BENEFIT STREET PARTNERS REALTY TRUST, INC.
NOTES TO CONSOLIDATED FINANCIAL STATEMENTS
(Unaudited)
Note 3 - Commercial Mortgage Loans
The following table is a summary of the Company's commercial mortgage loans, held-for-investment,held for investment, carrying values by class (in(dollars in thousands):
___________________
| March 31, 2020 | December 31, 2019 | ||||||
| Senior loans | $ | 2,653,564 | $ | 2,721,325 | |||
| Mezzanine loans | 9,117 | 41,638 | |||||
| Total gross carrying value of loans | 2,662,681 | 2,762,963 | |||||
Less: Allowance for credit losses (1) | 21,702 | 921 | |||||
| Total commercial mortgage loans, held for investment, net | $ | 2,640,979 | $ | 2,762,042 | |||
| September 30, 2017 | December 31, 2016 | ||||||
| Senior loans | $ | 1,254,879 | $ | 901,907 | |||
| Mezzanine loans | 32,186 | 136,830 | |||||
| Subordinated loans | — | 10,000 | |||||
| Total gross carrying value of loans | 1,287,065 | 1,048,737 | |||||
| Less: Allowance for loan losses | 1,959 | 2,181 | |||||
| Total commercial mortgage loans, held for investment, net | $ | 1,285,106 | $ | 1,046,556 | |||
| Nine Months Ended September 30, 2017 | Nine Months Ended September 30, 2016 | ||||||
| Beginning of period | $ | 2,181 | $ | 888 | |||
| Provision for loan losses | (222 | ) | 721 | ||||
| Charge-offs | — | — | |||||
| Recoveries | — | — | |||||
| Ending allowance for loan losses | $ | 1,959 | $ | 1,609 | |||
As of September 30, 2017March 31, 2020 and December 31, 2016,2019, the Company's total commercial mortgage loan portfolio, excluding commercial mortgage loans accounted for under the fair value option, was comprised of 73118 and 71122 loans, respectively.
Allowance for Credit Losses
The following table presents the activity in the Company's allowance for credit losses, excluding the unfunded loan commitments, for the three months ended March 31, 2020 (dollars in thousands):
| March 31, 2020 | ||||||||||||||||||||||||||||||||||||
| Multifamily | Retail | Office | Industrial | Mixed Use | Hospitality | Self Storage | Mobile Housing | Total | ||||||||||||||||||||||||||||
| Beginning Balance | $ | 322 | $ | 202 | $ | 249 | $ | 23 | $ | 4 | $ | 103 | $ | — | $ | 18 | $ | 921 | ||||||||||||||||||
| Cumulative-effect adjustment upon adoption of ASU 2016-13 | 3,220 | 386 | 1,966 | 434 | 9 | 739 | 399 | 58 | 7,211 | |||||||||||||||||||||||||||
| Current Period: | ||||||||||||||||||||||||||||||||||||
| Increase/(decrease) for credit losses | 8,647 | 565 | 2,358 | 1,875 | 28 | 655 | (123 | ) | (8 | ) | 13,997 | |||||||||||||||||||||||||
| Write-offs | — | — | — | — | — | (427 | ) | — | — | (427 | ) | |||||||||||||||||||||||||
| Ending Balance | $ | 12,189 | $ | 1,153 | $ | 4,573 | $ | 2,332 | $ | 41 | $ | 1,070 | $ | 276 | $ | 68 | $ | 21,702 | ||||||||||||||||||
The increase in the provision for credit losses during the three months ended March 31, 2020 of $13,997 is primarily driven by the significant adverse change in the overall economic outlook due to the COVID-19 pandemic. These are allowance for credit losses on commercial mortgage loans, held-for-investment, as of March 31, 2020 and December 31, 2019.
BENEFIT STREET PARTNERS REALTY TRUST, INC.
NOTES TO CONSOLIDATED FINANCIAL STATEMENTS
March 31, 2020
(Unaudited)
The following table presents the activity in the Company's allowance for credit losses, for the unfunded loan commitments, for the three months ended March 31, 2020 (dollars in thousands):
| March 31, 2020 | ||||||||||||||||||||||||||||||||||||
| Multifamily | Retail | Office | Industrial | Mixed Use | Hospitality | Self Storage | Mobile Housing | Total | ||||||||||||||||||||||||||||
| Beginning Balance | $ | — | $ | — | $ | — | $ | — | $ | — | $ | — | $ | — | $ | — | $ | — | ||||||||||||||||||
| Cumulative-effect adjustment upon adoption of ASU 2016-13 | 239 | 40 | 150 | 30 | 1 | 57 | 28 | 5 | 550 | |||||||||||||||||||||||||||
| Current Period: | ||||||||||||||||||||||||||||||||||||
Increase/(decrease) for credit losses | 56 | (40 | ) | 242 | 257 | (1 | ) | 117 | (28 | ) | (3 | ) | 600 | |||||||||||||||||||||||
| Write-offs | — | — | — | — | — | — | — | — | — | |||||||||||||||||||||||||||
| Ending Balance | $ | 295 | $ | — | $ | 392 | $ | 287 | $ | — | $ | 174 | $ | — | $ | 2 | $ | 1,150 | ||||||||||||||||||
The following table represents the composition by loan type of the Company's commercial mortgage loans portfolio, excluding commercial mortgage loans, held-for-sale, measured at fair value (dollars in thousands):
| March 31, 2020 | December 31, 2019 | |||||||||||||
| Loan Type | Par Value | Percentage | Par Value | Percentage | ||||||||||
| Multifamily | $ | 1,395,956 | 52.3 | % | $ | 1,491,971 | 53.9 | % | ||||||
| Office | 430,870 | 16.1 | % | 414,772 | 15.0 | % | ||||||||
| Hospitality | 398,186 | 14.9 | % | 446,562 | 16.1 | % | ||||||||
| Industrial | 144,093 | 5.4 | % | 118,743 | 4.3 | % | ||||||||
| Retail | 111,620 | 4.2 | % | 111,620 | 4.0 | % | ||||||||
| Mixed Use | 65,040 | 2.4 | % | 58,808 | 2.1 | % | ||||||||
| Self Storage | 63,057 | 2.4 | % | 67,767 | 2.4 | % | ||||||||
| Land | 16,400 | 0.6 | % | 16,400 | 0.6 | % | ||||||||
| Manufactured Housing | 44,911 | 1.7 | % | 44,656 | 1.6 | % | ||||||||
| Total | $ | 2,670,133 | 100.0 | % | $ | 2,771,299 | 100.0 | % | ||||||
As of March 31, 2020 and December 31, 2019, the Company's total commercial mortgage loans, held-for-sale, measured at fair value comprised of 8 and 7 loans, respectively. As of March 31, 2020 and December 31, 2019, the contractual principal outstanding of commercial mortgage loans, held-for-sale, measured at fair value was $93.7 million and $112.5 million, respectively. As of March 31, 2020 and December 31, 2019, none of the Company's commercial mortgage loans, held-for-sale, measured at fair value were in default or greater than ninety days past due.
The following table represents the composition by loan type of the Company's commercial mortgage loans, held-for-sale, measured at fair value (dollars in thousands):
| March 31, 2020 | December 31, 2019 | |||||||||||||
| Loan Type | Par Value | Percentage | Par Value | Percentage | ||||||||||
| Multifamily | $ | 41,000 | 43.8 | % | $ | 78,250 | 69.6 | % | ||||||
| Industrial | 23,625 | 25.2 | % | 23,625 | 21.0 | % | ||||||||
| Retail | 21,193 | 22.6 | % | 2,613 | 2.3 | % | ||||||||
| Office | 6,000 | 6.4 | % | — | — | % | ||||||||
| Manufactured Housing | 1,850 | 2.0 | % | — | — | % | ||||||||
| Hospitality | — | — | % | 8,000 | 7.1 | % | ||||||||
| Total | $ | 93,668 | 100.0 | % | $ | 112,488 | 100.0 | % | ||||||
Loan Credit Quality and Vintage
18
BENEFIT STREET PARTNERS REALTY TRUST, INC.
NOTES TO CONSOLIDATED FINANCIAL STATEMENTS
(Unaudited)
The following tables present the amortized cost of our commercial mortgage loans, held for investment at March 31, 2020, by loan type, the Company’s internal risk rating and year of origination. The risk ratings are updated as of March 31, 2020.
| As of March 31, 2020 | ||||||||||||||||||||||||||||||||
| 2020 | 2019 | 2018 | 2017 | 2016 | 2015 | Prior | Total | |||||||||||||||||||||||||
| Multifamily: | ||||||||||||||||||||||||||||||||
| Risk Rating: | ||||||||||||||||||||||||||||||||
| 1-2 internal grade | $ | 177,191 | $ | 456,036 | $ | 617,533 | $ | 34,875 | $ | — | $ | — | $ | 3,489 | $ | 1,289,124 | ||||||||||||||||
| 3-4 internal grade | — | — | 65,805 | 37,812 | — | — | — | 103,617 | ||||||||||||||||||||||||
| Total Multifamily Loans | $ | 177,191 | $ | 456,036 | $ | 683,338 | $ | 72,687 | $ | — | $ | — | $ | 3,489 | $ | 1,392,741 | ||||||||||||||||
| Retail: | ||||||||||||||||||||||||||||||||
| Risk Rating: | ||||||||||||||||||||||||||||||||
| 1-2 internal grade | $ | — | $ | 54,618 | $ | 16,319 | $ | — | $ | — | $ | — | $ | 9,450 | $ | 80,387 | ||||||||||||||||
| 3-4 internal grade | — | 3,501 | 43,907 | — | — | — | — | 47,408 | ||||||||||||||||||||||||
| Total Retail Loans | $ | — | $ | 58,119 | $ | 60,226 | $ | — | $ | — | $ | — | $ | 9,450 | $ | 127,795 | ||||||||||||||||
| Office: | ||||||||||||||||||||||||||||||||
| Risk Rating: | ||||||||||||||||||||||||||||||||
| 1-2 internal grade | $ | 49,163 | $ | 173,988 | $ | 97,936 | $ | 41,645 | $ | — | $ | 10,700 | $ | — | $ | 373,432 | ||||||||||||||||
| 3-4 internal grade | — | — | 45,259 | 10,506 | — | — | — | 55,765 | ||||||||||||||||||||||||
| Total Office Loans | $ | 49,163 | $ | 173,988 | $ | 143,195 | $ | 52,151 | $ | — | $ | 10,700 | $ | — | $ | 429,197 | ||||||||||||||||
| Industrial: | ||||||||||||||||||||||||||||||||
| Risk Rating: | ||||||||||||||||||||||||||||||||
| 1-2 internal grade | $ | 25,241 | $ | 84,576 | $ | — | $ | — | $ | — | $ | 33,655 | $ | — | $ | 143,472 | ||||||||||||||||
| 3-4 internal grade | — | — | — | — | — | — | — | — | ||||||||||||||||||||||||
| Total Industrial Loans | $ | 25,241 | $ | 84,576 | $ | — | $ | — | $ | — | $ | 33,655 | $ | — | $ | 143,472 | ||||||||||||||||
| Mixed Use: | ||||||||||||||||||||||||||||||||
| Risk Rating: | ||||||||||||||||||||||||||||||||
| 1-2 internal grade | $ | — | $ | — | $ | 52,097 | $ | 12,953 | $ | — | $ | — | $ | — | $ | 65,050 | ||||||||||||||||
| 3-4 internal grade | — | — | — | — | — | — | — | — | ||||||||||||||||||||||||
| Total Mixed Use Loans | $ | — | $ | — | $ | 52,097 | $ | 12,953 | $ | — | $ | — | $ | — | $ | 65,050 | ||||||||||||||||
| Hospitality: | ||||||||||||||||||||||||||||||||
| Risk Rating: | ||||||||||||||||||||||||||||||||
| 1-2 internal grade | $ | — | $ | 8,735 | $ | 20,962 | $ | — | $ | — | $ | — | $ | — | $ | 29,697 | ||||||||||||||||
| 3-4 internal grade | — | 161,948 | 114,190 | 90,940 | — | — | — | 367,078 | ||||||||||||||||||||||||
| Total Hospitality Loans | $ | — | $ | 170,683 | $ | 135,152 | $ | 90,940 | $ | — | $ | — | $ | — | $ | 396,775 | ||||||||||||||||
| Self Storage: | ||||||||||||||||||||||||||||||||
| Risk Rating: | ||||||||||||||||||||||||||||||||
| 1-2 internal grade | $ | — | $ | — | $ | 62,937 | $ | — | $ | — | $ | — | $ | — | $ | 62,937 | ||||||||||||||||
| 3-4 internal grade | — | — | — | — | — | — | — | — | ||||||||||||||||||||||||
| Total Self Storage Loans | $ | — | $ | — | $ | 62,937 | $ | — | $ | — | $ | — | $ | — | $ | 62,937 | ||||||||||||||||
19
BENEFIT STREET PARTNERS REALTY TRUST, INC.
NOTES TO CONSOLIDATED FINANCIAL STATEMENTS
March 31, 2020
(Unaudited)
| September 30, 2017 | December 31, 2016 | |||||||||||||
| Loan Type | Par Value | Percentage | Par Value | Percentage | ||||||||||
| Office | $ | 433,110 | 32.7 | % | $ | 340,944 | 31.6 | % | ||||||
| Multifamily | 441,431 | 33.4 | % | 329,203 | 30.6 | % | ||||||||
| Hospitality | 126,673 | 9.6 | % | 143,582 | 13.3 | % | ||||||||
| Retail | 223,315 | 16.9 | % | 154,684 | 14.4 | % | ||||||||
| Mixed Use | 45,235 | 3.4 | % | 56,136 | 5.2 | % | ||||||||
| Industrial | 53,208 | 4.0 | % | 52,688 | 4.9 | % | ||||||||
Total (1) | $ | 1,322,972 | 100.0 | % | $ | 1,077,237 | 100.0 | % | ||||||
| (1) Excludes $60.95 million in commercial mortgage loans held-for-sale, measured at fair value in the Company's TRS segment | ||||||||||||||
| Manufactured Housing: | ||||||||||||||||||||||||||||||||
| Risk Rating: | ||||||||||||||||||||||||||||||||
| 1-2 internal grade | $ | — | $ | 44,714 | $ | — | $ | — | $ | — | $ | — | $ | — | $ | 44,714 | ||||||||||||||||
| 3-4 internal grade | — | — | — | — | — | — | — | — | ||||||||||||||||||||||||
| Total Manufactured Housing Loans | $ | — | $ | 44,714 | $ | — | $ | — | $ | — | $ | — | $ | — | $ | 44,714 | ||||||||||||||||
| Total | $ | 251,595 | $ | 988,116 | $ | 1,136,945 | $ | 228,731 | $ | — | $ | 44,355 | $ | 12,939 | $ | 2,662,681 | ||||||||||||||||
Past Due Status
The following table presents an aging summary of the loans amortized cost basis at March 31, 2020 (dollars in thousands):
__________________
| Multifamily | Retail | Office | Industrial | Mixed Use | Hospitality | Self Storage | Mobile Housing | Total | ||||||||||||||||||||||||||||
| Status: | ||||||||||||||||||||||||||||||||||||
| Current | $ | 1,392,741 | $ | 127,795 | $ | 383,938 | $ | 143,472 | $ | 65,050 | $ | 339,700 | $ | 62,937 | $ | 44,714 | $ | 2,560,347 | ||||||||||||||||||
1-29 days past due(1) | — | — | 45,259 | — | — | — | — | — | 45,259 | |||||||||||||||||||||||||||
| 30-59 days past due | — | — | — | — | — | — | — | — | — | |||||||||||||||||||||||||||
| 60-89 days past due | — | — | — | — | — | — | — | — | — | |||||||||||||||||||||||||||
| 90-119 days past due | — | — | — | — | — | — | — | — | — | |||||||||||||||||||||||||||
120+ days past due(2) | — | — | — | — | — | 57,075 | — | — | 57,075 | |||||||||||||||||||||||||||
| Total | $ | 1,392,741 | $ | 127,795 | $ | 429,197 | $ | 143,472 | $ | 65,050 | $ | 396,775 | $ | 62,937 | $ | 44,714 | $ | 2,662,681 | ||||||||||||||||||
(1) For the three months ended March 31, 2020, interest income recognized on this loan was $0.6 million.
(2) For the three months ended March 31, 2020, interest income recognized on this loan was $0.0 million.
As of September 30, 2017March 31, 2020, the Company had two loans on non-accrual status with a cost basis of $57.1 million and $45.3 million. As of December 31, 2016,2019, the Company's total commercial mortgage loans, held for sale, measured at fair value comprisedCompany had one loan on non-accrual status with a cost basis of 4 and 0 loans, respectively.
| September 30, 2017 | December 31, 2016 | |||||||||||||
| Loan Type | Par Value | Percentage | Par Value | Percentage | ||||||||||
| Industrial | $ | 11,600 | 19.1 | % | $ | — | — | % | ||||||
| Mixed Use | 14,150 | 23.2 | % | — | — | % | ||||||||
| Multifamily | 7,200 | 11.8 | % | — | — | % | ||||||||
| Retail | 28,000 | 45.9 | % | — | — | % | ||||||||
| Total | $ | 60,950 | 100.0 | % | $ | — | — | % | ||||||
$57.1 million.
Credit Characteristics
As part of the Company's process for monitoring the credit quality of its commercial mortgage loans, excluding those held-for-sale, measured at fair value, it performs a quarterly loan portfolio assessment and assigns risk ratings to each of its loans. The loans are ratedscored on a 5-point scale of 1 to 5 as follows:
| Investment Rating | Summary Description | |
| 1 | Investment exceeding fundamental performance expectations and/or capital gain expected. Trends and risk factors since time of investment are favorable. | |
| 2 | Performing consistent with expectations and a full return of principal and interest expected. Trends and risk factors are neutral to favorable. | |
| 3 | Performing investments requiring closer monitoring. Trends and risk factors show some deterioration. | |
| 4 | Underperforming investment with the potential of some interest loss but still expecting a positive return on investment. Trends and risk factors are negative. | |
| 5 | Underperforming investment with expected loss of interest and some principal. | |
20
BENEFIT STREET PARTNERS REALTY TRUST, INC.
NOTES TO CONSOLIDATED FINANCIAL STATEMENTS
March 31, 2020
(Unaudited)
All commercial mortgage loans, excluding loans classified as commercial mortgage loans, held-for-sale, measured at fair value within the consolidated balance sheets, are assigned an initial risk rating of 2.0. As of September 30, 2017March 31, 2020 and December 31, 2016,2019, the weighted average risk rating of the loans was 2.22.3 and 2.1, respectively. As of
The following table represents the allocation by risk rating for the Company's commercial mortgage loans, held for investment (dollars in thousands):
| March 31, 2020 | December 31, 2019 | |||||||||||||||
| Risk Rating | Number of Loans | Par Value | Risk Rating | Number of Loans | Par Value | |||||||||||
| 1 | — | $ | — | 1 | — | $ | — | |||||||||
| 2 | 90 | 2,094,654 | 2 | 113 | 2,452,330 | |||||||||||
| 3 | 27 | 518,404 | 3 | 8 | 298,994 | |||||||||||
| 4 | 1 | 57,075 | 4 | 1 | 19,975 | |||||||||||
| 5 | — | — | 5 | — | — | |||||||||||
| 118 | $ | 2,670,133 | 122 | $ | 2,771,299 | |||||||||||
| Nine Months Ended September 30, 2017 | Nine Months Ended September 30, 2016 | ||||||
| Balance at Beginning of Year | $ | 1,046,556 | $ | 1,124,201 | |||
| Acquisitions and originations | 566,490 | 42,236 | |||||
| Dispositions | (68,514 | ) | — | ||||
| Principal repayments | (228,814 | ) | (48,127 | ) | |||
| Discount accretion and premium amortization* | 1,604 | 1,704 | |||||
| Loans transferred to commercial real estate loans, held-for-sale, at fair value | (31,207 | ) | — | ||||
| Fees capitalized into carrying value of loans | (1,231 | ) | — | ||||
| Provision for loan losses | 222 | (721 | ) | ||||
| Balance at End of Period | $ | 1,285,106 | $ | 1,119,293 | |||
| Three Months Ended March 31, | For the Year Ended December 31, | ||||||
| 2020 | 2019 | ||||||
| Balance at Beginning of Year | $ | 2,762,042 | $ | 2,206,830 | |||
| Cumulative-effect adjustment upon adoption of ASU 2016-13 | (7,211 | ) | — | ||||
| Acquisitions and originations | 288,825 | 1,326,983 | |||||
| Principal repayments | (366,058 | ) | (771,774 | ) | |||
| Discount accretion/premium amortization | 1,751 | 6,264 | |||||
| Loans reclassified to held-for-sale | (9,619 | ) | — | ||||
| Loans transferred from/(to) commercial real estate loans, held-for-sale | — | 10,100 | |||||
| Net fees capitalized into carrying value of loans | (1,181 | ) | (5,339 | ) | |||
| Increase/(decrease) for credit losses | (13,997 | ) | (3,007 | ) | |||
| Charge-off from allowance | 427 | 6,922 | |||||
| Transfer on foreclosure to real estate owned | (14,000 | ) | — | ||||
| Transfer on deed in lieu of foreclosure to real estate owned | — | (14,937 | ) | ||||
| Balance at End of Period | $ | 2,640,979 | $ | 2,762,042 | |||
date.
The following is a summary of the Company's real estate securities, CMBS (in(dollars in thousands):
| Weighted Average | ||||||||||||||||
| Number of Investments | Interest Rate | Maturity | Par Value | Fair Value | ||||||||||||
| September 30, 2017 | — | — | % | n/a | $ | — | $ | — | ||||||||
| December 31, 2016 | 6 | 5.8 | % | February 2020 | 50,000 | 49,049 | ||||||||||
| March 31, 2020 | ||||||||
| Type | Interest Rate | Maturity | Par Value | Fair Value | ||||
| CMBS 1 | 3.7% | 5/15/2022 | $13,250 | $10,408 | ||||
21
BENEFIT STREET PARTNERS REALTY TRUST, INC.
NOTES TO CONSOLIDATED FINANCIAL STATEMENTS
March 31, 2020
(Unaudited)
| CMBS 2 | 2.8% | 6/26/2025 | 11,488 | 10,250 | ||||
| CMBS 3 | 3.1% | 2/15/2036 | 40,000 | 34,728 | ||||
| CMBS 4 | 2.4% | 5/15/2036 | 18,500 | 14,672 | ||||
| CMBS 5 | 2.1% | 5/15/2036 | 15,000 | 14,259 | ||||
| CMBS 6 | 2.2% | 5/15/2037 | 13,500 | 11,279 | ||||
| CMBS 7 | 2.4% | 5/15/2037 | 15,000 | 12,538 | ||||
| CMBS 8 | 2.2% | 6/15/2037 | 7,000 | 6,386 | ||||
| CMBS 9 | 2.6% | 2/15/2036 | 9,600 | 8,695 | ||||
| CMBS 10 | 2.5% | 8/15/2036 | 10,000 | 9,083 | ||||
| CMBS 11 | 2.6% | 6/15/2037 | 8,000 | 7,330 | ||||
| CMBS 12 | 2.3% | 7/15/2038 | 13,000 | 10,802 | ||||
| CMBS 13 | 2.3% | 9/15/2037 | 32,000 | 27,563 | ||||
| CMBS 14 | 2.7% | 9/15/2037 | 24,000 | 20,628 | ||||
| CMBS 15 | 2.3% | 10/19/2038 | 50,000 | 42,408 | ||||
| CMBS 16 | 2.7% | 10/19/2038 | 26,000 | 22,210 | ||||
| CMBS 17 | 2.2% | 6/15/2034 | 15,000 | 13,332 | ||||
| CMBS 18 | 2.5% | 6/15/2034 | 6,500 | 5,606 | ||||
| CMBS 19 | 2.9% | 6/15/2034 | 12,000 | 10,417 | ||||
| CMBS 20 | 2.0% | 12/15/2036 | 20,000 | 17,920 | ||||
| CMBS 21 | 2.3% | 12/15/2036 | 25,000 | 22,221 | ||||
| CMBS 22 | 2.1% | 2/15/2035 | 22,500 | 18,255 | ||||
| CMBS 23 | 2.5% | 2/15/2035 | 16,000 | 13,166 | ||||
| CMBS 24 | 2.5% | 2/15/2035 | 2,000 | 1,646 | ||||
| CMBS 25 | 2.1% | 2/15/2035 | 2,200 | 1,785 | ||||
| CMBS 26 | 2.6% | 3/15/2035 | 12,500 | 11,153 | ||||
| CMBS 27 | 3.0% | 3/15/2035 | 25,665 | 23,056 | ||||
| CMBS 28 | 2.3% | 3/15/2037 | 28,000 | 25,601 | ||||
| CMBS 29 | 2.6% | 3/15/2037 | 15,000 | 13,763 | ||||
| December 31, 2019 | ||||||||
| Type | Interest Rate | Maturity | Par Value | Fair Value | ||||
| CMBS 1 | 4.7% | 5/15/2022 | $13,250 | $13,274 | ||||
| CMBS 2 | 3.8% | 6/26/2025 | 12,131 | 12,151 | ||||
| CMBS 3 | 4.1% | 2/15/2036 | 40,000 | 40,186 | ||||
| CMBS 4 | 3.7% | 5/15/2036 | 18,500 | 18,535 | ||||
| CMBS 5 | 3.1% | 5/15/2036 | 15,000 | 15,019 | ||||
| CMBS 6 | 3.2% | 5/15/2037 | 13,500 | 13,525 | ||||
| CMBS 7 | 3.4% | 5/15/2037 | 15,000 | 15,028 | ||||
| CMBS 8 | 3.2% | 6/15/2037 | 7,000 | 7,013 | ||||
| CMBS 9 | 3.6% | 2/15/2036 | 9,600 | 9,641 | ||||
| CMBS 10 | 3.5% | 8/15/2036 | 10,000 | 10,027 | ||||
| CMBS 11 | 3.6% | 6/15/2037 | 8,000 | 8,015 | ||||
| CMBS 12 | 3.3% | 7/15/2038 | 13,000 | 13,022 | ||||
| CMBS 13 | 3.3% | 9/15/2037 | 32,000 | 32,074 | ||||
| CMBS 14 | 3.7% | 9/15/2037 | 24,000 | 24,084 | ||||
22
BENEFIT STREET PARTNERS REALTY TRUST, INC.
NOTES TO CONSOLIDATED FINANCIAL STATEMENTS
March 31, 2020
(Unaudited)
| CMBS 15 | 3.3% | 10/19/2038 | 50,000 | 50,094 | ||||
| CMBS 16 | 3.7% | 10/19/2038 | 26,000 | 26,029 | ||||
| CMBS 17 | 3.2% | 6/15/2034 | 15,000 | 15,022 | ||||
| CMBS 18 | 3.5% | 6/15/2034 | 6,500 | 6,509 | ||||
| CMBS 19 | 3.9% | 6/15/2034 | 12,000 | 12,022 | ||||
| CMBS 20 | 3.1% | 12/15/2036 | 20,000 | 20,021 | ||||
| CMBS 21 | 3.4% | 12/15/2036 | 25,000 | 25,025 | ||||
The Company classified its CMBS investments as available-for-saleavailable for sale as of September 30, 2017March 31, 2020 and December 31, 2016.2019. These investments are reported at fair value in the consolidated balance sheets with changes in fair value recorded in "accumulatedaccumulated other comprehensive income or loss"(loss). The weighted average contractual maturity for CLO investments included within the CMBS portfolio as of March 31, 2020 and December 31, 2019 was 16 and 17 years. The weighted average contractual maturity for single asset single borrower "SASB" investments as of March 31, 2020 and December 31, 2019 was 14 and 5 years.
The following table shows the amortized cost, allowance for expected credit losses, unrealized gains/lossesgain/(loss) and fair value of the Company's CMBS investments as of September 30, 2017 and December 31, 2016 (inby investment type (dollars in thousands):
| Amortized Cost | Unrealized Gains | Unrealized Losses | Fair Value | |||||||||||||
| September 30, 2017 | $ | — | $ | — | $ | — | $ | — | ||||||||
| December 31, 2016 | 49,548 | — | (499 | ) | 49,049 | |||||||||||
| Amortized Cost | Credit Loss Allowance | Unrealized Gain | Unrealized Loss | Fair Value | ||||||||||||||||
| March 31, 2020 | ||||||||||||||||||||
| CLOs | $ | 411,234 | $ | — | $ | — | $ | (59,830 | ) | $ | 351,404 | |||||||||
| SASB | 98,511 | — | — | (8,755 | ) | 89,756 | ||||||||||||||
| Total | $ | 509,745 | $ | — | $ | — | $ | (68,585 | ) | $ | 441,160 | |||||||||
| December 31, 2019 | ||||||||||||||||||||
| CLOs | 330,000 | $ | — | 1 | (881 | ) | 329,120 | |||||||||||||
| SASB | 57,294 | — | — | (98 | ) | 57,196 | ||||||||||||||
| Total | $ | 387,294 | $ | — | $ | 1 | $ | (979 | ) | $ | 386,316 | |||||||||
As of September 30, 2017,March 31, 2020 the Company held no CMBS positions. As of December 31, 2016, the Company held 629 CMBS positions with an aggregate carrying value of $49.5$510 million and an unrealized loss of $0.5$69 million, of which 2two positions had a totalan unrealized loss of $0.2 million for a period greater than 12twelve months. As of December 31, 2019, the Company held 21 CMBS positions with an aggregate carrying value of $387 million and an unrealized loss of $1 million, of which two positions had an unrealized loss for a period greater than twelve months.
The Companyfollowing table provides information on the unrealized losses and fair value on the Company's real estate securities, CMBS, available for sale that were in an unrealized loss position, and for which an allowance for credit losses has recognizednot been recorded as of March 31, 2020 and December 31, 2019 (amounts in thousands):
| Fair Value | Unrealized Loss | ||||||||||||||
| Securities with an unrealized loss less than 12 months | Securities with an unrealized loss greater than 12 months | Securities with an unrealized loss less than 12 months | Securities with an unrealized loss greater than 12 months | ||||||||||||
| March 31, 2020 | |||||||||||||||
| CLOs | $ | 341,003 | $ | 10,401 | $ | (56,944 | ) | $ | (2,886 | ) | |||||
| SASB | 79,506 | 10,250 | (7,468 | ) | (1,287 | ) | |||||||||
| Total | $ | 420,509 | $ | 20,651 | $ | (64,412 | ) | $ | (4,173 | ) | |||||
| December 31, 2019 | |||||||||||||||
| CLOs | $ | 315,845 | $ | 13,275 | $ | (863 | ) | $ | (17 | ) | |||||
| SASB | 45,045 | 12,151 | (67 | ) | (31 | ) | |||||||||
| Total | $ | 360,890 | $ | 25,426 | $ | (930 | ) | $ | (48 | ) | |||||
23
BENEFIT STREET PARTNERS REALTY TRUST, INC.
NOTES TO CONSOLIDATED FINANCIAL STATEMENTS
March 31, 2020
(Unaudited)
As of March 31, 2020 and December 31, 2019, there are two securities with unrealized losses reflected in the table above. After evaluating the securities, we concluded that the unrealized losses reflected above were noncredit-related and would be recovered from the securities’ estimated future cash flows. We considered a gainnumber of $0.2 millionfactors in reaching this conclusion, including that we did not intend to sell the securities, it was not considered more likely than not that we would be forced to sell the securities prior to recovering our amortized cost, and that there were no material credit events that would have caused us to otherwise conclude that we would not recover our cost. The allowance for credit losses is calculated using a discounted cash flow approach and is measured as the nine months ended September 30, 2017 and recognizeddifference between the original cash flows expected to be collected to the revised cash flows expected to be collected discounted using the effective interest rate, limited by the amount that the fair value is less than the amortized cost basis. Significant judgment is used in projecting cash flows. As a result, actual income and/or credit losses could be materially different from what is currently projected and/or reported.
The following table provides information on the amounts of gain/(loss) on the Company's real estate securities, CMBS, available for sale (dollars in thousands):
| Three Months Ended March 31, | ||||||||
| 2020 | 2019 | |||||||
| Unrealized gain/(loss) available-for-sale securities | $ | (67,607 | ) | $ | 145 | |||
| Reclassification of net (gain)/loss on available-for-sale securities included in net income (loss) from sales of securities | — | — | ||||||
| Unrealized gain/(loss) available-for-sale securities, net of reclassification adjustment | $ | (67,607 | ) | $ | 145 | |||
The amounts reclassified for net (gain)/loss on available for sale securities from sales of approximately $1 million for the three and nine months ended September 30, 2016, recorded withinsecurities are included in the realized (gain)/loss on sale of real estate securities in the Company's consolidated statements of operations. The Company did not have any realized gains or losses duringCompany's unrealized gain/(loss) on available for sale securities is net of tax. Due to the three months ended September 30, 2017.Company's designation as a REIT, there was no tax impact on unrealized gain/(loss) on available for sale securities.
The following table provides information on the amountsdeterioration in fair value of gains (losses) on the Company's real estate securities CMBS, available-for-sale:for both collateralized loan obligations and other securities as of March 31, 2020 can be attributed mainly to the market down-turn and volatility as a result of high unemployment and credit uncertainties related to the outbreak of COVID-19. Management currently does not have the intention to sell any of the real estate securities as of March 31, 2020.
BENEFIT STREET PARTNERS REALTY TRUST, INC.
NOTES TO CONSOLIDATED FINANCIAL STATEMENTS
March 31, 2020
(Unaudited)
Note 5 - Real Estate Owned
The following table summarizes the Company's real estate owned assets as of March 31, 2020 (dollars in thousands):
| As of March 31, 2020 | ||||||||||||||||||||||||
| Acquisition Date | Property Type | Primary Location(s) | Land | Building and Improvements | Furniture, Fixtures and Equipment | Accumulated Depreciation | Real Estate Owned, net | |||||||||||||||||
August 2019 (1)(2) | Hotel | Chicago, IL | $ | — | $ | 8,337 | $ | — | $ | (139 | ) | $ | 8,198 | |||||||||||
October 2019 (1) | Office | Jeffersonville, IN | 1,887 | 21,989 | 3,565 | (333 | ) | 27,108 | ||||||||||||||||
March 2020 (1)(3) | Hotel | Knoxville, TN | 3,800 | 7,838 | 2,362 | — | 14,000 | |||||||||||||||||
| $ | 5,687 | $ | 38,164 | $ | 5,927 | $ | (472 | ) | $ | 49,306 | ||||||||||||||
________________________
(1)Refer to Note 2 for the useful life of the above assets
(2)Represents assets acquired by the Company by completing a deed-in-lieu of foreclosure transaction
(3)Represents assets acquired by the Company by completing a foreclosure transaction
The following table summarizes the Company's real estate asset acquisitions for the year ended December 31, 2019 (dollars in thousands):
| As of December 31, 2019 | ||||||||||||||||||||||||
| Acquisition Date | Property Type | Primary Location(s) | Land | Building and Improvements | Furniture, Fixtures and Equipment | Accumulated Depreciation | Real Estate Owned, net | |||||||||||||||||
August 2019 (1)(2) | Hotel | Chicago, IL | $ | — | $ | 8,110 | $ | — | $ | (86 | ) | $ | 8,024 | |||||||||||
October 2019 (1) | Office | Jeffersonville, IN | 1,887 | 25,554 | — | (133 | ) | 27,309 | ||||||||||||||||
| $ | 1,887 | $ | 33,664 | $ | — | $ | (219 | ) | $ | 35,333 | ||||||||||||||
________________________
(1)Refer to Note 2 for the useful life of the above assets
(2)Represents assets acquired by the Company by completing a deed-in-lieu of foreclosure transaction
Depreciation expense for the three months ended March 31, 2020 and March 31, 2019 totaled $0.3 million and $0.0 million, respectively.
25
BENEFIT STREET PARTNERS REALTY TRUST, INC.
NOTES TO CONSOLIDATED FINANCIAL STATEMENTS
(Unaudited)
Note 6 - Leases
Operating Right of Use Asset
The following table summarizes the Company's operating right of use asset recognized in the consolidated balance sheets as of March 31, 2020 (dollars in thousands):
| Three Months Ended September 30, | Nine Months Ended September 30, | |||||||||||||||
| 2017 | 2016 | 2017 | 2016 | |||||||||||||
| Unrealized gains (losses) available-for-sale securities | $ | (448 | ) | $ | 1,449 | $ | 19 | $ | (1,124 | ) | ||||||
| Reclassification of net (gains) losses on available-for-sale securities included in net income (loss) | — | 1,159 | 481 | 1,159 | ||||||||||||
| Unrealized gains (losses) available-for-sale securities, net of reclassification adjustment | $ | (448 | ) | $ | 2,608 | $ | 500 | $ | 35 | |||||||
| The amounts reclassified for net (gain) loss on available-for-sale securities are included in the realized (gain) loss on sale of real estate securities in the Company's consolidated statements of operations. | ||||||||||||||||
| March 31, 2020 | ||||||||||||||||
| Acquisition Date | Property Type | Primary Location(s) | Operating Right of Use Asset, Gross | Accumulated Amortization | Operating Right of Use Asset, net of Amortization | |||||||||||
| August 2019 | Hotel | Chicago, IL | $ | 6,109 | $ | (207 | ) | $ | 5,902 | |||||||
| $ | 6,109 | $ | (207 | ) | $ | 5,902 | ||||||||||
The following table summarizes the Company's operating right of use asset recognized in the consolidated balance sheets as of December 31, 2019 (dollars in thousands):
| December 31, 2019 | ||||||||||||||||
| Acquisition Date | Property Type | Primary Location(s) | Operating Right of Use Asset, Gross | Accumulated Amortization | Operating Right of Use Asset, net of Amortization | |||||||||||
| August 2019 | Hotel | Chicago, IL | $ | 6,109 | $ | (130 | ) | $ | 5,979 | |||||||
| $ | 6,109 | $ | (130 | ) | $ | 5,979 | ||||||||||
Operating Lease Liabilities
On August 19, 2019, in conjunction with the deed-in-lieu of foreclosure transaction, the Company assumed a non-cancelable ground lease for the land on which the property is located and classified the lease as an operating lease. The ground lease requires monthly rental payments with annual increases of 3%. The initial term of the lease expires in 2067 and can be renewed for a sixty-year period. Rent expense for this operating lease for the three months ended March 31, 2020 and March 31, 2019 totaled $0.2 million and $0.0 million, respectively.
The following table summarizes the Company's schedule of minimum future lease payments as of March 31, 2020 (dollars in thousands):
| Minimum Future Lease Payments | March 31, 2020 | |||
| 2020 (April - December) | $ | 300 | ||
| 2021 | 410 | |||
| 2022 | 422 | |||
| 2023 | 435 | |||
| 2024 | 448 | |||
| 2025 and beyond | 39,438 | |||
| Total undiscounted lease payments | $ | 41,453 | ||
| Less: Amount representing interest | (35,277 | ) | ||
| Present value of lease liability | $ | 6,176 | ||
26
BENEFIT STREET PARTNERS REALTY TRUST, INC.
NOTES TO CONSOLIDATED FINANCIAL STATEMENTS
March 31, 2020
(Unaudited)
The following table summarizes the Company's schedule of minimum future lease payments as of December 31, 2019 (dollars in thousands):
| Minimum Future Lease Payments | December 31, 2019 | |||
| 2020 | $ | 398 | ||
| 2021 | 410 | |||
| 2022 | 422 | |||
| 2023 | 435 | |||
| 2024 | 448 | |||
| 2025 and beyond | 39,438 | |||
| Total undiscounted lease payments | $ | 41,551 | ||
| Less: Amount representing interest | (35,415 | ) | ||
| Present value of lease liability | $ | 6,136 | ||
The discount rate used to calculate the lease liability as of March 31, 2020 and December 31, 2019 is 9%. The remaining lease term is 47.70 years as of March 31, 2020 and 47.95 as of December 31, 2019.
Intangible Lease Asset
The following table summarizes the Company's intangible lease asset recognized in the consolidated balance sheets as of March 31, 2020 (dollars in thousands):
| March 31, 2020 | ||||||||||||||||
| Acquisition Date | Property Type | Primary Location(s) | Intangible Lease Asset, Gross | Accumulated Amortization | Intangible Lease Asset, Net of Amortization | |||||||||||
| October 2019 | Office | Jeffersonville, IN | $ | 14,509 | $ | (344 | ) | $ | 14,165 | |||||||
| $ | 14,509 | $ | (344 | ) | $ | 14,165 | ||||||||||
The following table summarizes the Company's intangible lease asset recognized in the consolidated balance sheets as of December 31, 2019 (dollars in thousands):
| December 31, 2019 | ||||||||||||||||
| Acquisition Date | Property Type | Primary Location(s) | Intangible Lease Asset, Gross | Accumulated Amortization | Intangible Lease Asset, Net of Amortization | |||||||||||
| October 2019 | Office | Jeffersonville, IN | $ | 14,509 | $ | (131 | ) | $ | 14,377 | |||||||
| $ | 14,509 | $ | (131 | ) | $ | 14,377 | ||||||||||
Rental Income
On October 15, 2019, the Company purchased an office building that was subject to an existing triple net lease. The minimum rental amount due under the lease is subject to annual increases of 1.5%. The initial term of the lease expires in 2037 and contains renewal options for four consecutive five-year terms. The remaining lease term is 17.1 years. Rental income for this operating lease for the three months ended March 31, 2020 and March 31, 2019 totaled $0.7 million and $0.0 million, respectively.
27
BENEFIT STREET PARTNERS REALTY TRUST, INC.
NOTES TO CONSOLIDATED FINANCIAL STATEMENTS
March 31, 2020
(Unaudited)
The following table summarizes the Company's schedule of future minimum rents to be received under the lease (dollars in thousands):
| Minimum Rents | March 31, 2020 | |||
| 2020 (April - December) | $ | 1,903 | ||
| 2021 | 2,568 | |||
| 2022 | 2,607 | |||
| 2023 | 2,646 | |||
| 2024 | 2,686 | |||
| 2025 and beyond | 36,894 | |||
| Total minimum rent | $ | 49,304 | ||
AmortizationExpense
Intangible lease assets are amortized using the straight-line method over the contractual life of the lease, of a period up to 20.0 years. The weighted average life of intangible assets as of March 31, 2020 is approximately 17.1 years. Amortization expense for the three months ended March 31, 2020 and March 31, 2019 totaled $0.2 million and $0.0 million, respectively.
The following table summarizes the Company's expected amortization for intangible assets over the next five years, assuming no further acquisitions or dispositions (dollars in thousands):
| Amortization Expense | March 31, 2020 | |||
| 2020 (April - December) | $ | (619 | ) | |
| 2021 | (825 | ) | ||
| 2022 | (825 | ) | ||
| 2023 | (825 | ) | ||
| 2024 | (825 | ) | ||
Note 57 - Debt
Repurchase Agreements - Commercial Mortgage Loans
The Company has entered into repurchase facilities with JPMorgan Chase Bank, National Association (the "JPM Repo Facility"), Goldman Sachs Bank USA (the "GS Repo Facility"), U.S.U.S Bank National Association (the "USB Repo Facility"), Barclays Bank PLC (the "Barclays Revolver Facility" and the "Barclays Repo Facility"), Wells Fargo Bank, National Association (the "WF Repo Facility"), and Credit Suisse AG (the "CS Repo Facility" and together with the JPM Repo Facility, GS Repo Facility, USB Repo Facility, WF Repo Facility, Barclays Revolver Facility, and Barclays Repo Facility, the "Repo Facilities").
The JPM Repo Facility has aFacilities are financing sources through which the Company may pledge one or more mortgage loans to the financing entity in exchange for funds typically at an advance rate of between 65% to 80% of the principal amount of the mortgage loan being pledged.
The details of the Company's Repo Facilities at March 31, 2020 and December 31, 2019 are as follows (dollars in thousands):
| As of March 31, 2020 | |||||||||||||||||
| Repurchase Facility | Committed Financing | Amount Outstanding | Interest Expense(1) | Ending Weighted Average Interest Rate | Maturity | ||||||||||||
JPM Repo Facility (2) | $ | 300,000 | $ | 119,604 | $ | 1,362 | 3.83 | % | 1/30/2021 | ||||||||
USB Repo Facility (3) | 100,000 | 8,250 | 152 | 3.18 | % | 6/15/2020 | |||||||||||
CS Repo Facility (4) | 200,000 | 71,740 | 1,349 | 4.06 | % | 9/27/2020 | |||||||||||
WF Repo Facility (5) | 175,000 | — | 396 | N/A | 11/21/2020 | ||||||||||||
Barclays Revolver Facility (6) | 100,000 | 4,200 | 51 | 5.34 | % | 9/20/2021 | |||||||||||
Barclays Repo Facility (7) | 300,000 | 30,730 | 332 | 3.24 | % | 3/15/2022 | |||||||||||
| Total | $ | 1,175,000 | $ | 234,524 | $ | 3,642 | |||||||||||
__________________________
28
BENEFIT STREET PARTNERS REALTY TRUST, INC.
NOTES TO CONSOLIDATED FINANCIAL STATEMENTS
March 31, 2020
(Unaudited)
(1) For the three months ended March 31, 2020. Includes amortization of deferred financing costs.
(2) On September 3, 2019, the committed financing amount was downsized from $520 million to $300 million and the maturity date of June 12, 2019 plus a one-year extension at the Company's option and provides upwas amended to $300.0 million in advances. The GS Repo Facility has a maturity date of December 27, 2018, with a one-year extension at the Company’s option, which may be exercised upon the satisfaction of certain conditions, and provides up to $250.0 million in advances. The USB Repo Facility matures on July 15, 2020, withJanuary 30, 2021.
(3) Includes two one-year extensions at the option of an indirect wholly-owned subsidiary of the Company, which may be exercised upon the satisfaction of certain conditions, and provides up to $100.0 million in advances. The CS Repo Facility matures on August 30, 2018 and provides up to $250.0 million in advances. Prior to the end of each calendar quarter,conditions.
(4) On March 26, 2020, the Company may request anexercised the extension of the termination date for an additional 364 days from the end of such calendar quarter subject tooption upon the satisfaction of certain conditions, and approvals. extended the term maturity to September 27, 2020.
(5) Includes three one-year extensions at the Company’s option, which may be exercised upon the satisfaction of certain conditions.
(6) On September 13, 2019, the Company exercised the extension option, and extended the term maturity to September 20, 2021. There is one more one-year extension option available at the Company's discretion.
(7) Includes two one-year extensions at the Company's option.
| As of December 31, 2019 | |||||||||||||||||
| Repurchase Facility | Committed Financing | Amount Outstanding | Interest Expense(1) | Ending Weighted Average Interest Rate | Maturity | ||||||||||||
JPM Repo Facility (2) | $ | 300,000 | $ | 107,526 | $ | 6,862 | 4.51 | % | 1/30/2021 | ||||||||
USB Repo Facility (3) | 100,000 | — | 622 | N/A | 6/15/2020 | ||||||||||||
CS Repo Facility (4) | 300,000 | 87,375 | 5,563 | 4.84 | % | 3/27/2020 | |||||||||||
WF Repo Facility (5) | 175,000 | 24,942 | 1,333 | 3.65 | % | 11/21/2020 | |||||||||||
Barclays Revolver Facility (6) | 100,000 | — | 976 | N/A | 9/20/2021 | ||||||||||||
Barclays Repo Facility (7) | 300,000 | 32,700 | 1,260 | 3.80 | % | 3/15/2022 | |||||||||||
| Total | $ | 1,275,000 | $ | 252,543 | $ | 16,616 | |||||||||||
_______________________
(1) For the twelve months ended December 31, 2019. Includes amortization of deferred financing costs.
(2) On September 3, 2019, the committed financing amount was downsized from $520 million to $300 million and the maturity date was amended to January 30, 2021.
(3) Includes two one-year extensions at the option of an indirect wholly-owned subsidiary of the Company, which may be exercised upon the satisfaction of certain conditions.
(4) On March 26, 2019, the Company exercised the extension option upon the satisfaction of certain conditions, and extended the term maturity to March 27, 2020.
(5) Includes three one-year extensions at the Company’s option, which may be exercised upon the satisfaction of certain conditions.
(6) On September 13, 2019, the Company exercised the extension option, and extended the term maturity to September 20, 2021. There is one more one-year extension option available at the Company's discretion.
(7) Includes two one-year extensions at the Company's option.
The Company expects to use the advances from the Repo Facilities are all subject to various adjustments.
The Repo Facilities generally provide that in the event of a decrease in the value of the Company's collateral, the lenders can demand additional collateral. Should the value of the Company’s collateral decrease as a result of deteriorating credit quality, resulting margin calls may cause an adverse change in the Company’s liquidity position. As of September 30, 2017March 31, 2020 and December 31, 2016,2019, the Company is in compliance with all debt covenants.
On March 23, 2020, the Company transferred $15.2 million of its interest in a term loan to Sterling National Bank ("SNB") via a participation agreement. The Company incurred $13.0 thousand of interest expense on SNB for the three months ended March 31, 2020.
Unsecured Debt
On March 26, 2020, the Company and certain of its subsidiaries entered into a financing arrangementmaterial amendment to an existing lending agreement with Pacific Western BankSecurity Benefit Life Insurance Company ("SBL"), secured by a pledge of equity interests in certain of the Company’s subsidiaries, for term financing (“PWB Financing”) on May 17, 2017.a total commitment of $100 million with a maturity of February 10, 2023 and a rate of one-month LIBOR + 4.5%. The PWB Financing providedamendment revised the terms of the existing SBL lending agreement, entered into in February 2020, to permit the Company with $36.2 million and is collateralized by a portfolio asset of $54.2 million. The PWB Financing currently accrues interest at per annum rates equal to the sum of (i) the applicable LIBOR index rate plus (ii) a margin of 4.00%. The PWB Financing initially matures on June 9, 2019, with two one-year extension options at the Company’s option. As of September 30, 2017, the Company had $30.5 million outstandingborrow under the PWB Financing.agreement. The Company incurred $0.7 million$17.0 thousand of interest expense on the PWB Financinglending agreement with SBL for the ninethree months ended September 30, 2017, including amortizationMarch 31, 2020. As of deferred financing cost.March 31, 2020 there was no outstanding balance.
29
BENEFIT STREET PARTNERS REALTY TRUST, INC.
NOTES TO CONSOLIDATED FINANCIAL STATEMENTS
March 31, 2020
(Unaudited)
Repurchase Agreements - Real Estate Securities
The Company has entered into various Master Repurchase Agreements (the "MRAs") that allow the Company to sell real estate securities while providing a fixed repurchase price for the same real estate securities in the future. The repurchase contracts on each security under an MRA generally mature in 30 to 9030-90 days and terms are adjusted for current market rates as necessary. As of September 30, 2017, the Company pledged Tranche C of RFT 2015-FL1 under its MRAs. As of December 31, 2016, the Company pledged Tranche C of RFT 2015-FL1 and its real estate securities available for sale under its MRAs.
Below is a summary of the Company's MRAs as of September 30, 2017March 31, 2020 and December 31, 2016 (in2019 (dollars in thousands):
________________________
| Weighted Average | |||||||||||||||||
| Counterparty | Amount Outstanding | Accrued Interest | Collateral Pledged (1) | Interest Rate | Days to Maturity | ||||||||||||
| As of March 31, 2020 | |||||||||||||||||
| JP Morgan Securities LLC | $ | 159,879 | $ | 595 | $ | 202,688 | 2.21 | % | 11 | ||||||||
| Wells Fargo Securities, LLC | 159,924 | 955 | 190,623 | 2.32 | % | 12 | |||||||||||
| Barclays Capital Inc. | 79,047 | 365 | 106,965 | 2.28 | % | 17 | |||||||||||
| Citigroup Global Markets, Inc. | 98,030 | 653 | 109,500 | 2.60 | % | 16 | |||||||||||
| Total/Weighted Average | $ | 496,880 | $ | 2,568 | $ | 609,776 | 2.33 | % | 13 | ||||||||
| As of December 31, 2019 | |||||||||||||||||
| JP Morgan Securities LLC | $ | 83,353 | $ | 124 | $ | 93,500 | 2.53 | % | 20 | ||||||||
| Wells Fargo Securities, LLC | $ | 178,304 | $ | 1,199 | $ | 209,873 | 2.94 | % | 11 | ||||||||
| Barclays Capital Inc. | $ | 40,720 | $ | 221 | $ | 47,475 | 2.81 | % | 23 | ||||||||
| Citigroup Global Markets, Inc. | 91,982 | 413 | 103,453 | 2.69 | % | 19 | |||||||||||
| Total/Weighted Average | $ | 394,359 | $ | 1,957 | $ | 454,301 | 2.79 | % | 16 | ||||||||
| Weighted Average | |||||||||||||||||
| Counterparty | Amount Outstanding | Accrued Interest | Fair Value Collateral Pledged (*) | Interest Rate | Days to Maturity | ||||||||||||
| As of September 30, 2017 | |||||||||||||||||
| J.P. Morgan Securities LLC | $ | 39,035 | $ | 74 | $ | 55,764 | 2.97 | % | 6 | ||||||||
| Total/Weighted Average | $ | 39,035 | $ | 74 | $ | 55,764 | 2.97 | % | 6 | ||||||||
| As of December 31, 2016 | |||||||||||||||||
| J.P. Morgan Securities LLC | $ | 59,122 | $ | 96 | $ | 92,658 | 2.55 | % | 6 | ||||||||
| Citigroup Global Markets, Inc. | 3,879 | 1 | 4,850 | 2.11 | % | 26 | |||||||||||
| Wells Fargo Securities, LLC | 3,638 | 4 | 4,850 | 2.05 | % | 13 | |||||||||||
| Total/Weighted Average | $ | 66,639 | $ | 101 | $ | 102,358 | 2.50 | % | 8 | ||||||||
Collateralized Loan ObligationObligations
On October 19, 2015, RFT 2015-FL1January 15, 2020, the Company called all of the outstanding notes issued by BSPRT 2017-FL2 Issuer, Ltd. (the “2015 Issuer”), a wholly owned indirect subsidiary of the Company. The outstanding principal of the notes on the date of the call was $21.0 million. The Company recognized all the remaining unamortized deferred financing costs of $4.5 million recorded within the Interest expense line of the consolidated statements of operations, which was a non-cash charge.
As of March 31, 2020 and RFT 2015-FL1December 31, 2019 the notes issued by BSPRT 2018-FL3 Issuer, Ltd. and BSPRT 2018-FL3 Co-Issuer, LLC, (the “2015 Co-Issuer”), both wholly owned indirect subsidiaries of the Company, entered into an indenture with the OP, as advancing agent, U.S. Bank National Association as note administrator and U.S. Bank National Association as trustee, which governs the issuance of approximately $350.2 million principal balance secured floating rate notes (the “Notes”). In addition, concurrently with the issuance of the Notes, the 2015 Issuer also issued 78,188,494 Preferred Shares, par value of $0.001 per share and with an aggregate liquidation preference and notional amount equal to $1,000 per share (the “Preferred Shares”), which were not offered as part of closing the indenture. For U.S. federal income tax purposes, the 2015 Issuer and 2015 Co-Issuer are disregarded entities.
As of March 31, 2020 and December 31, 2019 the notes issued by BSPRT 2018-FL4 Issuer, Ltd. and BSPRT 2018-FL4 Co-Issuer, LLC, each wholly owned indirect subsidiaries of the Company, are collateralized by interests in a pool of 53 and 49 mortgage assets having a principal balance of $868.7 million and $867.9 million, respectively (the "2018-FL4 Mortgage Assets"). The sale of the 2018-FL4 Mortgage Assets to BSPRT 2018-FL4 Issuer is governed by a Mortgage Asset Purchase Agreement dated as of October 19, 2015,12, 2018, between the Company and the 2015BSPRT 2018-FL4 Issuer. In connection with the securitization, the 2015 Issuer and 2015 Co-Issuer offered and sold the following classes of Notes to third parties: Class A, Class B and Class C. A wholly owned subsidiary of the Company retained approximately $56.0 million of the total $76.0 million of Class C and all of the preferred equity in the Issuer. The retained Class C and its related interest income and the preferred equity are eliminated in the Company's consolidated financial statements. The Company, as the holder of preferred equity in the 2015 Issuer, will absorb the first losses of the CLO, which may have a negative impact to the Company's result of operations. The issuance of the CLO also results in an increase in interest expense within the Consolidated Statements of Operations.
As of September 30, 2017March 31, 2020 and December 31, 2019, the CLO Notesnotes issued in 2017by BSPRT 2019-FL5 Issuer, Ltd. and BSPRT 2019-FL5 Co-Issuer, LLC, each wholly owned indirect subsidiaries of the Company, are collateralized by interests in a pool of 2353 and 48 mortgage assets having a total principal balance of $418.1$803.4 million and $809.4 million respectively (the “Mortgage Assets”"2019-FL5 Mortgage Assets") originated by a subsidiary of the Company.. The sale of the 2019-FL5 Mortgage Assets to the 2017BSPRT 2019-FL5 Issuer is governed by a Mortgage Asset Purchase Agreement dated as of June 29, 2017,May 30, 2019, between the Company and the 2017BSPRT 2019-FL5 Issuer. In connection with the securitization, the 2017 Issuer and 2017 Co-Issuer offered and sold the following classes of Notes to third parties: Class A, Class B and Class C. A wholly owned subsidiary of the Company retained all of the preferred equity in the 2017 Issuer. The Company, as the holder of preferred equity in the 2017 Issuer, will absorb the first losses of the CLO, which may have a negative impact to the Company's result of operations. The issuance of the CLO also results in an increase in interest expense within the Consolidated Statements of Operations.
BENEFIT STREET PARTNERS REALTY TRUST, INC.
NOTES TO CONSOLIDATED FINANCIAL STATEMENTS
(Unaudited)
The Company, through its wholly-owned subsidiaries, holds the preferred equity tranches of the above CLOs of approximately $256.9 million and $305.4 million as of March 31, 2020 and December 31, 2019, respectively. The following tables representtable represents the terms of the 2015notes issued by the 2018-FL3 Issuer, 2018-FL4 Issuer and 2017 CLOs issued, respectively.2019-FL5 Issuer (the "CLOs), respectively, as of March 31, 2020 (dollars in thousands):
| CLO Facility | Tranche | Par Value Issued | Par Value Outstanding (1) | Interest Rate | Maturity Date | |||||||||
| 2018-FL3 Issuer | Tranche A | $ | 286,700 | $ | 275,800 | 1M LIBOR + 105 | 10/15/2034 | |||||||
| 2018-FL3 Issuer | Tranche A-S | 77,775 | 77,775 | 1M LIBOR + 135 | 10/15/2034 | |||||||||
| 2018-FL3 Issuer | Tranche B | 41,175 | 41,175 | 1M LIBOR + 165 | 10/15/2034 | |||||||||
| 2018-FL3 Issuer | Tranche C | 39,650 | 39,650 | 1M LIBOR + 255 | 10/15/2034 | |||||||||
| 2018-FL3 Issuer | Tranche D | 42,700 | 42,700 | 1M LIBOR + 345 | 10/15/2034 | |||||||||
| 2018-FL4 Issuer | Tranche A | 416,827 | 416,827 | 1M LIBOR + 105 | 9/15/2035 | |||||||||
| 2018-FL4 Issuer | Tranche A-S | 73,813 | 73,813 | 1M LIBOR + 130 | 9/15/2035 | |||||||||
| 2018-FL4 Issuer | Tranche B | 56,446 | 56,446 | 1M LIBOR + 160 | 9/15/2035 | |||||||||
| 2018-FL4 Issuer | Tranche C | 68,385 | 68,385 | 1M LIBOR + 210 | 9/15/2035 | |||||||||
| 2018-FL4 Issuer | Tranche D | 57,531 | 57,531 | 1M LIBOR + 275 | 9/15/2035 | |||||||||
| 2019-FL5 Issuer | Tranche A | 407,025 | 407,025 | 1M LIBOR + 115 | 5/15/2029 | |||||||||
| 2019-FL5 Issuer | Tranche A-S | 76,950 | 76,950 | 1M LIBOR + 148 | 5/15/2029 | |||||||||
| 2019-FL5 Issuer | Tranche B | 50,000 | 50,000 | 1M LIBOR + 140 | 5/15/2029 | |||||||||
| 2019-FL5 Issuer | Tranche C | 61,374 | 61,374 | 1M LIBOR + 200 | 5/15/2029 | |||||||||
| 2019-FL5 Issuer | Tranche D | 48,600 | 5,000 | 1M LIBOR + 240 | 5/15/2029 | |||||||||
| 2019-FL5 Issuer | Tranche E | 20,250 | 3,000 | 1M LIBOR + 285 | 5/15/2029 | |||||||||
| $ | 1,825,201 | $ | 1,753,451 | |||||||||||
| 2015 Facility ($000s) | Par Value Issued | Par Value Outstanding (*) | Interest Rate | Maturity Date | ||||||||
| As of September 30, 2017 | ||||||||||||
| Tranche A | $ | 231,345 | $ | 124,690 | 1M LIBOR + 175 | 8/1/2030 | ||||||
| Tranche B | 42,841 | 42,841 | 1M LIBOR + 388 | 8/1/2030 | ||||||||
| Tranche C | 76,044 | 20,000 | 1M LIBOR + 525 | 8/1/2030 | ||||||||
| $ | 350,230 | $ | 187,531 | |||||||||
| As of December 31, 2016 | ||||||||||||
| Tranche A | $ | 231,345 | $ | 222,195 | 1M LIBOR + 175 | 8/1/2030 | ||||||
| Tranche B | 42,841 | 42,841 | 1M LIBOR + 388 | 8/1/2030 | ||||||||
| Tranche C | 76,044 | 20,000 | 1M LIBOR + 525 | 8/1/2030 | ||||||||
| $ | 350,230 | $ | 285,036 | |||||||||
31
| 2017 Facility ($000s) | Par Value Issued | Par Value Outstanding | Interest Rate | Maturity Date | ||||||||
| As of September 30, 2017 | ||||||||||||
| Tranche A | $ | 223,600 | $ | 223,600 | 1M LIBOR + 135 | 7/1/2027 | ||||||
| Tranche B | 48,000 | 48,000 | 1M LIBOR + 240 | 7/1/2027 | ||||||||
| Tranche C | 67,900 | 67,900 | 1M LIBOR + 425 | 7/1/2027 | ||||||||
| $ | 339,500 | $ | 339,500 | |||||||||
BENEFIT STREET PARTNERS REALTY TRUST, INC.
NOTES TO CONSOLIDATED FINANCIAL STATEMENTS
March 31, 2020
(Unaudited)
The following table represents the terms of the notes issued by the 2017-FL1 Issuer, 2017-FL2 Issuer, 2018-FL3 Issuer and 2018-FL4 Issuer, as of December 31, 2019 (dollars in thousands):
| CLO Facility | Tranche | Par Value Issued | Par Value Outstanding (1) | Interest Rate | Maturity Date | |||||||||
| 2017-FL2 Issuer | Tranche A | $ | 237,970 | $ | — | 1M LIBOR + 82 | 10/15/2034 | |||||||
| 2017-FL2 Issuer | Tranche A-S | 36,357 | — | 1M LIBOR + 110 | 10/15/2034 | |||||||||
| 2017-FL2 Issuer | Tranche B | 26,441 | — | 1M LIBOR + 140 | 10/15/2034 | |||||||||
| 2017-FL2 Issuer | Tranche C | 25,339 | — | 1M LIBOR + 215 | 10/15/2034 | |||||||||
| 2017-FL2 Issuer | Tranche D | 35,255 | 21,444 | 1M LIBOR + 345 | 10/15/2034 | |||||||||
| 2018-FL3 Issuer | Tranche A | 286,700 | 286,700 | 1M LIBOR + 105 | 10/15/2034 | |||||||||
| 2018-FL3 Issuer | Tranche A-S | 77,775 | 77,775 | 1M LIBOR + 135 | 10/15/2034 | |||||||||
| 2018-FL3 Issuer | Tranche B | 41,175 | 41,175 | 1M LIBOR + 165 | 10/15/2034 | |||||||||
| 2018-FL3 Issuer | Tranche C | 39,650 | 39,650 | 1M LIBOR + 255 | 10/15/2034 | |||||||||
| 2018-FL3 Issuer | Tranche D | 42,700 | 42,700 | 1M LIBOR + 345 | 10/15/2034 | |||||||||
| 2018-FL4 Issuer | Tranche A | 416,827 | 416,827 | 1M LIBOR + 105 | 9/15/2035 | |||||||||
| 2018-FL4 Issuer | Tranche A-S | 73,813 | 73,813 | 1M LIBOR + 130 | 9/15/2035 | |||||||||
| 2018-FL4 Issuer | Tranche B | 56,446 | 56,446 | 1M LIBOR + 160 | 9/15/2035 | |||||||||
| 2018-FL4 Issuer | Tranche C | 68,385 | 68,385 | 1M LIBOR + 210 | 9/15/2035 | |||||||||
| 2018-FL4 Issuer | Tranche D | 57,531 | 57,531 | 1M LIBOR + 275 | 9/15/2035 | |||||||||
| 2019-FL5 Issuer | Tranche A | 407,025 | 407,025 | 1M LIBOR + 115 | 5/15/2029 | |||||||||
| 2019-FL5 Issuer | Tranche A-S | 76,950 | 76,950 | 1M LIBOR + 148 | 5/15/2029 | |||||||||
| 2019-FL5 Issuer | Tranche B | 50,000 | 50,000 | 1M LIBOR + 140 | 5/15/2029 | |||||||||
| 2019-FL5 Issuer | Tranche C | 61,374 | 61,374 | 1M LIBOR + 200 | 5/15/2029 | |||||||||
| 2019-FL5 Issuer | Tranche D | 48,600 | 24,300 | 1M LIBOR + 240 | 5/15/2029 | |||||||||
| 2019-FL5 Issuer | Tranche E | 20,250 | 20,250 | 1M LIBOR + 285 | 5/15/2029 | |||||||||
| $ | 2,186,563 | $ | 1,822,345 | |||||||||||
(1) Excludes $261.4 million of CLO notes, held by the Company, which are eliminated within the collateralized loan obligation line of the consolidated balance sheets as of December 31, 2019.
32
BENEFIT STREET PARTNERS REALTY TRUST, INC.
NOTES TO CONSOLIDATED FINANCIAL STATEMENTS
March 31, 2020
(Unaudited)
The below table reflects the total assets and liabilities of the Company's twooutstanding CLOs. The CLOs are considered VIEs and are consolidated into the Company's consolidated financial statements as of September 30, 2017March 31, 2020 and December 31, 20162019 as the Company is the primary beneficiary of the VIEs.VIE. The Company is the primary beneficiary of the CLOs because (i) the Company has the power to direct the activities that most significantly affect the VIEs'VIE’s economic performance and (ii) the right to receive benefits from the VIEs or the obligation to absorb losses of the VIEs that could be significant to the VIEs.VIE.
-17
BENEFIT STREET PARTNERS REALTY TRUST, INC.
NOTES TO CONSOLIDATED FINANCIAL STATEMENTSSeptember 30, 2017(Unaudited)
_______________________________________________
BasicThe Company uses the two-class method in calculating basic and diluted earnings per share. Net income/(loss) is allocated between our common share (“EPS”) is computed by dividingstock and other participating securities based on their participation rights. Diluted net income ofper share has been computed using the Company by the weighted-average number of common shares outstanding. Diluted EPS is computed in the same manner as basic EPS, except theweighted average number of shares is increased to include additionalof common shares that would have beenstock outstanding if potential common shares with aand other dilutive effect had been issued. Potential common shares consist primarily of share-based compensation awards calculated using the treasury stock method. As of September 30, 2017 and September 30, 2016, the Company did not have any anti-dilutive common shares outstanding.securities. The following table ispresents a summaryreconciliation of the numerators and denominators of the basic and diluted net incomeearnings per share computationcomputations and the calculation of basic and diluted earnings per share for the three and nine months ended September 30, 2017March 31, 2020 and 2016, respectively:March 31, 2019 (in thousands, except share and per share data):
OnAs of March 31, 2020 and December 30, 2014,31, 2019, the Company filed with the Maryland State Department of Assessmentshad 40,514 and Taxation articles supplementary to its charter that reclassified 1,000 authorized but unissued40,500 shares of the Company’s common stock asSeries A Preferred Stock outstanding, respectively and 1,400 shares of convertible stock and setSeries C Preferred Stock outstanding.
-18
BENEFIT STREET PARTNERS REALTY TRUST, INC.
NOTES TO CONSOLIDATED FINANCIAL STATEMENTSSeptember 30, 2017(Unaudited)
Company, with payouts dependent on the achievement of certain stockholder total return thresholds. Subsequent to September 30, 2016, the Company determined that as a result of the termination of the advisory agreement between the Former Advisor and the Company a triggering event had occurred. Based on the Company’s determination of the enterprise value of the Company on the date of the triggering event, the total distributions paid to the Company’s stockholders through the date of the triggering event, and the sum ofactivity in the Company's stockholders’ invested capital as ofSeries A Preferred Stock for the date ofperiods ended March 31, 2020 and March 31, 2019, respectively (dollars in thousands, except share amounts):
On May 13, 2013, the Company's board of directors authorized and declared a distribution calculated daily at a rate of $0.00565068493 per day, which is equivalent to $2.0625 per annum, per share of common stock. In March 2016, the Company's board of directors ratified the existing distribution amount equivalent to $2.0625 per annum for calendar year 2016. On November 10, 2016 the Company’s board of directors changed the DRIP offer price to $20.05, which is equal to the estimated per-share NAV as of September 30, 2016 approved by the board of directors. In August 2017, the Company’s board of directors authorized and declared a distribution calculated daily at a rate of $0.00394521 per day, which is equivalent to $1.44 per annum, per share of common stock. The price change was applied to the reinvestment of distributions commencing with the October 2016 distributions. On May 10, 2017, the Company’s board of directors changed the methodology used to determine the DRIP offer price to be the lesser of (i) the Company’s most recent estimated per-share NAV, as approved by the Company’s board of directors from time to time, and (ii) the Company’s book value per share, computed in accordance with GAAP. Based on this new methodology, the DRIP offer price for May 2017, June 2017 and July 2017 was $19.62 per share, which was the GAAP book value per share as of March 31, 2017. The DRIP offer price for September 2017, October 2017 and November 2017 was $19.29 per share, which was the GAAP book value per share as of June 30, 2017. Starting December 2017 the DRIP offer price will be $19.02 per share, which is the Company's estimated per share NAV as of September 30, 2017.
-19
BENEFIT STREET PARTNERS REALTY TRUST, INC.
NOTES TO CONSOLIDATED FINANCIAL STATEMENTSSeptember 30, 2017(Unaudited)
-2037
September 30, 2017March 31, 2020
The Company entered intoAdvisory Agreement Fees and ReimbursementsThe Advisor receives an acquisition fee of 1.0% of the principal amount funded by the Company makes or was required to originate or acquire commercial mortgage loans (or anticipated net equity funded bymake the following payments and reimbursements to the Advisor:Until September 29, 2016, the Former Advisor served as the Company’s advisorthree months ended March 31, 2020 and March 31, 2019 and the Companyassociated payable as of March 31, 2020 and December 31, 2019 (dollars in thousands):
________________________Duringduring the three and nine months ended September 30, 2017, the Company paid acquisition feesMarch 31, 2020 and expenses of $3.0March 31, 2019 were $2.1 million and $9.0$1.8 million respectively, of which $1.7$2.0 million and $4.2$1.5 million respectively, have been recognizedwere capitalized within the commercial mortgage loans, held for investment line of the consolidated balance sheets for the periods ended March 31, 2020 and 2019.
-2138
September 30, 2017March 31, 2020
expenses included in CommercialOther TransactionsDuring the three and nine months ended September 30, 2016,On March 26, 2020, the Company paid acquisition fees and expensescertain of $0.3its subsidiaries entered into a material amendment to an existing lending agreement with SBL, an entity that also holds 14,950 of the Company’s outstanding shares of Series A Preferred Stock, secured by a pledge of equity interests in certain of the Company’s subsidiaries, for a total commitment of $100.0 million with a maturity of February 10, 2023 and $0.6 million respectively, and recognizeda rate of one-month LIBOR + 4.5%. The amendment revised the same amounts respectively,terms of the existing SBL lending agreement, entered into in Acquisition fees and expensesFebruary 2020, to permit the Company to borrow under the agreement. The Company incurred $17 thousand of interest expense on the Company's consolidated statements of operations. The Company did not capitalize any acquisitions expenseslending agreement with SBL for the three and nine months ended September 30, 2016.The Company paid the Former Advisor, or its affiliates, a monthly asset management fee equal to one-twelfthMarch 31, 2020. As of 0.75% of the cost of the Company's assets. The asset management feeMarch 31, 2020 there was based on the lower of the cost of the Company's assets and the fair value of the Company's assets (fair value consist of the market value of each portfolio investment as determined by the Former Advisor in accordance with the Company's valuation guidelines).During the three and nine months ended September 30, 2017, the Company incurred $2.3 million and $7.0 million in asset management fees, respectively. During the three and nine months ended September 30, 2016, the Company incurred $1.1 million and $7.1 million in asset management fees, respectively. These asset management fees are recorded in "Asset management and subordinated performance fee" within the consolidated statements of operations.The Company is required to pay the Advisor an annual subordinated performance fee calculated on the basis of total return to stockholders, payable monthly in arrears, such that for any year in which total return on stockholders’ capital exceeds 6.0% per annum, the Former Advisor will be entitled to 15.0% of the excess total return; provided that in no event will the annual subordinated performance fee payable to the Former Advisor exceed 10.0% of the aggregate total return for such year. This fee will be payable only upon the sale of assets, distributions or other event which results in the Company's return on stockholders’ capital exceeding 6.0% per annum.The Company did not incur an annual subordinated performance fee during the three and nine months ended September 30, 2017 and September 30, 2016. These subordinated performance fees are recorded in "Asset management and subordinated performance fees" within the Company's consolidated statements of operations.The table below depicts related party fees and reimbursements in connection with the operations of the Company for the three and nine months ended September 30, 2017 and 2016 and the associated payable as of September 30, 2017 and December 31, 2016 (in thousands):
The payables as of September 30, 2017 and December 31, 2016 in the table above are included in "Due to affiliates" in the Company's consolidated balance sheets.Subject to the limitations outlined below, the Company reimbursed the Former Advisor's cost of providing administrative services and personnel costs in connection with other services provided, in addition to paying an asset management fee;outstanding balance.
-22
BENEFIT STREET PARTNERS REALTY TRUST, INC.
NOTES TO CONSOLIDATED FINANCIAL STATEMENTSSeptember 30, 2017(Unaudited)
however, the Company did not reimburse the Former Advisor for personnel costs in connection with services for which the Former Advisor received acquisition fees or disposition fees. For the three and nine months ended September 30, 2017, the Company incurred $1.5 million and $3.3 million of administrative costs in connection with the operations of the Company, which is included in "Administrative services expenses" in the consolidated statements of operations. For the three and nine months ended September 30, 2016, the Company incurred $2.5 million and $3.8 million of administrative costs in connection with the operations of the Company, which is included in "Administrative services expenses" in the consolidated statements of operations.The Advisor is required to pay any expenses in which the Company's operating expenses as defined by North American Securities Administrators Association at the end of the four preceding fiscal quarters exceeds the greater of (i) 2.0% of average invested assets or (ii) 25.0% of net income for such expense year. For the preceding four fiscal quarters, the Company did not exceed the greater of the two aforementioned criteria as of September 30, 2017.The Company has also established a restricted share plan for the benefit of employees, directors, employees of the Advisor and its affiliates.
values, these real estate securities are classified in either Level II or Level III of the fair value hierarchy. The Company obtains current market spread information where available and uses this information in evaluating and validating the market price of all CMBS.securities. Depending upon the significance of the fair value inputs used in determining these fair values, these real estate securities are classified in either Level II or Level III of the fair value hierarchy. As of September 30, 2017 the Company had no CMBS. As ofMarch 31, 2020 and December 31, 2016,2019 the Company obtained broker quotesthird party pricing for determining the fair value of each CMBS investment, used. As the broker quotes were both limited and non-binding, the Company has classified the CMBS asresulting in a Level III.
II classification.
-2339
September 30, 2017March 31, 2020
-2441
September 30, 2017March 31, 2020
The following table summarizes the valuation method and significant unobservable inputs used for the Company’s financial instruments that are categorized within Level III of the fair value hierarchy as of September 30, 2017. Both observable and unobservable inputs may be used to determine the fair value of positions that the Company has classified within the Level III category. As a result, the unrealized gains and losses for assets and liabilities within the Level III category may include changes in fair value that were attributable to both observable and unobservable inputs.
(1) In determining certain of these inputs, the Company evaluates a variety of factors including economic conditions, industry and market developments, market valuations of comparable companies and company specific developments including exit strategies and realization opportunities. The Company has determined that market participants would take these inputs into account when valuing the investments.(2) Inputs were weighted based on the fair value of the investments included in the range.
-25
BENEFIT STREET PARTNERS REALTY TRUST, INC.
NOTES TO CONSOLIDATED FINANCIAL STATEMENTSSeptember 30, 2017(Unaudited)
The following table presents additional information about the Company’s financial instruments which are measured at fair value on a recurring basis as of September 30, 2017 and December 31, 2016 for which the Company has used Level III inputs to determine fair value (in thousands):
________________________(1) - Unrealized gains included in Other comprehensive income ("OCI") are attributable to assets held at December 31, 2016.
-26
BENEFIT STREET PARTNERS REALTY TRUST, INC.
NOTES TO CONSOLIDATED FINANCIAL STATEMENTSSeptember 30, 2017(Unaudited)
Financial Instruments Measured at Fair Value on a Non-Recurring BasisThe following table presents the Company's financial instruments carried at fair value on a non-recurring basis in the consolidated balance sheets by its level in the fair value hierarchy as of September 30, 2017 and December 31, 2016 (in thousands):
(1) Fair value of the Commercial mortgage loans, held-for-sale as presented in the consolidated balance sheets is recorded at lower of cost or fair value. This treatment resulted in assets of $31,180 and $21,179 at September 30, 2017 and December 31, 2016, respectively.
A reviewIncreases or decreases in any of the fair value hierarchy classification is conducted on a quarterly basis. Changesabove unobservable inputs in the type of inputs mayisolation would result in a reclassification for certain assets. The Company's policy with respect to transfers between levels of thelower or higher fair value hierarchy is to recognize transfers into and out of each levelmeasurement for such assets.
-27
BENEFIT STREET PARTNERS REALTY TRUST, INC.
NOTES TO CONSOLIDATED FINANCIAL STATEMENTSSeptember 30, 2017(Unaudited)
1(1) The carrying value is gross of $2.0$21.7 million and $2.2$0.9 million of allowance for loancredit losses as of September 30, 2017March 31, 2020 and December 31, 2016,2019, respectively.
-28
BENEFIT STREET PARTNERS REALTY TRUST, INC.
NOTES TO CONSOLIDATED FINANCIAL STATEMENTSSeptember 30, 2017(Unaudited)
| Assets (dollars in thousands) | March 31, 2020 | December 31, 2019 | ||||||
Cash (1) | $ | 28,680 | $ | 89,946 | ||||
Commercial mortgage loans, held for investment, net (2) | 2,235,406 | 2,294,663 | ||||||
| Accrued interest receivable | 10,522 | 6,254 | ||||||
| Total Assets | $ | 2,274,608 | $ | 2,390,863 | ||||
| Liabilities | ||||||||
Notes payable (3)(4) | $ | 2,006,137 | $ | 2,064,601 | ||||
| Accrued interest payable | 1,659 | 2,576 | ||||||
| Total Liabilities | $ | 2,007,796 | $ | 2,067,177 | ||||
| Assets ($000s) | September 30, 2017 | December 31, 2016 | ||||||
Cash (1) | $ | 37,615 | $ | 5 | ||||
Commercial mortgage loans, held for investment, net of allowance of $1,431 and $1,017 (2) | 699,928 | 417,057 | ||||||
| Accrued interest receivable | 1,899 | 1,101 | ||||||
| Total assets | $ | 739,442 | $ | 418,163 | ||||
| Liabilities | ||||||||
Notes payable (3)(4) | $ | 571,303 | $ | 334,246 | ||||
| Interest payable | 980 | 564 | ||||||
| Total liabilities | $ | 572,283 | $ | 334,810 | ||||
(1) Includes $37.5$28.2 million and $89.3 million of cash held by the servicer related to CLO loan payoffs as of September 30, 2017.March 31, 2020 and December 31, 2019, respectively.
(2) The balance is presented net of allowance for loancredit loss of $1.4$10.5 million and $1.0$0.8 million as of September 30, 2017March 31, 2020 and December 31, 2016,2019, respectively.
(3) Includes $55.8$267.1 million and $55.8$261.4 million of Tranche C of Company issued CLO notes, held by the Company, which eliminatesare eliminated within the Collateralcollateralized loan obligationsobligation line of the consolidated balance sheets as of September 30, 2017March 31, 2020 and December 31, 2016,2019, respectively.
(4) The balance is presented net of deferred financing cost and discount of $11.5$14.4 million and $6.8$19.2 million as of September 30, 2017March 31, 2020 and December 31, 2016,2019, respectively.
33
BENEFIT STREET PARTNERS REALTY TRUST, INC.
NOTES TO CONSOLIDATED FINANCIAL STATEMENTS
March 31, 2020
(Unaudited)
Note 68 - Net IncomeEarnings Per Share
| Three Months Ended September 30, | Nine Months Ended September 30, | ||||||||||||||
| 2017 | 2016 | 2017 | 2016 | ||||||||||||
| Net income (in thousands) | $ | 6,975 | $ | 5,373 | $ | 19,305 | $ | 23,653 | |||||||
| Basic weighted average shares outstanding | 31,741,679 | 31,516,876 | 31,778,169 | 31,622,796 | |||||||||||
| Unvested restricted shares | 14,824 | 7,035 | 12,098 | 6,274 | |||||||||||
| Diluted weighted average shares outstanding | 31,756,503 | 31,523,911 | 31,790,267 | 31,629,070 | |||||||||||
| Basic net income per share | $ | 0.22 | $ | 0.17 | $ | 0.61 | $ | 0.75 | |||||||
| Diluted net income per share | $ | 0.22 | $ | 0.17 | $ | 0.61 | $ | 0.75 | |||||||
| Three Months Ended March 31, | |||||||
| Numerator | 2020 | 2019 | |||||
| Net income/(Loss) | $ | (7,400 | ) | $ | 19,890 | ||
| Less: Preferred stock dividends | 4,515 | 3,320 | |||||
| Less: Undistributed earnings allocated to preferred stock | — | 462 | |||||
| Net income/(Loss) attributable to common shareholders (for basic and diluted earnings per share) | (11,915 | ) | 16,108 | ||||
| Denominator | |||||||
| Weighted-average common shares outstanding for basic earnings per share | 44,263,334 | 39,798,215 | |||||
| Effect of dilutive shares: | |||||||
| Unvested restricted shares | 11,518 | 13,089 | |||||
| Weighted-average common shares outstanding for diluted earnings per share | 44,274,852 | 39,811,304 | |||||
| Basic earnings per share | $ | (0.27 | ) | $ | 0.40 | ||
| Diluted earnings per share | $ | (0.27 | ) | $ | 0.40 | ||
34
BENEFIT STREET PARTNERS REALTY TRUST, INC.
NOTES TO CONSOLIDATED FINANCIAL STATEMENTS
March 31, 2020
(Unaudited)
Note 79 - Common Stock Transactions
As of September 30, 2017March 31, 2020 and December 31, 2016,2019, the Company had 31,641,27544,396,346 and 31,884,63143,916,815 shares of common stock outstanding, respectively, including shares issued pursuant to the Dividend Reinvestment Plan ("DRIP"Company's distribution reinvestment plan (the "DRIP"), share repurchases and unvested restricted shares.
The following tables present the terms of such convertible shares. The Company then issued 1,000 convertible shares to the Former Advisor for $1.00 per share. The convertible shares automatically converted to shares of common stock upon the first occurrence of certain triggering events, including the termination of the Advisory Agreement with the Former Advisor and the
| Series A Preferred Stock | Shares | Amount | |||||
| Balance, December 31, 2019 | 40,500 | $ | 202,144 | ||||
| Issuance of Preferred Stock, net of offering cost | 14 | 70 | |||||
| Dividends paid in Preferred Stock | — | 2 | |||||
| Offering Costs | — | (5 | ) | ||||
| Amortization of offering costs | — | 24 | |||||
| Ending Balance, March 31, 2020 | 40,514 | $ | 202,235 | ||||
| Shares | Amount | ||||||
| Balance, December 31, 2018 | 29,249 | $ | 145,786 | ||||
| Issuance of Preferred Stock | 2,996 | 14,979 | |||||
| Amortization of offering costs | — | 25 | |||||
| Ending Balance, March 31, 2019 | 32,245 | $ | 160,790 | ||||
The following table presents the triggering event, thatactivity in the convertible shares converted into a number of common shares equal to zero. As a result,Company's Series C Preferred Stock for the convertible shares that were issued to the Former Advisor have been extinguished and no common shares were issuedperiod ended March 31, 2020 (dollars in connection with the conversion and the par value of the shares was transferred to Additional Paid In Capital upon extinguishment.thousands, except share amounts):
| Series C Preferred Stock | Shares | Amount | |||||
| Balance, December 31, 2019 | 1,400 | $ | 6,966 | ||||
| Issuance of Preferred Stock, net of offering cost | — | — | |||||
| Dividends paid in Preferred Stock | — | — | |||||
| Offering Costs | — | (5 | ) | ||||
| Amortization of offering costs | — | 1 | |||||
| Ending Balance, March 31, 2020 | 1,400 | $ | 6,962 | ||||
Distributions
In order to maintain its election to qualify as a REIT, the Company must currently distribute, at a minimum, an amount equal to 90% of its taxable income, without regard to the deduction for distributions paid and excluding net capital gains. The Company must distribute 100% of its taxable income (including net capital gains) to avoid paying corporate U.S. federal income taxes.
The Company's distributions are payable by the fifth day following each month end to stockholders of record at the close of business each day during the prior month. Distribution payments are dependent on the availability of funds. The Company's board of directors may reduce the amount of distributions paid or suspend distribution payments at any time, and therefore, distributions payments are not assured.
For the three months ended March 31, 2020 and March 31, 2019, the Company declared daily common stock distributions equivalent to $1.44 per annum per share. For the three months ended March 31, 2020 and March 31, 2019, the Company declared monthly Preferred Stock dividends per share equivalent to the amount of common stock distributions that would be paid on a conversion of Preferred Stock into common stock.
35
BENEFIT STREET PARTNERS REALTY TRUST, INC.
NOTES TO CONSOLIDATED FINANCIAL STATEMENTS
March 31, 2020
(Unaudited)
As of March 31, 2020 and December 31, 2019, the Company had declared but unpaid common stock distributions of $5.4 million and $5.4 million, respectively. Additionally, as of March 31, 2020 and December 31, 2019, the Company had declared but unpaid Series A Preferred Stock distributions of $1.5 million and $1.5 million, respectively, and $0.1 million and $0.1 million of Series C Preferred stock, respectively. These amounts are included in Distributions payable on the Company’s consolidated balance sheets.
The Company distributed $47.6$15.8 million during the ninethree months ended September 30, 2017,March 31, 2020, comprised of $31.3$12.2 million in cash and $16.3$3.6 million in shares of common stock issued under the DRIP. The Company distributed $49.0$14.0 million during the ninethree months ended September 30, 2016,March 31, 2019, comprised of $30.0$10.6 million in cash and $19.1$3.4 million in shares of common stock issued under the DRIP.
Share Repurchase Program
The Company's board of directors unanimously approved an amended and restated share repurchase program (the “SRP”), which became effective on February 28, 2016. The SRP enables stockholders to sell their shares to the Company. Subject to certain conditions, stockholders that purchased shares of the Company's common stock or received their shares from us (directly or indirectly) through one or more non-cash transactions and have held their shares for a period of at least one year may request that the Company repurchase their shares of common stock so long as the repurchase otherwise complies with the provisions of Maryland law. Repurchase requests made following the death or qualifying disability of a stockholder will not be subject to any minimum holding period.
On August 10, 2017, the Company's board of directors amended the SRP to provide that the repurchase price per share for requests will be equal to the lesser of (i) the Company’s most recent estimated per-share NAV,net asset value ("NAV"), as approved by the Company’s board of directors from time to time, and (ii) the Company’s book value per share, computed in accordance with GAAP, multiplied by a percentage equal to (i) 92.5%, if the person seeking repurchase has held his or her shares for a period greater than one year and less than two years; (ii) 95%, if the person seeking repurchase has held his or her shares for a period greater than two years and less than three years; (iii) 97.5%, if the person seeking repurchase has held his or her shares for a period greater than three years and less than four years; or (iv) 100%, if the person seeking repurchase has held his or her shares for a period greater than four years or in the case of requests for death or qualifying disability.
The Company’s most recent estimated per-share NAV is $19.02 and$18.57, as determined by the board of directors, as of September 30, 2019. The Company’s GAAP book value per share as of September 30, 2017March 31, 2020 is $19.07. These amendments will begin to apply to repurchases made pursuant to the SRP for the fiscal semester ended December 31, 2017.
$16.25.
Repurchase requests related to death or a qualifying disability must satisfy certain conditions, each of which are assessed by and at the sole discretion of the Company, including the following conditions. In the case of death, the shareholder must be a natural person (or a revocable grantor trust) and the Company must receive a written notice from the estate of the shareholder, the recipient of the shares through bequest or inheritance, or the trustee in the case of a revocable grantor trust. In the case of a “qualifying disability”, the shareholder must be a natural person (or a revocable grantor trust) and the Company must receive a written notice from the shareholder, or the trustee in the case of a revocable grantor trust, that the condition was not pre-existing on the date the shares were acquired. In order for a disability to be considered a “qualifying disability”, the shareholder must receive and provide evidence (the shareholder application and the notice of final determination) of disability based upon a physical or mental condition or impairment made by a government agency responsible for reviewing and determining disability retirement benefits (e.g. the Social Security Administration).
36
BENEFIT STREET PARTNERS REALTY TRUST, INC.
NOTES TO CONSOLIDATED FINANCIAL STATEMENTS
March 31, 2020
(Unaudited)
Repurchases pursuant to the SRP, when requested, generally will be made semiannually (each six-month period ending June 30 or December 31, a “fiscal semester”). Repurchases for any fiscal semester will be limited to a maximum of 2.5% of the weighted average number of shares of common stock outstanding during the previous fiscal year, with a maximum for any fiscal year of 5.0% of the weighted average number of shares of common stock outstanding during the previous fiscal year. Funding for repurchases pursuant to the SRP for any given fiscal semester will be limited to proceeds received during that same fiscal semester through the issuance of common stock pursuant to any DRIP in effect from time to time, provided that the Company's board of directors has the power, in its sole discretion, to determine the amount of shares repurchased during any fiscal semester as well as the amount of funds to be used for that purpose. Any repurchase requests received during such fiscal semester will be paid at the price, computed as described above on the last day of such fiscal semester. On March 26, 2020, the Company temporarily suspended the DRIP. Therefore amounts available to fund repurchases for the first semester of 2020 will be limited to DRIP proceeds from January and February 2020, and amounts available to fund repurchases for the second semester of 2020 will depend on the amount of dividends paid and the reactivation of the DRIP. Due to these limitations, the Company cannot guarantee that the Company will be able to accommodate all repurchase requests made during any fiscal semester or fiscal year. However, a stockholder may withdraw its request at any time or ask that the Company honors the request when funds are available. Pending repurchase requests will be honored on a pro rata basis. The Company will generally pay repurchase proceeds, less any applicable tax or other withholding required by law, by the 31st day following the end of the fiscal semester during which the repurchase request was made.
When a stockholder requests redemption and the redemption is approved, the Company will reclassify such obligation from equity to a liability based on the settlement value of the obligation. Shares repurchased under the SRP will have the status of authorized but unissued shares.
The following table reflects the number of shares repurchased under the SRP cumulatively through September 30, 2017:March 31, 2020:
_______________________
| Number of Requests | Number of Shares Repurchased | Average Price per Share | |||||||
| Cumulative as of December 31, 2019 | 5,878 | 3,542,267 | $ | 20.23 | |||||
January 1 - January 31, 2020(1) | 1,170 | 361,829 | 18.56 | ||||||
| February 1 - February 28, 2020 | — | — | N/A | ||||||
| March 1 - March 31, 2020 | — | — | N/A | ||||||
| Cumulative as of March 31, 2020 | 7,048 | 3,904,096 | $ | 20.08 | |||||
| Number of Requests | Number of Shares Repurchased | Average Price per Share | ||||||||
| Cumulative as of December 31, 2016 | 985 | 918,683 | $ | 23.94 | ||||||
| January 1 - March 31, 2017 | 502 | 496,678 | 19.04 | |||||||
| April 1 - June 30, 2017 | 2 | 327 | 20.08 | |||||||
| July 1 - September 30, 2017 | 636 | 575,703 | 19.24 | |||||||
| Cumulative as of September 30, 2017 | 2,125 | 1,991,391 | $ | 21.37 | ||||||
Note 810 - Commitments and Contingencies
Unfunded Commitments forUnder Commercial Mortgage Loans
As of September 30, 2017March 31, 2020 and December 31, 2016,2019, the Company had the below unfunded commitments to the Company's borrowers.borrowers (dollars in thousands):
| Funding Expiration | March 31, 2020 | December 31, 2019 | |||||
| 2020 | $ | 62,515 | $ | 90,519 | |||
| 2021 | 78,497 | 100,861 | |||||
| 2022 | 64,972 | 56,863 | |||||
| 2023 | 68,664 | 8,637 | |||||
| 2024 and beyond | 5,450 | 5,450 | |||||
| $ | 280,098 | $ | 262,330 | ||||
The borrowers are required to meet or maintain certain metrics in order to qualify for the unfunded commitment amounts.
BENEFIT STREET PARTNERS REALTY TRUST, INC.
NOTES TO CONSOLIDATED FINANCIAL STATEMENTS
(Unaudited)
| Funding Expiration | September 30, 2017 | December 31, 2016 | ||||||
| 2016 | $ | — | $ | — | ||||
| 2017 | 4,766 | 7,794 | ||||||
| 2018 | 44,180 | 62,368 | ||||||
| 2019 | 27,705 | 9,072 | ||||||
| 2020 | 19,856 | — | ||||||
| Total | $ | 96,507 | $ | 79,234 | ||||
Litigation and Regulatory Matters
In the ordinary course of business, the Company may become subject to litigation, claims and regulatory matters. Except as noted below, theThe Company has no knowledge of material legal or regulatory proceedings pending or known to be contemplated against the Company at this time. On June 6, 2016, an action was filed against the Company and two of its directors in the United States District Court for the Southern District of New York and styled Rurode v. Realty Finance Trust, Inc., et. al., No. 1:16-cv-04553. The plaintiff’s individual and derivative complaint alleged that the Company made material misstatements in the proxy statement for its 2016 annual stockholder’s meeting related to an alleged planned merger transaction between the Company and an affiliate of its Former advisor. The plaintiff alleged violations of Section 14(a) of the Securities Exchange Act of 1934 and sought to enjoin the Company’s 2016 annual meeting. On June 28, 2016, the parties filed, and the court subsequently entered, a stipulation and order of dismissal of the action, but provided that the court would retain jurisdiction to consider any application by plaintiff for an award of attorneys’ fees. On October 20, 2016, the plaintiff submitted a request for $0.75 million in fees and expenses. On November 14, 2016, the defendants filed a memorandum of law in opposition to that fee request. On July 19, 2017, the Company and the plaintiff entered into an agreement pursuant to which the Company paid $245,000 in attorneys’ fees and expenses and the plaintiff agreed to withdraw its October 20, 2016 fee request to the court and to release the Company from any further claims related to such fee request.
Note 911 - Related Party Transactions and Arrangements
Pursuant to the Advisory Agreement, with the Advisor on September 29, 2016.
•The Company inreimburses the caseAdvisor’s costs of acquisitions of real estate securities) and receives reimbursement for insourced acquisition expenses of 0.5%; provided, however, that if and when the aggregate purchase price for all investments acquired after the date ofproviding services pursuant to the Advisory Agreement, reaches $600,000,000,except the salaries and benefits paid by the Advisor to the Company’s obligation to pay acquisition fees to the Advisor shall terminate. In no event will the total of all acquisition fees and acquisition expenses exceed 4.5% of the principal amount funded with respect to the Company's total portfolio including subsequent funding to investments in the Company's portfolio. In September 2017, the Company's aggregate purchase price for all investments acquired reached $600,000,000, and concurrently terminated the 1.0% acquisition fee payments to the Advisor for all investments subsequent to the limit being reached.executive officers.
•The Company pays the Advisor, or its affiliates, a monthly asset management fee equal to one-twelfth of 1.5% of stockholder’s equity as calculated pursuant to the Advisory Agreement.
•The Company will pay the Advisor an annual subordinated performance fee calculated on the basis of total return to stockholders, payable monthly in arrears, such that for any year in which total return on stockholders’ capital exceeds 6.0% per annum, theour Advisor will be entitled to 15.0% of the excess total return; provided that in no event will the annual subordinated performance fee payable to theour Advisor exceed 10.0% of the aggregate total return for such year.
•The Company will reimbursereimburses the Advisor for insourced expenses incurred by the Advisor on the Company‘s behalf related to administrative services such as accounting, legalselecting, evaluating, originating and other servicesacquiring investments in accordancean amount up to 0.5% of the principal amount funded by the Company to originate or acquire commercial mortgage loans and up to 0.5% of the anticipated net equity funded by the Company to acquire real estate securities investments.
The table below shows the costs incurred due to arrangements with our Advisor and its affiliates during the advisory agreement.
Three Months Ended March 31, | Payable as of | ||||||||||||||
| 2020 | 2019 | March 31, 2020 | December 31, 2019 | ||||||||||||
Acquisition expenses (1) | $ | 142 | $ | 248 | $ | 1 | $ | 225 | |||||||
| Administrative services expenses | 4,112 | 3,963 | 4,392 | 1,238 | |||||||||||
| Asset management and subordinated performance fee | 3,912 | 3,644 | 5,901 | 3,326 | |||||||||||
Other related party expenses (2)(3) | 582 | 265 | 3,744 | — | |||||||||||
| Total related party fees and reimbursements | $ | 8,748 | $ | 8,120 | $ | 14,038 | $ | 4,789 | |||||||
(1) Total acquisition expenses paid the Former Advisor certain fees and expense reimbursements pursuant to its advisory agreement with the Former Advisor.
(2) These are primarily related to reimbursable costs incurred related to the increase in Acquisition fees andloan origination activities. These amounts are included in Other expenses onin the Company's consolidated statements of operations. In addition, during
(3) The related party payable includes $2.5 million of payments made by the three and nine months ended September 30, 2017,Advisor to third party vendors on behalf of the Company and $0.7 million of capitalized $1.3 millionacquisition expenses that are amortized over the life of the loan.
The payables as of March 31, 2020 and $4.8 million, respectively of acquisition fees andDecember 31, 2019 in the table above are included in Due to affiliates on the Company's consolidated balance sheets.
BENEFIT STREET PARTNERS REALTY TRUST, INC.
NOTES TO CONSOLIDATED FINANCIAL STATEMENTS
(Unaudited)
On February 22, 2018, the Company purchased commercial mortgage loans, withinheld-for-sale from an entity that is an affiliate of our Advisor, for an aggregate purchase price of $27.8 million. The purchase of the Company'scommercial mortgage loans and the $27.8 million purchase price were approved by the Company’s board of directors. On April 18, 2018, the Company sold $23.3 million of these commercial mortgage loans into a CMBS securitization. There had been a full principal pay-down on the remaining $4.5 million of these commercial mortgage loans as of March 31, 2020, which were previously recorded in commercial mortgage loans, held-for-investment, on the consolidated balance sheets, which is amortized over the life of each investment using the effective interest method.sheets.
| Three Months Ended September 30, | Nine Months Ended September 30, | Payable as of | |||||||||||||||||||||||
| 2017 | 2016 | 2017 | 2016 | September 30, 2017 | December 31, 2016 | ||||||||||||||||||||
Total compensation and reimbursement for services provided by the Former Advisor, its affiliates, entities under common control with the Former Advisor and the Former Dealer Manager | $ | — | $ | — | $ | — | $ | — | $ | 480 | $ | 480 | |||||||||||||
| Acquisition fees and expenses | 3,014 | 255 | 8,968 | 635 | 212 | — | |||||||||||||||||||
| Administrative services expenses | 1,480 | — | 2,480 | 3,285 | 3,835 | 1,480 | 1,000 | ||||||||||||||||||
| Advisory and investment banking fee | — | — | — | 6 | — | — | |||||||||||||||||||
| Asset management and subordinated performance fee | 2,299 | 1,066 | 6,952 | 7,091 | 2,299 | 2,439 | |||||||||||||||||||
| Other related party expenses | 87 | 6 | 183 | 56 | 112 | 145 | |||||||||||||||||||
| Total related party fees and reimbursements | $ | 6,880 | $ | 3,807 | $ | 19,388 | $ | 11,623 | $ | 4,583 | $ | 4,064 | |||||||||||||
Note 1012 - Fair Value of Financial Instruments
GAAP establishes a hierarchy of valuation techniques based on the observability of inputs used in measuring financial instruments at fair values. GAAP establishes market-based or observable inputs as the preferred source of values, followed by valuation models using management assumptions in the absence of market inputs. The three levels of the hierarchy are described below:
Level I - Inputs are unadjusted, quoted prices in active markets for identical assets or liabilities at the measurement date.
Level II - Inputs (other than quoted prices included in Level I) are either directly or indirectly observable for the asset or liability through correlation with market data at the measurement date and for the duration of the instrument’s anticipated life.
Level III - Unobservable inputs that reflect the entity’sentity's own assumptions about the assumptions that market participants would use in the pricing of the asset or liability and are consequently not based on market activity, but rather through particular valuation techniques.
The determination of where an asset or liability falls in the above hierarchy requires significant judgment and factors specific to the asset or liability. In instances where the determination of the fair value measurement is based on inputs from different levels of the fair value hierarchy, the level in the fair value hierarchy within which the entire fair value measurement falls is based on the lowest level input that is significant to the fair value measurement in its entirety. The Company evaluates its hierarchy disclosures each quarter and depending on various factors, it is possible that an asset or liability may be classified differently from quarter to quarter.
The Company has implemented valuation control processes to validate the fair value of the Company's financial instruments measured at fair value including those derived from pricing models. These control processes are designed to assure that the values used for financial reporting are based on observable inputs wherever possible. In the event that observable inputs are not available, the control processes are designed to assure that the valuation approach utilized is appropriate and consistently applied and the assumptions are reasonable.
Financial Instruments Measured at Fair Value on a Recurring Basis
CMBS, recorded in real estate securities, held-for-sale, measured at fair value on the consolidated balance sheets are valued utilizing both observable and unobservable market inputs. These factors include projected future cash flows, ratings, subordination levels, vintage, remaining lives, credit issues, and recent trades of similar real estate securities and the spreads used in the prior valuation. Depending upon the significance of the fair value inputs used in determining these fair
II classification.
BENEFIT STREET PARTNERS REALTY TRUST, INC.
NOTES TO CONSOLIDATED FINANCIAL STATEMENTS
(Unaudited)
Commercial mortgage loans held-for-sale, measured at fair value in the Company's TRS are initially recorded at transaction proceeds, which are considered to be the best initial estimate of fair value. The Company engaged the services of a third party independent valuation firm to determine fair value of certain investments held by the Company. Fair value is determined using a discounted cash flow model that primarily considers changes in interest rates and credit spreads, weighted average life and current performance of the underlying collateral. This model uses market data from recent securitizations that have similar collateral to the Company’s loan portfolio and other information available from market participants. All results of the model are evaluated by the Company’s senior investment professionals. The Company alsoclassified the commercial mortgage loans held-for-sale, measured at fair value as Level III.
Other real estate investments, measured at fair value on the consolidated balance sheets are valued using unobservable inputs. The Company engaged the services of a third party independent valuation firm to determine fair value of certain investments, including preferred equity investments, held by the Company. Future profitFair value is determined using a discounted cash flow model that primarily considers changes in interest rates and loss fromcredit spreads, weighted average life and current performance of the securitization is not recognized, but overall spread moves are captured in the loan valuation, theunderlying collateral. The Company classified the commercial mortgage loans held-for-sale,other real estate investments, measured at fair value as Level III.
The fair value for Treasury note futures is derived using market prices. Treasury note futures trade on the Chicago Mercantile Exchange (“CME”). The deliverable instruments are a variety of recently issued 10-year U.S. Treasury notes. The future contracts are liquid and are centrally cleared through the CME. Treasury note futures are generally categorized in Level I of the fair value hierarchy.
The fair value for a credit default swap contract isswaps and interest rate swaps contracts are derived using a pricing modelmodels that isare widely accepted by marketplace participants. Credit default swaps and interest rate swaps are traded in the OTC market. The pricing model takesmodels take into account multiple inputs including specific contract terms, interest rate yield curves, interest rates, credit curves, recovery rates, andand/or current credit spreads obtained from swap counterparties and other market participants. Most inputs into the modelmodels are not subjective as they are observable in the marketplace or set per the contract. Valuation is primarily determined by the difference between the contract spread and the current market spread. The contract spread (or rate) is generally fixed and the market spread is determined by the credit risk of the underlying debt or reference entity. If the underlying indices are liquid and the OTC market for the current spread is active, credit default swaps and interest rate swaps are categorized in Level II of the fair value hierarchy. If the underlying indices are illiquid and the OTC market for the current spread is not active, credit default swaps are categorized in Level III of the fair value hierarchy. The credit default swaps and interest rate swaps are generally categorized in Level II of the fair value hierarchy.
A review of the fair value hierarchy classification is conducted on a quarterly basis. Changes in the type of inputs may result in a reclassification for certain assets or liabilities. The Company's policy with respect to transfers between levels of the fair value hierarchy is to recognize transfers into and out of each level as of the beginning of the reporting period. There were no material transfers between levels within fair value hierarchy during the quarter ended March 31, 2020.
40
BENEFIT STREET PARTNERS REALTY TRUST, INC.
NOTES TO CONSOLIDATED FINANCIAL STATEMENTS
March 31, 2020
(Unaudited)
The following table presents information about the Company’sCompany's financial instruments carried at fair value on a recurring basis in the consolidated balance sheets by its level in the fair value hierarchy as of September 30, 2017March 31, 2020 and December 31, 2016:2019 (dollars in thousands):
| ($ in thousands) | Total | Level I | Level II | Level III | ||||||||||||
| September 30, 2017 | ||||||||||||||||
| Assets, at fair value | ||||||||||||||||
| Real estate securities | $ | — | $ | — | $ | — | $ | — | ||||||||
Commercial mortgage loans, held-for-sale (1) | 60,950 | — | — | 60,950 | ||||||||||||
| Treasury note futures | 754 | 754 | — | — | ||||||||||||
| Credit derivatives | 206 | — | 206 | — | ||||||||||||
| Total assets, at fair value | $ | 61,910 | $ | 754 | $ | 206 | — | $ | 60,950 | |||||||
| Liabilities, at fair value | ||||||||||||||||
| Credit derivatives | $ | 1,003 | $ | — | $ | 1,003 | $ | — | ||||||||
| Total liabilities, at fair value | $ | 1,003 | $ | — | $ | 1,003 | $ | — | ||||||||
| December 31, 2016 | ||||||||||||||||
| Assets, at fair value | ||||||||||||||||
| Real estate securities | $ | 49,049 | $ | — | $ | — | $ | 49,049 | ||||||||
Commercial mortgage loans, held-for-sale (1) | — | — | — | — | ||||||||||||
| Treasury note futures | — | — | — | — | ||||||||||||
| Credit derivatives | — | — | — | — | ||||||||||||
| Total assets, at fair value | $ | 49,049 | $ | — | $ | — | $ | 49,049 | ||||||||
| (1) Loans held in the Company's TRS, reported within "Commercial mortgage loans, held-for-sale, measured at fair value" on the consolidated balance sheets. | ||||||||||||||||
| Total | Level I | Level II | Level III | ||||||||||||
| March 31, 2020 | |||||||||||||||
| Real estate securities, available for sale, measured at fair value | $ | 441,160 | $ | — | $ | 441,160 | $ | — | |||||||
| Commercial mortgage loans, held-for-sale, measured at fair value | 91,813 | — | — | 91,813 | |||||||||||
| Other real estate investments, measured at fair value | 2,496 | — | — | 2,496 | |||||||||||
| Credit default swaps | 1,173 | — | 1,173 | — | |||||||||||
| Interest rate swaps | — | — | — | — | |||||||||||
| Total assets, at fair value | $ | 536,642 | $ | — | $ | 442,333 | $ | 94,309 | |||||||
| Liabilities, at fair value | |||||||||||||||
| Credit default swaps | $ | 4,016 | $ | — | $ | 4,016 | $ | — | |||||||
| Interest rate swaps | 1,512 | — | 1,512 | — | |||||||||||
| Treasury note futures | — | — | — | $ | — | ||||||||||
| Total liabilities, at fair value | $ | 5,528 | $ | — | $ | 5,528 | $ | — | |||||||
| December 31, 2019 | |||||||||||||||
| Real estate securities, available for sale, measured at fair value | $ | 386,316 | $ | — | $ | 386,316 | $ | — | |||||||
| Commercial mortgage loans, held-for-sale, measured at fair value | 112,562 | — | — | 112,562 | |||||||||||
Other real estate investments, measured at fair value | 2,557 | — | — | 2,557 | |||||||||||
| Credit default swaps | 59 | — | 59 | — | |||||||||||
| Interest rate swaps | 325 | — | 325 | — | |||||||||||
| Treasury Note Futures | 735 | 735 | — | — | |||||||||||
| Total assets, at fair value | $ | 502,554 | $ | 735 | $ | 386,700 | $ | 115,119 | |||||||
| Liabilities, at fair value | |||||||||||||||
| Credit Default Swaps | $ | 1,581 | $ | — | $ | 1,581 | $ | — | |||||||
| Total liabilities, at fair value | $ | 1,581 | $ | — | $ | 1,581 | $ | — | |||||||
BENEFIT STREET PARTNERS REALTY TRUST, INC.
NOTES TO CONSOLIDATED FINANCIAL STATEMENTS
(Unaudited)
| September 30, 2017 | Asset Category | Fair Value September 30, 2017 (in thousands) | Valuation Methodologies | Unobservable Inputs (1) | Weighted Average (2) | Range | |
| Commercial mortgage loans, held-for-sale, measured at fair value | $60,950 | Discounted Cash Flow | Yield | 4.39 | % | 4.21%-4.87% | |
| September 30, 2017 | ||||||||
| Commercial Mortgage Loans, held-for-sale, measured at fair value | Real Estate Securities | |||||||
| Beginning balance, January 1, 2017 | $ | — | $ | 49,049 | ||||
| Transfers into Level III | — | |||||||
| Total realized and unrealized gains (losses) included in earnings: | ||||||||
| Realized gain (loss) on sale of real estate securities | — | 172 | ||||||
| Impairment losses on real estate securities | — | |||||||
| Net accretion | — | 167 | ||||||
Unrealized gains (losses) included in OCI (1) | — | 500 | ||||||
| Purchases | 60,950 | — | ||||||
| Sales / paydown | — | (49,888 | ) | |||||
| Cash repayments/receipts | — | — | ||||||
| Transfers out of Level III | — | — | ||||||
| Ending balance, September 30, 2017 | $ | 60,950 | $ | — | ||||
| December 31, 2016 | ||||||||
| Commercial Mortgage Loans, held-for-sale, measured at fair value | Real Estate Securities | |||||||
| Beginning balance, January 1, 2016 | $ | — | $ | — | ||||
| Transfers into Level III | — | 57,639 | ||||||
| Total realized and unrealized gains (losses) included in earnings: | ||||||||
| Realized gain (loss) on sale of real estate securities | — | (874 | ) | |||||
| Impairment losses on real estate securities | — | (310 | ) | |||||
| Net accretion | — | — | ||||||
| Unrealized gains (losses) included in OCI | — | 1,719 | ||||||
| Purchases | — | — | ||||||
| Sales/paydown | — | (9,125 | ) | |||||
| Cash repayments/receipts | — | — | ||||||
| Transfers out of Level III | — | — | ||||||
| Ending balance, December 31, 2016 | $ | — | $ | 49,049 | ||||
| Total | Level I | Level II | Level III | ||||||||||||
| September 30, 2017 | |||||||||||||||
Commercial mortgage loans, held-for-sale (1) | $ | 33,451 | $ | — | $ | — | $ | 33,451 | |||||||
| December 31, 2016 | |||||||||||||||
Commercial mortgage loans, held-for-sale (1) | 21,179 | — | — | 21,179 | |||||||||||
The following table summarizes the valuation method and significant unobservable inputs used for the Company’s financial instruments that are categorized within Level III of the fair value hierarchy as of September 30, 2017andMarch 31, 2020 and December 31, 2016. Both observable and unobservable inputs may be used to determine the fair value of positions that the Company has classified within the Level III category. As a result, the unrealized gains and losses for assets and liabilities within the Level III category may include changes2019 (dollars in fair value that were attributable to both observable and unobservable inputs.thousands):
| Asset Category | Fair Value | Valuation Methodologies | Unobservable Inputs (1) | Weighted Average (2) | Range | ||||
| March 31, 2020 | |||||||||
| Commercial mortgage loans, held-for-sale, measured at fair value | $91,813 | Discounted Cash Flow | Yield | 4.2% | 2.4% - 5.6% | ||||
| Other real estate investments, measured at fair value | 2,496 | Discounted Cash Flow | Yield | 13.4% | 12.4% - 14.4% | ||||
| December 31, 2019 | |||||||||
| Commercial mortgage loans, held-for-sale, measured at fair value | $112,562 | Discounted Cash Flow | Yield | 4.9% | 4.7% - 5.2% | ||||
| Other real estate investments, measured at fair value | 2,557 | Discounted Cash Flow | Yield | 12.4% | 11.4% - 13.4% | ||||
| ($ in thousands) | Asset Category | Fair Value September 30, 2017 | Valuation Methodologies | Unobservable Inputs (1) | Weighted Average (2) | Range | |||
| September 30, 2017 | Commercial mortgage loans, held-for-sale | $ | 33,451 | Discounted Cash Flow | Yield | 10.18 | % | 10% - 13% | |
| December 31, 2016 | Commercial mortgage loans, held-for-sale | $ | 21,179 | Discounted Cash Flow | Yield | 10.80 | % | 10.5% - 11% | |
(1) In determining certain of these inputs, the Company evaluates a variety of factors including economic conditions, industry and market developments, market valuations of comparable companies and company specific developments including exit strategies and realization opportunities. The Company has determined that market participants would take these inputs into account when valuing the investments.
(2) Inputs were weighted based on the fair value of the investments included in the range.
42
BENEFIT STREET PARTNERS REALTY TRUST, INC.
NOTES TO CONSOLIDATED FINANCIAL STATEMENTS
March 31, 2020
(Unaudited)
The following table presents additional information about the Company’s financial instruments which are measured at fair value on a recurring basis as of March 31, 2020 and December 31, 2019 for which the beginning of the reporting period. There were no transfers between levels withinCompany has used Level III inputs to determine fair value hierarchy during the three and nine months ended September 30, 2017.(dollars in thousands):
| March 31, 2020 | ||||||||
| Commercial Mortgage Loans, held-for-sale, measured at fair value | Other Real Estate Investments, measured at fair value | |||||||
| Beginning balance, January 1, 2020 | $ | 112,562 | $ | 2,557 | ||||
| Transfers into Level III | — | — | ||||||
| Total realized and unrealized gain (loss) included in earnings: | ||||||||
| Realized gain (loss) on sale of commercial mortgage loans held-for-sale | 9,404 | — | ||||||
| Unrealized gain (loss) on commercial mortgage loans held-for-sale and other real estate investments | (1,934 | ) | (61 | ) | ||||
| Net accretion | — | — | ||||||
| Purchases | 119,349 | — | ||||||
| Sales / paydowns | (147,568 | ) | — | |||||
| Cash repayments/receipts | — | — | ||||||
| Transfers out of Level III | — | — | ||||||
| Ending Balance, March 31, 2020 | $ | 91,813 | $ | 2,496 | ||||
| December 31, 2019 | ||||||||
| Commercial Mortgage Loans, held-for-sale, measured at fair value | Other Real Estate Investments, measured at fair value | |||||||
| Beginning balance, January 1, 2019 | $ | 76,863 | $ | — | ||||
| Transfers into Level III | — | — | ||||||
| Total realized and unrealized gain (loss) included in earnings: | ||||||||
| Realized gain (loss) on sale of real estate securities | 37,832 | — | ||||||
| Realized gain (loss) on sale of commercial mortgage loan held-for-sale | — | — | ||||||
| Unrealized gain (loss) on commercial mortgage loans held-for-sale | 312 | 47 | ||||||
| Net accretion | — | — | ||||||
| Purchases | 1,015,677 | 2,510 | ||||||
| Sales / paydowns | (1,008,050 | ) | — | |||||
| Cash repayments/receipts | — | — | ||||||
| Transfers out of Level III | (10,072 | ) | — | |||||
| Ending Balance, December 31, 2019 | $ | 112,562 | $ | 2,557 | ||||
43
BENEFIT STREET PARTNERS REALTY TRUST, INC.
NOTES TO CONSOLIDATED FINANCIAL STATEMENTS
March 31, 2020
(Unaudited)
The fair value of cash and cash equivalents and restricted cash are measured using observable quoted market prices, or Level I inputs and their carrying value approximates their fair value. The fair value of borrowings under repurchase agreements approximate their carrying value on the consolidated balance sheets due to their short-term nature, and are measured using Level II inputs.
Financial Instruments Not Measured at Fair Value
The fair values of the Company's commercial mortgage loans, held-for-investmentheld for investment and collateralized loan obligations, which are not reported at fair value on the consolidated balance sheets are reported below as of September 30, 2017March 31, 2020 and December 31, 2016 (in2019 (dollars in thousands):
| Level | Carrying Amount | Fair Value | |||||||||
| September 30, 2017 | |||||||||||
Commercial mortgage loans, held-for-investment (1) | Asset | III | $ | 1,287,065 | $ | 1,281,114 | |||||
| Collateralized loan obligation | Liability | II | 515,500 | 583,046 | |||||||
| December 31, 2016 | |||||||||||
Commercial mortgage loans, held-for-investment (1) | Asset | III | 1,048,737 | 1,029,756 | |||||||
| Collateralized loan obligation | Liability | II | 278,450 | 282,001 | |||||||
| Level | Carrying Amount (1)(2) | Fair Value | |||||||||
| March 31, 2020 | |||||||||||
| Commercial mortgage loans, held for investment | Asset | III | $ | 2,672,300 | $ | 2,673,611 | |||||
| Collateralized loan obligations | Liability | III | 1,739,009 | 1,610,761 | |||||||
| Mortgage Note Payable | Liability | III | 40,167 | 40,167 | |||||||
| December 31, 2019 | |||||||||||
| Commercial mortgage loans, held for investment | Asset | III | $ | 2,762,963 | $ | 2,784,650 | |||||
| Collateralized loan obligations | Liability | III | 1,803,185 | 1,822,386 | |||||||
| Mortgage Note Payable | Liability | III | 29,167 | 29,167 | |||||||
________________________
(2) The carrying value is inclusive of $9.6 million of commercial mortgage loans, held-for-sale as of March 31, 2020.
The fair value of the commercial mortgage loans, held for investment is estimated using a discounted cash flow analysis, based on the Advisor's experience with similar types of investments. The Company received broker quotes for each trancheestimates the fair value of the CLOs issued in 2015collateralized loan obligations using external broker quotes. The fair value of the other financing and 2017.loan participation-commercial mortgage loans is generally estimated using a discounted cash flow analysis.
Note 1113 - Derivative Instruments
The Company uses derivative instruments primarily to economically manage the fair value variability of fixed rate assets caused by interest rate fluctuations and overall portfolio market risk.
As of September 30, 2017,March 31, 2020, the net premiums received on derivative instrument assets were $0.6$0.7 million.
The following derivative instruments were outstanding as of September 30, 2017 ($March 31, 2020 and December 31, 2019 (dollars in thousands):
| Fair Value | Fair Value | ||||||||||||||||||||||||||
| Contract type | Notional | Assets (1) | Liabilities (1) | Net | Notional | Assets | Liabilities | ||||||||||||||||||||
| Credit derivatives | $ | 66,000 | $ | 206 | $ | 1,003 | $ | (797 | ) | ||||||||||||||||||
| March 31, 2020 | |||||||||||||||||||||||||||
| Credit default swaps | $ | 55,000 | $ | 1,173 | $ | — | |||||||||||||||||||||
| Interest rate swaps | 67,489 | — | 4,016 | ||||||||||||||||||||||||
| Treasury note futures | 69,676 | 754 | — | 754 | 30,000 | — | 1,512 | ||||||||||||||||||||
| Total | $ | 135,676 | $ | 960 | $ | 1,003 | $ | (43 | ) | $ | 152,489 | $ | 1,173 | $ | 5,528 | ||||||||||||
| (1) Shown as derivative instruments, at fair value, in the accompanying consolidated balance sheets. | |||||||||||||||||||||||||||
| December 31, 2019 | |||||||||||||||||||||||||||
| Credit default swaps | $ | 94,300 | $ | 59 | $ | 1,581 | |||||||||||||||||||||
| Interest rate swaps | 42,546 | 325 | — | ||||||||||||||||||||||||
| Treasury note futures | 74,000 | 735 | — | ||||||||||||||||||||||||
| Total | $ | 210,846 | $ | 1,119 | $ | 1,581 | |||||||||||||||||||||
44
BENEFIT STREET PARTNERS REALTY TRUST, INC.
NOTES TO CONSOLIDATED FINANCIAL STATEMENTS
March 31, 2016.2020
(Unaudited)
The following tablestable indicates the net realized and unrealized losses on derivatives, by primary underlying risk exposure, as included in loss on derivative instruments in the consolidated statements of operations for the three and nine months ended September 30, 2017. The Company did not have any net realizedMarch 31, 2020 and unrealized gain or loss on derivatives during the three and nine months ended September 30, 2016.
March 31, 2019:
| Three Months Ended September 30, 2017 | Nine Months Ended September 30, 2017 | |||||||||||||||||||||||||||||||||||||
Unrealized Gain (Loss) | Realized Gain (Loss) | Total | Unrealized Gain (Loss) | Realized Gain (Loss) | Total | Three Months Ended March 31, 2020 | Three Months Ended March 31, 2019 | |||||||||||||||||||||||||||||||
| Contract type | Unrealized (Gain)/Loss | Realized (Gain)/Loss | Unrealized (Gain)/Loss | Realized (Gain)/Loss | ||||||||||||||||||||||||||||||||||
| Credit derivatives | $ | (171 | ) | $ | (18 | ) | $ | (189 | ) | $ | (171 | ) | $ | (18 | ) | $ | (189 | ) | ||||||||||||||||||||
| Credit default swaps | $ | (1,752 | ) | $ | 61 | $ | 112 | $ | 1,378 | |||||||||||||||||||||||||||||
| Interest rate swaps | 4,340 | 2,946 | 1,197 | (415 | ) | |||||||||||||||||||||||||||||||||
| Treasury note futures | 754 | — | 754 | 754 | — | 754 | 2,248 | 3,627 | (243 | ) | 350 | |||||||||||||||||||||||||||
| Options | — | 35 | 145 | |||||||||||||||||||||||||||||||||||
| Total | $ | 583 | $ | (18 | ) | $ | 565 | $ | 583 | $ | (18 | ) | $ | 565 | $ | 4,836 | $ | 6,669 | $ | 1,066 | $ | 1,458 | ||||||||||||||||
Note 1214 - Offsetting Assets and Liabilities
The Company's consolidated balance sheets usesused a gross presentation of derivatives and repurchase agreements and collateral pledged. Master netting agreements that the Company has entered into with its derivative and repurchase agreement counterparties allow for netting of the same transaction, in the same currency, on the same date. Assets, liabilities, and collateral subject to master netting agreements as of September 30, 2017 and December 31, 2016 are disclosed in the tables above. The Company does not present its derivative and repurchase agreements net on the consolidated balance sheets as it has elected gross presentation.
The table below provides a gross presentation, the effects of offsetting and a net presentation of the Company's derivative instruments and repurchase agreements and derivatives within the scope of ASC 210-20, Balance Sheet—Offsetting, as of September 30, 2017March 31, 2020 and December 31, 2016, (in2019 (dollars in thousands):
| Gross Amounts Not Offset on the Balance Sheet | |||||||||||||||||||||||||||||
| Gross Amounts of Recognized Assets | Gross Amounts Offset in the Balance Sheet | Net Amount of Assets Presented in the Balance Sheet | Financial Instruments | Cash Collateral Received | Net Amount | ||||||||||||||||||||||||
| September 30, 2017 | |||||||||||||||||||||||||||||
| Derivatives | $ | 960 | $ | — | $ | 960 | $ | — | $ | — | $ | 960 | |||||||||||||||||
| Total | $ | 960 | $ | — | $ | 960 | $ | — | $ | — | $ | 960 | |||||||||||||||||
| Gross Amounts Not Offset on the Balance Sheet | |||||||||||||||||||||||||||||
| Gross Amounts of Recognized Liabilities | Gross Amounts Offset on the Balance Sheet | Net Amount of Liabilities Presented on the Balance Sheet | Financial Instruments as Collateral Pledged (*) | Cash Collateral Pledged | Net Amount | ||||||||||||||||||||||||
| September 30, 2017 | |||||||||||||||||||||||||||||
| Repurchase agreements, commercial mortgage loans | $ | 319,385 | $ | — | $ | 319,385 | $ | 553,364 | $ | 5,005 | $ | — | |||||||||||||||||
| Repurchase agreements - real estate securities | 39,035 | — | 39,035 | 55,764 | 389 | — | |||||||||||||||||||||||
| Derivatives | 1,003 | — | 1,003 | — | 1,436 | — | |||||||||||||||||||||||
| Total | $ | 359,423 | — | $ | — | $ | 359,423 | $ | 609,128 | — | $ | 6,830 | — | $ | — | ||||||||||||||
| Gross Amounts Not Offset on the Balance Sheet | |||||||||||||||||||||||||||||
| December 31, 2016 | Gross Amounts of Recognized Liabilities | Gross Amounts Offset on the Balance Sheet | Net Amount of Liabilities Presented on the Balance Sheet | Financial Instruments as Collateral Pledged (*) | Cash Collateral Pledged | Net Amount | |||||||||||||||||||||||
| Repurchase agreements, commercial mortgage loans | $ | 257,664 | $ | — | $ | 257,664 | $ | 399,914 | $ | 5,000 | $ | — | |||||||||||||||||
| Real estate securities | 66,639 | — | 66,639 | 102,358 | 21 | — | |||||||||||||||||||||||
| Total | $ | 324,303 | — | $ | — | — | $ | 324,303 | — | $ | 502,272 | — | $ | 5,021 | — | $ | — | ||||||||||||
| Gross Amounts Not Offset on the Balance Sheet | ||||||||||||||||||||||||
| Assets | Gross Amounts of Recognized Assets | Gross Amounts Offset on the Balance Sheet | Net Amount of Assets Presented on the Balance Sheet | Financial Instruments | Cash Collateral(1) | Net Amount | ||||||||||||||||||
| March 31, 2020 | ||||||||||||||||||||||||
| Derivative instruments, at fair value | $ | 1,173 | $ | — | $ | 1,173 | $ | — | $ | — | $ | 1,173 | ||||||||||||
| December 31, 2019 | ||||||||||||||||||||||||
| Derivative instruments, at fair value | $ | 1,119 | $ | — | $ | 1,119 | $ | — | $ | 10,895 | $ | — | ||||||||||||
45
BENEFIT STREET PARTNERS REALTY TRUST, INC.
NOTES TO CONSOLIDATED FINANCIAL STATEMENTS
March 31, 2020
(Unaudited)
| Gross Amounts Not Offset on the Balance Sheet | ||||||||||||||||||||||||
| Liabilities | Gross Amounts of Recognized Liabilities | Gross Amounts Offset on the Balance Sheet | Net Amount of Liabilities Presented on the Balance Sheet | Financial Instruments | Cash Collateral(1) | Net Amount | ||||||||||||||||||
| March 31, 2020 | ||||||||||||||||||||||||
| Repurchase agreements - commercial mortgage loans | $ | 234,524 | $ | — | $ | 234,524 | $ | 370,760 | $ | 5,015 | $ | — | ||||||||||||
| Repurchase agreements - real estate securities | $ | 496,880 | $ | — | $ | 496,880 | $ | 609,776 | $ | 76,157 | $ | — | ||||||||||||
| Derivative instruments, at fair value | $ | 5,528 | $ | — | $ | 5,528 | $ | 8,584 | $ | — | ||||||||||||||
| December 31, 2019 | ||||||||||||||||||||||||
| Repurchase agreements - commercial mortgage loans | $ | 252,543 | $ | — | $ | 252,543 | $ | 394,229 | $ | 5,011 | $ | — | ||||||||||||
| Repurchase agreements - real estate securities | $ | 394,359 | $ | — | $ | 394,359 | $ | 455,301 | $ | 1,657 | $ | — | ||||||||||||
| Derivative instruments, at fair value | $ | 1,581 | $ | — | $ | 1,581 | $ | — | $ | 3,679 | $ | — | ||||||||||||
(1) These cash collateral amounts are recorded within the real estate securities, at fair value line ofRestricted cash balance on the consolidated balance sheets as of September 30, 2017 and December 31, 2016, respectively.sheets.
Note 1315 - Segment Reporting
The Company has determined that it has three reportable segments based on howconducts its business through the chief operating decision maker reviews and manages the business. The threefollowing reporting segments are as follows:segments:
The real estate debt, real estate owned and other real estate investments business which is focusedfocuses on originating, acquiring and asset managing commercial real estate debt and equity investments, including first mortgage loans, subordinate mortgages, mezzanine loans and participations in such loans.
loans and other real estate investments.
The real estate securities business focuses on investing in and asset managing commercial real estate securities primarily consisting of CMBS and may include unsecured REIT debt, CDO notes and other securities.
The commercial real estate conduit business operated through the Company's TRS, which is focused on generating superior risk-adjusted returns by originating and subsequently selling fixed-rate commercial real estate loans into the CMBS securitization market at a profit.
The real estate owned business represents real estate acquired by the Company performed a recastthrough foreclosure, deed in lieu of its results of operations for the TRS, a new line of business, and determined there to be no material changes.foreclosure, or purchase
46
BENEFIT STREET PARTNERS REALTY TRUST, INC.
NOTES TO CONSOLIDATED FINANCIAL STATEMENTS
March 31, 2020
(Unaudited)
The following table represents the Company's operations by segment for the three months ended September 30, 2017March 31, 2020 and 2016 (inMarch 31, 2019 (dollars in thousands):
| Three Months Ended September 30, 2017 | Total | Real Estate Debt | Real Estate Securities | TRS | ||||||||||||
| Interest income | $ | 22,195 | $ | 21,795 | $ | 269 | $ | 131 | ||||||||
| Interest expense | 8,845 | 8,386 | 409 | 50 | ||||||||||||
| Net income (loss) | 6,975 | 7,588 | (22 | ) | (591 | ) | ||||||||||
| Three Months Ended September 30, 2016 | ||||||||||||||||
| Interest income | 20,250 | 18,682 | 1,568 | — | ||||||||||||
| Interest expense | 7,317 | 6,642 | 675 | — | ||||||||||||
| Net income | 5,373 | 5,265 | 108 | — | ||||||||||||
| Nine Months Ended September 30, 2017 | Total | Real Estate Debt | Real Estate Securities | TRS | ||||||||||||
| Interest income | $ | 61,917 | $ | 60,435 | $ | 1,351 | $ | 131 | ||||||||
| Interest expense | 21,990 | 20,686 | 1,254 | 50 | ||||||||||||
| Net income | 19,305 | 19,627 | 269 | (591 | ) | |||||||||||
| Nine Months Ended September 30, 2016 | ||||||||||||||||
| Interest income | 60,763 | 55,973 | 4,790 | — | ||||||||||||
| Interest expense | 17,478 | 15,443 | 2,035 | — | ||||||||||||
| Net income | 23,653 | 22,775 | 878 | — | ||||||||||||
| As of September 30, 2017 | Total | Real Estate Debt | Real Estate Securities | Conduit | ||||||||||||
| Total Assets | $ | 1,521,102 | $ | 1,437,630 | $ | 389 | $ | 83,083 | ||||||||
| As of December 31, 2016 | ||||||||||||||||
| Total Assets | 1,248,125 | 1,198,806 | 49,319 | — | ||||||||||||
| Three Months Ended March 31, 2020 | Total | Real Estate Debt and Other Real Estate Investments | Real Estate Securities | TRS | Real Estate Owned | |||||||||||||||
| Interest income | $ | 47,854 | $ | 43,369 | $ | 3,295 | $ | 1,190 | $ | — | ||||||||||
| Revenue from real estate owned | 1,629 | — | — | — | 1,629 | |||||||||||||||
| Interest expense | 24,492 | 21,708 | 1,807 | 693 | 284 | |||||||||||||||
| Net income/(loss) | (7,400 | ) | (1,183 | ) | 1,050 | (5,982 | ) | (1,285 | ) | |||||||||||
| Total assets as of March 31, 2020 | 3,501,885 | 2,775,939 | 519,916 | 132,694 | 73,336 | |||||||||||||||
| Three Months Ended March 31, 2019 | ||||||||||||||||||||
| Interest income | $ | 46,511 | $ | 43,634 | $ | 507 | $ | 2,370 | $ | — | ||||||||||
| Revenue from real estate owned | — | — | — | — | — | |||||||||||||||
| Interest expense | 20,366 | 18,743 | 498 | 1,125 | — | |||||||||||||||
| Net income/(loss) | 19,890 | 14,725 | 9 | 5,156 | — | |||||||||||||||
| Total assets as of December 31, 2019 | 3,540,620 | 2,964,233 | 388,170 | 131,193 | 57,024 | |||||||||||||||
For the purposes of the table above, any expenses not associated with a specific segment have been allocated to the business segments using a percentage derived by using the sum of commercial mortgage loans net and real estate securities, at fair valueoriginated during the year as the denominator and commercial mortgage loans, held for investment, net of allowance and real estate securities,commercial mortgage loans, held-for-sale, measured at fair value as the numerators.numerator.
Note 1416 - Subsequent Events
On October 2, 2017 and November 1, 2017, the Company paid monthly distributions of $3.7 million and $3.9 million, respectively, to stockholders of record during the month of September 2017 and October 2017, respectively. Pursuant to the DRIP, $1.2 million of the October 2017 distribution $1.3 million of the November 2017 distribution was used to purchase 63,693 and 65,287 shares, respectively.
Since December 2019, COVID-19 has spread globally, including to every state in the Investment Program Association in April 2013.
The COVID-19 pandemic has had an adverse effect on our operations and the boardoperations of directorsmany of our lenders. The extent to which the COVID-19 pandemic impacts our future operating results will depend on future developments which are highly uncertain and cannot be predicted with confidence, including the scope, severity and duration of the estimated NAV per share as of September 30, 2017,pandemic and pursuant to the termsdirect and indirect economic effects of the DRIPpandemic and SRP, the Company (i) will offer shares pursuant to the DRIP at a purchase price of $19.02, beginning with November 2017 distributions which are reinvested in December 2017; and (ii) will repurchase shares pursuant to the SRP at a repurchase price of $19.02, subject to discounts in certain circumstances and subject to the terms and conditions of the SRP.containment measures.
Item 2.7. Management's Discussion and Analysis of Financial Condition and Results of Operations
The following discussion and analysis should be read in conjunction with the accompanying consolidated financial statements of Benefit Street Partners Realty Trust, Inc. Thethe notes thereto and other financial information included elsewhere in this Quarterly Report on Form 10-Q, as well as our Annual Report on Form 10-K10-K/A for the fiscal year ended December 31, 20162019 filed with the U.S. Securities and Exchange Commission (the "SEC") on March 29, 2017.19, 2020.
As used herein, the terms "we," "our" and "us" refer to Benefit Street Partners Realty Trust, Inc., a Maryland corporation, and, as required by context, to Benefit Street Partners Realty Operating Partnership, L.P., a Delaware limited partnership, which we refer to as the "OP," and to its subsidiaries. We are externally managed by Benefit Street Partners L.L.C. (our "Advisor").
The forward-looking statements contained in this Quarterly Report on Form 10-Q may include, but are not limited to, statements as to:
our business and investment strategy;
our ability to make investments in a timely manner or on acceptable terms;
the impact of the COVID-19 pandemic;
current credit market conditions and our ability to obtain long-term financing for our investments in a timely manner and on terms that are consistent with what we project when we invest;
the effect of general market, real estate market, economic and political conditions, including the recent economic slowdown and dislocation in the global credit markets;
our ability to make scheduled payments on our debt obligations;
our ability to generate sufficient cash flows to make distributions to our stockholders;
our ability to generate sufficient debt and equity capital to fund additional investments including through our ability to execute securitization transactions;
our ability to refinance our existing financing arrangements;
the degree and nature of our competition;
the availability of qualified personnel;
we may be deemed to be an investment company under the Investment Company Act of 1940, as amended (the "Investment Company Act"), and thus subject to regulation under the Investment Company Act; and
our ability to maintain our qualification as a real estate investment trust ("REIT"); and
other factors set forth under the caption "Risk Factors" in our Annual Report on Form 10-K10-K/A for the year ended December 31, 2016 and in Item 1A of Part II of this Form 10-Q for the quarter ended September 30, 2017.2019.
In addition, words such as "anticipate," "believe," "expect" and "intend" indicate a forward-looking statement, although not all forward-looking statements include these words. The forward-looking statements contained in this Quarterly Report on Form 10-Q involve risks and uncertainties. Our actual results could differ materially from those implied or expressed in the forward-looking statements for any reason.
Currently, one of the most significant factors that could cause actual outcomes to differ materially from our forward-looking statements is the potential adverse effect of the current pandemic of the novel coronavirus, or COVID-19, on the financial condition, operating results and cash flows of the Company, its borrowers, the real estate market, the global economy and the financial markets. The extent to which the COVID-19 pandemic impacts us and our borrowers will depend on future developments, which are highly uncertain and cannot be predicted with confidence, including the scope, severity and duration of the pandemic and the direct and indirect economic effects of the pandemic and containment measures, among others.
Our investors should not place undue reliance on these forward-looking statements. The forward-looking statements made in this Quarterly Report on Form 10-Q relate only to events as of the date on which the statements are made. We undertake no obligation to update any forward-looking statement to reflect events or circumstances occurring after the date of this Quarterly Report on Form 10-Q.
Overview
We were incorporated in Maryland on November 15, 2012 and conducthave conducted our operations to qualify as a REIT for U.S. federal income tax purposes beginning with theour taxable year ended December 31, 2013. In addition, theThe Company, through certain subsidiariesa subsidiary which areis treated as taxable REIT subsidiaries (each a “TRS”),TRS, is indirectly subject to U.S. federal, state and local income taxes. On May 14, 2013, weWe commenced business operations after raising in excess of $2.0 million of equity, the amount required for us to release equity proceeds from escrow.May 2013. We are in business toprimarily originate, acquire and manage a diversified portfolio of commercial real estate debt investments secured by properties located both within and outside of the United States. We may also invest in commercial real estate securities. Commercial real estate debt investments may include first mortgage loans, subordinated mortgage loans, mezzanine loans and participations in such loans. Commercial real estate securities may include commercial mortgage-backed securities ("CMBS") , senior unsecured debtSubstantially all of publicly traded REITs, debtour business is conducted through the OP, a Delaware limited partnership. We are the sole general partner and directly or equity securitiesindirectly hold all of other publicly traded real estate companies and CDOs. the units of limited partner interests in the OP.
The Company also originates conduit loans which the Company intends to sell through its TRS into CMBS securitization transactions at a profit.
The Advisor, an SEC-registered investment adviser, is a credit-focused alternative asset management firm. The Advisor manages assetsfunds for institutions and high-net-worth investors across a broad range ofvarious credit funds and complementary credit strategies including high yield, levered loans, private/private / opportunistic debt, liquid credit, structured credit and commercial real estate debt. These strategies complement each other as they all leverage the sourcing, analytical, compliance, and operational capabilities that encompass the Advisor’s robust platform. On February 1, 2019, Franklin Resources, Inc. and Templeton International, Inc. (collectively, “Franklin Templeton”) acquired the Advisor (the “Transaction”). The AdvisorTransaction did not impact the terms of the Advisory Agreement and the Transaction did not result in any changes to the executive officers of the Company.
The Company invests in commercial real estate debt investments, which may include first mortgage loans, subordinated mortgage loans, mezzanine loans and participations in such loans. The Company also originates conduit loans which the Company intends to sell through its TRS into CMBS securitization transactions at a profit. The Company also owns real estate, which represents real estate acquired by the Company through foreclosure, deed in lieu of foreclosure, or purchase.
The Company also invests in commercial real estate securities. Real estate securities may include CMBS, senior unsecured debt of publicly traded REITs, debt or equity securities of other publicly traded real estate companies and CDOs.
COVID-19 Pandemic
Since December 2019, COVID-19 has spread globally, including to every state in the United States. In March 2020, the World Health Organization declared COVID-19 a pandemic, and subsequently, the United States declared a national emergency. The COVID-19 pandemic has had significant repercussions across domestic and global economies and financial markets, including the industries in which our borrowers operate. The global impact of the COVID-19 outbreak evolved rapidly and many governmental authorities, including state and local governments in regions in which our borrowers own properties, have reacted by instituting government restrictions, border closings, quarantines, “shelter-in-place” orders and “social distancing” guidelines which have forced many of our borrowers to suspend or significantly restrict their business activities, and has resulted in a dramatic increase in national unemployment.
The COVID-19 pandemic has had and is affiliatedcontinuing to have a material impact on our operations:
Impact on Operating Results. With respect to our operating results in the quarter ended March 31, 2020, the COVID-19 pandemic drove a significant increase in our allowance for credit loss provision on our securities portfolio. This was a result of deterioration in the broader capital markets and uncertainty due to COVID-19 and its expected impact on values of properties underlying our real-estate debt assets. Due primarily to changes in market conditions associated with Providence Equity Partners L.L.C.the COVID-19 pandemic, the weighted average risk rating of our loan portfolio increased from 2.1 as of December 31, 2019 to 2.3 as of March 31, 2020, and the amortized cost basis of our loans past due increased by $45.3 million over this period. Additionally, we expect a decrease in conduit loan activity in the near term.
During April 2020, we have made limited modifications to certain loans to assist borrowers during the COVID-19 pandemic, but none of these modifications qualify as troubled debt restructurings ("TDRs").
Impact on Liquidity. In March and April 2020, there were significant disruptions in the financial markets that impacted our real estate securities portfolio. This resulted in decreases in market value for these assets due to volatility and lack of liquidity. We received margin calls from certain of our lenders due to the decline in pricing, which we satisfied through the contribution of additional cash, thereby reducing our liquidity position and substantially reducing our levered returns on this portfolio of assets. In addition, many of our lenders have reduced the advance rates on our repurchase agreements, which has further adversely impacted our liquidity and reduced anticipated returns. Although the markets for these assets have recently stabilized, if they were to suffer similar disruptions as a result of the ongoing economic impacts of COVID-19 or otherwise, we could receive additional margin calls which would strain our liquidity. In addition, the financial market dislocations created by the COVID-19 pandemic have currently made financing through CDO or CLO securitizations more difficult.
The extent to which the COVID-19 pandemic impacts our future operating results and liquidity will depend on future developments which are highly uncertain and cannot be predicted with confidence, including the scope, severity and duration of the pandemic and the direct and indirect economic effects of the pandemic and containment measures. The inability of our borrowers to meet their loan obligations and/or borrowers filing for bankruptcy protection would reduce our cash flows, which would impact our ability to pay dividends to our stockholders. For further discussion of the potential impacts from the COVID-19 pandemic on our business, financial condition, results of operations, liquidity and our ability to make distributions to our stockholders, refer to “Risk Factors” in Part II, Item 1A of this Quarterly Report on Form 10-Q.
Estimated Per Share NAV
On November 9, 2017,12, 2019, our board of directors, upon the recommendation of the Advisor, unanimously approved and established an estimated per share net asset value (“NAV”("NAV") per share of $19.02.the Company’s common stock of$18.57. The estimated per share NAV iswas based upon the estimated value of ourthe Company’s assets less ourthe Company’s liabilities as of September 30, 20172019 (the “Valuation Date”). This valuation was performed in accordance with the provisions of Practice Guideline 2013-01, Valuations of Publicly Registered Non-Listed REITs, issued by the Investment Program Association in April 2013. We believe that there have been no material changes between2013, including the Valuation Dateuse of an independent third-party valuation firm to estimate the fair value of our commercial real estate debt investments and the date of this filing that would impact the estimated per share NAV.commercial mortgage backed securities.
With the unanimous approval of our board of directors, we engaged an independent third-party valuation firm to estimate the fair value of our loans. The valuation firm estimated the value of our loan portfolio by applying a discounted cash flow analysis to each loan to determine a range of estimated valuations. To estimate the Company’s NAV, the Advisor adjusted the loan portfolio valuation prepared by the valuation advisor by adding the amounts of cash and other tangible assets reflected on our balance sheet (as computed in accordance with GAAP) and subtracting our liabilities as reflected on our balance sheet (computed in accordance with GAAP). Based in part on these valuation ranges, the Advisor estimated that the Company’s NAV as of September 30, 2017 ranged from $18.562019 is $18.57 which falls within the valuation range of $18.07 to $19.49, with a midpoint estimated NAV of $19.02 (the “Midpoint Valuation”). $19.15.
The Advisor recommended our board of directors approve the Midpoint Valuation as our estimated per share NAV.NAV of $18.57. As with any methodology used to estimate value, the methodologies employed to estimate the NAV were based upon a number of estimates and assumptions that may not be accurate or complete. If different judgments, assumptions or opinions were used, a different estimate would likely result.
We believe that the method used to determine the estimated per share NAV of the Company’s common stock is the methodology most commonly used by public, non-listed REITs to estimate per share NAV. The estimated per share NAV does not represent the per share amount a third party would pay to acquire us, or the price at which our common stock would trade in the event we were listed on a national securities exchange. For example, the estimated per share NAV of the Company’s common stock does not reflect a liquidity discount for the fact that the shares are not currently traded on a national securities exchange and other costs that may be incurred in connection with a liquidity event. Our estimated per share NAV does not reflect the conversion of any of our Series A convertible preferred stock ("Series A Preferred Stock") or Series C convertible preferred stock (“Series C Preferred Stock,” and with the Series A Preferred Stock, the “Preferred Stock”).
The estimated per share NAV was determined at a moment in time and as of the Valuation Date and the values of our assets and liabilities will change over time as a result of changes relating to the individual loans in our portfolio as well as changes and developments in the real estate and capital markets generally, including changes in interest rates. For example, the estimated per share NAV does not reflect the significant adverse impact on our business and the value of our shares related to the COVID-19 pandemic discussed above. Stockholders should not rely on the estimated per share NAV in making a decision to buy or sell shares of our common stock.
Significant Accounting Policies and Use of Estimates
A summary of our significant accounting policies is set forth in Note 2 - Summary of Significant Accounting Policies to our consolidated financial statements included in this Quarterly Report on Form 10-Q. A full disclosure of our significant accounting polices is disclosed in our Annual Report on Form 10-K10-K/A for the year ended December 31, 2016.2019.
Portfolio
As of September 30, 2017March 31, 2020 and December 31, 2016,2019, our portfolio consisted of 73118 and 71 commercial mortgage loans, excluding commercial mortgage loans accounted for under the fair value option, and 0 and 6 investments in CMBS, respectively. The122 commercial mortgage loans, held for investment hadwith a total carrying value, net of allowance for loancredit losses, of $1,285.1$2,641.0 million and $1,046.6 million.$2,762.0 million, respectively. As of September 30, 2017March 31, 2020 and December 31, 2016, the Company's2019, our total commercial mortgage loans, held for sale, measured at fair value comprised of 48 loans with total fair value of $91.8 million and 07 loans with total fair value of $112.6 million, respectively. As of September 30, 2017March 31, 2020 and December 31, 2016, the Company's total2019, our real estate securities, available for sale, measured at fair value comprised of 29 CMBS investments had awith total fair value of $0.0$441.2 million and $49.021 CMBS investments with total fair value of $386.3 million, respectively. As of March 31, 2020 and December 31, 2019, our other real estate investments consisted of 1 investment, measured at fair value, comprised of $2.5 million and $2.6 million, respectively. As of March 31, 2020, our real estate owned portfolio comprised of 3 investments with a carrying value of $49.3 million. As of December 31, 2019, our real estate owned portfolio was comprised of 2 investments with a carrying value of $35.3 million.
For our commercial mortgage loans, excluding commercial mortgage loans accounted for under the fair value option, we currently estimate loss rates based on historical realized losses experienced in the industry and take into account current collateral and economic conditions affecting the probability or severity of losses when establishing the allowance for loancredit losses. We recorded a general allowance for loan lossescredit loss as of September 30, 2017March 31, 2020 and December 31, 20162019 in the amount of $2.0$21.7 million and $2.2$0.9 million, respectively. There were no impaired or specifically reserved
As of March 31, 2020, we wrote off a commercial mortgage loan, held for investment, with a carrying value $14.4 million in exchange for the possession of a real estate owned investment at a fair value of $14.0 million at the time of the transfer. The transfer occurred when we took possession of the property by completing a foreclosure transaction which resulted in $0.4 million of Increase/(decrease) for credit losses at the time of transfer.
As of March 31, 2020, we had two loans in the portfolio aswith unpaid contractual principal balance and carrying values of September 30, 2017$57.1 million and $45.3 million, respectively. We did not take any asset specific reserves for these loans. As of December 31, 2019, we had one loan with unpaid contractual principal balance and carrying value of $57.1 million that had interest past due for greater than 90 days.
As of March 31, 2020 and December 31, 2016.
As of March 31, 2020 our Real estate securities, available for sale, measured at fair value had an unrecognized unrealized loss of $67.6 million included within the consolidated statements of other comprehensive income. The deterioration in fair value of real estate securities as of March 31, 2020 can be attributed mainly to the market down-turn and volatility as a result of high unemployment and credit uncertainties related to the outbreak of COVID-19.
The following charts summarize our commercial mortgage loans, excluding commercial mortgage loans, held-for-sale, measured at fair value and CMBS as a percentage of par value,held for investment, by the collateral type, geographical region and coupon rate type as of September 30, 2017March 31, 2020 and December 31, 2016:2019:
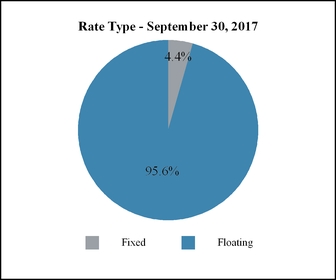
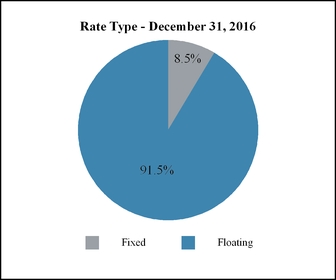
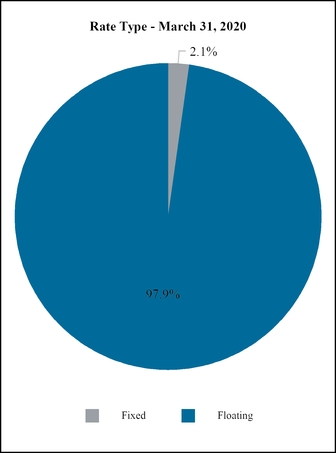
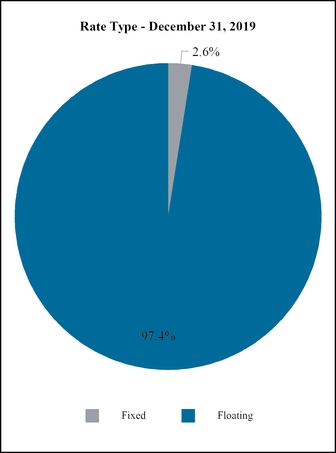
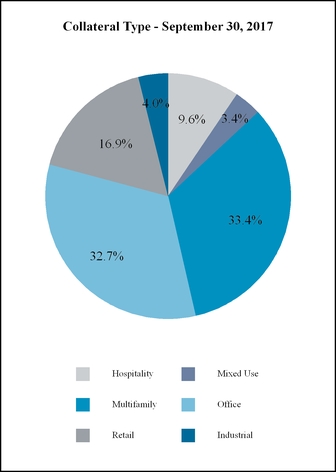
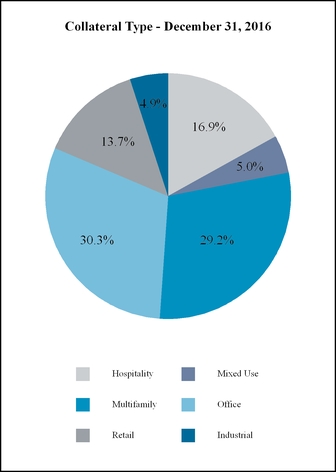
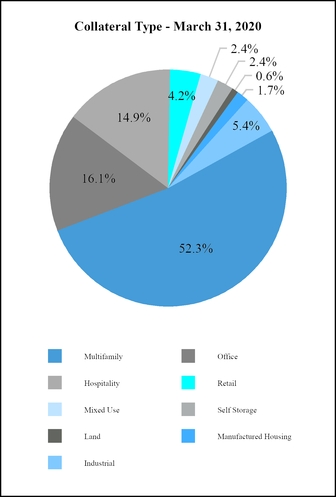
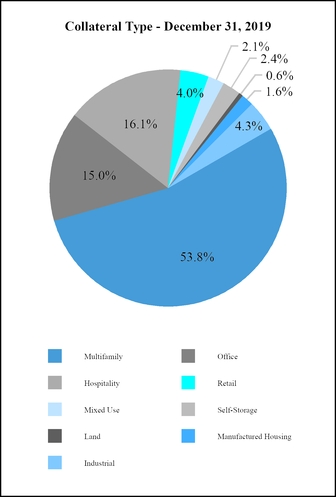
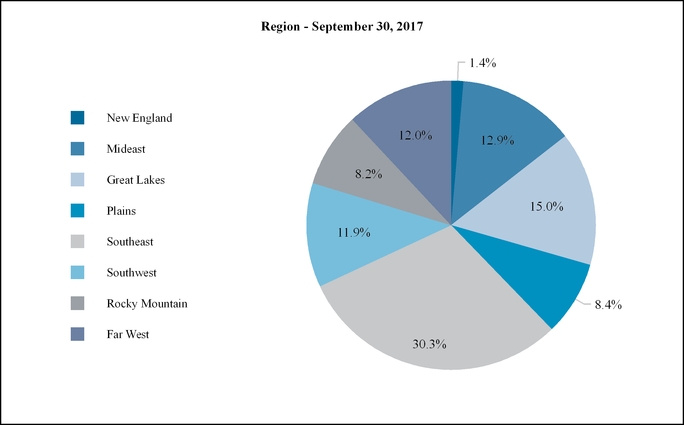
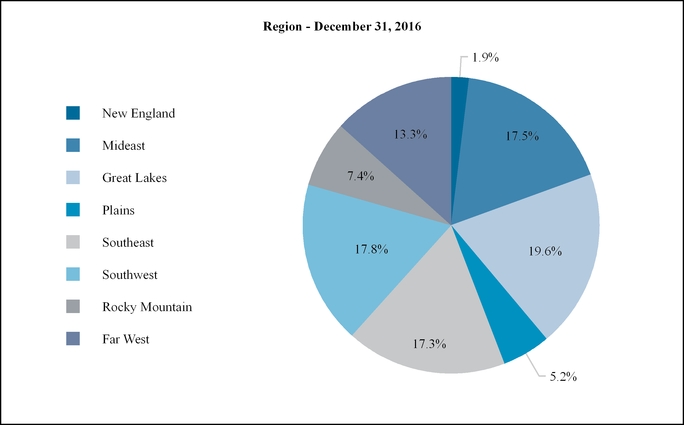
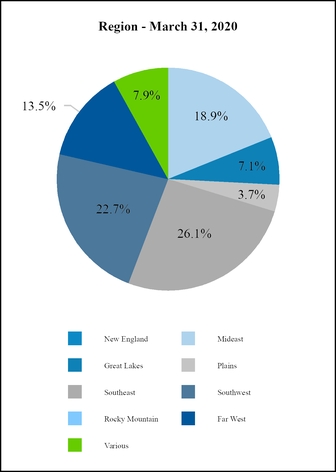
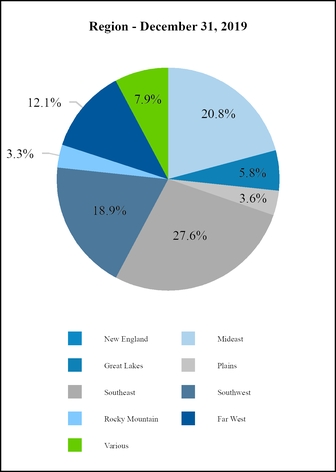
An investments region classification is defined according to the below map below based on the location of investments'investments secured property.
The following charts showshow the par value by contractual maturity year for the commercial mortgage loans, held-for-investmentheld for investments in our portfolio excluding loans held in our TRS segment as of September 30, 2017March 31, 2020 and December 31, 2016.2019:
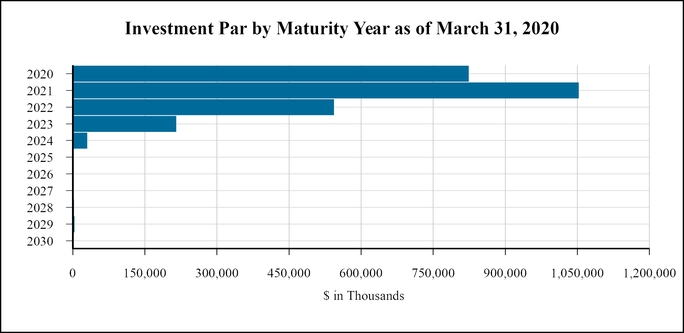
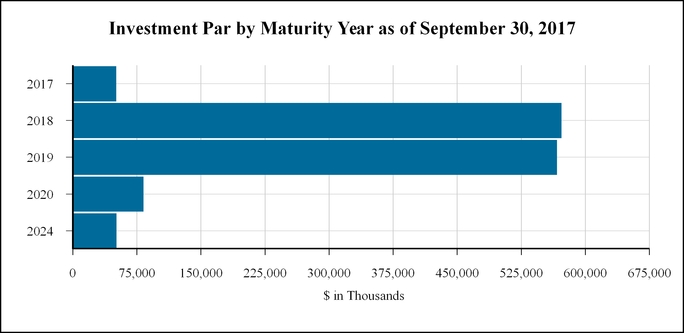
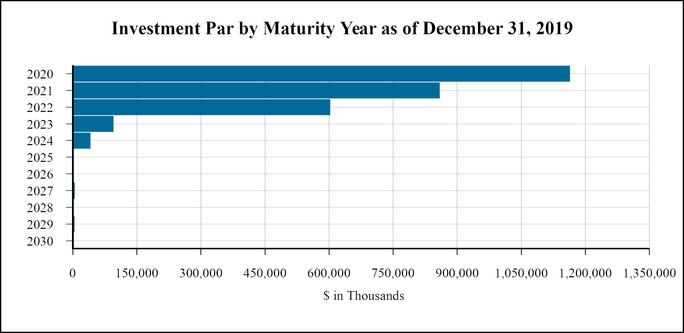
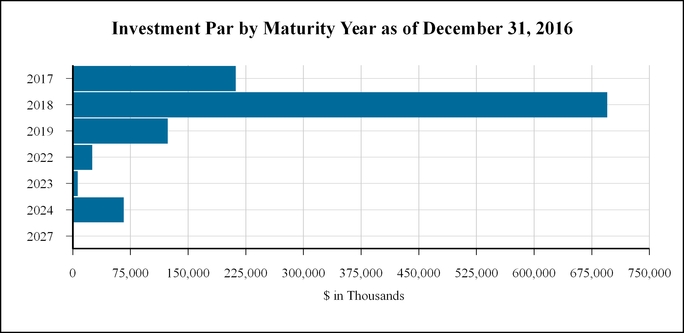
The following table shows selected data from our commercial mortgage loans, portfolio, excluding commercial mortgage loans accountedheld for under the fair value optioninvestment in our portfolio as of September 30, 2017 (inMarch 31, 2020 (dollars in thousands):
| Loan Type | Property Type | Par Value | Interest Rate (1) | Effective Yield | Loan to Value (2) |
| Senior 1 | Office | $31,250 | 1M LIBOR + 4.50% | 5.7% | 75.0% |
| Senior 2 | Retail | 9,450 | 1M LIBOR + 4.90% | 6.1% | 69.2% |
| Senior 3 | Hospitality | 4,423 | 1M LIBOR + 5.50% | 6.7% | 55.3% |
| Senior 4 | Retail | 11,800 | 1M LIBOR + 4.75% | 6.0% | 79.4% |
| Senior 5 | Office | 33,734 | 1M LIBOR + 4.65% | 5.9% | 80.0% |
| Senior 6 | Office | 42,481 | 1M LIBOR + 5.25% | 6.5% | 75.0% |
| Senior 7 | Office | 13,440 | 1M LIBOR + 5.00% | 6.2% | 75.0% |
| Senior 8 | Office | 30,450 | 1M LIBOR + 4.60% | 5.8% | 65.0% |
| Senior 9 | Retail | 11,684 | 1M LIBOR + 4.50% | 5.7% | 74.8% |
| Senior 10 | Multifamily | 14,775 | 1M LIBOR + 5.00% | 6.2% | 76.7% |
| Senior 11 | Retail | 10,745 | 1M LIBOR + 5.25% | 6.5% | 80.0% |
| Senior 12 | Hospitality | 16,800 | 1M LIBOR + 4.90% | 6.1% | 74.0% |
| Senior 13 | Multifamily | 26,410 | 1M LIBOR + 4.25% | 5.5% | 79.7% |
| Senior 14 | Multifamily | 14,917 | 1M LIBOR + 4.50% | 5.7% | 76.0% |
| Senior 15 | Retail | 14,600 | 1M LIBOR + 4.25% | 5.5% | 65.0% |
| Senior 16 | Retail | 27,249 | 1M LIBOR + 4.75% | 6.0% | 67.4% |
| Senior 17 | Office | 9,844 | 1M LIBOR + 4.65% | 5.9% | 70.8% |
| Senior 18 | Industrial | 19,553 | 1M LIBOR + 4.25% | 5.5% | 68.0% |
| Senior 19 | Multifamily | 18,941 | 1M LIBOR + 4.20% | 5.4% | 76.4% |
| Senior 20 | Hospitality | 10,350 | 1M LIBOR + 5.50% | 6.7% | 69.9% |
| Senior 21 | Hospitality | 15,375 | 1M LIBOR + 5.30% | 6.5% | 73.5% |
| Senior 22 | Mixed Use | 45,235 | 1M LIBOR + 5.50% | 6.7% | 72.6% |
| Senior 23 | Retail | 7,500 | 1M LIBOR + 5.00% | 6.2% | 59.0% |
| Senior 24 | Retail | 4,725 | 1M LIBOR + 5.50% | 6.7% | 72.0% |
| Senior 25 | Multifamily | 44,595 | 1M LIBOR + 4.25% | 5.5% | 77.0% |
| Senior 26 | Multifamily | 18,075 | 1M LIBOR + 4.50% | 5.7% | 75.0% |
| Senior 27 | Office | 14,040 | 1M LIBOR + 4.75% | 6.0% | 74.4% |
| Senior 28 | Multifamily | 24,387 | 1M LIBOR + 4.25% | 5.5% | 69.6% |
| Type | Property Type | Par Value | Interest Rate (1) | Effective Yield | Loan to Value (2) |
| Senior Debt 1 | Retail | $9,450 | 1 month LIBOR + 4.50% | 5.5% | 69.2% |
| Senior Debt 2 | Office | 10,700 | 1 month LIBOR + 4.65% | 5.6% | 70.8% |
| Senior Debt 3 | Industrial | 33,655 | 1 month LIBOR + 4.00% | 5.0% | 65.0% |
| Senior Debt 4 | Mixed Use | 12,953 | 1 month LIBOR + 5.00% | 6.0% | 73.3% |
| Senior Debt 5 | Office | 14,080 | 1 month LIBOR + 4.45% | 5.4% | 64.2% |
| Senior Debt 6 | Office | 10,506 | 1 month LIBOR + 6.00% | 7.0% | 74.0% |
| Senior Debt 7 | Multifamily | 37,812 | 1 month LIBOR + 3.35% | 4.3% | 76.0% |
| Senior Debt 8 | Office | 27,574 | 1 month LIBOR + 4.15% | 5.1% | 69.5% |
| Senior Debt 9 | Multifamily | 34,875 | 1 month LIBOR + 3.75% | 4.7% | 71.2% |
| Senior Debt 10 | Hospitality | 10,600 | 1 month LIBOR + 5.00% | 6.0% | 61.6% |
| Senior Debt 11 | Hospitality | 5,921 | 1 month LIBOR + 3.50% | 4.5% | 77.0% |
| Senior Debt 12 | Multifamily | 18,985 | 1 month LIBOR + 3.62% | 4.6% | 69.5% |
| Senior Debt 13 | Hospitality | 57,075 | 1 month LIBOR + 5.19% | 6.2% | 51.8% |
| Senior Debt 14 | Multifamily | 65,036 | 1 month LIBOR + 4.50% | 5.5% | 22.4% |
| Senior Debt 15 | Hospitality | 10,250 | 1 month LIBOR + 5.25% | 6.2% | 60.7% |
| Senior Debt 16 | Hospitality | 23,000 | 1 month LIBOR + 4.66% | 5.7% | 48.1% |
| Senior Debt 17 | Multifamily | 19,280 | 1 month LIBOR + 3.60% | 4.6% | 80.5% |
| Senior Debt 18 | Office | 24,426 | 1 month LIBOR + 4.65% | 5.6% | 56.4% |
| Senior Debt 19 | Hospitality | 21,000 | 1 month LIBOR + 4.00% | 5.0% | 54.8% |
| Senior Debt 20 | Multifamily | 20,741 | 1 month LIBOR + 4.25% | 5.2% | 75.0% |
| Senior Debt 21 | Multifamily | 42,000 | 1 month LIBOR + 3.70% | 4.7% | 63.7% |
| Senior Debt 22 | Hospitality | 28,272 | 1 month LIBOR + 4.00% | 5.0% | 68.0% |
| Senior Debt 23 | Hospitality | 22,018 | 1 month LIBOR + 4.40% | 5.4% | 72.7% |
| Senior Debt 24 | Multifamily | 34,788 | 1 month LIBOR + 3.00% | 4.0% | 83.6% |
| Senior Debt 25 | Self Storage | 4,120 | 1 month LIBOR + 4.05% | 5.0% | 45.5% |
| Senior Debt 26 | Self Storage | 6,496 | 1 month LIBOR + 4.05% | 5.0% | 55.8% |
| Senior Debt 27 | Self Storage | 7,606 | 1 month LIBOR + 4.05% | 5.0% | 57.6% |
| Senior Debt 28 | Self Storage | 2,400 | 1 month LIBOR + 4.05% | 5.0% | 37.6% |
| Senior Debt 29 | Self Storage | 6,310 | 1 month LIBOR + 5.05% | 6.0% | 59.1% |
| Senior Debt 30 | Multifamily | 22,775 | 1 month LIBOR + 3.15% | 4.1% | 79.7% |
| Senior Debt 31 | Multifamily | 11,590 | 1 month LIBOR + 3.75% | 4.7% | 85.9% |
| Senior Debt 32 | Multifamily | 66,000 | 1 month LIBOR + 3.75% | 4.7% | 76.8% |
| Senior Debt 33 | Multifamily | 17,250 | 1 month LIBOR + 3.95% | 4.9% | 70.0% |
| Senior Debt 34 | Hospitality | 22,355 | 1 month LIBOR + 3.50% | 4.5% | 68.8% |
| Senior Debt 35 | Mixed Use | 52,088 | 1 month LIBOR + 4.87% | 5.9% | 49.0% |
| Senior Debt 36 | Multifamily | 12,007 | 1 month LIBOR + 3.50% | 4.5% | 74.6% |
| Senior Debt 37 | Multifamily | 18,000 | 1 month LIBOR + 3.30% | 4.3% | 83.1% |
| Senior Debt 38 | Office | 22,000 | 1 month LIBOR + 3.75% | 4.7% | 70.0% |
| Senior Debt 39 | Office | 45,259 | 1 month LIBOR + 4.23% | 5.2% | 59.6% |
| Senior Debt 40 | Self Storage | 6,600 | 1 month LIBOR + 6.00% | 7.0% | 58.9% |
| Senior Debt 41 | Multifamily | 7,250 | 1 month LIBOR + 4.00% | 5.0% | 75.6% |
| Senior Debt 42 | Multifamily | 116,574 | 1 month LIBOR + 3.10% | 4.1% | 79.1% |
| Senior Debt 43 | Office | 13,551 | 1 month LIBOR + 3.40% | 4.4% | 67.5% |
| Senior Debt 44 | Retail | 29,500 | 6.25% | 6.3% | 68.5% |
| Senior Debt 45 | Multifamily | 25,500 | 1 month LIBOR + 3.50% | 4.5% | 73.3% |
| Senior Debt 46 | Self Storage | 12,125 | 1 month LIBOR + 5.50% | 6.5% | 68.1% |
| Senior Debt 47 | Office | 38,067 | 1 month LIBOR + 3.74% | 4.7% | 62.4% |
| Senior Debt 48 | Multifamily | 15,303 | 1 month LIBOR + 3.15% | 4.1% | 80.3% |
| Senior Debt 49 | Multifamily | 21,675 | 1 month LIBOR + 3.40% | 4.4% | 80.5% |
| Senior Debt 50 | Multifamily | 29,900 | 1 month LIBOR + 3.35% | 4.3% | 73.0% |
| Senior Debt 51 | Multifamily | 39,661 | 1 month LIBOR + 3.10% | 4.1% | 75.5% |
| Senior Debt 52 | Self Storage | 17,400 | 1 month LIBOR + 4.00% | 5.0% | 69.5% |
| Senior Debt 53 | Multifamily | 10,020 | 1 month LIBOR + 3.45% | 4.4% | 76.8% |
| Loan Type | Property Type | Par Value | Interest Rate (1) | Effective Yield | Loan to Value (2) |
| Senior 29 | Multifamily | 18,146 | 1M LIBOR + 3.85% | 5.1% | 76.8% |
| Senior 30 | Multifamily | 5,519 | 1M LIBOR + 3.95% | 5.2% | 77.5% |
| Senior 31 | Multifamily | 13,120 | 1M LIBOR + 3.95% | 5.2% | 78.2% |
| Senior 32 | Multifamily | 5,894 | 1M LIBOR + 4.05% | 5.3% | 80.0% |
| Senior 33 | Industrial | 33,655 | 1M LIBOR + 4.00% | 5.2% | 65.0% |
| Senior 34 | Office | 12,000 | 1M LIBOR + 4.75% | 6.0% | 54.1% |
| Senior 35 | Office | 35,000 | 1M LIBOR + 5.00% | 6.2% | 79.0% |
| Senior 36 | Office | 19,979 | 1M LIBOR + 4.55% | 5.8% | 70.0% |
| Senior 37 | Office | 29,006 | 1M LIBOR + 4.25% | 5.5% | 73.3% |
| Senior 38 | Office | 15,030 | 1M LIBOR + 5.35% | 6.6% | 47.1% |
| Senior 39 | Multifamily | 14,000 | 1M LIBOR + 5.00% | 6.2% | 56.3% |
| Senior 40 | Office | 16,300 | 1M LIBOR + 6.00% | 7.2% | 74.8% |
| Senior 41 | Retail | 13,700 | 1M LIBOR + 4.75% | 6.0% | 62.6% |
| Senior 42 | Retail | 28,500 | 1M LIBOR + 4.73% | 6.0% | 73.1% |
| Senior 43 | Retail | 12,700 | 1M LIBOR + 5.00% | 6.2% | 73.3% |
| Senior 44 | Multifamily | 23,150 | 1M LIBOR + 5.00% | 6.2% | 71.7% |
| Senior 45 | Multifamily | 45,103 | 1M LIBOR + 6.75% | 8.0% | 83.4% |
| Senior 46 | Retail | 15,750 | 1M LIBOR + 5.25% | 6.5% | 70.5% |
| Senior 47 | Retail | 25,000 | 1M LIBOR + 4.40% | 5.6% | 71.4% |
| Senior 48 | Multifamily | 13,944 | 1M LIBOR + 7.10% | 8.3% | 76.4% |
| Senior 49 | Hospitality | 12,600 | 1M LIBOR + 5.50% | 6.7% | 61.6% |
| Senior 50 | Hospitality | 11,750 | 1M LIBOR + 5.50% | 6.7% | 71.2% |
| Senior 51 | Retail | 20,450 | 1M LIBOR + 5.00% | 6.2% | 60.9% |
| Senior 52 | Multifamily | 26,000 | 1M LIBOR + 7.25% | 8.5% | 69.7% |
| Senior 53 | Hospitality | 14,900 | 1M LIBOR + 6.25% | 7.5% | 69.0% |
| Senior 54 | Office | 11,580 | 1M LIBOR + 4.45% | 5.7% | 65.0% |
| Senior 55 | Office | 9,750 | 1M LIBOR + 5.50% | 6.7% | 74.0% |
| Senior 56 | Multifamily | 39,700 | 1M LIBOR + 5.50% | 6.7% | 76.0% |
| Senior 57 | Multifamily | 25,500 | 1M LIBOR + 4.85% | 6.1% | 83.1% |
| Senior 58 | Retail | 7,500 | 1M LIBOR + 5.25% | 6.5% | 70.5% |
| Senior 59 | Office | 62,040 | 1M LIBOR + 4.50% | 5.7% | 69.2% |
| Senior 60 | Multifamily | 38,775 | 1M LIBOR + 4.50% | 5.7% | 73.8% |
| Senior 61 | Hospitality | 8,875 | 1M LIBOR + 6.20% | 7.4% | 67.7% |
| Senior 62 | Office | 25,120 | 1M LIBOR + 4.15% | 5.4% | 69.5% |
| Mezzanine 1 | Multifamily | 4,000 | 12.00% | 12.0% | 74.5% |
| Mezzanine 2 | Office | 7,000 | 12.00% | 12.0% | 78.3% |
| Mezzanine 3 | Retail | 1,963 | 13.00% | 13.0% | 85.0% |
| Mezzanine 4 | Multifamily | 3,480 | 9.50% | 9.5% | 84.5% |
| Mezzanine 5 | Office | 5,066 | 3M LIBOR + 10.00% | 11.2% | 79.5% |
| Mezzanine 6 | Office | 10,000 | 10.00% | 10.0% | 79.0% |
| Mezzanine 7 | Hospitality | 7,140 | 10.00% | 10.0% | 73.9% |
| Mezzanine 8 | Hospitality | 3,900 | 10.00% | 10.0% | 73.9% |
| Mezzanine 9 | Hospitality | 12,510 | 10.00% | 10.0% | 73.9% |
| Mezzanine 10 | Hospitality | 8,050 | 10.00% | 10.0% | 73.9% |
| Mezzanine 11 | Multifamily | 3,000 | 1M LIBOR + 13.00% | 14.2% | 69.7% |
| $1,322,973 | 5.9% | 72.5% | |||
| Type | Property Type | Par Value | Interest Rate (1) | Effective Yield | Loan to Value (2) |
| Senior Debt 54 | Multifamily | 67,980 | 1 month LIBOR + 3.45% | 4.4% | 76.3% |
| Senior Debt 55 | Land | 16,400 | 1 month LIBOR + 6.00% | 7.0% | 45.7% |
| Senior Debt 56 | Hospitality | 8,595 | 1 month LIBOR + 4.80% | 5.8% | 62.5% |
| Senior Debt 57 | Retail | 14,500 | 1 month LIBOR + 4.75% | 5.7% | 53.5% |
| Senior Debt 58 | Industrial | 11,357 | 1 month LIBOR + 3.95% | 4.9% | 66.4% |
| Senior Debt 59 | Multifamily | 48,500 | 1 month LIBOR + 3.75% | 4.7% | 69.5% |
| Senior Debt 60 | Multifamily | 32,388 | 1 month LIBOR + 3.25% | 4.2% | 73.8% |
| Senior Debt 61 | Multifamily | 54,057 | 1 month LIBOR + 5.70% | 6.7% | 70.7% |
| Senior Debt 62 | Office | 7,200 | 1 month LIBOR + 3.90% | 4.9% | 67.6% |
| Senior Debt 63 | Hospitality | 10,000 | 1 month LIBOR + 4.95% | 5.9% | 69.0% |
| Senior Debt 64 | Manufactured Housing | 8,611 | 1 month LIBOR + 3.90% | 4.9% | 60.3% |
| Senior Debt 65 | Hospitality | 9,747 | 1 month LIBOR + 3.44% | 4.4% | 44.8% |
| Senior Debt 66 | Retail | 14,250 | 1 month LIBOR + 3.95% | 4.9% | 61.2% |
| Senior Debt 67 | Hospitality | 21,000 | 1 month LIBOR + 4.14% | 5.1% | 56.0% |
| Senior Debt 68 | Office | 21,850 | 1 month LIBOR + 4.25% | 5.2% | 62.3% |
| Senior Debt 69 | Multifamily | 23,750 | 1 month LIBOR + 3.10% | 4.1% | 73.1% |
| Senior Debt 70 | Multifamily | 36,250 | 1 month LIBOR + 3.10% | 4.1% | 73.4% |
| Senior Debt 71 | Retail | 13,400 | 1 month LIBOR + 4.00% | 5.0% | 84.0% |
| Senior Debt 72 | Office | 41,812 | 1 month LIBOR + 3.50% | 4.5% | 71.0% |
| Senior Debt 73 | Retail | 8,500 | 1 month LIBOR + 5.00% | 6.0% | 51.6% |
| Senior Debt 74 | Hospitality | 8,784 | 1 month LIBOR + 4.50% | 5.5% | 68.7% |
| Senior Debt 75 | Multifamily | 18,100 | 1 month LIBOR + 3.40% | 4.4% | 76.4% |
| Senior Debt 76 | Multifamily | 28,250 | 1 month LIBOR + 3.40% | 4.4% | 77.2% |
| Senior Debt 77 | Hospitality | 19,900 | 1 month LIBOR + 3.48% | 4.5% | 61.8% |
| Senior Debt 78 | Multifamily | 18,553 | 1 month LIBOR + 3.10% | 4.1% | 67.4% |
| Senior Debt 79 | Office | 25,900 | 1 month LIBOR + 3.77% | 4.8% | 68.2% |
| Senior Debt 80 | Hospitality | 17,864 | 1 month LIBOR + 3.75% | 4.7% | 62.6% |
| Senior Debt 81 | Hospitality | 15,500 | 1 month LIBOR + 4.00% | 5.0% | 56.4% |
| Senior Debt 82 | Hospitality | 5,250 | 1 month LIBOR + 4.25% | 5.2% | 47.7% |
| Senior Debt 83 | Hospitality | 12,460 | 1 month LIBOR + 4.45% | 5.4% | 62.9% |
| Senior Debt 84 | Hospitality | 9,000 | 1 month LIBOR + 4.50% | 5.5% | 64.0% |
| Senior Debt 85 | Retail | 9,400 | 1 month LIBOR + 4.20% | 5.2% | 77.1% |
| Senior Debt 86 | Manufactured Housing | 12,200 | 1 month LIBOR + 3.65% | 4.6% | 48.4% |
| Senior Debt 87 | Manufactured Housing | 24,100 | 1 month LIBOR + 3.65% | 4.6% | 53.8% |
| Senior Debt 88 | Multifamily | 23,149 | 1 month LIBOR + 2.65% | 3.6% | 75.8% |
| Senior Debt 89 | Office | 29,750 | 1 month LIBOR + 3.35% | 4.3% | 54.3% |
| Senior Debt 90 | Hospitality | 34,806 | 1 month LIBOR + 3.99% | 5.0% | 31.0% |
| Senior Debt 91 | Multifamily | 11,590 | 1 month LIBOR + 2.65% | 3.6% | 71.6% |
| Senior Debt 92 | Multifamily | 34,913 | 1 month LIBOR + 2.75% | 3.7% | 79.3% |
| Senior Debt 93 | Industrial | 51,500 | 1 month LIBOR + 3.75% | 4.7% | 59.7% |
| Senior Debt 94 | Office | 21,825 | 1 month LIBOR + 3.50% | 4.5% | 70.9% |
| Senior Debt 95 | Hospitality | 7,100 | 1 month LIBOR + 4.00% | 5.0% | 70.3% |
| Senior Debt 96 | Industrial | 22,230 | 1 month LIBOR + 3.55% | 4.5% | 69.7% |
| Senior Debt 97 | Multifamily | 19,575 | 1 month LIBOR + 2.75% | 3.7% | 71.7% |
| Senior Debt 98 | Multifamily | 16,100 | 1 month LIBOR + 3.75% | 4.7% | 64.9% |
| Senior Debt 99 | Multifamily | 26,000 | 1 month LIBOR + 3.15% | 4.1% | 71.6% |
| Senior Debt 100 | Retail | 9,120 | 1 month LIBOR + 5.25% | 6.2% | 71.8% |
| Senior Debt 101 | Multifamily | 25,767 | 1 month LIBOR + 2.70% | 3.7% | 76.0% |
| Senior Debt 102 | Multifamily | 7,150 | 1 month LIBOR + 4.75% | 5.7% | 75.3% |
| Senior Debt 103 | Multifamily | 25,000 | 1 month LIBOR + 3.00% | 4.0% | 75.5% |
| Senior Debt 104 | Multifamily | 8,786 | 1 month LIBOR + 2.80% | 3.8% | 69.2% |
| Senior Debt 105 | Office | 26,500 | 1 month LIBOR + 6.00% | 7.0% | 64.9% |
| Senior Debt 106 | Multifamily | 12,289 | 1 month LIBOR + 3.10% | 4.1% | 63.7% |
| Senior Debt 107 | Multifamily | 35,100 | 1 month LIBOR + 3.25% | 4.2% | 70.2% |
| Senior Debt 108 | Office | 23,370 | 1 month LIBOR + 3.70% | 4.7% | 65.7% |
| Type | Property Type | Par Value | Interest Rate (1) | Effective Yield | Loan to Value (2) |
| Senior Debt 109 | Industrial | 25,350 | 1 month LIBOR + 3.50% | 4.5% | 58.1% |
| Senior Debt 110 | Multifamily | 11,800 | 1 month LIBOR + 3.15% | 4.1% | 72.4% |
| Senior Debt 111 | Multifamily | 43,207 | 1 month LIBOR + 5.50% | 6.5% | 43.4% |
| Senior Debt 112 | Office | 26,500 | 1 month LIBOR + 2.70% | 3.7% | 71.4% |
| Senior Debt 113 | Multifamily | 75,100 | 1 month LIBOR + 4.35% | 5.3% | 64.7% |
| Senior Debt 114 | Hospitality | 17,689 | 5.75% | 5.8% | 52.9% |
| Mezzanine Loan 1 | Multifamily | 3,480 | 9.50% | 9.5% | 84.3% |
| Mezzanine Loan 2 | Retail | 3,500 | 10.00% | 10.0% | 59.7% |
| Mezzanine Loan 3 | Multifamily | 1,100 | 11.01% | 11.0% | 68.4% |
| Mezzanine Loan 4 | Multifamily | 1,000 | 11.00% | 11.0% | 68.9% |
| $2,670,133 | 4.9% | 66.2% | |||
________________________
(1) Our floating rate loan agreements contain the contractual obligation for the borrower to maintain an interest rate cap to protect against rising interest rates. In a simple interest rate cap, the borrower pays a premium for a notional principal amount based on a capped interest rate (the "cap rate"“cap rate”). When the floating rate exceeds the cap rate, the borrower receives a payment from the cap counterparty equal to the difference between the floating rate and the cap rate on the same notional principal amount for a specified period of time. When interest rates rise, the value of an interest rate cap will increase, thereby reducing the borrower's exposure to rising interest rates.
(2) Loan to value percentage is from metrics at origination.
The following table shows selected data from our commercial mortgage loans, held-for-sale, measured at fair value.value in our portfolio as of March 31, 2020 (dollars in thousands):
| Loan Type | Property Type | Par Value | Interest Rate | Effective Yield | Loan to Value (1) |
| TRS Senior 1 | Mixed Use | $14,150 | 4.41% | 4.4% | 53.4% |
| TRS Senior 2 | Retail | 28,000 | 4.34% | 4.3% | 69.5% |
| TRS Senior 3 | Multifamily | 7,200 | 4.87% | 4.9% | 49.7% |
| TRS Senior 4 | Industrial | 11,600 | 4.21% | 4.2% | 55.8% |
| 60,950 | n/m | 60.8% | |||
(1) Loan to value percentage is from metrics at origination. | |||||
| n/m - not meaningful. | |||||
| Loan Type | Property Type | Par Value | Interest Rate | Effective Yield | Loan to Value (1) |
| TRS Senior Debt 1 | Industrial | $23,625 | 2.90% | 4.7% | 74.1% |
| TRS Senior Debt 2 | Multifamily | 30,000 | 4.55% | 3.5% | 52.8% |
| TRS Senior Debt 3 | Multifamily | 11,000 | 4.45% | 4.1% | 59.8% |
| TRS Senior Debt 4 | Retail | 1,868 | 4.06% | 4.4% | 69.9% |
| TRS Senior Debt 5 | Retail | 17,500 | 3.94% | 4.0% | 74.2% |
| TRS Senior Debt 6 | Manufactured Housing | 1,850 | 4.25% | 4.1% | 70.6% |
| TRS Senior Debt 7 | Retail | 1,825 | 4.09% | 4.1% | 48.0% |
| TRS Senior Debt 8 | Office | 6,000 | 4.06% | 3.7% | 60.6% |
| $93,668 | 4.0% | 64.1% | |||
________________________
(1)Loan to value percentage is from metrics at origination.
The following table shows selected data from our real estate securities, available for sale, measured at fair value in our portfolio as of March 31, 2020 (dollars in thousands):
| Type | Par Value | Interest Rate | Effective Yield |
| CMBS 1 | $13,250 | 1 month LIBOR + 2.95% | 3.9% |
| CMBS 2 | 11,488 | 1 month LIBOR + 2.10% | 3.1% |
| CMBS 3 | 40,000 | 1 month LIBOR + 2.35% | 3.3% |
| CMBS 4 | 18,500 | 1 month LIBOR + 1.70% | 2.7% |
| CMBS 5 | 15,000 | 1 month LIBOR + 1.37% | 2.4% |
| CMBS 6 | 13,500 | 1 month LIBOR + 1.50% | 2.5% |
| CMBS 7 | 15,000 | 1 month LIBOR + 1.70% | 2.7% |
| CMBS 8 | 7,000 | 1 month LIBOR + 1.50% | 2.5% |
| CMBS 9 | 9,600 | 1 month LIBOR + 1.90% | 2.9% |
| CMBS 10 | 10,000 | 1 month LIBOR + 1.75% | 2.7% |
| CMBS 11 | 8,000 | 1 month LIBOR + 1.85% | 2.8% |
| CMBS 12 | 13,000 | 1 month LIBOR + 1.60% | 2.6% |
| CMBS 13 | 32,000 | 1 month LIBOR + 1.60% | 2.6% |
| CMBS 14 | 24,000 | 1 month LIBOR + 2.00% | 3.0% |
| CMBS 15 | 50,000 | 1 month LIBOR + 1.55% | 2.5% |
| CMBS 16 | 26,000 | 1 month LIBOR + 1.90% | 2.9% |
| CMBS 17 | 15,000 | 1 month LIBOR + 1.45% | 2.4% |
| CMBS 18 | 6,500 | 1 month LIBOR + 1.75% | 2.7% |
| CMBS 19 | 12,000 | 1 month LIBOR + 2.15% | 3.1% |
| CMBS 20 | 20,000 | 1 month LIBOR + 1.33% | 2.3% |
| CMBS 21 | 25,000 | 1 month LIBOR + 1.63% | 2.6% |
| CMBS 22 | 22,500 | 1 month LIBOR + 1.40% | 2.4% |
| CMBS 23 | 16,000 | 1 month LIBOR + 1.80% | 2.8% |
| CMBS 24 | 2,000 | 1 month LIBOR + 1.80% | 2.8% |
| CMBS 25 | 2,200 | 1 month LIBOR + 1.40% | 2.4% |
| CMBS 26 | 12,500 | 1 month LIBOR + 1.75% | 2.7% |
| CMBS 27 | 25,665 | 1 month LIBOR + 2.15% | 3.1% |
| CMBS 28 | 28,000 | 1 month LIBOR + 1.34% | 2.3% |
| CMBS 29 | 15,000 | 1 month LIBOR + 1.63% | 2.6% |
| $508,703 | 2.8% | ||
The following table shows selected data from our other real estate investments, measured at fair value in our portfolio as of March 31, 2020 (dollars in thousands):
| Type | Property Type | Par Value | Preferred Return |
| Preferred Equity 1 | Retail | $2,500 | 12.50% |
| $2,500 | |||
The following table shows selected data from our real estate owned assets in our portfolio as of March 31, 2020 (dollars in thousands):
| Type | Property Type | Carrying Value | ||
| Real Estate Owned 1 | Hospitality | $ | 8,198 | |
| Real Estate Owned 2 | Office | 27,108 | ||
| Real Estate Owned 3 | Hospitality | 14,000 | ||
| $ | 49,306 | |||
Results of Operations
We conduct our business through the following segments:
The real estate debt business which is focusedfocuses on originating, acquiring and asset managing commercial real estate debt investments, including first mortgage loans, subordinate mortgages, mezzanine loans and participations in such loans.
The real estate securities business focuses on investing in and asset managing commercial real estate securities primarily consisting of CMBS and may include unsecured REIT debt, CDO notes and other securities.
The conduitConduit business operated through the Company's TRS, which is focused on generating superior risk-adjusted returns by originating and subsequently selling fixed-rate commercial real estate loans into the CMBS securitization market at a profit.
The real estate owned business represents real estate acquired by the Company performed a recastthrough foreclosure, deed in lieu of its results of operations for the TRS, a new line of business, and determined there to be no material changes.
Net Interest Income
Net interest income is generated on our interest-earning assets less related interest-bearing liabilities and is recorded as part of our real estate debt, and real estate securities and TRS segments.
The following table presents the average balance of interest-earning assets less related interest-bearing liabilities, associated interest income and expense and corresponding yield earned and incurred for the three months ended September 30, 2017March 31, 2020 and 2016March 31, 2019 (dollars in thousands):
| Three Months Ended September 30, | Three Months Ended March 31, | |||||||||||||||||||||||||||||||||||||||||||
| 2017 | 2016 | 2020 | 2019 | |||||||||||||||||||||||||||||||||||||||||
Average Carrying Value(1) | Interest Income / Expense(2) | WA Yield / Financing Cost(3)(4) | Average Carrying Value(1) | Interest Income / Expense(2) | WA Yield / Financing Cost(3)(4) | Average Carrying Value(1) | Interest Income/Expense(2) | WA Yield/Financing Cost(3)(4) | Average Carrying Value(1) | Interest Income/Expense(2) | WA Yield/Financing Cost(3)(4) | |||||||||||||||||||||||||||||||||
| Interest-earning assets: | ||||||||||||||||||||||||||||||||||||||||||||
| Real estate debt | $ | 1,272,914 | $ | 21,919 | 6.9 | % | $ | 1,127,464 | $ | 18,682 | 6.6 | % | $ | 2,702,936 | $ | 43,369 | 6.4 | % | $ | 2,325,959 | $ | 43,634 | 7.5 | % | ||||||||||||||||||||
| Real estate conduit | 100,175 | 1,190 | 4.8 | % | 150,821 | 2,370 | 6.3 | % | ||||||||||||||||||||||||||||||||||||
| Real estate securities | 12,749 | 276 | 8.7 | % | 122,264 | 1,568 | 5.1 | % | 406,186 | 3,295 | 3.2 | % | 41,151 | 507 | 4.9 | % | ||||||||||||||||||||||||||||
| Total | $ | 1,285,663 | $ | 22,195 | 6.9 | % | $ | 1,249,728 | $ | 20,250 | 6.5 | % | $ | 3,209,297 | $ | 47,854 | 6.0 | % | $ | 2,517,931 | $ | 46,511 | 7.4 | % | ||||||||||||||||||||
| Interest-bearing liabilities: | ||||||||||||||||||||||||||||||||||||||||||||
| Repurchase agreements - commercial mortgage loans | $ | 237,017 | $ | 2,784 | 4.7 | % | $ | 253,860 | $ | 4,451 | 7.0 | % | ||||||||||||||||||||||||||||||||
| Other financing - commercial mortgage loans | 34,681 | 472 | 5.4 | % | — | — | — | % | ||||||||||||||||||||||||||||||||||||
| Repurchase agreements - real estate securities | 47,477 | 409 | 3.4 | % | 114,086 | 675 | 2.4 | % | ||||||||||||||||||||||||||||||||||||
| Repurchase Agreements - commercial mortgage loans | $ | 282,282 | $ | 3,911 | 5.5 | % | $ | 357,850 | $ | 5,046 | 5.6 | % | ||||||||||||||||||||||||||||||||
| Other financing and loan participation - commercial mortgage loans | 1,502 | 18 | 4.8 | % | 9,904 | 123 | 5.0 | % | ||||||||||||||||||||||||||||||||||||
| Repurchase Agreements - real estate securities | 412,809 | 2,572 | 2.5 | % | 52,711 | 498 | 3.8 | % | ||||||||||||||||||||||||||||||||||||
| Collateralized loan obligations | 523,227 | 5,180 | 4.0 | % | 287,443 | 2,191 | 3.0 | % | 1,776,274 | 17,991 | 4.1 | % | 1,385,288 | 14,583 | 4.2 | % | ||||||||||||||||||||||||||||
| Derivative instruments, at fair value | — | — | N/A | — | 116 | N/A | ||||||||||||||||||||||||||||||||||||||
| Total | $ | 842,402 | $ | 8,845 | 4.2 | % | $ | 655,389 | $ | 7,317 | 4.5 | % | $ | 2,472,867 | $ | 24,492 | 4.0 | % | $ | 1,805,753 | $ | 20,366 | 4.5 | % | ||||||||||||||||||||
| Net interest income/spread | $ | 13,350 | 2.7 | % | $ | 12,933 | 2.0 | % | $ | 23,362 | 2.0 | % | $ | 26,145 | 2.9 | % | ||||||||||||||||||||||||||||
Average leverage %(5) | 65.5 | % | 52.4 | % | 77.1 | % | 71.7 | % | ||||||||||||||||||||||||||||||||||||
Weighted average levered yield(6) | 8.7 | % | 7.5 | % | 12.7 | % | 14.7 | % | ||||||||||||||||||||||||||||||||||||
(1) Based on amortized cost for real estate debt and real estate securities and principal amount for repurchase agreements. Amounts are calculated based on daily averages for the three months ended September 30, 2017March 31, 2020 and 2016,March 31, 2019, respectively.
(2) Includes the effect of amortization of premium or accretion of discount and deferred fees.
(3) Calculated as interest income or expense divided by average carrying value.
(4) Annualized.
(5) Calculated by dividing total average interest-bearing liabilities by total average interest-earning assets.
(6) Calculated by taking the sum of (i) thedividing net interest income/spread multiplied by difference between the average leverageinterest-earning assets and (ii) the interest-earning assets.
average interest-bearing liabilities.
Interest Incomeincome
Interest income earned duringfor the three months ended September 30, 2017 was $1.9March 31, 2020 and March 31, 2019 totaled $47.9 million higher compared toand $46.5 million, respectively. As of March 31, 2020, our portfolio consisted of 118 commercial mortgage loans, 8 commercial mortgage loans, held-for-sale, measured at fair value, 29 investments in CMBS and one other real estate investment, measured at fair value. The main driver in the three months ended September 30, 2016. The increase in interest income was due to an increase in the 1 Month LIBOR, the benchmark index for our loans and an increase of $35$691.4 million in the average carrying value of our interest-earning assets. As of September 30, 2017, our loans had a total carrying value of $1,379.2 million and our CMBS investments had a fair value of $0.0 million, while as of September 30, 2016, our loans had a total carrying value of $1,120.9 million and our CMBS investments had a fair value of $57.6 million.
Interest Expenseexpense
Interest expense for the three months ended September 30, 2017 was $1.5March 31, 2020 increased to $24.5 million higher compared to theinterest expense for three months ended September 30, 2016.March 31, 2019 of $20.4 million. The increase in interest expense was due to an increase in the 1 Month LIBOR, the benchmark index for our financing lines and an increase of $187$667.1 million in the average carrying value of our interest-bearing liabilities.
Expenses from operations
Expenses from operations for the three months ended September 30, 2017March 31, 2020 and 2016March 31, 2019 were made up of the following (in(dollars in thousands):
| Three Months Ended September 30, | Three months ended March 31, | |||||||||||||||
| 2017 | 2016 | 2020 | 2019 | |||||||||||||
| Asset management and subordinated performance fee | $ | 2,299 | $ | 1,066 | $ | 3,912 | $ | 3,644 | ||||||||
| Acquisition fees and acquisition expenses | 1,685 | 255 | ||||||||||||||
| Administrative services expenses | 4,112 | 3,963 | ||||||||||||||
| Acquisition expenses | 142 | 248 | ||||||||||||||
| Professional fees | 1,348 | 2,154 | 2,784 | 2,095 | ||||||||||||
| Administrative services expenses | 1,480 | 2,480 | ||||||||||||||
| Real estate owned operating expenses | 1,645 | — | ||||||||||||||
| Depreciation and amortization | 588 | — | ||||||||||||||
| Other expenses | 1,411 | 686 | 1,587 | 896 | ||||||||||||
| Total expenses | $ | 8,223 | $ | 6,641 | ||||||||||||
| Total expenses from operations | $ | 14,770 | $ | 10,846 | ||||||||||||
The increase in our expenses from operations was primarily related to real estate owned operating expenses and depreciation and amortization. The increase is attributable to our 3 real estate owned investments during three months ended March 31, 2020 the as compared to none during the three months ended March 31, 2019. For the three months ended September 30, 2017,March 31, 2020, we incurred approximately $1.6 million of real estate owned operating expenses; compared to $0.0 million of such expenses were primarilyfor the three months ended March 31, 2019, as there was no real estate owned at the time. Additionally, during the three months ended March 31, 2020, we incurred $0.6 million of depreciation and amortization expenses related to asset management and subordinated performance fees.real estate owned, compared to $0.0 million three months ended March 31, 2019. During the three months ended September 30, 2017March 31, 2020 and September 30, 2016,March 31, 2019, we incurred $2.3 million and $1.1 million of asset management and subordinated performance fees respectively, anof $3.9 million and $3.6 million, respectively. The increase of $1.2 million. The entire $2.3 million in the asset management and subordinated performance fee linewas primarily driven by the larger stockholders’ equity and Preferred Stock in the three months ended March 31, 2020 compared to the three months ended March 31, 2019. The increases in administrative expense reimbursement, professional fees and other expenses are due to increases in overall Company growth and origination activities.
Realized Gain/Loss on Commercial Mortgage Loans Held-for-Sale
There were no sales on commercial mortgage loans held-for-sale for the three months ended September 30, 2017 is composed of asset management fees, as there was no subordinated performance fee dueMarch 31, 2020 compared to applicable conditions not having been satisfied. The $1.1 million in the asset management and subordinated performance fee line$25.0 thousand realized loss for the three months ended September 30, 2016, is composed approximately $2.3 millionMarch 31, 2019 on the sale of asset management fees andone commercial mortgage loan held-for-sale for proceeds of $5.0 million.
Realized gain on commercial mortgage loans held-for-sale, measured at fair value at the reversal of approximately $1.3 million of subordinated performance fees.
As of March 31, 2020 our Real estate securities, available for sale, measured at fair value had an unrecognized unrealized loss of $67.6 million included within the Nine Months Ended September 30, 2017to the Nine Months Ended September 30, 2016
| Nine Months Ended September 30, | ||||||||||||||||||||||
| 2017 | 2016 | |||||||||||||||||||||
Average Carrying Value(1) | Interest Income / Expense(2) | WA Yield / Financing Cost(3)(4) | Average Carrying Value(1) | Interest Income / Expense(2) | WA Yield / Financing Cost(3)(4) | |||||||||||||||||
| Interest-earning assets: | ||||||||||||||||||||||
| Real estate debt | $ | 1,157,015 | $ | 60,566 | 7.0 | % | $ | 1,133,211 | $ | 55,973 | 6.6 | % | ||||||||||
| Real estate securities | 25,424 | 1,351 | 7.1 | % | 128,474 | 4,790 | 5.0 | % | ||||||||||||||
| Total | $ | 1,182,439 | $ | 61,917 | 7.0 | % | $ | 1,261,685 | $ | 60,763 | 6.4 | % | ||||||||||
| Interest-bearing liabilities: | ||||||||||||||||||||||
| Repurchase agreements - commercial mortgage loans | $ | 301,665 | $ | 10,511 | 4.6 | % | $ | 248,436 | $ | 9,019 | 4.8 | % | ||||||||||
| Other financing - commercial mortgage loans | 17,555 | 712 | 5.4 | % | — | — | n/a | |||||||||||||||
| Repurchase agreements - real estate securities | 54,928 | 1,254 | 3.0 | % | 119,054 | 2,035 | 2.3 | % | ||||||||||||||
| Collateralized loan obligations | 335,683 | 9,513 | 3.8 | % | 287,351 | 6,424 | 3.0 | % | ||||||||||||||
| Total | $ | 709,831 | $ | 21,990 | 4.1 | % | $ | 654,841 | $ | 17,478 | 3.6 | % | ||||||||||
| Net interest income/spread | $ | 39,927 | 2.9 | % | $ | 43,285 | 2.8 | % | ||||||||||||||
Average leverage %(5) | 60.0 | % | 51.9 | % | ||||||||||||||||||
Weighted average levered yield(6) | 8.7 | % | 7.9 | % | ||||||||||||||||||
| Nine Months Ended September 30, | ||||||||
| 2017 | 2016 | |||||||
| Asset management and subordinated performance fee | $ | 6,952 | $ | 7,091 | ||||
| Acquisition fees and acquisition expenses | 4,175 | 635 | ||||||
| Professional fees | 3,320 | 4,226 | ||||||
| Administrative services expenses | 3,285 | 3,835 | ||||||
| Other expenses | 2,773 | 2,092 | ||||||
| Total expenses from operations | $ | 20,505 | $ | 17,879 | ||||
Liquidity and Capital Resources
Our principal demands for cash will be acquisition costs, including the purchase price of anyfunding our loan investments, we originate or acquire,continuing debt service obligations, distributions to our stockholders and the payment of our operating and administrative expenses, continuing debt service obligations, and distributions to our stockholders. We currently believe that we have sufficient liquidity and capital resources available for all anticipated uses, including the acquisition of additional investments, required debt service and the payment of cash dividends.expenses.
We expect to use additional debt and equity financing as a source of capital. Our board of directors currently intends to operate at a leverage level of between one to three times book value of equity. However, our board of directors may change this target without shareholder approval. In addition, for the three months ended March 31, 2020, we raised an additional $10.9 million through sales of common and preferred equity to institutional and individual investors. We anticipate that adequateour debt and equity financing sources and our anticipated cash will be generated from operations will be adequate to fund our operating and administrative expenses, continuing debt service obligations and the paymentanticipated uses of distributions.capital.
In addition to our current mix of financing sources, we may also access additional forms of financings, including credit facilities, securitizations, public and private, secured and unsecured debt issuances by us or our subsidiaries, or through capital recycling initiatives whereby we sell certain assets in our portfolio and reinvest the proceeds in assets with more attractive risk-adjusted returns.
Refer to “COVID-19 Pandemic” above for information on the impact of the COVID-19 pandemic on our liquidity.
Collateralized Loan Obligations
On January 15, 2020, the Company called all of the outstanding notes issued by BSPRT 2017-FL2 Issuer, Ltd., a wholly owned indirect subsidiary of the Company. The outstanding principal of the notes on the date of the call was $21.0 million. The Company recognized all the remaining unamortized deferred financing costs of $4.5 million recorded within the Interest expense line of the consolidated statements of operations, which was a non-cash charge.
As of March 31, 2020 and December 31, 2019 the notes issued by BSPRT 2018-FL3 Issuer, Ltd. and BSPRT 2018-FL3 Co-Issuer, LLC, wholly owned indirect subsidiaries of the Company, are collateralized by interests in a pool of 42 and 41 mortgage assets having a principal balance of $579.6 million and $523.2 million, respectively (the "2018-FL3 Mortgage Assets"). The sale of the 2018-FL3 Mortgage Assets to BSPRT 2018-FL3 Issuer, Ltd. is governed by a Mortgage Asset Purchase Agreement dated as of April 5, 2018, between the Company and BSPRT 2018-FL3 Issuer, Ltd.
As of March 31, 2020 and December 31, 2019 the notes issued by BSPRT 2018-FL4 Issuer, Ltd. and BSPRT 2018-FL4 Co-Issuer, LLC, each wholly owned indirect subsidiaries of the Company, are collateralized by interests in a pool of 53 and 49 mortgage assets having a principal balance of $868.7 million and $867.9 million, respectively (the "2018-FL4 Mortgage Assets"). The sale of the 2018-FL4 Mortgage Assets to BSPRT 2018-FL4 Issuer is governed by a Mortgage Asset Purchase Agreement dated as of October 12, 2018, between the Company and BSPRT 2018-FL4 Issuer.
As of March 31, 2020 and December 31, 2019, the notes issued by BSPRT 2019-FL5 Issuer, Ltd. and BSPRT 2019-FL5 Co-Issuer, LLC, each wholly owned indirect subsidiaries of the Company, are collateralized by interests in a pool of 53 and 48 mortgage assets having a principal balance of $803.4 million and $809.4 million respectively (the "2019-FL5 Mortgage Assets"). The sale of the 2019-FL5 Mortgage Assets to BSPRT 2019-FL5 Issuer is governed by a Mortgage Asset Purchase Agreement dated as of May 30, 2019, between the Company and BSPRT 2019-FL5 Issuer.
Repurchase Agreement,Agreements, Commercial Mortgage Loans
As of September 30, 2017,March 31, 2020, we have repurchase facilities with JPMorgan Chase Bank, National Association (the "JPM Repo Facility"), Goldman Sachs Bank USA (the "GS Repo Facility"), U.S.U.S Bank National Association (the "USB Repo Facility"), Barclays Bank PLC (the "Barclays Revolver Facility" and the "Barclays Repo Facility"), Wells Fargo Bank, National Association (the "WF Repo Facility"), and Credit Suisse AG (the "CS Repo Facility" and together with JPM Repo Facility, GS Repo Facility, USB Repo Facility, WF Repo Facility, Barclays Revolver Facility and Barclays Repo Facility, the "Repo Facilities").
The JPM Repo Facility has a maturity date of June 12, 2019 plus a one-year extension at the Company's option and provides up to $300.0 million in advances. The GS Repo Facility has a maturity date of December 27, 2018, with a one-year extension at the Company’s option,Facilities are financing sources through which may be exercised upon the satisfaction of certain conditions, and provides up to $250.0 million in advances. The USB Repo Facility matures on July 15, 2020, with two one-year extensions at the option of the Company, which may be exercised upon the satisfaction of certain conditions, and provides up to $100.0 million in advances. The CS Repo Facility matures on August 30, 2018 and provides up to $250.0 million in advances. Prior to the end of each calendar quarter, the Company may requestpledge one or more mortgage loans to the financing entity in exchange for funds typically at an extensionadvance rate of between 65% to 80% of the termination date for an additional 364 days fromprincipal amount of the end of such calendar quarter subject to the satisfaction of certain conditions and approvals.mortgage loan being pledged.
We expect to use the advances from these Repo Facilities to finance the acquisition or origination of eligible loans, including first mortgage loans, subordinated mortgage loans, mezzanine loans and participation interests therein.
The Repo Facilities generally provide that in the event of a decrease in the value of the Company'sour collateral, the lenders can demand additional collateral. Should the value of the Company’sour collateral decrease as a result of deteriorating credit quality, resulting margin calls may cause an adverse change in the Company’sour liquidity position.
The details of our Repo Facilities at March 31, 2020 and December 31, 2019 are as follows (dollars in thousands):
| As of March 31, 2020 | |||||||||||||||||
| Repurchase Facility | Committed Financing | Amount Outstanding | Interest Expense(1) | Ending Weighted Average Interest Rate | Maturity | ||||||||||||
JPM Repo Facility (2) | $ | 300,000 | $ | 119,604 | $ | 1,362 | 3.83 | % | 1/30/2021 | ||||||||
USB Repo Facility (3) | 100,000 | 8,250 | 152 | 3.18 | % | 6/15/2020 | |||||||||||
CS Repo Facility (4) | 200,000 | 71,740 | 1,349 | 4.06 | % | 9/27/2020 | |||||||||||
WF Repo Facility (5) | 175,000 | — | 396 | N/A | 11/21/2020 | ||||||||||||
Barclays Revolver Facility (6) | 100,000 | 4,200 | 51 | 5.34 | % | 9/20/2021 | |||||||||||
Barclays Repo Facility (7) | 300,000 | 30,730 | 332 | 3.24 | % | 3/15/2022 | |||||||||||
| Total | $ | 1,175,000 | $ | 234,524 | $ | 3,642 | |||||||||||
__________________________
(1) For the three months ended March 31, 2020. Includes amortization of deferred financing costs.
(2) On September 3, 2019, the committed financing amount was downsized from $520 million to $300 million and the maturity date was amended to January 30, 2021.
(3) Includes two one-year extensions at the option of an indirect wholly-owned subsidiary of the Company, which may be exercised upon the satisfaction of certain conditions.
(4) On March 26, 2020, the Company exercised the extension option upon the satisfaction of certain conditions, and extended the term maturity to September 27, 2020.
(5) Includes three one-year extensions at the Company’s option, which may be exercised upon the satisfaction of certain conditions.
(6) On September 13, 2019, the Company exercised the extension option, and extended the term maturity to September 20, 2021. There is one more one-year extension option available at the Company's discretion.
(7) Includes two one-year extensions at the Company's option.
| As of December 31, 2019 | |||||||||||||||||
| Repurchase Facility | Committed Financing | Amount Outstanding | Interest Expense(1) | Ending Weighted Average Interest Rate | Maturity | ||||||||||||
JPM Repo Facility (2) | $ | 300,000 | $ | 107,526 | $ | 6,862 | 4.51 | % | 1/30/2021 | ||||||||
USB Repo Facility (3) | 100,000 | — | 622 | N/A | 6/15/2020 | ||||||||||||
CS Repo Facility (4) | 300,000 | 87,375 | 5,563 | 4.84 | % | 3/27/2020 | |||||||||||
WF Repo Facility (5) | 175,000 | 24,942 | 1,333 | 3.65 | % | 11/21/2020 | |||||||||||
Barclays Revolver Facility (6) | 100,000 | — | 976 | N/A | 9/20/2021 | ||||||||||||
Barclays Repo Facility (7) | 300,000 | 32,700 | 1,260 | 3.80 | % | 3/15/2022 | |||||||||||
| Total | $ | 1,275,000 | $ | 252,543 | $ | 16,616 | |||||||||||
_______________________
(1) For the twelve months ended December 31, 2019. Includes amortization of deferred financing costs.
(2) On September 3, 2019, the committed financing amount was downsized from $520 million to $300 million and the maturity date was amended to January 30, 2021.
(3) Includes two one-year extensions at the option of an indirect wholly-owned subsidiary of the Company, which may be exercised upon the satisfaction of certain conditions.
(4) On March 26, 2019, the Company exercised the extension option upon the satisfaction of certain conditions, and extended the term maturity to March 27, 2020.
(5) Includes three one-year extensions at the Company’s option, which may be exercised upon the satisfaction of certain conditions.
(6) On September 13, 2019, the Company exercised the extension option, and extended the term maturity to September 20, 2021. There is one more one-year extension option available at the Company's discretion.
(7) Includes two one-year extensions at the Company's option.
Other financing and loan participation - Commercial Mortgage Loans
Unsecured Debt
On March 26, 2020, the Company and certain of its subsidiaries entered into a financing arrangementmaterial amendment to an existing lending agreement with Pacific Western BankSecurity Benefit Life Insurance Company ("SBL"), secured by a pledge of equity interests in certain of the Company’s subsidiaries, for term financing (“PWB Financing”) on May 17, 2017.a total commitment of $100 million with a maturity of February 10, 2023 and a rate of one-month LIBOR + 4.5%. The PWB Financing providedamendment revised the terms of the existing SBL lending agreement, entered into in February 2020, to permit the Company to borrow under the agreement. The Company incurred $17.0 thousand of interest expense on its lending agreement with $36.2 million and is collateralized by a portfolio asset of $54.2 million. The PWB Financing initially matures on June 9, 2019, with two one-year extension option atSBL for the Company’s option.three months ended March 31, 2020. As of September 30, 2017, we had $30.5 millionMarch 31, 2020 there was no outstanding under the PWB Financingbalance.
CMBS Master Repurchase Agreements - Real Estate Securities
We have entered into various CMBS Master Repurchase Agreements ("MRAs"(“MRAs”) that allow us to sell real estate securities while providing a fixed repurchase price for the same real estate securities in the future. The repurchase contracts on each security under an MRA generally mature in 30 to 90 days and terms are adjusted for current market rates as necessary. As of September 30, 2017March 31, 2020 and December 31, 2016,2019, we entered into sixwere party to four MRAs, of which one and threetwo were in useused for each respective periods presented, described below (in(dollars in thousands):
| Amount | Weighted Average | Weighted Average | ||||||||||||||||||||||||||||||||
| Counterparty | Outstanding | Accrued Interest | Collateral Pledged (*) | Interest Rate | Days to Maturity | Amount Outstanding | Accrued Interest | Collateral Pledged (1) | Interest Rate | Days to Maturity | ||||||||||||||||||||||||
| As of September 30, 2017 | ||||||||||||||||||||||||||||||||||
| J.P. Morgan Securities LLC | $ | 39,035 | $ | 74 | $ | 55,764 | 2.97 | % | 6 | |||||||||||||||||||||||||
| As of March 31, 2020 | ||||||||||||||||||||||||||||||||||
| JP Morgan Securities LLC | $ | 159,879 | $ | 595 | $ | 202,688 | 2.21 | % | 11 | |||||||||||||||||||||||||
| Wells Fargo Securities, LLC | 159,924 | 955 | 190,623 | 2.32 | % | 12 | ||||||||||||||||||||||||||||
| Barclays Capital Inc. | 79,047 | 365 | 106,965 | 2.28 | % | 17 | ||||||||||||||||||||||||||||
| Citigroup Global Markets, Inc. | 98,030 | 653 | 109,500 | 2.60 | % | 16 | ||||||||||||||||||||||||||||
| Total/Weighted Average | $ | 39,035 | $ | 74 | $ | 55,764 | 2.97 | % | 6 | $ | 496,880 | $ | 2,568 | $ | 609,776 | 2.33 | % | 13 | ||||||||||||||||
| As of December 31, 2016 | ||||||||||||||||||||||||||||||||||
| J.P. Morgan Securities LLC | $ | 59,122 | $ | 96 | $ | 92,658 | 2.55 | % | 6 | |||||||||||||||||||||||||
| As of December 31, 2019 | ||||||||||||||||||||||||||||||||||
| JP Morgan Securities LLC | $ | 83,353 | $ | 124 | $ | 93,500 | 2.53 | % | 20 | |||||||||||||||||||||||||
| Wells Fargo Securities, LLC | $ | 178,304 | $ | 1,199 | $ | 209,873 | 2.94 | % | 11 | |||||||||||||||||||||||||
| Barclays Capital Inc. | $ | 40,720 | $ | 221 | $ | 47,475 | 2.81 | % | 23 | |||||||||||||||||||||||||
| Citigroup Global Markets, Inc. | 3,879 | 1 | 4,850 | 2.11 | % | 26 | 91,982 | 413 | 103,453 | 2.69 | % | 19 | ||||||||||||||||||||||
| Wells Fargo Securities, LLC | 3,638 | 4 | 4,850 | 2.05 | % | 13 | ||||||||||||||||||||||||||||
| Total/Weighted Average | $ | 66,639 | $ | 101 | $ | 102,358 | 2.50 | % | 8 | $ | 394,359 | $ | 1,957 | $ | 454,301 | 2.79 | % | 16 | ||||||||||||||||