UNITED STATES

SECURITIES AND

EXCHANGE COMMISSION

WASHINGTON, D.C. 20549

FORM

10-Q
QUARTERLY REPORT PURSUANT TO SECTION 13 OR 15(d) OF THE SECURITIES EXCHANGE ACT OF 1934

QUARTERLY REPORT PURSUANT TO SECTION 13 OR 15(d) OF THE SECURITIES EXCHANGE ACT OF 1934

For the quarterly period ended

March 31, 2023
2024

or

TRANSITION REPORT PURSUANT TO SECTION 13 OR 15(d) OF THE SECURITIES EXCHANGE ACT OF 1934

TRANSITION REPORT PURSUANT TO SECTION 13 OR 15(d) OF THE SECURITIES EXCHANGE ACT OF 1934

For the transition period from  _____________  to

______
_______

Commission file number

001-39028

CROSSFIRST BANKSHARES, INC.

(Exact Name of Registrant as Specified in its Charter)

Kansas
26-3212879

Kansas

26-3212879

(State or other jurisdiction of incorporation or organization)

(I.R.S. Employer Identification No.)

11440 Tomahawk Creek Parkway

Leawood

,

KS

66211

(Address of principal executive offices)

(Zip Code)

(State or other jurisdiction of incorporation or organization)

(I.R.S. Employer Identification No.913)
11440 Tomahawk Creek Parkway
Leawood
,
KS
66211
(Address of principal executive offices)
(Zip Code)
(
913
)
901-4516

(Registrant’s telephone number, including area code)

N/A

(Former name, former address and former fiscal year, if changed since

last report)

Securities registered pursuant to Section 12(b) of the Act:

Title of each class
Trading Symbol
Name of each exchange on which registered
Common Stock, par value $0.01 per share
CFB
The Nasdaq Stock Market LLC

Title of each class

Trading Symbol

Name of each exchange on which registered

Common Stock, par value $0.01 per share

CFB

The Nasdaq Stock Market LLC

Indicate by check mark whether the registrant (1) has filed all reports required

to be filed by Section 13 or 15(d) of the Securities
Exchange Act of 1934 during the preceding 12 months (or for such shorter period that the registrant was required to file such
reports), and
(2) has been subject to such filing requirements for the past 90 days.

Yes

No

Indicate by check mark whether the registrant has submitted electronically

every Interactive Data File required to be submitted pursuant to
Rule 405 of Regulation S-T (Section 232.405 of this chapter) during the preceding 12 months (or
for such shorter period that the registrant
was required to submit such files).
Yes
No

Indicate by check mark whether the registrant is a large accelerated filer, an accelerated

filer, a non-accelerated filer, a smaller reporting
company, or an emerging growth company. See the definitions of
“large “large accelerated filer,” “accelerated filer,” “smaller reporting
company,” and “emerging growth company” in Rule 12b-2 of the Exchange Act.
Large accelerated filer
Accelerated filer
Non-accelerated filer
Smaller reporting company
Emerging growth company

Large accelerated filer

Accelerated filer

Non-accelerated filer

Smaller reporting company

Emerging growth company

If an emerging growth company, indicate by check mark if the registrant has elected not

to use the extended transition period for
complying with any new or revised financial accounting standards provided
pursuant to Section 13(a) of the Exchange Act.

Indicate by check mark whether the registrant is a shell company (as defined

in Rule 12b-2 of the Exchange Act).  Yes
No

As of April 28, 2023,26, 2024, the registrant had

48,600,618
 49,292,977 shares of common stock, par value $0.01, outstanding.

2

Table of Contents

CROSSFIRST BANKSHARES, INC.

INC.

Form 10-Q for the Quarter Ended March 31, 20232024

Index

Part I. Financial Information

Item 1. Consolidated Financial Statements

Cautionary Note Regarding Forward-Looking Information

3

Consolidated Statements of Financial Condition – Unaudited

4

Consolidated Statements of Operations – Unaudited

5

Consolidated Statements of Comprehensive Income – Unaudited

6

Consolidated Statements of Stockholders’ Equity – Unaudited

7

Consolidated Statements of Cash Flows – Unaudited

8

Notes to Consolidated Financial Statements – Unaudited

9

Item 2. Management’s Discussion and Analysis of Financial Condition and Results of Operations

36

Item 3. Quantitative and Qualitative Disclosures about Market Risk

52

Item 4. Controls and Procedures

54

Part II. Other Information

Item 1. Legal Proceedings

54

Item 1A. Risk Factors

54

Item 2. Unregistered Sales of Equity Securities and Use of Proceeds

54

Item 5. Other Information

55

Item 6. Exhibit Index

56

Signature

57

Index
Part I. Financial Information
Item 1. Consolidated Financial Statements
Forward-Looking Information
Consolidated Statements of Financial Condition – Unaudited
4
Consolidated Statements of Operations – Unaudited
5
Consolidated Statements of Comprehensive Income (Loss) – Unaudited
6
Consolidated Statements of Stockholders’ Equity – Unaudited
7
Consolidated Statements of Cash Flows – Unaudited
8
Notes to Consolidated Financial Statements – Unaudited
9
Item 2. Management’s Discussion and Analysis of Financial Condition and Results of Operations
49
Item 3. Quantitative and Qualitative Disclosures about Market Risk
66
Item 4. Controls and Procedures
67
Part II. Other Information
Item 1. Legal Proceedings
67
Item 1A. Risk Factors
67
Item 2. Unregistered Sales of Equity Securities and Use of Proceeds
68
Item 5. Other Information
69
Item 6. Exhibit Index
70
Signature
71

2

Table of Contents

3

Cautionary Note Regarding Forward-Looking Information

All statements contained in this quarterly report on Form 10-Q that do not directly

and exclusively relate to historical facts
constitute forward-looking statements. These statements are often, but not always, made
through the use of words or phrases such as
“may, “may,” “might,” “could,” “predict,” “potential,” “believe,” “expect,” “continue,”
“will, “will,” “anticipate,” “seek,” “estimate,” “intend,”
“plan, “plan,” “projection,” “goal,” “target,” “outlook,” “aim,” “would,”
“annualized, “annualized,” “position” and “outlook,” or the negative of these words
or other comparable words or phrases of a future or forward-looking nature.
For example, our forward-looking statements include,
without limitation, statements regarding our business plans, expectations, opportunities or plansopportunities for growth;
our expense control initiatives and the proposed acquisition of Canyon Bancorporation, Inc. and
Canyon Community Bank, N.A. (collectively “Canyon”);results expected to be realized from those initiatives; our anticipated
financial results, expenses, cash requirements and sources of liquidity; and our
capital allocation strategies and plans.
plans; and our anticipated future financial performance.

Unless we state otherwise or the context otherwise requires, references

below in this Form 10-Q to “we,” “our,” “us,” and the “Company” refer to
CrossFirst Bankshares, Inc., and its consolidated subsidiaries. References in this Form 10-Q to “CrossFirst
Bank” and the “Bank” refer to CrossFirst Bank,
our wholly owned consolidated bank subsidiary.

These forward-looking statements are not historical facts, and are based

on current expectations, estimates and projections about
our industry, management’s beliefs andbelief, certain assumptions made by management,
and financial trends that may affect our financial condition, results of operations, business strategy or financial needs, many of which, by their nature, are inherently
uncertain and beyond our control. Our actual results could differ materially from those anticipated in such forward-looking statements. Accordingly, the Company cautionswe caution you that any such forward-looking
statements are not guarantees
of future performance and are subject to risks, assumptions, estimates and uncertainties
that are difficult to predict. Although the
Company believeswe believe that the expectations reflected in these forward-looking
statements are reasonable as of the date made, actual results
may prove to be materially different from the results expressed or
implied by the forward-looking statements due to a number of factors,
including, without limitation: impacts on us and our clients of a decline in general
uncertain or unfavorable business andor economic conditions and any regulatory
responses thereto, including uncertainty and volatility in the financial markets, possible slowing or recessionary economic conditions and continuing or increasing inflation; geographic concentration of our markets; changes in market interest
rate fluctuations; rates that affect the pricing of our products and our net interest income; our ability to effectively
execute our growth strategy and manage our growth, including identifying,
consummating and consummatingintegrating suitable mergers, and acquisitions
or other business combinations, entering new lines of business or offering new or enhanced services or
products; the transition away from the London Interbank Offered
Rate (“LIBOR”); fluctuations in the fair value of our investments due to factors outside
of our control;investments; our ability to successfully manage
our credit risk, particularly in our commercial real estate, energy and commercial-based loan portfolios, and the sufficiency of our allowance; geographic concentration
allowance for credit losses; declines in the values of our markets; economic impact on our commercialthe real
estate and commercial-based loan portfolios, including declinesother collateral securing loans in
commercial and residential real estate values; our portfolio; an increase in non-
performingnon-performing assets; borrower and depositor concentration risks; risks associated with originating Small Business Administration loans; our dependence on our management team, including our ability to attract, hire and retain key personnel; maintaining
employees and increasing customer deposits, funding
availability, liquiditytheir client and community relationships; our ability to raise and maintain sufficient
liquidity and capital; competition from banks, credit unions, FinTech companies and other financial
services providers; the effectiveness of our risk management framework;
accounting estimates; our ability to maintain effective internal
control over financial reporting; our ability to keep pace with technological changes;
system failures, service denials, cyber incidents or other failures, disruptions or
security breaches; employee error, employee or client misconduct, fraud committed against the Company
or our clients, or incomplete or inaccurate information about
clients and counterparties; mortgage markets;disruptions to our business caused by our third-party service providers; our ability to maintain our reputation;
environmental liability or failure to comply with regulatory requirements affecting foreclosed properties; costs and effects of litigation; environmental
liability;litigation, investigations or similar matters to which we may be subject; risk exposure from transactions with financial counterparties; severe
weather, natural disasters, pandemics or other health crises, acts of war or terrorism, climate change and responses thereto, or other external
events; compliance with (and changes inin) laws, rules, regulations, interpretations or policies relating
to or affecting financial institutions, including stringent capital requirements,
higher FDIC insurance premiums and assessments, consumer protection
laws and privacy laws;laws and accounting, tax, trade, monetary and fiscal matters, including the policies of the Federal Reserve and as a result of government initiatives; systemic risks across the banking industry associated with the soundness of other financial institutions; volatility in our stock price; issuance of
price and other risks associated with our preferredcommon stock; risks inherent with proposed business acquisitions
changes in our dividend or share repurchase policies and the failure to achieve projected synergies;practices; or other external
events.
Additional discussion of these and other risk factors can be found in our Annual Report on Form 10-K for the fiscal year
ended
December 31, 20222023 (“20222023 Form 10-K)10-K”),
filed with the Securities and Exchange Commission (“SEC”) on March 3, 2023,February 29, 2024, and
in our
other filings with the SEC.
Except

These forward-looking statements are made as required by law,of the date hereof, and the Company undertakes no obligation to

update or revise forward-looking statements to reflect
changed assumptions, the occurrence of unanticipated events or changes
in our business, results of operations or financial condition over
time. time, except as required by law. Given these risks and uncertainties, readers are cautioned not to place undue
reliance on such forward-looking statements.

3

Table of Contents

PART I - FINANCIAL INFORMATION

ITEM 1. CONSOLIDATED FINANCIAL STATEMENTS

CROSSFIRST BANKSHARES, INC.

Consolidated Statements of Financial Condition - Unaudited


March 31, 2024


December 31, 2023


(Dollars in thousands)

Assets


Cash and cash equivalents

$

206,773

$

255,229

Available-for-sale securities - taxable


441,157


413,217

Available-for-sale securities - tax-exempt


345,446


353,436

Loans, net of unearned fees


6,249,187


6,127,690

Allowance for credit losses on loans

74,856

73,462

Loans, net of the allowance for credit losses on loans

6,174,331

6,054,228

Premises and equipment, net


70,580


70,869

Restricted equity securities


3,752


3,950

Interest receivable


37,833


37,294

Foreclosed assets held for sale


5,377


Goodwill and other intangible assets, net


30,404


31,335

Bank-owned life insurance


71,266


70,810

Other


92,813


90,312

Total assets

$

7,479,732

$

7,380,680

Liabilities and stockholders’ equity


Deposits


Non-interest-bearing

$

954,240

$

990,458

Savings, NOW and money market


3,795,770


3,669,726

Time


1,837,136


1,831,092

Total deposits


6,587,146


6,491,276

Federal Home Loan Bank advances


77,840


77,889

Other borrowings


8,911


8,950

Interest payable and other liabilities


90,864


94,422

Total liabilities


6,764,761


6,672,537

Stockholders’ equity


Preferred stock, $0.01 par value: Authorized - 5,000,000 shares; issued - 7,750 at March 31, 2024 and December 31, 2023


Common stock, $0.01 par value: Authorized - 200,000,000 shares; issued - 53,503,391 and 53,326,641 shares at March 31, 2024 and December 31, 2023 respectively


535


533

Treasury stock, at cost: 4,102,925 and 3,990,753 shares held at March 31, 2024 and December 31, 2023 respectively


(59,720)


(58,251)

Additional paid-in capital


544,206


543,556

Retained earnings


290,419


272,351

Accumulated other comprehensive loss


(60,469)


(50,046)

Total stockholders’ equity


714,971


708,143

Total liabilities and stockholders’ equity

$

7,479,732

$

7,380,680

See Notes to Consolidated Financial Statements - Unaudited

4

PART I - FINANCIAL INFORMATION
ITEM 1. CONSOLIDATED FINANCIAL STATEMENTS

Table of Contents

CROSSFIRST BANKSHARES, INC.

Consolidated Statements of Financial Condition –Operations - Unaudited

March 31, 2023
December 31, 2022
(Dollars in thousands)
Assets
Cash and cash equivalents
$
262,971
$
300,138
Available-for-sale securities - taxable
280,408
198,808
Available-for-sale securities - tax-exempt
470,843
488,093
Loans, net of unearned fees
5,647,639
5,372,729
Allowance for credit losses on loans
65,130
61,775
Loans, net of the allowance for credit losses on loans
5,582,509
5,310,954
Premises and equipment, net
67,311
65,984
Restricted equity securities
16,700
12,536
Interest receivable
30,385
29,507
Foreclosed assets held for sale
855
1,130
Goodwill and other intangible assets, net
28,259
29,081
Bank-owned life insurance
69,511
69,101
Other
84,978
95,754
Total assets
$
6,894,730
$
6,601,086
Liabilities and stockholders’ equity
Deposits
Non-interest-bearing
$
969,701
$
1,400,260
Savings, NOW and money market
3,491,586
3,305,481
Time
1,376,027
945,567
Total deposits
5,837,314
5,651,308
Federal Home Loan Bank advances
314,031
218,111
Other borrowings
17,970
35,457
Interest payable and other liabilities
79,924
87,611
Total liabilities
6,249,239
5,992,487
Stockholders’ equity
Preferred stock, $
0.01
par value:
Authorized -
15,000
shares, issued -
7,750
and
no
shares at March 31, 2023 and December 31, 2022, respectively
-
-
Common stock, $
0.01
par value:
Authorized -
200,000,000
shares, issued -
53,189,016
and
53,036,613
shares at March 31, 2023 and December 31, 2022,
respectively
532
530
Treasury stock, at cost:
4,588,398
shares held at March 31, 2023 and December 31,
2022
(64,127)
(64,127)
Additional paid-in capital
539,023
530,658
Retained earnings
222,203
206,095
Accumulated other comprehensive loss
(52,140)
(64,557)
Total stockholders’ equity
645,491
608,599
Total liabilities and stockholders’ equity
$
6,894,730
$
6,601,086

Three Months Ended March 31, 


2024

2023

Interest Income


Loans, including fees

$

110,099

$

89,618

Available-for-sale securities - taxable


4,528


1,849

Available-for-sale securities - tax-exempt


2,553


3,794

Deposits with financial institutions


1,981


2,014

Dividends on bank stocks


78


262

Total interest income


119,239


97,537

Interest Expense


Deposits


62,111


36,725

Fed funds purchased and repurchase agreements


46

Federal Home Loan Bank Advances


471


2,391

Other borrowings


63


154

Total interest expense


62,645


39,316

Net Interest Income


56,594


58,221

Provision for Credit Losses


1,655


4,421

Net Interest Income after Provision for Credit Losses


54,939


53,800

Non-Interest Income


Service charges and fees on client accounts


2,104


1,829

ATM and credit card interchange income


1,487


1,264

Gain on sale of loans


537


187

Income from bank-owned life insurance


456


411

Swap fees and credit valuation adjustments, net


158


90

Other non-interest income


847


640

Total non-interest income


5,589


4,421

Non-Interest Expense


Salaries and employee benefits


23,585


22,622

Occupancy


3,206


2,974

Professional fees


972


2,618

Deposit insurance premiums


1,906


1,531

Data processing


970


1,242

Advertising


558


752

Software and communication


1,824


1,651

Foreclosed assets, net


229


149

Core deposit intangible amortization


931

822

Other non-interest expense

3,324


3,731

Total non-interest expense


37,505


38,092

Net Income Before Taxes


23,023


20,129

Income tax expense


4,800


4,021

Net Income

$

18,223

$

16,108

Basic Earnings Per Common Share

$

0.36

$

0.33

Diluted Earnings Per Common Share

$

0.36

$

0.33

See Notes to Consolidated Financial Statements - Unaudited

5

CROSSFIRST BANKSHARES, INC.

Consolidated Statements of Operations –Comprehensive Income - Unaudited

Three Months Ended
March 31,
2023
2022
(Dollars in thousands except per share data)
Interest Income
Loans, including fees
$
89,618
$
42,728
Available-for-sale securities - taxable
1,849
1,044
Available-for-sale securities - tax-exempt
3,794
3,692
Deposits with financial institutions
2,014
152
Dividends on bank stocks
262
144
Total interest income
97,537
47,760
Interest Expense
Deposits
36,725
3,511
Fed funds purchased and repurchase agreements
46
-
Federal Home Loan Bank Advances
2,391
1,109
Other borrowings
154
25
Total interest expense
39,316
4,645
Net Interest Income
58,221
43,115
Provision for Credit Losses
4,421
(625)
Net Interest Income after Provision for Credit Losses
53,800
43,740
Non-Interest Income
Service charges and fees on customer accounts
1,829
1,408
ATM and credit card interchange income
1,264
2,664
Realized gains (losses) on available-for-sale securities
63
(26)
Gain on sale of loans
187
-
Gains (losses), net on equity securities
10
(103)
Income from bank-owned life insurance
411
388
Swap fees and credit valuation adjustments, net
90
118
Other non-interest income
567
493
Total non-interest income
4,421
4,942
Non-Interest Expense
Salaries and employee benefits
22,622
17,941
Occupancy
2,974
2,493
Professional fees
2,618
805
Deposit insurance premiums
1,531
737
Data processing
1,242
812
Advertising
752
692
Software and communication
1,651
1,270
Foreclosed assets, net
149
(53)
Other non-interest expense
3,731
2,950
Core deposit intangible amortization
822
19
Total non-interest expense
38,092
27,666
Net Income Before Taxes
20,129
21,016
Income tax expense
4,021
4,188
Net Income
$
16,108
16,828
Basic Earnings Per Common Share
$
0.33
$
0.33
Diluted Earnings Per Common Share
$
0.33
$
0.33

Three Months Ended March 31, 


2024

2023

Net Income

$

18,223

$

16,108

Other Comprehensive (Loss) Income


Unrealized (loss) gain on available-for-sale securities


(10,870)


14,951

Less: income tax (benefit) expense


(2,196)


3,657

Unrealized (loss) gain on available-for-sale securities


(8,674)


11,294

Reclassification adjustment for realized gain included in income


2


63

Less: income tax expense


15

Less: reclassification adjustment for realized gain included in income, net of income tax


2


48

Unrealized (loss) gain on cash flow hedges


(3,205)


1,540

Less: income tax (benefit) expense


(744)


369

Unrealized (loss) gain on cash flow hedges, net of income tax


(2,461)


1,171

Reclassification adjustment for loss on cash flow hedges


(928)


Less: income tax benefit


(214)


Less: reclassification adjustment for loss on cash flow hedges, net of income tax


(714)


Other comprehensive (loss) income


(10,423)


12,417

Comprehensive Income

$

7,800

$

28,525

See Notes to Consolidated Financial Statements - Unaudited

6

CROSSFIRST BANKSHARES, INC.

Consolidated Statements of Comprehensive Income (Loss) –Stockholders’ Equity - Unaudited

Three Months Ended
March 31,
2023
2022
(Dollars in thousands)
Net Income
$
16,108
$
16,828
Other Comprehensive Income (Loss)
Unrealized gain (loss) on available-for-sale securities
14,951
(58,956)
Less: income tax expense (benefit)
3,657
(14,433)
Unrealized gain (loss) on available-for-sale securities, net of income tax
11,294
(44,523)
Reclassification adjustment for realized gains (losses) included in income
63
(26)
Less: income tax expense (benefit)
15
(6)
Less: reclassification adjustment for realized gain (loss) included
in income, net of income tax
48
(20)
Unrealized gain on cash flow hedges
1,540
2,655
Less: income tax expense
369
653
Unrealized gain on cash flow hedges, net of income tax
1,171
2,002
Other comprehensive income (loss)
12,417
(42,501)
Comprehensive Income (Loss)
$
28,525
$
(25,673)

Table of Contents


Accumulated


Additional

Other


Preferred Stock

Common Stock

Treasury

Paid-in

Retained

Comprehensive


Shares


Amount


Shares


Amount


Stock


Capital


Earnings


Loss


Total


(Dollars in thousands)

Balance at December 31, 2022


$


48,448,215

$

530

$

(64,127)

$

530,658

$

206,095

$

(64,557)


$

608,599

Net income


16,108


16,108

Other comprehensive gain - available-for-sale securities


11,246


11,246

Other comprehensive gain - cash flow hedges


1,171


1,171

Issuance of preferred shares

7,750


7,750


7,750

Issuance of shares from equity-based awards


152,403


2


(623)


(621)

Stock-based compensation


1,238


1,238

Balance at March 31, 2023


7,750

$


48,600,618

$

532

$

(64,127)

$

539,023

$

222,203

$

(52,140)


$

645,491


Accumulated


Additional

Other


Preferred Stock

Common Stock

Treasury

Paid-in

Retained

Comprehensive


Shares


Amount


Shares


Amount


Stock


Capital


Earnings


Loss


Total

(Dollars in thousands)

Balance at December 31, 2023


7,750

$


49,335,888

$

533

$

(58,251)

$

543,556

$

272,351

$

(50,046)

$

708,143

Net income


18,223


18,223

Other comprehensive loss - available-for-sale securities


(8,676)


(8,676)

Other comprehensive loss - cash flow hedges


(1,747)


(1,747)

Preferred dividends $20.00 per share


(155)


(155)

Issuance of shares from equity-based awards


176,750


2


(620)


(618)

Open market common shares repurchases


(112,172)


(1,469)


(1,469)

Stock-based compensation


1,270


1,270

Balance March 31, 2024


7,750

$


49,400,466

$

535

$

(59,720)

$

544,206

$

290,419

$

(60,469)

$

714,971

See Notes to Consolidated Financial Statements - Unaudited

7

Table of Contents

CROSSFIRST BANKSHARES, INC.

Consolidated Statements of Stockholders’ Equity –Cash Flows - Unaudited

Preferred Stock
Common Stock
Treasury
Stock
Additional
Paid-in
Capital
Retained
Earnings
Accumulated
Other
Comprehensive
Income (Loss)
Total
Shares
Amount
Shares
Amount
(Dollars in thousands)
Balance at December 31, 2021
-
$
-
50,450,045
$
526
$
(28,347)
$
526,806
$
147,099
$
21,489
$
667,573
Adoption of ASU 2016-13
-
-
-
-
-
-
(2,610)
-
(2,610)
Net income
-
-
-
-
-
-
16,828
-
16,828
Other comprehensive loss
- available-for-
sale securities
-
-
-
-
-
-
-
(44,503)
(44,503)
Other comprehensive gain
- cash flow
hedges
-
-
-
-
-
-
-
2,002
2,002
Issuance of shares from equity-based
awards
-
-
336,540
3
-
(453)
-
-
(450)
Open market common share repurchases
-
-
(1,058,332)
-
(16,762)
-
-
-
(16,762)
Employee receivables from sale of stock
-
-
-
-
-
-
6
-
6
Stock-based compensation
-
-
-
-
-
1,115
-
-
1,115
Balance at March 31, 2022
-
$
-
49,728,253
$
529
$
(45,109)
$
527,468
$
161,323
$
(21,012)
$
623,199
Preferred Stock
Common Stock
Treasury
Stock
Additional
Paid-in
Capital
Retained
Earnings
Accumulated
Other
Comprehensive
Income (Loss)
Total
Shares
Amount
Shares
Amount
(Dollars in thousands)
Balance at December 31, 2022
-
$
-
48,448,215
$
530
$
(64,127)
$
530,658
$
206,095
$
(64,557)
$
608,599
Net income
-
-
-
-
-
-
16,108
-
16,108
Other comprehensive gain
- available-for-
sale securities
-
-
-
-
-
-
-
11,246
11,246
Other comprehensive gain
- cash flow
hedges
-
-
-
-
-
-
-
1,171
1,171
Issuance of preferred shares
7,750
-
-
-
-
7,750
-
-
7,750
Issuance of shares from equity-based awards
-
-
152,403
2
-
(623)
-
-
(621)
Stock-based compensation
-
-
-
-
-
1,238
-
-
1,238
Balance March 31, 2023
7,750
$
-
48,600,618
$
532
$
(64,127)
$
539,023
$
222,203
$
(52,140)
$
645,491

For the Three Months Ended March 31, 


2024


2023


(Dollars in thousands)

Operating Activities


Net income

$

18,223

$

16,108

Adjustments to reconcile net income to net cash provided by operating activities:


Depreciation and amortization


2,414


2,318

Provision for credit losses


1,655


4,421

Accretion of discounts on loans


(488)


(547)

Accretion of discounts and amortization of premiums on securities


285


926

Stock-based compensation


1,270


1,238

Gain on disposal of fixed assets


(4)

Loss on sale of foreclosed assets and related impairments


102

Gain on sale of loans


(537)


(187)

Origination of loans held for sale

(1,612)

Proceeds from sale of loans held for sale

2,913

Deferred income taxes


3,224


1,640

Net increase in bank owned life insurance


(456)


(411)

Net realized gains on equity securities

(22)

Net realized gains on available-for-sale securities


(2)


(63)

Dividends on FHLB stock


(71)


(261)

Changes in:


Interest receivable


(539)


(878)

Other assets


1,762


2,615

Other liabilities


(8,218)


(2,693)

Net cash provided by operating activities


19,801


24,324

Investing Activities


Net change in loans


(128,665)


(275,817)

Purchases of available-for-sale and equity securities


(45,693)


(93,488)

Proceeds from maturities of available-for-sale securities


13,465


5,714

Proceeds from sale of available-for-sale and equity securities


37,069

Proceeds from the sale of foreclosed assets


173

Purchase of premises and equipment


(1,114)


(2,662)

Proceeds from the sale of premises and equipment and related insurance claims


4

Purchase of restricted equity securities


(8,226)

Proceeds from sale of restricted equity securities


291


4,334

Terminated cash flow hedges

(122)

Net cash used in investing activities


(161,838)


(332,899)

Financing Activities


Net increase (decrease) in demand deposits, savings, NOW and money market accounts


89,826


(244,454)

Net increase in time deposits


6,044


430,407

Net decrease in federal funds sold


(20,000)

Repayment of Federal Home Loan Bank advances


(114)


(12,643)

Net proceeds of lines of credit


110,969

Proceeds from issuance of preferred shares, net of issuance cost

7,750

Issuance of common shares, net of issuance cost


2


2

Proceeds from employee stock purchase plan


240


167

Repurchase of common stock


(1,402)


Acquisition of common stock for tax withholding obligations


(860)


(790)

Dividends paid on preferred stock

(155)

Net cash provided by financing activities


93,581


271,408

Decrease in Cash and Cash Equivalents


(48,456)


(37,167)

Cash and Cash Equivalents, Beginning of Period


255,229


300,138

Cash and Cash Equivalents, End of Period

$

206,773

$

262,971

Supplemental Cash Flows Information


Interest paid

$

61,253

$

35,459

Income taxes paid


24

Repossessed assets in settlement of loans

5,377

See Notes to Consolidated Financial Statements - Unaudited

8

CROSSFIRST BANKSHARES, INC.

Consolidated Statements of Cash Flows – Unaudited
Three Months Ended
March 31,
2023
2022
(Dollars in thousands)
Operating Activities
Net income
$
16,108
$
16,828
Adjustment to reconcile net income to net cash provided by operating activities:
Depreciation and amortization
2,318
1,241
Provision for credit losses
4,421
(625)
Accretion of discounts on loans
(547)
-
Accretion of discounts and amortization of premiums on securities
926
1,116
Equity based compensation
1,238
1,115
(Gain) loss on disposal of fixed assets
(4)
13
Loss (gain) on sale of foreclosed assets and related impairments
102
(62)
Gain on sale of loans
(187)
-
Deferred income taxes
1,640
3,358
Net increase in bank owned life insurance
(411)
(388)
Net realized (gains) losses on available-for-sale securities
(63)
26
Dividends on FHLB stock
(261)
(142)
Changes in:
Interest receivable
(878)
(910)
Other assets
2,615
14,565
Other liabilities
(2,693)
(21,650)
Net cash provided by operating activities
24,324
14,485
Investing Activities
Net change in loans
(275,817)
(94,437)
Purchases of available-for-sale securities
(93,488)
(49,138)
Proceeds from maturities of available-for-sale securities
5,714
11,582
Proceeds from sale of available-for-sale securities
37,069
-
Proceeds from the sale of foreclosed assets
173
237
Purchase of premises and equipment
(2,662)
(962)
Proceeds from the sale of premises and equipment and related insurance claims
4
13
Purchase of restricted equity securities
(8,226)
-
Proceeds from sale of restricted equity securities
4,334
1,544
Net cash used in investing activities
(332,899)
(131,161)
Financing Activities
Net (decrease) increase in demand deposits, savings, NOW and money market accounts
(244,454)
50,403
Net increase (decrease) in time deposits
430,407
(112,320)
Net decrease in federal funds sold
(20,000)
-
Repayment of Federal Home Loan Bank advances
(12,643)
(10,000)
Net proceeds of Federal Home Loan Bank line of credit
110,969
-
Proceeds from issuance of preferred shares, net of issuance cost
7,750
-
Issuance of common shares, net of issuance cost
2
170
Proceeds from employee stock purchase plan
167
172
Repurchase of common stock
-
(16,762)
Acquisition of common stock for tax withholding obligations
(790)
(793)
Net decrease in employee receivables
-
6
Net cash provided by (used in) financing activities
271,408
(89,124)
Decrease in Cash and Cash Equivalents
(37,167)
(205,800)
Cash and Cash Equivalents, Beginning of Period
300,138
482,727
Cash and Cash Equivalents, End of Period
$
262,971
$
276,927
Supplemental Cash Flows Information
Interest paid
35,459
4,784
Income taxes paid
24
-
9
CROSSFIRST BANKSHARES, INC.

Notes to Consolidated Financial Statements - Unaudited

Note 1:   Nature of Operations and Summary of Significant Accounting Policies

Organization and Nature of Operations

CrossFirst Bankshares, Inc. (the “Company”(“Bankshares”) is a bank holding company whose principal activities

are the ownership and
management of its wholly-owned subsidiary, CrossFirst Bank (the
“Bank” “Bank”). In addition, the Bank has
three
subsidiaries, including
CrossFirst Investments, Inc. (“CFI”), which holds investments in marketable
securities, CFBSA I, LLC and CFBSA II, LLC.

The Bank is primarily engaged in providing a full range of banking and financial

services to individual and corporate customers
clients primarily through its branches in: (i) Leawood, Kansas; (ii) Wichita, Kansas; (iii) Kansas City, Missouri;
(iv) Oklahoma City, Oklahoma; (v)
Tulsa, Oklahoma; (vi) Dallas, Texas; (vii) Fort Worth, Texas; (viii) Frisco, Texas; (ix) Phoenix, Arizona; (x) Tucson, Arizona; (xi) Colorado Springs,
Colorado; (xi)(xii) Denver, Colorado; and (xii)(xiii) Clayton, New Mexico.

Basis of Presentation

The accompanying interim unaudited consolidated financial statements serve

to update the CrossFirst Bankshares, Inc. Annual
Report on Form 10-K for the year ended December 31, 20222023 and include the consolidated accounts of
the Company, Bankshares, the Bank, CFI, CFBSA I, LLC
and CFBSA II, LLC.LLC (together, referred to herein as the “Company”). The accompanying unaudited consolidated financial statements have been prepared in accordance with
U.S.
generally accepted accounting principles (“GAAP”) and where applicable,
with general practices in the banking industry or guidelines
prescribed by bank regulatory agencies. However, they may not include
all information and notes necessary to constitute a complete set
of financial statements under GAAP applicable to annual periods and accordingly should be read
in conjunction with the financial
information contained in the Company's most recent Annual Report on Form 10-K. The unaudited consolidated financial
statements
reflect all adjustments which are, in the opinion of management, necessary for a fair
statement of the results presented. All such
adjustments are of a normal recurring nature. All significant intercompany balances and transactions have
been eliminated in
consolidation. Certain reclassifications of prior years' amounts are made whenever
necessary to conform to current period presentation.
The results of operations for the interim period are not necessarily indicative of the
results that may be expected for the full year or any
other interim period. All amounts are in thousands, except share data, or as otherwise noted.

GAAP requires management to make estimates that affect the reported amounts of assets, liabilities, revenues and

expenses, and
disclosures of contingent assets and liabilities. By their nature, estimates are based on
judgment and available information. Management
has made significant estimates in certain areas, such as the fair values of financial
instruments, and the allowance for credit losses
(“ACL”). Because of the inherent uncertainties associated with any estimation
process and future changes in market and economic
conditions, it is possible that actual results could differ significantly from those estimates.

The Company's significant accounting policies followed in the preparation of

the unaudited consolidated financial statements are
disclosed in Note 1 of the audited financial statements and notes for the year ended
December 31, 20222023 and are contained in the
Company's Annual Report on Form 10-K for that period. There have been no significant changes to the application of
significant
accounting policies since December 31, 2022 other than those noted below
:
2023.

Related Party Transactions

The Bank extends credit and receives deposits from related parties. In management’s

opinion, the loans and deposits were made
in the ordinary course of business and made on similar terms as those prevailing
at the time with other persons. Related party loans
totaled $
11
$10 million and $
13
$12 million, while related party deposits totaled $105 million and $106 million, at March 31, 20232024 and December 31, 2022,2023, respectively. Related party deposits
totaled parties also owned
$6 million of the

129

9

and $
92
million

Company’s Series A Non-Cumulative Perpetual Preferred Stock, par value $0.01 per share (“Series A Preferred Stock”), at March 31, 2024.

Recent Accounting Pronouncements

Accounting pronouncements not yet adopted by the Company

In November 2023, the Financial Accounting Standards Board (“FASB”) issued Accounting Standards Update (“ASU”) 2023-07, Segment Reporting (Topic 280): Improvements to Reportable Segment Disclosures, which requires enhanced disclosures on both an annual and interim basis about significant segment expenses, including for companies with only one reportable segment. This ASU is effective on a retrospective basis for fiscal years beginning after December 15, 2023, and interim periods within fiscal years beginning after December 31, 2022, respectively.

10
Accounting Pronouncements Implemented
ASU 2022-02, Financial Instruments-Credit Losses (Topic 326):
Troubled Debt Restructurings and Vintage Disclosures
Background
– ASU 2022-02 provides new guidance on (i) troubled debt restructurings (“TDRs”) and (ii) vintage disclosures
for
gross write-offs. The update eliminates the accounting guidance for TDRs and requires a company to determine
if a modification
results in a new loan or a continuation of an existing loan. The update enhances the required
disclosures for certain modifications
made to borrowers experiencing financial difficulty. In addition, the update
requires disclosure of current-period gross charge-offs
by year of origination for financing receivables. For the Company, the
amendments are effective as of January 1, 2023.
Impact of adoption
15, 2024. The Company adoptedis evaluating the provisions of this guidance as of January 1, 2023 on a prospective
basis. The
impact the adoption of this ASU did not impact ourwill have on its consolidated financial statements.
statements and related disclosures.

In December 2023, the FASB issued ASU 2023-09, Income Taxes (Topic 740): Improvements to Income Tax Disclosures which requires updates to rate reconciliation disclosures and information on income taxes paid on an annual basis. This ASU is effective on a prospective basis with retrospective application permitted for annual periods beginning after December 15, 2024. The incremental vintage disclosures for gross write-

offs are included within “Note 3: LoansCompany is evaluating the impact the adoption of this ASU will have on its consolidated financial statements and Allowance for Credit Losses.”
related disclosures.

Note 2:   Securities

The amortized cost and approximate fair values, together with gross unrealized
gains and losses, of period end available-for-sale

Available-for-Sale (“AFS”) Securities

AFS securities consistedare summarized as follows as of the following:

March 31, 2023
Amortized
Cost
Gross
Unrealized
Gains
Gross
Unrealized
Losses
Approximate
Fair Value
(Dollars in thousands)
Available-for-sale securities
Mortgage-backed - GSE residential
$
274,895
$
2,110
$
22,356
$
254,649
Collateralized mortgage obligations - GSE residential
10,989
-
604
10,385
State and political subdivisions
523,464
1,449
47,771
477,142
Corporate bonds
9,754
-
679
9,075
Total available-for-sale securities
$
819,102
$
3,559
$
71,410
$
751,251
December 31, 2022
Amortized
Cost
Gross
Unrealized
Gains
Gross
Unrealized
Losses
Approximate
Fair Value
(Dollars in thousands)
Available-for-sale securities
Mortgage-backed - GSE residential
$
197,243
$
232
$
25,166
$
172,309
Collateralized mortgage obligations - GSE residential
11,629
-
743
10,886
State and political subdivisions
551,007
929
57,440
494,496
Corporate bonds
9,762
-
552
9,210
Total available-for-sale securities
$
769,641
$
1,161
$
83,901
$
686,901
dates indicated:


March 31, 2024

Gross

Gross

Unrealized

Unrealized

Approximate


Amortized Cost


Gains


Losses


Fair Value

(Dollars in thousands)

Federal agency obligations

$

9,989

$

42

$

$

10,031

Mortgage-backed - GSE residential

251,994

280

23,614

228,660

Collateralized mortgage obligations - GSE residential


71,105


301


1,138


70,268

State and political subdivisions


394,166


297


46,680


347,783

Small Business Administration loan pools

123,224

325

2,256

121,293

Corporate bonds


9,731


1,163


8,568

Total available-for-sale securities

$

860,209

$

1,245

$

74,851

$

786,603


December 31, 2023

Gross

Gross


Unrealized

Unrealized

Approximate


Amortized Cost


Gains


Losses


Fair Value

(Dollars in thousands)

Federal agency obligations


$

9,988

$

84

$

$

10,072

U.S. Treasury securities

4,965

3

4,968

Mortgage-backed - GSE residential


233,203

629

21,370

212,462

Collateralized mortgage obligations - GSE residential


50,125

493

674

49,944

State and political subdivisions


396,349

497

40,949

355,897

Small Business Administration loan pools

125,017

722

961

124,778

Corporate bonds


9,740

1,208

8,532

Total available-for-sale securities


$

829,387

$

2,428

$

65,162

$

766,653

The carrying value of securities pledged as collateral was $

17
$46 million and $
22
$40 million at March 31, 20232024 and December 31, 2022,2023, respectively.

respectively.

10

As of March 31, 20232024 and December 31, 2022,2023, the available-for-saleAFS securities

had $
6
$6 million and $7 million, respectively, of accrued interest, excluded from
the amortized cost basis, and presented in “interest receivable” on the
consolidated statements of financial condition.
11

The following tables summarize the gross realized gains and losses from sales or

maturities of AFS securities:
Forsecurities as of the Three Months Ended
March 31, 2023
Gross
Realized
Gains
Gross
Realized
Losses
Net
Realized
Gain
(Dollars in thousands)
Available-for-sale securities
$
193
$
(130)
$
63
For the Three Months Ended
March 31, 2022
Gross
Realized
Gains
Gross
Realized
Losses
Net
Realized
Loss
(Dollars in thousands)
Available-for-sale securities
$
1
$
(27)
$
(26)
dates shown:

For the Three Months Ended

March 31, 2024

Gross Realized Gains


Gross Realized Losses


Net Realized Gain

(Dollars in thousands)

Available-for-sale securities

$

2

$

$

2

For the Three Months Ended

March 31, 2023

Gross Realized Gains


Gross Realized Losses


Net Realized Gain

(Dollars in thousands)

Available-for-sale securities

$

193

$

(130)

$

63

The following table shows available-for-saletables summarize AFS securities gross unrealized losses, the

numberas of securities that arethe dates shown, along with the length of time in an unrealized loss position:


March 31, 2024

Less than 12 Months

12 Months or More

Total

Fair

Unrealized

Number of

Fair

Unrealized

Number of

Fair

Unrealized

Number of


Value


Losses


Securities


Value


Losses


Securities


Value


Losses


Securities

(Dollars in thousands)

Available-for-Sale Securities


Federal agency obligations

$

$

$

$

$

$

Mortgage-backed - GSE residential

35,935

345


12

132,348

23,269


51

168,283

23,614


63

Collateralized mortgage obligations - GSE residential


47,106


610


9


7,863


528


17


54,969


1,138


26

State and political subdivisions


28,063


282


20


300,783


46,398


203


328,846


46,680


223

Small Business Administration loan pools

110,885

2,254

14

83

2

4

110,968

2,256

18

Corporate bonds


8,568


1,163


5


8,568


1,163


5

Total temporarily impaired AFS securities

$

221,989

$

3,491


55

$

449,645

$

71,360


280

$

671,634

$

74,851


335

loss position, and fair value

11

December 31, 2023

Less than 12 Months

12 Months or More

Total


Fair

Unrealized

Number of

Fair

Unrealized

Number of

Fair

Unrealized

Number of


Value


Losses


Securities


Value


Losses


Securities


Value


Losses


Securities

(Dollars in thousands)

Available-for-Sale Securities


Federal agency obligations


$

$

$

$

$

$

U.S. Treasury securities


Mortgage-backed - GSE residential


21,523

56

5

137,626

21,314

52

159,149

21,370

57

Collateralized mortgage obligations - GSE residential


17,707

135

4

8,469

539

17

26,176

674

21

State and political subdivisions


33,577

207

20

287,128

40,742

190

320,705

40,949

210

Small Business Administration loan pools


76,380

959

11

91

2

4

76,471

961

15

Corporate bonds


8,532

1,208

5

8,532

1,208

5

Total temporarily impaired AFS securities


$

149,187

$

1,357

40

$

441,846

$

63,805

268

$

591,033

$

65,162

308

Management evaluated all of the Company’s investments with unrealized

losses, aggregated by investment class and length of time that
individualAFS securities have been in a continuousan unrealized loss position at
March 31, 2023 and December 31, 2022:
March 31, 2023
Less than 12 Months
12 Months or More
Total
Fair Value
Unrealized
Losses
Number of
Securities
Fair Value
Unrealized
Losses
Number of
Securities
Fair Value
Unrealized
Losses
Number of
Securities
(Dollars in thousands)
Available-for-sale
securities
Mortgage-backed -
GSE residential
$
13,935
$
562
20
$
133,560
$
21,794
36
$
147,495
$
22,356
56
Collateralized
mortgage obligations
- GSE residential
2,235
88
1
8,150
516
18
10,385
604
19
State and political
subdivisions
142,418
2,633
105
210,220
45,138
151
352,638
47,771
256
Corporate bonds
4,861
251
2
4,213
428
3
9,074
679
5
Total temporarily
impaired securities
$
163,449
$
3,534
128
$
356,143
$
67,876
208
$
519,592
$
71,410
336
12
December 31, 2022
Less than 12 Months
12 Months or More
Total
Fair Value
Unrealized
Losses
Number of
Securities
Fair Value
Unrealized
Losses
Number of
Securities
Fair Value
Unrealized
Losses
Number of
Securities
(Dollars in thousands)
Available-for-sale
securities
Mortgage-backed -
GSE residential
$
91,929
$
10,410
41
$
66,036
$
14,756
16
$
157,965
$
25,166
57
Collateralized
mortgage obligations
- GSE residential
10,636
733
18
251
10
1
10,887
743
19
State and political
subdivisions
350,884
36,697
266
52,519
20,743
40
403,403
57,440
306
Corporate bonds
9,210
552
5
-
-
-
9,210
552
5
Total temporarily
impaired securities
$
462,659
$
48,392
330
$
118,806
$
35,509
57
$
581,465
$
83,901
387
Based on the Company’s evaluation at each respective period end,
we recorded
no
credit loss impairment during the first quarter
of 2023 or fourth quarter of 2022.
2024. The unrealized losses in the Company’s investment portfolio were primarily caused by
interest rate changes.
As of March 31, 2023 the The Company does not intend to sell the investments, in loss positions, and
it is not more likely than not the
Company will be required to sell the investments before recovery of their amortized
cost basis. The Company did not record any credit losses on AFS securities during the three months ended March 31, 2024 or the year ended December 31, 2023.

12

Table of Contents

13

The amortized cost, fair value, and weighted average yield of available-for-sale

AFS securities at March 31, 2023, by contractual
maturity, are shown below:

March 31, 2024

Within

After One to

After Five to

After


One Year


Five Years


Ten Years


Ten Years


Total

(Dollars in thousands)

Available-for-sale securities


Federal agency obligations(1)

Amortized cost

$

$

$

$

9,989

$

9,989

Estimated fair value

$

$

$

$

10,031

$

10,031

Weighted average yield(2)


%  


%  


%  


6.38

%  


6.38

%

Mortgage-backed - GSE residential(1)


Amortized cost

$

$

$

852

$

251,142

$

251,994

Estimated fair value

$

$

$

778

$

227,882

$

228,660

Weighted average yield(2)


%  


%  


2.24

%  


3.39

%  


3.39

%

Collateralized mortgage obligations - GSE residential(1)


Amortized cost

$

$

2,190

$

$

68,915

$

71,105

Estimated fair value

$

$

2,093

$

$

68,175

$

70,268

Weighted average yield(2)


%  


2.78

%  


%  


5.44

%  


5.36

%

State and political subdivisions(1)


Amortized cost

$

519

$

3,597

$

57,443

$

332,607

$

394,166

Estimated fair value

$

527

$

3,576

$

56,560

$

287,120

$

347,783

Weighted average yield(2)


4.41

%  


4.27

%  


2.81

%  


2.52

%  


2.58

%

Small Business Administration loan pools(1)


Amortized cost

$

$

10

$

75

$

123,139

$

123,224

Estimated fair value

$

$

10

$

73

$

121,210

$

121,293

Weighted average yield(2)


%  


4.96

%  


4.07

%  


4.86

%  


4.86

%

Corporate bonds(1)


Amortized cost

$

$

239

$

9,492

$

$

9,731

Estimated fair value

$

$

229

$

8,339

$

$

8,568

Weighted average yield(2)


%  


4.59

%  


5.71

%  


%  


5.69

%

Total available-for-sale securities


Amortized cost

$

519

$

6,036

$

67,862

$

785,792

$

860,209

Estimated fair value

$

527

$

5,908

$

65,750

$

714,418

$

786,603

Weighted average yield(2)


4.41

%  


3.74

%  


3.21

%  


3.47

%  


3.46

%

March 31, 2023
Within
After One to
After Five to
After
One Year
Five Years
Ten Years
Ten Years
Total
(Dollars in thousands)
Available-for-sale securities
Mortgage-backed - GSE residential
(1)
Amortized cost
$
-
$
17
$
91
$
274,787
$
274,895
Estimated fair value
$
-
$
17
$
88
$
254,544
$
254,649
Weighted average yield
(2)
-
%
4.82
%
4.02
%
3.14
%
3.14
%
Collateralized mortgage obligations -
GSE residential
(1)
Amortized cost
$
-
$
-
$
2,322
$
8,667
$
10,989
Estimated fair value
$
-
$
-
$
2,235
$
8,150
$
10,385
Weighted average yield
(2)
-
%
-
%
2.75
%
2.25
%
2.36
%
State and political subdivisions
Amortized cost
$
1,075
$
7,962
$
90,970
$
423,457
$
523,464
Estimated fair value
$
1,078
$
8,158
$
90,981
$
376,925
$
477,142
Weighted average yield
(2)
3.71
%
4.32
%
2.96
%
2.68
%
2.76
%
Corporate bonds
Amortized cost
$
-
$
149
$
9,605
$
-
$
9,754
Estimated fair value
$
-
$
146
$
8,929
$
-
$
9,075
Weighted average yield
(2)
-
%
4.09
%
5.71
%
-
%
5.68
%
Total available-for-sale securities
Amortized cost
$
1,075
$
8,128
$
102,988
$
706,911
$
819,102
Estimated fair value
$
1,078
$
8,321
$
102,233
$
639,619
$
751,251
Weighted average yield
(2)
3.71
%
4.32
%
3.21
%
2.85
%
2.92
%
(1)
Actual maturities may differ from contractual maturities because issuers may have
the rights to call or prepay obligations with or
without prepayment penalties.
(2)
Yields are calculated based on amortized cost using 30/360 day basis.
Tax-exempt securities are not tax effected.

(1)

Actual maturities may differ from contractual maturities because issuers may have the rights to call or prepay obligations with or without prepayment penalties.

(2)

Yields are calculated based on amortized cost using 30/360 day basis. Tax-exempt securities are not tax effected.

Equity Securities

Equity securities consist of $

3.2
$6.9 million of private equity investments. Equity securities are included in “other assets”other assets on
the
consolidated statements of financial condition.

The Company elected a measurement alternative for threeits private equity

investments that did not have a readily determinable fair
value and did not qualify for the practical expedient to estimate fair value using the
net asset value per share.
A cost basis was
calculated for the equity investments.
The recorded balance will adjust for any impairment or any observable
price changes for an
identical or similar investment of the same issuer. No such events occurred
during the three-month period ended March 31, 2023.2024.

13

14

The following is a summary of the recorded fair value and the unrealized and realized gains and losses on equity

securities recognized in net income:
Three Months Ended
March 31,
2023
2022
(Dollars in thousands)
Net gains (losses) recognized during the reporting periodincome on equity
securities
$
10
$
(103)
Less: net gains recognized during the reporting period on equity securities sold
during the reporting period
-
-
Unrealized gains (losses) recognized during the reporting period on equity securities
still held at the reporting
date
$
10
$
(103)
securities:

For the Three Months Ended

March 31, 

2024

2023

(Dollars in thousands)

Net gains recognized during the reporting period on equity securities

$

21

$

10

Less: net gains recognized during the period on equity securities sold during the period


18


Unrealized gain recognized during the reporting period on equity securities still held at the reporting date

$

3

$

10

Table of Contents
15

Note 3:

Loans and Allowance for Credit Losses

The table below shows the loan portfolio composition including carrying value

by segment as of the dates shown. The carrying value of loans is net of discounts, fees, costs,
and fair value marks of $
24
$24 million and $25 million as of March 31, 20232024 and December 31, 2022.
March 31, 2023,
December 31, 2022
Amount
% of Loans
Amount
% of Loans
(Dollars in thousands)
Commercial and industrial
$
986,636
17
%
$
1,017,678
19
%
Commercial and industrial lines of credit
1,047,280
19
957,254
18
Energy
193,859
3
173,218
3
Commercial real estate
1,808,888
33
1,718,947
32
Construction and land development
845,085
15
794,788
15
Residential real estate
412,334
7
409,124
8
Multifamily real estate
295,469
5
237,984
4
Consumer
58,088
1
63,736
1
Loans, net of unearned
fees
5,647,639
100
%
5,372,729
100
%
Less: allowance for credit losses on loans
65,130
61,775
Loans, net of the allowance for credit losses on loans
$
5,582,509
$
5,310,954
respectively.


March 31, 2024

December 31, 2023


Amount


% of Loans

Amount


% of Loans

(Dollars in thousands)

Commercial and industrial

$

2,179,562


35

%  

$

2,160,212


35

%

Energy


221,217


4


214,218


3

Commercial real estate - owner-occupied


577,812


9


566,253


9

Commercial real estate - non-owner-occupied


2,769,936


44


2,685,534


44

Residential real estate


468,628


7


464,095


8

Consumer


32,032


1


37,378


1

Loans, net of unearned fees


6,249,187


100

%  


6,127,690


100

%

Less: Allowance for credit losses on loans


(74,856)


(73,462)


Loans, net of the allowance for credit losses on loans

$

6,174,331

$

6,054,228


Accrued interest of $

24
$31 million and $
23
$30 million at March 31, 20232024 and December 31, 2022,2023, respectively,
presented in “interest receivable” on the consolidated statements of
financial condition is excluded from the carrying valueamortized cost basis disclosed in
the above table.

The Company aggregates the loan portfolio by similar credit risk characteristics. The loan

segments are described in additional detail below:

Commercial and Industrial - The category includes loans and lines of credit to commercial and industrial clients for use in property, plant, and equipment purchases, business operations, expansions and for working capital needs. Loan terms typically require amortizing payments that decrease the outstanding loan balance while the lines of credit typically require interest-only payments with maturities ranging from one- to three-years. Lines of credit allow the borrower to draw down and repay the line of credit based on the borrower’s cash flow needs. Repayment is primarily from the cash flow of a borrower’s principal business operation. Credit risk is driven by creditworthiness of a borrower and the economic conditions that impact the cash flow stability from business operations.
Energy - The category includes loans to oil and natural gas clients for use in financing working capital needs, exploration and production activities, and acquisitions. The loans are repaid primarily from the conversion of crude oil and natural gas to cash. Credit risk is driven by creditworthiness of a borrower and the economic conditions that impact the cash flow stability from business operations. Energy loans are typically collateralized with the underlying oil and gas reserves.

14

Commercial Real Estate - Owner-Occupied- The category includes relationships where the Company is usually the primary provider of financial services for the company and/or the principals and the primary source of repayment is through the cash flows generated by the borrowers’ business operations. Owner-occupied commercial real estate loans are typically secured by a first lien mortgage on real property plus assignments of all leases related to the properties. Credit risk may be impacted by the creditworthiness of a borrower, property values and the local economies in the borrower’s market areas.
Commercial Real Estate – Non-Owner-Occupied - The category includes loans that typically involve larger principal amounts and repayment of these loans is generally dependent on the leasing income generated from tenants. These are viewed primarily as cash flow loans and secondarily as loans secured by real estate.

Additionally, the category includes loans to commercialconstruction and industrial customers for use in property,

plant, and equipment purchases and
expansions. Loan terms typically require principal and interest payments
that decrease the outstanding loan balance.
Repayment is primarily from the cash flow of a
borrower’s principal business operation. Credit risk is driven by creditworthiness
of a borrower and the economic conditions that impact the cash flow stability from
business operations.
The category also includes the remaining PPP loans outstanding. These loans were established by the Coronavirus Aid, Relief, and Economic
Security Act which
authorized forgivable loans to small businesses to pay their employees during
the COVID-19 pandemic. The loans are
100
percent guaranteed by the Small Business
Administration (“SBA”) and repayment is primarily dependent on
the borrower’s cash flow or SBA repayment approval.
Commercial and Industrial Lines of Credit
– The category includes
lines of credit to commercial and industrial customers for working capital needs. The loan
terms typically require interest-only payments, mature in one year, and
require the full balance paid-off at maturity. Lines of credit allow the borrower
to draw down
and repay the line of credit based on the customer’s cash flow needs. Repayment
is primarily from the operating cash flow of the business. Credit risk is driven by
creditworthiness of a borrower and the economic conditions that impact the cash
flow stability from business operations.
16
Energy
- The category includes loans to oil and natural gas customers for use in financing working
capital needs, exploration and production activities, and
acquisitions. The loans are repaid primarily from the conversion of crude oil and natural gas to cash. Credit
risk is driven by creditworthiness of a borrower and the
economic conditions that impact the cash flow stability from business operations.
Energy loans are typically collateralized with the underlying oil and gas reserves.
Commercial Real Estate
- The category includesland development loans that typically involve larger principal amounts and repayment of these
loans is generally dependent on the
successful operations of the property securing the loan or the business conducted
on the property securing the loan. These are viewed primarily as cash flow loans and
secondarily as loans secured by real estate. Credit risk may be impacted by the
creditworthiness of a borrower, property values and the local economies in the
borrower’s market areas.
Construction and Land Development
- The category includes loans that are usually based upon estimates of costs and estimated value
of the completed project and
include independent appraisal reviewsproject. Independent appraisals and a financial analysis of the developers
and property owners.owners are completed. Sources of repayment include secondary market permanent loans,
sales of
developed property or an interim loan commitment from the Company
until permanent financing is obtained. These loans are higher risk than other real estate loans
due to their ultimate repayment being sensitive to interest rate changes, general
economic conditions, and the availability of long-term financing.

The category also includes loans that are secured by multifamily properties. Repayment of these loans is primarily dependent on occupancy rates and rental income.

Credit risk for non-owner-occupied commercial real estate loans may

be
impacted by the creditworthiness of a borrower, property values and
the local economies in the borrower’s market areas.
Residential Real Estate
- The category includes loans that are generally secured by owner-occupied

Residential Real Estate- The category includes loans that are generally secured by owner-occupied 1-4 family residences. Repayment of these loans is primarily dependent on the personal income and credit rating of the borrowers. We also offer open- and closed-ended home equity loans, which are loans generally secured by second lien positions on residential real estate. Credit risk in these loans can be impacted by economic conditions within or outside the borrower’s market areas that might impact either property values or a borrower’s personal income.
Consumer - The category includes personal lines of credit and various term loans such as automobile loans and loans for other personal purposes. Repayment is primarily dependent on the personal income and credit rating of the borrowers. Credit risk is driven by consumer economic factors (such as unemployment and general economic conditions in the borrower’s market area) and the creditworthiness of a borrower.

Risk Ratings

The Company uses a series of grades which reflect its assessment of the credit quality of loans based on an analysis of the borrower's financial condition, liquidity and ability to meet contractual debt service requirements. Risk ratings are established for loans at origination and are monitored on an ongoing basis. The rating assigned to a loan reflects the risks posed by the borrower’s expected performance and the transaction’s structure. Performance metrics used to determine a risk rating include, but are not limited to, cash flow adequacy, liquidity, and collateral. A description of the loan risk ratings follows:

Pass - The category includes loans that are considered satisfactory. The category includes borrowers that generally maintain good liquidity and financial condition, or the credit is currently protected with sales trends remaining flat or declining. Most ratios compare favorably with industry norms and Company policies. Debt is programmed and timely repayment is expected.
Special Mention - The category includes borrowers that generally exhibit adverse trends in operations or an imbalanced position in their balance sheet that has not reached a point where repayment is jeopardized. Credits are currently protected but, if left uncorrected, the potential weaknesses may result in deterioration of the

15

repayment prospects for the credit or in the Company’s credit or lien position at a future date. These credits are not adversely classified and do not expose the Company to enough risk to warrant adverse classification.
Substandard - The category includes borrowers that generally exhibit well-defined weakness(es) that jeopardize repayment. Credits are inadequately protected by the current worth and paying capacity of the obligor or of the collateral pledged. A distinct possibility exists that the Company will sustain some loss if deficiencies are not corrected. Loss potential, while existing in the aggregate amount of substandard assets, does not have to exist in individual assets classified substandard. Substandard loans include both performing and non-performing loans and are broken out in the table below.
Doubtful - The category includes borrowers that exhibit weaknesses inherent in a substandard credit and characteristics that these weaknesses make collection or liquidation in full highly questionable or improbable based on existing facts, conditions, and values. Because of reasonably specific pending factors, which may work to the advantage and strengthening of the assets, classification as a loss is deferred until its more exact status may be determined.
Loss - Credits that are considered uncollectible or of such little value that their continuance as a bankable asset is not warranted.

16

The following tables present the credit risk profile of the Company’s loan portfolio based on internal rating categories and loan segments:


As of March 31, 2024

Amortized Cost Basis by Origination Year and Internal Risk Rating

Amortized Cost Basis


2024


2023


2022


2021


2020


2019 and Prior


Revolving Loans


Revolving Loans Converted to Term Loans


Total

(Dollars in thousands)

Commercial and industrial


Pass

$

162,797

$

301,628

$

253,530

$

158,058

$

39,382

$

45,697

$

1,042,118

$

57,434

$

2,060,644

Special mention


1,627


1,128


852


1,966


12


43


24,074


79


29,781

Substandard - accrual


1,996


12,850


1,848


6,666


204


2,420


33,699


18,604


78,287

Substandard - non-accrual


2,213


264


144


6,105


129


8,855

Doubtful


1,995


1,995

Loss


Total

$

166,420

$

317,819

$

256,230

$

166,954

$

39,598

$

48,304

$

1,107,991

$

76,246

$

2,179,562

Energy


Pass

$

$

4,583

$

6,345

$

$

$

$

208,147

$

1,944

$

221,019

Special mention


Substandard - accrual


Substandard - non-accrual


Doubtful


198


198

Loss


Total

$

-

$

4,583

$

6,345

$

-

$

-

$

-

$

208,345

$

1,944

$

221,217

Commercial real estate - owner-occupied


Pass

$

6,280

$

55,911

$

103,985

$

116,685

$

63,069

$

80,507

$

76,967

$

33,023

$

536,427

Special mention


9,597


548


5,291


9,793


1,736


3,114


571


30,650

Substandard - accrual


2,977


1,464


1,630


2,800


1,528


10,399

Substandard - non-accrual


336


336

Doubtful


Loss


Total

$

15,877

$

59,436

$

111,076

$

126,478

$

66,435

$

86,421

$

76,967

$

35,122

$

577,812

Commercial real estate - non-owner-occupied


Pass

$

79,617

$

444,515

$

862,200

$

246,477

$

159,192

$

114,102

$

651,858

$

143,649

$

2,701,610

Special mention


18,908


7,228


18,960


45,096

Substandard - accrual


3,236


9,619


4,030


1,898


3,627


298


22,708

Substandard - non-accrual


522


522

Doubtful


Loss


Total

$

82,853

$

454,134

$

885,660

$

255,603

$

162,819

$

133,360

$

651,858

$

143,649

$

2,769,936

Residential real estate


Pass

$

1,924

$

49,465

$

90,734

$

80,314

$

109,425

$

94,830

$

36,618

$

$

463,310

Special mention


1,076


1,954


173


3,203

Substandard - accrual


253


1,310


200


176


1,939

Substandard - non-accrual


176


176

Doubtful


Loss


Total

$

2,177

$

49,465

$

91,810

$

83,578

$

109,598

$

95,030

$

36,794

$

176

$

468,628

Consumer


Pass

$

1,289

$

10,995

$

4,381

$

412

$

45

$

246

$

14,638

$

$

32,006

Special mention


5


5

Substandard - accrual


21


21

Substandard - non-accrual


Doubtful


Loss


Total

$

1,289

$

10,995

$

4,381

$

412

$

66

$

251

$

14,638

$

-

$

32,032

Total


Pass

$

251,907

$

867,097

$

1,321,175

$

601,946

$

371,113

$

335,382

$

2,030,346

$

236,050

$

6,015,016

Special mention


11,224


1,676


26,127


20,941


1,921


22,122


24,074


650


108,735

Substandard - accrual


5,485


25,446


7,342


9,874


5,482


5,718


33,875


20,132


113,354

Substandard - non-accrual


2,213


858


264


144


6,105


305


9,889

Doubtful


2,193


2,193

Loss


Total

$

268,616

$

896,432

$

1,355,502

$

633,025

$

378,516

$

363,366

$

2,096,593

$

257,137

$

6,249,187

17


As of December 31, 2023

Amortized Cost Basis by Origination Year and Internal Risk Rating

Amortized Cost Basis


2023


2022


2021


2020


2019


2018 and Prior


Revolving Loans


Revolving Loans Converted to Term Loans


Total

(Dollars in thousands)

Commercial and industrial


Pass

$

379,360

$

258,182

$

193,302

$

54,901

$

38,762

$

18,801

$

1,061,365

$

53,015

$

2,057,688

Special mention


2,442


925


6,000


2,674


1,460


26


9,748


3,175


26,450

Substandard - accrual


12,655


1,877


5,101


238


598


815


28,652


16,831


66,767

Substandard - non-accrual


266


24


6,848


178


7,316

Doubtful


1,991


1,991

Loss


Total

$

394,457

$

260,984

$

204,669

$

57,837

$

40,820

$

19,642

$

1,108,604

$

73,199

$

2,160,212

Energy


Pass

$

4,581

$

6,868

$

$

156

$

$

$

202,218

$

107

$

213,930

Special mention


Substandard - accrual


Substandard - non-accrual


Doubtful


288


288

Loss


Total

$

4,581

$

6,868

$

$

156

$

$

$

202,506

$

107

$

214,218

Commercial real estate - owner-occupied


Pass

$

56,236

$

92,148

$

119,684

$

62,072

$

49,992

$

32,936

$

76,782

$

36,263

$

526,113

Special mention


10,095


6,798


8,522


1,747


793


2,448


576


30,979

Substandard - accrual


2,977


1,635


770


2,047


1,528


8,957

Substandard - non-accrual


204


204

Doubtful


Loss


Total

$

69,308

$

98,946

$

128,410

$

65,454

$

51,555

$

37,431

$

76,782

$

38,367

$

566,253

Commercial real estate - non-owner-occupied


Pass

$

477,238

$

842,755

$

242,405

$

161,845

$

65,540

$

50,062

$

626,998

$

145,621

$

2,612,464

Special mention


18,939


7,331


17,208


4,052


47,530

Substandard - accrual


10,341


2,396


3,626


298


439


17,100

Substandard - non-accrual


713


6,029


1,698


8,440

Doubtful


Loss


Total

$

487,579

$

862,407

$

258,161

$

167,169

$

82,748

$

54,412

$

626,998

$

146,060

$

2,685,534

Residential real estate


Pass

$

37,676

$

86,919

$

82,390

$

110,853

$

36,589

$

62,288

$

37,619

$

$

454,334

Special mention


813


3,519


176


4,508

Substandard - accrual


253


1,317


3,125


203


176


5,074

Substandard - non-accrual


179


179

Doubtful


Loss


Total

$

37,929

$

87,732

$

87,226

$

114,154

$

36,792

$

62,288

$

37,795

$

179

$

464,095

Consumer


Pass

$

11,591

$

6,004

$

462

$

54

$

221

$

25

$

18,960

$

$

37,317

Special mention


5


5

Substandard - accrual


23


23

Substandard - non-accrual


33


33

Doubtful


Loss


Total

$

11,591

$

6,037

$

462

$

77

$

221

$

30

$

18,960

$

$

37,378

Total


Pass

$

966,682

$

1,292,876

$

638,243

$

389,881

$

191,104

$

164,112

$

2,023,942

$

235,006

$

5,901,846

Special mention


12,537


27,475


25,372


4,597


19,461


6,531


9,748


3,751


109,472

Substandard - accrual


26,226


1,877


8,814


8,647


1,571


3,160


28,828


18,798


97,921

Substandard - non-accrual


746


6,499


1,722


6,848


357


16,172

Doubtful


2,279


2,279

Loss


Total

$

1,005,445

$

1,322,974

$

678,928

$

404,847

$

212,136

$

173,803

$

2,071,645

$

257,912

$

6,127,690

18

The following tables present the Company’s loan portfolio aging analysis as of March 31, 2024 and December 31, 2023:

As of March 31, 2024

Amortized Cost Basis by Origination Year and Past Due Status

Amortized Cost Basis


Revolving loans


2019 and

converted to


2024


2023


2022


2021


2020


Prior


Revolving loans


term loans


Total

(Dollars in thousands)

Commercial and industrial


30-59 days

$

-

$

2,558

$

150

$

448

$

-

$

274

$

4,672

$

-

$

8,102

60-89 days


-


62


18


-


-


-

2,154


-


2,234

Greater than 90 days


-


280


-


331


-


144

8,548


-


9,303

Total past due


-


2,900


168


779


-


418


15,374


-


19,639

Current


166,420


314,919

256,062

166,175

39,598

47,886

1,092,617

76,246


2,159,923

Total

$

166,420

$

317,819

$

256,230

$

166,954

$

39,598

$

48,304

$

1,107,991

$

76,246

$

2,179,562

Greater than 90 days and accruing

$

-

$

280

$

-

$

67

$

-

$

-

$

447

$

-

$

794

Energy


30-59 days

$

-

$

-

$

-

$

-

$

-

$

-

$

-

$

-

$

-

60-89 days


-

-

-

-

-

-

-

-


-

Greater than 90 days


-

-

-

-

-

-

198

-


198

Total past due


-


-


-


-


-


-


198


-


198

Current


-

4,583

6,345

-

-

-

208,147

1,944

221,019

Total

$

-

$

4,583

$

6,345

$

-

$

-

$

-

$

208,345

$

1,944

$

221,217

Greater than 90 days and accruing

$

-

$

-

$

-

$

-

$

-

$

-

$

-

$

-

$

-

Commercial real estate - owner-occupied


30-59 days

$

-

$

2,977

$

336

$

-

$

-

$

-

$

-

$

1,528

$

4,841

60-89 days


-

-

-

-

-

-

-

-


-

Greater than 90 days


-

-

-

-

416

229

-

-


645

Total past due


-


2,977


336


-


416


229


-


1,528


5,486

Current


15,877

56,459

110,740

126,478

66,019

86,192

76,967

33,594

572,326

Total

$

15,877

$

59,436

$

111,076

$

126,478

$

66,435

$

86,421

$

76,967

$

35,122

$

577,812

Greater than 90 days and accruing

$

-

$

-

$

-

$

-

$

416

$

229

$

-

$

-

$

645

Commercial real estate - non-owner-occupied


30-59 days

$

-

$

18,853

$

4,717

$

-

$

-

$

141

$

5,606

$

-

$

29,317

60-89 days


-

573

-

-

816

68

-

-


1,457

Greater than 90 days


-

-

522

-

-

-

-

-


522

Total past due


-


19,426


5,239


-


816


209


5,606


-


31,296

Current


82,853

434,708

880,421

255,603

162,003

133,151

646,252

143,649


2,738,640

Total

$

82,853

$

454,134

$

885,660

$

255,603

$

162,819

$

133,360

$

651,858

$

143,649

$

2,769,936

Greater than 90 days and accruing

$

-

$

-

$

-

$

-

$

-

$

-

$

-

$

-

$

-

Residential real estate


30-59 days

$

-

$

-

$

6

$

89

$

136

$

-

$

-

$

-

$

231

60-89 days


-

-

-

-

-

-

-

-


-

Greater than 90 days


-

-

-

1,310

-

-

176

-


1,486

Total past due


-


-


6


1,399


136


-


176


-


1,717

Current


2,177

49,465

91,804

82,179

109,462

95,030

36,618

176


466,911

Total

$

2,177

$

49,465

$

91,810

$

83,578

$

109,598

$

95,030

$

36,794

$

176

$

468,628

Greater than 90 days and accruing

$

-

$

-

$

-

$

1,310

$

-

$

-

$

176

$

-

$

1,486

Consumer


30-59 days

$

-

$

-

$

4

$

22

$

-

$

-

$

135

$

-

$

161

60-89 days


-

-

17

16

-

5

-

-


38

Greater than 90 days


-

-

-

-

-

-

-

-


-

Total past due


-


-


21


38


-


5


135


-


199

Current


1,289

10,995

4,360

374

66

246

14,503

-


31,833

Total

$

1,289

$

10,995

$

4,381

$

412

$

66

$

251

$

14,638

$

-

$

32,032

Greater than 90 days and accruing

$

-

$

-

$

-

$

-

$

-

$

-

$

-

$

-

$

-

Total


30-59 days

$

-

$

24,388

$

5,213

$

559

$

136

$

415

$

10,413

$

1,528

$

42,652

60-89 days


-


635


35


16


816


73


2,154


-


3,729

Greater than 90 days


-


280


522


1,641


416


373


8,922


-


12,154

Total past due


-


25,303


5,770


2,216


1,368


861


21,489


1,528


58,535

Current


268,616


871,129


1,349,732


630,809


377,148


362,505


2,075,104


255,609


6,190,652

Total

$

268,616

$

896,432

$

1,355,502

$

633,025

$

378,516

$

363,366

$

2,096,593

$

257,137

$

6,249,187

Greater than 90 days and accruing

$

-

$

280

$

-

$

1,377

$

416

$

229

$

623

$

-

$

2,925

19

As of December 31, 2023

Amortized Cost Basis by Origination Year and Past Due Status

Amortized Cost Basis


Revolving loans


2018 and

converted to


2023


2022


2021


2020


2019


Prior


Revolving loans


term loans


Total

(Dollars in thousands)

Commercial and industrial


30-59 days

$

250

$

178

$

$

81

$

$

136

$

158

$

151

$

954

60-89 days


Greater than 90 days


30


28


347


24


199


10,800


2,376


13,804

Total past due


280


206


347


105


199


136


10,958


2,527


14,758

Current


394,177


260,778


204,322


57,732


40,621


19,506


1,097,646


70,672


2,145,454

Total

$

394,457

$

260,984

$

204,669

$

57,837

$

40,820

$

19,642

$

1,108,604

$

73,199

$

2,160,212

Greater than 90 days and accruing

$

30

$

28

$

81

$

$

199

$

$

2,000

$

2,199

$

4,537

Energy


30-59 days

$

$

$

$

$

$

$

30

$

$

30

60-89 days


Greater than 90 days


288


288

Total past due


318


318

Current


4,581


6,868


156


202,188


107


213,900

Total

$

4,581

$

6,868

$

$

156

$

$

$

202,506

$

107

$

214,218

Greater than 90 days and accruing

$

$

$

$

$

$

$

$

$

Commercial real estate - owner-occupied


30-59 days

$

$

$

$

371

$

$

71

$

$

$

442

60-89 days


Greater than 90 days


204


204

Total past due


204


371


71


646

Current


69,308


98,946


128,206


65,083


51,555


37,360


76,782


38,367


565,607

Total

$

69,308

$

98,946

$

128,410

$

65,454

$

51,555

$

37,431

$

76,782

$

38,367

$

566,253

Greater than 90 days and accruing

$

$

$

$

$

$

$

$

$

Commercial real estate - non-owner-occupied


30-59 days

$

$

$

$

$

$

$

$

$

60-89 days


Greater than 90 days


713


6,029


1,698


307


8,747

Total past due


713


6,029


1,698


307


8,747

Current


487,579


861,694


252,132


165,471


82,748


54,105


626,998


146,060


2,676,787

Total

$

487,579

$

862,407

$

258,161

$

167,169

$

82,748

$

54,412

$

626,998

$

146,060

$

2,685,534

Greater than 90 days and accruing

$

$

$

$

$

$

307

$

$

$

307

Residential real estate


30-59 days

$

$

6

$

$

137

$

$

$

$

$

143

60-89 days


Greater than 90 days


1,317


176


1,493

Total past due


6


1,317


137


176


1,636

Current


37,929


87,726


85,909


114,017


36,792


62,288


37,619


179


462,459

Total

$

37,929

$

87,732

$

87,226

$

114,154

$

36,792

$

62,288

$

37,795

$

179

$

464,095

Greater than 90 days and accruing

$

$

$

1,317

$

$

$

$

176

$

$

1,493

Consumer


30-59 days

$

$

219

$

40

$

$

$

$

200

$

$

459

60-89 days


Greater than 90 days


35


35

Total past due


254


40


200


494

Current


11,591


5,783


422


77


221


30


18,760


36,884

Total

$

11,591

$

6,037

$

462

$

77

$

221

$

30

$

18,960

$

$

37,378

Greater than 90 days and accruing

$

$

2

$

$

$

$

$

$

$

2

Total


30-59 days

$

250

$

403

$

40

$

589

$

$

207

$

388

$

151

$

2,028

60-89 days


Greater than 90 days


30


776


7,897


1,722


199


307


11,264


2,376


24,571

Total past due


280


1,179


7,937


2,311


199


514


11,652


2,527


26,599

Current


1,005,165


1,321,795


670,991


402,536


211,937


173,289


2,059,993


255,385


6,101,091

Total

$

1,005,445

$

1,322,974

$

678,928

$

404,847

$

212,136

$

173,803

$

2,071,645

$

257,912

$

6,127,690

Greater than 90 days and accruing

$

30

$

30

$

1,398

$

$

199

$

307

$

2,176

$

2,199

$

6,339

20

Non-accrual loans are loans for which the Company does not record interest income. The accrual of interest on loans is primarily

dependentdiscontinued at the time the loan is 90 days past due unless the credit is well secured and in process of collection. Past due status is based on the personal income and credit ratingcontractual terms of the borrowers. Credit
risk in theseloan. In all cases, loans can be impactedare placed on non-accrual or charged off at an earlier date, if collection of principal or interest is considered doubtful. Loans are returned to accrual status when all the principal and interest amounts contractually due are brought current and future payments are reasonably assured. The following table presents the Company’s non-accrual loans by economic conditions within or outsideloan segments at March 31, 2024 and December 31, 2023:

As of March 31, 2024

Amortized Cost Basis by Origination Year

Amortized Cost Basis

Revolving

Non-accrual

loans

Loans with

2019 and

Revolving

converted

Total Non-

no related


2024


2023


2022


2021


2020


Prior


loans


to term loans


accrual Loans


Allowance

(Dollars in thousands)

Commercial and industrial

$

$

2,213

$

$

264

$

$

144

$

8,100

$

129

$

10,850

$

5,717

Energy


198


198


198

Commercial real estate - owner-occupied


336


336


336

Commercial real estate - non-owner-occupied


522


522


Residential real estate


176


176


176

Consumer


Total

$

$

2,213

$

858

$

264

$

$

144

$

8,298

$

305

$

12,082

$

6,427

As of December 31, 2023

Amortized Cost Basis by Origination Year

Amortized Cost Basis

Revolving

Non-accrual

loans

Loans with

2018 and

Revolving

converted

Total Non-

no related


2023


2022


2021


2020


2019


Prior


loans


to term loans


accrual Loans


Allowance

(Dollars in thousands)

Commercial and industrial

$

$

$

266

$

24

$

$

$

8,839

$

178

$

9,307

$

6,198

Energy


288


288


288

Commercial real estate - owner-occupied


204


204


204

Commercial real estate - non-owner-occupied


713


6,029


1,698


8,440


1,698

Residential real estate


179


179


179

Consumer


33


33


33

Total

$

$

746

$

6,499

$

1,722

$

$

$

9,127

$

357

$

18,451

$

8,600

Interest income recognized on non-accrual loans was zero during the

borrower’s market areas that might impact either property values or a borrower’s
personal income.
Multifamily Real Estate -
The category includes loans that are generally secured by multifamily properties.
Repayment of these loans is primarily dependent on
occupancy rates three months ended March 31, 2024 and the personal income of the tenants. Credit risk in these
loans can be impacted by economic conditions within or outside the
borrower’s market
areas that might impact either property values or the tenants’ personal income.
Consumer
- The category includes revolving lines of credit and various term loans such as automobile
loans and loans for other personal purposes. Repayment is
primarily dependent on the personal income and credit rating of the borrowers.
Credit risk is driven by consumer economic factors (such as unemployment and
general economic conditions in the borrower’s market area) and the
creditworthiness of a borrower.
2023.

Allowance for Credit Losses

The Company’s CECL committee meets at least quarterly to oversee the ACL methodology. The committee estimates the ACL using relevant available information, from

internal and external sources, relating to past events, current conditions,
and reasonable and supportable forecasts. The ACL represents the Company’s current estimate of lifetime
credit losses inherent in the loan portfolio at the statement of financial condition
date. The ACL is
adjusted for expected prepayments when appropriate and excludes expected
extensions, renewals, and modifications.

The ACL is the sum of three components: (i) asset specific / individual loan reserves; (ii) quantitative (formulaic or pooled) reserves; and (iii)

qualitative (judgmental)
reserves.

Asset Specific -

When unique qualities cause a loan’s exposure to loss to be inconsistent with the
pool segments, pooled reserves, the loan is individually evaluated. Individual reserves are
calculated for loans that are risk-rated substandard and on non-accrual
and loans that are risk-rated doubtful or loss that are greater than a defined dollar threshold.
In addition, TDRs
are also individually evaluated. Reserves on asset specific loans may be based
on collateral, for collateral-dependent loans, or on quantitative and
qualitative factors, including
expected cash flow, market sentiment, and guarantor support.

21

17

Quantitative

- The Company used the cohort method, which identifies and captures the balance of a pool of loans with similar
risk characteristics as of a particular time to
form a cohort. For example, the outstanding commercial and industrial
loans and commercial and industrial lines of credit loan segments as of quarter
-end are considered cohorts.
The cohort is then tracked for losses over the remaining life of loans or until the poo
l
pool is exhausted. The Company used a lookback period of approximately six-years to establish the
cohort population. By using the historical data timeframe, the Company can establish
a historical loss factor for each of its loan segments and adjust the losses with qualitative and
forecast factors.
segments.

Qualitative

– The Company uses qualitative factors to adjust the historical loss factors for current conditions. The
Company primarily uses the following qualitative factors:

The nature and volume of changes in risk ratings;
The volume and severity of past due loans;
The volume of non-accrual loans;
The nature and volume of the loan portfolio, including the existence, growth, and effect of any concentrations of credit;
Changes in the Institute of Supply Management’s Purchasing Manager Indices (“PMI”) for services and manufacturing;
Changes in collateral values;
Changes in lending policies, procedures, and quality of loan reviews;
Changes in lending staff; and
Changes in competition, legal and regulatory environments
The nature and volume of changes in risk ratings;
The volume and severity of past due loans;
The volume of non-accrual loans;
The nature and volume of the loan portfolio, including the existence, growth, and
effect of any concentrations of credit;
Changes in the Institute of Supply Management’s Purchasing Manager Indices
(“PMI”) for services and manufacturing;
Changes in collateral values;
Changes in lending policies, procedures, and quality of loan reviews;
Changes in lending staff; and
Changes in competition, legal and regulatory environments

In addition to the current condition qualitative adjustments, the Company uses the

Federal Reserve’s unemployment forecast to adjust the ACL based on forward looking
forward-looking guidance. The Federal Reserve’s unemployment forecast extends three-years
three years and is eventually reverted to the mean of six percent by year 10.
Internal Credit Risk Ratings
The Company uses a weighted average risk rating factor to adjust the historical
loss factors for current events. Risk ratings incorporate the criteria utilized by regulatory
authorities to describe criticized assets, but separate various levels of risk
concentrated within the regulatory “Pass” category. Risk ratings are established
for loans at origination and
are monitored on an ongoing basis. The rating assigned to a loan reflects the risks
posed by the borrower’s expected performance and the transaction’s structure.
Performance metrics
used to determine a risk rating include, but are not limited to, cash flow adequacy,
liquidity, and collateral. A description of the loan risk ratings follows:
Loan Grades
Pass (risk rating 1-4)
- The category includes loans that are considered satisfactory. The category includes borrowers that generally
maintain good liquidity and
financial condition, or the credit is currently protected with sales trends remaining
flat or declining. Most ratios compare favorably with industry norms and Company
policies. Debt is programmed and timely repayment is expected.
Special Mention (risk rating 5)
- The category includes borrowers that generally exhibit adverse trends in operations or an
imbalanced position in their balance
sheet that has not reached a point where repayment is jeopardized. Credits are currently
protected but, if left uncorrected, the potential weaknesses may result in
deterioration of the repayment prospects for the credit or in the Company’s
credit or lien position at a future date. These credits are not adversely classified and do not
expose the Company to enough risk to warrant adverse classification.
Substandard (risk rating 6)
- The category includes borrowers that generally exhibit well-defined weakness(es) that jeopardize
repayment. Credits are inadequately
protected by the current worth and paying capacity of the obligor or of the collateral
pledged. A
distinct possibility exists that the Company will sustain some loss if
18
deficiencies are not corrected. Loss potential, while existing in the aggregate
amount of substandard assets, does not have to exist in individual assets classified
substandard. Substandard loans include both performing and non-performing loans
and are broken out in the table below.
Doubtful (risk rating 7)
- The category includes borrowers that exhibit weaknesses inherent in a substandard credit and
characteristics that these weaknesses make
collection or liquidation in full highly questionable or improbable based
on existing facts, conditions, and values. Because of reasonably specific
pending factors,
which may work to the advantage and strengthening of the assets, classification as a loss is
deferred until its more exact status may be determined.
Loss (risk rating 8)
- Credits which are considered uncollectible or of such little value that their continuance
as a bankable asset is not warranted.
19
The following tables present the credit risk profile of the Company’s loan portfolio
based on internal rating categories and loan segments as of March 31, 2023
and December
31, 2022:
As of March 31, 2023
Amortized Cost Basis by Origination Year and Internal Risk Rating
Amortized Cost Basis
2023
2022
2021
2020
2019
2018 and
Prior
Revolving
Loans
Revolving
Loans
converted to
Term Loans
Total
(Dollars in thousands)
Commercial and industrial
Pass
$
111,407
$
379,176
$
224,316
$
54,865
$
48,014
$
64,730
$
-
$
27,044
$
909,552
Special mention
12,388
5,826
19,996
13,802
795
318
-
33
53,158
Substandard - accrual
-
69
125
1,566
1,152
1,019
-
19,786
23,717
Substandard - non-
accrual
-
-
-
-
-
11
-
198
209
Doubtful
-
-
-
-
-
-
-
-
-
Loss
-
-
-
-
-
-
-
-
-
Total
$
123,795
$
385,071
$
244,437
$
70,233
$
49,961
$
66,078
$
-
$
47,061
$
986,636
Commercial and industrial
lines of credit
Pass
$
-
$
-
$
-
$
-
$
-
$
-
$
973,052
$
-
$
973,052
Special mention
-
-
-
-
-
-
49,569
-
49,569
Substandard - accrual
-
-
-
-
-
-
18,594
-
18,594
Substandard - non-
accrual
-
-
-
-
-
-
6,065
-
6,065
Doubtful
-
-
-
-
-
-
-
-
-
Loss
-
-
-
-
-
-
-
-
-
Total
$
-
$
-
$
-
$
-
$
-
$
-
$
1,047,280
$
-
$
1,047,280
Energy
Pass
$
-
$
7,481
$
206
$
192
$
-
$
-
$
185,262
$
160
$
193,301
Special mention
-
-
-
-
-
-
-
-
-
Substandard - accrual
-
-
-
-
-
-
-
-
-
Substandard - non-
accrual
-
-
-
-
-
-
-
-
-
Doubtful
-
-
-
-
-
-
558
-
558
Loss
-
-
-
-
-
-
-
-
-
Total
$
-
$
7,481
$
206
$
192
$
-
$
-
$
185,820
$
160
$
193,859
20
As of March 31, 2023
Amortized Cost Basis by Origination Year and Internal Risk Rating
Amortized Cost Basis
2023
2022
2021
2020
2019
2018 and
Prior
Revolving
Loans
Revolving
Loans
converted to
Term Loans
Total
(Dollars in thousands)
Commercial real estate
Pass
$
65,310
$
437,240
$
287,175
$
153,430
$
128,097
$
135,622
$
411,771
$
101,002
$
1,719,647
Special mention
9,833
12,446
5,945
555
1,204
13,815
4,243
27,476
75,517
Substandard - accrual
-
10,238
-
550
81
385
-
-
11,254
Substandard - non-
accrual
-
-
2,470
-
-
-
-
-
2,470
Doubtful
-
-
-
-
-
-
-
-
-
Loss
-
-
-
-
-
-
-
-
-
Total
$
75,143
$
459,924
$
295,590
$
154,535
$
129,382
$
149,822
$
416,014
$
128,478
$
1,808,888
Construction and land development
Pass
$
96,933
$
395,906
$
212,418
$
70,749
$
9,960
$
1,603
$
49,228
$
-
$
836,797
Special mention
-
-
7,624
-
-
-
-
-
7,624
Substandard - accrual
-
226
-
-
-
-
438
-
664
Substandard - non-
accrual
-
-
-
-
-
-
-
-
-
Doubtful
-
-
-
-
-
-
-
-
-
Loss
-
-
-
-
-
-
-
-
-
Total
$
96,933
$
396,132
$
220,042
$
70,749
$
9,960
$
1,603
$
49,666
$
-
$
845,085
Residential real estate
Pass
$
6,195
$
77,458
$
86,022
$
118,328
$
44,628
$
68,535
$
3,950
$
-
$
405,116
Special mention
253
-
3,253
182
212
-
-
-
3,900
Substandard - accrual
-
-
-
3,130
-
-
-
-
3,130
Substandard - non-
accrual
-
-
-
-
-
-
-
188
188
Doubtful
-
-
-
-
-
-
-
-
-
Loss
-
-
-
-
-
-
-
-
-
Total
$
6,448
$
77,458
$
89,275
$
121,640
$
44,840
$
68,535
$
3,950
$
188
$
412,334
21
As of March 31, 2023
Amortized Cost Basis by Origination Year and Internal Risk Rating
Amortized Cost Basis
2023
2022
2021
2020
2019
2018 and
Prior
Revolving
Loans
Revolving
Loans
converted to
Term Loans
Total
(Dollars in thousands)
Multifamily real estate
Pass
$
22,508
$
112,051
$
39,983
$
7,490
$
11,869
$
3,178
$
98,355
$
-
$
295,434
Special mention
-
-
-
-
-
-
-
35
35
Substandard - accrual
-
-
-
-
-
-
-
-
-
Substandard - non-
accrual
-
-
-
-
-
-
-
-
-
Doubtful
-
-
-
-
-
-
-
-
-
Loss
-
-
-
-
-
-
-
-
-
Total
$
22,508
$
112,051
$
39,983
$
7,490
$
11,869
$
3,178
$
98,355
$
35
$
295,469
Consumer
Pass
$
397
$
7,016
$
707
$
133
$
255
$
130
$
49,407
$
-
$
58,045
Special mention
-
-
-
-
-
8
-
-
8
Substandard - accrual
-
-
-
30
-
5
-
-
35
Substandard - non-
accrual
-
-
-
-
-
-
-
-
-
Doubtful
-
-
-
-
-
-
-
-
-
Loss
-
-
-
-
-
-
-
-
-
Total
$
397
$
7,016
$
707
$
163
$
255
$
143
$
49,407
$
-
$
58,088
Total
Pass
$
302,750
$
1,416,328
$
850,827
$
405,187
$
242,823
$
273,798
$
1,771,025
$
128,206
$
5,390,944
Special mention
22,474
18,272
36,818
14,539
2,211
14,141
53,812
27,544
189,811
Substandard - accrual
-
10,533
125
5,276
1,233
1,409
19,032
19,786
57,394
Substandard - non-
accrual
-
-
2,470
-
-
11
6,065
386
8,932
Doubtful
-
-
-
-
-
-
558
-
558
Loss
-
-
-
-
-
-
-
-
-
Total
$
325,224
$
1,445,133
$
890,240
$
425,002
$
246,267
$
289,359
$
1,850,492
$
175,922
$
5,647,639
22
As of December 31, 2022
Amortized Cost Basis by Origination Year and Internal Risk Rating
Amortized Cost Basis
2022
2021
2020
2019
2018
2017 and
Prior
Revolving
Loans
Revolving
Loans
converted to
Term Loans
Total
(Dollars in thousands)
Commercial and industrial
Pass
$
465,963
$
281,166
$
55,934
$
50,445
$
48,595
$
20,648
$
-
$
19,089
$
941,840
Special mention
2,531
23,055
14,573
2,951
4,947
86
-
41
48,184
Substandard - accrual
290
677
1,647
1,330
740
299
-
21,166
26,149
Substandard - non-
accrual
-
104
-
6
1,383
-
-
-
1,493
Doubtful
-
-
-
-
-
-
-
-
-
Loss
-
-
-
-
-
12
-
-
12
Total
$
468,784
$
305,002
$
72,154
$
54,732
$
55,665
$
21,045
$
-
$
40,296
$
1,017,678
Commercial and industrial lines of credit
Pass
$
-
$
-
$
-
$
-
$
-
$
-
$
890,109
$
-
$
890,109
Special mention
-
-
-
-
-
-
49,861
-
49,861
Substandard - accrual
-
-
-
-
-
-
10,805
-
10,805
Substandard - non-
accrual
-
-
-
-
-
-
6,479
-
6,479
Doubtful
-
-
-
-
-
-
-
-
-
Loss
-
-
-
-
-
-
-
-
-
Total
$
-
$
-
$
-
$
-
$
-
$
-
$
957,254
$
-
$
957,254
Energy
Pass
$
7,585
$
306
$
228
$
-
$
-
$
-
$
162,834
$
171
$
171,124
Special mention
-
-
-
-
-
-
-
-
-
Substandard - accrual
-
-
-
-
-
-
1,476
-
1,476
Substandard - non-
accrual
-
-
-
-
-
-
-
-
-
Doubtful
-
-
-
-
-
-
618
-
618
Loss
-
-
-
-
-
-
-
-
-
Total
$
7,585
$
306
$
228
$
-
$
-
$
-
$
164,928
$
171
$
173,218
23
As of December 31, 2022
Amortized Cost Basis by Origination Year and Internal Risk Rating
Amortized Cost Basis
2022
2021
2020
2019
2018
2017 and
Prior
Revolving
Loans
Revolving
Loans
converted to
Term Loans
Total
(Dollars in thousands)
Commercial real estate
Pass
$
474,901
$
276,403
$
156,553
$
119,643
$
73,989
$
84,460
$
350,732
$
108,837
$
1,645,518
Special mention
23,223
6,603
566
1,330
6,558
4,339
2,429
12,285
57,333
Substandard - accrual
10,388
-
547
82
60
1,548
-
992
13,617
Substandard - non-
accrual
-
2,479
-
-
-
-
-
-
2,479
Doubtful
-
-
-
-
-
-
-
-
-
Loss
-
-
-
-
-
-
-
-
-
Total
$
508,512
$
285,485
$
157,666
$
121,055
$
80,607
$
90,347
$
353,161
$
122,114
$
1,718,947
Construction and land development
Pass
$
346,429
$
266,557
$
93,229
$
19,866
$
1,497
$
9,053
$
49,500
$
-
$
786,131
Special mention
-
7,727
-
-
-
-
-
-
7,727
Substandard - accrual
157
310
463
-
-
-
-
-
930
Substandard - non-
accrual
-
-
-
-
-
-
-
-
-
Doubtful
-
-
-
-
-
-
-
-
-
Loss
-
-
-
-
-
-
-
-
-
Total
$
346,586
$
274,594
$
93,692
$
19,866
$
1,497
$
9,053
$
49,500
$
-
$
794,788
Residential real estate
Pass
$
77,416
$
84,158
$
121,078
$
45,265
$
37,395
$
34,852
$
1,649
$
-
$
401,813
Special mention
253
3,272
187
226
-
-
-
-
-
3,938
Substandard - accrual
34
-
3,148
-
-
-
-
-
3,182
Substandard - non-
accrual
-
-
-
-
-
-
-
191
191
Doubtful
-
-
-
-
-
-
-
-
-
Loss
-
-
-
-
-
-
-
-
-
Total
$
77,703
$
87,430
$
124,413
$
45,491
$
37,395
$
34,852
$
1,649
$
191
$
409,124
24
As of December 31, 2022
Amortized Cost Basis by Origination Year and Internal Risk Rating
Amortized Cost Basis
2022
2021
2020
2019
2018
2017 and
Prior
Revolving
Loans
Revolving
Loans
converted to
Term Loans
Total
(Dollars in thousands)
Multifamily real estate
Pass
$
85,785
$
26,705
$
6,915
$
11,938
$
2,491
$
726
$
86,879
$
16,509
$
237,948
Special mention
-
-
-
-
-
-
-
36
36
Substandard - accrual
-
-
-
-
-
-
-
-
-
Substandard - non-
accrual
-
-
-
-
-
-
-
-
-
Doubtful
-
-
-
-
-
-
-
-
-
Loss
-
-
-
-
-
-
-
-
-
Total
$
85,785
$
26,705
$
6,915
$
11,938
$
2,491
$
726
$
86,879
$
16,545
$
237,984
Consumer
Pass
$
7,917
$
1,347
$
2,611
$
265
$
129
$
6
$
51,416
$
-
$
63,691
Special mention
-
-
-
-
8
-
-
-
8
Substandard - accrual
-
-
32
-
5
-
-
-
37
Substandard - non-
accrual
-
-
-
-
-
-
-
-
-
Doubtful
-
-
-
-
-
-
-
-
-
Loss
-
-
-
-
-
-
-
-
-
Total
$
7,917
$
1,347
$
2,643
$
265
$
142
$
6
$
51,416
$
-
$
63,736
Total
Pass
$
1,465,996
$
936,642
$
436,548
$
247,422
$
164,096
$
149,745
$
1,593,119
$
144,606
$
5,138,174
Special mention
26,007
40,657
15,326
4,507
11,513
4,425
52,290
12,362
167,087
Substandard - accrual
10,869
987
5,837
1,412
805
1,847
12,281
22,158
56,196
Substandard - non-
accrual
-
2,583
-
6
1,383
-
6,479
191
10,642
Doubtful
-
-
-
-
-
-
618
-
618
Loss
-
-
-
-
-
12
-
-
12
Total
$
1,502,872
$
980,869
$
457,711
$
253,347
$
177,797
$
156,029
$
1,664,787
$
179,317
$
5,372,729
25
Loan Portfolio Aging Analysis
The following tables present the Company’s loan portfolio aging analysis as of
March 31, 2023 and December 31, 2022:
As of March 31, 2023
Amortized Cost Basis by Origination Year and Past Due Status
Amortized Cost Basis
2023
2022
2021
2020
2019
2018 and
Prior
Revolving
loans
Revolving
loans
converted to
term loans
Total
(Dollars in thousands)
Commercial and industrial
30-59 days
$
-
$
70
$
142
$
-
$
-
$
-
$
-
$
1,915
$
2,127
60-89 days
-
-
-
-
-
-
-
-
-
Greater than 90 days
-
-
2
148
-
11
-
-
161
Total past due
-
70
144
148
-
11
-
1,915
2,288
Current
123,795
385,001
244,293
70,085
49,961
66,067
-
45,146
984,348
Total
$
123,795
$
385,071
$
244,437
$
70,233
$
49,961
$
66,078
$
-
$
47,061
$
986,636
Greater than 90 days
and accruing
$
-
$
-
$
2
$
148
$
-
$
-
$
-
$
-
$
150
Commercial and industrial lines of credit
30-59 days
$
-
$
-
$
-
$
-
$
-
$
-
$
2,510
$
-
$
2,510
60-89 days
-
-
-
-
-
-
-
-
-
Greater than 90 days
-
-
-
-
-
-
6,679
-
6,679
Total past due
-
-
-
-
-
-
9,189
-
9,189
Current
-
-
-
-
-
-
1,038,091
-
1,038,091
Total
$
-
$
-
$
-
$
-
$
-
$
-
$
1,047,280
$
-
$
1,047,280
Greater than 90 days
and accruing
$
-
$
-
$
-
$
-
$
-
$
-
$
613
$
-
$
613
Energy
30-59 days
$
-
$
-
$
-
$
-
$
-
$
-
$
-
$
-
$
-
60-89 days
-
-
-
-
-
-
-
-
-
Greater than 90 days
-
-
-
-
-
-
558
-
558
Total past due
-
-
-
-
-
-
558
-
558
Current
-
7,481
206
192
-
-
185,262
160
193,301
Total
$
-
$
7,481
$
206
$
192
$
-
$
-
$
185,820
$
160
$
193,859
Greater than 90 days
and accruing
$
-
$
-
$
-
$
-
$
-
$
-
$
-
$
-
$
-
26
As of March 31, 2023
Amortized Cost Basis by Origination Year and Past Due Status
Amortized Cost Basis
2023
2022
2021
2020
2019
2018 and
Prior
Revolving
loans
Revolving
loans
converted to
term loans
Total
(Dollars in thousands)
Commercial real estate
30-59 days
$
-
$
190
$
-
$
-
$
-
$
214
$
-
$
-
$
404
60-89 days
-
-
-
-
-
-
-
-
-
Greater than 90 days
-
-
-
-
-
-
100
-
100
Total past due
-
190
-
-
-
214
100
-
504
Current
75,143
459,734
295,590
154,535
129,382
149,608
415,914
128,478
1,808,384
Total
$
75,143
$
459,924
$
295,590
$
154,535
$
129,382
$
149,822
$
416,014
$
128,478
$
1,808,888
Greater than 90 days
and accruing
$
-
$
-
$
-
$
-
$
-
$
-
$
100
$
-
$
100
Construction and land development
30-59 days
$
-
$
-
$
-
$
-
$
-
$
-
$
-
$
-
$
-
60-89 days
-
-
-
-
-
-
-
-
-
Greater than 90 days
-
-
-
-
-
-
-
-
-
Total past due
-
-
-
-
-
-
-
-
-
Current
96,933
396,132
220,042
70,749
9,960
1,603
49,666
-
845,085
Total
$
96,933
$
396,132
$
220,042
$
70,749
$
9,960
$
1,603
$
49,666
$
-
$
845,085
Greater than 90 days
and accruing
$
-
$
-
$
-
$
-
$
-
$
-
$
-
$
-
$
-
Residential real estate
30-59 days
$
-
$
8
$
-
$
-
$
-
$
-
$
-
$
-
$
8
60-89 days
-
-
-
-
-
-
-
-
-
Greater than 90 days
-
-
-
-
-
-
-
-
-
Total past due
-
8
-
-
-
-
-
-
8
Current
6,448
77,450
89,275
121,640
44,840
68,535
3,950
188
412,326
Total
$
6,448
$
77,458
$
89,275
$
121,640
$
44,840
$
68,535
$
3,950
$
188
$
412,334
Greater than 90 days
and accruing
$
-
$
-
$
-
$
-
$
-
$
-
$
-
$
-
$
-
27
As of March 31, 2023
Amortized Cost Basis by Origination Year and Past Due Status
Amortized Cost Basis
2023
2022
2021
2020
2019
2018 and
Prior
Revolving
loans
Revolving
loans
converted to
term loans
Total
(Dollars in thousands)
Multifamily real estate
30-59 days
$
-
$
-
$
-
$
-
$
-
$
-
$
-
$
-
$
-
60-89 days
-
-
-
-
-
-
-
-
-
Greater than 90 days
-
-
-
-
-
-
-
-
-
Total past due
-
-
-
-
-
-
-
-
-
Current
22,508
112,051
39,983
7,490
11,869
3,178
98,355
35
295,469
Total
$
22,508
$
112,051
$
39,983
$
7,490
$
11,869
$
3,178
$
98,355
$
35
$
295,469
Greater than 90 days
and accruing
$
-
$
-
$
-
$
-
$
-
$
-
$
-
$
-
$
-
Consumer
30-59 days
$
-
$
-
$
5
$
-
$
-
$
-
$
-
$
-
$
5
60-89 days
-
1
-
1
-
-
-
-
2
Greater than 90 days
-
-
-
-
-
5
-
-
5
Total past due
-
1
5
1
-
5
-
-
12
Current
397
7,015
702
162
255
138
49,407
-
58,076
Total
$
397
$
7,016
$
707
$
163
$
255
$
143
$
49,407
$
-
$
58,088
Greater than 90 days
and accruing
$
-
$
-
$
-
$
-
$
-
$
5
$
-
$
-
$
5
Total
30-59 days
$
-
$
268
$
147
$
-
$
-
$
214
$
2,510
$
1,915
$
5,054
60-89 days
-
1
-
1
-
-
-
-
2
Greater than 90 days
-
-
2
148
-
16
7,337
-
7,503
Total past due
-
269
149
149
-
230
9,847
1,915
12,559
Current
325,224
1,444,864
890,091
424,853
246,267
289,129
1,840,645
174,007
5,635,080
Total
$
325,224
$
1,445,133
$
890,240
$
425,002
$
246,267
$
289,359
$
1,850,492
$
175,922
$
5,647,639
Greater than 90 days
and accruing
$
-
$
-
$
2
$
148
$
-
$
5
$
713
$
-
$
868
28
As of December 31, 2022
Amortized Cost Basis by Origination Year and Past Due Status
Amortized Cost Basis
2022
2021
2020
2019
2018
2017 and
Prior
Revolving
loans
Revolving
loans
converted to
term loans
Total
(Dollars in thousands)
Commercial and industrial
30-59 days
$
20
$
4,784
$
-
$
-
$
-
$
1,049
$
-
$
-
$
5,853
60-89 days
-
55
-
-
-
-
-
430
485
Greater than 90 days
-
143
7
6
1,383
12
-
-
1,551
Total past due
20
4,982
7
6
1,383
1,061
-
430
7,889
Current
468,764
300,020
72,147
54,726
54,282
19,984
-
39,866
1,009,789
Total
$
468,784
$
305,002
$
72,154
$
54,732
$
55,665
$
21,045
$
-
$
40,296
$
1,017,678
Greater than 90 days
and accruing
$
-
$
39
$
7
$
-
$
-
$
-
$
-
$
-
$
46
Commercial and industrial lines of credit
30-59 days
$
-
$
-
$
-
$
-
$
-
$
-
$
2,814
$
-
$
2,814
60-89 days
-
-
-
-
-
-
980
-
980
Greater than 90 days
-
-
-
-
-
-
7,063
-
7,063
Total past due
-
-
-
-
-
-
10,857
-
10,857
Current
-
-
-
-
-
-
946,397
-
946,397
Total
$
-
$
-
$
-
$
-
$
-
$
-
$
957,254
$
-
$
957,254
Greater than 90 days
and accruing
$
-
$
-
$
-
$
-
$
-
$
-
$
584
$
-
$
584
Energy
30-59 days
$
-
$
-
$
-
$
-
$
-
$
-
$
-
$
-
$
-
60-89 days
-
-
-
-
-
-
-
-
-
Greater than 90 days
-
-
-
-
-
-
618
-
618
Total past due
-
-
-
-
-
-
618
-
618
Current
7,585
306
228
-
-
-
164,310
171
172,600
Total
$
7,585
$
306
$
228
$
-
$
-
$
-
$
164,928
$
171
$
173,218
Greater than 90 days
and accruing
$
-
$
-
$
-
$
-
$
-
$
-
$
-
$
-
$
-
29
As of December 31, 2022
Amortized Cost Basis by Origination Year and Past Due Status
Amortized Cost Basis
2022
2021
2020
2019
2018
2017 and
Prior
Revolving
loans
Revolving
loans
converted to
term loans
Total
(Dollars in thousands)
Commercial real estate
30-59 days
$
-
$
-
$
-
$
1,180
$
-
$
-
$
-
$
-
$
1,180
60-89 days
-
-
-
-
-
-
-
-
-
Greater than 90 days
-
-
-
-
-
-
-
-
-
Total past due
-
-
-
1,180
-
-
-
-
1,180
Current
508,512
285,485
157,666
119,875
80,607
90,347
353,161
122,114
1,717,767
Total
$
508,512
$
285,485
$
157,666
$
121,055
$
80,607
$
90,347
$
353,161
$
122,114
$
1,718,947
Greater than 90 days
and accruing
$
-
$
-
$
-
$
-
$
-
$
-
$
-
$
-
$
-
Construction and land development
30-59 days
$
4,293
$
-
$
-
$
-
$
-
$
-
$
-
$
-
$
4,293
60-89 days
-
-
-
-
-
-
-
-
-
Greater than 90 days
-
-
-
-
-
-
-
-
-
Total past due
4,293
-
-
-
-
-
-
-
4,293
Current
342,293
274,594
93,692
19,866
1,497
9,053
49,500
-
790,495
Total
$
346,586
$
274,594
$
93,692
$
19,866
$
1,497
$
9,053
$
49,500
$
-
$
794,788
Greater than 90 days
and accruing
$
-
$
-
$
-
$
-
$
-
$
-
$
-
$
-
$
-
Residential real estate
30-59 days
$
-
$
3,867
$
-
$
10
$
-
$
-
$
-
$
-
$
3,877
60-89 days
-
-
-
-
-
-
-
-
-
Greater than 90 days
-
120
-
-
-
-
-
-
120
Total past due
-
3,987
-
10
-
-
-
-
3,997
Current
77,703
83,443
124,413
45,481
37,395
34,852
1,649
191
405,127
Total
$
77,703
$
87,430
$
124,413
$
45,491
$
37,395
$
34,852
$
1,649
$
191
$
409,124
Greater than 90 days
and accruing
$
-
$
120
$
-
$
-
$
-
$
-
$
-
$
-
$
120
30
As of December 31, 2022
Amortized Cost Basis by Origination Year and Past Due Status
Amortized Cost Basis
2022
2021
2020
2019
2018
2017 and
Prior
Revolving
loans
Revolving
loans
converted to
term loans
Total
(Dollars in thousands)
Multifamily real estate
30-59 days
$
-
$
-
$
-
$
-
$
-
$
-
$
-
$
-
$
-
60-89 days
-
-
-
-
-
-
-
-
-
Greater than 90 days
-
-
-
-
-
-
-
-
-
Total past due
-
-
-
-
-
-
-
-
-
Current
85,785
26,705
6,915
11,938
2,491
726
86,879
16,545
237,984
Total
$
85,785
$
26,705
$
6,915
$
11,938
$
2,491
$
726
$
86,879
$
16,545
$
237,984
Greater than 90 days
and accruing
$
-
$
-
$
-
$
-
$
-
$
-
$
-
$
-
$
-
Consumer
30-59 days
$
-
$
-
$
-
$
-
$
-
$
-
$
30
$
-
$
30
60-89 days
-
-
2
-
5
-
-
-
7
Greater than 90 days
-
-
-
-
-
-
-
-
-
Total past due
-
-
2
-
5
-
30
-
37
Current
7,917
1,347
2,641
265
137
6
51,386
-
63,699
Total
$
7,917
$
1,347
$
2,643
$
265
$
142
$
6
$
51,416
$
-
$
63,736
Greater than 90 days
and accruing
$
-
$
-
$
-
$
-
$
-
$
-
$
-
$
-
$
-
Total
30-59 days
$
4,313
$
8,651
$
-
$
1,190
$
-
$
1,049
$
2,844
$
-
$
18,047
60-89 days
-
55
2
-
5
-
980
430
1,472
Greater than 90 days
-
263
7
6
1,383
12
7,681
-
9,352
Total past due
4,313
8,969
9
1,196
1,388
1,061
11,505
430
28,871
Current
1,498,559
971,900
457,702
252,151
176,409
154,968
1,653,282
178,887
5,343,858
Total
$
1,502,872
$
980,869
$
457,711
$
253,347
$
177,797
$
156,029
$
1,664,787
$
179,317
$
5,372,729
Greater than 90 days
and accruing
$
-
$
159
$
7
$
-
$
-
$
-
$
584
$
-
$
750
31
Non-accrual Loan Analysis
Non-accrual loans are loans for which the Company does not record interest
income. The accrual of interest on loans is discontinued at the time the loan is 90 days past due
unless the credit is well secured and in process of collection. Past due status is based on
contractual terms of the loan. In all cases, loans are placed on non-accrual or
charged off at
an earlier date, if collection of principal or interest is considered doubtful. Loans
are returned to accrual status when all the principal and interest amounts contractually due
are
brought current and future payments are reasonably assured. The following
tables present the Company’s non
-accrual loans by loan segments at March 31, 2023 and December 31,
2022:
As of March 31, 2023
Amortized Cost Basis by Origination Year and On Non-accrual
Amortized Cost Basis
2023
2022
2021
2020
2019
2018 and
Prior
Revolving
loans
Revolving
loans
converted
to term
loans
Total Non-
accrual
Loans
Non-accrual
Loans with no
related
Allowance
(Dollars in thousands)
Commercial and industrial
$
-
$
-
$
-
$
-
$
-
$
11
$
-
$
198
$
209
$
209
Commercial and industrial
lines of credit
-
-
-
-
-
-
6,065
-
6,065
6,065
Energy
-
-
-
-
-
-
558
-
558
558
Commercial real estate
-
-
2,470
-
-
-
-
-
2,470
2,470
Construction and land
development
-
-
-
-
-
-
-
-
-
-
Residential real estate
-
-
-
-
-
-
-
188
188
188
Multifamily real estate
-
-
-
-
-
-
-
-
-
-
Consumer
-
-
-
-
-
-
-
-
-
-
Total
$
-
$
-
$
2,470
$
-
$
-
$
11
$
6,623
$
386
$
9,490
$
9,490
32
As of December 31, 2022
Amortized Cost Basis by Origination Year and On Non-accrual
Amortized Cost Basis
2022
2021
2020
2019
2018
2017 and
Prior
Revolving
loans
Revolving
loans
converted
to term
loans
Total Non-
accrual
Loans
Non-accrual
Loans with no
related
Allowance
(Dollars in thousands)
Commercial and industrial
$
-
$
104
$
-
$
6
$
1,383
$
12
$
-
$
-
$
1,505
$
1,505
Commercial and industrial
lines of credit
-
-
-
-
-
-
6,479
-
6,479
6,479
Energy
-
-
-
-
-
-
618
-
618
618
Commercial real estate
-
2,479
-
-
-
-
-
-
2,479
2,479
Construction and land
development
-
-
-
-
-
-
-
-
-
-
Residential real estate
-
-
-
-
-
-
-
191
191
191
Multifamily real estate
-
-
-
-
-
-
-
-
-
-
Consumer
-
-
-
-
-
-
-
-
-
-
Total
$
-
$
2,583
$
-
$
6
$
1,383
$
12
$
7,097
$
191
$
11,272
$
11,272
Interest income recognized on non-accrual loans was $
0.5
million and $
0.2
million for the three months ended March 31, 2023 and 2022, respectively.
33
Allowance for Credit Losses

The following table presents the activity in the allowance for credit losses and

allowance for credit losses on off-balance sheet credit exposures by portfolio
loan segment for the
three months ended March 31, 2023:
For the Three Months Ended March 31, 2023
Commercial
and Industrial
Commercial
and
Industrial
Lines of
Credit
Energy
Commercial
Real Estate
Construction
and Land
Development
Residential
Real Estate
Multifamily
Real Estate
Consumer
Total
(Dollars in thousands)
Allowance for Credit Losses:
Beginning balance
$
12,272
$
14,531
$
4,396
$
19,504
$
5,337
$
3,110
$
2,253
$
372
$
61,775
Charge-offs
(1,642)
-
-
-
-
-
-
-
(1,642)
Recoveries
-
-
-
-
-
-
-
1
1
Provision (release)
1,392
676
283
1,259
437
(49)
627
371
4,996
Ending balance
$
12,022
$
15,207
$
4,679
$
20,763
$
5,774
$
3,061
$
2,880
$
744
$
65,130
Allowance for Credit Losses on Off-Balance Sheet Credit Exposures:
Beginning balance
$
245
$
74
$
787
$
700
$
6,830
$
35
$
14
$
3
$
8,688
Provision (release)
(71)
213
(246)
12
(506)
16
(5)
12
(575)
Ending balance
$
174
$
287
$
541
$
712
$
6,324
$
51
$
9
$
15
$
8,113
34
2024:

For the Three Months Ended March 31, 2024

Commercial

Commercial

Real Estate

Real Estate

Commercial

Owner-

Non-owner-

Residential


and Industrial


Energy


Occupied


Occupied


Real Estate


Consumer


Total

(Dollars in thousands)

Allowance for Credit Losses:


Beginning balance

$

32,244

$

3,143

$

6,445

$

28,130

$

3,456

$

44

$

73,462

Charge-offs


(786)


(848)


(1,634)

Recoveries


55


118


173

Provision (release)


2,308


(92)


(60)


707


10


(18)


2,855

Ending balance

$

33,821

$

3,169

$

6,385

$

27,989

$

3,466

$

26

$

74,856

Allowance for Credit Losses on Off-Balance Sheet Credit Exposures:


Beginning balance

$

954

$

149

$

125

$

5,096

$

89

$

$

6,413

Provision (release)


54


(149)


(36)


(1,076)


6


1


(1,200)

Ending balance

$

1,008

$

$

89

$

4,020

$

95

$

1

$

5,213

The ACL balance increased $

2.8
$1.4 million during the quarter.
Provision expensequarter ended March 31, 2024 and included provision of $
4.4
$2.9million was driven bydue to loan growth partially offset by improvementand an increase in qualitative
factors, in part
specific reserves. Net charge-offs were $1.5 million, primarily due to continued improvement in credit quality.
In addition, $
1.6
million in charge-offs on two commercial and industrial loans, offsettwo commercial real estate – non-owner-occupied loans and one credit card account. One of the provision expensecharge-offs on commercial real estate – non-owner-occupied loans was a partial charge-off of a commercial construction non-accrual credit that moved to foreclosed assets held for
sale during the quarter.
The
reserve on unfunded commitments decreased $
0.6
1.2 million due to higher line utilizationa decrease in the quarter.unfunded commitments.

22

The following table presents the Company’s gross charge-offs by year of origination

for the three months ended March 31, 2023:
For the Quarter Ended March 31, 2023
Gross Charge-offs by Origination Year
Gross Charge-offs
2023
2022
2021
2020
2019
2018 and
Prior
Revolving
loans
Revolving
loans
converted
to term
loans
Gross
Charge-
offs
(Dollars in thousands)
Commercial and industrial
$
-
$
-
$
70
$
-
$
-
$
1,347
$
-
$
225
$
1,642
Commercial and industrial lines of credit
-
-
-
-
-
-
-
-
-
Energy
-
-
-
-
-
-
-
-
-
Commercial real estate
-
-
-
-
-
-
-
-
-
Construction and land development
-
-
-
-
-
-
-
-
-
Residential real estate
-
-
-
-
-
-
-
-
-
Multifamily real estate
-
-
-
-
-
-
-
-
-
Consumer
-
-
-
-
-
-
-
-
-
Total
$
-
$
-
$
70
$
-
$
-
$
1,347
$
-
$
225
$
1,642
35
2024:

As of March 31, 2024

Gross Charge-offs by Origination Year

Gross Charge-offs

Revolving

loans

converted

Gross

2019 and

Revolving

to term

Charge-

2024

2023

2022

2021

2020

 Prior

loans

loans

offs

(Dollars in thousands)

Commercial and industrial


$


$


$


$


$

24


$


$

584


$

178


$

786

Energy


Commercial real estate - owner-occupied


Commercial real estate - non-owner-occupied


163


685


848

Residential real estate


Consumer


Total

$

$

$

163

$

$

24

$

$

584

$

863

$

1,634

Collateral Dependent Loans:

Collateral dependent loans are loans for which the repayment is expected to be provided

substantially through the operation or
sale of the collateral and the borrower is experiencing financial difficulty. The following
table presents tables present the amortized cost balance of
loans considered collateral dependent by loan segment and collateral type
as of March 31, 20232024 and December 31, 2022:2023:

As of March 31, 2024

Amortized Cost of

Collateral

Amortized Cost of

Related Allowance

Dependent Loans

Collateral

for

with no related

Loan Segment and Collateral Description


Dependent Loans


Credit Losses


Allowance


(Dollars in thousands)

Commercial and industrial


All business assets

$

10,822

$

2,926

$

5,688

Energy


Oil and natural gas properties


198


198

Commercial real estate - owner-occupied


Commercial real estate properties


336


336

Commercial real estate - non-owner-occupied


Commercial real estate properties


550


16


Residential real estate


Residential real estate properties


176


176

$

12,082

$

2,942

$

6,398

23

As

As of December 31, 2023

Amortized Cost of

Collateral

Amortized Cost of

Related Allowance

Dependent Loans

Collateral

for

with no related

Loan Segment and Collateral Description


Dependent Loans


Credit Losses


Allowance


(Dollars in thousands)

Commercial and industrial


All business assets

$

9,308

$

1,392

$

6,198

Energy


Oil and natural gas properties


288


288

Commercial real estate - owner-occupied


Commercial real estate properties


204


204

Commercial real estate - non-owner-occupied


Commercial real estate properties


8,440


571


1,698

Residential real estate


Residential real estate properties


179


179

Consumer


Vehicles & other personal assets


$

18,419

$

1,963

$

8,567

Loan Modifications

The Company considers loans to borrowers experiencing financial difficulties to be troubled loans and is required to evaluate whether loan modifications represent a new loan or a continuation of an existing loan. Such troubled debt modifications (“TDMs”) may include principal forgiveness, interest rate reductions, other-than-insignificant-payment delays, term extensions or any combination thereof.

The Company modified 12 loans that are considered TDMs in the preceding twelve months ended March 31, 2024, including six loans in the current quarter, with an amortized cost basis at March 31, 2024 of $15.3 million to facilitate repayment. The following table presents, by loan segment, the amortized cost basis as of the date shown for modified loans to borrowers experiencing financial difficulty:

March 31, 2024

Term Extension

Amortized Cost Basis

% of Loan Class

(Dollars in thousands)

Commercial and industrial


$

7,272


0.33

%

Commercial real estate - owner-occupied


4,568


0.79

Commercial real estate - non-owner-occupied

3,236

0.12

Residential real estate

253

0.05

Total Loans

$

15,329

The following schedule presents the payment status by loan segment, as of March 31, 2023

Loan Segment and Collateral Description
Amortized Cost2024, of
Collateral Dependent
Loans
Related Allowance for
Credit Losses
Amortized Cost the amortized cost basis of
Collateral Dependent
Loans with no related
Allowance
(Dollars in thousands)
Commercial and Industrial Lines of Credit
All business assets
6,065
-
6,065
Energy
Oil and natural gas properties
558
-
558
Consumer
Vehicles & other personal assets
5
5
-
$
6,628
$
5
$
6,623
As of December 31, 2022
Loan Segment and Collateral Description
Amortized Cost of
Collateral Dependent
Loans
Related Allowance for
Credit Losses
Amortized Cost of
Collateral Dependent
Loans with no related
Allowance
(Dollars in thousands)
Commercial and Industrial
All business assets
$
1,489
$
-
$
1,489
Commercial and Industrial Lines of Credit
All business assets
6,492
-
6,492
Energy
Oil and natural gas properties
618
-
618
Commercial Real Estate
Commercial real estate properties
92
-
92
Consumer
Vehicles & other personal assets
39
22
-
$
8,728
$
22
$
8,689
Troubled Debt Restructurings
TDRs are those extended to borrowers who are experiencing financial
difficulty and who loans that have been granted a concession,modified since April 1, 2023:

Balance at March 31, 2024

30-59 Days

60-89 Days

Greater than 90

Total

Current

Past Due

Past Due

Days Past Due

Past Due

(Dollars in thousands)

Commercial and industrial


$

7,022


$

250


$


$


$

250

Commercial real estate - owner-occupied


64


4,504


4,504

Commercial real estate - non-owner-occupied

3,236

Residential real estate

253

Total Loans

$

10,575

$

4,754

$

$

$

4,754

excluding loan modifications as a result

24

maturity, reduction or deferment of monthly payment, or reduction of the
stated interest rate. Effective January 1, 2023, the Company
adopted ASU 2022-02, which eliminates the accounting guidance for TDRs.

The Company adopted this accounting standardhad no TDMs that were modified and had defaulted on a

prospective basis.
The outstanding balance of TDRs recognized prior to the adoption of ASU 2022-02 was $
28.7
million and $
30.5
million as of
March 31, 2023 and December 31, 2022, respectively. Under the new
guidance, there were
no
loans restructured that qualified as
modifications fortheir modified terms during the three months ended March 31, 2023.
2024. For purposes of this disclosure, the Company considers “default” to mean 90 days or more past due on principal or interest. The allowance for credit losses related to TDMs on non-accrual status is determined by individual evaluation, including collateral adequacy, using the same process as loans on non-accrual status which are not classified as TDMs.

The following schedule presents the financial effect of the modifications made to borrowers experiencing financial difficulty as of March 31, 2024:

March 31, 2024

Financial Effect

Term Extension

Commercial and industrial

Added a weighted average 1.1 years to the life of loan, which reduced monthly payment amounts

Commercial real estate - owner-occupied

Added a weighted average 0.5 years to the life of loan, which reduced monthly payment amounts

Commercial real estate - non-owner-occupied

Added a weighted average 0.5 years to the life of loan, which reduced monthly payment amounts

Residential real estate

Added a weighted average 0.4 years to the life of loan, which reduced monthly payment amounts

Allowance for Credit Losses on Off-Balance Sheet Credit Exposures

The Company estimates expected credit losses for off-balance sheet credit

exposures unless the obligation is unconditionally
cancellable by the Company. The ACL on off-balance sheet credit exposures is adjusted as a provision (release) for credit loss expense. The
estimate is calculated for each loan segment and includes consideration of the
likelihood that funding will occur and an estimate of the
36
expected credit losses on commitments expected to be funded over its estimated life.
For each pool of contractual obligations expected
to be funded, the Company uses the reserve rate established for the related
loan pools. The $
8
$5 million and $
9
$6 million allowance for
credit losses on off-balance sheet credit exposures at March 31, 2023
2024 and December 31, 2022,2023, respectively, are included in “interest
payable and other liabilities” on the statements of financial condition.

The following categories of off-balance sheet credit exposures have been identified:

Loan commitments – include revolving lines of credit, non-revolving lines of credit, and loans approved that are not yet funded. Risks inherent to revolving lines of credit often are related to the susceptibility of an individual or business experiencing unpredictable cash flow or financial troubles, thus leading to payment default. The primary risk associated with non-revolving lines of credit is the diversion of funds for other expenditures.
Letters of credit – are primarily established to provide assurance to the beneficiary that the applicant will perform certain obligations arising out of a separate transaction between the beneficiary and applicant. If the obligation is not met, it gives the beneficiary the right to draw on the letter of credit.
identified:
Loan commitments – include revolving lines of credit, non-revolving lines
of credit, and loans approved that are not yet funded. Risks
inherent to revolving lines of credit often are related to the susceptibility of an
individual or business experiencing unpredictable cash
flow or financial troubles, thus leading to payment default. The primary risk associated
with non-revolving lines of credit is the
diversion of funds for other expenditures.
Letters of credit – are primarily established to provide assurance to the beneficiary
that the applicant will perform certain obligations
arising out of a separate transaction between the beneficiary and applicant.
If the obligation is not met, it gives the beneficiary the right
to draw on the letter of credit.

Note 4:

Leases

The Company’s leases primarily include bank branches located in

Kansas City, Missouri; Tulsa, Oklahoma; Dallas, Texas; Frisco,
Texas; Fort Worth, Texas; Phoenix, Arizona;
Denver, ColoradoColorado; and Colorado Springs, Colorado. The remaining lease terms on these branch
leases range
from less than
one year
two years to
nineteen 18 years
with certain options to renew. Renewal terms can extend the lease term between
five years
and
twenty years
. 20 years. The exercise of lease renewal options is at the Company’s sole discretion. When it is reasonably certain
that the Company
will exercise its option to renew or extend the lease term, that option is included
in the estimated value of the right of use (“ROU”) asset
and lease liability. The Company’s lease agreements do not contain any material residual
value guarantees or material restrictive covenants.

covenants.

25

As of March 31, 2023,2024, the Company recognized one finance lease and the

remaining Company leases arewere classified as
operating leases.

The ROU asset is included in “other“Other assets” on the consolidated statements of

financial condition, and was $
29.6
$29 million and
$
30.5
$30 million at March 31, 20232024 and December 31, 2022,2023, respectively. Certain adjustments
to the ROU asset may be required for items
such as initial direct costs paid or incentives received. The lease liability is located in “Interest payable
and other liabilities” on the
consolidated statements of financial condition and was $
33
$33 million and $
34
$34 million at March 31, 20232024 and December 31, 2022,
2023, respectively.

As of March 31, 2023,2024, the remaining weighted-average lease term is

11.4
was 10.5 years, and the weighted-average discount rate was
2.54
% 2.77% utilizing the Company’s incremental Federal Home Loan Bank (“FHLB”)
borrowing rate for borrowings of a similar term at the
date of lease commencement.

The following table presents components of operating lease expense in

the accompanying consolidated statements of operations
for the three-month periodperiods ended March 31, 2024 and 2023:
For the Three Months Ended March 31,
2023
2022
(Dollars in thousands)
Finance lease amortization of right-of-use asset
$
70
$
-
Finance lease interest on lease liability
69
-
Operating lease expense
732
726
Variable lease expense
393
213
Short-term lease expense
5
5
Total lease expense
$
1,269
$
944
37

Three Months Ended March 31, 

2024

2023

(Dollars in thousands)

Finance lease amortization of right-of-use asset

$

73

$

70

Finance lease interest on lease liability


66


69

Operating lease expense


862


732

Variable lease expense


339


393

Short-term lease expense


6


5

Total lease expense

$

1,346

$

1,269

Future minimum commitments due under these lease agreementsoperating and finance leases as of

March 31, 2023 are2024 were as follows:
Operating Leases
Finance Lease
(Dollars in thousands)
Remainder of 2023
$
2,821
$
367
2024
3,289
490
2025
3,309
490
2026
3,350
490
2027
3,340
528
Thereafter
12,619
8,296
Total lease payments
$
28,728
$
10,661
Less imputed interest
3,350
3,095
Total
$
25,378
$
7,566

Operating Leases

Finance Leases

(Dollars in thousands)

2024


$

2,815


$

367

2025


3,806


490

2026


3,852


490

2027


3,847


528

2028


3,427


540

Thereafter


10,750


7,705

Total lease payments


28,497


10,120

Less: imputed interest


2,775


2,776

Total

$

25,722

$

7,344

Supplemental cash flow information

Operating cash flows paid for operating lease amountsleases included in the measurement

of
lease liabilities were $
0.9
$1.0 million and $
0.7
$0.9million, respectively, for the three months ended March 31, 20232024 and 2022, respectively.2023. Operating
cash
flows paid for finance lease amounts included in the measurement of
lease liabilities was were $
0.1
million for the three-month periodthree months ended
March 31, 2024 and 2023. During the three months ended March 31, 2023,2024, the Company
did
no
tnot record any ROU assets that were exchanged for
operating lease liabilities.

Note 5:

Goodwill and Core Deposit Intangible

Goodwill is measured as the excess of the fair value of consideration paid over the

fair value of net assets acquired. In accordance
with GAAP, the Company performs annual tests to identify impairment
of goodwill and more frequently if events or circumstances
indicate a potential impairment may exist.
No
goodwill impairment was recorded during the three months ended March 31, 2023.2024.

As a result

26

goodwill impairment test as of March 31, 2023. A qualitative analysis was performed,
and the Company does not believe it is more
likely than not that a goodwill impairment exists.

The Company is amortizing the core deposit intangible (“CDI”) from the

Farmers & Stockmens (“Central”) acquisition over its
estimated useful life of approximately
10
years from the date of each respective acquisition using the sum of the years’ digits accelerated method. The Company recognized core
deposit intangible amortization expense of $
0.8
million for the three months ended March 31, 2023.

The gross carrying amount of goodwill and the gross carrying amount and

accumulated amortization of the CDI at March 31,
2023 2024 and December 31, 20222023 were:
Gross Carrying
Amount
Accumulated
Amortization
Net Carrying
Amount
(Dollars in thousands)
March 31, 2023
Goodwill
$
12,836
$
-
$
12,836
Core deposit intangible
17,479
2,056
15,423
Total goodwill and intangible assets
$
30,315
$
2,056
$
28,259
December 31, 2022
Goodwill
$
12,836
$
-
$
12,836
Core deposit intangible
17,479
1,234
16,245
Total goodwill and intangible assets
$
30,315
$
1,234
$
29,081
38

Gross Carrying

Accumulated 

Net Carrying

Amount

Amortization

Amount

(Dollars in thousands)

March 31, 2024


Goodwill

$

14,135

$

$

14,135

Core deposit intangible


21,938


5,669


16,269

Total goodwill and intangible assets

$

36,073

$

5,669

$

30,404

December 31, 2023


Goodwill

$

14,135

$

$

14,135

Core deposit intangible

21,938


4,738


17,200

Total goodwill and intangible assets

$

36,073

$

4,738

$

31,335

The following table shows the estimated aggregate future amortization expense over the next five years for

the CDI is as offollows at March 31, 2023:
Amount
Years ending December 31,
(Dollars in thousands)
For the nine months ending December 31, 2023
$
2,286
For the year ending December 31, 2024
2,762
For the year ending December 31, 2025
2,436
For the year ending December 31, 2026
2,109
For the year ending December 31, 2027
1,783
2024:

(Dollars in thousands)


For the nine months ending December 31, 2024

$

2,638

For the year ending December 31, 2025


3,155

For the year ending December 31, 2026


2,739

For the year ending December 31, 2027


2,325

For the year ending December 31, 2028


1,909

Note 6:

Derivatives and Hedging

The Company is exposed to certain risks arising from both its business operations and

economic conditions, including interest
rate, liquidity, and
credit risk. The Company uses derivative financial instruments as part of its risk management
activities to manage
exposures that arise from business activities that result in the receipt or payment
of future known and uncertain cash amounts, the value
of which are determined by interest rates.

Cash Flow Hedges of Interest Rate Risk

The Company uses interest rate derivatives to add stability to interest income

and expense and to manage its exposure to interest
rate movements. To
accomplish this objective, the Company usesmay utilize interest rate swaps, including forwards, interest rate caps, floors, collars, corridors and swaptions as part of its interest rate risk management strategy. During the first quarter of 2024, the Company utilized interest rate swaps and collars as part of its interest
rate risk
management strategy.
a collar to hedge the variable cash flows associated with existing variable-rate debt and loan assets. Interest rate swaps designated as cash flow hedges involve the receipt of variable amounts
from a counterparty in
exchange for the Company making fixed-rate payments over the life
of the agreements without exchange of the underlying notional
amount. Interest rate collars designated as cash flow hedges involve
payments of variable-rate amounts if interest rates rise above the
cap strike rate on the contract and the receipt of variable-rate amounts
if interest rates fall below the floor strike rate on the contract.
During 2023, such derivativesthe first quarter of 2024, two cash flow hedges matured and two cash flow hedges were used to hedge the variable cash flows associated
with existing variable-rate loan assets.
The five
swaps that were entered into in 2021 were terminated during the third quarter
of 2022, however, the amortization of the gains
on these
instruments will start in 2023 based on the original effective dates
of these swaps.terminated. Derivatives designated and that qualify as cash flow
hedges and are designated as such include
one
instrument with a total notional amountvalue of $
250
$250 million at March 31, 20232024, and five instruments with a total notional value of $340 million at December 31, 2022.
2023.

For derivatives designated and that qualify as cash flow hedges of interest rate

risk and are designated as such, the gain or loss on the derivative is recorded
in Accumulated Other Comprehensive Income (Loss)Loss (“AOCI”) and subsequently reclassified into interest
income or expense in the
same period(s) during which the hedged transaction affects earnings. Amounts reported

27

in AOCI related to derivatives will be

reclassified to interest income and expense as interest payments are received
and made on the Company’s variable-rate assets and
liabilities. The derivative financial instruments did not impact the statements of operations
for the three months ended March 31, 2023.
debt. The Company currently estimates that $
0.2
$3.3 million will be reclassified as a net decrease to net interest income during the next twelve months.
These reclassifications are for active hedges, as well as amounts related to five hedged swaps that were terminated in 2022 and the two hedged swaps terminated in the first quarter of 2024, that continue to be recognized based on the original effective dates of the hedged swaps.

The Company is hedging its exposure to the variability in future cash flows for forecasted

transactions over a maximum period of
6.1
2.8 years.

Non-designated Hedges

Derivatives not designated as hedges are not speculative and result from

a service provided to clients. The Company executes
interest rate swaps with customersclients to facilitate their respective risk management
strategies. Those interest rate swaps are simultaneously
hedged by offsetting derivatives that the Company executes with a third-party,
such that the Company minimizes its net risk exposure
resulting from such transactions. Interest rate derivatives associated
with this program do not meet the strict hedge accounting
requirements and changes in the fair value of both the customerclient derivatives
and the offsetting derivatives are recognized directly in
earnings.

Swap fees earned upon origination and credit valuation adjustments that represent

the risk of a counterparty’s default are reported
on the consolidated statements of operations as swap fee income, net. The effect of the Company’s derivative financial
instruments gain (loss) is
reported on the consolidated statements of cash flows within “other assets” and “other liabilities”.
39
These
50
and
49

The Company had 46 swaps hadoutstanding with an aggregate notional amount of $

417
$323 million and $
421
$307 million at March 31, 20232024 and December 31,
2022, 2023, respectively.
Fair Values
of Derivative Instruments on the Statements of Financial Condition

The table below presents the fair value of the Company’s derivative financial

instruments and their classification on the
Statements consolidated statements of Financial Conditionfinancial condition as of March 31, 20232024 and December
31, 2022:2023:

Asset Derivatives

Liability Derivatives

Statement of

Statement of

Financial

Financial

Condition

March 31, 

December 31, 

Condition

March 31, 

December 31, 

Location

2024

2023

Location

2024

2023

(Dollars in thousands)

Interest rate products:


Derivatives designated as hedging instruments


Other assets and Interest receivable

$

$

101


Interest payable and other liabilities

$

8,083

$

5,992

Derivatives not designated as hedging instruments


Other assets and Interest receivable

9,366

7,830


Interest payable and other liabilities

9,366

7,837

Total


$

9,366

$

7,931


$

17,449

$

13,829

28

Asset Derivatives
Liability Derivatives
Statement of
Financial
Condition
March 31,
December 31,
Statement of
Financial
Condition
March 31,
December 31,
Location
2023
2022
Location
2023
2022
(Dollars in thousands)
Interest rate products:
Derivatives
designated as hedging
instruments
Other assets
$
-
$
-
Interest payable
and other
liabilities
$
3,883
$
5,403
Derivatives not
designated as hedging
instruments
Other assets
7,907
11,038
Interest payable
and other
liabilities
7,908
11,039
Total
$
7,907
$
11,038
$
11,791
$
16,442

The tabletables below presentspresent the effect of cash flow hedge accounting on Accumulated Other Comprehensive Income

(Loss)AOCI for the
three months ended March 31, 20232024 and 2022.
For the Three Months Ended
March 31, 2023
March 31, 2022
Location of
Gain or (Loss)
Recognized
from
Accumulated
Other
Comprehensive
Income into
Income
Gain or
(Loss)
Recognized
in OCI on
Derivative
Gain or
(Loss)
Recognized
in OCI
Included
Component
Gain or
(Loss)
Recognized
in OCI
Excluded
Component
Gain or
(Loss)
Recognized
in OCI on
Derivative
Gain or
(Loss)
Recognized
in OCI
Included
Component
Gain or
(Loss)
Recognized
in OCI
Excluded
Component
(Dollars in thousands)
Derivatives in Cash Flow Hedging Relationships:
Interest Rate Products
Interest Expense
1,540
1,540
-
2,655
2,655
-
Total
$
1,540
$
1,540
$
-
$
2,655
$
2,655
$
-
2023.

March 31, 2024

Location of

Gain or 

Gain or 

Gain or (Loss)

(Loss)

(Loss)

Recognized

Gain or 

Reclassified

Reclassified

from

Gain or

Gain or 

(Loss)

from

from

Accumulated 

Gain or

(Loss)

(Loss)

Reclassified

Accumulated

Accumulated

Other

(Loss)

Recognized

Recognized

from

OCI into

OCI into

Comprehensive

Recognized

in OCI

in OCI

Accumulated

Earnings

Earnings

Income into

in OCI on

Included

Excluded

OCI into

Included

Excluded

Earnings

Derivative


Component


Component


Earnings


Component


Component

(Dollars in thousands)

Derivatives in Cash Flow Hedging Relationships


Interest Rate Products

Interest Income

$

(3,215)

$

(3,215)

$


$

(1,124)

$

(1,124)

$

Interest Rate Products

Interest Expense


10


10


196


196


Total


$

(3,205)

$

(3,205)

$


$

(928)

$

(928)

$

March 31, 2023

Location of

Gain or 

Gain or 

Gain or (Loss)

(Loss)

(Loss)

Recognized

Gain or 

Reclassified

Reclassified

from

Gain or

Gain or 

(Loss)

from

from

Accumulated 

Gain or

(Loss)

(Loss)

Reclassified

Accumulated

Accumulated

Other

(Loss)

Recognized

Recognized

from

OCI into

OCI into

Comprehensive

Recognized

in OCI

in OCI

Accumulated

Earnings

Earnings

Income into

in OCI on

Included

Excluded

OCI into

Included

Excluded

Earnings

Derivative


Component


Component


Earnings


Component


Component

(Dollars in thousands)

Derivatives in Cash Flow Hedging Relationships

Interest Rate Products

Interest Expense

$

1,540

$

1,540

$


$

$

$

Total


$

1,540

$

1,540

$


$

$

$

As of March 31, 20232024 and December 31, 2022,2023, the Company had minimum

collateral thresholds with certain of its derivative
counterparties and hashad pledged collateral of $1.1 million and $1.0 million, respectively, and received collateral of $
3.6
$0.6 million and $
4.9
$1.5 million, respectively.
40

Note 7:

Time Deposits and Borrowings

The scheduled maturities, excluding interest, of the Company’s borrowings at

March 31, 20232024 were as follows:

As of March 31, 2024

Within One

One to Two

Two to Three

Three to

Four to Five

After Five


Year


Years


Years


Four Years


Years


Years


Total

(Dollars in thousands)

Time deposits

$

1,662,674

$

170,867

$

1,305

$

1,500

$

790

$

$

1,837,136

FHLB borrowings


1,549


11,291


50,000


15,000


77,840

SBA secured borrowing


7,778


7,778

Trust preferred securities(1)


1,133


1,133

Total

$

1,664,223

$

182,158

$

1,305

$

51,500

$

15,790

$

8,911

$

1,923,887

(1)The contract value of the trust preferred securities is $2.6 million and is currently being accreted to the maturity date of 2035.
March 31, 2023
Within One
Year
One to Two
Years
Two to
Three Years
Three to
Four Years
Four to Five
Years
After Five
Years
Total
(Dollars in thousands)
Time deposits
$
1,153,933
$
215,690
$
2,084
$
1,356
$
2,964
$
-
$
1,376,027
FHLB borrowings
37,573
1,598
11,423
-
60,000
20,000
130,594
FHLB line of credit
183,437
-
-
-
-
-
183,437
Line of credit
7,500
-
-
-
-
-
7,500
SBA secured borrowing
-
-
-
-
-
9,396
9,396
Trust preferred securities
(1)
-
-
-
-
-
1,074
1,074
$
1,382,443
$
217,288
$
13,507
$
1,356
$
62,964
$
30,470
$
1,708,028

29

(1)
The contract value of the trust preferred securities is $
2.6
million and is currently being accreted to the maturity date of 2035.
Note 8:
Income Tax
An income tax expense reconciliation at the statutory rate to the Company’s
actual income tax expense is shown below:
Three Months Ended
March 31,
2023
2022
(Dollars in thousands)
Computed at the statutory rate (21%)
$
4,227
$
4,413
Increase (decrease) resulting from
Tax-exempt income
(880)
(854)
Non-deductible expenses
93
82
State income taxes
632
696
Equity based compensation
(45)
(169)
Other adjustments
(6)
20
Actual tax expense
$
4,021
$
4,188
The tax effects of temporary differences related to deferred taxes located
in “other assets” on the consolidated statements of
financial condition are presented below:
March 31, 2023
December 31, 2022
(Dollars in thousands)
Deferred tax assets
Net unrealized loss on securities available-for-sale
$
16,285
$
20,295
Allowance for credit losses
17,372
16,710
Lease incentive
438
451
Loan fees
4,070
4,048
Accrued expenses
1,303
3,379
Deferred compensation
1,735
2,166
Other
1,433
1,469
Total deferred tax asset
42,636
48,518
Deferred tax liability
FHLB stock basis
(394)
(436)
Premises and equipment
(1,934)
(2,042)
Other
(938)
(1,018)
Total deferred tax liability
(3,266)
(3,496)
Net deferred tax asset
$
39,370
$
45,022
41

Note 9:

8:   Change in Accumulated Other Comprehensive Income (Loss)
Loss

Amounts reclassified from AOCI and the affected line items in the consolidated statements of operations during the

three months
ended March 31, 2023 and 2022, were as follows:
Three Months Ended
March 31,
Affected Line Item in the
2023
2022
Statements of Operations
(Dollars in thousands)
Unrealized gains (losses) on available-for-sale securities
$
63
$
(26)
Gain (loss) on sale of available-
for-sale securities
Less: tax expense (benefit) effect
15
(6)
Income tax expense (benefit)
Net reclassified amount
$
48
$
(20)

Three Months Ended March 31, 

Affected Line Item in the


2024


2023


Statements of Operations

(Dollars in thousands)

Realized gain on available-for-sale securities

$

2

$

63

Other non-interest income

Less: tax expense effect


15

Income tax expense

Realized gain on available-for-sale securities, net of income tax

2

48

Loss on cash flow hedges

(1,124)

Interest income - Loans

Gain on cash flow hedges

196

Interest expense - Deposits

Less: tax benefit effect

(214)

Income tax expense

Net loss on cash flow hedges, net of tax

(714)

Total reclassified amount

$

(712)

$

48


Note 10:

9:   Regulatory Matters

The Company and the Bank are subject to various regulatory capital requirements

administered by the federal banking agencies.
Failure to meet minimum capital requirements can initiate certain mandatory
and possibly additional discretionary actions by regulators
that, if undertaken, could have a direct material effect on the Company’s
consolidated financial statements. Management believes that,
as of March 31, 2023,2024, the Company and the Bank met all capital adequacy requirements
to which they are subject.

The capital rules require the Company to maintain a

2.5
% 2.5% capital conservation buffer with respect to Common Equity Tier I
capital, Tier I capital to risk-weighted assets, and total capital to risk-weighted assets, which
is included in the column “Required to be
Considered Adequately Capitalized” within the table below. A financial institution with a conservation buffer of less than the required
amount is subject to limitations on capital distributions, including dividend
payments and stock repurchases, as well as certain
discretionary bonus payments to executive officers.

The Company and the Bank opted to exclude AOCI from the regulatory capital calculations. As a result, changes in AOCI, net of

tax, do not impact the Company’s or Bank’s regulatory capital ratios.

30

42

The Company’s and the Bank’s actual capital amounts and ratios as of March

31, 20232024 and December 31, 20222023 are presented in
the following table:


Required to be Considered


Required to be Considered


Actual

Well Capitalized

Adequately Capitalized(1)


Amount


Ratio


Amount


Ratio


Amount


Ratio


(Dollars in thousands)


March 31, 2024


Total Capital to Risk-Weighted Assets


Consolidated

$

825,110


11.4

N/A


N/A

$

761,189


10.5

%

Bank


806,893


11.1

$

724,451


10.0

%  


760,673


10.5

Tier 1 Capital to Risk-Weighted Assets


Consolidated


745,321


10.3


N/A


N/A


616,201


8.5

Bank


727,104


10.0


579,561


8.0


615,783


8.5

Common Equity Tier 1 to Risk-Weighted Assets


Consolidated


736,438


10.2


N/A


N/A


507,460


7.0

Bank


727,104


10.0


470,893


6.5


507,116


7.0

Tier 1 Capital to Average Assets


Consolidated


745,321


10.1


N/A


N/A


295,231


4.0

Bank

$

727,104


9.9

%  

$

369,073


5.0

%  

$

295,258


4.0

%

December 31, 2023


Total Capital to Risk-Weighted Assets


Consolidated

$

807,018


11.2

N/A


N/A

$

756,285


10.5

%

Bank


800,522


11.1

$

719,705


10.0

%  


755,691


10.5

Tier 1 Capital to Risk-Weighted Assets


Consolidated


727,723


10.1


N/A


N/A


612,231


8.5

Bank


721,227


10.0


575,764


8.0


611,750


8.5

Common Equity Tier 1 to Risk-Weighted Assets


Consolidated


718,855


10.0


N/A


N/A


504,190


7.0

Bank


721,227


10.0


467,809


6.5


503,794


7.0

Tier 1 Capital to Average Assets


Consolidated


727,723


10.0


N/A


N/A


292,517


4.0

Bank

$

721,227


9.9

%  

$

365,675


5.0

%  

$

292,540


4.0

%

(1)Represents the minimum capital required for capital adequacy under Basel III. Includes capital conservation buffer of 2.5%.

31

Actual
Required to be Considered
Well Capitalized
Required to be Considered
Adequately Capitalized
(1)
Amount
Ratio
Amount
Ratio
Amount
Ratio
(Dollars in thousands)
March 31, 2023
Total Capital to Risk-Weighted Assets
Consolidated
$
743,690
10.5
%
N/A
N/A
$
741,502
10.5
%
Bank
745,374
10.6
$
705,775
10.0
%
741,064
10.5
Tier I Capital to Risk-Weighted Assets
Consolidated
670,447
9.5
N/A
N/A
600,264
8.5
Bank
672,131
9.5
564,620
8.0
599,909
8.5
Common Equity Tier 1 to Risk-Weighted Assets
Consolidated
661,622
9.4
N/A
N/A
494,335
7.0
Bank
672,131
9.5
458,754
6.5
494,043
7.0
Tier I Capital to Average Assets
Consolidated
670,447
9.9
N/A
N/A
270,441
4.0
Bank
$
672,131
9.9
%
$
338,128
5.0
%
$
270,502
4.0
%
December 31, 2022
Total Capital to Risk-Weighted Assets
Consolidated
$
715,416
10.5
%
N/A
N/A
$
714,162
10.5
%
Bank
714,300
10.5
$
679,793
10.0
%
713,783
10.5
Tier I Capital to Risk-Weighted Assets
Consolidated
644,953
9.5
N/A
N/A
578,131
8.5
Bank
643,837
9.5
543,835
8.0
577,824
8.5
Common Equity Tier 1 to Risk-Weighted Assets
Consolidated
643,892
9.5
N/A
N/A
476,108
7.0
Bank
643,837
9.5
441,866
6.5
475,855
7.0
Tier I Capital to Average Assets
Consolidated
644,953
10.3
N/A
N/A
249,270
4.0
Bank
$
643,837
10.3
%
$
311,623
5.0
%
$
249,299
4.0
%
(1)
Includes capital conservation buffer of
2.5
%
Note 11:
Stock-Based Compensation
The Company issues stock-based compensation in the form of non-vested
restricted stock, restricted stock units and stock
appreciation rights under the 2018 Omnibus Equity Incentive Plan (as amended,
the “Omnibus Plan”). The Omnibus Plan will expire on
the tenth anniversary of its effective date. In addition, the Company
has an Employee Stock Purchase Plan that was reinstated during the
third quarter of 2020. The aggregate number of shares authorized for future issuance under the
Omnibus Plan is
1,218,970
shares as of
March 31, 2023.
43
The table below summarizes the stock-based compensation for the
three months ended March 31, 2023 and 2022:
Three Months Ended
March 31,
2023
2022
(Dollars in thousands)
Stock appreciation rights
$
99
$
99
Performance-based stock awards
236
211
Restricted stock units and awards
879
778
Employee stock purchase plan
24
27
Total stock-based compensation
$
1,238
$
1,115
Performance-Based Restricted Stock Units
The Company awards performance-based restricted stock units (“PBRSUs”) to key
officers of the Company. The performance-
based shares typically cliff-vest at the end of
three years
based on attainment of certain performance metrics developed by the
Compensation Committee. The ultimate number of shares issuable under each performance
award is the product of the award target and
the award payout percentage given the level of achievement. The award payout percentages
by level of achievement range between
0
%
of target and
150
% of target.
During the three-month period ended March 31, 2023, the Company
granted
128,005
PBRSUs. The performance metrics include
three-year
cumulative earnings per share and relative total shareholder return.
The following table summarizes the status of and changes in the PBRSUs:
Performance-Based Restricted
Stock Unit Awards
Number of Shares
Weighted-Average
Grant Date Fair Value
Unvested, January 1, 2023
134,286
$
14.52
Granted
128,005
14.13
Vested
(20,736)
13.55
Forfeited
(5,335)
14.49
Unvested, March 31, 2023
236,220
$
14.40
Unrecognized stock-based compensation related to the performance
awards issued through March 31, 2023 was $
2.7
million and
is expected to be recognized over
2.5
years.
Restricted Stock Units and Restricted Stock Awards
The Company issues time-based restricted stock units (“RSUs”) and restricted
stock awards (“RSAs”) to provide incentives to
key officers, employees, and non-employee directors. Awards are typically granted annually as determined by
the Compensation
Committee. The service-based RSUs typically vest in equal amounts over three years. The service-based
RSAs typically cliff-vest after
one year
.
The following table summarizes the status of and changes in the RSUs and RSAs:
Restricted Stock Units and Awards
Number of Shares
Weighted-Average
Grant Date Fair Value
Unvested, January 1, 2023
416,980
$
14.13
Granted
264,197
13.96
Vested
(141,857)
14.05
Forfeited
(11,650)
14.28
Unvested, March 31, 2023
527,670
$
14.06

44
Unrecognized stock-based compensation related to the RSUs and RSAs issued through
March 31, 2023 was $
6.3
million and is
expected to be recognized over
2.4
years.

Note 12:

Stock Warrants
The Company had
80,000
outstanding, fully vested warrants to purchase common stock at a strike price
of $
5.00
per share as of
March 31, 2023 and December 31, 2022. The
80,000
warrants expire on April 26, 2023. During the three-month period ended
March 31,
2023,
no
warrants were exercised or issued.
Note 13: Earnings Per Common Share
10:   Stockholders’ Equity

The following table presents the computation of basic and diluted earnings per

common share:
Three Months Ended
March 31,
2023
2022
(Dollars in thousands except per share data)
Earnings per Common Share
Net income available to common stockholders
$
16,108
$
16,828
Weighted average common shares
48,635,910
50,251,297
Earnings per common share
$
0.33
$
0.33
Diluted Earnings per Common Share
Net income available to common stockholders
$
16,108
$
16,828
Weighted average common shares
48,635,910
50,251,297
Effect

Three Months Ended March 31, 


2024


2023

(Dollars in thousands, except per share data)

Earnings per Common Share


Net Income

$

18,223

$

16,108

Less: preferred stock dividends

155

Net income available to common stockholders

18,068

16,108

Weighted average common shares


49,510,808


48,635,910

Earnings per common share

$

0.36

$

0.33

Diluted Earnings per Common Share


Net Income

$

18,223

$

16,108

Less: preferred stock dividends

155

Net income available to common stockholders

18,068

16,108

Weighted average common shares


49,510,808


48,635,910

Effect of dilutive shares


456,830


407,711

Weighted average dilutive common shares


49,967,638


49,043,621

Diluted earnings per common share

$

0.36

$

0.33

Stock-based awards not included because to do so would be antidilutive


281,666


916,080

Dividends of dilutive common shares

407,711
659,193
Weighted average dilutive common shares
49,043,621
50,910,490
Diluted earnings per common share
$
0.33
$
0.33
Stock-based awards not included because to do so would be antidilutive
916,080
285,672
During March 2023, the Company offered and sold shares of its Series A Non-Cumulative Perpetual Preferred Stock, par value
$
0.01
per share, for an aggregate purchase price of $
7.8
million.
No
dividends$155 thousand related to the preferred stockSeries A Preferred Stock were declared orand paid during
the three months ended March 31, 2023.
2024. On May 2, 2024, the Board of Directors declared a quarterly dividend on Series A Preferred Stock in the amount of $20.00 per share to be payable on June 17, 2024 to stockholders of record as of May 31, 2024.

Note 14:

11:   Disclosures about Fair Value of Financial Instruments

Fair value is the price that would be received to sell an asset or paid to transfer a liability

in an orderly transaction between
market participants at the measurement date. Fair value measurements must maximize
the use of observable inputs and minimize the use
of unobservable inputs. There is a hierarchy of three levels of inputs that may be used to measure fair
value:

Level 1

Quoted prices in active markets for identical assets or liabilities.

Level 2

Observable inputs other than Level 1 prices, such as quoted prices for similar assets or liabilities, quoted prices in markets that are not active; or other inputs that are observable or can be corroborated by observable market data for substantially the full term of the assets or liabilities.

Level 3

Unobservable inputs supported by little or no market activity and significant to the fair value of the assets or liabilities.

32

Quoted prices in active markets for identical assets or liabilities.
Level 2
Observable inputs other than Level 1 prices, such as quoted prices for similar
assets or liabilities; quoted prices in
markets that are not active; or other inputs that are observable or can be corroborated
by observable market data for
substantially the full term of the assets or liabilities.
Level 3
Unobservable inputs supported by little or no market activity and significant to
the fair value of the assets or liabilities.
45

Recurring Measurements

The following list presents the assets and liabilities recognized in the accompanying

consolidated statements of financial
condition measured at fair value on a recurring basis and the level within the fair
value hierarchy in which the fair value measurements
fall at March 31, 20232024 and December 31, 2022:
Fair Value Description
Valuation
Hierarchy
Level
Where Fair
Value Balance
Can Be Found
Available-for-
Sale Securities and
CRA Equity Security
Where quoted market prices are available in an active market, securities are
classified within Level 1 of the valuation hierarchy. If quoted market prices
are not available, then fair values are estimated by using quoted prices of
securities with similar characteristics or independent asset pricing services
and pricing models, the inputs of which are market-based or independently
sourced market parameters, including, but not limited to, yield curves,
interest rates, volatilities, prepayments, defaults, cumulative loss projections
and cash flows.
Level 2
Note 2:
Securities
Derivatives
Fair value of the interest rate swaps is obtained from independent pricing
services based on quoted market prices for similar derivative contracts.
Level 2
Note 6:
Derivatives and
Hedging
Non-recurring2023:

Fair Value Description

Valuation
Hierarchy
Level

Where Fair Value
Balance Can Be Found

Available-for-Sale Securities

Where quoted market prices are available in an active market, securities are classified within Level 1 of the valuation hierarchy. If quoted market prices are not available, then fair values are estimated by using quoted prices of securities with similar characteristics or independent asset pricing services and pricing models, the inputs of which are market-based or independently sourced market parameters, including, but not limited to, yield curves, interest rates, volatilities, prepayments, defaults, cumulative loss projections and cash flows.

Level 2

Note 2: Securities

Derivatives

Fair value of the interest rate swaps is obtained from independent pricing services based on quoted market prices for similar derivative contracts.

Level 2

Note 6: Derivatives and
Hedging

Nonrecurring Measurements

The following tables present assets measured atthe fair value measurement on a non-recurring

nonrecurring basis and the level within the fair value hierarchy in
which the fair value measurements fall at March 31, 20232024 and December
31, 2022:
March 31, 2023
Fair Value Measurements Using
Fair Value
Quoted Prices in Active
Markets for Identical Assets
(Level 1)
Significant Other
Observable Inputs
(Level 2)
Unobservable
Inputs
(Level 3)
(Dollars in thousands)
Collateral-dependent loans
$
6,628
$
-
$
-
$
6,628
Foreclosed assets held-for-sale
$
880
$
-
$
-
$
880
December 31, 2022
Fair Value Measurements Using
Fair Value
Quoted Prices in Active
Markets for Identical Assets
(Level 1)
Significant Other
Observable Inputs
(Level 2)
Unobservable
Inputs
(Level 3)
(Dollars in thousands)
Collateral-dependent impaired loans
$
8,728
$
-
$
-
$
8,728
Foreclosed assets held-for-sale
$
1,745
$
-
$
-
$
1,745
2023:


March 31, 2024

Fair Value Measurements Using

Quoted Prices in

Active Markets for

Significant Other

Unobservable

Identical Assets

Observable Inputs

Inputs


Fair Value


(Level 1)


(Level 2)


(Level 3)

(Dollars in thousands)

Collateral-dependent impaired loans

$

2,288

$

$

$

2,288

Foreclosed assets held-for-sale

5,374

5,374


December 31, 2023

Fair Value Measurements Using

Quoted Prices in


Active Markets for

Significant Other

Unobservable

Identical Assets

Observable Inputs

Inputs


Fair Value


(Level 1)


(Level 2)


(Level 3)

(Dollars in thousands)

Collateral-dependent impaired loans


$

10,570

$

$

$

10,570

Following is a description of the valuation methodologies and inputs used for

assets measured at fair value on a non-recurring
nonrecurring basis and recognized in the accompanying consolidated statements of
financial condition.
condition, as well as the general classification of such assets pursuant to the valuation hierarchy. For assets classified within Level 3 of the fair value hierarchy, the process used to develop the reported fair value is described below.

Collateral-Dependent Impaired Loans, Net of ACL

- The estimated fair value of collateral-dependent loans is based on the appraised
fair value of the collateral, less estimated cost to
sell. If the fair value of the collateral is below the loan’s amortized cost, the ACL is netted against the loan balance. Collateral-dependent
loans are classified within Level 3 of

33

the fair value hierarchy.

46
The Company considers the appraisal or evaluation as the starting point for determining
fair value and then considers other
factors and events in the environment that may affect the fair value. Appraisals of the collateral underlying collateral dependent
loans are
obtained when the loan is determined to be collateral dependent and subsequently
as deemed necessary by the Office of the Chief Credit
Officer.
Appraisals are reviewed for accuracy and consistency by management. Appraisers are selected from the list of approved
appraisers maintained by management. The appraised values are reduced by discounts to
consider lack of marketability and estimated
cost costs to sell if repayment or satisfaction of the loan is dependent on the sale of the collateral. These discounts
and estimates are developed
by the Office of the Chief Credit Officer by comparison to historical results.

Foreclosed Assets Held-for-Sale

- The fair value of foreclosed assets-held-for-sale is based on the appraised fair value of
the collateral, less estimated cost to sell.

Unobservable (Level 3) Inputs

The following tables present quantitative information about unobservable

inputs used in non-recurringnonrecurring Level 3 fair value
measurements at March 31, 20232024 and December 31, 2022:2023:

March 31, 2024

Unobservable

Range


Fair Value


Valuation Techniques


Inputs


(Weighted Average)

(Dollars in thousands)

Collateral-dependent impaired loans

$

2,288


Appraisal of collateral


Appraisal adjustments (1)


0% - 25%
(19%)

Foreclosed assets held-for-sale

$

5,374


Appraisal of held property


Appraisal adjustments (1)


10% - 10%
(10%)

December 31, 2023

Unobservable

Range


Fair Value


Valuation Techniques


Inputs


(Weighted Average)

(Dollars in thousands)

Collateral-dependent impaired loans


$

10,570


Appraisal of collateral


Appraisal adjustments (1)


0% - 56%
(22%)

(1)Appraisals may be adjusted by management for qualitative factors such as economic conditions and estimated liquidation expenses.

34

March 31, 2023
Fair Value
Valuation Techniques
Unobservable
Inputs
Range
(Weighted Average)
(Dollars in thousands)
$
Market comparable
properties
Marketability
discount
4
%
-
6
%
Collateral dependent loans
6,628
(
6
)%
$
Market comparable
properties
Marketability
discount
10
%
Foreclosed assets held-for-sale
880
(
10
)%
December 31, 2022
Fair Value
Valuation Techniques
Unobservable
Inputs
Range
(Weighted Average)
(Dollars in thousands)
$
Market comparable
properties
Marketability
discount
-
%
-
100
%
Collateral-dependent impaired loans
8,728
(
13
)%
$
Market comparable
properties
Marketability
discount
10%
Foreclosed assets held-for-sale
1,745
(
10
)%
47

The following tables present the estimated fair values of the Company’s financial

instruments at March 31, 20232024 and
December 31, 2022:2023:

March 31, 2024

Carrying

Fair Value Measurements


Amount


Level 1


Level 2


Level 3

(Dollars in thousands)

Financial Assets


Cash and cash equivalents

$

206,773

$

206,773

$

$

Available-for-sale securities


786,603


786,603


Loans, net of allowance for credit losses


6,174,331


6,139,784

Restricted equity securities


3,752


3,752

Interest receivable


37,833


37,833


Equity securities


6,917


6,917

Derivative assets


9,054


9,054


Financial Liabilities


Deposits

$

6,587,146

$

954,240

$

$

5,663,040

Federal Home Loan Bank advances


77,840


71,735


Other borrowings


8,911


9,885


Interest payable


19,921


19,921


Derivative liabilities


17,138


17,138


December 31, 2023

Carrying

Fair Value Measurements


Amount


Level 1


Level 2


Level 3

(Dollars in thousands)

Financial Assets


Cash and cash equivalents

$

255,229

$

255,229

$

$

Available-for-sale securities


766,653


766,653


Loans, net of allowance for credit losses


6,054,228


6,036,887

Restricted equity securities


3,950


3,950

Interest receivable


37,294


37,294


Equity securities


5,794


5,794

Derivative assets


7,581


7,581


Financial Liabilities


Deposits

$

6,491,276

$

990,458

$

$

5,547,203

Federal Home Loan Bank advances


77,889


72,123


Other borrowings


8,950


9,891


Interest payable


18,529


18,529


Derivative liabilities


13,594


13,594


35

March 31, 2023
Carrying
Fair Value Measurements
Amount
Level 1
Level 2
Level 3
(Dollars in thousands)
Financial Assets
Cash and cash equivalents
$
262,971
$
262,971
$
-
$
-
Available-for-sale securities
751,251
-
751,251
-
Loans, net of allowance for credit losses
5,582,509
-
-
5,587,995
Restricted equity securities
16,700
-
-
16,700
Interest receivable
30,385
-
30,385
-
Equity securities
3,242
-
-
3,242
Derivative assets
7,907
-
7,907
-
Financial Liabilities
Deposits
$
5,837,314
$
969,701
$
-
$
4,879,677
Federal Home Loan Bank line of credit
183,437
-
183,437
-
Federal Home Loan Bank advances
130,594
-
125,909
-
Other borrowings
17,970
-
18,382
-
Interest payable
9,571
-
9,571
-
Derivative liabilities
11,791
-
11,791
-
December 31, 2022
Carrying
Fair Value Measurements
Amount
Level 1
Level 2
Level 3
(Dollars in thousands)
Financial Assets
Cash and cash equivalents
$
300,138
$
300,138
$
-
$
-
Available-for-sale securities
769,641
-
686,901
-
Loans, net of allowance for loan losses
5,310,954
-
-
5,307,607
Restricted equity securities
12,536
-
-
12,536
Interest receivable
29,507
-
29,507
-
Equity securities
2,870
-
-
2,870
Derivative assets
11,038
-
11,038
-
Financial Liabilities
Deposits
$
5,651,308
$
1,400,260
$
-
$
4,142,673
Federal funds purchased and repurchase agreements
74,968
-
74,968
-
Federal Home Loan Bank advances
143,143
-
135,086
-
Other borrowings
35,457
-
36,529
-
Interest payable
5,713
-
5,713
-
Derivative liabilities
16,442
-
16,442
-
48

Note 15:

12:   Commitments and Credit Risk
Commitments

The Company had the following commitments at March 31, 2023

2024 and December 31, 2022:
March 31, 2023
December 31, 2022
(Dollars in thousands)
Commitments to originate loans
$
202,975
$
134,961
Standby letters of credit
65,124
66,889
Lines of credit
2,528,595
2,705,730
Future lease commitments
1,888
1,888
Commitments related to investment fund
3,032
3,403
$
2,801,614
$
2,912,871
Note 16:
Subsequent Events
On April 21, 2023, the Company announced its entry into a definitive agreement under which the Company will acquire
Canyon
Bancorporation, Inc. and its wholly owned subsidiary, Canyon Community
Bank, N.A. (collectively, “Canyon”) in a stock and cash
transaction.
The business combination transaction is expected to result in the mergers of
Canyon Bancorporation, Inc. with and into
CrossFirst Bankshares, Inc. and Canyon Community Bank, N.A. with and
into CrossFirst Bank. Canyon has a branch in Tucson,
Arizona. The transaction is currently expected to close in the second half of 2023,
subject to approval by bank regulatory authorities, as
well as the satisfaction or waiver of customary closing conditions.
On April 21, 2023, the Company’s remaining
80,000
outstanding, fully vested warrants were exercised. See “Note 12: Stock
Warrants” for additional information about these warrants.
2023:


March 31, 2024


December 31, 2023

(Dollars in thousands)

Commitments to originate loans

$

97,741

$

59,728

Standby letters of credit


75,672


74,139

Lines of credit


1,897,172


2,008,356

Commitment related to investment fund


3,026


4,206

Total

$

2,073,611

$

2,146,429

Table of Contents
49

ITEM 2.MANAGEMENT’S DISCUSSION AND ANALYSIS OF FINANCIAL CONDITION

AND RESULTS OF
OPERATIONS

The following management's discussion and analysis of our financial condition

and results of operations should be read in
conjunction with our consolidated financial statements and related notes
as of and for the three months ended March 31, 2023,2024, and with
our 20222023 Form 10-K, which includes our audited consolidated financial statements
and related notes as of December 31, 2023 and 2022, and for the years ended
December 31, 2023, 2022 2021
and 2020.2021. This discussion and analysis contains forward-looking statements that involve risks, uncertainties
and assumptions that may cause actual results to differ materially from management's
expectations. Factors that could cause such
differences are discussed in the section entitled “Cautionary Note Regarding
Forward-Looking Statements”Information” located elsewhere in this
quarterly report and in Item 1A “Risk Factors” in our 20222023 Form 10-K and should be read herewith.

36

Performance Measures

As of or for the Three Months Ended


March 31, 2024


December 31, 2023


September 30, 2023


June 30, 2023

March 31, 2023

(Dollars in thousands, except per share data)

Return on average assets(1)


1.00

%  

0.97

%  

0.94

%

0.93

%  

0.97

%  

Adjusted return on average assets(1)(2)


1.00

%  

1.07

%  

1.04

%

1.00

%  

1.04

%  

Return on average common equity(1)


10.36

%  

10.71

%  

10.19

%

10.00

%  

10.54

%  

Adjusted return on average common equity(1)(2)


10.36

%  

11.89

%  

11.26

%

10.81

%  

11.30

%  

Earnings per common share

$

0.36

$

0.35

$

0.34

$

0.33

$

0.33

Diluted earnings per common share

$

0.36

$

0.35

$

0.34

$

0.33

$

0.33

Adjusted diluted earnings per common share(2)

$

0.36

$

0.39

$

0.37

$

0.35

$

0.35

Efficiency ratio(3)


60.31

%  


57.05

%  


59.49

%


62.02

%  


60.81

%  

Adjusted efficiency ratio - fully tax equivalent ("FTE")(2)(3)(4)


58.31

%  


51.87

%  


55.17

%


57.27

%  


56.42

%  

Ratio of equity to assets


9.56

%  


9.59

%  


8.96

%


9.15

%  


9.36

%  

(1)Interim periods annualized
(2)Represents a non-GAAP financial measure. See “Non-GAAP Financial Measures” below for a reconciliation to the most directly comparable financial measure calculated and presented in accordance with generally accepted accounting principles (“GAAP”).
(3)We calculate efficiency ratio as non-interest expense divided by the sum of net interest income and non-interest income.
(4)Tax exempt income (tax-free municipal securities) is calculated on a tax equivalent basis. The incremental tax rate used is 21.0%.

First Quarter 20232024 Highlights

During the first quarter ended March 31, 2023,2024, we accomplished the following:

Operating revenue(1) improved $0.8 million from the fourth quarter of 2023 and decreased $0.4 million from the first quarter of 2023
Grew loans $121 million, or 2%, for the quarter and 8% annualized
Grew deposits $96 million, or 1%, for the quarter and 6% annualized
Credit quality remained stable with non-performing assets decreasing to 0.27% of total assets and annualized net charge-offs representing 0.10% of average loans
Returned capital to stockholders of $1.5 million during the quarter via share buybacks at a weighted average price of $13.10 per share
Continued to build capital with total risk-based capital increasing to 11.4% and common equity Tier 1 capital increasing to 10.2%
Grew book value per common share 1% to $14.47 at March 31, 2024 compared to December 31, 2023; tangible book value per common share(2) also grew 1% to $13.70 during the same period

(1)Net interest income plus non-interest income.
(2)Represents a non-GAAP financial measure. See “Non-GAAP Financial Measures” below for a reconciliation to the most directly comparable financial measure calculated and presented in accordance with GAAP.

37

Completed the core systems conversion for Central
Loans grew $275

Results of Operations

Income from Operations

Net income totaled $18.2 million, or $0.36 per diluted common share, for the quarter with our newer markets and verticals contributing

meaningfully as we realize scale
in those areas
Credit quality improved with non-performing assets decreasing
$2.0three months ended March 31, 2024 compared to $16.1 million, and the non-performing assets to total assets
ratio decreasing to 0.16% at quarter end
Recorded $4.4 million of provision expenseor $0.33 per diluted common share, during the three months ended March 31, 2023. Compared to the first quarter driven by loan growth
and net charge-offs of $1.6 million, or
0.12% of average loans
Deposits increased $186 million due to a $405 million increase in wholesale
deposits.
Non-interest-bearing accounts were
lower as elevated deposits at year-end were deployed early in2023, the quarter
quarter’s results reflect higher non-interest income in addition to clients migrating into savingslower provision expense and
money market accounts
Net non-interest expense partially offset by lower net interest margin – fully tax equivalent (“FTE”) of 3.65% widened
four basis points for the quarter entirely due to the
benefit of non-interest-bearing deposits
Book value per common share increased to $13.28 at March 31, 2023 compared
to $12.56 at December 31, 2022. Tangible
book value per common share
(1)
as of March 31, 2023 increased to $12.54 compared to $11.96
at December 31, 2022
Issued $7.8 million of Series A Non-Cumulative Perpetual Preferred Stock, par value $0.01 per share (the Series A Preferred
Stock”), further bolstering our capital position
Received regulatory approval to expand into the Fort Worth, Texas market
(1)
Represents a non-GAAP financial measure.
See “Non-GAAP Financial Measures” below in Management’s Discussion and Analysis
of Financial Condition and Results of Operations for a reconciliation of these measures.
Banking Industry Events
The banking industry has faced significant upheaval since the collapse of
several banks in March 2023 related to their liquidity
and their significant concentration in certain industries, including exposure
to the technology sector and cryptocurrency.
We do not have
significant industry concentration or any significant exposure to the
technology or crypto sectors. Competition for deposits was
exacerbated by renewed focus on deposits in excess of FDIC insurance limits following
the failures, in addition to increased focus on
liquidity and interest rate management risks at all banks.
These challenges, combined with uncertainties around continued cost pressures
from inflation, potential FDIC special assessments and potential for higher
loan loss provisioning all led to a highly volatile market for
banks.
During the quarter, we focused on the following strategies and data:
Mobilized our business continuity team and aspects of our contingency funding
plan in response to the headline and publicity
risk created by the bank failures
Conducted frequent executive team meetings (including
daily during certain periods) during March to monitor our response
which was focused on client outreach and increasing liquidity
Expanded liquidity available by $220 million at the Federal Reserve Bank
by pledging additional loans
50
Conducted proactive client outreach by bankers to communicate the strength,
stability and trust clients have come to expect
from CrossFirst Bank
Improved liquidity in our securities portfolio - as of March 31, 2023, $244
million of securities can be pledged and $222
million of securities could be sold with a net gain, based on current market
conditions
Our total on-balance sheet and off-balance sheet liquidity was $2.3 billion as of
March 31, 2023, or 33% of total assets
Expanded our partnership with IntraFi as we served clients who were interested
in the program; our IntraFi Cash Service
(“ICS”) partnership dates back to 2013
Estimated uninsured deposits after excluding pass-thru insured accounts
was 35% of total deposits
Mergers and Acquisitions
Update
On April 21, 2023, the Company announced its entry into a definitive agreement under which the Company
will acquire Canyon
Bancorporation, Inc. and its wholly owned subsidiary, Canyon Community
Bank, N.A. (collectively, “Canyon”) in a stock and cash
transaction.
The business combination transaction is expected to result in the mergers
of Canyon Bancorporation, Inc. with and into
CrossFirst Bankshares, Inc. and Canyon Community Bank, N.A. with and
into CrossFirst Bank.
Canyon has a branch in Tucson,
Arizona. In accordance with the agreement, the Company has agreed to pay
up to 50% of the merger consideration in the form of
Company common stock based on the election of the target stockholders and
subject to certain conditions. The Company's common
stock will be valued at a per share price of $14.11 for purposes of calculating the
merger consideration. The Company expects to issue
up to approximately 621,000 shares of its common stock at closing assuming:
(i) aggregate merger consideration of $17.5 million; and
(ii) that the Company issues 50% of such merger consideration in the form
of the Company's common stock.
The aggregate transaction
value was estimated at approximately $15.1 million based on the Company’s
stock price on April 20, 2023. The transaction is currently
expected to close in the second half of 2023, subject to approval by bank regulatory
authorities, as well as the satisfaction or waiver of
customary closing conditions.
Update to Customer Concentrations
As of March 31, 2023, the Company’s
top 25 customer relationships represented approximately 23% or $1.4 billion
of total
deposits,
$0.5 billion of which are ICS deposits.
The Company believes it has sufficient funding sources,
including on-balance sheet
liquid assets and wholesale deposit options, so that an immediate reduction in
these deposit balances would not be expected to have a
material, detrimental effect on the Company’s
financial position or operations. Deposits at March 31, 2023 are 70% commercial,
17%
consumer,
and 13% wholesale, which is consistent with our strategy.
We operate largely
in the Midwest and in strong markets, with a
diverse deposit composition by state which follows our branch footprint.
We also have diversity in depositors
by industry with no
industry concentrations above 5% outside of trusts and banking
institutions.
Our loan portfolio remains diversified with 45% of loans in commercial and
industrial and owner-occupied real estate and 44% of
loans in commercial real estate. We
have diversification within each portfolio
with the top 25 commercial and industrial clients
representing 27% of total commercial and industrial exposure or 10% of
total loan exposure and the top 25 commercial real estate
transactions representing 23% of commercial real estate exposure or
10% of total loan exposure.
There also remains diversity within
our loan portfolios with the highest commercial real estate property
type accounting for 17% of total commercial real estate exposure,
and the largest industry segment in commercial and
industrial being manufacturing at 10% of commercial and industrial exposure.
Our
commercial real estate loan portfolio also has geographic diversity with concentrations
in high-quality markets including Dallas, Kansas
City, Phoenix, and Denver
.
51
Performance Measures
As of or for the Quarter Ended
March 31,
December 31,
September 30,
June 30,
March 31,
2023
2022
2022
2022
2022
(Dollars in thousands, except per share data)
income.

Return on average assets

(1)
0.97
%
0.77
%
1.19
%
1.12
%
1.23
%
Adjusted return on average assets
(1)(2)
1.04
%
1.15
%
1.19
%
1.20
%
1.23
%
was 1.00% for the three months ended March 31, 2024. Return on average common equity
(1)
10.53
%
8.04
%
11.18
%
10.15
%
10.44
%
Adjusted return was 10.36% for the three months ended March 31, 2024.

Net Interest Income

Our profitability depends in substantial part on average equity

(1)(2)
11.30
%
12.03
%
11.22
%
10.82
%
10.44
%
Earnings per common share – basic
$
0.33
$
0.25
$
0.35
$
0.31
$
0.33
Earnings per common share – diluted
$
0.33
$
0.24
$
0.35
$
0.31
$
0.33
Adjusted earnings per common share – diluted
(2)
$
0.35
$
0.36
$
0.35
$
0.33
$
0.33
Efficiency ratio
(3)
60.81
%
62.40
%
53.20
%
57.36
%
57.57
%
Adjusted efficiency ratio - FTE
(2)(3)(4)
56.42
%
55.01
%
52.25
%
53.95
%
56.66
%
Ratio of equity to assets
9.36
%
9.22
%
9.93
%
10.65
%
11.29
%
(1)
Interim periods annualized
(2)
Represents a non-GAAP financial measure.
See "Non-GAAP Financial Measures"
below in Management's Discussion and
Analysis of Financial Condition and
Results of Operations for a reconciliation of these measures.
(3)
We calculate efficiency ratio as non-interest expense
divided by the sum ofour net interest income, and
non-interest income.
(4)
Tax exempt income (tax-free municipal securities)
which is calculateddiscussed below on a tax equivalentGAAP and FTE basis.
The incremental tax rate used is 21.0%.
Results of Operations
Net Interest Income
Net interest income is presented on a fully tax equivalent basis.
We believe reportingproviding disclosure on an FTE basis provides for improved
comparability between the various earning assets. Changes in interest
income and interest expense result from changes in average
balances (volume) of interest earninginterest-earning assets and interest-bearing
liabilities, as well as changes in average interest rates.
52
yields.

The following tables present,table presents, for the periods indicated, average statement

of financial condition information, interest income,
interest expense and the corresponding average yield and rates paid:


For the Three Months Ended March 31, 

2024

2023

Interest

Interest

Average

Income /

Average

Income /


Balance


Expense


Yield / Rate(4)


Balance


Expense


Yield / Rate(4)


(Dollars in thousands)

Interest-earning assets:


Securities - taxable

$

445,952

$

4,606


4.13

%  

$

268,705

$

2,111


3.14

%  

Securities - tax-exempt - FTE(1)


392,505


3,089


3.15


542,268


4,591


3.39

Federal funds sold


1,757


5


1.15

Interest-bearing deposits in other banks


168,653


1,981


4.72


195,289


2,009


4.17

Gross loans, net of unearned income(2)(3)


6,159,447


110,099


7.19


5,539,954


89,618


6.56

Total interest-earning assets - FTE(1)


7,166,557

$

119,775


6.72

%  


6,547,973

$

98,334


6.08

%  

Allowance for credit losses


(73,683)


(63,235)


Other non-interest-earning assets


251,228


228,063


Total assets

$

7,344,102


$

6,712,801


Interest-bearing liabilities


Transaction deposits

$

878,446

$

7,930


3.63

%  

$

542,366

$

3,500


2.62

%  

Savings and money market deposits


2,848,979


31,675


4.47


2,881,726


23,569


3.32

Time deposits


1,820,013


22,506


4.97


1,100,444


9,656


3.56

Total interest-bearing deposits


5,547,438


62,111


4.50


4,524,536


36,725


3.29

FHLB and short-term borrowings


77,874


471


2.43


272,754


2,535


3.77

Trust preferred securities, net of fair value adjustments


1,121


63


22.60


1,062


56


21.39

Non-interest-bearing deposits


900,216


1,194,788


Cost of funds


6,526,649

$

62,645


3.86

%  


5,993,140

$

39,316


2.66

%  

Other liabilities


108,105


99,451

Stockholders’ equity


709,348


620,210

Total liabilities and stockholders’ equity

$

7,344,102

$

6,712,801

Net interest income - FTE(1)

$

57,130


$

59,018

Net interest spread - FTE(1)


2.86

%  


3.42

%  

Net interest margin - FTE(1)


3.20

%  


3.65

%  

(1)

Calculated on an FTE basis. Tax-free municipal securities are exempt from Federal taxes. The incremental tax rate used is 21.0%.

(2)

Loans, net of unearned income includes non-accrual loans of $12 million and $10 million as of March 31, 2024 and 2023, respectively.

(3)

Loan interest income includes loan fees of $4 million for the three months ended March 31, 2024 and 2023.

(4)

Actual unrounded values are used to calculate the reported yield or rate. Accordingly, recalculations using the amounts in thousands as disclosed in this report may not produce the same amounts.

38

Three Months Ended
March 31, 2023
March 31, 2022
Average
Balance
Interest
Income /
Expense
Average
Yield /
Rate
(4)
Average
Balance
Interest
Income /
Expense
Average
Yield /
Rate
(4)
(Dollars in thousands)
Interest-earning assets:
Securities - taxable
$
268,705
$
2,111
3.14
%
$
220,802
$
1,188
2.15
%
Securities - tax-exempt - FTE
(1)
542,268
4,591
3.39
533,674
4,467
3.35
Federal funds sold
1,757
5
1.15
-
-
-
Interest-bearing deposits in other banks
195,289
2,009
4.17
309,948
152
0.20
Gross loans, net of unearned income
(2)(3)
5,539,954
89,618
6.56
4,332,831
42,728
4.00
Total interest-earning assets - FTE
(1)
6,547,973
$
98,334
6.08
%
5,397,255
$
48,535
3.64
%
Allowance for credit losses
(63,235)
(57,922)
Other non-interest-earning assets
228,063
224,405
Total assets
$
6,712,801
$
5,563,738
Interest-bearing liabilities
Transaction deposits
$
542,366
$
3,500
2.62
%
$
585,990
$
222
0.15
%
Savings and money market deposits
2,881,726
23,569
3.32
2,302,552
1,847
0.33
Time deposits
1,100,444
9,656
3.56
587,452
1,442
1.00
Total interest-bearing deposits
4,524,536
36,725
3.29
3,475,994
3,511
0.41
FHLB and short-term borrowings
272,754
2,535
3.77
231,156
1,109
1.95
Trust preferred securities, net of fair value
adjustments
1,062
56
21.39
1,012
25
10.25
Non-interest-bearing deposits
1,194,788
-
-
1,157,387
-
-
Cost of funds
5,993,140
$
39,316
2.66
%
4,865,549
$
4,645
0.39
%
Other liabilities
99,451
44,442
Stockholders’ equity
620,210
653,747
Total liabilities and stockholders’ equity
$
6,712,801
$
5,563,738

Net interest income - FTE

(1)
$
59,018
$
43,890
Net interest spread - FTE
(1)
3.42
%
3.25
%
Net interest margin - FTE
(1)
3.65
%
3.29
%
(1)
Tax exempt income is calculated on a tax equivalent basis. Tax-free municipal securities are exempt from Federal income taxes. The incremental
tax rate used is 21.0%.
(2)
Loans, net of unearned income include non-accrual loans of $10 million and $33 million as of March 31, 2023 and 2022, respectively.
(3)
Loan interest income includes loan fees of $4 million and $4 million for the three months ended March 31, 2023 and 2022, respectively.
(4)
Actual unrounded values are used to calculate the reported yield or rate. Accordingly, recalculations using the amounts in thousands as disclosed in
this report may not produce the same amounts.
53
Net interest income -
Net interest income increased $15.1decreased $1.6 million for the three-month
period ended March 31, 2023 compared to the
same period in 2022 driven by increases in average earning assets from strong
loan growth and an increase in loan yields, partially offset
by a higher cost of funds due to the rising rate environment.
Compared to the first quarter of 2022, FTE net interest income increased
$15.1 million and net interest margin - FTE increased 36 basis points.
The higher income and margin were primarily due to increases in
average earning assets from strong loan growth and an increase in loan yields, partially
offset by a higher cost of funds due to the rising
rate environment.
Average earning assets totaled $6.5 billion for the three-month period
ended March 31, 2023 resulting in an increase of $1.2 billion or
21%2024, compared to the same period in 2022, inclusive2023. Net interest income – FTE decreased $1.9 million for the same comparative period as the benefits from higher average earning assets and one additional day were more than offset by a 45 basis point reduction in net interest margin - FTE.

The FTE yield on earning assets increased 64 basis points from the first quarter of 2023 to the impactfirst quarter of

2024 due to stronger loan yields and higher yields on securities. The cost of a hedge that was used to manage interest rate risk lowered the Central acquisition.earning asset yield by seven basis points. The cost of funds increased 1.20% over the same period due to pricing pressure on deposits, client migration into higher cost deposit products, as well as the reduction in average non-interest-bearing deposits compared to the prior year.

Average earning assets totaled $7.2 billion for the three-month period ended March 31, 2024, resulting in an increase of $0.6 billion for the period, compared to the same period in 2023. The increase was driven by higher average

loan and investment portfolio balances, partially offset by lower average
cash balances for the three-month period ended March 31, 2023
compared to the corresponding period in 2022.
The FTE yield on earning assets increased 2.44% from the first quarter
of 2022 to the first quarter of 2023 due to new loan production as
well as repricing of variable rate loans. The cost of funds increased 2.27% over the same period
due to pricing pressure on deposits as
well as client migration into higher cost deposit products compared to the prior
year.
balances.

The Company currently anticipates net interest margin to narrow from

the current quarter- FTE to be in thea range of 3.40%3.20% to 3.55%3.25% for 2024.

Provision for Credit Losses

For the Three Months Ended

March 31,

2024

2023

(Dollars in thousands)

Provision for credit losses - loans


$

2,855


$

4,996

Provision for credit losses - off-balance sheet


(1,200)


(575)

Total provision for credit losses

$

1,655

$

4,421

Provision expense of $1.7 million for the

full-year 2023 based on changes first quarter of 2024 was primarily driven by loan growth and an increase in our funding mix. This may bespecific reserves and was partially offset withby a
benefit $1.2 million decrease in the reserve for unfunded commitments. Provision expense of one to three basis points from any
additional rate increases$4.4 million for the first quarter of 2023 was driven by loan growth partially offset by improvement in qualitative factors, in part due to our largely variable loan portfolio.
continued improvement in credit quality, and a $0.6 million decrease in the reserve for unfunded commitments.

Non-Interest Income

The components of non-interest income were as follows for the periods

shown:
Three Months Ended
March 31,
Change
2023
2022
$
%
(Dollars in thousands)
Service charges and fees on customer accounts
$
1,829
$
1,408
$
421
30
%
ATM and credit card interchange income
1,264
2,664
(1,400)
(53)
Realized gains (losses) on available-for-sale securities
63
(26)
89
N/M
Gain on sale of loans
187
-
187
-
Gains (losses), net on equity securities
10
(103)
113
(110)
Income from bank-owned life insurance
411
388
23
6
Swap fees and credit valuation adjustments, net
90
118
(28)
(24)
Other non-interest income
567
493
74
15
Total non-interest income
$
4,421
$
4,942
$
(521)
(11)
%
Non-interest income to average assets (annualized)
0.27%
0.36%

Three Months Ended March 31, 


Change


2024


2023


$


%

(Dollars in thousands)

Service charges and fees on client accounts

$

2,104

$

1,829

$

275

15

%

ATM and credit card interchange income


1,487


1,264


223

18

Gain on sale of loans


537


187


350

187

Income from bank-owned life insurance


456


411


45

11

Swap fees and credit valuation adjustments, net


158


90


68

76

Other non-interest income


847


640


207

32

Total non-interest income

$

5,589

$

4,421

$

1,168

26

%

Non-interest income to average assets


0.31

%  


0.27

%  


The changes in non-interest income were driven primarily by the following:

Service charges and fees on customer accounts
- The increase for the three-month period ended March 31, 20232024 compared to the
corresponding period in 2022 was2023 were driven primarily by increases in account
analysisservice charges and fees due toon client fee increases enacted in 2022.
ATM and credit card interchange income
- The decrease inaccounts, ATM and credit card interchange income, was driven primarily by a
decrease in credit card fees due to one large customer with pandemic-related
activity that did not occur in the current year.
Gaingain on sale of loans
and other non-interest income. The increase for the three months ended March 31, 2023 compared to the same period for 2022in service charges and fees on client accounts was driven by new clients as well as an increase in client activity. The increase in ATM and

39

credit card interchange income was due to the

expansionhigher interchange income from an increase in spend volume and higher foreign ATM transaction volume. The increase in gain on sale of our mortgage businessloans was due to acquired through the 2022 acquisition
of Central.
54
SBA lending capabilities in late 2022. The increase in other non-interest income was primarily due to higher client-related fees.

Non-Interest Expense

The components of non-interest expense were as follows for the periods indicated:

Three Months Ended
March 31,
Change
2023
2022
$
%
(Dollars in thousands)
Salary and employee benefits
$
22,622
$
17,941
$
4,681
26
%
Occupancy
2,974
2,493
481
19
Professional fees
2,618
805
1,813
225
Deposit insurance premiums
1,531
737
794
108
Data processing
1,242
812
430
53
Advertising
752
692
60
9
Software and communication
1,651
1,270
381
30
Foreclosed assets, net
149
(53)
202
N/M
Other non-interest expense
3,731
2,950
781
26
Core deposit intangible amortization
822
19
803
4,226
Total non-interest expense
$
38,092
$
27,666
$
10,426
38
%
Non-interest income to average assets (annualized)
2.30%
2.02%

Three Months Ended March 31, 


Change


2024


2023


$


%

(Dollars in thousands)

Salary and employee benefits

$

23,585

$

22,622

$

963

4

%

Occupancy


3,206


2,974


232

8

Professional fees


972


2,618


(1,646)

(63)

Deposit insurance premiums


1,906


1,531


375

24

Data processing


970


1,242


(272)

(22)

Advertising


558


752


(194)

(26)

Software and communication


1,824


1,651


173

10

Foreclosed assets, net


229


149


80

54

Core deposit intangible amortization


931


822


109

13

Other non-interest expense


3,324


3,731


(407)

(11)

Total non-interest expense

$

37,505

$

38,092

$

(587)

(2)

%

Non-interest expense to average assets


2.05

%  


2.30

%  


Non-interest expense increased $10.4 million for the three-month

period ended March 31, 20232024 decreased $0.6 million compared to the same period in
2022 and included 2023. Excluding acquisition-related costs of $1.5 million in the first quarter of transaction costs and $0.82023, non-interest expense in the first quarter of 2024 increased $0.9 million of core deposit
intangible amortization relatedcompared to the Central
acquisition.
The changes in non-interest expense were driven primarily by the following:
Salary and Employee Benefits
- Salaryprior year first quarter. On an adjusted basis, salary and employee benefit costs increased due to merit increases hiring
and higher incentives. Occupancy costs increased due to new locations in new marketsthe high-growth Dallas-Fort Worth market and
verticals,
and the addition of employees as part of the Central acquisition.
Occupancy
– The increase in occupancy costs was driven by the addition of a second location in
Dallas, Texas during
2022 and new
properties in Colorado and New Mexico as part of the from our acquisition of Central.
Canyon Bancorporation, Inc. and Canyon Community Bank, N.A. in Tucson, Arizona. Professional Fees
– The increase in professional fees was primarilydecreased due to increases in consulting
costs related to the acquisition of
Central and digital banking conversion, increased recruiting costs, and timing
of legal fees.
reduced project expenses. Deposit Insurance Premiums
– The increase in deposit insurance premiums wasincreased due to an increasegrowth in theassets and a higher assessment rate and
increases
in assets.
Data Processing
– The increase in data processing costs was driven primarily by increased costs associated with
the Company's digital
banking conversion.
Other Non-interest Expense
-rate. Other non-interest expense increaseddecreased primarily due to increased post-pandemic
because of lower travel expenses and
transaction fraud-related losses.
Core Deposit Intangible Amortization
– Core deposit intangible amortization increased due to a fulldecrease in credit card fees.

Our GAAP efficiency ratio for the first quarter of expense

related2024 was 60.31% and our adjusted efficiency ratio – FTE was 58.31% compared to 60.81% and 56.42% on a reported and adjusted basis for the
Central acquisition.
three-month period ended March 31, 2023. See "Non-GAAP Financial Measures" below for a reconciliation of our adjusted efficiency ratio – FTE to our GAAP efficiency ratio. We currently anticipateexpect our non-interest expense to be in a range of $35-$36
$36 million to $37 million per quarter for the remainder of 2023. The
efficiency ratio was 60.81% and the adjusted efficiency ratio – FTE
(1)
was 56.42% for the three months ended March 31, 2023.
(1)
Represents a non-GAAP financial measure.
See "Non-GAAP Financial Measures"
below in Management’s Discussion and
Analysis of Financial Condition and
Results of Operations for a reconciliation of these measures.
55
2024.

Income Taxes

For the Quarter Ended
March 31,
December 31,
September 30,
June 30,
March 31,
2023
2022
2022
2022
2022
(Dollars in thousands)
Income tax expense
$
4,021
$
3,348
$
4,410
$
4,027
$
4,188
Income before income taxes
20,129
15,294
21,690
19,572
21,016
Effective tax rate
20
%
22
%
20
%
21
%
20
%

Our income tax expense differs from the amount that would be calculated

using the federal statutory tax rate, primarily from
investments in tax advantaged assets, includingsuch as bank-owned
life insurance and tax-exempt municipal securities;
securities, state tax credits;
credits and
permanent tax differences from equity-basedstock-based compensation.

40

The tax-exempt benefit diminishes as the Company’s ratio of taxable income to tax-exempt income increases. We currently anticipate the effective tax rate to remain in the range of 20% to 22% for the remainder of 2024. Our income tax and effective tax rate is presented below for the periods indicated:

Three Months Ended March 31, 

2024


2023

(Dollars in thousands)

Income tax expense

$

4,800

$

4,021

Income before income taxes

$

23,023

$

20,129

Effective tax rate


21

%


20

%

Discussion and Analysis - Financial Condition

Total assets were $7.5 billion at March 31, 2024 compared to $7.4 billion at December 31, 2023, an increase of $0.1 billion, or 1%. Cash and cash equivalents decreased $48 million, or 19%, and investment securities increased $20 million, or 3%, from December 31, 2023. Loans increased $121 million, or 2%, from December 31, 2023, and the allowance for credit losses increased $1 million to $75 million at March 31, 2024. Total deposits increased $96 million to $6.6 billion at March 31, 2024, compared to December 31, 2023. Federal Home Loan Bank (“FHLB”) advances totaled $78 million and were flat compared to December 31, 2023.

Investment Portfolio

The primary objective of our investment portfolio is to ensure adequate liquidity, including serving as a contingent, on-balance sheet source of liquidity. In addition, we manage the portfolio in a manner that optimizes earnings, manages credit and interest rate risk, and meets pledging and regulatory capital requirements. As of March 31, 2024, our portfolio was 100% available-for-sale and totaled $787 million, an increase of $20 million from December 31, 2023.

The increase in the investment portfolio was driven by the purchase of $40 million in mortgage-backed securities and $5 million in collateralized mortgage obligations. The increase was partially offset by an increase of $11 million in the unrealized loss on available-for-sale securities and $13 million of paydowns and maturities in investment securities. Our current investment strategy includes reducing the concentration in municipal investments, investing in lower risk-weighted assets and restructuring the portfolio to increase liquidity and provide more balanced cash flow. For additional information, including information regarding other securities owned by the Company, see “Note 2: Securities” in the notes to consolidated financial statements – unaudited.

The following table shows with respect to our portfolio of available-for-sale securities, the estimated fair value, percent of the portfolio of available-for-sale securities and weighted average yield of such securities as of the dates indicated:


As of March 31, 2024


As of December 31, 2023

Estimated

Percent of

Weighted


Estimated

Percent of

Weighted


Fair Value


portfolio


Average Yield

Fair Value


portfolio


Average Yield

Available-for-sale securities


(Dollars in thousands)

Federal agency obligations

$

10,031

1

6.38

%

$

10,072

1

%

6.41

%

U.S. Treasury securities

4,968

1

5.56

Mortgage-backed - GSE residential

228,660

29

3.39

212,462

28

3.15

Collateralized mortgage obligations - GSE residential


70,268

9


5.36


49,944

7


5.12

State and political subdivisions


347,783

44


2.58


355,897

46


2.61

Small Business Administration loan pools

121,293

16

4.86

124,778

16

4.87

Corporate bonds


8,568

1


5.69


8,532

1


5.68

Total available-for-sale securities

$

786,603

100

%

3.46

%

$

766,653

100

%

3.35

%

41

Loan Portfolio

Refer to “Note

8: Income Tax” 3: Loans and Allowance for Credit Losses” within the notes to consolidated financial statements – unaudited for additional information regarding the Company’s loan portfolio. As of March 31, 2024, gross loans, net of unearned fees increased $121 million or 2% from December 31, 2023. The following table presents the balance and associated percentage change of each segment within our portfolio as of the dates indicated:

December 31, 2023, vs.


As of

As of

March 31, 2024


March 31, 2024


December 31, 2023


% Change


(Dollars in thousands)


Commercial and industrial

$

2,179,562

$

2,160,212


1

%

Energy


221,217


214,218


3

Commercial real estate - owner-occupied


577,812


566,253


2

Commercial real estate - non-owner-occupied


2,769,936


2,685,534


3

Residential real estate


468,628


464,095


1

Consumer


32,032


37,378


(14)

Total

$

6,249,187

$

6,127,690


2

%

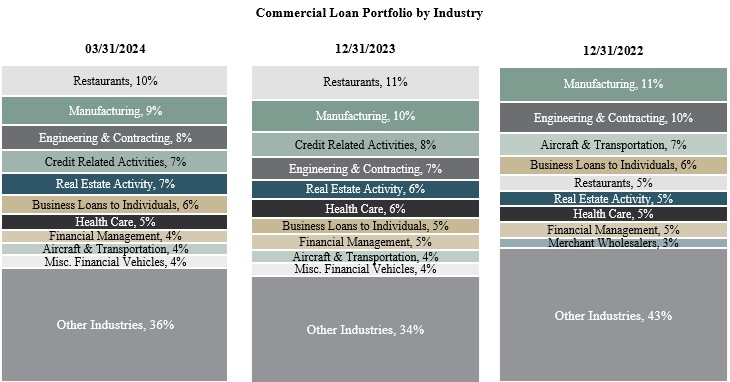
Our loan portfolio remains balanced with 44% of loans in commercial and industrial and owner-occupied commercial real estate and 44% of loans in non-owner-occupied commercial real estate.

The Company provides a mix of variable- and fixed-rate commercial and industrial loans across various industries. Our commercial and industrial loan portfolio is comprised of diverse industry segments. The largest segment as of March 31, 2024 was restaurants. Details of the Company’s commercial and industrial loan portfolio by industry as of March 31, 2024, December 31, 2023, and December 31, 2022 are provided below with loans acquired in 2022 excluded as of December 31, 2022:

Graphic

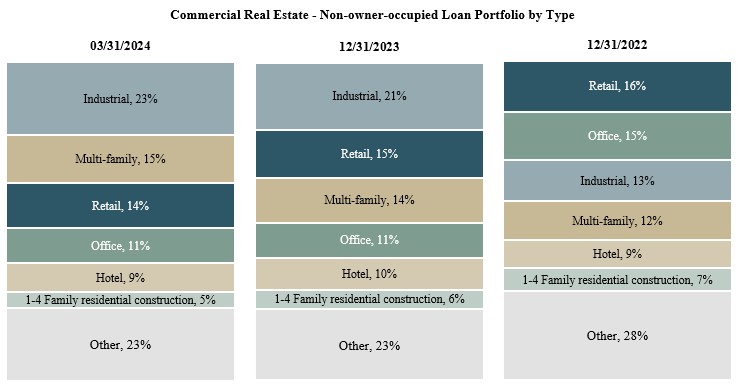
Our commercial real estate - non-owner-occupied loan portfolio is comprised of construction and development loans, multifamily loans and investor commercial real estate loans. Management regularly monitors the credit risk of our commercial real estate portfolio, including periodic portfolio reviews of all outstanding credits, sensitivity testing of the impacts of the current interest rate environment on borrower financial condition and overall credit risk profile. In

42

addition, management engages third-party specialists to review the loan portfolio on a regular basis. Management actively monitors credit risk including oversight of credit and lending strategies, exposures and objectives of the Company. Management’s monitoring activities are reviewed by the Risk Committee of the Board of Directors of the Company on a regular basis.

As of March 31, 2024, the highest commercial real estate - non-owner-occupied property type, industrial, accounted for 23% of total commercial real estate - non-owner-occupied exposure. Details of our commercial real estate - non-owner-occupied loan portfolio by type as of March 31, 2024, December 31, 2023, and December 31, 2022 are provided below with loans acquired in 2022 excluded from December 31, 2022:

Graphic

43

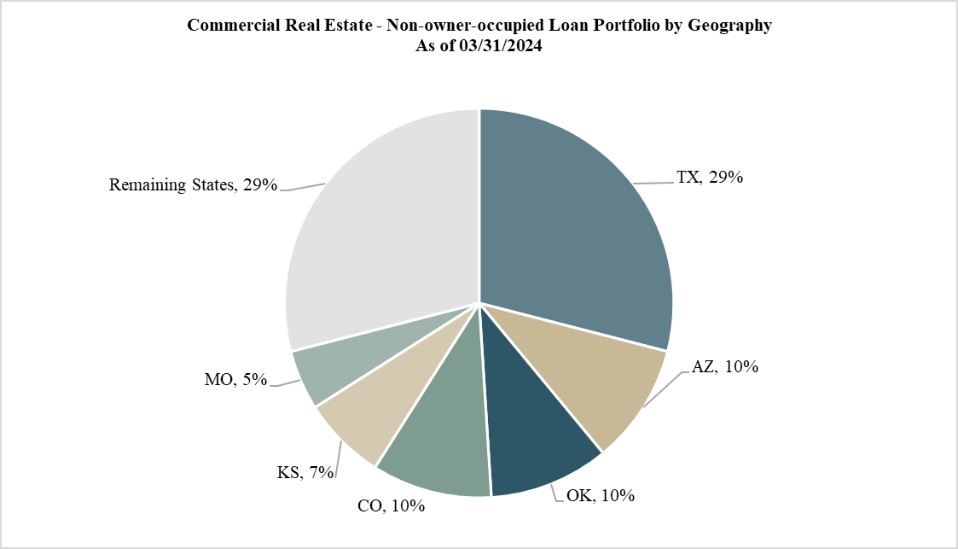
Our commercial real estate - non-owner-occupied loan portfolio is comprised predominately of in-market relationships with 71% of commercial real estate loans located within our footprint of Kansas, Missouri, Texas, Oklahoma, Arizona and Colorado as of March 31, 2024. A detail of our commercial real estate - non-owner-occupied loan portfolio by geography (based upon location of collateral) as of March 31, 2024 is presented below:

Graphic

The following tables show the contractual maturities of our gross loans and sensitivity to interest rate changes at March 31, 2024 and December 31, 2023:

As of March 31, 2024

Due in One Year through Five

Due in Five Year through

Due in One Year or Less

Years

Fifteen Years

Due after Fifteen Years

Adjustable

Adjustable

Adjustable

Adjustable


Fixed Rate


Rate


Fixed Rate


Rate


Fixed Rate


Rate


Fixed Rate


Rate


Total

(Dollars in thousands)

Commercial and industrial

$

112,125

$

617,329

$

315,356

$

967,120

$

75,745

$

72,045

$

19,814

$

28

$

2,179,562

Energy

89

3,650

217,478

221,217

Commercial real estate - owner-occupied


17,648


26,018


175,639


73,160


117,129


117,933


2,510


47,775


577,812

Commercial real estate - non-owner-occupied


104,365


527,061


570,727


1,193,492


88,460


182,120


9,550


94,161


2,769,936

Residential real estate


4,805


2,003


25,470


12,034


68,340


26,473


3,028


326,475


468,628

Consumer


9,819


14,379


5,420


2,250


31


133


32,032

Total

$

248,851

$

1,190,440

$

1,092,612

$

2,465,534

$

349,705

$

398,704

$

34,902

$

468,439

$

6,249,187

44

As of December 31, 2023

Due in One Year through Five

Due in Five Year through

Due in One Year or Less

Years

Fifteen Years

Due after Fifteen Years

Adjustable

Adjustable

Adjustable

Adjustable


Fixed Rate


Rate


Fixed Rate


Rate


Fixed Rate


Rate


Fixed Rate


Rate


Total

(Dollars in thousands)

Commercial and industrial

$

125,460

$

608,786

$

335,330

$

926,646

$

64,907

$

78,996

$

19,826

$

261

$

2,160,212

Energy

107

3,631

340

210,140

214,218

Commercial real estate - owner-occupied


14,772


25,907


180,194


76,358


101,018


117,019


2,524


48,461


566,253

Commercial real estate - non-owner-occupied


75,518


427,082


596,545


1,161,103


113,622


197,637


16,436


97,591


2,685,534

Residential real estate


5,537


1,364


29,156


11,717


65,086


27,356


3,036


320,843


464,095

Consumer


15,464


13,763


6,448


1,633


23


47


37,378

Total

$

236,858

$

1,080,533

$

1,148,013

$

2,387,597

$

344,656

$

421,055

$

41,822

$

467,156

$

6,127,690

The stated interest rate (which excludes the effects of non-refundable loan origination and commitment fees, net of costs and the accretion of fair value marks) of gross loans was as follows at March 31, 2024:

As of March 31, 2024

Fixed

Variable

Total

Weighted

Weighted

Weighted


Balance


average rate


Balance


average rate

Balance


average rate

(Dollars in thousands)


Commercial and industrial

$

523,040

5.35

%

$

1,656,522

8.46

%

$

2,179,562

7.74

%

Energy

89

6.50

%

221,128

9.00

%

221,217

9.00

%

Commercial real estate - owner-occupied


312,926


4.48

%


264,886


6.54

%

577,812


5.43

%

Commercial real estate - non-owner-occupied


773,102


5.08

%


1,996,834


7.59

%

2,769,936


6.89

%

Residential real estate


101,643


4.08

%


366,985


4.02

%

468,628


4.03

%

Consumer


15,270


6.35

%


16,762


8.62

%

32,032


7.54

%

Total

$

1,726,070

$

4,523,117

$

6,249,187

Allowance for Credit Losses

The ACL represents our best estimate of the expected credit losses in the Company’s loan portfolio and off-balance sheet commitments, measured over the contractual life of the underlying instrument. The allocation in one portfolio segment does not preclude its availability to absorb losses in other segments. The table below presents the allocation of the allowance for credit losses as of the dates indicated:

March 31, 2024


December 31, 2023


ACL Amount


ACL Amount  


Percent of

Percent of

Percent of

Percent of

Off-Balance

ACL to

Loans to

Off-Balance

ACL to

Loans to


Loans


Sheet


Total


Total ACL


Total Loans


Loans


Sheet


Total


Total ACL


Total Loans


(Dollars in thousands)


Commercial and industrial

$

33,821

$

1,008

$

34,829

44

%  

35

%  

$

32,244

$

954

$

33,198

42

%  

35

%

Energy


3,169


3,169


4


4


3,143


149


3,292


4


3

Commercial real estate - owner-occupied


6,385


89


6,474


8


9


6,445


125


6,570


8


9

Commercial real estate - non-owner-occupied


27,989


4,020


32,009


40


44


28,130


5,096


33,226


42


44

Residential real estate


3,466


95


3,561


4


7


3,456


89


3,545


4


8

Consumer


26


1


27


1


44


44


1

Gross loans

$

74,856

$

5,213

$

80,069


100

%  

100

%  

$

73,462

$

6,413

$

79,875


100

%  

100

%

Refer to “Note 3: Loans and Allowance for Credit Losses” within the notes to consolidated financial statements -

45

unaudited for a summary of the changes in the ACL.

Charge-offs and Recoveries

Net charge-offs were $1.5 million for the three-month period ended March 31, 2024 and were primarily due to charge-offs on two commercial and industrial loans, two commercial real estate – non-owner-occupied loans and one credit card account. One of the charge-offs on commercial real estate – non-owner-occupied loans was a partial charge-off of a commercial construction non-accrual credit that moved to foreclosed assets held for sale during the quarter. The table below provides the ratio of net charge-offs (recoveries) to average loans outstanding based on our loan categories for the periods indicated:

For the Quarter Ended


March 31, 2024


December 31, 2023


September 30, 2023


June 30, 2023


March 31, 2023


Commercial and industrial


0.14

%  

0.35

%  

0.24

%

0.14

%  

0.31

%

Energy


(0.23)


(0.23)


Commercial real estate - owner-occupied


Commercial real estate - non-owner-occupied


0.13


Residential real estate


Consumer


0.01


0.04


Total net charge-offs to average loans


0.10

%  

0.12

%  

0.09

%

0.04

%  

0.12

%

Non-performing Assets and Other Asset Quality Metrics

Non-performing assets include: (i) non-performing loans - includes non-accrual loans, loans past due 90 days or more and still accruing; (ii) foreclosed assets held for sale; (iii) repossessed assets; and (iv) impaired debt securities.

Non-performing assets decreased $4.4 million during the quarter to $20.4 million at March 31, 2024. The decrease was due to client principal reductions, partial charge-offs on non-accrual loans, and two credits that were 90+ days past due and still accruing at December 31, 2023, which were brought current during the first quarter of 2024. Additionally, one commercial construction credit that was in non-accrual loans at December 31, 2023 was moved to foreclosed assets held for sale during the first quarter of 2024. The non-performing assets to total assets ratio decreased from 0.34% at December 31, 2023 to 0.27% at March 31, 2024. Annualized net charge-offs were 0.10% for the first quarter of 2024 compared to 0.12% in the quarter ended December 31, 2023 and the first quarter of 2023.

The Company continues to monitor the U.S. economic indicators, including the inflation rate, the unemployment rate, commodity prices, interest rates, and potential supply chain disruptions and the impact they may have on the Company’s markets, clients, and prospects. The Company is monitoring the impact of the interest rate environment on the commercial real estate market and enterprise and leverage loans that is currently partially mitigated by low debt-to-equity ratios. As of March 31, 2024, the Company did not identify any systemic issues within its loan portfolio that would materially affect the credit quality of the loan portfolio. However, there could be some risk rating migration in certain sectors of the commercial real estate portfolio in the future as many projects are faced with higher interest rates, operating costs, and property taxes.

46

The table below summarizes our non-performing assets and related ratios as of the dates indicated:


For the Quarter Ended

March 31, 

December 31,

September 30,

June 30,

March 31,

2024

2023

2023

2023

2023

Asset quality

(Dollars in thousands)

Non-accrual loans

$

12,082

$

18,451

$

20,380

$

12,867

$

9,490

Loans 90+ days past due and still accruing


2,925


6,339


15,750


433


868

Total non-performing loans


15,007


24,790


36,130


13,300


10,358

Foreclosed assets held-for-sale


5,377


855

Total non-performing assets

$

20,384

$

24,790

$

36,130

$

13,300

$

11,213

Loans 30 - 89 days past due

$

46,381

$

2,028

$

29,457

$

13,333

$

5,056

Asset quality metrics (%)


Non-performing loans to total loans


0.24

%  

0.40

%  

0.61

%

0.23

%

0.18

%

Non-performing assets to total assets


0.27


0.34


0.50

0.19

0.16

ACL to total loans


1.20


1.20


1.20

1.17

1.15

ACLs + RUC to total loans(1)


1.28


1.30


1.31

1.30

1.30

ACL to non-performing loans


499


296


198

508

629

Classified Loans / (Capital + ACL)


15.9


14.9


14.2

9.7

9.4

Classified Loans / (Capital + ACL + RUC)(1)


15.8


14.8


14.0

9.6

9.3

(1)

Includes the accrual for off-balance sheet credit risk from unfunded commitments.

Deposits and Other Borrowings

At March 31, 2024, our deposits totaled $6.6 billion, an increase of $96 million or 1% from December 31, 2023. The increase included a $126 million increase in money market, NOW and savings deposits and $6 million in time deposits, partially offset by a decrease of $36 million in non-interest-bearing deposits. Approximately 77% of the increase in money market, NOW and savings deposits was from new and existing client money, with the remainder representing an increase in wholesale funding. Other borrowings include FHLB advances, SBA loan secured borrowings, and our trust preferred security and totaled $87 million at both March 31, 2024 and December 31, 2023.

The following table sets forth the maturity of time deposits as of March 31, 2024:


As of March 31, 2024

Three Months or

Three to Six 

Six to Twelve

After Twelve 


Less


Months


Months


Months


Total

(Dollars in thousands)

Time deposits in excess of FDIC insurance limit

$

169,726

$

141,238

$

167,485

$

16,439

$

494,888

Time deposits below FDIC insurance limit


626,115


336,914


221,196


158,023


1,342,248

Total time deposits

$

795,841

$

478,152

$

388,681

$

174,462

$

1,837,136

As of March 31, 2024, the Company had approximately $2.6 billion of uninsured deposits, which is an estimated amount based on the same methodologies and assumptions used for the Bank’s regulatory reporting requirements. Excluding pass-thru accounts where clients have deposit insurance at the correspondent financial institution, our uninsured deposits were $2.2 billion, or 33% of total deposits as of March 31, 2024. The average client account balance as of March 31, 2024 was less than $250 thousand for both individual accounts and business accounts in total after excluding pass-through and insured cash sweep deposits. We have geographic and industry diversity within our deposit base as the majority of our deposits are located in our footprint states of Kansas, Oklahoma, Texas, Missouri, Arizona, Colorado and New Mexico. The Company believes that its current capital ratios and liquidity are sufficient to mitigate the risks of uninsured deposits.

47

Liquidity and Capital Resources

Liquidity

We manage our liquidity based upon factors that include the level and quality of capital and our overall financial condition, the trend and volume of problem assets, our balance sheet risk exposure, the level of deposits as a percentage of total loans, the amount of non-deposit funding used to fund assets, the availability of unused funding sources and off-balance sheet obligations, the availability of assets to be readily converted into cash without undue loss, the amount of cash and liquid securities we hold, and other factors. We also conduct contingency funding plan stress tests at least annually to assess potential liquidity outflows or funding problems resulting from economic disruptions, volatility in the financial markets, unexpected credit events or other significant occurrences deemed potentially problematic by management. The Company’s liquidity strategy is to maintain adequate, but not excessive, liquidity to meet the daily cash flow needs of our clients while attempting to achieve maximum earnings for our stockholders. The Company measures liquidity needs through daily balance sheet monitoring, weekly cash projections and monthly liquidity measures reviewed in conjunction with Board-approved liquidity policy limits. The Company's short-term and long-term liquidity requirements are primarily met through cash flow from operations, redeployment of prepaying and maturing balances in our loan portfolio and security portfolio, increases in client deposits and wholesale deposits. The Company believes that other alternative sources of funds are available to supplement these primary sources to the extent necessary to meet additional liquidity requirements on either a short-term or long-term basis. Liquidity resources can be derived from two sources: (i) on-balance sheet liquidity resources, which represent funds currently on the statement of financial condition and (ii) off-balance sheet liquidity resources, which represent funds available from third-party sources. The Company’s on-balance sheet and off-balance sheet liquidity resources consisted of the following as of the dates indicated:


March 31, 2024


December 31, 2023


(Dollars in thousands)

On-balance sheet liquidity(1)

$

993,376

$

1,021,882

Off-balance sheet liquidity(2)


1,481,420


1,496,225

Total liquidity

$

2,474,796

$

2,518,107

On-balance sheet liquidity as a percent of assets


13

%  


14

%  

Total liquidity as a percent of assets


33

%  


34

%  

(1)On-balance sheet liquidity represents funds on the consolidated statements of financial condition – unaudited. It consists of overnight funds, short-term deposits with other banks, and unpledged AFS securities.
(2)Off-balance sheet liquidity represents funds available from third-party sources including credit lines, FHLB and Federal Reserve Bank.

The consolidated statements of cash flows - unaudited summarize our sources and uses of cash by type of activity for the three-months ended March 31, 2024 and 2023. As of March 31, 2024 and 2023, we had cash and cash equivalents of $207 million and $263 million, respectively. During the three-months ended March 31, 2024 and 2023, operating activities provided $19.8 million and $24.3 million of cash, respectively, while financing activities provided $93.6 million and $271.4 million of cash, respectively. The primary drivers of lower cash provided by financing activities in the first quarter of 2024 were a smaller increase in time deposits, lower line of credit borrowings, and current quarter share repurchases, partially offset by an increase in demand and savings, NOW and money market accounts. Cash usage from investing activities was $161.8 million and $332.9 million for the three-months ended March 31, 2024 and 2023, respectively. The primary driver of lower cash used in the first quarter of 2024 for investing activities was that the prior year first quarter included more loan origination volume.

Off-balance sheet liquidity slightly decreased from December 31, 2023 to March 31, 2024 due to normal fluctuations in our available third party sources.

The Company purchased $1.5 million of common stock during the first three months of 2024 under its previously approved share repurchase program. As of March 31, 2024, $14.4 million remained available for repurchase

48

under our share repurchase program. The amount and timing of such future share repurchases will be dependent on a number of factors, including the price of our common stock, overall capital levels and cash flow needs. There is no assurance that we will repurchase up to the full amount remaining under our program.

Dividends of $155 thousand related to the Series A Non-Cumulative Perpetual Preferred Stock were declared and paid by the Company during the three months ended March 31, 2024. On May 2, 2024, the Board of Directors declared a quarterly dividend on Series A Non-Cumulative Perpetual Preferred Stock in the amount of $20.00 per share to be payable on June 17, 2024 to stockholders of record as of May 31, 2024.

The Company believes that its current on and off-balance sheet liquidity will be sufficient to meet anticipated cash requirements for the next 12 months and thereafter. The Company believes that it has several on and off-balance sheet options to address reductions in cash and cash equivalents in order to maintain appropriate liquidity.

Contractual Obligations and Off-Balance Sheet Arrangements

The Company is subject to contractual obligations made in the ordinary course of business. The obligations include deposit liabilities, other borrowed funds, operating leases, and preferred dividends. To the extent declared by the Board of Directors, the Company pays $0.6 million of cash dividends per year to holders of our preferred stock. Refer to “Note 7: Time Deposits and Other Borrowings” and “Note 4: Leases” within the notes to consolidated financial statements – unaudited for information regarding the Company’s significant contractual cash obligations and contractual obligations to third parties on lease obligations, respectively.

As a financial services provider, the Company is a party to various financial instruments with off-balance sheet risks, such as commitments to extend credit. Off-balance sheet arrangements represent the Company’s future cash requirements. However, a portion of these commitments may expire without being drawn upon. Refer to “Note 12: Commitments and Credit Risk” within the notes to consolidated financial statements – unaudited for a reconciliationlisting of the statutory rateCompany’s off-balance sheet arrangements.

The Company’s short-term and long-term contractual obligations, including off-balance sheet obligations, may be satisfied through the Company’s on-balance sheet and off-balance sheet liquidity discussed above.

Capital Requirements

The Company and the Bank are subject to various regulatory capital requirements administered by the federal banking agencies. The regulatory capital requirements involve quantitative measures of the Company’s

actual income tax expense.
During assets, liabilities, select off-balance sheet items and equity. Failure to meet minimum capital requirements can initiate certain mandatory and possibly additional discretionary actions by regulators that, if undertaken, could have a direct material effect on the three-month periods
endedCompany’s consolidated financial statements. Refer to “Note 9: Regulatory Matters” in the notes to consolidated financial statements – unaudited for additional information. Management believes that as of March 31, 2024, the Company and the Bank met all capital adequacy requirements to which they are subject.

Critical Accounting Policies and Estimates

Our consolidated financial statements are prepared in accordance with GAAP and with general practices within the financial services industry. Application of these principles requires management to make complex and subjective estimates and assumptions that affect the amounts reported in the financial statements and accompanying notes. The Company bases estimates on historical experience and on various other assumptions that it believes to be reasonable under current circumstances. These assumptions form the basis for management judgments about the carrying values of assets and liabilities that are not readily available from independent, objective sources. The Company evaluates estimates on an ongoing basis. Use of alternative assumptions may have resulted in significantly different estimates. Actual results may differ from these estimates.

A discussion of these policies can be found in the section captioned “Critical Accounting Policies and Estimates” in Management’s Discussion and Analysis of Financial Condition and Results of Operations included in the

49

2023 and 2022,Form 10-K. There have been no changes in the Company’s effective tax rate

benefited primarily from
permanent tax differences relatedapplication of critical accounting policies and estimates since December 31, 2023.

Recent Accounting Pronouncements

Refer to tax-exempt interest.

We currently anticipate the Company’s effective tax rate to remain within the
20% to 22% range“Note 1: Nature of Operations and Summary of Significant Accounting Policies” included in the near term.
notes to consolidated financial statements – unaudited included elsewhere in this Form 10-Q.

Non-GAAP Financial Measures

In addition to disclosing financial measures determined in accordance

with U.S. generally accepted accounting principles
(GAAP), the Company discloses certain non-GAAP financial measures including “tangible common
stockholders’ equity,” “tangible
book value per common share,” “adjusted efficiency ratio – FTE,”
“adjusted “adjusted net income,” “adjusted diluted earnings per common share,
diluted,” “adjusted return on average assets,” and “adjusted return on average
common equity.”
We consider the use of select non-GAAP
financial measures and ratios to be useful for financial and operational
decision making and useful in evaluating period-to-period
comparisons. We believe that these non-GAAP financial measures provide meaningful supplemental information
to investors regarding
our performance by excluding certain expenditures or gains that we believe
are not indicative of our primary business operating results.
We believe that management and investors benefit from referring to these non
-GAAPnon-GAAP financial measures in assessing our performance
and when planning, forecasting, analyzing,
and comparing past, present and future periods.

These non-GAAP financial measures should not be considered a substitute for financial information presented

in accordance with
GAAP and you should not rely on non-GAAP financial measures alone as measures of our performance. The non-GAAP financial
measures we present may differ from non-GAAP financial measures used by our peers or other
companies. We compensate for these
limitations by providing the equivalent GAAP measures whenever we present the non-GAAP financial measures and by including
a
reconciliation of the impact of the components adjusted for in the non-GAAP financial measure so
that both measures and the individual
components may be considered when analyzing our performance.

A reconciliation of non-GAAP financial measures to the comparable GAAP financial measures follows.


Quarter Ended

3/31/2024


12/31/2023


9/30/2023


6/30/2023

3/31/2023

Adjusted net income:

(Dollars in thousands, except per share data)

Net income (GAAP)

$

18,223

$

17,651

$

16,863

$

16,047

$

16,108

Add: Acquisition costs


1,300


1,328


338


1,477

Add: Acquisition - Day 1 CECL provision


900


Add: Employee separation


1,300


Add: Loss on bond repositioning

1,130

Less: Tax effect(1)


(510)


(468)


(344)


(310)

Adjusted net income

$

18,223

$

19,571

$

18,623

$

17,341

$

17,275

Preferred stock dividends

155

155

155

103

Diluted weighted average common shares outstanding


49,967,638


49,788,962


49,480,107


48,943,325


49,043,621

Diluted earnings per common share (GAAP)

$

0.36

$

0.35

$

0.34

$

0.33

$

0.33

Adjusted diluted earnings per common share

$

0.36

$

0.39

$

0.37

$

0.35

$

0.35

(1)Represents the tax impact of the adjustments at a tax rate of 21.0%, plus permanent tax expense associated with merger related transactions.

50


Quarter Ended

3/31/2024


12/31/2023


9/30/2023


6/30/2023

3/31/2023

Adjusted return on average assets:


(Dollars in thousands, except per share data)

Net income

$

18,223

$

17,651

$

16,863

$

16,047

$

16,108

Adjusted net income


18,223


19,571


18,623


17,341


17,275

Average assets

$

7,344,102

$

7,231,611

$

7,114,228

$

6,929,972

$

6,712,801

Return on average assets (GAAP)


1.00

%  


0.97

%  


0.94

%


0.93

%  


0.97

%  

Adjusted return on average assets


1.00

%  


1.07

%  


1.04

%


1.00

%  


1.04

%  


Quarter Ended

3/31/2024


12/31/2023


9/30/2023


6/30/2023

3/31/2023

Adjusted return on average common equity:


(Dollars in thousands, except per share data)

Net income

$

18,223

$

17,651

$

16,863

$

16,047

$

16,108

Preferred stock dividends

155

155

155

103

Net income attributable to common stockholders

$

18,068

$

17,496

$

16,708

$

15,944

$

16,108

Adjusted net income


18,223


19,571


18,623


17,341


17,275

Preferred stock dividends

155

155

155

103

Adjusted net income attributable to common stockholders

$

18,068

$

19,416

$

18,468

$

17,238

$

17,275

Average common equity

$

701,598

$

647,882

$

650,494

$

639,741

$

619,952

Return on average common equity (GAAP)


10.36

%  


10.71

%  


10.19

%


10.00

%  


10.54

%

Adjusted return on average common equity


10.36

%  


11.89

%  


11.26

%


10.81

%  


11.30

%


Quarter Ended

3/31/2024


12/31/2023


9/30/2023


6/30/2023

3/31/2023

Tangible common stockholders’ equity:


(Dollars in thousands, except per share data)

Total stockholders’ equity (GAAP)

$

714,971

$

708,143

$

643,051

$

651,483

$

645,491

Less: goodwill and other intangible assets


30,404


31,335


32,293


27,457


28,259

Less: preferred stock

7,750

7,750

7,750

7,750

7,750

Tangible common stockholders’ equity

$

676,817

$

669,058

$

603,008

$

616,276

$

609,482

Common Shares outstanding at end of period


49,400,466


49,335,888


49,295,036


48,653,487


48,600,618

Book value per common share (GAAP)

$

14.47

$

14.35

$

13.04

$

13.39

$

13.28

Tangible book value per common share

$

13.70

$

13.56

$

12.23

$

12.67

$

12.54

51

56
Quarter Ended
3/31/2023
12/31/2022
9/30/2022
6/30/2022
3/31/2022
(Dollars in thousands, except per share data)
Adjusted net income:
Net income (GAAP)
$
16,108
$
11,946
$
17,280
$
15,545
$
16,828
Add: Acquisition costs
1,477
3,570
81
239
-
Add: Acquisition - Day 1 CECL
provision
-
4,400
-
-
-
Add: Employee separation
-
-
-
1,063
-
Less: Tax effect
(1)
(310)
(2,045)
(17)
(273)
-
Adjusted net income
$
17,275
$
17,871
$
17,344
$
16,574
$
16,828
Diluted weighted average common shares
outstanding
49,043,621
49,165,578
49,725,207
50,203,725
50,910,490
Earnings per common share – diluted (GAAP)
$
0.33
$
0.24
$
0.35
$
0.31
$
0.33
Adjusted earnings per common share – diluted
$
0.35
$
0.36
$
0.35
$
0.33
$
0.33
(1)
Represents the tax impact of the adjustments at a tax rate
of 21.0%, plus permanent tax expense associated with
merger related
transactions
Quarter Ended
3/31/2023
12/31/2022
9/30/2022
6/30/2022
3/31/2022
(Dollars in thousands)
Adjusted return on average assets:
Net income (GAAP)
$
16,108
$
11,946
$
17,280
$
15,545
$
16,828
Adjusted net income
17,275
17,871
17,344
16,574
16,828
Average assets
$
6,712,801
$
6,159,783
$
5,764,347
$
5,545,657
$
5,563,738
Return on average assets (GAAP)
0.97
%
0.77
%
1.19
%
1.12
%
1.23
%
Adjusted return on average assets
1.04
%
1.15
%
1.19
%
1.20
%
1.23
%
Quarter Ended
3/31/2023
12/31/2022
9/30/2022
6/30/2022
3/31/2022
(Dollars in thousands)
Adjusted return on average equity:
Net income (GAAP)
$
16,108
$
11,946
$
17,280
$
15,545
$
16,828
Adjusted net income
17,275
17,871
17,344
16,574
16,828
Average equity
$
620,210
$
589,587
$
613,206
$
614,541
$
653,747
Return on average equity (GAAP)
10.53
%
8.04
%
11.18
%
10.15
%
10.44
%
Adjusted return on average equity
11.30
%
12.03
%
11.22
%
10.82
%
10.44
%
Quarter Ended
3/31/2023
12/31/2022
9/30/2022
6/30/2022
3/31/2022
(Dollars in thousands, except per share data)
Tangible common stockholders' equity:
Total stockholders' equity (GAAP)
$
645,491
$
608,599
$
580,547
$
608,016
$
623,199
Less: goodwill and other intangible assets
28,259
29,081
71
91
110
Less: preferred stock
7,750
-
-
-
-
Tangible common stockholders' equity
$
609,482
$
579,518
$
580,476
$
607,925
$
623,089
Tangible book value per common share:
Tangible common stockholders' equity
$
609,482
$
579,518
$
580,476
$
607,925
$
623,089
Common shares outstanding at end of period
48,600,618
48,448,215
48,787,696
49,535,949
49,728,253
Book value per common share (GAAP)
$
13.28
$
12.56
$
11.90
$
12.27
$
12.53
Tangible book value per common share
$
12.54
$
11.96
$
11.90
$
12.27
$
12.53


Quarter Ended


3/31/2024


12/31/2023


9/30/2023


6/30/2023

3/31/2023

(Dollars in thousands, except per share data)

Adjusted Efficiency Ratio - FTE(1)


Non-interest expense

$

37,505

$

35,049

$

36,354

$

37,412

$

38,092

Less: Acquisition costs


(1,300)


(1,328)


(338)


(1,477)

Less: Core deposit intangible amortization


(931)


(957)


(922)


(802)


(822)

Less: Employee separation


(1,300)


Adjusted Non-interest expense (numerator)

$

36,574

$

32,792

$

34,104

$

34,972

$

35,793

Net interest income


56,594


56,954


55,127


54,539


58,221

Tax equivalent interest income(1)


536


654


707


750


797

Non-interest income


5,589


4,483


5,981


5,779


4,421

Add: Loss on bond repositioning

1,130

Total tax-equivalent income (denominator)

$

62,719

$

63,221

$

61,815

$

61,068

$

63,439

Efficiency Ratio (GAAP)


60.31

%  


57.05

%  


59.49

%


62.02

%


60.81

%

Adjusted Efficiency Ratio - FTE(1)


58.31

%  


51.87

%  


55.17

%


57.27

%


56.42

%

57
Quarter Ended
3/31/2023
12/31/2022
9/30/2022
6/30/2022
3/31/2022
(Dollars in thousands)
Adjusted Efficiency Ratio - FTE
(1)
Non-interest expense
$
38,092
$
36,423
$
28,451
$
29,203
$
27,666
Less: Acquisition costs
(1,477)
(3,570)
(81)
(239)
-
Less: Core deposit intangible amortization
(822)
(291)
-
-
-
Less: Employee separation
-
-
-
(1,063)
-
Adjusted Non-interest expense (numerator)
$
35,793
$
32,562
$
28,370
$
27,901
$
27,666
Net interest income
58,221
54,015
49,695
46,709
43,115
Tax equivalent interest income
(1)
797
818
820
808
775
Non-interest income
4,421
4,359
3,780
4,201
4,942
Total tax-equivalent income (denominator)
$
63,439
$
59,192
$
54,295
$
51,718
$
48,832
Efficiency Ratio (GAAP)
60.81
%
62.40
%
53.20
%
57.36
%
57.57
%
Adjusted Efficiency Ratio - FTE
(1)
56.42
%
55.01
%
52.25
%
53.95
%
56.66
%
(1)
Tax exempt income (tax-free municipal securities) is
calculated on a tax equivalent basis. The incremental
tax rate used is 21.0%.
Analysis of Financial Condition
Investment portfolio
The objective of the investment portfolio is to optimize earnings, manage
credit and interest rate risk, ensure adequate liquidity,
and meet pledging and regulatory capital requirements. The securities portfolio is also maintained
to serve as a contingent, on-balance
sheet source of liquidity. As of March 31, 2023, available-for-sale investments totaled $751 million, an increase
of $64 million from
December 31, 2022.
The increase in the securities portfolio was driven by the purchase of
$81 million in SBA securities and $12 million in tax-exempt
municipal securities and a $15 million reduction in the unrealized loss on available
-for-sale securities. The increase was partially offset
by the sale of $37 million in tax-exempt municipal securities at a modest gain
as we intentionally improved the liquidity of the portfolio
during the quarter. For additional information, see “Note 2: Securities” in
the notes to consolidated financial statements
– unaudited.
(1)Tax exempt income (tax-free municipal securities) is calculated on a tax equivalent basis. The incremental tax rate used is 21.0%.

Table of Contents
58
Loan Portfolio
Refer to “Note 3: Loans and Allowance for Credit Losses” within the notes to consolidated financial statements –
unaudited for additional information regarding the
Company’s loan portfolio. As of March 31, 2023, gross loans, net of unearned fees increased $275 million or
5% from December 31, 2022.
The following table presents the balance
and associated percentage change of each segment within our portfolio
as of the dates indicated:
As of March 31,
2023
As of December 31,
2022
December 31, 2022
vs.
March 31, 2023
% Change
(Dollars in thousands)
Commercial and industrial
$
986,636
$
1,017,678
(3.1)
%
Commercial and industrial lines of credit
1,047,280
957,254
9.4
Energy
193,859
173,218
11.9
Commercial real estate
1,808,888
1,718,947
5.2
Construction and land development
845,085
794,788
6.3
Residential real estate
412,334
409,124
0.8
Multifamily real estate
295,469
237,984
24.2
Consumer
58,088
63,736
(8.9)
Total
$
5,647,639
$
5,372,729
5.1
%
59
The following table shows the contractual maturities of our gross loans and
sensitivity to interest rate changes:
As of March 31, 2023
Due in One Year or Less
Due in One Year through
Five Years
Due in Five Year through
Fifteen Years
Due after Fifteen Years
Fixed Rate
Adjustable
Rate
Fixed Rate
Adjustable
Rate
Fixed Rate
Adjustable
Rate
Fixed Rate
Adjustable
Rate
Total
(Dollars in thousands)
Commercial and industrial
$
50,578
$
113,038
$
327,978
$
358,192
$
52,576
$
64,189
$
19,589
$
496
$
986,636
Commercial and industrial
lines of credit
74,724
395,100
29,926
512,736
17,668
17,126
-
-
1,047,280
Energy
-
30,660
775
162,424
-
-
-
-
193,859
Commercial real estate
78,596
218,319
502,179
480,495
185,242
276,256
6,462
61,339
1,808,888
Construction and land
development
27,932
105,116
72,762
541,254
28,483
15,881
4,747
48,910
845,085
Residential real estate
7,510
2,999
21,965
5,301
65,518
5,530
371
303,140
412,334
Multifamily real estate
4,340
43,640
108,450
123,038
4,808
10,410
-
783
295,469
Consumer
5,783
10,210
5,171
13,749
343
20,944
-
1,888
58,088
Total
$
249,463
$
919,082
$
1,069,206
$
2,197,189
$
354,638
$
410,336
$
31,169
$
416,556
$
5,647,639
Provision and Allowance for Credit Losses
The ACL at March 31, 2023 represents our best estimate of the expected credit losses in the Company’s loan portfolio and off-balance
sheet commitments, measured over the
contractual life of the underlying instrument.
For the Quarter Ended
March 31,
December 31,
September 30,
June 30,
March 31,
2023
2022
2022
2022
2022
(Dollars in thousands)
Provision for credit losses - loans
$
4,996
$
4,700
$
1,923
$
1,690
$
(316)
Provision for credit losses - off-balance sheet
(575)
1,957
1,411
445
(309)
Allowance for credit losses - loans
65,130
61,775
55,864
55,817
55,231
Allowance for credit losses - off-balance sheet
8,113
8,688
6,731
5,320
4,875
Net charge-offs
$
1,641
$
(296)
$
1,876
$
1,104
$
1,081
The ACL increased $2.8 million during the quarter.
Provision expense of $4.4 million was driven by loan growth partially offset by improvement
in qualitative factors, in part
due to continued improvement in credit quality.
In addition, $1.6 million in charge-offs on two commercial and industrial
loans offset the provision expense for the quarter.
The
reserve on unfunded commitments decreased $0.6 million due to higher
line utilization in the quarter.
60
The table below presents the allocation of the allowance for credit losses as of the dates
indicated.
The allocation in one portfolio segment does not preclude its availability to
absorb losses in other segments.
March 31, 2023
December 31, 2022
ACL
Amount
Percent of
ACL to
Total ACL
Percent of
Loans to
Total Loans
ACL
Amount
Percent of
ACL to
Total ACL
Percent of
Loans to
Total Loans
Loans
Off-
Balance
Sheet
Total
Loans
Off-
Balance
Sheet
Total
(Dollars in thousands)
Commercial and industrial
$
12,022
$
174
$
12,196
17
%
17
%
$
12,272
$
245
$
12,517
18
%
19
%
Commercial and industrial
lines of credit
15,207
287
15,494
19
19
14,531
74
14,605
21
18
Energy
4,679
541
5,220
3
3
4,396
787
5,183
7
3
Commercial real estate
20,763
712
21,475
33
33
19,504
700
20,204
29
32
Construction and land
development
5,774
6,324
12,098
15
15
5,337
6,830
12,167
17
15
Residential real estate
3,061
51
3,112
7
7
3,110
35
3,145
4
8
Multifamily real estate
2,880
9
2,889
5
5
2,253
14
2,267
3
4
Consumer
744
15
759
1
1
372
3
375
1
1
Total
$
65,130
$
8,113
$
73,243
100
%
100
%
$
61,775
$
8,688
$
70,463
100
%
100
%
Refer to “Note 3: Loans and Allowance for Credit Losses” within the notes to consolidated financial statements –
unaudited for a summary of the changes in the ACL.
61
Charge-offs and Recoveries
Net charge-offs were $1.6 million for the three-month period ended
March 31, 2023 primarily related to a charge-off of a collateral-dependent
commercial and industrial loan.
The below table provides the ratio of net charge-offs (recoveries) to average
loans outstanding based on our loan categories for the periods indicated:
For the Quarter Ended
March 31,
December 31,
September 30,
June 30,
March 31,
2023
2022
2022
2022
2022
Commercial and industrial
0.51
%
(0.02)
%
-
%
0.28
%
(0.27)
%
Commercial and industrial lines of credit
-
(0.01)
1.10
(0.56)
0.76
Energy
-
(0.46)
1.19
4.77
(1.02)
Commercial real estate
-
-
(0.21)
(0.45)
0.34
Construction and land development
-
-
-
-
-
Residential real estate
-
-
-
0.21
-
Multifamily real estate
-
-
-
-
-
Consumer
-
(0.03)
(0.05)
-
0.05
Total net charge-offs to average loans
0.12
%
(0.02)
%
0.16
%
0.10
%
0.10
%
Non-performing Assets and Other Asset Quality Metrics
Non-performing assets include: (i) non-performing loans, which
includes non-accrual loans, loans past due 90 days or more and still accruing
interest, and loans modified
prior to January 1, 2023 under TDRs that are not performing in accordance with their modified
terms; (ii) foreclosed assets held for sale; (iii) repossessed assets; and (iv) impaired
debt securities.
Credit quality metrics generally improved during the first quarter of 2023.
Non-performing assets decreased to $11.2 million at March 31, 2023 primarily due
to a $1.8 million
decrease from the charge-off of one commercial and industrial loan,
as well as paydowns. The non-performing assets to total assets ratio decreased from 0.64% at
March 31, 2022 to
0.16% at March 31, 2023. In addition, classified loans decreased $0.7 million
during the first quarter of 2023. Net charge-offs were $1.6 million for the first quarter
of 2023
compared to net recoveries of ($0.3) million in the prior quarter and net charge-offs
of $1.1 million in the prior year first quarter.
The Company continues to monitor the U.S. economic indicators, including
the inflation rate, commodity prices, interest rates, and potential supply
chain disruptions and the
impact they may have on the Company’s markets, clients, and prospects. The Company is monitoring
the impact of a rising interest rate environment on the commercial real estate
market and enterprise and leverage loans that is currently partially mitigated
by low debt-to-equity ratios.
As of March 31, 2023, the Company did not identify any systemic issues
within its loan portfolio that would significantly affect the credit quality of the
loan portfolio.
62
The table below summarizes our non-performing assets and related ratios as of
the dates indicated:
For the Quarter Ended
March 31,
December 31,
September 30,
June 30,
March 31,
2023
2022
2022
2022
2022
Asset quality
(Dollars in thousands)
Non-accrual loans
$
9,490
$
11,272
$
16,923
$
27,698
$
33,071
Loans past due 90 days or more and still accruing
868
750
303
2,163
1,534
Total non-performing loans
10,358
12,022
17,226
29,861
34,605
Foreclosed assets held for sale
855
1,130
973
973
973
Total non-performing assets
$
11,213
$
13,152
$
18,199
$
30,834
$
35,578
Loans 30-89 days past due
$
5,056
$
19,519
$
21,383
$
16,635
$
15,950
Asset quality metrics (%)
Non-performing loans to total loans
0.18
%
0.22
%
0.37
%
0.66
%
0.79
%
Non-performing assets to total assets
0.16
0.20
0.31
0.54
0.64
ACL to total loans
1.15
1.15
1.19
1.23
1.27
ACL + RUC to total loans
(1)
1.30
1.31
1.34
1.35
1.38
ACL to non-performing loans
629
514
324
187
160
Classified loans / (total capital + ACL)
9.4
10.1
11.3
12.1
10.8
Classified loans / (total capital + ACL + RUC)
(1)
9.3
%
10.0
%
11.2
%
12.0
%
10.7
%
(1)
Includes the accrual for off-balance sheet credit risk from unfunded commitments.
Deposits and Other Borrowings
The following table sets forth the maturity of time deposits as of March
31, 2023:
As of March 31, 2023
Three Months
or Less
Three to Six Months
Six to Twelve
Months
After Twelve Months
Total
(Dollars in thousands)
Time deposits in excess of FDIC insurance limit
$
34,077
$
22,585
$
198,742
$
119,578
$
374,982
Time deposits below FDIC insurance limit
291,514
254,286
352,729
102,516
1,001,045
Total
$
325,591
$
276,871
$
551,471
$
222,094
$
1,376,027
At March 31, 2023, our deposits totaled $5.8 billion, an increase of $186 million
or 3% from December 31, 2022. The increase included $430 million in time deposits and
$186
million in money market, NOW and savings deposits,
partially offset by a decrease of $430 million in non-interest-bearing deposits.
The increase in time deposits was the result of a
63
$405 million net increase in wholesale funding to support current and expected
loan growth and to partially supplement the decrease in client deposits. The
increase in money market,
NOW, and
savings deposits was driven primarily by increases in money market deposits.
Other borrowings include FHLB advances, a line of credit, SBA loan secured
borrowings, and our trust preferred security.
At March 31, 2023, other borrowings totaled $332
million, a $78 million, or 31% increase from December 31, 2022.
During the three-month period ended March 31, 2023, $6.0 million of FHLB advances matured
and were converted
into a drawdown on the FHLB line of credit and $6.5 million of net FHLB advances
were paid off.
The Company utilized an additional $102.5 million of net draws on the
FHLB line
of credit and the conversion of $6.0 million of FHLB advances
to the FHLB line of credit to support loan growth and changes in deposits, resulting in
a balance of $183.4 million
outstanding on the FHLB line of credit as of March 31, 2023.
As of March 31, 2023, the Company had approximately $2.4 billion of uninsured
deposits, which is an estimated amount based on the same methodologies and assumptions
used for the Bank’s regulatory requirements.
Excluding pass-thru accounts where clients have deposit insurance at the correspondent
financial institution, our uninsured deposits are
$2.0 billion, or 35% of total deposits as of March 31, 2023. The average
client account balance as of March 31, 2023 is less than $250 thousand for both individual
accounts and
business accounts in total after excluding pass-through and ICS deposits. We
have geographic and industry diversity within our deposit base
as the majority of our deposits are located
in our footprint states of Kansas, Oklahoma, Texas,
Missouri,
and Colorado. The Company believes that its current capital ratios and
liquidity are sufficient to mitigate the risks of
uninsured deposits.
64
Liquidity and Capital Resources
Contractual Obligations and Off-Balance Sheet Arrangements
The Company is subject to contractual obligations made in the ordinary
course of business. The obligations include deposit
liabilities, other borrowed funds, and operating leases. Refer to “Note 7: Time
Deposits and Other Borrowings” and “Note 4: Leases”
within the notes to consolidated financial statements – unaudited for
a listing of the Company’s significant
contractual cash obligations
and contractual obligations to third parties on lease obligations, respectively.
As a financial services provider, the Company
is a party to various financial instruments with off-balance sheet risks, such
as
commitments to extend credit. Off-balance sheet arrangements represent
the Company’s future cash requirements.
However, a portion
of these commitments may expire without being drawn upon. Refer to
“Note 15: Commitments and Credit Risk” within the notes to
consolidated financial statements – unaudited for a listing of the Company’s
off-balance
sheet arrangements.
The Company’s short-term and long
-term contractual obligations, including off-balance
sheet obligations, may be satisfied
through the Company’s on-balance
sheet and off-balance sheet liquidity discussed below.
Liquidity
The Company’s liquidity strategy is to maintain adequate, but not excessive,
liquidity to meet the daily cash flow needs of clients
while attempting to achieve adequate earnings for stockholders. The liquidity
position is monitored continuously by management. The
Company's short-term and long-term liquidity requirements are primarily
met through cash flow from operations, redeployment of
prepaying and maturing balances in our loan portfolio and security portfolio,
increases in client deposits and wholesale deposits.
Liquidity resources can be derived from two sources: (i) on-balance
sheet liquidity resources, which represent funds currently on the
statement of financial condition and (ii) off-balance sheet liquidity resources,
which represent funds available from third-party sources.
The Company’s on-balance sheet and off-balance sheet liquidity resources
consisted of the following as of the dates indicated:
March 31, 2023
December 31, 2022
(Dollars in thousands)
Total on-balance sheet liquidity
$
1,014,222
$
986,482
Total off-balance sheet liquidity
1,264,618
770,165
Total liquidity
$
2,278,840
$
1,756,647
On-balance sheet liquidity as a percent of assets
15
%
15
%
Total liquidity as a percent of assets
33
%
27
%
For the three months ended March 31, 2023, the Company’s cash and cash
equivalents declined $37 million from December 31,
2022
to $263 million, representing 4% of total assets. During the three-month period
ended March 31, 2023, the Company increased the
AFS securities portfolio on an amortized cost basis by $49 million, net
of paydowns,
maturities, and amortization.
As of March 31,
2023, the Company had $244 million in securities that could be pledged
and $222 million that could be sold at a net gain based on
market conditions at the time. In addition, the Company increased funded
loans by $276 million, net of payoffs and charge-offs during
the three-month period ended March 31, 2023 that reduced
cash and cash equivalents.
The Company’s time deposits increased by $430 million primarily from
wholesale funding, while savings and money market
deposits increased by $186 million. Non-interest-bearing deposits decreased
$430 million as elevated year-end balances were deployed
by clients in the quarter in addition to clients migrating into savings and
money market accounts.
Other borrowings decreased $17
million during the three-month period ended March 31, 2023, largely related
to a reduction in Federal Funds purchased.
The Company did not purchase any common stock during the first three months of
2023. As of March 31, 2023, $16 million
remains available for repurchase under our share repurchase program. The
amount and timing of such future share repurchases will be
dependent on a number of factors, including the price of our common stock,
overall capital levels and cash flow needs. There is no
assurance that we will repurchase up to the full amount remaining under
our program.
65
During March 2023, the Company offered and sold Series A Preferred Stock for an aggregate purchase price of $7.8 million. No
dividends related to the preferred stock were declared or paid during
the three months ended March 31, 2023.
The Company believes that its current on and off-balance sheet liquidity
will be sufficient to meet anticipated cash requirements
for the next 12 months and thereafter. The Company believes that it has several on and off-balance
sheet options to address any resulting
reductions in cash and cash equivalents in order to maintain appropriate liquidity.
Capital Requirements
The Company and the Bank are subject to various regulatory capital requirements
administered by the federal banking agencies.
The regulatory capital requirements involve quantitative measures of
the Company’s assets, liabilities, select off-balance sheet items and
equity. Failure to meet minimum capital requirements can initiate certain
mandatory and possibly additional discretionary actions by
regulators that, if undertaken, could have a direct material effect on the
Company’s consolidated financial statements. Refer to “Note 10:
Regulatory Matters” in the notes to consolidated financial statements – unaudited
for additional information. Management believes that
as of March 31, 2023, the Company and the Bank met all capital adequacy requirements
to which they are subject.
Critical Accounting Policies and Estimates
Our consolidated financial statements are prepared in accordance
with GAAP and with general practices within the financial
services industry. Application of these principles requires management to make complex and subjective estimates and
assumptions that
affect the amounts reported in the financial statements and accompanying
notes. The Company bases estimates on historical experience
and on various other assumptions that it believes
to be reasonable under current circumstances. These assumptions form the basis for
management judgments about the carrying values of assets and liabilities that are
not readily available from independent, objective
sources. The Company evaluates estimates on an ongoing basis. Use of alternative assumptions
may have resulted in significantly
different estimates. Actual results may differ from these estimates.
A discussion of these policies can be found in the section captioned “Critical Accounting Policies and Estimates” in
Management’s Discussion and Analysis of Financial Condition and Results of Operations included in the 2022 Form
10-K.
There have
been no changes in the Company’s application of critical accounting policies
and estimates since December 31, 2022.
Recent Accounting Pronouncements
Refer to “Note 1: Nature of Operations and Summary of Significant Accounting Policies” included in the notes to consolidated
financial statements – unaudited included elsewhere in this Form 10-Q.
66

ITEM 3.QUANTITATIVE AND QUALITATIVE DISCLOSURES ABOUT MARKET RISK

Interest Rate Risk

A primary component of market risk is interest rate volatility. Interest rate risk management is a key element of the

Company’s
statement of financial condition management. Interest rate risk is the risk that
net interest margins will erode over time due to changing
market conditions. Many factors can cause margins to erode:erode including, without limitation, (i) lower loan demand;
(ii) increased competition for funds; (iii) weak
pricing policies; (iv) statement of financial condition mismatches; and
(v) changing liquidity demands. The objective is to maximize
income while minimizing interest rate risk. The Company manages its sensitivity position using
its interest rate risk policy. The
management of interest rate risk is a three-step process and involves:
(i) measuring the interest rate risk position; (ii) assessing policy constraints;
and (iii) strategic review and implementation.

Our exposure to interest rate risk is managed by the Asset/Liability Committee (“ALCO”). The in accordance with policies approved by the Board of Directors. ALCO uses a combination of

three systems to measure the statement of financial condition’s interest rate
risk position. The three systems in combination are expected
to provide a better overall result than a single system alone. The three systems include:
(i) gap reports; (ii) earnings simulation; and (iii)
economic value of equity. The ALCO’s primary tools to change theinstruments for managing interest rate risk position are:include: (i) modifying the duration of interest-bearing liabilities; (ii) modifying the duration of interest-earning assets, including our investment portfolio duration;
(ii)
deposit
and borrowing mix;portfolio; and (iii) entering into on-balance sheet derivatives. The Company may utilize interest swaps for the purpose of managing interest rate risk, including forwards, interest rate caps, floors, collars, corridors and swaptions.

The

52

ALCO evaluates interest rate risk using a rate shock method and rate ramp method. In a rate shock analysis, rates change

immediately,
and the change is sustained over the time horizon. In a rate ramp analysis, rate changes
occur gradually over time.
Management reviews and utilizes both methods in managing interest rate risk,
risk; however, both methods represent a risk indicator, not a
forecast. The following tables summarize the simulated changes in net interest income and
fair value of equity over a 12-month horizon
using a rate shock and rate ramp method as of the dates indicated:
Hypothetical Change in Interest Rate - Rate Shock
March 31, 2023
March 31, 2022
Change in Interest
Rate (Basis Points)
Percent change in net
interest income
Percent change in fair
value of equity
Percent change in net
interest income
Percent change in fair
value of equity
+300
2.0
%
(18.4)
%
6.5
%
(8.1)
%
+200
1.3
(12.3)
3.9
(4.6)
+100
0.6
(5.8)
1.6
(2.0)
Base
-
%
-
%
-
%
-
%
-100
(0.7)
5.7
NA
(1)
NA
(1)
-200
(1.7)
11.7
NA
(1)
NA
(1)
-300
(5.3)
17.6
NA
(1)
NA
(1)
(1)
The Company excluded the down rate environment from its analysis due to the low interest rate environment.
Hypothetical Change in Interest Rate - Rate Ramp
March 31, 2023
March 31, 2022
Change in Interest Rate
(Basis Points)
Percent change in net interest
income
Percent change in net interest
income
+300
(0.1)
%
2.8
%
+200
(0.1)
1.6
+100
-
0.6
Base
-
%
-
%
-100
0.1
NA
(1)
-200
0.1
NA
(1)
-300
(0.6)
NA
(1)
(1)
The Company excluded the down rate environment from its analysis due to the low interest rate environment.
67

Hypothetical Change in Interest Rate - Rate Shock


March 31, 2024

March 31, 2023


Change in Interest Rate

Percent Change in

Percent Change in

Percent Change in

Percent Change in


(Basis Points)


Net Interest Income


Fair Value of Equity


Net Interest Income


Fair Value of Equity


+300


(4.4)

%  

(22.9)

%  

2.0

%  

(18.4)

%

+200


(3.0)


(15.8)


1.3


(12.3)

+100


(1.5)


(8.0)


0.6


(5.8)

Base


%  

%  

%  

%

-100


2.1


8.1


(0.7)


5.7

-200


4.3


16.3


(1.7)


11.7

-300


5.6


26.8


(5.3)


17.6

Hypothetical Change in Interest Rate - Rate Ramp


March 31, 2024

March 31, 2023

Change in Interest Rate

Percent Change in

Percent Change in

(Basis Points)


Net Interest Income


Net Interest Income


+300

(2.3)

%  

(0.1)

%

+200


(1.5)


(0.1)

+100


(0.9)


Base


%  

%

-100


0.8


0.1

-200


1.8


0.1

-300


2.6


(0.6)

The Company’s position is slightly assetliability sensitive as of March 31, 2023

which decreased compared to both2024 and has changed from an asset sensitive position as of March 31, 2022 and
December 31, 20222023 primarily due to the drastic changeexpected repricing of interest-bearing liabilities as compared to repricing of earning assets. Loans remain the largest portion of the Company’s variable rate earning assets, and $4.5 billion, or 71%, of loans mature or reprice within the twelve-month period following March 31, 2024, including $3.6 billion that repriced in market rates fromApril 2024. The Company expects $5.6 billion of interest-bearing liabilities will reprice in the prior year.
Compared to December 31, 2022,next twelve months which consists of short duration time deposits and indexed client deposits. Approximately 95% of the Company’s
position is slightly less asset sensitive due time deposits mature within the next twelve months, with 48% in the second quarter of 2024. In addition, the Company has 26% of its deposits indexed to the reductionfederal funds rate. The Company also holds a $250 million interest rate collar, which was executed in demand deposits.July 2022 and became effective in January 2024, and increases the Company’s liability sensitive position. The Company continuously monitors the interest rate environment and believes that derivative strategies to protect net interest margin are available if needed. Additional information regarding the Company’s on-balance sheet derivative activity is incorporated herein from “Note 6: Derivatives and Hedging” within the notes to consolidated financial statements – unaudited.

The models the Company uses include assumptions regarding interest rates and balance changes. The aggregate

non-maturity beta assumption utilized as of March 31,
2023 2024 was approximately 60%57%, which is slightly higher thanunchanged from our previous
assumption due to continued competitive and pricing pressure
on deposits. assumption. Other key assumptions updated thisduring the first quarter of 2024 include updated
deposit decay rates, new businessloan spreads and updatingupdated market
yield curves. Other assumptions included in the model that are periodically
updated include deposit decay rates, loan prepayments and call provisions within
investment and debt holdings.
The Company is monitoring interest rate sensitivity closely as $4.2 billion or 62%
of earning assets
mature or reprice within the twelve-month period following March 31, 2023,
including $3.1 billion that repriced in the first month. $4.9
billion of interest-bearing liabilities mature or reprice over the same twelve-month
period. As of March 31, 2023 and December 31,
2022, the investment portfolio duration was approximately 5.2 years.
The Company is reviewing additional options to manage the
statement of financial condition sensitivity based on the interest rate environment
and composition of assets and liabilities in the next
twelve months and beyond.
The models the Company uses include These assumptions regarding interest rates
while balances remain unchanged. These assumptions
are inherently uncertain and, as a result, the model cannot precisely estimate net interest income
or precisely predict the impact of higher
or lower interest rates on net interest income. Actual results will differ from simulated results due to timing,

53

magnitude,

and frequency
of interest rate changes as well as changes in market conditions, customerclient behavior
and management strategies, among other factors.

ITEM 4. CONTROLS AND PROCEDURES

Controls and Procedures

Evaluation of Disclosure Controls and Procedures

The Company’s management, with the participation of the Company’s Chief Executive

Officer and Chief Financial Officer, has
evaluated the effectiveness of the Company’s disclosure controls and procedures
(as (as defined in Rule 13a-15(e) under the Securities
Exchange Act of 1934 (“Exchange Act”)) as of March 31, 2023.2024. Based on that evaluation, the Company’s Chief Executive Officer and
Chief Financial Officer concluded that the Company’s disclosure controls
and procedures were effective as of March 31, 2023.
2024.

Changes in Internal Control over Financial Reporting

Our internal control over financial reporting continues to be updated

as necessary to accommodate modifications to our business
processes and accounting procedures. There has been no change in our internal
control over financial reporting (as such term is defined
in Rule 13a-15(f) under the Exchange Act) during the first quarter of 20232024 that has materially affected, or
is reasonably likely to
materially affect, our internal control over financial reporting.

PART II - OTHER INFORMATION

ITEM 1.LEGAL PROCEEDINGS

In the normal course of business, we are named or threatened to be named

as a defendant in various lawsuits. Management,
following consultation with legal counsel, does not expect the ultimate disposition
of any or a combination of these matters to have a
material adverse effect on our business, financial condition, results of operations,
cash flows or growth prospects. However, given the
nature, scope, and complexity of the extensive legal and regulatory landscape
applicable to our business (including laws and regulations
governing consumer protection, fair lending, fair labor, privacy, information
security and anti-money laundering and anti-terrorism
laws), we, like all banking organizations, are subject to heightened legal
and regulatory compliance and litigation risk.

ITEM 1A.RISK FACTORS

In addition to the other information set forth in this report, you should carefully consider

the factors discussed in Part I, "Item 1A.
Risk Factors" in our 20222023 Form 10-K, which could materially affect
our business, financial condition, or results of operations in future
periods.
There were no material changes from the risk factors disclosed in the 20222023 Form 10-K.

ITEM 2.

UNREGISTERED SALES OF EQUITY SECURITIES AND USE OF PROCEEDS

(a)

None.

(b)

Not applicable.

54

68
ITEM 2. UNREGISTERED SALES OF EQUITY SECURITIES AND USE OF PROCEEDS
(a)
Sales of Unregistered Securities.
On March 29, 2023, the Company entered into a Securities Purchase Agreement
with certain investors qualified as "accredited
investors," as such term is defined in Rule 501(a) of Regulation D ("Regulation
D") promulgated under the Securities Act of 1933,
as amended (the "Securities Act"), pursuant to which the Company offered and sold 7,750 shares of Series A Preferred Stock, for an
aggregate purchase price of $7,750,000. The offer and sale of the Series A Preferred Stock by the Company was made in reliance
upon the exemptions from registration available under Section 4(a)(2) of
the Securities Act and Rule 506(b) of Regulation D.
Pursuant to the Certificate of Designations for the Series A Preferred Stock filed March 29, 2023, holders of the Series A Preferred
Stock will be entitled to receive, only when, as and if declared by the Company’s
Board of Directors or a duly authorized committee
thereof, non-cumulative cash dividends on the liquidation preference
of $1,000 per share of Series A Preferred Stock at a rate of
8.00% per annum, payable quarterly in arrears. Such dividends are not mandatory
or cumulative and are payable only to the extent
declared by the Company’s Board of Directors or a duly authorized committee
thereof. The Series A
Preferred Stock is perpetual
and has no maturity date and is not subject to any mandatory redemption, sinking
fund, or other similar provisions. The holders of
the Series A
Preferred Stock will not have any right to require the redemption
or repurchase of their shares of Series A Preferred
Stock. The Company may, at its option and subject to required regulatory approval, redeem the Series A Preferred Stock (i) in whole
or in part, from time to time, on March 29, 2028, or on any dividend payment date on or
after March 29, 2028, or (ii) in whole but
not in part at any time within 90 days following a “regulatory capital treatment event”
(as defined in the Certificate of Designations)
in each case at a redemption price equal to $1,000 per share, plus the per share
amount of any declared and unpaid dividends,
without accumulation of any undeclared dividends.
The Company intends to use the net proceeds from the sale of the Series A Preferred Stock for general corporate purposes, including
providing capital to support strategic growth and for making contributions
to the capital of CrossFirst Bank, to support its lending,
investing and other banking activities.
(b)
Not applicable.
(c)
Share Repurchase Program

(c)

Share Repurchase Program

Approximate Dollar Value of Shares

Total Number of

Total Number of Shares

that may yet be Purchased as Part

Calendar

Shares

Average Price

Purchased as Part of Publicly

of Publicly Announced Plans or

Month


Repurchased


Paid per Share


Announced Plans or Programs


Programs

January 1 - 31


$


$

15,872,867

February 1 - 29


29,900

$

13.33


29,900

$

15,345,322

March 1 - 31


82,272

$

13.01


82,272

$

14,403,779

Total


112,172

$

13.10


112,172


On May 10, 2022, the Company announced that its Board of Directors approved

a share repurchase program under which the
Company may repurchase up to $30 million of its common stock. NoThe objective of the program is to give the Company the ability to opportunistically acquire undervalued shares
were repurchased during the three months ended March
31, 2023.
and return capital to stockholders. As of March 31, 2023, $162024, $14.4 million remainsremained available for repurchase under
this share repurchase program. Repurchases
under the program may be made in the open market or privately negotiated
transactions in compliance with SEC Rule 10b-18,
subject to market conditions, applicable legal requirements,
and other relevant factors. The program does not obligate the Company
to acquire any amount of common stock and may be suspended at any time at the
Company's discretion. No time limit has been set
for completion of the program. Our officers and directors are prohibited from trading in the Company’s securities if they are in possession of material non-public information and must at all times comply with the Company’s Insider Trading Policy, including quarterly blackout periods and pre-clearance procedures.

The Company’s ability to pay dividends to its stockholders and repurchase shares is affected by both general corporate law requirements and the regulations and policies of the Federal Reserve applicable to bank holding companies, including the Basel III Capital Rules. In addition, so long as any Series A Preferred Stock remains outstanding, unless full dividends for the most recently completed dividend period have been declared and paid (or declared and the payment amount has been set aside), the Company may not, subject to certain exceptions, declare, pay or set aside for payment any dividend on its common stock, or repurchase or redeem its common stock. The Company's principal source of funds to pay distributions on its common stock, other than further issuances of securities, is dividends received from its wholly owned subsidiaries. Furthermore, the ability of the Company's wholly owned subsidiaries to pay dividends to the Company would depend on the earnings or financial condition of such wholly owned subsidiaries and various business considerations. In addition, various federal and state statutes limit the amount of dividends that the Company's wholly owned subsidiaries may pay to the Company without regulatory approval.

Item 5.Other Information

(a)

None

(b)

None

(c)

Trading Arrangements

During the three months ended March 31, 2024, no director or officer (as defined in Rule 16a-1(f) under the Exchange Act) of the Company adopted or terminated a “Rule 10b5-1 trading arrangement” or “non-Rule 10b5-1 trading arrangement,” as each term is defined in Item 408 of Regulation S-K.

55

69
ITEM 5. OTHER INFORMATION
Effective May 1, 2023, the Company refined its organizational structure
to support future growth, new business lines, recent
acquisitions, and to effectively utilize the skills and expertise on our team as we optimize for
the future.
In connection with the
reorganization:
W. Randall Rapp will continue to serve as President of the Bank with overarching
responsibility for all markets and credit
administration.
Steve Peterson will continue to serve as Chief Banking Officer, with responsibility
for sales management, commercial and
industrial (C&I) strategy, and our business lines.
Amy Fauss will continue to serve as Chief Human Resources Officer and
will also assume the role of Chief Administrative
Officer with overarching responsibility for human resources, services
and support, and technology.
Jenny Payne will continue to serve as the Chief Risk Officer and will report to the
Chief Executive Officer of the Bank and
the Company.
70

ITEM 6. EXHIBITS

Exhibit
Number

Exhibit Description

3.1

Articles of Incorporation of CrossFirst Bankshares, Inc. (incorporated by reference to Exhibit 3.1 to the Company's Registration Statement on Form S-1 as filed with the SEC on July 18, 2019)

3.2

Amendment to Articles of Incorporation of CrossFirst Bankshares, Inc. (incorporated by reference to Exhibit 3.2 to the Company’s Registration Statement on Form S-1 as filed with the SEC on July 18, 2019)

3.3

Bylaws of CrossFirst Bankshares, Inc. (incorporated by reference to Exhibit 3.3 to the Company's Registration Statement on Form S-1 as filed with the SEC on July 18, 2019)

3.4

Certificate of Designations of Series A Non-Cumulative Perpetual Preferred Stock of CrossFirst Bankshares, Inc. (incorporated by reference to Exhibit 3.1 to the Company’s Current Report on Form 8-K as filed with the SEC on March 31, 2023)

31.1*

Certification of Principal Executive Officer pursuant to Rule 13a-14(a) of the Exchange Act, as adopted pursuant to Section 302 of the Sarbanes-Oxley Act of 2002

31.2*

Certification of Principal Financial Officer pursuant to Rule 13a-14(a) of the Exchange Act, as adopted pursuant to Section 302 of the Sarbanes-Oxley Act of 2002

32.1**

Certification pursuant to 18 U.S.C. Section 1350, as adopted pursuant to Section 906 of the Sarbanes-Oxley Act of 2002

101.INS*

XBRL Instance Document - the instance document does not appear in the Interactive Data File because its XBRL tags are embedded within the Inline XBRL document

101.SCH*

XBRL Taxonomy Extension Schema Document

101.CAL*

XBRL Taxonomy Extension Calculation Linkbase Document

101.DEF*

XBRL Taxonomy Extension Definition Linkbase Document

101.LAB*

XBRL Taxonomy Extension Label Linkbase Document

101.PRE*

XBRL Taxonomy Extension Presentation Linkbase Document

104*

Cover Page Interactive Data File (formation in Inline XBRL and contained in Exhibit 101)

Exhibit
Number
Exhibit Description
**
101.INS*
XBRL Instance Document - the instance document does not appear in the Interactive Data File because its XBRL tags
are embedded within the Inline XBRL document
101.SCH*
XBRL Taxonomy Extension Schema Document
101.CAL*
XBRL Taxonomy Extension Calculation Linkbase Document
101.DEF*
XBRL Taxonomy Extension Definition Linkbase Document
101.LAB*
XBRL Taxonomy Extension Label Linkbase Document
101.PRE*
XBRL Taxonomy Extension Presentation Linkbase Document
104*
Cover Page Interactive Data File (formation in Inline XBRL and contained in Exhibit 101)
*
Filed Herewith

**

Furnished Herewith

Indicates a management contract or compensatory plan arrangement

56

71

SIGNATURE

Pursuant to the requirements of the Securities Exchange Act of 1934, the Registrant has duly caused this report to be signed

on its
behalf by the undersigned thereunto duly authorized.

CrossFirst Bankshares, Inc.

Date: May 3, 2024

/s/ Benjamin R. Clouse

Benjamin R. Clouse

Chief Financial Officer

(Duly authorized officer and principal financial officer)

CrossFirst Bankshares, Inc.
Date:
May 5, 2023
/s/ Benjamin R. Clouse

57

Benjamin R. Clouse
Chief Financial Officer
(Duly authorized officer and principal financial officer)