Form10q2023q3p1i0
 
UNITED STATES
SECURITIES AND EXCHANGE COMMISSION
Washington, D.C. 20549

FORM
10-Q

(Mark One)
 
QUARTERLY
 
REPORT PURSUANT TO SECTION 13
 
OR 15(d) OF THE SECURITIES EXCHANGE
ACT OF 1934
For the quarterly period ended
March 31,September 30, 2023
OR
 
TRANSITION REPORT PURSUANT TO
 
SECTION 13 OR 15(d) OF THE SECURITIES EXCHANGE
ACT OF 1934
For the transition period from
 
to
 
Commission File Number:
1-16247

Coronado Global Resources Inc.
(Exact name of registrant as specified in its charter)

Delaware
83-1780608
(State or other jurisdiction of
incorporation or organization)
(I.R.S. Employer
Identification No.)
Level 33, Central Plaza One
,
345 Queen Street
Brisbane, Queensland
,
Australia
4000
(Address of principal executive offices)
(Zip Code)
(
61
)
7
3031 7777
(Registrant’s telephone number, including area code)
N/A
(Former name, former address and former fiscal year, if changed since last report)

Securities registered pursuant to Section 12(b) of the Act:
 
Title of each class
Trading Symbol(s)
Name of each exchange on which registered
None
None
None
Indicate by check
 
mark whether the
 
registrant (1) has filed
 
all reports required
 
to be filed
 
by Section 13 or
 
15(d) of the
 
Securities Exchange
Act of 1934 during
 
the preceding 12 months
 
(or for such shorter
 
period that the registrant
 
was required to file
 
such reports), and (2) has
been subject to such filing requirements for the past 90 days.
Yes
 
 
No
 
Indicate by check mark whether
 
the registrant has submitted electronically
 
every Interactive Data File required to
 
be submitted pursuant
to Rule 405
 
of Regulation S-T
 
(§232.405 of this
 
chapter) during the
 
preceding 12 months
 
(or for such
 
shorter period that
 
the registrant
was required to submit such files).
 
Yes
 
 
No
 
Indicate by check mark whether the registrant
 
is a large accelerated filer,
 
an accelerated filer, a non-accelerated
 
filer, a smaller reporting
company,
 
or
 
an
 
emerging
 
growth
 
company.
 
See
 
the
 
definitions
 
of
 
“large
 
accelerated
 
filer,”
 
“accelerated
 
filer,”
 
“smaller
 
reporting
company,” and “emerging growth company” in Rule 12b-2 of the Exchange Act.
 
Large accelerated filer
Accelerated filer
Non-accelerated filer
Smaller reporting company
Emerging growth company
 
If an emerging
 
growth company, indicate by
 
check mark if
 
the registrant has
 
elected not to
 
use the extended
 
transition period for
 
complying
with any new or revised financial accounting standards provided pursuant to Section 13(a) of the Exchange Act.
 
Indicate by check mark whether the registrant is a shell company (as defined in Rule 12b-2 of the Exchange Act).
 
Yes
 
 
No
The registrant’s
 
common stock is
 
publicly traded on
 
the Australian Securities
 
Exchange in the
 
form of CHESS
 
Depositary Interests, or
CDIs, convertible at the option of
 
the holders into shares of the
 
registrant’s common stock on a 10-for-1 basis.
 
The total number of shares
of the
registrant's common
stock, par
value $0.01
per share,
outstanding on April 30,
October 31,
2023, including
 
shares of
common stock
underlying
CDIs, was
167,645,373
.
Form10q2023q3p2i1 Form10q2023q1p2i0Form10q2023q3p2i0
Steel starts
here.
Quarterly Report on Form 10-Q for the quarterly period ended
 
March 31,ended September 30, 2023.


Coronado Global Resources Inc.
 
Form 10-Q March 31,September 30, 2023
 
4
PART I – FINANCIAL INFORMATION
ITEM 1.
 
FINANCIAL STATEMENTS
Condensed Consolidated Balance Sheets
(In US$ thousands, except share data)
Assets
Note
(Unaudited)
 
March 31, September 30,
2023
December 31,
2022
Current assets:
Cash and restricted cash
 
$
498,300337,097
$
334,629
Trade receivables, net
 
311,980262,601
409,979
Income tax receivable
10,409
Inventories
5
 
185,014207,272
158,018
Other current assets
7
 
75,636118,422
60,188
Assets held for sale
4
 
26,214
Total
 
current assets
 
1,070,930935,801
989,028
Non-current assets:
Property, plant and equipment,
 
net
6
 
1,411,2841,426,769
1,389,548
Right of use asset – operating leases, net
9
 
16,29248,479
17,385
Goodwill
 
28,008
28,008
Intangible assets, net
 
3,2603,159
3,311
Restricted deposits
1516
 
86,45367,942
89,062
Deferred income tax assets
1,567
Other non-current assets
21,24021,291
33,585
Total
 
assets
 
$
2,637,4672,533,016
$
2,549,927
Liabilities and Stockholders’ Equity
Current liabilities:
 
Accounts payable
 
$
69,22484,863
$
61,780
Accrued expenses and other current liabilities
7
324,655
343,691
Dividends payable
8
 
8,311257,461
343,691
Income tax payable
 
110,541
119,981
Asset retirement obligations
 
15,73715,549
10,646
Contract obligations
 
39,97638,495
40,343
Lease liabilities
9
 
7,45216,580
7,720
Other current financial liabilities
 
4,1753,944
4,458
Liabilities held for sale
4
 
12,241
Total
 
current liabilities
 
580,071416,892
600,860
Non-current liabilities:
Asset retirement obligations
 
135,241138,279
127,844
Contract obligations
 
86,75667,924
94,525
Deferred consideration liability
 
248,300254,001
243,191
Interest bearing liabilities
910
 
233,523234,718
232,953
Other financial liabilities
 
7,4985,748
8,268
Lease liabilities
9
 
13,71035,248
15,573
Deferred income tax liabilities
 
103,726109,444
95,671
Other non-current liabilities
 
30,88535,332
27,952
Total
 
liabilities
 
$
1,439,7101,297,586
$
1,446,837
Common stock $
0.01
 
par value;
1,000,000,000
 
shares
authorized,
167,645,373
 
shares issued and outstanding as of March 31,
September 30, 2023 and December 31, 2022
1,677
1,677
Series A Preferred stock $
0.01
 
par value;
100,000,000
 
shares
authorized,
1
 
Share issued and outstanding as of March 31,September 30, 2023 and
and December 31, 2022
Additional paid-in capital
 
1,091,9741,093,845
1,092,282
Accumulated other comprehensive losses
1314
 
(95,926)(121,970)
(91,423)
Retained earnings
 
200,032261,878
100,554
Total
 
stockholders’ equity
 
1,197,7571,235,430
1,103,090
Total
 
liabilities and stockholders’ equity
 
$
2,637,4672,533,016
$
2,549,927
See accompanying notes to unaudited condensed
 
consolidated financial statements.


Coronado Global Resources Inc.
 
Form 10-Q March 31,September 30, 2023
 
5
Unaudited Condensed Consolidated Statements of
 
Operations and Comprehensive Income
(In US$ thousands, except share data)
Three months ended
 
 
March 31,September 30,
Nine months ended
September 30,
Note
2023
2022
2023
2022
Revenues:
Coal revenues
$
738,345707,303
$
936,628863,709
$
2,163,093
$
2,821,334
Other revenues
27,36910,527
10,49710,948
47,977
33,152
Total
 
revenues
3
765,714717,830
947,125874,657
2,211,070
2,854,486
Costs and expenses:
Cost of coal revenues (exclusive of items
shown separately
below)
380,474501,471
357,500385,504
1,262,907
1,140,467
Depreciation, depletion and amortization
39,42334,749
38,00937,508
113,052
126,901
Freight expenses
63,35371,746
59,26463,026
192,542
189,316
Stanwell rebate
39,20837,100
29,05354,575
105,357
124,160
Other royalties
85,95792,700
83,032137,331
268,606
299,711
Selling, general, and administrative
expenses
 
7,77412,221
7,87610,405
29,976
28,657
Total
 
costs and expenses
616,189749,987
574,734688,349
1,972,440
1,909,212
Other (expense) income:
Interest expense, net
(14,665)(14,496)
(17,332)(17,220)
(43,341)
(52,034)
Loss on debt extinguishment
(1,385)
(1,385)
Decrease (increase) in provision for
discounting and credit
losses
3,988536
(428)12
4,255
(572)
Other, net
3,0428,189
(2,790)32,898
17,704
55,191
Total
 
other (expense) income, net
(7,635)(7,156)
(20,550)15,690
Income(22,767)
2,585
(Loss) income before tax
141,890(39,313)
351,841201,998
215,863
947,859
Income tax expensebenefit (expense)
1011
(34,030)18,230
(81,943)(51,423)
(37,775)
(235,391)
Net (loss) income attributable to
Coronado Global Resources
Inc.
$
107,860(21,083)
$
269,898150,575
$
178,088
$
712,468
Other comprehensive income,loss, net of income
taxes:
Foreign currency translation adjustments
1314
(4,503)(18,247)
16,258(41,998)
(30,547)
(75,908)
Total
 
other comprehensive (loss) incomeloss
(4,503)(18,247)
16,258(41,998)
(30,547)
(75,908)
Total
 
comprehensive (loss) income
attributable to Coronado
Global
Resources Inc.
 
$
103,357(39,330)
$
286,156108,577
Earnings$
147,541
$
636,560
(Loss) earnings per share of common stock
Basic
1112
0.64(0.13)
1.610.90
1.06
4.25
Diluted
1112
0.64(0.13)
1.610.90
1.06
4.25
See accompanying notes to unaudited condensed
 
consolidated financial statements.


Coronado Global Resources Inc.
 
Form 10-Q March 31,September 30, 2023
 
6
Unaudited Condensed Consolidated Statements of
 
Stockholders’ Equity
(In US$ thousands, except share data)
Common stock
Preferred stock
Additional
Accumulated other
Total
paid in
comprehensive
Retained
stockholders
Shares
Amount
Series A
Amount
capital
losses
earnings
equity
Balance December 31, 2022
167,645,373
$
1,677
1
$
$
1,092,282
$
(91,423)
$
100,554
$
1,103,090
Net income
107,860
107,860
Other comprehensive loss
(4,503)
(4,503)
Total
 
comprehensive (loss) income
(4,503)
107,860
103,357
Share-based compensation for equity
classified awards
(308)
(308)
Dividends
(8,382)
(8,382)
Balance March 31, 2023
167,645,373
$
1,677
1
$
$
1,091,974
$
(95,926)
$
200,032
$
1,197,757
Net income
91,311
91,311
Other comprehensive loss
(7,797)
(7,797)
Total
comprehensive (loss) income
(7,797)
91,311
83,514
Share-based compensation for equity
classified awards
1,289
1,289
Balance June 30, 2023
167,645,373
$
1,677
1
$
$
1,093,263
$
(103,723)
$
291,343
$
1,282,560
Net loss
(21,083)
(21,083)
Other comprehensive loss
(18,247)
(18,247)
Total
comprehensive loss
(18,247)
(21,083)
(39,330)
Share-based compensation for equity
classified awards
582
582
Dividends
(8,382)
(8,382)
Balance September 30, 2023
167,645,373
$
1,677
1
$
$
1,093,845
$
(121,970)
$
261,878
$
1,235,430
Coronado Global Resources Inc.
Form 10-Q September 30, 2023
7
Common stock
Preferred stock
Additional
Accumulated other
Total
paid in
comprehensive
Retained
stockholders
Shares
Amount
Series A
Amount
capital
losses
earnings
equity
Balance December 31, 2021
167,645,373
$
1,677
1
$
$
1,089,547
$
(44,228)
$
30,506
$
1,077,502
Net income
269,898
269,898
Other comprehensive income
16,258
16,258
Total
 
comprehensive income
16,258
269,898
286,156
Share-based compensation for equity
classified awards
84
84
Dividends
(150,881)
(150,881)
Balance March 31, 2022
167,645,373
$
1,677
1
$
$
1,089,631
$
(27,970)
$
149,523
$
1,212,861
Net income
291,995
291,995
Other comprehensive loss
(50,168)
(50,168)
Total
comprehensive (loss) income
(50,168)
291,995
241,827
Share-based compensation for equity
classified awards
1,731
1,731
Dividends
(200,040)
(200,040)
Balance June 30, 2022
167,645,373
$
1,677
1
$
$
1,091,362
$
(78,138)
$
241,478
$
1,256,379
Net income
150,575
150,575
Other comprehensive loss
(41,998)
(41,998)
Total
comprehensive (loss) income
(41,998)
150,575
108,577
Share-based compensation for equity
classified awards
289
289
Dividends
(125,734)
(125,734)
Balance September 30, 2022
167,645,373
$
1,677
1
$
$
1,091,651
$
(120,136)
$
266,319
$
1,239,511
See accompanying notes to unaudited condensed
 
consolidated financial statements.


Coronado Global Resources Inc.
 
Form 10-Q March 31,September 30, 2023
 
78
Unaudited Condensed Consolidated Statements of
 
Cash Flows
(In US$ thousands)
ThreeNine months ended
March 31,September 30,
2023
2022
Cash flows from operating activities:
Net income
$
107,860178,088
$
269,898712,468
Adjustments to reconcile net income to cash and restricted cash
 
provided by
operating activities:
Depreciation, depletion and amortization
39,423113,052
38,009126,901
Amortization of right of use asset - operating leases
1,0836,894
3,4015,597
Amortization of deferred financing costs
4831,595
4841,451
Loss on debt extinguishment
1,385
Non-cash interest expense
8,08624,748
7,68923,544
Amortization of contract obligations
(7,201)(23,896)
(8,670)(26,883)
Loss on disposal of property,
 
plant and equipment
121393
228433
Equity-based compensation expense
(308)1,563
842,104
Deferred income taxes
8,14113,140
19,02749,929
Reclamation of asset retirement obligations
(737)(3,168)
(1,156)(3,961)
(Decrease) increase in provision for discounting and credit
 
losses
(3,988)(4,255)
428572
Changes in operating assets and liabilities:
Accounts receivable
105,270147,956
(226,983)(170,094)
Inventories
(28,039)(54,704)
(10,574)6,094
Other assets
5,362(5,197)
3,160(30,109)
Accounts payable
7,60125,676
(34,488)(3,371)
Accrued expenses and other current liabilities
(11,883)(69,303)
54,967161,224
Operating lease liabilities
(2,080)(9,311)
(6,202)
Income tax payable
(8,510)(128,418)
(2,086)88,614
Change in other liabilities
2,9427,443
58,4317,073
Net cash provided by operating activities
223,626223,681
171,849945,384
Cash flows from investing activities:
Capital expenditures
(54,839)(182,442)
(37,768)(141,928)
Purchase of restricted and other deposits
(2,403)(26,836)
(3,548)(9,558)
Redemption of restricted and other deposits
3,09526,250
140816
Net cash used in investing activities
(54,147)(183,028)
(41,176)(150,670)
Cash flows from financing activities:
Debt issuance costs and other financing costs
(3,420)
Principal payments on interest bearing liabilities and other financial
 
liabilities
(920)(2,732)
(4,773)(9,773)
Principal payments on finance lease obligations
(31)(98)
(21)(91)
Premiums paid on early redemption of debt
(22)(90)
Dividends paid
(16,755)
(473,900)
Net cash used in financing activities
(951)(23,005)
(4,816)(483,854)
Net increase in cash and restricted cash
168,52817,648
125,857310,860
Effect of exchange rate changes on cash and restricted
 
cash
(4,857)(15,180)
7,679(50,144)
Cash and restricted cash at beginning of period
334,629
437,931
Cash and restricted cash at end of period
$
498,300337,097
$
571,467698,647
Supplemental disclosure of cash flow information:
Cash payments for interest
$
57514,598
$
67719,035
Cash paid for taxes
$
34,000148,775
$
90,888
Restricted cash
$
251
$
251
See accompanying notes to unaudited condensed
 
consolidated financial statements.
Coronado Global Resources Inc.
 
Form 10-Q March 31,September 30, 2023
 
89
NOTES TO UNAUDITED CONDENSED CONSOLIDATED
 
FINANCIAL STATEMENTS
1.
 
Description of Business, Basis of Presentation
(a)
Description of the Business
 
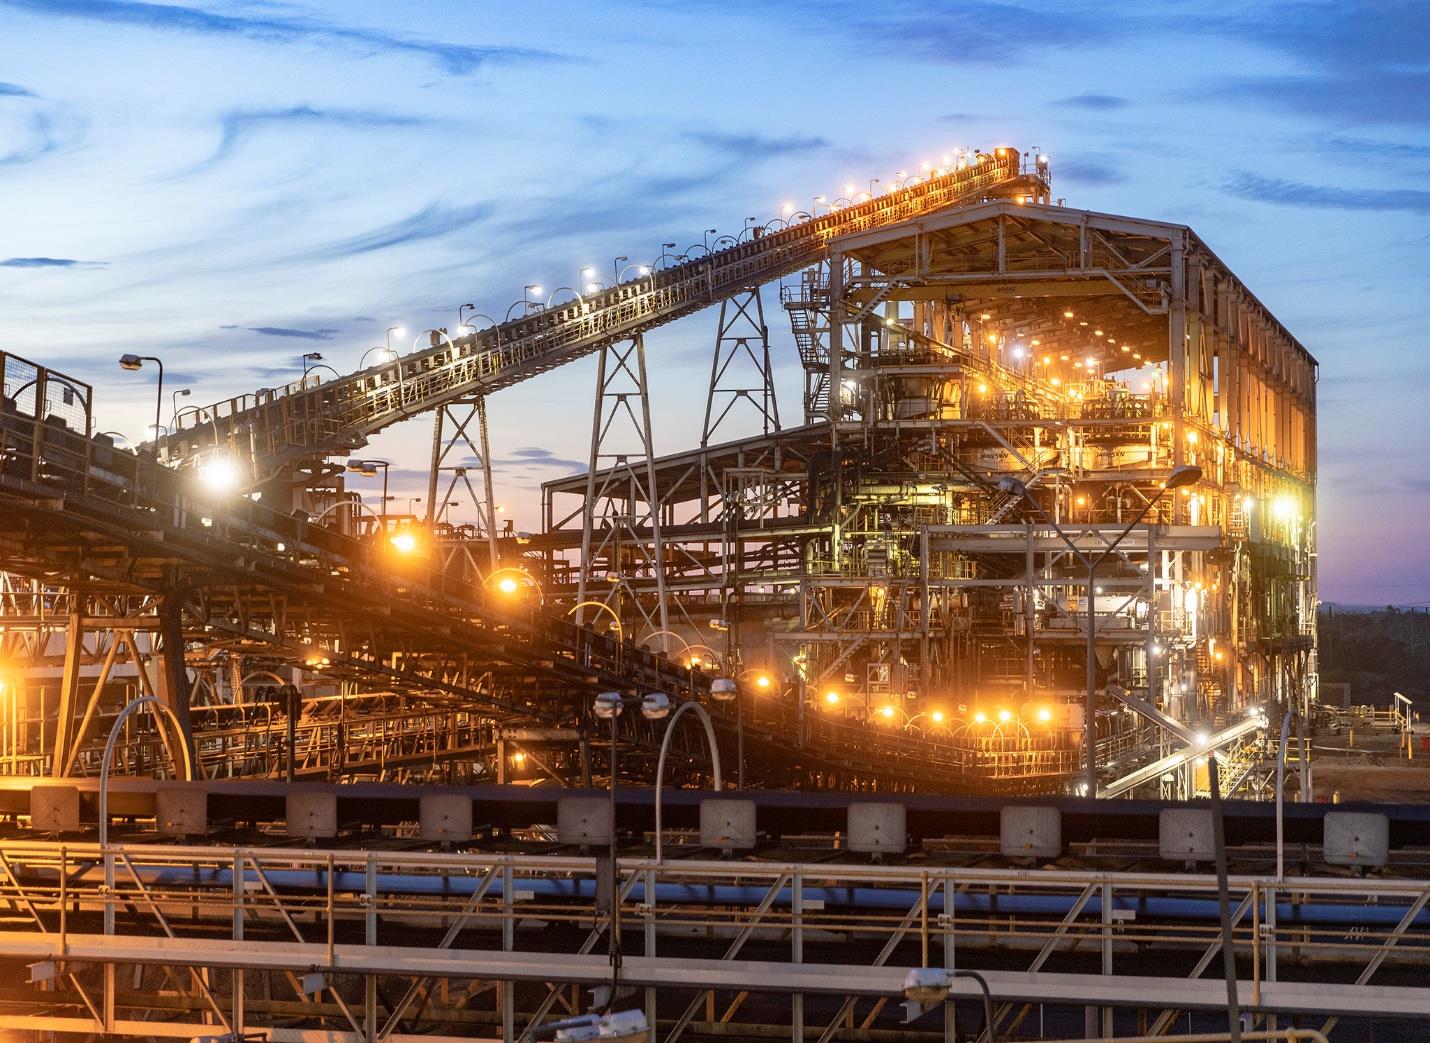
Coronado
 
Global
 
Resources
 
Inc.
 
is
 
a
 
global
 
producer,
 
marketer,
 
and
 
exporter
 
of
 
a
 
full
 
range
 
of
 
metallurgical
coals,
 
an
 
essential
 
element
 
in
 
the
 
production
 
of
 
steel.
 
The
 
Company
 
has
 
a
 
portfolio
 
of
 
operating
 
mines
 
and
development projects in
 
Queensland, Australia, and
 
in the states of
 
Pennsylvania, Virginia and
 
West Virginia
 
in
the United States, or U.S.
 
(b)
 
Basis of Presentation
 
The interim unaudited condensed consolidated financial statements
 
have been prepared in accordance with the
requirements of U.S. generally accepted
 
accounting principles, or U.S. GAAP,
 
and with the instructions to Form
10-Q and Article
 
10 of Regulation
 
S-X related to
 
interim financial reporting
 
issued by the
 
Securities and Exchange
Commission, or the
 
SEC. Accordingly,
 
they do not
 
include all of
 
the information
 
and footnotes required
 
by U.S.
GAAP for complete
 
financial statements and should
 
be read in
 
conjunction with the audited
 
consolidated financial
statements and notes thereto included in the
 
Company’s Annual Report on Form 10-K filed with the
 
SEC and the
Australian Securities Exchange, or the ASX, on February
 
21, 2023.
The
 
interim
 
unaudited
 
condensed
 
consolidated
 
financial
 
statements
 
are
 
presented
 
in
 
U.S.
 
dollars,
 
unless
otherwise
 
stated.
 
They
 
include
 
the
 
accounts
 
of
 
Coronado
 
Global
 
Resources
 
Inc.
 
and
 
its
 
wholly-owned
subsidiaries.
 
References
 
to
 
“US$”
 
or
 
“USD”
 
are
 
references
 
to
 
U.S.
 
dollars.
 
References
 
to
 
“A$”
 
or
 
“AUD”
 
are
references
 
to
 
Australian
 
dollars,
 
the
 
lawful
 
currency
 
of
 
the
 
Commonwealth
 
of
 
Australia.
 
The
 
“Company”
 
and
“Coronado”
 
are
 
used
 
interchangeably
 
to
 
refer
 
to
 
Coronado
 
Global
 
Resources
 
Inc.
 
and
 
its
 
subsidiaries,
collectively, or to Coronado Global Resources Inc., as
 
appropriate to the context.
 
All intercompany balances and
transactions have been eliminated upon consolidation.
 
In
 
the
 
opinion
 
of
 
management,
 
these
 
interim
 
financial
 
statements
 
reflect
 
all
 
normal,
 
recurring
 
adjustments
necessary
 
for
 
the
 
fair
 
presentation
 
of
 
the
 
Company’s
 
financial
 
position,
 
results
 
of
 
operations,
 
comprehensive
income, cash flows and changes in
 
equity
for the periods presented. Balance sheet information
 
presented herein
as of December 31,
 
2022 has been derived from
 
the Company’s audited consolidated balance sheet at
 
that date.
The
Company’s
results
 
of
operations
for
 
the
three
and
nine
months
 
ended March 31,
September
30,
 
2023 are not necessarily
 
indicativeare
not
necessarily indicative of the results that may be expected for
the year ending
December 31, 2023.
2.
 
Summary of Significant Accounting Policies
Please see Note 2 “Summary
 
of Significant Accounting Policies”
 
contained in the audited
 
consolidated financial
statements for the year ended December 31, 2022 included in Coronado Global Resources Inc.’s Annual Report
on Form 10-K filed with the SEC and ASX on February
 
21, 2023.
 
(a) Newly Adopted Accounting Standards
During
 
the
 
period,
 
there
 
has
 
been
 
no
 
new
 
Accounting
 
Standards
 
Update
 
issued
 
by
 
the
 
Financial
 
Accounting
Standards Board that had a material impact on the Company’s
 
consolidated financial statements.
3.
 
Segment Information
The Company has a portfolio of operating
 
mines and development projects in
 
Queensland, Australia, and in the
states
 
of
 
Pennsylvania,
 
Virginia
 
and
 
West
 
Virginia
 
in
 
the
 
U.S.
 
The
 
operations
 
in
 
Australia,
 
or
 
Australian
Operations, comprise
 
the 100%-owned
 
Curragh producing
 
mine complex. The
 
operations in the
 
United States,
or U.S. Operations,
 
comprise
two
 
100%-owned producing
 
mine complexes (Buchanan
 
and Logan),
one
 
100%-
owned idled mine complex (Greenbrier) and
two
 
development properties (Mon Valley
 
and Russell County).
 
The
 
Company
 
operates
 
its
 
business
 
along
two
 
reportable
 
segments:
 
Australia
 
and
 
the
 
United
 
States.
 
The
organization
 
of
 
the
two
 
reportable
 
segments
 
reflects
 
how
 
the
 
Company’s
 
chief
 
operating
 
decision
 
maker,
 
or
CODM, manages
and allocates resources to the various components
 
components of the Company’s business.
The CODM
 
uses Adjusted
 
EBITDA as
 
the primary
 
metric to
 
measure each
 
segment’s
 
operating performance.
Adjusted EBITDA is not a measure of financial performance in accordance with U.S. GAAP.
 
Investors should be
aware that
 
the Company’s
 
presentation of
 
Adjusted EBITDA
 
may not
 
be comparable
 
to similarly
 
titled financial
measures used by other companies.


NOTES TO UNAUDITED CONDENSED CONSOLIDATED
 
FINANCIAL STATESTATEMENTS
 
MENTS (Continued)
Coronado Global Resources Inc.
 
Form 10-Q March 31,September 30, 2023
 
910
Adjusted EBITDA is
 
defined as earnings
 
before interest, taxes,
 
depreciation, depletion and
 
amortization and other
foreign exchange losses. Adjusted EBITDA is
 
also adjusted for certain discrete items that
 
management exclude
in analyzing each
 
of the
 
Company’s segments’ operating performance.
 
“Other and corporate”
 
relates to additional
financial information for
 
the corporate function
 
such as accounting,
 
treasury, legal, human resources,
 
compliance,
and tax.
 
As such, the corporate function is not determined to be a
 
a reportable segment but is discretely disclosed
for purposes of reconciliation to the Company’s
 
unaudited Condensed Consolidated Financial Statements.
Reportable segment
results as
 
of and for
 
the three
and nine
months ended
 
March 31, 2023September 30,
 
2023 and
2022 are
presented below:
(in US$ thousands)
Australia
United
States
Other and
Corporate
Total
Three months ended March 31,September 30, 2023
Total
 
revenues
$
398,661455,774
$
367,053262,056
$
$
765,714717,830
Adjusted EBITDA
13,233(32,353)
185,04247,630
(7,526)(11,899)
190,7493,378
Total
 
assets
1,146,5081,217,712
951,2371,012,399
539,722302,905
2,637,4672,533,016
Capital expenditures
7,23510,625
34,16350,709
55173
41,45361,507
Three months ended March 31,September 30, 2022
Total
 
revenues
$
605,298546,485
$
341,827328,172
$
$
947,125874,657
Adjusted EBITDA
238,96888,035
179,899145,890
(7,880)(10,349)
410,987223,576
Total
 
assets
1,371,2941,405,333
976,326988,728
504,735410,349
2,852,3552,804,410
Capital expenditures
15,96217,289
23,74931,174
92103
39,80348,566
Nine months ended September 30, 2023
Total
revenues
$
1,286,242
$
924,828
$
$
2,211,070
Adjusted EBITDA
35,580
349,160
(29,088)
355,652
Total
assets
1,217,712
1,012,399
302,905
2,533,016
Capital expenditures
34,352
115,917
253
150,522
Nine months ended September 30, 2022
Total
revenues
$
1,730,172
$
1,124,314
$
$
2,854,486
Adjusted EBITDA
523,319
578,183
(28,579)
1,072,923
Total
assets
1,405,333
988,728
410,349
2,804,410
Capital expenditures
64,005
75,595
433
140,033
The reconciliations
 
of Adjusted
EBITDA to
net income
attributable to the
 
Company for
the three and nine months
ended
March 31,ended September 30, 2023 and 2022 are as follows:
Three months ended
 
March 31,Nine months ended
September 30,
September 30,
(in US$ thousands)
2023
2022
2023
2022
Net (loss) income
$
107,860(21,083)
$
269,898150,575
$
178,088
$
712,468
Depreciation, depletion and amortization
39,42334,749
38,00937,508
113,052
126,901
Interest expense (net of interest income)
14,66514,496
17,33217,220
43,341
52,034
Income tax (benefit) expense
34,030(18,230)
81,94351,423
37,775
235,391
Other foreign exchange (gains) lossesgains
(1)
(2,992)(7,859)
1,991(31,917)
(17,265)
(55,064)
Loss on extinguishment of debt
1,385
1,385
Losses (gains) on idled assets held for sale
(2)
1,751456
1,386(1,221)
3,531
621
(Decrease) increase in provision for
discounting and credit
losses
(3,988)(536)
428(12)
(4,255)
572
Consolidated Adjusted EBITDA
$
190,7493,378
$
410,987223,576
$
355,652
$
1,072,923
(1)
 
The balance
 
primarily relates
 
to foreign
 
exchange gains
 
and losses
 
recognized in
 
the translation
 
of short-term
 
inter-entity balances
 
in
certain entities within the group that
 
are denominated in currencies other than
 
their respective functional currencies. These gains
 
gains and losses
are included in “Other, net” on the unaudited Consolidated Statement
 
of Operations and Comprehensive Income.
 
(2)
 
These losses relate to idled non-core assets
 
that the Company has an active plan to sell.
The
reconciliations
of
capital
expenditures
per
the
Company’s
segment
information
 
to
capital
expenditures
disclosed
on
the
unaudited
Condensed
Consolidated
Statements
of
Cash
Flows
for
the
three
months
ended
sell. Prior to March 31, 2023, and 2022 arethe
Company had idled
assets that were classified as follows:held for sale. Refer
to Note 4 “Assets held for sale” for further details.
Three months ended March 31,
(in US$ thousands)
2023
2022
Capital expenditures per unaudited Condensed Consolidated
Statements of
Cash Flows
$
54,839
$
37,768
Accruals for capital expenditures
4,098
9,510
Payment for capital acquired in prior periods
(11,242)
(7,475)
Advance payment to acquire long lead capital items
(6,242)
Capital expenditures per segment detail
$
41,453
$
39,803


NOTES TO UNAUDITED CONDENSED CONSOLIDATED
 
FINANCIAL STATESTATEMENTS
 
MENTS (Continued)
Coronado Global Resources Inc.
 
Form 10-Q March 31,September 30, 2023
 
1011
The
reconciliations
of
capital
expenditures
per
the
Company’s
segment
information
to
capital
expenditures
disclosed
on
the
unaudited
Condensed
Consolidated
Statements
of
Cash
Flows
for
the
nine
months
ended
September 30, 2023 and 2022 are as follows:
Nine months ended September 30,
(in US$ thousands)
2023
2022
Capital expenditures per unaudited Condensed Consolidated
Statements of
Cash Flows
$
182,442
$
141,928
Accruals for capital expenditures
898
5,580
Payment for capital acquired in prior periods
(11,241)
(7,475)
Advance payment to acquire long lead capital items
(21,577)
Capital expenditures per segment detail
$
150,522
$
140,033
Disaggregation of Revenue
The Company disaggregates the revenue
 
from contracts with customers by
 
major product group for each of
 
the
Company’s
 
reportable
 
segments,
 
as
 
the
 
Company
 
believes
 
it
 
best
 
depicts
 
the
 
nature,
 
amount,
 
timing
 
and
uncertainty of revenues and cash flows.
 
All revenue is recognized at a point in time.
Three months ended March 31,September 30, 2023
(in US$ thousands)
Australia
United States
Total
Product Groups:
Metallurgical coal
$
372,519419,032
$
283,023232,870
$
655,542651,902
Thermal coal
18,28527,783
64,51827,618
82,80355,401
Total
 
coal revenue
390,804446,815
347,541260,488
738,345707,303
Other
(1)
7,8578,959
19,5121,568
27,36910,527
Total
$
398,661455,774
$
367,053262,056
$
765,714717,830
Three months ended March 31,September 30, 2022
(in US$ thousands)
Australia
United States
Total
Product Groups:
Metallurgical coal
$
554,009518,010
$
337,720309,609
$
891,729827,619
Thermal coal
42,28919,246
2,61016,844
44,89936,090
Total
 
coal revenue
596,298537,256
340,330326,453
936,628863,709
Other
(1)
9,0009,229
1,4971,719
10,49710,948
Total
$
605,298546,485
$
341,827328,172
$
947,125874,657
Nine months ended September 30, 2023
(in US$ thousands)
Australia
United States
Total
Product Groups:
Metallurgical coal
$
1,195,413
$
773,184
$
1,968,597
Thermal coal
65,328
129,168
194,496
Total
coal revenue
1,260,741
902,352
2,163,093
Other
(1)
25,501
22,476
47,977
Total
$
1,286,242
$
924,828
$
2,211,070
Nine months ended September 30, 2022
(in US$ thousands)
Australia
United States
Total
Product Groups:
Metallurgical coal
$
1,615,364
$
1,098,186
$
2,713,550
Thermal coal
86,537
21,247
107,784
Total
coal revenue
1,701,901
1,119,433
2,821,334
Other
(1)
28,271
4,881
33,152
Total
$
1,730,172
$
1,124,314
$
2,854,486
(1) Other revenue for the Australian segment includes
 
the amortization of the Stanwell non-market coal
 
supply contract obligation liability.
NOTES TO UNAUDITED CONDENSED CONSOLIDATED
FINANCIAL STATEMENTS
(Continued)
Coronado Global Resources Inc.
Form 10-Q September 30, 2023
12
4.
 
Assets Held for Sale
During
 
the
 
fourth
 
quarter
 
of
 
2020, the
 
Company
 
committed
 
to
 
a
 
plan
 
to
 
sell
 
the
 
Greenbrier
 
mining
 
asset
 
and
determined that all
 
of the criteria
 
to classify assets
 
and liabilities as
 
held for sale
 
were met. The
 
asset is part
 
of
our U.S. segment, located
 
in the State of Virginia
 
in the United States. The
 
Greenbrier asset does not
 
form part
of the Company’s core business strategy and
 
has been idledidle since April 1, 2020.
The
Company
remains
 
committed
to
a
 
plan
to
sell
 
the Greenbrier
 
mining asset,
however,
 
on
March
31,
2023,
the
Company
concluded that the timing of
 
the sale
within
the
next
 
twelve
months
is
uncertain.
 
As such,
the Greenbrier
 
mining
asset
 
nohas
 
longerbeen
 
meetsreclassified
as
held
and
used
since
March
31,
2023,
as
it
does
not
meet
 
the
 
criteria
 
for
classification as held for sale and hassale.
The Greenbrier
 
been reclassified as held for use asmining asset
 
of March 31, 2023, however it remains idle
and the
Company does
not intend
to recommence
operations at
the
idle.mine.
 
The assets and
 
liabilities of Greenbrier met
 
the criteria for
 
classification as held for
 
sale as of
 
December 31, 2022,
therefore the Condensed Consolidated Balance Sheet continues to reflect these assets and liabilities as held for
sale as of that date.
 
5.
 
Inventories
(in US$ thousands)
March 31,
2023
December 31,
2022
Raw coal
$
65,571
$
50,604
Saleable coal
62,375
45,913
To
tal coal inventories
127,946
96,517
Supplies inventory
57,068
61,501
To
tal inventories
$
185,014
$
158,018
Coal inventories measured at its net
realizable value were $
2.1
million
and $
5.0
million as at March 31, 2023
and
December 31,
2022, respectively,
and relates
to coal
designated for
deliveries under
the Stanwell
non-market
coal supply agreement.


(in US$ thousands)
September 30,
2023
December 31,
2022
Raw coal
$
72,839
$
50,604
Saleable coal
80,082
45,913
Total
coal inventories
152,921
96,517
Supplies inventory
54,351
61,501
Total
inventories
$
207,272
$
158,018
Coal inventories measured at
its net realizable value
were $
1.6
million
and $
5.0
million as at September
30, 2023
and December 31, 2022,
respectively,
and primarily relates
to coal designated for
deliveries under the Stanwell
non-market coal supply agreement.
6.
Property, Plant and
Equipment


(in US$ thousands)
September 30,
2023
December 31,
2022
Land
$
27,847
$
27,711
Buildings and improvements
87,900
91,336
Plant, machinery, mining
equipment and transportation vehicles
1,088,959
1,012,844
Mineral rights and reserves
390,394
373,309
Office and computer equipment
9,586
9,488
Mine development
548,733
565,106
Asset retirement obligation asset
76,698
87,877
Construction in process
153,162
82,713
Total
cost of property,
plant and equipment
2,383,279
2,250,384
Less accumulated depreciation, depletion and amortization
956,510
860,836
Property, plant and
equipment, net
$
1,426,769
$
1,389,548


NOTES TO UNAUDITED CONDENSED CONSOLIDATED
 
FINANCIAL STATESTATEMENTS
 
MENTS (Continued)
Coronado Global Resources Inc.
 
Form 10-Q March 31,September 30, 2023
 
1113
6.
7. Other Assets
Property, Plant and
Equipment
(in US$ thousands)
March 31,September 30,
2023
December 31,
2022
LandOther current assets
Prepayments
$
27,68633,761
$
27,71126,831
Buildings and improvementsLong service leave receivable
90,7707,901
91,3367,884
Plant, machinery, miningTax
 
equipment and transportation vehiclescredits receivable
1,055,1064,183
1,012,8444,183
Mineral rights and reservesDeposits to acquire capital items
392,84633,289
373,309
Office and computer equipmentShort term deposits
9,49321,618
9,488
Mine developmentOther
563,75517,670
565,10621,290
Asset retirement obligation asset
76,017
87,877
Construction in process
99,613
82,713
To
tal cost of property,Total
 
plant and equipment
2,315,286
2,250,384
Less accumulated depreciation, depletion and amortization
904,002
860,836
Property, plant and
equipment, netother current assets
$
1,411,284118,422
$
1,389,54860,188
7.
The Company has
other current assets
which includes prepayments,
favorable mineral leases,
long service leave
receivable,
equipment
deposits,
short
term
deposits
and
coalfield
employment
enhancement
tax
credit
receivable.
Short term deposits are term deposits that do not meet
the cash and cash equivalents criteria.
8.
 
Accrued Expenses and Other Current Liabilities
Accrued expenses and other current liabilities consist of the
 
following:
(in US$ thousands)
March 31,September 30,
2023
December 31,
2022
Wages and employee benefits
$
42,14945,355
$
38,687
Taxes
 
other than income taxes
6,9918,123
5,988
Accrued royalties
102,38361,831
117,131
Accrued freight costs
50,51532,290
44,496
Accrued mining fees
89,52081,466
103,492
Acquisition related accruals
11,61211,172
11,669
Other liabilities
21,48517,224
22,228
Total
 
accrued expenses and other current liabilities
$
324,655257,461
$
343,691
Acquisition
 
related
 
accruals
 
is
 
an
 
accrual
 
for
 
the
 
estimated
 
remaining
 
stamp
 
duty
 
payable
 
on
 
the
 
Curragh
acquisition,
including
penalty
interest,
of
$
11.611.2
 
million (A$
(A$
17.017.3
 
million).
Refer
to
Note 14. “Contingencies”
16
“Contingencies”
for
further details.
8. Dividends payable
9.
Leases
On
From time to
 
Februarytime, the Company
 
21,enters into mining
 
2023,services contracts,
which may include
embedded leases
of
mining equipment
and other
contractual agreements
to lease
mining equipment
and facilities.
Based upon
 
the
Company’s
Board assessment
 
of terms within
 
Directorsthese agreements,
 
declaredthe Company classifies
 
a lease as
 
bi-annualeither finance
 
fullyor
operating.
 
franked
During the nine months
 
fixed
ordinary
dividend of $
8.4
million, or
0.5
cents per CDI. On April 5,period ended September 30,
 
2023, the Company paidentered
into a number of agreements
to
lease
mining
equipment.
On
mobilization
of
this
mining
equipment,
the
Company
recognized
right-of-use
assets and operating lease liabilities of $
8.338.9
 
million, netmillion.
As of September 30,
2023, there are additional
operating leases of
mining equipment, which
have not yet been
mobilized, that have
a present value
of minimum lease
payments of approximately $
0.134.0
 
millionmillion. These operating
foreign exchangeleases have commenced in October 2023 with lease terms
 
gain onof
5
 
payment ofyears.
 
dividends
Information related to the Company’s right-of-use
 
certain CDI
holders who
elected to be
paid in
Australian dollars.
assets and related lease liabilities are as follows:


NOTES TO UNAUDITED CONDENSED CONSOLIDATED
 
FINANCIAL STATESTATEMENTS
 
MENTS (Continued)
Coronado Global Resources Inc.
 
Form 10-Q March 31,September 30, 2023
 
1214
9.
Three months ended
Nine months ended
(in US$ thousands)
September 30,
2023
September 30,
2022
September 30,
2023
September 30,
2022
Operating lease costs
$
5,200
$
1,699
$
9,697
$
6,514
Cash paid for operating lease liabilities
4,310
2,039
9,311
6,202
Finance lease costs:
Amortization of right of use assets
32
31
92
130
Interest on lease liabilities
2
4
8
21
Total
finance lease costs
$
34
$
35
$
100
$
151
(in US$ thousands)
September 30,
2023
December 31,
2022
Operating leases:
Operating lease right-of-use assets
$
48,479
$
17,385
Finance leases:
Property and equipment
360
371
Accumulated depreciation
(243)
(186)
Property and equipment, net
117
185
Current operating lease obligations
16,484
7,593
Operating lease liabilities, less current portion
35,248
15,505
Total
operating lease liabilities
51,732
23,098
Current finance lease obligations
96
127
Finance lease liabilities, less current portion
68
Total
Finance lease liabilities
96
195
Current lease obligation
16,580
7,720
Non-current lease obligation
35,248
15,573
Total
Lease liability
$
51,828
$
23,293
September 30,
2023
December 31,
2022
Weighted Average Remaining
Lease Term (Years)
Weighted average remaining lease term – finance
leases
0.75
1.52
Weighted average remaining lease term – operating
leases
3.19
4.11
Weighted Average Discount
Rate
Weighted discount rate – finance lease
7.60%
7.60%
Weighted discount rate – operating lease
9.00%
8.94%
NOTES TO UNAUDITED CONDENSED CONSOLIDATED
FINANCIAL STATEMENTS
(Continued)
Coronado Global Resources Inc.
Form 10-Q September 30, 2023
15
The Company’s operating leases have remaining lease
terms of
1
year to
5
years, some of which include
options
to extend the terms
where the Company deems
it is reasonably certain
the options will be
exercised. Maturities
of lease liabilities as at September 30, 2023, are as follows:
(in US$ thousands)
Operating
Lease
Finance
Lease
Year ending
December 31,
2023
$
5,483
$
33
2024
19,430
66
2025
18,642
2026
11,333
2027
3,213
Thereafter
1,093
Total
lease payments
59,194
99
Less imputed interest
(7,462)
(3)
Total
lease liability
$
51,732
$
96
10.
 
Interest Bearing Liabilities
The following is a summary of interest-bearing liabilities
 
at March 31,September 30, 2023:
 
(in US$ thousands)
March 31,September 30, 2023
December 31, 2022
Weighted Average
Interest Rate at
March 31,September 30, 2023
Final
Maturity
10.75
% Senior Secured Notes
$
242,326
$
242,326
12.14
%
(2)
2026
New ABL Facility
20242026
Discount and debt issuance costs
(1)
(8,803)(7,608)
(9,373)
Total
 
interest bearing liabilities
$
233,523234,718
$
232,953
(1)
Debt issuance costs incurred on the establishment
 
of the ABL Facility has been included within
 
"Other non-current assets" onin the
unaudited Condensed Consolidated Balance Sheet.
(2)
 
Represents the effective interest rate.
Senior Secured Notes
As of
 
March 31,September 30,
 
2023, the
 
Company’s
 
aggregate principal
 
amount of
 
the
10.750
% Senior
 
Secured Notes
due
 
due2026,
or
2026, or
the
Notes,
outstanding
was
$
242.3
 
million.
The
Notes
mature
on
May 15, 2026
 
and
are
senior secured
secured obligations of the Company.
The
 
terms
 
of
 
the
 
Notes
 
are
 
governed
 
by
 
an
 
indenture,
 
dated
 
as
 
of
 
May
 
12,
 
2021,
 
or
 
the
 
Indenture,
 
among
Coronado Finance
 
Pty Ltd,
 
an Australian
 
proprietary
 
company,
 
as issuer,
 
Coronado,
 
as parent
 
guarantor,
 
the
other guarantors
 
party thereto
 
and Wilmington
 
Trust,
 
National Association,
 
as trustee.
 
The Indenture
 
contains
customary
 
covenants
 
for
 
high
 
yield
 
bonds,
 
including,
 
but
 
not
 
limited
 
to,
 
limitations
 
on
 
investments,
 
liens,
indebtedness, asset
 
sales, transactions
 
with affiliates
 
and restricted
 
payments, including
 
payment of
 
dividends
on capital stock. As of March 31,
September 30, 2023, the Company was in compliance
 
compliance with all applicable covenants under the
the Indenture.
The carrying
value of
debt issuance
costs, recorded
as a
direct deduction
fromUnder the
face amount
terms of the
 
Notes,
were $
8.8
Indenture, upon the occurrence of a “Change
 
million and $
9.4
of Control” (as defined in the
 
million at March 31, 2023 and December 31, 2022, respectively.
Indenture), the
issuer
is
ABL Facility
required
to
make
an
offer,
On May 12, 2021, the Company entered into a senior secured asset-based revolving credit agreement providing
foror
 
a
 
multi-currency
asset-based-loan
facility,
or
ABL
Facility,
in
an
initial
principal
amountChange
 
of
 
$
100.0
Control
 
million,
including a $
30.0
million sublimit for
the issuance of
letters of credit
and $
5.0
million for swingline
loans, at any
time outstanding, subject to borrowing base availability.
The ABL Facility matures on
May 12, 2024
.
Borrowings under
the ABL
Facility bear
interest at
a rate
equal to
a Bank
Bill Swap
Bid, or
BBSY,
rate plus
an
applicable
margin.
In
additionOffer,
 
to
 
paying
interest
onrepurchase
 
the
 
outstandingNotes
 
borrowingsat
101
%
 
under
the
ABL
Facility,of
 
the
Company is alsoaggregate principal
 
required to payamount thereof,
 
a fee inplus accrued
 
respect of unutilizedand unpaid
 
commitments, on amountsinterest, if
 
available to beany,
 
drawn
under outstanding letters of credit and certain administrativeto, but
 
fees.
excluding, the
 
repurchase
As at March 31, 2023,
no
date. Alternatively,
 
amounts were drawn and
no
if the
 
letters of credit were outstandingissuer elects
 
under the ABL Facility.
As at March 31, 2023, the Company was in compliance with allto redeem
 
applicable covenants under the ABL Facility.
The carrying valueall of debt
issuance costs, recorded as “Other non-current assets” in
 
the unaudited Consolidated
Balance Sheets, were $
2.0
million and $
2.5
Notes,
 
million at March 31, 2023 and December 31, 2022,during the
 
respectively.12-month period
commencing
on
May 15 of
 
the years set
forth below at
the redemption
prices (expressed
in percentages of
principal amount on
the redemption date) set forth below, plus accrued and unpaid interest to,
but not including, the redemption date,
the issuer is not required to make a Change of Control
Offer:
Period
Redemption price
2023
108.06%
2024
104.03%
2025 and thereafter
100.00%
NOTES TO UNAUDITED CONDENSED CONSOLIDATED
 
FINANCIAL STATESTATEMENTS
 
MENTS (Continued)
Coronado Global Resources Inc.
 
Form 10-Q March 31,September 30, 2023
 
1316
10.
New Asset Based Revolving Credit Facility
On May
8, 2023,
the Company, Coronado Coal
Corporation, a Delaware
corporation and wholly
owned subsidiary
of the Company,
Coronado Finance Pty
Ltd, an Australian
proprietary company
and a wholly
owned subsidiary
of the Company,
or an Australian
Borrower, Coronado
Curragh Pty Ltd,
an Australian proprietary
company and
wholly
owned
subsidiary
of
the
Company,
or
an
Australian
Borrower
and,
together
with
the
other
Australian
Borrower, the Borrowers,
and the other guarantors party
thereto, collectively with the
Company,
the Guarantors
and, together
with the
Borrowers, the
Loan Parties,
entered into
a senior
secured asset-based
revolving credit
agreement in
an initial
aggregate amount
of $
150.0
million, or
the New
ABL Facility,
with Global
Loan Agency
Services Australia
Pty Ltd,
as the
Administrative Agent,
Global Loan
Agency Services
Australia Nominees
Pty
Ltd, as the
Collateral Agent,
the Hongkong and
Shanghai Banking Corporation
Limited, Sydney
Branch, as the
Lender, and DBS Bank
Limited, Australia Branch,
as the
Lender and, together
with the other
Lender, the Lenders.
On August 3, 2023, the Company
satisfied all conditions precedent
under the New ABL Facility,
at which time it
became effective and replaced the predecessor
ABL Facility.
The New
ABL Facility
matures in
August 2026
and provides
for up
to $
150.0
million in
borrowings, including
a
$
100.0
million sublimit for the issuance
of letters of credit and $
70.0
million sublimit as a revolving
credit facility.
Availability under the New
ABL Facility is
limited to an
eligible borrowing base, determined
by applying customary
advance rates to eligible accounts receivable and inventory.
Borrowings under
the New
ABL Facility
bear interest
at a
rate per
annum equal
to an
applicable rate
of
2.80
%
plus BBSY,
for loans denominated in A$, or SOFR, for loans denominated
in US$, at the Borrower’s election.
The New
ABL Facility
is guaranteed
by the
Guarantors.
Amounts outstanding
under the
New ABL
Facility are
secured by
(i) first
priority lien
in the
accounts receivable
and other
rights to
payment, inventory,
intercompany
indebtedness, certain general
intangibles and commercial tort
claims, commodities accounts,
deposit accounts,
securities accounts
and other
related assets
and proceeds
and products
of each
of the
foregoing, collectively,
the New ABL Collateral, (ii)
a second-priority lien on substantially
all of the Company’s
assets and the assets
of
the guarantors, other than the New ABL
Collateral, and (iii) solely in the case of
the obligations of the Australian
Borrower, a featherweight
floating security interest over certain
assets of the Australian Borrower,
in each case,
subject to certain customary exceptions.
The New
ABL Facility
contains customary representations
and warranties
and affirmative and
negative covenants
including, among
others, a
covenant regarding
the maintenance
of leverage
ratio to
be less
than
3.00
times, a
covenant regarding maintenance of interest coverage ratio to be more than
3.00
times, covenants relating to the
payment of dividends, or purchase or redemption of, with respect to any Equity Interests of Holdings or
any of its
Subsidiaries,
covenants
relating
to
financial
reporting,
covenants
relating
to
the
incurrence
of
liens
or
encumbrances, covenants relating to the incurrence or prepayment of certain debt, compliance with laws, use of
proceeds, maintenance of properties, maintenance of insurance, payment obligations, financial accommodation,
mergers and
sales of all
or substantially all
of the Borrowers
and Guarantors’, collectively
the Loan Parties,
assets
and limitations on changes in the nature of the Loan Parties’
business.
Subject
to
customary
grace
periods
and
notice
requirements,
the
New
ABL
Facility
also
contains
customary
events of default.
Under the terms of New ABL Facility,
a Review Event (as defined in the New ABL Facility) is triggered if, among
other matters, a “change of control” (as defined in the
New ABL Facility) occurs.
Following the
occurrence of
a Review
Event, the
Borrowers must
promptly meet
and consult
in good
faith with
the Administrative Agent and the Lenders to agree a
strategy to address the relevant Review Event including but
not limited to a restructure of the terms of the New ABL Facility to the satisfaction of the Lenders
.
If at the end of
a period
of
20
business days
after the
occurrence
of the
Review Event,
the Lenders
are not
satisfied
with the
result of their discussion or meeting with the Borrowers or do not wish to
continue to provide their commitments,
the Lenders may declare all amounts owing
under the ABL Facility immediately due and payable,
terminate such
Lenders’
commitments
to
make
loans
under
the
ABL
Facility,
require
the
Borrowers
to
cash
collateralize
any
letter of credit obligations and/or exercise any and all remedies
and other rights under the New ABL Facility.
To establish
the New ABL Facility, the Company incurred debt issuance costs of $
3.4
million. The Company has
elected an accounting
policy to present debt
issuance costs incurred
before the debt liability
is recognized (e.g.
before the debt
proceeds are received)
as an asset
which will be
amortized ratably
over the term
of the facility.
The costs
will not
be subsequently
reclassified as
a direct
deduction of
the liability.
The carrying
value of
debt
issuance costs, recorded
as “Other
non-current assets” in
the unaudited Condensed
Consolidated Balance Sheet
was $
2.9
million as at September 30, 2023.
NOTES TO UNAUDITED CONDENSED CONSOLIDATED
FINANCIAL STATEMENTS
(Continued)
Coronado Global Resources Inc.
Form 10-Q September 30, 2023
17
As
at
September
30,
2023,
the
letter
of
credit
sublimit
had
been
partially
used
to
issue
$
21.6
million
of
bank
guarantees on
behalf of
the Company
and
no
amounts were
drawn under
the revolving
credit sublimit
of New
ABL Facility.
As at September 30,
2023, the Company was in
compliance with all applicable covenants under the
New ABL Facility.
Predecessor ABL Facility
On
August
3,
2023,
the
New
ABL
Facility
replaced
the
predecessor
ABL
Facility.
As
a
result
of
the
early
termination of the predecessor ABL Facility, the Company recorded a loss on
debt extinguishment of $
1.4
million
in its unaudited
Condensed Consolidated
Statement of
Operations and
Comprehensive Income
for each
of the
three and nine months ended September 30, 2023.
The
foregoing
descriptions
of
the
Notes
and
the
New
ABL
Facility
are
subject
to
the
disclosure
in
Note
17.
“Related Party Transactions” incorporated
herein by reference.
11.
 
Income Taxes
For the threenine months ended March 31, 2023
 
September 30, 2023 and
2022, the Company estimated its
 
its annual effective
tax rate and
and applied this effective tax rate to its
year-to-date pretax income at the end
of the interim reporting period. The tax
tax
effects
of
unusual
or
 
infrequently
occurring
items,
 
including
effects
of
changes
 
in
tax
laws
or
rates
 
and changes
changes in judgment about the
 
realizability of deferred
tax assets, are
reported in the interim period
 
in the interim
period in which they
occur.
occur. The Company’s 2023 estimated
annual effective tax rate
is
24.018.5
%, which has been favorably
impacted by mine
mine depletion deductions in
 
the United States.
The Company had an
 
an income tax expense of
 
of $
34.037.8
 
million based on
on
an
income
before
tax
of
$
215.9
million
for
the
nine
months
ended
September
30,
2023,
which
includes
a
discrete benefit of $
141.92.1
million relating to the prior year for Australia.
Income tax expense of
$
235.4
 
million for the three months ended March 31, 2023.
Income tax
expense of
$
81.9
million for
the threenine
 
months ended September
 
March 31,30, 2022 was calculated
 
2022 was
calculated based
on an
an estimated annual effective tax rate of
23.324.8
% for the period.
The Company utilizes the
 
“more likely than not”
 
standard in recognizing
 
a tax benefit in
 
its financial statements.
For
the
three
nine months
 
ended
March
31, September 30,
 
2023,
the
Company
 
had
no
 
unrecognized
tax
benefits.
 
If
accrual
for
interest
 
or
 
penalties
 
is
 
required,
 
it
 
is
 
the
 
Company’s
 
policy
 
to
 
include
 
these
 
as
 
a
 
component
 
of
 
income
 
tax
expense.
The Company is
 
subject to taxation
 
in the
 
U.S. and its
 
various states, as
 
well as Australia
 
and its
 
various localities.
In the
 
U.S.
 
and
 
Australia, the
 
first tax
 
return
 
was
 
lodged for
 
the
 
year
 
ended December
 
31,
 
2018. In
 
the U.S.,
companies are
 
subject to
 
open tax
 
audits for
 
a period
 
of seven
 
years at
 
the federal
 
level and
 
five years
 
at the
state level.
 
In Australia,
 
companies
 
are subject
 
to open
 
tax audits
 
for a
 
period of
 
four years
 
from the
 
date of
assessment.
The Company assessed the need for valuation allowances by evaluating future taxable income, available for tax
strategies and the reversal of temporary tax differences.
NOTES TO UNAUDITED CONDENSED CONSOLIDATED
FINANCIAL STATEMENTS
(Continued)
Coronado Global Resources Inc.
Form 10-Q September 30, 2023
18
12.
 
Earnings per Share
Basic earnings per
 
share of common
 
stock is computed
 
by dividing net
 
income attributable
 
to the Company
 
for
the period,
 
by the
 
weighted-average
 
number of
 
shares
 
of common
 
stock outstanding
 
during the
 
same period.
 
Diluted earnings per share of common stock is computed
 
by dividing net income attributable to the Company
 
by
the weighted-average number
 
of shares
 
of common
 
stock outstanding adjusted
 
to give
 
effect to potentially
 
dilutive
securities.
Basic and diluted earnings per share was calculated as
 
follows (in thousands, except per share data):
Three months ended March 31,September 30,
Nine months ended September 30,
(in US$ thousands, except per share data)
2023
2022
2023
2022
Numerator:
Net (loss) income attributable to Company
stockholders
 
$
107,860(21,083)
$
269,898150,575
$
178,088
$
712,468
Denominator (in thousands):
 
Weighted-average shares of common stock
outstanding
167,645
167,645
167,645
167,645
Effects of dilutive shares
307
88342
447
185
Weighted average diluted shares of common
stock
outstanding
167,952167,645
167,733167,987
168,092
167,830
(Loss) Earnings Per Share (US$):
Basic
0.64(0.13)
1.610.90
1.06
4.25
Dilutive
0.64(0.13)
1.610.90
1.06
4.25
12.
The Company’s common stock is publicly traded on the
ASX in the form of CDIs, convertible at the option of the
holders into shares of the Company’s common stock
on a
10-for-1 basis
.
13.
 
Fair Value Measurement
The fair
 
value of
 
a financial
 
instrument is
 
the amount
 
that will
 
be received
 
to sell
 
an asset
 
or paid
 
to transfer
 
a
liability in
 
an orderly transaction
 
between market participants
 
at the
 
measurement date. The
 
fair values
 
of financial
instruments involve uncertainty and cannot be determined with
 
precision.
The Company utilizes valuation
 
techniques that maximize
 
the use of observable inputs
 
and minimize the use of
unobservable
 
inputs
 
to
 
the
 
extent
 
possible.
 
The
 
Company
 
determines
 
fair
 
value
 
based
 
on
 
assumptions
 
that
market participants would use in pricing
 
an asset or liability in the
 
market.
 
When considering market participant
assumptions in fair
 
value measurements, the
 
following fair value
 
hierarchy distinguishes between observable
 
and
unobservable inputs, which are categorized in one of the following
 
levels:
NOTES TO UNAUDITED CONDENSED CONSOLIDATED
FINANCIAL STATE
MENTS (Continued)
Coronado Global Resources Inc.
Form 10-Q March 31, 2023
14
Level
 
1 Inputs:
 
Unadjusted
 
quoted
 
prices
 
in
 
active
 
markets
 
for identical
 
assets
 
or liabilities
 
accessible
 
to
 
the
reporting entity at the measurement date.
Level 2 Inputs:
 
Other than quoted prices that are observable for the
 
asset or liability,
 
either directly or indirectly,
for substantially the full term of the asset or liability.
Level
 
3
 
Inputs:
 
Unobservable
 
inputs
 
for
 
the
 
asset
 
or
 
liability
 
used
 
to
 
measure
 
fair
 
value
 
to
 
the
 
extent
 
that
observable inputs
 
are not
 
available, thereby
 
allowing for
 
situations in
 
which there
 
is little, if
 
any,
 
market activity
for the asset or liability at measurement date.
Financial Instruments Measured on a Recurring Basis
As of March
 
31, of
September
30,
2023,
there
 
were
no
 
financial
instruments
 
required
to
be
 
measured
at
fair
 
value on a
 
recurringon
a
recurring basis.
NOTES TO UNAUDITED CONDENSED CONSOLIDATED
FINANCIAL STATEMENTS
(Continued)
Coronado Global Resources Inc.
Form 10-Q September 30, 2023
19
Other Financial Instruments
The following methods
 
and assumptions
 
are used to
 
estimate the fair
 
value of other
 
financial instruments
 
as of
March 31,September 30, 2023 and December 31, 2022:
 
Cash
 
and
 
restricted
 
cash,
 
accounts
 
receivable,
 
short-term
deposits,
accounts
 
payable,
 
accrued
expenses,
 
lease
 
liabilities
and
 
other
 
current
 
financial
 
liabilities:
 
The
 
carrying
 
amounts
 
reported
 
in
 
the
unaudited Condensed Consolidated
 
unaudited
Condensed
Consolidated Balance Sheets approximate
fair value due to the
 
the short maturity of
these instruments.
 
Restricted
 
deposits,
 
lease
 
liabilities,
 
interest
 
bearing
 
liabilities
 
and
 
other
 
financial
 
liabilities:
 
The
 
fair
values
 
approximate
 
the
 
carrying
 
values
 
reported
 
in
 
the
 
unaudited
 
Condensed
 
Consolidated
 
Balance
Sheets.
 
Interest bearing liabilities: The
 
Company’s outstanding interest-bearing liabilities are carried at
 
amortized
cost. As of March 31,
September 30, 2023, there were
no
 
borrowings outstandingamounts drawn under the revolving credit sublimit of the
New ABL
Facility.
The estimated
fair value of
 
of the
Notes as
 
of March 31,September
 
30, 2023
was approximately
$
253.3249.6
 
million based upon
quoted market
prices in a market
that is not considered active (Level 2).
13.
14.
 
Accumulated Other Comprehensive Losses
The Company’s Accumulated Other Comprehensive
Losses consists of foreign currency translation adjustment
of subsidiaries for which the functional currency is different
of the Group’s functional currency in U.S.
dollar.
Accumulated other comprehensive losses consisted of
 
the following at March 31,September 30, 2023:
(in US$ thousands)
Foreign
currency
translation
adjustments
Balance at December 31, 2022
$
(91,423)
Net current-period other comprehensive income (loss):
Loss in other comprehensive income before reclassifications
 
(807)(11,939)
Loss on long-term intra-entity foreign currency transactions
(3,696)(18,608)
Total
 
net current-period other comprehensive loss
(4,503)(30,547)
Balance at March 31,September 30, 2023
$
(95,926)
(121,970)
NOTES TO UNAUDITED CONDENSED CONSOLIDATED
FINANCIAL STATE
MENTS (Continued)
Coronado Global Resources Inc.
Form 10-Q March 31, 2023
15
14.15.
 
Commitments
(a)
 
Mineral Leases
The
 
Company
 
leases
 
mineral
 
interests
 
and
 
surface
 
rights
 
from
 
land
 
owners
 
under
 
various
 
terms
 
and
 
royalty
rates. The future minimum royalties under these leases
 
as of March 31,September 30, 2023 are as follows:
(in US$ thousands)
Amount
Year ending
 
December 31,
2023
$
4,0432,115
2024
4,7365,448
2025
4,6295,342
2026
4,5005,213
2027
4,4745,188
Thereafter
23,71126,099
Total
$
46,09349,405
Mineral leases are not in scope of Accounting Standards Codification,
or ASC, 842 and continue to be
be accounted for under the guidance in ASC 932, Extractive
Extractive Activities – Mining.
(b)
 
Other commitments
As of
 
March 31,September
30, 2023,
 
purchase
commitments
for
 
capital expenditures were
 
were $
26.624.0
 
million, all
 
all of which is
 
obligatedwhich
is
obligated within the next twelve months.
NOTES TO UNAUDITED CONDENSED CONSOLIDATED
FINANCIAL STATEMENTS
(Continued)
Coronado Global Resources Inc.
Form 10-Q September 30, 2023
20
In Australia, the
 
Company has generally
 
secured the ability
 
to transport coal
 
through rail contracts
 
and coal export
terminal contracts that are primarily funded
 
through take-or-pay arrangements with terms ranging up to
13 years
.
 
In
the
U.S.,
the
Company
 
typically
negotiates
its
rail
 
and
coal
terminal
access
 
on
an
annual
basis.
 
As
of March
31, September
30,
2023,
these
Australian
and
U.S.
 
commitments
under
take-or-pay
 
arrangements
totaled
$
0.90.8
 
billion, of which
approximately $
96.092.0
 
million is obligated within the next twelve months.
15.
16.
 
Contingencies
In the
 
normal course
 
of business,
 
the Company
 
is a
 
party to
 
certain guarantees
 
and financial
 
instruments with
off-balance sheet
 
risk, such
 
as letters
 
of credit
 
and performance
 
or surety
 
bonds.
No
 
liabilities related
 
to these
arrangements are reflected
 
in the Company’s
 
unaudited Condensed Consolidated Balance Sheets.
 
Management
does not expect any material losses to result from these
 
guarantees or off-balance sheet financial instruments.
As required
 
by certain
 
agreements, the
 
Company had
 
cash collateral
 
in the
 
form of
 
deposits in
 
the amount
 
of
$
86.567.9
 
million and $
89.1
 
million as of September 30, 2023 and
 
MarchDecember 31, 2023
and December 31,
2022, respectively,
to provide back-to-back-
backto-back support
for bank
guarantees,
financial
payments,
other performance
obligations, various
other
operating
agreements and
 
contractual obligations
 
under workers
 
compensation insurance.insurance
.
 
These deposits
 
are restricted
and classified as long-term assets in the unaudited Condensed
 
Consolidated Balance Sheets.
 
In accordance
 
with the
 
terms of
 
the ABLNew
 
ABL Facility,
 
the Company
 
may be
 
required to
 
to cash
collateralize
 
the
New ABL
Facility to
the extent of outstanding letters of
credit after the expiration or
termination date of such letter
of credit.
As of March 31,
September 30,
2023,
no
 
letter of
credit was
outstanding after
the expiration
or termination
date
and
no
 
cash collateral was required.
For the U.S. Operations in order to provide the required financial assurance, the Company generally uses surety
bonds
 
for
 
post-mining
 
reclamation.
 
The
 
Company
 
can
 
also
 
use
 
bank
 
letters
 
of
 
credit
 
to
 
collateralize
 
certain
obligations.
As of
 
March
31,September 30, 2023,
 
the
Company
had
 
outstanding
surety
 
bonds
of $
37.640.9
 
million and letters
of
 
letterscredit
 
of
credit of $
16.8
 
million
issued
from
our
available
bank
guarantees
 
under
the
New
ABL
Facility,
to
meet
contractual obligations under
workers
compensation insurance
and to
secure other obligations
 
and commitments.
 
For
the
 
Australian
Operations,
 
the
Company
 
had
bank
 
guarantees
outstanding
 
of $
24.1
million, including
 
$
25.54.9
million issued from
 
millionthe New ABL
 
atFacility,
 
Marchas at September
 
31,
30, 2023, primarily
in respect of
certain rail and port arrangements
 
of the Company.port
arrangements.
 
As at MarchSeptember 30, 2023, the Company
 
31, 2023, thein aggregate had total outstanding bank
 
Company had total
outstanding bank guarantees
provided of $
42.340.9
million to
secure obligations
and commitments,
including $
21.6
 
million to secure
obligations andissued
 
commitments. Futurefor the
 
New ABL
Facility.
Future
regulatory changes
 
relating to
 
these obligations could
 
could result in
 
in increased
obligations, additional
costs or
additional
collateral requirements.
NOTES TO UNAUDITED CONDENSED CONSOLIDATED
FINANCIAL STATE
MENTS (Continued)
Coronado Global Resources Inc.
Form 10-Q March 31, 2023
16
Stamp duty on Curragh acquisition
On September 27, 2022, the Company received from
 
the Queensland Revenue Office, or QRO,
 
an assessment
of the stamp duty
 
payable on its
 
acquisition of the Curragh
 
mine in March
 
2018. The QRO assessed
 
the stamp
duty
 
on
 
this
 
acquisition
 
at
 
an
 
amount
 
of
 
$
55.253.1
 
million
 
(A$
82.2
 
million)
 
plus
 
unpaid
 
tax
 
interest
 
of
 
$
8.17.8
 
million
(A$
12.1
 
million).
 
On
 
November
 
23,
 
2022,
 
the
 
Company
 
filed
 
an
 
objection
 
to
 
the
 
assessment
 
and
 
is
 
currently
awaiting the outcome of this objection. The outcome of this
 
objection isremains uncertain.
 
The Company continues to
 
to maintain its position and
 
position and the
estimated accrual of
$
28.927.8
 
million (A$
43.0
 
million) stamp
duty
payable
 
on
the
 
Curragh
acquisition
 
based
on
 
legal
and
 
valuation
advice
 
obtained. The
 
In
October
2022,
the
Company made
a
partial payment to datefollowing filing of the stamp dutyobjection reducing the estimated
accrual to $
11.611.2
 
million (A$
(A$
17.3
 
million),
which
is
is
included
 
within
 
“Accrued
 
Expenses
 
and
Other
 
Current
 
Liabilities”
 
in
 
its unaudited
 
Condensed
Consolidatedunaudited
Condensed Consolidated Balance sheet,
 
as at March 31,September 30, 2023.
 
From time to time, the
 
the Company becomes a
 
a party to other legal
 
legal proceedings in the
 
ordinary course of business
in Australia, the U.S. and other countries where the Company does business.
 
Based on current information, the
Company believes that such other pending
 
or threatened proceedings are likely to
 
be resolved without a material
adverse
 
effect
 
on
 
its
 
financial
 
condition,
 
results
 
of
 
operations
 
or
 
cash
 
flows.
 
In
 
management’s
 
opinion,
 
the
Company is not currently
 
involved in any legal
 
proceedings, which individually
 
or in the aggregate
 
could have a
material effect on the financial condition, results of
 
operations and/or liquidity of the Company.
NOTES TO UNAUDITED CONDENSED CONSOLIDATED
 
Subsequent EventsFINANCIAL STATEMENTS
(Continued)
New asset-based revolving credit facilityCoronado Global Resources Inc.
Form 10-Q September 30, 2023
21
17. Related
Party Transactions
The Energy & Minerals Group
On MaySeptember 25, 2023, Energy &
 
8, 2023,Minerals Group, the Company’s controlling stockholder through its ownership
of Coronado Group
 
or theLLC, including through
 
Signing Date,certain of its
 
the Company,affiliates and managed
 
Coronado Coalfunds (the Sellers),
 
Corporation, a
Delaware corporation
and
wholly owned subsidiary
of the Company,
Coronado Finance Pty
Ltd, an Australian
proprietary company
and a
wholly owned
subsidiary of
the Company,
or an
Australian Borrower,
Coronado Curragh
Pty Ltd,
an Australian
proprietary company and wholly owned subsidiary of the Company, or an Australian Borrower and, together with
the
other
Australian
Borrower,
the
Borrowers,
and
the
other
guarantors
party
thereto,
collectively
with
advised the
Company
 
thethat
 
Guarantorsit
 
and,
together
with
the
Borrowers,
the
Loan
Parties,had
 
entered
 
into
 
a
 
seniormembership
 
securedinterest
purchase
agreement,
or
MIPA,
with
Sev.en
Global
asset-based revolving credit agreement in an initial aggregate amount Investments
a.s.,
or
SGI.
A
copy
of
 
$
150.0
million, or the New ABL Facility,
with Global Loan Agency Services
Australia Pty Ltd, as the
 
Administrative Agent, Global LoanMIPA
 
Agency Serviceshas
not
been
made
available
to
the
Company
or
the
Special
Australia Nominees Pty Ltd, Committee
referred
to
below
as
of
the
date
of
this
Quarterly
Report
on
Form
10-Q.
However,
the
Company
understands that, pursuant
to the terms of
 
the Collateral Agent,MIPA,
the Sellers agreed to
sell all of their
interests
in Coronado
Group LLC to
a wholly-owned
subsidiary of
SGI. We
refer to the
 
Hongkong and Shanghai Banking
Corporation Limited,
Sydney Branch,proposed transaction
 
as the SGI
 
Lender,Transaction.
The
Company
also
understands
that,
under
the
MIPA,
the
SGI
Transaction
is
subject
to
customary
closing
conditions including regulatory approvals in the U.S. and Australia.
The Board of
Directors has appointed
a special committee
of independent
directors, or the
Special Committee,
to, among other things, assess
the impact and consequences of the
SGI Transaction on the
Company and take
such actions as the Special Committee deems appropriate
in connection with the SGI Transaction.
The Energy and
Minerals Group
has reported that
following the
closing of
the SGI Transaction,
SGI will
be the
direct or indirect owner of
Coronado Group LLC. As of the
date of this Quarterly Report on
Form 10-Q, Coronado
Group LLC
is currently
the direct
owner of
845,061,399
CDIs (representing
a beneficial
interest in
84,506,140
shares
of common
stock,
or
50.4
% of
the Company’s
outstanding
total common
stock)
 
and DBSthe
one
 
Bank Limited,Series
 
Australia Branch,A
Share.
Based on information that the Company is currently aware of,
 
as the
Lender and,
together with
the
other Lender, the Lenders.
Upon satisfactionon completion of the stipulated conditionsSGI Transaction,
 
precedent to closinga change of
control as defined under the terms of Notes and New
 
ABL Facility may occur. Refer to Note 10. “Interest Bearing
Liabilities” for further information.
 
which conditions
include,Under the
 
amongCompany’s
 
other2018
 
things,Equity
 
Incentive
Plan,
the
change
of control
provisions
may
also
be
triggered
on
completion
 
of
 
athe
 
fieldSGI
 
examinationTransaction,
 
byhowever
 
anthe
 
independentCompensation
and
Nominating
Committee
of
the
Board
of
Directors, at its
sole discretion, will determine
how the outstanding awards
under the plan
will be dealt
with, which
may include acceleration of the vesting conditions.
In
addition,
certain
contract
counterparties,
including
Stanwell,
customers,
suppliers
and
 
third-party
 
assessor,providers
may assert
 
and
satisfactory rightcontractual rights, such
 
of entry
arrangements being
entered into
in relation
to certain
Australian ports
utilized by
the
Company for
shipment of
coal, the
New ABL
Facility will
replace the
predecessor ABL
Facility.
The conditions
precedent under
the New
ABL Facility
need to
be satisfied,
or waived,
onas consent or
 
before the
datetermination rights that
 
falls 60
days
after the Signing Date, or such later date as agreed between the Company
and each lender under the New ABL
Facility.
The New ABL
Facility will
mature
three years
after the
Signing Date
and will provide
for up to
$
150.0
million in
borrowings, including a $
100.0
million sublimit for the issuance of letters of credit and
$
70.0
million sublimit as a
revolving credit facility. Availability under the
New ABL Facility
is limited to
an eligible borrowing
base, determined
by applying customary advance rates to eligible accounts
receivable and inventory.
The New
ABL Facility
is guaranteedmay be triggered
 
by the
 
Guarantors.
Amounts outstanding
under the
New ABL
Facility arechange of control
secured by
(i) first
priority lien
inresulting from the
accounts receivable
and other
rights to
payment, inventory,
intercompany
indebtedness, certain general
intangibles and commercial tort
claims, commodities accounts,
deposit accounts,
securities accounts
and other
related assets
and proceeds
and products
of each
of the
foregoing, collectively,
the New ABL
Collateral, and
(ii) a second-priority lien
on substantially all
consummation of the Company’s assetsSGI Transaction.
For a number of
 
customers and the assets
of thesupplier agreements, including
 
guarantors, other thancontractor agreements, the completion of
 
the New ABLSGI
Transaction
 
Collateral, and (iii)may
 
solely in trigger
a
financial
or
suitability
assessment
by
the
 
case of counterparty,
which
may
entitle
the
counterparty
to
terminate
the
 
obligations of agreement,
request
further
security
or
seek
amendments
to
the
 
Australian
Borrower, a featherweightterms
 
floating security interest over certainof
 
assets of the Australian Borrower,
in each case,
subject to certain customary exceptions
Borrowings under the New
ABL Facility bear interest
at a rate per
annum equal to applicable
rate of
2.80
% and
BBSY,
for loans denominated in A$, or SOFR, for loans
denominated in U$, at the Borrower’s election.
agreement.
NOTES TO UNAUDITED CONDENSED CONSOLIDATED
 
FINANCIAL STATESTATEMENTS
 
MENTS (Continued)
Coronado Global Resources Inc.
 
Form 10-Q March 31,September 30, 2023
 
1722
The New
ABL Facility
contains customary representations
and warranties
and affirmative and
negative covenants
including, among
others, a
covenant regarding
the maintenance
of leverage
ratio to
be less
than
3.00
times, a
covenant regarding maintenance of interest coverage ratio to be more than
3.00
times, covenants relating to the
payment of dividends, or purchase or redemption of, with respect to any Equity Interests of Holdings or
any of its
Subsidiaries,
covenants
relating
to
financial
reporting,
covenants
relating
to
the
incurrence
of
liens
or
encumbrances, covenants relating to the incurrence or prepayment of certain debt, compliance with laws, use of
proceeds, maintenance of properties, maintenance of insurance, payment obligations, financial accommodation,
mergers and
sales of all
or substantially all
of the Borrowers
and Guarantors’, collectively
the Loan Parties,
assets
and limitations on changes in the nature of the Loan Parties’
business.
The
New
ABL
Facility
provides
for
customary
events
of
default,
including,
among
other
things,
the
event
of
nonpayment
of
principal,
interest,
fees,
or
other
amounts,
a
representation
or
warranty
proving
to
have
been
materially incorrect when made, failure to perform or observe certain covenants within a specified period of time,
a cross-default to certain material indebtedness,
the bankruptcy or insolvency of
the Company and certain of its
subsidiaries,
monetary
judgment
defaults
of
a
specified
amount,
invalidity
of
any
loan
documentation,
and
Employee Retirement
Income Security
Act, or
ERISA, defaults
resulting in
liability of
a material
amount. In
the
event of a
default by the Borrowers (beyond
any applicable grace or cure
period, if any), the
Administrative Agent
may and, at the direction
of the requisite number of Lenders, shall
declare all amounts owing under the
New ABL
Facility immediately due and payable, terminate such
Lenders’ commitments to make loans under the New
ABL
Facility,
require
the
Borrowers
to cash
collateralize
any
letter of
credit
obligations
and/or exercise
any
and all
remedies and other
rights under the
New ABL Facility. For certain
defaults related to
insolvency and receivership,
the commitments
of the Lenders
will be automatically
terminated, and
all outstanding
loans and other
amounts
will become
immediately due
and payable.
A review
event will
occur under
the New
ABL Facility
if any
one or
more of
the following
occurs: (a)
downgrade of
the credit
rating by
S&P or
Moody’s
in respect
of a
Loan Party
which applies as at
the Closing Date; (b)
change of control occurs;
or (c) delisting of
any listed Loan
Party from
the relevant stock
exchange on which
it was listed or
a trading halt in
respect of such
Loan Party for more
than
5 business days. Following
the occurrence of a
review event, the
Borrowers must promptly
meet and consult in
good faith
with the Administrative
Agent and the
Lenders to agree
a strategy to
address the relevant
review event.
If at
the end of
a period of
20 business days
after the occurrence
of the review
event, the Lenders
are not satisfied
with
the
result
of
their
discussion
or
meeting
with
the
Borrowers
or
do
not
wish
to
continue
to
provide
their
commitments,
the
Lenders
may
declare
all
amounts
owing
under
the
New
ABL
Facility
immediately
due
and
payable, terminate such Lenders’
commitments to make loans
under the New ABL
Facility, require the Borrowers
to cash collateralize
any letter of
credit obligations and/or
exercise any and
all remedies and
other rights under
the New ABL Facility.18. Material Transactions
Curragh Housing Transaction
On May 8, 2023,
the Company entered into an
 
agreement, the Curragh Housing Agreement, for accommodation
services
and
to
 
sell
and
leaseback
housing
housing
and
 
accommodation
 
assets
included
 
in
property,
 
plant and
 
and
equipment.
The
 
transaction
did
 
not
satisfy
the
 
sale
 
criteria
 
under
 
ASC
 
606
 
Revenues
 
withfrom
 
Contracts
 
with
Customers
Customers
 
and
 
was
 
deemed
 
a
 
financing
arrangement.
arrangement.
As
a
result,
the
Company
continued
to
recognize
 
the
underlying property,
 
plant and
equipment on
its
 
its condensed
 
consolidated
balance
 
sheet. Upon
 
Thecompletion,
 
the
proceeds
 
of
 
$
23.222.3
 
million
 
(A$
34.6
 
million)
 
received
 
from
 
the
transaction
transaction
will
 
be
recorded
as
 
“Other Financial
 
Financial
Liabilities” on
the Company’s
condensed consolidated
balance
sheet. Condensed Consolidated Balance Sheet. The term of the
financing arrangement is
ten years
 
with an effective interest rate of
12.8
%.
 
In connection
with this
transaction, the Company
 
Company borrowedwill borrow an
additional amount of
$
27.126.1
 
million (A$
40.4
 
million)
which will
be recorded
in “Interest
Bearing Liabilities”.
on completion
date. The
term of
the arrangement
 
is
ten
years
 
with an effective
interest rate of
12.8
%.
The Curragh Housing Agreement is subject to conditions
precedent not completed as at September 30, 2023.
In line
 
with the
 
Company’s
 
capital management
 
strategy,
 
the above
 
transactions provide
 
additional liquidity.
 
In
addition,
the
accommodation
 
services
component
of
the
 
arrangementCurragh Housing Agreement
 
is
anticipated
to
enhance
the
level
of
the level of service for our employees at our Curragh
mine.
 
Coronado Global Resources Inc.
 
Form 10-Q March 31,September 30, 2023
 
1823
REPORT OF INDEPENDENT REGISTERED PUBLIC
 
ACCOUNTING FIRM
To the Stockholders
 
and Board of Directors of Coronado Global Resources
 
Inc.
 
Results of Review of Interim Financial Statements
We
 
have
 
reviewed
 
the
 
accompanying
 
condensed
 
consolidated
 
balance sheet
 
of
 
Coronado
 
Global
 
Resources
Inc.
(the
(the Company)
as
 
of
March
31,
September 30, 2023,
the
 
related
condensed
consolidated
statements
of
operations
and
comprehensive
 
income
 
for
 
the
 
three-monththree
and
nine-month
 
periods
 
ended
 
MarchSeptember
 
31,30,
 
2023
 
and
 
2022,
 
the
condensed
condensed consolidated statements of stockholders’
equity for the three-month period three-months periods
ended March 31,
June
30 and September 30, 2023 and 2022, the
condensed consolidated statements
of cash flows
for the three-monthnine-month
periods ended September
 
period ended March30, 2023 and 2022,
 
31, 2023 and
2022,
and
the
related
 
notes
(collectively
(collectively referred
 
to as the “condensed
as
the
“condensed
consolidated
interim
financial
 
statements”).
Based on our
 
our reviews,
we are
 
not aware of
 
of any
material modifications
that should
be made
to the
 
condensed
consolidated interim
financial statements
for them
to be
 
in conformity with
with U.S.
generally accepted
accounting
principles.
 
We
 
have
 
previously
 
audited,
 
in
 
accordance
 
with
 
the
 
standards
 
of
 
the
 
Public
 
Company
 
Accounting
 
Oversight
Board (United States) (PCAOB), the
 
consolidated balance sheet of the Company
 
as of December 31, 2022, the
related consolidated statements
 
of operations
 
and comprehensive
 
income, stockholders'
 
equity and cash
 
flows
for the year then ended, and
 
the related notes (not presented herein), and
 
in our report dated February 21, 2023,
we
 
expressed
 
an
 
unqualified
 
audit
 
opinion
 
on
 
those
 
consolidated
 
financial
 
statements.
 
In
 
our
 
opinion,
 
the
information set
 
forth in
 
the accompanying
 
condensed consolidated
 
balance sheet
 
as of December
 
31, 2022,
 
is
fairly stated, in all material
 
respects, in relation to the consolidated balance
 
sheet from which it has been
 
derived.
Basis for Review Results
 
These financial
 
statements
 
are the
 
responsibility
 
of the
 
Company's
 
management.
 
We
 
are a
 
public accounting
firm registered with the PCAOB and are required
 
to be independent with respect to the Company
 
Company in accordance
with the
 
U.S. federal
 
securities laws
 
and the
 
applicable rules
 
and regulations
 
of the
 
SEC and
 
the PCAOB.
 
We
conducted our review
 
in accordance with
 
the standards of
 
the PCAOB. A
 
review of interim
 
financial statements
consists principally
 
of applying
 
analytical procedures
 
and making
 
inquiries of
 
persons
 
responsible for
 
financial
and accounting matters.
 
It is substantially
 
less in scope
 
than an audit
 
conducted in accordance
 
with the standards
of the PCAOB, the objective of which is the expression of an opinion regarding the financial statements taken as
a whole. Accordingly,
 
we do not express such an opinion.
/s/ Ernst & Young
Brisbane, Australia
MayNovember 8, 2023.
 
Coronado Global Resources Inc.
 
Form 10-Q March 31,September 30, 2023
 
1924
ITEM 2.
 
MANAGEMENT’S DISCUSSION
 
AND ANALYSIS
 
OF FINANCIAL
 
CONDITION AND
 
RESULTS
 
OF
OPERATIONS
The following
 
Management’s Discussion
 
and Analysis
 
of our Financial
 
Condition and
 
Results of
 
Operations, or
MD&A, should be read in conjunction with the unaudited Condensed Consolidated Financial Statements and the
related notes to
 
those statements includednotes
 
to those
statements
included elsewhere
in this
 
Quarterly
Report
on Form 10-Q. 10
-Q.
In addition,
 
this
Quarterly Report on Form 10-Q report
should
be read in conjunction
with the Consolidated
Financial Statements
for
year ended December 31,
 
2022 included
in Coronado Global
Resources Inc.’s Annual
 
Annual Report on Form 10-K
for the year
 
the year ended December
31, 2022, filed
 
filed
with
the
U.S.
 
Securities
and
 
Exchange
Commission,
 
or
SEC,
 
and
the
Australian
Securities
Exchange,
or
the
the Australian Securities Exchange, or the ASX, on February
21, 2023.
Unless otherwise
 
noted,
 
references
 
in this
 
Quarterly
 
Report on
 
Form 10-Q
 
to “we,”
 
“us,”
 
“our,”
 
“Company,”
 
or
“Coronado” refer
 
to Coronado
 
Global Resources
 
Inc. and
 
its consolidated
 
subsidiaries and
 
associates, unless
the context indicates otherwise.
All production and sales volumes contained in this Quarterly Report on Form 10-Q
 
are expressed in metric tons,
or Mt,
 
millions of
 
metric tons,
 
or MMt,
 
or millions
 
of metric
 
tons per
 
annum, or
 
MMtpa, except
 
where otherwise
stated. One Mt
 
(1,000 kilograms) is equal
 
to 2,204.62 pounds and
 
is equivalent to 1.10231
 
short tons. In addition,
all
 
dollar
 
amounts
 
contained
 
herein
 
are
 
expressed
 
in
 
United
 
States
 
dollars,
 
or
 
US$,
 
except
 
where
 
otherwise
stated.
 
References
 
to
 
“A$”
 
are
 
references
 
to
 
Australian
 
dollars,
 
the
 
lawful
 
currency
 
of
 
the
 
Commonwealth
 
of
Australia. Some numerical figures included in this Quarterly Report on
 
on Form 10-Q have been subject to rounding
adjustments. Accordingly, numerical figures shown as
 
totals in certain
 
tables may not
 
equal the sum
 
of the figures
that precede them.
CAUTIONARY NOTICE REGARDING FORWARD
 
-LOOKING STATEMENTS
This Quarterly Report on Form 10-Q contains “forward-looking statements” within the meaning of Section 27A of
the Securities Act of 1933, as
 
amended, and Section 21E of the Securities
 
Exchange Act of 1934, as amended,
or the Exchange
 
Act, concerning
 
our business,
 
operations, financial
 
performance and
 
condition, the
 
coal, steel
and
 
other
 
industries,
 
as well
 
as
 
our
 
plans,
 
objectives
 
and
 
expectations
 
for
 
our
 
business,
 
operations,
 
financial
performance
 
and
 
condition.
 
Forward-looking
 
statements
 
may
 
be
 
identified
 
by
 
words
 
such
 
as
 
“may,”
 
“could,”
“believes,”
 
“estimates,”
 
“expects,”
 
“intends,”
 
“plans,”
 
“anticipate,”
 
“forecast,”
 
“outlook,”
 
“target,”
 
“likely,”
“considers” and other similar words.
Any
 
forward-looking
 
statements
 
involve
 
known
 
and
 
unknown
 
risks,
 
uncertainties,
 
assumptions
 
and
 
other
important factors that
 
could cause actual
 
results, performance,
 
events or outcomes
 
to differ
 
materially from
 
the
results,
 
performance,
 
events
 
or
 
outcomes
 
expressed
 
or
 
anticipated
 
in
 
these
 
statements,
 
many
 
of
 
which
 
are
beyond
 
our
 
control.
 
Such
 
forward-looking
 
statements
 
are
 
based
 
on
 
an
 
assessment
 
of
 
present
 
economic
 
and
operating
 
conditions
 
on
 
a
 
number
 
of
 
best
 
estimate
 
assumptions
 
regarding
 
future
 
events
 
and
 
actions.
 
These
factors are difficult to accurately predict and may be beyond our control. Factors that could affect our results, our
announced plans, or an investment in our securities include,
 
but are not limited to:
 
the prices we receive for our coal;
 
uncertainty
in
 
global
economic
 
conditions,
including
 
the
extent,
 
duration
and
 
impact
of
 
the Russiaongoing
 
andcivil
Ukraine war, unrest and wars,
as well as
risks related to
government actions with
respect to trade
agreements, treaties or
or policies;
 
a decrease in
 
the availability or increase
 
in costs of
 
key supplies, capital equipment
 
or commodities, such
as diesel fuel, steel, explosives and tires, as the result
 
of inflationary pressures or otherwise;
 
the extensive forms of taxation
 
that our mining operations
 
are subject to, and future
 
tax regulations and
developments. For example,
 
the amendments to
 
the coal
 
royalty regime implemented
 
by the Queensland
state Government in
 
Australia in 2022 introducing
 
higher tiers to the
 
coal royalty rates
 
applicable to our
Australian Operations;
 
concerns about the environmental impacts of coal
combustion and greenhouse gas, or GHG, emissions,
relating
to
mining
activities,
including
possible
impacts
on global
climate
issues,
which
could
result
in
increased
regulation
of
coal
combustion
and
requirements
to
reduce
GHG
emissions
in
many
jurisdictions, including federal and state government initiatives to control GHG emissions could increase
costs associated with
coal production
and consumption, such
as costs for
additional controls to
reduce
carbon
dioxide
emissions
or
costs
to
purchase
emissions
reduction
credits
to
comply
with
future
emissions
trading
programs,
which
could
significantly
impact
our
financial
condition
and
results
of
operations, affect demand
for our products
or our
securities and reduced
access to capital
and insurance;
Coronado Global Resources Inc.
Form 10-Q September 30, 2023
25
the impact of the SGI Transaction, including the impact of the SGI Transaction
on change of control and
related provisions in material agreements;
severe financial
 
hardship,
 
bankruptcy,
 
temporary or
 
or permanent shut
 
shut downs or
 
or operational
challenges,
due
 
to
 
future
 
public
 
health
 
crisis
 
(such
 
as
 
the
 
COVID-19
 
pandemic),
 
of
 
one
 
or
 
more
 
of
 
our
 
major
customers,
 
including
 
customers
 
in
 
the
 
steel
 
industry,
 
key
 
suppliers/contractors,
 
which
 
among
 
other
adverse effects,
 
could lead
 
to reduced
 
demand for
 
our coal,
 
increased difficulty
 
collecting receivables
and
 
customers
 
and/or
 
suppliers
 
asserting
 
force
 
majeure
 
or
 
other
 
reasons
 
for
 
not
 
performing
 
their
contractual obligations to us;
 
our ability to generate sufficient cash to service
 
our indebtedness and other obligations;
Coronado Global Resources Inc.
Form 10-Q March 31, 2023
20
 
our indebtedness and ability to
 
comply with the covenants and other
 
undertakings under the agreements
governing such indebtedness;
 
our
 
ability
 
to
 
collect
 
payments
 
from
 
our
 
customers
 
depending
 
on
 
their
 
creditworthiness,
 
contractual
performance or otherwise;
 
the demand for steel products, which impacts the demand for
 
our metallurgical, or Met, coal;
 
risks inherent to
 
mining operations could
 
impact the amount
 
of coal produced,
 
cause delay or
 
or suspend
coal deliveries, or increase the cost of operating our business;
 
the loss of, or significant reduction in, purchases by our
 
largest customers;
 
risks unique to international mining and trading operations,
 
including tariffs and other barriers to trade;
 
unfavorable economic and financial market conditions;
 
our ability to continue acquiring and developing coal reserves
 
that are economically recoverable;
 
uncertainties in estimating our economically recoverable coal
 
reserves;
 
transportation for our coal becoming unavailable or uneconomic
 
for our customers;
 
the risk
 
that we
 
may
 
be required
 
to pay
 
for unused
 
capacity
 
pursuant
 
to the
 
terms
 
of our
 
take-or-pay
arrangements with rail and port operators;
 
our ability to retain key personnel and attract qualified
 
personnel;
 
any failure to maintain satisfactory labor relations;
 
our ability to obtain, renew or maintain permits and consents
 
necessary for our operations;
 
potential costs or liability under applicable environmental
 
laws and regulations, including with respect
 
to
any
 
exposure
 
to
 
hazardous
 
substances
 
caused
 
by
 
our
 
operations,
 
as
 
well
 
as
 
any
 
environmental
contamination our properties may have or our operations
 
may cause;
 
extensive regulation of our mining operations and future
 
regulations and developments;
 
our
 
ability
 
to
 
provide
 
appropriate
 
financial
 
assurances
 
for
 
our
 
obligations
 
under
 
applicable
 
laws
 
and
regulations;
 
assumptions underlying our asset retirement obligations
 
for reclamation and mine closures;
 
concerns
about
the
environmental
impacts
of
coal
combustion,
including
possible
impacts
on
global
climate issues, which could result
in increased regulation of
coal combustion and requirements to
reduce
greenhouse gas,
or GHG,
emissions in
many jurisdictions,
which could
significantly affect
demand for
our products or our securities and reduced access to capital
and insurance;
any cyber-attacks or other security breaches that disrupt
 
our operations or result in the dissemination
of
proprietary or confidential information about us, our customers
 
or other third parties;
 
the risk that we may not recover our investments in our mining, exploration and other assets, which may
require us to recognize impairment charges related to those assets;
 
risks related to divestitures and acquisitions;
 
the risk that diversity in interpretation and application of accounting principles in the mining industry may
impact our reported financial results; and
Coronado Global Resources Inc.
Form 10-Q September 30, 2023
26
 
other
 
risks
 
and
 
uncertainties
 
detailed
 
herein,
 
including,
 
but
 
not
 
limited
 
to,
 
those
 
discussed
 
in
 
“Risk
Factors,” set forth in Part II, Item 1A of this Quarterly Report
 
on Form 10-Q.
 
We
 
make
 
many
 
of
 
our
 
forward-looking
 
statements
 
based
 
on
 
our
 
operating
 
budgets
 
and
 
forecasts,
 
which
 
are
based upon
 
detailed assumptions.
 
While we
 
believe that
 
our assumptions
 
are reasonable,
 
we caution
 
that it
 
is
Coronado Global Resources Inc.
Form 10-Q March 31, 2023
21
very difficult to
 
predict the impact
 
of known factors,
 
and it is
 
impossible for us
 
to anticipate all
 
factors that could
affect our actual results.
See Part I, Item
 
1A. “Risk Factors”
 
of our Annual Report
 
on Form 10-K for
 
the year ended December
 
31, 2022,
filed with the
SEC and
ASX on February
21, 2023,
and Part
II, Item 1A.
“Risk Factors”
of our Quarterly
Report
on Form 10-Q for
the quarterly period ended March
31, 2023, filed with
SEC and ASX on February 21,
May 8, 2023, for
a more
complete
 
discussion
of
the
risks
and
uncertainties
mentioned
mentioned
above
 
and
for
 
discussion
of
 
other
risks
 
and
uncertainties
we face
that could
 
cause actual
results to
differ materially from
those expressed or implied by
 
these
forward-looking statements.
 
All
 
forward-looking
 
statements
 
attributable
 
to
 
us
 
are
 
expressly
 
qualified
 
in
 
their
 
entirety
 
by
 
these
 
cautionary
statements, as well as others
 
made in this Quarterly Report on Form
 
10-Q and hereafter in our other
 
filings with
the
 
SEC
 
and
 
public
 
communications.
 
You
 
should
 
evaluate
 
all
 
forward-looking
 
statements
 
made
 
by
 
us
 
in
 
the
context of these risks and uncertainties.
We caution you that the risks and uncertainties identified by us may not be all of the factors that are important to
you.
 
You
 
should
 
not
 
interpret
 
the
 
disclosure
 
of
 
any
 
risk
 
to
 
imply
 
that
 
the
 
risk
 
has
 
not
 
already
 
materialized.
Furthermore, the
 
forward-looking statements
 
included in this
 
Quarterly Report
 
on Form 10-Q
 
are made only
 
as
of the date
 
hereof. We
 
undertake no
 
obligation to
 
publicly update
 
or revise
 
any forward-looking
 
statement as
 
a
result of new information, future events, or otherwise, except
 
as required by applicable law.
Overview
We
 
are
 
a
 
global
 
producer,
 
marketer
 
and
 
exporter
 
of
 
a
 
full
 
range
 
of
 
Met
 
coal
 
products.
 
We
 
own
 
a
 
portfolio
 
of
operating mines and development
 
projects in Queensland, Australia,
 
and in the states of
 
Virginia,
West Virginia
and Pennsylvania in the United States.
 
Our Australian
 
Operations
 
comprise the
 
100%-owned
 
Curragh producing
 
mine complex.
 
Our U.S.
 
Operations
comprise
 
two
 
100%-owned
 
producing
 
mine
 
complexes
 
(Buchanan
 
and
 
Logan),
 
one
 
100%-owned
 
idled
 
mine
complex (Greenbrier) and two development properties (Mon Valley
 
and Russell County). In addition to Met coal,
our Australian
 
Operations sell
 
thermal coal
 
domestically,
 
which is
 
used to
 
generate electricity,
 
to Stanwell
 
and
some thermal
 
coal in
 
the export
 
market. Our
 
U.S. Operations
 
primarily focus
 
on the
 
production of
 
Met coal
 
for
the North American domestic and seaborne export
 
markets and also produce and sell some
 
thermal coal that is
extracted in the process of mining Met coal.
 
Coking coal
index prices
have continued
to increase
inDuring the
first third quarter
 
of 2023, Coronado navigated
 
compared tothrough some operational headwinds
 
fourth quarterthat were out of
 
ofour
2022, primarily driven by supply constraints in key Met coalcontrol,
 
markets caused by wet weather amidst mild demand
recovery fromincluding
 
Indian andadverse
 
Southeast Asiangeological
 
steelmakers. Theconditions
 
Australian Premiumat
 
Low Volume
Index averaged
$335 per Mt during Q1 2023, $60 per Mt above Q4 2022, however,
$153 per Mt below Q1 2022.
Coronado has
continued to
take advantage
of its
unique geographical
diversification as
a Met
coal supplier
of
scale to meet the requirements of steel customers across the globe. Our U.S. Operations have taken advantage
of current unique market fundamentals created
by the trade restrictions on Russian coal
by switching coal sales
from China to Europe providing higher returns for our
 
products.U.S.
 
Our results for the three months endedOperations
 
March 31, 2023, were adversely impacted
by (1) significant wet weather
events impacting
 
production
 
at ourrates
 
Australian Operations
,
(2) continued
inflationary
pressure (3)
reduced coal
availability from
equipment breakdown,
(4) a
train derailment
on the
Blackwater line
which impacted
our sales
volume, (5) lower
average realized Met
price per Mt sold
compared to first
quarter of 2022yield
 
and (6) higher sales
related costs (royalties and freight costs).unexpected downtime for
 
For the three months ended March 31, 2023, we producedrepairs and sold 3.7 MMtmaintenance
following a mechanical
failure of coal. Met coal sales represented
74.7% of our
total volumeone
 
of coal soldthe draglines
 
and 88.8% ofat our
Australian
 
total coal revenuesOperations.
 
for the threeIn
 
months endedaddition,
 
March 31,
2023.
Coal revenues of $738.3coal
 
million for the threeproduction
 
months ended March 31,rates
 
2023, decreased by 21.2%
compared to
the same
period in
2022, driven
by decreased
average realized
Met price
per Mt
sold from
$266.5 to
$239.7.
Sales volumes
were lower
for the
three months
ended March
31, 2023,
compared to
the same
period in
2022
due to lower production primarily driven by higher than anticipated wet weather resulting in
lower coal availability
at
 
our
 
Australian
 
Operations
 
combinedwere
 
withlower
 
shippingin
 
delaysthe
third
quarter of
2023 primarily
due to
planned focus
on advancing
pre-strip waste
movement and
the completion
of
planned maintenance on the two coal preparation plants. Overall, these events contributed to the lower saleable
production of 0.8 MMt compared
to the three months ended
June 30, 2023. Despite the
lower production, sales
volume
compared
to
the
three
months
ended
June
30,
2023
increased
as
the
Company
drew
down
on
coal
inventory built in the previous quarter.
Coking
coal
index
prices
improved
in
the
third
quarter
of
2023
compared
to
the
previous
quarter
due
to
a
combination
of
tight
supply
 
from
 
adversethe
 
weatherAustralian
coal
market,
which
was
impacted
negatively
by continued
rail
constraints
and
planned
maintenance
disruptions
to
operations
and
 
at
 
ourQueensland
 
U.S.ports,
 
Operations.and
heightened
Operating costsdemand from Indian steel mills restocking raw material as
the monsoon season comes to an end. The Australian
Premium Low
Volatile
Hard Coking
Coal, or
AUS PLV
HCC, index
price averaged
$263.6 per
Mt for
 
the three
months ended September
30, 2023, $20.8
per Mt higher,
compared to the
three months
 
ended March 31,June 30,
2023.
The
AUS PLV
HCC
averaged
$283.5
per
Mt
for
the
nine months
ended
September
30,
 
2023, were $569.0
 
million, or 7.6%,$109.0
 
higherper
Mt
lower, compared to the nine months ended September 30, 2022. The spot price of AUS PLV HCC reached $333
per Mt during the corresponding period inthree months ended September 30, 2023.
Our
 
2022 primarily driven results
for
the
nine
months
ended
September
30,
2023,
were
adversely
impacted
by
 
inflationary pressure on supply,(1)
 
contractors and fuel costs,lower
average
realized Met
price per
Mt sold
compared
to the
nine
months
ended September
30, 2022,
(2)
additional
 
fleets
deployed to
 
mobilizedrecover pre-strip
 
sinceoverburden removal,
 
March(3) significant
 
31,wet weather
 
2022events during
the first
quarter of
2023
 
and
unplanned
 
equipment
 
breakdown
 
at
 
our
 
Australian
Operations and higher freight costs at our U.S. Operations
 
.
Liquidity
As of March 31, 2023,impacting
 
the Company’s netproduction,
 
cash position,(4)
 
comprising of $498.0 millionrail
 
cash (excluding restricted
cash) lessconstraints
 
$242.3 millionand
disruption
 
aggregate principalto
 
amount of Notesport
 
outstanding,operations
 
was $255.7impacting
 
million.timing
 
Coronado hasof
sales
at
our
Australian
Operations,
(5)
adverse
geological
 
Coronado Global Resources Inc.
 
Form 10-Q March 31,September 30, 2023
 
2227
availableconditions at our U.S. Operations
 
liquidityresulting in slower production rates
and yield in the quarter
ended September
30, 2023, and (6) continued inflationary pressure on labor and
supply costs.
For the
nine months
ended September
30, 2023,
we produced
11.9
MMt and
sold 11.7
MMt of
coal. Met
coal
sales represented 75.8%
of our total
volume of coal
sold and 91.0%
of total coal
revenues for the
nine months
ended September 30, 2023, compared to 78.4% and 96.2%, respectively, for the nine months ended September
30, 2022.
Coal
revenues
 
of
 
$598.02,163.1
 
million
 
asfor
the
nine
months
ended
September
30,
2023,
decreased
by
23.3%
compared to the same period in 2022, driven by average realized Met price per Mt sold, which was $57.9 per Mt
lower than
the
average
realized
price
per
Mt sold
 
of
 
March$279.4
 
31,for
 
2023,the
 
consistingnine
months
ended
September
30,
2022.
Additionally,
sales volumes were 0.7 Mt lower
for the nine months ended September
30, 2023, compared to the
same
period
in
2022,
primarily
driven
by
lower
production
as
well
as
required
coal
qualities
to
meet
sales
commitments during the nine months ended September 30,
2023.
Mining costs for the nine months ended September 30, 2023, were $1,210.4 million or $105.5 per Mt sold, $17.9
per Mt sold higher compared
to the corresponding period in
2022, largely driven by elevated
inflation levels, the
impacts
 
of
 
lower
production
following
significant
weather
events,
equipment
breakdown,
adverse
geological
conditions at
our U.S.
Operations
and additional
fleets
mobilized
at our
Australian Operations
during the
nine
months ended September 30, 2023.
Dividends
In September
2023, the
Company settled
its previously
declared dividends
of $8.4
million, which
were paid
to
stockholders from available cash.
Liquidity
As of September
30, 2023,
our net cash
position, comprising
of $336.8
million cash
 
(excluding
restricted
 
cash)
less $242.3 million aggregate principal amount of Notes outstanding, was $94.5 million.
 
andCoronado has available
$100.0 liquidity of $486.8
million as of
September 30, 2023,
consisting of cash
(excluding restricted cash),
unrestricted
short term deposits of $21.6 million and $128.4 million
availability under our New ABL facility,
which remains fully undrawn.facility.
Safety
For
 
our
 
Australian
 
Operations,
 
the
 
twelve-month
 
rolling
 
average
 
Total
 
Reportable
 
Injury
 
Frequency
 
Rate,
 
or
TRIFR, at
 
March 31,September 30,
 
2023 was
 
3.182.43,
compared to
 
a rate of
 
of 3.92
at the
 
end of
 
December 31,
 
2022. At
 
our U.S.
U.S. Operations, the
 
twelve-monththe twelve
-month rolling
 
average Total
 
Reportable Incident
 
Rate, or
 
TRIR, at
 
March 31,September
 
30,
2023 was 1.60, compared
2.43
compared to a rate of 2.42
 
2.42 at the end
of December
31, 2022.
 
These strong results
year to date
reflect a
record
safety
rate
at our
U.S. Operations
and the
best safety
rate since
July
2018 for
our Australian
Operations. Reportable rates for
our Australian and
 
and U.S.
Operations are
below the relevant industry
benchmarks.
 
Our
Logan
mining
complex
at
our
U.S.
Operations,
which
includes
multiple
underground
and
surface
mines,
achieved 1.5 million hours Lost Time
Injury, or
LTI, free during the
quarter.
The
health
and
safety
 
of
our
 
workforce
is
our
 
number
one
priority
 
and Coronado remains
 
focused on theCoronado
continues
implement
 
safety and wellbeing
of all employees and contracting parties.initiatives to improve our safety rates every quarter.
Segment Reporting
In accordance with
 
Accounting Standards Codification,
 
or ASC, 280,
 
Segment Reporting, we
 
have adopted the
following reporting
 
segments: Australia and
 
the United
 
States. In
 
addition, “Other and
 
Corporate” is
 
not a
 
reporting
segment but is disclosed for the purposes of reconciliation
 
to our consolidated financial statements.
Results of Operations
How We Evaluate Our Operations
We
 
evaluate
 
our
 
operations
 
based
 
on
 
the
 
volume
 
of
 
coal
 
we
 
can
 
safely
 
produce
 
and
 
sell
 
in
 
compliance
 
with
regulatory
 
standards,
 
and
 
the
 
prices
 
we
 
receive
 
for
 
our
 
coal.
 
Our
 
sales
 
volume
 
and
 
sales
 
prices
 
are
 
largely
dependent upon
 
the terms
 
of our
 
coal sales
 
contracts, for
 
which prices
 
generally are
 
set based
 
on daily
 
index
averages, on a quarterly basis or annual fixed price
contracts.
Our management
 
uses a
 
variety of
 
financial and
 
operating metrics
 
to analyze
 
our performance.
 
These metrics
are significant factors
 
in assessing our
 
our operating results
 
and profitability.
 
These financial
 
and operating metrics
include: (i) safety and environmental metrics; (ii) Adjusted EBITDA; (iii) total sales volumes and average realized
price
 
per
 
Mt
 
sold,
 
which
 
we
 
define
 
as
 
total
 
coal
 
revenues
 
divided
 
by
 
total
 
sales
 
volume;
 
(iv) Met
 
coal
 
sales
Coronado Global Resources Inc.
Form 10-Q September 30, 2023
28
volumes and average realized Met price per
 
Mt sold, which we define as Met coal
 
revenues divided by Met coal
sales volume; (v) average
 
segment mining costs
 
per Mt sold,
 
which we define
 
as mining costs
 
divided by sales
volumes (excluding non-produced coal) for the respective segment; (vi) average segment operating costs
 
per Mt
sold, which we define as segment operating costs divided by sales volumes for the respective segment; and (vii)
net cash, which we define
 
as cash and cash equivalents
 
(excluding restricted cash) less
 
less outstanding aggregate
principal amount of 10.750% senior secure notes due
2026.the Notes.
Coal
 
revenues
 
are
 
shown
 
on
 
our
 
statement
 
of
 
operations
 
and
 
comprehensive
 
income
 
exclusive
 
of
 
other
revenues.
 
Generally,
 
export
 
sale contracts
 
for our
 
Australian
 
Operations
 
require
 
us to
 
bear the
 
cost
 
of freight
from our mines to the
 
the applicable outbound shipping
 
shipping port, while freight costs
 
costs from the port
to the
end destination
are typically
 
borne by the
 
customer. Sales to the
 
export market from
 
our U.S.
 
Operations are generally
 
recognized
when title
to the coal
passes to
 
the coal passes
to the customer
 
at the
 
mine load
 
out similar
 
to a
 
domestic sale.
 
For our
 
domestic
sales,
 
customers
 
typically
 
bear
 
the
 
cost
 
of
 
freight.
 
As
 
such,
 
freight
 
expenses
 
are
 
excluded
 
from
 
cost
 
of
 
coal
revenues to allow for consistency and comparability in
 
in evaluating our operating performance.
Non-GAAP Financial Measures; Other Measures
The
 
following
 
discussion
 
of
 
our
 
results
 
includes
 
references
 
to
 
and
 
analysis
 
of
 
Adjusted
 
EBITDA,
 
Segment
Adjusted EBITDA and mining
 
mining costs, which are financial
 
financial measures not recognized in
 
in accordance with U.S. GAAP.
 
U.S. GAAP.
Non-GAAP financial
 
measures, including
 
Adjusted EBITDA,
 
Segment Adjusted
 
EBITDA and
 
mining costs,
 
are
used by investors to measure our operating performance.
Non-GAAP financial measures are intended to provide additional information only and do not have any standard
meaning prescribed by U.S. GAAP.
These measures should not be considered
in isolation or as a substitute for
measures of performance prepared in accordance with
U.S. GAAP.
Adjusted EBITDA, a non-GAAP measure, is defined as earnings before interest, tax, depreciation, depletion and
amortization
 
and
 
other
 
foreign
 
exchange
 
losses.
 
Adjusted
 
EBITDA
 
is
 
also
 
adjusted
 
for
 
certain
 
discrete
 
non-
recurring items that we exclude in
 
analyzing each of our segments’
 
operating performance. Adjusted EBITDA
 
is
not intended to
 
to serve
as an
 
alternative to
U.S. GAAP measures
 
measures of performance
 
and may notincluding total
 
revenues, total
costs and expenses,
net income or
cash flows from
operating activities as
those terms are
defined by U.S.
GAAP.
Adjusted EBITDA may
therefore not be
comparable to
similarly titled measures
presented by other
 
other companies.
A reconciliation of
 
of Adjusted EBITDA to its
 
its most
directly
comparable measure
under U.S. GAAP is
included below.
 
Coronado Global Resources Inc.
Form 10-Q March 31, 2023
23
Segment
 
Adjusted
 
EBITDA
 
is
 
defined
 
as
 
Adjusted
 
EBITDA
 
by
 
operating
 
and
 
reporting
 
segment,
 
adjusted
 
for
certain
 
transactions,
 
eliminations
 
or
 
adjustments
 
that
 
our
 
CODM
 
does
 
not
 
consider
 
for
 
making
 
decisions
 
to
allocate resources among segments or assessing segment performance.
 
Segment Adjusted EBITDA is used as
a supplemental
 
financial measure
 
by management
 
and by
 
external users
 
of our
 
financial statements,
 
such
 
as
investors, industry analysts and lenders, to assess the operating
 
performance of the business.
Mining costs, a
 
a non-GAAP measure, is
 
is based on
 
reported cost of
 
coal revenues, which
 
is shown
 
on our
 
statement
of
 
operations
 
and
 
comprehensive
 
income
 
exclusive
 
of
 
freight
 
expense,
 
Stanwell
 
rebate,
 
other
 
royalties,
depreciation,
 
depletion
 
and
 
amortization,
 
and selling,
 
general and
 
administrative
 
expenses,
 
adjusted for
 
other
items that do not relate directly to the costs incurred to produce coal at a mine. Mining costs excludes these cost
components as
 
our CODM
 
does not
 
view these
 
costs as
 
directly attributableattributabl
e
 
to the
 
production of
 
coal. Mining
costs
 
is
 
used
 
as
 
a
 
supplemental
 
financial
 
measure
 
by
 
management,
 
providing
 
an
 
accurate
 
view
 
of
 
the
 
costs
directly
 
attributable
 
to
 
the
 
production
 
of
 
coal
 
at
 
our
 
mining
 
segments,
 
and
 
by
 
external
 
users
 
of
 
our
 
financial
statements, such as
 
investors, industry analysts and
 
ratings agencies, to assess
 
our mine operating
 
performance
in comparison to the mine operating performance of other companies
 
companies in the coal industry.
Coronado Global Resources Inc.
Form 10-Q September 30, 2023
29
Three Months Ended March 31,September 30, 2023 Compared to
 
to Three Months Ended March 31,September 30, 2022
Summary
The financial and operational highlights for the three months ended
 
March 31,ended September 30, 2023 include:
 
Net
 
incomeloss
 
of
 
$107.921.1
 
million
 
for
 
the
 
three
 
months
 
ended
 
MarchSeptember
 
31,30,
 
2023,
 
was
 
$162.0171.7
 
million
 
lower
compared to
net income
of $150.6
million for
the three
months ended
September 30, 2022.
This decrease
was
driven
by
lower
coal
revenues
due
 
to
 
lower
average
realized
Met
coal
price
per
Mt
sold,
higher
mining
and
operating
costs,
partially
offset
by
tax
benefit
of
$269.918.2
 
million
in
the
third
quarter
of
2023
compared to an income tax expense of $51.4 million for
the same period in 2022.
Average realized Met price
per Mt sold of $207.4 for
the three months ended September
30, 2023, was
$45.6 per Mt
lower compared to
average realized price of
$253.0 per Mt
sold for the
same period in
2022.
Although coking coal
index prices improved
during the third
quarter of
2023 due to
tight supply,
coking
coal prices were significantly lower than the same period in 2022 when supply in global
met coal market
was readjusting from the impact of the Russia and Ukraine
war.
Despite lower saleable production,
sales volume of 4.1 MMt
for the three months
ended September 30,
2023, increased 0.1 MMt as compared to
the same period in 2022, as the Company
drew down on coal
inventory built in the second quarter of 2023.
Adjusted
EBITDA
 
for
 
the
 
three
 
months
 
ended
 
MarchSeptember
 
31,30,
 
2022.2023,
 
Thisof
 
was$3.4
 
drivenmillion,
 
bya
 
lower
revenues duedecrease
 
to lowerof
$220.2
million,
 
average realized
Met coal
price per
Mt sold,
lower sales
volume and
by higher
operating costs.
Sales volume totaled 3.7 MMtcompared to $223.6 million for the three months ended March 31, 2023, comparedSeptember 30, 2022, largely due
to 4.4 MMt for the
three months ended March 31,
2022. The lower sales volumes
were largely driven by the impact
of wet
weather
and
equipment
breakdown
on
production
performance
and
coal
availability
at
our
Australian
Operations, and a train derailment on the Blackwater line resulting in coal not being railed for two weeks
while repairs were undertaken.
Average realized Met price
per Mt sold
of $239.7 for
the three months ended
March 31, 2023,
was 10.1%
lower compared to $266.5 per
Mt sold for the same
period in 2022 as the
Met coal supply has readjusted
following the impact of Russia and Ukraine war on the global coal supply chain
and supply constraints in
key Met coal markets during the first half of 2022.
Adjusted EBITDA for
the three months
ended March
31, 2023, of
$190.7 million,
a decrease of
$220.2
million compared to $411.0
million for the three
months ended March
31, 2022, due to
lower coal sales
revenues and higher operating costs.
 
As of March
 
31, of
September
30,
2023,
 
the
Company
 
had
total
 
available
liquidity
 
of $598.0
$486.8
 
million,
consisting
 
of $498.0
$336.8
million
cash (excluding
(excluding
restricted
cash),
$21.6
million
of
unrestricted
short-term
deposits
and $100.0
$128.4 million of availability
under the New ABL Facility.


Coronado Global Resources Inc.
 
Form 10-Q March 31,September 30, 2023
 
2430
Three months ended March 31,September 30,
2023
2022
Change
%
(in US$ thousands)
Revenues:
Coal revenues
$
738,345707,303
$
936,628863,709
$
(198,283)(156,406)
(21.2%(18.1%)
Other revenues
27,36910,527
10,49710,948
16,872(421)
160.7%(3.8%)
Total
 
revenues
765,714717,830
947,125874,657
(181,411)(156,827)
(19.2%(17.9%)
Costs and expenses:
Cost of coal revenues (exclusive of items
shown separately below)
380,474501,471
357,500385,504
22,974115,967
6.4%30.1%
Depreciation, depletion and amortization
39,42334,749
38,00937,508
1,414(2,759)
3.7%(7.4%)
Freight expenses
63,35371,746
59,26463,026
4,0898,720
6.9%13.8%
Stanwell rebate
39,20837,100
29,05354,575
10,155(17,475)
35.0%(32.0%)
Other royalties
85,95792,700
83,032137,331
2,925(44,631)
3.5%(32.5%)
Selling, general, and administrative expenses
7,77412,221
7,87610,405
(102)1,816
(1.3%)17.5%
Total
 
costs and expenses
616,189749,987
574,734688,349
41,45561,638
7.2%9.0%
Other income (expenses):
Interest expense, net
(14,665)(14,496)
(17,332)(17,220)
2,6672,724
(15.4%(15.8%)
Loss on debt extinguishment
(1,385)
(1,385)
100.0%
Decrease (increase) in provision for
discounting and
credit losses
3,988536
(428)12
4,416524
(1,031.8%)4,366.7%
Other, net
3,0428,189
(2,790)32,898
5,832(24,709)
(209.0%(75.1%)
Total
 
other expenses,(expenses) income, net
(7,635)(7,156)
(20,550)15,690
12,915(22,846)
(62.8%(145.6%)
Net (loss) income before tax
141,890(39,313)
351,841201,998
(209,951)(241,311)
(59.7%(119.5%)
Income tax expensebenefit (expense)
(34,030)18,230
(81,943)(51,423)
47,91369,653
(58.5%(135.5%)
Net (loss) income attributable to Coronado Global
Resources, Inc.
$
107,860(21,083)
$
269,898150,575
$
(162,038)(171,658)
(60.0%(114.0%)
Coal Revenues
Coal revenues were
 
were $738.3
$707.3 million for
 
the three months
 
months ended
March 31, September 30,
 
2023, a
 
decrease of
$198.3 million,
compared
to
$936.6
million
for
the
three
months
ended
March
31,
2022.
The
decrease
was
driven
by
lower
average realized Met coal price of
$239.7 per Mt sold for the three
months ended March 31, 2023, compared
to
$266.5 per Mt sold for the
same period in 2022 and lower coal
sales volume. Coal sales volume at our
Australian
Operations
were
down
by
0.6
MMt
due
to
reduced
production
from
higher
than
anticipated
wet
weather
and
equipment breakdown,
while sales volume for our U.S. Operations were 0.1 MMt
higher.
Other revenues
Other
revenues
were
$27.4
million
for
the
three
months
ended
March
31,
2023,
an
increase
of
$16.9 $156.4
 
million,
compared to $10.5$863.7 million
 
million for the three months
 
three months ended
March 31, September 30, 2022.
 
This increase wasLower Met coal price
 
primarily driven byindices, due
to varied
 
a
one-off termination fee revenue from a coal sales contractmarket conditions
 
cancelled at our U.S. Operations.compared to
the third
quarter of
2022, saw
the average
realized Met
coal price
for
the three months
ended September 30,
2023,
reduced by $45.6
to $207.4 per
Mt sold compared
to $253.0 per
Mt sold for the same period in 2022.
Cost of Coal Revenues (Exclusive of Items Shown
 
Separately Below)
Cost of coal revenues comprise costs related
 
to produced tons sold, along with
 
changes in both the volumes and
carrying
 
values
 
of
 
coal
 
inventory.
 
Cost
 
of
 
coal
 
revenues
 
include
 
items
 
such
 
as
 
direct
 
operating
 
costs,
 
which
includes employee-related costs,
 
materials and
 
supplies, contractor services,
 
coal handling
 
and preparation costs
and production taxes.
Total
 
cost of
coal revenues
 
was $501.5 million for the
three months ended September
30, 2023, $116.0
million,
or 30.1% higher,
compared to $385.5 million for the three months ended
September 30, 2022.
Cost of coal
revenues for our
U.S. Operations for the
three months ended September
30, 2023, was $38.8
million
higher
compared
to
the
three
months
September
30,
2022,
largely
due
draw
down
of
coal
stocks
from
the
previous quarter,
as sales
volume exceeded
saleable production
in the
2023 period,
combined with
continued
impact of
inflation on
labor,
contractor and
other supply
costs. Our
Australian Operations
contributed to
$77.2
million
of
the
increase
in
cost
of
coal
revenues,
primarily
driven
by
additional
fleets
mobilized
during
2023
to
advance
pre-strip
overburden
removal,
impact
of
high
inflation
on
mining
costs
and
drawn
of
coal
inventory,
resulting from
sales volume
exceeding saleable
production in
the 2023
period. Increase
in costs
were $380.5partially
offset by favorable
average foreign exchange
rate on translation
of the
Australian Operations for
the three months
ended September 30, 2023, of A$/US$: 0.66 compared
to 0.68 for the same period in 2022.
Depreciation, Depletion and Amortization
Depreciation, depletion
and amortization
was $34.7
 
million for
 
the three
 
months ended
 
March 31,September 30,
 
2023, $23.0a
decrease
of
$2.8
 
million, or
6.4% higher,
 
compared
to $357.5
$37.5
million
for
the
three
months
ended
 
March 31, 2022.
Our Australian OperationsSeptember
 
contributed $12.0 million30,
 
to the increase2022.
 
in total cost ofThe
decrease
 
coal revenues, largelywas
 
driven
by the impact of continued inflationary pressure on contractors’associated
 
costs, fuel, and other supply costs and additional
fleetwith
 
mobilizedassets
 
infully
 
February
2022,
partially
offset
bydepreciated,
 
lower
 
purchaseddepreciation
 
coalrates
 
costfollowing
 
andannual
 
favorableuseful
 
average
foreign
exchange rate on
translation of the
Australian Operations for
the three months
ended March 31,
2023, of A$/US$:
0.68 compared to
0.72 for the
same period in
2022. Cost
of coal revenues
for our U.S
Operations for the
three
months ended March 31,
2023, was $11.0
million higher compared to
the three months ended
March 31, 2022,
largely due to the continued impact of inflation on labor
and supply costs.life
 
Coronado Global Resources Inc.
 
Form 10-Q March 31,September 30, 2023
 
2531
review at
the
beginning
of
2023 and
favorable
average
foreign exchange
rate on
translation of
the
Australian
Operations,
partially
offset
by
additional
equipment
brought
into
service
during
the
twelve
months
since
September 30, 2022.
Freight Expenses
Freight expenses
 
relate to
 
costs associated
 
with rail
 
and port
 
providers,
including
 
take-or-pay commitments
 
at
our
 
Australian
 
Operations,
 
and
 
demurrage
 
costs.
 
Freight
 
expenses
 
totaled
 
$63.471.7
 
million
 
for the
 
three
 
months
ended March 31,September
30, 2023,
an increase of $4.1
$8.7 million,
compared to
$63.0 million
for the three
months ended
September 30, 2022. Our
Australian Operations’ freight costs
contributed $11.8
million to the increase
primarily
driven by penalties incurred due to underutilization
of rail capacity.
This was partially offset by freight
cost at our
U.S.
Operations,
which
decreased
by
$3.1
million,
driven
by
lower
coal
sales
under
Free
on
Board,
or
FOB,
terms, compared to $59.3the three months ended September
30, 2022.
Stanwell Rebate
The Stanwell
rebate
was
$37.1
million for
the three
months
ended September
30, 2023,
a decrease
of $17.5
million, compared
to $54.6
million for
the three
months ended
September 30,
2022. The
decrease was
largely
driven by lower
realized reference coal
pricing for the
prior twelve-month period applicable
to three months
ended
September 30, 2023,
used to calculate
the rebate compared
to the same
period in 2022,
and favorable foreign
exchange rate on translation of our Australian Operations.
Other Royalties
Other royalties were
$92.7 million in
the three months
ended September 30,
2023, a decrease
of $44.6 million,
compared to
$137.3 million
for the
three months
ended September
30, 2022.
The decrease
in Other
royalties
was
due
to
lower
coal revenues,
largely
driven
by
lower
average
realized
prices,
for the
three
months
ended
September 30, 2023,
compared to the
same period in
2022, combined with
favorable foreign exchange
rate on
translation of our Australian Operations.
Interest Expense, net
Interest
expense,
net
was
$14.5
million
in
the
three
months
ended
September
30,
2023,
a
decrease
of
$2.7
million compared
to $17.2
million for
the three
months
ended September
30, 2022.
The decrease
was due
to
lower
Notes
outstanding
during
the
three
months
ended
September
30,
2023,
following
redemptions
since
September 30, 2022.
Other, net
Other,
net
was
$8.2
million
for
the
three
months
ended
September
30,
2023,
a
decrease
of
$24.7
million
compared to $32.9 million for the three months ended March
31, 2022. Our U.S. Operations’ freightSeptember
 
cost contributed $10.0 million to30, 2022. The decrease was largely driven by
lower exchange
 
this increase, driven by coal saleslosses on translation
 
underof short-term
inter-entity balances
in certain
entities within
the group
that
certain contractsare denominated in currencies other than their respective
functional currencies.
Income Tax Benefit (Expense)
Income tax
benefit of
$18.2 million
 
for which
we arrange
and pay
for transportation
to port
that did
not exist
to the
same extent
during the
 
three months
 
ended MarchSeptember
 
31,30, 2023,
variance of
$69.7 million,
compared to the income tax expense of $51.4 million for the three
months ended September 30, 2022, driven by
net loss before tax in the 2023 period.
Coronado Global Resources Inc.
Form 10-Q September 30, 2023
32
Nine months ended September 30, 2023 compared to
Nine months ended September 30, 2022
Summary
The financial and operational highlights for the nine months ended
September 30, 2023 include:
Net
income
of
$178.1
million
for
the
nine
months
ended
September
30,
2023,
decreased
by
$534.4
million, from $712.5 million
for the nine months
ended September 30,
2022. The decrease
was a result
of lower revenues and higher operating costs partially
offset by lower income tax expense.
Sales volume totaled
11.7
MMt for the
nine months ended
September 30, 2023,
or 0.7 MMt
lower than
the nine
months ended
September 30,
2022. The
lower sales
volumes were
primarily driven
by the
impact
of wet
weather
and equipment
breakdowns
on production
performance,
coal availability,
and required
coal qualities to meet
sales commitments at our
Australian Operations combined with adverse
geological
conditions caused by a rock intrusion at our U.S. Operations
.
Average realized
Met price
of $221.5
per Mt
sold for
the nine
months ended
September 30,
2023 was
20.7% lower compared to $279.4
per Mt sold for
the nine months ended September
30, 2022, as the
Met
coal price index
rebalanced from record
highs achieved in
2022, particularly in
the first half
of 2022, as
steel demand
weakened.
During the third
quarter of 2023,
the Met coal
prices trended upwards,
however,
the Company was not able
to take full advantage of
this due to the three
-month lag in price
realizations
for certain sales contracts at our Australian Operation.
Adjusted EBITDA of
$355.7 million for the
nine months ended
September 30, 2023,
was $717.3 million
lower compared to $1,072.9 million for
the nine months ended September 30,
2022. This decrease was
a result of lower coal revenues and higher operating costs.
As
of
September
30,
2023,
the
Company
had
net
cash
of
$94.5
million,
consisting
of
a
closing
cash
balance
(excluding
restricted
cash)
of
$336.8
million
and
$242.3
million
aggregate
principal
amount
outstanding of the Notes.
Nine months ended September 30,
2023
2022
Change
%
(in US$ thousands)
Revenues:
Coal revenues
$
2,163,093
$
2,821,334
$
(658,241)
(23.3%)
Other revenues
47,977
33,152
14,825
44.7%
Total
revenues
2,211,070
2,854,486
(643,416)
(22.5%)
Costs and expenses:
Cost of coal revenues (exclusive of items
shown separately below)
1,262,907
1,140,467
122,440
10.7%
Depreciation, depletion and amortization
113,052
126,901
(13,849)
(10.9%)
Freight expenses
192,542
189,316
3,226
1.7%
Stanwell rebate
105,357
124,160
(18,803)
(15.1%)
Other royalties
268,606
299,711
(31,105)
(10.4%)
Selling, general, and administrative expenses
29,976
28,657
1,319
4.6%
Total
costs and expenses
1,972,440
1,909,212
63,228
3.3%
Other income (expenses):
Interest expense, net
(43,341)
(52,034)
8,693
(16.7%)
Loss on debt extinguishment
(1,385)
(1,385)
100.0%
Decrease (increase) in provision for discounting
and credit losses
4,255
(572)
4,827
(843.9%)
Other, net
17,704
55,191
(37,487)
(67.9%)
Total
other (expenses) income, net
(22,767)
2,585
(25,352)
(980.7%)
Net income before tax
215,863
947,859
(731,996)
(77.2%)
Income tax expense
(37,775)
(235,391)
197,616
(84.0%)
Net income
178,088
712,468
(534,380)
(75.0%)
Net income attributable to Coronado Global
Resources, Inc.
$
178,088
$
712,468
$
(534,380)
(75.0%)
Coronado Global Resources Inc.
Form 10-Q September 30, 2023
33
Coal Revenues
Coal
revenues
were
$2,163.1
million
for
the
nine
months
ended
September
30,
2023,
a
decrease
of
$658.2
million, compared to $2,821.3 million for the nine months ended September 30, 2022. The decrease was largely
driven by
lower average
realized Met
price of
$221.5 per
Mt sold
compared to
$279.4 per
Mt sold
for the
nine
months ended September 30, 2022, combined with 0.7 MMt lower sales volume compared to the
same period in
2022.
Other Revenues
Other revenues were $48.0 million for the nine months ended September 30, 2023, an increase of $14.8 million,
compared to $33.2 million for the nine months ended September 30, 2022.
This increase was primarily driven by
a termination fee revenue from a coal sales contract cancelled
at our U.S. Operations.
Cost of Coal Revenues (Exclusive of Items Shown
Separately Below)
Total
cost of coal revenues was $1,262.9 million for the nine months
ended September 30, 2023, an increase of
$122.4 million, compared to $1,140.5 million for the nine
months ended September 30, 2022.
Cost of coal revenues for
our Australian Operations in
the nine months ended September
30, 2023, were $85.6
million higher compared
to the same
period in 2022,
primarily driven
by additional
fleets mobilized
during 2023
to advance pre-strip overburden removal,
the continued impact of inflation
on labor,
contractor and other supply
costs, higher
maintenance
expenses following
a dragline
propel failure,
 
partially offset
 
by lowera
significant
build in
coal
inventories
from
saleable
production
exceeding
 
sales
volume
in
period compared
to
a draw
down
in
the
same period
in 2022,
lower purchase
coal and favorable
foreign exchange
rate on
translation of
our Australian
Operations
for
the
nine
months
ended
September
30,
2023,
of
A$/US$:
0.67
compared
to
0.71
for the
same
period
in
2022.
Cost
of
coal
revenues
for
our
U.S.
Operations
were
$36.8
million
higher
for
the
nine
months
ended
September
30,
2023,
compared
to the
same
period
in 2022,
also impacted
by
an elevated
inflationary
environment
and
higher
consumables
and
maintenance
costs
following
a
rock
intrusion
in
the
quarter
ended
September 30, 2023.
Depreciation, Depletion and Amortization
Depreciation, depletion
 
and aamortization
 
favorable foreign
exchange rate on translationwas $113.1
 
of our Australian Operations.
Stanwell Rebate
The Stanwell rebate was $39.2 million for the three months ended March
 
31, 2023,nine months
 
an increaseended September 30,
2023, a
decrease of $10.1
$13.8 million,
as compared
compared
to $29.1 $126.9
million for
 
the three nine
months ended March
 
31, September 30,
2022. The increase
decrease
was
 
largely driven by higherassociated
with
assets
fully
depreciated,
lower
depreciation
rates
following
annual
useful
life
realized export reference coal pricing for review at
the prior
beginning
of
2023 and
favorable
average
foreign exchange
rate on
translation of
the
Australian
Operations,
partially
offset
by
additional
equipment
brought
into
service
during
the
twelve
 
-month period used to calculate the rebate.months
 
since
Other RoyaltiesSeptember 30, 2022.
Other royaltiesFreight Expenses
Freight
 
were $86.0expenses
totaled
$192.5
 
million
 
in for
the
 
three nine
months
 
ended
 
MarchSeptember
 
31, 30,
2023,
 
an
increase
 
of $2.9
 
$3.2
million, ascompared
compared to $83.0$189.3 million
for the three nine
months ended March 31,
September 30,
 
2022. Royalties have increased compared to a
significant decline inOur Australian
 
coal revenues Operations
contributed
$4.4
million
to
the
increase
due
 
to the adverse
 
impact of thehigher
 
new Queensland Governmentrail
 
royalty regime
effectivecosts
 
from Julyprimarily
 
1, 2022driven
by
penalties
incurred
due
 
to
underutilization of
rail capacities
in our
 
Australian Operations,
 
partially offset
 
by lower
 
sales volumes
 
and favorablereducing
foreign exchange rate on translation
offreight costs at our Australian Operations. The newOperations and U.S. Operations
 
royalty regime has resulted in
$29.0
million additional royalty costs for the three months ended
March 31, 2023.
Decrease (increase) in Provision for Discounting and
Credit Losses
Decrease in provision for
discounting and credit losses of
$3.9 million in the
three months ended March 31,
2023,
a favorable movement of $4.4 million compared to increase in provision for discounting and credit losses of $0.4
million for the three months ended March 31, 2022. The lower provision was
primarily driven by timely collection
of trade receivables during the three months ended March
31, 2023..
 
Interest Expense, netStanwell Rebate
Interest expense,The Stanwell
 
netrebate was
 
$14.7105.4 million
 
infor the
 
threenine months
 
ended MarchSeptember
 
31,30, 2023,
 
a decrease
 
of $2.7$18.8
million, as compared
 
million
compared to
$17.3 $124.2 million
 
for the nine
 
three months ended
 
ended MarchSeptember 30,
 
31, 2022.
The decrease
 
was due
lower
realized
reference
coal
pricing
for
the
prior
twelve-month
period
applicable
to
the
nine
months
ended
September 30, 2023, used
 
to lowercalculate the rebate
 
Notes
outstanding during the three months ended March 31,
2023, following redemptions since March 31, 2023.
Income Tax Expense
Income tax
expense of
$34.0
million for
the three
months ended
March 31,
2023, decreased
by $47.9
million,
compared to a tax expensethe same
period in 2022 and
favorable average
foreign exchange rate on translation of $81.9the Australian
Operations.
Other Royalties
Other royalties were $268.6 million for the threenine months ended September 30, 2023, a decrease
 
March 31,of $31.1 million,
as
compared
to
$299.7
million
for
the
nine
months
ended
September
30,
2022.
Our
Australian
Operations
contributed
to
$27.7
million
of the
decrease
due
to
lower
average
realized
export
pricing
for
the
nine
months
ended September 30, 2023,
compared to the same period in 2022 driven and favorable average foreign exchange rate
on translation
of the
Australian Operations,
partially offset
by lower incomethe
adverse
impact
that the
new royalty
regime,
before taxwhich was
effective from
July 1,
2022, had
in the
first half
of 2023 compared
to the
first half
of 2022
under the
old regime. The new royalty regime resulted in $58.7
million additional royalty costs in the 2023 period.
The income tax expense for the three months ended March 31, 2023, is based on an annual effective tax rate of
24.0%.
 
 
Coronado Global Resources Inc.
 
Form 10-Q March 31,September 30, 2023
 
2634
Interest Expense, net
Interest expense, net was
$43.3 million in
the nine months ended
September 30, 2023, a
decrease of $8.7
million
compared to $52.0 million
for the nine months
ended September 30, 2022.
The decrease was due
to lower Notes
outstanding following redemptions since September 30,
2022.
Decrease (increase) in Provision for Discounting and
Credit Losses
Decrease in provision for
discounting and credit
losses of $4.3 million
in the nine months
ended September 30,
2023, a favorable
movement of $4.8
million compared to
increase in provision
for discounting and
credit losses
of $0.6 million for
the nine months ended September
30, 2022. The lower
provision was primarily driven by
timely
collection of certain overdue trade receivables
at December 31, 2022 during the
nine months ended September
30, 2023.
Other, net
Other, net was
$17.7 million in
the nine
months ended September
30, 2023,
a decrease of
$37.5 million
compared
to the
net gain
of $55.2
million
for the
nine months
ended
September 30,
2022. The
decrease
was
driven
by
lower foreign exchange gains on translation of short-term inter-entity balances in certain entities within the group
that are denominated in currencies other than their
respective functional currencies.
Income Tax Expense
Income tax expense
of $37.8 million
for the nine
months ended September
30, 2023 decreased
by $197.6 million,
compared
to
$235.4
million
tax
expense
for
the
nine
months
ended
September
30,
2022,
primarily
driven
by
lower net income before tax in the 2023 period.
The income tax expense for the nine
months ended September 30, 2023 is based
on an annual effective tax rate
of 18.5%, which includes a discrete benefit of $2.1 million
relating to prior year for Australia.
Supplemental Segment Financial Data
Three months ended March 31,September 30, 2023 compared to
three months
ended March 31,September 30, 2022
Australia
Three months ended March 31,September 30,
2023
2022
Change
%
(in US$ thousands)
Sales volume (MMt)
2.22.6
2.82.4
(0.6)0.2
(21.6)%7.1%
Total
 
revenues ($)
398,661455,774
605,298546,485
(206,637)(90,711)
(34.1)(16.6)%
Coal revenues ($)
390,804446,815
596,298537,256
(205,494)(90,441)
(34.5)(16.8)%
Average realized price per Mt sold ($/Mt)
178.9172.3
214.1221.8
(35.2)(49.5)
(16.4)(22.3)%
Met sales volume (MMt)
1.5
1.8
(0.3)1.7
(15.0)%0.1
7.2%
Met coal revenues ($)
372,519419,032
554,009518,010
(181,490)(98,978)
(32.8)(19.1)%
Average realized Met price per Mt sold ($/Mt)
241.9236.2
305.8313.0
(63.9)(76.8)
(20.9)(24.5)%
Mining costs ($)
236,056310,727
202,018241,674
34,03869,053
16.8%28.6%
Mining cost per Mt sold ($/Mt)
108.5121.7
76.199.8
32.421.9
42.6%21.9%
Operating costs ($)
385,226487,864
365,707458,405
19,51929,459
5.3%6.4%
Operating costs per Mt sold ($/Mt)
176.4188.2
131.3189.3
45.1(1.1)
34.3%(0.6)%
Segment Adjusted EBITDA ($)
13,233(32,353)
238,96888,035
(225,735)(120,388)
(94.5)(136.8)%
Coal
revenues for our Australian Operations,
 
for the three months ended March 31, 2023, were $390.8 million, a
decrease of
 
$205.5 millionour
 
or 34.5%,Australian
 
compared to
$596.3 million
for the
three months
ended March
31, 2022.
This decrease
was driven
by lower
average realized
Met coal price
per Mt
sold of
$241.9 for
the three
months
ended March
31, 2023, $63.9
lower than the
$305.8 per
Mt sold
for the same
period in
2022 as Met
coal price
index
readjusts
from record
highs
achieved
in
the
first
half of
2022.
The
decrease
was
exacerbated
by lower
sales
volume
of
0.6
MMt
due
to
higher
than
planned
wet
weather
and
equipment
breakdown
and
co-shipper
delays.
Operating costs increased
by $19.5 million,
or 5.3%, for
the three months
ended March
31, 2023, compared
to
the three months ended
March 31, 2022. The
increase was largely driven
by higher mining costs,
higher Stanwell
rebate and higher royalties as a result of the new
royalty regime introduced by the Queensland government from
July
1,
2022.
Mining
costs
were
$34.0
million,
or 16.8%,
higherOperations,
 
for
 
the
 
three
 
months
 
ended
 
MarchSeptember
 
31,30,
 
2023,
were
$446.8
million, a decrease of
$90.4 million, or 16.8%, compared
to $537.3 million for
the three months ended September
30, 2022. This decrease was driven by lower average
realized Met coal price per Mt sold of $236.2 for the three
months ended September
30, 2023, compared to
$313.0 per Mt sold
for the same period
in 2022, when supply
in global
met coal
market was
readjusting from
the impact
of the
Russia and
Ukraine war.
The lower
realized
pricing was partially offset by higher sales volume of 0.2 MMt compared to the same
period in 2022, primarily due to additional fleet mobilized in February 2022 2022. Production,
and continued
inflationary pressures on costs including contractor costs and fuel costs. This combined with lower sales, volu
 
me
resulted toperformance in
 
a higherthe three
 
Mining andmonths ended
 
Operating costSeptember 30,
 
per Mt2022, was
 
soldimpacted by
unprecedented wet
weather events at our Australian Operations.
Operating costs were $487.9
million, an increase of
 
$32.4 and29.5 million or
 
$45.1, respectively,
compared to
the
same period in 2022.
Segment Adjusted
EBITDA of
$13.2 million
6.4%, for the
 
three months
ended March
31, 2023,
decreased by
$225.7September
million30, 2023, compared to Adjusted
EBITDA of $239.0$458.4 million
for the three months
 
months ended March 31, 2022,
whichSeptember 30, 2022. The increase was
driven by lower coal revenues and higher operating costs. largely


Coronado Global Resources Inc.
 
Form 10-Q March 31,September 30, 2023
 
2735
driven
by
additional
fleets
mobilized
in
2023
to
advance
pre-strip
overburden
removal,
continued
inflationary
pressures
on contractor
and supply
costs, higher
freight expense
and
increased
third-party
coal purchases
to
meet sales commitments. This was partially offset by favorable average foreign exchange rates on translation of
the Australian
Operations. Mining
cost per
Mt sold for
the three
months ended
September 30,
2023, increased
by $21.9 to $121.7,
compared to the same
period in 2022, driven
by higher mining costs, partially
offset by higher
sales volumes.
Segment Adjusted EBITDA
decreased by $120.4
million, or 136.8%,
to an EBITDA
loss of $32.4
million for the
three months ended September 30, 2023, compared to $88.0 million
for the three months ended September 30,
2022, largely driven by lower coal revenues and higher
operating costs.
United States
Three months ended March 31,September 30,
2023
2022
Change
%
(in US$ thousands)
Sales volume (MMt)
1.5
1.61.7
(0.1)(0.2)
(5.8)(11.3)%
Total
 
revenues ($)
367,053262,056
341,827328,172
25,226(66,116)
7.4%(20.1)%
Coal revenues ($)
347,541260,488
340,330326,453
7,211(65,965)
2.1%(20.2)%
Average realized price per Mt sold ($/Mt)
235.1172.6
217.0193.1
18.1(20.5)
8.3%(10.6)%
Met sales volume (MMt)
1.21.4
1.51.6
(0.3)(0.2)
(22.2)(15.9)%
Met coal revenues ($)
283,023232,870
337,720309,609
(54,697)(76,739)
(16.2)(24.8)%
Average realized Met price per Mt sold ($/Mt)
236.9170.2
220.0191.6
16.9(21.4)
7.7%(11.2)%
Mining costs ($)
128,120175,883
115,263132,380
12,85743,503
11.2%32.9%
Mining cost per Mt sold ($/Mt)
90.8119.3
76.781.4
14.137.9
18.4%46.6%
Operating costs ($)
183,766215,153
163,142182,031
20,62433,122
12.6%18.2%
Operating costs per Mt sold ($/Mt)
124.3142.6
104.0107.0
20.335.6
19.5%33.3%
Segment Adjusted EBITDA ($)
185,04247,630
179,899145,890
5,143(98,260)
2.9%(67.4)%
Coal revenues increased
decreased by
 
$7.2 million, or 2.1%, to
$347.5 million for the three
months ended March 31, 2023
compared to
$340.3 million
for the
three months
ended March
31, 2022.
This increase
was largely
driven by
a
higher average realized Met
price per Mt sold for
the three months ended
March 31, 2023 of $236.9,
compared
to $220.0 per Mt sold for the same period in 2022, primarily due to
higher prices achieved from annual domestic
fixed price contracts compared to 2022.
Operating costs
increased by
$20.666.0 million,
 
or 12.6%20.2%,
 
to $183.8$260.5
 
million for
 
the three
 
months ended
 
March 31,September
30,
2023,
compared
to
 
operating costs of
$163.1 million for
the three months
ended March 31,
2022. The increase
was due to higher purchased coal to meet sales commitments and higher mining costs of $12.8 million, primarily
due to the continued impact of inflation on supplies
and labor costs.
Segment
Adjusted
EBITDA
of
$185.0326.5
 
million
 
for
 
the
 
three
 
months
 
ended
 
MarchSeptember
 
31,30,
 
2023,2022.
 
increasedThis
 
bydecrease
 
$5.1was
millionprimarily
 
compareda result
 
toof
 
$179.9lower
 
millionaverage
realized
Met
price
per
Mt sold
 
for
 
the
 
three
 
months
 
ended
 
MarchSeptember
 
31,30,
2023, which was
$20.5 per Mt
sold below for
the same
period in
 
2022, due to
 
primarilylower coal
price indices
albeit at
the back of a less volatile coal market. Coal revenues were also impacted by lower sales volume of 0.2 MMt due
to adverse geological conditions impacting production
at our Buchanan mine complex.
Operating costs
increased by
$33.1 million,
or 18.2%,
to $215.2 million
for the three
months ended
September
30, 2023, compared
to operating
costs of
$182.0 million
for the
three months
ended September
30, 2022.
The
increase
was largely
 
driven by
 
byhigher mining
costs due
to continued
impact
of inflation
on supplies
and
labor
costs
and
 
a
 
higher
drawdown
of
coal
inventories,
resulting
from
lower
sales
production
volumes
outweighing
lower sales
volume when
comparing the
third quarter
of 2023
to the
third quarter
of 2022.
Sales volume
exceeding
saleable production in the period. The increase in mining costs was partially offset by lower freight expense from
lower sales on FOB terms and lower royalties as a result
of lower coal revenues.
Segment Adjusted EBITDA of
$47.6 million for
the three months ended
September 30, 2023, decreased
by $98.3
million compared
to $145.9
million for
the three
months ended
September 30,
2022, primarily
driven by
lower
average realized Met price per Mt sold partially offsetand higher operating
 
by higher operating costs.
Corporate and Other Adjusted EBITDA
The following table presents a summary of the components
 
of Corporate and Other Adjusted EBITDA:
Three months ended March 31,September 30,
2023
2022
Change
%
(in US$ thousands)
Selling, general, and administrative expenses
$
7,77412,221
$
7,87610,405
$
(102)1,816
(1.3)%17.5%
Other, net
(248)(322)
4(56)
(252)(266)
n/m
Total
 
Corporate and Other Adjusted EBITDA
$
7,52611,899
$
7,88010,349
$
(354)1,550
(4.5)%15.0%
n/m – Not meaningful for comparison.
Corporate and other costs
 
of $7.8 million for
the three months ended
March 31, 2023 remained
largely consistent
compared to $7.9 million for the three months ended
March 31, 2022.


Coronado Global Resources Inc.
 
Form 10-Q March 31,September 30, 2023
 
2836
MiningCorporate and operating
other costs
of $11.9
million for
the three
 
months ended March 31,
September 30,
2023, were
$1.6 million
higher
compared
to
$10.3
million
for
the
three
 
months
ended
September
30,
2022,
due
to
timing
of
certain
March 31,corporate costs.
Mining
and
operating
costs
for
the
three
months
ended
September
30,
2023
compared
to
three
months ended September 30, 2022
A
reconciliation of
segment costs and
expenses, segment operating
 
costs, and expenses,segment
 
segment operatingmining costs is
 
and segment mining
costs is shown
below:
Three months ended March 31,September 30, 2023
(in US$ thousands)
Australia
United
States
Other /
Corporate
Total
Consolidated
Total costs and
 
expenses
$
403,868501,021
$
204,263236,478
$
8,05812,488
$
616,189749,987
Less: Selling, general and administrative
expense
(7,774)(12,221)
(7,774)(12,221)
Less: Depreciation, depletion and amortization
(18,642)(13,157)
(20,497)(21,325)
(284)(267)
(39,423)(34,749)
Total operating costs
385,226487,864
183,766215,153
568,992703,017
Less: Other royalties
(72,993)(80,726)
(12,964)(11,974)
(85,957)(92,700)
Less: Stanwell rebate
(39,208)(37,100)
(39,208)(37,100)
Less: Freight expenses
(33,819)(49,712)
(29,534)(22,034)
(63,353)(71,746)
Less: Other non-mining costs
(3,150)(9,599)
(13,148)(5,262)
(16,298)(14,861)
Total mining costs
236,056310,727
128,120175,883
364,176486,610
Sales Volume excluding non-produced
 
coal
(MMt)
2.22.6
1.41.5
3.64.0
Mining cost per Mt sold ($/Mt)
108.5121.7
90.8119.3
101.6120.8
Three months ended March 31,September 30, 2022
(in US$ thousands)
Australia
United
States
Other /
Corporate
Total
Consolidated
Total costs and
 
expenses
$
384,380475,496
$
182,183202,167
$
8,17110,686
$
574,734688,349
Less: Selling, general and administrative
expense
(7,876)(10,405)
(7,876)(10,405)
Less: Depreciation, depletion and amortization
(18,673)(17,091)
(19,041)(20,136)
(295)(281)
(38,009)(37,508)
Total operating costs
365,707458,405
163,142182,031
528,849640,436
Less: Other royalties
(69,692)(122,820)
(13,340)(14,511)
(83,032)(137,331)
Less: Stanwell rebate
(29,053)(54,575)
(29,053)(54,575)
Less: Freight expenses
(39,767)(37,885)
(19,497)(25,141)
(59,264)(63,026)
Less: Other non-mining costs
(25,177)(1,451)
(15,042)(9,999)
(40,219)(11,450)
Total mining costs
202,018241,674
115,263132,380
317,281374,054
Sales Volume excluding non-produced
 
coal
(MMt)
2.72.4
1.51.6
4.24.0
Mining cost per Mt sold ($/Mt)
76.199.8
76.781.4
76.392.4
Average
realized Met
price per
 
Mt sold
for the
three months
 
ended
March
31, September 30, 2023
 
compared
to three
three months ended March 31,September 30, 2022
A reconciliation of the Company’s average realized
 
Met price per Mt sold is shown below:
Three months ended March 31,September 30,
2023
2022
Change
%
(in US$ thousands)
Met sales volume (MMt)
2.73.1
3.3
(0.6)(0.2)
(18.3)(4.3)%
Met coal revenues ($)
655,542651,902
891,729827,619
(236,187)(175,717)
(26.5)(21.2)%
Average realized Met price per Mt sold ($/Mt)
239.7207.4
266.5253.0
(26.8)(45.6)
(10.1)(18.0)%
 
Coronado Global Resources Inc.
Form 10-Q September 30, 2023
37
Nine months ended September 30, 2023 compared to
Nine months ended September 30, 2022
Australia
Nine months ended September 30,
2023
2022
Change
%
(in US$ thousands)
Sales volume (MMt)
7.2
7.5
(0.3)
(3.8)%
Total
revenues ($)
1,286,242
1,730,172
(443,930)
(25.7)%
Coal revenues ($)
1,260,741
1,701,901
(441,160)
(25.9)%
Average realized price per Mt sold ($/Mt)
174.0
225.9
(51.9)
(23.0)%
Met sales volume (MMt)
5.0
5.0
0.5%
Met coal revenues ($)
1,195,413
1,615,364
(419,951)
(26.0)%
Average realized Met price per Mt sold ($/Mt)
238.5
323.9
(85.4)
(26.4)%
Mining costs ($)
772,561
648,965
123,596
19.0%
Mining cost per Mt sold ($/Mt)
107.8
89.3
18.5
20.7%
Operating costs ($)
1,249,490
1,206,022
43,468
3.6%
Operating costs per Mt sold ($/Mt)
172.5
160.1
12.4
7.7%
Segment Adjusted EBITDA ($)
35,580
523,319
(487,739)
(93.2)%
Coal
revenues
for
our
Australian
Operations
for
the
nine
months
ended
September
30,
2023,
were
$1,260.7
million,
a
decrease
of
$441.2
million,
or
25.9%,
compared
to
$1,701.9
million
for
the
nine
months
ended
September 30, 2022. This decrease was driven by lower average
realized Met price per Mt sold of $238.5,
$85.4
per Mt lower compared to $323.9 per Mt
sold for the nine months ended September
30, 2022, as Met coal price
index
rebalanced
from
record
highs
achieved
in
2022,
particularly
in
the
first
half
of
2022,
as
steel
demand
weakened. Coal
revenues were
further impacted
by significant
wet weather
events and
equipment breakdown
and their associated recovery time resulting in
sales volumes 0.3 MMt lower compared to
the nine months ended
September 30, 2022.
Operating costs increased by $43.5 million, or 3.6%, for the nine
months ended September 30, 2023, compared
to
the
nine
months
ended
September
30,
2022,
primarily
driven
by
higher
mining
costs
and
freight
expense.
Mining costs were $123.6 million higher for the nine
months ended September 30, 2023, due to additional
fleets
mobilized in 2023
to advance
pre-strip overburden
removal, the
continued impact
of inflation on
contractor and
supply costs,
and costs
associated
with equipment
breakdown. This
increase was
partially offset
by favorable
average
foreign
exchange
on
translation
of
our
Australian
Operations
and
lower
Stanwell
rebate
and
other
royalties
expense.
Increase
in
costs
and
lower
sales
volumes
saw
Mining
and
Operating
costs
per
Mt
sold
increased by $18.5 and $12.4, respectively,
compared to the same period in 2022.
For the
nine months
ended September
30, 2023,
Adjusted EBITDA
of $35.6
million, were
$487.7 million
lower
compared to $523.3 million for the nine months ended September 30, 2022. This decrease was a result of lower
coal revenues
and higher mining and operating costs.
United States
Nine months ended September 30,
2023
2022
Change
%
(in US$ thousands)
Sales volume (MMt)
4.5
4.9
(0.4)
(8.1)%
Total
revenues ($)
924,828
1,124,314
(199,486)
(17.7)%
Coal revenues ($)
902,352
1,119,433
(217,081)
(19.4)%
Average realized price per Mt sold ($/Mt)
201.2
230.5
(29.3)
(12.6)%
Met sales volume (MMt)
3.9
4.7
(0.8)
(18.4)%
Met coal revenues ($)
773,184
1,098,186
(325,002)
(29.6)%
Average realized Met price per Mt sold ($/Mt)
199.5
232.4
(32.9)
(14.0)%
Mining costs ($)
437,860
396,562
41,298
10.4%
Mining cost per Mt sold ($/Mt)
101.6
85.0
16.6
19.8%
Operating costs ($)
579,922
547,632
32,290
5.9%
Operating costs per Mt sold ($/Mt)
129.3
112.8
16.5
14.8%
Segment Adjusted EBITDA ($)
349,160
578,183
(229,023)
(39.6)%
Coal revenues
decreased by
$217.1 million,
or 19.4%,
to $902.4 million
for the nine
months ended
September
30,
2023,
compared
to
$1,119.4
million
for
the
nine
months
ended
September
30,
2022.
This
decrease
was
Coronado Global Resources Inc.
Form 10-Q September 30, 2023
38
primarily due to lower average realized
Met price per Mt sold for
the nine months ended September
30, 2023 of
$199.5 compared to $232.4
per Mt sold for
the same period in
2022, product mix
skewed towards lower
quality
Met coal
and lower
sales volume
driven by
lower production
which was
impacted by
adverse geological
conditions
and wet weather events in the 2023 period.
Operating costs of
$580.0 million were
$32.3 million higher
compared to $547.6 million
for the nine
months ended
September
30,
2023.
Mining
costs
contributed
$41.3
million
of
the
increase
driven
by
continued
inflationary
impact on
labor and
supply
costs
and unplanned
maintenance
costs. Mining
and Operating
costs per
Mt sold
increased by $16.6
and $16.5, respectively, due to
lower sales volume
and higher costs
in the
nine months ended
September 30, 2023.
Adjusted EBITDA of $349.2
million decreased by $229.0
million, or 39.6%, for
the nine months ended
September
30,
2023,
compared
to
$578.2
million
for
the
nine
months
ended
September
30,
2022.
This
decrease
was
primarily driven by lower coal revenues
and higher mining and operating costs.
Corporate and Other Adjusted EBITDA
The following table presents a summary of the components
of Corporate and Other Adjusted EBITDA:
Nine months ended September 30,
2023
2022
Change
%
(in US$ thousands)
Selling, general, and administrative expenses
$
29,976
$
28,657
$
1,319
4.6%
Other, net
(888)
(78)
(810)
n/m
Total
Corporate and Other Adjusted EBITDA
$
29,088
$
28,579
$
509
1.8%
n/m – Not meaningful for comparison.
Corporate and
other costs
of $29.1
million for
the nine
months
ended September
30, 2023,
were $0.5
million
higher
compared
to
$28.6
million
for
the
nine
months
ended
September
30,
2022,
due
to
timing
of
certain
corporate costs.


Coronado Global Resources Inc.
 
Form 10-Q March 31,September 30, 2023
 
2939
Mining and operating costs
for the Nine
months ended September 30,
2023 compared to Nine
months
ended September 30, 2022
A reconciliation of
segment costs and
expenses, segment operating
costs, and segment
mining costs is
shown
below:
Nine months ended September 30, 2023
(in US$ thousands)
Australia
United
States
Other /
Corporate
Total
Consolidated
Total costs and
expenses
$
1,297,492
$
644,168
$
30,780
$
1,972,440
Less: Selling, general and administrative
expense
(29,976)
(29,976)
Less: Depreciation, depletion and amortization
(48,002)
(64,246)
(804)
(113,052)
Total operating costs
1,249,490
579,922
1,829,412
Less: Other royalties
(231,443)
(37,163)
(268,606)
Less: Stanwell rebate
(105,357)
(105,357)
Less: Freight expenses
(120,747)
(71,795)
(192,542)
Less: Other non-mining costs
(19,382)
(33,104)
(52,486)
Total mining costs
772,561
437,860
1,210,421
Sales Volume excluding non-produced
coal
(MMt)
7.2
4.3
11.5
Mining cost per Mt sold ($/Mt)
107.8
101.6
105.5
Nine months ended September 30, 2022
(in US$ thousands)
Australia
United
States
Other /
Corporate
Total
Consolidated
Total costs and
expenses
$
1,270,397
$
609,291
$
29,524
$
1,909,212
Less: Selling, general and administrative
expense
(28,657)
(28,657)
Less: Depreciation, depletion and amortization
(64,375)
(61,659)
(867)
(126,901)
Total operating costs
1,206,022
547,632
1,753,654
Less: Other royalties
(259,140)
(40,571)
(299,711)
Less: Stanwell rebate
(124,160)
(124,160)
Less: Freight expenses
(116,386)
(72,930)
(189,316)
Less: Other non-mining costs
(57,371)
(37,569)
(94,940)
Total mining costs
648,965
396,562
1,045,527
Sales Volume excluding non-produced
coal
(MMt)
7.3
4.7
11.9
Mining cost per Mt sold ($/Mt)
89.3
85.0
87.6
Average realized Met
price per Mt
sold for the
Nine months ended
September 30, 2023
compared to
Nine months ended September 30, 2022
A reconciliation of the Company’s average realized
Met price per Mt sold is shown below:
Nine months ended September 30,
2023
2022
Change
%
(in US$ thousands)
Met sales volume (MMt)
8.9
9.7
(0.8)
(8.7)%
Met coal revenues ($)
1,968,597
2,713,550
(744,953)
(27.5)%
Average realized Met price per Mt sold ($/Mt)
221.5
279.4
(57.9)
(20.7)%
Coronado Global Resources Inc.
Form 10-Q September 30, 2023
40
Reconciliation of Non-GAAP Financial Measures
Adjusted EBITDA
Three months ended March 31,September
30,
Nine months ended September
30,
(in US$ thousands)
2023
2022
2023
2022
Reconciliation to Adjusted EBITDA:
Net (loss) income
$
107,860(21,083)
$
269,898150,575
$
178,088
$
712,468
Add: Depreciation, depletion and amortization
39,42334,749
38,00937,508
113,052
126,901
Add: Interest expense (net of interest income)
14,66514,496
17,33217,220
43,341
52,034
Add: Other foreign exchange (gains) lossesgains
(2,992)(7,859)
1,991(31,917)
(17,265)
(55,064)
Add: Loss on extinguishment of debt
1,385
1,385
Add: Income tax expense
34,030(18,230)
81,94351,423
37,775
235,391
Add: Losses on idled assets held for sale
1,751456
1,386(1,221)
3,531
621
Add: (Decrease) increase in provision for
discounting
and credit losses
(3,988)(536)
428(12)
(4,255)
572
Adjusted EBITDA
$
190,7493,378
$
410,987223,576
$
355,652
$
1,072,923
Liquidity and Capital Resources
Overview
Our objective is
 
to maintain a
 
prudent capital structure
 
and to ensure
 
that sufficient
 
liquid assets and
 
funding is
available to meet both anticipated and
 
unanticipated financial obligations, including unforeseen events that could
have an
 
adverse impact
 
on revenues
 
or costs.
 
Our principal
 
sources of
 
funds are
 
cash and
 
cash equivalents,
cash flow from operations and availability under our debt
facilities.
 
Our main uses of cash have historically been, and are expected to continue to be, the funding of our
operations,
working capital,
 
capital
 
expenditure,
 
debt
 
service
 
obligations,
 
business
 
or assets
 
acquisitions
 
and
 
payment
 
of
dividends. Based
on our
 
outlook for
the next
 
twelve months,
which is
 
subject to
completion of
the SGI
Transaction,
continued changing demand from our customers, volatility in coal prices, ongoing interruptions and uncertainties
surrounding China’s import restrictions, such as trade barriers imposed by China on Australian sourced coal and
the
uncertainty
of
impacts
 
from
our
customers,
volatility
in
coal
prices,
 
ongoing
 
interruptionscivil
unrest
 
and
 
uncertaintieswars,
 
surroundingwe
 
China’sbelieve
 
import
restrictions, such as tradeexpected
 
barriers imposed by Chinacash
 
on Australian sourced coalgenerated
from
operations together with available borrowing facilities
 
and the uncertainty of
impacts
from the
Russia and Ukraine
war on
the global
supply chain,
we believe
expected cash generated
from operations
together with
available borrowing
facilities and
other strategic
and financial
 
initiatives, will be sufficient
to meet
 
be sufficientthe needs
 
to meet
the needs of our existing
 
existing operations,
capital expenditure,
 
service our
debt obligations
 
and, if
declared, payment
payment of dividends.
Under
the
Senior
Secured
Notes
Indenture,
upon
a
change
of
control,
we
are
required
to
make
an
offer
to
purchase the Notes from the holders at a
price of 101% of the principal amount thereof,
plus accrued and unpaid
interest.
Under the New ABL Facility,
a change of control constitutes a Review Event pursuant to which the Lenders may
request to meet
and consult with
us to agree
a strategy to
address the relevant
Review Event including
but not
limited to a restructure
of the terms of the
New ABL Facility to
the satisfaction of the
Lenders. Refer to Note
10.
“Interest Bearing Liabilities” for further information.
Our ability to generate sufficient cash
 
sufficient cash depends
on our future performance,
 
which may be subject
to a number
of
factors
 
beyond
 
our
 
control,
 
including
 
general
 
economic,
 
financial
 
and
 
competitive
 
conditions
 
and
 
other
 
risks
described in this document
 
,document, and Part
 
and Part I, Item 1A. “Risk
 
1A. “Risk Factors” of our
 
of our Annual Report on
 
on Form 10-K for the
 
for the year
ended December 31,
2022, filed
with the SEC
and ASX on
 
February 21, 2023.
Liquidity as of March 31, 2023 and December 31, 2022
 
was as follows:
(in US$ thousands)
March 31,
2023
December 31,
2022
Cash, excluding restricted cash
$
498,048
$
334,378
Availability under ABL Facility
(1)
100,000
100,000
Total
$
598,048
$
434,378
(1)
The ABL, and Part
 
Facility containsII, Item
 
a springing1A. “Risk Factors”
of our Quarterly Report
 
fixed charge
coverage ratio
of not
less than
1.00 to
1.00, which
ratio is
tested if
availability underon Form 10-Q for
 
the ABL facilityquarterly period ended March
 
is less than
$17.5 million
for five consecutive
business days
or less than
$15.0 million on
any business day.
Our total indebtedness as of March 31, 2023, and December 31,filed with
 
2022 consisted of the following:SEC and ASX
(in US$ thousands)
March 31,
2023
December 31,
2022
Current instalments of interest bearing liabilities
$
242,326
$
242,326
Current instalments of other financial liabilities and financeon May 8, 2023.
 
lease obligations
4,304
4,585
Other financial liabilities and finance lease obligations, excluding current
instalments
7,532
8,336
Total
$
254,162
$
255,247
 
Coronado Global Resources Inc.
 
Form 10-Q March 31,September 30, 2023
 
41
Liquidity as of September 30, 2023 and December 31,
2022 was as follows:
(in US$ thousands)
September 30,
2023
December 31,
2022
Cash, excluding restricted cash
$
336,845
$
334,378
Short term deposits
21,618
Availability under the Predecessor ABL Facility
100,000
Availability under the New ABL Facility
(1)
128,382
Total
$
486,845
$
434,378
(1)
The New ABL Facility
provides for up to
$150.0 million in borrowings,
including a $100.0 million
sublimit for the issuance
of letters of credit,
of which $21.6 million
has been issued, and
$70.0 million sublimit as
a revolving credit facility.
The letter
of credit sublimit contributes to our liquidity as the Company has the ability
to replace cash collateral, provided in the form of
restricted deposits, with letters of credit allowing the release of such restricted deposits to cash and cash equivalents.
Our total indebtedness as of September 30, 2023 and
December 31, 2022 consisted of the following:
(in US$ thousands)
September 30,
2023
December 31,
2022
Current installments of interest bearing liabilities
$
242,326
$
242,326
Current installments of other financial liabilities and finance
lease obligations
4,040
4,585
Other financial liabilities and finance lease obligations, excluding
current
installments
5,748
8,336
Total
$
252,114
$
255,247
Liquidity
As
of March 31,
September
30,
2023,
available
liquidity
was $598.0
$486.8 million, comprising
comprised
of
cash
and
cash
equivalents (excluding
(excluding restricted cash) of $498.0$336.8
million, unrestricted short term deposits
of $21.6 million and $100.0$128.4 million
of
available borrowings under our New ABL Facility.
As
of
 
December
31,
 
2022,
available
liquidity
 
was $434.4
$434.4
million,
 
comprising comprised
of
cash
and
 
cash equivalents
 
equivalents
(excluding
restricted cash) of $334.4 million and $100.0
million of
available borrowings under our ABL Facility.
Cash
Cash is held in
 
multicurrency interest bearing
 
bank accounts available to
 
be used to service
 
the working capital
needs of the Company. Cash
 
balances surplus to immediate working capital requirements are invested
 
in short-
term interest-bearing deposit accounts or used to repay
 
interest bearing liabilities.
Senior Secured Notes
As of March 31,
September
30,
2023, the
outstanding
principal
amount of
our Notes
was $242.3 million.
$242.3 million
.
 
Interest on
the
Notes is
payable semi-annually in arrears on May 15 and November 15 of each year.
 
year. The Notes mature on May
15, 2026
and are senior secured obligations of the Company.
The Notes are guaranteed
 
on a senior secured
 
basis by the Company
 
and its wholly-owned
 
subsidiaries (other
than
 
the
 
Issuer)
 
(subject
 
to
 
certain
 
exceptions
 
and
 
permitted
 
liens)
 
and
 
secured
 
by
 
(i)
 
a
 
first-priority
 
lien
 
on
substantially all of the Company’s assets and the assets of the other guarantors (other than accounts
 
accounts receivable
and other rights to payment,
 
inventory,
 
intercompany indebtedness, certain
 
general intangibles and commercial
tort claims, commodities accounts, deposit accounts, securities accounts and other related assets and proceeds
and
 
products
 
of
 
each
 
of
 
the
 
foregoing,
 
or,
 
collectively,
 
the
 
ABL
 
Collateral),
 
or
 
the
 
Notes
 
Collateral,
 
and
 
(ii)
 
a
second-priority lien on the ABL Collateral, which is
 
junior to a first-priority lien, for the
 
benefit of the lenders under
the ABL Facility.
The terms
 
of the
 
Notes are
 
governed
 
by the
 
Indenture.
 
The Indenture
 
contains
 
customary
covenants
 
for high
yield bonds, including,
 
but not limited
 
to, limitations on
 
investments, liens, indebtedness,
 
asset sales, transactions
with affiliates and restricted payments, including payment
 
payment of dividends on capital stock.
The Company may
 
redeem some or
 
all of the
 
Notes at the
 
redemption prices and
 
on the terms
 
specified in the
Indenture. In addition, the Company may,
 
from time to time, seek to retire or purchase outstanding
 
debt through
open-market purchases,
 
privately negotiated
 
transactions or
 
otherwise. Such
 
repurchases, if
 
if any,
 
will be
 
upon
such terms and at such prices as the Company may determine, and will depend on prevailing market conditions,
liquidity requirements, contractual restrictions and other
 
factors.
Coronado Global Resources Inc.
Form 10-Q September 30, 2023
42
Based on information that
we are currently aware
of, on completion of
the SGI Transaction, a “Change
of Control”
as defined under
the terms of
the Notes may
occur. Refer to Part
I, Item
I. Financial Statements,
Note 10. “Interest
Bearing Liabilities” for further information.
As of March 31,September 30, 2023, we were in compliance with
all applicable covenants under the Indenture.
New ABL Facility
On May 8, 2023, we entered into
a senior secured asset-based revolving credit agreement in
an initial aggregate
amount of $150.0 million, or the New ABL Facility.
On August 3, 2023, the Company
satisfied all conditions precedent
 
under the Indenture.
New ABL Facility,
at which time it
became effective and replaced the predecessor
ABL Facility.
The ABLNew
 
ABL Facility
 
dated Maymatures in
 
12, 2021,August 2026
 
is forand provides
 
an aggregate
multi-currency
lender commitment
offor up
 
to $100.0
million, including a $30.0 million$150.0
 
million in
borrowings, including
a
$100.0 million sublimit for the issuance
 
of letters of credit and $70.0
 
$5.0 million for swinglinesublimit as a revolving
 
loans,credit facility.
at anyAvailability under the New
 
time outstanding,ABL Facility is
 
subject limited to an
eligible borrowing base, determined
by applying customary
advance rates to eligible accounts receivable and inventory.
Borrowings under the New
ABL Facility bear interest
at a rate per
annum equal to applicable
rate of 2.80% and
BBSY,
for loans denominated in A$, or SOFR, for loans
denominated in US$, at the Borrower’s election.
Subject
to
 
borrowingcustomary
 
base availability.grace
 
The periods
and
notice
requirements,
the
New
ABL
 
Facility
 
will maturealso
contains
customary
events of default.
Based on information
that we are
currently aware of,
 
on Maycompletion of
 
12, 2024.the SGI Transaction,
a “Change of
Control”
as defined under the terms of the
New ABL Facility may occur. Refer to Part I, Item I.
Financial Statements, Note
10. “Interest Bearing Liabilities” for further information.
 
Borrowings under the ABL
Facility bear interest at
a rate equal to
a BBSY rate plus
an applicable margin. As
 
at
September
March 31,
30,
2023, no amounts were drawn and no letters
letter
 
of credit were outstanding under the ABL Facility.
As of March 31, 2023, we were in compliance with all applicable covenants
 
under the ABL Facility.
Refinancing update
On April 28, 2023, we enteredcredit
 
into a Syndicated Facilitysublimit
 
Agreement, or SFA,had
 
which will provide for upbeen
partially
used
 
to $150.0
million
 
in
borrowings,
including aissue
 
$100.021.6
 
million
 
sublimitof
 
for bank
guarantees
on
behalf
of
the
 
issuanceCompany
 
ofand
no
amounts
were drawn
and
no
 
letters
 
of credit
 
andwere
 
$70.0
millionoutstanding
sublimit for revolving credit facility.
The SFA replaced
the ABL Facility.
Availability
under
 
the
 
SFArevolving
 
iscredit
 
limitedsublimit
 
toof
 
anNew
 
eligibleABL
 
borrowingFacility.
 
base,As
 
determinedat
 
bySeptember
 
applying30,
 
advance2023,
 
ratesthe
 
toCompany
was
in
eligible accounts receivablecompliance with all applicable covenants under the New
ABL Facility.
Predecessor ABL Facility
On August 3, 2023, the Company satisfied all conditions precedent under
the New ABL Facility at which time the
New ABL Facility replaced
the predecessor ABL Facility.
As a result of the
early termination of
the predecessor
ABL Facility,
the Company
recorded a
loss on
debt extinguishment
of $1.4
million in
its unaudited
Condensed
Consolidated Statement of Operations and inventory.Comprehensive Income for each of
the three and nine months ended
September 30, 2023.
Bank Guarantees and Surety Bonds
We
 
are
 
required
 
to
 
provide
 
financial
 
assurances
 
and
 
securities
 
to
 
satisfy
 
contractual
 
and
 
other
 
requirements
generated in the
 
normal course of
 
business. Some of
 
these assurances are provided
 
to comply with
 
state or other
government agencies’ statutes and regulations.
As required by certain agreements,
we had cash collateral in the form
of deposits in the amount of $67.9
million
and
$89.1
million
as
of
September
30,
2023,
and
December
31,
2022,
respectively,
to
provide
back-to-back
support
for
bank
guarantees,
financial
payments,
other
performance
obligations,
various
other
operating
agreements and
contractual obligations
under workers
compensation insurance.
These deposits
are restricted
and classified as long-term assets in the unaudited Condensed
Consolidated Balance Sheets.
In accordance with the terms of the ABL Facility, we may be required to cash collateralize the ABL Facility to the
extent
of
outstanding
letters
of
credit
after
the
expiration
or
termination
date
of
such
letter
of
credit.
As
of
September
30,
2023,
no
letter
of
credit
was
outstanding
after
the
expiration
or
termination
date
and
no
cash
collateral was required.
For the U.S. Operations
in order to
provide the required
financial assurance, we
generally use surety
bonds for
post-mining
reclamation.
We
can
also
use
bank
letters
of
credit
to
collateralize
certain
obligations.
As
of
September 30, 2023,
we had outstanding
surety bonds of
$40.9 million and
letters of credit
of $16.8 million
issued
from our available
bank guarantees
under the New
ABL Facility,
to meet contractual
obligations under
workers
compensation insurance and to secure other obligations
and commitments.


Coronado Global Resources Inc.
 
Form 10-Q March 31,September 30, 2023
 
31
As required by certain agreements,
we had cash collateral in the form
of deposits in the amount of $86.5
million
and $89.1 million
as of March
31, 2023, and
December 31, 2022,
respectively,
to provide back-to-back
support
for bank guarantees, financial
payments, other performance obligations, various
other operating agreements and
contractual obligations
under workers
compensation insurance.
These deposits
are restricted
and classified
as
long-term assets in the unaudited Condensed Consolidated
Balance Sheets.
In accordance with the terms of the ABL Facility, we may be required to cash collateralize the ABL Facility to the
extent of outstanding letters
of credit after the expiration
or termination date of
such letter of credit.
As of March
31, 2023, no letter of credit was outstanding and no
cash collateral was required.43
For the U.S. OperationsAustralian
 
in order to provideOperations, we had bank
 
the required financialguarantees outstanding of $24.1
 
assurance, we generallymillion,
 
use surety bondsincluding $4.9 million issued
from the New ABL
 
for
post-mining reclamation.Facility,
 
We can alsoas at September 30,
 
use bank letters2023, primarily in respect
 
of credit tocertain rail and
 
collateralize certainport arrangements
of the Company.
 
obligations.
As of
 
March
31, 2023, we had outstandingat
 
surety bonds of $37.6 millionSeptember
 
and letters of credit of30,
 
$16.8 million issued from our
available bank guarantees, to
meet contractual obligations under
workers compensation insurance and to
secure
other obligations and commitments.
For
the
Australian
Operations,2023,
 
we
 
had
 
total
outstanding
bank
 
guarantees
 
outstandingprovided
 
of
 
$25.540.9
 
million
 
asto
 
atsecure
obligations and
 
March
31,
2023,
primarily in respect of certain rail and port arrangements
of the Company.
As at March 31, 2023, we had
total outstanding bank guarantees provided
of $42.3 million to secure obligations
and commitments. Future
 
regulatory changes relating
 
relating to
these obligations
 
could result in
 
in increased obligations,
obligations, additional costs or additional collateral requirements.
Dividend
On February 21,
 
2023, our Board
 
of Directors declared
 
a bi-annual fully
 
franked fixed ordinary
 
dividend of $8.4
million, or 0.5
 
cents per CDI.
 
On April
 
5, 2023, the
 
Company paid $8.3
 
million, net of
 
$0.1 million foreign
 
exchange
gain on payment of dividends to certain CDI holders
 
who elected to be paid in Australian dollars.
On April 28,
August
7,
 
2023, we announced
 
that the Companyour
 
would not declare
any dividends to
stockholders for the
fiscal
quarter ended March
31, 2023.
Subject to the assessments and outcomes of
potential in-organic growth options
in the future,
and on-going operational
performance and market
conditions, our Board
 
of Directors may
 
declare
dividends in futureDirectors
 
quarters. Coronado’sdeclared
a
bi-annual
fully
franked
fixed
ordinary
 
dividend policy
 
remains unchanged toof
 
distribute between 60%$8.4
million, or 0.5 cents per CDI. On September 19, 2023,
 
- 100%the Company paid $8.3 million, net of $0.1 million foreign
exchange loss on payment of Free Cashflow.dividends to certain CDI
holders who elected to be paid in Australian dollars.
Capital Requirements
Our main uses of cash have historically been the funding
 
funding of our operations, working capital, capital expenditure,
the payment of
 
interest and dividends.
 
We intend
 
to use cash
 
to fund debt
 
service payments
 
on our Notes,
 
the
New ABL Facility and our
 
other indebtedness, to fund operating
 
operating activities, working capital,
capital expenditures, partial
partial redemption of the Notes, business or assets acquisitions and,
 
and, if declared, payment of dividends.
Historical Cash Flows
The following table
 
table summarizes
our cash
 
flows for the
 
three the nine
months ended
 
March 31, 2023September 30,
 
2023 and
2022, as
reported
reported in the accompanying consolidated financial statements:
Cash Flow
ThreeNine months ended March 31,September 30,
(in US$ thousands)
2023
2022
Net cash provided by operating activities
$
223,626223,681
$
171,849945,384
Net cash used in investing activities
(54,147)(183,028)
(41,176)(150,670)
Net cash used in financing activities
(951)(23,005)
(4,816)(483,854)
Net change in cash and cash equivalents
168,52817,648
125,857310,860
Effect of exchange rate changes on cash and restricted
 
cash
(4,857)(15,180)
7,679(50,144)
Cash and restricted cash at beginning of period
334,629
437,931
Cash and restricted cash at end of period
$
498,300337,097
$
571,467698,647
Operating activities
Net cash
provided by
operating activities
was $223.7
million for
the nine
months ended
September 30,
2023,
compared to $945.4 million
for the nine
months ended September 30,
2022. The decrease in
cash from operating
activities was driven
by the lower
coal revenues, higher
operating costs and
income tax paid
during the period,
including $107.6 million relating to 2022 taxable income.
Investing activities
Net
 
cash
 
providedused
 
byin
 
operatinginvesting
 
activities
 
was
 
$223.6 183.0
million
for
the
nine
months
ended
September
30,
2023,
compared to $150.7 million for the nine months ended September 30, 2022. Cash spent on capital expenditures
for the
nine months
ended September
30, 2023
was $182.4
million, of
which $
44.3 million
was related
to the
Australian Operations and $ 138.1 million was related
to the U.S. Operations.
Financing activities
Net cash used
in financing activities was
$23.0 million
for the nine
months ended September 30,
2023, compared
to cash
used in
financing
activities
of $483.9
million for
the nine
months ended
September 30,
2022. The
net
cash
used
in
financing
activities
 
for
 
the
 
threenine
 
months
 
ended
 
MarchSeptember
 
31,30,
 
2023
compared to $171.8 million for
 
the three months ended March 31,largely
 
2022. Higher operating cash flows were
driven
by
the
favorable
movement
in
working
capital
duerelated
 
to
 
higherdividends
payment of $16.8
 
collectionmillion, payment of
deferred debt issuance
costs for the
New ABL Facility
 
of $3.4 million
 
tradeand
repayment of borrowings and other financial liabilities
 
receivables
partially
offset
by
higher operating costs.of $2.8 million.
 
Coronado Global Resources Inc.
 
Form 10-Q March 31,September 30, 2023
 
3244
Investing activities
NetIncluded in net cash used in investing activities was $54.1 million
for the three months ended March 31, 2023, compared to
$41.2 million
for the
three months
ended March
31, 2022.
Cash spent
on capital
expenditures for
the three
months
ended March 31,
2023 was $54.8
million, of which
$14.6 million related
to the Australian
Operations and $40.2
million related
to the
U.S. Operations. During
the three months
ended March
31, 2023,
a net $0.7
million restricted
deposits was redeemed relating to our Australian Operations.
Financing activities
Net cash used
in financing activities
 
was $1.0 million
for the three
nine months ended MarchSeptember
 
31, 2023, compared
to30, 2022, were dividends
cash used in
financing activities
paid of $4.8$473.9 million
for the three
months ended March
31, 2022. The
net cash used
in
financing
activities
for
the
three
months
ended
March
31,
2022
and
March
31,
2023,
largely
related
to
repayment of borrowings and
other financial liabilities.liabilities of $10.0 million.
Contractual Obligations
There were no
 
material changes
 
to our contractual
 
obligations from
 
the information
 
previously provided
 
in Item
7.
 
“Management’s
 
Discussion
 
and
 
Analysis
 
of
 
Financial
 
Conditions
 
and
 
Results
 
of
 
Operations”
 
of
 
our
 
Annual
Report on Form 10-K for the year ended December 31, 2022, filed with the SEC and
 
ASX on February 21, 2023.
Critical Accounting Policies and Estimates
The preparation
 
of
 
our
 
financial
 
statements
 
in
 
conformity
 
with
 
U.S. GAAP
 
requires
 
us to
 
make
 
estimates
 
and
assumptions that affect the
 
reported amounts of assets and liabilities
 
at the date of the financial statements
 
and
the reported
 
amounts of
 
revenue and
 
expenses during
 
the reporting
 
period. On
 
an ongoing basis,
 
we evaluate
our estimates. Our estimates are
 
based on historical experience
 
and various other assumptions
 
that we believe
are appropriate,
 
the results
 
of which form
 
the basis
 
for making
 
judgements about
 
the carrying values
 
of assets
and liabilities that are not readily apparent from other sources. Actual results may differ from these estimates. All
of these accounting estimates and assumptions, as well as the resulting impact to
 
our financial statements, have
been discussed with the Audit Committee of our Board
 
of Directors.
Our
 
critical
 
accounting
 
policies
 
are discussed
 
in
 
Item
 
7. “Management’s
 
Discussion
 
and
 
Analysis
 
of Financial
Condition and Results of
 
Operations” of our Annual
 
Report on Form 10-K for
 
the year ended December
 
31, 2022,
filed with the SEC and ASX on February 21, 2023.
Newly Adopted Accounting Standards and Accounting
 
Standards Not Yet Implemented
See
 
Note
 
2.
 
(a)
 
“Newly
 
Adopted
 
Accounting
 
Standards”
 
to
 
our
 
unaudited
 
condensed
 
consolidated
 
financial
statements
for
 
a
discussion
 
of
newly
 
adopted
accounting
 
standards.
As
 
of September
 
March
31,
30, 2023,
 
there
were
 
no
accounting standards not yet implemented.
 
Coronado Global Resources Inc.
 
Form 10-Q March 31,September 30, 2023
 
3345
ITEM 3.
 
QUANTITATIVE
 
AND QUALITATIVE
 
DISCLOSURES ABOUT MARKET RISK
Our activities
 
expose us
 
to
 
a variety
 
of financial
 
risks, such
 
as commodity
 
price risk,
 
interest rate
 
risk, foreign
currency risk, liquidity risk and credit
 
risk. The overall risk management objective is
 
to minimize potential adverse
effects on our financial performance from those
 
risks which are not coal price related.
We manage
 
financial risk
 
through policies
 
and procedures
 
approved by
 
our Board
 
of Directors.
 
These specify
the responsibility
 
of the
 
Board
 
of Directors
 
and
 
management
 
with regard
 
to the
 
management
 
of financial
 
risk.
Financial risks are
 
managed centrally by
 
our finance
 
team under the
 
direction of the
 
Group Chief Financial
 
Financial Officer.
The finance team manages risk exposures primarily through delegated authority limits approved
by the Board of
Directors. The finance team regularly monitors
our exposure
to these financial risks and reports to
 
to management
and
 
the
 
Board
 
of
 
Directors
 
on
 
a
 
regular
 
basis.
 
Policies
 
are
 
reviewed
 
at
 
least
 
annually
 
and
 
amended
 
where
appropriate.
We may use
 
derivative financial instruments such
 
as forward fixed
 
price commodity contracts, interest
 
rate swaps
and
 
foreign
 
exchange
 
rate
 
contracts
 
to
 
hedge
 
certain
 
risk
 
exposures.
 
Derivatives
 
for
 
speculative
 
purposes
 
is
strictly prohibited by the Treasury Risk Management Policy approved by our Board of
 
Directors. We use different
methods
 
to
 
measure
 
the
 
extent
 
to
 
which
 
we
 
are
 
exposed
 
to
 
various
 
financial
 
risks.
 
These
 
methods
 
include
sensitivity analysis
 
in the
 
case of
 
interest rates,
 
foreign exchange
 
and other
 
price risks
 
and aging
 
analysis for
credit risk.
Commodity Price Risk
Coal Price Risk
We
 
are
 
exposed
 
to
 
domestic
 
and
 
global
 
coal
 
prices.
 
Our
 
principal
 
philosophy
 
is
 
that
 
our
 
investors
 
would
 
not
consider
 
hedging
 
of
 
coal
 
prices
 
to
 
be
 
in
 
the
 
long-term
 
interest
 
of
 
our
 
stockholders.
 
Therefore,
 
any
 
potential
hedging of coal prices through long-term fixed price contracts is subject to the approval of our Board of Directors
and would only be adopted in exceptional circumstances.
The
 
expectation
 
of
 
future
 
prices
 
for
 
coal
 
depends
 
upon
 
many
 
factors
 
beyond
 
our
 
control.
 
Met
 
coal
 
has
 
been
volatile commodity
over the
past ten
 
years. Recently,In the second quarter of
 
in 2022, seaborne prices reached record levels
with
both
the
 
second quarterAustralian
and
U.S.
Met
coal
price
indices
exceeding
$600
per
Mt,
largely
as
result
 
of 2022,
 
seaborne prices
reachedsupply
record levels with both the Australian and U.S.concerns in key Met coal price indices exceeding $600 per Mt, largely as result of
supply concerns
in key
Met coal
markets and
continued trade
flow disruptions
caused by
geopolitical tensions following
following Russian
invasion
of Ukraine.
The demand
 
and supply in the Met coal industry
 
in thechanges from time to time. There
are
 
Met coalno
 
industry changesassurances
 
from timethat
 
tooversupply
will
time. There are no assurances that oversupply will not occur, that demand will not decrease or that overcapacity
will not
 
occur,
that
demand
will
not
decrease
or
that
overcapacity
will
not
occur, which could
cause declines in
the prices
of coal,
 
which could
 
cause declineshave a
 
in the
prices of
coal, which
could have
a material
adverse effect
 
on our
financial
our financial condition and results of operations.
Access to
 
international markets
 
may be
 
subject to
 
ongoing interruptions
 
and trade
 
barriers due
 
to policies
 
and
tariffs of individual countries. For example, the imposition of
 
tariffs and import quota restrictions by China on U.S.
and Australian coal
 
imports, respectively,
 
may in the future
 
have a negative
 
impact on our
 
profitability.
 
We may
or may not be able to access alternate markets of our coal should additional interruptions
or trade barriers
occur
in the future. An
 
inability for metallurgical coal
 
suppliers to access
 
international markets, including China,
 
would
likely
 
result
 
in
 
an
 
oversupply
 
of
 
Met
 
coal
 
and
 
may
 
result
 
in
 
a
 
decrease
 
in
 
prices
 
and
 
or
 
the
 
curtailment
 
of
production.
We manage
 
our commodity
 
price risk
 
for our non-trading,
 
thermal coal
 
sales through
 
the use
 
of long-term
 
coal
supply agreements in our
 
U.S. Operations. In Australia, thermal
 
coal is sold
 
to Stanwell on a
 
supply contract. See
Item
 
1A.
 
“Risk
 
Factors—Risks
 
related
 
to
 
the
 
Supply
 
Deed
 
with
 
Stanwell
 
may
 
adversely
 
affect
 
our
 
financial
condition and results of operations” in our Annual Report on Form 10-K filed with the SEC and ASX on February
21, 2023.
Sales commitments in the
 
Met coal market are typically
 
not long-term in nature, and
 
and we are therefore subject
 
to
fluctuations
in
 
market
pricing.
 
Certain
coal
 
sales
in
our
Australian
Operations
are
 
provisionally
priced
 
initially.
Provisionally priced sales
 
sales are
those for which price finalization,
 
which price
finalization, referenced
to the relevant index,
 
index, is outstanding
at the reporting
date. The final
sales price is determined
 
determined within 7 to
90 days after delivery
 
delivery to the customer.
 
As of September
March 31,30, 2023,
 
we had $57.8
$26.7
 
million
of
 
outstanding provisionally
priced receivables
subject to
changes in
the
relevant
price
index.
If
prices
decreased
10%,
these
 
provisionally
 
priced
 
receivables
 
wouldsubject
 
decreaseto
 
by
$5.8
million. See Item 1A. “Risk Factors—Our profitability depends upon the prices we receive for our coal.
Prices for
coal
are
volatile
and
can
fluctuate
widely
based
upon
a
number
of
factors
beyond
our
control”changes
 
in
 
the
relevant
price
index.
If
prices decreased 10%, these provisionally
priced receivables would decrease by
$2.7 million. See Item
1A. “Risk
Factors—Our profitability
depends upon
the prices
we receive
for our
 
Annualcoal. Prices
for coal
are volatile
and can
fluctuate widely
based upon
a number
of factors
beyond our
control” in
our Annual
Report on
Form 10-K
filed
with the SEC and ASX on
February 21, 2023.
 
Coronado Global Resources Inc.
Form 10-Q March 31, 2023
34
Diesel Fuel
We may
 
be exposed
 
to price
 
risk in
 
relation to
 
other commodities
 
from time
 
to time
 
arising from
 
raw materials
used in our
operations (such
as gas or
 
or diesel).
The expectation
of future
prices for
diesel depends
upon many
factors
beyond
our
control.
The
current
Israel-Palestine
conflict
could
create
significant
uncertainty
regarding
interruptions to global oil supply causing significant
volatility in prices of related commodities,
including the price
Coronado Global Resources Inc.
Form 10-Q September 30, 2023
46
of diesel fuel we
purchase. These commodities
may be hedged
through financial instruments
if the
 
exposure is
considered material
and where
if the exposure
 
is
considered material and where the exposure cannot be
 
mitigated through
fixed price
supply
agreements.
The fuel
 
required
 
for
 
our operations
 
for
 
the remainder
 
of fiscal
 
year
 
2023
 
will
 
be
 
purchased
 
under
 
fixed-price
contracts or on a spot basis.
 
Interest Rate Risk
Interest rate risk is the risk that a change in interest rates
 
on our borrowing facilities will have an adverse impact
on
 
our
 
financial
 
performance,
 
investment
 
decisions
 
and
 
stockholder
 
return.
 
Our
 
objectives
 
in
 
managing
 
our
exposure
 
to
 
interest
 
rates
 
include
 
minimizing
 
interest
 
costs
 
in
 
the
 
long
 
term,
 
providing
 
a
 
reliable
 
estimate
 
of
interest costs for the
 
annual work program
 
and budget and ensuring
 
ensuring that changes in interest
 
in interest rates will
not have
a material impact on our financial performance.
As
of March 31,
September
30,
2023,
we
had $254.4
$252.1
million
of
fixed
rate
borrowings
and
Notes
and
no
 
variable-rate borrowings
borrowings outstanding.
We currently do not hedge against interest rate
 
fluctuations.
 
Foreign Exchange Risk
A significant portion of our
 
sales are denominated in US$.
 
Foreign exchange risk is
 
the risk that our earnings
 
or
cash flows are adversely impacted by movements in exchange
 
rates of currencies that are not in US$.
Our main exposure
 
is to the
 
A$-US$ exchange rate
 
through our Australian
 
Operations, which have
 
predominantly
A$ denominated costs. Greater than 60% of expenses incurred at our Australian Operations are denominated in
A$. Approximately 40%
 
of our Australian Operations’ purchases are
 
made with reference to US$,
 
which provides
a natural hedge against foreign
 
exchange movements on these
 
purchases (including fuel, several
 
port handling
charges, demurrage,
 
purchased coal
 
and some
 
insurance premiums).
 
premiums). Appreciation of
 
of the A$
 
A$ against US$
 
US$ will
increase our Australian
 
Operations’ US$ reported
 
cost base and
 
reduce US$ reported
 
net income. For
 
the portion
of US$ required to purchase A$ to settle our Australian Operations’ operating costs, a 10% increase in the A$ to
US$ exchange rate
would increase reported
 
total costs and
expenses by approximately
 
$25.734.4 million and $86.1
million for
the three
and nine months ended March 31,September
30, 2023, respectively.
Under normal market conditions, we generally do not consider it necessary to hedge our exposure
 
exposure to this foreign
exchange risk.
 
However,
 
there
 
may be
 
specific
commercial
 
circumstances,
 
such
 
as the
 
the hedging
 
of significant
capital
 
expenditure,
 
acquisitions,
 
disposals
 
and
 
other
 
financial
 
transactions,
 
where
 
we
 
may
 
deem
 
foreign
exchange hedging
 
as appropriate
 
and
 
where a
 
US$ contract
 
cannot
 
be negotiated
 
directly with
 
suppliers
 
and
other third parties.
For our Australian
 
Operations, we
 
translate all
 
monetary assets
 
and liabilities
 
at the period-end
 
exchange rate,
all
 
nonmonetary
 
assets
 
and
 
liabilities
 
at
 
historical
 
rates
 
and
 
revenue
 
and
 
expenses
 
at
 
the
 
average
 
exchange
rates in effect during
 
the periods. The net
 
effect of these
 
translation adjustments is
 
shown in the accompanying
consolidated financial statements within components of
 
net income.
We currently do not hedge our non-US$ exposures
 
against exchange rate fluctuations.
Credit Risk
Credit risk is the risk of
 
sustaining a financial loss
 
as a result of a counterparty
 
not meeting its obligations
 
under
a financial instrument or customer contract.
We are exposed
 
to credit risk
 
when we have financial
 
derivatives, cash deposits,
 
lines of credit, letters
 
of credit
or bank guarantees
 
in place with
 
financial institutions.
To
mitigate against credit risk
 
from financial counterparties,
we have minimum credit rating requirements with financial
 
institutions where we transact.
We
 
are
 
also
 
exposed
 
to
 
counterparty
 
credit
 
risk
 
arising
 
from
 
our
 
operating
 
activities,
 
primarily
 
from
 
trade
receivables. Customers who wish to trade on
 
on credit terms are subject to credit
 
verification procedures, including
an assessment of their independent credit rating, financial position, past experience and industry reputation.
We
monitor the financial performance
 
of counterparties on a routine
 
basis to ensure credit
 
thresholds are achieved.
Where required, we will request additional credit
 
support, such as letters of credit,
 
to mitigate against credit risk.
Credit
 
risk
 
is
 
monitored
 
regularly,
 
and
 
performance
 
reports
 
are
 
provided
 
to
 
our
 
management
 
and
 
Board
 
of
Directors.
As of
 
March 31,September 30,
 
2023, we
 
had financial
 
assets of
 
$896.7690.1 million,
 
comprising
of cash
and restricted
 
cash, and
restricted cash,
trade
trade receivables and
 
restricted deposits,and other
 
deposits, which are
 
exposed to counterparty
 
counterparty credit
risk. These
 
financial
assets
 
have
been
been
assessed
under
ASC
 
326,
Financial
Instruments
Credit
 
Losses
,
and
a
provision
 
for
discounting and credit
losses of $1.1$0.8 million was recorded
as of March 31, 2023
.September 30, 2023.
 
Coronado Global Resources Inc.
 
Form 10-Q March 31,September 30, 2023
 
3547
ITEM 4.
 
CONTROLS AND PROCEDURES
Disclosure Controls and Procedures
We
 
maintain
 
disclosure
 
controls
 
and
 
procedures
 
that
 
are
 
designed
 
to
 
ensure
 
that
 
information
 
required
 
to
 
be
disclosed in our Exchange Act reports is recorded, processed, summarized and
 
reported within the time periods
specified
 
in
 
the
 
SEC’s
 
rules
 
and
 
forms,
 
and
 
that
 
such
 
information
 
is
 
accumulated
 
and
 
communicated
 
to
 
our
management, including the
 
Chief Executive Officer
 
and the Group
 
Chief Financial Officer, as appropriate,
 
to allow
timely
 
decisions
 
regarding
 
required
 
disclosure
 
based
 
solely
 
on
 
the
 
definition
 
of
 
“disclosure
 
controls
 
and
procedures” in Rule 13a-15(e) promulgated under the
 
Exchange Act. In designing and evaluating the disclosure
controls
 
and
 
procedures,
 
management
 
recognized
 
that
 
any
 
controls
 
and
 
procedures,
 
no
 
matter
 
how
 
well
designed and operated, can provide only reasonable
 
assurance of achieving the desired control
 
objectives, and
management necessarily was
 
required to apply
 
its judgment in
 
evaluating the cost-benefit
 
relationship of possible
controls and procedures.
As of the end
 
of the period
 
covered by this Quarterly
 
Report on Form
 
10-Q, we carried
 
out an evaluation
 
under
the supervision and
 
with the participation
 
of our
 
management, including the
 
Chief Executive Officer
 
and the
 
Group
Chief Financial
 
Officer, of the effectiveness of
 
the design and
 
operation of
 
our disclosure controls
 
and procedures.
Based on
 
the foregoing,
 
the
 
Chief Executive
 
Officer
 
and the
 
Group Chief
 
Financial
 
Officer
 
concluded
 
that our
disclosure controls and procedures were effective.
Changes to Internal Control over Financial Reporting
During the
 
fiscal quarter covered
 
by this
 
Quarterly Report on
 
Form 10-Q,
 
there were
 
no changes
 
in the
 
Company's
internal
 
control
 
over
 
financial
 
reporting,
 
as
 
such
 
term
 
is
 
defined
 
in
 
Rule
 
13a-15(f)
 
of
 
the
 
Exchange
 
Act,
 
that
materially affected,
 
or are
 
reasonably
 
likely to
 
materially
 
affect,
 
the
 
Company’s
 
internal controls
 
over financial
reporting.
 
Coronado Global Resources Inc.
 
Form 10-Q March 31,September 30, 2023
 
3648
PART II – OTHER
 
INFORMATION
ITEM 1.
 
LEGAL PROCEEDINGS
We are subject to various legal and
 
and regulatory proceedings. For a description of
our significant legal
proceedings
refer
 
to
 
Note 14.16. “Contingencies” to
 
the
 
unaudited
 
condensed
 
consolidated
 
financial
 
statements
 
included
 
in
Part I,
Item 1. “Financial
 
Statements”
of
 
this
Quarterly
 
Report on
Form 10-Q,
 
which
information
 
is
incorporated
by
reference
by reference herein.
ITEM 1A.
 
RISK FACTORS
Except as set forth below,
 
there were no material changes
 
to the risk factors previously
 
disclosed in Part I, Item
1A, “Risk Factors”, of
 
our Annual Report on
 
Form 10-K for the
 
year ended December 31,
 
2022, filed with the
 
SEC
and ASX on February 21, 2023:
Concerns2023
 
aboutand Part II, Item 1A, “Risk Factors”, of
our Quarterly Report on Form 10-Q for
 
the
quarterly period ended March 31, 2023, filed with the
 
environmentalSEC and ASX on May 8, 2023.
impactsConsummation
 
of the
 
coalproposed SGI
 
combustion,Transaction
 
includingmay constitute
 
possible
impacts
on
global
climate
issues,
are
resulting
in
increased
regulationa change
 
of control
 
coalunder our
 
combustionSenior
Secured
Notes
Indenture
 
and
 
coalour
 
miningNew
 
inABL
 
many
jurisdictions,Facility,
 
which
 
could
 
significantlymaterially
and
adversely
 
affect
 
demandour
business, financial condition and results of operations
 
for.
On September
 
our25, 2023,
 
productsthe Sellers
 
oradvised the
 
ourCompany that
 
securitiesthe Sellers
 
andhad entered
 
reduce
access to capital and insurance.into a
 
Global considerationsMIPA
 
regarding climatewith SGI.
The Company understands that, pursuant to the terms of the
 
change continueMIPA, the Sellers agreed to sell all of their interests
in
Coronado
Group
LLC
 
to attract
 
attention, particularlya
wholly-owned
subsidiary
of
SGI
 
in relation
the
SGI
Transaction.
For
a
more
detailed
description of
the SGI
Transaction
refer to
Note 17.
“Related Party
Transactions”
 
to the
 
coalunaudited condensed
industry. Greenhouse Gas, or GHG, emissions from coal consumption, both directly andconsolidated financial
 
indirectly,statements included
in Part
I, Item
1. “Financial
Statements” of
this Quarterly
Report on
Form 10-Q, which information is incorporated by reference
herein.
Energy & Minerals Group has
reported that following the closing
of the SGI Transaction
,
the timing of which the
Company is not aware, SGI will be the direct or indirect owner of Coronado Group LLC. Coronado Group LLC
is
currently
the
direct
owner
of
845,061,399
CDIs
(representing
a
beneficial
interest
in
84,506,140
shares
of
common stock, or 50.4% of the Company’s
outstanding total common stock) and from coal
miningthe one Series
 
itselfA Share.
 
are
The consummation
of the
proposed SGI
Transaction
may constitute
a change
of control
under the
Company’s
Senior Secured
Notes
Indenture,
dated as
of May
12,
2021, pursuant
to which
the Company
has issued
and
outstanding approximately $242.3 million
aggregate principal amount of
its 10.750% Senior Secured Notes
due
2026, or the Notes, as of September 30, 2023. Upon a change of control, Coronado
Finance Pty Ltd., the issuer
of the
Notes, is
required to
offer
to repurchase
all or
any part
of a
holder’s Notes
at a
purchase price
in cash
equal to
101% of
��
the principal
amount thereof,
plus accrued
and unpaid
interest, if
any,
to, but
excluding, the
date
of
repurchase,
 
subject
 
to
 
existing,the
 
pendingterms
 
and
 
proposed
regulation
as
partconditions
 
of
 
initiativesthe
indenture.
Failure
 
to
 
addressconsummate
 
global
climate change.a
 
A numberrequired
repurchase
offer,
whether
as a
result
 
of countries,lack
 
including Australiaof sufficient
funds
or otherwise
,
is an
event
of default
under
the
Senior Secured
Notes Indenture
that would
accelerate the
maturity of
the Notes
 
and thepermit
 
United States,holders to
 
have alreadypursue
available remedies.
 
introduced, or
areThe consummation of the proposed
 
contemplatingSGI Transaction may also constitute a change of
 
thecontrol under our New ABL
Facility.
 
introductionA
change
 
of
 
regulatorycontrol,
 
responses
to
GHG
emissions,
including
the
extraction
and
combustion of fossil fuels, to address the impacts of climate
change.
For example,
the Australian
Government is
reforming the
existing Safeguard
Mechanism that
was established
under
 
the
 
NationalNew
 
GreenhouseABL
 
andFacility
 
Energy
Reporting
Act
2007,
or
NGER
Act,
to
incentivize
emissions
reductions,
through
declining
emissions
limits,
called
baselines,
predictably
and
gradually
onconstitutes
 
a
 
trajectory
consistent withReview
 
achieving theEvent,
 
Government’s emissions
reduction target
of 43%
below 2005
levels by
2030 and
net
zero
by
2050.
On
March
31,
2023,
the
Australian
Federal
Parliament
passed
the
Safeguard
Mechanism
(Crediting) Amendment
Bill 2023
amending the
NGER Act
and other
legislation, to
establish the
framework
to
give effect to
key elements
of the reforms,
such as introducing
credits to the
scheme to provide
an incentive to
companies to go below their baselines.
The
Safeguard
Mechanism
applies
to
industrial
facilities
emitting
more
than
100,000
tons
of
carbon
dioxide
equivalent per
year,
including in
electricity,
mining, oil
and gas
production, manufacturing,
transport and
waste
facilities.
In accordance with
Safeguard Mechanism,
under this
reformed legislation
and once
the Federal Government’s
finalises the
National Greenhouse
and Energy
Reporting (Safeguard
Mechanism) Amendment
(Reforms) Rule
2023, Curragh must establish a
new baseline for covered emissions
(Scope 1). Curragh must take
action to keep
its net Scope
1 emissions at
or below the
baseline through emissions reduction,
purchasing emissions reductions
from
another
facilitypursuant
 
to
 
which
 
the
Lenders
 
Safeguardmay
 
Mechanismrequest
 
applies,to
meet
and
consult
with
us
to
agree
a
strategy
to
address
the
relevant
Review
Event
including but not limited
to, a restructure of
the terms of the
New ABL Facility to
the satisfaction of the
Lenders,
for
example
any
unpaid
amounts
may
become
due
and
payable
 
or
 
purchasingexisting
 
andundrawn
 
surrenderingcommitments
 
Australian
Carbon Credit Units, or ACCUs, or face enforcementmay
 
measures.be
Thecancelled. As of September 30,
 
2023, the Company had drawn
down $21.6 million of
borrowings and had $128.4
million of undrawn commitments under our New ABL
Facility.
Should these potential
 
directevents collectively occur,
 
andwe may need
 
indirectto seek to
 
financialrefinance the Notes,
 
impactreplace the New
ABL Facility,
 
onraise new
 
uscapital through
 
froma public
offering or
modify existing
or future
capital expense
projects to
restore the Company’s liquidity.
Although we would expect to have numerous options available to us to address
our liquidity needs, there is no assurance that the Company will be able to refinance the Notes, replace the
New
ABL Facility,
raise
new
capital
through
a public
offering
or modify
 
existing
 
laws,capital
 
regulationsexpense
 
policies,projects,
 
including
theon terms
Safeguard Mechanism,which are favorable to us, in which case
 
and future laws,taken as a whole, our liquidity profile
 
regulations, policies,could deteriorate which could
materially and technology
developments may
depend upon
the degree
to which
any such
laws, regulations
and developments
result in
reduced reliance
on coal
as a
fuel
source. Such developments could result in adverse impacts
onadversely affect our financial condition or results of operations.
For further information see Part I, Itemcondition.
 
1A, “Risk Factors”, of our Annual Report on Form
 
10-K for the year ended
December 31, 2022, filed with the SEC and ASX on February
21, 2023.
ITEM 2.
UNREGISTERED SALES OF EQUITY SECURITIES
AND USE OF PROCEEDS
None.
 
Coronado Global Resources Inc.
 
Form 10-Q March 31,September 30, 2023
 
3749
Uncertainty
about
the
effects
of
the
SGI
Transaction
may
affect
our
potential
and
existing
financial
arrangements
and
customer
relationships,
including
contractual
rights
triggered
upon
a
change
of
control in
connection with
the SGI
Transaction,
and may
materially and
adversely affect
our business,
results of operations and financial condition.
Certain contract counterparties,
including customers, suppliers
and third-party providers
may assert contractual
rights, such as consent or termination rights that may be triggered by the consummation of the SGI Transaction.
In relation to the arrangements
with Stanwell, we are required
to request Stanwell’s
prior consent to the change
of control that is expected to occur on consummation of the SGI Transaction. Stanwell must either give or refuse
to give consent within a specified period following receipt
of the request, and may only refuse to consent
if in its’
reasonable opinion,
it determines,
that the
SGI Transaction
will have
a material
adverse effect
on the
financial
ability of Coronado Curragh
Pty Ltd to perform
its obligations under
the Stanwell agreements.
In circumstances
where consent is
not obtained, the
Company would
seek to
find mutually
agreeable alternative
terms on which
Stanwell would consent to the change in control.
The Company is also required to request Aurizon’s consent to the change of control that is expected to occur on
consummation
of
the
SGI
Transaction
under
the
Aurizon
UT5
Rail
Access
Agreement.
A
failure
to
obtain
Aurizon’s consent to the
consummation of the SGI
Transaction will constitute a breach of
the agreement, entitling
Aurizon to legal or equitable remedies which may include termination
of the agreement.
For a number of
customers and supplier agreements, including
contractor agreements, the completion of
the SGI
Transaction
may
trigger
a
financial
or
suitability
assessment
by
the
counterparty,
which
may
entitle
the
counterparty
to
terminate
the
agreement,
request
further
security
or
seek
amendments
to
the
terms
of
the
agreement. The
termination
of these
arrangements, or
the requirement
to provide
further security,
could harm
our
relationships
with
such
third
parties
and
could
have
a
material
adverse
effect
on
our
business,
financial
condition, and results of operations.
Consummation
of
the
SGI
Transaction
will
also
constitute
a
“changed
holder
event”
for
the
purposes
of
Queensland
financial
provisioning
legislation
relating
to
rehabilitation
obligations
for
the
Curragh
mining
tenements, which
may result
in the
Queensland
government reviewing
the “risk
category” to
which the
mining
tenements
are
allocated
(i.e.,
very
low,
low,
moderate
or
high),
which
may
require
us
to
provide
further
contribution or surety to the Queensland government.
Following the consummation
of the SGI
Transaction, we
expect that
SGI through
Coronado Group
LLC
will
have
significant
influence
over
corporate
matters,
including
control
over
certain
decisions
that
require the approval of stockholders.
The Special Committee is reviewing
the terms of the Certificate
of Incorporation regarding the Series A
Preferred
Stock and the terms
of the Stockholder’s Agreement
dated as of September 24,
2018 between the Company and
Coronado Group LLC
to evaluate whether
the rights ascribed
collectively to “EMG”
(as defined thereunder)
will
inure to
SGI as
the new
owner of
the Coronado
Group LLC.
Even apart
from those
rights, SGI
as the
indirect
owner of a majority of the Company’s common
stock will have significant influence over corporate
matters.
Further,
uncertainty
about
the
timing
of;
and
effects
of
the
SGI
Transaction
on
counterparties
to
contracts,
employees
and
other
parties
may
have
an
adverse
effect
on
us.
These
uncertainties
could
cause
contract
counterparties and
others who
deal with
us to
seek to
terminate or
amend their
existing business
relationships
with us, and may
impair our ability
to attract, retain
and motivate key
personnel for a
period of time
prior to and
following the consummation of the SGI
Transaction. As a result, uncertainties regarding the timing of;
and impact
of the
SGI Transaction on
our business
strategy may have
a material
and adverse
effect on our
business, financial
condition and results of operations.
ITEM
2.
UNREGISTERED
SALES
OF
EQUITY
SECURITIES,
USE
OF
PROCEEDS
AND
ISSUER
PURCHASES OF EQUITY SECURITIES
None.
ITEM 3.
 
DEFAULTS
 
UPON SENIOR SECURITIES
None.
Coronado Global Resources Inc.
Form 10-Q September 30, 2023
50
ITEM 4. MINE SAFETY DISCLOSURES
Safety is the cornerstone of the Company’s values and is the number one priority
 
for all employees at Coronado
Global Resources Inc.
 
Our U.S. Operations
 
include multiple mining
 
complexes across
 
three states and
 
are regulated by
 
both the U.S.
Mine Safety
 
and Health
 
Administration, or
 
MSHA, and
 
state regulatory
 
agencies. Under
 
regulations mandated
by the Federal Mine Safety and Health Act of 1977, or the Mine Act, MSHA inspects our U.S. mines on a regular
basis and issues various citations and orders when it believes
 
a violation has occurred under the Mine Act.
In accordance
 
with
 
Section 1503(a) of
 
the
 
Dodd-Frank
 
Wall
 
Street
 
Reform
 
and
 
Consumer
 
Protection
 
Act
 
and
Item
 
104
 
of
 
Regulation
 
S-K
 
(17
 
CFR
 
229.104),
 
each
 
operator
 
of
 
a
 
coal
 
or
 
other
 
mine
in
 
the
 
United
 
States
 
is
required to report certain mine safety results
in its periodic reports
filed with the SEC under the
Exchange Act.
Information
 
pertaining
 
to
 
mine
 
safety
 
matters
 
is
 
included
 
in
 
Exhibit 95.1
 
attached
 
to
 
this
 
Quarterly
 
Report
 
on
Form 10-Q. The disclosures reflect the United
 
States mining operations only, as these requirements do not
 
apply
to our mines operated outside the United States.
ITEM 5.
 
OTHER INFORMATION
None.During the
 
quarter ended
September 30,
2023, no
director or
officer
(as defined
in Rule
16a-1(f) promulgated
under the Exchange
Act) of the
Company
adopted
or
terminated
a “Rule
10b5-1 trading arrangement”
or “
non-
Rule
10b5-1
trading arrangement” (as each term is defined in Item 408
of Regulation S-K).
Coronado Global Resources Inc.
Form 10-Q September 30, 2023
51
ITEM 6.
 
EXHIBITS
The following documents are filed as exhibits hereto:
Exhibit No.
Description of Document
3.1
3.2
10.1
15.1
31.1
31.2
32.1
95.1
101.INS
Inline XBRL Instance Document
101.SCH
Inline XBRL Taxonomy
 
Extension Schema Document
101.CAL
Inline XBRL Taxonomy
 
Extension Calculation Linkbase Document
101.DEF
Inline XBRL Taxonomy
 
Extension Definition Linkbase Document
101.LAB
Inline XBRL Taxonomy
 
Extension Label Linkbase Document
101.PRE
Inline XBRL Taxonomy
 
Extension Presentation Linkbase Document
104
Cover Page Interactive Data File (formatted as Inline
 
XBRL and contained in Exhibit 101)
 
___________________________
* Certain schedules
and exhibits to
this agreement have
been omitted pursuant
to Item 601(a)(5)
of Regulation
S-K. A copy of any omitted
schedule and/or exhibit will be furnished to
the Securities and Exchange Commission
upon request.
 
 
Coronado Global Resources Inc.
 
Form 10-Q March 31,September 30, 2023
 
3852
SIGNATURES
Pursuant to the requirements
 
of the Securities Exchange
 
Act of 1934, the registrant
 
has duly caused this
 
report
to be signed on its behalf by the undersigned, thereunto
 
duly authorized.
Coronado Global Resources Inc.
By:
/s/ Gerhard Ziems
Gerhard Ziems
Group Chief Financial Officer (as duly authorized officer
and as principal financial officer of the registrant)
Date: MayNovember 8, 2023