
UNITED STATES
SECURITIES AND EXCHANGE COMMISSION
WASHINGTON, D.C. 20549
FORM 10-Q
☒ | Quarterly Report pursuant to Section 13 or 15(d) of the Securities Exchange Act of 1934 |
For the quarterly period ended SeptemberJune 30, 20162017
or
☐ | Transition Report Pursuant to Section 13 or 15(d) of the Securities Exchange Act of 1934 |
For the transition period from to
96 South George Street, Suite 520
York, Pennsylvania 17401
(Address of principal executive offices)
(717) 225-4711
(Registrant's telephone number, including area code)
| Commission file number |
| Exact name of registrant as specified in its charter |
| IRS Employer Identification No. |
| State or other jurisdiction of incorporation or organization |
|
| 1-03560 |
| P. H. Glatfelter Company |
| 23-0628360 |
| Pennsylvania |
|
N/A
(Former name or former address, if changed since last report)
Indicate by check mark whether the registrant (1) has filed all reports required to be filed by Section 13 or 15(d) of the Securities Exchange Act of 1934 during the preceding 12 months (or for such shorter period that the registrant was required to file such reports), and (2) has been subject to such filing requirements for at the past 90 days. Yes ☒ No ☐.
Indicate by check mark whether the registrant has submitted electronically and posted on its corporate Web site, if any, every Interactive Data File required to be submitted and posted pursuant to Rule 405 of Regulation S-T (§232.405 of this chapter) during the preceding 12 months (or for such shorter period that the registrant was required to submit and post such files). Yes ☒ No ☐.
Indicate by check mark whether the registrant is a large accelerated filer, an accelerated filer, a non-accelerated filer, or a small reporting company or emerging growth company. See the definitions of “large accelerated filer”, “accelerated filer”, “smaller reporting company” and “smaller reporting“emerging growth company” in Rule 12b-2 of the Exchange Act.
Large accelerated filer | ☒ |
| Accelerated filer | ☐ | ||
Non-accelerated filer | ☐ | (Do not check if a smaller reporting company) | Smaller reporting company | ☐ | ||
Emerging growth company | ☐ | |||||
If an emerging growth company, indicate by check mark if the registrant has elected not to use the extended transition period for complying with any new or revised financial accounting standards provided pursuant to Section 13(a) of the Exchange Act. | ☐ | |||||
Indicate by check mark whether the registrant is a shell company (as defined in Rule 12b-2 of the Exchange Act) Yes ☐ No ☒.
Common Stock outstanding on OctoberJuly 25, 20162017 totaled 43,549,63943,583,926 shares.
P. H. GLATFELTER COMPANY AND SUBSIDIARIES
REPORT ON FORM 10-Q
For the QUARTERLY PERIOD ENDED
SeptemberJune 30, 20162017
Table of Contents
| Page |
| Page |
|
|
|
| |||||
|
|
|
|
|
|
| ||
Item 1 |
|
|
|
| ||||
|
| 2 |
| 2 | ||||
|
| 3 |
| 3 | ||||
| Condensed Consolidated Balance Sheets as of September 30, 2016 and December 31, 2015 (unaudited) |
| 4 | Condensed Consolidated Balance Sheets as of June 30, 2017 and December 31, 2016 (unaudited) |
| 4 | ||
|
| 5 |
| 5 | ||||
| Notes to Condensed Consolidated Financial Statements (unaudited) |
| 6 | Notes to Condensed Consolidated Financial Statements (unaudited) |
| 6 | ||
| 1. |
| 6 | 1. |
| 6 | ||
| 2. |
| 6 | 2. |
| 6 | ||
| 3. |
| 7 | 3. |
| 7 | ||
| 4. |
| 8 | 4. |
| 8 | ||
| 5. |
| 10 | 5. |
| 10 | ||
| 6. |
| 10 | 6. |
| 10 | ||
7. |
| 11 | ||||||
7. |
| 11 | 8. |
| 12 | |||
| 8. |
| 12 | 9. |
| 12 | ||
| 9. |
| 12 | 10. |
| 13 | ||
| 10. |
| 13 | 11. |
| 13 | ||
| 11. |
| 13 | 12. |
| 15 | ||
| 12. |
| 15 | 13. |
| 18 | ||
| 13. |
| 19 | 14. |
| 19 | ||
| 14. |
| 20 | 15. |
| 23 | ||
|
|
|
|
|
|
| ||
Item 2 | Management’s Discussion and Analysis of Financial Condition and Results of Operations |
| 27 | Management’s Discussion and Analysis of Financial Condition and Results of Operations |
| 24 | ||
Item 3 |
| 37 |
| 34 | ||||
Item 4 |
| 37 |
| 34 | ||||
|
|
|
|
|
|
| ||
| 38 |
| 35 | |||||
|
|
|
|
|
|
| ||
Item 6 |
| 38 |
| 35 | ||||
|
|
|
|
|
|
| ||
|
| 38 |
| 35 | ||||
P. H. GLATFELTER COMPANY AND SUBSIDIARIES
CONDENSED CONSOLIDATED STATEMENTS OF INCOME
(unaudited)
| Three months ended September 30 |
|
| Nine months ended September 30 |
|
| Three months ended June 30 |
|
| Six months ended June 30 |
| ||||||||||||||||||||
In thousands, except per share | 2016 |
|
| 2015 |
|
| 2016 |
|
| 2015 |
|
| 2017 |
|
| 2016 |
|
| 2017 |
|
| 2016 |
| ||||||||
Net sales | $ | 405,301 |
|
| $ | 419,960 |
|
| $ | 1,213,932 |
|
| $ | 1,248,232 |
|
| $ | 387,342 |
|
| $ | 406,413 |
|
| $ | 778,055 |
|
| $ | 808,631 |
|
Energy and related sales, net |
| 1,346 |
|
|
| 1,153 |
|
|
| 4,013 |
|
|
| 3,936 |
|
|
| 981 |
|
|
| 2,001 |
|
|
| 2,110 |
|
|
| 2,667 |
|
Total revenues |
| 406,647 |
|
|
| 421,113 |
|
|
| 1,217,945 |
|
|
| 1,252,168 |
|
|
| 388,323 |
|
|
| 408,414 |
|
|
| 780,165 |
|
|
| 811,298 |
|
Costs of products sold |
| 345,477 |
|
|
| 361,205 |
|
|
| 1,056,209 |
|
|
| 1,107,319 |
|
|
| 357,887 |
|
|
| 365,691 |
|
|
| 692,800 |
|
|
| 710,732 |
|
Gross profit |
| 61,170 |
|
|
| 59,908 |
|
|
| 161,736 |
|
|
| 144,849 |
|
|
| 30,436 |
|
|
| 42,723 |
|
|
| 87,365 |
|
|
| 100,566 |
|
Selling, general and administrative expenses |
| 35,747 |
|
|
| 39,792 |
|
|
| 104,796 |
|
|
| 100,201 |
|
|
| 31,999 |
|
|
| 37,191 |
|
|
| 67,085 |
|
|
| 69,049 |
|
Losses (gains) on dispositions of plant, equipment and timberlands, net |
| 5 |
|
|
| (123 | ) |
|
| 31 |
|
|
| (2,888 | ) | ||||||||||||||||
Operating income |
| 25,418 |
|
|
| 20,239 |
|
|
| 56,909 |
|
|
| 47,536 |
| ||||||||||||||||
(Gains) losses on dispositions of plant, equipment and timberlands, net |
|
| (58 | ) |
|
| 2 |
|
|
| (26 | ) |
|
| 26 |
| |||||||||||||||
Operating income (loss) |
|
| (1,505 | ) |
|
| 5,530 |
|
|
| 20,306 |
|
|
| 31,491 |
| |||||||||||||||
Non-operating income (expense) |
|
|
|
|
|
|
|
|
|
|
|
|
|
|
|
|
|
|
|
|
|
|
|
|
|
|
|
|
|
|
|
Interest expense |
| (3,895 | ) |
|
| (4,317 | ) |
|
| (11,964 | ) |
|
| (13,177 | ) |
|
| (4,476 | ) |
|
| (3,953 | ) |
|
| (8,484 | ) |
|
| (8,069 | ) |
Interest income |
| 52 |
|
|
| 90 |
|
|
| 204 |
|
|
| 232 |
|
|
| 45 |
|
|
| 61 |
|
|
| 158 |
|
|
| 152 |
|
Other, net |
| (573 | ) |
|
| (220 | ) |
|
| (956 | ) |
|
| (192 | ) |
|
| (149 | ) |
|
| 317 |
|
|
| (428 | ) |
|
| (383 | ) |
Total non-operating expense |
| (4,416 | ) |
|
| (4,447 | ) |
|
| (12,716 | ) |
|
| (13,137 | ) |
|
| (4,580 | ) |
|
| (3,575 | ) |
|
| (8,754 | ) |
|
| (8,300 | ) |
Income before income taxes |
| 21,002 |
|
|
| 15,792 |
|
|
| 44,193 |
|
|
| 34,399 |
| ||||||||||||||||
Income tax provision |
| 1,401 |
|
|
| 2,288 |
|
|
| 6,459 |
|
|
| 4,122 |
| ||||||||||||||||
Net income | $ | 19,601 |
|
| $ | 13,504 |
|
| $ | 37,734 |
|
| $ | 30,277 |
| ||||||||||||||||
Earnings per share |
|
|
|
|
|
|
|
|
|
|
|
|
|
|
| ||||||||||||||||
(Loss) income before income taxes |
|
| (6,085 | ) |
|
| 1,955 |
|
|
| 11,552 |
|
|
| 23,191 |
| |||||||||||||||
Income tax provision (benefit) |
|
| (371 | ) |
|
| (10 | ) |
|
| 5,663 |
|
|
| 5,058 |
| |||||||||||||||
Net income (loss) |
| $ | (5,714 | ) |
| $ | 1,965 |
|
| $ | 5,889 |
|
| $ | 18,133 |
| |||||||||||||||
(Loss) earnings per share |
|
|
|
|
|
|
|
|
|
|
|
|
|
|
|
| |||||||||||||||
Basic | $ | 0.45 |
|
| $ | 0.31 |
|
| $ | 0.87 |
|
| $ | 0.70 |
|
| $ | (0.13 | ) |
| $ | 0.05 |
|
| $ | 0.14 |
|
| $ | 0.42 |
|
Diluted |
| 0.44 |
|
|
| 0.31 |
|
|
| 0.86 |
|
|
| 0.69 |
|
|
| (0.13 | ) |
|
| 0.04 |
|
|
| 0.13 |
|
|
| 0.41 |
|
Cash dividends declared per common share | $ | 0.125 |
|
| $ | 0.12 |
|
| $ | 0.375 |
|
| $ | 0.36 |
|
| $ | 0.13 |
|
| $ | 0.125 |
|
| $ | 0.26 |
|
| $ | 0.25 |
|
Weighted average shares outstanding |
|
|
|
|
|
|
|
|
|
|
|
|
|
|
|
|
|
|
|
|
|
|
|
|
|
|
|
|
|
|
|
Basic |
| 43,576 |
|
|
| 43,457 |
|
|
| 43,552 |
|
|
| 43,363 |
|
|
| 43,604 |
|
|
| 43,558 |
|
|
| 43,593 |
|
|
| 43,539 |
|
Diluted |
| 44,133 |
|
|
| 43,865 |
|
|
| 44,059 |
|
|
| 43,949 |
|
|
| 43,604 |
|
|
| 44,062 |
|
|
| 44,449 |
|
|
| 43,963 |
|
The accompanying notes are an integral part of these condensed consolidated financial statements.
- 2 -
GLATFELTER
9.30.1606.30.17 Form 10-Q
P. H. GLATFELTER COMPANY AND SUBSIDIARIES
CONDENSED CONSOLIDATED STATEMENTS OF COMPREHENSIVE INCOME
(unaudited)
| Three months ended September 30 |
|
| Nine months ended September 30 |
|
| Three months ended June 30 |
|
| Six months ended June 30 |
| ||||||||||||||||||||
In thousands | 2016 |
|
| 2015 |
|
| 2016 |
|
| 2015 |
|
| 2017 |
|
| 2016 |
|
| 2017 |
|
| 2016 |
| ||||||||
Net income | $ | 19,601 |
|
| $ | 13,504 |
|
| $ | 37,734 |
|
| $ | 30,277 |
| ||||||||||||||||
Net income (loss) |
| $ | (5,714 | ) |
| $ | 1,965 |
|
| $ | 5,889 |
|
| $ | 18,133 |
| |||||||||||||||
Foreign currency translation adjustments |
| (1,530 | ) |
|
| (3,262 | ) |
|
| (2,975 | ) |
|
| (27,895 | ) |
|
| 27,504 |
|
|
| (14,864 | ) |
|
| 33,569 |
|
|
| (1,445 | ) |
Net change in: |
|
|
|
|
|
|
|
|
|
|
|
|
|
|
|
|
|
|
|
|
|
|
|
|
|
|
|
|
|
|
|
Deferred (gains) losses on cash flow hedges, net of taxes |
|
|
|
|
|
|
|
|
|
|
|
|
|
|
|
|
|
|
|
|
|
|
|
|
|
|
|
|
|
|
|
of $289, $1,045, $88 and $938, respectively |
| (858 | ) |
|
| (2,823 | ) |
|
| 152 |
|
|
| (2,558 | ) | ||||||||||||||||
of $1,632, $(258), $1,920 and $(201), respectively |
|
| (3,651 | ) |
|
| 944 |
|
|
| (4,597 | ) |
|
| 1,010 |
| |||||||||||||||
Unrecognized retirement obligations, net of taxes |
|
|
|
|
|
|
|
|
|
|
|
|
|
|
|
|
|
|
|
|
|
|
|
|
|
|
|
|
|
|
|
of $(1,405), $(1,895), $(4,214) and $(5,675), respectively |
| 2,319 |
|
|
| 3,083 |
|
|
| 6,957 |
|
|
| 9,253 |
| ||||||||||||||||
of $(1,430), $(1,442), $(2,678) and $(2,809), respectively |
|
| 2,479 |
|
|
| 2,381 |
|
|
| 4,553 |
|
|
| 4,638 |
| |||||||||||||||
Other comprehensive income (loss) |
| (69 | ) |
|
| (3,002 | ) |
|
| 4,134 |
|
|
| (21,200 | ) |
|
| 26,332 |
|
|
| (11,539 | ) |
|
| 33,525 |
|
|
| 4,203 |
|
Comprehensive income | $ | 19,532 |
|
| $ | 10,502 |
|
| $ | 41,868 |
|
| $ | 9,077 |
| ||||||||||||||||
Comprehensive income (loss) |
| $ | 20,618 |
|
| $ | (9,574 | ) |
| $ | 39,414 |
|
| $ | 22,336 |
| |||||||||||||||
The accompanying notes are an integral part of these condensed consolidated financial statements.
- 3 -
GLATFELTER
9.30.1606.30.17 Form 10-Q
P. H. GLATFELTER COMPANY AND SUBSIDIARIES
CONDENSED CONSOLIDATED BALANCE SHEETS
(unaudited)
| September 30 |
|
| December 31 |
| June 30 |
|
| December 31 |
| ||||
In thousands | 2016 |
|
| 2015 |
| 2017 |
|
| 2016 |
| ||||
Assets |
|
|
|
|
|
|
|
|
|
|
|
|
|
|
Cash and cash equivalents | $ | 50,752 |
|
| $ | 105,304 |
| $ | 69,442 |
|
| $ | 55,444 |
|
Accounts receivable, net |
| 179,352 |
|
|
| 167,199 |
|
| 172,014 |
|
|
| 152,989 |
|
Inventories |
| 262,891 |
|
|
| 247,214 |
|
| 261,721 |
|
|
| 249,669 |
|
Prepaid expenses and other current assets |
| 36,573 |
|
|
| 32,650 |
|
| 37,032 |
|
|
| 36,157 |
|
Total current assets |
| 529,568 |
|
|
| 552,367 |
|
| 540,209 |
|
|
| 494,259 |
|
Plant, equipment and timberlands, net |
| 771,453 |
|
|
| 698,864 |
|
| 838,007 |
|
|
| 775,898 |
|
Goodwill |
| 77,268 |
|
|
| 76,056 |
|
| 78,855 |
|
|
| 73,094 |
|
Intangible assets |
| 60,721 |
|
|
| 63,057 |
| |||||||
Intangible assets, net |
| 58,439 |
|
|
| 56,259 |
| |||||||
Other assets |
| 115,229 |
|
|
| 110,072 |
|
| 126,271 |
|
|
| 121,749 |
|
Total assets | $ | 1,554,239 |
|
| $ | 1,500,416 |
| $ | 1,641,781 |
|
| $ | 1,521,259 |
|
Liabilities and Shareholders' Equity |
|
|
|
|
|
|
|
|
|
|
|
|
|
|
Current portion of long-term debt | $ | 11,432 |
|
| $ | 7,366 |
| $ | 10,400 |
|
| $ | 8,961 |
|
Accounts payable |
| 163,674 |
|
|
| 172,735 |
|
| 178,793 |
|
|
| 164,345 |
|
Dividends payable |
| 5,455 |
|
|
| 5,231 |
|
| 5,681 |
|
|
| 5,455 |
|
Environmental liabilities |
| 8,408 |
|
|
| 12,544 |
|
| 29,500 |
|
|
| 25,000 |
|
Other current liabilities |
| 127,149 |
|
|
| 106,444 |
|
| 115,390 |
|
|
| 119,250 |
|
Total current liabilities |
| 316,118 |
|
|
| 304,320 |
|
| 339,764 |
|
|
| 323,011 |
|
Long-term debt |
| 367,549 |
|
|
| 353,296 |
|
| 431,494 |
|
|
| 363,647 |
|
Deferred income taxes |
| 73,075 |
|
|
| 76,458 |
|
| 60,715 |
|
|
| 54,995 |
|
Other long-term liabilities |
| 105,808 |
|
|
| 103,095 |
|
| 124,776 |
|
|
| 125,780 |
|
Total liabilities |
| 862,550 |
|
|
| 837,169 |
|
| 956,749 |
|
|
| 867,433 |
|
Commitments and contingencies |
| — |
|
|
| — |
|
| — |
|
|
| — |
|
Shareholders’ equity |
|
|
|
|
|
|
|
|
|
|
|
|
|
|
Common stock |
| 544 |
|
|
| 544 |
|
| 544 |
|
|
| 544 |
|
Capital in excess of par value |
| 55,890 |
|
|
| 54,912 |
|
| 60,570 |
|
|
| 57,917 |
|
Retained earnings |
| 984,520 |
|
|
| 963,143 |
|
| 957,418 |
|
|
| 962,884 |
|
Accumulated other comprehensive loss |
| (186,352 | ) |
|
| (190,486 | ) |
| (171,081 | ) |
|
| (204,606 | ) |
|
| 854,602 |
|
|
| 828,113 |
|
| 847,451 |
|
|
| 816,739 |
|
Less cost of common stock in treasury |
| (162,913 | ) |
|
| (164,866 | ) |
| (162,419 | ) |
|
| (162,913 | ) |
Total shareholders’ equity |
| 691,689 |
|
|
| 663,247 |
|
| 685,032 |
|
|
| 653,826 |
|
Total liabilities and shareholders’ equity | $ | 1,554,239 |
|
| $ | 1,500,416 |
| $ | 1,641,781 |
|
| $ | 1,521,259 |
|
The accompanying notes are an integral part of these condensed consolidated financial statements.
- 4 -
GLATFELTER
9.30.1606.30.17 Form 10-Q
P. H. GLATFELTER COMPANY AND SUBSIDIARIES
CONDENSED CONSOLIDATED STATEMENTS OF CASH FLOWS
(unaudited)
| Nine months ended September 30 |
| Six months ended June 30 |
| ||||||||||
In thousands | 2016 |
|
| 2015 |
| 2017 |
|
| 2016 |
| ||||
Operating activities |
|
|
|
|
|
|
|
|
|
|
|
|
|
|
Net income | $ | 37,734 |
|
| $ | 30,277 |
| $ | 5,889 |
|
| $ | 18,133 |
|
Adjustments to reconcile to net cash provided by operations: |
|
|
|
|
|
|
|
|
|
|
|
|
|
|
Depreciation, depletion and amortization |
| 49,725 |
|
|
| 47,423 |
|
| 34,967 |
|
|
| 33,411 |
|
Amortization of debt issue costs |
| 864 |
|
|
| 893 |
|
| 578 |
|
|
| 574 |
|
Pension expense, net of unfunded benefits paid |
| 2,908 |
|
|
| 5,541 |
|
| 2,512 |
|
|
| 1,964 |
|
Charge for impairment of intangible asset |
| — |
|
|
| 1,200 |
| |||||||
Deferred income tax benefit |
| (4,266 | ) |
|
| (2,043 | ) |
| 1,824 |
|
|
| (2,672 | ) |
Losses (gains) on dispositions of plant, equipment and timberlands, net |
| 31 |
|
|
| (2,888 | ) | |||||||
(Gains) losses on dispositions of plant, equipment and timberlands, net |
| (26 | ) |
|
| 26 |
| |||||||
Share-based compensation |
| 4,218 |
|
|
| 5,502 |
|
| 2,956 |
|
|
| 2,803 |
|
Change in operating assets and liabilities |
|
|
|
|
|
|
|
|
|
|
|
|
|
|
Accounts receivable |
| (12,927 | ) |
|
| (21,572 | ) |
| (12,511 | ) |
|
| (8,471 | ) |
Inventories |
| (17,897 | ) |
|
| (5,714 | ) |
| (4,750 | ) |
|
| (12,295 | ) |
Prepaid and other current assets |
| (4,205 | ) |
|
| 420 |
|
| (1,711 | ) |
|
| (163 | ) |
Accounts payable |
| (9,662 | ) |
|
| 5,561 |
|
| 7,044 |
|
|
| (3,027 | ) |
Accruals and other current liabilities |
| 10,257 |
|
|
| 5,180 |
|
| (6,399 | ) |
|
| 5,252 |
|
Other |
| 2,657 |
|
|
| 743 |
|
| (1,609 | ) |
|
| 1,105 |
|
Net cash provided by operating activities |
| 59,437 |
|
|
| 70,523 |
|
| 28,764 |
|
|
| 36,640 |
|
|
|
|
|
|
|
|
| |||||||
|
|
|
|
|
|
|
| |||||||
Investing activities |
|
|
|
|
|
|
|
|
|
|
|
|
|
|
Expenditures for purchases of plant, equipment and timberlands |
| (116,948 | ) |
|
| (74,280 | ) |
| (71,047 | ) |
|
| (80,391 | ) |
Proceeds from disposals of plant, equipment and timberlands, net |
| 55 |
|
|
| 3,181 |
|
| 83 |
|
|
| 53 |
|
Acquisition, net of cash acquired |
| — |
|
|
| (224 | ) | |||||||
Other |
| (400 | ) |
|
| (1,600 | ) |
| — |
|
|
| (300 | ) |
Net cash used by investing activities |
| (117,293 | ) |
|
| (72,923 | ) |
| (70,964 | ) |
|
| (80,638 | ) |
|
|
|
|
|
|
|
| |||||||
|
|
|
|
|
|
|
| |||||||
Financing activities |
|
|
|
|
|
|
|
|
|
|
|
|
|
|
Net repayments of revolving credit facility |
| (642 | ) |
|
| — |
| |||||||
Net borrowings (repayments) under revolving credit facility |
| 68,236 |
|
|
| (11,403 | ) | |||||||
Payments of borrowing costs |
| (136 | ) |
|
| (1,329 | ) |
| — |
|
|
| (136 | ) |
Proceeds from term loans |
| 19,428 |
|
|
| — |
|
| — |
|
|
| 19,428 |
|
Repayment of term loans |
| (3,803 | ) |
|
| (3,387 | ) |
| (4,528 | ) |
|
| (3,803 | ) |
Payments of dividends |
| (16,134 | ) |
|
| (15,215 | ) |
| (11,130 | ) |
|
| (10,679 | ) |
Proceeds from government grants |
| 5,251 |
|
|
| — |
|
| — |
|
|
| 4,443 |
|
Payments related to share-based compensation awards and other |
| (990 | ) |
|
| (2,015 | ) |
| (112 | ) |
|
| (976 | ) |
Net cash provided (used) by financing activities |
| 2,974 |
|
|
| (21,946 | ) |
| 52,466 |
|
|
| (3,126 | ) |
Effect of exchange rate changes on cash |
| 330 |
|
|
| (1,826 | ) |
| 3,732 |
|
|
| 352 |
|
Net decrease in cash and cash equivalents |
| (54,552 | ) |
|
| (26,172 | ) | |||||||
Net increase (decrease) in cash and cash equivalents |
| 13,998 |
|
|
| (46,772 | ) | |||||||
Cash and cash equivalents at the beginning of period |
| 105,304 |
|
|
| 99,837 |
|
| 55,444 |
|
|
| 105,304 |
|
Cash and cash equivalents at the end of period | $ | 50,752 |
|
| $ | 73,665 |
| $ | 69,442 |
|
| $ | 58,532 |
|
|
|
|
|
|
|
|
|
|
|
|
|
|
|
|
Supplemental cash flow information |
|
|
|
|
|
|
|
|
|
|
|
|
|
|
Cash paid for: |
|
|
|
|
|
|
|
|
|
|
|
|
|
|
Interest, net of amounts capitalized | $ | 7,376 |
|
| $ | 8,943 |
| $ | 7,810 |
|
| $ | 7,509 |
|
Income taxes, net |
| 11,609 |
|
|
| 14,566 |
|
| 4,193 |
|
|
| 8,486 |
|
The accompanying notes are an integral part of these condensed consolidated financial statements.
- 5 -
GLATFELTER
9.30.1606.30.17 Form 10-Q
P. H. GLATFELTER COMPANY AND SUBSIDIARIES
NOTES TO CONDENSED CONSOLIDATED FINANCIAL STATEMENTS
(unaudited)
1. |
P. H. Glatfelter Company and subsidiaries (“Glatfelter”) is a manufacturer of specialty papers and fiber-based engineered materials. Headquartered in York, PA, U.S. operations include facilities in Spring Grove, PA and Chillicothe and Fremont, OH. International operations include facilities in Canada, Germany, France, the United Kingdom and the Philippines, and sales and distribution offices in Russia and China. The terms “we,” “us,” “our,” “the Company,” or “Glatfelter,” refer to P. H. Glatfelter Company and subsidiaries unless the context indicates otherwise. Our products are marketed worldwide, either through wholesale paper merchants, brokers and agents, or directly to customers.
2. |
Basis of Presentation The unaudited condensed consolidated financial statements (“financial statements”) include the accounts of Glatfelter and its wholly-owned subsidiaries. All intercompany balances and transactions have been eliminated.
We prepared these financial statements in accordance with accounting principles generally accepted in the United States of America (“generally accepted accounting principles” or “GAAP”) and pursuant to the rules and regulations of the Securities and Exchange Commission pertaining to interim financial statements. In our opinion, the financial statements reflect all normal, recurring adjustments needed to present fairly our results for the interim periods. When preparing these financial statements, we have assumed that you have read the audited consolidated financial statements included in our 20152016 Annual Report on Form 10-K.
Accounting Estimates The preparation of financial statements in conformity with GAAP requires management to make estimates and assumptions that affect the reported amounts of assets and liabilities and disclosures of contingencies as of the balance sheet date and the reported amounts of revenues and expenses during the reporting period. Management believes the estimates and assumptions used in the preparation of these financial statements are reasonable, based upon currently available facts and known circumstances, but recognizes that actual results may differ from those estimates and assumptions.
Recently Issued Accounting Pronouncements In March 2017, the FASB issued ASU No. 2017-07, Improving the Presentation of Net Periodic Pension Cost and Net Periodic Postretirement Benefit Cost (“ASU 2017-07”). The update requires entities to present the service cost component of the net periodic benefit cost in the same income statement
line item as other employee compensation costs arising from services rendered during the period. All other components are to be presented below the determination of operating income. Entities will be required to disclose the line(s) used to present the other components of net periodic benefit cost, if the components are not presented separately in the income statement. ASU 2017-07 is effective for fiscal years and interim periods beginning after December 15, 2017, and early adoption is permitted. We do not expect the adoption of ASU 2017-07 will have a material impact on our consolidated financial statements.
In March 2016, the Financial Accounting Standards Board (“FASB”) issued Accounting Standards Update (“ASU”) No. 2016-09, Compensation – Stock Compensation (Topic 718) Improvements to Employee Share-Based Payment Accounting designed to simplify certain aspects of accounting for share-
basedshare-based awards. The new ASU requires entities to recognize as a component of income tax expense all excess tax benefits or deficiencies arising from the difference between compensation costs recognized and the intrinsic value at the time an option is exercised or, in the case of restricted stock and similar awards, the fair value upon vesting of an award. Previously such differences were recognized in additional paid in capital as part of an “APIC pool.” In addition, theThe ASU also requires entities to exclude excess tax benefits and tax deficiencies from the calculation of common share equivalents for purposes of calculating earnings per share. The newIn addition, as permitted by the ASU, we have elected to account for the impact of forfeitures as they occur rather to estimate forfeitures for purposes of recognizing compensation expense. We adopted this standard is required to be adopted, either prospectively or retrospectively, in the first quarter ofeffective January 1, 2017, and early adoption is permitted. We do not believeon a prospective basis; however, the adoption of thisthe new standard willdid not have a material impact on our reported results of operations or financial position.
In February 2016, the FASB issued ASU No. 2016-02, Leases (Topic 842). This ASU will require organizations such as us that lease assets to recognize on the balance sheet the assets and liabilities for the rights and obligations created by those leases. The new guidance will be effective for annual periods beginning after December 15, 2018, and interim periods therein. Early adoption is permitted. We are in the process of assessing the impact this standard will have on us and expect to follow a modified retrospective method provided for under the standard.
In May 2014, the FASB issued ASU No. 2014-09, Revenue from Contracts with Customers which clarifies the principles for recognizing revenue and develops a common revenue standard for GAAP and International Financial Reporting Standards. The new standard is required to be adopted retrospectively for fiscal years beginning after December 15, 2017 and early adoption is permitted only for reporting periods beginning after December 31, 2016. We are in the process of evaluating the impact this standard may have, if any, on our reported results of operations or financial position.
In June 2016, the FASB issued ASU No. 2016-13 Financial Instruments—Credit Losses (Topic 326): Measurement of Credit Losses on Financial Instruments that changes the impairment model for most financial instruments, including trade receivables from an incurred loss method to a new forward-looking approach, based on expected losses.
- 6 -
GLATFELTER
06.30.17 Form 10-Q
Under the new guidance, an allowance is recognized based on an estimate of expected credit losses. This standard is effective for us in the first quarter of 2020 and must be adopted using a modified retrospective transition approach. We are currently assessing the impact this standard may have on our results of operations and financial position.
In May 2014, the FASB issued ASU No. 2014-09, Revenue from Contracts with Customers which clarifies the principles for recognizing revenue and develops a common revenue standard for GAAP and International Financial Reporting Standards. The new standard is required to be adopted retrospectively for fiscal years beginning after December 15, 2017. The ASU requires additional disclosure about the nature, amount, timing and uncertainty of revenue and cash flows arising from customer contracts, including significant judgments and changes in judgments. The guidance allows for both retrospective and modified retrospective methods of adoption. We will apply the modified retrospective method of adoption. We continue to perform our assessment of the impact of the ASU on our policies, processes, systems and controls and are developing processes to obtain the information necessary for the new disclosures. This assessment requires, among others, a review of a substantial amount of the contracts we have with our customers.
Substantially all of our revenue is earned pursuant to contracts under which we have one performance obligation that is satisfied at a point-in-time. Based on our analysis completed to date, we do not expect this ASU will have a significant impact on the timing or amount of revenue recognition, our results of operations or our financial position.
- 6 -
GLATFELTER
9.30.16 Form 10-Q
3. |
The following table sets forth the details of basic and diluted earnings per share (“EPS”):
| Three months ended September 30 |
| Three months ended June 30 |
| |||||||||||
In thousands, except per share | 2016 |
|
| 2015 |
| 2017 |
|
| 2016 |
| |||||
Net income | $ | 19,601 |
|
| $ | 13,504 |
| ||||||||
Net income (loss) | $ | (5,714 | ) |
| $ | 1,965 |
| ||||||||
Weighted average common shares |
|
|
|
|
|
|
|
|
|
|
|
|
|
| |
outstanding used in basic EPS |
| 43,576 |
|
|
| 43,457 |
|
| 43,604 |
|
|
| 43,558 |
| |
Common shares issuable upon |
|
|
|
|
|
|
|
|
|
|
|
|
|
| |
exercise of dilutive stock options |
|
|
|
|
|
|
|
|
|
|
|
|
|
| |
and PSAs / RSUs |
| 557 |
|
|
| 408 |
|
| — |
|
|
| 504 |
| |
Weighted average common shares |
|
|
|
|
|
|
|
|
|
|
|
|
|
| |
outstanding and common share |
|
|
|
|
|
|
|
|
|
|
|
|
|
| |
equivalents used in diluted EPS |
| 44,133 |
|
|
| 43,865 |
|
| 43,604 |
|
|
| 44,062 |
| |
Earnings per share |
|
|
|
|
|
|
| ||||||||
Earnings (loss) per share |
|
|
|
|
|
|
| ||||||||
Basic | $ | 0.45 |
|
| $ | 0.31 |
| $ | (0.13 | ) |
| $ | 0.05 |
| |
Diluted |
| 0.44 |
|
|
| 0.31 |
|
| (0.13 | ) |
|
| 0.04 |
| |
Nine months ended September 30 |
| Six months ended June 30 |
| ||||||||||||
In thousands, except per share | 2016 |
|
| 2015 | �� | 2017 |
|
| 2016 |
| |||||
Net income | $ | 37,734 |
|
| $ | 30,277 |
| $ | 5,889 |
|
| $ | 18,133 |
| |
Weighted average common shares |
|
|
|
|
|
|
|
|
|
|
|
|
|
| |
outstanding used in basic EPS |
| 43,552 |
|
|
| 43,363 |
|
| 43,593 |
|
|
| 43,539 |
| |
Common shares issuable upon |
|
|
|
|
|
|
|
|
|
|
|
|
|
| |
exercise of dilutive stock options |
|
|
|
|
|
|
|
|
|
|
|
|
|
| |
and PSAs / RSUs |
| 507 |
|
|
| 586 |
|
| 856 |
|
|
| 424 |
| |
Weighted average common shares |
|
|
|
|
|
|
|
|
|
|
|
|
|
| |
outstanding and common share |
|
|
|
|
|
|
|
|
|
|
|
|
|
| |
equivalents used in diluted EPS |
| 44,059 |
|
|
| 43,949 |
|
| 44,449 |
|
|
| 43,963 |
| |
Earnings per share |
|
|
|
|
|
|
|
|
|
|
|
|
|
| |
Basic | $ | 0.87 |
|
| $ | 0.70 |
| $ | 0.14 |
|
| $ | 0.42 |
| |
Diluted |
| 0.86 |
|
|
| 0.69 |
|
| 0.13 |
|
|
| 0.41 |
| |
The following table sets forth potential common shares outstanding that were not included in the computation of diluted EPS for the period indicated, because their effect would be anti-dilutive:
| September 30 |
| June 30 |
| |||||||||||
In thousands | 2016 |
|
| 2015 |
| 2017 |
|
| 2016 |
| |||||
Three months ended |
| 681 |
|
|
| 696 |
|
| 1,327 |
|
|
| 1,368 |
| |
Nine months ended |
| 683 |
|
|
| 696 |
| ||||||||
Six months ended |
| 591 |
|
|
| 1,451 |
| ||||||||
- 7 -
GLATFELTER
9.30.1606.30.17 Form 10-Q
The following table sets forth details of the changes in accumulated other comprehensive income (losses) for the three months and ninesix months ended SeptemberJune 30, 20162017 and 2015.2016.
In thousands | Currency translation adjustments |
|
| Unrealized gain (loss) on cash flow hedges |
|
| Change in pensions |
|
| Change in other postretirement defined benefit plans |
|
| Total |
| |||||
Balance at April 1, 2017 | $ | (94,383 | ) |
| $ | 554 |
|
| $ | (108,466 | ) |
| $ | 4,882 |
|
| $ | (197,413 | ) |
Other comprehensive income before reclassifications (net of tax) |
| 27,504 |
|
|
| (3,080 | ) |
|
| — |
|
|
| (106 | ) |
|
| 24,318 |
|
Amounts reclassified from accumulated other comprehensive income (net of tax) |
| — |
|
|
| (571 | ) |
|
| 2,642 |
|
|
| (57 | ) |
|
| 2,014 |
|
Net current period other comprehensive income (loss) |
| 27,504 |
|
|
| (3,651 | ) |
|
| 2,642 |
|
|
| (163 | ) |
|
| 26,332 |
|
Balance at June 30, 2017 | $ | (66,879 | ) |
| $ | (3,097 | ) |
| $ | (105,824 | ) |
| $ | 4,719 |
|
| $ | (171,081 | ) |
Balance at April 1, 2016 | $ | (59,622 | ) |
| $ | (159 | ) |
| $ | (118,399 | ) |
| $ | 3,436 |
|
| $ | (174,744 | ) |
Other comprehensive income before reclassifications (net of tax) |
| (14,864 | ) |
|
| 837 |
|
|
| — |
|
|
| — |
|
|
| (14,027 | ) |
Amounts reclassified from accumulated other comprehensive income (net of tax) |
| — |
|
|
| 107 |
|
|
| 2,613 |
|
|
| (232 | ) |
|
| 2,488 |
|
Net current period other comprehensive income (loss) |
| (14,864 | ) |
|
| 944 |
|
|
| 2,613 |
|
|
| (232 | ) |
|
| (11,539 | ) |
Balance at June 30, 2016 | $ | (74,486 | ) |
| $ | 785 |
|
| $ | (115,786 | ) |
| $ | 3,204 |
|
| $ | (186,283 | ) |
In thousands | Currency translation adjustments |
|
| Unrealized gain (loss) on cash flow hedges |
|
| Change in pensions |
|
| Change in other postretirement defined benefit plans |
|
| Total |
| Currency translation adjustments |
|
| Unrealized gain (loss) on cash flow hedges |
|
| Change in pensions |
|
| Change in other postretirement defined benefit plans |
|
| Total |
| ||||||||||
Balance at July 1, 2016 | $ | (74,486 | ) |
| $ | 785 |
|
| $ | (115,786 | ) |
| $ | 3,204 |
|
| $ | (186,283 | ) | |||||||||||||||||||
Balance at January 1, 2017 | $ | (100,448 | ) |
| $ | 1,500 |
|
| $ | (110,656 | ) |
| $ | 4,998 |
|
| $ | (204,606 | ) | |||||||||||||||||||
Other comprehensive income before reclassifications (net of tax) |
| (1,530 | ) |
|
| (1,195 | ) |
|
| --- |
|
|
| --- |
|
|
| (2,725 | ) |
| 33,569 |
|
|
| (3,335 | ) |
|
| — |
|
|
| (106 | ) |
|
| 30,128 |
|
Amounts reclassified from accumulated other comprehensive income (net of tax) |
| — |
|
|
| 337 |
|
|
| 2,464 |
|
|
| (145 | ) |
|
| 2,656 |
|
| — |
|
|
| (1,262 | ) |
|
| 4,832 |
|
|
| (173 | ) |
|
| 3,397 |
|
Net current period other comprehensive income (loss) |
| (1,530 | ) |
|
| (858 | ) |
|
| 2,464 |
|
|
| (145 | ) |
|
| (69 | ) |
| 33,569 |
|
|
| (4,597 | ) |
|
| 4,832 |
|
|
| (279 | ) |
|
| 33,525 |
|
Balance at September 30, 2016 | $ | (76,016 | ) |
| $ | (73 | ) |
| $ | (113,322 | ) |
| $ | 3,059 |
|
| $ | (186,352 | ) | |||||||||||||||||||
Balance at July 1, 2015 | $ | (58,857 | ) |
| $ | 2,621 |
|
| $ | (114,076 | ) |
| $ | (2,756 | ) |
| $ | (173,068 | ) | |||||||||||||||||||
Balance at June 30, 2017 | $ | (66,879 | ) |
| $ | (3,097 | ) |
| $ | (105,824 | ) |
| $ | 4,719 |
|
| $ | (171,081 | ) | |||||||||||||||||||
Balance at January 1, 2016 | $ | (73,041 | ) |
| $ | (225 | ) |
| $ | (120,714 | ) |
| $ | 3,494 |
|
| $ | (190,486 | ) | |||||||||||||||||||
Other comprehensive income before reclassifications (net of tax) |
| (3,262 | ) |
|
| (1,381 | ) |
|
| --- |
|
|
| --- |
|
|
| (4,643 | ) |
| (1,445 | ) |
|
| 1,089 |
|
|
| — |
|
|
| — |
|
|
| (356 | ) |
Amounts reclassified from accumulated other comprehensive income (net of tax) |
| — |
|
|
| (1,442 | ) |
|
| 3,090 |
|
|
| (7 | ) |
|
| 1,641 |
|
| — |
|
|
| (79 | ) |
|
| 4,928 |
|
|
| (290 | ) |
|
| 4,559 |
|
Net current period other comprehensive income (loss) |
| (3,262 | ) |
|
| (2,823 | ) |
|
| 3,090 |
|
|
| (7 | ) |
|
| (3,002 | ) |
| (1,445 | ) |
|
| 1,010 |
|
|
| 4,928 |
|
|
| (290 | ) |
|
| 4,203 |
|
Balance at September 30, 2015 | $ | (62,119 | ) |
| $ | (202 | ) |
| $ | (110,986 | ) |
| $ | (2,763 | ) |
| $ | (176,070 | ) | |||||||||||||||||||
Balance at June 30, 2016 | $ | (74,486 | ) |
| $ | 785 |
|
| $ | (115,786 | ) |
| $ | 3,204 |
|
| $ | (186,283 | ) | |||||||||||||||||||
In thousands | Currency translation adjustments |
|
| Unrealized gain (loss) on cash flow hedges |
|
| Change in pensions |
|
| Change in other postretirement defined benefit plans |
|
| Total |
| |||||
Balance at January 1, 2016 | $ | (73,041 | ) |
| $ | (225 | ) |
| $ | (120,714 | ) |
| $ | 3,494 |
|
| $ | (190,486 | ) |
Other comprehensive income before reclassifications (net of tax) |
| (2,975 | ) |
|
| (106 | ) |
|
| --- |
|
|
| --- |
|
|
| (3,081 | ) |
Amounts reclassified from accumulated other comprehensive income (net of tax) |
| — |
|
|
| 258 |
|
|
| 7,392 |
|
|
| (435 | ) |
|
| 7,215 |
|
Net current period other comprehensive income (loss) |
| (2,975 | ) |
|
| 152 |
|
|
| 7,392 |
|
|
| (435 | ) |
|
| 4,134 |
|
Balance at September 30, 2016 | $ | (76,016 | ) |
| $ | (73 | ) |
| $ | (113,322 | ) |
| $ | 3,059 |
|
| $ | (186,352 | ) |
Balance at January 1, 2015 | $ | (34,224 | ) |
| $ | 2,356 |
|
| $ | (120,260 | ) |
| $ | (2,742 | ) |
| $ | (154,870 | ) |
Other comprehensive income before reclassifications (net of tax) |
| (27,895 | ) |
|
| 793 |
|
|
| --- |
|
|
| --- |
|
|
| (27,102 | ) |
Amounts reclassified from accumulated other comprehensive income (net of tax) |
| — |
|
|
| (3,351 | ) |
|
| 9,274 |
|
|
| (21 | ) |
|
| 5,902 |
|
Net current period other comprehensive income (loss) |
| (27,895 | ) |
|
| (2,558 | ) |
|
| 9,274 |
|
|
| (21 | ) |
|
| (21,200 | ) |
Balance at September 30, 2015 | $ | (62,119 | ) |
| $ | (202 | ) |
| $ | (110,986 | ) |
| $ | (2,763 | ) |
| $ | (176,070 | ) |
- 8 -
GLATFELTER
9.30.1606.30.17 Form 10-Q
Reclassifications out of accumulated other comprehensive income were as follows:
|
| Three months ended September 30 |
|
| Nine months ended September 30 |
|
|
|
| Three months ended June 30 |
|
| Six months ended June 30 |
|
|
| ||||||||||||||||||||
In thousands |
| 2016 |
|
| 2015 |
|
| 2016 |
|
| 2015 |
|
|
|
| 2017 |
|
| 2016 |
|
| 2017 |
|
| 2016 |
|
|
| ||||||||
Description |
|
|
|
|
|
|
|
|
|
|
|
|
|
|
|
|
| Line Item in Statements of Income |
|
|
|
|
|
|
|
|
|
|
|
|
|
|
|
|
| Line Item in Statements of Income |
Cash flow hedges (Note 11) |
|
|
|
|
|
|
|
|
|
|
|
|
|
|
|
|
|
|
|
|
|
|
|
|
|
|
|
|
|
|
|
|
|
|
|
|
(Gains) losses on cash flow hedges |
| $ | 347 |
|
| $ | (1,972 | ) |
| $ | 264 |
|
| $ | (4,595 | ) |
| Costs of products sold | ||||||||||||||||||
Gains (losses) on cash flow hedges |
| $ | (785 | ) |
| $ | 215 |
|
| $ | (1,716 | ) |
| $ | (83 | ) |
| Costs of products sold | ||||||||||||||||||
Tax expense (benefit) |
|
| (10 | ) |
|
| 530 |
|
|
| (6 | ) |
|
| 1,244 |
|
| Income tax provision |
|
| 214 |
|
|
| (108 | ) |
|
| 454 |
|
|
| 4 |
|
| Income tax provision (benefit) |
Net of tax |
|
| 337 |
|
|
| (1,442 | ) |
|
| 258 |
|
|
| (3,351 | ) |
|
|
|
| (571 | ) |
|
| 107 |
|
|
| (1,262 | ) |
|
| (79 | ) |
|
|
Retirement plan obligations (Note 7) |
|
|
|
|
|
|
|
|
|
|
|
|
|
|
|
|
|
|
|
|
|
|
|
|
|
|
|
|
|
|
|
|
|
|
|
|
Amortization of deferred benefit pension plan items |
|
|
|
|
|
|
|
|
|
|
|
|
|
|
|
|
|
| ||||||||||||||||||
Amortization of deferred benefit pension plans |
|
|
|
|
|
|
|
|
|
|
|
|
|
|
|
|
|
| ||||||||||||||||||
Prior service costs |
|
| 506 |
|
|
| 571 |
|
|
| 1,519 |
|
|
| 1,713 |
|
| Costs of products sold |
|
| 532 |
|
|
| 509 |
|
|
| 1,060 |
|
|
| 1,013 |
|
| Costs of products sold |
|
|
| 168 |
|
|
| 189 |
|
|
| 504 |
|
|
| 568 |
|
| Selling, general and administrative |
|
| 176 |
|
|
| 166 |
|
|
| 352 |
|
|
| 336 |
|
| Selling, general and administrative |
Actuarial losses |
|
| 2,450 |
|
|
| 3,144 |
|
|
| 7,350 |
|
|
| 9,432 |
|
| Costs of products sold |
|
| 2,463 |
|
|
| 2,618 |
|
|
| 4,562 |
|
|
| 4,900 |
|
| Costs of products sold |
|
|
| 843 |
|
|
| 1,082 |
|
|
| 2,530 |
|
|
| 3,247 |
|
| Selling, general and administrative |
|
| 848 |
|
|
| 915 |
|
|
| 1,571 |
|
|
| 1,687 |
|
| Selling, general and administrative |
|
|
| 3,967 |
|
|
| 4,986 |
|
|
| 11,903 |
|
|
| 14,960 |
|
|
|
|
| 4,019 |
|
|
| 4,208 |
|
|
| 7,545 |
|
|
| 7,936 |
|
|
|
Tax benefit |
|
| (1,503 | ) |
|
| (1,896 | ) |
|
| (4,511 | ) |
|
| (5,686 | ) |
| Income tax provision |
|
| (1,377 | ) |
|
| (1,595 | ) |
|
| (2,713 | ) |
|
| (3,008 | ) |
| Income tax provision (benefit) |
Net of tax |
|
| 2,464 |
|
|
| 3,090 |
|
|
| 7,392 |
|
|
| 9,274 |
|
|
|
|
| 2,642 |
|
|
| 2,613 |
|
|
| 4,832 |
|
|
| 4,928 |
|
|
|
Amortization of deferred benefit other plan items |
|
|
|
|
|
|
|
|
|
|
|
|
|
|
|
|
|
| ||||||||||||||||||
Amortization of deferred benefit other plans |
|
|
|
|
|
|
|
|
|
|
|
|
|
|
|
|
|
| ||||||||||||||||||
Prior service costs |
|
| (37 | ) |
|
| (58 | ) |
|
| (112 | ) |
|
| (173 | ) |
| Costs of products sold |
|
| (38 | ) |
|
| (38 | ) |
|
| (75 | ) |
|
| (75 | ) |
| Costs of products sold |
|
|
| (8 | ) |
|
| (12 | ) |
|
| (24 | ) |
|
| (37 | ) |
| Selling, general and administrative |
|
| (8 | ) |
|
| (8 | ) |
|
| (16 | ) |
|
| (16 | ) |
| Selling, general and administrative |
Actuarial losses |
|
| (156 | ) |
|
| 48 |
|
|
| (467 | ) |
|
| 142 |
|
| Costs of products sold |
|
| (38 | ) |
|
| (269 | ) |
|
| (156 | ) |
|
| (311 | ) |
| Costs of products sold |
|
|
| (33 | ) |
|
| 10 |
|
|
| (100 | ) |
|
| 31 |
|
| Selling, general and administrative |
|
| (8 | ) |
|
| (58 | ) |
|
| (33 | ) |
|
| (67 | ) |
| Selling, general and administrative |
|
|
| (234 | ) |
|
| (12 | ) |
|
| (703 | ) |
|
| (37 | ) |
|
|
|
| (92 | ) |
|
| (373 | ) |
|
| (280 | ) |
|
| (469 | ) |
|
|
Tax expense |
|
| 89 |
|
|
| 5 |
|
|
| 268 |
|
|
| 16 |
|
| Income tax provision |
|
| 35 |
|
|
| 141 |
|
|
| 107 |
|
|
| 179 |
|
| Income tax provision (benefit) |
Net of tax |
|
| (145 | ) |
|
| (7 | ) |
|
| (435 | ) |
|
| (21 | ) |
|
|
|
| (57 | ) |
|
| (232 | ) |
|
| (173 | ) |
|
| (290 | ) |
|
|
Total reclassifications, net of tax |
| $ | 2,656 |
|
| $ | 1,641 |
|
| $ | 7,215 |
|
| $ | 5,902 |
|
|
|
| $ | 2,014 |
|
| $ | 2,488 |
|
| $ | 3,397 |
|
| $ | 4,559 |
|
|
|
- 9 -
GLATFELTER
9.30.1606.30.17 Form 10-Q
5. |
Income taxes are recognized for the amount of taxes payable or refundable for the current year and deferred tax liabilities and assets for the future tax consequences of events that have been recognized in our consolidated financial statements or tax returns. The effects of income taxes are measured based on enacted tax laws and rates.
As of SeptemberJune 30, 20162017 and December 31, 2015,2016, we had $15.2$16.9 million and $12.2$14.2 million of gross unrecognized tax benefits. As of SeptemberJune 30, 2016,2017, if such benefits were to be recognized, approximately $12.2$11.4 million would be recorded as a component of income tax expense, thereby affecting our effective tax rate.
We, or one of our subsidiaries, file income tax returns with the United States Internal Revenue Service, as well as various state and foreign authorities.
The following table summarizes, by major jurisdiction, tax years that remain subject to examination:
| Open Tax Years | |||||
Jurisdiction | Examinations not yet initiated |
| Examination in progress | |||
United States |
|
|
| |||
Federal | 2013 - |
| N/A | |||
State |
| 2013 - 2014 | ||||
Canada(1) | 2010 - 2013; 2016 | 2014 - 2015 |
|
| ||
|
|
|
| |||
| 2012 - 2015 |
|
| |||
France |
|
| 2011 - 2012 | |||
United Kingdom |
|
| N/A | |||
Philippines | 2015 - 2016 |
| 2013 - 2014 | |||
(1) | includes provincial or similar local jurisdictions, as applicable |
The amount of income taxes we pay is subject to ongoing audits by federal, state and foreign tax authorities, which often result in proposed assessments. Management performs a comprehensive review of its global tax positions on a quarterly basis and accrues amounts for uncertain tax positions. Based on these reviews and the result of discussions and resolutions of matters with certain tax authorities and the closure of tax years subject to tax audit, reserves are adjusted as necessary. However, future results may include favorable or unfavorable adjustments to our estimated tax liabilities in the period the assessments are determined or resolved or as such statutes are closed. Due to potential for resolution of federal, state and foreign examinations, and the lapse of various statutes of limitation, it is reasonably possible our gross unrecognized tax benefits balance may decrease within the next twelve months by a range of zero to $1.8$0.9 million. Substantially all of this
range relates to tax positions taken in Germany.the United Kingdom and the U.S.
We recognize interest and penalties related to uncertain tax positions as income tax expense. The following table summarizes information related to interest and penalties on uncertain tax positions:
| Nine months ended September 30 |
| Six months ended June 30 |
| |||||||||||
In millions | 2016 |
|
| 2015 |
| 2017 |
|
|
| 2016 |
| ||||
Interest expense | $ | 0.2 |
|
| $ | — |
| ||||||||
Interest expense (income) | $ | 0.3 |
|
|
| $ | 0.2 |
| |||||||
Penalties |
| — |
|
|
| — |
|
| — |
|
|
|
| — |
|
| September 30 |
|
| December 31 |
| ||
| 2016 |
|
| 2015 |
| ||
Accrued interest payable | $ | 0.8 |
|
| $ | 0.6 |
|
| June 30 |
|
|
| December 31 |
| ||
| 2017 |
|
|
| 2016 |
| ||
Accrued interest payable | $ | 0.8 |
|
|
| $ | 0.5 |
|
The P. H. Glatfelter Amended and Restated Long Term Incentive Plan (the “LTIP”) provides for the issuance of Glatfelter common stock to eligible participants in the form of restricted stock units, restricted stock awards, non-qualified stock options, performance shares, incentive stock options and performance units.
Pursuant to terms of the LTIP, we have issued to eligible participants restricted stock units, performance share awards and stock only stock appreciation rights.
Restricted Stock Units (“RSU”) and Performance Share Awards (“PSAs”) Awards of RSUs and PSAs are made under our LTIP. On May 4, 2017, our shareholders approved a 1,840,000 share increase in the shares available to be awarded under the LTIP. The RSUs vest on the passage of time, generally on a graded scale over a three, four, and five-year period, or in certain instances the RSUs were issued with five year cliff vesting. PSAs are issued annually to members of management and each respective grant cliff vests each December 31 of the third year following the grant, assuming thevesting is based on achievement of predetermined, cumulative financial performance targets covering a two or three year periods.period followed by an additional one-year service period. The performance measures include a minimum, target and maximum performance level providing the grantees an opportunity to receive more or less shares than targeted depending on actual financial performance. For both RSUs and PSAs, the grant date fair value of the awards, which is equal to the closing price per common share on the date of the award, is used to determine the amount of expense to be recognized over the applicable service period. Settlement of RSUs and PSAs will be made in shares of our common stock currently held in treasury.
- 10 -
GLATFELTER
9.30.1606.30.17 Form 10-Q
The following table summarizes RSU and PSA activity during periods indicated:
Units | 2016 |
|
| 2015 |
| 2017 |
|
|
| 2016 |
| ||||
Balance at January 1, |
| 674,523 |
|
|
| 888,942 |
|
| 679,038 |
|
|
|
| 674,523 |
|
Granted |
| 298,832 |
|
|
| 160,514 |
|
| 364,748 |
|
|
|
|
| |
Forfeited |
| (146,327 | ) |
|
| (87,567 | ) |
| (91,449 | ) |
|
|
| (143,209 | ) |
Shares delivered |
| (149,975 | ) |
|
| (286,857 | ) |
| (24,052 | ) |
|
|
| (149,475 | ) |
Balance at September 30, |
| 677,053 |
|
|
| 675,032 |
| ||||||||
Balance at June 30, |
| 928,285 |
|
|
|
| 677,493 |
| |||||||
The amount granted in 20162017 and 20152016 includes PSAs of 199,693163,274 and 105,017,199,693, respectively, exclusive of reinvested dividends.
The following table sets forth aggregate RSU and PSA compensation expense for the periods indicated:
| September 30 |
| June 30 |
| |||||||||||
In thousands | 2016 |
|
| 2015 |
| 2017 |
|
|
| 2016 |
| ||||
Three months ended | $ | 765 |
|
| $ | 395 |
| $ | 1,049 |
|
|
| $ | 935 |
|
Nine months ended |
| 2,167 |
|
|
| 1,214 |
| ||||||||
Six months ended |
| 2,088 |
|
|
|
| 1,402 |
| |||||||
Stock Only Stock Appreciation Rights (“SOSARs”) Under terms of the SOSAR, a recipient receives the right to a payment in the form of shares of common stock equal to the difference, if any, in the fair market value of one share of common stock at the time of exercising the SOSAR and the exercise price. The SOSARs vest ratably over a three year period and have a term of ten years.
The following table sets forth information related to outstanding SOSARS.SOSARS for the six months ended June 30;
| 2016 |
|
| 2015 |
| 2017 |
|
| 2016 |
| |||||||||||||||||||||
SOSARS | Shares |
|
| Wtd Avg Exercise Price |
|
| Shares |
|
| Wtd Avg Exercise Price |
| Shares |
|
|
| Wtd Avg Exercise Price |
|
| Shares |
|
| Wtd Avg Exercise Price |
| ||||||||
Outstanding at January 1, |
| 2,199,742 |
|
| $ | 17.82 |
|
|
| 1,864,707 |
|
| $ | 16.20 |
|
| 2,736,616 |
|
| $ | 17.64 |
|
|
| 2,199,742 |
|
| $ | 17.82 |
| |
Granted |
| 743,925 |
|
|
| 17.54 |
|
|
| 423,590 |
|
| 24.62 |
|
| — |
|
|
| — |
|
|
| 743,925 |
|
| 17.54 |
| |||
Exercised |
| (61,190 | ) |
|
| 10.70 |
|
|
| (70,347 | ) |
|
| 14.12 |
|
| (33,050 | ) |
|
|
| 14.65 |
|
|
| (53,190 | ) |
|
| 9.91 |
|
Canceled / forfeited |
| (143,932 | ) |
|
| 17.87 |
|
|
| (17,559 | ) |
|
| 25.24 |
|
| (17,630 | ) |
|
| 18.46 |
|
|
| (108,945 | ) |
|
| 21.81 |
| |
Outstanding at September 30, |
| 2,738,545 |
|
| $ | 17.64 |
|
|
| 2,200,391 |
|
| $ | 17.82 |
| ||||||||||||||||
Outstanding at June 30, |
| 2,685,936 |
|
|
| $ | 17.67 |
|
|
| 2,781,532 |
|
| $ | 17.74 |
| |||||||||||||||
|
|
|
|
|
|
|
|
|
|
|
|
|
|
|
|
|
|
|
|
|
|
|
|
|
|
|
|
|
|
| |
SOSAR Grants |
|
|
|
|
|
|
|
|
|
|
|
|
|
|
|
|
|
|
|
|
|
|
|
|
|
|
|
|
|
|
|
Weighted average grant date |
|
|
|
|
|
|
|
|
|
|
|
|
|
|
| ||||||||||||||||
fair value per share | $ | 4.07 |
|
|
|
|
|
| $ | 7.46 |
|
|
|
|
| ||||||||||||||||
Aggregate grant date |
|
|
|
|
|
|
|
|
|
|
|
|
|
|
| ||||||||||||||||
fair value (in thousands) | $ | 3,013 |
|
|
|
|
|
| $ | 3,134 |
|
|
|
|
| ||||||||||||||||
|
|
|
|
|
|
|
|
|
|
|
|
|
|
|
|
| |||||||||||||||
Weighted average grant date fair value per share | $ | - |
|
|
|
|
|
|
| $ | 4.07 |
|
|
|
|
| |||||||||||||||
Aggregate grant date fair value (in thousands) | $ | - |
|
|
|
|
|
|
| $ | 3,013 |
|
|
|
|
| |||||||||||||||
Black-Scholes assumptions |
|
|
|
|
|
|
|
|
|
|
|
|
|
|
|
|
|
|
|
|
|
|
|
|
|
|
|
|
|
|
|
Dividend yield |
| 2.85 | % |
|
|
|
|
|
| 1.94 | % |
|
|
|
|
| - |
|
|
|
|
|
|
|
| 2.85 | % |
|
|
|
|
Risk free rate of return |
| 1.34 | % |
|
|
|
|
|
| 1.64 | % |
|
|
|
|
| - |
|
|
|
|
|
|
|
| 1.34 | % |
|
|
|
|
Volatility |
| 31.97 | % |
|
|
|
|
|
| 36.38 | % |
|
|
|
|
| - |
|
|
|
|
|
|
|
| 31.97 | % |
|
|
|
|
Expected life | 6 yrs |
|
|
|
|
|
| 6 yrs |
|
|
|
|
| - |
|
|
|
|
|
|
| 6 yrs |
|
|
|
|
| ||||
The following table sets forth SOSAR compensation expense for the periods indicated:
| September 30 |
| June 30 |
| |||||||||||
In thousands | 2016 |
|
| 2015 |
| 2017 |
|
|
| 2016 |
| ||||
Three months ended | $ | 650 |
|
| $ | 671 |
| $ | 259 |
|
|
| $ | 669 |
|
Nine months ended |
| 2,051 |
|
|
| 1,940 |
| ||||||||
Six months ended |
| 868 |
|
|
|
| 1,401 |
| |||||||
7. |
The following tables provide information with respect to the net periodic costs of our pension and post retirementpost-retirement medical benefit plans.
| Three months ended September 30 |
|
| Three months ended June 30 | |||||||||||||
In thousands | 2016 |
|
| 2015 |
|
| 2017 |
|
|
| 2016 |
|
| ||||
Pension Benefits |
|
|
|
|
|
|
|
|
|
|
|
|
|
|
|
|
|
Service cost | $ | 2,614 |
|
| $ | 2,850 |
|
| $ | 2,649 |
|
|
| $ | 2,510 |
|
|
Interest cost |
| 6,120 |
|
|
| 5,868 |
|
|
| 5,989 |
|
|
|
| 6,153 |
|
|
Expected return on plan assets |
| (11,331 | ) |
|
| (11,498 | ) |
|
| (10,666 | ) |
|
|
| (11,275 | ) |
|
Amortization of prior service cost |
| 674 |
|
|
| 760 |
|
|
| 708 |
|
|
|
| 675 |
|
|
Amortization of unrecognized loss |
| 3,293 |
|
|
| 4,226 |
|
|
| 3,311 |
|
|
|
| 3,533 |
|
|
Net periodic benefit cost | $ | 1,370 |
|
| $ | 2,206 |
| ||||||||||
Total net periodic benefit cost |
| $ | 1,991 |
|
|
| $ | 1,596 |
|
| |||||||
|
|
|
|
|
|
|
|
|
|
| |||||||
Other Benefits |
|
|
|
|
|
|
|
|
|
|
|
|
|
|
|
|
|
Service cost | $ | 287 |
|
| $ | 358 |
|
| $ | 284 |
|
|
| $ | 250 |
|
|
Interest cost |
| 498 |
|
|
| 499 |
|
|
| 513 |
|
|
|
| 456 |
|
|
Amortization of prior service cost |
| (45 | ) |
|
| (70 | ) | ||||||||||
Amortization of unrecognized (gain)/loss |
| (189 | ) |
|
| 58 |
| ||||||||||
Net periodic benefit cost | $ | 551 |
|
| $ | 845 |
| ||||||||||
Amortization of prior service credit |
|
| (46 | ) |
|
|
| (46 | ) |
| |||||||
Amortization of actuarial gain |
|
| (46 | ) |
|
|
| (327 | ) |
| |||||||
Total net periodic benefit cost |
| $ | 705 |
|
|
| $ | 333 |
|
| |||||||
| Nine months ended September 30 |
|
| Six months ended June 30 |
| |||||||||||
In thousands | 2016 |
|
| 2015 |
|
| 2017 |
|
|
| 2016 |
| ||||
Pension Benefits |
|
|
|
|
|
|
|
|
|
|
|
|
|
|
|
|
Service cost | $ | 7,855 |
|
| $ | 8,546 |
|
| $ | 5,370 |
|
|
| $ | 5,240 |
|
Interest cost |
| 18,360 |
|
|
| 17,606 |
|
|
| 11,896 |
|
|
|
| 12,240 |
|
Expected return on plan assets |
| (33,992 | ) |
|
| (34,495 | ) |
|
| (21,497 | ) |
|
|
| (22,661 | ) |
Amortization of prior service cost |
| 2,023 |
|
|
| 2,281 |
|
|
| 1,412 |
|
|
|
| 1,349 |
|
Amortization of unrecognized loss |
| 9,880 |
|
|
| 12,679 |
|
|
| 6,133 |
|
|
|
| 6,587 |
|
Net periodic benefit cost | $ | 4,126 |
|
| $ | 6,617 |
| |||||||||
Total net periodic benefit cost |
| $ | 3,314 |
|
|
| $ | 2,755 |
| |||||||
|
|
|
|
|
|
|
|
|
| |||||||
Other Benefits |
|
|
|
|
|
|
|
|
|
|
|
|
|
|
|
|
Service cost | $ | 860 |
|
| $ | 1,074 |
|
| $ | 579 |
|
|
| $ | 573 |
|
Interest cost |
| 1,494 |
|
|
| 1,498 |
|
|
| 998 |
|
|
|
| 996 |
|
Amortization of prior service cost |
| (136 | ) |
|
| (210 | ) | |||||||||
Amortization of unrecognized (gain)/loss |
| (567 | ) |
|
| 173 |
| |||||||||
Net periodic benefit cost | $ | 1,651 |
|
| $ | 2,535 |
| |||||||||
Amortization of prior service credit |
|
| (91 | ) |
|
|
| (91 | ) | |||||||
Amortization of actuarial gain |
|
| (189 | ) |
|
|
| (378 | ) | |||||||
Total net periodic benefit cost |
| $ | 1,297 |
|
|
| $ | 1,100 |
| |||||||
- 11 -
GLATFELTER
9.30.1606.30.17 Form 10-Q
8. |
Inventories, net of reserves, were as follows:
| September 30 |
|
| December 31 |
| June 30 |
|
| December 31 |
| |||||
In thousands | 2016 |
|
| 2015 |
| 2017 |
|
| 2016 |
| |||||
Raw materials | $ | 64,579 |
|
| $ | 60,098 |
| $ | 71,723 |
|
| $ | 66,359 |
| |
In-process and finished |
| 124,459 |
|
|
| 115,874 |
|
| 117,385 |
|
|
| 112,507 |
| |
Supplies |
| 73,853 |
|
|
| 71,242 |
|
| 72,613 |
|
|
| 70,803 |
| |
Total | $ | 262,891 |
|
| $ | 247,214 |
| $ | 261,721 |
|
| $ | 249,669 |
| |
9. |
Long-term debt is summarized as follows:
| September 30 |
|
| December 31 |
| June 30 |
|
| December 31 |
| |||||
In thousands | 2016 |
|
| 2015 |
| 2017 |
|
| 2016 |
| |||||
Revolving credit facility, due Mar. 2020 | $ | 59,830 |
|
| $ | 58,792 |
| $ | 130,000 |
|
|
| $ | 61,595 |
|
5.375% Notes, due Oct. 2020 |
| 250,000 |
|
|
| 250,000 |
|
| 250,000 |
|
|
|
| 250,000 |
|
2.40% Term Loan, due Jun. 2022 |
| 9,566 |
|
|
| 10,109 |
|
| 8,151 |
|
|
|
| 8,282 |
|
2.05% Term Loan, due Mar. 2023 |
| 40,210 |
|
|
| 42,130 |
|
| 35,023 |
|
|
|
| 35,163 |
|
1.30% Term Loan, due Jun. 2023 |
| 11,161 |
|
|
| - |
|
| 9,781 |
|
|
|
| 9,788 |
|
1.55% Term Loan, due Sep. 2025 |
| 10,941 |
|
|
| 2,839 |
|
| 11,187 |
|
|
|
| 10,333 |
|
Total long-term debt |
| 381,708 |
|
|
| 363,870 |
|
| 444,142 |
|
|
|
| 375,161 |
|
Less current portion |
| (11,432 | ) |
|
| (7,366 | ) |
| (10,400 | ) |
|
|
| (8,961 | ) |
Unamortized deferred issuance costs |
| (2,727 | ) |
|
| (3,208 | ) |
| (2,248 | ) |
|
|
| (2,553 | ) |
Long-term debt, net of current portion | $ | 367,549 |
|
| $ | 353,296 |
| $ | 431,494 |
|
|
| $ | 363,647 |
|
The amount set forth for Long-term debt, net of current portion as of December 31, 2015, has been restated to retroactively adopt ASU No. 2015-03, Interest - Imputation of Interest (Subtopic 835-30) Simplifying the Presentation of Debt Issuance Costs. This ASU requires debt issuance costs to be presented as a direct deduction from the carrying value of the related debt instrument rather than as a deferred asset except for costs associated with a revolving line of credit. We adopted this standard in the first quarter of 2016 retroactive to December 31, 2015.
On March 12, 2015, we amended our revolving credit agreement with a consortium of banks (the “Revolving Credit Facility”) which increased the amount available for borrowing to $400 million, extended the maturity of the facility to March 12, 2020, and instituted a revised interest rate pricing grid. On February 1, 2017, the Revolving Credit Facility was further amended to, among other things, change the definition of earnings before interest, taxes, depreciation and amortization (“EBITDA”) for purposes of calculating covenant compliance.
For all US dollar denominated borrowings under the Revolving Credit Facility, the borrowing rate is, at our option, either, (a) the bank’s base rate which is equal to the greater of i) the prime rate; ii) the federal funds rate plus 50 basis points; or iii) the daily Euro-rate plus 100 basis points plus an applicable spread over either i), ii) or iii) ranging from 12.5 basis points to 100 basis points based on the Company’s leverage ratio and its corporate credit ratings determined by Standard & Poor’s Rating Services and Moody’s Investor Service, Inc. (the “Corporate Credit Rating”); or (b) the daily
Euro-rate plus an applicable margin ranging from 112.5 basis points to 200 basis points based on the Company’s leverage ratio and the Corporate Credit Rating. For non-US dollar denominated borrowings, interest is based on (b) above.
The Revolving Credit Facility contains a number of customary covenants for financings of this type that, among other things, restrict our ability to dispose of or create liens on assets, incur additional indebtedness, repay other
indebtedness, limits certain intercompany financing arrangements, make acquisitions and engage in mergers or consolidations. We are also required to comply with specified financial tests and ratios including: i) maximum net debt to earnings before interest, taxes, depreciation and amortization (“EBITDA”)EBITDA ratio (the “leverage ratio”); and ii) a consolidated EBITDA to interest expense ratio. The most restrictive of our covenants is a maximum leverage ratio of 3.5x. As of SeptemberJune 30, 2016,2017, the leverage ratio, as calculated in accordance with the definition in our amended credit agreement, was 2.1x.2.6x. A breach of these requirements would give rise to certain remedies under the Revolving Credit Facility, among which are the termination of the agreement and accelerated repayment of the outstanding borrowings plus accrued and unpaid interest under the credit facility.
On October 3, 2012, we completed a private placement offering of $250.0 million aggregate principal amount of 5.375% Senior Notes due 2020 (the “5.375% Notes”). The 5.375% Notes, which are now publically registered, are fully and unconditionally guaranteed, jointly and severally, by PHG Tea Leaves, Inc., Mollanvick, Inc., Glatfelter Composite Fibers N. A., Inc., Glatfelter Advanced Materials N.A., LLC., and Glatfelter Holdings, LLC (the “Guarantors”). Interest on the 5.375% Notes is payable semiannually in arrears on April 15 and October 15.
The 5.375% Notes are redeemable, in whole or in part, at any time on or after October 15, 2016 at the redemption prices specified in the applicable Indenture. These Notes and the guarantees of the notes are senior obligations of the Company and the Guarantors, respectively, rank equally in right of payment with future senior indebtedness of the Company and the Guarantors and will mature on October 15, 2020.
The 5.375% Notes contain various covenants customary to indebtedness of this nature including limitations on i) the amount of indebtedness that may be incurred; ii) certain restricted payments including common stock dividends; iii) distributions from certain subsidiaries; iv) sales of assets; v) transactions amongst subsidiaries; and vi) incurrence of liens on assets. In addition, the 5.375% Notes contain cross default provisions that could result in all such notes becoming due and payable in the event of a failure to repay debt outstanding under the Revolving Credit AgreementFacility at maturity or a default under the Revolving Credit AgreementFacility that accelerates the debt outstanding thereunder. As of SeptemberJune 30, 2016,2017, we met all of the requirements of our debt covenants.
- 12 -
GLATFELTER
9.30.1606.30.17 Form 10-Q
Glatfelter Gernsbach GmbH & Co. KG (“Gernsbach”), a wholly-owned subsidiary of ours, entered into a series of borrowing agreements with IKB Deutsche Industriebank AG, Düsseldorf (“IKB”) as summarized below:
Amounts in thousands | Original Principal |
|
|
| Interest Rate |
|
|
| Maturity | ||
Borrowing date |
|
|
|
|
|
|
|
|
|
|
|
Apr. 11, 2013 | € | 42,700 |
|
|
|
| 2.05 | % |
|
| Mar. 2023 |
Sep. 4, 2014 |
| 10,000 |
|
|
|
| 2.40 | % |
|
| Jun. 2022 |
Oct. 10, 2015 |
| 2,608 |
|
|
|
| 1.55 | % |
|
| Sep. 2025 |
May 4, 2016 |
| 7,195 |
|
|
|
| 1.55 | % |
|
| Sep. 2025 |
Apr. 26, 2016 |
| 10,000 |
|
|
|
| 1.30 | % |
|
| Jun. 2023 |
Each of the borrowings require quarterly repayments of principal and interest and provide for representations, warranties and covenants customary for financings of these types. The financial covenants contained in each of the IKB loans, which relate to the minimum ratio of consolidated EBITDA to consolidated interest expense and the maximum ratio of consolidated total net debt to consolidated adjusted EBITDA, are calculated by reference to our Revolving Credit Agreement.Facility.
P. H. Glatfelter Company guarantees all debt obligations of its subsidiaries. All such obligations are recorded in these condensed consolidated financial statements.
Letters of credit issued to us by certain financial institutions totaled $5.1 million and $5.3$5.2 million as of SeptemberJune 30, 20162017 and $5.1 million as of December 31, 2015, respectively.2016. The letters of credit, which reduce amounts available under our revolving credit facility, primarily provide financial assurances for the benefit of certain state workers compensation insurance agencies in conjunction with our self-insurance program. We bear the credit risk on this amount to the extent that we do not comply with the provisions of certain agreements. No amounts are outstanding under the letters of credit.
10. |
The amounts reported on the condensed consolidated balance sheets for cash and cash equivalents, accounts receivable and accounts payable approximate fair value. The following table sets forth carrying value and fair value of long-term debt:
| September 30, 2016 |
|
| December 31, 2015 |
| June 30, 2017 |
|
|
| December 31, 2016 |
| ||||||||||||||||||||
In thousands | Carrying Value |
|
| Fair Value |
|
| Carrying Value |
|
| Fair Value |
| Carrying Value |
|
| Fair Value |
|
|
| Carrying Value |
|
| Fair Value |
| ||||||||
Variable rate debt | $ | 59,830 |
|
| $ | 59,830 |
|
| $ | 58,792 |
|
| $ | 58,792 |
| $ | 130,000 |
|
| $ | 130,000 |
|
| $ | 61,595 |
|
| $ | 61,595 |
| |
Fixed-rate bonds |
| 250,000 |
|
|
| 252,658 |
|
|
| 250,000 |
|
|
| 250,938 |
|
| 250,000 |
|
|
| 256,623 |
|
|
| 250,000 |
|
|
| 256,563 |
| |
2.40% Term loan |
| 9,566 |
|
|
| 9,324 |
|
|
| 10,109 |
|
|
| 10,535 |
|
| 8,151 |
|
|
| 8,349 |
|
|
| 8,282 |
|
|
| 8,877 |
| |
2.05% Term loan |
| 40,210 |
|
|
| 38,735 |
|
|
| 42,130 |
|
|
| 42,886 |
|
| 35,023 |
|
|
| 35,570 |
|
|
| 35,163 |
|
|
| 37,089 |
| |
1.30% Term Loan |
| 11,161 |
|
|
| 10,470 |
|
|
| - |
|
|
| - |
|
| 9,781 |
|
|
| 9,712 |
|
|
| 9,788 |
|
|
| 10,062 |
| |
1.55% Term loan |
| 10,941 |
|
|
| 10,180 |
|
|
| 2,839 |
|
|
| 2,524 |
|
| 11,187 |
|
|
| 11,103 |
|
|
| 10,333 |
|
|
| 10,082 |
| |
Total | $ | 381,708 |
|
| $ | 381,197 |
|
| $ | 363,870 |
|
| $ | 365,675 |
| $ | 444,142 |
|
| $ | 451,357 |
|
| $ | 375,161 |
|
| $ | 384,268 |
| |
As of SeptemberJune 30, 2016,2017, and December 31, 2015,2016, we had $250.0 million of 5.375% fixed rate bonds. These bonds are publicly registered, but thinly traded. Accordingly, the values set forth above for the bonds, as well as our other debt instruments, are based on observable inputs and other relevant market data (Level 2). The fair value of financial derivatives is set forth below in Note 11.
11. |
As part of our overall risk management practices, we enter into financial derivatives primarily designed to either i) hedge foreign currency risks associated with forecasted transactions – “cash flow hedges”; or ii) mitigate the impact that changes in currency exchange rates have on intercompany financing transactions and foreign currency denominated receivables and payables – “foreign currency hedges."
Derivatives Designated as Hedging Instruments - Cash Flow Hedges We use currency forward contracts as cash flow hedges to manage our exposure to fluctuations in the currency exchange rates on certain forecasted production costs or capital expenditures expected to be incurred. Currency forward contracts involve fixing the exchange for delivery of a specified amount of foreign currency on a specified date. As of SeptemberJune 30, 2016,2017, the maturity of currency forward contracts ranged from one month to 2218 months.
We designate certain currency forward contracts as cash flow hedges of forecasted raw material purchases, certain production costs or capital expenditures with exposure to changes in foreign currency exchange rates. The effective portion of changes in the fair value of derivatives designated and that qualify as cash flow hedges of foreign exchange risk is deferred as a component of accumulated other comprehensive income in the accompanying condensed consolidated balance sheets. With respect to hedges of forecasted raw material purchases or production costs, the
- 13 -
GLATFELTER
9.30.1606.30.17 Form 10-Q
amount deferred is subsequently reclassified into costs of products sold in the period that inventory produced using the hedged transaction affects earnings. For hedged capital expenditures, deferred gains or losses are reclassified and included in the historical cost of the capital asset and subsequently affect earnings as depreciation is recognized. The ineffective portion of the change in fair value of the derivative is recognized directly to earnings and reflected in the accompanying condensed consolidated statements of income as non-operating income (expense) under the caption “Other, net.”
We had the following outstanding derivatives that were used to hedge foreign exchange risks associated with forecasted transactions and designated as hedging instruments:
In thousands | September 30 2016 |
|
| December 31 2015 |
| June 30 2017 |
|
| December 31 2016 |
| ||||
Derivative |
|
|
|
|
|
|
|
|
|
|
|
|
|
|
Sell/Buy - sell notional |
|
|
|
|
|
|
|
|
|
|
|
|
|
|
Philippine Peso / British Pound |
| 22,856 |
|
|
| — |
| |||||||
Philippine Peso / Euro |
| 11,072 |
|
|
| — |
| |||||||
Euro / British Pound |
| 7,703 |
|
|
| 10,527 |
|
| 11,921 |
|
|
| 10,373 |
|
U.S. Dollar / Euro |
| 2,190 |
|
|
| — |
| |||||||
Sell/Buy - buy notional |
|
|
|
|
|
|
|
|
|
|
|
|
|
|
Euro / Philippine Peso |
| 733,358 |
|
|
| 758,634 |
|
| 879,929 |
|
|
| 699,279 |
|
British Pound / Philippine Peso |
| 408,967 |
|
|
| 542,063 |
|
| 652,206 |
|
|
| 557,025 |
|
U.S. Dollar / Euro |
| 9,025 |
|
|
| 15,379 |
| |||||||
Euro / U.S. Dollar |
| 42,672 |
|
|
| 51,433 |
|
| 56,538 |
|
|
| 43,951 |
|
U.S. Dollar / Canadian Dollar |
| 34,143 |
|
|
| 34,649 |
|
| 33,841 |
|
|
| 35,290 |
|
U.S. Dollar / Euro |
| 26,774 |
|
|
| — |
| |||||||
British Pound / Euro |
| 403 |
|
|
| — |
| |||||||
Derivatives Not Designated as Hedging Instruments - Foreign Currency Hedges We also enter into forward foreign exchange contracts to mitigate the impact changes in currency exchange rates have on balance sheet monetary assets and liabilities. None of these contracts are designated as hedges for financial accounting purposes and, accordingly, changes in value of the foreign exchange forward contracts and in the offsetting underlying on-balance-sheet transactions are reflected in the accompanying condensed consolidated statements of income under the caption “Other, net.”
The following sets forth derivatives used to mitigate the impact changes in currency exchange rates have on balance sheet monetary assets and liabilities:
In thousands | September 30 2016 |
|
| December 31 2015 |
| June 30 2017 |
|
| December 31 2016 |
| ||||
Derivative |
|
|
|
|
|
|
|
|
|
|
|
|
|
|
Sell/Buy - sell notional |
|
|
|
|
|
|
|
|
|
|
|
|
|
|
U.S. Dollar / British Pound |
| 10,500 |
|
|
| 10,000 |
|
| 13,500 |
|
|
| 10,500 |
|
British Pound / Euro |
| 2,500 |
|
|
| 3,500 |
|
| 2,500 |
|
|
| 2,500 |
|
Sell/Buy - buy notional |
|
|
|
|
|
|
|
|
|
|
|
|
|
|
Euro / U.S. Dollar |
| - |
|
|
| 12,500 |
|
| 7,500 |
|
|
| 3,500 |
|
British Pound / Euro |
| 18,500 |
|
|
| 13,500 |
|
| 12,000 |
|
|
| 18,500 |
|
Fair Value Measurements The following table summarizes the fair values of derivative instruments for the period indicated and the line items in the accompanying condensed consolidated balance sheets where the instruments are recorded:
In thousands | September 30 2016 |
|
| December 31 2015 |
|
| September 30 2016 |
|
| December 31 2015 |
| June 30 2017 |
|
| December 31 2016 |
|
| June 30 2017 |
|
| December 31 2016 |
| ||||||||
| Prepaid Expenses and Other |
|
| Other |
| Prepaid Expenses and Other |
|
| Other |
| ||||||||||||||||||||
Balance sheet caption | Current Assets |
|
| Current Liabilities |
| Current Assets |
|
| Current Liabilities |
| ||||||||||||||||||||
Designated as hedging: |
|
|
|
|
|
|
|
|
|
|
|
|
|
|
|
|
|
|
|
|
|
|
|
|
|
|
|
|
|
|
Forward foreign currency |
|
|
|
|
|
|
|
|
|
|
|
|
|
|
|
|
|
|
|
|
|
|
|
|
|
|
|
|
|
|
exchange contracts | $ | 330 |
|
| $ | 955 |
|
| $ | 958 |
|
| $ | 1,545 |
| $ | 633 |
|
| $ | 2,625 |
|
| $ | 4,166 |
|
| $ | 1,493 |
|
Not designated as hedging: |
|
|
|
|
|
|
|
|
|
|
|
|
|
|
|
|
|
|
|
|
|
|
|
|
|
|
|
|
|
|
Forward foreign currency |
|
|
|
|
|
|
|
|
|
|
|
|
|
|
|
|
|
|
|
|
|
|
|
|
|
|
|
|
|
|
exchange contracts | $ | 172 |
|
| $ | 68 |
|
| $ | 136 |
|
| $ | 49 |
| $ | 259 |
|
| $ | 60 |
|
| $ | 88 |
|
| $ | 104 |
|
The amounts set forth in the table above represent the net asset or liability giving effect to rights of offset with each counterparty. The effect of netting the amounts presented above did not have a material effect on our consolidated financial position.
The following table summarizes the amount of income or (loss) from derivative instruments recognized in our results of operations for the periods indicated and the line items in the accompanying condensed consolidated statements of income where the results are recorded:
|
|
| Three months ended September 30 |
|
| Nine months ended September 30 |
|
|
| Three months ended June 30 |
|
| Six months ended June 30 |
| ||||||||||||||||||||
In thousands |
|
| 2016 |
|
| 2015 |
|
| 2016 |
|
| 2015 |
|
|
| 2017 |
|
| 2016 |
|
| 2017 |
|
| 2016 |
| ||||||||
Designated as hedging: |
|
|
|
|
|
|
|
|
|
|
|
|
|
|
|
|
|
|
|
|
|
|
|
|
|
|
|
|
|
|
|
|
|
|
Forward foreign currency exchange contracts: |
|
|
|
|
|
|
|
|
|
|
|
|
|
|
|
|
|
|
|
|
|
|
|
|
|
|
|
|
|
|
|
|
|
|
Effective portion – cost of products sold |
|
| $ | (347 | ) |
| $ | 1,972 |
|
| $ | (264 | ) |
| $ | 4,595 |
|
|
| $ | 785 |
|
| $ | (215 | ) |
| $ | 1,716 |
|
| $ | 83 |
|
Ineffective portion – other – net |
|
|
| (69 | ) |
|
| (184 | ) |
|
| (399 | ) |
|
| 104 |
|
|
|
| 36 |
|
|
| 73 |
|
|
| 86 |
|
|
| (330 | ) |
Not designated as hedging: |
|
|
|
|
|
|
|
|
|
|
|
|
|
|
|
|
|
|
|
|
|
|
|
|
|
|
|
|
|
|
|
|
|
|
Forward foreign currency |
|
|
|
|
|
|
|
|
|
|
|
|
|
|
|
|
|
|
|
|
|
|
|
|
|
|
|
|
|
|
|
|
|
|
exchange contracts: |
|
|
|
|
|
|
|
|
|
|
|
|
|
|
|
|
|
|
|
|
|
|
|
|
|
|
|
|
|
|
|
|
|
|
Other – net |
|
| $ | 332 |
|
| $ | 621 |
|
| $ | 1,396 |
|
| $ | 1,028 |
|
|
| $ | 370 |
|
| $ | 475 |
|
| $ | 391 |
|
| $ | 1,064 |
|
The impact of activity not designated as hedging was substantially all offset by the remeasurement of the underlying on-balance-sheet item.
The fair value hierarchy consists of three broad levels, which gives the highest priority to unadjusted quoted prices in
- 14 -
GLATFELTER
06.30.17 Form 10-Q
active markets for identical assets or liabilities (Level 1) and the lowest priority to unobservable inputs (Level 3).
- 14 -
GLATFELTER
9.30.16 Form 10-Q
The fair values of the foreign exchange forward contracts are considered to be Level 2. Foreign currency forward contracts are valued using foreign currency forward and interest rate curves. The fair value of each contract is determined by comparing the contract rate to the forward rate and discounting to present value. Contracts in a gain position are recorded in the condensed consolidated balance sheets under the caption “Prepaid expenses and other current assets” and the value of contracts in a loss position is recorded under the caption “Other current liabilities.”
A rollforward of fair value amounts recorded as a component of accumulated other comprehensive income (loss) is as follows:
In thousands | 2016 |
|
| 2015 |
| 2017 |
|
| 2016 |
| ||||
Balance at January 1, | $ | (178 | ) |
| $ | 3,282 |
| $ | 1,882 |
|
| $ | (178 | ) |
Deferred (losses) gains |
|
|
|
|
|
|
|
|
|
|
|
|
|
|
on cash flow hedges |
| (200 | ) |
|
| 1,100 |
|
| (4,801 | ) |
|
| 1,294 |
|
Reclassified to earnings |
| 264 |
|
|
| (4,595 | ) |
| (1,716 | ) |
|
| (83 | ) |
Balance at September 30, | $ | (114 | ) |
| $ | (213 | ) | |||||||
Balance at June 30, | $ | (4,635 | ) |
| $ | 1,033 |
| |||||||
We expect substantially all of the amounts recorded as a component of accumulated other comprehensive income will be recorded as a component of the capital asset or realized in results of operations within the next twelve12 to twenty-two18 months and the amount ultimately recognized will vary depending on actual market rates.
Credit risk related to derivative activity arises in the event the counterparty fails to meet its obligations to us. This exposure is generally limited to the amounts, if any, by which the counterparty’s obligations exceed our obligation to them. Our policy is to enter into contracts only with financial institutions which meet certain minimum credit ratings.
12. |
Fox River - Neenah, Wisconsin
Background. We have significant uncertainties associated with environmental claims arising out of the presence of polychlorinated biphenyls (“PCBs”) in sediments in the lower Fox River, on which our former Neenah facility was located, and in the Bay of Green Bay Wisconsin (collectively, the “Site”). Since the early 1990s, the United States, the State of Wisconsin and two Indian tribes (collectively, the “Governments”) have pursued a cleanup of a 39-mile stretch of river from Little Lake Butte des Morts into Green Bay and natural resource damages (“NRDs”).
The United States notified the following parties (“PRPs”) of their potential responsibility to implement response actions, to pay response costs, and to compensate for NRDs at this site: us, Appvion, Inc. (formerly known as Appleton Papers Inc.), CBC Coating, Inc. (formerly known as Riverside Paper
Corporation), Georgia-Pacific Consumer Products, L.P. (“Georgia-Pacific”, formerly known as Fort James Operating Company), Menasha Corporation, NCR Corporation (“NCR”), U.S. Paper Mills Corp., and WTM I Company. As described below, many other parties have been joined in litigation. After giving effect to settlements reached with the Governments, the remaining PRPs exposed to continuing obligations to implement the remainder of the cleanup consist of us, Georgia-Pacific and NCR.
The Site has been subject to certain studies, and the parties conducted certain demonstration projects and completed certain interim cleanups. The permanent cleanup, known as a “remedial action” under the Comprehensive Environmental Response, Compensation and Liability Act (“CERCLA” or “Superfund”), consists of sediment dredging, installation of engineered caps and placement of sand covers in various areas in the bed of the river.
The United States originally notified several entities that they were potentially responsible parties (“PRPs”); however, after giving effect to settlements reached with the Governments, the remaining PRPs exposed to continuing obligations to implement the remainder of the cleanup consist of us, Georgia Pacific Consumer Products, L.P. (“Georgia Pacific”) and NCR Corporation (“NCR”). In addition to the government claims, Appvion, Inc. (“Appvion”) retains a claim against us and Georgia Pacific.
The United States Environmental Protection Agency (“EPA”) has divided the Site into five “operable units”,units,” including the most upstream portion of the Site on which our facility was located (“OU1”) and four downstream reaches of the river and bay (“OU2-5”).
We and WTM I Company, one of the PRPs, implemented the remedial action in OU1 under a consent decree with the Governments; Menasha Corporation made a financial contribution to that work. That project began in 2004 and the work is complete, other than on-going monitoring and maintenance.
For OU2-5, work has proceeded primarily under a Unilateral Administrative Order (“UAO”) issued in November 2007 by the EPA to us and seven other respondents. The remedial actions from 2007 through 2014 weremajority of that work to date has been funded primarilyor conducted by NCRparties other than us, although before the UAO, we contributed to a project in that area and its indemnitors, including Appvion, Inc. In 2015, we placed certain covering and capping in OU4b as a response tohave conducted about $13.4 million of cleanup work under the Government’s demands at a cost of $9.7 million. Georgia Pacific and NCR funded workUAO in 2015 pursuantand 2016. The cleanup is expected to continue through 2018. However, as discussed below, under a proposed consent decree between the United States, Wisconsin, NCR and Appvion we would not entered by the court until May 10, 2016. Work is scheduled to continue in OU2-5 through at least 2018, with monitoring and maintenance to follow.
As more fully discussed below, significant uncertainties exist pertaining to the ultimate allocation of OU2-5 remediation costs as well as the shorter term funding of the remedial actionsbe responsible for OU2-5.
Cost estimates. Estimates of the Site remediation change over time as we, or others, gainany additional data and experiencecleanup at the Site.
Litigation and Settlement. In addition, disagreement exists over the likely costs for some of this work. On October 14, 2014, the Governments represented to the United States District Court2008, in Green Bay that $1.1 billion provided an “upper end estimate of total past and future response costs” including a $100 million “uncertainty premium for future response costs.”
- 15 -
GLATFELTER
9.30.16 Form 10-Q
Based upon estimates made by the Governments and independent estimates commissioned by various potentially responsible parties, we have no reason to disagree with the Governments’ assertion. Much of that amount has already been incurred, including approximately $100 million for OU1 and what we believe to be approximately $575 million for OU2-5 prior to the 2016 remediation season.
In 2016, the Governments again seek approximately $100 million of work to be completed in OU2-5. The exact work and a more precise estimate of its cost depend on certain unresolved technical issues. During 2016, we placed the final layer on certain caps at a cost of approximately $4 million.
Allocation Litigation. In January 2008,allocation action, NCR and Appvion broughtsued us and many other defendants in an action in the federal district court in Green Bayeffort to allocate among allthe liable parties responsible forthe costs of cleaning up this Site all of the costs incurred byand compensating the Governments all offor their costs and the costs incurred by the parties, and all of the NRDs owed to the Natural Resource Trustees. We have previously referred to thisnatural resource trustees for NRDs. This case ashas been called the “Whiting Litigation.litigation.” After several summary judgment rulings and a trial, the trial court entered judgment in the Whiting Litigation allocating to NCR 100% of the costs of (a) the OU2-5 cleanup, (b) NRDs, (c) past and future costs incurred by the Governments in OU2-5, and (d) past and future costs incurred by any of the other parties net of an appropriate equitable adjustment for insurance recoveries. As to Glatfelter, NCR was judged liable to us for $4.28 million and any future costs or damages we may incur. NCR was held not responsible for costs incurred in OU1.
All parties appealed the Whiting Litigation judgment to- 15 -
GLATFELTER
06.30.17 Form 10-Q
On appeal, the United States Court of Appeals for the Seventh Circuit. On September 25, 2014, that courtCircuit affirmed the district court’s ruling, holding that if knowledge and fault were the only equitable factors governing allocation of costs and NRDs at the Site, NCR would owe 100% of all costs and damages in OU2-5, but would not have a share of costs in OU1 -- which is upstream of the outfall of the facilities for which NCR is responsible -- solely as an “arranger for disposal” of PCB-containing waste paper by recycling it at our mill. However, the court of appeals vacated the judgment and remanded the case for the district court’s further consideration of whether any other equitable factors might cause the district court to alter its allocation.
We contendIn 2010, in an enforcement action, the Governments sued us and other defendants for (a) an injunction to require implementation of the cleanup ordered by the 2007 UAO, (b) recovery of the Governments’ past and future costs of response, (c) recovery of NRDs, and (d) recovery of a declaration of liability for the Site. After appeals, the Governments did not obtain an injunction and they withdrew their claims for NRDs. The Governments obtained a declaration of our liability to comply with the 2007 UAO. The Governments’ costs claims remained pending.
On January 17, 2017, the United States filed a consent decree with the federal district court among the United States, Wisconsin, NCR, and Appvion (the “NCR/Appvion consent decree”) under which NCR would agree to complete the remaining cleanup and both NCR and Appvion would agree not to seek to recover from us or anyone else any amounts they have spent or will spend, and we and others would be barred from seeking claims against NCR or Appvion. On March 29, 2017, the United States moved for entry of a somewhat revised version of the NCR/Appvion consent decree. If the proposed consent decree is approved by the district court should, afterand if it were to withstand any appeal, then we would only face exposure to: (i) government past oversight costs, (ii) government future oversight costs, (iii) long term monitoring and maintenance, and (iv) depending on the reason, a further consideration, reinstateremedy if necessary in the 100%,event the currently ordered remedy fails, over 30 or some similar very high, allocationmore years, to achieve its objectives. As the result of earlier settlements, Georgia Pacific is only jointly liable with us to the Governments for monitoring and maintenance costs incurred in the most downstream three miles of the river (“OU4b”) and the bay of Green Bay (“OU5”). In connection with the filing of the proposed consent decree, NCR of alland Appvion filed a request to stay the costs, and should hold that we should bear no share or a very small share. However, NCR has taken a contrary position and has sought contributions from others for future work until all allocation issues are resolved.trial scheduled to commence in April 2017. The court granted the stay.
In addition, we takeand Georgia Pacific had claims against each other to reallocate the positioncosts that we have each incurred or will incur. We have settled those claims. Under this settlement, Georgia Pacific has agreed to implement the “single site” theory on which the courts held usmonitoring and maintenance in OU4b and OU5 and we would be responsible for cleaning up partsmonitoring and maintenance of all other upstream Operable Units. We have agreed to pay Georgia
Pacific $9.5 million in August 2017. Once the payment is made, the parties will have their claims against each other dismissed as settled.
Cost estimates. The proposed NCR/Appvion consent decree, as revised, states that all parties combined have spent more than approximately $1 billion to date towards remedial actions and NRDs, of which we have contributed approximately $65 million. In addition, work to complete the remaining site remedy under the UAO was anticipated to cost approximately $200 million at the beginning of the Site far downstream of our former mill should, if applied to NCR, make it liable for costs incurred in OU1. The district court agreed with us in an order dated March 3, 2015.
On March 31, 2015, NCR sought review of that order by2017 remediation season. If the court of appeals which review was denied on May 1, 2015.
Appvion and NCR have had a cost-sharing agreement since at least 1998. The court of appeals held if Appvion incurred any recoverable costs because the Governments had named Appvion as a potentially responsible party, then Appvion may have a right to recover those costs under CERCLA. We and Appvion disagree over what being named a PRP means and the proper treatment of amounts that Appvion incurred while a PRP thatconsent decree were also subject to a cost-sharing agreement with NCR; we contend Appvion may not recover costs it was contractually obligated to incur, that it has no other costs, and if it did,entered, we would have a rightno longer be exposed to contributionreallocation of any recovery against NCR and others. However, of those amounts.
Under the proposed NCR/Appvion takes a contrary position and claims approximately $200 million.
The district court has established a scheduleconsent decree, we would remain responsible for the Whiting Litigation under which it would hold a trial beginning in March 2017 on remaining issues.
Enforcement Litigation. In October 2010, the United States and the State of Wisconsin brought an action (“Government Action”) in the federal district court in Green Bay against us and 13 other defendants seeking (a) to recover all of the United States’ and the State of Wisconsin’sGovernments’ unreimbursed past costs, (b)which although in dispute, are represented to obtain a declaration of joint and several liability for all of their future costs, (c) to recover NRDs, and (d) to obtain a declaration of liability of all of the respondents on the UAO to perform the remedy in OU2-5 as required by the UAO and a mandatory permanent injunction to the same effect. The last of these claims was tried in 2012, and in May 2013, the district court enjoined us, NCR, WTM I, and Menasha Corp. to perform the work under the UAO. As the result of partial settlements, U.S. Paper Mills Corp. and Georgia-Pacific Consumer Products L.P. agreed to joint and several liability for some of the work. Appvion was held not liable for this Site under CERCLA.
All other potentially responsible parties, including the United Statestotal approximately $34 million and the State of Wisconsin, have settledGovernments’ future costs. Furthermore, we, along with the Governments. As a result, the remaining defendants consist of us, NCR, and Georgia-Pacific.
We appealed the injunction to the United States Court of Appeals for the Seventh Circuit, as did NCR, WTM I, and Menasha. On September 25, 2014, the court of appeals decided our and NCR’s appeals; the others’ appeals were not decided because they entered into a settlement. The court of appeals vacated the injunction as to us and NCR. However, it affirmed the district court’s ruling that we are liable for response actions in OU2-5 and for complying with the UAO. The court of appeals vacated and remanded the district court’s decision that NCR had failed to prove that liability for OU2-5 could be apportioned, directing the lower court to consider issues it had not considered initially.
- 16 -
GLATFELTER
9.30.16 Form 10-Q
On remand, the district court issued an opinion on October 19, 2015, holding that NCR had not shown a reasonable basis for apportionment of its liability for the site. On January 25, 2016, the court denied NCR’s request to certify that decision for immediate appeal.
As described below, the United States has withdrawn its natural resources damages claim against us. The Governments’ remaining claims principally consist of claims for (1) unreimbursed past costs of the United States totaling $35.1 million (as incurred through September 30, 2015), and (2) costs incurred and/or to be incurred by the United States after September 30, 2015 and by the State of Wisconsin after June 30, 2015 in excess of about $4.7 million, respectively. The remaining issues in the Government Action are set for trial to commence after the conclusion of the 2017 trial in the Whiting Litigation.
Interim Funding of Ongoing Work. As described above, the court of appeals vacated the allocation judgment in the Whiting Litigation on September 25, 2014, but neither court has since replaced that allocation with any other. The 2007 UAO requires the PRPs to submit annual remediation work plans. For 2015, the EPA approved the 2015 Work Plan for $100 million of remediation activities. NCR, GP, and we were not able to reach agreement on a division of the costs of that work on an interim basis, subject to reallocation in the Whiting Litigation. NCR and GP entered into a proposed consent decree with the United States under which they agreed to fund certain work estimated to cost approximately $67 million in 2015, and theyGeorgia Pacific, would not be responsible for completinglong term monitoring and maintenance required pursuant to the remainderLower Fox River 100% Remedial Design Report dated December 2009 – Long Term Monitoring Plan (the “Plan”). The Plan requires long term monitoring of each of OU1 through OU5 over a period of at least 30 years. The monitoring activities consist of, among others, testing fish tissue, sampling water quality and sediment, and inspections of the work in 2015, estimated to cost approximately $33 million. However, NCR and GP did not complete all of the work assigned to them under the consent decree. The United States did not move to enter that consent decree until April 12, 2016, and the court did not enter that decree until May 10, 2016. Through the issuance of the 2015 Work Plan the EPA assigned to us those remaining tasks. Under the proposed consent decree, all parties would remain jointly and severally liable for work in the 2015 Work Plan not completed in 2015, except for a small amount of work upstream of the area for which GPengineered caps. Each operable unit is responsible. We contracted for remediation work in OU4 at a total cost of $9.7 million, an amount of work less than the amount assigned to us in the 2015 Work Plan. We anticipate that the amount of work performed by us in 2015 satisfied our share of the obligation if NCR and GP had performed the work assigned to them in the 2015 Work Plan. The United States disagrees. We cannot predict the outcome of these disagreements or any possible resulting litigation.
The 2016 Work Plan similarly calls for completion of work that is estimated to cost in the range of $100 million. However, unlike the 2015 Work Plan, it does not allocate the work among NCR, GP, and us. The parties have again not come to agreement on an interim allocation among them of responsibility for completing the work called for by the 2016
Work Plan. NCR and GP have begun certain work. We have completed the placement of certain capping material.
Because we may not be able to obtain an agreement with the other parties or a ruling in litigation defining our obligation to contribute to work in any given year prior to the time that work would haverequired to be implemented, it is conceivable that we may have to choose an amountmonitored; however, because of work that we believe satisfies any obligation we may have to complete workour settlement with Georgia Pacific, our obligations are in that year, which selection we will have to defend after the fact. We expect to spend less than $5 million in connection with the 2016 Work Plan. It is conceivable we may be in the same position with respect to work in OU2-5 beyond the 2016 season.OU1-OU4a. Although we are unable to determine with any degree of certainty the amount we may be requiredtiming of cash expenditures for the above matters, they are reasonably likely to complete or to fund, those amounts could be significant. Any amounts we pay or any other party pays in the interim may be subject to reallocation when the Whiting Litigation is resolved.
NRDs. The Governments’ NRD assessment documents originally claimed we are jointly and severally responsible for NRDs withextend over a value between $176 million and $333 million. The Governments claimed this range should be inflated to current dollars and then certain unreimbursed past assessment costs should be added, so the rangeperiod of their claim was $287 million to $423 million in 2009.
However, on October 14, 2014, the Governments represented to the district court that if certain settlements providing $45.9 million toward compensation of NRDs were approved, the total NRD recovery would amount to $105 million. The Governments stated they would consider those recoveries adequate and they would withdraw their claims against us and NCR for additional compensation of NRDs. On October 19, 2015, the district court granted the Governments leave to withdraw their NRD claims against us without prejudice to re-filing them at some later time. Some of the settling parties, including all of the settling parties contributing the $45.9 million, have waived their rights to seek contribution from us of the settlement amounts. We previously paid a portion of the earlier settlements that the Governments value at $59 million and that we contend may be somewhat more.least 30 years.
Reserves for the Site. Our reserve including ongoing monitoring obligations in OU1, our share of remediation of the downstream portions of the Site, NRDs andfor all pending, threatened or asserted and unassertedremaining claims against us relating to PCB contamination is set forth below:
| Nine months ended September 30 |
| |||||
In thousands |
| 2016 |
|
|
| 2015 |
|
Balance at January 1, | $ | 17,105 |
|
| $ | 16,223 |
|
Payments |
| (4,193 | ) |
|
| (5,617 | ) |
Accruals |
| — |
|
|
| 10,000 |
|
Balance at September 30, | $ | 12,912 |
|
| $ | 20,606 |
|
|
| Six months ended June 30 |
| ||||||
In thousands |
|
| 2017 |
|
|
|
| 2016 |
|
Balance at January 1, |
| $ | 52,788 |
|
|
| $ | 17,105 |
|
Payments |
|
| (128 | ) |
|
|
| (1,189 | ) |
Accruals |
|
| - |
|
|
|
| - |
|
Balance at June 30, |
| $ | 52,660 |
|
|
| $ | 15,916 |
|
- 17 -
GLATFELTER
9.30.16 Form 10-Q
The payments set forth above represent cash paid towards completion of remediation activities in connection with the 2016 and 2015 Work Plans and 2016 Work Plans. Our reserve as of September 30, 2016, includes our estimate of costs to be incurred for remediation work, pending clarity from the Whiting litigation. If we are unsuccessful in the allocation litigation or in the enforcement litigation described above, we may be required to record additional charges and such charges could be significant.
ongoing monitoring activities. Of our total reserve for the Fox River, $8.4$29.5 million is recorded in the accompanying SeptemberJune 30, 20162017 condensed consolidated balance sheet under the caption “Environmental liabilities” and the remainderremaining $23.2 million is recorded under the caption “Other long term liabilities.”
As described above, the appellate court vacated and remanded for reconsideration the district court’s ruling in the Whiting Litigation that NCR would bear 100% of costs for the downstream portion of the Site. We continue to believe we will not be allocated a significant share of liability in any final equitable allocation of the response costs for OU2-5 or for NRDs. The accompanying condensed consolidated financial statements do not include reserves for any future defense costs, which could be significant, related to our involvement at the Site.
In setting our reserve for the Site, we have assessed our legal defenses, including our successful defenses to the allegations made in the Whiting Litigation and the original determination in the Whiting Litigation that NCR owes us “full contribution” for response costs and for NRDs that we may become obligated to pay except in OU1. We assume we will not bear the entire cost of remediation or damages to the exclusion of other known parties at the Site, who are also jointly and severally liable. The existence and ability of other parties to participate has also been taken into account in setting our reserve, and setting our reserve is generally based on our evaluation of recent publicly available financial information on certain of the responsible parties and any known insurance, indemnity or cost sharing agreements between responsible parties and third parties. In addition, we have considered the magnitude, nature, location and circumstances associated with the various discharges of PCBs to the river and the relationship of those discharges to identified contamination. We will continue to evaluate our exposure and the level of our reserves associated with the Site.
Other Information. The Governments have published studies estimating the amount of PCBs discharged by each identified potentially responsible party to the lower Fox River and Green Bay. These reports estimate our Neenah mill’s share of the mass of PCBs discharged to be as high as 27%. The district court has found the discharge mass estimates used in these studies not to be accurate. We believe the Neenah mill’s absolute and relative contribution of PCB mass is significantly lower than the estimates set forth in these studies.
The district court in the Government Action has found that the Neenah mill discharged an unknown amount of PCBs.
Based upon the rulings in the Whiting Litigation and the Government Action, neither of which endorsed an equitable allocation in proportion to the mass of PCBs discharged, we continue to believe an allocation in proportion to mass of PCBs discharged would not constitute an equitable allocation of the potential liability for the contamination at the Fox River. We contend other factors, such as a party’s role in causing costs, the location of discharge, and the location of contamination must be considered in order for the allocation to be equitable.
Range of Reasonably Possible Outcomes.Outcomes. Based on our analysis of all available information, including but not limited to decisions of the courts, official documents such as records
- 16 -
GLATFELTER
06.30.17 Form 10-Q
of decision, as well as discussions with legal counsel, and cost estimates for workfuture monitoring and maintenance and other post-remediation costs to be performed at the Site, and substantially dependent on whether the resolution of the allocation issues discussed above,NCR/Appvion consent decree is entered, we believe it is reasonably possible that our costs associated with the Fox River matter could exceed the aggregate amounts accrued for the Fox River matter by amounts ranging from insignificant to $190approximately $30 million. We believe the likelihood of an outcome in the upper end of the monetary range is less than other possible outcomes within the range and the possibility of an outcome in excess of the upper end of the monetary range is remote.
We expect remediation costs However, in the event the NCR/Appvion consent decree is not entered, the ultimate resolution of this matter would likely resort to be incurred primarily over the next two to three years,extensive litigation involving various issues, including allocation of remedial action and related costs. In such a scenario, although we are unableshould ultimately bear a very small share, it is reasonably possible that our costs associated with the Fox River matter could exceed the aggregate amounts accrued by amounts ranging from insignificant to determine with any degree of certainty the amount we may be required to fund for interim remediation work. To the extent we provide such interim funding, we contend that NCR or another party would be required to reimburse us once the final allocation is determined.$150 million.
Summary.Summary. Our current assessment is we will be able to manage this environmental matter without a long-term, material adverse impact on the Company. This matter could, however, at any particular time or for any particular year or years, have a material adverse effect on our consolidated financial position, liquidity and/or results of operations or could result in a default under our debt covenants. Moreover, there can be no assurance our reserves will be adequate to provide for future obligations related to this matter, or our share of costs and/or damages will not exceed our available resources, or those obligations will not have a long-term, material adverse effect on our consolidated financial position, liquidity orand results of operations. Shouldoperations and might result in a default under our loan covenants. If the proposed NCR/Appvion consent decree is not approved and a court grant the United States or the State of Wisconsingrants relief requiring us individually either to perform directly or to contribute significant amounts towards remedial action downstream of Little Lake Butte des MortsOU1 those developments could have a material adverse effect on our consolidated financial position, liquidity and results of operations and might result in a default under our loan covenants.
- 1817 -
GLATFELTER
9.30.1606.30.17 Form 10-Q
The following tables set forth financial and other information by business unit for the period indicated:
Three months ended September 30 |
|
|
| Advanced Airlaid |
|
|
|
|
| Other and |
|
|
|
| ||||||||||||||||||||||||||||||||||||||||||||||||||||||||||||||||
Three months ended June 30 |
|
|
| Advanced Airlaid |
|
|
|
|
| Other and |
|
|
|
| ||||||||||||||||||||||||||||||||||||||||||||||||||||||||||||||||
Dollars in millions | Composite Fibers |
|
| Materials |
|
| Specialty Papers |
|
| Unallocated |
|
| Total |
| Composite Fibers |
|
| Materials |
|
| Specialty Papers |
|
| Unallocated |
|
| Total |
| ||||||||||||||||||||||||||||||||||||||||||||||||||
| 2016 |
|
| 2015 |
|
| 2016 |
|
| 2015 |
|
| 2016 |
|
| 2015 |
|
| 2016 |
|
| 2015 |
|
| 2016 |
|
| 2015 |
| 2017 |
|
| 2016 |
|
| 2017 |
|
| 2016 |
|
| 2017 |
|
| 2016 |
|
| 2017 |
|
| 2016 |
|
| 2017 |
|
| 2016 |
| ||||||||||||||||||||
Net sales | $ | 131.7 |
|
| $ | 133.9 |
|
| $ | 61.9 |
|
| $ | 63.2 |
|
| $ | 211.8 |
|
| $ | 222.8 |
|
| $ | — |
|
| $ | — |
|
| $ | 405.3 |
|
| $ | 420.0 |
| $ | 133.1 |
|
| $ | 136.4 |
|
| $ | 62.8 |
|
| $ | 60.8 |
|
| $ | 191.4 |
|
| $ | 209.3 |
|
| $ | — |
|
| $ | — |
|
| $ | 387.3 |
|
| $ | 406.4 |
|
Energy and related sales, net |
| — |
|
| — |
|
|
| — |
|
| — |
|
|
| 1.3 |
|
|
| 1.2 |
|
|
| — |
|
|
| — |
|
|
| 1.3 |
|
|
| 1.2 |
|
| — |
|
| — |
|
|
| — |
|
| — |
|
|
| 1.0 |
|
|
| 2.0 |
|
|
| — |
|
|
| — |
|
|
| 1.0 |
|
|
| 2.0 |
| ||||
Total revenue |
| 131.7 |
|
|
| 133.9 |
|
|
| 61.9 |
|
| 63.2 |
|
|
| 213.1 |
|
|
| 224.0 |
|
|
| — |
|
|
| — |
|
|
| 406.6 |
|
|
| 421.1 |
|
| 133.1 |
|
|
| 136.4 |
|
|
| 62.8 |
|
| 60.8 |
|
|
| 192.4 |
|
|
| 211.3 |
|
|
| — |
|
|
| — |
|
|
| 388.3 |
|
|
| 408.4 |
| ||
Cost of products sold |
| 105.8 |
|
| 108.4 |
|
|
| 53.5 |
|
|
| 54.6 |
|
|
| 180.1 |
|
|
| 196.1 |
|
|
| 6.1 |
|
|
| 2.1 |
|
|
| 345.5 |
|
|
| 361.2 |
|
| 107.6 |
|
|
| 109.0 |
|
|
| 53.0 |
|
|
| 51.8 |
|
|
| 195.9 |
|
|
| 202.9 |
|
|
| 1.4 |
|
|
| 2.0 |
|
|
| 357.9 |
|
|
| 365.7 |
| |
Gross profit (loss) |
| 25.9 |
|
|
| 25.5 |
|
|
| 8.4 |
|
|
| 8.6 |
|
|
| 33.0 |
|
|
| 27.9 |
|
|
| (6.1 | ) |
|
| (2.1 | ) |
|
| 61.2 |
|
|
| 59.9 |
|
| 25.5 |
|
|
| 27.4 |
|
|
| 9.8 |
|
|
| 9.0 |
|
|
| (3.5 | ) |
|
| 8.4 |
|
|
| (1.4 | ) |
|
| (2.0 | ) |
|
| 30.4 |
|
|
| 42.7 |
|
SG&A |
| 11.9 |
|
|
| 11.5 |
|
|
| 2.0 |
|
|
| 1.8 |
|
|
| 14.3 |
|
|
| 10.4 |
|
|
| 7.5 |
|
|
| 16.2 |
|
|
| 35.7 |
|
|
| 39.8 |
|
| 10.8 |
|
|
| 12.1 |
|
|
| 2.3 |
|
|
| 2.2 |
|
|
| 10.3 |
|
|
| 14.2 |
|
|
| 8.6 |
|
|
| 8.7 |
|
|
| 32.0 |
|
|
| 37.2 |
|
Gains on dispositions of plant, equipment |
|
|
|
|
|
|
|
|
|
|
|
|
|
|
|
|
|
|
|
|
|
|
|
|
|
|
|
|
|
|
|
|
|
|
|
|
|
|
| |||||||||||||||||||||||||||||||||||||||
and timberlands, net |
| — |
|
|
| — |
|
|
| — |
|
|
| — |
|
|
| — |
|
|
| — |
|
|
| — |
|
|
| (0.1 | ) |
|
| — |
|
|
| (0.1 | ) | |||||||||||||||||||||||||||||||||||||||
(Gains) losses on dispositions of plant, equipment and timberlands, net |
| — |
|
|
| — |
|
|
| — |
|
|
| — |
|
|
| — |
|
|
| — |
|
|
| (0.1 | ) |
|
| — |
|
|
| (0.1 | ) |
|
| — |
| |||||||||||||||||||||||||||||||||||||||
Total operating income (loss) |
| 14.0 |
|
|
| 14.1 |
|
|
| 6.4 |
|
|
| 6.8 |
|
|
| 18.7 |
|
|
| 17.5 |
|
|
| (13.6 | ) |
|
| (18.2 | ) |
|
| 25.4 |
|
|
| 20.2 |
|
| 14.7 |
|
|
| 15.3 |
|
|
| 7.5 |
|
|
| 6.8 |
|
|
| (13.8 | ) |
|
| (5.8 | ) |
|
| (9.9 | ) |
|
| (10.7 | ) |
|
| (1.5 | ) |
|
| 5.5 |
|
Non-operating expense |
| — |
|
|
| — |
|
|
| — |
|
|
| — |
|
|
| — |
|
|
| — |
|
|
| (4.4 | ) |
|
| (4.4 | ) |
|
| (4.4 | ) |
|
| (4.4 | ) |
| — |
|
|
| — |
|
|
| — |
|
|
| — |
|
|
| — |
|
|
| — |
|
|
| (4.6 | ) |
|
| (3.6 | ) |
|
| (4.6 | ) |
|
| (3.6 | ) |
Income (loss) before income taxes | $ | 14.0 |
|
| $ | 14.1 |
|
| $ | 6.4 |
|
| $ | 6.8 |
|
| $ | 18.7 |
|
| $ | 17.5 |
|
| $ | (18.0 | ) |
| $ | (22.6 | ) |
| $ | 21.0 |
|
| $ | 15.8 |
| $ | 14.7 |
|
| $ | 15.3 |
|
| $ | 7.5 |
|
| $ | 6.8 |
|
| $ | (13.8 | ) |
| $ | (5.8 | ) |
| $ | (14.5 | ) |
| $ | (14.3 | ) |
| $ | (6.1 | ) |
| $ | 2.0 |
|
Supplementary Data |
|
|
|
|
|
|
|
|
|
|
|
|
|
|
|
|
|
|
|
|
|
|
|
|
|
|
|
|
|
|
|
|
|
|
|
|
|
|
|
|
|
|
|
|
|
|
|
|
|
|
|
|
|
|
|
|
|
|
|
|
|
|
|
|
|
|
|
|
|
|
|
|
|
|
|
|
|
|
Net tons sold (thousands) |
| 39.1 |
|
|
| 38.9 |
|
|
| 25.2 |
|
|
| 24.8 |
|
|
| 197.3 |
|
|
| 203.6 |
|
|
| — |
|
|
| — |
|
|
| 261.5 |
|
|
| 267.2 |
|
| 41.9 |
|
|
| 40.7 |
|
|
| 25.5 |
|
|
| 24.4 |
|
|
| 184.1 |
|
|
| 194.7 |
|
|
| — |
|
|
| — |
|
|
| 251.5 |
|
|
| 259.7 |
|
Depreciation, depletion and amortization | $ | 6.9 |
|
| $ | 6.7 |
|
| $ | 2.4 |
|
| $ | 2.2 |
|
| $ | 6.4 |
|
| $ | 6.4 |
|
| $ | 0.6 |
|
| $ | 0.5 |
|
| $ | 16.3 |
|
| $ | 15.8 |
| $ | 7.0 |
|
| $ | 7.2 |
|
| $ | 2.3 |
|
| $ | 2.4 |
|
| $ | 7.7 |
|
| $ | 6.5 |
|
| $ | 0.7 |
|
| $ | 0.7 |
|
| $ | 17.7 |
|
| $ | 16.8 |
|
Capital expenditures |
| 5.1 |
|
|
| 5.8 |
|
|
| 4.3 |
|
|
| 1.8 |
|
|
| 26.7 |
|
|
| 22.1 |
|
|
| 0.5 |
|
|
| — |
|
|
| 36.6 |
|
|
| 29.7 |
|
| 2.1 |
|
|
| 2.3 |
|
|
| 12.9 |
|
|
| 6.1 |
|
|
| 15.8 |
|
|
| 28.7 |
|
|
| 3.5 |
|
|
| — |
|
|
| 34.3 |
|
|
| 37.1 |
|
Nine months ended September 30 |
|
|
| Advanced Airlaid |
|
|
|
|
| Other and |
|
|
|
| ||||||||||||||||||||||||||||||||||||||||||||||||||||||||||||||||
Six months ended June 30 |
|
|
| Advanced Airlaid |
|
|
|
|
| Other and |
|
|
|
| ||||||||||||||||||||||||||||||||||||||||||||||||||||||||||||||||
Dollars in millions | Composite Fibers |
|
| Materials |
|
| Specialty Papers |
|
| Unallocated |
|
| Total |
| Composite Fibers |
|
| Materials |
|
| Specialty Papers |
|
| Unallocated |
|
| Total |
| ||||||||||||||||||||||||||||||||||||||||||||||||||
| 2016 |
|
| 2015 |
|
| 2016 |
|
| 2015 |
|
| 2016 |
|
| 2015 |
|
| 2016 |
|
| 2015 |
|
| 2016 |
|
| 2015 |
| 2017 |
|
| 2016 |
|
| 2017 |
|
| 2016 |
|
| 2017 |
|
| 2016 |
|
| 2017 |
|
| 2016 |
|
| 2017 |
|
| 2016 |
| ||||||||||||||||||||
Net sales | $ | 391.6 |
|
| $ | 409.6 |
|
| $ | 183.4 |
|
| $ | 183.0 |
|
| $ | 638.9 |
|
| $ | 655.6 |
|
| $ | — |
|
| $ | — |
|
| $ | 1,213.9 |
|
| $ | 1,248.2 |
| $ | 258.2 |
|
| $ | 259.9 |
|
| $ | 122.7 |
|
| $ | 121.5 |
|
| $ | 397.1 |
|
| $ | 427.2 |
|
| $ | — |
|
| $ | — |
|
| $ | 778.1 |
|
| $ | 808.6 |
|
Energy and related sales, net |
| — |
|
| — |
|
|
| — |
|
| — |
|
|
| 4.0 |
|
|
| 3.9 |
|
|
| — |
|
|
| — |
|
|
| 4.0 |
|
|
| 3.9 |
|
| — |
|
| — |
|
|
| — |
|
| — |
|
|
| 2.1 |
|
|
| 2.7 |
|
|
| — |
|
|
| — |
|
|
| 2.1 |
|
|
| 2.7 |
| ||||
Total revenue | 391.6 |
|
| 409.6 |
|
|
| 183.4 |
|
|
| 183.0 |
|
|
| 642.9 |
|
|
| 659.5 |
|
|
| — |
|
|
| — |
|
|
| 1,217.9 |
|
|
| 1,252.2 |
|
| 258.2 |
|
| 259.9 |
|
|
| 122.7 |
|
|
| 121.5 |
|
|
| 399.2 |
|
|
| 429.9 |
|
|
| — |
|
|
| — |
|
|
| 780.2 |
|
|
| 811.3 |
| |||
Cost of products sold |
| 316.0 |
|
|
| 329.8 |
|
|
| 157.5 |
|
|
| 162.0 |
|
|
| 574.1 |
|
|
| 608.4 |
|
|
| 8.6 |
|
|
| 7.1 |
|
|
| 1,056.2 |
|
|
| 1,107.3 |
|
| 207.2 |
|
|
| 210.3 |
|
|
| 103.5 |
|
|
| 104.1 |
|
|
| 376.0 |
|
|
| 394.0 |
|
|
| 6.1 |
|
|
| 2.3 |
|
|
| 692.8 |
|
|
| 710.7 |
|
Gross profit (loss) |
| 75.6 |
|
|
| 79.8 |
|
|
| 25.9 |
|
|
| 21.0 |
|
|
| 68.8 |
|
|
| 51.1 |
|
|
| (8.6 | ) |
|
| (7.1 | ) |
|
| 161.7 |
|
|
| 144.8 |
|
| 51.0 |
|
|
| 49.6 |
|
|
| 19.2 |
|
|
| 17.4 |
|
|
| 23.2 |
|
|
| 35.9 |
|
|
| (6.1 | ) |
|
| (2.3 | ) |
|
| 87.4 |
|
|
| 100.6 |
|
SG&A |
| 35.1 |
|
|
| 34.4 |
|
|
| 6.2 |
|
|
| 5.8 |
|
|
| 40.9 |
|
|
| 34.2 |
|
|
| 22.6 |
|
|
| 25.7 |
|
|
| 104.8 |
|
|
| 100.2 |
|
| 21.9 |
|
|
| 23.2 |
|
|
| 4.6 |
|
|
| 4.2 |
|
|
| 23.8 |
|
|
| 26.6 |
|
|
| 16.8 |
|
|
| 15.0 |
|
|
| 67.1 |
|
|
| 69.0 |
|
Gains on dispositions of plant, equipment |
|
|
|
|
|
|
|
|
|
|
|
|
|
|
|
|
|
|
|
|
|
|
|
|
|
|
|
|
|
|
|
|
|
|
|
|
|
|
| |||||||||||||||||||||||||||||||||||||||
and timberlands, net |
| — |
|
|
| — |
|
|
| — |
|
|
| — |
|
|
| — |
|
|
| — |
|
|
| — |
|
|
| (2.9 | ) |
|
| — |
|
|
| (2.9 | ) | |||||||||||||||||||||||||||||||||||||||
(Gains) losses on dispositions of plant, |
|
|
|
|
|
|
|
|
|
|
|
|
|
|
|
|
|
|
|
|
|
|
|
|
|
|
|
|
|
|
|
|
|
|
|
|
|
|
| |||||||||||||||||||||||||||||||||||||||
equipment and timberlands, net |
| — |
|
|
| — |
|
|
| — |
|
|
| — |
|
|
| — |
|
|
| — |
|
|
| — |
|
|
| — |
|
|
| — |
|
|
| — |
| |||||||||||||||||||||||||||||||||||||||
Total operating income (loss) |
| 40.5 |
|
|
| 45.4 |
|
|
| 19.7 |
|
|
| 15.2 |
|
|
| 27.9 |
|
|
| 16.9 |
|
|
| (31.2 | ) |
|
| (29.9 | ) |
|
| 56.9 |
|
|
| 47.5 |
|
| 29.1 |
|
|
| 26.4 |
|
|
| 14.6 |
|
|
| 13.2 |
|
|
| (0.6 | ) |
|
| 9.3 |
|
|
| (22.9 | ) |
|
| (17.3 | ) |
|
| 20.3 |
|
|
| 31.5 |
|
Non-operating expense |
| — |
|
|
| — |
|
|
| — |
|
|
| — |
|
|
| — |
|
|
| — |
|
|
| (12.7 | ) |
|
| (13.1 | ) |
|
| (12.7 | ) |
|
| (13.1 | ) |
| — |
|
|
| — |
|
|
| — |
|
|
| — |
|
|
| — |
|
|
| — |
|
|
| (8.8 | ) |
|
| (8.3 | ) |
|
| (8.8 | ) |
|
| (8.3 | ) |
Income (loss) before income taxes | $ | 40.5 |
|
| $ | 45.4 |
|
| $ | 19.7 |
|
| $ | 15.2 |
|
| $ | 27.9 |
|
| $ | 16.9 |
|
| $ | (43.9 | ) |
| $ | (43.0 | ) |
| $ | 44.2 |
|
| $ | 34.4 |
| $ | 29.1 |
|
| $ | 26.4 |
|
| $ | 14.6 |
|
| $ | 13.2 |
|
| $ | (0.6 | ) |
| $ | 9.3 |
|
| $ | (31.7 | ) |
| $ | (25.6 | ) |
| $ | 11.6 |
|
| $ | 23.2 |
|
Supplementary Data |
|
|
|
|
|
|
|
|
|
|
|
|
|
|
|
|
|
|
|
|
|
|
|
|
|
|
|
|
|
|
|
|
|
|
|
|
|
|
|
|
|
|
|
|
|
|
|
|
|
|
|
|
|
|
|
|
|
|
|
|
|
|
|
|
|
|
|
|
|
|
|
|
|
|
|
|
|
|
Net tons sold (thousands) |
| 116.7 |
|
|
| 116.2 |
|
|
| 74.1 |
|
|
| 71.4 |
|
|
| 597.7 |
|
|
| 593.6 |
|
|
| — |
|
|
| — |
|
|
| 788.5 |
|
|
| 781.2 |
|
| 80.7 |
|
|
| 77.6 |
|
|
| 50.3 |
|
|
| 48.9 |
|
|
| 381.4 |
|
|
| 400.5 |
|
|
| — |
|
|
| — |
|
|
| 512.4 |
|
|
| 527.0 |
|
Depreciation, depletion and amortization | $ | 21.2 |
|
| $ | 20.1 |
|
| $ | 7.0 |
|
| $ | 6.5 |
|
| $ | 19.7 |
|
| $ | 19.3 |
|
| $ | 1.8 |
|
| $ | 1.5 |
|
| $ | 49.7 |
|
| $ | 47.4 |
| $ | 13.8 |
|
| $ | 14.3 |
|
| $ | 4.6 |
|
| $ | 4.7 |
|
| $ | 14.9 |
|
| $ | 13.2 |
|
| $ | 1.7 |
|
| $ | 1.2 |
|
| $ | 35.0 |
|
| $ | 33.4 |
|
Capital expenditures |
| 13.7 |
|
|
| 17.3 |
|
|
| 25.0 |
|
|
| 4.6 |
|
|
| 77.4 |
|
|
| 51.0 |
|
|
| 0.8 |
|
|
| 1.4 |
|
|
| 116.9 |
|
|
| 74.3 |
|
| 6.8 |
|
|
| 8.6 |
|
|
| 23.5 |
|
|
| 20.7 |
|
|
| 34.0 |
|
|
| 50.8 |
|
|
| 6.7 |
|
|
| 0.3 |
|
|
| 71.0 |
|
|
| 80.4 |
|
The sum of individual amounts set forth above may not agree to the consolidated financial statements included herein due to rounding.
Business Units Results of individual business units are presented based on our management accounting practices and management structure. There is no comprehensive, authoritative body of guidance for management accounting equivalent to accounting principles generally accepted in the United States of America; therefore, the financial results of individual business units are not necessarily comparable with similar information for any other company. The management accounting process uses assumptions and allocations to measure performance of the business units. Methodologies are refined from time to time as management accounting practices are enhanced and businesses change. The costs incurred by support areas not directly aligned with the business unit are allocated primarily based on an estimated utilization of support area services or are included in “Other and Unallocated” in the Business Unit Performance table.
Management evaluates results of operations of the business units before pension expense, certain corporate level costs, and the effects of certain gains or losses not considered to be related to the core business operations. Management believes that this is a more meaningful representation of the operating performance of its core businesses, the profitability of business units and the extent of cash flow generated from these core operations. Such amounts are presented under the caption “Other and Unallocated.” In the evaluation of business unit results, management does not use any measures of total assets. This presentation is aligned with the management and operating structure of our company. It is also on this basis that the Company’s performance is evaluated internally and by the Company’s Board of Directors.
- 1918 -
GLATFELTER
9.30.1606.30.17 Form 10-Q
Our 5.375% Notes issued by P. H. Glatfelter Company (the “Parent”) are fully and unconditionally guaranteed, on a joint and several basis, by certain of our 100%-owned domestic subsidiaries, PHG Tea Leaves, Inc., Mollanvick, Inc., Glatfelter Composite Fibers N. A., Inc. (“CFNA”), Glatfelter Advance Materials N.A., Inc. (“GAMNA”), and Glatfelter Holdings, LLC. The guarantees are subject to certain customary release provisions including i) the designation of such subsidiary as an unrestricted or excluded subsidiary; (ii) in connection with any sale or disposition of the capital stock of the subsidiary guarantor; or (iii) upon our exercise of our legal defeasance option or our covenant defeasance option, all of which are more fully described in the Indenture dated as of October 3, 2012 and the First Supplemental Indenture dated as of October 27, 2015, among us, the Guarantors and US Bank National Association, as Trustee, relating to the 5.375% Notes.
The following presents our condensed consolidating statements of income, including comprehensive income, for the three months and ninesix months ended SeptemberJune 30, 20162017 and 2015,2016, our condensed consolidating balance sheets as of SeptemberJune 30, 20162017 and December 31, 20152016, and our condensed consolidating cash flows for the ninesix months ended SeptemberJune 30, 20162017 and 2015. 2016.
Condensed Consolidating Statement of Income for the three months ended SeptemberJune 30, 2016
2017
In thousands | Parent Company |
|
| Guarantors |
|
| Non Guarantors |
|
| Adjustments/ Eliminations |
|
| Consolidated |
| Parent Company |
|
| Guarantors |
|
| Non Guarantors |
|
| Adjustments/ Eliminations |
|
| Consolidated |
| ||||||||||
Net sales | $ | 211,761 |
|
| $ | 18,086 |
|
| $ | 192,214 |
|
| $ | (16,760 | ) |
| $ | 405,301 |
| $ | 191,370 |
|
| $ | 23,052 |
|
| $ | 194,708 |
|
| $ | (21,788 | ) |
| $ | 387,342 |
|
Energy and related sales, net |
| 1,346 |
|
|
| — |
|
|
| — |
|
|
| — |
|
|
| 1,346 |
|
| 981 |
|
|
| — |
|
|
| — |
|
|
| — |
|
|
| 981 |
|
Total revenues |
| 213,107 |
|
|
| 18,086 |
|
|
| 192,214 |
|
|
| (16,760 | ) |
|
| 406,647 |
|
| 192,351 |
|
|
| 23,052 |
|
|
| 194,708 |
|
|
| (21,788 | ) |
|
| 388,323 |
|
Costs of products sold |
| 186,297 |
|
|
| 16,732 |
|
|
| 159,208 |
|
|
| (16,760 | ) |
|
| 345,477 |
|
| 195,444 |
|
|
| 22,047 |
|
|
| 162,184 |
|
|
| (21,788 | ) |
|
| 357,887 |
|
Gross profit |
| 26,810 |
|
|
| 1,354 |
|
|
| 33,006 |
|
|
| — |
|
|
| 61,170 |
|
| (3,093 | ) |
|
| 1,005 |
|
|
| 32,524 |
|
|
| — |
|
|
| 30,436 |
|
Selling, general and administrative |
|
|
|
|
|
|
|
|
|
|
|
|
|
|
|
|
|
|
|
|
|
|
|
|
|
|
|
|
|
|
|
|
|
|
|
|
|
|
expenses |
| 21,048 |
|
|
| (25 | ) |
|
| 14,724 |
|
|
| — |
|
|
| 35,747 |
|
| 16,875 |
|
|
| 236 |
|
|
| 14,888 |
|
|
| — |
|
|
| 31,999 |
|
(Gain) loss on dispositions of plant |
|
|
|
|
|
|
|
|
|
|
|
|
|
|
|
|
|
|
|
|
|
|
|
|
|
|
|
|
|
|
|
|
|
|
|
|
|
|
equipment and timberlands, net |
| 7 |
|
|
| — |
|
|
| (2 | ) |
|
| — |
|
|
| 5 |
|
| 16 |
|
|
| (74 | ) |
|
| — |
|
|
| — |
|
|
| (58 | ) |
Operating income |
| 5,755 |
|
|
| 1,379 |
|
|
| 18,284 |
|
|
| — |
|
|
| 25,418 |
| |||||||||||||||||||
Operating income (loss) |
| (19,984 | ) |
|
| 843 |
|
|
| 17,636 |
|
|
| — |
|
|
| (1,505 | ) | |||||||||||||||||||
Other non-operating |
|
|
|
|
|
|
|
|
|
|
|
|
|
|
|
|
|
|
|
|
|
|
|
|
|
|
|
|
|
|
|
|
|
|
|
|
|
|
income (expense) |
|
|
|
|
|
|
|
|
|
|
|
|
|
|
|
|
|
|
|
|
|
|
|
|
|
|
|
|
|
|
|
|
|
|
|
|
|
|
Interest expense |
| (4,332 | ) |
|
| (1 | ) |
|
| (751 | ) |
|
| 1,189 |
|
|
| (3,895 | ) |
| (5,182 | ) |
|
| (206 | ) |
|
| (437 | ) |
|
| 1,349 |
|
|
| (4,476 | ) |
Interest income |
| 173 |
|
|
| 1,063 |
|
|
| 5 |
|
|
| (1,189 | ) |
|
| 52 |
|
| 142 |
|
|
| 1,237 |
|
|
| 15 |
|
|
| (1,349 | ) |
|
| 45 |
|
Equity in earnings of subsidiaries |
| 17,228 |
|
|
| 16,225 |
|
|
| — |
|
|
| (33,453 | ) |
|
| — |
|
| 18,801 |
|
|
| 19,249 |
|
|
| — |
|
|
| (38,050 | ) |
|
| — |
|
Other, net |
| (670 | ) |
|
| (819 | ) |
|
| 916 |
|
|
| — |
|
|
| (573 | ) |
| 534 |
|
|
| (2,319 | ) |
|
| 1,636 |
|
|
| — |
|
|
| (149 | ) |
Total other non-operating |
|
|
|
|
|
|
|
|
|
|
|
|
|
|
|
|
|
|
|
|
|
|
|
|
|
|
|
|
|
|
|
|
|
|
|
|
|
|
income (expense) |
| 12,399 |
|
|
| 16,468 |
|
|
| 170 |
|
|
| (33,453 | ) |
|
| (4,416 | ) |
| 14,295 |
|
|
| 17,961 |
|
|
| 1,214 |
|
|
| (38,050 | ) |
|
| (4,580 | ) |
Income before income taxes |
| 18,154 |
|
|
| 17,847 |
|
|
| 18,454 |
|
|
| (33,453 | ) |
|
| 21,002 |
| |||||||||||||||||||
Income (loss) before income taxes |
| (5,689 | ) |
|
| 18,804 |
|
|
| 18,850 |
|
|
| (38,050 | ) |
|
| (6,085 | ) | |||||||||||||||||||
Income tax provision (benefit) |
| (1,447 | ) |
|
| 619 |
|
|
| 2,229 |
|
|
| — |
|
|
| 1,401 |
|
| 25 |
|
|
| 3 |
|
|
| (399 | ) |
|
| — |
|
|
| (371 | ) |
Net income |
| 19,601 |
|
|
| 17,228 |
|
|
| 16,225 |
|
|
| (33,453 | ) |
|
| 19,601 |
| |||||||||||||||||||
Other comprehensive loss |
| (69 | ) |
|
| (2,307 | ) |
|
| (2,462 | ) |
|
| 4,769 |
|
|
| (69 | ) | |||||||||||||||||||
Net income (loss) |
| (5,714 | ) |
|
| 18,801 |
|
|
| 19,249 |
|
|
| (38,050 | ) |
|
| (5,714 | ) | |||||||||||||||||||
Other comprehensive income |
| 26,332 |
|
|
| 23,964 |
|
|
| 23,371 |
|
|
| (47,335 | ) |
|
| 26,332 |
| |||||||||||||||||||
Comprehensive income | $ | 19,532 |
|
| $ | 14,921 |
|
| $ | 13,763 |
|
| $ | (28,684 | ) |
| $ | 19,532 |
| $ | 20,618 |
|
| $ | 42,765 |
|
| $ | 42,620 |
|
| $ | (85,385 | ) |
| $ | 20,618 |
|
- 2019 -
GLATFELTER
9.30.1606.30.17 Form 10-Q
Condensed Consolidating Statement of Income for the ninesix months ended SeptemberJune 30, 20162017.
In thousands | Parent Company |
|
| Guarantors |
|
| Non Guarantors |
|
| Adjustments/ Eliminations |
|
| Consolidated |
| Parent Company |
|
| Guarantors |
|
| Non Guarantors |
|
| Adjustments/ Eliminations |
|
| Consolidated |
|
| ||||||||||
Net sales | $ | 638,918 |
|
| $ | 54,293 |
|
| $ | 573,355 |
|
| $ | (52,634 | ) |
| $ | 1,213,932 |
| $ | 397,141 |
|
| $ | 42,585 |
|
| $ | 380,595 |
|
| $ | (42,266 | ) |
| $ | 778,055 |
|
|
Energy and related sales, net |
| 4,013 |
|
|
| — |
|
|
| — |
|
|
| — |
|
|
| 4,013 |
|
| 2,110 |
|
|
| — |
|
|
| — |
|
|
| — |
|
|
| 2,110 |
|
|
Total revenues |
| 642,931 |
|
|
| 54,293 |
|
|
| 573,355 |
|
|
| (52,634 | ) |
|
| 1,217,945 |
|
| 399,251 |
|
|
| 42,585 |
|
|
| 380,595 |
|
|
| (42,266 | ) |
|
| 780,165 |
|
|
Costs of products sold |
| 582,751 |
|
|
| 51,493 |
|
|
| 474,599 |
|
|
| (52,634 | ) |
|
| 1,056,209 |
|
| 379,390 |
|
|
| 40,633 |
|
|
| 315,043 |
|
|
| (42,266 | ) |
|
| 692,800 |
|
|
Gross profit |
| 60,180 |
|
|
| 2,800 |
|
|
| 98,756 |
|
|
| — |
|
|
| 161,736 |
|
| 19,861 |
|
|
| 1,952 |
|
|
| 65,552 |
|
|
| — |
|
|
| 87,365 |
|
|
Selling, general and administrative |
|
|
|
|
|
|
|
|
|
|
|
|
|
|
|
|
|
|
|
|
|
|
|
|
|
|
|
|
|
|
|
|
|
|
|
|
|
|
|
expenses |
| 62,115 |
|
|
| (246 | ) |
|
| 42,927 |
|
|
| — |
|
|
| 104,796 |
|
| 37,246 |
|
|
| 310 |
|
|
| 29,529 |
|
|
| — |
|
|
| 67,085 |
|
|
Loss on dispositions of plant |
|
|
|
|
|
|
|
|
|
|
|
|
|
|
|
|
|
|
| ||||||||||||||||||||
(Gain) loss on dispositions of plant |
|
|
|
|
|
|
|
|
|
|
|
|
|
|
|
|
|
|
|
| |||||||||||||||||||
equipment and timberlands, net |
| 11 |
|
|
| — |
|
|
| 20 |
|
|
| — |
|
|
| 31 |
|
| 48 |
|
|
| (74 | ) |
|
| — |
|
|
| — |
|
|
| (26 | ) |
|
Operating income (loss) |
| (1,946 | ) |
|
| 3,046 |
|
|
| 55,809 |
|
|
| — |
|
|
| 56,909 |
|
| (17,433 | ) |
|
| 1,716 |
|
|
| 36,023 |
|
|
| — |
|
|
| 20,306 |
|
|
Other non-operating |
|
|
|
|
|
|
|
|
|
|
|
|
|
|
|
|
|
|
|
|
|
|
|
|
|
|
|
|
|
|
|
|
|
|
|
|
|
|
|
income (expense) |
|
|
|
|
|
|
|
|
|
|
|
|
|
|
|
|
|
|
|
|
|
|
|
|
|
|
|
|
|
|
|
|
|
|
|
|
|
|
|
Interest expense |
| (13,036 | ) |
|
| (1 | ) |
|
| (2,352 | ) |
|
| 3,425 |
|
|
| (11,964 | ) |
| (9,843 | ) |
|
| (319 | ) |
|
| (941 | ) |
|
| 2,619 |
|
|
| (8,484 | ) |
|
Interest income |
| 523 |
|
|
| 3,056 |
|
|
| 50 |
|
|
| (3,425 | ) |
|
| 204 |
|
| 291 |
|
|
| 2,398 |
|
|
| 88 |
|
|
| (2,619 | ) |
|
| 158 |
|
|
Equity in earnings of subsidiaries |
| 46,485 |
|
|
| 44,050 |
|
|
| — |
|
|
| (90,535 | ) |
|
| — |
|
| 32,418 |
|
|
| 33,101 |
|
|
| — |
|
|
| (65,519 | ) |
|
| — |
|
|
Other, net |
| (1,787 | ) |
|
| (2,220 | ) |
|
| 3,051 |
|
|
| — |
|
|
| (956 | ) |
| 1,027 |
|
|
| (4,525 | ) |
|
| 3,070 |
|
|
| — |
|
|
| (428 | ) |
|
Total other non-operating |
|
|
|
|
|
|
|
|
|
|
|
|
|
|
|
|
|
|
|
|
|
|
|
|
|
|
|
|
|
|
|
|
|
|
|
|
|
|
|
income (expense) |
| 32,185 |
|
|
| 44,885 |
|
|
| 749 |
|
|
| (90,535 | ) |
|
| (12,716 | ) |
| 23,893 |
|
|
| 30,655 |
|
|
| 2,217 |
|
|
| (65,519 | ) |
|
| (8,754 | ) |
|
Income before income taxes |
| 30,239 |
|
|
| 47,931 |
|
|
| 56,558 |
|
|
| (90,535 | ) |
|
| 44,193 |
|
| 6,460 |
|
|
| 32,371 |
|
|
| 38,240 |
|
|
| (65,519 | ) |
|
| 11,552 |
|
|
Income tax provision (benefit) |
| (7,495 | ) |
|
| 1,446 |
|
|
| 12,508 |
|
|
| — |
|
|
| 6,459 |
|
| 571 |
|
|
| (47 | ) |
|
| 5,139 |
|
|
| — |
|
|
| 5,663 |
|
|
Net income |
| 37,734 |
|
|
| 46,485 |
|
|
| 44,050 |
|
|
| (90,535 | ) |
|
| 37,734 |
|
| 5,889 |
|
|
| 32,418 |
|
|
| 33,101 |
|
|
| (65,519 | ) |
|
| 5,889 |
|
|
Other comprehensive income (loss) |
| 4,134 |
|
|
| (2,691 | ) |
|
| (2,835 | ) |
|
| 5,526 |
|
|
| 4,134 |
| ||||||||||||||||||||
Other comprehensive income |
| 33,525 |
|
|
| 29,066 |
|
|
| 28,385 |
|
|
| (57,451 | ) |
|
| 33,525 |
|
| |||||||||||||||||||
Comprehensive income | $ | 41,868 |
|
| $ | 43,794 |
|
| $ | 41,215 |
|
| $ | (85,009 | ) |
| $ | 41,868 |
| $ | 39,414 |
|
| $ | 61,484 |
|
| $ | 61,486 |
|
| $ | (122,970 | ) |
| $ | 39,414 |
|
|
Condensed Consolidating Statement of Income for the three months ended June 30, 2016.
In thousands | Parent Company |
|
| Guarantors |
|
| Non Guarantors |
|
| Adjustments/ Eliminations |
|
| Consolidated |
| |||||
Net sales | $ | 209,269 |
|
| $ | 17,561 |
|
| $ | 196,675 |
|
| $ | (17,092 | ) |
| $ | 406,413 |
|
Energy and related sales, net |
| 2,001 |
|
|
| — |
|
|
| — |
|
|
| — |
|
|
| 2,001 |
|
Total revenues |
| 211,270 |
|
|
| 17,561 |
|
|
| 196,675 |
|
|
| (17,092 | ) |
|
| 408,414 |
|
Costs of products sold |
| 204,495 |
|
|
| 16,711 |
|
|
| 161,577 |
|
|
| (17,092 | ) |
|
| 365,691 |
|
Gross profit |
| 6,775 |
|
|
| 850 |
|
|
| 35,098 |
|
|
| — |
|
|
| 42,723 |
|
Selling, general and administrative |
|
|
|
|
|
|
|
|
|
|
|
|
|
|
|
|
|
|
|
expenses |
| 22,622 |
|
|
| (36 | ) |
|
| 14,605 |
|
|
| — |
|
|
| 37,191 |
|
Loss on dispositions of plant |
|
|
|
|
|
|
|
|
|
|
|
|
|
|
|
|
|
|
|
equipment and timberlands, net |
| 2 |
|
|
| — |
|
|
| — |
|
|
| — |
|
|
| 2 |
|
Operating income (loss) |
| (15,849 | ) |
|
| 886 |
|
|
| 20,493 |
|
|
| — |
|
|
| 5,530 |
|
Other non-operating |
|
|
|
|
|
|
|
|
|
|
|
|
|
|
|
|
|
|
|
income (expense) |
|
|
|
|
|
|
|
|
|
|
|
|
|
|
|
|
|
|
|
Interest expense |
| (4,289 | ) |
|
| — |
|
|
| (814 | ) |
|
| 1,150 |
|
|
| (3,953 | ) |
Interest income |
| 169 |
|
|
| 1,001 |
|
|
| 41 |
|
|
| (1,150 | ) |
|
| 61 |
|
Equity in earnings of subsidiaries |
| 16,385 |
|
|
| 16,071 |
|
|
| — |
|
|
| (32,456 | ) |
|
| — |
|
Other, net |
| (575 | ) |
|
| (1,421 | ) |
|
| 2,313 |
|
|
| — |
|
|
| 317 |
|
Total other non-operating |
|
|
|
|
|
|
|
|
|
|
|
|
|
|
|
|
|
|
|
income (expense) |
| 11,690 |
|
|
| 15,651 |
|
|
| 1,540 |
|
|
| (32,456 | ) |
|
| (3,575 | ) |
Income (loss) before income taxes |
| (4,159 | ) |
|
| 16,537 |
|
|
| 22,033 |
|
|
| (32,456 | ) |
|
| 1,955 |
|
Income tax provision (benefit) |
| (6,124 | ) |
|
| 152 |
|
|
| 5,962 |
|
|
| — |
|
|
| (10 | ) |
Net income |
| 1,965 |
|
|
| 16,385 |
|
|
| 16,071 |
|
|
| (32,456 | ) |
|
| 1,965 |
|
Other comprehensive loss |
| (11,539 | ) |
|
| (13,937 | ) |
|
| (13,490 | ) |
|
| 27,427 |
|
|
| (11,539 | ) |
Comprehensive income (loss) | $ | (9,574 | ) |
| $ | 2,448 |
|
| $ | 2,581 |
|
| $ | (5,029 | ) |
| $ | (9,574 | ) |
- 2120 -
GLATFELTER
9.30.1606.30.17 Form 10-Q
Condensed Consolidating Statement of Income for the threesix months ended SeptemberJune 30, 20152016.
In thousands | Parent Company |
|
| Guarantors |
|
| Non Guarantors |
|
| Adjustments/ Eliminations |
|
| Consolidated |
|
| |||||
Net sales | $ | 427,157 |
|
| $ | 36,207 |
|
| $ | 381,141 |
|
| $ | (35,874 | ) |
| $ | 808,631 |
|
|
Energy and related sales, net |
| 2,667 |
|
|
| — |
|
|
| — |
|
|
| — |
|
|
| 2,667 |
|
|
Total revenues |
| 429,824 |
|
|
| 36,207 |
|
|
| 381,141 |
|
|
| (35,874 | ) |
|
| 811,298 |
|
|
Costs of products sold |
| 396,454 |
|
|
| 34,761 |
|
|
| 315,391 |
|
|
| (35,874 | ) |
|
| 710,732 |
|
|
Gross profit |
| 33,370 |
|
|
| 1,446 |
|
|
| 65,750 |
|
|
| — |
|
|
| 100,566 |
|
|
Selling, general and administrative |
|
|
|
|
|
|
|
|
|
|
|
|
|
|
|
|
|
|
|
|
expenses |
| 41,067 |
|
|
| (221 | ) |
|
| 28,203 |
|
|
| — |
|
|
| 69,049 |
|
|
Loss on dispositions of plant |
|
|
|
|
|
|
|
|
|
|
|
|
|
|
|
|
|
|
|
|
equipment and timberlands, net |
| 4 |
|
|
| — |
|
|
| 22 |
|
|
| — |
|
|
| 26 |
|
|
Operating income (loss) |
| (7,701 | ) |
|
| 1,667 |
|
|
| 37,525 |
|
|
| — |
|
|
| 31,491 |
|
|
Other non-operating |
|
|
|
|
|
|
|
|
|
|
|
|
|
|
|
|
|
|
|
|
income (expense) |
|
|
|
|
|
|
|
|
|
|
|
|
|
|
|
|
|
|
|
|
Interest expense |
| (8,704 | ) |
|
| — |
|
|
| (1,601 | ) |
|
| 2,236 |
|
|
| (8,069 | ) |
|
Interest income |
| 350 |
|
|
| 1,993 |
|
|
| 45 |
|
|
| (2,236 | ) |
|
| 152 |
|
|
Equity in earnings of subsidiaries |
| 29,257 |
|
|
| 27,825 |
|
|
| — |
|
|
| (57,082 | ) |
|
| — |
|
|
Other, net |
| (1,117 | ) |
|
| (1,401 | ) |
|
| 2,135 |
|
|
| — |
|
|
| (383 | ) |
|
Total other non-operating |
|
|
|
|
|
|
|
|
|
|
|
|
|
|
|
|
|
|
|
|
income (expense) |
| 19,786 |
|
|
| 28,417 |
|
|
| 579 |
|
|
| (57,082 | ) |
|
| (8,300 | ) |
|
Income before income taxes |
| 12,085 |
|
|
| 30,084 |
|
|
| 38,104 |
|
|
| (57,082 | ) |
|
| 23,191 |
|
|
Income tax provision (benefit) |
| (6,048 | ) |
|
| 827 |
|
|
| 10,279 |
|
|
| — |
|
|
| 5,058 |
|
|
Net income |
| 18,133 |
|
|
| 29,257 |
|
|
| 27,825 |
|
|
| (57,082 | ) |
|
| 18,133 |
|
|
Other comprehensive income (loss) |
| 4,203 |
|
|
| (384 | ) |
|
| (373 | ) |
|
| 757 |
|
|
| 4,203 |
|
|
Comprehensive income | $ | 22,336 |
|
| $ | 28,873 |
|
| $ | 27,452 |
|
| $ | (56,325 | ) |
| $ | 22,336 |
|
|
Condensed Consolidating Balance Sheet as of June 30, 2017
In thousands | Parent Company |
|
| Guarantors |
|
| Non Guarantors |
|
| Adjustments/ Eliminations |
|
| Consolidated |
| |||||
Net sales | $ | 222,803 |
|
| $ | 19,005 |
|
| $ | 197,589 |
|
| $ | (19,437 | ) |
| $ | 419,960 |
|
Energy and related sales, net |
| 1,153 |
|
|
| — |
|
|
| — |
|
|
| — |
|
|
| 1,153 |
|
Total revenues |
| 223,956 |
|
|
| 19,005 |
|
|
| 197,589 |
|
|
| (19,437 | ) |
|
| 421,113 |
|
Costs of products sold |
| 197,906 |
|
|
| 17,299 |
|
|
| 165,437 |
|
|
| (19,437 | ) |
|
| 361,205 |
|
Gross profit |
| 26,050 |
|
|
| 1,706 |
|
|
| 32,152 |
|
|
| — |
|
|
| 59,908 |
|
Selling, general and administrative |
|
|
|
|
|
|
|
|
|
|
|
|
|
|
|
|
|
|
|
expenses |
| 24,764 |
|
|
| (8 | ) |
|
| 15,036 |
|
|
| — |
|
|
| 39,792 |
|
Gain on dispositions of plant |
|
|
|
|
|
|
|
|
|
|
|
|
|
|
|
|
|
|
|
equipment and timberlands, net |
| (4 | ) |
|
| — |
|
|
| (119 | ) |
|
| — |
|
|
| (123 | ) |
Operating income |
| 1,290 |
|
|
| 1,714 |
|
|
| 17,235 |
|
|
| — |
|
|
| 20,239 |
|
Other non-operating |
|
|
|
|
|
|
|
|
|
|
|
|
|
|
|
|
|
|
|
income (expense) |
|
|
|
|
|
|
|
|
|
|
|
|
|
|
|
|
|
|
|
Interest expense |
| (4,346 | ) |
|
| — |
|
|
| (23,201 | ) |
|
| 23,230 |
|
|
| (4,317 | ) |
Interest income |
| 181 |
|
|
| 23,129 |
|
|
| 11 |
|
|
| (23,231 | ) |
|
| 90 |
|
Equity in earnings of subsidiaries |
| 14,173 |
|
|
| (9,366 | ) |
|
| — |
|
|
| (4,808 | ) |
|
| — |
|
Other, net |
| (961 | ) |
|
| 23 |
|
|
| 718 |
|
|
| — |
|
|
| (220 | ) |
Total other non-operating |
|
|
|
|
|
|
|
|
|
|
|
|
|
|
|
|
|
|
|
income (expense) |
| 9,047 |
|
|
| 13,786 |
|
|
| (22,472 | ) |
|
| (4,809 | ) |
|
| (4,447 | ) |
Income (loss) before income taxes |
| 10,337 |
|
|
| 15,500 |
|
|
| (5,237 | ) |
|
| (4,809 | ) |
|
| 15,792 |
|
Income tax provision (benefit) |
| (3,167 | ) |
|
| 1,270 |
|
|
| 4,185 |
|
|
| — |
|
|
| 2,288 |
|
Net income (loss) |
| 13,504 |
|
|
| 14,230 |
|
|
| (9,422 | ) |
|
| (4,809 | ) |
|
| 13,504 |
|
Other comprehensive loss |
| (3,002 | ) |
|
| (5,954 | ) |
|
| (7,752 | ) |
|
| 13,706 |
|
|
| (3,002 | ) |
Comprehensive income (loss) | $ | 10,502 |
|
| $ | 8,276 |
|
| $ | (17,174 | ) |
| $ | 8,897 |
|
| $ | 10,502 |
|
In thousands |
| Parent Company |
|
| Guarantors |
|
| Non Guarantors |
|
| Adjustments/ Eliminations |
|
| Consolidated |
| |||||
Assets |
|
|
|
|
|
|
|
|
|
|
|
|
|
|
|
|
|
|
|
|
Cash and cash equivalents |
| $ | 8,587 |
|
| $ | 3,080 |
|
| $ | 57,775 |
|
| $ | — |
|
| $ | 69,442 |
|
Other current assets |
|
| 219,123 |
|
|
| 278,908 |
|
|
| 277,622 |
|
|
| (304,886 | ) |
|
| 470,767 |
|
Plant, equipment and timberlands, net |
|
| 384,846 |
|
|
| 58,075 |
|
|
| 395,086 |
|
|
| — |
|
|
| 838,007 |
|
Investments in subsidiaries |
|
| 851,050 |
|
|
| 601,864 |
|
|
| — |
|
|
| (1,452,914 | ) |
|
| — |
|
Other assets |
|
| 127,334 |
|
|
| — |
|
|
| 136,231 |
|
|
| — |
|
|
| 263,565 |
|
Total assets |
| $ | 1,590,940 |
|
| $ | 941,927 |
|
| $ | 866,714 |
|
| $ | (1,757,800 | ) |
| $ | 1,641,781 |
|
Liabilities and Shareholders' Equity |
|
|
|
|
|
|
|
|
|
|
|
|
|
|
|
|
|
|
|
|
Current liabilities |
| $ | 447,573 |
|
| $ | 52,294 |
|
| $ | 144,785 |
|
| $ | (304,888 | ) |
| $ | 339,764 |
|
Long-term debt |
|
| 338,991 |
|
|
| 39,000 |
|
|
| 53,503 |
|
|
| — |
|
|
| 431,494 |
|
Deferred income taxes |
|
| 13,083 |
|
|
| (729 | ) |
|
| 48,361 |
|
|
| — |
|
|
| 60,715 |
|
Other long-term liabilities |
|
| 106,263 |
|
|
| 312 |
|
|
| 18,201 |
|
|
| — |
|
|
| 124,776 |
|
Total liabilities |
|
| 905,910 |
|
|
| 90,877 |
|
|
| 264,850 |
|
|
| (304,888 | ) |
|
| 956,749 |
|
Shareholders’ equity |
|
| 685,030 |
|
|
| 851,050 |
|
|
| 601,864 |
|
|
| (1,452,912 | ) |
|
| 685,032 |
|
Total liabilities and shareholders’ equity |
| $ | 1,590,940 |
|
| $ | 941,927 |
|
| $ | 866,714 |
|
| $ | (1,757,800 | ) |
| $ | 1,641,781 |
|
- 2221 -
GLATFELTER
9.30.16 Form 10-Q
Condensed Consolidating Statement of Income for the nine months ended September 30, 2015
In thousands | Parent Company |
|
| Guarantors |
|
| Non Guarantors |
|
| Adjustments/ Eliminations |
|
| Consolidated |
| |||||
Net sales | $ | 655,599 |
|
| $ | 61,822 |
|
| $ | 590,466 |
|
| $ | (59,655 | ) |
| $ | 1,248,232 |
|
Energy and related sales, net |
| 3,936 |
|
|
| — |
|
|
| — |
|
|
| — |
|
|
| 3,936 |
|
Total revenues |
| 659,535 |
|
|
| 61,822 |
|
|
| 590,466 |
|
|
| (59,655 | ) |
|
| 1,252,168 |
|
Costs of products sold |
| 614,060 |
|
|
| 58,554 |
|
|
| 494,360 |
|
|
| (59,655 | ) |
|
| 1,107,319 |
|
Gross profit |
| 45,475 |
|
|
| 3,268 |
|
|
| 96,106 |
|
|
| — |
|
|
| 144,849 |
|
Selling, general and administrative |
|
|
|
|
|
|
|
|
|
|
|
|
|
|
|
|
|
|
|
expenses |
| 57,607 |
|
|
| 947 |
|
|
| 41,647 |
|
|
| — |
|
|
| 100,201 |
|
Gains on dispositions of plant, |
|
|
|
|
|
|
|
|
|
|
|
|
|
|
|
|
|
|
|
equipment and timberlands, net |
| (1,526 | ) |
|
| (1,183 | ) |
|
| (179 | ) |
|
| — |
|
|
| (2,888 | ) |
Operating income (loss) |
| (10,606 | ) |
|
| 3,504 |
|
|
| 54,638 |
|
|
| — |
|
|
| 47,536 |
|
Other non-operating |
|
|
|
|
|
|
|
|
|
|
|
|
|
|
|
|
|
|
|
income (expense) |
|
|
|
|
|
|
|
|
|
|
|
|
|
|
|
|
|
|
|
Interest expense |
| (13,771 | ) |
|
| — |
|
|
| (35,965 | ) |
|
| 36,559 |
|
|
| (13,177 | ) |
Interest income |
| 513 |
|
|
| 36,226 |
|
|
| 52 |
|
|
| (36,559 | ) |
|
| 232 |
|
Equity in earnings of subsidiaries |
| 48,775 |
|
|
| 11,879 |
|
|
| — |
|
|
| (60,654 | ) |
|
| — |
|
Other, net |
| (2,423 | ) |
|
| (136 | ) |
|
| 2,367 |
|
|
| — |
|
|
| (192 | ) |
Total other non-operating |
|
|
|
|
|
|
|
|
|
|
|
|
|
|
|
|
|
|
|
income (expense) |
| 33,094 |
|
|
| 47,969 |
|
|
| (33,546 | ) |
|
| (60,654 | ) |
|
| (13,137 | ) |
Income before income taxes |
| 22,488 |
|
|
| 51,473 |
|
|
| 21,092 |
|
|
| (60,654 | ) |
|
| 34,399 |
|
Income tax provision (benefit) |
| (7,789 | ) |
|
| 2,586 |
|
|
| 9,325 |
|
|
| — |
|
|
| 4,122 |
|
Net income |
| 30,277 |
|
|
| 48,887 |
|
|
| 11,767 |
|
|
| (60,654 | ) |
|
| 30,277 |
|
Other comprehensive income (loss) |
| (21,200 | ) |
|
| (30,607 | ) |
|
| 21,156 |
|
|
| 9,451 |
|
|
| (21,200 | ) |
Comprehensive income | $ | 9,077 |
|
| $ | 18,280 |
|
| $ | 32,923 |
|
| $ | (51,203 | ) |
| $ | 9,077 |
|
- 23 -
GLATFELTER
9.30.1606.30.17 Form 10-Q
Condensed Consolidating Balance Sheet as of September 30,December 31, 2016
In thousands | Parent Company |
|
| Guarantors |
|
| Non Guarantors |
|
| Adjustments/ Eliminations |
|
| Consolidated |
|
| Parent Company |
|
| Guarantors |
|
| Non Guarantors |
|
| Adjustments/ Eliminations |
|
| Consolidated |
| ||||||||||
Assets |
|
|
|
|
|
|
|
|
|
|
|
|
|
|
|
|
|
|
|
|
|
|
|
|
|
|
|
|
|
|
|
|
|
|
|
|
|
|
|
Cash and cash equivalents | $ | 3,658 |
|
| $ | 418 |
|
| $ | 46,676 |
|
| $ | — |
|
| $ | 50,752 |
|
| $ | 5,082 |
|
| $ | 1,461 |
|
| $ | 48,901 |
|
| $ | — |
|
| $ | 55,444 |
|
Other current assets |
| 222,853 |
|
|
| 265,889 |
|
|
| 270,650 |
|
|
| (280,576 | ) |
|
| 478,816 |
|
|
| 206,002 |
|
|
| 256,289 |
|
|
| 242,187 |
|
|
| (265,663 | ) |
|
| 438,815 |
|
Plant, equipment and timberlands, net |
| 351,301 |
|
|
| 20,918 |
|
|
| 399,234 |
|
|
| — |
|
|
| 771,453 |
|
|
| 360,521 |
|
|
| 31,455 |
|
|
| 383,922 |
|
|
| — |
|
|
| 775,898 |
|
Investments in subsidiaries |
| 798,376 |
|
|
| 548,865 |
|
|
| — |
|
|
| (1,347,241 | ) |
|
| — |
|
|
| 789,565 |
|
|
| 540,029 |
|
|
| — |
|
|
| (1,329,594 | ) |
|
| — |
|
Other assets |
| 115,900 |
|
|
| — |
|
|
| 137,318 |
|
|
| — |
|
|
| 253,218 |
|
|
| 123,010 |
|
|
| — |
|
|
| 128,092 |
|
|
| — |
|
|
| 251,102 |
|
Total assets | $ | 1,492,088 |
|
| $ | 836,090 |
|
| $ | 853,878 |
|
| $ | (1,627,817 | ) |
| $ | 1,554,239 |
|
| $ | 1,484,180 |
|
| $ | 829,234 |
|
| $ | 803,102 |
|
| $ | (1,595,257 | ) |
| $ | 1,521,259 |
|
Liabilities and Shareholders' Equity |
|
|
|
|
|
|
|
|
|
|
|
|
|
|
|
|
|
|
|
|
|
|
|
|
|
|
|
|
|
|
|
|
|
|
|
|
|
|
|
Current liabilities | $ | 415,957 |
|
| $ | 36,689 |
|
| $ | 144,048 |
|
| $ | (280,576 | ) |
| $ | 316,118 |
|
| $ | 426,628 |
|
| $ | 26,085 |
|
| $ | 135,961 |
|
| $ | (265,663 | ) |
| $ | 323,011 |
|
Long-term debt |
| 269,535 |
|
|
| 1,000 |
|
|
| 97,014 |
|
|
| — |
|
|
| 367,549 |
|
|
| 283,686 |
|
|
| 14,000 |
|
|
| 65,961 |
|
|
| — |
|
|
| 363,647 |
|
Deferred income taxes |
| 26,048 |
|
|
| (288 | ) |
|
| 47,315 |
|
|
| — |
|
|
| 73,075 |
|
|
| 10,221 |
|
|
| (729 | ) |
|
| 45,503 |
|
|
| — |
|
|
| 54,995 |
|
Other long-term liabilities |
| 88,859 |
|
|
| 313 |
|
|
| 16,636 |
|
|
| — |
|
|
| 105,808 |
|
|
| 109,819 |
|
|
| 313 |
|
|
| 15,648 |
|
|
| — |
|
|
| 125,780 |
|
Total liabilities |
| 800,399 |
|
|
| 37,714 |
|
|
| 305,013 |
|
|
| (280,576 | ) |
|
| 862,550 |
|
|
| 830,354 |
|
|
| 39,669 |
|
|
| 263,073 |
|
|
| (265,663 | ) |
|
| 867,433 |
|
Shareholders’ equity |
| 691,689 |
|
|
| 798,376 |
|
|
| 548,865 |
|
|
| (1,347,241 | ) |
|
| 691,689 |
|
|
| 653,826 |
|
|
| 789,565 |
|
|
| 540,029 |
|
|
| (1,329,594 | ) |
|
| 653,826 |
|
Total liabilities and |
|
|
|
|
|
|
|
|
|
|
|
|
|
|
|
|
|
|
| ||||||||||||||||||||
shareholders’ equity | $ | 1,492,088 |
|
| $ | 836,090 |
|
| $ | 853,878 |
|
| $ | (1,627,817 | ) |
| $ | 1,554,239 |
| ||||||||||||||||||||
Total liabilities and shareholders’ equity |
| $ | 1,484,180 |
|
| $ | 829,234 |
|
| $ | 803,102 |
|
| $ | (1,595,257 | ) |
| $ | 1,521,259 |
| |||||||||||||||||||
Condensed Consolidating Balance Sheet asStatement of December 31, 2015
Cash Flows for the six months ended June 30, 2017
In thousands | Parent Company |
|
| Guarantors |
|
| Non Guarantors |
|
| Adjustments/ Eliminations |
|
| Consolidated |
| |||||
Assets |
|
|
|
|
|
|
|
|
|
|
|
|
|
|
|
|
|
|
|
Cash and cash equivalents | $ | 59,130 |
|
| $ | 465 |
|
| $ | 45,709 |
|
| $ | — |
|
| $ | 105,304 |
|
Other current assets |
| 199,690 |
|
|
| 238,515 |
|
|
| 239,367 |
|
|
| (230,509 | ) |
|
| 447,063 |
|
Plant, equipment and timberlands, net |
| 286,334 |
|
|
| 1,114 |
|
|
| 411,416 |
|
|
| — |
|
|
| 698,864 |
|
Investments in subsidiaries |
| 737,450 |
|
|
| 507,116 |
|
|
| — |
|
|
| (1,244,566 | ) |
|
| — |
|
Other assets |
| 106,586 |
|
|
| — |
|
|
| 142,599 |
|
|
| — |
|
|
| 249,185 |
|
Total assets | $ | 1,389,190 |
|
| $ | 747,210 |
|
| $ | 839,091 |
|
| $ | (1,475,075 | ) |
| $ | 1,500,416 |
|
Liabilities and Shareholders' Equity |
|
|
|
|
|
|
|
|
|
|
|
|
|
|
|
|
|
|
|
Current liabilities | $ | 363,037 |
|
| $ | 9,725 |
|
| $ | 162,081 |
|
| $ | (230,523 | ) |
| $ | 304,320 |
|
Long-term debt |
| 247,075 |
|
|
| — |
|
|
| 106,221 |
|
|
| — |
|
|
| 353,296 |
|
Deferred income taxes |
| 28,561 |
|
|
| (79 | ) |
|
| 47,976 |
|
|
| — |
|
|
| 76,458 |
|
Other long-term liabilities |
| 87,270 |
|
|
| — |
|
|
| 15,825 |
|
|
| — |
|
|
| 103,095 |
|
Total liabilities |
| 725,943 |
|
|
| 9,646 |
|
|
| 332,103 |
|
|
| (230,523 | ) |
|
| 837,169 |
|
Shareholders’ equity |
| 663,247 |
|
|
| 737,564 |
|
|
| 506,988 |
|
|
| (1,244,552 | ) |
|
| 663,247 |
|
Total liabilities and |
|
|
|
|
|
|
|
|
|
|
|
|
|
|
|
|
|
|
|
shareholders’ equity | $ | 1,389,190 |
|
| $ | 747,210 |
|
| $ | 839,091 |
|
| $ | (1,475,075 | ) |
| $ | 1,500,416 |
|
In thousands |
| Parent Company |
|
| Guarantors |
|
| Non Guarantors |
|
| Adjustments/ Eliminations |
|
| Consolidated |
|
| |||||
Net cash provided (used) by |
|
|
|
|
|
|
|
|
|
|
|
|
|
|
|
|
|
|
|
|
|
Operating activities |
| $ | (12,072 | ) |
| $ | (1,085 | ) |
| $ | 42,606 |
|
| $ | (685 | ) |
| $ | 28,764 |
|
|
Investing activities |
|
|
|
|
|
|
|
|
|
|
|
|
|
|
|
|
|
|
|
|
|
Expenditures for purchases of plant, equipment and timberlands |
|
| (40,739 | ) |
|
| (21,421 | ) |
|
| (8,887 | ) |
|
| — |
|
|
| (71,047 | ) |
|
Proceeds from disposals of plant, equipment and timberlands, net |
|
| 8 |
|
|
| 75 |
|
|
| — |
|
|
| — |
|
|
| 83 |
|
|
Repayments from intercompany loans |
|
| — |
|
|
| 12,000 |
|
|
| — |
|
|
| (12,000 | ) |
|
| — |
|
|
Advances of intercompany loans |
|
| — |
|
|
| (12,550 | ) |
|
| — |
|
|
| 12,550 |
|
|
| — |
|
|
Intercompany capital contributed |
|
| — |
|
|
| (400 | ) |
|
| — |
|
|
| 400 |
|
|
| — |
|
|
Total investing activities |
|
| (40,731 | ) |
|
| (22,296 | ) |
|
| (8,887 | ) |
|
| 950 |
|
|
| (70,964 | ) |
|
Financing activities |
|
|
|
|
|
|
|
|
|
|
|
|
|
|
|
|
|
|
|
|
|
Net long-term borrowings |
|
| 55,000 |
|
|
| 25,000 |
|
|
| (16,292 | ) |
|
| — |
|
|
| 63,708 |
|
|
Payment of dividends to shareholders |
|
| (11,130 | ) |
|
| — |
|
|
| — |
|
|
| — |
|
|
| (11,130 | ) |
|
Repayments of intercompany loans |
|
| — |
|
|
| — |
|
|
| (12,000 | ) |
|
| 12,000 |
|
|
| — |
|
|
Borrowings of intercompany loans |
|
| 12,550 |
|
|
| — |
|
|
| — |
|
|
| (12,550 | ) |
|
| — |
|
|
Intercompany capital received |
|
| — |
|
|
| — |
|
|
| 400 |
|
|
| (400 | ) |
|
| — |
|
|
Payment of intercompany dividend |
|
| — |
|
|
| — |
|
|
| (685 | ) |
|
| 685 |
|
|
| — |
|
|
Payments related to share-based compensation awards and other |
|
| (112 | ) |
|
| — |
|
|
| — |
|
|
| — |
|
|
| (112 | ) |
|
Total financing activities |
|
| 56,308 |
|
|
| 25,000 |
|
|
| (28,577 | ) |
|
| (265 | ) |
|
| 52,466 |
|
|
Effect of exchange rate on cash |
|
| — |
|
|
| — |
|
|
| 3,732 |
|
|
| — |
|
|
| 3,732 |
|
|
Net increase in cash |
|
| 3,505 |
|
|
| 1,619 |
|
|
| 8,874 |
|
|
| — |
|
|
| 13,998 |
|
|
Cash at the beginning of period |
|
| 5,082 |
|
|
| 1,461 |
|
|
| 48,901 |
|
|
| — |
|
|
| 55,444 |
|
|
Cash at the end of period |
| $ | 8,587 |
|
| $ | 3,080 |
|
| $ | 57,775 |
|
| $ | — |
|
| $ | 69,442 |
|
|
- 2422 -
GLATFELTER
9.30.1606.30.17 Form 10-Q
Condensed Consolidating Statement of Cash Flows for the ninesix months ended SeptemberJune 30, 2016
In thousands | Parent Company |
|
| Guarantors |
|
| Non Guarantors |
|
| Adjustments/ Eliminations |
|
| Consolidated |
|
| Parent Company |
|
| Guarantors |
|
| Non Guarantors |
|
| Adjustments/ Eliminations |
|
| Consolidated |
|
| ||||||||||
Net cash provided (used) by |
|
|
|
|
|
|
|
|
|
|
|
|
|
|
|
|
|
|
|
|
|
|
|
|
|
|
|
|
|
|
|
|
|
|
|
|
|
|
|
|
Operating activities | $ | 41,753 |
|
| $ | 3,748 |
|
| $ | 13,936 |
|
| $ | — |
|
| $ | 59,437 |
|
| $ | 17,067 |
|
| $ | 2,821 |
|
| $ | 16,752 |
|
| $ | — |
|
| $ | 36,640 |
|
|
Investing activities |
|
|
|
|
|
|
|
|
|
|
|
|
|
|
|
|
|
|
|
|
|
|
|
|
|
|
|
|
|
|
|
|
|
|
|
|
|
|
|
|
Expenditures for purchases of plant, |
|
|
|
|
|
|
|
|
|
|
|
|
|
|
|
|
|
|
| |||||||||||||||||||||
equipment and timberlands |
| (78,187 | ) |
|
| (21,066 | ) |
|
| (17,695 | ) |
|
| — |
|
|
| (116,948 | ) | |||||||||||||||||||||
Proceeds from disposals of plant, |
|
|
|
|
|
|
|
|
|
|
|
|
|
|
|
|
|
|
| |||||||||||||||||||||
equipment and timberlands, net |
| 41 |
|
|
| — |
|
|
| 14 |
|
|
| — |
|
|
| 55 |
| |||||||||||||||||||||
Expenditures for purchases of plant, equipment and timberlands |
|
| (51,043 | ) |
|
| (18,861 | ) |
|
| (10,487 | ) |
|
| — |
|
|
| (80,391 | ) |
| |||||||||||||||||||
Proceeds from disposals of plant, equipment and timberlands, net |
|
| 41 |
|
|
| — |
|
|
| 12 |
|
|
| — |
|
|
| 53 |
|
| |||||||||||||||||||
Repayments from intercompany loans |
| — |
|
|
| 11,101 |
|
|
| — |
|
|
| (11,101 | ) |
|
| — |
|
|
| — |
|
|
| 7,500 |
|
|
| — |
|
|
| (7,500 | ) |
|
| — |
|
|
Advances of intercompany loans |
| — |
|
|
| (12,330 | ) |
|
| — |
|
|
| 12,330 |
|
|
| — |
|
|
| — |
|
|
| (7,880 | ) |
|
| — |
|
|
| 7,880 |
|
|
| — |
|
|
Intercompany capital |
|
|
|
|
|
|
|
|
|
|
|
|
|
|
|
|
|
|
| |||||||||||||||||||||
contributed |
| (17,000 | ) |
|
| (500 | ) |
|
| — |
|
|
| 17,500 |
|
|
| — |
| |||||||||||||||||||||
Intercompany capital (contributed) returned |
|
| (17,000 | ) |
|
| (500 | ) |
|
| — |
|
|
| 17,500 |
|
|
| — |
|
| |||||||||||||||||||
Other |
| (400 | ) |
|
| — |
|
|
| — |
|
|
| — |
|
|
| (400 | ) |
|
| (300 | ) |
|
| — |
|
|
| — |
|
|
| — |
|
|
| (300 | ) |
|
Total investing activities |
| (95,546 | ) |
|
| (22,795 | ) |
|
| (17,681 | ) |
|
| 18,729 |
|
|
| (117,293 | ) |
|
| (68,302 | ) |
|
| (19,741 | ) |
|
| (10,475 | ) |
|
| 17,880 |
|
|
| (80,638 | ) |
|
Financing activities |
|
|
|
|
|
|
|
|
|
|
|
|
|
|
|
|
|
|
|
|
|
|
|
|
|
|
|
|
|
|
|
|
|
|
|
|
|
|
|
|
Net long-term borrowings |
| — |
|
|
| — |
|
|
| 14,983 |
|
|
| — |
|
|
| 14,983 |
| |||||||||||||||||||||
Net repayments of indebtedness |
|
| — |
|
|
| — |
|
|
| 4,222 |
|
|
| — |
|
|
| 4,222 |
|
| |||||||||||||||||||
Payments of borrowing costs |
| (136 | ) |
|
| — |
|
|
| — |
|
|
| — |
|
|
| (136 | ) |
|
| (51 | ) |
|
| — |
|
|
| (85 | ) |
|
| — |
|
|
| (136 | ) |
|
Payment of dividends |
|
|
|
|
|
|
|
|
|
|
|
|
|
|
|
|
|
|
| |||||||||||||||||||||
to shareholders |
| (16,134 | ) |
|
| — |
|
|
| — |
|
|
| — |
|
|
| (16,134 | ) | |||||||||||||||||||||
Payment of dividends to shareholders |
|
| (10,679 | ) |
|
| — |
|
|
| — |
|
|
| — |
|
|
| (10,679 | ) |
| |||||||||||||||||||
Repayments of intercompany loans |
| — |
|
|
| — |
|
|
| (11,101 | ) |
|
| 11,101 |
|
|
| — |
|
|
| — |
|
|
| — |
|
|
| (7,500 | ) |
|
| 7,500 |
|
|
| — |
|
|
Borrowings of intercompany loans |
| 12,330 |
|
|
| — |
|
|
| — |
|
|
| (12,330 | ) |
|
| — |
|
|
| 7,880 |
|
|
| — |
|
|
| — |
|
|
| (7,880 | ) |
|
| — |
|
|
Intercompany capital (returned) received |
| — |
|
|
| 17,000 |
|
|
| 500 |
|
|
| (17,500 | ) |
|
| — |
|
|
| — |
|
|
| 17,000 |
|
|
| 500 |
|
|
| (17,500 | ) |
|
| — |
|
|
Proceeds from government grants |
| 3,251 |
|
|
| 2,000 |
|
|
| — |
|
|
| — |
|
|
| 5,251 |
|
|
| 2,443 |
|
|
| 2,000 |
|
|
| — |
|
|
| — |
|
|
| 4,443 |
|
|
Payments related to share-based comp- |
|
|
|
|
|
|
|
|
|
|
|
|
|
|
|
|
|
|
| |||||||||||||||||||||
ensation awards and other |
| (990 | ) |
|
| — |
|
|
| — |
|
|
| — |
|
|
| (990 | ) | |||||||||||||||||||||
Payments related to share-based compensation awards and other |
|
| (976 | ) |
|
| — |
|
|
| — |
|
|
| — |
|
|
| (976 | ) |
| |||||||||||||||||||
Total financing activities |
| (1,679 | ) |
|
| 19,000 |
|
|
| 4,382 |
|
|
| (18,729 | ) |
|
| 2,974 |
|
|
| (1,383 | ) |
|
| 19,000 |
|
|
| (2,863 | ) |
|
| (17,880 | ) |
|
| (3,126 | ) |
|
Effect of exchange rate on cash |
| — |
|
|
| — |
|
|
| 330 |
|
|
| — |
|
|
| 330 |
|
|
| — |
|
|
| — |
|
|
| 352 |
|
|
| — |
|
|
| 352 |
|
|
Net increase (decrease) in cash |
| (55,472 | ) |
|
| (47 | ) |
|
| 967 |
|
|
| — |
|
|
| (54,552 | ) |
|
| (52,618 | ) |
|
| 2,080 |
|
|
| 3,766 |
|
|
| — |
|
|
| (46,772 | ) |
|
Cash at the beginning of period |
| 59,130 |
|
|
| 465 |
|
|
| 45,709 |
|
|
| — |
|
|
| 105,304 |
|
|
| 59,130 |
|
|
| 465 |
|
|
| 45,709 |
|
|
| — |
|
|
| 105,304 |
|
|
Cash at the end of period | $ | 3,658 |
|
| $ | 418 |
|
| $ | 46,676 |
|
| $ | — |
|
| $ | 50,752 |
|
| $ | 6,512 |
|
| $ | 2,545 |
|
| $ | 49,475 |
|
| $ | — |
|
| $ | 58,532 |
|
|
- 25 -
GLATFELTER
9.30.16 Form 10-Q15.SUBSEQUENT EVENT
Condensed Consolidating StatementOn July 27, 2017, we announced several cost reduction measures in our Specialty Papers business unit including the shutdown of Cash Flows fora paper machine at the nine months ended September 30, 2015Chillicothe, OH facility, the elimination of approximately 50 affected hourly positions, and a reduction of an additional 70 salaried positions across the business unit. The machine shutdown will remove approximately 80,000 tons, or 10%, of capacity from the business unit. Production is expected to be absorbed by the remaining seven paper machines in the business unit. The
machine shutdown and headcount reductions are expected to result in an annual net profitability improvement of approximately $9 million and the avoidance of costly market-driven downtime. In connection with these cost reduction initiatives, we will recognize an aggregate pre-tax charge to earnings of approximately $8 million to $9 million including an estimated $5 million to $6 million in non-cash charges. The full amount of the charge is expected to be recognized in the third quarter of 2017.
In thousands | Parent Company |
|
| Guarantors |
|
| Non Guarantors |
|
| Adjustments/ Eliminations |
|
| Consolidated |
| |||||
Net cash provided (used) by |
|
|
|
|
|
|
|
|
|
|
|
|
|
|
|
|
|
|
|
Operating activities | $ | 9,927 |
|
| $ | 152 |
|
| $ | 60,444 |
|
| $ | — |
|
| $ | 70,523 |
|
Investing activities |
|
|
|
|
|
|
|
|
|
|
|
|
|
|
|
|
|
|
|
Expenditures for purchases of plant, |
|
|
|
|
|
|
|
|
|
|
|
|
|
|
|
|
|
|
|
equipment and timberlands |
| (52,331 | ) |
|
| (42 | ) |
|
| (21,907 | ) |
|
| — |
|
|
| (74,280 | ) |
Proceeds from disposals of plant, |
|
|
|
|
|
|
|
|
|
|
|
|
|
|
|
|
|
|
|
equipment and timberlands, net |
| 1,584 |
|
|
| 1,213 |
|
|
| 384 |
|
|
| — |
|
|
| 3,181 |
|
Repayments from intercompany loans |
| 1,465 |
|
|
| 53,855 |
|
|
| — |
|
|
| (55,320 | ) |
|
| — |
|
Advances of intercompany loans |
| — |
|
|
| (44,590 | ) |
|
| — |
|
|
| 44,590 |
|
|
| — |
|
Intercompany capital |
|
|
|
|
|
|
|
|
|
|
|
|
|
|
|
|
|
|
|
(contributed) returned |
| 10,500 |
|
|
| (300 | ) |
|
| — |
|
|
| (10,200 | ) |
|
| — |
|
Acquisitions, net of cash acquired |
| — |
|
|
| — |
|
|
| (224 | ) |
|
| — |
|
|
| (224 | ) |
Other |
| (1,600 | ) |
|
| — |
|
|
| — |
|
|
| — |
|
|
| (1,600 | ) |
Total investing activities |
| (40,382 | ) |
|
| 10,136 |
|
|
| (21,747 | ) |
|
| (20,930 | ) |
|
| (72,923 | ) |
Financing activities |
|
|
|
|
|
|
|
|
|
|
|
|
|
|
|
|
|
|
|
Net repayments of indebtedness |
| — |
|
|
| — |
|
|
| (3,387 | ) |
|
| — |
|
|
| (3,387 | ) |
Payments of borrowing costs |
| (1,329 | ) |
|
| — |
|
|
| — |
|
|
| — |
|
|
| (1,329 | ) |
Payment of dividends |
|
|
|
|
|
|
|
|
|
|
|
|
|
|
|
|
|
|
|
to shareholders |
| (15,215 | ) |
|
| — |
|
|
| — |
|
|
| — |
|
|
| (15,215 | ) |
Repayments of intercompany loans |
| (9,158 | ) |
|
| — |
|
|
| (46,162 | ) |
|
| 55,320 |
|
|
| — |
|
Borrowings of intercompany loans |
| 44,590 |
|
|
| — |
|
|
| — |
|
|
| (44,590 | ) |
|
| — |
|
Intercompany capital (returned) received |
| — |
|
|
| (10,500 | ) |
|
| 300 |
|
|
| 10,200 |
|
|
| — |
|
Payments related to share-based comp- |
|
|
|
|
|
|
|
|
|
|
|
|
|
|
|
|
|
|
|
ensation awards and other |
| (2,015 | ) |
|
| — |
|
|
| — |
|
|
| — |
|
|
| (2,015 | ) |
Total financing activities |
| 16,873 |
|
|
| (10,500 | ) |
|
| (49,249 | ) |
|
| 20,930 |
|
|
| (21,946 | ) |
Effect of exchange rate on cash |
| — |
|
|
| — |
|
|
| (1,826 | ) |
|
| — |
|
|
| (1,826 | ) |
Net decrease in cash |
| (13,582 | ) |
|
| (212 | ) |
|
| (12,378 | ) |
|
| — |
|
|
| (26,172 | ) |
Cash at the beginning of period |
| 42,208 |
|
|
| 509 |
|
|
| 57,120 |
|
|
| — |
|
|
| 99,837 |
|
Cash at the end of period | $ | 28,626 |
|
| $ | 297 |
|
| $ | 44,742 |
|
| $ | — |
|
| $ | 73,665 |
|
- 2623 -
GLATFELTER
9.30.1606.30.17 Form 10-Q
ITEM 2. MANAGEMENT'S DISCUSSION AND ANALYSIS OF FINANCIAL CONDITION AND RESULTS OF OPERATIONS
The following discussion should be read in conjunction with the information in the unaudited condensed consolidated financial statements and notes thereto included herein and Glatfelter’s Financial Statements and Management’s Discussion and Analysis of Financial Condition and Results of Operations included in our 20152016 Annual Report on Form 10-K.
Forward-Looking Statements This Quarterly Report on Form 10-Q includes forward-looking statements within the meaning of the Private Securities Litigation Reform Act of 1995. All statements other than statements of historical fact, including statements regarding industry prospects and future consolidated financial position or results of operations, made in this Report on Form 10-Q are forward looking. We use words such as “anticipates”, “believes”, “expects”, “future”, “intends” and similar expressions to identify forward-looking statements. Forward-looking statements reflect management’s current expectations and are inherently uncertain. Our actual results may differ significantly from such expectations. The following discussion includes forward-looking statements regarding expectations of, among others, shipping volumes, selling prices, input costs, non-cash pension expense, environmental costs, capital expenditures and liquidity, all of which are inherently difficult to predict. Although we make such statements based on assumptions that we believe to be reasonable, there can be no assurance that actual results will not differ materially from our expectations. Accordingly, we identify the following important factors, among others, which could cause our results to differ from any results that might be projected, forecasted or estimated in any such forward-looking statements:
i. | variations in demand for our products including the impact of unplanned market-related downtime, variations in product pricing, or product substitution; |
ii. | the impact of competition, both domestic and international, changes in industry production capacity, including the construction of new mills or new machines, the closing of mills and incremental changes due to capital expenditures or productivity increases; |
iii. | risks associated with our international operations, including local economic and political environments and fluctuations in currency exchange rates; |
iv. | geopolitical events, including the impact of conflicts such as Russia and Ukraine; |
v. | our ability to develop new, high value-added products; |
vi. | changes in the cost or availability of raw materials we use, in particular pulpwood, pulp, pulp substitutes, caustic soda, and abaca fiber; |
vii. | changes in energy-related costs and commodity raw materials with an energy component; |
viii. |
ix. | disruptions in production and/or increased costs due to labor disputes; |
x. | the impact of exposure to volatile market-based pricing for sales of excess electricity; |
xi. | the gain or loss of significant customers and/or on-going viability of such customers; |
xii. | cost and other effects of environmental compliance, cleanup, damages, remediation or restoration, or personal injury or property damages related thereto, such as the costs of natural resource restoration or damages related to the presence of polychlorinated biphenyls ("PCBs") in the lower Fox River on which our former Neenah mill was located; |
xiii. | adverse results in litigation in the Fox River matter; |
xiv. | the impact of war and terrorism; |
xv. | the impact of unfavorable outcomes of audits by various state, federal or international tax |
xvi. | enactment of adverse state, federal or foreign tax or other legislation or changes in government policy or regulation; and |
xvii. | our ability to finance, consummate and integrate acquisitions. |
IntroductionWe manufacture a wide array of specialty papers and fiber-based engineered materials. We manage our company along three business units:
Composite Fiberswith revenue from the sale of single-serve tea and coffee filtration papers, nonwoven wall coveringwallcovering base materials, metallized papers,products, composite laminateslaminate papers, and many technically special papers including substrates for electrical applications;
Advanced Airlaid Materialswith revenue from the sale of airlaid nonwoven fabric-like materials used in feminine hygiene and adult incontinence products, specialty wipes, home care products and other airlaid applications; and
Specialty Paperswith revenue from the sale of papers for carbonless and other forms, envelopes, book publishing, and engineered products such as papers for high-speed ink jet printing, office specialty products, greeting cards, packaging, casting, release, transfer, playing card, postal, FDA-compliant food, and beverage applications, and other niche specialty applications.
- 2724 -
GLATFELTER
9.30.1606.30.17 Form 10-Q
NineSix months ended SeptemberJune 30, 20162017 versus the ninesix months ended SeptemberJune 30, 20152016
Overview Net income forFor the first ninesix months of 2016 was $37.72017 net income totaled $5.9 million, or $0.86$0.13 per diluted share compared with $30.3$18.1 million or $0.69and $0.41 per diluted share in the first nine months of 2015. Adjusted earnings, a non-GAAP measure, was $43.0 million, or $0.98 per diluted share for the first nine months of 2016 compared with $36.0 million, or $0.82 per diluted share, for the same period a year ago.earlier period. Our Composite Fibers and Advanced Airlaid Materials and Specialty Papers businesses, which combined represented 49% of consolidated net sales, reported significantly higher operating income and operating margin expansion in the comparison. The impact of lower selling prices was more the offsetcomparison driven by lower input costs,higher shipping volumes and improved operations and, with respect toproductivity. Specialty Papers, less costly annual maintenance outages. The improved performance of these two businesses was partially offset by lower operating incomePapers’ results declined significantly in the Composite Fibers business, which was impacted by lower selling prices. comparison reflecting challenging market conditions.
The following table sets forth summarized consolidated results of operations:
| Nine months ended September 30 |
| Six months ended June 30 |
|
| |||||||||||
In thousands, except per share | 2016 |
|
| 2015 |
| 2017 |
|
|
| 2016 |
|
| ||||
Net sales | $ | 1,213,932 |
|
| $ | 1,248,232 |
| $ | 778,055 |
|
|
| $ | 808,631 |
|
|
Gross profit |
| 161,736 |
|
|
| 144,849 |
|
| 87,365 |
|
|
|
| 100,566 |
|
|
Operating income |
| 56,909 |
|
|
| 47,536 |
|
| 20,306 |
|
|
|
| 31,491 |
|
|
Net income |
| 37,734 |
|
|
| 30,277 |
|
| 5,889 |
|
|
|
| 18,133 |
|
|
Earnings per diluted share |
| 0.86 |
|
| 0.69 |
|
| 0.13 |
|
|
| 0.41 |
|
| ||
In addition to the results reported in accordance with GAAP, we evaluate our performance using adjusted net incomeearnings and adjusted earnings per diluted share. We disclose this information to allow investors to evaluate our performance exclusive of certain items that impact the comparability of results from period to period and we believe it is helpful in understanding underlying operating trends and cash flow generation. Adjusted net incomeearnings consists of net income determined in accordance with GAAP adjusted to exclude the impact of the following:
Specialty Papers environmental compliance. These adjustments reflect non-capitalized, one-time costs incurred by the business unit directly related to the compliance with the U.S. EPA Best Available Retrofit Technology rule (BART; otherwise known as the Regional Haze Rule) and the Boiler Maximum Achievable Control Technology rule (Boiler MACT).rule. This adjustment includes costs incurred during the transition period in which the newly installed equipment was brought on-line.
Airlaid capacity expansion costs. These adjustments reflect non-capitalized, one-time costs incurred directly related to the
start-up of a new airlaid production facility for Advanced Airlaid Materials.in Ft. Smith, Arkansas.
Fox River environmental matterCost optimization actions. . This adjustment reflects a chargecharges incurred in connection with initiatives to increase our reserve for estimated costsoptimize the cost structure of certain business units in response to remediate environmental contamination at the Fox River site.
Thesechanges in business conditions. The costs are irregular in timing and as such may not be indicative of our past or future performance.
Asset impairment charges. This adjustment represents a non-cash charge required to adjust to its estimated fair value the carrying value of a trade name intangible asset. Charges of this nature are irregular in timing and as such may not be indicative of our past and future performance.
Timberland sales and related costs. These adjustments exclude gains from the sales of timberlands as these items are not considered to be part of our core business, ongoing results of operations or cash flows. These adjustments are irregular in timing and amount and may significantly impact our operating performance. As such, these items may not be indicative of past and future performance of the Company and therefore are excluded for comparability purposes.
Workforce efficiency charges. This includes costs that are directlyprimarily related to actions undertaken to reduce costsheadcount reduction efforts, asset write-offs and improve operating efficiencies. Such costs were specifically incurred as part of our initiative to reduce global headcount as part of a more broad based cost reduction effort initiated in the fourth quarter of 2014.
Acquisition and integration relatedcertain contract termination costs. These adjustments include costs directly related to the consummation of the acquisition process and those related to integrating businesses previously acquired. These costs are irregular in timing and as such may not be indicative of our past and future performance.
Adjusted earnings and adjusted earnings per diluted share are considered measures not calculated in accordance with GAAP, and therefore are non-GAAP measures. The non-GAAP financial information should not be considered in isolation from, or as a substitute for, measures of financial performance prepared in accordance with GAAP. The following table sets forth the reconciliation of net income to adjusted earnings for the ninesix months ended SeptemberJune 30, 20162017 and 2015:2016:
- 28 -
GLATFELTER
9.30.16 Form 10-Q
| Six months ended June 30 |
| ||||||||||||||||||||||||||||
| 2016 |
|
| 2015 |
| 2017 |
|
| 2016 |
| ||||||||||||||||||||
In thousands, except per share | Amount |
|
| Diluted EPS |
|
| Amount |
|
| Diluted EPS |
| Amount |
|
| Diluted EPS |
|
| Amount |
|
| Diluted EPS |
| ||||||||
Net income | $ | 37,734 |
|
| $ | 0.86 |
|
| $ | 30,277 |
|
| $ | 0.69 |
| $ | 5,889 |
|
| $ | 0.13 |
|
| $ | 18,133 |
|
| $ | 0.41 |
|
Adjustments (pre-tax) |
|
|
|
|
|
|
|
|
|
|
|
|
|
|
|
|
|
|
|
|
|
|
|
|
|
|
|
|
|
|
Specialty Papers' environmental compliance |
| 6,645 |
|
|
|
|
|
|
| - |
|
|
|
|
|
| 2,480 |
|
|
|
|
|
|
| 1,125 |
|
|
|
|
|
Airlaid capacity expansion costs |
| 1,308 |
|
|
|
|
|
|
| - |
|
|
|
|
|
| 4,453 |
|
|
|
|
|
|
| 257 |
|
|
|
|
|
Fox River environmental matter |
| - |
|
|
|
|
|
|
| 10,000 |
|
|
|
|
| |||||||||||||||
Asset impairment charge |
| - |
|
|
|
|
|
|
| 1,201 |
|
|
|
|
| |||||||||||||||
Cost optimization actions |
| 2,788 |
|
|
|
|
|
|
| 88 |
|
|
|
|
| |||||||||||||||
Timberland sales and related costs |
| - |
|
|
|
|
|
|
| (2,705 | ) |
|
|
|
|
| (74 | ) |
|
|
|
|
|
| - |
|
|
|
|
|
Workforce efficiency charges |
| 88 |
|
|
|
|
|
|
| 2,249 |
|
|
|
|
| |||||||||||||||
Acquisition and integration related costs |
| - |
|
|
|
|
|
|
| 178 |
|
|
|
|
| |||||||||||||||
Total adjustments (pre-tax) |
| 8,041 |
|
|
|
|
|
|
| 10,923 |
|
|
|
|
|
| 9,647 |
|
|
|
|
|
|
| 1,470 |
|
|
|
|
|
Income taxes (1) (2) |
| (2,736 | ) |
|
|
|
|
|
| (5,175 | ) |
|
|
|
| |||||||||||||||
Income taxes (1) |
| (999 | ) |
|
|
|
|
|
| (543 | ) |
|
|
|
| |||||||||||||||
Total after-tax adjustments |
| 5,305 |
|
|
| 0.12 |
|
|
| 5,748 |
|
|
| 0.13 |
|
| 8,648 |
|
|
| 0.19 |
|
|
| 927 |
|
|
| 0.02 |
|
Adjusted earnings | $ | 43,039 |
|
| $ | 0.98 |
|
| $ | 36,025 |
|
| $ | 0.82 |
| $ | 14,537 |
|
| $ | 0.33 |
|
| $ | 19,060 |
|
| $ | 0.43 |
|
(1) | Tax effect |
|
|
The sum of individual per share amounts set forth above may not agree to adjusted earnings per share due to rounding.
- 25 -
GLATFELTER
06.30.17 Form 10-Q
Nine months ended September 30 |
|
|
| Advanced Airlaid |
|
|
|
|
| Other and |
|
|
|
| ||||||||||||||||||||||||||||||||||||||||||||||||||||||||||||||||
Six months ended June 30 |
|
|
| Advanced Airlaid |
|
|
|
|
| Other and |
|
|
|
| ||||||||||||||||||||||||||||||||||||||||||||||||||||||||||||||||
Dollars in millions | Composite Fibers |
|
| Materials |
|
| Specialty Papers |
|
| Unallocated |
|
| Total |
| Composite Fibers |
|
| Materials |
|
| Specialty Papers |
|
| Unallocated |
|
| Total |
| ||||||||||||||||||||||||||||||||||||||||||||||||||
| 2016 |
|
| 2015 |
|
| 2016 |
|
| 2015 |
|
| 2016 |
|
| 2015 |
|
| 2016 |
|
| 2015 |
|
| 2016 |
|
| 2015 |
| 2017 |
|
| 2016 |
|
| 2017 |
|
| 2016 |
|
| 2017 |
|
| 2016 |
|
| 2017 |
|
| 2016 |
|
| 2017 |
|
| 2016 |
| ||||||||||||||||||||
Net sales | $ | 391.6 |
|
| $ | 409.6 |
|
| $ | 183.4 |
|
| $ | 183.0 |
|
| $ | 638.9 |
|
| $ | 655.6 |
|
| $ | — |
|
| $ | — |
|
| $ | 1,213.9 |
|
| $ | 1,248.2 |
| $ | 258.2 |
|
| $ | 259.9 |
|
| $ | 122.7 |
|
| $ | 121.5 |
|
| $ | 397.1 |
|
| $ | 427.2 |
|
| $ | — |
|
| $ | — |
|
| $ | 778.1 |
|
| $ | 808.6 |
|
Energy and related sales, net |
| — |
|
| — |
|
|
| — |
|
| — |
|
|
| 4.0 |
|
|
| 3.9 |
|
|
| — |
|
|
| — |
|
|
| 4.0 |
|
|
| 3.9 |
|
| — |
|
| — |
|
|
| — |
|
| — |
|
|
| 2.1 |
|
|
| 2.7 |
|
|
| — |
|
|
| — |
|
|
| 2.1 |
|
|
| 2.7 |
| ||||
Total revenue | 391.6 |
|
| 409.6 |
|
|
| 183.4 |
|
|
| 183.0 |
|
|
| 642.9 |
|
|
| 659.5 |
|
|
| — |
|
|
| — |
|
|
| 1,217.9 |
|
|
| 1,252.2 |
|
| 258.2 |
|
| 259.9 |
|
|
| 122.7 |
|
|
| 121.5 |
|
|
| 399.2 |
|
|
| 429.9 |
|
|
| — |
|
|
| — |
|
|
| 780.2 |
|
|
| 811.3 |
| |||
Cost of products sold |
| 316.0 |
|
|
| 329.8 |
|
|
| 157.5 |
|
|
| 162.0 |
|
|
| 574.1 |
|
|
| 608.4 |
|
|
| 8.6 |
|
|
| 7.1 |
|
|
| 1,056.2 |
|
|
| 1,107.3 |
|
| 207.2 |
|
|
| 210.3 |
|
|
| 103.5 |
|
|
| 104.1 |
|
|
| 376.0 |
|
|
| 394.0 |
|
|
| 6.1 |
|
|
| 2.3 |
|
|
| 692.8 |
|
|
| 710.7 |
|
Gross profit (loss) |
| 75.6 |
|
|
| 79.8 |
|
|
| 25.9 |
|
|
| 21.0 |
|
|
| 68.8 |
|
|
| 51.1 |
|
|
| (8.6 | ) |
|
| (7.1 | ) |
|
| 161.7 |
|
|
| 144.8 |
|
| 51.0 |
|
|
| 49.6 |
|
|
| 19.2 |
|
|
| 17.4 |
|
|
| 23.2 |
|
|
| 35.9 |
|
|
| (6.1 | ) |
|
| (2.3 | ) |
|
| 87.4 |
|
|
| 100.6 |
|
SG&A |
| 35.1 |
|
|
| 34.4 |
|
|
| 6.2 |
|
|
| 5.8 |
|
|
| 40.9 |
|
|
| 34.2 |
|
|
| 22.6 |
|
|
| 25.7 |
|
|
| 104.8 |
|
|
| 100.2 |
|
| 21.9 |
|
|
| 23.2 |
|
|
| 4.6 |
|
|
| 4.2 |
|
|
| 23.8 |
|
|
| 26.6 |
|
|
| 16.8 |
|
|
| 15.0 |
|
|
| 67.1 |
|
|
| 69.0 |
|
Gains on dispositions of plant, equipment |
|
|
|
|
|
|
|
|
|
|
|
|
|
|
|
|
|
|
|
|
|
|
|
|
|
|
|
|
|
|
|
|
|
|
|
|
|
|
| |||||||||||||||||||||||||||||||||||||||
and timberlands, net |
| — |
|
|
| — |
|
|
| — |
|
|
| — |
|
|
| — |
|
|
| — |
|
|
| — |
|
|
| (2.9 | ) |
|
| — |
|
|
| (2.9 | ) | |||||||||||||||||||||||||||||||||||||||
(Gains) losses on dispositions of plant, |
|
|
|
|
|
|
|
|
|
|
|
|
|
|
|
|
|
|
|
|
|
|
|
|
|
|
|
|
|
|
|
|
|
|
|
|
|
|
| |||||||||||||||||||||||||||||||||||||||
equipment and timberlands, net |
| — |
|
|
| — |
|
|
| — |
|
|
| — |
|
|
| — |
|
|
| — |
|
|
| — |
|
|
| — |
|
|
| — |
|
|
| — |
| |||||||||||||||||||||||||||||||||||||||
Total operating income (loss) |
| 40.5 |
|
|
| 45.4 |
|
|
| 19.7 |
|
|
| 15.2 |
|
|
| 27.9 |
|
|
| 16.9 |
|
|
| (31.2 | ) |
|
| (29.9 | ) |
|
| 56.9 |
|
|
| 47.5 |
|
| 29.1 |
|
|
| 26.4 |
|
|
| 14.6 |
|
|
| 13.2 |
|
|
| (0.6 | ) |
|
| 9.3 |
|
|
| (22.9 | ) |
|
| (17.3 | ) |
|
| 20.3 |
|
|
| 31.5 |
|
Non-operating expense |
| — |
|
|
| — |
|
|
| — |
|
|
| — |
|
|
| — |
|
|
| — |
|
|
| (12.7 | ) |
|
| (13.1 | ) |
|
| (12.7 | ) |
|
| (13.1 | ) |
| — |
|
|
| — |
|
|
| — |
|
|
| — |
|
|
| — |
|
|
| — |
|
|
| (8.8 | ) |
|
| (8.3 | ) |
|
| (8.8 | ) |
|
| (8.3 | ) |
Income (loss) before income taxes | $ | 40.5 |
|
| $ | 45.4 |
|
| $ | 19.7 |
|
| $ | 15.2 |
|
| $ | 27.9 |
|
| $ | 16.9 |
|
| $ | (43.9 | ) |
| $ | (43.0 | ) |
| $ | 44.2 |
|
| $ | 34.4 |
| $ | 29.1 |
|
| $ | 26.4 |
|
| $ | 14.6 |
|
| $ | 13.2 |
|
| $ | (0.6 | ) |
| $ | 9.3 |
|
| $ | (31.7 | ) |
| $ | (25.6 | ) |
| $ | 11.6 |
|
| $ | 23.2 |
|
Supplementary Data |
|
|
|
|
|
|
|
|
|
|
|
|
|
|
|
|
|
|
|
|
|
|
|
|
|
|
|
|
|
|
|
|
|
|
|
|
|
|
|
|
|
|
|
|
|
|
|
|
|
|
|
|
|
|
|
|
|
|
|
|
|
|
|
|
|
|
|
|
|
|
|
|
|
|
|
|
|
|
Net tons sold (thousands) |
| 116.7 |
|
|
| 116.2 |
|
|
| 74.1 |
|
|
| 71.4 |
|
|
| 597.7 |
|
|
| 593.6 |
|
|
| — |
|
|
| — |
|
|
| 788.5 |
|
|
| 781.2 |
|
| 80.7 |
|
|
| 77.6 |
|
|
| 50.3 |
|
|
| 48.9 |
|
|
| 381.4 |
|
|
| 400.5 |
|
|
| — |
|
|
| — |
|
|
| 512.4 |
|
|
| 527.0 |
|
Depreciation, depletion and amortization | $ | 21.2 |
|
| $ | 20.1 |
|
| $ | 7.0 |
|
| $ | 6.5 |
|
| $ | 19.7 |
|
| $ | 19.3 |
|
| $ | 1.8 |
|
| $ | 1.5 |
|
| $ | 49.7 |
|
| $ | 47.4 |
| $ | 13.8 |
|
| $ | 14.3 |
|
| $ | 4.6 |
|
| $ | 4.7 |
|
| $ | 14.9 |
|
| $ | 13.2 |
|
| $ | 1.7 |
|
| $ | 1.2 |
|
| $ | 35.0 |
|
| $ | 33.4 |
|
Capital expenditures |
| 13.7 |
|
|
| 17.3 |
|
|
| 25.0 |
|
|
| 4.6 |
|
|
| 77.4 |
|
|
| 51.0 |
|
|
| 0.8 |
|
|
| 1.4 |
|
|
| 116.9 |
|
|
| 74.3 |
|
| 6.8 |
|
|
| 8.6 |
|
|
| 23.5 |
|
|
| 20.7 |
|
|
| 34.0 |
|
|
| 50.8 |
|
|
| 6.7 |
|
|
| 0.3 |
|
|
| 71.0 |
|
|
| 80.4 |
|
The sum of individual amounts set forth above may not agree to the consolidated financial statements included herein due to rounding.
Business Units Results of individual business units are presented based on our management accounting practices and management structure. There is no comprehensive, authoritative body of guidance for management accounting equivalent to accounting principles generally accepted in the United States of America; therefore, the financial results of individual business units are not necessarily comparable with similar information for any other company. The management accounting process uses assumptions and allocations to measure performance of the business units. Methodologies are refined from time to time as management accounting practices are enhanced and businesses change. The costs incurred by support areas not directly aligned with the business unit are allocated primarily based on an estimated utilization of support area services or are included in “Other and Unallocated” in the Business Unit Performance table.
Management evaluates results of operations of the business units before pension expense, certain corporate level costs, and the effects of certain gains or losses not considered to be related to the core business operations. Management believes that this is a more meaningful representation of the operating performance of its core businesses, the profitability of business units and the extent of cash flow generated from these core operations. Such amounts are presented under the caption “Other and Unallocated.” In the evaluation of business unit results, management does not use any measures of total assets. This presentation is aligned with the management and operating structure of our company. It is also on this basis that the Company’s performance is evaluated internally and by the Company’s Board of Directors.
- 2926 -
GLATFELTER
9.30.1606.30.17 Form 10-Q
Sales and Costs of Products Sold
| Nine months ended September 30 |
|
|
|
|
| Six months ended June 30 |
|
|
|
|
| |||||||||||
In thousands | 2016 |
|
| 2015 |
|
| Change |
| 2017 |
|
|
| 2016 |
|
| Change |
| ||||||
Net sales | $ | 1,213,932 |
|
| $ | 1,248,232 |
|
| $ | (34,300 | ) | $ | 778,055 |
|
|
| $ | 808,631 |
|
| $ | (30,576 | ) |
Energy and related sales, net |
| 4,013 |
|
|
| 3,936 |
|
|
| 77 |
|
| 2,110 |
|
|
|
| 2,667 |
|
|
| (557 | ) |
Total revenues |
| 1,217,945 |
|
|
| 1,252,168 |
|
|
| (34,223 | ) |
| 780,165 |
|
|
|
| 811,298 |
|
|
| (31,133 | ) |
Costs of products sold |
| 1,056,209 |
|
|
| 1,107,319 |
|
|
| (51,110 | ) |
| 692,800 |
|
|
|
| 710,732 |
|
|
| (17,932 | ) |
Gross profit | $ | 161,736 |
|
| $ | 144,849 |
|
| $ | 16,887 |
| $ | 87,365 |
|
|
| $ | 100,566 |
|
| $ | (13,201 | ) |
Gross profit as a percent of Net sales |
| 13.3 | % |
|
| 11.6 | % |
|
|
|
|
| 11.2 | % |
|
|
| 12.4 | % |
|
|
|
|
The following table sets forth the contribution to consolidated net sales by each business unit:
| Nine months ended September 30 |
| Six months ended June 30 |
|
| |||||||||||
Percent of Total | 2016 |
|
| 2015 |
| 2017 |
|
|
| 2016 |
|
| ||||
Business Unit |
|
|
|
|
|
|
|
|
|
|
|
|
|
|
|
|
Composite Fibers |
| 32.3 | % |
|
| 32.8 | % |
| 33.2 | % |
|
|
| 32.1 | % |
|
Advanced Airlaid Material |
| 15.1 |
|
|
| 14.7 |
|
| 15.8 |
|
|
|
| 15.0 |
|
|
Specialty Papers |
| 52.6 |
|
|
| 52.5 |
|
| 51.0 |
|
|
|
| 52.9 |
|
|
Total |
| 100.0 | % |
|
| 100.0 | % |
| 100.0 | % |
|
|
| 100.0 | % |
|
Net sales totaled $1,213.9$778.1 million and $1,248.2$808.6 million in the first ninesix months of 20162017 and 2015,2016, respectively. The $34.3$30.5 million decrease was primarily driven by $24.4$14.4 million of lower selling prices and $6.7 million of unfavorable currency translation.translation of $12.8 million. Shipping volumes increased 0.9%decreased 2.8%.
Composite Fibers’ net sales decreased $18.0$1.7 million, or 4.4%, primarily due to $6.3 million of0.6%. Shipping volumes increased 4.0%; however, unfavorable currency translation and lower selling prices adversely impacted the comparison by $10.8 million and $6.8$4.0 million, of unfavorable currency translation.respectively.
Composite Fibers’ operating income for the ninesix months of 2016 decreased $4.92017 increased $2.7 million to $40.5$29.1 million compared to the year-ago period.period primarily due to a $4.9 million benefit from improved operations including the impact of our cost optimization program. The primary drivers are summarized in the following chart:
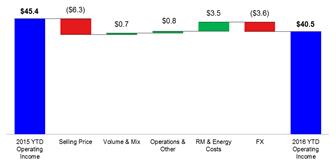
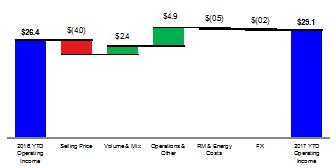
Advanced Airlaid Materials’ net sales increased $0.4$1.2 million in the year-over-year comparison as the impact from primarily due to
higher shipping volumes was substantially offset by $7.7 million of lower selling prices, from the contractual pass
through of lower raw material costs. Shipping volumeswhich increased 3.8% primarily2.9% due to higher shipments of wipes and personal hygiene products.
Advanced Airlaid Materials’ operating income totaled $19.7$14.6 million, an increase of $4.5$1.4 million compared to the same period a year ago. The primary drivers are summarized in the following chart:
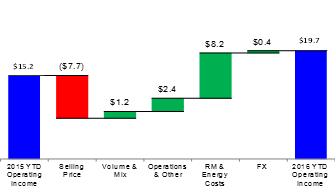

Specialty Papers’ net sales decreased $16.7$30.1 million, or 2.5%7.0%, due to a $10.44.8% decrease in shipping volumes and a $9.8 million impact from lower selling prices. Shipping volumes increased 0.7%. The business unit again outperformed the broader uncoated freesheet market which declined 0.8%.
Operating incomeloss totaled $27.9$0.6 million an increase of $11.0 million compared toin the first ninesix months of 2015.2017, compared with operating income of $9.3 million for the first six months of 2016. Operating results for both quarters reflect the cost of annual maintenance outages at the Chillicothe, OH and Spring Grove, PA facilities which adversely impacted second-quarter 2017 and 2016 results by $22.9 million and $26.3 million, respectively. The primary drivers of the change are summarized in the following chart:
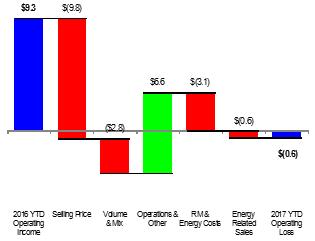

The improvement in “Operations & Other” in the chart above includes $7.1 million from the lower cost of the annual maintenance outages.
- 30 -
GLATFELTER
9.30.16 Form 10-Q
- 27 -
GLATFELTER
06.30.17 Form 10-Q
| Nine months ended September 30 |
|
|
|
|
| |||||
In thousands | 2016 |
|
| 2015 |
|
| Change |
| |||
Energy sales | $ | 2,919 |
|
| $ | 4,375 |
|
| $ | (1,456 | ) |
Costs to produce |
| (3,229 | ) |
|
| (3,387 | ) |
|
| 158 |
|
Net |
| (310 | ) |
|
| 988 |
|
|
| (1,298 | ) |
Renewable energy credits |
| 4,323 |
|
|
| 2,948 |
|
|
| 1,375 |
|
Total | $ | 4,013 |
|
| $ | 3,936 |
|
| $ | 77 |
|
| Six months ended June 30 |
|
|
|
|
| ||||||
In thousands | 2017 |
|
|
| 2016 |
|
| Change |
| |||
Energy sales | $ | 1,793 |
|
|
| $ | 1,818 |
|
| $ | (25 | ) |
Costs to produce |
| (2,367 | ) |
|
|
| (2,042 | ) |
|
| (325 | ) |
Net |
| (574 | ) |
|
|
| (224 | ) |
|
| (350 | ) |
Renewable energy credits |
| 2,684 |
|
|
|
| 2,891 |
|
|
| (207 | ) |
Total | $ | 2,110 |
|
|
| $ | 2,667 |
|
| $ | (557 | ) |
Renewable energy credits (“RECs”) represent sales of certified credits earned related to burning renewable sources of energy such as black liquor and wood waste. We sell RECs into an illiquid market. The extent and value of future revenues from REC sales is dependent on many factors outside of management’s control. Therefore, we may not be able to generate consistent additional sales of RECs in future periods.
Other and Unallocated The amount of net operating expenses not allocated to a business unit and reported as “Other and Unallocated” in our table of Business Unit Performance totaled $31.2$22.9 million in the first ninesix months of 20162017 compared with $29.9$17.3 million in the first ninesix months of 2015. Excluding $2.9 million of gains2016. The increase in 2015 from sales of timberlands inOther and Unallocated expenses primarily relates to Specialty Papers environmental compliance, the comparison, unallocated net operating expenses decreased $1.6 million primarily due to lower pension expense.Airlaid capacity expansion project and the cost optimization actions.
Pension Expense The following table summarizes the amounts of pension expense recognized for the periods indicated:
| Nine months ended September 30 |
|
|
|
|
| Six months ended June 30 |
|
|
|
|
| |||||||||||
In thousands | 2016 |
|
| 2015 |
|
| Change |
| 2017 |
|
|
| 2016 |
|
| Change |
| ||||||
Recorded as: |
|
|
|
|
|
|
|
|
|
|
|
|
|
|
|
|
|
|
|
|
|
|
|
Costs of products sold | $ | 1,761 |
|
| $ | 5,247 |
|
| $ | (3,486 | ) | $ | 1,692 |
|
|
| $ | 1,178 |
|
| $ | 514 |
|
SG&A expense |
| 2,365 |
|
|
| 1,370 |
|
|
| 995 |
|
| 1,622 |
|
|
|
| 1,577 |
|
|
| 45 |
|
Total | $ | 4,126 |
|
| $ | 6,617 |
|
| $ | (2,491 | ) | $ | 3,314 |
|
|
| $ | 2,755 |
|
| $ | 559 |
|
The amount of pension expense recognized each year is dependent on various actuarial assumptions and certain other factors, including discount rates and the fair value of our pension assets. Pension expense for the full year of 20162017 is expected to be approximately $5.5$6.6 million compared with $9.1$5.5 million in 2015. The decrease reflects the impact of higher discount rates partially offset by2016 (which excludes a lower assumed long term rate of return on plan assets.$7.3 million settlement charge).
Income taxes For the first ninesix months of 2016,2017, we recorded a provision for income taxes of $6.5$5.7 million on pretaxpre-tax income of $44.2$11.6 million. The comparable amounts in the six months of 2016 were $5.1 million and $23.2 million, respectively. The effective tax rate of 49.0% in the first six months of 2017 compared with 21.8% in the same period of 2015 were $4.12016 reflects the adverse impact of an increase in unrecognized tax benefits and in our valuation allowances for U.S. deferred tax assets. We currently expect to record valuation allowances of between $16 million and $34.4$18 million respectively. Tax
expense infor the first nine months of 2016 includes a benefit of $2.4 million primarily due to investment tax credits, release of reserves related to the completion of tax audits and changes in statutory tax rates.full year 2017. The effective tax rate in 2015 includesfuture periods may be affected by changes in U.S.-based pre-tax income and its impact on the benefitvaluation of a $2.6 million release of uncertain tax positions in connection with the completion of certain tax audits.deferred taxes.
Foreign Currency We own and operate facilities in Canada, Germany, France, the United Kingdom and the Philippines. The functional currency of our Canadian operations is the U.S. dollar. However, in Germany and France it is the Euro, in the UK, it is the British Pound Sterling, and in the Philippines the functional currency is the Peso. On an annual basis, our euro denominated revenue exceeds euro expenses by approximately €120€125 million to €130 million. For the first ninesix months of 2016,2017, the average currency exchange rate for euro to the U.S. dollar was essentially unchanged in1.093 compared with 1.114 for the year over year comparison.same period of 2016. With respect to the British Pound Sterling, Canadian dollar, and Philippine Peso, we have differing amounts of inflows and outflows of these currencies, although to a lesser degree than the euro. As a result, we are exposed to changes in currency exchange rates and such changes could be significant. The translation of the results from international operations into U.S. dollars is subject to changes in foreign currency exchange rates.
The table below summarizes the translation impact on reported results that changes in currency exchange rates had on our non-U.S. based operations from the conversion of these operation’s results for the first ninesix months of 2016.2017.
In thousands | Nine months ended September 30, 2016 |
| Six months ended June 30, 2017 |
|
| |||||||
| Favorable (unfavorable) |
| Favorable (unfavorable) |
|
| |||||||
Net sales |
|
| $ | (6,672 | ) |
|
|
| $ | (12,799 | ) |
|
Costs of products sold |
|
|
| 2,736 |
|
|
|
|
| 11,706 |
|
|
SG&A expenses |
|
|
| 725 |
|
|
|
|
| 1,063 |
|
|
Income taxes and other |
|
|
| 355 |
|
|
|
|
| 367 |
|
|
Net income |
|
| $ | (2,856 | ) |
|
|
| $ | 337 |
|
|
The above table only presents the financial reporting impact of foreign currency translations assuming currency exchange rates in 20162017 were the same as 2015.2016. It does not present the impact of certain competitive advantages or disadvantages of operating or competing in multi-currency markets.
- 3128 -
GLATFELTER
9.30.1606.30.17 Form 10-Q
Three months ended SeptemberJune 30, 20162017 versus the three months ended SeptemberJune 30, 20152016
Overview For the thirdsecond quarter of 2016,2017, net incomeloss totaled $19.6$5.7 million, or $0.44$0.13 per diluted share compared with $13.5net income of $2.0 million, or $0.31$0.04 per diluted share in the thirdsecond quarter of 2015. Adjusted2016. On an adjusted earnings basis the loss for the thirdsecond quarter of 2016 were $24.02017 was $2.6 million, or $0.54$0.06 per diluted share compared with $20.8adjusted earnings of $2.8 million, or $0.47$0.06 per diluted share, for the same period a year ago.
The following table sets forth summarized results of operations:
| Three months ended September 30 |
| Three months ended June 30 |
|
| |||||||||||
In thousands, except per share | 2016 |
|
| 2015 |
| 2017 |
|
|
| 2016 |
|
| ||||
Net sales | $ | 405,301 |
|
| $ | 419,960 |
| $ | 387,342 |
|
|
| $ | 406,413 |
|
|
Gross profit |
| 61,170 |
|
|
| 59,908 |
|
| 30,436 |
|
|
|
| 42,723 |
|
|
Operating income |
| 25,418 |
|
|
| 20,239 |
| |||||||||
Net income |
| 19,601 |
|
|
| 13,504 |
| |||||||||
Earnings per diluted share |
| 0.44 |
|
|
| 0.31 |
| |||||||||
Operating income (loss) |
| (1,505 | ) |
|
|
| 5,530 |
|
| |||||||
Net income (loss) |
| (5,714 | ) |
|
|
| 1,965 |
|
| |||||||
Earnings (loss) per share |
| (0.13 | ) |
|
|
| 0.04 |
|
| |||||||
The following table sets forth the reconciliation of net income to adjusted earnings for the three months ended SeptemberJune 30, 20162017 and 2015:
2016:
| 2016 |
|
| 2015 |
| ||||||||||
In thousands, except per share | Amount |
|
| Diluted EPS |
|
| Amount |
|
| Diluted EPS |
| ||||
Net income | $ | 19,601 |
|
| $ | 0.44 |
|
| $ | 13,504 |
|
| $ | 0.31 |
|
Adjustments (pre-tax) |
|
|
|
|
|
|
|
|
|
|
|
|
|
|
|
Specialty Papers' environmental compliance |
| 5,520 |
|
|
|
|
|
|
| - |
|
|
|
|
|
Airlaid capacity expansion costs |
| 1,051 |
|
|
|
|
|
|
| - |
|
|
|
|
|
Fox River environmental matter |
| - |
|
|
|
|
|
|
| 10,000 |
|
|
|
|
|
Asset impairment charge |
| - |
|
|
|
|
|
|
| 1,201 |
|
|
|
|
|
Workforce efficiency charges |
| - |
|
|
|
|
|
|
| 296 |
|
|
|
|
|
Acquisition and integration related costs |
| - |
|
|
|
|
|
|
| 18 |
|
|
|
|
|
Total adjustments (pre-tax) |
| 6,571 |
|
|
|
|
|
|
| 11,515 |
|
|
|
|
|
Income taxes (1) |
| (2,193 | ) |
|
|
|
|
|
| (4,212 | ) |
|
|
|
|
Total after-tax adjustments |
| 4,378 |
|
|
| 0.10 |
|
|
| 7,303 |
|
|
| 0.17 |
|
Adjusted earnings | $ | 23,979 |
|
|
| 0.54 |
|
| $ | 20,807 |
|
| $ | 0.47 |
|
| Three months ended June 30 |
| |||||||||||||
| 2017 |
|
| 2016 |
| ||||||||||
In thousands, except per share | Amount |
|
| EPS |
|
| Amount |
|
| Diluted EPS |
| ||||
|
|
|
|
|
|
|
|
|
|
|
|
|
|
|
|
Net income (loss) | $ | (5,714 | ) |
| $ | (0.13 | ) |
| $ | 1,965 |
|
| $ | 0.04 |
|
Adjustments (pre-tax) |
|
|
|
|
|
|
|
|
|
|
|
|
|
|
|
Specialty Papers' environmental compliance and other |
| 216 |
|
|
|
|
|
|
| 1,088 |
|
|
|
|
|
Airlaid capacity expansion costs |
| 2,495 |
|
|
|
|
|
|
| 201 |
|
|
|
|
|
Cost optimization |
| 775 |
|
|
|
|
|
|
| - |
|
|
|
|
|
Timberland sales and related costs |
| (74 | ) |
|
|
|
|
|
| - |
|
|
|
|
|
Total adjustments (pre-tax) |
| 3,412 |
|
|
|
|
|
|
| 1,289 |
|
|
|
|
|
Income taxes (1) |
| (317 | ) |
|
|
|
|
|
| (487 | ) |
|
|
|
|
Total after-tax adjustments |
| 3,095 |
|
|
| 0.07 |
|
|
| 802 |
|
|
| 0.02 |
|
Adjusted earnings (loss) | $ | (2,619 | ) |
| $ | (0.06 | ) |
| $ | 2,767 |
|
| $ | 0.06 |
|
(1) | Tax effect |
Three months ended September 30 |
|
|
| Advanced Airlaid |
|
|
|
|
| Other and |
|
|
|
| ||||||||||||||||||||||||||||||||||||||||||||||||||||||||||||||||
Three months ended June 30 |
|
|
| Advanced Airlaid |
|
|
|
|
| Other and |
|
|
|
| ||||||||||||||||||||||||||||||||||||||||||||||||||||||||||||||||
Dollars in millions | Composite Fibers |
|
| Materials |
|
| Specialty Papers |
|
| Unallocated |
|
| Total |
| Composite Fibers |
|
| Materials |
|
| Specialty Papers |
|
| Unallocated |
|
| Total |
| ||||||||||||||||||||||||||||||||||||||||||||||||||
| 2016 |
|
| 2015 |
|
| 2016 |
|
| 2015 |
|
| 2016 |
|
| 2015 |
|
| 2016 |
|
| 2015 |
|
| 2016 |
|
| 2015 |
| 2017 |
|
| 2016 |
|
| 2017 |
|
| 2016 |
|
| 2017 |
|
| 2016 |
|
| 2017 |
|
| 2016 |
|
| 2017 |
|
| 2016 |
| ||||||||||||||||||||
Net sales | $ | 131.7 |
|
| $ | 133.9 |
|
| $ | 61.9 |
|
| $ | 63.2 |
|
| $ | 211.8 |
|
| $ | 222.8 |
|
| $ | — |
|
| $ | — |
|
| $ | 405.3 |
|
| $ | 420.0 |
| $ | 133.1 |
|
| $ | 136.4 |
|
| $ | 62.8 |
|
| $ | 60.8 |
|
| $ | 191.4 |
|
| $ | 209.3 |
|
| $ | — |
|
| $ | — |
|
| $ | 387.3 |
|
| $ | 406.4 |
|
Energy and related sales, net |
| — |
|
| — |
|
|
| — |
|
| — |
|
|
| 1.3 |
|
|
| 1.2 |
|
|
| — |
|
|
| — |
|
|
| 1.3 |
|
|
| 1.2 |
|
| — |
|
| — |
|
|
| — |
|
| — |
|
|
| 1.0 |
|
|
| 2.0 |
|
|
| — |
|
|
| — |
|
|
| 1.0 |
|
|
| 2.0 |
| ||||
Total revenue |
| 131.7 |
|
|
| 133.9 |
|
|
| 61.9 |
|
| 63.2 |
|
|
| 213.1 |
|
|
| 224.0 |
|
|
| — |
|
|
| — |
|
|
| 406.6 |
|
|
| 421.1 |
|
| 133.1 |
|
|
| 136.4 |
|
|
| 62.8 |
|
| 60.8 |
|
|
| 192.4 |
|
|
| 211.3 |
|
|
| — |
|
|
| — |
|
|
| 388.3 |
|
|
| 408.4 |
| ||
Cost of products sold |
| 105.8 |
|
| 108.4 |
|
|
| 53.5 |
|
|
| 54.6 |
|
|
| 180.1 |
|
|
| 196.1 |
|
|
| 6.1 |
|
|
| 2.1 |
|
|
| 345.5 |
|
|
| 361.2 |
|
| 107.6 |
|
|
| 109.0 |
|
|
| 53.0 |
|
|
| 51.8 |
|
|
| 195.9 |
|
|
| 202.9 |
|
|
| 1.4 |
|
|
| 2.0 |
|
|
| 357.9 |
|
|
| 365.7 |
| |
Gross profit (loss) |
| 25.9 |
|
|
| 25.5 |
|
|
| 8.4 |
|
|
| 8.6 |
|
|
| 33.0 |
|
|
| 27.9 |
|
|
| (6.1 | ) |
|
| (2.1 | ) |
|
| 61.2 |
|
|
| 59.9 |
|
| 25.5 |
|
|
| 27.4 |
|
|
| 9.8 |
|
|
| 9.0 |
|
|
| (3.5 | ) |
|
| 8.4 |
|
|
| (1.4 | ) |
|
| (2.0 | ) |
|
| 30.4 |
|
|
| 42.7 |
|
SG&A |
| 11.9 |
|
|
| 11.5 |
|
|
| 2.0 |
|
|
| 1.8 |
|
|
| 14.3 |
|
|
| 10.4 |
|
|
| 7.5 |
|
|
| 16.2 |
|
|
| 35.7 |
|
|
| 39.8 |
|
| 10.8 |
|
|
| 12.1 |
|
|
| 2.3 |
|
|
| 2.2 |
|
|
| 10.3 |
|
|
| 14.2 |
|
|
| 8.6 |
|
|
| 8.7 |
|
|
| 32.0 |
|
|
| 37.2 |
|
Gains on dispositions of plant, equipment |
|
|
|
|
|
|
|
|
|
|
|
|
|
|
|
|
|
|
|
|
|
|
|
|
|
|
|
|
|
|
|
|
|
|
|
|
|
|
| |||||||||||||||||||||||||||||||||||||||
and timberlands, net |
| — |
|
|
| — |
|
|
| — |
|
|
| — |
|
|
| — |
|
|
| — |
|
|
| — |
|
|
| (0.1 | ) |
|
| — |
|
|
| (0.1 | ) | |||||||||||||||||||||||||||||||||||||||
(Gains) losses on dispositions of plant, equipment and timberlands, net |
| — |
|
|
| — |
|
|
| — |
|
|
| — |
|
|
| — |
|
|
| — |
|
|
| (0.1 | ) |
|
| — |
|
|
| (0.1 | ) |
|
| — |
| |||||||||||||||||||||||||||||||||||||||
Total operating income (loss) |
| 14.0 |
|
|
| 14.1 |
|
|
| 6.4 |
|
|
| 6.8 |
|
|
| 18.7 |
|
|
| 17.5 |
|
|
| (13.6 | ) |
|
| (18.2 | ) |
|
| 25.4 |
|
|
| 20.2 |
|
| 14.7 |
|
|
| 15.3 |
|
|
| 7.5 |
|
|
| 6.8 |
|
|
| (13.8 | ) |
|
| (5.8 | ) |
|
| (9.9 | ) |
|
| (10.7 | ) |
|
| (1.5 | ) |
|
| 5.5 |
|
Non-operating expense |
| — |
|
|
| — |
|
|
| — |
|
|
| — |
|
|
| — |
|
|
| — |
|
|
| (4.4 | ) |
|
| (4.4 | ) |
|
| (4.4 | ) |
|
| (4.4 | ) |
| — |
|
|
| — |
|
|
| — |
|
|
| — |
|
|
| — |
|
|
| — |
|
|
| (4.6 | ) |
|
| (3.6 | ) |
|
| (4.6 | ) |
|
| (3.6 | ) |
Income (loss) before income taxes | $ | 14.0 |
|
| $ | 14.1 |
|
| $ | 6.4 |
|
| $ | 6.8 |
|
| $ | 18.7 |
|
| $ | 17.5 |
|
| $ | (18.0 | ) |
| $ | (22.6 | ) |
| $ | 21.0 |
|
| $ | 15.8 |
| $ | 14.7 |
|
| $ | 15.3 |
|
| $ | 7.5 |
|
| $ | 6.8 |
|
| $ | (13.8 | ) |
| $ | (5.8 | ) |
| $ | (14.5 | ) |
| $ | (14.3 | ) |
| $ | (6.1 | ) |
| $ | 2.0 |
|
Supplementary Data |
|
|
|
|
|
|
|
|
|
|
|
|
|
|
|
|
|
|
|
|
|
|
|
|
|
|
|
|
|
|
|
|
|
|
|
|
|
|
|
|
|
|
|
|
|
|
|
|
|
|
|
|
|
|
|
|
|
|
|
|
|
|
|
|
|
|
|
|
|
|
|
|
|
|
|
|
|
|
Net tons sold (thousands) |
| 39.1 |
|
|
| 38.9 |
|
|
| 25.2 |
|
|
| 24.8 |
|
|
| 197.3 |
|
|
| 203.6 |
|
|
| — |
|
|
| — |
|
|
| 261.5 |
|
|
| 267.2 |
|
| 41.9 |
|
|
| 40.7 |
|
|
| 25.5 |
|
|
| 24.4 |
|
|
| 184.1 |
|
|
| 194.7 |
|
|
| — |
|
|
| — |
|
|
| 251.5 |
|
|
| 259.7 |
|
Depreciation, depletion and amortization | $ | 6.9 |
|
| $ | 6.7 |
|
| $ | 2.4 |
|
| $ | 2.2 |
|
| $ | 6.4 |
|
| $ | 6.4 |
|
| $ | 0.6 |
|
| $ | 0.5 |
|
| $ | 16.3 |
|
| $ | 15.8 |
| $ | 7.0 |
|
| $ | 7.2 |
|
| $ | 2.3 |
|
| $ | 2.4 |
|
| $ | 7.7 |
|
| $ | 6.5 |
|
| $ | 0.7 |
|
| $ | 0.7 |
|
| $ | 17.7 |
|
| $ | 16.8 |
|
Capital expenditures |
| 5.1 |
|
|
| 5.8 |
|
|
| 4.3 |
|
|
| 1.8 |
|
|
| 26.7 |
|
|
| 22.1 |
|
|
| 0.5 |
|
|
| — |
|
|
| 36.6 |
|
|
| 29.7 |
|
| 2.1 |
|
|
| 2.3 |
|
|
| 12.9 |
|
|
| 6.1 |
|
|
| 15.8 |
|
|
| 28.7 |
|
|
| 3.5 |
|
|
| — |
|
|
| 34.3 |
|
|
| 37.1 |
|
The sum of individual amounts set forth above may not agree to the consolidated financial statements included herein due to rounding.
- 3229 -
GLATFELTER
9.30.1606.30.17 Form 10-Q
Sales and Costs of Products Sold
| Three months ended September 30 |
|
|
|
|
| Three months ended June 30 |
|
|
|
|
|
| |||||||||||
In thousands | 2016 |
|
| 2015 |
|
| Change |
| 2017 |
|
|
| 2016 |
|
| Change |
|
| ||||||
Net sales | $ | 405,301 |
|
| $ | 419,960 |
|
| $ | (14,659 | ) | $ | 387,342 |
|
|
| $ | 406,413 |
|
| $ | (19,071 | ) |
|
Energy and related sales, net |
| 1,346 |
|
|
| 1,153 |
|
|
| 193 |
|
| 981 |
|
|
|
| 2,001 |
|
|
| (1,020 | ) |
|
Total revenues |
| 406,647 |
|
|
| 421,113 |
|
|
| (14,466 | ) |
| 388,323 |
|
|
|
| 408,414 |
|
|
| (20,091 | ) |
|
Costs of products sold |
| 345,477 |
|
|
| 361,205 |
|
|
| (15,728 | ) |
| 357,887 |
|
|
|
| 365,691 |
|
|
| (7,804 | ) |
|
Gross profit | $ | 61,170 |
|
| $ | 59,908 |
|
| $ | 1,262 |
| $ | 30,436 |
|
|
| $ | 42,723 |
|
| $ | (12,287 | ) |
|
Gross profit as a percent of Net sales |
| 15.1 | % |
|
| 14.3 | % |
|
|
|
|
| 7.9 | % |
|
|
| 10.5 | % |
|
|
|
|
|
The following table sets forth the contribution to consolidated net sales by each business unit:
| Three months ended September 30 |
| Three months ended June 30 |
|
| |||||||||||
Percent of Total | 2016 |
|
| 2015 |
| 2017 |
|
|
| 2016 |
|
| ||||
Business Unit |
|
|
|
|
|
|
|
|
|
|
|
|
|
|
|
|
Composite Fibers |
| 32.5 | % |
|
| 31.9 | % |
| 34.4 | % |
|
|
| 33.6 | % |
|
Advanced Airlaid Material |
| 15.3 |
|
|
| 15.0 |
|
| 16.2 |
|
|
|
| 15.0 |
|
|
Specialty Papers |
| 52.2 |
|
|
| 53.1 |
|
| 49.4 |
|
|
|
| 51.4 |
|
|
Total |
| 100.0 | % |
|
| 100.0 | % |
| 100.0 | % |
|
|
| 100.0 | % |
|
Net sales totaled $405.3$387.3 million and $420.0$406.4 million in the thirdsecond quarters of 2017 and 2016, and 2015, respectively. LowerShipping volumes declined 3.2% and selling prices and foreign currency translation unfavorably impacted the year-over-yearquarter-over-quarter comparison by $6.3$7.6 million and shipping volumes declined 2.1%.$6.0 million, respectively.
Composite Fibers’ net sales declined $2.3$3.2 million, or 1.7%2.4%, primarily due to $1.6$5.2 million of unfavorable currency translation and $2.1 million from lower selling prices. Shipping volumes increased 0.5% in the comparison.prices partially offset by higher shipping volumes.
Composite Fibers’ thirdsecond quarter of 20162017 operating income decreasedecreased slightly to $14.0$14.7 million. The primary drivers are summarized in the following chart:

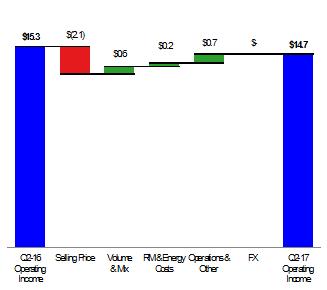
Advanced Airlaid Materials’ net sales decreased $1.3increased $2.1 million in the quarter-over-quarter comparisoncomparison. Shipping volumes increased 4.7% primarily due to $2.2 millioncontinued growth of lower selling prices. Shipping volumes increased 1.8% primarily due to higher shipments of wipes products.personal hygiene products and wipes.
Advanced Airlaid Materials’ operating income totaled $6.4$7.5 million compared with $6.8 million in the thirdsecond quarter of 2015.2016. The primary drivers are summarized in the following chart:
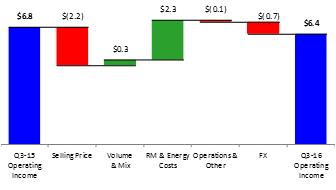
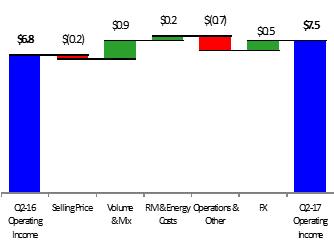
Specialty Papers’ net sales decreased $11.0$17.9 million, or 5.0%8.6%, due to a 3.15.4 % decline in shipping volumes and a $2.5$5.3 million impact from lower selling prices.
- 30 -
GLATFELTER
06.30.17 Form 10-Q
Specialty Papers’ operating incomeloss totaled $18.7$13.8 million in the thirdsecond quarter of 2016, slightly higher2017, compared with $5.8 million in the same period a year ago. The primary drivers are summarized in the following chart:
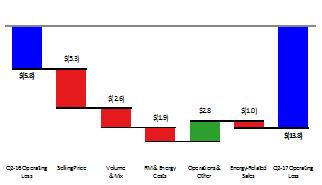
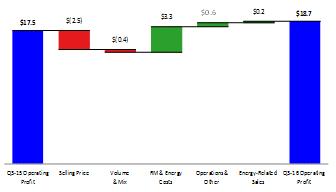
We sell excess power generated by the Spring Grove, PA facility. The following table summarizes this activity for the thirdsecond quarters of 20162017 and 2015:2016:
| Three months ended September 30 |
|
|
|
|
| Three months ended June 30 |
|
|
|
|
|
| |||||||||||
In thousands | 2016 |
|
| 2015 |
|
| Change |
| 2017 |
|
|
| 2016 |
|
| Change |
|
| ||||||
Energy sales | $ | 1,101 |
|
| $ | 1,047 |
|
| $ | 54 |
| $ | 787 |
|
|
| $ | 836 |
|
| $ | (49 | ) |
|
Costs to produce |
| (1,187 | ) |
|
| (1,131 | ) |
|
| (56 | ) |
| (929 | ) |
|
|
| (934 | ) |
|
| 5 |
|
|
Net |
| (86 | ) |
|
| (84 | ) |
|
| (2 | ) |
| (142 | ) |
|
|
| (98 | ) |
|
| (44 | ) |
|
Renewable energy credits |
| 1,432 |
|
|
| 1,237 |
|
|
| 195 |
|
| 1,123 |
|
|
|
| 2,099 |
|
|
| (976 | ) |
|
Total | $ | 1,346 |
|
| $ | 1,153 |
|
| $ | 193 |
| $ | 981 |
|
|
| $ | 2,001 |
|
| $ | (1,020 | ) |
|
Other and Unallocated The amount of net operating expenses not allocated to a business unit and reported as “Other and Unallocated” in our table of Business Unit Performance excluding gains from sales of timberlands, totaled $13.6$10.0 million in the thirdsecond quarter of 2016
- 33 -
GLATFELTER
9.30.16 Form 10-Q
2017 compared with $18.2$10.7 million in the thirdsecond quarter of 2015. The decrease was primarily due to the $10.0 million reserve for environmental matters recorded in the third quarter of 2015, partially offset by higher incentive compensation and professional service fees in 2016.
Pension Expense The following table summarizes the amounts of pension expense recognized for the periods indicated:
| Three months ended September 30 |
|
|
|
|
| Three months ended June 30 |
|
|
|
|
|
| |||||||||||
In thousands | 2016 |
|
| 2015 |
|
| Change |
| 2017 |
|
|
| 2016 |
|
| Change |
|
| ||||||
Recorded as: |
|
|
|
|
|
|
|
|
|
|
|
|
|
|
|
|
|
|
|
|
|
|
|
|
Costs of products sold | $ | 582 |
|
| $ | 1,752 |
|
| $ | (1,170 | ) | $ | 1,098 |
|
|
| $ | 742 |
|
| $ | 356 |
|
|
SG&A expense |
| 788 |
|
|
| 454 |
|
|
| 334 |
|
| 893 |
|
|
|
| 854 |
|
|
| 39 |
|
|
Total | $ | 1,370 |
|
| $ | 2,206 |
|
| $ | (836 | ) | $ | 1,991 |
|
|
| $ | 1,596 |
|
| $ | 395 |
|
|
Income taxes For the thirdsecond quarter of 2016,2017, we recorded $1.4$0.4 million of tax expensebenefit on pretax incomeloss of $21.0$6.1 million. The comparable amounts in the thirdsecond quarter of 20152016 were no taxes of $2.3 million on a pretax income of $15.8$2.0 million. The third quarter 2016change in the effective tax rate benefited by $2.4 million primarily due to investmentreflects the adverse impact of valuation allowances recorded in 2017 for deferred tax credits, release of reserves related to the completion of tax audits and changes in statutory tax rates.assets.
Foreign Currency The table below summarizes the translation impact on reported results that changes in currency exchange rates had on our non-U.S. based operations from the conversion of these operation’s results for the thirdsecond quarter of 2016.2017.
In thousands | Three months ended September 30, 2016 |
| Three months ended June 30, 2017 |
|
| |||||||
| Favorable (unfavorable) |
| Favorable (unfavorable) |
|
| |||||||
Net sales |
|
| $ | (2,153 | ) |
|
|
| $ | (6,039 | ) |
|
Costs of products sold |
|
|
| (475 | ) |
|
|
|
| 6,085 |
|
|
SG&A expenses |
|
|
| 350 |
|
|
|
|
| 476 |
|
|
Income taxes and other |
|
|
| 318 |
|
|
|
|
| 91 |
|
|
Net income |
|
| $ | (1,960 | ) |
|
|
| $ | 613 |
|
|
The above table only presents the financial reporting impact of foreign currency translations assuming currency exchange rates in 20162017 were the same as 2015.2016. It does not present the impact of certain competitive advantages or disadvantages of operating or competing in multi-currency markets.
- 31 -
GLATFELTER
06.30.17 Form 10-Q
LIQUIDITY AND CAPITAL RESOURCES
Our business is capital intensive and requires significant expenditures for new or enhanced equipment, to support our research and development efforts, for environmental compliance matters including, but not limited to, the Clean Air Act, and to support our business strategy. In addition, we have mandatory debt service requirements of both principal and
interest. The following table summarizes cash flow information for each of the periods presented:
| Nine months ended September 30 |
| Six months ended June 30 |
| |||||||||||
In thousands | 2016 |
|
| 2015 |
| 2017 |
|
|
| 2016 |
| ||||
Cash and cash equivalents at |
|
|
|
|
|
|
|
|
|
|
|
|
|
| |
beginning of period | $ | 105,304 |
|
| $ | 99,837 |
| $ | 55,444 |
|
| $ | 105,304 |
| |
Cash provided (used) by |
|
|
|
|
|
|
|
|
|
|
|
|
|
| |
Operating activities |
| 59,437 |
|
|
| 70,523 |
|
| 28,764 |
|
|
| 36,640 |
| |
Investing activities |
| (117,293 | ) |
|
| (72,923 | ) |
| (70,964 | ) |
|
| (80,638 | ) | |
Financing activities |
| 2,974 |
|
|
| (21,946 | ) |
| 52,466 |
|
|
| (3,126 | ) | |
Effect of exchange rate |
|
|
|
|
|
|
|
|
|
|
|
|
|
| |
changes on cash |
| 330 |
|
|
| (1,826 | ) |
| 3,732 |
|
|
| 352 |
| |
Net cash used |
| (54,552 | ) |
|
| (26,172 | ) | ||||||||
Net cash provided (used) |
| 13,998 |
|
|
| (46,772 | ) | ||||||||
Cash and cash equivalents at |
|
|
|
|
|
|
|
|
|
|
|
|
|
| |
end of period | $ | 50,752 |
|
| $ | 73,665 |
| $ | 69,442 |
|
| $ | 58,532 |
| |
At SeptemberJune 30, 2016,2017, we had $50.8$69.4 million in cash and cash equivalents held by both domestic and foreign subsidiaries. Unremitted earnings of our foreign subsidiaries are deemed to be indefinitely reinvested; however, asreinvested and therefore no U.S. tax liability is reflected in the accompanying condensed consolidated financial statements. As of SeptemberJune 30, 2016,2017, the majority of our cash and cash equivalents is either held by domestic entities or is available for use domestically.our international subsidiaries and the repatriation of such funds would result in additional tax liability. In addition to our cash and cash equivalents, $227.8$104.4 million is available under our revolving credit agreement, which matures in March 2020.
Cash provided by operating activities totaled $59.4$28.8 million in the first ninesix months of 20162017 compared with $70.5$36.6 million in the same period a year ago. The decrease in cash from operations primarily reflects an increase in cash used for working capital partially offset by improvedlower operating income.
Net cash used by investing activities increaseddecreased by $44.4$9.7 million in the year-over-year comparison primarily due to lower capital expenditures for Specialty Papers’ environmental compliance and Advanced Airlaid Materials’ capacity expansion projects which totaled $73.6 million in 2016 compared to $19.0 million in 2015.expenditures. Capital expenditures are expected to total between $155$130 million and $170$140 million for 2016,2017, including approximately $55 million to $60$10 million for the Specialty Papers’ environmental compliance projects and $40$43 million to $45$48 million for the Airlaid capacity expansion.
Net cash provided by financing activities totaled $3.0$52.5 million in the first ninesix months of 20162017 compared with a use of $21.9$3.1 million in the same period of 2015.2016. The increase in cash provided by financing activities primarily reflects additional term loan borrowings and receipt of $5.3 million of government grants primarily related tounder our Airlaid capacity expansion and Specialty Papers’ compliance projects.credit agreement.
- 34 -
GLATFELTER
9.30.16 Form 10-Q
The following table sets forth our outstanding long-term indebtedness:
| September 30 |
|
| December 31 |
| June 30 |
|
| December 31 |
| |||||
In thousands | 2016 |
|
| 2015 |
| 2017 |
|
| 2016 |
| |||||
Revolving credit facility, due Mar. 2020 | $ | 59,830 |
|
| $ | 58,792 |
| $ | 130,000 |
|
|
| $ | 61,595 |
|
5.375% Notes, due Oct. 2020 |
| 250,000 |
|
|
| 250,000 |
|
| 250,000 |
|
|
|
| 250,000 |
|
2.40% Term Loan, due Jun. 2022 |
| 9,566 |
|
|
| 10,109 |
|
| 8,151 |
|
|
|
| 8,282 |
|
2.05% Term Loan, due Mar. 2023 |
| 40,210 |
|
|
| 42,130 |
|
| 35,023 |
|
|
|
| 35,163 |
|
1.30% Term Loan, due Jun. 2023 |
| 11,161 |
|
|
| - |
|
| 9,781 |
|
|
|
| 9,788 |
|
1.55% Term Loan, due Sep. 2025 |
| 10,941 |
|
|
| 2,839 |
|
| 11,187 |
|
|
|
| 10,333 |
|
Total long-term debt |
| 381,708 |
|
|
| 363,870 |
|
| 444,142 |
|
|
|
| 375,161 |
|
Less current portion |
| (11,432 | ) |
|
| (7,366 | ) |
| (10,400 | ) |
|
|
| (8,961 | ) |
Unamortized deferred issuance costs |
| (2,727 | ) |
|
| (3,208 | ) |
| (2,248 | ) |
|
|
| (2,553 | ) |
Long-term debt, net of current portion | $ | 367,549 |
|
| $ | 353,296 |
| $ | 431,494 |
|
|
| $ | 363,647 |
|
Our revolving credit facility contains a number of customary compliance covenants, the most restrictive of which is a maximum leverage ratio of 3.5x. As of SeptemberJune 30, 2016,2017, the leverage ratio, as calculated in accordance with the definition in our amended credit agreement, was 2.1x,2.6x, within the limits set forth in our credit agreement. Based on our expectations of future results of operations and capital needs, we do not believe the debt covenants will impact our operations or limit our ability to undertake financings that may be necessary to meet our capital needs.
The 5.375% Notes contain cross default provisions that could result in all such notes becoming due and payable in the event of a failure to repay debt outstanding under the credit agreement at maturity, or a default under the credit agreement that accelerates the debt outstanding thereunder. As of SeptemberJune 30, 2016,2017, we met all of the requirements of our debt covenants. The significant terms of the debt instruments are more fully discussed in Item 1 - Financial Statements – Note 9.
Financing activities includes cash used for common stock dividends which increased in the comparison reflecting a 4% increase in our quarterly cash dividend. In the first ninesix months of 2016,2017, we used $16.1$11.1 million of cash for dividends on our common stock compared with $15.2$10.7 million in the same period of 2015.2016. Our Board of Directors determines what, if any, dividends will be paid to our shareholders. Dividend payment decisions are based upon then-existing factors and conditions and, therefore, historical trends of dividend payments are not necessarily indicative of future payments.
We are subject to various federal, state and local laws and regulations intended to protect the environment as well as human health and safety. At various times, we have incurred significant costs to comply with these regulations and we could incur additional costs as new regulations are developed or regulatory priorities change. We will incur material capital costs to comply with new air quality regulations including the
- 32 -
GLATFELTER
06.30.17 Form 10-Q
U.S. EPA Best Available Retrofit Technology rule (BART; otherwise known as the Regional Haze Rule) and the Boiler Maximum Achievable Control Technology rule (Boiler MACT). These rules will require process modifications and/or installation of air pollution controls on boilers at two of our facilities. We are converting or replacing five coal-fired boilers to natural gas and upgrading site infrastructure to accommodate the new boilers, including connecting to gas pipelines. Net of government grants, the total cost of these projects is estimated at $95 million to $100 million, of which approximately $82.9 million has been incurred through the end of the third quarter of 2016. The balance of the related spending will be substantially completed in 2016.
As more fully discussed in Item 1 - Financial Statements – Note 12 – Commitments, Contingencies and Legal Proceedings (“Note 12”), we are involved in the Lower Fox River in Wisconsin (the “Fox River”), an EPA Superfund site for which we remain potentially liable for contributions tocertain response costs and long-term monitoring and maintenance related matters. Based on the clean-up activity. During 2015, we used $9.7 million and expect to spend less than $5.0 millionrecent developments more fully discussed in 2016 for remediation activities. ItNote 12, it is conceivable wethe resolution of this matter may needrequire us to fund amountsspend in excess of this to fund a portion of$29.5 million in the on-going costs beyond 2016.next twelve months. Although we are unable to determine with any degree of certainty the amount we may be required to fund for interim remediation work, such amounts couldspend, other than a $9.5 million payment to be significant. The ultimate allocationmade in August 2017, related to the settlement with Georgia Pacific, the recent developments provide greater clarity to the extent of such costs is the subject of extensive ongoing litigation amongst three potentially responsible parties. See Note 12 for a summary of significant environmental matters.amounts.
During 2016, we expect our use of cash for capital expenditures, strategic investments and environmental compliance projects will exceed cash generated from operations. We expect to meet all of our near and long-term cash needs from a combination of operating cash flow, cash and cash equivalents, our existing credit facility and other long-term debt. However, as discussed in Note 12, an unfavorable outcome of the Fox River matters could have a material adverse impact on our consolidated financial position, liquidity and/or results of operations.
- 35 -
GLATFELTER
9.30.16 Form 10-Q
Off-Balance-Sheet Arrangements As of SeptemberJune 30, 20162017 and December 31, 2015,2016, we had not entered into any off-balance-sheet arrangements. Financial derivative instruments, to which we are a party, and guarantees of indebtedness, which solely consist of obligations of subsidiaries, are reflected in the condensed consolidated balance sheets included herein in Item 1 – Financial Statements.
Outlook Composite Fibers’ shipping volumes in the fourththird quarter of 20162017 are expected to be approximately 5% lower3% higher than the second quarter. Selling prices are expected to be in-line with the second quarter while raw material and energy prices are expected to be slightly higher. In addition, we expect this business unit to incur approximately $1 million of less market related downtime in the third quarter driven by lower sales of metalized products.than the second quarter.
Advanced Airlaid Materials’ shipping volumes in the third quarter are expected to be approximately 2% higher than the second quarter. Selling prices and raw material and energy prices are expected to be in-lineincrease slightly compared with the thirdsecond quarter. We anticipate the impact of machine downtime to reduce inventory levels will be largely offset by cost reduction initiatives.
Advanced Airlaid Materials’Specialty Papers’ shipping volumes in the third quarter are expected to be approximately 5% higher than the second quarter of 2017. Selling prices are expected to decline slightly compared with the third quarter. Customer selling prices and raw material and energy prices are expected to be in-lineup slightly. In addition, we expect to incur $2 million to $3 million of less market related downtime in the third quarter than the second quarter. Specialty Papers will also benefit
about $1 million from the cost reduction actions recently announced.
In connection with our cost reduction actions within Specialty Papers, we expect to record one-time charges of approximately $8 million to $9 million primarily during the third quarter, of which approximately $5 million to $6 million will be non-cash. In addition, costs associated with the third quarter.
For Specialty Papers shipping volumes in the fourth quarterenvironmental compliance projects and Advanced Airlaid Materials capacity expansion are expected to be in line with the third quarter. Lower selling prices$1 million and mix changes$4 million, respectively.
Consolidated capital expenditures are expected to reduce operating profit by approximately $5 million. total between $130 million and $140 million for 2017 and approximate between $62 million and $72 million in 2018.
The impact of machine downtime to reduce inventory levelseffective tax rate on adjusted earnings is expected to be offset by lower maintenance costs. Raw material and energy prices are expected to increase moderately.approximately 35% for the second half of 2017.
- 3633 -
GLATFELTER
9.30.1606.30.17 Form 10-Q
ITEM 3. QUANTITATIVE AND QUALITATIVE DISCLOSURES ABOUT MARKET RISKS
| Year Ended December 31 |
|
| September 30, 2016 |
|
| Year Ended December 31 |
|
| June 30, 2017 |
| ||||||||||||||||||||||||||||||||||||||||||||
Dollars in thousands | 2017 |
|
| 2018 |
|
| 2019 |
|
| 2020 |
|
| 2021 |
|
| Carrying Value |
|
| Fair Value |
|
| 2017 |
|
| 2018 |
|
| 2019 |
|
| 2020 |
|
| 2021 |
|
| Carrying Value |
|
| Fair Value |
| ||||||||||||||
Long-term debt |
|
|
|
|
|
|
|
|
|
|
|
|
|
|
|
|
|
|
|
|
|
|
|
|
|
|
|
|
|
|
|
|
|
|
|
|
|
|
|
|
|
|
|
|
|
|
|
|
|
|
|
|
|
|
|
Average principal outstanding |
|
|
|
|
|
|
|
|
|
|
|
|
|
|
|
|
|
|
|
|
|
|
|
|
|
|
|
|
|
|
|
|
|
|
|
|
|
|
|
|
|
|
|
|
|
|
|
|
|
|
|
|
|
|
|
At fixed interest rates – Bond | $ | 250,000 |
|
| $ | 250,000 |
|
| $ | 250,000 |
|
| $ | 250,000 |
|
| $ | 250,000 |
|
| $ | 250,000 |
|
| $ | 252,658 |
|
| $ | 250,000 |
|
| $ | 250,000 |
|
| $ | 250,000 |
|
| $ | 218,750 |
|
| $ | — |
|
| $ | 250,000 |
|
| $ | 256,623 |
|
At fixed interest rates – Term Loans |
| 62,732 |
|
|
| 52,903 |
|
|
| 42,389 |
|
|
| 31,876 |
|
|
| 21,362 |
|
|
| 71,878 |
|
|
| 68,709 |
|
|
| 61,805 |
|
|
| 54,091 |
|
|
| 43,342 |
|
|
| 32,592 |
|
|
| 21,841 |
|
|
| 64,142 |
|
|
| 64,734 |
|
At variable interest rates |
| 59,830 |
|
|
| 59,830 |
|
|
| 59,830 |
|
|
| 59,830 |
|
|
| 59,830 |
|
|
| 59,830 |
|
|
| 59,830 |
|
|
| 130,000 |
|
|
| 130,000 |
|
|
| 130,000 |
|
|
| 27,083 |
|
|
| — |
|
|
| 130,000 |
|
|
| 130,000 |
|
|
|
|
|
|
|
|
|
|
|
|
|
|
|
|
|
|
|
|
|
| $ | 381,708 |
|
| $ | 381,197 |
|
|
|
|
|
|
|
|
|
|
|
|
|
|
|
|
|
|
|
|
|
| $ | 444,142 |
|
| $ | 451,357 |
|
Weighted-average interest rate |
|
|
|
|
|
|
|
|
|
|
|
|
|
|
|
|
|
|
|
|
|
|
|
|
|
|
|
|
|
|
|
|
|
|
|
|
|
|
|
|
|
|
|
|
|
|
|
|
|
|
|
|
|
|
|
On fixed rate debt – Bond |
| 5.375 | % |
|
| 5.375 | % |
|
| 5.375 | % |
|
| 5.375 | % |
|
| 5.375 | % |
|
|
|
|
|
|
|
|
|
| 5.375 | % |
|
| 5.375 | % |
|
| 5.375 | % |
|
| 5.375 | % |
|
| 5.375 | % |
|
|
|
|
|
|
|
|
On fixed rate debt – Term Loans |
| 2.17 | % |
|
| 2.17 | % |
|
| 2.17 | % |
|
| 2.17 | % |
|
| 2.17 | % |
|
|
|
|
|
|
|
|
|
| 1.89 | % |
|
| 1.89 | % |
|
| 1.88 | % |
|
| 1.86 | % |
|
| 1.82 | % |
|
|
|
|
|
|
|
|
On variable rate debt |
| 1.25 | % |
|
| 1.25 | % |
|
| 1.25 | % |
|
| 1.25 | % |
|
| 1.25 | % |
|
|
|
|
|
|
|
|
|
| 2.72 | % |
|
| 2.72 | % |
|
| 2.72 | % |
|
| 2.72 | % |
|
| 2.72 | % |
|
|
|
|
|
|
|
|
The table above presents the average principal outstanding and related interest rates for the next five years for debt outstanding as of SeptemberJune 30, 2016.2017. Fair values included herein have been determined based upon rates currently available to us for debt with similar terms and remaining maturities.
Our market risk exposure primarily results from changes in interest rates and currency exchange rates. At SeptemberJune 30, 2016,2017, we had $379.0$441.9 million of long-term debt, net of unamortized debt issuance costs, of which 15.8%29.4% was at variable interest rates. Variable-rate debt outstanding represents borrowings under our revolving credit agreement that accrues interest based on LIBOR plus a margin. At SeptemberJune 30, 2016,2017, the interest rate paid was approximately 1.25%2.72%. A hypothetical 100 basis point increase or decrease in the interest rate on variable rate debt would increase or decrease annual interest expense by $0.6$1.3 million.
As part of our overall risk management practices, we enter into financial derivatives primarily designed to either i) hedge foreign currency risks associated with forecasted transactions – “cash flow hedges”; or ii) mitigate the impact that changes in currency exchange rates have on intercompany financing transactions and foreign currency denominated receivables and payables – “foreign currency hedges.” For a more complete discussion of this activity, refer to Item 1 – Financial Statements – Note 11.
We are subject to certain risks associated with changes in foreign currency exchange rates to the extent our operations are conducted in currencies other than the U.S. Dollar. On an annual basis, our euro denominated revenue exceeds euro expenses by approximately €120€125 million to €130 million. With respect to the British Pound Sterling, Canadian dollar, and Philippine Peso, we have differing amounts of inflows and outflows of these currencies, although to a lesser degree than the euro. As a result, particularly with respect to the euro, we are exposed to changes in currency exchange rates and such changes could be significant.
ITEM 4. CONTROLS AND PROCEDURES
Evaluation of Disclosure Controls and Procedures Our chief executive officer and our principal financial officer, after evaluating the effectiveness of our disclosure controls and procedures (as defined in Exchange Act Rules 13a-15(e) and 15d-15(e)) as of SeptemberJune 30, 2016,2017, have concluded that, as of the evaluation date, our disclosure controls and procedures are effective.
Changes in Internal Controls During the second quarter of 2017, we completed the conversion of the payroll processing system for our U.S.-based operations provided by an outsourced service provider. There were no other changes in our internal control over financial reporting during the three months ended SeptemberJune 30, 2016,2017, that have materially affected or are reasonably likely to materially affect our internal control over financial reporting.
- 3734 -
GLATFELTER
9.30.1606.30.17 Form 10-Q
The following exhibits are filed herewith or incorporated by reference as indicated.
10.1 | Schedule of Change in Control Employment Agreement, filed herewith ** |
31.1 | Certification of Dante C. Parrini, Chairman and Chief Executive Officer of Glatfelter, pursuant to Section 302(a) of the Sarbanes-Oxley Act of |
|
|
31.2 | Certification of John P. Jacunski, Executive Vice President and Chief Financial Officer, |
|
|
32.1 | Certification of Dante C. Parrini, Chairman and Chief Executive Officer of Glatfelter, pursuant to Section 906 of the Sarbanes-Oxley Act of 2002, 18 U.S.C. Section |
|
|
32.2 | Certification of John P. Jacunski, Executive Vice President and Chief Financial Officer, |
|
|
101.INS | XBRL Instance Document, filed herewith |
|
|
101.SCH | XBRL Taxonomy Extension Schema, filed herewith |
|
|
101.CAL | XBRL Extension Calculation Linkbase, filed herewith |
|
|
101.DEF | XBRL Extension Definition Linkbase, filed herewith |
|
|
101.LAB | XBRL Extension Label Linkbase, filed herewith |
|
|
101.PRE | XBRL Extension Presentation Linkbase, filed herewith |
** | Management compensatory contract |
Pursuant to the requirements of Section 13 or 15(d) of the Securities Exchange Act of 1934, the Registrant has duly caused this report to be signed on its behalf by the undersigned, thereunto duly authorized.
| P. H. GLATFELTER COMPANY (Registrant) | ||
|
|
|
|
|
|
|
|
|
|
|
|
| By |
| /s/ David C. Elder |
|
|
| David C. Elder |
|
|
| Vice President, Finance |
- 3835 -
GLATFELTER
9.30.1606.30.17 Form 10-Q
|
| |
| Schedule of Change in Control Employment Agreement, filed herewith ** | |
|
| |
31.1 | Certification of Dante C. Parrini, Chairman and Chief Executive Officer of Glatfelter, pursuant to Section 302(a) of the Sarbanes-Oxley Act of 2002, | |
|
| |
31.2 | Certification of John P. Jacunski, Executive Vice President and Chief Financial Officer, | |
|
| |
32.1 | Certification of Dante C. Parrini, Chairman and Chief Executive Officer of Glatfelter, pursuant to Section 906 of the Sarbanes-Oxley Act of 2002, | |
|
| |
32.2 | Certification of John P. Jacunski, Executive Vice President and Chief Financial Officer, | |
|
| |
101.INS | XBRL Instance Document, filed herewith | |
|
| |
101.SCH | XBRL Taxonomy Extension Schema, filed herewith | |
|
| |
101.CAL | XBRL Extension Calculation Linkbase, filed herewith | |
|
| |
101.DEF | XBRL Extension Definition Linkbase, filed herewith | |
|
| |
101.LAB | XBRL Extension Label Linkbase, filed herewith | |
|
| |
101.PRE | XBRL Extension Presentation Linkbase, filed herewith | |
** | Management compensatory contract |
- 3936 -
GLATFELTER
9.30.1606.30.17 Form 10-Q