
UNITED STATES
SECURITIES AND EXCHANGE COMMISSION
Washington, D.C. 20549
FORM 10-Q
☒ | QUARTERLY REPORT PURSUANT TO SECTION 13 OR 15(d) OF THE SECURITIES EXCHANGE ACT OF 1934 |
For the quarterly period ended June 30, 20172018
☐ | TRANSITION REPORT PURSUANT TO SECTION 13 OR 15(d) OF THE SECURITIES EXCHANGE ACT OF 1934 |
For the transition period from ______________ to ______________
Commission File Number: 001-13545 (Prologis, Inc.) 001-14245 (Prologis, L.P.)
Prologis, Inc.
Prologis, L.P.
(Exact name of registrant as specified in its charter)
Maryland (Prologis, Inc.) Delaware (Prologis, L.P.) |
| 94-3281941 (Prologis, Inc.) 94-3285362 (Prologis, L.P.) |
(State or other jurisdiction of incorporation or organization) |
| (I.R.S. Employer Identification No.) |
|
|
|
Pier 1, Bay 1, San Francisco, California |
| 94111 |
(Address or principal executive offices) |
| (Zip Code) |
(415) 394-9000
(Registrants’ telephone number, including area code)
(Former name, former address and former fiscal year, if changed since last report)
Indicate by check mark whether the registrant (1) has filed all reports required to be filed by Section 13 or 15(d) of the Securities Exchange Act of 1934 during the preceding 12 months (or for such shorter period that the registrant was required to file such reports), and (2) has been subject to such filing for the past 90 days.
Prologis, Inc. | Yes | ☒ | No | ☐ |
Prologis, L.P. | Yes | ☒ | No | ☐ |
Indicate by check mark whether the registrant has submitted electronically and posted on its corporate website; if any, every Interactive Data File required to be submitted and posted pursuant to Rule 405 of Regulation S-T (§232.405 of this chapter) during the preceding 12 months (or for such shorter periods that the registrant was required to submit and post such files).
Prologis, Inc. | Yes | ☒ | No | ☐ |
Prologis, L.P. | Yes | ☒ | No | ☐ |
Indicate by check mark whether the registrant is a large accelerated filer, an accelerated filer, a non-accelerated filer, or a smaller reporting company, or an emerging growth company. See definitions of “large accelerated filer”, “accelerated filer” andfiler,” “smaller reporting company,” and “emerging growth company” in Rule 12b-2 of the Exchange Act (check one):
Prologis, Inc.: |
|
|
|
|
|
Large accelerated filer ☒ |
| Accelerated filer ☐ | Non-accelerated filer ☐ | Smaller reporting company ☐ | Emerging growth company ☐ |
|
| (Do not check if a smaller reporting company) |
|
| |
Prologis, L.P.: |
|
|
|
|
|
Large accelerated filer ☐ |
| Accelerated filer ☐ | Non-accelerated filer ☒ | Smaller reporting company ☐ | Emerging growth company ☐ |
|
| (Do not check if a smaller reporting company) |
|
| |
If an emerging growth company, indicate by check mark if the registrant has elected not to use the extended transition period for complying with any new or revised financial accounting standards provided pursuant to Section 13(a) of the Exchange Act. ☐
Indicate by check mark whether the registrant is a shell company (as defined in Rule 12b-2 of the Securities Exchange Act of 1934).
Prologis, Inc. | Yes | ☐ | No | ☒ |
Prologis, L.P. | Yes | ☐ | No | ☒ |
The number of shares of Prologis, Inc.’s common stock outstanding at July 24, 2017,19, 2018, was approximately 531,863,000.533,307,000.
This report combines the quarterly reports on Form 10-Q for the period ended June 30, 2017,2018, of Prologis, Inc. and Prologis, L.P. Unless stated otherwise or the context otherwise requires, references to “Prologis, Inc.” or the “Parent” mean Prologis, Inc. and its consolidated subsidiaries; and references to “Prologis, L.P.” or the “Operating Partnership” or the “OP” mean Prologis, L.P., and its consolidated subsidiaries. The terms “the Company,” “Prologis,” “we,” “our” or “us” means the Parent and the Operating PartnershipOP collectively.
The Parent is a real estate investment trust (“REIT”(a “REIT”) and the general partner of the Operating Partnership.OP. At June 30, 2017,2018, the Parent owned an approximate 97.33%97.11% common general partnership interest in the Operating PartnershipOP and 100% of the preferred units in the Operating Partnership.OP. The remaining approximate 2.67%2.89% common limited partnership interests are owned by nonaffiliatedunaffiliated investors and certain current and former directors and officers of the Parent. As the sole general partner of the Operating Partnership, the Parent has complete responsibility and discretion in the day-to-day management and control of the Operating Partnership.
We operate the Parent and the Operating PartnershipOP as one enterprise. The management of the Parent consists of the same members as the management of the Operating Partnership.OP. These members are officers of the Parent and employees of the Operating PartnershipOP or one of its subsidiaries. As sole general partner, withthe Parent has control of the Operating Partnership,OP through complete responsibility and discretion in the Parentday-to-day management and therefore, consolidates the Operating PartnershipOP for financial reporting purposes. Because the only significant asset of the Parent is its investment in the Operating Partnership,OP, the assets and liabilities of the Parent and the Operating PartnershipOP are the same on their respective financial statements.
We believe combining the quarterly reports on Form 10-Q of the Parent and the Operating PartnershipOP into this single report results in the following benefits:
enhances investors’ understanding of the Parent and the Operating PartnershipOP by enabling investors to view the business as a whole in the same manner as management views and operates the business;
eliminates duplicative disclosure and provides a more streamlined and readable presentation as a substantial portion of the Company’s disclosure applies to both the Parent and the Operating Partnership;OP; and
creates time and cost efficiencies through the preparation of one combined report instead of two separate reports.
It is important to understand the few differences between the Parent and the Operating PartnershipOP in the context of how we operate the Company. The Parent does not conduct business itself, other than acting as the sole general partner of the Operating PartnershipOP and issuing public equity from time to time. The Parent itself does not incur any indebtedness, but it guarantees the unsecured debt of the Operating Partnership.OP. The Operating PartnershipOP holds substantially all the assets of the business, directly or indirectly, and holds the ownership interests in the Company’s investment in certain entities.indirectly. The Operating PartnershipOP conducts the operations of the business and is structured as a partnership with no publicly traded equity. Except for net proceeds from equity issuances by the Parent, which are contributed to the Operating PartnershipOP in exchange for partnership units, the Operating PartnershipOP generates capital required by the business through the Operating Partnership’sOP’s operations, incurrence of indebtedness and issuance of partnership units to third parties.
The presentation of noncontrolling interests, stockholders’ equity and partners’ capital are the main areas of difference between the consolidated financial statements of the Parent and those of the Operating Partnership. OP. The differences in the presentations between stockholders’ equity and partners’ capital result from the differences in the equity and capital issuances in the Parent and in the OP.
The preferred stock, common stock, additional paid-in capital, accumulated other comprehensive lossincome (loss) and distributions in excess of net earnings of the Parent are presented as stockholders’ equity in the Parent’s consolidated financial statements. These items represent the common and preferred general partnership interests held by the Parent in the Operating PartnershipOP and are presented as general partner’s capital within partners’ capital in the Operating Partnership’sOP’s consolidated financial statements. The common limited partnership interests held by the limited partners in the Operating PartnershipOP are presented as noncontrolling interest within equity in the Parent’s consolidated financial statements and as limited partners’ capital within partners’ capital in the Operating Partnership’sOP’s consolidated financial statements. The differences in the presentations between stockholders’ equity and partners’ capital result from the differences in the equity and capital issuances at the Parent and Operating Partnership levels.
To highlight the differences between the Parent and the Operating Partnership,OP, separate sections in this report, as applicable, individually discuss the Parent and the Operating Partnership,OP, including separate financial statements and separate Exhibit 31 and 32 certifications. In the sections that combine disclosure of the Parent and the Operating Partnership,OP, this report refers to actions or holdings as being actions or holdings of Prologis.
INDEX
PROLOGIS, INC.
(In thousands, except per share data)
|
|
|
|
|
|
|
|
|
|
|
|
|
|
|
| June 30, 2017 |
|
| December 31, |
| June 30, 2018 |
|
| December 31, |
| ||||
| (Unaudited) |
|
| 2016 |
| (Unaudited) |
|
| 2017 |
| ||||
ASSETS |
|
|
|
|
|
|
|
|
|
|
|
|
|
|
Investments in real estate properties | $ | 27,501,284 |
|
| $ | 27,119,330 |
| $ | 25,555,343 |
|
| $ | 25,838,644 |
|
Less accumulated depreciation |
| 4,026,369 |
|
|
| 3,758,372 |
|
| 4,283,877 |
|
|
| 4,059,348 |
|
Net investments in real estate properties |
| 23,474,915 |
|
|
| 23,360,958 |
|
| 21,271,466 |
|
|
| 21,779,296 |
|
Investments in and advances to unconsolidated entities |
| 4,617,724 |
|
|
| 4,230,429 |
|
| 5,414,623 |
|
|
| 5,496,450 |
|
Assets held for sale or contribution |
| 350,987 |
|
|
| 322,139 |
|
| 892,546 |
|
|
| 342,060 |
|
Notes receivable backed by real estate |
| 19,536 |
|
|
| 32,100 |
|
| - |
|
|
| 34,260 |
|
Net investments in real estate |
| 28,463,162 |
|
|
| 27,945,626 |
|
| 27,578,635 |
|
|
| 27,652,066 |
|
|
|
|
|
|
|
|
|
|
|
|
|
|
|
|
Cash and cash equivalents |
| 271,354 |
|
|
| 807,316 |
|
| 527,830 |
|
|
| 447,046 |
|
Other assets |
| 1,415,879 |
|
|
| 1,496,990 |
|
| 1,396,417 |
|
|
| 1,381,963 |
|
Total assets | $ | 30,150,395 |
|
| $ | 30,249,932 |
| $ | 29,502,882 |
|
| $ | 29,481,075 |
|
|
|
|
|
|
|
|
|
|
|
|
|
|
|
|
LIABILITIES AND EQUITY |
|
|
|
|
|
|
|
|
|
|
|
|
|
|
Liabilities: |
|
|
|
|
|
|
|
|
|
|
|
|
|
|
Debt | $ | 11,081,922 |
|
| $ | 10,608,294 |
| $ | 9,427,124 |
|
| $ | 9,412,631 |
|
Accounts payable and accrued expenses |
| 554,775 |
|
|
| 556,179 |
|
| 719,679 |
|
|
| 702,804 |
|
Other liabilities |
| 653,460 |
|
|
| 627,319 |
|
| 629,576 |
|
|
| 659,899 |
|
Total liabilities |
| 12,290,157 |
|
|
| 11,791,792 |
|
| 10,776,379 |
|
|
| 10,775,334 |
|
|
|
|
|
|
|
|
|
|
|
|
|
|
|
|
Equity: |
|
|
|
|
|
|
|
|
|
|
|
|
|
|
Prologis, Inc. stockholders’ equity: |
|
|
|
|
|
|
|
|
|
|
|
|
|
|
Series Q preferred stock at stated liquidation preference of $50 per share: $0.01 par value; 1,565 shares issued and outstanding and 100,000 preferred shares authorized at June 30, 2017, and December 31, 2016 |
| 78,235 |
|
|
| 78,235 |
| |||||||
Common stock: $0.01 par value; 531,338 shares and 528,671 shares issued and outstanding at June 30, 2017, and December 31, 2016, respectively |
| 5,313 |
|
|
| 5,287 |
| |||||||
Series Q preferred stock at stated liquidation preference of $50 per share; $0.01 par value; 1,379 shares issued and outstanding and 100,000 preferred shares authorized at June 30, 2018 and December 31, 2017, respectively |
| 68,948 |
|
|
| 68,948 |
| |||||||
Common stock; $0.01 par value; 533,303 shares and 532,186 shares issued and outstanding at June 30, 2018 and December 31, 2017, respectively |
| 5,333 |
|
|
| 5,322 |
| |||||||
Additional paid-in capital |
| 19,305,197 |
|
|
| 19,455,039 |
|
| 19,322,016 |
|
|
| 19,363,007 |
|
Accumulated other comprehensive loss |
| (934,196 | ) |
|
| (937,473 | ) |
| (1,041,486 | ) |
|
| (901,658 | ) |
Distributions in excess of net earnings |
| (3,607,253 | ) |
|
| (3,610,007 | ) |
| (2,716,241 | ) |
|
| (2,904,461 | ) |
Total Prologis, Inc. stockholders’ equity |
| 14,847,296 |
|
|
| 14,991,081 |
|
| 15,638,570 |
|
|
| 15,631,158 |
|
Noncontrolling interests |
| 3,012,942 |
|
|
| 3,467,059 |
|
| 3,087,933 |
|
|
| 3,074,583 |
|
Total equity |
| 17,860,238 |
|
|
| 18,458,140 |
|
| 18,726,503 |
|
|
| 18,705,741 |
|
Total liabilities and equity | $ | 30,150,395 |
|
| $ | 30,249,932 |
| $ | 29,502,882 |
|
| $ | 29,481,075 |
|
The accompanying notes are an integral part of these Consolidated Financial Statements.
CONSOLIDATED STATEMENTS OF INCOME
(Unaudited)
(In thousands, except per share amounts)
|
| Three Months Ended |
|
| Six Months Ended |
|
| Three Months Ended |
|
| Six Months Ended |
| ||||||||||||||||||||
|
| June 30, |
|
| June 30, |
|
| June 30, |
|
| June 30, |
| ||||||||||||||||||||
|
| 2017 |
|
| 2016 |
|
| 2017 |
|
| 2016 |
|
| 2018 |
|
| 2017 |
|
| 2018 |
|
| 2017 |
| ||||||||
Revenues: |
|
|
|
|
|
|
|
|
|
|
|
|
|
|
|
|
|
|
|
|
|
|
|
|
|
|
|
|
|
|
|
|
Rental |
| $ | 447,960 |
|
| $ | 426,150 |
|
| $ | 887,844 |
|
| $ | 863,254 |
|
| $ | 426,549 |
|
| $ | 447,960 |
|
| $ | 854,450 |
|
| $ | 887,844 |
|
Rental recoveries |
|
| 128,417 |
|
|
| 119,981 |
|
|
| 255,466 |
|
|
| 236,993 |
|
|
| 118,130 |
|
|
| 128,417 |
|
|
| 246,172 |
|
|
| 255,466 |
|
Strategic capital |
|
| 180,654 |
|
|
| 53,535 |
|
|
| 237,699 |
|
|
| 104,538 |
|
|
| 75,697 |
|
|
| 180,654 |
|
|
| 208,658 |
|
|
| 237,699 |
|
Development management and other |
|
| 9,152 |
|
|
| 2,489 |
|
|
| 14,329 |
|
|
| 3,670 |
|
|
| 900 |
|
|
| 9,152 |
|
|
| 5,652 |
|
|
| 14,329 |
|
Total revenues |
|
| 766,183 |
|
|
| 602,155 |
|
|
| 1,395,338 |
|
|
| 1,208,455 |
|
|
| 621,276 |
|
|
| 766,183 |
|
|
| 1,314,932 |
|
|
| 1,395,338 |
|
Expenses: |
|
|
|
|
|
|
|
|
|
|
|
|
|
|
|
|
|
|
|
|
|
|
|
|
|
|
|
|
|
|
|
|
Rental |
|
| 147,794 |
|
|
| 140,725 |
|
|
| 300,450 |
|
|
| 287,306 |
|
|
| 133,329 |
|
|
| 147,794 |
|
|
| 276,270 |
|
|
| 300,450 |
|
Strategic capital |
|
| 51,986 |
|
|
| 27,866 |
|
|
| 83,785 |
|
|
| 53,159 |
|
|
| 34,850 |
|
|
| 51,986 |
|
|
| 78,710 |
|
|
| 83,785 |
|
General and administrative |
|
| 60,077 |
|
|
| 56,934 |
|
|
| 113,694 |
|
|
| 107,477 |
|
|
| 57,615 |
|
|
| 60,077 |
|
|
| 120,043 |
|
|
| 113,694 |
|
Depreciation and amortization |
|
| 228,145 |
|
|
| 230,382 |
|
|
| 454,736 |
|
|
| 480,382 |
|
|
| 203,673 |
|
|
| 228,145 |
|
|
| 407,754 |
|
|
| 454,736 |
|
Other |
|
| 2,909 |
|
|
| 3,900 |
|
|
| 5,515 |
|
|
| 8,585 |
|
|
| 4,515 |
|
|
| 2,909 |
|
|
| 7,754 |
|
|
| 5,515 |
|
Total expenses |
|
| 490,911 |
|
|
| 459,807 |
|
|
| 958,180 |
|
|
| 936,909 |
|
|
| 433,982 |
|
|
| 490,911 |
|
|
| 890,531 |
|
|
| 958,180 |
|
|
|
|
|
|
|
|
|
|
|
|
|
|
|
|
|
|
|
|
|
|
|
|
|
|
|
|
|
|
|
|
|
|
Operating income |
|
| 275,272 |
|
|
| 142,348 |
|
|
| 437,158 |
|
|
| 271,546 |
|
|
| 187,294 |
|
|
| 275,272 |
|
|
| 424,401 |
|
|
| 437,158 |
|
|
|
|
|
|
|
|
|
|
|
|
|
|
|
|
|
|
|
|
|
|
|
|
|
|
|
|
|
|
|
|
|
|
Other income (expense): |
|
|
|
|
|
|
|
|
|
|
|
|
|
|
|
|
|
|
|
|
|
|
|
|
|
|
|
|
|
|
|
|
Earnings from unconsolidated entities, net |
|
| 68,596 |
|
|
| 41,454 |
|
|
| 117,201 |
|
|
| 99,765 |
|
|
| 62,549 |
|
|
| 68,596 |
|
|
| 125,205 |
|
|
| 117,201 |
|
Interest expense |
|
| (75,354 | ) |
|
| (76,455 | ) |
|
| (148,266 | ) |
|
| (157,267 | ) |
|
| (56,314 | ) |
|
| (75,354 | ) |
|
| (102,575 | ) |
|
| (148,266 | ) |
Interest and other income, net |
|
| 1,892 |
|
|
| 1,527 |
|
|
| 4,677 |
|
|
| 4,118 |
|
|
| 5,641 |
|
|
| 1,892 |
|
|
| 7,617 |
|
|
| 4,677 |
|
Gains on dispositions of investments in real estate, net |
|
| 83,006 |
|
|
| 200,350 |
|
|
| 180,331 |
|
|
| 344,667 |
|
|
| 94,261 |
|
|
| 83,006 |
|
|
| 289,372 |
|
|
| 180,331 |
|
Foreign currency and derivative losses, net |
|
| (20,055 | ) |
|
| (10,335 | ) |
|
| (27,455 | ) |
|
| (24,546 | ) | ||||||||||||||||
Foreign currency and derivative gains (losses), net |
|
| 85,382 |
|
|
| (20,055 | ) |
|
| 44,288 |
|
|
| (27,455 | ) | ||||||||||||||||
Gains (losses) on early extinguishment of debt, net |
|
| (30,596 | ) |
|
| 2,044 |
|
|
| (30,596 | ) |
|
| 992 |
|
|
| 282 |
|
|
| (30,596 | ) |
|
| (702 | ) |
|
| (30,596 | ) |
Total other income |
|
| 27,489 |
|
|
| 158,585 |
|
|
| 95,892 |
|
|
| 267,729 |
|
|
| 191,801 |
|
|
| 27,489 |
|
|
| 363,205 |
|
|
| 95,892 |
|
Earnings before income taxes |
|
| 302,761 |
|
|
| 300,933 |
|
|
| 533,050 |
|
|
| 539,275 |
|
|
| 379,095 |
|
|
| 302,761 |
|
|
| 787,606 |
|
|
| 533,050 |
|
Total income tax expense |
|
| 14,781 |
|
|
| 5,142 |
|
|
| 24,381 |
|
|
| 20,679 |
|
|
| 14,104 |
|
|
| 14,781 |
|
|
| 30,656 |
|
|
| 24,381 |
|
Consolidated net earnings |
|
| 287,980 |
|
|
| 295,791 |
|
|
| 508,669 |
|
|
| 518,596 |
|
|
| 364,991 |
|
|
| 287,980 |
|
|
| 756,950 |
|
|
| 508,669 |
|
Less net earnings attributable to noncontrolling interests |
|
| 19,363 |
|
|
| 18,712 |
|
|
| 35,123 |
|
|
| 31,787 |
|
|
| 28,904 |
|
|
| 19,363 |
|
|
| 53,485 |
|
|
| 35,123 |
|
Net earnings attributable to controlling interests |
|
| 268,617 |
|
|
| 277,079 |
|
|
| 473,546 |
|
|
| 486,809 |
|
|
| 336,087 |
|
|
| 268,617 |
|
|
| 703,465 |
|
|
| 473,546 |
|
Less preferred stock dividends |
|
| 1,674 |
|
|
| 1,696 |
|
|
| 3,348 |
|
|
| 3,385 |
|
|
| 1,476 |
|
|
| 1,674 |
|
|
| 2,952 |
|
|
| 3,348 |
|
Net earnings attributable to common stockholders |
| $ | 266,943 |
|
| $ | 275,383 |
|
| $ | 470,198 |
|
| $ | 483,424 |
|
| $ | 334,611 |
|
| $ | 266,943 |
|
| $ | 700,513 |
|
| $ | 470,198 |
|
|
|
|
|
|
|
|
|
|
|
|
|
|
|
|
|
|
|
|
|
|
|
|
|
|
|
|
|
|
|
|
|
|
Weighted average common shares outstanding – Basic |
|
| 530,040 |
|
|
| 524,842 |
|
|
| 529,400 |
|
|
| 524,540 |
|
|
| 532,639 |
|
|
| 530,040 |
|
|
| 532,427 |
|
|
| 529,400 |
|
Weighted average common shares outstanding – Diluted |
|
| 552,114 |
|
|
| 545,388 |
|
|
| 550,512 |
|
|
| 544,293 |
|
|
| 554,515 |
|
|
| 552,114 |
|
|
| 554,066 |
|
|
| 550,512 |
|
|
|
|
|
|
|
|
|
|
|
|
|
|
|
|
|
|
|
|
|
|
|
|
|
|
|
|
|
|
|
|
|
|
Net earnings per share attributable to common stockholders – Basic |
| $ | 0.50 |
|
| $ | 0.52 |
|
| $ | 0.89 |
|
| $ | 0.92 |
|
| $ | 0.63 |
|
| $ | 0.50 |
|
| $ | 1.32 |
|
| $ | 0.89 |
|
|
|
|
|
|
|
|
|
|
|
|
|
|
|
|
|
|
|
|
|
|
|
|
|
|
|
|
|
|
|
|
|
|
Net earnings per share attributable to common stockholders – Diluted |
| $ | 0.50 |
|
| $ | 0.52 |
|
| $ | 0.88 |
|
| $ | 0.92 |
|
| $ | 0.62 |
|
| $ | 0.50 |
|
| $ | 1.30 |
|
| $ | 0.88 |
|
|
|
|
|
|
|
|
|
|
|
|
|
|
|
|
|
|
|
|
|
|
|
|
|
|
|
|
|
|
|
|
|
|
Dividends per common share |
| $ | 0.44 |
|
| $ | 0.42 |
|
| $ | 0.88 |
|
| $ | 0.84 |
|
| $ | 0.48 |
|
| $ | 0.44 |
|
| $ | 0.96 |
|
| $ | 0.88 |
|
The accompanying notes are an integral part of these Consolidated Financial Statements.
2
CONSOLIDATED STATEMENTS OF COMPREHENSIVE INCOME
(Unaudited)
(In thousands)
|
| Three Months Ended |
|
| Six Months Ended |
|
| Three Months Ended |
|
| Six Months Ended |
| ||||||||||||||||||||
|
| June 30, |
|
| June 30, |
|
| June 30, |
|
| June 30, |
| ||||||||||||||||||||
|
| 2017 |
|
| 2016 |
|
| 2017 |
|
| 2016 |
|
| 2018 |
|
| 2017 |
|
| 2018 |
|
| 2017 |
| ||||||||
Consolidated net earnings |
| $ | 287,980 |
|
| $ | 295,791 |
|
| $ | 508,669 |
|
| $ | 518,596 |
|
| $ | 364,991 |
|
| $ | 287,980 |
|
| $ | 756,950 |
|
| $ | 508,669 |
|
Other comprehensive income (loss): |
|
|
|
|
|
|
|
|
|
|
|
|
|
|
|
|
|
|
|
|
|
|
|
|
|
|
|
|
|
|
|
|
Foreign currency translation gains (losses), net |
|
| 3,162 |
|
|
| (23,061 | ) |
|
| 42,829 |
|
|
| (21,600 | ) |
|
| (147,813 | ) |
|
| 3,162 |
|
|
| (143,043 | ) |
|
| 42,829 |
|
Unrealized gains (losses) on derivative contracts, net |
|
| 6,735 |
|
|
| (5,926 | ) |
|
| 9,366 |
|
|
| (21,818 | ) |
|
| 2,131 |
|
|
| 6,735 |
|
|
| (4,156 | ) |
|
| 9,366 |
|
Comprehensive income |
|
| 297,877 |
|
|
| 266,804 |
|
|
| 560,864 |
|
|
| 475,178 |
|
|
| 219,309 |
|
|
| 297,877 |
|
|
| 609,751 |
|
|
| 560,864 |
|
Net earnings attributable to noncontrolling interests |
|
| (19,363 | ) |
|
| (18,712 | ) |
|
| (35,123 | ) |
|
| (31,787 | ) |
|
| (28,904 | ) |
|
| (19,363 | ) |
|
| (53,485 | ) |
|
| (35,123 | ) |
Other comprehensive income attributable to noncontrolling interests |
|
| (811 | ) |
|
| (5,192 | ) |
|
| (48,918 | ) |
|
| (13,232 | ) | ||||||||||||||||
Other comprehensive loss (income) attributable to noncontrolling interests |
|
| 7,539 |
|
|
| (811 | ) |
|
| 7,371 |
|
|
| (48,918 | ) | ||||||||||||||||
Comprehensive income attributable to common stockholders |
| $ | 277,703 |
|
| $ | 242,900 |
|
| $ | 476,823 |
|
| $ | 430,159 |
|
| $ | 197,944 |
|
| $ | 277,703 |
|
| $ | 563,637 |
|
| $ | 476,823 |
|
|
|
|
|
|
|
|
|
|
|
|
|
|
|
|
|
|
|
|
|
|
|
|
|
|
|
|
|
|
|
|
|
|
The accompanying notes are an integral part of these Consolidated Financial Statements.
CONSOLIDATED STATEMENT OF EQUITY
Six Months Ended June 30, 20172018
(Unaudited)
(In thousands)
|
|
|
|
|
| Common Stock |
|
|
|
|
|
| Accumulated |
|
| Distributions |
|
|
|
|
|
|
|
|
| |||||||
|
|
|
|
|
| Number |
|
|
|
|
|
| Additional |
|
| Other |
|
| in Excess of |
|
| Non- |
|
|
|
|
| |||||
|
| Preferred |
|
| of |
|
| Par |
|
| Paid-in |
|
| Comprehensive |
|
| Net |
|
| controlling |
|
| Total |
| ||||||||
|
| Stock |
|
| Shares |
|
| Value |
|
| Capital |
|
| Loss |
|
| Earnings |
|
| Interests |
|
| Equity |
| ||||||||
Balance at January 1, 2017 |
| $ | 78,235 |
|
|
| 528,671 |
|
| $ | 5,287 |
|
| $ | 19,455,039 |
|
| $ | (937,473 | ) |
| $ | (3,610,007 | ) |
| $ | 3,467,059 |
|
| $ | 18,458,140 |
|
Consolidated net earnings |
|
| - |
|
|
| - |
|
|
| - |
|
|
| - |
|
|
| - |
|
|
| 473,546 |
|
|
| 35,123 |
|
|
| 508,669 |
|
Effect of equity compensation plans |
|
| - |
|
|
| 1,714 |
|
|
| 17 |
|
|
| 39,879 |
|
|
| - |
|
|
| - |
|
|
| 18,889 |
|
|
| 58,785 |
|
Capital contributions |
|
| - |
|
|
| - |
|
|
| - |
|
|
| - |
|
|
| - |
|
|
| - |
|
|
| 135,857 |
|
|
| 135,857 |
|
Settlement of noncontrolling interests |
|
| - |
|
|
| - |
|
|
| - |
|
|
| (201,620 | ) |
|
| - |
|
|
| - |
|
|
| (588,006 | ) |
|
| (789,626 | ) |
Conversion of noncontrolling interests |
|
| - |
|
|
| 953 |
|
|
| 9 |
|
|
| 28,429 |
|
|
| - |
|
|
| - |
|
|
| (28,438 | ) |
|
| - |
|
Foreign currency translation gains (losses), net |
|
| - |
|
|
| - |
|
|
| - |
|
|
| - |
|
|
| (5,839 | ) |
|
| - |
|
|
| 48,668 |
|
|
| 42,829 |
|
Unrealized gains on derivative contracts, net |
|
| - |
|
|
| - |
|
|
| - |
|
|
| - |
|
|
| 9,116 |
|
|
| - |
|
|
| 250 |
|
|
| 9,366 |
|
Reallocation of equity |
|
| - |
|
|
| - |
|
|
| - |
|
|
| (16,501 | ) |
|
| - |
|
|
| - |
|
|
| 16,501 |
|
|
| - |
|
Distributions and other |
|
| - |
|
|
| - |
|
|
| - |
|
|
| (29 | ) |
|
| - |
|
|
| (470,792 | ) |
|
| (92,961 | ) |
|
| (563,782 | ) |
Balance at June 30, 2017 |
| $ | 78,235 |
|
|
| 531,338 |
|
| $ | 5,313 |
|
| $ | 19,305,197 |
|
| $ | (934,196 | ) |
| $ | (3,607,253 | ) |
| $ | 3,012,942 |
|
| $ | 17,860,238 |
|
|
|
|
|
| Common Stock |
|
|
|
|
|
| Accumulated |
|
| Distributions |
|
|
|
|
|
|
|
|
| |||||||
|
|
|
|
| Number |
|
|
|
|
|
| Additional |
|
| Other |
|
| in Excess of |
|
| Non- |
|
|
|
|
| |||||
| Preferred |
|
| of |
|
| Par |
|
| Paid-in |
|
| Comprehensive |
|
| Net |
|
| controlling |
|
| Total |
| ||||||||
| Stock |
|
| Shares |
|
| Value |
|
| Capital |
|
| Loss |
|
| Earnings |
|
| Interests |
|
| Equity |
| ||||||||
Balance at January 1, 2018 | $ | 68,948 |
|
|
| 532,186 |
|
| $ | 5,322 |
|
| $ | 19,363,007 |
|
| $ | (901,658 | ) |
| $ | (2,904,461 | ) |
| $ | 3,074,583 |
|
| $ | 18,705,741 |
|
Consolidated net earnings |
| - |
|
|
| - |
|
|
| - |
|
|
| - |
|
|
| - |
|
|
| 703,465 |
|
|
| 53,485 |
|
|
| 756,950 |
|
Effect of equity compensation plans |
| - |
|
|
| 1,117 |
|
|
| 11 |
|
|
| 8,835 |
|
|
| - |
|
|
| - |
|
|
| 24,835 |
|
|
| 33,681 |
|
Capital contributions |
| - |
|
|
| - |
|
|
| - |
|
|
| - |
|
|
| - |
|
|
| - |
|
|
| 37,974 |
|
|
| 37,974 |
|
Redemption of noncontrolling interests |
| - |
|
|
| - |
|
|
| - |
|
|
| (2,792 | ) |
|
| - |
|
|
| - |
|
|
| (20,976 | ) |
|
| (23,768 | ) |
Foreign currency translation losses, net |
| - |
|
|
| - |
|
|
| - |
|
|
| - |
|
|
| (135,793 | ) |
|
| - |
|
|
| (7,250 | ) |
|
| (143,043 | ) |
Unrealized losses on derivative contracts, net |
| - |
|
|
| - |
|
|
| - |
|
|
| - |
|
|
| (4,035 | ) |
|
| - |
|
|
| (121 | ) |
|
| (4,156 | ) |
Reallocation of equity |
| - |
|
|
| - |
|
|
| - |
|
|
| (46,927 | ) |
|
| - |
|
|
| - |
|
|
| 46,927 |
|
|
| - |
|
Distributions and other |
| - |
|
|
| - |
|
|
| - |
|
|
| (107 | ) |
|
| - |
|
|
| (515,245 | ) |
|
| (121,524 | ) |
|
| (636,876 | ) |
Balance at June 30, 2018 | $ | 68,948 |
|
|
| 533,303 |
|
| $ | 5,333 |
|
| $ | 19,322,016 |
|
| $ | (1,041,486 | ) |
| $ | (2,716,241 | ) |
| $ | 3,087,933 |
|
| $ | 18,726,503 |
|
The accompanying notes are an integral part of these Consolidated Financial Statements.
CONSOLIDATED STATEMENTS OF CASH FLOWS
(Unaudited)
(In thousands)
|
| Six Months Ended |
|
| Six Months Ended |
| ||||||||||
|
| June 30, |
|
| June 30, |
| ||||||||||
|
| 2017 |
|
| 2016 |
|
| 2018 |
|
| 2017 |
| ||||
Operating activities: |
|
|
|
|
|
|
|
|
|
|
|
|
|
|
|
|
Consolidated net earnings |
| $ | 508,669 |
|
| $ | 518,596 |
|
| $ | 756,950 |
|
| $ | 508,669 |
|
Adjustments to reconcile net earnings to net cash provided by operating activities: |
|
|
|
|
|
|
|
|
|
|
|
|
|
|
|
|
Straight-lined rents and amortization of above and below market leases |
|
| (48,920 | ) |
|
| (43,113 | ) |
|
| (26,369 | ) |
|
| (48,920 | ) |
Equity-based compensation awards |
|
| 37,604 |
|
|
| 29,212 |
|
|
| 39,082 |
|
|
| 37,604 |
|
Depreciation and amortization |
|
| 454,736 |
|
|
| 480,382 |
|
|
| 407,754 |
|
|
| 454,736 |
|
Earnings from unconsolidated entities, net |
|
| (117,201 | ) |
|
| (99,765 | ) |
|
| (125,205 | ) |
|
| (117,201 | ) |
Distributions from unconsolidated entities |
|
| 141,256 |
|
|
| 147,155 |
| ||||||||
Net changes in operating receivables from unconsolidated entities |
|
| (117,675 | ) |
|
| 22,896 |
| ||||||||
Amortization of debt premiums, net of debt issuance costs |
|
| (4,445 | ) |
|
| (9,616 | ) | ||||||||
Operating distributions from unconsolidated entities |
|
| 175,960 |
|
|
| 141,256 |
| ||||||||
Decrease (increase) in operating receivables from unconsolidated entities |
|
| 6,589 |
|
|
| (117,675 | ) | ||||||||
Amortization of debt discounts (premiums), net of debt issuance costs |
|
| 5,971 |
|
|
| (4,445 | ) | ||||||||
Gains on dispositions of investments in real estate, net |
|
| (180,331 | ) |
|
| (344,667 | ) |
|
| (289,372 | ) |
|
| (180,331 | ) |
Unrealized foreign currency and derivative losses, net |
|
| 35,266 |
|
|
| 23,386 |
| ||||||||
Losses (gains) on early extinguishment of debt, net |
|
| 30,596 |
|
|
| (992 | ) | ||||||||
Unrealized foreign currency and derivative losses (gains), net |
|
| (52,595 | ) |
|
| 35,266 |
| ||||||||
Losses on early extinguishment of debt, net |
|
| 702 |
|
|
| 30,596 |
| ||||||||
Deferred income tax expense (benefit) |
|
| 2,268 |
|
|
| (4,602 | ) |
|
| (1,194 | ) |
|
| 2,268 |
|
Decrease in accounts receivable and other assets |
|
| 61,452 |
|
|
| 14,327 |
| ||||||||
Decrease (increase) in accounts receivable and other assets |
|
| (35,756 | ) |
|
| 61,452 |
| ||||||||
Decrease in accounts payable and accrued expenses and other liabilities |
|
| (58,115 | ) |
|
| (99,539 | ) |
|
| (89,293 | ) |
|
| (58,115 | ) |
Net cash provided by operating activities |
|
| 745,160 |
|
|
| 633,660 |
|
|
| 773,224 |
|
|
| 745,160 |
|
Investing activities: |
|
|
|
|
|
|
|
|
|
|
|
|
|
|
|
|
Real estate development |
|
| (715,294 | ) |
|
| (775,545 | ) |
|
| (788,604 | ) |
|
| (715,294 | ) |
Real estate acquisitions |
|
| (202,088 | ) |
|
| (136,107 | ) |
|
| (289,031 | ) |
|
| (202,088 | ) |
Tenant improvements and lease commissions on previously leased space |
|
| (75,342 | ) |
|
| (88,659 | ) |
|
| (59,342 | ) |
|
| (75,342 | ) |
Nondevelopment capital expenditures |
|
| (37,253 | ) |
|
| (30,096 | ) | ||||||||
Property improvements |
|
| (33,289 | ) |
|
| (37,253 | ) | ||||||||
Proceeds from dispositions and contributions of real estate properties |
|
| 836,107 |
|
|
| 1,284,126 |
|
|
| 901,808 |
|
|
| 836,107 |
|
Investments in and advances to unconsolidated entities |
|
| (144,894 | ) |
|
| (145,287 | ) |
|
| (83,250 | ) |
|
| (144,894 | ) |
Return of investment from unconsolidated entities |
|
| 133,677 |
|
|
| 533,333 |
|
|
| 134,640 |
|
|
| 133,677 |
|
Proceeds from repayment of notes receivable backed by real estate |
|
| 32,100 |
|
|
| 201,250 |
|
|
| 34,260 |
|
|
| 32,100 |
|
Proceeds from the settlement of net investment hedges |
|
| 7,541 |
|
|
| 16,768 |
|
|
| - |
|
|
| 7,541 |
|
Payments on the settlement of net investment hedges |
|
| (5,058 | ) |
|
| - |
|
|
| (3,966 | ) |
|
| (5,058 | ) |
Net cash provided by (used in) investing activities |
|
| (170,504 | ) |
|
| 859,783 |
| ||||||||
Net cash used in investing activities |
|
| (186,774 | ) |
|
| (170,504 | ) | ||||||||
Financing activities: |
|
|
|
|
|
|
|
|
|
|
|
|
|
|
|
|
Proceeds from issuance of common stock |
|
| 25,374 |
|
|
| 10,354 |
|
|
| 4,322 |
|
|
| 25,374 |
|
Dividends paid on common and preferred stock |
|
| (470,792 | ) |
|
| (445,343 | ) |
|
| (515,245 | ) |
|
| (470,792 | ) |
Noncontrolling interests contributions |
|
| 135,857 |
|
|
| 825 |
|
|
| 26,174 |
|
|
| 135,857 |
|
Noncontrolling interests distributions |
|
| (99,896 | ) |
|
| (214,263 | ) |
|
| (121,524 | ) |
|
| (99,896 | ) |
Purchase of noncontrolling interests |
|
| (789,626 | ) |
|
| (2,979 | ) | ||||||||
Settlement of noncontrolling interests |
|
| (23,768 | ) |
|
| (789,626 | ) | ||||||||
Tax paid for shares withheld |
|
| (18,894 | ) |
|
| (7,301 | ) |
|
| (26,694 | ) |
|
| (18,894 | ) |
Debt and equity issuance costs paid |
|
| (6,151 | ) |
|
| (14,865 | ) | ||||||||
Debt issuance costs paid |
|
| (6,386 | ) |
|
| (6,151 | ) | ||||||||
Net payments on credit facilities |
|
| (33,745 | ) |
|
| (3,515 | ) |
|
| (307,086 | ) |
|
| (33,745 | ) |
Repurchase and payments of debt |
|
| (2,002,519 | ) |
|
| (1,277,311 | ) |
|
| (1,251,830 | ) |
|
| (2,002,519 | ) |
Proceeds from issuance of debt |
|
| 2,134,041 |
|
|
| 517,045 |
|
|
| 1,721,793 |
|
|
| 2,134,041 |
|
Net cash used in financing activities |
|
| (1,126,351 | ) |
|
| (1,437,353 | ) |
|
| (500,244 | ) |
|
| (1,126,351 | ) |
|
|
|
|
|
|
|
|
|
|
|
|
|
|
|
|
|
Effect of foreign currency exchange rate changes on cash |
|
| 15,733 |
|
|
| 12,051 |
|
|
| (5,422 | ) |
|
| 15,733 |
|
Net increase (decrease) in cash and cash equivalents |
|
| (535,962 | ) |
|
| 68,141 |
|
|
| 80,784 |
|
|
| (535,962 | ) |
Cash and cash equivalents, beginning of period |
|
| 807,316 |
|
|
| 264,080 |
|
|
| 447,046 |
|
|
| 807,316 |
|
Cash and cash equivalents, end of period |
| $ | 271,354 |
|
| $ | 332,221 |
|
| $ | 527,830 |
|
| $ | 271,354 |
|
See Note 11 for information on noncash investing and financing activities and other information.
The accompanying notes are an integral part of these Consolidated Financial Statements.
(In thousands)
|
|
|
|
|
|
|
|
|
|
|
|
|
|
|
| June 30, 2017 |
|
| December 31, |
| June 30, 2018 |
|
| December 31, |
| ||||
| (Unaudited) |
|
| 2016 |
| (Unaudited) |
|
| 2017 |
| ||||
ASSETS |
|
|
|
|
|
|
|
|
|
|
|
|
|
|
Investments in real estate properties | $ | 27,501,284 |
|
| $ | 27,119,330 |
| $ | 25,555,343 |
|
| $ | 25,838,644 |
|
Less accumulated depreciation |
| 4,026,369 |
|
|
| 3,758,372 |
|
| 4,283,877 |
|
|
| 4,059,348 |
|
Net investments in real estate properties |
| 23,474,915 |
|
|
| 23,360,958 |
|
| 21,271,466 |
|
|
| 21,779,296 |
|
Investments in and advances to unconsolidated entities |
| 4,617,724 |
|
|
| 4,230,429 |
|
| 5,414,623 |
|
|
| 5,496,450 |
|
Assets held for sale or contribution |
| 350,987 |
|
|
| 322,139 |
|
| 892,546 |
|
|
| 342,060 |
|
Notes receivable backed by real estate |
| 19,536 |
|
|
| 32,100 |
|
| - |
|
|
| 34,260 |
|
Net investments in real estate |
| 28,463,162 |
|
|
| 27,945,626 |
|
| 27,578,635 |
|
|
| 27,652,066 |
|
|
|
|
|
|
|
|
|
|
|
|
|
|
|
|
Cash and cash equivalents |
| 271,354 |
|
|
| 807,316 |
|
| 527,830 |
|
|
| 447,046 |
|
Other assets |
| 1,415,879 |
|
|
| 1,496,990 |
|
| 1,396,417 |
|
|
| 1,381,963 |
|
Total assets | $ | 30,150,395 |
|
| $ | 30,249,932 |
| $ | 29,502,882 |
|
| $ | 29,481,075 |
|
|
|
|
|
|
|
|
|
|
|
|
|
|
|
|
LIABILITIES AND CAPITAL |
|
|
|
|
|
|
|
|
|
|
|
|
|
|
Liabilities: |
|
|
|
|
|
|
|
|
|
|
|
|
|
|
Debt | $ | 11,081,922 |
|
| $ | 10,608,294 |
| $ | 9,427,124 |
|
| $ | 9,412,631 |
|
Accounts payable and accrued expenses |
| 554,775 |
|
|
| 556,179 |
|
| 719,679 |
|
|
| 702,804 |
|
Other liabilities |
| 653,460 |
|
|
| 627,319 |
|
| 629,576 |
|
|
| 659,899 |
|
Total liabilities |
| 12,290,157 |
|
|
| 11,791,792 |
|
| 10,776,379 |
|
|
| 10,775,334 |
|
|
|
|
|
|
|
|
|
|
|
|
|
|
|
|
Capital: |
|
|
|
|
|
|
|
|
|
|
|
|
|
|
Partners’ capital: |
|
|
|
|
|
|
|
|
|
|
|
|
|
|
General partner – preferred |
| 78,235 |
|
|
| 78,235 |
|
| 68,948 |
|
|
| 68,948 |
|
General partner – common |
| 14,769,061 |
|
|
| 14,912,846 |
|
| 15,569,622 |
|
|
| 15,562,210 |
|
Limited partners – common |
| 165,826 |
|
|
| 150,173 |
|
| 218,162 |
|
|
| 165,401 |
|
Limited partners – Class A common |
| 239,764 |
|
|
| 244,417 |
|
| 245,596 |
|
|
| 248,940 |
|
Total partners’ capital |
| 15,252,886 |
|
|
| 15,385,671 |
|
| 16,102,328 |
|
|
| 16,045,499 |
|
Noncontrolling interests |
| 2,607,352 |
|
|
| 3,072,469 |
|
| 2,624,175 |
|
|
| 2,660,242 |
|
Total capital |
| 17,860,238 |
|
|
| 18,458,140 |
|
| 18,726,503 |
|
|
| 18,705,741 |
|
Total liabilities and capital | $ | 30,150,395 |
|
| $ | 30,249,932 |
| $ | 29,502,882 |
|
| $ | 29,481,075 |
|
The accompanying notes are an integral part of these Consolidated Financial Statements.
CONSOLIDATED STATEMENTS OF INCOME
(Unaudited)
(In thousands, except per unit amounts)
|
| Three Months Ended |
|
| Six Months Ended |
|
| Three Months Ended |
|
| Six Months Ended |
| ||||||||||||||||||||
|
| June 30, |
|
| June 30, |
|
| June 30, |
|
| June 30, |
| ||||||||||||||||||||
|
| 2017 |
|
| 2016 |
|
| 2017 |
|
| 2016 |
|
| 2018 |
|
| 2017 |
|
| 2018 |
|
| 2017 |
| ||||||||
Revenues: |
|
|
|
|
|
|
|
|
|
|
|
|
|
|
|
|
|
|
|
|
|
|
|
|
|
|
|
|
|
|
|
|
Rental |
| $ | 447,960 |
|
| $ | 426,150 |
|
| $ | 887,844 |
|
| $ | 863,254 |
|
| $ | 426,549 |
|
| $ | 447,960 |
|
| $ | 854,450 |
|
| $ | 887,844 |
|
Rental recoveries |
|
| 128,417 |
|
|
| 119,981 |
|
|
| 255,466 |
|
|
| 236,993 |
|
|
| 118,130 |
|
|
| 128,417 |
|
|
| 246,172 |
|
|
| 255,466 |
|
Strategic capital |
|
| 180,654 |
|
|
| 53,535 |
|
|
| 237,699 |
|
|
| 104,538 |
|
|
| 75,697 |
|
|
| 180,654 |
|
|
| 208,658 |
|
|
| 237,699 |
|
Development management and other |
|
| 9,152 |
|
|
| 2,489 |
|
|
| 14,329 |
|
|
| 3,670 |
|
|
| 900 |
|
|
| 9,152 |
|
|
| 5,652 |
|
|
| 14,329 |
|
Total revenues |
|
| 766,183 |
|
|
| 602,155 |
|
|
| 1,395,338 |
|
|
| 1,208,455 |
|
|
| 621,276 |
|
|
| 766,183 |
|
|
| 1,314,932 |
|
|
| 1,395,338 |
|
Expenses: |
|
|
|
|
|
|
|
|
|
|
|
|
|
|
|
|
|
|
|
|
|
|
|
|
|
|
|
|
|
|
|
|
Rental |
|
| 147,794 |
|
|
| 140,725 |
|
|
| 300,450 |
|
|
| 287,306 |
|
|
| 133,329 |
|
|
| 147,794 |
|
|
| 276,270 |
|
|
| 300,450 |
|
Strategic capital |
|
| 51,986 |
|
|
| 27,866 |
|
|
| 83,785 |
|
|
| 53,159 |
|
|
| 34,850 |
|
|
| 51,986 |
|
|
| 78,710 |
|
|
| 83,785 |
|
General and administrative |
|
| 60,077 |
|
|
| 56,934 |
|
|
| 113,694 |
|
|
| 107,477 |
|
|
| 57,615 |
|
|
| 60,077 |
|
|
| 120,043 |
|
|
| 113,694 |
|
Depreciation and amortization |
|
| 228,145 |
|
|
| 230,382 |
|
|
| 454,736 |
|
|
| 480,382 |
|
|
| 203,673 |
|
|
| 228,145 |
|
|
| 407,754 |
|
|
| 454,736 |
|
Other |
|
| 2,909 |
|
|
| 3,900 |
|
|
| 5,515 |
|
|
| 8,585 |
|
|
| 4,515 |
|
|
| 2,909 |
|
|
| 7,754 |
|
|
| 5,515 |
|
Total expenses |
|
| 490,911 |
|
|
| 459,807 |
|
|
| 958,180 |
|
|
| 936,909 |
|
|
| 433,982 |
|
|
| 490,911 |
|
|
| 890,531 |
|
|
| 958,180 |
|
|
|
|
|
|
|
|
|
|
|
|
|
|
|
|
|
|
|
|
|
|
|
|
|
|
|
|
|
|
|
|
|
|
Operating income |
|
| 275,272 |
|
|
| 142,348 |
|
|
| 437,158 |
|
|
| 271,546 |
|
|
| 187,294 |
|
|
| 275,272 |
|
|
| 424,401 |
|
|
| 437,158 |
|
|
|
|
|
|
|
|
|
|
|
|
|
|
|
|
|
|
|
|
|
|
|
|
|
|
|
|
|
|
|
|
|
|
Other income (expense): |
|
|
|
|
|
|
|
|
|
|
|
|
|
|
|
|
|
|
|
|
|
|
|
|
|
|
|
|
|
|
|
|
Earnings from unconsolidated entities, net |
|
| 68,596 |
|
|
| 41,454 |
|
|
| 117,201 |
|
|
| 99,765 |
|
|
| 62,549 |
|
|
| 68,596 |
|
|
| 125,205 |
|
|
| 117,201 |
|
Interest expense |
|
| (75,354 | ) |
|
| (76,455 | ) |
|
| (148,266 | ) |
|
| (157,267 | ) |
|
| (56,314 | ) |
|
| (75,354 | ) |
|
| (102,575 | ) |
|
| (148,266 | ) |
Interest and other income, net |
|
| 1,892 |
|
|
| 1,527 |
|
|
| 4,677 |
|
|
| 4,118 |
|
|
| 5,641 |
|
|
| 1,892 |
|
|
| 7,617 |
|
|
| 4,677 |
|
Gains on dispositions of investments in real estate, net |
|
| 83,006 |
|
|
| 200,350 |
|
|
| 180,331 |
|
|
| 344,667 |
|
|
| 94,261 |
|
|
| 83,006 |
|
|
| 289,372 |
|
|
| 180,331 |
|
Foreign currency and derivative losses, net |
|
| (20,055 | ) |
|
| (10,335 | ) |
|
| (27,455 | ) |
|
| (24,546 | ) | ||||||||||||||||
Foreign currency and derivative gains (losses), net |
|
| 85,382 |
|
|
| (20,055 | ) |
|
| 44,288 |
|
|
| (27,455 | ) | ||||||||||||||||
Gains (losses) on early extinguishment of debt, net |
|
| (30,596 | ) |
|
| 2,044 |
|
|
| (30,596 | ) |
|
| 992 |
|
|
| 282 |
|
|
| (30,596 | ) |
|
| (702 | ) |
|
| (30,596 | ) |
Total other income |
|
| 27,489 |
|
|
| 158,585 |
|
|
| 95,892 |
|
|
| 267,729 |
|
|
| 191,801 |
|
|
| 27,489 |
|
|
| 363,205 |
|
|
| 95,892 |
|
Earnings before income taxes |
|
| 302,761 |
|
|
| 300,933 |
|
|
| 533,050 |
|
|
| 539,275 |
|
|
| 379,095 |
|
|
| 302,761 |
|
|
| 787,606 |
|
|
| 533,050 |
|
Total income tax expense |
|
| 14,781 |
|
|
| 5,142 |
|
|
| 24,381 |
|
|
| 20,679 |
|
|
| 14,104 |
|
|
| 14,781 |
|
|
| 30,656 |
|
|
| 24,381 |
|
Consolidated net earnings |
|
| 287,980 |
|
|
| 295,791 |
|
|
| 508,669 |
|
|
| 518,596 |
|
|
| 364,991 |
|
|
| 287,980 |
|
|
| 756,950 |
|
|
| 508,669 |
|
Less net earnings attributable to noncontrolling interests |
|
| 11,986 |
|
|
| 10,396 |
|
|
| 22,123 |
|
|
| 17,237 |
|
|
| 18,882 |
|
|
| 11,986 |
|
|
| 32,940 |
|
|
| 22,123 |
|
Net earnings attributable to controlling interests |
|
| 275,994 |
|
|
| 285,395 |
|
|
| 486,546 |
|
|
| 501,359 |
|
|
| 346,109 |
|
|
| 275,994 |
|
|
| 724,010 |
|
|
| 486,546 |
|
Less preferred unit distributions |
|
| 1,674 |
|
|
| 1,696 |
|
|
| 3,348 |
|
|
| 3,385 |
|
|
| 1,476 |
|
|
| 1,674 |
|
|
| 2,952 |
|
|
| 3,348 |
|
Net earnings attributable to common unitholders |
| $ | 274,320 |
|
| $ | 283,699 |
|
| $ | 483,198 |
|
| $ | 497,974 |
|
| $ | 344,633 |
|
| $ | 274,320 |
|
| $ | 721,058 |
|
| $ | 483,198 |
|
|
|
|
|
|
|
|
|
|
|
|
|
|
|
|
|
|
|
|
|
|
|
|
|
|
|
|
|
|
|
|
|
|
Weighted average common units outstanding – Basic |
|
| 536,060 |
|
|
| 531,912 |
|
|
| 535,392 |
|
|
| 531,507 |
|
|
| 540,084 |
|
|
| 536,060 |
|
|
| 539,547 |
|
|
| 535,392 |
|
Weighted average common units outstanding – Diluted |
|
| 552,114 |
|
|
| 545,388 |
|
|
| 550,512 |
|
|
| 544,293 |
|
|
| 554,515 |
|
|
| 552,114 |
|
|
| 554,066 |
|
|
| 550,512 |
|
|
|
|
|
|
|
|
|
|
|
|
|
|
|
|
|
|
|
|
|
|
|
|
|
|
|
|
|
|
|
|
|
|
Net earnings per unit attributable to common unitholders – Basic |
| $ | 0.50 |
|
| $ | 0.52 |
|
| $ | 0.89 |
|
| $ | 0.92 |
|
| $ | 0.63 |
|
| $ | 0.50 |
|
| $ | 1.32 |
|
| $ | 0.89 |
|
|
|
|
|
|
|
|
|
|
|
|
|
|
|
|
|
|
|
|
|
|
|
|
|
|
|
|
|
|
|
|
|
|
Net earnings per unit attributable to common unitholders – Diluted |
| $ | 0.50 |
|
| $ | 0.52 |
|
| $ | 0.88 |
|
| $ | 0.92 |
|
| $ | 0.62 |
|
| $ | 0.50 |
|
| $ | 1.30 |
|
| $ | 0.88 |
|
|
|
|
|
|
|
|
|
|
|
|
|
|
|
|
|
|
|
|
|
|
|
|
|
|
|
|
|
|
|
|
|
|
Distributions per common unit |
| $ | 0.44 |
|
| $ | 0.42 |
|
| $ | 0.88 |
|
| $ | 0.84 |
|
| $ | 0.48 |
|
| $ | 0.44 |
|
| $ | 0.96 |
|
| $ | 0.88 |
|
The accompanying notes are an integral part of these Consolidated Financial Statements.
CONSOLIDATED STATEMENTS OF COMPREHENSIVE INCOME
(Unaudited)
(In thousands)
|
| Three Months Ended |
|
| Six Months Ended |
| ||||||||||
|
| June 30, |
|
| June 30, |
| ||||||||||
|
| 2018 |
|
| 2017 |
|
| 2018 |
|
| 2017 |
| ||||
Consolidated net earnings |
| $ | 364,991 |
|
| $ | 287,980 |
|
| $ | 756,950 |
|
| $ | 508,669 |
|
Other comprehensive income (loss): |
|
|
|
|
|
|
|
|
|
|
|
|
|
|
|
|
Foreign currency translation gains (losses), net |
|
| (147,813 | ) |
|
| 3,162 |
|
|
| (143,043 | ) |
|
| 42,829 |
|
Unrealized gains (losses) on derivative contracts, net |
|
| 2,131 |
|
|
| 6,735 |
|
|
| (4,156 | ) |
|
| 9,366 |
|
Comprehensive income |
|
| 219,309 |
|
|
| 297,877 |
|
|
| 609,751 |
|
|
| 560,864 |
|
Net earnings attributable to noncontrolling interests |
|
| (18,882 | ) |
|
| (11,986 | ) |
|
| (32,940 | ) |
|
| (22,123 | ) |
Other comprehensive loss (income) attributable to noncontrolling interests |
|
| 3,424 |
|
|
| (561 | ) |
|
| 3,205 |
|
|
| (48,828 | ) |
Comprehensive income attributable to common unitholders |
| $ | 203,851 |
|
| $ | 285,330 |
|
| $ | 580,016 |
|
| $ | 489,913 |
|
|
|
|
|
|
|
|
|
|
|
|
|
|
|
|
|
|
The accompanying notes are an integral part of these Consolidated Financial Statements.
CONSOLIDATED STATEMENTS OF COMPREHENSIVE INCOME
(Unaudited)
(In thousands)
|
| Three Months Ended |
|
| Six Months Ended |
| ||||||||||
|
| June 30, |
|
| June 30, |
| ||||||||||
|
| 2017 |
|
| 2016 |
|
| 2017 |
|
| 2016 |
| ||||
Consolidated net earnings |
| $ | 287,980 |
|
| $ | 295,791 |
|
| $ | 508,669 |
|
| $ | 518,596 |
|
Other comprehensive income (loss): |
|
|
|
|
|
|
|
|
|
|
|
|
|
|
|
|
Foreign currency translation gains (losses), net |
|
| 3,162 |
|
|
| (23,061 | ) |
|
| 42,829 |
|
|
| (21,600 | ) |
Unrealized gains (losses) on derivative contracts, net |
|
| 6,735 |
|
|
| (5,926 | ) |
|
| 9,366 |
|
|
| (21,818 | ) |
Comprehensive income |
|
| 297,877 |
|
|
| 266,804 |
|
|
| 560,864 |
|
|
| 475,178 |
|
Net earnings attributable to noncontrolling interests |
|
| (11,986 | ) |
|
| (10,396 | ) |
|
| (22,123 | ) |
|
| (17,237 | ) |
Other comprehensive income attributable to noncontrolling interests |
|
| (561 | ) |
|
| (6,118 | ) |
|
| (48,828 | ) |
|
| (14,844 | ) |
Comprehensive income attributable to common unitholders |
| $ | 285,330 |
|
| $ | 250,290 |
|
| $ | 489,913 |
|
| $ | 443,097 |
|
|
|
|
|
|
|
|
|
|
|
|
|
|
|
|
|
|
The accompanying notes are an integral part of these Consolidated Financial Statements.
CONSOLIDATED STATEMENT OF CAPITAL
Six Months Ended June 30, 20172018
(Unaudited)
(In thousands)
| General Partner |
|
| Limited Partners |
|
| Non- |
|
|
|
|
| |||||||||||||||||||||||||||
| Preferred |
|
| Common |
|
| Common |
|
| Class A Common |
|
| controlling |
|
|
|
|
| |||||||||||||||||||||
| Units |
|
| Amount |
|
| Units |
|
| Amount |
|
| Units |
|
| Amount |
|
| Units |
|
| Amount |
|
| Interests |
|
| Total |
| ||||||||||
Balance at January 1, 2017 |
| 1,565 |
|
| $ | 78,235 |
|
|
| 528,671 |
|
| $ | 14,912,846 |
|
|
| 5,323 |
|
| $ | 150,173 |
|
|
| 8,894 |
|
| $ | 244,417 |
|
| $ | 3,072,469 |
|
| $ | 18,458,140 |
|
Consolidated net earnings |
| - |
|
|
| - |
|
|
| - |
|
|
| 473,546 |
|
|
| - |
|
|
| 5,322 |
|
|
| - |
|
|
| 7,678 |
|
|
| 22,123 |
|
|
| 508,669 |
|
Effect of equity compensation plans |
| - |
|
|
| - |
|
|
| 1,714 |
|
|
| 39,896 |
|
|
| 1,320 |
|
|
| 18,889 |
|
|
| - |
|
|
| - |
|
|
| - |
|
|
| 58,785 |
|
Capital contributions |
| - |
|
|
| - |
|
|
| - |
|
|
| - |
|
|
| - |
|
|
| - |
|
|
| - |
|
|
| - |
|
|
| 135,857 |
|
|
| 135,857 |
|
Settlement of noncontrolling interests |
| - |
|
|
| - |
|
|
| - |
|
|
| (201,620 | ) |
|
| - |
|
|
| - |
|
|
| - |
|
|
| - |
|
|
| (588,006 | ) |
|
| (789,626 | ) |
Conversion of limited partners units |
| - |
|
|
| - |
|
|
| 953 |
|
|
| 28,438 |
|
|
| (677 | ) |
|
| (18,753 | ) |
|
| - |
|
|
| - |
|
|
| (9,685 | ) |
|
| - |
|
Foreign currency translation gains (losses), net |
| - |
|
|
| - |
|
|
| - |
|
|
| (5,839 | ) |
|
| - |
|
|
| (66 | ) |
|
| - |
|
|
| (94 | ) |
|
| 48,828 |
|
|
| 42,829 |
|
Unrealized gains on derivative contracts, net |
| - |
|
|
| - |
|
|
| - |
|
|
| 9,116 |
|
|
| - |
|
|
| 102 |
|
|
| - |
|
|
| 148 |
|
|
| - |
|
|
| 9,366 |
|
Reallocation of capital |
| - |
|
|
| - |
|
|
| - |
|
|
| (16,501 | ) |
|
| - |
|
|
| 17,383 |
|
|
| - |
|
|
| (882 | ) |
|
| - |
|
|
| - |
|
Distributions and other |
| - |
|
|
| - |
|
|
| - |
|
|
| (470,821 | ) |
|
| - |
|
|
| (7,224 | ) |
|
| - |
|
|
| (11,503 | ) |
|
| (74,234 | ) |
|
| (563,782 | ) |
Balance at June 30, 2017 |
| 1,565 |
|
| $ | 78,235 |
|
|
| 531,338 |
|
| $ | 14,769,061 |
|
|
| 5,966 |
|
| $ | 165,826 |
|
|
| 8,894 |
|
| $ | 239,764 |
|
| $ | 2,607,352 |
|
| $ | 17,860,238 |
|
| General Partner |
|
| Limited Partners |
|
| Non- |
|
|
|
|
| |||||||||||||||||||||||||||
| Preferred |
|
| Common |
|
| Common |
|
| Class A Common |
|
| controlling |
|
|
|
|
| |||||||||||||||||||||
| Units |
|
| Amount |
|
| Units |
|
| Amount |
|
| Units |
|
| Amount |
|
| Units |
|
| Amount |
|
| Interests |
|
| Total |
| ||||||||||
Balance at January 1, 2018 |
| 1,379 |
|
| $ | 68,948 |
|
|
| 532,186 |
|
| $ | 15,562,210 |
|
|
| 5,656 |
|
| $ | 165,401 |
|
|
| 8,894 |
|
| $ | 248,940 |
|
| $ | 2,660,242 |
|
| $ | 18,705,741 |
|
Consolidated net earnings |
| - |
|
|
| - |
|
|
| - |
|
|
| 703,465 |
|
|
| - |
|
|
| 9,368 |
|
|
| - |
|
|
| 11,177 |
|
|
| 32,940 |
|
|
| 756,950 |
|
Effect of equity compensation plans |
| - |
|
|
| - |
|
|
| 1,117 |
|
|
| 8,846 |
|
|
| 2,057 |
|
|
| 24,835 |
|
|
| - |
|
|
| - |
|
|
| - |
|
|
| 33,681 |
|
Capital contributions |
| - |
|
|
| - |
|
|
| - |
|
|
| - |
|
|
| - |
|
|
| - |
|
|
| - |
|
|
| - |
|
|
| 37,974 |
|
|
| 37,974 |
|
Redemption of noncontrolling interests |
| - |
|
|
| - |
|
|
| - |
|
|
| (2,792 | ) |
|
| - |
|
|
| - |
|
|
| - |
|
|
| - |
|
|
| (3,157 | ) |
|
| (5,949 | ) |
Redemption of limited partners units |
| - |
|
|
| - |
|
|
| - |
|
|
| - |
|
|
| (240 | ) |
|
| (15,017 | ) |
|
| (45 | ) |
|
| (2,802 | ) |
|
| - |
|
|
| (17,819 | ) |
Foreign currency translation losses, net |
| - |
|
|
| - |
|
|
| - |
|
|
| (135,793 | ) |
|
| - |
|
|
| (1,903 | ) |
|
| - |
|
|
| (2,142 | ) |
|
| (3,205 | ) |
|
| (143,043 | ) |
Unrealized losses on derivative contracts, net |
| - |
|
|
| - |
|
|
| - |
|
|
| (4,035 | ) |
|
| - |
|
|
| (57 | ) |
|
| - |
|
|
| (64 | ) |
|
| - |
|
|
| (4,156 | ) |
Reallocation of capital |
| - |
|
|
| - |
|
|
| - |
|
|
| (46,927 | ) |
|
| - |
|
|
| 44,937 |
|
|
| - |
|
|
| 1,990 |
|
|
| - |
|
|
| - |
|
Distributions and other |
| - |
|
|
| - |
|
|
| - |
|
|
| (515,352 | ) |
|
| - |
|
|
| (9,402 | ) |
|
| - |
|
|
| (11,503 | ) |
|
| (100,619 | ) |
|
| (636,876 | ) |
Balance at June 30, 2018 |
| 1,379 |
|
| $ | 68,948 |
|
|
| 533,303 |
|
| $ | 15,569,622 |
|
|
| 7,473 |
|
| $ | 218,162 |
|
|
| 8,849 |
|
| $ | 245,596 |
|
| $ | 2,624,175 |
|
| $ | 18,726,503 |
|
The accompanying notes are an integral part of these Consolidated Financial Statements.
CONSOLIDATED STATEMENTS OF CASH FLOWS
(Unaudited)
(In thousands)
|
| Six Months Ended |
|
| Six Months Ended |
| ||||||||||
|
| June 30, |
|
| June 30, |
| ||||||||||
|
| 2017 |
|
| 2016 |
|
| 2018 |
|
| 2017 |
| ||||
Operating activities: |
|
|
|
|
|
|
|
|
|
|
|
|
|
|
|
|
Consolidated net earnings |
| $ | 508,669 |
|
| $ | 518,596 |
|
| $ | 756,950 |
|
| $ | 508,669 |
|
Adjustments to reconcile net earnings to net cash provided by operating activities: |
|
|
|
|
|
|
|
|
|
|
|
|
|
|
|
|
Straight-lined rents and amortization of above and below market leases |
|
| (48,920 | ) |
|
| (43,113 | ) |
|
| (26,369 | ) |
|
| (48,920 | ) |
Equity-based compensation awards |
|
| 37,604 |
|
|
| 29,212 |
|
|
| 39,082 |
|
|
| 37,604 |
|
Depreciation and amortization |
|
| 454,736 |
|
|
| 480,382 |
|
|
| 407,754 |
|
|
| 454,736 |
|
Earnings from unconsolidated entities, net |
|
| (117,201 | ) |
|
| (99,765 | ) |
|
| (125,205 | ) |
|
| (117,201 | ) |
Distributions from unconsolidated entities |
|
| 141,256 |
|
|
| 147,155 |
| ||||||||
Net changes in operating receivables from unconsolidated entities |
|
| (117,675 | ) |
|
| 22,896 |
| ||||||||
Amortization of debt premiums, net of debt issuance costs |
|
| (4,445 | ) |
|
| (9,616 | ) | ||||||||
Operating distributions from unconsolidated entities |
|
| 175,960 |
|
|
| 141,256 |
| ||||||||
Decrease (increase) in operating receivables from unconsolidated entities |
|
| 6,589 |
|
|
| (117,675 | ) | ||||||||
Amortization of debt discounts (premiums), net of debt issuance costs |
|
| 5,971 |
|
|
| (4,445 | ) | ||||||||
Gains on dispositions of investments in real estate, net |
|
| (180,331 | ) |
|
| (344,667 | ) |
|
| (289,372 | ) |
|
| (180,331 | ) |
Unrealized foreign currency and derivative losses, net |
|
| 35,266 |
|
|
| 23,386 |
| ||||||||
Losses (gains) on early extinguishment of debt, net |
|
| 30,596 |
|
|
| (992 | ) | ||||||||
Unrealized foreign currency and derivative losses (gains), net |
|
| (52,595 | ) |
|
| 35,266 |
| ||||||||
Losses on early extinguishment of debt, net |
|
| 702 |
|
|
| 30,596 |
| ||||||||
Deferred income tax expense (benefit) |
|
| 2,268 |
|
|
| (4,602 | ) |
|
| (1,194 | ) |
|
| 2,268 |
|
Decrease in accounts receivable and other assets |
|
| 61,452 |
|
|
| 14,327 |
| ||||||||
Decrease (increase) in accounts receivable and other assets |
|
| (35,756 | ) |
|
| 61,452 |
| ||||||||
Decrease in accounts payable and accrued expenses and other liabilities |
|
| (58,115 | ) |
|
| (99,539 | ) |
|
| (89,293 | ) |
|
| (58,115 | ) |
Net cash provided by operating activities |
|
| 745,160 |
|
|
| 633,660 |
|
|
| 773,224 |
|
|
| 745,160 |
|
Investing activities: |
|
|
|
|
|
|
|
|
|
|
|
|
|
|
|
|
Real estate development |
|
| (715,294 | ) |
|
| (775,545 | ) |
|
| (788,604 | ) |
|
| (715,294 | ) |
Real estate acquisitions |
|
| (202,088 | ) |
|
| (136,107 | ) |
|
| (289,031 | ) |
|
| (202,088 | ) |
Tenant improvements and lease commissions on previously leased space |
|
| (75,342 | ) |
|
| (88,659 | ) |
|
| (59,342 | ) |
|
| (75,342 | ) |
Nondevelopment capital expenditures |
|
| (37,253 | ) |
|
| (30,096 | ) | ||||||||
Property improvements |
|
| (33,289 | ) |
|
| (37,253 | ) | ||||||||
Proceeds from dispositions and contributions of real estate properties |
|
| 836,107 |
|
|
| 1,284,126 |
|
|
| 901,808 |
|
|
| 836,107 |
|
Investments in and advances to unconsolidated entities |
|
| (144,894 | ) |
|
| (145,287 | ) |
|
| (83,250 | ) |
|
| (144,894 | ) |
Return of investment from unconsolidated entities |
|
| 133,677 |
|
|
| 533,333 |
|
|
| 134,640 |
|
|
| 133,677 |
|
Proceeds from repayment of notes receivable backed by real estate |
|
| 32,100 |
|
|
| 201,250 |
|
|
| 34,260 |
|
|
| 32,100 |
|
Proceeds from the settlement of net investment hedges |
|
| 7,541 |
|
|
| 16,768 |
|
|
| - |
|
|
| 7,541 |
|
Payments on the settlement of net investment hedges |
|
| (5,058 | ) |
|
| - |
|
|
| (3,966 | ) |
|
| (5,058 | ) |
Net cash provided by (used in) investing activities |
|
| (170,504 | ) |
|
| 859,783 |
| ||||||||
Net cash used in investing activities |
|
| (186,774 | ) |
|
| (170,504 | ) | ||||||||
Financing activities: |
|
|
|
|
|
|
|
|
|
|
|
|
|
|
|
|
Proceeds from issuance of common partnership units in exchange for contributions from Prologis, Inc. |
|
| 25,374 |
|
|
| 10,354 |
|
|
| 4,322 |
|
|
| 25,374 |
|
Distributions paid on common and preferred units |
|
| (489,519 | ) |
|
| (465,071 | ) |
|
| (536,150 | ) |
|
| (489,519 | ) |
Noncontrolling interests contributions |
|
| 135,857 |
|
|
| 825 |
|
|
| 26,174 |
|
|
| 135,857 |
|
Noncontrolling interests distributions |
|
| (81,169 | ) |
|
| (195,386 | ) |
|
| (100,619 | ) |
|
| (81,169 | ) |
Purchase of noncontrolling interests |
|
| (789,626 | ) |
|
| (2,128 | ) | ||||||||
Settlement of noncontrolling interests |
|
| (5,949 | ) |
|
| (789,626 | ) | ||||||||
Redemption of common limited partnership units |
|
| (17,819 | ) |
|
| - |
| ||||||||
Tax paid for shares withheld |
|
| (18,894 | ) |
|
| (7,301 | ) |
|
| (26,694 | ) |
|
| (18,894 | ) |
Debt and capital issuance costs paid |
|
| (6,151 | ) |
|
| (14,865 | ) | ||||||||
Debt issuance costs paid |
|
| (6,386 | ) |
|
| (6,151 | ) | ||||||||
Net payments on credit facilities |
|
| (33,745 | ) |
|
| (3,515 | ) |
|
| (307,086 | ) |
|
| (33,745 | ) |
Repurchase and payments of debt |
|
| (2,002,519 | ) |
|
| (1,277,311 | ) |
|
| (1,251,830 | ) |
|
| (2,002,519 | ) |
Proceeds from issuance of debt |
|
| 2,134,041 |
|
|
| 517,045 |
|
|
| 1,721,793 |
|
|
| 2,134,041 |
|
Net cash used in financing activities |
|
| (1,126,351 | ) |
|
| (1,437,353 | ) |
|
| (500,244 | ) |
|
| (1,126,351 | ) |
|
|
|
|
|
|
|
|
|
|
|
|
|
|
|
|
|
Effect of foreign currency exchange rate changes on cash |
|
| 15,733 |
|
|
| 12,051 |
|
|
| (5,422 | ) |
|
| 15,733 |
|
Net increase (decrease) in cash and cash equivalents |
|
| (535,962 | ) |
|
| 68,141 |
|
|
| 80,784 |
|
|
| (535,962 | ) |
Cash and cash equivalents, beginning of period |
|
| 807,316 |
|
|
| 264,080 |
|
|
| 447,046 |
|
|
| 807,316 |
|
Cash and cash equivalents, end of period |
| $ | 271,354 |
|
| $ | 332,221 |
|
| $ | 527,830 |
|
| $ | 271,354 |
|
See Note 11 for information on noncash investing and financing activities and other information.
The accompanying notes are an integral part of these Consolidated Financial Statements.
PROLOGIS, INC. AND PROLOGIS, L.P.
NOTES TO THE CONSOLIDATED FINANCIAL STATEMENTS
(Unaudited)
Business. Prologis, Inc. (or the “Parent”) commenced operations as a fully integrated real estate company in 1997, elected to be taxed as a real estate investment trust (“REIT”) under the Internal Revenue Code of 1986, as amended (the “Internal Revenue Code”), and believes the current organization and method of operation will enable it to maintain its status as a REIT. The Parent is the general partner of Prologis, L.P. (or the “Operating Partnership” or “OP”). Through the Operating Partnership,OP, we are engaged in the ownership, acquisition, development and management of logistics propertiesfacilities with a focus on high-barrier, high-growth markets in 19 countries. We invest in real estate through wholly owned subsidiaries and other entities through which we co-invest with partners and investors. We maintain a significant level of ownership in these co-investment ventures, which may be consolidated or unconsolidated based on our level of control of the world’s primary population centers and in those supported by extensive transportation infrastructure.entity. Our current business strategy consists of two operating business segments: Real Estate Operations and Strategic Capital. Our Real Estate Operations segment represents the ownership and development of logistics properties. Our Strategic Capital segment represents the management of unconsolidated co-investment ventures and other unconsolidated entities.ventures. See Note 10 for further discussion of our business segments. Unless otherwise indicated, the Notes to the Consolidated Financial Statements apply to both the Parent and the Operating Partnership.OP. The terms “the Company,” “Prologis,” “we,” “our” or “us” means the Parent and Operating PartnershipOP collectively.
For each share of common stockpreferred or preferredcommon stock the Parent issues, the Operating PartnershipOP issues a corresponding commonpreferred or preferredcommon partnership unit, as applicable, to the Parent in exchange for the contribution of the proceeds from the stock issuance. At June 30, 2017,2018, the Parent owned an approximate 97.33%97.11% common general partnership interest in the Operating PartnershipOP and 100% of the preferred units in the Operating Partnership.OP. The remaining approximate 2.67%2.89% common limited partnership interests, which include 8.98.8 million Class A common limited partnership units (“Class A Units”) in the Operating Partnership,OP, are owned by unaffiliated investors and certain current and former directors and officers of the Parent. Each partner’s percentage interest in the Operating PartnershipOP is determined based on the number of Operating PartnershipOP units held, including the number of Operating PartnershipOP units into which Class A Units are convertible, compared to total Operating PartnershipOP units outstanding at each period end and is used as the basis for the allocation of net income or loss to each partner. At the end of each reporting period, a capital adjustment is made in the Operating PartnershipOP to reflect the appropriate ownership interest for each of the common unitholders. These adjustments are reflected in the line items Reallocation of Equity in the Consolidated Statement of Equity of the Parent and Reallocation of Capital in the Consolidated Statement of Capital.Capital of the OP.
As the sole general partner of the Operating Partnership,OP, the Parent has complete responsibility and discretion in the day-to-day management and control of the Operating PartnershipOP and we operate the Parent and the Operating PartnershipOP as one enterprise. The management of the Parent consists of the same members as the management of the Operating Partnership.OP. These members are officers of the Parent and employees of the Operating PartnershipOP or one of its subsidiaries. As general partner with control of the Operating Partnership,OP, the Parent is the primary beneficiary and therefore consolidates the Operating Partnership.OP. Because the Parent’s only significant asset is its investment in the Operating Partnership,OP, the assets and liabilities of the Parent and the Operating PartnershipOP are the same on their respective financial statements.
Basis of Presentation. The accompanying Consolidated Financial Statements are prepared in accordance with United States (“U.S.”) generally accepted accounting principles (“GAAP”) and are presented in our reporting currency, the U.S. dollar. All material intercompany transactions with consolidated entities have been eliminated.
The accompanying unaudited interim financial information has been prepared according to the rules and regulations of the U.S. Securities and Exchange Commission (“SEC”). Certain information and footnotenote disclosures normally included in our annual financial statements prepared in accordance with GAAP have been condensed or omitted in accordance with such rules and regulations. Our management believes that the disclosures presented in these financial statements are adequate to make the information presented not misleading. In our opinion, all adjustments and eliminations, consisting only of normal recurring adjustments, necessary to present fairly the financial position and results of operations for both the Parent and the Operating PartnershipOP for the reported periods have been included. The results of operations for such interim periods are not necessarily indicative of the results for the full year. The accompanying unaudited interim financial information should be read in conjunction with our Annual Report on Form 10-K for the fiscal year ended December 31, 2016,2017, as filed with the SEC, and other public information.
Certain amounts included in the accompanying Consolidated Financial Statements for 2016 have been reclassified to conform to the 2017 financial statement presentation. This included two reclassifications made in the Consolidated Statements of Cash Flows. The first was a reclassification of distributions from our unconsolidated entities from investing activities to operating activities due to the adoption of the accounting standard update in 2016 that provided guidance for areas in which there was diversity in how certain cash receipts and payments were presented and classified. The second was the reclassification of payments from operating activities to financing activities due to the accounting standard update in 2016 that amended the stock compensation requirements in existing GAAP.
New Accounting Pronouncements.
New Accounting Standards Adopted
Revenue Recognition. In January 2017,May 2014, the Financial Accounting Standards Board (“FASB”) issued an accounting standard update that clarifies the definition of a business. The update adds further guidance that assists preparers in evaluating whether a transaction will be accounted for as an
acquisition of an asset or a business. We expect most of our acquisitions of operating properties and portfolios of operating properties to qualify as asset acquisitions under the standard that permits the capitalization of acquisition costs to the basis of the acquired buildings. We adopted this standard on January 1, 2017, on a prospective basis, and the adoption did not have a significant impact on the Consolidated Financial Statements.
New Accounting Standards Issued but not yet Adopted
Revenue Recognition. In May 2014, the FASB issued an accounting standard update(“ASU”) that requires companies to use a five-step model to determine when to recognize revenue from customer contracts in an effort to increase consistency and comparability throughout global capital markets and across industries. We are evaluating each of our revenue streams and their related accounting policies under the standard. Rental revenues and recoveries earned from leasing our operating properties will be assessed with the adoption of the lease accounting standard update discussed below. Our evaluation under the revenue recognition standard also includes recurring fees and promotes earned from our co-investment ventures as well as sales to third parties and unconsolidated co-investment ventures. While we do not expect changes in the recognition of recurring fees earned, we are evaluating both the timing and measurement of promotes that may result in recognition when they are probable of being earned. For sales to third parties, primarily dispositions of real estate in exchange for cash with few contingencies, we do not expect the standard to significantly impact the recognition of or accounting treatment. In February 2017, the FASB issued an additional accounting standard updateASU that provides the accounting treatment for gains and losses from the derecognition of non-financial assets, including the accounting for partial sales. Upon adoptionsales of the standard, we will recognize, on a prospective basis, the entire gain attributed to sales to unconsolidated co-investment ventures rather than the third-party share we recognize today. For deferred gains from existing partial sales recorded prior to the adoption of the standard we will continue to recognize these gains into earnings over the lives of the assets. Bothreal estate properties.
We adopted the revenue recognition and derecognition of non-financial assets standards are effective for us(collectively “the new revenue recognition standard”) on January 1, 2018. In addition to the recognition changes discussed above, expanded quantitative and qualitative disclosures regarding revenue recognition will be required for contracts that are subject to these standards. We expect to adopt the standards2018, on a modified retrospective basis.
Rental revenues and recoveries earned from leasing our operating properties are excluded from this standard and will be assessed with the adoption of the lease ASU discussed below. Our evaluation under the new revenue recognition standard included recurring and
transactional fees and incentive fees (“promotes” or “promote revenues”) earned from our co-investment ventures as well as dispositions and contributions of real estate properties. There is no change in our recognition of recurring and transactional fees as we will continue to recognize these fees as we provide the services. Promote revenues are earned based on a venture’s cumulative returns over a certain time-period and the returns are determined by both the operating performance and real estate valuation of the venture, including highly variable inputs such as capitalization rates, interest rates and foreign currency exchange rates. As these key inputs are highly volatile and out of our control, and such volatility can materially impact our promotes period over period, we expect promote revenues will continue to be recognized at or near the end of the performance period. Accordingly, we do not expect significant changes in promote revenue recognition as a result of this ASU.
For dispositions of real estate properties to third parties, the standard will not impact the recognition of the sale. Beginning January 1, 2018, we recognized the entire gain attributed to contributions of real estate properties to unconsolidated entities. We previously recognized a gain on contribution only to the extent of the third-party ownership in the unconsolidated entity acquiring the property and deferred the portion of the gain related to our ownership. For discussion of net gains on contributions to unconsolidated entities recognized during the three and six months ended June 30, 2018 and 2017, see Note 2. For deferred gains from partial sales recorded prior to the adoption, we will continue to recognize these gains over the lives of the underlying real estate properties or at the time of disposition to a third party, as discussed in Note 3.
We adopted the practical expedient to only assess the recognition of revenue for open contracts during the transition period and there was no adjustment to the opening balance of retained earnings at January 1, 2018. The comparative information has not been restated and continues to be reported under the accounting standards in effect for that period.
New Accounting Standards Issued but not yet Adopted
Leases. In February 2016, the FASB issued an accounting standard updateASU that provides the principles for the recognition, measurement, presentation and disclosure of leases.
As a lessor. The accounting for lessors will remain largely unchanged from current GAAP; however, the standard requires that lessors expense, on an as-incurred basis, certain initial direct costs that are not incremental in negotiating a lease. Under existing standards, certain of these costs are capitalizable and therefore this new standard maywill result in certain of these costs being expensed as incurred after adoption. During the six months ended June 30, 2018 and 2017, we capitalized $10.5 million and $12.4 million, respectively, of internal costs related to our leasing activities. This standard may also impact the timing, recognition, presentation and disclosures related to our rental recoveries from tenants earned from leasing our operating properties.properties, although we do not expect a significant impact.
As a lessee. Under the standard, lessees apply a dual approach, classifying leases as either finance or operating leases. A lessee is required to record a right-of-use (“ROU”) asset and a lease liability for all leases with a term of greater than 12 months, regardless of their lease classification. We are a lessee onof ground leases and office space leases. At December 31, 2016,2017, we had approximately 90 ground and office space leases that will require us to measure and record a right-of-useROU asset and a lease liability upon adoption of the standard. There have been no significant changes to our ground and office space leases since December 31, 2016.2017. Details of our future minimum rental payments under these ground and office space leases are disclosed in Note 4 to the Annual Report on Form 10-K for the year ended December 31, 2017.
The standard is effective for us on January 1, 2019. We are assessingexpect to adopt the practical expedients available for implementation under the standard. If theBy adopting these practical expedients, are elected, we wouldwill not be required to reassess (i) whether an expired or existing contract meets the definition of a lease; (ii) the lease classification at the adoption date for expired or existing leases; and (iii) whether costs previously capitalized as initial direct costs would continue to be amortized. This allows us to continue to account for our ground and office space leases as operating leases, however, any new or renewed ground leases may be classified as financing leases unless they meet certain conditions to be considered a lease involving facilities owned by a government unit or authority. The standard will also require new disclosures within the accompanying notes accompanyingto the Consolidated Financial Statements. WeWhile we are well into our analysis of the adoption, we will continue to evaluate the key drivers in the measurement of the ROU asset and lease liability and assess the method of adoption and the overall impact the adoption will have on the Consolidated Financial Statements.Statements based on industry practice and potential updates to the ASU.
Derivatives and Hedging. In August 2017, the FASB issued an ASU that simplifies the application of hedge accounting guidance in current GAAP and improves the reporting of hedging relationships to better portray the economic results of an entity’s risk management activities in its consolidated financial statements. Among the simplification updates, the standard eliminates the requirement in current GAAP to separately recognize periodic hedge ineffectiveness. Mismatches between the changes in value of the hedged item and hedging instrument may still occur but they will no longer be separately reported. The standard requires the presentation of the earnings effect of the hedging instrument in the same income statement line item in which the earnings effect of the hedged item is reported. The standard is effective for us on January 1, 2019, but early adoption is permitted. We do not expect the adoption of this standard to have a material impact on the Consolidated Financial Statements.
Investments in real estate properties consisted of the following (dollars and square feet in thousands):
| Square Feet |
|
| Number of Buildings |
|
|
|
| Square Feet |
|
| Number of Buildings |
|
|
|
| ||||||||||||||||||||||||||||||
| June 30, |
|
| December 31, |
|
| June 30, |
|
| December 31, |
|
| June 30, |
|
| December 31, |
| June 30, |
|
| December 31, |
|
| June 30, |
|
| December 31, |
|
| June 30, |
|
| December 31, |
| ||||||||||||
| 2017 |
|
| 2016 |
|
| 2017 |
|
| 2016 |
|
| 2017 |
|
| 2016 |
| 2018 |
|
| 2017 |
|
| 2018 |
|
| 2017 |
|
| 2018 |
|
| 2017 |
| ||||||||||||
Operating properties |
|
|
|
|
|
|
|
|
|
|
|
|
|
|
|
|
|
|
|
|
|
|
| |||||||||||||||||||||||
Operating properties (1): |
|
|
|
|
|
|
|
|
|
|
|
|
|
|
|
|
|
|
|
|
|
|
| |||||||||||||||||||||||
Buildings and improvements |
| 332,282 |
|
|
| 331,210 |
|
|
| 1,752 |
|
|
| 1,776 |
|
| $ | 18,273,094 |
|
| $ | 17,905,914 |
|
| 287,393 |
|
|
| 294,811 |
|
|
| 1,477 |
|
|
| 1,525 |
|
| $ | 16,658,627 |
|
| $ | 16,849,349 |
|
Improved land |
|
|
|
|
|
|
|
|
|
|
|
|
|
|
|
|
| 6,139,322 |
|
|
| 6,037,543 |
|
|
|
|
|
|
|
|
|
|
|
|
|
|
|
|
|
| 5,608,507 |
|
|
| 5,735,978 |
|
Development portfolio, including land costs: |
|
|
|
|
|
|
|
|
|
|
|
|
|
|
|
|
|
|
|
|
|
|
|
|
|
|
|
|
|
|
|
|
|
|
|
|
|
|
|
|
|
|
|
|
|
|
Prestabilized |
| 5,878 |
|
|
| 8,256 |
|
|
| 22 |
|
|
| 29 |
|
|
| 526,442 |
|
|
| 798,233 |
|
| 6,024 |
|
|
| 7,345 |
|
|
| 20 |
|
|
| 22 |
|
|
| 471,491 |
|
|
| 546,173 |
|
Properties under development |
| 22,325 |
|
|
| 19,539 |
|
|
| 55 |
|
|
| 60 |
|
|
| 962,851 |
|
|
| 633,849 |
|
| 21,317 |
|
|
| 22,216 |
|
|
| 63 |
|
|
| 63 |
|
|
| 1,184,404 |
|
|
| 1,047,316 |
|
Land (1) |
|
|
|
|
|
|
|
|
|
|
|
|
|
|
|
|
| 1,081,897 |
|
|
| 1,218,904 |
| |||||||||||||||||||||||
Land (1) (2) |
|
|
|
|
|
|
|
|
|
|
|
|
|
|
|
|
| 1,111,185 |
|
|
| 1,154,383 |
| |||||||||||||||||||||||
Other real estate investments |
|
|
|
|
|
|
|
|
|
|
|
|
|
|
|
|
| 517,678 |
|
|
| 524,887 |
|
|
|
|
|
|
|
|
|
|
|
|
|
|
|
|
|
| 521,129 |
|
|
| 505,445 |
|
Total investments in real estate properties |
|
|
|
|
|
|
|
|
|
|
|
|
|
|
|
|
| 27,501,284 |
|
|
| 27,119,330 |
|
|
|
|
|
|
|
|
|
|
|
|
|
|
|
|
|
| 25,555,343 |
|
|
| 25,838,644 |
|
Less accumulated depreciation |
|
|
|
|
|
|
|
|
|
|
|
|
|
|
|
|
| 4,026,369 |
|
|
| 3,758,372 |
|
|
|
|
|
|
|
|
|
|
|
|
|
|
|
|
|
| 4,283,877 |
|
|
| 4,059,348 |
|
Net investments in real estate properties |
|
|
|
|
|
|
|
|
|
|
|
|
|
|
|
| $ | 23,474,915 |
|
| $ | 23,360,958 |
|
|
|
|
|
|
|
|
|
|
|
|
|
|
|
|
| $ | 21,271,466 |
|
| $ | 21,779,296 |
|
(1) | During the six months ended June 30, 2018, we acquired 808 acres of land for $211.2 million and 3 operating properties for $103.1 million. |
(2) | Included in our investments in real estate at June 30, |
| Included in other real estate investments |
Dispositions
The following table summarizes our real estate disposition activity for the three and six months ended June 30 (dollars and square feet in thousands):
|
| Three Months Ended June 30, |
|
| Six Months Ended June 30, |
|
| Three Months Ended June 30, |
|
| Six Months Ended June 30, |
| ||||||||||||||||||||
|
| 2017 |
|
| 2016 |
|
| 2017 |
|
| 2016 |
|
| 2018 |
|
| 2017 |
|
| 2018 |
|
| 2017 |
| ||||||||
Contributions to unconsolidated co-investment ventures |
|
|
|
|
|
|
|
|
|
|
|
|
|
|
|
|
|
|
|
|
|
|
|
|
|
|
|
|
|
|
|
|
Number of properties |
|
| 5 |
|
|
| 5 |
|
|
| 10 |
|
|
| 10 |
|
|
| 3 |
|
|
| 5 |
|
|
| 11 |
|
|
| 10 |
|
Square feet |
|
| 875 |
|
|
| 1,308 |
|
|
| 3,644 |
|
|
| 4,019 |
|
|
| 1,164 |
|
|
| 875 |
|
|
| 4,242 |
|
|
| 3,644 |
|
Net proceeds (1) |
| $ | 115,617 |
|
| $ | 65,805 |
|
| $ | 513,106 |
|
| $ | 463,700 |
|
| $ | 125,917 |
|
| $ | 115,617 |
|
| $ | 665,739 |
|
| $ | 513,106 |
|
Gains on contributions, net (1) |
| $ | 37,702 |
|
| $ | 10,451 |
|
| $ | 126,068 |
|
| $ | 103,590 |
| ||||||||||||||||
Gains on contributions, net (1) (2) |
| $ | 33,527 |
|
| $ | 37,702 |
|
| $ | 201,253 |
|
| $ | 126,068 |
| ||||||||||||||||
Dispositions to third parties |
|
|
|
|
|
|
|
|
|
|
|
|
|
|
|
|
|
|
|
|
|
|
|
|
|
|
|
|
|
|
|
|
Number of properties |
|
| 20 |
|
|
| 72 |
|
|
| 38 |
|
|
| 99 |
|
|
| 7 |
|
|
| 20 |
|
|
| 18 |
|
|
| 38 |
|
Square feet |
|
| 3,720 |
|
|
| 8,321 |
|
|
| 6,038 |
|
|
| 10,565 |
|
|
| 4,139 |
|
|
| 3,720 |
|
|
| 5,442 |
|
|
| 6,038 |
|
Net proceeds (1) |
| $ | 216,290 |
|
| $ | 609,028 |
|
| $ | 459,679 |
|
| $ | 889,607 |
|
| $ | 314,141 |
|
| $ | 216,290 |
|
| $ | 402,122 |
|
| $ | 459,679 |
|
Gains on dispositions, net (1) |
| $ | 45,304 |
|
| $ | 103,284 |
|
| $ | 54,263 |
|
| $ | 154,462 |
|
| $ | 60,734 |
|
| $ | 45,304 |
|
| $ | 88,119 |
|
| $ | 54,263 |
|
|
|
|
|
|
|
|
|
|
|
|
|
|
|
|
|
|
|
|
|
|
|
|
|
|
|
|
|
|
|
|
|
|
Total gains on contributions and dispositions, net |
| $ | 83,006 |
|
| $ | 113,735 |
|
| $ | 180,331 |
|
| $ | 258,052 |
| ||||||||||||||||
Gains on redemption of investment in co-investment ventures (3) |
|
| - |
|
|
| 86,615 |
|
|
| - |
|
|
| 86,615 |
| ||||||||||||||||
Total gains on dispositions of investments in real estate, net |
| $ | 83,006 |
|
| $ | 200,350 |
|
| $ | 180,331 |
|
| $ | 344,667 |
|
| $ | 94,261 |
|
| $ | 83,006 |
|
| $ | 289,372 |
|
| $ | 180,331 |
|
(1) | Includes the contribution and disposition of land parcels. |
(2) |
|
(3) |
|
NOTE 3. UNCONSOLIDATED ENTITIES
Summary of Investments
We have investments in entities through a variety of ventures. We co-invest in entities that own multiple properties with partners and investors and we provide asset and property management services to these entities, which we refer to as co-investment ventures. These entities may be consolidated or unconsolidated, depending on the structure, our partner’s participation and other rights and our level of control of the entity. This note details our investments in unconsolidated co-investment ventures, which are accounted for using the equity method of accounting. See Note 6 for more detail regarding our consolidated investments.investments that are not wholly owned.
We also have other ventures, generally with one partner and that we do not manage, which we account for primarily using the equity method. We refer to our investments in all entities accounted for using the equity method, both unconsolidated co-investment ventures and other ventures, collectively, as unconsolidated entities.
The following table summarizes our investments in and advances to our unconsolidated entities (in thousands):
|
| June 30, |
|
| December 31, |
|
| June 30, |
|
| December 31, |
| ||||
|
| 2017 |
|
| 2016 |
|
| 2018 |
|
| 2017 |
| ||||
Unconsolidated co-investment ventures |
| $ | 4,382,825 |
|
| $ | 4,057,524 |
|
| $ | 5,207,093 |
|
| $ | 5,274,702 |
|
Other ventures |
|
| 234,899 |
|
|
| 172,905 |
|
|
| 207,530 |
|
|
| 221,748 |
|
Totals |
| $ | 4,617,724 |
|
| $ | 4,230,429 |
| ||||||||
Total |
| $ | 5,414,623 |
|
| $ | 5,496,450 |
| ||||||||
|
|
|
|
|
|
|
|
|
|
|
|
|
|
|
|
|
Unconsolidated Co-Investment Ventures
The amounts recognized in Strategic Capital Revenues and Earnings from Unconsolidated Entities, Net depend on the size and operations of the co-investment ventures, the timing of revenues earned through promotes during the life of a venture or upon liquidation, as well as fluctuations in foreign currency exchange rates. We recognized Strategic Capital Expenses for direct costs associated with the asset management of these ventures and allocated property-level management costs for the properties owned by the ventures. Our ownership interest in these ventures also impacts the earnings we recognize.
The following table summarizes the amountsStrategic Capital Revenues we recognized in the Consolidated Statements of Income related to theour unconsolidated co-investment ventures (in thousands):
|
| Three Months Ended June 30, |
|
| Six Months Ended June 30, |
| ||||||||||
|
| 2017 |
|
| 2016 |
|
| 2017 |
|
| 2016 |
| ||||
Strategic capital revenues from unconsolidated co-investment ventures, net: |
|
|
|
|
|
|
|
|
|
|
|
|
|
|
|
|
U.S. (1) |
| $ | 130,165 |
|
| $ | 9,179 |
|
| $ | 141,223 |
|
| $ | 18,174 |
|
Other Americas (1) |
|
| 9,864 |
|
|
| 5,693 |
|
|
| 15,915 |
|
|
| 11,079 |
|
Europe |
|
| 25,957 |
|
|
| 25,435 |
|
|
| 52,127 |
|
|
| 47,768 |
|
Asia |
|
| 14,064 |
|
|
| 12,654 |
|
|
| 26,719 |
|
|
| 26,255 |
|
Total strategic capital revenues from unconsolidated co-investment ventures, net |
| $ | 180,050 |
|
| $ | 52,961 |
|
| $ | 235,984 |
|
| $ | 103,276 |
|
|
|
|
|
|
|
|
|
|
|
|
|
|
|
|
|
|
Earnings from unconsolidated co-investment ventures, net: |
|
|
|
|
|
|
|
|
|
|
|
|
|
|
|
|
U.S. |
| $ | 1,963 |
|
| $ | 718 |
|
| $ | 6,909 |
|
| $ | 7,377 |
|
Other Americas |
|
| 8,933 |
|
|
| 7,509 |
|
|
| 15,503 |
|
|
| 12,808 |
|
Europe |
|
| 35,859 |
|
|
| 29,014 |
|
|
| 65,764 |
|
|
| 60,593 |
|
Asia |
|
| 14,410 |
|
|
| 3,693 |
|
|
| 18,439 |
|
|
| 7,348 |
|
Total earnings from unconsolidated co-investment ventures, net |
| $ | 61,165 |
|
| $ | 40,934 |
|
| $ | 106,615 |
|
| $ | 88,126 |
|
|
|
|
|
|
|
|
|
|
|
|
|
|
|
|
|
|
|
| Three Months Ended June 30, |
|
| Six Months Ended June 30, |
| ||||||||||
|
| 2018 |
|
| 2017 |
|
| 2018 |
|
| 2017 |
| ||||
Recurring fees |
| $ | 57,918 |
|
| $ | 43,478 |
|
| $ | 112,562 |
|
| $ | 87,673 |
|
Transactional fees |
|
| 11,828 |
|
|
| 12,626 |
|
|
| 27,452 |
|
|
| 21,219 |
|
Promote revenues |
|
| 5,674 |
|
|
| 123,946 |
|
|
| 68,218 |
|
|
| 127,092 |
|
Total strategic capital revenues from unconsolidated co-investment ventures |
| $ | 75,420 |
|
| $ | 180,050 |
|
| $ | 208,232 |
|
| $ | 235,984 |
|
|
|
|
|
|
|
|
|
|
|
|
|
|
|
|
|
|
|
|
The following tables summarizetable summarizes the key property information, financial position and operating information and financial position of our unconsolidated co-investment ventures (not our proportionate share), as presented at and the amounts we recognized in the Consolidated Financial Statements related to our adjusted basis derived from the ventures’ U.S. GAAP information:unconsolidated co-investment ventures (dollars and square feet in millions):
|
| June 30, |
|
| December 31, |
|
| June 30, |
| |||
(dollars and square feet in millions) |
| 2017 |
|
| 2016 |
|
| 2016 |
| |||
U.S.: |
|
|
|
|
|
|
|
|
|
|
|
|
Number of ventures |
|
| 1 |
|
|
| 1 |
|
|
| 1 |
|
Number of operating properties owned |
|
| 384 |
|
|
| 369 |
|
|
| 379 |
|
Square feet |
|
| 52 |
|
|
| 50 |
|
|
| 49 |
|
Total assets |
| $ | 4,346 |
|
| $ | 4,238 |
|
| $ | 4,228 |
|
Third-party debt |
| $ | 1,400 |
|
| $ | 1,414 |
|
| $ | 1,425 |
|
Total liabilities |
| $ | 1,620 |
|
| $ | 1,540 |
|
| $ | 1,504 |
|
Our investment balance (1) |
| $ | 545 |
|
| $ | 435 |
|
| $ | 518 |
|
Our weighted average ownership (2) |
|
| 14.2 | % |
|
| 14.9 | % |
|
| 17.6 | % |
Other Americas: |
|
|
|
|
|
|
|
|
|
|
|
|
Number of ventures |
|
| 2 |
|
|
| 2 |
|
|
| 2 |
|
Number of operating properties owned |
|
| 215 |
|
|
| 213 |
|
|
| 209 |
|
Square feet |
|
| 43 |
|
|
| 42 |
|
|
| 41 |
|
Total assets |
| $ | 2,791 |
|
| $ | 2,793 |
|
| $ | 2,694 |
|
Third-party debt |
| $ | 728 |
|
| $ | 739 |
|
| $ | 677 |
|
Total liabilities |
| $ | 812 |
|
| $ | 814 |
|
| $ | 772 |
|
Our investment balance (1) |
| $ | 836 |
|
| $ | 845 |
|
| $ | 848 |
|
Our weighted average ownership (2) |
|
| 44.0 | % |
|
| 43.9 | % |
|
| 43.6 | % |
Europe: |
|
|
|
|
|
|
|
|
|
|
|
|
Number of ventures (3) (4) |
|
| 4 |
|
|
| 4 |
|
|
| 4 |
|
Number of operating properties owned |
|
| 702 |
|
|
| 700 |
|
|
| 690 |
|
Square feet |
|
| 164 |
|
|
| 163 |
|
|
| 160 |
|
Total assets |
| $ | 12,178 |
|
| $ | 10,853 |
|
| $ | 11,188 |
|
Third-party debt |
| $ | 2,595 |
|
| $ | 2,446 |
|
| $ | 2,566 |
|
Total liabilities |
| $ | 3,536 |
|
| $ | 3,283 |
|
| $ | 3,521 |
|
Our investment balance (1) |
| $ | 2,505 |
|
| $ | 2,327 |
|
| $ | 2,464 |
|
Our weighted average ownership (2) |
|
| 33.0 | % |
|
| 35.1 | % |
|
| 36.2 | % |
Asia: |
|
|
|
|
|
|
|
|
|
|
|
|
Number of ventures |
|
| 2 |
|
|
| 2 |
|
|
| 2 |
|
Number of operating properties owned |
|
| 83 |
|
|
| 85 |
|
|
| 77 |
|
Square feet |
|
| 36 |
|
|
| 36 |
|
|
| 34 |
|
Total assets |
| $ | 5,528 |
|
| $ | 5,173 |
|
| $ | 5,346 |
|
Third-party debt |
| $ | 2,088 |
|
| $ | 1,947 |
|
| $ | 1,952 |
|
Total liabilities |
| $ | 2,376 |
|
| $ | 2,239 |
|
| $ | 2,250 |
|
Our investment balance (1) |
| $ | 497 |
|
| $ | 451 |
|
| $ | 498 |
|
Our weighted average ownership (2) |
|
| 15.1 | % |
|
| 15.1 | % |
|
| 15.0 | % |
Total: |
|
|
|
|
|
|
|
|
|
|
|
|
Number of ventures |
|
| 9 |
|
|
| 9 |
|
|
| 9 |
|
Number of operating properties owned |
|
| 1,384 |
|
|
| 1,367 |
|
|
| 1,355 |
|
Square feet |
|
| 295 |
|
|
| 291 |
|
|
| 284 |
|
Total assets |
| $ | 24,843 |
|
| $ | 23,057 |
|
| $ | 23,456 |
|
Third-party debt |
| $ | 6,811 |
|
| $ | 6,546 |
|
| $ | 6,620 |
|
Total liabilities |
| $ | 8,344 |
|
| $ | 7,876 |
|
| $ | 8,047 |
|
Our investment balance (1) |
| $ | 4,383 |
|
| $ | 4,058 |
|
| $ | 4,328 |
|
Our weighted average ownership (2) |
|
| 26.9 | % |
|
| 27.9 | % |
|
| 28.8 | % |
| U.S. |
|
| Other Americas |
|
| Europe |
|
| Asia |
|
| Total |
| |||||||||||||||||||||||||
As of: | Jun 30, 2018 |
|
| Dec 31, 2017 |
|
| Jun 30, 2018 |
|
| Dec 31, 2017 |
|
| Jun 30, 2018 |
|
| Dec 31, 2017 |
|
| Jun 30, 2018 |
|
| Dec 31, 2017 |
|
| Jun 30, 2018 |
|
| Dec 31, 2017 |
| ||||||||||
Key property information |
|
|
|
|
|
|
|
|
|
|
|
|
|
|
|
|
|
|
|
|
|
|
|
|
|
|
|
|
|
|
|
|
|
|
|
|
|
|
|
Ventures |
| 1 |
|
|
| 1 |
|
|
| 2 |
|
|
| 2 |
|
|
| 3 |
|
|
| 3 |
|
|
| 2 |
|
|
| 2 |
|
|
| 8 |
|
|
| 8 |
|
Operating properties |
| 554 |
|
|
| 552 |
|
|
| 205 |
|
|
| 205 |
|
|
| 653 |
|
|
| 707 |
|
|
| 114 |
|
|
| 95 |
|
|
| 1,526 |
|
|
| 1,559 |
|
Square feet |
| 88 |
|
|
| 88 |
|
|
| 37 |
|
|
| 37 |
|
|
| 154 |
|
|
| 166 |
|
|
| 48 |
|
|
| 41 |
|
|
| 327 |
|
|
| 332 |
|
|
|
|
|
|
|
|
|
|
|
|
|
|
|
|
|
|
|
|
|
|
|
|
|
|
|
|
|
|
|
|
|
|
|
|
|
|
|
|
|
Financial position |
|
|
|
|
|
|
|
|
|
|
|
|
|
|
|
|
|
|
|
|
|
|
|
|
|
|
|
|
|
|
|
|
|
|
|
|
|
|
|
Unconsolidated co-investment ventures: |
| ||||||||||||||||||||||||||||||||||||||
Total assets ($) |
| 7,188 |
|
|
| 7,062 |
|
|
| 2,073 |
|
|
| 2,118 |
|
|
| 13,176 |
|
|
| 13,586 |
|
|
| 6,694 |
|
|
| 6,133 |
|
|
| 29,131 |
|
|
| 28,899 |
|
Third-party debt ($) |
| 2,098 |
|
|
| 2,313 |
|
|
| 752 |
|
|
| 756 |
|
|
| 2,650 |
|
|
| 2,682 |
|
|
| 2,577 |
|
|
| 2,328 |
|
|
| 8,077 |
|
|
| 8,079 |
|
Total liabilities ($) |
| 2,307 |
|
|
| 2,520 |
|
|
| 788 |
|
|
| 782 |
|
|
| 3,689 |
|
|
| 3,655 |
|
|
| 2,881 |
|
|
| 2,685 |
|
|
| 9,665 |
|
|
| 9,642 |
|
|
|
|
|
|
|
|
|
|
|
|
|
|
|
|
|
|
|
|
|
|
|
|
|
|
|
|
|
|
|
|
|
|
|
|
|
|
|
|
|
Our investment balance ($) (1) |
| 1,365 |
|
|
| 1,383 |
|
|
| 561 |
|
|
| 555 |
|
|
| 2,699 |
|
|
| 2,813 |
|
|
| 582 |
|
|
| 524 |
|
|
| 5,207 |
|
|
| 5,275 |
|
Our weighted average ownership (2) |
| 26.7 | % |
|
| 28.2 | % |
|
| 43.8 | % |
|
| 43.4 | % |
|
| 32.9 | % |
|
| 32.8 | % |
|
| 15.1 | % |
|
| 15.1 | % |
|
| 28.2 | % |
|
| 28.8 | % |
|
|
|
|
|
|
|
|
|
|
|
|
|
|
|
|
|
|
|
|
|
|
|
|
|
|
|
|
|
|
|
|
|
|
|
|
|
|
|
|
| U.S. |
|
| Other Americas |
|
| Europe |
|
| Asia |
|
| Total |
| |||||||||||||||||||||||||
Operating information | Jun 30, 2018 |
|
| Jun 30, 2017 |
|
| Jun 30, 2018 |
|
| Jun 30, 2017 |
|
| Jun 30, 2018 |
|
| Jun 30, 2017 |
|
| Jun 30, 2018 |
|
| Jun 30, 2017 |
|
| Jun 30, 2018 |
|
| Jun 30, 2017 |
| ||||||||||
For the three months ended: |
|
|
|
|
|
|
|
|
|
|
|
|
|
|
|
|
|
|
|
|
|
|
|
|
|
|
|
|
|
|
|
|
|
|
|
|
|
|
|
Unconsolidated co-investment ventures: |
| ||||||||||||||||||||||||||||||||||||||
Total revenues ($) |
| 168 |
|
|
| 105 |
|
|
| 55 |
|
|
| 66 |
|
|
| 272 |
|
|
| 248 |
|
|
| 114 |
|
|
| 89 |
|
|
| 609 |
|
|
| 508 |
|
Net earnings ($) |
| 24 |
|
|
| 15 |
|
|
| 19 |
|
|
| 22 |
|
|
| 110 |
|
|
| 93 |
|
|
| 6 |
|
|
| 93 |
|
|
| 159 |
|
|
| 223 |
|
|
|
|
|
|
|
|
|
|
|
|
|
|
|
|
|
|
|
|
|
|
|
|
|
|
|
|
|
|
|
|
|
|
|
|
|
|
|
|
|
Our earnings from unconsolidated co-investment ventures, net ($) |
| 7 |
|
|
| 2 |
|
|
| 8 |
|
|
| 10 |
|
|
| 37 |
|
|
| 36 |
|
|
| 2 |
|
|
| 14 |
|
|
| 54 |
|
|
| 62 |
|
|
|
|
|
|
|
|
|
|
|
|
|
|
|
|
|
|
|
|
|
|
|
|
|
|
|
|
|
|
|
|
|
|
|
|
|
|
|
|
|
For the six months ended: |
|
|
|
|
|
|
|
|
|
|
|
|
|
|
|
|
|
|
|
|
|
|
|
|
|
|
|
|
|
|
|
|
|
|
|
|
|
|
|
Unconsolidated co-investment ventures: |
| ||||||||||||||||||||||||||||||||||||||
Total revenues ($) |
| 336 |
|
|
| 209 |
|
|
| 108 |
|
|
| 130 |
|
|
| 560 |
|
|
| 492 |
|
|
| 222 |
|
|
| 177 |
|
|
| 1,226 |
|
|
| 1,008 |
|
Net earnings ($) |
| 37 |
|
|
| 51 |
|
|
| 33 |
|
|
| 39 |
|
|
| 203 |
|
|
| 166 |
|
|
| 48 |
|
|
| 117 |
|
|
| 321 |
|
|
| 373 |
|
|
|
|
|
|
|
|
|
|
|
|
|
|
|
|
|
|
|
|
|
|
|
|
|
|
|
|
|
|
|
|
|
|
|
|
|
|
|
|
|
Our earnings from unconsolidated co-investment ventures, net ($) |
| 12 |
|
|
| 7 |
|
|
| 14 |
|
|
| 16 |
|
|
| 74 |
|
|
| 66 |
|
|
| 9 |
|
|
| 18 |
|
|
| 109 |
|
|
| 107 |
|
|
| Three Months Ended June 30, |
|
| Six Months Ended June 30, |
| ||||||||||
(in millions) |
| 2017 |
|
| 2016 |
|
| 2017 |
|
| 2016 |
| ||||
Revenues: |
|
|
|
|
|
|
|
|
|
|
|
|
|
|
|
|
U.S. |
| $ | 105 |
|
| $ | 98 |
|
| $ | 209 |
|
| $ | 196 |
|
Other Americas |
|
| 66 |
|
|
| 59 |
|
|
| 130 |
|
|
| 116 |
|
Europe |
|
| 248 |
|
|
| 248 |
|
|
| 492 |
|
|
| 492 |
|
Asia |
|
| 89 |
|
|
| 86 |
|
|
| 177 |
|
|
| 162 |
|
Total revenues |
| $ | 508 |
|
| $ | 491 |
|
| $ | 1,008 |
|
| $ | 966 |
|
|
|
|
|
|
|
|
|
|
|
|
|
|
|
|
|
|
Net earnings: |
|
|
|
|
|
|
|
|
|
|
|
|
|
|
|
|
U.S. |
| $ | 15 |
|
| $ | 6 |
|
| $ | 51 |
|
| $ | 36 |
|
Other Americas |
|
| 22 |
|
|
| 19 |
|
|
| 39 |
|
|
| 33 |
|
Europe |
|
| 93 |
|
|
| 68 |
|
|
| 166 |
|
|
| 141 |
|
Asia |
|
| 93 |
|
|
| 22 |
|
|
| 117 |
|
|
| 44 |
|
Total net earnings |
| $ | 223 |
|
| $ | 115 |
|
| $ | 373 |
|
| $ | 254 |
|
|
|
|
|
|
|
|
|
|
|
|
|
|
|
|
|
|
(1) | Prologis’ investment balance is presented at our adjusted basis derived from the ventures’ U.S. GAAP information. The difference between our ownership interest of a venture’s equity and our investment balance at June 30, |
(2) | Represents our weighted average ownership interest in all co-investment ventures based on each entity’s contribution of total assets, before depreciation, net of other liabilities. |
|
|
|
|
In July 2017, we contributed 190 operating properties formerly owned by Prologis North American Industrial Fund (“NAIF”), totaling approximately 39 million square feet, for an aggregate purchase price of $2.8 billion, to USLF, our unconsolidated co-investment venture. We received cash proceeds of $720 million and additional units, which increased our ownership interest in USLF to approximately 27% and USLF assumed $956.0 million of secured debt. As a result of this transaction, we expect to record a gain of approximately $480 million, net of a deferral due to our ongoing investment, in the third quarter of 2017.
Equity Commitments Related to Certain Unconsolidated Co-Investment Ventures
The following table summarizes the remaining equity commitments at June 30, 20172018 (in millions):
|
| Equity Commitments |
|
| Expiration Date for Remaining Commitments | |||||||||
|
| Prologis |
|
| Venture Partners |
|
| Total |
|
|
| |||
Prologis Targeted Europe Logistics Fund (1) |
| $ | - |
|
| $ | 346 |
|
| $ | 346 |
|
| 2017 - 2018 |
Prologis United Kingdom Logistics Venture (2) |
|
| 35 |
|
|
| 201 |
|
|
| 236 |
|
| 2021 |
Prologis China Logistics Venture |
|
| 294 |
|
|
| 1,665 |
|
|
| 1,959 |
|
| 2017 |
Totals |
| $ | 329 |
|
| $ | 2,212 |
|
| $ | 2,541 |
|
|
|
|
| Equity Commitments |
|
| Expiration Date | |||||||||
|
| Prologis |
|
| Venture Partners |
|
| Total |
|
|
| |||
Prologis Targeted U.S. Logistics Fund |
| $ | - |
|
| $ | 178 |
|
| $ | 178 |
|
| 2019 |
Prologis European Logistics Fund (1) |
|
| - |
|
|
| 1,201 |
|
|
| 1,201 |
|
| 2018 – 2019 |
Prologis UK Logistics Venture (2) |
|
| 18 |
|
|
| 102 |
|
|
| 120 |
|
| 2021 |
Prologis China Logistics Venture |
|
| 267 |
|
|
| 1,510 |
|
|
| 1,777 |
|
| 2020 – 2024 |
Total |
| $ | 285 |
|
| $ | 2,991 |
|
| $ | 3,276 |
|
|
|
(1) | Equity commitments are denominated in euro and reported in U.S. dollars based on an exchange rate of |
NOTE 4. ASSETS HELD FOR SALE OR CONTRIBUTION
We have investments in certain real estate properties that met the criteria to be classified as held for sale or contribution at June 30, 2017,2018 and December 31, 2016. These2017. At the time of classification, these properties arewere expected to be sold to third parties or were recently developed and expected to be contributed to unconsolidated co-investment ventures within twelve months. The amounts included in Assets Held for Sale or Contributionrepresented real estate investment balances and the related assets and liabilities for each property.
Assets held for sale or contribution consisted of the following (dollars and square feet in thousands):
|
| June 30, |
|
| December 31, |
|
| June 30, |
|
| December 31, |
| ||||
|
| 2017 |
|
| 2016 |
|
| 2018 |
|
| 2017 |
| ||||
Number of operating properties |
|
| 22 |
|
|
| 13 |
|
|
| 73 |
|
|
| 22 |
|
Square feet |
|
| 4,886 |
|
|
| 4,167 |
|
|
| 14,735 |
|
|
| 5,384 |
|
Total assets held for sale or contribution |
| $ | 350,987 |
|
| $ | 322,139 |
|
| $ | 892,546 |
|
| $ | 342,060 |
|
Total liabilities associated with assets held for sale or contribution – included in Other Liabilities |
| $ | 6,281 |
|
| $ | 4,984 |
|
| $ | 22,829 |
|
| $ | 9,341 |
|
All debt is incurred by the Operating Partnership.OP. The Parent does not have any indebtedness, but guarantees the unsecured debt ofissued by the Operating Partnership.OP.
The following table summarizes our debt (dollars in thousands):
|
| June 30, 2017 |
|
| December 31, 2016 |
|
| June 30, 2018 |
|
| December 31, 2017 |
| ||||||||||||||||||||
|
| Weighted Average Interest Rate (1) |
|
| Amount Outstanding (2) |
|
| Weighted Average Interest Rate (1) |
|
| Amount Outstanding |
|
| Weighted Average Interest Rate (1) |
|
| Amount Outstanding (2) |
|
| Weighted Average Interest Rate (1) |
|
| Amount Outstanding (2) |
| ||||||||
Credit facilities |
|
| - |
|
| $ | - |
|
|
| 1.0 | % |
| $ | 35,023 |
|
|
| 0.9 | % |
| $ | 11,658 |
|
|
| 1.8 | % |
| $ | 317,392 |
|
Senior notes |
|
| 3.1 | % |
|
| 6,727,450 |
|
|
| 3.3 | % |
|
| 6,417,492 |
|
|
| 2.9 | % |
|
| 7,102,381 |
|
|
| 3.0 | % |
|
| 6,067,277 |
|
Term loans |
|
| 1.6 | % |
|
| 1,954,091 |
|
|
| 1.4 | % |
|
| 1,484,523 |
|
|
| 1.2 | % |
|
| 1,402,568 |
|
|
| 1.7 | % |
|
| 2,046,945 |
|
Unsecured other |
|
| 6.1 | % |
|
| 14,346 |
|
|
| 6.1 | % |
|
| 14,478 |
|
|
| 6.1 | % |
|
| 13,093 |
|
|
| 6.1 | % |
|
| 13,546 |
|
Secured mortgages |
|
| 3.9 | % |
|
| 1,983,623 |
|
|
| 4.9 | % |
|
| 979,585 |
|
|
| 5.5 | % |
|
| 897,424 |
|
|
| 5.3 | % |
|
| 967,471 |
|
Secured mortgages of consolidated entities (3) |
|
| 2.7 | % |
|
| 402,412 |
|
|
| 3.0 | % |
|
| 1,677,193 |
| ||||||||||||||||
Totals |
|
| 3.0 | % |
| $ | 11,081,922 |
|
|
| 3.2 | % |
| $ | 10,608,294 |
| ||||||||||||||||
Total |
|
| 2.9 | % |
| $ | 9,427,124 |
|
|
| 2.9 | % |
| $ | 9,412,631 |
| ||||||||||||||||
(1) | The interest rates presented represent the effective interest rates (including amortization of debt issuance costs and the noncash premiums or discounts) at the end of the period for the debt |
(2) | Included in the outstanding balances |
|
|
|
|
| June 30, 2018 |
|
| December 31, 2017 |
| ||
| British pound sterling |
| $ | 653,632 |
|
| $ | 671,522 |
|
| Canadian dollar |
|
| 274,180 |
|
|
| 451,080 |
|
| Euro |
|
| 4,184,844 |
|
|
| 3,839,422 |
|
| Japanese yen |
|
| 1,276,029 |
|
|
| 1,306,380 |
|
| U.S. dollar |
|
| 3,038,439 |
|
|
| 3,144,227 |
|
| Total |
| $ | 9,427,124 |
|
| $ | 9,412,631 |
|
Generally, we borrow in the functional currency of the consolidated subsidiaries but we also borrow in currencies other than the U.S. dollar in the OP and may designate this borrowing as a nonderivative financial instrument. We may also hedge our foreign currency risk by designating derivative financial instruments as net investment hedges, as these amounts offset the translation adjustments on the underlying net assets of our foreign investments. See Note 9 for more information about our nonderivative and derivative financial instruments.
We have a global senior credit facility (the “Global Facility”), under which we may draw in British pounds sterling, Canadian dollars, euro, Japanese yen and U.S. dollars on a revolving basis up to $3.0 billion (subject to currency fluctuations). We have the ability to increase the Global Facility to $3.8 billion, subject to currency fluctuations and obtaining additional lender commitments. Pricing under the Global Facility, including the spread over LIBOR, facility fees and letter of credit fees, varies based on the public debt ratings of the Operating Partnership.OP. The Global Facility is scheduled to mature in April 2020; however, we may extend the maturity date for six months on two occasions, subject to the satisfaction of certain conditions and payment of extension fees.
We also have a Japanese yen revolver (the “Revolver”). In February 2017, we renewed and amended the Revolver to increase our with availability from ¥45.0 billion toof ¥50.0 billion ($446.7451.7 million at June 30, 2017)2018). We have the ability to increase the Revolver to ¥65.0 billion ($580.6587.2 million at June 30, 2017)2018), subject to obtaining additional lender commitments. Pricing under the Revolver, including the spread over LIBOR, facility fees and letter of credit fees, varies based on the public debt ratings of the Operating Partnership.OP. The Revolver is scheduled to mature in February 2021; however, we may extend the maturity date for one year, subject to the satisfaction of certain conditions and payment of extension fees.
We refer to the Global Facility and the Revolver, collectively, as our “Credit Facilities.”
The following table summarizes information about our Credit Facilities at June 30, 20172018 (in millions):
Aggregate lender commitments |
| $ | 3,452 |
|
| $ | 3,479 |
|
Less: |
|
|
|
|
|
|
|
|
Borrowings outstanding |
|
| - |
|
|
| 12 |
|
Outstanding letters of credit |
|
| 37 |
|
|
| 31 |
|
Current availability |
| $ | 3,415 |
|
| $ | 3,436 |
|
Senior Notes
In June 2017,January 2018, we issued £500.0€400.0 million ($645.3494.2 million) of senior notes bearing a floating rate of Euribor plus 0.25%, maturing in January 2020. The exchange rate used to calculate into U.S. dollars was the spot rate at the date of the transaction. The effective interest rate was -0.08% at June 30, 2018, primarily due to the amortization of the net premium on the debt. In association with the issuance, we entered into cash flow hedges to effectively fix the interest rate, as discussed in Note 9. Following the issuance, we used the proceeds to pay down our multi-currency term loan (the “2017 Term Loan”) during the first quarter of 2018.
In June 2018, we issued $400.0 million of senior notes that bear an interest rate of 2.25%, maturing3.88% and mature in 2029, at 99.94%September 2028 and $300.0 million of par value forsenior notes that bear an all-in-rateinterest rate of 2.30%.4.38% and mature in September 2048. Following the issuance, we paid cashused the proceeds to pay down our Global Facility in the second quarter of $652.0 million to redeem $618.3 million of previously issued senior notes before the maturity date2018 and our Canadian term loan (the “2015 Canadian Term Loan”) in an effort to reduce our borrowing costs and extend our debt maturities. As a result, we recognized a loss in Gains (Losses) on Early Extinguishment of Debt, Net of $32.2 million represented by the difference between the recorded debt (including premiums and discounts and related debt issuance costs) and the consideration we paid to retire the debt, including fees.July 2018.
Term Loans
In March 2017,During the six months ended June 30, 2018, we entered into an unsecured senior term loan agreement (the “2017 Yenborrowed on our Global Facility and paid down CAD 201.4 million ($158.9 million) on the 2015 Canadian Term Loan”) under which we can draw in Japanese yen, of which ¥7.2 billionLoan, leaving CAD $170.5 million ($64.3128.7 million at June 30, 2017) matures2018) outstanding. In association with the pay down of the 2015 Canadian Term Loan, we terminated our Canadian denominated cash flow hedges in March 2027 and bears an interest rate of 0.92% and ¥4.8 billion ($42.9 million atFebruary 2018. See Note 9 for more information.
During the six months ended June 30, 2017) matures in March 20282018 and bears an interest rate of 1.01%. In the first quarter of 2017, we borrowed ¥12.0 billion ($107.2 million), causing the 2017 Yen Term Loan to be fully drawn at June 30, 2017.
In May 2017, we renewed and amended our existing senior term loan agreement (the “2017 Term Loan,” formerly the “Euro Term Loan”) under which loans can be obtained in British pounds sterling, euro, Japanese yen and U.S. dollars in an aggregate amount not to exceed $500.0 million. We may increase the borrowings up topaid down $1.0 billion subject to obtaining additional lender commitments. We may also pay down and reborrow under this term loan. The 2017 Term Loan bears an interest rate of LIBOR plus 0.90%$575.7 million, and is scheduled to mature in May 2020; however, we may extend the maturity date twice, by one year each, subject to the satisfaction of certain conditions and the payment of an extension fee. In the second quarter of 2017, we borrowedreborrowed $500.0 million causing the 2017 Term Loan to be fully drawn at June 30, 2017. In connection with the contribution of properties to USLF in July 2017, we used the net proceeds to pay down the balance outstandingand $877.5 million, on our 2017 Term Loan.
Long-Term Debt Maturities
Principal payments due on our debt for the remainder of 20172018 and for each of the years inyear through the period endingended December 31, 2026,2022, and thereafter were as follows at June 30, 20172018 (in thousands):
|
| Unsecured |
|
|
|
|
|
|
|
| Unsecured |
|
|
|
|
|
|
| ||||||||||||||||||
|
| Senior |
|
| Term Loans |
|
| Secured |
|
|
|
|
|
| Credit |
|
| Senior |
|
| Term Loans |
|
| Secured |
|
|
|
|
| |||||||
Maturity |
| Notes |
|
| and Other |
|
| Mortgage Debt |
|
| Total |
|
| Facilities |
|
| Notes |
|
| and Other |
|
| Mortgages |
|
| Total |
| |||||||||
2017 (1) |
| $ | - |
|
| $ | 491 |
|
| $ | - |
|
| $ | 491 |
| ||||||||||||||||||||
2018 |
|
| 175,000 |
|
|
| 1,009 |
|
|
| 118,063 |
|
|
| 294,072 |
| ||||||||||||||||||||
2019 |
|
| - |
|
|
| 1,091 |
|
|
| 610,281 |
|
|
| 611,372 |
| ||||||||||||||||||||
2018 (1) |
| $ | - |
|
| $ | - |
|
| $ | 492 |
|
| $ | 108,137 |
|
| $ | 108,629 |
| ||||||||||||||||
2019 (1) |
|
| - |
|
|
| - |
|
|
| 1,014 |
|
|
| 446,328 |
|
|
| 447,342 |
| ||||||||||||||||
2020 (2) |
|
| 887,241 |
|
|
| 501,155 |
|
|
| 446,318 |
|
|
| 1,834,714 |
|
|
| 11,658 |
|
|
| 1,165,802 |
|
|
| 1,077 |
|
|
| 12,409 |
|
|
| 1,190,946 |
|
2021 |
|
| 1,298,840 |
|
|
| 954 |
|
|
| 436,544 |
|
|
| 1,736,338 |
|
|
| - |
|
|
| 816,060 |
|
|
| 910 |
|
|
| 14,600 |
|
|
| 831,570 |
|
2022 |
|
| 798,840 |
|
|
| 447,396 |
|
|
| 141,673 |
|
|
| 1,387,909 |
|
|
| - |
|
|
| 816,060 |
|
|
| 452,455 |
|
|
| 10,636 |
|
|
| 1,279,151 |
|
2023 |
|
| 850,000 |
|
|
| 913,201 |
|
|
| 163,284 |
|
|
| 1,926,485 |
| ||||||||||||||||||||
2024 |
|
| 798,840 |
|
|
| 882 |
|
|
| 174,735 |
|
|
| 974,457 |
| ||||||||||||||||||||
2025 |
|
| 750,000 |
|
|
| 958 |
|
|
| 133,420 |
|
|
| 884,378 |
| ||||||||||||||||||||
2026 |
|
| 570,600 |
|
|
| 599 |
|
|
| 139,920 |
|
|
| 711,119 |
| ||||||||||||||||||||
Thereafter |
|
| 648,903 |
|
|
| 112,851 |
|
|
| 2,384 |
|
|
| 764,138 |
|
|
| - |
|
|
| 4,356,824 |
|
|
| 968,756 |
|
|
| 306,385 |
|
|
| 5,631,965 |
|
Subtotal |
|
| 6,778,264 |
|
|
| 1,980,587 |
|
|
| 2,366,622 |
|
|
| 11,125,473 |
|
|
| 11,658 |
|
|
| 7,154,746 |
|
|
| 1,424,704 |
|
|
| 898,495 |
|
|
| 9,489,603 |
|
Premiums (discounts), net |
|
| (22,648 | ) |
|
| - |
|
|
| 28,391 |
|
|
| 5,743 |
|
|
| - |
|
|
| (23,909 | ) |
|
| - |
|
|
| 2,212 |
|
|
| (21,697 | ) |
Debt issuance costs, net |
|
| (28,166 | ) |
|
| (12,150 | ) |
|
| (8,978 | ) |
|
| (49,294 | ) |
|
| - |
|
|
| (28,456 | ) |
|
| (9,043 | ) |
|
| (3,283 | ) |
|
| (40,782 | ) |
Totals |
| $ | 6,727,450 |
|
| $ | 1,968,437 |
|
| $ | 2,386,035 |
|
| $ | 11,081,922 |
| ||||||||||||||||||||
|
|
|
|
|
|
|
|
|
|
|
|
|
|
|
|
| ||||||||||||||||||||
Total |
| $ | 11,658 |
|
| $ | 7,102,381 |
|
| $ | 1,415,661 |
|
| $ | 897,424 |
|
| $ | 9,427,124 |
| ||||||||||||||||
�� |
|
|
|
|
|
|
|
|
|
|
|
|
|
|
|
|
|
|
|
| ||||||||||||||||
(1) | We expect to repay the amounts maturing in |
(2) | Included in the 2020 maturities |
We have approximately $6.7$7.1 billion of senior notes and $2.0$1.4 billion of term loans outstanding at June 30, 2017,2018 under threetwo separate indentures, as supplemented, which arethat were subject to certain financial covenants. We are also subject to financial covenants under our Credit Facilities and certain secured mortgage debt.mortgages. At June 30, 2017,2018, we were in compliance with all of our financial debt covenants.
Guarantee of Finance Subsidiary Debt
In July 2018, we formed a finance subsidiary as part of our European operations, Prologis Euro Finance LLC (“Euro Finance Subsidiary”), that is 100% indirectly owned by the OP. All unsecured debt issued by the Euro Finance Subsidiary will be fully and unconditionally guaranteed by the OP. There are no restrictions or limits on the OP’s ability to obtain funds from its subsidiaries by dividend or loan. In reliance on Rule 3-10 of Regulation S-X, the separate financial statements of the Euro Finance Subsidiary are not provided.
NOTE 6. NONCONTROLLING INTERESTS
Prologis, L.P.
We report noncontrolling interests related to several entities we consolidate but of which we do not own 100% of the equity. These entities include two real estate partnerships that have issued limited partnership units to third parties. Depending on the specific partnership agreements, these limited partnership units are redeemable for cash or, at our option into shares of the Parent’s common stock, generally at a rate of one share of common stock to one unit. We also consolidate severalcertain entities in which we do not own 100% of the equity andbut the unitsequity of the entity arethese entities is not convertible or redeemable.exchangeable into our common stock.
Prologis, Inc.
The noncontrolling interests of the Parent include the noncontrolling interests presented infor the Operating Partnership,OP, as well as the common limited partnership units in the Operating PartnershipOP that are not owned by the Parent.
The following table summarizes our ownership percentages, and noncontrolling interests and the consolidated entities’ total assets and liabilities at June 30, 2017, and December 31, 2016 (dollars in thousands):
| Our Ownership Percentage |
|
| Noncontrolling Interests |
|
| Total Assets |
|
| Total Liabilities |
| ||||||||||||||||||||
| 2017 |
|
| 2016 |
|
| 2017 |
|
| 2016 |
|
| 2017 |
|
| 2016 |
|
| 2017 |
|
| 2016 |
| ||||||||
Prologis U.S. Logistics Venture |
| 55.0 | % |
|
| 55.0 | % |
| $ | 2,522,506 |
|
| $ | 2,424,800 |
|
| $ | 6,105,549 |
|
| $ | 6,201,278 |
|
| $ | 496,086 |
|
| $ | 797,593 |
|
Prologis North American Industrial Fund (1) |
| 100.0 | % |
|
| 66.1 | % |
|
| - |
|
|
| 486,648 |
|
|
| - |
|
|
| 2,479,072 |
|
|
| - |
|
|
| 1,038,708 |
|
Prologis Brazil Logistics Partners Fund I (2) |
| 100.0 | % |
|
| 50.0 | % |
|
| - |
|
|
| 61,836 |
|
|
| - |
|
|
| 131,581 |
|
|
| - |
|
|
| 720 |
|
Other consolidated entities (3) | various |
|
| various |
|
|
| 84,846 |
|
|
| 99,185 |
|
|
| 849,870 |
|
|
| 866,821 |
|
|
| 37,488 |
|
|
| 34,073 |
| ||
Prologis, L.P. noncontrolling interests |
|
|
|
|
|
|
|
|
| 2,607,352 |
|
|
| 3,072,469 |
|
|
| 6,955,419 |
|
|
| 9,678,752 |
|
|
| 533,574 |
|
|
| 1,871,094 |
|
Limited partners in Prologis, L.P. (4) (5) |
|
|
|
|
|
|
|
|
| 405,590 |
|
|
| 394,590 |
|
|
| - |
|
|
| - |
|
|
| - |
|
|
| - |
|
Prologis, Inc. noncontrolling interests |
|
|
|
|
|
|
|
| $ | 3,012,942 |
|
| $ | 3,467,059 |
|
| $ | 6,955,419 |
|
| $ | 9,678,752 |
|
| $ | 533,574 |
|
| $ | 1,871,094 |
|
| Our Ownership Percentage |
|
| Noncontrolling Interests |
|
| Total Assets |
|
| Total Liabilities |
| ||||||||||||||||||||
| Jun 30, 2018 |
|
| Dec 31, 2017 |
|
| Jun 30, 2018 |
|
| Dec 31, 2017 |
|
| Jun 30, 2018 |
|
| Dec 31, 2017 |
|
| Jun 30, 2018 |
|
| Dec 31, 2017 |
| ||||||||
Prologis U.S. Logistics Venture |
| 55.0 | % |
|
| 55.0 | % |
| $ | 2,539,930 |
|
| $ | 2,581,629 |
|
| $ | 6,186,215 |
|
| $ | 6,030,819 |
|
| $ | 238,101 |
|
| $ | 284,162 |
|
Other consolidated entities (1) | various |
|
| various |
|
|
| 84,245 |
|
|
| 78,613 |
|
|
| 820,113 |
|
|
| 806,138 |
|
|
| 29,813 |
|
|
| 30,330 |
| ||
Prologis, L.P. |
|
|
|
|
|
|
|
|
| 2,624,175 |
|
|
| 2,660,242 |
|
|
| 7,006,328 |
|
|
| 6,836,957 |
|
|
| 267,914 |
|
|
| 314,492 |
|
Limited partners in Prologis, L.P. (2) (3) |
|
|
| 463,758 |
|
|
| 414,341 |
|
|
| - |
|
|
| - |
|
|
| - |
|
|
| - |
| ||||||
Prologis, Inc. |
|
|
|
|
|
|
|
| $ | 3,087,933 |
|
| $ | 3,074,583 |
|
| $ | 7,006,328 |
|
| $ | 6,836,957 |
|
| $ | 267,914 |
|
| $ | 314,492 |
|
|
|
|
|
|
|
|
|
|
|
|
|
|
|
|
|
|
|
|
|
|
|
|
|
|
|
|
|
|
|
|
|
(1) |
|
|
|
| This line item includes our two partnerships that have issued limited partnership units to third parties, as discussed above, along with various other consolidated entities. |
| We had 8.8 million and 8.9 million Class A Units that were convertible into |
NOTE 7. LONG-TERM COMPENSATION
Equity-Based Compensation Plans and Programs
Prologis Outperformance Plan (“POP”)
ParticipationWe allocate participation points represent a portionto participants under our POP corresponding to three-year performance periods beginning January 1. The fair value of a compensation pool that can bethe awards is measured at the grant date and amortized over the period from the grant date to the date at which the awards vest, which range from three to ten years. POP awards are earned if and when certain performance criteria are met underto the POPextent our three-year compound annualized total stockholder return (“TSR”) for the applicable performance period. period is positive and exceeds the three-year compound annualized TSR for the Morgan Stanley Capital International (“MSCI”) US REIT Index for the same period plus 100 basis points.
We granted participation points for the 20172018 – 20192020 performance period in January 2017,2018, with a fair value of $20.4$23.3 million using a Monte Carlo valuation model that assumed a risk-free interest rate of 1.49%2.1% and an expected volatility of 22.2%16.5%. The 2018 – 2020 performance period has an absolute maximum cap of $100 million. If the award is earned then 20% of the POP award is paid at the end of the performance period and the remaining 80% is subject to additional seven-year cliff vesting. The 20% that is paid at the end of the three-year performance period is subject to an additional three-year holding requirement.
The POP performance criteria were met for the 20142015 – 20162017 performance period, which resulted in awards for this performance period being earned.earned at December 31, 2017. An aggregate performance pool of $62.2$110.2 million was awarded in January 20172018 in the form of 0.6 million shares of common stock orand 1.2 million vested POP LTIP Units.
Other Equity-Based Compensation Plans and Programs
Our other equity-based compensation plans and programs include (i) the Prologis Promote Plan (“PPP”); (ii) the annual long-term incentive (“LTI”) equity award program (“Annual LTI Award”); and (iii) the annual bonus exchange program. Awards under these plans and programs may be issued in the form of restricted stock units (“RSUs”) or LTIP Units at the participant’s election. RSUs and LTIP Units are valued based on the market price of the Parent’s common stock on the date the award is granted and is charged to compensation expense over the service period. Beginning in February 2018 with awards for PPP and Annual LTI Awards, the service period is four years.
Summary of Award Activity
The following table details the equity awards granted under the PPP for the six months ended June 30 (in thousands):
|
| 2017 |
|
| 2016 |
| ||
RSUs granted |
|
| 88 |
|
|
| 53 |
|
Grant date fair value of RSUs granted |
| $ | 4,800 |
|
| $ | 2,300 |
|
LTIP Units granted |
|
| 203 |
|
|
| 114 |
|
Grant date fair value of LTIP Units granted |
| $ | 11,100 |
|
| $ | 4,900 |
|
Prologis Outperformance Plan Operating Partnership Long-Term Incentive Plan Units (“POP LTIP Units”)RSUs
The following table summarizes the activity for the unvested POP LTIP UnitsRSUs for the six months ended June 30, 20172018 (units in thousands):
|
| |||||||||||||||||||||||||||||||||||||||||||||||||||||||||||||||||||||||||||
| ||||||||||||||||||||||||||||||||||||||||||||||||||||||||||||||||||||||||||||
|
| |||||||||||||||||||||||||||||||||||||||||||||||||||||||||||||||||||||||||||
|
| |||||||||||||||||||||||||||||||||||||||||||||||||||||||||||||||||||||||||||
|
|
| ||||||||||||||||||||||||||||||||||||||||||||||||||||||||||||||||||||||||||
|
|
| ||||||||||||||||||||||||||||||||||||||||||||||||||||||||||||||||||||||||||
|
| |||||||||||||||||||||||||||||||||||||||||||||||||||||||||||||||||||||||||||
|
|
Operating Partnership Long-Term Incentive Plan Units (“LTIP Units”)
The following table summarizes the activity for LTIP Units for the six months ended June 30, 20172018 (units in thousands):
|
| Number of |
|
| Weighted Average |
|
| Number of |
| |||
|
| LTIP Units |
|
| Grant-Date Fair Value |
|
| LTIP Units Vested |
| |||
Balance at January 1, 2017 |
|
| 2,219 |
|
| $ | 40.81 |
|
|
| 743 |
|
Granted |
|
| 1,032 |
|
|
|
|
|
|
|
|
|
Vested POP LTIP Units |
|
| 698 |
|
|
|
|
|
|
|
|
|
Conversion to common limited partnership units |
|
| (227 | ) |
|
|
|
|
|
|
|
|
Balance at June 30, 2017 |
|
| 3,722 |
|
| $ | 45.55 |
|
|
| 1,835 |
|
|
|
|
|
|
|
|
|
|
|
|
|
|
|
| Vested |
|
| Unvested |
|
| Unvested Weighted Average |
| |||
|
| LTIP Units (1) |
|
| LTIP Units (1) |
|
| Grant Date Fair Value |
| |||
Balance at January 1, 2018 |
|
| 1,532 |
|
|
| 1,829 |
|
| $ | 46.48 |
|
Granted |
|
| - |
|
|
| 1,246 |
|
|
| 60.95 |
|
Forfeited |
|
| - |
|
|
| (70 | ) |
|
| 47.66 |
|
Vested LTIP Units |
|
| 887 |
|
|
| (887 | ) |
|
| 45.25 |
|
Vested LTIP Units – POP (2) |
|
| 1,170 |
|
|
| - |
|
| N/A |
| |
Conversion to common limited partnership units |
|
| (52 | ) |
|
| - |
|
| N/A |
| |
Balance at June 30, 2018 |
|
| 3,537 |
|
|
| 2,118 |
|
| $ | 55.46 |
|
|
|
|
|
|
|
|
|
|
|
|
|
|
(1) | The outstanding LTIP Units are exchangeable into limited partnership units of the OP and redeemable for the Parent’s common stock after they vest and other applicable conditions have been met. |
Restricted Stock Units (“RSUs”)
The following table summarizes the activity for RSUs for the six months ended June 30, 2017 (units in thousands):
|
| Number of |
|
| Weighted Average |
|
| Number of |
| |||
|
| RSUs |
|
| Grant-Date Fair Value |
|
| RSUs Vested |
| |||
Balance at January 1, 2017 |
|
| 1,617 |
|
| $ | 40.58 |
|
|
| 125 |
|
Granted |
|
| 757 |
|
|
|
|
|
|
|
|
|
Vested and distributed |
|
| (783 | ) |
|
|
|
|
|
|
|
|
Forfeited |
|
| (46 | ) |
|
|
|
|
|
|
|
|
Balance at June 30, 2017 |
|
| 1,545 |
|
| $ | 45.29 |
|
|
| 106 |
|
|
|
|
|
|
|
|
|
|
|
|
|
|
(2) | Vested units were based on the POP performance criteria being met for the 2015 – 2017 performance period and represented the earned award amount, as discussed above. |
Stock Options
We have 1.0 million stock options outstanding and exercisable at June 30, 2017, with a weighted average exercise price of $31.14. The aggregate intrinsic value of exercised options was $19.8 million and $10.0 million for the six months ended June 30, 2017, and 2016, respectively. No stock options were granted in 2017 or 2016.
NOTE 8. EARNINGS PER COMMON SHARE OR UNIT
We determine basic earnings per share or unit based on the weighted average number of shares of common stock or units outstanding during the period. We compute diluted earnings per share or unit based on the weighted average number of shares or units outstanding combined with the incremental weighted average effect from all outstanding potentially dilutive instruments.
The computation of our basic and diluted earnings per share and unit was as follows (in thousands, except per share and unit amounts) is as follows::
|
| Three Months Ended |
|
| Six Months Ended |
|
| Three Months Ended |
|
| Six Months Ended |
| ||||||||||||||||||||
|
| June 30, |
|
| June 30, |
|
| June 30, |
|
| June 30, |
| ||||||||||||||||||||
Prologis, Inc. |
| 2017 |
|
| 2016 |
|
| 2017 |
|
| 2016 |
|
| 2018 |
|
| 2017 |
|
| 2018 |
|
| 2017 |
| ||||||||
Net earnings attributable to common stockholders – Basic |
| $ | 266,943 |
|
| $ | 275,383 |
|
| $ | 470,198 |
|
| $ | 483,424 |
|
| $ | 334,611 |
|
| $ | 266,943 |
|
| $ | 700,513 |
|
| $ | 470,198 |
|
Net earnings attributable to redeemable limited partnership unitholders (1) |
|
| 7,798 |
|
|
| 9,085 |
|
|
| 13,765 |
|
|
| 15,694 |
| ||||||||||||||||
Net earnings attributable to exchangeable limited partnership units (1) |
|
| 10,216 |
|
|
| 7,798 |
|
|
| 20,909 |
|
|
| 13,765 |
| ||||||||||||||||
Adjusted net earnings attributable to common stockholders – Diluted |
| $ | 274,741 |
|
| $ | 284,468 |
|
| $ | 483,963 |
|
| $ | 499,118 |
|
| $ | 344,827 |
|
| $ | 274,741 |
|
| $ | 721,422 |
|
| $ | 483,963 |
|
|
|
|
|
|
|
|
|
|
|
|
|
|
|
|
|
|
|
|
|
|
|
|
|
|
|
|
|
|
|
|
|
|
Weighted average common shares outstanding – Basic |
|
| 530,040 |
|
|
| 524,842 |
|
|
| 529,400 |
|
|
| 524,540 |
|
|
| 532,639 |
|
|
| 530,040 |
|
|
| 532,427 |
|
|
| 529,400 |
|
Incremental weighted average effect on redemption of limited partnership units (1) |
|
| 16,364 |
|
|
| 17,703 |
|
|
| 16,409 |
|
|
| 17,623 |
| ||||||||||||||||
Incremental weighted average effect on exchange of limited partnership units (1) |
|
| 16,847 |
|
|
| 16,364 |
|
|
| 16,560 |
|
|
| 16,409 |
| ||||||||||||||||
Incremental weighted average effect of equity awards |
|
| 5,710 |
|
|
| 2,843 |
|
|
| 4,703 |
|
|
| 2,130 |
|
|
| 5,029 |
|
|
| 5,710 |
|
|
| 5,079 |
|
|
| 4,703 |
|
Weighted average common shares outstanding – Diluted (2) |
|
| 552,114 |
|
|
| 545,388 |
|
|
| 550,512 |
|
|
| 544,293 |
|
|
| 554,515 |
|
|
| 552,114 |
|
|
| 554,066 |
|
|
| 550,512 |
|
|
|
|
|
|
|
|
|
|
|
|
|
|
|
|
|
|
|
|
|
|
|
|
|
|
|
|
|
|
|
|
|
|
Net earnings per share attributable to common stockholders: |
|
|
|
|
|
|
|
|
|
|
|
|
|
|
|
|
|
|
|
|
|
|
|
|
|
|
|
|
|
|
|
|
Basic |
| $ | 0.50 |
|
| $ | 0.52 |
|
| $ | 0.89 |
|
| $ | 0.92 |
|
| $ | 0.63 |
|
| $ | 0.50 |
|
| $ | 1.32 |
|
| $ | 0.89 |
|
Diluted |
| $ | 0.50 |
|
| $ | 0.52 |
|
| $ | 0.88 |
|
| $ | 0.92 |
|
| $ | 0.62 |
|
| $ | 0.50 |
|
| $ | 1.30 |
|
| $ | 0.88 |
|
| Three Months Ended |
|
| Six Months Ended |
|
| Three Months Ended |
|
| Six Months Ended |
| |||||||||||||||||||||
|
| June 30, |
|
| June 30, |
|
| June 30, |
|
| June 30, |
| ||||||||||||||||||||
Prologis, L.P. |
| 2017 |
|
| 2016 |
|
| 2017 |
|
| 2016 |
|
| 2018 |
|
| 2017 |
|
| 2018 |
|
| 2017 |
| ||||||||
Net earnings attributable to common unitholders |
| $ | 274,320 |
|
| $ | 283,699 |
|
| $ | 483,198 |
|
| $ | 497,974 |
|
| $ | 344,633 |
|
| $ | 274,320 |
|
| $ | 721,058 |
|
| $ | 483,198 |
|
Net earnings attributable to Class A common unitholders |
|
| (4,347 | ) |
|
| (4,619 | ) |
|
| (7,678 | ) |
|
| (8,129 | ) | ||||||||||||||||
Net earnings attributable to Class A Units |
|
| (5,324 | ) |
|
| (4,347 | ) |
|
| (11,177 | ) |
|
| (7,678 | ) | ||||||||||||||||
Net earnings attributable to common unitholders – Basic |
| $ | 269,973 |
|
| $ | 279,080 |
|
| $ | 475,520 |
|
| $ | 489,845 |
|
|
| 339,309 |
|
|
| 269,973 |
|
|
| 709,881 |
|
|
| 475,520 |
|
Net earnings attributable to Class A common unitholders |
|
| 4,347 |
|
|
| 4,619 |
|
|
| 7,678 |
|
|
| 8,129 |
| ||||||||||||||||
Net earnings attributable to limited partnership unitholders |
|
| 421 |
|
|
| 768 |
|
|
| 765 |
|
|
| 1,143 |
| ||||||||||||||||
Net earnings attributable to Class A Units |
|
| 5,324 |
|
|
| 4,347 |
|
|
| 11,177 |
|
|
| 7,678 |
| ||||||||||||||||
Net earnings attributable to exchangeable other limited partnership units |
|
| 194 |
|
|
| 421 |
|
|
| 364 |
|
|
| 765 |
| ||||||||||||||||
Adjusted net earnings attributable to common unitholders – Diluted |
| $ | 274,741 |
|
| $ | 284,467 |
|
| $ | 483,963 |
|
| $ | 499,117 |
|
| $ | 344,827 |
|
| $ | 274,741 |
|
| $ | 721,422 |
|
| $ | 483,963 |
|
|
|
|
|
|
|
|
|
|
|
|
|
|
|
|
|
|
|
|
|
|
|
|
|
|
|
|
|
|
|
|
|
|
Weighted average common partnership units outstanding – Basic |
|
| 536,060 |
|
|
| 531,912 |
|
|
| 535,392 |
|
|
| 531,507 |
|
|
| 540,084 |
|
|
| 536,060 |
|
|
| 539,547 |
|
|
| 535,392 |
|
Incremental weighted average effect on conversion of Class A Units |
|
| 8,626 |
|
|
| 8,798 |
|
|
| 8,645 |
|
|
| 8,821 |
| ||||||||||||||||
Incremental weighted average effect on redemption of limited partnership units into common stock of Prologis, Inc. |
|
| 1,718 |
|
|
| 1,835 |
|
|
| 1,772 |
|
|
| 1,835 |
| ||||||||||||||||
Incremental weighted average effect on exchange of Class A Units |
|
| 8,477 |
|
|
| 8,626 |
|
|
| 8,495 |
|
|
| 8,645 |
| ||||||||||||||||
Incremental weighted average effect on exchange of other limited partnership units |
|
| 925 |
|
|
| 1,718 |
|
|
| 945 |
|
|
| 1,772 |
| ||||||||||||||||
Incremental weighted average effect of equity awards of Prologis, Inc. |
|
| 5,710 |
|
|
| 2,843 |
|
|
| 4,703 |
|
|
| 2,130 |
|
|
| 5,029 |
|
|
| 5,710 |
|
|
| 5,079 |
|
|
| 4,703 |
|
Weighted average common partnership units outstanding – Diluted (2) |
|
| 552,114 |
|
|
| 545,388 |
|
|
| 550,512 |
|
|
| 544,293 |
| ||||||||||||||||
Weighted average common units outstanding – Diluted (2) |
|
| 554,515 |
|
|
| 552,114 |
|
|
| 554,066 |
|
|
| 550,512 |
| ||||||||||||||||
|
|
|
|
|
|
|
|
|
|
|
|
|
|
|
|
|
|
|
|
|
|
|
|
|
|
|
|
|
|
|
|
|
Net earnings per unit attributable to common unitholders: |
|
|
|
|
|
|
|
|
|
|
|
|
|
|
|
|
|
|
|
|
|
|
|
|
|
|
|
|
|
|
|
|
Basic |
| $ | 0.50 |
|
| $ | 0.52 |
|
| $ | 0.89 |
|
| $ | 0.92 |
|
| $ | 0.63 |
|
| $ | 0.50 |
|
| $ | 1.32 |
|
| $ | 0.89 |
|
Diluted |
| $ | 0.50 |
|
| $ | 0.52 |
|
| $ | 0.88 |
|
| $ | 0.92 |
|
| $ | 0.62 |
|
| $ | 0.50 |
|
| $ | 1.30 |
|
| $ | 0.88 |
|
(1) | The exchangeable limited partnership units include the units as discussed in Note 6. Earnings allocated to the |
(2) | Our total weighted average potentially dilutive shares and units outstanding consisted of the following: |
|
|
| Three Months Ended |
|
| Six Months Ended |
| ||||||||||
|
|
| June 30, |
|
| June 30, |
| ||||||||||
|
|
| 2017 |
|
| 2016 |
|
| 2017 |
|
| 2016 |
| ||||
| Total weighted average potentially dilutive limited partnership units |
|
| 10,344 |
|
|
| 10,633 |
|
|
| 10,417 |
|
|
| 10,656 |
|
| Total potentially dilutive stock awards |
|
| 9,355 |
|
|
| 7,176 |
|
|
| 8,583 |
|
|
| 6,854 |
|
| Total Prologis, L.P. |
|
| 19,699 |
|
|
| 17,809 |
|
|
| 19,000 |
|
|
| 17,510 |
|
| Limited partners in Prologis, L.P. |
|
| 6,020 |
|
|
| 7,070 |
|
|
| 5,992 |
|
|
| 6,967 |
|
| Total Prologis, Inc. |
|
| 25,719 |
|
|
| 24,879 |
|
|
| 24,992 |
|
|
| 24,477 |
|
|
|
|
|
|
|
|
|
|
|
|
|
|
|
|
|
|
|
|
|
| Three Months Ended |
|
| Six Months Ended |
| ||||||||||
|
|
| June 30, |
|
| June 30, |
| ||||||||||
|
|
| 2018 |
|
| 2017 |
|
| 2018 |
|
| 2017 |
| ||||
| Class A Units |
|
| 8,477 |
|
|
| 8,626 |
|
|
| 8,495 |
|
|
| 8,645 |
|
| Other limited partnership units |
|
| 925 |
|
|
| 1,718 |
|
|
| 945 |
|
|
| 1,772 |
|
| Equity awards |
|
| 8,432 |
|
|
| 9,355 |
|
|
| 8,391 |
|
|
| 8,583 |
|
| Prologis, L.P. |
|
| 17,834 |
|
|
| 19,699 |
|
|
| 17,831 |
|
|
| 19,000 |
|
| Common limited partnership units |
|
| 7,445 |
|
|
| 6,020 |
|
|
| 7,120 |
|
|
| 5,992 |
|
| Prologis, Inc. |
|
| 25,279 |
|
|
| 25,719 |
|
|
| 24,951 |
|
|
| 24,992 |
|
NOTE 9. FINANCIAL INSTRUMENTS AND FAIR VALUE MEASUREMENTS
Derivative Financial Instruments
In the normal course of business, our operations are exposed to market risks, including the effect of changes in foreign currency exchange rates and interest rates. To manage these risks, we mayWe enter into derivative contracts, such as foreign currency contracts to manage foreign currency exposure, and interest rate swaps to manage the effect of interest rate fluctuations. We do not use derivative financial instruments for trading or speculative purposes. Our derivative financial instruments are customized transactions and are not exchange-traded. Management reviews our hedging program, derivative positions and overall risk management strategy on a regular basis. We enter into only those transactions we believe will be highly effective at offsetting theto offset these underlying risk.market risks. There have been no significant changes in our policy or strategy from what was disclosed in our Annual Report on Form 10-K for the fiscal year ended December 31, 2016.
2017.
The following table presents the fair value and classification of our derivative financial instruments recognized within the line items Other Assets and Other Liabilities on the Consolidated Balance Sheet (in thousands):
|
| June 30, 2017 |
|
| December 31, 2016 |
| ||||||||||
|
| Asset |
|
| Liability |
|
| Asset |
|
| Liability |
| ||||
Net investment hedges |
|
|
|
|
|
|
|
|
|
|
|
|
|
|
|
|
British pound sterling denominated |
| $ | - |
|
| $ | - |
|
| $ | 7,439 |
|
| $ | - |
|
Canadian dollar denominated |
|
| - |
|
|
| 3,904 |
|
|
| 1,245 |
|
|
| - |
|
|
|
|
|
|
|
|
|
|
|
|
|
|
|
|
|
|
Forwards and options (1) |
|
|
|
|
|
|
|
|
|
|
|
|
|
|
|
|
British pound sterling denominated |
|
| 8,401 |
|
|
| 4,048 |
|
|
| 16,985 |
|
|
| - |
|
Canadian dollar denominated |
|
| 31 |
|
|
| 546 |
|
|
| 831 |
|
|
| 197 |
|
Euro denominated |
|
| 538 |
|
|
| 6,101 |
|
|
| 10,933 |
|
|
| - |
|
Yen denominated |
|
| 6,919 |
|
|
| 1,512 |
|
|
| 9,246 |
|
|
| 1,071 |
|
|
|
|
|
|
|
|
|
|
|
|
|
|
|
|
|
|
Interest rate hedges |
|
| 3,639 |
|
|
| - |
|
|
| 435 |
|
|
| - |
|
|
|
|
|
|
|
|
|
|
|
|
|
|
|
|
|
|
Total fair value of derivatives |
| $ | 19,528 |
|
| $ | 16,111 |
|
| $ | 47,114 |
|
| $ | 1,268 |
|
|
|
|
|
|
|
|
|
|
|
|
|
|
|
|
|
|
|
| June 30, 2018 |
|
| December 31, 2017 |
| ||||||||||
|
| Asset |
|
| Liability |
|
| Asset |
|
| Liability |
| ||||
Undesignated derivatives |
|
|
|
|
|
|
|
|
|
|
|
|
|
|
|
|
Foreign currency contracts |
|
|
|
|
|
|
|
|
|
|
|
|
|
|
|
|
Forwards |
|
|
|
|
|
|
|
|
|
|
|
|
|
|
|
|
British pound sterling |
| $ | 142 |
|
| $ | 4,017 |
|
| $ | 2,440 |
|
| $ | 8,103 |
|
Canadian dollar |
|
| 1,469 |
|
|
| 253 |
|
|
| - |
|
|
| 1,698 |
|
Euro |
|
| 3,619 |
|
|
| 6,380 |
|
|
| 2 |
|
|
| 14,234 |
|
Japanese yen |
|
| 3,992 |
|
|
| 1,235 |
|
|
| 6,474 |
|
|
| 931 |
|
Mexican peso |
|
| 373 |
|
|
| - |
|
|
| - |
|
|
| - |
|
|
|
|
|
|
|
|
|
|
|
|
|
|
|
|
|
|
Designated derivatives |
|
|
|
|
|
|
|
|
|
|
|
|
|
|
|
|
Foreign currency contracts |
|
|
|
|
|
|
|
|
|
|
|
|
|
|
|
|
Net investment hedges |
|
|
|
|
|
|
|
|
|
|
|
|
|
|
|
|
Canadian dollar |
|
| 1,871 |
|
|
| - |
|
|
| - |
|
|
| 7,263 |
|
Euro |
|
| - |
|
|
| 280 |
|
|
| - |
|
|
| - |
|
|
|
|
|
|
|
|
|
|
|
|
|
|
|
|
|
|
Interest rate swaps |
|
|
|
|
|
|
|
|
|
|
|
|
|
|
|
|
Cash flow hedges |
|
|
|
|
|
|
|
|
|
|
|
|
|
|
|
|
Canadian dollar |
|
| - |
|
|
| - |
|
|
| 10,223 |
|
|
| - |
|
Euro |
|
| - |
|
|
| 555 |
|
|
| - |
|
|
| - |
|
Total fair value of derivatives |
| $ | 11,466 |
|
| $ | 12,720 |
|
| $ | 19,139 |
|
| $ | 32,229 |
|
|
|
|
|
|
|
|
|
|
|
|
|
|
|
|
|
|
Undesignated Derivative Financial Instruments |
|
Foreign Currency Contracts
We primarily manage our foreign currency exposure by borrowing inThe following table summarizes the currencies in which we invest. We may issue debt in a currency that is not the same functional currency of the borrowing entity to offset the translation and economic exposures related to our net investment in international subsidiaries. To mitigate the impact of the translation from the fluctuations in exchange rates, we may designate this debt as a nonderivative financial instrument hedge. We also hedge our investments in certain international subsidiaries using foreign currency derivative contracts (net investment hedges) to offset the translation and economic exposures related to our investments in these subsidiaries by locking in a forward exchange rate at the inception of the hedge. To the extent we have an effective hedging relationship, we report all changes in fair value of the hedged portion of the nonderivative financial instruments and net investment hedges in equity in the foreign currency translation component of Accumulated Other Comprehensive Loss (“AOCI”) in the Consolidated Balance Sheets. These amounts offset the translation adjustments on the underlying net assetsactivity of our foreign investments, which we also record in AOCI. The changes in fair value of the portion of the nonderivative financial instruments that are not designated as hedges are recorded in Foreign Currency and Derivative Losses, Net in the Consolidated Statements of Income. We recognize ineffectiveness, if any, in earnings at the time the ineffectiveness occurred.
We may use foreign currency option contracts, including puts, calls and collars to mitigate foreign currency exchange rate risk associated with the translation of our projected net operating income of our international subsidiaries. These are not designated as hedges as they do not meet hedge accounting requirements. Changes in the fair value of non-hedge designated derivatives are recorded in Foreign Currency and Derivative Losses, Net.
The following tables summarize the activity in ourundesignated foreign currency contracts for the six months ended June 30 (in millions, except for weighted average forward rates and number of active contracts):
|
| 2018 |
|
| 2017 |
| ||||||||||||||||||||||||||||||||||
|
| CAD |
|
| CNY |
|
| EUR |
|
| GBP |
|
| JPY |
|
| MXN |
|
| CAD |
|
| EUR |
|
| GBP |
|
| JPY |
| ||||||||||
Notional amounts at January 1 |
| $ | 56 |
|
| $ | - |
|
| $ | 233 |
|
| $ | 132 |
|
| $ | 153 |
|
| $ | - |
|
| $ | 38 |
|
| $ | 197 |
|
| $ | 78 |
|
| $ | 144 |
|
New contracts |
|
| 13 |
|
|
| 80 |
|
|
| 54 |
|
|
| - |
|
|
| 28 |
|
|
| 10 |
|
|
| - |
|
|
| 63 |
|
|
| 137 |
|
|
| 38 |
|
Matured, expired or settled contracts |
|
| (14 | ) |
|
| (80 | ) |
|
| (55 | ) |
|
| (36 | ) |
|
| (36 | ) |
|
| (10 | ) |
|
| (12 | ) |
|
| (56 | ) |
|
| (46 | ) |
|
| (31 | ) |
Notional amounts at June 30 |
| $ | 55 |
|
| $ | - |
|
| $ | 232 |
|
| $ | 96 |
|
| $ | 145 |
|
| $ | - |
|
| $ | 26 |
|
| $ | 204 |
|
| $ | 169 |
|
| $ | 151 |
|
|
|
|
|
|
|
|
|
|
|
|
|
|
|
|
|
|
|
|
|
|
|
|
|
|
|
|
|
|
|
|
|
|
|
|
|
|
|
|
|
|
Weighted average forward rate at June 30 |
|
| 1.28 |
|
|
| - |
|
|
| 1.20 |
|
|
| 1.30 |
|
|
| 105.53 |
|
|
| - |
|
|
| 1.32 |
|
|
| 1.13 |
|
|
| 1.33 |
|
|
| 106.51 |
|
Active contracts at June 30 |
|
| 24 |
|
|
| - |
|
|
| 29 |
|
|
| 16 |
|
|
| 32 |
|
|
| - |
|
|
| 12 |
|
|
| 26 |
|
|
| 22 |
|
|
| 32 |
|
During the six months ended June 30, 2018 and 2017, we exercised 31 and 22 forward contracts, respectively. We recognized realized losses of $1.1 million and $7.9 million for the three and six months ended June 30, 2018, respectively, and gains of $3.6 million and $8.9 million for the three and six months ended June 30, 2017, respectively, from contracts that matured, expired or settled in Foreign Currency and Derivative Gain (Losses), Net in the Consolidated Statements of Income.
We recognized unrealized gains of $30.1 million and $17.2 million for the three and six months ended June 30, 2018, respectively, and unrealized losses of $18.8 million and $32.5 million for the three and six months ended June 30, 2017, respectively, from the change in value of our outstanding foreign currency contracts within Foreign Currency and Derivative Gains (Losses), Net in the Consolidated Statements of Income.
Designated Derivative Financial Instruments
Foreign Currency Contracts
The following table summarizes the activity of our foreign currency contracts designated as net investment hedges for the six months ended June 30 (in millions, except for weighted average forward rates and number of active contracts):
2017 |
|
|
|
|
|
|
|
|
|
|
|
|
|
|
|
|
|
|
|
|
|
|
|
| ||||||||||||||||
|
| Foreign Currency Contracts |
| |||||||||||||||||||||||||||||||||||||
Local Currency |
| Net Investment Hedges |
|
| Forwards and Options |
| ||||||||||||||||||||||||||||||||||
|
| CAD |
|
| GBP |
|
| CAD |
|
| EUR |
|
| GBP |
|
| JPY |
| ||||||||||||||||||||||
Notional amounts at January 1 |
| $ | 133 |
|
| £ | 31 |
|
| $ | 50 |
|
| € | 174 |
|
| £ | 48 |
|
| ¥ | 15,500 |
| ||||||||||||||||
New contracts |
|
| 133 |
|
|
| 100 |
|
|
| - |
|
|
| 56 |
|
|
| 107 |
|
|
| 4,000 |
| ||||||||||||||||
Matured, expired or settled contracts |
|
| (133 | ) |
|
| (131 | ) |
|
| (15 | ) |
|
| (50 | ) |
|
| (31 | ) |
|
| (3,500 | ) | ||||||||||||||||
Notional amounts at June 30 |
| $ | 133 |
|
| £ | - |
|
| $ | 35 |
|
| € | 180 |
|
| £ | 124 |
|
| ¥ | 16,000 |
| ||||||||||||||||
|
|
|
|
|
|
|
|
|
|
|
|
|
|
|
|
|
|
|
|
|
|
|
|
|
| 2018 |
|
| 2017 |
| ||||||||||
|
| Foreign Currency Contracts |
|
| CAD |
|
| EUR |
|
| CAD |
|
| GBP |
| |||||||||||||||||||||||||
U.S. Dollar |
| Net Investment Hedges |
|
| Forwards and Options |
| ||||||||||||||||||||||||||||||||||
Notional amounts at January 1 |
| $ | 100 |
|
| $ | 46 |
|
| $ | 38 |
|
| $ | 197 |
|
| $ | 78 |
|
| $ | 144 |
|
| $ | 99 |
|
| $ | - |
|
| $ | 100 |
|
| $ | 46 |
|
New contracts |
|
| 99 |
|
|
| 127 |
|
|
| - |
|
|
| 63 |
|
|
| 137 |
|
|
| 38 |
|
|
| 100 |
|
|
| 35 |
|
|
| 99 |
|
|
| 127 |
|
Matured, expired or settled contracts |
|
| (100 | ) |
|
| (173 | ) |
|
| (12 | ) |
|
| (56 | ) |
|
| (46 | ) |
|
| (31 | ) |
|
| (99 | ) |
|
| - |
|
|
| (100 | ) |
|
| (173 | ) |
Notional amounts at June 30 |
| $ | 99 |
|
| $ | - |
|
| $ | 26 |
|
| $ | 204 |
|
| $ | 169 |
|
| $ | 151 |
|
| $ | 100 |
|
| $ | 35 |
|
| $ | 99 |
|
| $ | - |
|
|
|
|
|
|
|
|
|
|
|
|
|
|
|
|
|
|
|
|
|
|
|
|
|
|
|
|
|
|
|
|
|
|
|
|
|
|
|
|
|
|
Weighted average forward rate at June 30 |
|
| 1.34 |
|
|
| - |
|
|
| 1.32 |
|
|
| 1.13 |
|
|
| 1.33 |
|
|
| 106.51 |
|
|
| 1.28 |
|
|
| 1.16 |
|
|
| 1.34 |
|
|
| - |
|
Active contracts at June 30 |
|
| 2 |
|
|
| - |
|
|
| 12 |
|
|
| 26 |
|
|
| 22 |
|
|
| 32 |
|
|
| 2 |
|
|
| 1 |
|
|
| 2 |
|
|
| - |
|
2016 |
|
|
|
|
|
|
|
|
|
|
|
|
|
|
|
|
|
|
|
|
|
|
|
|
|
|
|
|
|
| Foreign Currency Contracts |
| |||||||||||||||||||||||||
Local Currency |
| Net Investment Hedges |
|
| Forwards and Options |
| ||||||||||||||||||||||
|
| CAD |
|
| GBP |
|
| JPY |
|
| EUR |
|
| GBP |
|
| JPY |
|
| Other |
| |||||||
Notional amounts at January 1 |
| $ | - |
|
| £ | 238 |
|
| ¥ | - |
|
| € | 275 |
|
| £ | 97 |
|
| ¥ | 12,840 |
|
|
|
|
|
New contracts |
|
| 133 |
|
|
| 60 |
|
|
| 11,189 |
|
|
| 171 |
|
|
| - |
|
|
| 11,460 |
|
|
|
|
|
Matured, expired or settled contracts |
|
| - |
|
|
| (60 | ) |
|
| (11,189 | ) |
|
| (75 | ) |
|
| (24 | ) |
|
| (3,120 | ) |
|
|
|
|
Notional amounts at June 30 |
| $ | 133 |
|
| £ | 238 |
|
| ¥ | - |
|
| € | 371 |
|
| £ | 73 |
|
| ¥ | 21,180 |
|
|
|
|
|
|
|
|
|
|
|
|
|
|
|
|
|
|
|
|
|
|
|
|
|
|
|
|
|
|
|
|
|
|
|
| Foreign Currency Contracts |
| |||||||||||||||||||||||||
U.S. Dollar |
| Net Investment Hedges |
|
| Forwards and Options (1) |
| ||||||||||||||||||||||
Notional amounts at January 1 |
| $ | - |
|
| $ | 386 |
|
| $ | - |
|
| $ | 310 |
|
| $ | 148 |
|
| $ | 109 |
|
| $ | 50 |
|
New contracts |
|
| 100 |
|
|
| 85 |
|
|
| 99 |
|
|
| 192 |
|
|
| - |
|
|
| 108 |
|
|
| 15 |
|
Matured, expired or settled contracts |
|
| - |
|
|
| (100 | ) |
|
| (99 | ) |
|
| (85 | ) |
|
| (36 | ) |
|
| (27 | ) |
|
| (15 | ) |
Notional amounts at June 30 |
| $ | 100 |
|
| $ | 371 |
|
| $ | - |
|
| $ | 417 |
|
| $ | 112 |
|
| $ | 190 |
|
| $ | 50 |
|
Interest Rate Swaps
The following table summarizes the activity of our interest rate swaps designated as cash flow hedges for the six months ended June 30 (in millions):
|
| 2018 |
|
| 2017 |
| ||||||||||
|
| CAD |
|
| EUR |
|
| USD |
|
| CAD |
| ||||
Notional amounts at January 1 |
| $ | 271 |
|
| $ | - |
|
| $ | - |
|
| $ | 271 |
|
New contracts (1) |
|
| - |
|
|
| 500 |
|
|
| 300 |
|
|
| - |
|
Matured, expired or settled contracts (2) |
|
| (271 | ) |
|
| - |
|
|
| (300 | ) |
|
| - |
|
Notional amounts at June 30 |
| $ | - |
|
| $ | 500 |
|
| $ | - |
|
| $ | 271 |
|
|
|
|
|
|
|
|
|
|
|
|
|
|
|
|
|
|
(1) | During the six months ended June 30, |
(2) | During the six months ended June 30, |
Interest Rate
We may enter into interest rate swap agreements that allow us to receive variable-rate amounts from a counterparty in exchange for us making fixed-rate payments over the life of our agreements without the exchange of the underlying notional amount.
We report the effective portion of the gain or loss on the derivative as a component of AOCI and reclassify it to Interest Expense over the corresponding period of the hedged item. We recognize any hedge ineffectiveness in Interest Expense at the time the ineffectiveness occurred. During the six months ended June 30, 2018 and 2017, and 2016, we did not havehad no losses due to hedge ineffectiveness.
AtDesignated Nonderivative Financial Instruments
The following table summarizes our debt, net of accrued interest, designated as a nonderivative financial instrument to hedge our net investment in international subsidiaries (in millions):
|
| June 30, 2018 |
|
| December 31, 2017 |
| ||
British pound sterling |
| $ | 267 |
|
| $ | 436 |
|
Euro |
| $ | 3,550 |
|
| $ | 3,620 |
|
We recognized unrealized gains of $64.6 million and $40.3 million in Foreign Currency and Derivative Losses, Net on the unhedged portion of our debt, net of accrued interest, for the three and six months ended June 30, 2017,2018, respectively. We recognized unrealized losses of $7.2 million and December 31, 2016, we had$11.3 million for the three interest rate swaps outstanding with a notional amount of $271.2 million. We did not enter into or settle any interest rate swaps during theand six months ended June 30, 2017, or 2016.respectively.
Other Comprehensive Income (Loss)
The change in Other Comprehensive Income (Loss)in the Consolidated Statements of Comprehensive Income during the periods presented is due to the translation into U.S. dollars on consolidation of the financial statements into U.S. dollars of our consolidated subsidiaries whose functional currency is not the U.S. dollar. We recorded gains of $225.6 million and $307.5 million for the three and six months ended June 30, 2017, respectively, and losses of $136.0 million and gains of $18.8 million for the three and six months ended June 30, 2016, respectively. It also includes theThe change in fair value forof the effective portion of our derivative and nonderivativefinancial instruments that have been designated as hedges.
The following table presentsnet investment hedges and cash flow hedges and the gains and (losses) associated with the change in fair value for the effective portiontranslation of our derivative and nonderivative hedgingfinancial instruments as discussed above are also included in Other Comprehensive Income (Loss).
The following table presents these changes in Other Comprehensive Income (Loss) (in thousands):
|
| Three Months Ended June 30, |
|
| Six Months Ended June 30, |
| ||||||||||
|
| 2017 |
|
| 2016 |
|
| 2017 |
|
| 2016 |
| ||||
Derivative net investment hedges (1) |
| $ | 7,197 |
|
| $ | 21,512 |
|
| $ | 9,491 |
|
| $ | 29,420 |
|
Interest rate and cash flow hedges (2) |
|
| 4,559 |
|
|
| (2,703 | ) |
|
| 4,988 |
|
|
| (13,824 | ) |
Our share of derivatives from unconsolidated co-investment ventures |
|
| 2,176 |
|
|
| (3,223 | ) |
|
| 4,378 |
|
|
| (7,994 | ) |
Total derivative instruments |
|
| 13,932 |
|
|
| 15,586 |
|
|
| 18,857 |
|
|
| 7,602 |
|
Nonderivative net investment hedges (3) (4) |
|
| (229,666 | ) |
|
| 91,416 |
|
|
| (274,192 | ) |
|
| (69,773 | ) |
Total derivative and nonderivative hedging instruments |
| $ | (215,734 | ) |
| $ | 107,002 |
|
| $ | (255,335 | ) |
| $ | (62,171 | ) |
|
|
|
|
|
|
|
|
|
|
|
|
|
|
|
|
|
|
| Three Months Ended June 30, |
|
| Six Months Ended June 30, |
| ||||||||||
|
| 2018 |
|
| 2017 |
|
| 2018 |
|
| 2017 |
| ||||
Net investment hedges |
| $ | 1,740 |
|
| $ | 7,197 |
|
| $ | 4,833 |
|
| $ | 9,491 |
|
Nonderivative financial instruments |
|
| 223,739 |
|
|
| (229,666 | ) |
|
| 113,862 |
|
|
| (274,192 | ) |
Cumulative translation adjustment |
|
| (373,292 | ) |
|
| 225,631 |
|
|
| (261,738 | ) |
|
| 307,530 |
|
Total foreign currency translation gains (losses), net |
| $ | (147,813 | ) |
| $ | 3,162 |
|
| $ | (143,043 | ) |
| $ | 42,829 |
|
|
|
|
|
|
|
|
|
|
|
|
|
|
|
|
|
|
Cash flow hedges (1) |
| $ | 963 |
|
| $ | 4,559 |
|
| $ | (8,322 | ) |
| $ | 4,988 |
|
Our share of derivatives from unconsolidated co-investment ventures |
|
| 1,168 |
|
|
| 2,176 |
|
|
| 4,166 |
|
|
| 4,378 |
|
Total unrealized gains (losses) on derivative contracts, net |
| $ | 2,131 |
|
| $ | 6,735 |
|
| $ | (4,156 | ) |
| $ | 9,366 |
|
Total change in other comprehensive income (loss) |
| $ | (145,682 | ) |
| $ | 9,897 |
|
| $ | (147,199 | ) |
| $ | 52,195 |
|
|
|
|
|
|
|
|
|
|
|
|
|
|
|
|
|
|
(1) | We |
|
|
|
|
|
|
Fair Value Measurements
There have been no significant changes in our policy from what was disclosed in our Annual Report on Form 10-K for the fiscal year ended December 31, 2016.2017.
Fair Value Measurements on a Recurring Basis
At June 30, 2017,2018, and December 31, 2016,2017, other than the derivatives discussed previously, we did not have any significant financial assets or financial liabilities that were measured at fair value on a recurring basis in the Consolidated Financial Statements. All of our derivatives held at June 30, 2017,2018, and December 31, 2016,2017, were classified as Level 2 of the fair value hierarchy.
Fair Value Measurements on Nonrecurring Basis
NoAcquired properties and assets we expect to sell or contribute met the criteria to be measured at fair value on a nonrecurring basis at fair value and the lower of their carrying amount or their estimated fair value less the costs to sell, respectively, at June 30, 2017, or2018 and December 31, 2016.2017. At June 30, 2018 and December 31, 2017, we estimate the fair value of our properties using Level 2 or Level 3 inputs from the fair value hierarchy. See more information on our acquired properties and assets held for sale or contribution in Notes 2 and 4, respectively.
Fair Value of Financial Instruments
At June 30, 2017,2018, and December 31, 2016,2017, the carrying amounts of certain financial instruments, including cash and cash equivalents, restricted cash, accounts and notes receivable, accounts payable and accrued expenses were representative of their fair values because of the short-term nature of these instruments.values.
The differences in the fair value of our debt from the carrying value in the table below arewere the result of differences in interest rates or borrowing spreads that were available to us at June 30, 2017,2018 and December 31, 2016,2017, as compared with those in effect when the debt was issued or assumed.assumed, including reduced borrowing spreads due to our improved credit ratings. The senior notes and many of the issuesissuances of secured mortgage debtmortgages contain pre-payment penalties or yield maintenance provisions that could make the cost of refinancing the debt at lower rates exceed the benefit that would be derived from doing so.
The following table reflects the carrying amounts and estimated fair values of our debt (in thousands):
|
| June 30, 2017 |
|
| December 31, 2016 |
|
| June 30, 2018 |
|
| December 31, 2017 |
| ||||||||||||||||||||
|
| Carrying Value |
|
| Fair Value |
|
| Carrying Value |
|
| Fair Value |
|
| Carrying Value |
|
| Fair Value |
|
| Carrying Value |
|
| Fair Value |
| ||||||||
Credit Facilities |
| $ | - |
|
| $ | - |
|
| $ | 35,023 |
|
| $ | 35,061 |
|
| $ | 11,658 |
|
| $ | 11,660 |
|
| $ | 317,392 |
|
| $ | 317,496 |
|
Senior notes |
|
| 6,727,450 |
|
|
| 7,216,569 |
|
|
| 6,417,492 |
|
|
| 6,935,485 |
|
|
| 7,102,381 |
|
|
| 7,447,585 |
|
|
| 6,067,277 |
|
|
| 6,537,100 |
|
Term loans and unsecured other |
|
| 1,968,437 |
|
|
| 1,986,654 |
|
|
| 1,499,001 |
|
|
| 1,510,661 |
|
|
| 1,415,661 |
|
|
| 1,431,793 |
|
|
| 2,060,491 |
|
|
| 2,075,002 |
|
Secured mortgages |
|
| 1,983,623 |
|
|
| 2,063,821 |
|
|
| 979,585 |
|
|
| 1,055,020 |
|
|
| 897,424 |
|
|
| 937,205 |
|
|
| 967,471 |
|
|
| 1,026,197 |
|
Secured mortgages of consolidated entities |
|
| 402,412 |
|
|
| 402,348 |
|
|
| 1,677,193 |
|
|
| 1,683,489 |
| ||||||||||||||||
Total debt |
| $ | 11,081,922 |
|
| $ | 11,669,392 |
|
| $ | 10,608,294 |
|
| $ | 11,219,716 |
| ||||||||||||||||
Total |
| $ | 9,427,124 |
|
| $ | 9,828,243 |
|
| $ | 9,412,631 |
|
| $ | 9,955,795 |
| ||||||||||||||||
|
|
|
|
|
|
|
|
|
|
|
|
|
|
|
|
| ||||||||||||||||
NOTE 10. BUSINESSBUSINESS SEGMENTS
Our current business strategy consists of two operating segments: Real Estate Operations and Strategic Capital. We generate revenues, earnings, net operating income, earnings and cash flows through our segments, as follows:
Real Estate Operations. This operating segment represents the ownership and development of operating properties and is the largest component of our revenues and earnings. We collect rent from our customers through operating leases, including reimbursements for the majority of our property operating costs. Each operating property is considered to be an individual operating segment with similar economic characteristics; these properties are combined within the reportable business segment based on geographic location. Our Real Estate Operations segment also includes development activities that lead to rental operations, including land held for development and properties currently under development. Within this line of business, we utilize the following: (i) our land bank; (ii) the development expertise of our local teams; and (iii) our customer relationships; and (iv) our in-depth knowledge in connection with our development activities.relationships. Land we own and lease to customers under ground leases is also included in this segment.
Strategic Capital. This operating segment represents the management of unconsolidated co-investment ventures. We generate strategic capital revenues primarily from our unconsolidated co-investment ventures through asset management and property management services and we earn additional revenues by providing leasing, acquisition, construction, development, financing, legal and disposition services. Depending on the structure of the venture and the returns provided to our partners, we also earn revenues through promotes periodically during the life of a venture or upon liquidation. Each unconsolidated co-investment venture we manage is considered to be an individual operating segment with similar economic characteristics; these ventures are combined within the reportable business segment based on geographic location.
Reconciliations are presented below for: (i) each reportable business segment’s revenues from external customers to Total Revenues; (ii) each reportable business segment’s net operating income from external customers to Operating Income and Earnings Before Income Taxes; and (iii) each reportable business segment’s assets to Total Assets. Our chief operating decision makers rely primarily on net operating income and similar measures to make decisions about allocating resources and assessing segment performance. The applicable components of Total Revenues, Operating Income, Earnings Before Income Taxes and Total Assets are allocated to each reportable business segment’s revenues, net operating income and assets. Items that are not directly assignable to a segment, such as certain corporate income and expenses, are not allocated but reflected as reconciling items. The following reconciliations are presented in thousands:
|
| Three Months Ended |
|
| Six Months Ended |
|
| Three Months Ended June 30, |
|
| Six Months Ended June 30, |
| ||||||||||||||||||||
|
| June 30, |
|
| June 30, |
|
|
| 2018 |
|
|
| 2017 |
|
|
| 2018 |
|
|
| 2017 |
| ||||||||||
|
|
| 2017 |
|
|
| 2016 |
|
|
| 2017 |
|
|
| 2016 |
| ||||||||||||||||
Revenues: |
|
|
|
|
|
|
|
|
|
|
|
|
|
|
|
| ||||||||||||||||
Segment revenues: |
|
|
|
|
|
|
|
|
|
|
|
|
|
|
|
| ||||||||||||||||
Real estate operations segment: |
|
|
|
|
|
|
|
|
|
|
|
|
|
|
|
|
|
|
|
|
|
|
|
|
|
|
|
|
|
|
|
|
U.S. |
| $ | 529,841 |
|
| $ | 501,707 |
|
| $ | 1,053,988 |
|
| $ | 1,012,864 |
|
| $ | 491,051 |
|
| $ | 529,841 |
|
| $ | 990,308 |
|
| $ | 1,053,988 |
|
Other Americas |
|
| 16,444 |
|
|
| 15,083 |
|
|
| 31,533 |
|
|
| 29,018 |
|
|
| 29,948 |
|
|
| 16,444 |
|
|
| 60,379 |
|
|
| 31,533 |
|
Europe |
|
| 22,076 |
|
|
| 19,533 |
|
|
| 40,307 |
|
|
| 36,008 |
|
|
| 12,908 |
|
|
| 22,076 |
|
|
| 30,110 |
|
|
| 40,307 |
|
Asia |
|
| 17,168 |
|
|
| 12,297 |
|
|
| 31,811 |
|
|
| 26,027 |
|
|
| 11,672 |
|
|
| 17,168 |
|
|
| 25,477 |
|
|
| 31,811 |
|
Total real estate operations segment |
|
| 585,529 |
|
|
| 548,620 |
|
|
| 1,157,639 |
|
|
| 1,103,917 |
|
|
| 545,579 |
|
|
| 585,529 |
|
|
| 1,106,274 |
|
|
| 1,157,639 |
|
Strategic capital segment: |
|
|
|
|
|
|
|
|
|
|
|
|
|
|
|
|
|
|
|
|
|
|
|
|
|
|
|
|
|
|
|
|
U.S. |
|
| 130,677 |
|
|
| 9,580 |
|
|
| 142,585 |
|
|
| 18,936 |
|
|
| 17,905 |
|
|
| 130,677 |
|
|
| 33,974 |
|
|
| 142,585 |
|
Other Americas |
|
| 9,864 |
|
|
| 5,693 |
|
|
| 15,915 |
|
|
| 11,079 |
|
|
| 12,256 |
|
|
| 9,864 |
|
|
| 18,409 |
|
|
| 15,915 |
|
Europe |
|
| 25,973 |
|
|
| 25,526 |
|
|
| 52,235 |
|
|
| 48,109 |
|
|
| 28,488 |
|
|
| 25,973 |
|
|
| 67,305 |
|
|
| 52,235 |
|
Asia |
|
| 14,140 |
|
|
| 12,736 |
|
|
| 26,964 |
|
|
| 26,414 |
|
|
| 17,048 |
|
|
| 14,140 |
|
|
| 88,970 |
|
|
| 26,964 |
|
Total strategic capital segment |
|
| 180,654 |
|
|
| 53,535 |
|
|
| 237,699 |
|
|
| 104,538 |
|
|
| 75,697 |
|
|
| 180,654 |
|
|
| 208,658 |
|
|
| 237,699 |
|
|
|
|
|
|
|
|
|
|
|
|
|
|
|
|
|
|
|
|
|
|
|
|
|
|
|
|
|
|
|
|
|
|
Total revenues |
| $ | 766,183 |
|
| $ | 602,155 |
|
| $ | 1,395,338 |
|
| $ | 1,208,455 |
| ||||||||||||||||
Total segment revenues |
|
| 621,276 |
|
|
| 766,183 |
|
|
| 1,314,932 |
|
|
| 1,395,338 |
| ||||||||||||||||
|
|
|
|
|
|
|
|
|
|
|
|
|
|
|
|
|
|
|
|
|
|
|
|
|
|
|
|
|
|
|
|
|
Segment net operating income: |
|
|
|
|
|
|
|
|
|
|
|
|
|
|
|
|
|
|
|
|
|
|
|
|
|
|
|
|
|
|
|
|
Real estate operations segment: |
|
|
|
|
|
|
|
|
|
|
|
|
|
|
|
|
|
|
|
|
|
|
|
|
|
|
|
|
|
|
|
|
U.S. |
| $ | 396,274 |
|
| $ | 369,786 |
|
| $ | 780,374 |
|
| $ | 745,503 |
| ||||||||||||||||
U.S. (1) |
|
| 367,935 |
|
|
| 396,274 |
|
|
| 737,299 |
|
|
| 780,374 |
| ||||||||||||||||
Other Americas |
|
| 10,384 |
|
|
| 10,517 |
|
|
| 20,366 |
|
|
| 18,710 |
|
|
| 22,488 |
|
|
| 10,384 |
|
|
| 45,411 |
|
|
| 20,366 |
|
Europe |
|
| 16,401 |
|
|
| 15,328 |
|
|
| 29,259 |
|
|
| 26,633 |
|
|
| 8,693 |
|
|
| 16,401 |
|
|
| 21,152 |
|
|
| 29,259 |
|
Asia |
|
| 11,767 |
|
|
| 8,364 |
|
|
| 21,675 |
|
|
| 17,180 |
|
|
| 8,619 |
|
|
| 11,767 |
|
|
| 18,388 |
|
|
| 21,675 |
|
Total real estate operations segment |
|
| 434,826 |
|
|
| 403,995 |
|
|
| 851,674 |
|
|
| 808,026 |
|
|
| 407,735 |
|
|
| 434,826 |
|
|
| 822,250 |
|
|
| 851,674 |
|
Strategic capital segment: |
|
|
|
|
|
|
|
|
|
|
|
|
|
|
|
|
|
|
|
|
|
|
|
|
|
|
|
|
|
|
|
|
U.S. |
|
| 99,668 |
|
|
| 826 |
|
|
| 101,607 |
|
|
| 2,536 |
| ||||||||||||||||
U.S. (1) |
|
| 5,893 |
|
|
| 99,668 |
|
|
| 1,657 |
|
|
| 101,607 |
| ||||||||||||||||
Other Americas |
|
| 7,587 |
|
|
| 3,052 |
|
|
| 10,732 |
|
|
| 6,188 |
|
|
| 9,032 |
|
|
| 7,587 |
|
|
| 11,939 |
|
|
| 10,732 |
|
Europe |
|
| 16,342 |
|
|
| 18,450 |
|
|
| 32,732 |
|
|
| 34,070 |
|
|
| 19,382 |
|
|
| 16,342 |
|
|
| 47,045 |
|
|
| 32,732 |
|
Asia |
|
| 5,071 |
|
|
| 3,341 |
|
|
| 8,843 |
|
|
| 8,585 |
|
|
| 6,540 |
|
|
| 5,071 |
|
|
| 69,307 |
|
|
| 8,843 |
|
Total strategic capital segment |
|
| 128,668 |
|
|
| 25,669 |
|
|
| 153,914 |
|
|
| 51,379 |
|
|
| 40,847 |
|
|
| 128,668 |
|
|
| 129,948 |
|
|
| 153,914 |
|
|
|
|
|
|
|
|
|
|
|
|
|
|
|
|
|
|
|
|
|
|
|
|
|
|
|
|
|
|
|
|
|
|
Total segment net operating income |
|
| 563,494 |
|
|
| 429,664 |
|
|
| 1,005,588 |
|
|
| 859,405 |
|
|
| 448,582 |
|
|
| 563,494 |
|
|
| 952,198 |
|
|
| 1,005,588 |
|
|
|
|
|
|
|
|
|
|
|
|
|
|
|
|
|
|
|
|
|
|
|
|
|
|
|
|
|
|
|
|
|
|
Reconciling items: |
|
|
|
|
|
|
|
|
|
|
|
|
|
|
|
|
|
|
|
|
|
|
|
|
|
|
|
|
|
|
|
|
General and administrative expenses |
|
| 60,077 |
|
|
| 56,934 |
|
|
| 113,694 |
|
|
| 107,477 |
|
|
| 57,615 |
|
|
| 60,077 |
|
|
| 120,043 |
|
|
| 113,694 |
|
Depreciation and amortization expenses |
|
| 228,145 |
|
|
| 230,382 |
|
|
| 454,736 |
|
|
| 480,382 |
|
|
| 203,673 |
|
|
| 228,145 |
|
|
| 407,754 |
|
|
| 454,736 |
|
Operating income |
|
| 275,272 |
|
|
| 142,348 |
|
|
| 437,158 |
|
|
| 271,546 |
|
|
| 187,294 |
|
|
| 275,272 |
|
|
| 424,401 |
|
|
| 437,158 |
|
Earnings from unconsolidated entities, net |
|
| 68,596 |
|
|
| 41,454 |
|
|
| 117,201 |
|
|
| 99,765 |
|
|
| 62,549 |
|
|
| 68,596 |
|
|
| 125,205 |
|
|
| 117,201 |
|
Interest expense |
|
| (75,354 | ) |
|
| (76,455 | ) |
|
| (148,266 | ) |
|
| (157,267 | ) |
|
| (56,314 | ) |
|
| (75,354 | ) |
|
| (102,575 | ) |
|
| (148,266 | ) |
Interest and other income, net |
|
| 1,892 |
|
|
| 1,527 |
|
|
| 4,677 |
|
|
| 4,118 |
|
|
| 5,641 |
|
|
| 1,892 |
|
|
| 7,617 |
|
|
| 4,677 |
|
Gains on dispositions of investments in real estate, net |
|
| 83,006 |
|
|
| 200,350 |
|
|
| 180,331 |
|
|
| 344,667 |
|
|
| 94,261 |
|
|
| 83,006 |
|
|
| 289,372 |
|
|
| 180,331 |
|
Foreign currency and derivative losses, net |
|
| (20,055 | ) |
|
| (10,335 | ) |
|
| (27,455 | ) |
|
| (24,546 | ) | ||||||||||||||||
Foreign currency and derivative gains (losses), net |
|
| 85,382 |
|
|
| (20,055 | ) |
|
| 44,288 |
|
|
| (27,455 | ) | ||||||||||||||||
Gains (losses) on early extinguishment of debt, net |
|
| (30,596 | ) |
|
| 2,044 |
|
|
| (30,596 | ) |
|
| 992 |
|
|
| 282 |
|
|
| (30,596 | ) |
|
| (702 | ) |
|
| (30,596 | ) |
Earnings before income taxes |
| $ | 302,761 |
|
| $ | 300,933 |
|
| $ | 533,050 |
|
| $ | 539,275 |
|
| $ | 379,095 |
|
| $ | 302,761 |
|
| $ | 787,606 |
|
| $ | 533,050 |
|
|
|
|
|
|
|
|
|
|
|
|
|
|
|
|
|
| ||||||||||||||||
| June 30, |
|
| December 31, |
|
| June 30, 2018 |
|
| December 31, 2017 |
| |||||
|
|
| 2017 |
|
|
| 2016 |
| ||||||||
Assets: |
|
|
|
|
|
|
|
| ||||||||
Segment assets: |
|
|
|
|
|
|
|
| ||||||||
Real estate operations segment: |
|
|
|
|
|
|
|
|
|
|
|
|
|
|
|
|
U.S. |
| $ | 21,295,808 |
|
| $ | 21,286,422 |
|
| $ | 18,807,476 |
|
| $ | 19,058,610 |
|
Other Americas |
|
| 1,052,052 |
|
|
| 978,476 |
|
|
| 1,618,701 |
|
|
| 1,767,385 |
|
Europe |
|
| 1,139,882 |
|
|
| 1,346,589 |
|
|
| 970,749 |
|
|
| 1,008,340 |
|
Asia |
|
| 1,147,246 |
|
|
| 936,462 |
|
|
| 1,023,036 |
|
|
| 1,083,764 |
|
Total real estate operations segment |
|
| 24,634,988 |
|
|
| 24,547,949 |
|
|
| 22,419,962 |
|
|
| 22,918,099 |
|
Strategic capital segment: |
|
|
|
|
|
|
|
|
|
|
|
|
|
|
|
|
U.S. |
|
| 17,454 |
|
|
| 18,090 |
|
|
| 16,438 |
|
|
| 16,818 |
|
Europe |
|
| 44,680 |
|
|
| 47,635 |
|
|
| 25,280 |
|
|
| 25,280 |
|
Asia |
|
| 958 |
|
|
| 1,301 |
|
|
| 341 |
|
|
| 544 |
|
Total strategic capital segment |
|
| 63,092 |
|
|
| 67,026 |
|
|
| 42,059 |
|
|
| 42,642 |
|
Total segment assets |
|
| 24,698,080 |
|
|
| 24,614,975 |
|
|
| 22,462,021 |
|
|
| 22,960,741 |
|
|
|
|
|
|
|
|
|
| ||||||||
Reconciling items: |
|
|
|
|
|
|
|
|
|
|
|
|
|
|
|
|
Investments in and advances to unconsolidated entities |
|
| 4,617,724 |
|
|
| 4,230,429 |
| �� |
| 5,414,623 |
|
|
| 5,496,450 |
|
Assets held for sale or contribution |
|
| 350,987 |
|
|
| 322,139 |
|
|
| 892,546 |
|
|
| 342,060 |
|
Notes receivable backed by real estate |
|
| 19,536 |
|
|
| 32,100 |
|
|
| - |
|
|
| 34,260 |
|
Cash and cash equivalents |
|
| 271,354 |
|
|
| 807,316 |
|
|
| 527,830 |
|
|
| 447,046 |
|
Other assets |
|
| 192,714 |
|
|
| 242,973 |
|
|
| 205,862 |
|
|
| 200,518 |
|
Total reconciling items |
|
| 5,452,315 |
|
|
| 5,634,957 |
|
|
| 7,040,861 |
|
|
| 6,520,334 |
|
Total assets |
| $ | 30,150,395 |
|
| $ | 30,249,932 |
|
| $ | 29,502,882 |
|
| $ | 29,481,075 |
|
(1) | This includes compensation and personnel costs for employees who were located in the U.S. but also support other regions. |
NOTE 11. SUPPLEMENTAL CASH FLOW INFORMATION
Our significant noncash investing and financing activities for the six months ended June 30, 2017,2018 and 20162017 included the following:
We capitalized $14.1 million and $14.0 million in 2018 and $13.3 million in 2017, and 2016, respectively, of equity-based compensation expense resulting from our development and leasing activities.
We issued 0.7received $105.4 million and 0.9$22.8 million shares in 2018 and 2017, and 2016, respectively, of the Parent’s common stock upon redemption of an equal number of common limited partnership units in the Operating Partnership, as disclosed in Note 6.
We received $22.8 million of ownership interests in certain unconsolidated co-investment ventures as a portion of our proceeds from the contribution of properties to these entities, during 2017, as disclosed in Note 3.2.
We formed a consolidated joint venture into which our partner contributed $11.8 million of land in 2018.
We issued 0.7 million shares in 2017 of the Parent’s common stock upon redemption of an equal number of common limited partnership units in the OP.
We received a $19.5 million of a note backed by real estate in exchange for the disposition of real estate in 2017.
We paid $188.1$154.4 million and $197.9$188.1 million for interest, net of amounts capitalized, for the six months ended June 30, 2017,2018 and 2016,2017, respectively.
We paid $23.6$32.3 million and $14.4$23.6 million for income taxes, net of refunds, for the six months ended June 30, 2018 and 2017, respectively.
Proposed Merger. On April 29, 2018, we entered into a definitive agreement (the “Merger Agreement”) with DCT Industrial Trust Inc. (“DCT”) and 2016, respectively.DCT Industrial Operating Partnership LP (“DCT OP”), pursuant to which, subject to the terms and conditions set forth in the Merger Agreement, (i) DCT will merge with and into Prologis, with Prologis surviving the merger (the “Company Merger”) and (ii) immediately prior to the effective time of the Company Merger, DCT OP will merge with and into the OP, with the OP surviving the merger (the “Partnership Merger” and, together with the Company Merger, the “Mergers”). The estimated purchase price consideration for the Mergers will be approximately $8.2 billion in a stock-for-stock transaction, including the assumption of debt, and is based on the closing price of Prologis' common stock on July 19, 2018. Under the terms of the Merger Agreement, at the effective time of the Company Merger, each issued and outstanding share of DCT common stock will be converted automatically into the right to receive 1.02 shares of Prologis common stock and each issued and outstanding common unit of DCT OP will be converted automatically into the right to receive 1.02 common units of the OP. This exchange ratio is fixed and will not be adjusted to reflect changes in the Prologis stock price prior to closing. Changes in the price of Prologis common stock prior to the Mergers will affect the market value of the
merger consideration that DCT stockholders and unitholders will receive on the closing date of the Mergers. After consideration of all applicable factors pursuant to the business combination accounting rules, we concluded the Mergers will be treated as an asset acquisition and as a result the transaction costs will be capitalized to the basis of the acquired properties.
On July 9, 2018, the SEC declared the registration statement on Form S-4 for the proposed Mergers effective. Subject to DCT stockholder approval and the other closing conditions described in the Form S-4, the Mergers are expected to be consummated in August 2018.
In connection with the Mergers, on July 2, 2018, DCT, DCT OP, DCT’s board of directors (the “DCT Board”), Prologis, and the OP were sued in a putative class action lawsuit, the Rosenblatt Action, filed in the United States District Court for the District of Colorado, in connection with DCT's proposed merger with Prologis and the related Form S-4. The complaint in the Rosenblatt Action alleges that DCT, DCT OP, the DCT Board, Prologis, and Prologis OP violated federal securities laws by omitting material information from the Form S-4, rendering the Form S-4 materially deficient. On July 10, 2018, DCT and the DCT Board were sued in another putative class action lawsuit, the Bushansky Action, also filed in the United States District Court for the District of Colorado, and also in connection with DCT's proposed merger with Prologis and the related Form S-4. On July 13, 2018, DCT, DCT OP and the DCT Board were sued in a third putative class action lawsuit, the Aiken Action, filed in the United States District Court for the District of Maryland, also in connection with DCT’s proposed merger with Prologis and the related Form S-4. The complaints in the Bushansky Action and the Aiken Action allege that DCT and the DCT Board violated federal securities laws by omitting from the Form S-4, and/or misrepresenting in the Form S-4, material information, rendering the Form S-4 materially deficient. In all three actions, the plaintiffs seek, among other things, (i) to enjoin the transaction (or rescind it to the extent it is completed), and (ii) attorneys' fees and costs in connection with these lawsuits.
Although the ultimate outcome of litigation cannot be predicted with certainty, we believe that these lawsuits are without merit and intend to defend against these actions vigorously.
REPORT OF INDEPENDENT REGISTERED PUBLIC ACCOUNTING FIRM
Report of Independent Registered Public Accounting Firm
TheTo the Stockholders and Board of Directors and Stockholders
Prologis, Inc.:
Results of Review of Interim Financial Information
We have reviewed the accompanying consolidated balance sheet of Prologis, Inc. and subsidiaries (the Company) as of June 30, 2017,2018, the related consolidated statements of income, and consolidated statements of comprehensive income for the three-month and six-month periods ended June 30, 20172018 and 2016,2017, the related consolidated statement of equity for the six-month period ended June 30, 2017, and2018, the related consolidated statements of cash flows for the six-month periods ended June 30, 2018 and 2017, and 2016. Thesethe related notes (collectively, the consolidated interim financial statementsinformation). Based on our reviews, we are not aware of any material modifications that should be made to the responsibility of the Company’s management.consolidated interim financial information for it to be in conformity with U.S. generally accepted accounting principles.
We conducted our reviewshave previously audited, in accordance with the standards of the Public Company Accounting Oversight Board (United States). (PCAOB), the consolidated balance sheet of the Company as of December 31, 2017, and the related consolidated statements of income, comprehensive income, equity, and cash flows for the year then ended (not presented herein); and in our report dated February 15, 2018, we expressed an unqualified opinion on those consolidated financial statements. In our opinion, the information set forth in the accompanying consolidated balance sheet as of December 31, 2017, is fairly stated, in all material respects, in relation to the consolidated balance sheet from which it has been derived.
Basis for Review Results
This consolidated interim financial information is the responsibility of the Company’s management. We are a public accounting firm registered with the PCAOB and are required to be independent with respect to the Company in accordance with the U.S. federal securities laws and the applicable rules and regulations of the Securities and Exchange Commission and the PCAOB.
We conducted our reviews in accordance with the standards of the PCAOB. A review of consolidated interim financial information consists principally of applying analytical procedures and making inquiries of persons responsible for financial and accounting matters. It is substantially less in scope than an audit conducted in accordance with the standards of the Public Company Accounting Oversight Board (United States),PCAOB, the objective of which is the expression of an opinion regarding the financial statements taken as a whole. Accordingly, we do not express such an opinion.
/s/ KPMG LLP
Denver, Colorado
July 23, 2018
REPORT OF INDEPENDENT REGISTERED PUBLIC ACCOUNTING FIRM
To the Partners
Prologis, L.P.:
Results of Review of Interim Financial Information
We have reviewed the consolidated balance sheet of Prologis, L.P. and subsidiaries (the Operating Partnership) as of June 30, 2018, the related consolidated statements of income, and consolidated statements of comprehensive income for the three-month and six-month periods ended June 30, 2018 and 2017, the related consolidated statement of capital for the six-month period ended June 30, 2018, the related consolidated statements of cash flows for the six-month periods ended June 30, 2018 and 2017, and the related notes (collectively, the consolidated interim financial information). Based on our reviews, we are not aware of any material modifications that should be made to the consolidated interim financial statements referred to aboveinformation for themit to be in conformity with U.S. generally accepted accounting principles.
As discussed in Note 1 of the consolidated financial statements, during 2016 the Company changed its method for classifying distributions received from equity method investees in the consolidated statements of cash flows for all periods presented at June 30, 2017, on a retrospective basis, due to the early adoption of Accounting Standards Update 2016-15.
We have previously audited, in accordance with the standards of the Public Company Accounting Oversight Board (United States) (PCAOB), the consolidated balance sheet of Prologis, Inc. and subsidiariesthe Operating Partnership as of December 31, 2016,2017, and the related consolidated statements of income, comprehensive income, equitycapital, and cash flows for the year then ended (not presented herein); and in our report dated February 14, 2017,15, 2018, we expressed an unqualified opinion on those consolidated financial statements. In our opinion, the information set forth in the accompanying consolidated balance sheet as of December 31, 2016,2017, is fairly stated, in all material respects, in relation to the consolidated balance sheet from which it has been derived.
/s/ KPMG LLPBasis for Review Results
Denver, Colorado
July 26, 2017
Report of Independent Registered Public Accounting Firm
The Partners
Prologis, L.P.:
We have reviewed the accompanyingThis consolidated balance sheet of Prologis, L.P. and subsidiaries (the Operating Partnership) as of June 30, 2017, the related consolidated statements of income, and consolidated statements of comprehensive income for the three-month and six-month periods ended June 30, 2017 and 2016, the related consolidated statement of capital for the six-month period ended June 30, 2017, and the related consolidated statements of cash flows for the six-month periods ended June 30, 2017 and 2016. These consolidatedinterim financial statements areinformation is the responsibility of the Operating Partnership’s management.
We are a public accounting firm registered with the PCAOB and are required to be independent with respect to the Operating Partnership in accordance with the U.S. federal securities laws and the applicable rules and regulations of the Securities and Exchange Commission and the PCAOB.
We conducted our reviews in accordance with the standards of the Public Company Accounting Oversight Board (United States).PCAOB. A review of consolidated interim financial information consists principally of applying analytical procedures and making inquiries of persons responsible for financial and accounting matters. It is substantially less in scope than an audit conducted in accordance with the standards of the Public Company Accounting Oversight Board (United States),PCAOB, the objective of which is the expression of an opinion regarding the financial statements taken as a whole. Accordingly, we do not express such an opinion.
Based on our reviews, we are not aware of any material modifications that should be made to the consolidated financial statements referred to above for them to be in conformity with U.S. generally accepted accounting principles.
As discussed in Note 1 of the consolidated financial statements, during 2016 the Operating Partnership changed its method for classifying distributions received from equity method investees in the consolidated statements of cash flows for all periods presented at June 30, 2017, on a retrospective basis, due to the early adoption of Accounting Standards Update 2016-15.
We have previously audited, in accordance with standards of the Public Company Accounting Oversight Board (United States), the consolidated balance sheet of Prologis, L.P. and subsidiaries as of December 31, 2016, and the related consolidated statements of income, comprehensive income, capital and cash flows for the year then ended (not presented herein); and in our report dated February 14, 2017, we expressed an unqualified opinion on those consolidated financial statements. In our opinion, the information set forth in the accompanying consolidated balance sheet as of December 31, 2016, is fairly stated, in all material respects, in relation to the consolidated balance sheet from which it has been derived.
/s/ KPMG LLP
Denver, Colorado
July 26, 2017
23, 2018
ITEM 2. Management’s DisMacussionnagement’s Discussion and Analysis of Financial Condition and Results of Operations
The following should be read in conjunction with the Consolidated Financial Statements and related Notes included in Item 1 of this report and our Annual Report on Form 10-K for the fiscal year ended December 31, 2016,2017, as filed with the Securities and Exchange Commission (“SEC”).
The statements in this report that are not historical facts are forward-looking statements within the meaning of Section 27A of the Securities Act of 1933, as amended, and Section 21E of the Securities Exchange Act of 1934, as amended. These forward-looking statements are based on current expectations, estimates and projections about the industry and markets in which we operate as well as management’s beliefs and assumptions. Such statements involve uncertainties that could significantly impact our financial results. Words such as “expects,” “anticipates,” “intends,” “plans,” “believes,” “seeks”“seeks,” and “estimates” including variations of such words and similar expressions are intended to identify such forward-looking statements, which generally are not historical in nature. All statements that address operating performance, events or developments that we expect or anticipate will occur in the future — including statements relating to rent and occupancy growth, development activity, and contribution orand disposition activity, general conditions in the geographic areas where we operate, our debt, capital structure and financial position, our ability to form new co-investment ventures and the availability of capital in existing or new co-investment ventures — are forward-looking statements. These statements are not guarantees of future performance and involve certain risks, uncertainties and assumptions that are difficult to predict. Although we believe the expectations reflected in any forward-looking statements are based on reasonable assumptions, we can give no assurance that our expectations will be attained, and therefore actual outcomes and results may differ materially from what is expressed or forecasted in such forward-looking statements. Some of the factors that may affect outcomes and results include, but are not limited to: (i) national, international, regional and local economic and political climates; (ii) changes in global financial markets, interest rates and foreign currency exchange rates; (iii) increased or unanticipated competition for our properties; (iv) risks associated with acquisitions, dispositions and development of properties; (v) maintenance of REITreal estate investment trust (“REIT”) status, tax structuring and changes in income tax laws and rates; (vi) availability of financing and capital, the levels of debt that we maintain and our credit ratings; (vii) risks related to our investments in our co-investment ventures, including our ability to establish new co-investment ventures; (viii) risks of doing business internationally, including currency risks; (ix) environmental uncertainties, including risks of natural disasters; and (x) those additional factors discussed under Part I, Item 1A. Risk Factors in our Annual Report on Form 10-K for the fiscal year ended December 31, 2016.2017. We undertake no duty to update any forward-looking statements appearing in this report except as may be required by law.
Prologis, Inc. is a self-administered and self-managed real estate investment trust (a “REIT”)REIT and is the sole general partner of Prologis, L.P. We operate Prologis, Inc. and PrologsPrologis, L.P. as one enterprise and, therefore, our discussion and analysis refers to Prologis, Inc. and its consolidated subsidiaries, including Prologis, L.P., collectively. We invest in real estate through wholly owned subsidiaries and other entities through which we co-invest with partners and investors. We maintain a significant level of ownership in these co-investment ventures, which may be consolidated or unconsolidated based on our level of control of the entity.
MANAGEMENT’S OVERVIEW
Prologis is the global leader in logistics real estate with a focus on high-barrier, high-growth markets.markets in 19 countries. We own, manage and develop well-located, high-quality logistics facilities in the world’s most active centersbusiest consumption markets. Our local teams actively manage our portfolio, which encompasses leasing and property management, capital deployment and opportunistic dispositions allowing us to recycle capital to self-fund our development activities. The majority of commerce. An investmentour properties in Prologis taps intothe United States (“U.S.”) are wholly owned, while our properties outside the U.S. are generally held in co-investment ventures, reducing our exposure to foreign currency movements.
Our portfolio benefits from key drivers of economic growth,activity, including consumption, supply chain modernization, e-commerce and urbanization.
In the developed markets of the U.S., Europe and Japan, key factors are the reconfiguration of supply chains (strongly influenced by e-commerce trends), and the operational efficiencies that can be realized from our modern logistics facilities. In emerging markets, such as Brazil, China and Mexico, new affluence and the rise of a new consumer class have increased the need for modern distribution networks. Our strategy is to own the highest-quality logistics property portfolio in each of our target markets. These markets are characterized by large population densities and consumption. They typically offer proximity to large labor pools and are supported by extensive transportation infrastructure (major airports, seaports and rail and highway networks). Customers turn to us because they know an efficient supply chain will make their businesses run better, and that a strategic relationship with Prologis will create a competitive advantage. We lease modern logistics facilities to a diverse base of approximately 5,200 customers. These facilities assist the efficient distribution of goods for the world’s best businesses and brands.
We invest in Class-A logistics facilities in the world’s primary population centers with high barriers to entry and supported by extensive transportation infrastructure (major airports, seaports and rail and highway networks). We believe our portfolio is the highest-quality logistics property portfolio in the industry because it is focused in these key markets. Our local teams actively manage the portfolio, which encompasses leasing and property management, capital deployment and an opportunistic disposition program. The majority of our consolidated properties are in the United States (“U.S.”); while our properties outside the U.S. are generally held in co-investment ventures, which reduces our exposure to movements in foreign currency. Therefore, we are principally an owner-operator in the U.S. and a manager-developer outside the U.S.
We manageoperate our business on an owned and managed basis, including properties that we wholly owned by us orown and properties that are owned by one of our co-investment ventures, which allows us toventures. We make decisions based on the property operations, versus our ownership. We believe the operating fundamentalsregardless of our owned and managed portfolio are consistent with those of our consolidated portfolio,ownership interest, and therefore we generally look atevaluate operating metrics on an owned and managed basis.
At June 30, 2017,2018, we owned or had investments in, on a wholly-owned basis or through co-investment ventures, properties and development projects (based on gross book value and total expected to total $54.7investment (“TEI”)) totaling $58.6 billion in gross total investment across 684685 million square feet (64 million square meters) in 19 countries spanningacross four continents. Our investment of $32.7totaled $33.6 billion and consisted of our wholly-owned properties and our pro rata (or ownership) share of the properties owned by our co-investment ventures. We leased modern logistics facilities to a diverse base of approximately 5,000 customers.
Our business comprises two operating segments: Real Estate Operations and Strategic Capital. See below for information for the six months ended June 30, 2017:
REAL ESTATE | STRATEGIC CAPITAL | |
RENTAL
Generate revenues, net operating income |
DEVELOPMENT
Provide significant earnings growth as projects lease up and generate income |
Access third-party capital to grow our business and earn |
|
|
|
Real Estate Operations
Rental Operations.Rental. Rental operations comprise the largest component of our operating segments and generally contribute 85% to 90% of our consolidated revenues, earnings and funds from operations (“FFO”) (see below for more information on funds from operations,FFO, a non-GAAP measure). We collect rent from our customers through operating leases, including reimbursements for the majority of our property operating costs. We expect to generate long-term internal growth by increasing rents, maintaining high occupancy rates and controlling expenses. The primary driver of our rent growth will be rolling in-place leases to current market rents. We believe our active portfolio management, coupled with the skills of our property, leasing, maintenance, capital, energy and risk management teams, will allow us to maximize rental revenues across our portfolio. In the first six months of 2017, more than 90%A significant amount of our consolidatedrental revenues and NOI in this segment werenet operating income (“NOI”) are generated in the U.S. NOI from this segment is calculated directly from our financial statements as rental revenues, rental recoveries and development management and other revenues less rental expenses and other expenses.
Development. We usedevelop properties to meet our customers’ needs, deepen our market presence and refresh our portfolio quality. We believe we have a competitive advantage due to (i) the strategic locations of our land bank; (ii) the development expertise of our local teams; and (iii) the depth of our customer relationships; and (iv) our in-depth local knowledge in connection with our value creation activities.relationships. Successful development and redevelopment efforts increase both the rental revenues and the net asset value of our Real Estate Operations segment. We measure the development value we createdcreate based on the increase in estimated fair value of a stabilized development property, as compared to the costs incurred. Generally, weWe develop properties in the U.S. for long-term hold or contribution to our unconsolidated co-investment venture and outside the U.S. we develop primarily for contribution to our co-investment ventures. Occasionally, we develop for sale to third parties.
NOI from this segment is calculated directly from our financial statements as Rental Revenues, Rental Recoveries and Development Management and Other Revenues less Rental Expenses and Other Expenses.
Strategic Capital
Real estate is a capital-intensive business that requires growth capital. This segment of ournew capital to grow. Our strategic capital business gives us access to third-party capital, both private and public, allowing us to diversify our sources of capital and providing us with a broaderbroad range of options to fund our growth.growth, while reducing our exposure to foreign currency movements for investments outside of the U.S. We co-investpartner with some of the world’s largest institutional partnersinvestors to grow our business and provide incremental revenues.revenues, with a focus on long-term and open-ended ventures. We also access alternative sources of equity through two publicly traded vehicles: Nippon Prologis REIT, Inc. in Japan and FIBRA Prologis in Mexico. We tailor logistics portfolios to meet our partners’ specific needs, with a focus on long-term ventures and open-ended funds. We hold significant ownership interests in these ventures, aligning ouralign interests with those of our partners.partners by holding significant ownership interests in all of our unconsolidated co-investment ventures (ranging from 15% to 50%).
This segment produces stable, long-term cash flows and generally contributes 10% of our consolidated revenues, earnings and FFO. We generate strategic capital revenues primarily from our unconsolidated co-investment ventures, principally through asset management and property management services.services, of which 90% are generally earned from long-term and open-ended ventures. We earn additional revenues by providing leasing, acquisition, construction, development, financing, legal and disposition services. Depending onIn certain ventures, we also have the structure of the venture and the returns providedability to our partners, we also earn revenues through incentive fees (“promotes” or “promote revenues”) periodically during the life of a venture or upon liquidation. Approximately 40% of promote revenues are paid to our employees as a combination of cash and stock awards pursuant to the terms of the Prologis Promote Plan and expensed through Strategic Capital Expenses. This segment generally contributes 10% to 15% of our consolidated revenues, earnings and funds from operations. In June 2017, we earned promotes of $124 million primarily from our U.S. co-investment venture that increased these percentages slightly over 15%. During the first quarter of 2017, we formed a new co-investment venture that will acquire land, develop buildings and own and hold logistics real estate assets in the United Kingdom (“U.K.”). We plan to profitably grow this business by increasing our assets under management in our existing or new ventures. Generally, approximately 80%the majority of the
consolidated strategic capital revenues and NOI in this segment are generated outside the U.S. With the promote we earned from our U.S. co-investment venture in June, this percentage temporarily decreased revenues and NOI generated outside the U.S. to approximately 35%. NOI in this segment is calculated directly from our financial statements as strategic capital revenuesStrategic Capital Revenues less strategic capital expensesStrategic Capital Expenses and does not include property-related NOI.
Growth StrategiesFUTURE GROWTH
We believe the quality and scale of our global owned and managed operating portfolio, the expertise of our team, the depth of our customer relationships and the strength of our balance sheet give us unique competitive advantages. Our plan to grow revenues, NOI, earnings, NOI,FFO, and cash flows and funds from operations is based on the following:
Rent Growth. We expect market rents to continue to grow over the next few years, albeit at a more modest pace, driven by demand for the location and quality of our properties. Because of strong market rent growth in the last several years, even if market rents remain flat, our in-place leases have considerable room to rise back to market levels. We estimate that across our owned and managed portfolio, our leases on an aggregate basis are more than 10% below market; this means that a lease renewal would translate into increased future earnings, NOI and cash flow, both on a consolidated basis and through the amounts we recognize from our unconsolidated co-investment ventures based on our ownership. This is reflected in the positive rent change on rollover (comparing the net effective rent of the new lease to the prior lease for the same space) on our owned and managed portfolio. We have experienced positive rent change on rollover for every quarter since 2013, and we expect this to continue for several more years.
positive rent change on rollover (comparing the net effective rent of the new lease to the prior lease for the same space) every quarter since 2013. During the first six months of 2018, our net effective rents increased 21.3% on lease rollover that represented approximately 7% of our proportionate economic ownership of each entity included in our owned and managed operating portfolio. We expect this trend to continue for several more years due to our current rents being below market, increasing market rents and the term of our leases. |
Value Creation from Development. A successful development and redevelopment program involves maintaining control of well-positionedwell-located and entitled land. On the basis ofBased on our current estimates, our owned and managedconsolidated land bank, excluding land we have under an option contract, has the potential to support the development of $8.5$7.5 billion of total expected investment (“TEI”)TEI of new logistics space. TEI is the total estimated cost of development or expansion, including land, construction and leasing costs. We believe the carrying value of our land bank is below its current fair value, and we expect to realize this value going forward—primarily through development. During the first six months of 2017,2018, we stabilized consolidated development projects with a TEI of $1.1$1.0 billion, in our owned and managed portfolio. Post-stabilization, we estimate the value of these buildings to be 23.3%35.6% above their book value or theour cost to develop (defined as estimated margin and calculated using estimated yield and capitalization rates from our underwriting models). In addition, these, while increasing NOI of our operating portfolio. We expect our properties will generate NOI as they are leased up and become occupied.
Economies of Scale from Growth in Assets Under Management. Over the last several years, we have invested in a variety of technologies that have allowed usunder development at June 30, 2018, to achieve efficiencies and increase our investments in real estate with minimal increases to general and administrative (“G&A”) expenses. We have increased our owned and managed real estate assets by 25 million square feet (or approximately 4%) over the last two years primarily through acquisitions, and we have integrated the assets with only minimal increases in overhead related to property management and leasing functions. We will continue to leverage these technologies to further streamline our operations and reduce our costs as a percentage of assets under management, along with advanced data analytics to enhance decision-making.be completed before October 2019.
Summary of 2017SUMMARY OF 2018
During the six months ended June 30, 2017,2018, operating fundamentals remained strong for our owned and managed operating portfolio and we ended the period with occupancy of 96.2%97.4%. See below for the results of our two business segments and details of the operating and development activity of our Ownedowned and Managed Portfolio. managed portfolio.
In 2017,2018, we completed the following significant activities as furtherpreviously described in the accompanying notesNotes to the Consolidated Financial Statements:
During the first six months of 2017, we We generated net proceeds of $973 million$1.1 billion and recordedrealized net gains of $180$289 million from the contribution of properties to our unconsolidated co-investment ventures in Europe and Japan and the disposition of non-strategic operating properties primarily in the U.S. Beginning January 1, 2018, we recognized the entire gain attributed to contributions of real estate assets primarily from propertyto our unconsolidated entities under the new revenue recognition standard, as discussed in Note 2 to the Consolidated Financial Statements. We previously recognized gains on contributions in Europe andto the extent of the third-party dispositionsownership in the U.S.unconsolidated entity acquiring the property.
In January, we sold our investmentWe recognized promotes aggregating $68 million in EuropeStrategicCapital Revenues ($50 million net of expenses in the period), primarily from the Prologis China Logistics Venture, 1 (“ELV”) to our fund partner for $84 million and ELV contributed its properties to Prologis Targeted Europe Logistics Fund (“PTELF”)an unconsolidated co-investment venture, in exchange for equity interests. the first quarter of 2018.
In February, we formed the Prologis United Kingdom Logistics Venture (“UKLV”), in which we have a 15.0% ownership interest. During the six months of 2017, we contributed 1 million square feet of stabilized properties, 1 million square feet properties under development and 145 acres of land for £270 million ($336 million), included in net proceeds and net gains above. We expect to continue to contribute properties and land into UKLV.
In February, we amended our Japanese yen revolver and increased the total borrowing capacity to ¥50.0 billion ($447 million at June 30, 2017).
In March, we acquired our partner’s interest in Prologis North American Industrial Fund (“NAIF”), a consolidated co-investment venture, for $710 million. In July, we contributed 190 operating properties formerly owned by NAIF, for an aggregate purchase price of $2.8 billion, to Prologis Targeted U.S. Logistics Fund (“USLF”). We received cash proceeds of $720 million and additional units, which increased our ownership interest in USLF to approximately 27%, and USLF assumed secured debt of $1.0 billion.
In June, we issued £500$400 million ($645 million) of senior notes withthat bear an interest rate of 2.3%, maturing3.88% and mature in 2029, at 99.9%September 2028 and $300 million of par value.senior notes that bear an interest rate of 4.38% and mature in September 2048. Following the issuance, we used the cash proceeds to redeem $618 millionpay down our global senior credit facility in the second quarter of previously issued senior notes.2018 and our Canadian term loan (the “2015 Canadian Term Loan”) in July 2018.
On April 29, 2018, we entered into a definitive agreement (the “Merger Agreement”) with DCT Industrial Trust Inc. (“DCT”) and DCT Industrial Operating Partnership LP (“DCT OP”), pursuant to which, subject to the terms and conditions set forth in the Merger Agreement, (i) DCT will merge with and into Prologis, with Prologis surviving the merger (the “Company Merger”) and (ii) immediately prior to the effective time of the Company Merger, DCT OP will merge with and into the OP, with the OP surviving the merger (the “Partnership Merger” and, together with the Company Merger, the “Mergers”). The estimated purchase price consideration for the Mergers will be approximately $8.2 billion in a stock-for-stock transaction, including the assumption of debt, and is based on the closing price of Prologis' common stock on July 19, 2018. We expect to close on the transaction in August 2018 after the vote of the DCT shareholders. See Note 12 to our Consolidated Financial Statements for more information on this subsequent event.
Throughout this discussion, we reflect amounts in U.S. dollars, our reporting currency. Included in these amounts are consolidated and unconsolidated investments denominated in foreign currencies, principally the British pound sterling, euro and Japanese yen that are impacted by fluctuations in exchange rates when translated to U.S. dollars. We mitigate our exposure to foreign currency fluctuations by investing outside the U.S. through co-investment ventures, borrowing in the functional currency of our consolidated subsidiaries, borrowing in currencies other than the U.S. dollar in the OP (designated as a nonderivative financial instrument) and utilizing derivative financial instruments.
RESULTS OF OPERATIONS – SIX MONTHS ENDED JUNE 30, 20172018 AND 20162017
We evaluate our business operations based on the NOI of our two operating segments,segments: Real Estate Operations and Strategic Capital. NOI by segment is a non-GAAP financial measure that is calculated using revenues and expenses directly from our financial statements. We consider NOI by segment to be an appropriate supplemental measure of our performance because it helps both management and investors to understand the core operations of our business.real estate assets.
Below is a reconciliation of our NOI by segment to Operating Income per the Consolidated Financial Statements for the six months ended June 30 (in millions). Each segment’s NOI is reconciled to a line item in the Consolidated Financial Statements in the respective segment discussion below.
| 2017 |
|
| 2016 |
|
| 2018 |
|
| 2017 |
| |||||
Real Estate Operations segment – NOI |
| $ | 852 |
|
| $ | 808 |
| ||||||||
Strategic Capital segment – NOI |
|
| 154 |
|
|
| 51 |
| ||||||||
Real Estate Operations – NOI |
| $ | 822 |
|
| $ | 852 |
| ||||||||
Strategic Capital – NOI |
|
| 130 |
|
|
| 154 |
| ||||||||
General and administrative expenses |
|
| (114 | ) |
|
| (107 | ) |
|
| (120 | ) |
|
| (114 | ) |
Depreciation and amortization expenses |
|
| (455 | ) |
|
| (480 | ) |
|
| (408 | ) |
|
| (455 | ) |
Operating income |
| $ | 437 |
|
| $ | 272 |
|
| $ | 424 |
|
| $ | 437 |
|
|
|
|
|
|
|
|
|
|
|
|
|
|
|
|
|
|
See Note 10 to the Consolidated Financial Statements for more information on our segments and a reconciliation of each reportable business segment’s NOI to Operating Income and Earnings Before Income Taxes.
Real Estate Operations
This operating segment principally includes rental revenues, rental recoveries and rental expenses recognized from our consolidated properties. We allocate the costs of our property management functions to the Real Estate Operations segment through Rental Expenses and to the Strategic Capital segment through Strategic Capital Expenses based on the sizesquare footage of the relative portfolios as compared to our total owned and managed portfolio. The operating fundamentals in the markets in which we operate continue to improve,be strong, which has positively affected both the rental ratesdriven rents higher, kept occupancies high and occupancy and also has fueled development activity. This segment is impacted by our development, acquisition and disposition activities.
Below are the components of Real Estate Operations revenues, expenses and NOI for the six months ended June 30, (in millions), derived directly from line items in the Consolidated Financial Statements.Statements (in millions):
| 2017 |
|
| 2016 |
|
| 2018 |
|
| 2017 |
| |||||
Rental revenues |
| $ | 888 |
|
| $ | 863 |
|
| $ | 854 |
|
| $ | 888 |
|
Rental recoveries |
|
| 255 |
|
|
| 237 |
|
|
| 246 |
|
|
| 255 |
|
Development management and other revenues |
|
| 14 |
|
|
| 4 |
|
|
| 6 |
|
|
| 14 |
|
Rental expenses |
|
| (300 | ) |
|
| (287 | ) |
|
| (276 | ) |
|
| (300 | ) |
Other expenses |
|
| (5 | ) |
|
| (9 | ) |
|
| (8 | ) |
|
| (5 | ) |
Real Estate Operations segment – NOI |
| $ | 852 |
|
| $ | 808 |
| ||||||||
Real Estate Operations – NOI |
| $ | 822 |
|
| $ | 852 |
| ||||||||
|
|
|
|
|
|
|
|
| ||||||||
The change in Real Estate Operations revenues, expenses and NOI are impacted by changes in rental rates, occupancy and capital deployment activities. The following items highlight the key changes in NOI for the six months ended June 30, 2017,2018 from the same period in 20162017, was impacted by the following items (in millions):
Rent rate and occupancy growth (1) |
| $ | 84 |
|
Development activity |
|
| (2 | ) |
Contributions and dispositions |
|
| (48 | ) |
Other |
|
| 10 |
|
Total change in Real Estate Operations segment – NOI |
| $ | 44 |
|
|
|
|
|
|
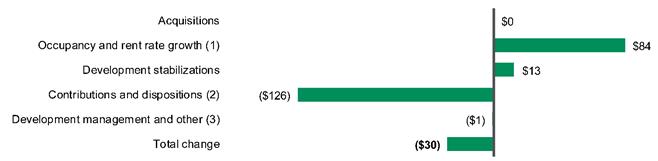
(1) | We experienced increased occupancy and positive rent rate growth in 2018 compared to 2017. Rent rate growth (or rent change) is a combination of the rollover of existing leases and increases in certain rental rates from contractual rent increases on existing leases. If a lease has a contractual rent increase that is not known at the time the lease |
(2) | Contribution and disposition activity decreased NOI from this segment in 2018, compared to 2017, primarily due to the contribution of the Prologis North American Industrial Fund (“NAIF”) operating properties to Prologis Targeted U.S. Logistics Fund (“USLF”) in July 2017. |
(3) | Other items include recoveries, noncash adjustments for the amortization of above or below market leases, non-recoverable expenses, termination fees and changes in foreign currency rates. |
Below are the key operating metrics of our consolidated operating portfolio. Beginning January 1, 2018, we modified certain definitions of our operating metrics to align methodologies with members of the industrial REIT group. These changes were retroactively applied for all prior periods presented.
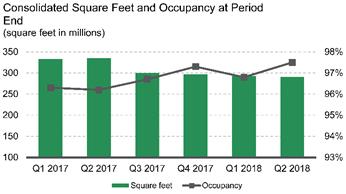
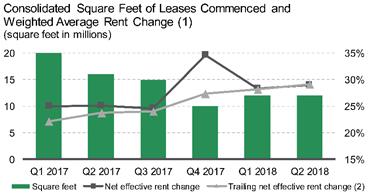
(1) | Consolidated square feet of leases commenced and weighted average rent change were calculated for leases with initial terms of one year or greater during each quarter in 2017 and 2018. |
(2) | Calculated using the trailing twelve months immediately prior to the period ended. |
Development Start Activity
The following table summarizes consolidated development starts for the six months ended June 30 (dollars and square feet in millions):
|
| 2018 |
|
| 2017 |
| ||
Number of new development projects during the period |
|
| 32 |
|
|
| 28 |
|
Square feet |
|
| 11 |
|
|
| 12 |
|
TEI |
| $ | 1,150 |
|
| $ | 1,202 |
|
Percentage of build-to-suits based on TEI |
|
| 38.0 | % |
|
| 46.7 | % |
Development Stabilization Activity
A developed property moves into the operating portfolio when it meets our definition of stabilization. A property is considered stabilized when a development project has been completed for one year or is 90% occupied, whichever occurs first. The following table summarizes consolidated development stabilization activity for the six months ended June 30 (dollars and square feet in millions):
|
| 2018 |
|
| 2017 |
| ||
Number of development projects stabilized during the period |
|
| 31 |
|
|
| 37 |
|
Square feet |
|
| 13 |
|
|
| 12 |
|
TEI |
| $ | 1,022 |
|
| $ | 913 |
|
Weighted average expected yield on TEI (1) |
|
| 6.6 | % |
|
| 6.5 | % |
Estimated value at completion |
| $ | 1,386 |
|
| $ | 1,119 |
|
Estimated weighted average margin |
|
| 35.6 | % |
|
| 22.5 | % |
(1) | We calculate the weighted average expected yield on TEI as estimated NOI assuming stabilized occupancy divided by TEI. |
Capital Expenditures
We capitalize costs incurred in renovating and improving our operating properties as part of the investment basis. The following graph summarizes our capital expenditures on operating properties within our consolidated operating portfolio:
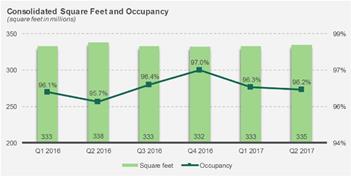
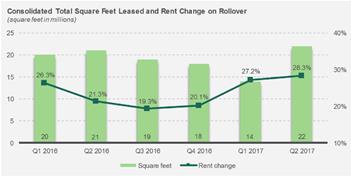

Strategic Capital
This operating segment includes revenues from asset and property management and other fees for services performed, as well as promotes earned, for services performed for ourfrom the unconsolidated co-investment ventures. Revenues associated with the Strategic Capital segment fluctuate because of the size of co-investment ventures under management, the transactional activity in the ventures and the timing of promotes. These revenues are reduced generally by the direct costs associated with the asset management and property-level management expenses for the properties owned by these ventures. We allocate the costs of our property management functions to the Strategic Capital segment through Strategic Capital Expenses and to the Real Estate Operations segment through Rental Expenses based on the sizesquare footage of the relative portfolios as compared to our total owned and managed portfolio.
Below are the components of Strategic Capital revenues, expenses and NOI for the six months ended June 30, derived directly from the line items in the Consolidated Financial Statements (in millions):
|
| 2017 |
|
| 2016 |
|
| 2018 |
|
| 2017 |
| ||||
Strategic capital revenues |
| $ | 238 |
|
| $ | 104 |
|
| $ | 209 |
|
| $ | 238 |
|
Strategic capital expenses |
|
| (84 | ) |
|
| (53 | ) |
|
| (79 | ) |
|
| (84 | ) |
Strategic Capital segment – NOI |
| $ | 154 |
|
| $ | 51 |
| ||||||||
Strategic Capital – NOI |
| $ | 130 |
|
| $ | 154 |
| ||||||||
Below is additional detail of our Strategic Capital revenues, expenses and NOI for the six months ended June 30 (in millions):
|
| 2017 |
|
| 2016 |
| ||
U.S.: |
|
|
|
|
|
|
|
|
Asset management and other fees |
| $ | 18 |
|
| $ | 16 |
|
Leasing commissions, acquisition, development and other transaction fees |
|
| 5 |
|
|
| 3 |
|
Promote (1) |
|
| 120 |
|
|
| - |
|
Strategic capital expenses (2) |
|
| (41 | ) |
|
| (16 | ) |
Subtotal U.S. |
|
| 102 |
|
|
| 3 |
|
Other Americas: |
|
|
|
|
|
|
|
|
Asset management and other fees |
|
| 11 |
|
|
| 10 |
|
Leasing commissions, acquisition, development and other transaction fees |
|
| 1 |
|
|
| 1 |
|
Promote (1) |
|
| 4 |
|
|
| - |
|
Strategic capital expenses |
|
| (5 | ) |
|
| (5 | ) |
Subtotal Other Americas |
|
| 11 |
|
|
| 6 |
|
Europe: |
|
|
|
|
|
|
|
|
Asset management and other fees |
|
| 42 |
|
|
| 42 |
|
Leasing commissions, acquisition, development and other transaction fees |
|
| 7 |
|
|
| 6 |
|
Promote (1) |
|
| 3 |
|
|
| - |
|
Strategic capital expenses |
|
| (20 | ) |
|
| (14 | ) |
Subtotal Europe |
|
| 32 |
|
|
| 34 |
|
Asia: |
|
|
|
|
|
|
|
|
Asset management and other fees |
|
| 18 |
|
|
| 18 |
|
Leasing commissions, acquisition, development and other transaction fees |
|
| 9 |
|
|
| 8 |
|
Strategic capital expenses |
|
| (18 | ) |
|
| (18 | ) |
Subtotal Asia |
|
| 9 |
|
|
| 8 |
|
Strategic Capital segment – NOI |
| $ | 154 |
|
| $ | 51 |
|
|
| U.S. (1) |
|
| Other Americas |
|
| Europe |
|
| Asia |
|
| Total |
| |||||||||||||||||||||||||
|
| 2018 |
|
| 2017 |
|
| 2018 |
|
| 2017 |
|
| 2018 |
|
| 2017 |
|
| 2018 |
|
| 2017 |
|
| 2018 |
|
| 2017 |
| ||||||||||
Strategic capital revenues ($) |
|
|
|
|
|
|
|
|
|
|
|
|
|
|
|
|
|
|
|
|
|
|
|
|
|
|
|
|
|
|
|
|
|
|
|
|
|
|
|
|
Recurring fees (2) |
|
| 31 |
|
|
| 18 |
|
|
| 12 |
|
|
| 11 |
|
|
| 48 |
|
|
| 42 |
|
|
| 23 |
|
|
| 18 |
|
|
| 114 |
|
|
| 89 |
|
Transactional fees (3) |
|
| 3 |
|
|
| 5 |
|
|
| 1 |
|
|
| 1 |
|
|
| 11 |
|
|
| 7 |
|
|
| 12 |
|
|
| 9 |
|
|
| 27 |
|
|
| 22 |
|
Promote revenues (4) |
|
| - |
|
|
| 120 |
|
|
| 5 |
|
|
| 4 |
|
|
| 9 |
|
|
| 3 |
|
|
| 54 |
|
|
| - |
|
|
| 68 |
|
|
| 127 |
|
Total strategic capital revenues ($) |
|
| 34 |
|
|
| 143 |
|
|
| 18 |
|
|
| 16 |
|
|
| 68 |
|
|
| 52 |
|
|
| 89 |
|
|
| 27 |
|
|
| 209 |
|
|
| 238 |
|
Strategic capital expenses ($) |
|
| (32 | ) |
|
| (41 | ) |
|
| (6 | ) |
|
| (5 | ) |
|
| (21 | ) |
|
| (20 | ) |
|
| (20 | ) |
|
| (18 | ) |
|
| (79 | ) |
|
| (84 | ) |
Strategic Capital – NOI ($) |
|
| 2 |
|
|
| 102 |
|
|
| 12 |
|
|
| 11 |
|
|
| 47 |
|
|
| 32 |
|
|
| 69 |
|
|
| 9 |
|
|
| 130 |
|
|
| 154 |
|
|
|
|
|
|
|
|
|
|
|
|
|
|
|
|
|
|
|
|
|
|
|
|
|
|
|
|
|
|
|
|
|
|
|
|
|
|
|
|
|
|
(1) |
|
(2) | Recurring fees include asset and |
(3) | Transactional fees include leasing commission, acquisition and |
(4) | The promote |
|
|
The following real estate investments were held through our unconsolidated co-investment ventures based on historical cost (dollars and square feet in millions):
|
| June 30, |
|
| December 31, |
|
| June 30, |
| |||
|
| 2017 |
|
| 2016 |
|
| 2016 |
| |||
U.S.: |
|
|
|
|
|
|
|
|
|
|
|
|
Number of ventures |
|
| 1 |
|
|
| 1 |
|
|
| 1 |
|
Number of operating properties owned |
|
| 384 |
|
|
| 369 |
|
|
| 379 |
|
Square feet |
|
| 52 |
|
|
| 50 |
|
|
| 49 |
|
Total assets |
| $ | 4,346 |
|
| $ | 4,238 |
|
| $ | 4,228 |
|
Other Americas: |
|
|
|
|
|
|
|
|
|
|
|
|
Number of ventures |
|
| 2 |
|
|
| 2 |
|
|
| 2 |
|
Number of operating properties owned |
|
| 215 |
|
|
| 213 |
|
|
| 209 |
|
Square feet |
|
| 43 |
|
|
| 42 |
|
|
| 41 |
|
Total assets |
| $ | 2,791 |
|
| $ | 2,793 |
|
| $ | 2,694 |
|
Europe (1): |
|
|
|
|
|
|
|
|
|
|
|
|
Number of ventures |
|
| 4 |
|
|
| 4 |
|
|
| 4 |
|
Number of operating properties owned |
|
| 702 |
|
|
| 700 |
|
|
| 690 |
|
Square feet |
|
| 164 |
|
|
| 163 |
|
|
| 160 |
|
Total assets |
| $ | 12,178 |
|
| $ | 10,853 |
|
| $ | 11,188 |
|
Asia: |
|
|
|
|
|
|
|
|
|
|
|
|
Number of ventures |
|
| 2 |
|
|
| 2 |
|
|
| 2 |
|
Number of operating properties owned |
|
| 83 |
|
|
| 85 |
|
|
| 77 |
|
Square feet |
|
| 36 |
|
|
| 36 |
|
|
| 34 |
|
Total assets |
| $ | 5,528 |
|
| $ | 5,173 |
|
| $ | 5,346 |
|
Total: |
|
|
|
|
|
|
|
|
|
|
|
|
Number of ventures |
|
| 9 |
|
|
| 9 |
|
|
| 9 |
|
Number of operating properties owned |
|
| 1,384 |
|
|
| 1,367 |
|
|
| 1,355 |
|
Square feet |
|
| 295 |
|
|
| 291 |
|
|
| 284 |
|
Total assets |
| $ | 24,843 |
|
| $ | 23,057 |
|
| $ | 23,456 |
|
|
|
| U.S. |
|
| Other Americas |
|
| Europe |
|
| Asia |
|
| Total |
| |||||||||||||||||||||||||
| Jun 30, 2018 |
|
| Dec 31, 2017 |
|
| Jun 30, 2018 |
|
| Dec 31, 2017 |
|
| Jun 30, 2018 |
|
| Dec 31, 2017 |
|
| Jun 30, 2018 |
|
| Dec 31, 2017 |
|
| Jun 30, 2018 |
|
| Dec 31, 2017 |
| ||||||||||
Ventures |
| 1 |
|
|
| 1 |
|
|
| 2 |
|
|
| 2 |
|
|
| 3 |
|
|
| 3 |
|
|
| 2 |
|
|
| 2 |
|
|
| 8 |
|
|
| 8 |
|
Operating properties |
| 554 |
|
|
| 552 |
|
|
| 205 |
|
|
| 205 |
|
|
| 653 |
|
|
| 707 |
|
|
| 114 |
|
|
| 95 |
|
|
| 1,526 |
|
|
| 1,559 |
|
Square feet |
| 88 |
|
|
| 88 |
|
|
| 37 |
|
|
| 37 |
|
|
| 154 |
|
|
| 166 |
|
|
| 48 |
|
|
| 41 |
|
|
| 327 |
|
|
| 332 |
|
Total assets ($) |
| 7,188 |
|
|
| 7,062 |
|
|
| 2,073 |
|
|
| 2,118 |
|
|
| 13,176 |
|
|
| 13,586 |
|
|
| 6,694 |
|
|
| 6,133 |
|
|
| 29,131 |
|
|
| 28,899 |
|
See Note 3 to the Consolidated Financial Statements for additional information about the contribution of the ELV properties to PTELF and the formation of UKLV, along withon our other unconsolidated co-investment ventures.
G&A Expenses
G&A expenses increased $6 million for the six months ended June 30, 2017, compared to2018, from the same period in 2016, primarily2017, principally due to additionalinflationary increases and higher compensation expenseexpenses based on the company’sCompany’s performance.
We capitalize certain costs directly related to our development and leasing activities. Capitalized G&A expenses includeincluded salaries and related costs, as well as certain other G&A costs. The following table summarizes capitalized G&A amounts for the six months ended June 30 (dollars in millions):
|
| 2017 |
|
| 2016 |
|
| 2018 |
|
| 2017 |
| ||||
Building and land development activities |
| $ | 31 |
|
| $ | 30 |
|
| $ | 31 |
|
| $ | 31 |
|
Leasing activities |
|
| 12 |
|
|
| 12 |
|
|
| 11 |
|
|
| 12 |
|
Operating building improvements and other |
|
| 8 |
|
|
| 8 |
|
|
| 8 |
|
|
| 8 |
|
Total capitalized G&A expenses |
| $ | 51 |
|
| $ | 50 |
|
| $ | 50 |
|
| $ | 51 |
|
Capitalized salaries and related costs as a percent of total salaries and related costs |
|
| 25.5 | % |
|
| 26.7 | % |
|
| 23.7 | % |
|
| 25.5 | % |
(1) | Due to a new accounting standard effective January 1, 2019, we expect a change in capitalized leasing activities. See Note 1 to the Consolidated Financial Statements for additional information. |
Depreciation and Amortization Expenses
The following table highlights the key changeschange in depreciation and amortization expenses for the six months ended June 30, 2017,2018 from the same period in 20162017, was impacted by the following items (in millions):
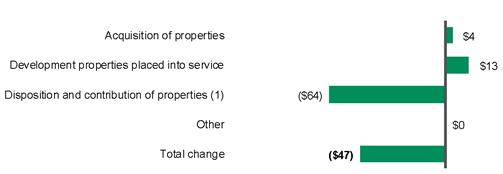
Acquisition of properties |
| $ | 10 |
|
Development properties placed into service |
|
| 18 |
|
Disposition and contribution of properties |
|
| (36 | ) |
Other |
|
| (18 | ) |
Total change in depreciation and amortization expenses |
| $ | (26 | ) |
(1) | The decrease in depreciation and amortization expense in 2018 from 2017 was primarily due to the contribution of the NAIF operating properties to USLF in July 2017. |
Our Owned and Managed Operating Portfolio
We manage our business and review our operating fundamentals on an owned and managed basis, which includes properties wholly owned by us or owned by one of our co-investment ventures. We review our operating fundamentals on an owned and managed basis. We believe reviewing these fundamentals this way allows management to understand the entire impact to the financial statements, as it will affect both the Real Estate Operations and Strategic Capital segments, as well as the net earnings we recognize from our unconsolidated co-investment ventures based on our ownership share. We do not control the unconsolidated co-investment ventures for purposes of GAAP and the presentation of the ventures’ operating information does not represent a legal claim to such items.
Our owned and managed portfolio includes operating properties andportfolio does not include our development portfolio, value-added properties under development or properties held for sale to third parties (square feet in millions):
| June 30, 2017 |
|
| December 31, 2016 |
|
| June 30, 2016 |
| |||||||||||||||||||||||||||
| Number of Properties |
|
| Square Feet |
|
| Percentage Occupied |
|
| Number of Properties |
|
| Square Feet |
|
| Percentage Occupied |
|
| Number of Properties |
|
| Square Feet |
|
| Percentage Occupied |
| |||||||||
Consolidated |
| 1,765 |
|
|
| 335 |
|
|
| 96.2 | % |
|
| 1,777 |
|
|
| 332 |
|
|
| 97.0 | % |
|
| 1,838 |
|
|
| 338 |
|
|
| 95.7 | % |
Unconsolidated |
| 1,378 |
|
|
| 294 |
|
|
| 96.1 | % |
|
| 1,359 |
|
|
| 290 |
|
|
| 97.2 | % |
|
| 1,339 |
|
|
| 280 |
|
|
| 96.6 | % |
Totals |
| 3,143 |
|
|
| 629 |
|
|
| 96.2 | % |
|
| 3,136 |
|
|
| 622 |
|
|
| 97.1 | % |
|
| 3,177 |
|
|
| 618 |
|
|
| 96.1 | % |
Our operating portfolio excludes value-addedparties. Value-added properties which are defined as properties that are expected to be repurposed or redeveloped to a higher and better use and recently acquired properties that present opportunities to create greater value. We had seven consolidated value-added properties totaling two million square feet and six unconsolidated value-added properties totaling one million square feet at June 30, 2017.
Operating ActivitySee below for information on our owned and managed operating portfolio (square feet in millions):
| June 30, 2018 |
|
| December 31, 2017 |
| ||||||||||||||||||
| Number of Properties |
|
| Square Feet |
|
| Percentage Occupied |
|
| Number of Properties |
|
| Square Feet |
|
| Percentage Occupied |
| ||||||
Consolidated |
| 1,490 |
|
|
| 291 |
|
|
| 97.5 | % |
|
| 1,532 |
|
|
| 297 |
|
|
| 97.3 | % |
Unconsolidated |
| 1,523 |
|
|
| 326 |
|
|
| 97.3 | % |
|
| 1,557 |
|
|
| 331 |
|
|
| 97.1 | % |
Total |
| 3,013 |
|
|
| 617 |
|
|
| 97.4 | % |
|
| 3,089 |
|
|
| 628 |
|
|
| 97.2 | % |
Below is informationare the key operating metrics summarizing the leasing activity of our owned and managed operating portfolio:portfolio. Beginning January 1, 2018, we modified certain definitions of our operating metrics to align methodologies with members of the industrial REIT group. These changes were retroactively applied for all prior periods presented.
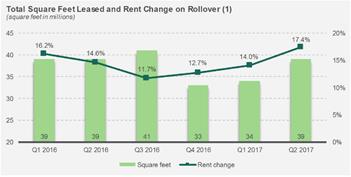
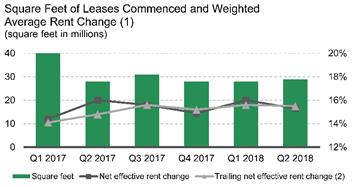
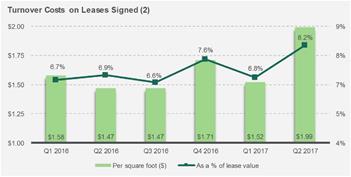
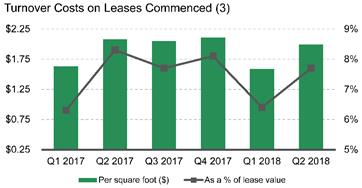
(2) | Calculated using the trailing twelve months immediately prior to the period ended. |
(3) | Turnover costs are defined as leasing commissions and tenant improvements and represent the obligations incurred in connection with the |
We capitalize costs incurred in developing, renovating, rehabilitating and improving our properties as part of the investment basis. The following table summarizes our capital expenditures on previously leased buildings within our owned and managed portfolio for the six months ended June 30 (in millions):
|
| 2017 |
|
| 2016 |
| ||
Property improvements |
| $ | 65 |
|
| $ | 59 |
|
|
|
|
|
|
|
|
|
|
Turnover costs: |
|
|
|
|
|
|
|
|
Tenant improvements |
|
| 58 |
|
|
| 63 |
|
Leasing commissions |
|
| 57 |
|
|
| 56 |
|
Total turnover costs |
|
| 115 |
|
|
| 119 |
|
Total capital expenditures |
| $ | 180 |
|
| $ | 178 |
|
Our proportionate share of capital expenditures based on ownership (1) |
| $ | 115 |
|
| $ | 120 |
|
|
|
Development Start Activity
The following table summarizes our development starts for the six months ended June 30 (dollars and square feet in millions):
|
| 2017 (1) |
|
| 2016 |
| ||
Number of new development projects during the period |
|
| 37 |
|
|
| 34 |
|
Square feet |
|
| 15 |
|
|
| 9 |
|
TEI |
| $ | 1,382 |
|
| $ | 720 |
|
Our proportionate share of TEI (2) |
| $ | 1,209 |
|
| $ | 658 |
|
Percentage of build-to-suits based on TEI |
|
| 44.9 | % |
|
| 44.9 | % |
|
|
|
|
Development Stabilization Activity
The following table summarizes our development stabilization activity for the six months ended June 30 (dollars and square feet in millions):
|
| 2017 |
|
| 2016 |
| ||
Number of development projects stabilized during the period |
|
| 44 |
|
|
| 52 |
|
Square feet |
|
| 14 |
|
|
| 19 |
|
TEI |
| $ | 1,066 |
|
| $ | 1,332 |
|
Our proportionate share of TEI (1) |
| $ | 965 |
|
| $ | 1,089 |
|
Weighted average expected yield on TEI (2) |
|
| 6.8 | % |
|
| 7.0 | % |
Estimated value at completion |
| $ | 1,314 |
|
| $ | 1,671 |
|
Our proportionate share of estimated value at completion (1) |
| $ | 1,184 |
|
| $ | 1,374 |
|
Estimated weighted average margin |
|
| 23.3 | % |
|
| 25.5 | % |
|
|
|
|
Same Store Analysis
Our same store metrics are non-GAAP financial measures, which are commonly used in the real estate industry and expected from the financial community, on both a net-effective and cash basis. We evaluate the operating performance of the operating properties we own and manage using a “same store” analysis because the population of properties in this analysis is consistent from period to period, which eliminates the effects of changes in the composition of the portfolio. allows us to analyze our ongoing business operations.
We have defined thedefine our same store portfolio,population for the sixthree months ended June 30, 2017,2018 as thoseour owned and managed properties that were in operationthe operating portfolio at January 1, 20162017 and have been in operationowned throughout the end of the same three-month periodsperiod in both 20172018 and 2016 (including2017. The same store population excludes non-industrial real estate properties and properties held for sale, along with development properties that have been completedwere not stabilized at the beginning of the period (January 1, 2017) and available for lease). We have removed all properties that wereacquired or disposed of to a third party or were classified as held for sale to a third party fromparties during the population for both periods. We believe the
factors that affect rental revenues, rental expenses and NOI in theperiod. Beginning January 1, 2018, we modified our definition of same store portfolio are generallyto align methodologies with members of the same as for the total operating portfolio.industrial REIT group. This did not materially change our historical amounts reported. To derive an appropriate measure of period-to-period operating performance, we remove the effects of foreign currency exchange rate movements by using the recentreported period end exchange rate to translate from local currency into the U.S. dollar, for both periods.
Same store is a commonly used measure in We believe the real estate industry. Our same store measures are non-GAAP financial measuresfactors that are calculated beginning withaffect rental revenues, rental recoveries, and rental expenses fromand NOI in the financial statements prepared in accordance with GAAP. same store portfolio are generally the same as for our consolidated portfolio.
As our same store measures are non-GAAP financial measures, they have certain limitations as analytical tools and may vary among real estate companies. As a result, we provide a reconciliation of rental revenues, rental recoveries and rental expenses from our financial statementsConsolidated Financial Statements prepared in accordance with GAAP to same store property NOI with explanations of how these metrics are calculated. In addition, we further remove certain noncash items (straight-line rent adjustments and amortization of lease intangibles) included in the financial statements prepared in accordance with GAAP to reflect a cash same store number. To clearly label these metrics, they are categorized as same store portfolio NOI – net effective and same store portfolio NOI – cash.
The following is a reconciliation of our consolidated rental revenues, rental recoveries, rental expenses and property NOI, as included in the Consolidated Statements of Operations,Income, to the respective amounts in our same store portfolio analysis for the three months ended June 30 (dollars in millions):
|
|
|
|
|
|
|
|
|
| Percentage |
| |
|
| 2017 |
|
| 2016 |
|
| Change |
| |||
Rental Revenues (1) (2) |
|
|
|
|
|
|
|
|
|
|
|
|
Consolidated: |
|
|
|
|
|
|
|
|
|
|
|
|
Rental revenues per the Consolidated Statements of Income |
| $ | 448 |
|
| $ | 426 |
|
|
|
|
|
Rental recoveries per the Consolidated Statements of Income |
|
| 128 |
|
|
| 120 |
|
|
|
|
|
Consolidated adjustments to derive same store results: |
|
|
|
|
|
|
|
|
|
|
|
|
Rental revenues and recoveries of properties not in the same store portfolio – properties developed, acquired and sold to third parties during the period and land subject to ground leases |
|
| (59 | ) |
|
| (51 | ) |
|
|
|
|
Effect of changes in foreign currency exchange rates and other |
|
| (2 | ) |
|
| (1 | ) |
|
|
|
|
Unconsolidated co-investment ventures – rental revenues |
|
| 462 |
|
|
| 449 |
|
|
|
|
|
Same store portfolio – rental revenues (2) |
| $ | 977 |
|
| $ | 943 |
|
|
| 3.6 | % |
Rental Expenses (1) (3) |
|
|
|
|
|
|
|
|
|
|
|
|
Consolidated: |
|
|
|
|
|
|
|
|
|
|
|
|
Rental expenses per the Consolidated Statements of Income |
| $ | 148 |
|
| $ | 141 |
|
|
|
|
|
Consolidated adjustments to derive same store results: |
|
|
|
|
|
|
|
|
|
|
|
|
Rental expenses of properties not in the same store portfolio – properties developed, acquired and sold to third parties during the period and land subject to ground leases |
|
| (18 | ) |
|
| (20 | ) |
|
|
|
|
Effect of changes in foreign currency exchange rates and other |
|
| 13 |
|
|
| 14 |
|
|
|
|
|
Unconsolidated co-investment ventures – rental expenses |
|
| 99 |
|
|
| 101 |
|
|
|
|
|
Same store portfolio – rental expenses (3) |
| $ | 242 |
|
| $ | 236 |
|
|
| 2.4 | % |
NOI (1) |
|
|
|
|
|
|
|
|
|
|
|
|
Consolidated: |
|
|
|
|
|
|
|
|
|
|
|
|
Property NOI (calculated as rental revenues and rental recoveries less rental expenses per the Consolidated Statements of Income) |
| $ | 428 |
|
| $ | 405 |
|
|
|
|
|
Consolidated adjustments to derive same store results: |
|
|
|
|
|
|
|
|
|
|
|
|
Property NOI of properties not in the same store portfolio – properties developed, acquired and sold to third parties during the period and land subject to ground leases |
|
| (41 | ) |
|
| (31 | ) |
|
|
|
|
Effect of changes in foreign currency exchange rates and other |
|
| (15 | ) |
|
| (15 | ) |
|
|
|
|
Unconsolidated co-investment ventures – property NOI |
|
| 363 |
|
|
| 348 |
|
|
|
|
|
Same store portfolio – NOI |
| $ | 735 |
|
| $ | 707 |
|
|
| 3.9 | % |
|
|
|
|
|
|
|
|
|
| Percentage |
| |
|
| 2018 |
|
| 2017 |
|
| Change |
| |||
Rental revenues |
|
|
|
|
|
|
|
|
|
|
|
|
Rental revenues per the Consolidated Statements of Income |
| $ | 427 |
|
| $ | 448 |
|
|
|
|
|
Rental recoveries per the Consolidated Statements of Income |
|
| 118 |
|
|
| 128 |
|
|
|
|
|
Total rental revenues (1) |
|
| 545 |
|
|
| 576 |
|
|
|
|
|
Adjustments to derive same store results: |
|
|
|
|
|
|
|
|
|
|
|
|
Properties not included in the same store portfolio and other adjustments (1) (2) |
|
| (59 | ) |
|
| (67 | ) |
|
|
|
|
Unconsolidated co-investment ventures (1) |
|
| 543 |
|
|
| 479 |
|
|
|
|
|
Same store portfolio – rental revenues – net effective |
| $ | 1,029 |
|
| $ | 988 |
|
|
| 4.1 | % |
Straight-line rent adjustments |
|
| (8 | ) |
|
| (18 | ) |
|
|
|
|
Fair value lease adjustments |
|
| - |
|
|
| (1 | ) |
|
|
|
|
Same store portfolio – rental revenues – cash |
| $ | 1,021 |
|
| $ | 969 |
|
|
| 5.3 | % |
|
|
|
|
|
|
|
|
|
|
|
|
|
Rental expenses |
|
|
|
|
|
|
|
|
|
|
|
|
Rental expenses per the Consolidated Statements of Income (1) |
| $ | 133 |
|
| $ | 148 |
|
|
|
|
|
Adjustments to derive same store results: |
|
|
|
|
|
|
|
|
|
|
|
|
Properties not included in the same store portfolio and other adjustments (1) (3) |
|
| (4 | ) |
|
| (10 | ) |
|
|
|
|
Unconsolidated co-investment ventures (1) |
|
| 116 |
|
|
| 101 |
|
|
|
|
|
Same store portfolio – rental expenses – net effective and cash |
| $ | 245 |
|
| $ | 239 |
|
|
| 2.4 | % |
|
|
|
|
|
|
|
|
|
|
|
|
|
NOI |
|
|
|
|
|
|
|
|
|
|
|
|
Property NOI (calculated as rental revenues and rental recoveries less rental expenses per the Consolidated Statements of Income) (1) |
| $ | 412 |
|
| $ | 428 |
|
|
|
|
|
Adjustments to derive same store results: |
|
|
|
|
|
|
|
|
|
|
|
|
Properties not included in the same store portfolio and other adjustments (1) (2) (3) |
|
| (55 | ) |
|
| (57 | ) |
|
|
|
|
Unconsolidated co-investment ventures (1) |
|
| 427 |
|
|
| 378 |
|
|
|
|
|
Same store portfolio – NOI – net effective |
| $ | 784 |
|
| $ | 749 |
|
|
| 4.7 | % |
Same store portfolio – NOI – cash |
| $ | 776 |
|
| $ | 730 |
|
|
| 6.3 | % |
(1) | We include 100% of the same store NOI from the properties in our same store portfolio. During the periods presented, certain properties owned by us were contributed to a co-investment venture and are included in the same store portfolio. Neither our consolidated results nor those of the co-investment ventures, when viewed individually, would be comparable on a same store basis because of the changes in composition of the respective portfolios from period to period (e.g. the results of a contributed property are included in our consolidated results through the contribution date and in the results of the unconsolidated entities subsequent to the contribution date). As a result, only line items labeled “same store portfolio” are comparable period over period. |
(3) | Rental expenses include the direct operating expenses of the property such as property taxes, insurance and utilities. In addition, we include an allocation of the property management expenses for our |
Other Components of Income (Expense)
Earnings from Unconsolidated Entities, Net
We recognized net earnings from unconsolidated entities, which are accounted for using the equity method, of $117$125 million and $100$117 million for the six months ended June 30, 2017,2018, and 2016,2017, respectively. The earnings we recognize can be impacted by: (i) variances in NOI and other revenues and expenses of each venture; (ii) the size and occupancy rate of the portfolio of properties owned by each venture; (iii) gains or losses from the dispositions of properties;properties and extinguishment of debt; (iv) our ownership interest in each venture; and (v) fluctuations in foreign currency exchange rates used to translate our share of net earnings to U.S. dollars.
See the discussion of our co-investment ventures above in the Strategic Capital segment discussion and in Note 3 to the Consolidated Financial Statements for further breakdown of our share of net earnings recognized.
Interest Expense
The following table details our net interest expense for the six months ended June 30 (dollars in millions):
|
| 2017 |
|
| 2016 |
|
| 2018 |
|
| 2017 |
| ||||
Gross interest expense |
| $ | 181 |
|
| $ | 197 |
|
| $ | 120 |
|
| $ | 181 |
|
Amortization of premiums, net and debt issuance costs, net |
|
| (5 | ) |
|
| (10 | ) | ||||||||
Amortization of discounts (premiums), net of debt issuance costs |
|
| 6 |
|
|
| (5 | ) | ||||||||
Capitalized amounts |
|
| (28 | ) |
|
| (30 | ) |
|
| (23 | ) |
|
| (28 | ) |
Net interest expense |
| $ | 148 |
|
| $ | 157 |
|
| $ | 103 |
|
| $ | 148 |
|
Weighted average effective interest rate |
|
| 3.2 | % |
|
| 3.2 | % | ||||||||
Weighted average effective interest rate during the period |
|
| 2.9 | % |
|
| 3.2 | % | ||||||||
Our overall debt decreased by $1.7 billion from June 30, 2017 to June 30, 2018, primarily from USLF assuming secured debt in conjunction with our contribution of real estate properties in July 2017. Gross interest expense decreased for the six months ended June 30, 2017, compared to2018, from the same period in 2016,2017, principally due to pay downs on previously issueddecreased secured debt as a result of the USLF contribution, lower interest rates due to the change in the composition of our senior notes and secured debt and less borrowings on our credit facilities. Our overall debt increased by $474 million from December 31, 2016, to June 30, 2017, primarily from increased borrowings on our term loans related toand the buyout of our partner in NAIF. In July, we repaid the term loans with proceeds received from the contributionsettlement of the operating properties formerly owned by NAIF to USLF.interest rate swaps on the 2015 Canadian Term Loan.
See Note 5 to the Consolidated Financial Statements and the Liquidity and Capital Resources section below, for further discussion of our debt and borrowing costs.
Gains on Dispositions of Investments in Real Estate, Net
The following table details ourDuring the six months ended June 30, 2018, and 2017, we recognized net gains on dispositions of investments in real estate net forof $289 million and $180 million, respectively. We contributed properties, generally that we developed, to our unconsolidated co-investment ventures in Europe in 2018 and 2017 and in Japan in 2018. We also sold properties to third parties, primarily from our operating portfolio in the U.S. During the six months ended June 30, (dollars2017, we sold our investment in millions):Europe Logistics Venture 1 (“ELV”) to our venture partner and contributed properties to our newly formed co-investment venture Prologis UK Logistics Venture. We utilized the proceeds from both contributions and dispositions to fund our capital investments in both periods.
|
| 2017 |
|
| 2016 |
| ||
Contributions to unconsolidated co-investment ventures (1) |
|
|
|
|
|
|
|
|
Number of properties |
|
| 10 |
|
|
| 10 |
|
Gains on contributions, net |
| $ | 126 |
|
| $ | 104 |
|
Dispositions to third parties (2) (3) |
|
|
|
|
|
|
|
|
Number of properties |
|
| 38 |
|
|
| 99 |
|
Gains on dispositions, net |
| $ | 54 |
|
| $ | 154 |
|
|
|
|
|
|
|
|
|
|
Total gains on contributions and dispositions, net |
| $ | 180 |
|
| $ | 258 |
|
Gains on redemption of investment in co-investment ventures |
|
| - |
|
|
| 87 |
|
Total gains on dispositions of investments in real estate, net |
| $ | 180 |
|
| $ | 345 |
|
Beginning January 1, 2018, we recognized the entire gain attributed to contributions of real estate properties to unconsolidated entities under the new revenue recognition standard, as discussed in Note 1 to the Consolidated Financial Statements. We previously recognized a gain in connection with contributions to the extent of the third-party ownership in the unconsolidated entity acquiring the property. For deferred gains from partial sales recorded prior to the adoption, we will continue to recognize these gains over the lives of the underlying real estate properties or at the time of disposition to a third party.
|
|
|
|
|
|
See Notes 2 and 3 to the Consolidated Financial Statements for further information on the gains we recognized and our unconsolidated co-investment ventures.recognized.
Foreign Currency and Derivative Losses,Gains (Losses), Net
The following table details our foreign currency and derivative losses, net for the six months ended June 30 (in millions):
|
| 2017 |
|
| 2016 |
| ||
Realized foreign currency and derivative gains (losses): |
|
|
|
|
|
|
|
|
Gains on the settlement of unhedged derivative transactions |
| $ | 9 |
|
| $ | 2 |
|
Losses on the settlement of transactions with third parties |
|
| (1 | ) |
|
| (4 | ) |
Total realized foreign currency and derivative gains (losses) |
|
| 8 |
|
|
| (2 | ) |
|
|
|
|
|
|
|
|
|
Unrealized foreign currency and derivative gains (losses), net: |
|
|
|
|
|
|
|
|
Losses on the change in fair value of unhedged derivative transactions |
|
| (44 | ) |
|
| (25 | ) |
Gains on remeasurement of certain assets and liabilities (1) |
|
| 9 |
|
|
| 2 |
|
Total unrealized foreign currency and derivative losses, net |
|
| (35 | ) |
|
| (23 | ) |
Total foreign currency and derivative losses, net |
| $ | (27 | ) |
| $ | (25 | ) |
|
|
|
|
|
|
|
|
|
|
| 2018 |
|
| 2017 |
| ||
Realized foreign currency and derivative gains (losses): |
|
|
|
|
|
|
|
|
Gains (losses) on the settlement of unhedged derivative transactions |
| $ | (8 | ) |
| $ | 9 |
|
Losses on the settlement of transactions with third parties |
|
| (1 | ) |
|
| (1 | ) |
Total realized foreign currency and derivative gains (losses) |
|
| (9 | ) |
|
| 8 |
|
|
|
|
|
|
|
|
|
|
Unrealized foreign currency and derivative gains (losses): |
|
|
|
|
|
|
|
|
Gains (losses) on the change in fair value of unhedged derivative and nonderivative transactions |
|
| 58 |
|
|
| (44 | ) |
Gains (losses) on remeasurement of certain assets and liabilities (1) |
|
| (5 | ) |
|
| 9 |
|
Total unrealized foreign currency and derivative gains (losses) |
|
| 53 |
|
|
| (35 | ) |
Total foreign currency and derivative gains (losses), net |
| $ | 44 |
|
| $ | (27 | ) |
|
|
|
|
|
|
|
|
|
(1) | These gains or losses |
See Note 9 to the Consolidated Financial Statements for more information about our derivative transactions.
Gains (Losses) on Early Extinguishment of Debt, Net
During the six months ended June 30,second quarter of 2017, we redeemed $618 million of senior notes and repaid $302 million of secured mortgage debt prior to maturity, which resulted in a loss of $31 million. During the six months ended June 30, 2016, we repaid $363 million of secured mortgage debt prior to maturity, which resulted in a gain of $1 million.
Income Tax Expense
We recognize current income tax expense for income taxes incurred byrelated to our taxable REIT subsidiaries and the local, state and local income taxes and taxes incurred in the foreign jurisdictions in which we operate. Our current income tax expense fluctuates from period to period based predominantly fromprimarily on the dispositionstiming of real estate.our taxable income. Deferred income tax expense (benefit) is generally a function of the period’s temporary differences and the utilization of net operating losses generated in prior years that had been previously recognized as deferred income tax assets in taxable subsidiaries operating in the U.S. or in foreign jurisdictions.
The following table summarizes our income tax expense for the six months ended June 30 (in millions):
|
| 2017 |
|
| 2016 |
|
| 2018 |
|
| 2017 |
| ||||
Current income tax expense (benefit): |
|
|
|
|
|
|
|
|
|
|
|
|
|
|
|
|
Income tax expense |
| $ | 22 |
|
| $ | 16 |
|
| $ | 21 |
|
| $ | 22 |
|
Income tax expense on dispositions |
|
| 1 |
|
|
| 10 |
|
|
| 10 |
|
|
| 1 |
|
Income tax benefit related to acquired tax assets |
|
| (1 | ) |
|
| - |
| ||||||||
Income tax expense (benefit) related to acquired tax assets |
|
| 1 |
|
|
| (1 | ) | ||||||||
Total current income tax expense |
|
| 22 |
|
|
| 26 |
|
|
| 32 |
|
|
| 22 |
|
|
|
|
|
|
|
|
|
|
|
|
|
|
|
|
|
|
Deferred income tax expense (benefit): |
|
|
|
|
|
|
|
|
|
|
|
|
|
|
|
|
Income tax expense (benefit) |
|
| 1 |
|
|
| (5 | ) | ||||||||
Income tax expense related to acquired tax assets |
|
| 1 |
|
|
| - |
| ||||||||
Income tax expense |
|
| - |
|
|
| 1 |
| ||||||||
Income tax expense (benefit) related to acquired tax assets |
|
| (1 | ) |
|
| 1 |
| ||||||||
Total deferred income tax expense (benefit) |
|
| 2 |
|
|
| (5 | ) |
|
| (1 | ) |
|
| 2 |
|
Total income tax expense |
| $ | 24 |
|
| $ | 21 |
|
| $ | 31 |
|
| $ | 24 |
|
|
|
|
|
|
|
|
|
| ||||||||
The Tax Cuts and Jobs Act, enacted on December 22, 2017, reduced the corporate federal tax rate in the U.S. to 21.0%, effective upon enactment. As such deferred tax assets and liabilities were remeasured using the lower corporate federal tax rate beginning December 31, 2017. While we do not expect other material impacts, the new rules are complex and lack developed administrative guidance; thus, the impact of certain aspects of these provisions on us is currently unclear.
Net Earnings Attributable to Noncontrolling Interests
This amount represents the third-party investors’ share of the earnings generated in consolidated entities in which we do not own 100% of the equity, reduced by the third-party share of fees or promotes payable to us and earned during the period.
The following table summarizes We had net earnings attributable to noncontrolling interests of $53 million and $35 million for the six months ended June 30, (in millions):2018 and 2017, respectively. Included in these amounts were $21 million and $13 million for the six months ended June 30, 2018 and 2017, respectively, of net earnings attributable to the common limited partnership unitholders of Prologis, L.P.
|
| 2017 |
|
| 2016 |
| ||
Prologis U.S. Logistics Venture |
| $ | 19 |
|
| $ | 2 |
|
Prologis North American Industrial Fund (1) |
|
| 2 |
|
|
| 11 |
|
Other consolidated entities (1) |
|
| 1 |
|
|
| 4 |
|
Prologis, L.P. net earnings attributable to noncontrolling interests |
|
| 22 |
|
|
| 17 |
|
Limited partners in Prologis, L.P. |
|
| 13 |
|
|
| 15 |
|
Prologis, Inc. net earnings attributable to noncontrolling interests |
| $ | 35 |
|
| $ | 32 |
|
|
|
|
|
|
|
|
|
|
|
|
See Note 6 to the Consolidated Financial Statements for further information on our consolidated co-investment ventures.noncontrolling interests.
Other Comprehensive Income (Loss)
During the six months ended June 30, 2017, we recorded net gains in the Statements of Comprehensive Income related to foreign currency translations of our foreign subsidiaries into U.S. dollars upon consolidation. These gains were principally due to the strengthening of the British pound sterling, euro and Japanese yen to the U.S. dollar, offset slightly by the weakening of the Brazilian real. During the six months ended June 30, 2016, we recorded net losses, principally due to the weakening of the British pound sterling, offset slightly by the strengthening of the Brazilian real, euro and Japanese yen to the U.S. dollar.
During the six months ended June 30, 2017, we recorded unrealized gains and during the six months ended June 30, 2016, we recorded unrealized losses in the Statements of Comprehensive Income, related to the change in fair value of our cash flow hedges and our share of derivatives in our unconsolidated co-investment ventures.
See Note 9 to the Consolidated Financial Statements for more information about our derivative transactions.transactions and other comprehensive income (loss).
Other Matters
The U.S. government has created the potential for significant changes in trade policies, including tariffs and government regulations affecting trade between the U.S. and other countries where we operate. The foreign trade policies, tariffs and other impositions on imported goods by the U.S. or other countries are beyond our control. We believe that our customers are moving forward with their growth plans and we do not expect these tariffs will materially change the consumption habits that drive our business globally. However, increased sanctions are generally negative for all businesses in the U.S. and abroad, including our business, and could adversely affect economic growth generally and our financial performance.
RESULTS OF OPERATIONS – THREE MONTHS ENDED JUNE 30, 2018 AND 2017 and 2016
Except as separately discussed above, the changes in comprehensive income attributable to common stockholders and its components for the three months ended June 30, 2017,2018, as compared to the three months ended June 30, 2016,2017, are similar to the changes for the six monthsix-month periods ended on the same dates.
LIQUIDITY AND CAPITAL RESOURCES
Overview
We consider our ability to generate cash from operating activities, distributions from our co-investment ventures, contributions and dispositions of properties and from available financing sources to be adequate to meet our anticipated future development, acquisition, operating, debt service, dividend and distribution requirements.
Near-Term Principal Cash Sources and Uses
In addition to dividends to the common and preferred stockholders of Prologis, Inc. and distributions, to the holders of limited partnership units of Prologis, L.P. and our partner in our consolidated co-investment venture, we expect our primary cash needs will consist of the following:
completion of the development and leasing of the properties in our consolidated development portfolio (at June 30, 2017, 772018, 83 properties in our development portfolio were 63.5%51.8% leased with a current investment of $1.5$1.7 billion and a TEI of $2.7$2.9 billion when completed and leased, leaving $1.2 billion remaining to be spent)of estimated additional required investment);
development of new properties for long-term investment or contributions to unconsolidated co-investment ventures, including the acquisition of land in certain markets;
capital expenditures and leasing costs on properties in our operating portfolio;
repayment of debt and scheduled principal payments of less than $1$109 million in 2017;2018;
additional investments in current unconsolidated entities or new investments in future unconsolidated co-investment ventures; including the expected acquisition of our partners’ interest in the Brazil platform for R$1.2 billion ($362 million), discussed earlier;entities;
acquisition of operating properties or portfolios of operating properties (depending on market and other conditions) for direct, long-term investment in our consolidated portfolio (this might include acquisitions from our co-investment ventures);
repurchase of our outstanding debt or equity securities (depending on prevailing market conditions, our liquidity, requirements, contractual restrictions and other factors) through cash purchases, open-market purchases, privately negotiated transactions, tender offers or otherwise.otherwise; and
as discussed earlier, we expect to close on the acquisition of DCT in August principally through the issuance of common stock and the assumption of debt. We expect to repay certain of this debt with available cash, borrowings under our credit facilities and proceeds from the issuance of debt.
We expect to fund our cash needs principally from the following sources (subject to market conditions):
available unrestricted cash balances ($271528 million at June 30, 2017)2018);
net cash flow from property operations;
fees earned for services performed on behalf of the co-investment ventures, including promotes;
distributions received from the co-investment ventures;
proceeds from the disposition of properties, land parcels or other investments to third parties;
proceeds from the contributions of properties to current or future co-investment ventures;
proceeds from the sale of a portion of our investments in co-investment ventures;ventures to achieve long-term ownership targets;
borrowing capacity under our current credit facility arrangements, discussed in the following section, other facilities or borrowing arrangements ($3.53.4 billion available at June 30, 2017)2018); and
proceeds from the issuance of debt.
We may also generate proceeds from the issuance of equity securities, subject to market conditions.
Debt
The following table summarizes information about our consolidated debt by currency (dollars in millions):
|
| June 30, 2017 |
|
| December 31, 2016 |
| ||
Debt outstanding |
| $ | 11,082 |
|
| $ | 10,608 |
|
Weighted average interest rate |
|
| 3.0 | % |
|
| 3.2 | % |
Weighted average maturity in months |
| 65 |
|
| 60 |
| ||
|
| June 30, 2018 |
|
| December 31, 2017 |
| ||||||||||
|
| Weighted Average Interest Rate |
|
| Amount Outstanding |
|
| Weighted Average Interest Rate |
|
| Amount Outstanding |
| ||||
British pound sterling |
|
| 2.3 | % |
| $ | 654 |
|
|
| 2.3 | % |
| $ | 672 |
|
Canadian dollar |
|
| 3.4 | % |
|
| 274 |
|
|
| 3.3 | % |
|
| 451 |
|
Euro |
|
| 2.3 | % |
|
| 4,185 |
|
|
| 2.6 | % |
|
| 3,840 |
|
Japanese yen (1) |
|
| 1.0 | % |
|
| 1,276 |
|
|
| 0.9 | % |
|
| 1,306 |
|
U.S. dollar |
|
| 4.6 | % |
|
| 3,038 |
|
|
| 4.1 | % |
|
| 3,144 |
|
Total debt (2) |
|
| 2.9 | % |
| $ | 9,427 |
|
|
| 2.9 | % |
| $ | 9,413 |
|
(1) | The majority of our Japanese yen denominated debt is variable rate debt. |
(2) | The weighted average maturity for total debt outstanding at June 30, 2018 and December 31, 2017 was 73 months and 67 months, respectively. |
In February 2017, we renewed and amended our Japanese yen revolver (the “Revolver”) and increased our availability underDuring the Revolver to ¥50.0 billion ($447 million atsix months ended June 30, 2017).2018, we had the following significant consolidated debt activity, which resulted in extending our debt maturities (principal in millions):
|
|
| Principal |
|
|
|
|
|
|
|
|
| ||||
| Borrowing Currency |
| Borrowing Currency |
| USD |
|
| Stated Interest Rate |
|
| Fixed/ Variable |
| Maturity | |||
Repurchase and payments of debt |
|
|
|
|
|
|
|
|
|
|
|
|
|
|
|
|
2015 Canadian Term Loan (1) | CAD |
| $ | 201 |
| $ | 159 |
|
| CDOR + 1.50% |
|
| Variable |
| February 2023 | |
|
|
|
|
|
|
|
|
|
|
|
|
|
|
|
|
|
Issuance of debt |
|
|
|
|
|
|
|
|
|
|
|
|
|
|
|
|
Senior notes | EUR |
| € | 400 |
| $ | 494 |
|
| Euribor + 0.25% |
|
| Variable |
| January 2020 | |
Senior notes | USD |
| $ | 400 |
| $ | 400 |
|
| 3.88% |
|
| Fixed |
| September 2028 | |
Senior notes | USD |
| $ | 300 |
| $ | 300 |
|
| 4.38% |
|
| Fixed |
| September 2048 | |
In March 2017, we entered into an unsecured senior term loan agreement (the “2017 Yen Term Loan”) under which we can draw in Japanese yen, of which ¥7.2 billion (
(1)$64 million at June 30, 2017) matures in March 2027 and bears an interest rate of 0.9% and ¥4.8 billion ($43 million at June 30, 2017) matures in March 2028 and bears an interest rate of 1.0%. In the first quarter of 2017, we borrowed ¥12.0 billion ($107 million)This activity included a partial pay down on the 2017 Yen Term Loan and it was fully drawn at June 30, 2017.
In May 2017, we renewed and amended our 2017 Term Loan under which loans can be obtained in British pounds sterling, euro, Japanese yen and U.S. dollars in an aggregate amount not to exceed $500 million. We may pay down and reborrow under the 2017 Term Loan. The 2017 Term Loan bears an interest rate of LIBOR plus 0.9% and is scheduled to mature in May 2020; however, we may extend the maturity date twice, by one year each, subject to the satisfaction of certain conditions and the payment of an extension fee. In the second quarter of 2017, we borrowed $500 million, causing the 2017 Term Loan to be fully drawn at June 30, 2017.debt outstanding.
In June 2017, we issued £500 million ($645 million) of senior notes with an interest rate of 2.3%, maturing in 2029, at 99.9% of par value. We used the net proceeds for redemption of previously issued senior notes, general corporate purposes and to repay other indebtedness.
At June 30, 2017,2018, we had credit facilities with an aggregate borrowing capacity of $3.5 billion, of which $3.4 billion was available for borrowing.
Our credit ratings at June 30, 2018, were A3 from Moody’s and A- from S&P, both with stable outlook. These ratings allow us to borrow at an advantageous rate. Adverse changes in our credit ratings could negatively impact our business and, in particular, our refinancing and other capital market activities, our ability to manage debt maturities, our future growth and our development and acquisition activity. A securities rating is not a recommendation to buy, sell or hold securities and is subject to revision or withdrawal at any time by the rating organization.
At June 30, 2017,2018, we were in compliance with all of our financial debt covenants. These covenants include customary financial covenants for total debt, encumbered debt and fixed charge coverage ratios.
As discussed earlier, in July, we contributed operating properties formerly owned by NAIF to USLF and received cash proceeds of $720 million that was used to pay down term loans and other borrowings. Also, USLF assumed $956 million of secured mortgage debt related to the properties.
See Note 5 to the Consolidated Financial Statements for further discussion on our debt.
Equity Commitments Related to Certain Co-Investment Ventures
Certain co-investment ventures have equity commitments from us and our venture partners. Our venture partners fulfill their equity commitment with cash. We may fulfill our equity commitment through contributions of properties or cash. See the Cash Flow Summary below for more information about our investment activity in our co-investment ventures. For more information on equity commitments for our unconsolidated co-investment ventures, see Note 3 to the Consolidated Financial Statements.
The following table summarizes our cash flow activity for the six months ended June 30 (in millions):
|
| 2017 |
|
| 2016 |
|
| 2018 |
|
| 2017 |
| ||||
Net cash provided by operating activities |
| $ | 745 |
|
| $ | 634 |
|
| $ | 773 |
|
| $ | 745 |
|
Net cash provided by (used in) investing activities |
| $ | (171 | ) |
| $ | 860 |
| ||||||||
Net cash used in investing activities |
| $ | (187 | ) |
| $ | (171 | ) | ||||||||
Net cash used in financing activities |
| $ | (1,126 | ) |
| $ | (1,437 | ) |
| $ | (500 | ) |
| $ | (1,126 | ) |
Cash Provided by Operating Activities
Cash provided by operating activities, exclusive of changes in receivables and payables, is impacted by the following significant activity:activity during the six months ended June 30, 2018 and 2017:
Real estate operations. We receive the majority of our operating cash through the net revenues of our Real Estate Operations segment. See ourthe Results of Operations section above for further explanation of our Real Estate Operations segment. The revenues from this segment include noncash adjustments for straight-lined rentrents and amortization of above and below market leases of $26 million and $49 million for 2018 and $43 million for 2017, and 2016, respectively.
Strategic capital. We also generate operating cash through our Strategic Capital segment by providing management services to our unconsolidated co-investment ventures, including promotes.ventures. See ourthe Strategic Capital Results of Operations section above for the key drivers of our strategic capital revenues and expenses. We earned $124 million of promotesIncluded in Strategic Capital Revenues is the second quarter of 2017, which represents the third-parties’third-party investors’ share of the promotes earned that were included as strategic capital revenues, but excluded from cash provided bytotal promote revenue, which is recognized in operating activities as the cash will be received in the third quarter of 2017. Included in the cash provided by operating activities for 2016period it is $30 million of cash received, which represented the third-parties’ share of promotes earned in 2015.received.
G&A expenses. We incurred $114$120 million and $107$114 million of G&A costs in 2018 and 2017, and 2016, respectively.
Distributions from unconsolidated entities. We recognized $141 million and $147 million of distributions from our unconsolidated entities in 2017 and 2016, respectively. Included in 2016 are distributions of $27 million that represented our share of promotes earned in 2015. In the third quarter of 2016, we adopted an accounting standard update that clarifies the classification methodology within the statement of cash flows for distributions received from equity method investments. As a result, for the six months ended June 30, 2016, we reclassified $48 million of distributions from our unconsolidated entities into operating activities that were previously reported as investing activities.
Equity-based compensation awards. We record equity-based compensation expenses in Rental Expenses in the Real Estate Operations segment, Strategic Capital Expenses in the Strategic Capital segment and G&A expenses. The total amounts expensed were $39 million and $38 million in 2018 and $292017, respectively.
Operating distributions from unconsolidated entities. We received $176 million and $141 million of distributions from our unconsolidated entities in 2018 and 2017, respectively. Certain co-investment ventures distribute the total promote (third-party investors’ and 2016, respectively.our share) and our share is recorded to Investment In and Advances to Unconsolidated Entities, and is recognized in operating activities in the period it is received.
Cash paid for interest and income taxes. As disclosed in Note 11 to the Consolidated Financial Statements, we paid combined amounts for interest and income taxes of $187 million and $212 million in both2018 and 2017, and 2016, respectively.
Cash Provided by (Used in) Investing Activities
Cash provided by investing activities is primarily driven by proceeds from contributions and dispositions of real estate properties. Cash used in investing activities is principally driven by our investments in real estate development, acquisitions and capital expenditures. See Note 2 to the Consolidated Financial Statements for further information on these real estate activities. The following significant transactions impacted our cash used in investing activities during the six months ended June 30, 2018 and 2017:
Real estate development. We invested $789 million and $715 million in 2018 and $776 million in 2017, and 2016, respectively, in real estate development and leasing costs for first generation leases.space. We had 5563 properties under development and 2220 properties that were completed but not stabilized at June 30, 2017, and we expect to continue to develop new properties as the opportunities arise.2018.
Real estate acquisitions. In 2017, weWe acquired total real estate of $289 million, which included 808 acres of land and 3 operating properties in 2018. We acquired total real estate of $202 million, which included 524 acres of land and 2 operating properties. In 2016, we acquired total real estate of $136 million, which included 384 acres of land and 6 operating properties.
Proceeds from contributions and dispositions.We generated cash from contributions and dispositions of real estate properties of $836 million and $1.3 billion during 2017 and 2016, respectively. See Note 2 to the Consolidated Financial Statements for more detail about our contributions and dispositions.in 2017.
Investments in and advances to. We investinvested cash in our unconsolidated co-investment ventures and other ventures, which represents our proportionate share.share of $83 million and $145 million in 2018 and 2017, respectively. The ventures primarily use the funds for the acquisition of operating properties, development and repayment of debt. The following table summarizes our investments in our unconsolidated co-investment ventures for the six months ended June 30 (in millions):
|
|
| 2017 |
|
| 2016 |
| ||
| Unconsolidated co-investment ventures: |
|
|
|
|
|
|
|
|
| Other Americas |
|
|
|
|
|
|
|
|
| Prologis Brazil Logistics Partners Fund I and related joint ventures |
| $ | 4 |
|
| $ | 21 |
|
| Europe |
|
|
|
|
|
|
|
|
| European Logistics Venture 1 |
|
| 19 |
|
|
| - |
|
| Prologis European Logistics Partners Sàrl |
|
| 3 |
|
|
| 61 |
|
| Prologis United Kingdom Logistics Venture |
|
| 31 |
|
|
| - |
|
| Asia |
|
|
|
|
|
|
|
|
| Nippon Prologis REIT, Inc. |
|
| - |
|
|
| 33 |
|
| Remaining unconsolidated co-investment ventures |
|
| 7 |
|
|
| 10 |
|
| Total unconsolidated co-investment ventures |
|
| 64 |
|
|
| 125 |
|
|
|
|
|
|
|
|
|
|
|
| Other ventures |
|
| 81 |
|
|
| 20 |
|
| Total investments in and advances to unconsolidated entities |
| $ | 145 |
|
| $ | 145 |
|
|
|
|
|
|
|
|
|
|
|
See Note 3 to the Consolidated Financial Statements for more detail on our unconsolidated co-investment ventures.
Return of investment. We received distributions from unconsolidated co-investment ventures and other ventures as a return of investment of $135 million and $134 million in 2018 and $533 million during 2017, and 2016, respectively. Included in this amountthese amounts for 2018 and 2017 is $84was $115 million from the disposition of our investment in ELV and $49 million from property dispositions within our unconsolidated co-investment ventures. Included in this amount for 2016 is $411 million from the redemption of a portion of our investments in PTELF and USLF and $79In 2017, we also included $84 million from the disposition of our investment in a joint venture, and the remaining amount was from property dispositions within our unconsolidated entities. As discussed above, we adopted an accounting standard update in the third quarter of 2016 that clarifies the classification methodology within the statement of cash flows for distributions received from equity method investments and as a result, we reclassified $48 million of distributions in 2016 from our unconsolidated entities that were previously reported as investing activities into operating activities.ELV.
Proceeds from repayment of notes receivable backed by real estate. In 2017 and 2016, we received $32 million and $201 million, respectively, for the payment of notes receivable received in connection with dispositions of real estate to third parties.
Cash Used in Financing Activities
DividendsCash provided by financing activities is primarily driven by proceeds from the issuance of debt. Cash used in financing activities is principally driven by dividends paid on common and preferred stock. We paid dividendsunits, noncontrolling interest distributions and payments of $471 milliondebt and $445 million tocredit facilities. The following significant transactions impacted our commoncash used in financing activities during the six months ended June 30, 2018 and preferred stockholders during 2017 and 2016, respectively.2017:
Noncontrolling interests contributions. In 2017, our partner in U.S. Logistics Venture (“USLV”) made contributions of $136 million for the pay down of secured mortgage debt.
Noncontrolling interests distributions.In 2017 and 2016, we distributed $100 million and $214 million to various noncontrolling interests, respectively. Distributions in 2017 and 2016 included $28 million and $137 million related to proceeds from dispositions of real estate, primarily to our partner in USLV. Included in these amounts in both 2017 and 2016 were $19 million of distributions to common limited partnership unitholders of Prologis, L.P.
PurchaseSettlement of noncontrolling interests. In 2017, weWe paid net cash of $710 million to acquire our partner’s interest in NAIF and $80 million to acquire our partner’s interest in the Prologis Brazil Fund.Logistics Partners Fund I, L.P. in 2017.
Tax paid for shares withheld.Other debt activity. In the third quarterOur repurchase of 2016, we adopted an accounting standard update that clarifies the classification methodology within the statement of cash flows for taxes paid to a tax authority by us when we withhold shares to cover employee withholding tax payments for certain stock compensation plans. As a result of the adoption, in 2016 we reclassified payments of $7 million from operating activitiesto financing activities.
Repurchase and payments of debt. During 2017, we made payments of $1.0 billion, primarily on our outstanding term loans. We also repurchaseddebt and extinguished senior notes and secured mortgage debt for a combined total of $954 million, which included extinguishment costs. During 2016, we made payments of $750 million on our outstanding term loans and $164 million on regularly scheduled debt principal payments and payments at maturity. We also repurchased and extinguished secured mortgage debt of $363 million, which included extinguishment costs.
Proceedsproceeds from issuance of debt.In 2017, we issued $1.3 billiondebt consisted of term loans, £500 million ($645 million) of senior notes and $148 million of secured mortgage debt and used the net proceeds to repurchase and extinguish senior notes and secured mortgage debt andfollowing activity for general corporate purposes. In 2016, we issued $299 million of term loans and $218 million of secured mortgage debt and used the net proceeds for general corporate purposes. See Note 5 to the Consolidated Financial Statements for more detail on debt.six months ended June 30 (in millions):
|
|
| 2018 |
|
| 2017 |
| ||
| Repurchase of and payments on debt (including extinguishment costs) |
|
|
|
|
|
|
|
|
| Regularly scheduled debt principal payments and payments at maturity |
| $ | 4 |
|
| $ | 9 |
|
| Senior notes |
|
| - |
|
|
| 652 |
|
| Term loans |
|
| 1,159 |
|
|
| 1,040 |
|
| Secured mortgages |
|
| 89 |
|
|
| 302 |
|
| Total |
| $ | 1,252 |
|
| $ | 2,003 |
|
|
|
|
|
|
|
|
|
|
|
| Proceeds from issuance of debt |
|
|
|
|
|
|
|
|
| Senior notes |
| $ | 1,190 |
|
| $ | 645 |
|
| Term loans |
|
| 500 |
|
|
| 1,449 |
|
| Secured mortgages |
|
| 32 |
|
|
| 40 |
|
| Total |
| $ | 1,722 |
|
| $ | 2,134 |
|
Off-Balance Sheet Arrangements
Unconsolidated Co-Investment Venture Debt
We had investments in and advances to unconsolidated co-investment ventures, at June 30, 2017,2018, of $4.4$5.2 billion. These ventures had total third-party debt of $6.8$8.1 billion at June 30, 2017.2018. The weighted average loan-to-value ratio for all unconsolidated co-investment ventures was 27.8% at June 30, 2018. Loan-to-value, a non-GAAP measure, was calculated as the percentage of total third-party debt to the gross book value of real estate for each venture and weighted based on the cumulative gross book value of all unconsolidated co-investment ventures.
At June 30, 2017,2018, we did not guarantee any third-party debt of the unconsolidated co-investment ventures. In our role as the manager or sponsor, we work with the ventures to refinance their maturing debt. There can be no assurance that the ventures will be able to refinance any maturing indebtedness on terms as favorable as the maturing debt, or at all. If the ventures are unable to refinance the maturing indebtedness with newly issued debt, they may be able to obtain funds by voluntary capital contributions from us and our partners or by selling assets. Certain of our ventures also have credit facilities, or unencumbered properties, both of which may be used to obtain funds.
Contractual Obligations
DistributionDividend and DividendDistribution Requirements
Our dividend policy on our common stock is to distribute a percentage of our cash flow to ensure that we will meet the dividend requirements of the Internal Revenue Code, relative to maintaining our REIT status, while still allowing us to retain cash to meet other needs such asfund capital improvements and other investment activities.
Under the Internal Revenue Code, REITs may be subject to certain federal income and excise taxes on our undistributed taxable income. We do not expect the Tax Cuts and Jobs Act, enacted on December 22, 2017, to modify our current distribution policy.
We paid a cash dividend of $0.44$0.48 per common share in the first two quarters of 2017.2018. Our future common stock dividends, if and as declared, may vary and will be determined by the board of directors (the “Board”(“Board”) upon the circumstances prevailing at the time, including our financial condition, operating results and REIT distribution requirements, and may be adjusted at the discretion of the Board during the year.
We make distributions on the common limited partnership units outstanding at the same per unit amount as our common stock dividend. The Class A Units in the OP are entitled to a quarterly distribution equal to $0.64665 per unit so long as the common units receive a quarterly distribution of at least $0.40 per unit. We paid a quarterly distribution of $0.64665 per Class A Unit in the first two quarters of 2018.
At June 30, 2017,2018, we had one series of preferred stock outstanding, the series Q. The annual dividend rate is 8.54% per share and dividends are payable quarterly in arrears.
Pursuant to the terms of our preferred stock, we are restricted from declaring or paying any dividend with respect to our common stock unless and until all cumulative dividends with respect to the preferred stock have been paid and sufficient funds have been set aside for dividends that have been declared for the relevant dividend period with respect to the preferred stock.
Other Commitments
On a continuing basis, we are engaged in various stages of negotiations for the acquisition or disposition of individual properties or portfolios of properties.
NEW ACCOUNTING PRONOUNCEMENTS
See Note 1 to the Consolidated Financial Statements.
FUNDS FROM OPERATIONS ATTRIBUTABLE TO COMMON STOCKHOLDERS/UNITHOLDERS (“FFO”)
FFO is a non-GAAP financial measure that is commonly used in the real estate industry. The most directly comparable GAAP measure to FFO is net earnings.
The National Association of Real Estate Investment Trusts (“NAREIT”) defines FFO as earnings computed under GAAP to exclude historical cost depreciation and gains and losses from the sales, along with impairment charges, of previously depreciated properties. We also exclude the gains on revaluation of equity investments upon acquisition of a controlling interest and the gain recognized from a
partial sale of our investment, as these are similar to gains from the sales of previously depreciated properties. We exclude similar adjustments from our unconsolidated entities and the third parties’ share of our consolidated co-investment ventures.
Our FFO Measures
Our FFO measures begin with NAREIT’s definition and we make certain adjustments to reflect our business and the way that management plans and executes our business strategy. While not infrequent or unusual, the additional items we adjust for in calculating FFO, as modified by Prologis, and Core FFO, both as defined below, are subject to significant fluctuations from period to period. Although these items may have a material impact on our operations and are reflected in our financial statements, the removal of the effects of these items allows us to better understand the core operating performance of our properties over the long term. These items have both positive and negative short-term effects on our results of operations in inconsistent and unpredictable directions that are not relevant to our long-term outlook.
We calculate our FFO measures, as defined below, based on our proportionate ownership share of both our unconsolidated and consolidated ventures. We reflect our share of our FFO measures for unconsolidated co-investment ventures by applying our average ownership percentage for the period to the applicable reconciling items on an entity by entity basis. We reflect our share for consolidated ventures in which we do not own 100% of the equity by adjusting our FFO measures to remove the noncontrolling interests share of the applicable reconciling items based on our average ownership percentage for the applicable periods.
These FFO measures are used by management as supplemental financial measures of operating performance and we believe that it is important that stockholders, potential investors and financial analysts understand the measures management uses. We do not use our FFO measures as, nor should they be considered to be, alternatives to net earnings computed under GAAP, as indicators of our operating performance, as alternatives to cash from operating activities computed under GAAP or as indicators of our ability to fund our cash needs.
We analyze our operating performance primarilyprincipally by the rental revenues of our real estate and the revenues from our strategic capital business, net of operating, administrative and financing expenses. This income stream is not directly impacted by fluctuations in the market value of our investments in real estate or debt securities.
FFO, as modified by Prologis attributable to common stockholders and stockholders/unitholders (“FFO, as modified by Prologis”)
To arrive at FFO, as modified by Prologis, we adjust the NAREIT defined FFO measure to exclude the impact of foreign currency related items and deferred tax, specifically:
deferred income tax benefits and deferred income tax expenses recognized by our subsidiaries;
current income tax expense related to acquired tax liabilities that were recorded as deferred tax liabilities in an acquisition, to the extent the expense is offset with a deferred income tax benefit in earnings that is excluded from our defined FFO measure;
unhedged foreign currency exchange gains and losses resulting from debt transactions between us and our foreign consolidated subsidiaries and our foreign unconsolidated entities;
foreign currency exchange gains and losses from the remeasurement (based on current foreign currency exchange rates) of certain third partythird-party debt of our foreign consolidated and unconsolidated entities; and
mark-to-market adjustments associated with derivative financial instruments.
We use FFO, as modified by Prologis, so that management, analysts and investors are able to evaluate our performance against other REITs that do not have similar operations or operations in jurisdictions outside the U.S.
Core FFO attributable to common stockholders and stockholders/unitholders (“Core FFO”)
In addition to FFO, as modified by Prologis, we also use Core FFO. To arrive at Core FFO, we adjust FFO, as modified by Prologis, to exclude the following recurring and nonrecurring items that we recognized directly in FFO, as modified by Prologis:
gains or losses from the disposition of land and development properties that were developed with the intent to contribute or sell;
income tax expense related to the sale of investments in real estate and third-party acquisition costs related to the acquisition of real estate;
impairment charges recognized related to our investments in real estate generally as a result of our change in intent to contribute or sell these properties;
gains or losses from the early extinguishment of debt and redemption and repurchase of preferred stock; and
expenses related to natural disasters.
We use Core FFO, including by segment and region, to: (i) assess our operating performance as compared to other real estate companies; (ii) evaluate our performance and the performance of our properties in comparison with expected results and results of previous periods; (iii) evaluate the performance of our management; (iv) budget and forecast future results to assist in the allocation of resources; (v) provide guidance to the financial markets to understand our expected operating performance; and (v)(vi) evaluate how a specific potential investment will impact our future results.
Limitations on the use of our FFO measures
While we believe our modified FFO measures are important supplemental measures, neither NAREIT’s nor our measures of FFO should be used alone because they exclude significant economic components of net earnings computed under GAAP and are, therefore, limited as an analytical tool. Accordingly, these are only a few of the many measures we use when analyzing our business. Some of the limitations are:
The current income tax expenses and acquisition costs that are excluded from our modified FFO measures represent the taxes and transaction costs that are payable.
Depreciation and amortization of real estate assets are economic costs that are excluded from FFO. FFO is limited, as it does not reflect the cash requirements that may be necessary for future replacements of the real estate assets. Furthermore, the amortization of capital expenditures and leasing costs necessary to maintain the operating performance of logistics facilities are not reflected in FFO.
Gains or losses from non-development property and dispositions orand impairment charges related to expected dispositions represent changes in value of the properties. By excluding these gains and losses, FFO does not capture realized changes in the value of disposed properties arising from changes in market conditions.
The deferred income tax benefits and expenses that are excluded from our modified FFO measures result from the creation of a deferred income tax asset or liability that may have to be settled at some future point. Our modified FFO measures do not currently reflect any income or expense that may result from such settlement.
The foreign currency exchange gains and losses that are excluded from our modified FFO measures are generally recognized based on movements in foreign currency exchange rates through a specific point in time. The ultimate settlement of our foreign currency-denominated net assets is indefinite as to timing and amount. Our FFO measures are limited in that they do not reflect the current period changes in these net assets that result from periodic foreign currency exchange rate movements.
The gains and losses on extinguishment of debt or preferred stock that we exclude from our Core FFO, may provide a benefit or cost to us as we may be settling our debtobligation at less or more than our future obligation.
The natural disaster expenses that we exclude from Core FFO are costs that we have incurred.
We compensate for these limitations by using our FFO measures only in conjunction with net earnings computed under GAAP when making our decisions. This information should be read with our complete consolidated financial statementsConsolidated Financial Statements prepared under GAAP. To assist investors in compensating for these limitations, we reconcile our modified FFO measures to our net earnings computed under GAAP for six months ended June 30 as follows (in millions).:
|
| 2017 |
|
| 2016 |
|
| 2018 |
|
| 2017 |
| ||||
FFO |
|
|
|
|
|
|
|
|
|
|
|
|
|
|
|
|
Reconciliation of net earnings to FFO measures: |
|
|
|
|
|
|
|
|
|
|
|
|
|
|
|
|
Net earnings attributable to common stockholders |
| $ | 470 |
|
| $ | 483 |
|
| $ | 701 |
|
| $ | 470 |
|
|
|
|
|
|
|
|
|
|
|
|
|
|
|
|
|
|
Add (deduct) NAREIT defined adjustments: |
|
|
|
|
|
|
|
|
|
|
|
|
|
|
|
|
Real estate related depreciation and amortization |
|
| 439 |
|
|
| 465 |
|
|
| 390 |
|
|
| 439 |
|
Gains on dispositions of investments in real estate properties, net |
|
| (113 | ) |
|
| (238 | ) |
|
| (68 | ) |
|
| (113 | ) |
Reconciling items related to noncontrolling interests |
|
| (42 | ) |
|
| (64 | ) |
|
| (23 | ) |
|
| (42 | ) |
Our share of reconciling items included in earnings from unconsolidated entities |
|
| 60 |
|
|
| 79 |
|
|
| 104 |
|
|
| 60 |
|
NAREIT defined FFO |
|
| 814 |
|
|
| 725 |
|
|
| 1,104 |
|
|
| 814 |
|
|
|
|
|
|
|
|
|
|
|
|
|
|
|
|
|
|
Add (deduct) our modified adjustments: |
|
|
|
|
|
|
|
|
|
|
|
|
|
|
|
|
Unrealized foreign currency and derivative losses, net |
|
| 36 |
|
|
| 24 |
| ||||||||
Deferred income tax expense (benefit), net |
|
| 2 |
|
|
| (5 | ) | ||||||||
Current income tax benefit on dispositions related to acquired tax assets |
|
| (1 | ) |
|
| - |
| ||||||||
Reconciling items related to noncontrolling interests |
|
| - |
|
|
| 1 |
| ||||||||
Unrealized foreign currency and derivative (gains) losses, net |
|
| (53 | ) |
|
| 36 |
| ||||||||
Deferred income tax expense (benefit) |
|
| (1 | ) |
|
| 2 |
| ||||||||
Current income tax expense (benefit) on dispositions related to acquired tax assets |
|
| 1 |
|
|
| (1 | ) | ||||||||
Our share of reconciling items included in earnings from unconsolidated entities |
|
| (1 | ) |
|
| - |
|
|
| 2 |
|
|
| (1 | ) |
FFO, as modified by Prologis |
|
| 850 |
|
|
| 745 |
|
|
| 1,053 |
|
|
| 850 |
|
|
|
|
|
|
|
|
|
|
|
|
|
|
|
|
|
|
Adjustments to arrive at Core FFO: |
|
|
|
|
|
|
|
|
|
|
|
|
|
|
|
|
Gains on dispositions of development properties and land, net |
|
| (68 | ) |
|
| (105 | ) |
|
| (221 | ) |
|
| (68 | ) |
Current income tax expense on dispositions |
|
| 1 |
|
|
| 10 |
|
|
| 10 |
|
|
| 1 |
|
Acquisition expenses |
|
| - |
|
|
| 2 |
| ||||||||
Losses (gains) on early extinguishment of debt, net |
|
| 31 |
|
|
| (1 | ) | ||||||||
Losses on early extinguishment of debt, net |
|
| 1 |
|
|
| 31 |
| ||||||||
Reconciling items related to noncontrolling interests |
|
| (1 | ) |
|
| 1 |
|
|
| 5 |
|
|
| (1 | ) |
Our share of reconciling items included in earnings from unconsolidated entities |
|
| (5 | ) |
|
| 2 |
|
|
| (14 | ) |
|
| (5 | ) |
Core FFO |
| $ | 808 |
|
| $ | 654 |
|
| $ | 834 |
|
| $ | 808 |
|
ITEM 3. Quantitative and Qualitative Disclosures About Market Risk
We are exposed to the impact of foreign-exchange relatedforeign exchange-related variability and earnings volatility on our foreign investments and interest rate changes. See our risk factors in Item 1A. Risk Factors, in our Annual Report on Form 10-K for the fiscal year ended December 31, 2016.2017. See also Note 9 to the Consolidated Financial Statements in Item 1 for more information about our derivative financial instruments.
We monitor our market risk exposures using a sensitivity analysis. Our sensitivity analysis estimates the exposure to market risk sensitive instruments assuming a hypothetical 10% adverse change in foreign currency exchange rates or interest rates at June 30, 2017.2018. The results of the sensitivity analysis are summarized in the following sections. The sensitivity analysis is of limited predictive value. As a result, revenues and expenses, as well as our ultimate realized gains or losses with respect to interestforeign currency exchange rate and foreign currency exchangeinterest rate fluctuations will depend on the exposures that arise during a future period, hedging strategies at the time and the prevailing interest and foreign currency exchange rates and interest rates.
Foreign Currency Risk
We are exposed to foreign exchange-relatedcurrency exchange variability ofrelated to investments in and earnings from our foreign investments. Foreign currency market risk is the possibility that our financial results of operations or financial position could be better or worse than planned because of changes in foreign currency exchange rates. We primarily hedge our foreign currency risk by borrowing in the currencies in which we invest. Generally, we borrow in the functional currency of the consolidated subsidiaries but we also borrow in currencies other than the U.S. dollar in the OP and may designate this borrowing as a nonderivative financial instrument. We may also hedge our foreign currency risk by designating derivative financial instruments as net investment hedges, as these amounts offset the translation adjustments on the underlying net assets of our foreign investments. Other foreign currency contracts, such as forwards, not designated as hedges reduce fluctuations in foreign currency associated with the translation of our projected net operating income of our international subsidiaries.
At June 30, 2017,2018, after consideration of our nonderivative and derivative financial instruments, we had net equity of approximately $984$694 million or 4.8% of total net equity, denominated in a currency other than the U.S. dollar after considerationrepresenting 3.7% of our derivative and nonderivative financial instruments.total net equity. Based on our sensitivity analysis, a 10% adverse change in exchange ratesstrengthening of the U.S. dollar against other currencies would cause a reduction of $98$69 million to our net equity.
At June 30, 2017,2018, we had foreign currency forward contracts, which were designated and qualify as net investment hedges, with an aggregate notional amount of $99$135 million to hedge a portion of our investments in Canada.Canada and Europe. On the basis of our sensitivity analysis, a weakening of the U.S. dollar against the Canadian dollar or Euro by 10% would result in a $10$13 million negative change in our cash flows on settlement. In addition, we also have British pound sterling, Canadian dollar, euro and Japanese yen forward and option contracts, which were not designated as hedges, and have an aggregate notional amount of $550$528 million to mitigate risk associated with the translation of the projected financial resultsearnings of our subsidiaries in Canada, Europe and Japan. A weakening of the U.S. dollar against these currencies by 10% would result in a $55$53 million negative change in our net income and cash flows on settlement.settlement of these contracts.
Interest Rate Risk
We also are exposed to the impact of interest rate changes on future earnings and cash flows. At June 30, 2017,2018, we had $2.3$1.7 billion of variable rate debt outstanding, of which $2.0$1.2 billion was outstanding on our term loans, and $327$466 million was outstanding onsenior notes, $12 million was credit facilities and $50 million was secured mortgage debt.mortgages. At June 30, 2017,2018, we had interest rate swap agreements to fix the interestour floating rate on $287 million (CAD $372 million) of our Canadian term loan. During the six months ended June 30, 2017, we had weighted average daily outstanding borrowings of $56 million on our variable rate credit facilities.euro senior notes. On the basis of our sensitivity analysis, a 10% adverse change in interest rates based on our average outstanding variable rate debt balances not subject to interest rate swap agreements during the period would result in additional annual interest expense of $2 million, which equates to a change in interest rates of 1112 basis points.
ITEM 4. Controls and Procedures
Controls and Procedures (The Parent)
The Parent carried out an evaluation under the supervision and with the participation of management, including the chief executive officerChief Executive Officer and chief financial officer,Chief Financial Officer, of the effectiveness of the disclosure controls and procedures (as defined in Rule 13a-14(c)) under the Securities and Exchange Act of 1934 (the “Exchange Act”) at June 30, 2017.2018. On the basis of this evaluation, the chief executive officerChief Executive Officer and the chief financial officerChief Financial Officer have concluded that the disclosure controls and procedures are effective to ensure that the information required to be disclosed in reports that are filed or submitted under the Exchange Act are recorded, processed, summarized and reported within the time periods specified in the Securities and Exchange Commission (“SEC”) rules and forms.
No changes in the internal controls over financial reporting during the most recent fiscal quarter have materially affected, or are reasonably likely to materially affect, internal control over financial reporting.
Controls and Procedures (The Operating Partnership)OP)
The Operating PartnershipOP carried out an evaluation under the supervision and with the participation of management, including the chief executive officerChief Executive Officer and chief financial officer,Chief Financial Officer, of the effectiveness of the disclosure controls and procedures (as defined in Rule 13a-14(c)) under the Exchange Act at June 30, 2017.2018. On the basis of this evaluation, the chief executive officerChief Executive Officer and the chief financial officerChief Financial Officer have concluded that the disclosure controls and procedures are effective to ensure that the information required to be disclosed in reports that are filed or submitted under the Exchange Act are recorded, processed, summarized and reported within the time periods specified in the SEC rules and forms.
No changes in the internal controls over financial reporting during the most recent fiscal quarter have materially affected, or are reasonably likely to materially affect, internal control over financial reporting.
In connection with the Mergers, on July 2, 2018, DCT, DCT OP, DCT’s board of directors (the “DCT Board”), Prologis, and the OP were sued in a putative class action lawsuit, the Rosenblatt Action, filed in the United States District Court for the District of Colorado, in connection with DCT's proposed merger with Prologis and the related Form S-4. The complaint in the Rosenblatt Action alleges that DCT, DCT OP, the DCT Board, Prologis, and Prologis OP violated federal securities laws by omitting material information from the Form S-4, rendering the Form S-4 materially deficient. On July 10, 2018, DCT and the DCT Board were sued in another putative class action lawsuit, the Bushansky Action, also filed in the United States District Court for the District of Colorado, and also in connection with DCT's proposed merger with Prologis and the related Form S-4. On July 13, 2018, DCT, DCT OP and the DCT Board were sued in a third putative class action lawsuit, the Aiken Action, filed in the United States District Court for the District of Maryland, also in connection with DCT’s proposed merger with Prologis and the related Form S-4. The complaints in the Bushansky Action and the Aiken Action allege that DCT and the DCT Board violated federal securities laws by omitting from the Form S-4, and/or misrepresenting in the Form S-4, material information, rendering the Form S-4 materially deficient. In all three actions, the plaintiffs seek, among other things, (i) to enjoin the transaction (or rescind it to the extent it is completed), and (ii) attorneys' fees and costs in connection with these lawsuits.
Although the ultimate outcome of litigation cannot be predicted with certainty, we believe that these lawsuits are without merit and intend to defend against these actions vigorously.
In addition, Prologis and our unconsolidated investees are party to a variety of other legal proceedings arising in the ordinary course of business. With respect to any such matters to which we are currently a party, the ultimate disposition of any such matters will not result in a material adverse effect on our business, financial position or results of operations.
At June 30, 2017, no material changes had occurred in our2018, the risk factors as discussed in Item 1Aunder the heading “Item 1A. Risk Factors” in our Annual Report on Form 10-K for the fiscal year ended December 31, 2016.2017 and “Risk Factors” in Amendment No. 1 to the Registration Statement on Form S-4 for Prologis, Inc., filed with the SEC on July 6, 2018, and any amendments thereto, continue to apply to our business.
ITEM 2. Unregistered Sales of Equity Securities and Use of Proceeds
During the quarter ended June 30, 2017,2018, we issued an aggregate of 0.3 milliondid not issue shares of common stock of the Parent uponin connection with the redemption of common units of the Operating Partnership. TheOP. If issued, the shares of common stock werewould be issued in reliance on the exemption from registration requirements of the Securities Act of 1933, as amended, afforded by Section 4(a)(2) thereof.
ITEM 3. Defaults Upon Senior Securities
None.
ITEM 4. Mine Safety Disclosures
Not Applicable.
None.
The exhibits required by this item are set forth on the Exhibit Index attached hereto.
Certain of the following documents are filed herewith. Certain other of the following documents that have been previously filed with the Securities and Exchange Commission and, pursuant to Rule 12-b-32, are incorporated herein by reference.
2.1 | |
4.1 | |
4.2 | |
4.3 | |
4.4 | |
10.1 | |
12.1† | Computation of Ratio of Earnings to Fixed Charges of Prologis, Inc. and Prologis, L.P. |
12.2† | |
15.1† | |
15.2† | |
31.1† | |
31.2† | |
31.3† | |
31.4† | |
32.1† | |
32.2† | |
101.INS† | XBRL Instance Document |
101.SCH† | XBRL Taxonomy Extension Schema |
101.CAL† | XBRL Taxonomy Extension Calculation Linkbase |
101.DEF† | XBRL Taxonomy Extension Definition Linkbase |
101.LAB† | XBRL Taxonomy Extension Label Linkbase |
101.PRE† | XBRL Taxonomy Extension Presentation Linkbase |
† | Filed herewith |
Pursuant to the requirements of Section 13 or 15(d) of the Exchange Act, the registrants have duly caused this report to be signed on their behalf by the undersigned, thereunto duly authorized.
PROLOGIS, INC. | |
|
|
By: | /s/ Thomas S. Olinger |
| Thomas S. Olinger |
| Chief Financial Officer |
|
|
By: | /s/ Lori A. Palazzolo |
| Lori A. Palazzolo |
| Managing Director and Chief Accounting Officer |
|
|
PROLOGIS, L.P. | |
By: | Prologis, Inc., its general partner |
|
|
By: | /s/ Thomas S. Olinger |
| Thomas S. Olinger |
| Chief Financial Officer |
|
|
By: | /s/ Lori A. Palazzolo |
| Lori A. Palazzolo |
| Managing Director and Chief Accounting Officer |
|
|
Date: July 26, 201723, 2018
Certain of the following documents are filed herewith. Certain other of the following documents that have been previously filed with the Securities and Exchange Commission and, pursuant to Rule 12-b-32, are incorporated herein by reference.
|
|
|
|
|
|
|
|
|
|
|
|
|
|
|
|
|
|
|
|
|
|
|
|
|
|
|
|
|
|
|
|
|
|
|
|
|
|
|
|
|
|
|
|
51
50