•our research and development, clinical trial and commercialization activities and projected expenditures;
•the further commercialization of Optune®, our first Tumor Treating Fields (“TTFields”) delivery system,Products for current and our other TTFields delivery system candidates;
•our business strategies and the expansion of our sales and marketing efforts in the United States and in other countries;
•the market acceptance of Optuneour Products for current and our other TTFields delivery systemsfuture indications by patients, physicians, third-party payers and others in the healthcare and scientific community;
•our plans to pursue the use of TTFieldsour Products for the treatment of other solid tumor cancers;
•our estimates regarding revenues, expenses, capital requirements and needs for additional financing;
•our ability to obtain regulatory approvals for additional indicationsthe use of our Products in cancers other than GBM and any future TTFields delivery systems;
•our ability to acquire from third-party suppliers the supplies needed to manufacture our TTFields delivery systems from third-party suppliers;
•our ability to manufacture adequate supply;
•our ability to secure and maintain adequate coverage from third-party payers to reimburse us for Optune orour Products for current and future TTFields delivery systems;
•our ability to maintain and develop our intellectual property position;
•our cash needs;
our ongoing legal proceedings and tax audits; and
•our prospects, financial condition and results of operations.
| ||||||||||||||
| Page | ||||||||||||||
| ||||||||||||||
| ||||||||||||||
| ||||||||||||||
| ||||||||||||||
| ||||||||||||||
| ||||||||||||||
| ||||||||||||||
| ||||||||||||||
| ||||||||||||||
| ||||||||||||||
| ||||||||||||||
-
NOVOCURE LIMITED AND SUBSIDIARIES
| NOVOCURE LIMITED AND SUBSIDIARIES CONSOLIDATED BALANCE SHEETS | ||||||||||||||||||||
| U.S. dollars in thousands | ||||||||||||||||||||
| September 30, 2019 | December 31, 2018 | |||||||||||||||||||
| Unaudited | Audited | |||||||||||||||||||
| ASSETS | ||||||||||||||||||||
| CURRENT ASSETS: | ||||||||||||||||||||
| Cash and cash equivalents | $ | 208,034 | $ | 140,622 | ||||||||||||||||
| Short-term investments | 104,565 | 105,256 | ||||||||||||||||||
| Restricted cash | 2,134 | 2,134 | ||||||||||||||||||
| Trade receivables | 49,904 | 36,523 | ||||||||||||||||||
| Receivables and prepaid expenses | 17,917 | 14,279 | ||||||||||||||||||
| Inventories | 24,388 | 22,555 | ||||||||||||||||||
| Total current assets | 406,942 | 321,369 | ||||||||||||||||||
| LONG-TERM ASSETS: | ||||||||||||||||||||
| Property and equipment, net | 8,425 | 8,442 | ||||||||||||||||||
| Field equipment, net | 8,139 | 6,924 | ||||||||||||||||||
| Right-of-use assets, net | 14,635 | — | ||||||||||||||||||
| Other long-term assets | 5,717 | 3,058 | ||||||||||||||||||
| Total long-term assets | 36,916 | 18,424 | ||||||||||||||||||
| TOTAL ASSETS | $ | 443,858 | $ | 339,793 | ||||||||||||||||
| The accompanying notes are an integral part of these unaudited consolidated financial statements. | ||||||||||||||||||||
U.S. dollars in thousands
|
| September 30, |
|
| December 31, |
| ||
|
| 2017 |
|
| 2016 |
| ||
|
| Unaudited |
|
| Audited |
| ||
ASSETS |
|
|
|
|
|
|
|
|
|
|
|
|
|
|
|
|
|
CURRENT ASSETS: |
|
|
|
|
|
|
|
|
Cash and cash equivalents |
| $ | 82,104 |
|
| $ | 99,780 |
|
Short-term investments |
|
| 104,453 |
|
|
| 119,854 |
|
Restricted cash |
|
| 2,129 |
|
|
| 267 |
|
Trade receivables |
|
| 23,000 |
|
|
| 6,339 |
|
Receivables and prepaid expenses |
|
| 5,559 |
|
|
| 10,084 |
|
Inventories |
|
| 24,642 |
|
|
| 25,549 |
|
Total current assets |
|
| 241,887 |
|
|
| 261,873 |
|
|
|
|
|
|
|
|
|
|
LONG-TERM ASSETS: |
|
|
|
|
|
|
|
|
Property and equipment, net |
|
| 9,361 |
|
|
| 9,812 |
|
Field equipment, net |
|
| 8,948 |
|
|
| 8,808 |
|
Severance pay fund |
|
| 104 |
|
|
| 88 |
|
Other long-term assets |
|
| 1,978 |
|
|
| 1,500 |
|
Total long-term assets |
|
| 20,391 |
|
|
| 20,208 |
|
|
|
|
|
|
|
|
|
|
TOTAL ASSETS |
| $ | 262,278 |
|
| $ | 282,081 |
|
| NOVOCURE LIMITED AND SUBSIDIARIES CONSOLIDATED BALANCE SHEETS | ||||||||||||||||||||
| U.S. dollars in thousands | ||||||||||||||||||||
| September 30, 2019 | December 31, 2018 | |||||||||||||||||||
| Unaudited | Audited | |||||||||||||||||||
| LIABILITIES AND SHAREHOLDERS' EQUITY | ||||||||||||||||||||
| CURRENT LIABILITIES: | ||||||||||||||||||||
| Trade payables | $ | 31,998 | $ | 26,708 | ||||||||||||||||
| Other payables, lease liabilities and accrued expenses | 48,407 | 37,852 | ||||||||||||||||||
| Total current liabilities | 80,405 | 64,560 | ||||||||||||||||||
| LONG-TERM LIABILITIES: | ||||||||||||||||||||
| Long-term loan, net of discount and issuance costs | 149,384 | 149,268 | ||||||||||||||||||
| Deferred revenue | 8,341 | 9,929 | ||||||||||||||||||
| Employee benefits | 3,701 | 2,683 | ||||||||||||||||||
| Long-term leases | 11,367 | — | ||||||||||||||||||
| Other long-term liabilities | 295 | 1,094 | ||||||||||||||||||
| Total long-term liabilities | 173,088 | 162,974 | ||||||||||||||||||
| TOTAL LIABILITIES | 253,493 | 227,534 | ||||||||||||||||||
| COMMITMENTS AND CONTINGENCIES | ||||||||||||||||||||
| SHAREHOLDERS' EQUITY: | ||||||||||||||||||||
| Share capital - | ||||||||||||||||||||
Ordinary shares no par value, unlimited shares authorized; issued and outstanding: 98,948,935 shares and 93,254,185 shares at September 30, 2019 (unaudited) and December 31, 2018, respectively | — | — | ||||||||||||||||||
| Additional paid-in capital | 848,151 | 757,314 | ||||||||||||||||||
| Accumulated other comprehensive income (loss) | (2,641) | (1,400) | ||||||||||||||||||
| Retained earnings (accumulated deficit) | (655,145) | (643,655) | ||||||||||||||||||
| TOTAL SHAREHOLDERS' EQUITY | 190,365 | 112,259 | ||||||||||||||||||
| TOTAL LIABILITIES AND SHAREHOLDERS' EQUITY | $ | 443,858 | $ | 339,793 | ||||||||||||||||
- 2 -
CONSOLIDATED BALANCE SHEETS
U.S. dollars in thousands (except share data)
|
| September 30, |
|
| December 31, |
| ||
|
| 2017 |
|
| 2016 |
| ||
|
| Unaudited |
|
| Audited |
| ||
LIABILITIES AND SHAREHOLDERS' EQUITY |
|
|
|
|
|
|
|
|
|
|
|
|
|
|
|
|
|
CURRENT LIABILITIES: |
|
|
|
|
|
|
|
|
Trade payables |
| $ | 14,143 |
|
| $ | 18,356 |
|
Other payables and accrued expenses |
|
| 26,842 |
|
|
| 18,526 |
|
Total current liabilities |
|
| 40,985 |
|
|
| 36,882 |
|
|
|
|
|
|
|
|
|
|
LONG-TERM LIABILITIES: |
|
|
|
|
|
|
|
|
Long-term loan, net of discount and issuance costs |
|
| 97,049 |
|
|
| 96,231 |
|
Employee benefit liabilities |
|
| 2,489 |
|
|
| 2,590 |
|
Other long-term liabilities |
|
| 5,070 |
|
|
| 4,033 |
|
Total long-term liabilities |
|
| 104,608 |
|
|
| 102,854 |
|
|
|
|
|
|
|
|
|
|
TOTAL LIABILITIES |
|
| 145,593 |
|
|
| 139,736 |
|
|
|
|
|
|
|
|
|
|
COMMITMENTS AND CONTINGENCIES |
|
|
|
|
|
|
|
|
|
|
|
|
|
|
|
|
|
SHAREHOLDERS' EQUITY: |
|
|
|
|
|
|
|
|
Share capital - |
|
| - |
|
|
| - |
|
Ordinary shares no par value, unlimited shares authorized; issued and outstanding: 89,355,679 shares and 87,066,446 shares at September 30, 2017 (unaudited) and December 31, 2016, respectively |
|
|
|
|
|
|
|
|
Additional paid-in capital |
|
| 689,460 |
|
|
| 664,154 |
|
Accumulated other comprehensive loss |
|
| (1,462 | ) |
|
| (1,883 | ) |
Accumulated deficit |
|
| (571,313 | ) |
|
| (519,926 | ) |
Total shareholders' equity |
|
| 116,685 |
|
|
| 142,345 |
|
|
|
|
|
|
|
|
|
|
TOTAL LIABILITIES AND SHAREHOLDERS' EQUITY |
| $ | 262,278 |
|
| $ | 282,081 |
|
| NOVOCURE LIMITED AND SUBSIDIARIES CONSOLIDATED STATEMENTS OF OPERATIONS | ||||||||||||||||||||||||||||||||||||||||||||||||||||||||
| U.S. dollars in thousands (except share and per share data) | ||||||||||||||||||||||||||||||||||||||||||||||||||||||||
| Three months ended September 30, | Nine months ended September 30, | Year ended December 31, | ||||||||||||||||||||||||||||||||||||||||||||||||||||||
| 2019 | 2018 | 2019 | 2018 | 2018 | ||||||||||||||||||||||||||||||||||||||||||||||||||||
| Unaudited | Unaudited | Audited | ||||||||||||||||||||||||||||||||||||||||||||||||||||||
| Net revenues | $ | 92,062 | $ | 64,756 | $ | 252,084 | $ | 178,395 | $ | 248,069 | ||||||||||||||||||||||||||||||||||||||||||||||
| Cost of revenues | 22,900 | 18,949 | 63,820 | 57,020 | 80,048 | |||||||||||||||||||||||||||||||||||||||||||||||||||
| Gross profit | 69,162 | 45,807 | 188,264 | 121,375 | 168,021 | |||||||||||||||||||||||||||||||||||||||||||||||||||
| Operating costs and expenses: | ||||||||||||||||||||||||||||||||||||||||||||||||||||||||
| Research, development and clinical trials | 18,766 | 13,074 | 55,262 | 35,540 | 50,574 | |||||||||||||||||||||||||||||||||||||||||||||||||||
| Sales and marketing | 23,830 | 19,124 | 69,871 | 56,455 | 77,663 | |||||||||||||||||||||||||||||||||||||||||||||||||||
| General and administrative | 22,711 | 18,855 | 64,198 | 54,388 | 73,456 | |||||||||||||||||||||||||||||||||||||||||||||||||||
| Total operating costs and expenses | 65,307 | 51,053 | 189,331 | 146,383 | 201,693 | |||||||||||||||||||||||||||||||||||||||||||||||||||
| Operating income (loss) | 3,855 | (5,246) | (1,067) | (25,008) | (33,672) | |||||||||||||||||||||||||||||||||||||||||||||||||||
| Financial expenses (income), net | 2,555 | 2,397 | 6,165 | 10,110 | 12,270 | |||||||||||||||||||||||||||||||||||||||||||||||||||
| Income (loss) before income taxes | 1,300 | (7,643) | (7,232) | (35,118) | (45,942) | |||||||||||||||||||||||||||||||||||||||||||||||||||
| Income taxes | (630) | 4,051 | 4,258 | 12,810 | 17,617 | |||||||||||||||||||||||||||||||||||||||||||||||||||
| Net income (loss) | $ | 1,930 | $ | (11,694) | $ | (11,490) | $ | (47,928) | $ | (63,559) | ||||||||||||||||||||||||||||||||||||||||||||||
| Basic net income (loss) per ordinary share | $ | 0.02 | $ | (0.13) | $ | (0.12) | $ | (0.52) | $ | (0.69) | ||||||||||||||||||||||||||||||||||||||||||||||
| Weighted average number of ordinary shares used in computing basic net income (loss) per share | 98,485,519 | 92,911,375 | 96,551,041 | 91,409,619 | 91,828,043 | |||||||||||||||||||||||||||||||||||||||||||||||||||
| Diluted net income (loss) per ordinary share | $ | 0.02 | $ | (0.13) | $ | (0.12) | $ | (0.52) | $ | (0.69) | ||||||||||||||||||||||||||||||||||||||||||||||
| Weighted average number of ordinary shares used in computing diluted net income (loss) per share | 107,604,578 | 92,911,375 | 96,551,041 | 91,409,619 | 91,828,043 | |||||||||||||||||||||||||||||||||||||||||||||||||||
| CONSOLIDATED STATEMENTS OF COMPREHENSIVE INCOME (LOSS) | ||||||||||||||||||||||||||||||||||||||||||||||||||||||||
| U.S. dollars in thousands | ||||||||||||||||||||||||||||||||||||||||||||||||||||||||
| Three months ended September 30, | Nine months ended September 30, | Year ended December 31, | ||||||||||||||||||||||||||||||||||||||||||||||||||||||
| 2019 | 2018 | 2019 | 2018 | 2018 | ||||||||||||||||||||||||||||||||||||||||||||||||||||
| Unaudited | Unaudited | Audited | ||||||||||||||||||||||||||||||||||||||||||||||||||||||
| Net income (loss) | $ | 1,930 | $ | (11,694) | $ | (11,490) | $ | (47,928) | $ | (63,559) | ||||||||||||||||||||||||||||||||||||||||||||||
| Other comprehensive income (loss), net of tax: | ||||||||||||||||||||||||||||||||||||||||||||||||||||||||
| Change in foreign currency translation adjustments | (216) | (2) | (430) | 19 | 27 | |||||||||||||||||||||||||||||||||||||||||||||||||||
| Pension benefit plan | (68) | 147 | (811) | 197 | (84) | |||||||||||||||||||||||||||||||||||||||||||||||||||
| Total comprehensive income (loss) | $ | 1,646 | $ | (11,549) | $ | (12,731) | $ | (47,712) | $ | (63,616) | ||||||||||||||||||||||||||||||||||||||||||||||
- 3 -
| NOVOCURE LIMITED AND SUBSIDIARIES CONSOLIDATED STATEMENTS OF CHANGES IN SHAREHOLDERS’ EQUITY | ||||||||||||||||||||||||||||||||||||||||||||||||||||||||
| U.S. dollars in thousands (except share data) | ||||||||||||||||||||||||||||||||||||||||||||||||||||||||
| Ordinary shares | Additional paid-in capital | Accumulated other comprehensive loss | Retained earnings (accumulated deficit) | Total shareholders' equity | ||||||||||||||||||||||||||||||||||||||||||||||||||||
| Balance as of December 31, 2018 (audited) | 93,254,185 | $ | 757,314 | $ | (1,400) | $ | (643,655) | $ | 112,259 | |||||||||||||||||||||||||||||||||||||||||||||||
| Share-based compensation to employees | — | 9,649 | — | — | 9,649 | |||||||||||||||||||||||||||||||||||||||||||||||||||
| Exercise of options and warrants and vested RSUs | 2,438,612 | 16,978 | — | — | 16,978 | |||||||||||||||||||||||||||||||||||||||||||||||||||
| Other comprehensive income (loss), net of tax benefit of $11 | — | — | (342) | — | (342) | |||||||||||||||||||||||||||||||||||||||||||||||||||
| Net income (loss) | — | — | — | (12,150) | (12,150) | |||||||||||||||||||||||||||||||||||||||||||||||||||
| Balance as of March 31, 2019 (unaudited) | 95,692,797 | $ | 783,941 | $ | (1,742) | $ | (655,805) | $ | 126,394 | |||||||||||||||||||||||||||||||||||||||||||||||
| Share-based compensation to employees | — | 13,732 | — | — | 13,732 | |||||||||||||||||||||||||||||||||||||||||||||||||||
| Proceeds from issuance of shares | 43,421 | 1,208 | — | — | 1,208 | |||||||||||||||||||||||||||||||||||||||||||||||||||
| Exercise of options and warrants and vested RSUs | 2,122,658 | 19,457 | — | — | 19,457 | |||||||||||||||||||||||||||||||||||||||||||||||||||
| Other comprehensive income (loss), net of tax benefit of $69 | — | — | (615) | — | (615) | |||||||||||||||||||||||||||||||||||||||||||||||||||
| Net income (loss) | — | — | — | (1,270) | (1,270) | |||||||||||||||||||||||||||||||||||||||||||||||||||
| Balance as of June 30, 2019 (unaudited) | 97,858,876 | $ | 818,338 | $ | (2,357) | $ | (657,075) | $ | 158,906 | |||||||||||||||||||||||||||||||||||||||||||||||
| Share-based compensation to employees | — | 14,338 | — | — | 14,338 | |||||||||||||||||||||||||||||||||||||||||||||||||||
| Proceeds from issuance of shares | — | — | — | — | — | |||||||||||||||||||||||||||||||||||||||||||||||||||
| Exercise of options and warrants and vested RSUs | 1,090,059 | 15,475 | — | — | 15,475 | |||||||||||||||||||||||||||||||||||||||||||||||||||
| Other comprehensive income (loss), net of tax benefit of $11 | — | — | (284) | — | (284) | |||||||||||||||||||||||||||||||||||||||||||||||||||
| Net income (loss) | — | — | — | 1,930 | 1,930 | |||||||||||||||||||||||||||||||||||||||||||||||||||
| Balance as of September 30, 2019 (unaudited) | 98,948,935 | $ | 848,151 | $ | (2,641) | $ | (655,145) | $ | 190,365 | |||||||||||||||||||||||||||||||||||||||||||||||
U.S. dollars in thousands (except share and per share data)
|
| Three months ended September 30, |
|
| Nine months ended September 30, |
|
| Year ended December 31, |
| |||||||||||
|
| 2017 |
|
| 2016 |
|
| 2017 |
|
| 2016 |
|
| 2016 |
| |||||
|
| Unaudited |
|
| Unaudited |
|
| Audited |
| |||||||||||
Net revenues |
| $ | 50,109 |
|
| $ | 21,674 |
|
| $ | 123,365 |
|
| $ | 52,646 |
|
| $ | 82,888 |
|
Cost of revenues |
|
| 15,153 |
|
|
| 11,118 |
|
|
| 39,969 |
|
|
| 28,897 |
|
|
| 39,870 |
|
Impairment of field equipment |
|
| - |
|
|
| - |
|
|
| - |
|
|
| 6,412 |
|
|
| 6,412 |
|
|
|
|
|
|
|
|
|
|
|
|
|
|
|
|
|
|
|
|
|
|
Gross profit |
|
| 34,956 |
|
|
| 10,556 |
|
|
| 83,396 |
|
|
| 17,337 |
|
|
| 36,606 |
|
|
|
|
|
|
|
|
|
|
|
|
|
|
|
|
|
|
|
|
|
|
Operating costs and expenses: |
|
|
|
|
|
|
|
|
|
|
|
|
|
|
|
|
|
|
|
|
Research, development and clinical trials |
|
| 9,273 |
|
|
| 10,233 |
|
|
| 28,055 |
|
|
| 32,996 |
|
|
| 41,467 |
|
Sales and marketing |
|
| 16,387 |
|
|
| 15,865 |
|
|
| 47,503 |
|
|
| 43,771 |
|
|
| 59,449 |
|
General and administrative |
|
| 15,215 |
|
|
| 12,723 |
|
|
| 42,660 |
|
|
| 38,010 |
|
|
| 51,007 |
|
|
|
|
|
|
|
|
|
|
|
|
|
|
|
|
|
|
|
|
|
|
Total operating costs and expenses |
|
| 40,875 |
|
|
| 38,821 |
|
|
| 118,218 |
|
|
| 114,777 |
|
|
| 151,923 |
|
|
|
|
|
|
|
|
|
|
|
|
|
|
|
|
|
|
|
|
|
|
Operating loss |
|
| (5,919 | ) |
|
| (28,265 | ) |
|
| (34,822 | ) |
|
| (97,440 | ) |
|
| (115,317 | ) |
Financial expenses, net |
|
| 2,156 |
|
|
| 2,189 |
|
|
| 6,785 |
|
|
| 3,293 |
|
|
| 6,147 |
|
|
|
|
|
|
|
|
|
|
|
|
|
|
|
|
|
|
|
|
|
|
Loss before income tax expense |
|
| (8,075 | ) |
|
| (30,454 | ) |
|
| (41,607 | ) |
|
| (100,733 | ) |
|
| (121,464 | ) |
Income tax expense |
|
| 3,423 |
|
|
| 3,174 |
|
|
| 9,110 |
|
|
| 8,944 |
|
|
| 10,381 |
|
|
|
|
|
|
|
|
|
|
|
|
|
|
|
|
|
|
|
|
|
|
Net loss |
| $ | (11,498 | ) |
| $ | (33,628 | ) |
| $ | (50,717 | ) |
| $ | (109,677 | ) |
| $ | (131,845 | ) |
|
|
|
|
|
|
|
|
|
|
|
|
|
|
|
|
|
|
|
|
|
Basic and diluted net loss per ordinary share |
| $ | (0.13 | ) |
| $ | (0.39 | ) |
| $ | (0.57 | ) |
| $ | (1.29 | ) |
| $ | (1.54 | ) |
|
|
|
|
|
|
|
|
|
|
|
|
|
|
|
|
|
|
|
|
|
Weighted average number of ordinary shares used in computing basic and diluted net loss per share |
|
| 89,125,646 |
|
|
| 85,774,874 |
|
|
| 88,265,835 |
|
|
| 85,153,644 |
|
|
| 85,558,448 |
|
| Ordinary shares | Additional paid-in capital | Accumulated other comprehensive loss | Retained earnings (accumulated deficit) | Total shareholders' equity | |||||||||||||||||||||||||
| Balance as of December 31, 2017 (audited) | 89,478,032 | $ | 697,165 | $ | (1,343) | $ | (582,258) | $ | 113,564 | ||||||||||||||||||||
| Share-based compensation to employees | — | 8,520 | — | — | 8,520 | ||||||||||||||||||||||||
| Exercise of options and warrants and vested RSUs | 920,869 | 2,581 | — | — | 2,581 | ||||||||||||||||||||||||
| Cumulative effect adjustment on retained earnings (*) | — | — | — | 2,162 | 2,162 | ||||||||||||||||||||||||
| Other comprehensive income (loss), net of tax benefit of $5 | — | — | 15 | — | 15 | ||||||||||||||||||||||||
| Net income (loss) | — | — | — | (20,724) | (20,724) | ||||||||||||||||||||||||
| Balance as of March 31, 2018 (unaudited) | 90,398,901 | $ | 708,266 | $ | (1,328) | $ | (600,820) | $ | 106,118 | ||||||||||||||||||||
| Share-based compensation to employees | — | 10,206 | — | — | 10,206 | ||||||||||||||||||||||||
| Proceeds from issuance of shares | 54,386 | 938 | — | — | 938 | ||||||||||||||||||||||||
| Exercise of options and warrants and vested RSUs | 2,049,986 | 10,274 | — | — | 10,274 | ||||||||||||||||||||||||
| Other comprehensive income (loss), net of tax benefit of $3 | — | — | 55 | — | 55 | ||||||||||||||||||||||||
| Net income (loss) | — | — | — | (15,510) | (15,510) | ||||||||||||||||||||||||
| Balance as of June 30, 2018 (unaudited) | 92,503,273 | $ | 729,684 | $ | (1,273) | $ | (616,330) | $ | 112,081 | ||||||||||||||||||||
| Share-based compensation to employees | — | 10,479 | — | — | 10,479 | ||||||||||||||||||||||||
| Proceeds from issuance of shares | — | — | — | — | — | ||||||||||||||||||||||||
| Exercise of options and warrants and vested RSUs | 504,571 | 3,924 | — | — | 3,924 | ||||||||||||||||||||||||
| Other comprehensive income (loss), net of tax benefit of $11 | — | — | 146 | — | 146 | ||||||||||||||||||||||||
| Net income (loss) | — | — | — | (11,694) | (11,694) | ||||||||||||||||||||||||
| Balance as of September 30, 2018 (unaudited) | 93,007,844 | $ | 744,087 | $ | (1,127) | $ | (628,024) | $ | 114,936 | ||||||||||||||||||||
CONSOLIDATED STATEMENTS OF COMPREHENSIVE INCOME (LOSS)
U.S. dollars in thousands
|
| Three months ended September 30, |
|
| Nine months ended September 30, |
|
| Year ended December 31, |
| |||||||||||
|
| 2017 |
|
| 2016 |
|
| 2017 |
|
| 2016 |
|
| 2016 |
| |||||
|
| Unaudited |
|
| Unaudited |
|
| Audited |
| |||||||||||
Net loss |
| $ | (11,498 | ) |
| $ | (33,628 | ) |
| $ | (50,717 | ) |
| $ | (109,677 | ) |
| $ | (131,845 | ) |
Other comprehensive income (loss), net of tax : |
|
|
|
|
|
|
|
|
|
|
|
|
|
|
|
|
|
|
|
|
Change in foreign currency translation adjustments |
|
| (2 | ) |
|
| 8 |
|
|
| 8 |
|
|
| 64 |
|
|
| 10 |
|
Pension benefit plan |
|
| 279 |
|
|
| (409 | ) |
|
| 413 |
|
|
| (644 | ) |
|
| (388 | ) |
Total comprehensive loss |
| $ | (11,221 | ) |
| $ | (34,029 | ) |
| $ | (50,296 | ) |
|
| (110,257 | ) |
| $ | (132,223 | ) |
- 4 -
| NOVOCURE LIMITED AND SUBSIDIARIES CONSOLIDATED STATEMENTS OF CASH FLOWS | ||||||||||||||||||||||||||||||||||||||||||||||||||||||||
| U.S. dollars in thousands | ||||||||||||||||||||||||||||||||||||||||||||||||||||||||
| Three months ended September 30, | Nine months ended September 30, | Year ended December 31, | ||||||||||||||||||||||||||||||||||||||||||||||||||||||
| 2019 | 2018 | 2019 | 2018 | 2018 | ||||||||||||||||||||||||||||||||||||||||||||||||||||
| Unaudited | Unaudited | Audited | ||||||||||||||||||||||||||||||||||||||||||||||||||||||
| Cash flows from operating activities: | ||||||||||||||||||||||||||||||||||||||||||||||||||||||||
| Net income (loss) | $ | 1,930 | $ | (11,694) | $ | (11,490) | $ | (47,928) | $ | (63,559) | ||||||||||||||||||||||||||||||||||||||||||||||
| Adjustments to reconcile net loss to net cash provided by (used in) operating activities: | ||||||||||||||||||||||||||||||||||||||||||||||||||||||||
| Depreciation and amortization | 1,932 | 2,311 | 5,993 | 6,801 | 9,006 | |||||||||||||||||||||||||||||||||||||||||||||||||||
| Asset write-downs and impairment of field equipment | 78 | 178 | 239 | 320 | 407 | |||||||||||||||||||||||||||||||||||||||||||||||||||
| Amortization of discount (premium) | (547) | (555) | (1,712) | 1,502 | 1,022 | |||||||||||||||||||||||||||||||||||||||||||||||||||
| Share-based compensation to employees | 14,338 | 10,479 | 37,719 | 29,205 | 39,846 | |||||||||||||||||||||||||||||||||||||||||||||||||||
| Decrease (increase) in accounts receivables | (9,986) | 3,577 | (17,020) | (4,805) | (10,325) | |||||||||||||||||||||||||||||||||||||||||||||||||||
| Decrease (increase) in inventories | 1,067 | (1,735) | (1,832) | 385 | (529) | |||||||||||||||||||||||||||||||||||||||||||||||||||
| Increase (decrease) in accounts payables and accrued expenses | 6,433 | 2,839 | 10,902 | (2,760) | 13,713 | |||||||||||||||||||||||||||||||||||||||||||||||||||
| Decrease (increase) in other long-term assets | 1,069 | 155 | 1,151 | (743) | (949) | |||||||||||||||||||||||||||||||||||||||||||||||||||
| Increase (decrease) in other long-term liabilities | (1,407) | 83 | (4,292) | (656) | 9,503 | |||||||||||||||||||||||||||||||||||||||||||||||||||
| Net cash provided by (used in) operating activities | $ | 14,907 | $ | 5,638 | $ | 19,658 | $ | (18,679) | $ | (1,865) | ||||||||||||||||||||||||||||||||||||||||||||||
| Cash flows from investing activities: | ||||||||||||||||||||||||||||||||||||||||||||||||||||||||
| Purchase of property, equipment and field equipment | $ | (2,708) | $ | (1,353) | $ | (7,430) | $ | (4,918) | $ | (6,711) | ||||||||||||||||||||||||||||||||||||||||||||||
| Proceeds from maturity of short-term investments | 105,000 | 45,000 | 315,661 | 150,000 | 255,000 | |||||||||||||||||||||||||||||||||||||||||||||||||||
| Purchase of short-term investments | (104,466) | (44,652) | (313,142) | (148,786) | (253,782) | |||||||||||||||||||||||||||||||||||||||||||||||||||
| Net cash provided by (used in) investing activities | $ | (2,174) | $ | (1,005) | $ | (4,911) | $ | (3,704) | $ | (5,493) | ||||||||||||||||||||||||||||||||||||||||||||||
| Cash flows from financing activities: | ||||||||||||||||||||||||||||||||||||||||||||||||||||||||
| Proceeds from issuance of shares, net | $ | — | $ | — | $ | 1,208 | $ | 938 | $ | 1,835 | ||||||||||||||||||||||||||||||||||||||||||||||
| Proceeds from long-term loan, net | — | — | — | 149,150 | 149,150 | |||||||||||||||||||||||||||||||||||||||||||||||||||
| Repayment of long-term loan | (7) | (22) | (23) | (100,063) | (100,084) | |||||||||||||||||||||||||||||||||||||||||||||||||||
| Exercise of options and warrants | 15,475 | 3,924 | 51,910 | 16,779 | 18,468 | |||||||||||||||||||||||||||||||||||||||||||||||||||
| Net cash provided by (used in) financing activities | $ | 15,468 | $ | 3,902 | $ | 53,095 | $ | 66,804 | $ | 69,369 | ||||||||||||||||||||||||||||||||||||||||||||||
| Effect of foreign currency translation | $ | (216) | $ | (2) | $ | (430) | $ | 19 | $ | 27 | ||||||||||||||||||||||||||||||||||||||||||||||
| Increase (decrease) in cash, cash equivalents and restricted cash | 27,985 | 8,533 | 67,412 | 44,440 | 62,038 | |||||||||||||||||||||||||||||||||||||||||||||||||||
| Cash, cash equivalents and restricted cash at the beginning of the period | 182,183 | 116,625 | 142,756 | 80,718 | 80,718 | |||||||||||||||||||||||||||||||||||||||||||||||||||
| Cash, cash equivalents and restricted cash at the end of the period | $ | 210,168 | $ | 125,158 | $ | 210,168 | $ | 125,158 | $ | 142,756 | ||||||||||||||||||||||||||||||||||||||||||||||
U.S. dollars in thousands (except share data)
|
| Ordinary shares |
|
|
| Additional paid-in |
|
| Accumulated other comprehensive |
|
| Accumulated |
|
| Total shareholders' |
| |||||
|
| Shares |
|
|
| capital |
|
| loss |
|
| deficit |
|
| equity |
| |||||
|
|
|
|
|
|
|
|
|
|
|
|
|
|
|
|
|
|
|
|
|
|
Balance as of December 31, 2015 (audited) |
|
| 83,778,581 |
|
|
| $ | 640,406 |
|
| $ | (1,505 | ) |
| $ | (388,081 | ) |
| $ | 250,820 |
|
Share-based compensation to employees |
|
| - |
|
|
|
| 21,441 |
|
|
| - |
|
|
| - |
|
|
| 21,441 |
|
Exercise of options and warrants |
|
| 3,195,477 |
|
|
|
| 993 |
|
|
| - |
|
|
| - |
|
|
| 993 |
|
Issuance of shares in connection with employee stock purchase plan |
|
| 92,388 |
|
|
|
| 616 |
|
|
| - |
|
|
| - |
|
|
| 616 |
|
Tax benefit from share-based award activity |
|
| - |
|
|
|
| 698 |
|
|
| - |
|
|
| - |
|
|
| 698 |
|
Other comprehensive loss, net of tax benefit of $38 |
|
| - |
|
|
|
| - |
|
|
| (378 | ) |
|
| - |
|
|
| (378 | ) |
Net loss |
|
| - |
|
|
|
| - |
|
|
| - |
|
|
| (131,845 | ) |
|
| (131,845 | ) |
Balance as of December 31, 2016 (audited) |
|
| 87,066,446 |
|
|
| $ | 664,154 |
|
| $ | (1,883 | ) |
| $ | (519,926 | ) |
| $ | 142,345 |
|
|
|
|
|
|
|
|
|
|
|
|
|
|
|
|
|
|
|
|
|
|
|
Share-based compensation to employees |
|
| - |
|
|
|
| 20,760 |
|
|
| - |
|
|
| - |
|
|
| 20,760 |
|
Exercise of options and warrants |
|
| 2,172,266 |
|
|
|
| 3,095 |
|
|
| - |
|
|
| - |
|
|
| 3,095 |
|
Cumulative effect adjustment resulting from ASU 2016-09 adoption (see Note 1) |
|
| - |
|
|
|
| 670 |
|
|
| - |
|
|
| (670 | ) |
|
| - |
|
Issuance of shares in connection with employee stock purchase plan |
|
| 116,967 |
|
|
|
| 781 |
|
|
| - |
|
|
| - |
|
|
| 781 |
|
Other comprehensive income, net of tax benefit of $57 |
|
| - |
|
|
|
| - |
|
|
| 421 |
|
|
| - |
|
|
| 421 |
|
Net loss |
|
| - |
|
|
|
| - |
|
|
| - |
|
|
| (50,717 | ) |
|
| (50,717 | ) |
Balance as of September 30, 2017 (unaudited) |
|
| 89,355,679 |
|
|
| $ | 689,460 |
|
| $ | (1,462 | ) |
| $ | (571,313 | ) |
| $ | 116,685 |
|
| NOVOCURE LIMITED AND SUBSIDIARIES CONSOLIDATED STATEMENTS OF CASH FLOWS | ||||||||||||||||||||||||||||||||||||||||||||||||||||||||
| U.S. dollars in thousands | ||||||||||||||||||||||||||||||||||||||||||||||||||||||||
| Three months ended September 30, | Nine months ended September 30, | Year ended December 31, | ||||||||||||||||||||||||||||||||||||||||||||||||||||||
| 2019 | 2018 | 2019 | 2018 | 2018 | ||||||||||||||||||||||||||||||||||||||||||||||||||||
| Unaudited | Unaudited | Audited | ||||||||||||||||||||||||||||||||||||||||||||||||||||||
| Supplemental cash flow activities: | ||||||||||||||||||||||||||||||||||||||||||||||||||||||||
| Cash paid during the period for: | ||||||||||||||||||||||||||||||||||||||||||||||||||||||||
| Income taxes | $ | 3,040 | $ | 4,145 | $ | 10,431 | $ | 16,159 | $ | 20,350 | ||||||||||||||||||||||||||||||||||||||||||||||
| Interest | $ | 3,453 | $ | 3,454 | $ | 10,247 | $ | 9,879 | $ | 13,334 | ||||||||||||||||||||||||||||||||||||||||||||||
| Non-cash activities in accordance with of ASC-842: | ||||||||||||||||||||||||||||||||||||||||||||||||||||||||
| Right-of-use assets obtained in exchange for lease obligations | $ | 1,062 | — | $ | 18,335 | — | — | |||||||||||||||||||||||||||||||||||||||||||||||||
- 5 -
|
| Three months ended September 30, |
|
| Nine months ended September 30, |
|
| Year ended December 31, |
| |||||||||||
|
| 2017 |
|
| 2016 |
|
| 2017 |
|
| 2016 |
|
| 2016 |
| |||||
|
| Unaudited |
|
| Unaudited |
|
| Audited |
| |||||||||||
Cash flows from operating activities: |
|
|
|
|
|
|
|
|
|
|
|
|
|
|
|
|
|
|
|
|
Net loss |
| $ | (11,498 | ) |
| $ | (33,628 | ) |
| $ | (50,717 | ) |
| $ | (109,677 | ) |
| $ | (131,845 | ) |
Adjustments to reconcile net loss to net cash provided by (used in) operating activities: |
|
|
|
|
|
|
|
|
|
|
|
|
|
|
|
|
|
|
|
|
Depreciation and amortization |
|
| 2,053 |
|
|
| 1,553 |
|
|
| 5,524 |
|
|
| 4,063 |
|
|
| 5,652 |
|
Asset write-downs and impairment of field equipment |
|
| 72 |
|
|
| 10 |
|
|
| 206 |
|
|
| 6,440 |
|
|
| 6,446 |
|
Increase in accrued interest expense |
|
| - |
|
|
| 222 |
|
|
| - |
|
|
| 222 |
|
|
| - |
|
Share-based compensation to employees |
|
| 8,629 |
|
|
| 5,626 |
|
|
| 20,760 |
|
|
| 16,719 |
|
|
| 22,139 |
|
Excess tax benefits from share-based award activity |
|
| - |
|
|
| - |
|
|
| - |
|
|
| - |
|
|
| (698 | ) |
Increase in trade receivables |
|
| (9,112 | ) |
|
| - |
|
|
| (16,661 | ) |
|
| - |
|
|
| (6,339 | ) |
Amortization of discount |
|
| 17 |
|
|
| 81 |
|
|
| 226 |
|
|
| 25 |
|
|
| 155 |
|
Decrease (increase) in receivables and prepaid expenses |
|
| 5,986 |
|
|
| 694 |
|
|
| 4,525 |
|
|
| (1,514 | ) |
|
| 243 |
|
Decrease (increase) in inventories |
|
| 504 |
|
|
| (2,757 | ) |
|
| 907 |
|
|
| (10,378 | ) |
|
| (11,955 | ) |
Increase in other long-term assets |
|
| (238 | ) |
|
| (526 | ) |
|
| (532 | ) |
|
| (804 | ) |
|
| (692 | ) |
Increase (decrease) in trade payables |
|
| 983 |
|
|
| (6,765 | ) |
|
| (4,213 | ) |
|
| (2,621 | ) |
|
| 1,601 |
|
Increase in other payables and accrued expenses |
|
| 4,830 |
|
|
| 1,651 |
|
|
| 8,308 |
|
|
| 2,407 |
|
|
| 6,647 |
|
Increase in employee benefit liabilities, net |
|
| 113 |
|
|
| 80 |
|
|
| 352 |
|
|
| 350 |
|
|
| 97 |
|
Increase in other long-term liabilities |
|
| 208 |
|
|
| 263 |
|
|
| 1,079 |
|
|
| 901 |
|
|
| 957 |
|
Net cash provided by (used in) operating activities |
| $ | 2,547 |
|
| $ | (33,496 | ) |
| $ | (30,236 | ) |
| $ | (93,867 | ) |
| $ | (107,592 | ) |
|
|
|
|
|
|
|
|
|
|
|
|
|
|
|
|
|
|
|
|
|
Cash flows from investing activities: |
|
|
|
|
|
|
|
|
|
|
|
|
|
|
|
|
|
|
|
|
Purchase of property and equipment |
| $ | (544 | ) |
| $ | (1,715 | ) |
| $ | (1,951 | ) |
| $ | (5,055 | ) |
| $ | (5,674 | ) |
Purchase of field equipment |
|
| (1,208 | ) |
|
| (3,113 | ) |
|
| (3,469 | ) |
|
| (9,213 | ) |
|
| (11,990 | ) |
Decrease (increase) in restricted cash |
|
| (592 | ) |
|
| 27 |
|
|
| (1,861 | ) |
|
| 15 |
|
|
| (180 | ) |
Proceeds from maturity of short-term investments |
|
| - |
|
|
| 120,000 |
|
|
| 120,000 |
|
|
| 270,000 |
|
|
| 270,000 |
|
Purchase of short-term investments |
|
| - |
|
|
| (119,613 | ) |
|
| (104,006 | ) |
|
| (239,341 | ) |
|
| (239,341 | ) |
Net cash provided by (used in) investing activities |
| $ | (2,344 | ) |
| $ | (4,414 | ) |
| $ | 8,713 |
|
| $ | 16,406 |
|
| $ | 12,815 |
|
|
|
|
|
|
|
|
|
|
|
|
|
|
|
|
|
|
|
|
|
|
Cash flows from financing activities: |
|
|
|
|
|
|
|
|
|
|
|
|
|
|
|
|
|
|
|
|
Proceeds from issuance of shares, net |
| $ | - |
|
| $ | - |
|
| $ | 781 |
|
| $ | - |
|
| $ | 616 |
|
Proceeds from long-term loan, net |
|
| - |
|
|
| 72,870 |
|
|
| 19 |
|
|
| 72,887 |
|
|
| 72,887 |
|
Excess tax benefits from share-based award activity |
|
| - |
|
|
| - |
|
|
| - |
|
|
| - |
|
|
| 698 |
|
Repayment of other long-term loan |
|
| (19 | ) |
|
| (17 | ) |
|
| (56 | ) |
|
| (52 | ) |
|
| (70 | ) |
Exercise of options and warrants |
|
| 1,732 |
|
|
| - |
|
|
| 3,095 |
|
|
| 961 |
|
|
| 993 |
|
Net cash provided by financing activities |
| $ | 1,713 |
|
| $ | 72,853 |
|
| $ | 3,839 |
|
| $ | 73,796 |
|
| $ | 75,124 |
|
|
|
|
|
|
|
|
|
|
|
|
|
|
|
|
|
|
|
|
|
|
Effect of exchange rate changes on cash and cash equivalents |
| $ | (2 | ) |
| $ | 8 |
|
| $ | 8 |
|
| $ | 64 |
|
| $ | 10 |
|
|
|
|
|
|
|
|
|
|
|
|
|
|
|
|
|
|
|
|
|
|
Increase (decrease) in cash and cash equivalents |
|
| 1,914 |
|
|
| 34,951 |
|
|
| (17,676 | ) |
|
| (3,601 | ) |
|
| (19,643 | ) |
Cash and cash equivalents at the beginning of the period |
|
| 80,190 |
|
|
| 80,871 |
|
|
| 99,780 |
|
|
| 119,423 |
|
|
| 119,423 |
|
|
|
|
|
|
|
|
|
|
|
|
|
|
|
|
|
|
|
|
|
|
Cash and cash equivalents at the end of the period |
| $ | 82,104 |
|
| $ | 115,822 |
|
| $ | 82,104 |
|
| $ | 115,822 |
|
| $ | 99,780 |
|
|
|
|
|
|
|
|
|
|
|
|
|
|
|
|
|
|
|
|
|
|
Supplemental cash flow activities: |
|
|
|
|
|
|
|
|
|
|
|
|
|
|
|
|
|
|
|
|
Cash paid during the period for: |
|
|
|
|
|
|
|
|
|
|
|
|
|
|
|
|
|
|
|
|
Income taxes |
| $ | 2,335 |
|
| $ | 4,624 |
|
| $ | 7,237 |
|
| $ | 7,793 |
|
| $ | 9,447 |
|
Interest |
| $ | 2,561 |
|
| $ | 1,880 |
|
| $ | 7,603 |
|
| $ | 3,813 |
|
| $ | 6,595 |
|
The accompanying notes are an integral part of these unaudited consolidated financial statements.
- 6 -
NOVOCURE LIMITED AND SUBSIDIARIES
NOTES TO UNAUDITED CONSOLIDATED FINANCIAL STATEMENTS
GBM. The Company also has received FDA approval under the Humanitarian Device Exemption pathway to market NovoTTF-100L for unresectable, locally advanced or metastatic MPM in combination with standard chemotherapies.
28, 2019.
Recent Accounting Pronouncements. In May 2014, FASB issued ASU 2014-09, Revenue from Contracts with CustomersNo. 2016-02, “Leases (Topic 606) (ASU 2014-09)842)”, which amends the existing accounting standards for revenue recognition. In August 2015, the FASB issued ASU No. 2015-14, Revenue from Contracts with Customers (Topic 606): Deferral of the Effective Date, which delays the effective date of ASU 2014-09 by one year. The Company is currently evaluating the requirements of the new standardlease accounting, requiring lessees to insure that it has processes, systems and internal controls in place to collect the necessary information to implement the standard, which will be effective as of January 1, 2018. Currently, the Company anticipates using a portfolio approach to apply the standard to portfolios of contracts with similar characteristics and anticipates that it will apply the cumulative catch-up transition method which requires the application of the provisions of the new standard as of the date of adoption with the cumulative effect of the retrospective application of the provisions as an adjustment through retained earnings. While the Company is still in the process of completing its assessmentrecognize most leases on the impact this guidance will have on its consolidated financial statements and related disclosures, the Company does not anticipate that the adoption of this standard will have a material impact on its financial position, results of operations or cash flows.
In April 2016, FASB issued ASU 2016-10, Revenue from Contracts with Customers (Topic 606): Identifying Performance Obligations and Licensing. ASU 2016-10 covers two specific topics: performance obligations and licensing. This amendment includes guidance on immaterial promised goods or services, shipping or handling activities, separately identifiable performance obligations, functional or symbolic intellectual property licenses, sales-based and usage-based royalties, license restrictions (time, use, geographical) and licensing renewals. In addition, in May 2016, FASB issued ASU No. 2016-12, Revenue from Contracts with Customers (Topic 606): Narrow-Scope Improvements and Practical Expedients, which is intended to not change the core principle of the guidance in Topic 606, but rather affect only the narrow aspects of Topic 606 by reducing the potential for diversity in practice at initial application and by reducing the cost and complexity of applying Topic 606 both at transition and on an ongoing basis. The Company is currently evaluating the impact of the adoption of both revenue standards on its consolidated financial statements.
In February 2016, FASB issued ASU 2016-02-Leases (ASC 842), which sets out the principles for the recognition, measurement, presentation and disclosure of leases for both parties to a contract (i.e. lessees and lessors).their balance sheets. The new standard establishes a right-of-use model that requires lesseesa lessee to apply
- 7 -
a dual approach, classifying leases as either finance or operating leases based on the principle of whether or not the lease is effectively a financed purchase by the lessee. This classification will determine whether lease expense is recognized based on an effective interest method or on a straight line basis over the term of the lease, respectively. A lessee is also required to recordrecognize a right-of-use asset and a lease liability on the balance sheet for all leases with a term of greaterlonger than twelve months regardless of their classification.12 months. Leases with a term of twelve months or less will be accounted for similar to existing guidance for operating leases. The new standard requires lessors to account for leases using an approach that is substantially equivalent to existing guidance for sales-type leases, direct financing leases and operating leases. ASC 842 supersedes the previous leases standard, ASC 840.classified as finance or operating. The standard is effective on January 1, 2019,for interim and annual reporting periods beginning after December 15, 2018.
In May 2017, FASB issued ASU 2017-09, Compensation-Stock Compensation (Topic 718) Scopestatements for the three and nine months ended September 30, 2019 are presented under the new standard, while comparative year and other periods presented are not adjusted and continue to be reported in accordance with Topic 840, Leases.
| September 30, 2019 | December 31, 2018 | ||||||||||
| Unaudited | Audited | ||||||||||
| Cash | $ | 5,851 | $ | 9,197 | |||||||
| Money market funds | 202,183 | 131,425 | |||||||||
| Total cash and cash equivalents | $ | 208,034 | $ | 140,622 | |||||||
| September 30, 2019 | December 31, 2018 | ||||||||||
| Unaudited | Audited | ||||||||||
| Short-term investments | $ | 104,565 | $ | 105,256 | |||||||
|
| September 30, |
|
| December 31, |
| |||||||||||||
|
| 2017 |
|
| 2016 |
| September 30, 2019 | December 31, 2018 | |||||||||||
|
| Unaudited |
|
| Audited |
| Unaudited | Audited | |||||||||||
Raw materials |
| $ | 5,936 |
|
| $ | 5,243 |
| Raw materials | $ | 3,077 | $ | 870 | ||||||
Work in progress |
|
| 10,621 |
|
|
| 8,292 |
| Work in progress | 9,860 | 8,667 | ||||||||
Finished products |
|
| 8,085 |
|
|
| 12,014 |
| Finished products | 11,451 | 13,018 | ||||||||
Total |
| $ | 24,642 |
|
| $ | 25,549 |
| Total | $ | 24,388 | $ | 22,555 | ||||||
2022.
| September 30, 2019 | |||||
| Unaudited | |||||
| Future minimum lease payments: | |||||
| 2019 (remainder of the year) | $ | 1,146 | |||
| 2020 | 4,519 | ||||
| 2021 | 4,193 | ||||
| 2022 | 3,130 | ||||
| 2023 | 1,933 | ||||
| Thereafter | 3,651 | ||||
| Total future minimum lease payments | $ | 18,572 | |||
| Less imputed interest | (2,956) | ||||
| Net present value of future minimum lease payments | $ | 15,616 | |||
| Presented as of September 30, 2019: | |||||
| Short-term lease liabilities | $ | 4,249 | |||
| Long-term lease liabilities | 11,367 | ||||
| Net present value of future minimum lease payments | $ | 15,616 | |||
| Weighted average of remaining operating lease term | 4.85 | ||||
| Weighted average of operating lease discount rate | 7.51% | ||||
In January 2017, two putative class action lawsuits were filed against the Company, its directors and certain of its officers, as well as the underwriters in the Company’s October 2015 initial public offering. The complaints, which purport to be brought on behalf of a class of persons and/or entities who purchased or otherwise acquired ordinary shares of the Company pursuant and/or traceable to the registration statement and prospectus issued in connection with the Company’s initial public offering, allege material misstatements and/or omissions in the Company’s initial public offering materials in alleged violation of the federal securities laws and seek compensatory damages, among other remedies. The two actions have been consolidated and the plaintiffs filed a consolidated amended complaint on May 31, 2017. The court granted the defendants’ motion to bifurcate the motion to dismiss into two stages: a threshold motion to dismiss for lack of personal jurisdiction, lack of subject matter jurisdiction, and insufficient process and service of process; and, if the matter is not dismissed following that threshold motion, a subsequent merits motion to dismiss regarding whether the allegations in the amended complaint state a claim under the securities laws. The defendants filed the threshold motion to dismiss on July 31, 2017, and the plaintiffs filed an opposition to the threshold motion to dismiss on September 29, 2017. The Company believes that the amended complaint is without merit and plans to defend the consolidated lawsuits vigorously. The Company has not
- 8 -
accrued any amounts in respect of these lawsuits, as a liability is not probable and the amount of any potential liability cannot be reasonably estimated.
$1,299, respectively
.For the nine months ended September 30, 2017, warrants to purchase 1,418,711 ordinary shares with an exercise price of $3.59 per share were cashlessly exercised, resulting in the issuance of 803,138 ordinary shares. Also, warrants to purchase 6,498 ordinary shares with an exercise price of $3.59 per share were exercised for cash. For the nine months ended September 30, 2017, options to purchase 1,370,810 ordinary shares were exercised, resulting in the issuance of 1,364,645 ordinary shares.
NOTE 6: EQUITY INCENTIVE PLANS
|
| Nine months ended September 30, 2017 |
| Nine months ended September 30, 2019 | |||||||||||||||||||||
|
| Unaudited |
| Unaudited | |||||||||||||||||||||
|
| Number of options |
|
| Weighted average exercise price |
| Number of options | Weighted average exercise price | |||||||||||||||||
Outstanding at beginning of year |
|
| 11,377,354 |
|
| $ | 9.76 |
| Outstanding at beginning of year | 14,438,215 | $ | 13.56 | |||||||||||||
Granted |
|
| 5,117,088 |
|
|
| 9.96 |
| Granted | 1,496,161 | 49.43 | ||||||||||||||
Exercised |
|
| (1,370,810 | ) |
|
| 2.31 |
| Exercised | (4,914,918) | 10.55 | ||||||||||||||
Forfeited and cancelled |
|
| (310,693 | ) |
|
| 12.39 |
| |||||||||||||||||
Outstanding as of September 30, 2017 |
|
| 14,812,939 |
|
|
| 10.46 |
| |||||||||||||||||
| Forfeited and canceled | Forfeited and canceled | (144,403) | 19.91 | ||||||||||||||||||||||
| Outstanding as of September 30, 2019 | Outstanding as of September 30, 2019 | 10,875,055 | $ | 19.77 | |||||||||||||||||||||
|
|
|
|
|
|
|
|
| |||||||||||||||||
Exercisable options |
|
| 6,119,710 |
|
|
| 8.17 |
| Exercisable options | 3,444,478 | $ | 14.61 | |||||||||||||
|
|
|
|
|
|
|
|
| |||||||||||||||||
Vested and expected to vest |
|
| 14,812,939 |
|
| $ | 10.46 |
| |||||||||||||||||
|
| Nine months ended September 30, 2017 |
| Nine months ended September 30, 2019 | |||||||||||||||||||||
|
| Unaudited |
| Unaudited | |||||||||||||||||||||
|
| Number of RSUs |
|
| Weighted average grant date fair value price |
| Number of RSUs | Weighted average grant date fair value price | |||||||||||||||||
Unvested at beginning of year |
|
| - |
|
| $ | - |
| Unvested at beginning of year | 1,613,197 | 14.04 | ||||||||||||||
Granted |
|
| 1,661,619 |
|
|
| 9.64 |
| Granted | 597,583 | 50.71 | ||||||||||||||
Vested |
|
| - |
|
|
| - |
| Vested | (736,411) | 13.36 | ||||||||||||||
Forfeited and cancelled |
|
| (10,400 | ) |
|
| 7.15 |
| Forfeited and cancelled | (24,356) | 34.32 | ||||||||||||||
Unvested as of September 30, 2017 |
|
| 1,651,219 |
|
| $ | 9.66 |
| |||||||||||||||||
| Unvested as of September 30, 2019 | Unvested as of September 30, 2019 | 1,450,013 | 29.16 | ||||||||||||||||||||||
- 9 -
Nine months ended September 30, Year ended December 31, 2017 2016 2016 Unaudited Audited Stock Option Plans Expected term (years) 5.5-6.25 6.25 6.25 Expected volatility 56.74%-59.45% 59.80%-61.65% 58.40%-61.70% Risk-free interest rate 1.97%-2.23% 1.23%-1.88% 1.23%-1.88% Dividend yield 0.00% 0.00% 0.00% ESPP Expected term (years) 0.50 0.42 0.42 Expected volatility 76.37%-82.00% 70.45% 70.45% Risk-free interest rate 0.62%-1.13% 0.40% 0.40% Dividend yield 0.00% 0.00% 0.00% Three months ended September 30, Nine months ended September 30, Year ended December 31, 2017 2016 2017 2016 2016 Unaudited Unaudited Audited Cost of revenues $ 79 $ 160 $ 353 $ 471 $ 623 Research, development and clinical trials 972 776 2,645 2,378 3,155 Sales and marketing 1,874 1,249 4,264 3,888 5,111 General and administrative 5,704 3,441 13,498 9,982 12,552 Total share-based compensation expense $ 8,629 $ 5,626 $ 20,760 $ 16,719 $ 21,441 September 30, December 31, 2017 2016 Unaudited Audited United States $ 10,942 $ 11,981 Switzerland 5,057 4,346 Israel 1,884 1,915 Others 426 378 Total $ 18,309 $ 18,620 Three months ended September 30, Nine months ended September 30, Year ended December 31, 2017 2016 2017 2016 2016 Unaudited Unaudited Audited United States $ 35,300 $ 18,131 $ 95,826 $ 46,264 $ 72,771 EMEA (*) 14,757 3,519 27,316 6,296 10,028 Japan 52 24 223 86 89 Total $ 50,109 $ 21,674 $ 123,365 $ 52,646 $ 82,888 (*) including Germany $ 14,664 $ 1,766 26,880 2,659 $ 9,799 We now expect data from the HEPANOVA phase 2 pilot trial in 2021. Estimates September 30, Operating statistics 2017 2016 Active patients at period end (1) United States 1,234 783 EMEA (2) (*) 448 202 Japan (2) 1 - 1,683 985 (*) including Germany 331 146 Three months ended September 30, Nine months ended September 30, 2017 2016 2017 2016 Prescriptions received in period (3) United States 805 569 2,293 1,800 EMEA (2) (*) 270 120 731 301 Japan (2) 1 1 5 1 1,076 690 3,029 2,102 (*) including Germany 202 87 553 221 2017 2016 U.S. dollars in millions Q3 Q2 Q1 Q4 Q3 Q2 Q1 Gross billings $ 101.9 $ 87.2 $ 73.2 $ 63.8 $ 57.5 $ 54.0 $ 45.5 Accrual basis revenue $ 35.7 $ 19.1 $ 14.7 $ 8.5 $ 0.0 $ 0.0 $ 0.0 Cash basis revenue for therapy provided in the period 3.1 5.7 5.9 6.3 8.9 7.6 5.6 Cash basis revenue for therapy provided in previous periods 11.3 13.6 14.3 15.5 12.7 10.3 7.4 Net revenues $ 50.1 $ 38.4 $ 34.9 $ 30.2 $ 21.7 $ 17.9 $ 13.1 our 2018 10-K. Our reporting currency is the U.S. dollar. We 2018. Three months ended September 30, 2017 2016 Change % Change Net revenues $ 50,109 $ 21,674 $ 28,435 131 % initial benefit from Medicare with $0.5 million in third quarter net revenues. goods per active patient driven by ongoing efficiency initiatives and scale. Gross margin was Three months ended September 30, 2017 2016 Change % Change Research, development and clinical trials $ 9,273 $ 10,233 $ (960 ) (9 %) Sales and marketing 16,387 15,865 522 3 % General and administrative 15,215 12,723 2,492 20 % Total operating expenses $ 40,875 $ 38,821 $ 2,054 5 % Non-cash expenses: Share-based compensation expense $ 8,550 $ 5,466 $ 3,084 56 % Other non-cash expenses 600 708 (108 ) (15 %) Total non-cash expenses $ 9,150 $ 6,174 $ 2,976 48 % Total operating expenses, net of non-cash expenses * $ 31,725 $ 32,647 $ (922 ) (3 %) Research, development and clinical trials expenses.Research, development and clinical trials expenses will beare construed in a manner consistent with the requirements of such section. The Company began its offerings under the ESPP on August 1, 2016. As of September 30, 2017, 2,328,1712019, 3,078,989 ordinary shares were available to be purchased by eligible employees under the ESPP and 209,355390,614 shares had been issued under the ESPP.all equity-basedshare-based awards was estimated using the Black-Scholes option-pricing model withfor all equity grants. For market condition awards, the Company also applied the Monte-Carlo simulation model. We assessed fair value using the following underlying assumptions, excluding market condition awards for which fair value was estimated using the Monte Carlo option-pricing model: assumptions: Nine months ended September 30, Year ended December 31,
20182019 2018 Year ended December 31,
2018Unaudited Audited Stock Option Plans Expected term (years) 5.50-6.50 5.50-6.25 5.50-6.25 Expected volatility 55%-61% 52%-55% 52%-55% Risk-free interest rate 1.90%-2.40% 2.70%-2.89% 2.70%-2.99% Dividend yield 0.00 % 0.00 % 0.00 % ESPP Expected term (years) 0.50 0.50 0.50 Expected volatility 44%-62% 45%-53% 45%-53% Risk-free interest rate 2.10%-2.51% 1.61%-2.14% 1.61%-2.14% Dividend yield 0.00 % 0.00 % 0.00 % 20172019 and 20162018 and the year ended December 31, 20162018 was:Three months ended September 30, Nine months ended September 30, Year ended December 31,
20182019 2018 2019 2018 Year ended December 31,
2018Unaudited Unaudited Audited Cost of revenues $ 605 $ 464 $ 1,626 $ 891 $ 1,261 Research, development and clinical trials 2,202 1,223 5,203 3,415 4,709 Sales and marketing 3,368 1,979 8,585 5,309 7,393 General and administrative 8,163 6,813 22,305 19,590 26,483 Total share-based compensation expense $ 14,338 $ 10,479 $ 37,719 $ 29,205 $ 39,846 - 10 -September 30,
2019December 31,
2018 Unaudited Audited United States $ 8,170 $ 8,289 Switzerland 3,695 2,513 Israel 2,393 2,236 Germany 778 1,054 Others 1,528 1,274 Total $ 16,564 $ 15,366 Three months ended September 30, Nine months ended September 30, Year ended December 31,
20182019 2018 2019 2018 Year ended December 31,
2018Unaudited Unaudited Audited United States $ 61,399 $ 44,469 $ 166,937 $ 124,206 $ 168,414 EMEA (*) 24,482 18,295 69,507 50,692 72,485 Japan 4,779 1,992 12,334 3,497 6,351 Greater China (1) Greater China (1) 1,402 — 3,306 — 819 Total $ 92,062 $ 64,756 $ 252,084 $ 178,395 $ 248,069 - 11 -(*) including Germany $ 21,688 $ 17,536 $ 64,065 $ 48,545 $ 67,849 ofof Financial Condition and Results of Operations20172019 included in Part I, Item 1 of this Quarterly Report on Form 10-Q. This discussion contains forward-looking statements that involve risks and uncertainties. As a result of many factors, such as those set forthPlease refer to the information under Part I, Item 1A, “Risk Factors”, of our Annual Report on Form 10-K for the fiscal year ended December 31, 2016 (the “2016 10-K”), our actual results may differ materially from those anticipatedheading “Cautionary Note Regarding Forward-Looking Statements” elsewhere in these forward-looking statements.this report. References to the words “we,” “our,” “us,” and the “Company” in this report refer to NovoCure Limited, including its consolidated subsidiaries.commercial stageglobal oncology company developing a profoundly different cancer treatment centered onwith a proprietary therapyplatform technology called Tumor Treating Fields, (“TTFields”), the use of electric fields tuned to specific frequencies to disrupt solid tumor cancer cell division. Our key priorities are to accelerate commercialdrive adoption of Optune and the NovoTTF-100L System (“NovoTTF-100L”), our first commercial TTFieldsTumor Treating Fields delivery system, for the treatment of glioblastoma (“GBM”)systems, and to advance programs testing the safety and efficacy and safety of TTFieldsour products in multiple solid tumor indications through our clinical pipeline.were foundedhave built a commercial organization in 2000the United States, Austria, Germany, Israel, Japan, Sweden and operatedSwitzerland, which we refer to as a development stage company through December 31, 2011. We initially receivedour currently active markets. Optune is approved by the U.S. Food and Drug Administration (“FDA”) approvalunder the Premarket Approval (“PMA”) pathway for Optunethe treatment of adult patients with newly diagnosed glioblastoma (“GBM”) in 2011combination with temozolomide, a chemotherapy drug, and for use as a monotherapy treatment for adult patients with GBM following confirmed recurrence after chemotherapy. In October 2015, we received FDAWe also have approval to market Optune for the treatment of adult patients with newly diagnosed GBM in combination with temozolomide, a chemotherapy drug. We have also received approval to market Optune in Germany, Austria, Switzerland, Israel,the European Union, Japan and certain other countries. To date, we have focused on commercializing Optune in the United States, Germany, Austria, Switzerland, Israel and Japan, which we refer to collectively as our currently active markets.In April 2017, we announced final analyses of the full 695 patient dataset with a median follow-up of 40 months from our phase 3 pivotal trial of Optune in combination with temozolomide for patients with newly diagnosed GBM. For patients treated with Optune in combination with temozolomide versus patients treated with temozolomide alone, the two-year survival rate increased from 30 percent to 43 percent and the five-year survival rate increased from five percent to 13 percent. In September 2017, we announced results from health-related quality of life analyses from this same phase 3 pivotal trial. Patients treated with Optune in combination with temozolomide were able to maintain quality of life for longer compared to patients treated with temozolomide alone. These data further support our belief that Optune plus temozolomide is an essential combination treatment for patients with newly diagnosed GBM.newly diagnosed and recurrent GBM. As of September 30, 2017, more than 210 million2019, a substantial majority of Americans have availablewith private health insurance had coverage for the use of Optune for newly diagnosed and/or recurrent GBM. Additionally, we have signed contracts to establish OptuneEffective as an in-network benefit for more than 178 million American lives. The percentage of our U.S. active patient populationSeptember 1, 2019, Americans who are beneficiaries of the Medicare fee-for-service program which has deniedalso have coverage for our claims to date, continues to range from 20 to 25 percent.In Germany, we are able to bill healthcare payers for individual cases and each case is evaluated individually on its merits and under the payer’s specific rules for such cases. In the third quarter 2017, approximately half of German claims were approved for reimbursement. In September 2017, the German Federal Joint Committee, or G-BA, published its decision to support a clinical trial studying Optune for the treatment of newly diagnosed GBM. Our team is focused on working through the typical administrative ramp-up with Medicare to ensure that we realize the full financial benefit as soon as possible. We are actively appealing Medicare fee-for-service coverage denials up to and including the Administrative Law Judge (“ALJ”) process with Centers for Medicare and Medicaid Services (“CMS”).proposedfirst trial, designwhich we plan to begin in the next few months, will examinebe a post-marketing trial designed to study the potential benefit of startingearlier initiation of Optune, concurrent with radiation therapy, versus initiation post radiation, and temozolomide prioris intended to support possible label expansion. A second trial, which we plan to begin in 2020, is currently being designed.initiationFDA under the Humanitarian Device Exemption (“HDE”) pathway to treat unresectable, locally advanced or metastatic malignant pleural mesothelioma (“MPM”) in combination with standard chemotherapies based upon the results of maintenance temozolomideour STELLAR trial. In October 2019, results from our STELLAR trial were published in accordance with Section 137eThe Lancet Oncology. We have initiated a phased launch for MPM shaped by our learnings from our GBM rollout. Our initial launch efforts are focused on certifying radiation oncologists and on supporting the required Institutional Review Board (“IRB”) approval process at the approximately 40 centers that we believe see the majority of U.S. MPM patients. As of September 30, 2019, prescribers were certified at 10 centers across the U.S. and two centers had successfully completed the required IRB approval process. The first MPM commercial patient started therapy in September 2019. We are currently exploring the appropriate regulatory pathway for MPM in our currently active markets outside of the German Healthcare Provision Act.U.S.shareoccur in 2022. The European Network for Gynaecological Oncological Trial groups (“ENGOT”) and The GOG Foundation, Inc. (“GOG”), third-party clinical trial networks, are collaborating with us on the costs fortrial. ENGOT and GOG were involved in the conductdevelopment of the clinical trial withand the G-BA. The statutory health insurance funds will reimburse treatment costs, includingcollaborations are intended to facilitate enrollment of INNOVATE-3 at leading cancer centers in Europe and the cost of Optune for clinical trial patients. The G-BA decision is an important first step in the process to secure national reimbursement for Optune in Germany.In August 2017,United States.signed a contract with the Federation of Austrian Social Insurance Institutions to grant reimbursement for Optune. All 18 Austrian insurance funds have agreed to participate in the contract, marking our first national reimbursement decision. We are currently working to implement the contract and believe that our first payments for Austrian claims will begin in the fourth quarter 2017.In April 2017, we submitted our applicate to the Federal Office of Public Health in Switzerland to secure a defined reimbursement rate for Optune based upon the long-term analysis of the EF-14 clinical trial data. We now believe a Swiss reimbursement decision will come no earlier than 2018. Until we secure a defined reimbursement rate, payment is not guaranteed.- 12 -In March 2017, we received Japanese Ministry of Health, Labour and Welfare (“MHLW”) approval for the second generation Optune. In March 2017, we filed an application to request a defined reimbursement rate for Optune based on the December 2016 regulatory approval of Optune to treat newly diagnosed GBM. We are currently in active reimbursement discussions with the MHLW and believe that a reimbursement decision will come before the end of 2017.We have researched the biological effects of TTFields extensively. Because TTFields are delivered regionally, act only on dividing cells (a biological process known as mitosis) and are frequency-tuned to target cells of a specific size, we believe there is minimal damage to healthy cells. We believe our pre-clinical and clinical research demonstrates that TTFields’ mechanism of action affects fundamental aspects of cell division and may have broad applicability across a variety of solid tumors. We have demonstrated in pre-clinical studies that TTFields can offer additive or synergistic benefits in combination with radiation, chemotherapy and immunotherapy, which may lead to greater efficacy than radiation, chemotherapy and immunotherapy alone, without significantly increasing the side effects when used in combination with other cancer treatments.We are currently planning or conducting clinicalphase 3 pivotal trials evaluating the use of TTFieldsTumor Treating Fields in brain metastases, non-small-cell lung cancer, (“NSCLC”), pancreatic cancer and ovarian cancer and mesothelioma.cancer. We are also conducting a phase 2 pilot trial evaluating the use of Tumor Treating Fields in liver cancer. We anticipate expanding our clinical pipeline over time to study the safety and efficacy of TTFieldsTumor Treating Fields for additional solid tumor indications. clinical pipeline and our expected next milestone for each.
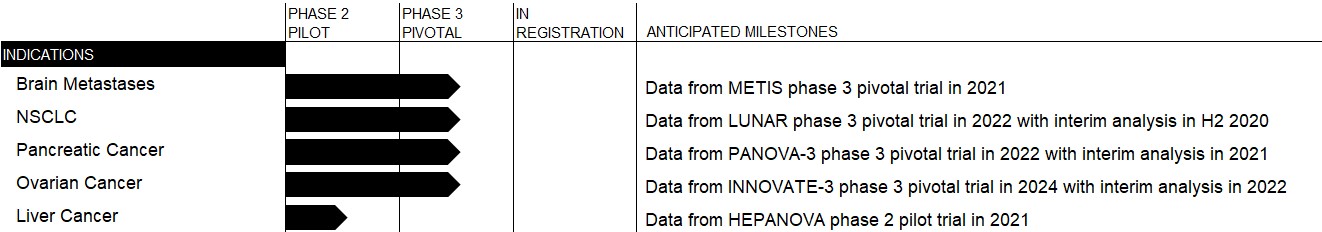
May 2017,2018, we received humanitarian use device (HUD) designationgranted Zai Lab (Shanghai) Co., Ltd. (“Zai”) a license to commercialize Optune in China, Hong Kong, Macau and Taiwan under a License and Collaboration Agreement (the “Zai Agreement”). The Chinese regulatory authorities designated Optune as an Innovative Medical Device and have accepted the Marketing Authorization Application for the useGBM indication in China. Zai is pursuing a clinical trial waiver and, should a clinical trial waiver be granted, Zai intends to launch Optune in China before the end of TTFields for2019. On the treatment of pleural mesothelioma. The HUD designationclinical development front, Zai is the first step in obtaining a Humanitarian Device Exemption (HDE) for the treatment of pleural mesothelioma with TTFields. An approved HDE would allow usworking to market TTFields in combination with standard of care chemotherapy as a treatment for pleural mesothelioma in the United States.In October 2016, we enrolled the first patient in our METIS trial, a phase 3 pivotal trial testing the effectiveness of stereotactic radiosurgery plus TTFields compared to stereotactic radiosurgery alone in patients with brain metastases resulting from NSCLC. In September 2017, the FDA approved an IDE supplement amendingfinalize the protocol for a phase 2 pilot trial in gastric cancer and is collaborating closely with our clinical teams to initiate trials in other key indications in China.METIS trial. The protocol amendment is designed to accelerate the pace of enrollment by expanding the eligible patient population. Among other updates, the protocol now allowsthree and nine months ended September 30, 2019, our net revenues were $92.1 million and $252.1 million, respectively. Our net income (loss) for the enrollmentthree and nine months ended September 30, 2019 was $1.9 million and $(11.5) million, respectively. As of patients with infratentorial brain metastases, based upon new scientific information to support a specialized array layout to treat infratentorial tumors.We own all commercialization rights to TTFields in oncology. Our robust global patentSeptember 30, 2019, we had an accumulated deficit of $655.1 million.intellectual property portfolio consists of over 120 issued patents, with numerous additional patent applications pending worldwide. The patents have expected expiration dates between 2021 and 2035. We have also filed approximately 50 additional patent applications that, if issued, may protect aspects of our platform beyond 2035. We believe we will maintain exclusive rights to market TTFields for all solid tumor indications in our key markets through the life of our patents.We were incorporated in the Bailiwick of Jersey in 2000. Our U.S. operations are located in Portsmouth, New Hampshire, Malvern, Pennsylvania, and New York City. Additionally, we have offices in Germany, Switzerland, Israel and Japan, and a research center in Israel. We completed our initial public offering of our ordinary shares in October 2015. Our ordinary shares are quoted on the NASDAQ Global Select Market under the symbol “NVCR.”Financial Overview. We expect to continue to incur significant expenses and operating losses for at least the next several years. We expect our research, development and clinical trials expenses to increase in connection with our ongoing activities, and as additional indications enter late-stage clinical development. In addition, we expect to incur significant commercialization expenses for product sales, marketing, manufacturing and distribution. We may need additional funding to support the continuation of our operating activities. Until we can generate substantial revenues (which may not occur), we expect to finance our cash needs through our existing cash, cash equivalents, short-term investments, equity issuances or additional debt, and possibly also from collaborations, strategic alliances, licensing arrangements and other marketing and distribution arrangements. We will need to generate significant revenues to achieve profitability, and we may never do so.- 13 -Critical accounting policies and estimatesGAAP,generally accepted accounting principles (“GAAP”), in preparing our financial statements, we must make estimates and assumptions that affect the reported amounts of assets and liabilities, the disclosure of contingent assets and liabilities as of the date of the financial statements and the reported amounts of net revenues and expenses during the reporting period. We develop and periodically change these estimates and assumptions based on historical experience and on various other factors that we believe are reasonable under the circumstances. Actual results may differ from these estimates.2016 10-K.Company’s Annual Report on Form 10-K for the fiscal year ended December 31, 2018 (the “2018 10-K”). For additional information, see Note 1 to our Unaudited Consolidated Financial Statements. There have beenwere no other material changes to our critical accounting policies and estimates as compared to the critical accounting policies and estimates described in our 20162018 10-K.We account for revenue when all revenue recognition criteria have been met or when cash is collected. Revenue recognized in a given period may include a mixture of accrued revenue, cash collections from amounts billed in prior periods and cash collections from amounts billed in the current periodWe report certain operating statistics to provide additional insight into the commercial performance of Optune in our currently active markets.The number of active patients on Optune is our principal revenue driver. Growth in the number of active patients is a factor of both treatment duration and new patient starts. Median treatment duration differs based upon the clinical diagnosis of the patient. For the three months ended September 30, 2017, more than 60% of prescriptions received were for patients with newly diagnosed GBM. The conversion of prescriptions to new patients is driven by the prescription fill rate and the time to fill. In the twelve months ended September 30, 2017, our prescription fill rate was between 70-75%.The following table includes certain commercial operating statistics for and as of the end of the periods presented.(1)An “active patient” is a patient who is on Optune under a commercial prescription order as of the measurement date, including patients who may be on a temporary break from treatment and who plan to resume treatment in less than 60 days.(2)As we enter each new market, our commercial activities focus initially on establishing the required in-market infrastructure, certifying physicians to prescribe Optune and obtaining a defined reimbursement pathway. Once established, our commercial efforts turn to increasing adoption.(3)A “prescription received” is a commercial order for Optune that is received from a physician certified to treat patients with Optune for a patient not previously on Optune. Orders to renew or extend treatment are not included in this total.- 14 -Net revenues. Substantially all of ourOur revenues are primarily derived from patients using our TTFields delivery system, marketed as Optune in our currently active markets. We charge patients or their third-party healthcare payers directly for treatment with Optune andbasis and bear the financial risk of securing payment in the United States and Europe.The following is a summary of gross billings and revenues recorded on an accrual basis and a cash basis by quarters (unaudited):We began recognizing a portion of ourbasis. Our potential net revenues per patient are determined by our ability to secure payment, the monthly fee we collect and the number of months that the patient remains on an accrual basis in the fourth quarter 2016. Priortherapy.thirdZai Agreement in each quarter 2017, all of 2019. For additional information regarding the net revenues recognized on an accrual basis represent chargesZai Agreement, see Note 12 to certain U.S.-based third-party payers. Beginningthe Consolidated Financial Statements in the third quarter 2017, net revenues recognized on an accrual basis represent charges to certain U.S.-based third-party payers and certain German payers. In the period of transition from cash-based to accrual-based revenue recognition, there is a one-time impact to net revenues as net revenues in the current period may also include revenues from gross billings from previous periods. In the table above, gross billings reflect the total charges for active patients on Optune without any deductions or adjustments for payer discounts, patient financial assistance, charitable care or other similar items. The subsequent table line items detail the three sources of net revenue in the applicable reporting period.comprised primarily of (i) costcomprised of the following:arrays purchased from third-party manufacturers, (ii) arrays;patientspatients; and (iii) Expenses. expenses. Our operating expenses consist of research, development and clinical trials, sales and marketing and general and administrative expenses. Personnel costs are a significant component for each category of operating expenses and consist of wages, benefits and bonuses. Personnel costs also include share-based compensation.net.net.Financial expenses, net primarily consists of credit facility interest expense and related debt issuance costs, under our Term Loan Credit Facility (as defined below), interest income from cash balances and short-term investments and gains (losses) from foreign currency transactions.viewhave historically held substantially all of our operationscash balances in U.S. dollar denominated accounts to minimize the risk of translational currency exposure.manage our businessas of the end of the periods presented.September 30, Operating statistics 2019 2018 Active patients at period end (1) United States 1,860 1,602 EMEA (*) 731 581 Japan 160 69 Total 2,751 2,252 (*) including Germany 499 399 Three months ended September 30, Nine months ended September 30, 2019 2018 2019 2018 Gross billings (in millions) $ 171.4 $ 139.2 $ 499.4 $ 401.0 Prescriptions received in period (2) United States 917 907 2,831 2,800 EMEA (*) 318 288 947 835 Japan 84 48 213 110 Total 1,319 1,243 3,991 3,745 (*) including Germany 218 235 696 635 one operating segment. Forless than 60 days. and nine months ended September 30, 2017, our net revenues were $50.1 million and $123.4 million, respectively, and our net loss was $11.5 million and $50.7 million, respectively. Our net loss2019, compared to 75% for the three and nine months ended September 30, 2017 includes $8.6 million and $20.8 million, respectively,same period in non-cash share-based compensation expense. As of September 30, 2017, we had an accumulated deficit of $571.3 million.20172019 compared to three months ended September 30, 2016(All dollar figures in tables are in thousands unless otherwise indicated)Three months ended September 30, 2019 2018 Change % Change Net revenues $ 92,062 $ 64,756 $ 27,306 42 % $28.4$27.3 million, or 131%42%, to $50.1$92.1 million for the three months September 30, 2019 from $64.8 million for the three months ended September 30, 2017 from $21.7 million for the three months ended September 30, 2016.2018. This was primarily due to an increase of $17.2 million499 active patients in commercial sales of Optune in the United States and an increase of $11.3 million in commercial sales of Optune in our other currently active markets, representing 22% growth, and an improvement in the net revenues booked per active patient. The increase in net revenues per active patient benefited from continued improvements in reimbursement rates in both the U.S. and EMEA. In addition, under the newly defined coverage policy effective as well asof September 1, 2019, we recognized the transition to accrual-based revenue recognition for a portion of our billings.- 15 -Three months ended September 30, 2019 2018 Change % Change Cost of revenues $ 22,900 $ 18,949 $ 3,951 21 % 36%21%, to $15.2$22.9 million for the three months endedSeptember 30, 2017 2019from $11.1$18.9 million for the three months endedSeptember 30, 2016.2018. The increase resultedin cost of revenues was primarily fromdue to the cost of shipping transducer arrays to a higher volume of commercial patients as well as an increasepartially offset by a reduction in field equipment depreciation. Costthe cost of revenues includes $0.1 million of non-cash share-based compensation.Three months ended September 30, 2019 2018 Change % Change Research, development and clinical trials $ 18,766 $ 13,074 $ 5,692 44 % Sales and marketing 23,830 19,124 4,706 25 % General and administrative 22,711 18,855 3,856 20 % Total operating expenses $ 65,307 $ 51,053 $ 14,254 28 % *This non-GAAP metric has been included because management believes that it provides for a more accurate year to year comparison of our operating expenses without the impact of non-cash items.decreased $1.0increased $5.7 million, or 9%44%, to $9.3$18.8 million for the three months ended September 30, 20172019 from $10.2$13.1 million for the three months ended September 30, 2016.2018. The change is primarily due to a decrease in clinical trial expenses resulting from the conclusion of our EF-14 phase 3 pivotal trial in newly diagnosed GBM, a decrease in expenses related to the approval of our second generation Optune and a decrease in medical grants driven principally by timing, partially offset by an increase in clinical trial and personnel expenses for our LUNARphase 3 pivotal trials and METIS trials. These expenses include $1.0 million of non-cash share-based compensation.
an increase in costs associated with medical affairs, regulatory matters and engineering.
| Three months ended September 30, | |||||||||||||||||||||||||||||
| 2019 | 2018 | Change | % Change | ||||||||||||||||||||||||||
| Financial expenses (income), net | $ | 2,555 | $ | 2,397 | $ | 158 | 7 | % | |||||||||||||||||||||
General and administrative expenses. General and administrativenet.
Financial expenses, net. Financial expenses remained consistent at $2.2 million for both the three months ended September 30, 2017interest income and the three months ended September 30, 2016.
|
| Three months ended September 30, |
|
|
|
|
|
|
|
|
| |||||
|
| 2017 |
|
| 2016 |
|
| Change |
|
| % Change |
| ||||
Income tax expenses |
| $ | 3,423 |
|
| $ | 3,174 |
|
| $ | 249 |
|
|
| 8 | % |
| Three months ended September 30, | |||||||||||||||||||||||||||||
| 2019 | 2018 | Change | % Change | ||||||||||||||||||||||||||
| Income taxes | $ | (630) | $ | 4,051 | $ | (4,681) | (116) | % | |||||||||||||||||||||
- 16 -
We also recorded an income tax benefit of approximately $1.5 million in the quarter ended September 30, 2019 as a result of research and development credits claimed in the U.S.
(All dollar figures in tables are in thousands unless otherwise indicated)
|
| Nine months ended September 30, |
|
|
|
|
|
|
|
|
| |||||
|
| 2017 |
|
| 2016 |
|
| Change |
|
| % Change |
| ||||
Net revenues |
| $ | 123,365 |
|
| $ | 52,646 |
|
| $ | 70,719 |
|
|
| 134 | % |
| Nine months ended September 30, | |||||||||||||||||||||||||||||
| 2019 | 2018 | Change | % Change | ||||||||||||||||||||||||||
| Net revenues | $ | 252,084 | $ | 178,395 | $ | 73,689 | 41 | % | |||||||||||||||||||||
| Nine months ended September 30, | |||||||||||||||||||||||||||||
| 2019 | 2018 | Change | % Change | ||||||||||||||||||||||||||
| Cost of revenues | $ | 63,820 | $ | 57,020 | $ | 6,800 | 12 | % | |||||||||||||||||||||
Cost of revenues. Our cost of revenues (excluding the impairment of field equipment described below) increased by $11.1 million, or 38%, to $40.0 million for the nine months ended September 30, 2017 from $28.9 million for the nine months ended September 30, 2016. The increase resulted primarily from the cost of shipping transducer arrays to a higher volume of commercial patients as well as an increase in field equipment depreciation. Cost of revenues include $0.4 million of non-cash share-based compensation.
We received FDA approval on our PMA supplement application to market our second generation Optunepartially offset by a reduction in the United States in July 2016. In the second quarter 2016, we recorded an impairment loss with respect to the write-off of first generation Optune field equipment (finished goods and production stage) in the amount of $6.4 million that was not recoverable and was presented in cost of revenues. We do not expectgoods per active patient driven by ongoing efficiency initiatives and scale. Gross margin was 75% for the conversion to our second generation Optune to result in an additional material impairment charge innine months ended September 30, 2019 and 68% for the future.
nine months ended September 30, 2018.
|
| Nine months ended September 30, |
|
|
|
|
|
|
|
|
| |||||
|
| 2017 |
|
| 2016 |
|
| Change |
|
| % Change |
| ||||
Research, development and clinical trials |
| $ | 28,055 |
|
| $ | 32,996 |
|
| $ | (4,941 | ) |
|
| (15 | %) |
Sales and marketing |
|
| 47,503 |
|
|
| 43,771 |
|
|
| 3,732 |
|
|
| 9 | % |
General and administrative |
|
| 42,660 |
|
|
| 38,010 |
|
|
| 4,650 |
|
|
| 12 | % |
Total operating expenses |
| $ | 118,218 |
|
| $ | 114,777 |
|
| $ | 3,441 |
|
|
| 3 | % |
|
|
|
|
|
|
|
|
|
|
|
|
|
|
|
|
|
Non-cash expenses: |
|
|
|
|
|
|
|
|
|
|
|
|
|
|
|
|
Share-based compensation expense |
| $ | 20,407 |
|
| $ | 16,248 |
|
| $ | 4,159 |
|
|
| 26 | % |
Other non-cash expenses |
|
| 1,749 |
|
|
| 2,023 |
|
|
| (274 | ) |
|
| (14 | %) |
Total non-cash expenses |
| $ | 22,156 |
|
| $ | 18,271 |
|
| $ | 3,885 |
|
|
| 21 | % |
|
|
|
|
|
|
|
|
|
|
|
|
|
|
|
|
|
Total operating expenses, net of non-cash expenses |
| $ | 96,062 |
|
| $ | 96,506 |
|
| $ | (444 | ) |
|
| (0 | %) |
| Nine months ended September 30, | |||||||||||||||||||||||||||||
| 2019 | 2018 | Change | % Change | ||||||||||||||||||||||||||
| Research, development and clinical trials | $ | 55,262 | $ | 35,540 | $ | 19,722 | 55 | % | |||||||||||||||||||||
| Sales and marketing | 69,871 | 56,455 | 13,416 | 24 | % | ||||||||||||||||||||||||
| General and administrative | 64,198 | 54,388 | 9,810 | 18 | % | ||||||||||||||||||||||||
| Total operating expenses | $ | 189,331 | $ | 146,383 | $ | 42,948 | 29 | % | |||||||||||||||||||||
|
|
Research, development and clinical trials expenses.Research, development and clinical trials expenses decreased $4.9increased $19.7 million, or 15%55%, to $28.1$55.3 million for the nine months ended September 30, 20172019 from $33.0$35.5 million for the nine months ended September 30, 2016 .2018. The change is primarily due to a decrease in clinical trial expenses resulting from the conclusion of our EF-14 phase 3 pivotal trial in newly diagnosed GBM, a decrease in expenses related to the approval of our second generation Optune and a decrease in medical grants driven principally by timing, partially offset by an increase in clinical trial and personnel expenses for our LUNARphase 3 pivotal trials and METIS trials. These expenses include $2.6 million of non-cash share-based compensation.