

UNITED STATES
SECURITIES AND EXCHANGE COMMISSION
Washington, D.C. 20549
FORM 10-Q
|
|
☒QUARTERLY REPORT PURSUANT TO SECTION 13 OR 15(d) OF THE SECURITIESEXCHANGE ACT OF 1934
For the quarterly period ended September 30, 2017March 31, 2023
|
|
☐TRANSITION REPORT PURSUANT TO SECTION 13 OR 15(d) OF THE SECURITIESEXCHANGE ACT OF 1934
For the transition period from ______________ to______________
Commission File Number: 001-13545 (Prologis, Inc.) 001-14245 (Prologis, L.P.)
Prologis, Inc.
Prologis, L.P.
(Exact name of registrant as specified in its charter)
Maryland (Prologis, Inc.) Delaware (Prologis, L.P.) | 94-3281941 (Prologis, Inc.) 94-3285362 (Prologis, L.P.) | |
(State or other jurisdiction of incorporation or organization) | (I.R.S. Employer Identification No.) | |
Pier 1, Bay 1, San Francisco, California | 94111 | |
(Address or principal executive offices) | (Zip Code) |
(415) (415) 394-9000
(Registrants’ telephone number, including area code)
(Former name, former address and former fiscal year, if changed since last report)
Securities registered pursuant to Section 12(b) of the Act:
Title of Each Class | Trading Symbol(s) | Name of Each Exchange on Which Registered | ||||
Prologis, Inc. | Common Stock, $0.01 par value | PLD | New York Stock Exchange | |||
Prologis, L.P. | 3.000% Notes due 2026 | PLD/26 | New York Stock Exchange | |||
Prologis, L.P. | 2.250% Notes due 2029 | PLD/29 | New York Stock Exchange | |||
Indicate by check mark whether the registrant (1) has filed all reports required to be filed by Section 13 or 15(d) of the Securities Exchange Act of 1934 during the preceding 12 months (or for such shorter period that the registrant was required to file such reports), and (2) has been subject to such filing for the past 90 days.
Prologis, Inc. | Yes | ☒ | No | ☐ |
Prologis, L.P. | Yes | ☒ | No | ☐ |
Indicate by check mark whether the registrant has submitted electronically and posted on its corporate website; if any, every Interactive Data File required to be submitted and posted pursuant to Rule 405 of Regulation S-T (§232.405 of this chapter) during the preceding 12 months (or for such shorter periods that the registrant was required to submit and post such files).
Prologis, Inc. | Yes |
| No | ☐ |
Prologis, L.P. | Yes |
| No | ☐ |
Indicate by check mark whether the registrant is a large accelerated filer, an accelerated filer, a non-accelerated filer, or a smaller reporting company, or an emerging growth company. See definitions of “large accelerated filer”, “accelerated filer” andfiler,” “smaller reporting company,” and “emerging growth company” in Rule 12b-2 of the Exchange Act (check one):Act:
Prologis, Inc.: | |||||
Large accelerated filer☒ | Accelerated filer ☐ | Non-accelerated filer ☐ | Smaller reporting company ☐ | Emerging growth company ☐ |
Prologis, L.P.: | |||||
Large accelerated filer | Accelerated filer ☐ |
|
| Smaller reporting company ☐ | Emerging growth company ☐ |
| |||||
| |||||
|
|
|
|
| |
| |||||
If an emerging growth company, indicate by check mark if the registrant has elected not to use the extended transition period for complying with any new or revised financial accounting standards provided pursuant to Section 13(a) of the Exchange Act. ☐
Indicate by check mark whether the registrant is a shell company (as defined in Rule 12b-2 of the Securities Exchange Act of 1934).
Prologis, Inc. | Yes | ☐ | No | ☒ |
Prologis, L.P. | Yes | ☐ | No | ☒ |
The number of shares of Prologis, Inc.’s common stock outstanding at October 25, 2017,April 26, 2023, was approximately 532,082,000.923,466,000.
This report combines the quarterly reports on Form 10-Q for the period ended September 30, 2017,March 31, 2023, of Prologis, Inc. and Prologis, L.P. Unless stated otherwise or the context otherwise requires, references to “Prologis, Inc.” or the “Parent” mean Prologis, Inc. and its consolidated subsidiaries; and references to “Prologis, L.P.” or the “Operating Partnership” or the “OP” mean Prologis, L.P., and its consolidated subsidiaries. The terms “the Company,” “Prologis,” “we,” “our” or “us” means the Parent and the Operating PartnershipOP collectively.
The Parent is a real estate investment trust (“REIT”(a “REIT”) and the general partner of the Operating Partnership.OP. At September 30, 2017,March 31, 2023, the Parent owned an approximate 97.33%a 97.55% common general partnership interest in the Operating PartnershipOP and 100%substantially all of the preferred units in the Operating Partnership.OP. The remaining approximate 2.67%2.45% common limited partnership interests are owned by nonaffiliatedunaffiliated investors and certain current and former directors and officers of the Parent. As the sole general partner of the Operating Partnership, the Parent has complete responsibility and discretion in the day-to-day management and control of the Operating Partnership.
We operate the Parent and the Operating PartnershipOP as one enterprise. The management of the Parent consists of the same members as the management of the Operating Partnership.OP. These members are officers of the Parent and employees of the Operating PartnershipOP or one of its subsidiaries. As sole general partner, withthe Parent has control of the Operating Partnership,OP through complete responsibility and discretion in the Parentday-to-day management and therefore, consolidates the Operating PartnershipOP for financial reporting purposes. Because the only significant asset of the Parent is its investment in the Operating Partnership,OP, the assets and liabilities of the Parent and the Operating PartnershipOP are the same on their respective financial statements.
We believe combining the quarterly reports on Form 10-Q of the Parent and the Operating PartnershipOP into this single report results in the following benefits:
enhances investors’ understanding of the Parent and the Operating PartnershipOP by enabling investors to view the business as a whole in the same manner as management views and operates the business;
eliminates duplicative disclosure and provides a more streamlined and readable presentation as a substantial portion of the Company’s disclosure applies to both the Parent and the Operating Partnership;OP; and
creates time and cost efficiencies through the preparation of one combined report instead of two separate reports.
It is important to understand the few differences between the Parent and the Operating PartnershipOP in the context of how we operate the Company. The Parent does not conduct business itself, other than acting as the sole general partner of the Operating PartnershipOP and issuing public equity from time to time. The Parent itself does not incur any indebtedness, but it guarantees the unsecured debt of the Operating Partnership. The Operating PartnershipOP holds substantially all the assets of the business, directly or indirectly, and holds the ownership interests in the Company’s investment in certain entities.indirectly. The Operating PartnershipOP conducts the operations of the business and is structured as a partnership with no publicly traded equity. Except for net proceeds from equity issuances by the Parent, which are contributed to the Operating PartnershipOP in exchange for partnership units, the Operating PartnershipOP generates capital required by the business through the Operating Partnership’sOP’s operations, incurrence of indebtedness and issuance of partnership units to third parties.
The presentation of noncontrolling interests, stockholders’ equity and partners’ capital are the main areas of difference between the consolidated financial statements of the Parent and those of the Operating Partnership. OP. The differences in the presentations between stockholders’ equity and partners’ capital result from the differences in the equity and capital issuances in the Parent and in the OP.
The preferred stock, common stock, additional paid-in capital, accumulated other comprehensive lossincome (loss) and distributions in excess of net earnings of the Parent are presented as stockholders’ equity in the Parent’s consolidated financial statements. These items represent the common and preferred general partnership interests held by the Parent in the Operating PartnershipOP and are presented as general partner’s capital within partners’ capital in the Operating Partnership’sOP’s consolidated financial statements. The common limited partnership interests held by the limited partners in the Operating PartnershipOP are presented as noncontrolling interest within equity in the Parent’s consolidated financial statements and as limited partners’ capital within partners’ capital in the Operating Partnership’sOP’s consolidated financial statements. The differences in the presentations between stockholders’ equity and partners’ capital result from the differences in the equity and capital issuances at the Parent and Operating Partnership levels.
To highlight the differences between the Parent and the Operating Partnership,OP, separate sections in this report, as applicable, individually discuss the Parent and the Operating Partnership,OP, including separate financial statements and separate Exhibit 31 and 32 certifications. In the sections that combine disclosure of the Parent and the Operating Partnership,OP, this report refers to actions or holdings as being actions or holdings of Prologis.
PROLOGIS
INDEX
Page Number | |||||||
PART I. | |||||||
Item 1. | 1 | ||||||
Prologis, Inc.: | |||||||
Consolidated Balance Sheets – | 1 | ||||||
2 | |||||||
3 | |||||||
| |||||||
| |||||||
Prologis, L.P.: | |||||||
Consolidated Balance Sheets – |
| ||||||
| |||||||
| |||||||
| |||||||
| |||||||
Prologis, Inc. and Prologis, L.P.: | |||||||
| |||||||
| |||||||
11 | |||||||
12 | |||||||
13 | |||||||
| |||||||
| |||||||
| |||||||
| |||||||
| |||||||
Note |
| ||||||
| |||||||
| |||||||
| |||||||
Item 2. | Management’s Discussion and Analysis of Financial Condition and Results of Operations |
| |||||
Item 3. |
| ||||||
Item 4. |
| ||||||
PART II. | |||||||
Item 1. |
| ||||||
Item 1A. |
| ||||||
Item 2. |
| ||||||
Item 3. |
| ||||||
Item 4. | 50 | ||||||
Item 5. |
| ||||||
Item 6. |
| ||||||
PART I. FINANCIALFINANCIAL INFORMATION
PROLOGIS, INC.
(Unaudited)
(In thousands, except per share data)
|
|
|
|
|
| ||
| March 31, 2023 |
|
| December 31, 2022 |
| ||
ASSETS |
|
|
|
|
| ||
Investments in real estate properties | $ | 82,385,546 |
|
| $ | 81,623,396 |
|
Less accumulated depreciation |
| 9,508,351 |
|
|
| 9,036,085 |
|
Net investments in real estate properties |
| 72,877,195 |
|
|
| 72,587,311 |
|
Investments in and advances to unconsolidated entities |
| 9,680,097 |
|
|
| 9,698,898 |
|
Assets held for sale or contribution |
| 734,106 |
|
|
| 531,257 |
|
Net investments in real estate |
| 83,291,398 |
|
|
| 82,817,466 |
|
|
|
|
|
|
| ||
Cash and cash equivalents |
| 522,501 |
|
|
| 278,483 |
|
Other assets |
| 4,706,985 |
|
|
| 4,801,499 |
|
Total assets | $ | 88,520,884 |
|
| $ | 87,897,448 |
|
|
|
|
|
|
| ||
LIABILITIES AND EQUITY |
|
|
|
|
| ||
Liabilities: |
|
|
|
|
| ||
Debt | $ | 25,153,342 |
|
| $ | 23,875,961 |
|
Accounts payable and accrued expenses |
| 1,507,748 |
|
|
| 1,711,885 |
|
Other liabilities |
| 4,394,565 |
|
|
| 4,446,509 |
|
Total liabilities |
| 31,055,655 |
|
|
| 30,034,355 |
|
|
|
|
|
|
| ||
Equity: |
|
|
|
|
| ||
Prologis, Inc. stockholders’ equity: |
|
|
|
|
| ||
Series Q preferred stock at stated liquidation preference of $50 per share; $0.01 par value; |
| 63,948 |
|
|
| 63,948 |
|
Common stock; $0.01 par value; 923,453 shares and 923,142 shares issued and outstanding at |
| 9,235 |
|
|
| 9,231 |
|
Additional paid-in capital |
| 54,058,036 |
|
|
| 54,065,407 |
|
Accumulated other comprehensive loss |
| (496,424 | ) |
|
| (443,609 | ) |
Distributions in excess of net earnings |
| (799,577 | ) |
|
| (457,695 | ) |
Total Prologis, Inc. stockholders’ equity |
| 52,835,218 |
|
|
| 53,237,282 |
|
Noncontrolling interests |
| 4,630,011 |
|
|
| 4,625,811 |
|
Total equity |
| 57,465,229 |
|
|
| 57,863,093 |
|
Total liabilities and equity | $ | 88,520,884 |
|
| $ | 87,897,448 |
|
|
|
|
|
|
|
|
|
| September 30, 2017 |
|
| December 31, |
| ||
| (Unaudited) |
|
| 2016 |
| ||
ASSETS |
|
|
|
|
|
|
|
Investments in real estate properties | $ | 25,977,157 |
|
| $ | 27,119,330 |
|
Less accumulated depreciation |
| 3,977,667 |
|
|
| 3,758,372 |
|
Net investments in real estate properties |
| 21,999,490 |
|
|
| 23,360,958 |
|
Investments in and advances to unconsolidated entities |
| 5,371,758 |
|
|
| 4,230,429 |
|
Assets held for sale or contribution |
| 321,905 |
|
|
| 322,139 |
|
Notes receivable backed by real estate |
| - |
|
|
| 32,100 |
|
Net investments in real estate |
| 27,693,153 |
|
|
| 27,945,626 |
|
|
|
|
|
|
|
|
|
Cash and cash equivalents |
| 568,726 |
|
|
| 807,316 |
|
Other assets |
| 1,392,271 |
|
|
| 1,496,990 |
|
Total assets | $ | 29,654,150 |
|
| $ | 30,249,932 |
|
|
|
|
|
|
|
|
|
LIABILITIES AND EQUITY |
|
|
|
|
|
|
|
Liabilities: |
|
|
|
|
|
|
|
Debt | $ | 9,721,065 |
|
| $ | 10,608,294 |
|
Accounts payable and accrued expenses |
| 707,049 |
|
|
| 556,179 |
|
Other liabilities |
| 666,780 |
|
|
| 627,319 |
|
Total liabilities |
| 11,094,894 |
|
|
| 11,791,792 |
|
|
|
|
|
|
|
|
|
Equity: |
|
|
|
|
|
|
|
Prologis, Inc. stockholders’ equity: |
|
|
|
|
|
|
|
Series Q preferred stock at stated liquidation preference of $50 per share: $0.01 par value; 1,565 shares issued and outstanding and 100,000 preferred shares authorized at September 30, 2017, and December 31, 2016 |
| 78,235 |
|
|
| 78,235 |
|
Common stock: $0.01 par value; 532,081 shares and 528,671 shares issued and outstanding at September 30, 2017, and December 31, 2016, respectively |
| 5,321 |
|
|
| 5,287 |
|
Additional paid-in capital |
| 19,350,643 |
|
|
| 19,455,039 |
|
Accumulated other comprehensive loss |
| (924,620 | ) |
|
| (937,473 | ) |
Distributions in excess of net earnings |
| (2,965,828 | ) |
|
| (3,610,007 | ) |
Total Prologis, Inc. stockholders’ equity |
| 15,543,751 |
|
|
| 14,991,081 |
|
Noncontrolling interests |
| 3,015,505 |
|
|
| 3,467,059 |
|
Total equity |
| 18,559,256 |
|
|
| 18,458,140 |
|
Total liabilities and equity | $ | 29,654,150 |
|
| $ | 30,249,932 |
|
The accompanying notes are an integral part of these Consolidated Financial Statements.
1
CONSOLIDATED STATEMENTS OF INCOME
(Unaudited)
(In thousands, except per share amounts)
|
| Three Months Ended |
|
| Nine Months Ended |
|
| Three Months Ended |
|
| |||||||||||||||
|
| September 30, |
|
| September 30, |
|
| March 31, |
|
| |||||||||||||||
|
| 2017 |
|
| 2016 |
|
| 2017 |
|
| 2016 |
|
| 2023 |
|
| 2022 |
|
| ||||||
Revenues: |
|
|
|
|
|
|
|
|
|
|
|
|
|
|
|
|
|
|
|
|
|
| |||
Rental |
| $ | 416,427 |
|
| $ | 435,868 |
|
| $ | 1,304,271 |
|
| $ | 1,299,122 |
|
| $ | 1,633,770 |
|
| $ | 1,076,861 |
|
|
Rental recoveries |
|
| 114,755 |
|
|
| 124,409 |
|
|
| 370,221 |
|
|
| 361,402 |
| |||||||||
Strategic capital |
|
| 68,042 |
|
|
| 142,581 |
|
|
| 305,741 |
|
|
| 247,119 |
|
|
| 134,701 |
|
|
| 133,925 |
|
|
Development management and other |
|
| 3,650 |
|
|
| 1,707 |
|
|
| 17,979 |
|
|
| 5,377 |
|
|
| 116 |
|
|
| 8,342 |
|
|
Total revenues |
|
| 602,874 |
|
|
| 704,565 |
|
|
| 1,998,212 |
|
|
| 1,913,020 |
|
|
| 1,768,587 |
|
|
| 1,219,128 |
|
|
Expenses: |
|
|
|
|
|
|
|
|
|
|
|
|
|
|
|
|
|
|
|
|
|
| |||
Rental |
|
| 128,735 |
|
|
| 140,514 |
|
|
| 429,185 |
|
|
| 427,820 |
|
|
| 412,554 |
|
|
| 275,674 |
|
|
Strategic capital |
|
| 35,996 |
|
|
| 44,624 |
|
|
| 119,781 |
|
|
| 97,783 |
|
|
| 71,709 |
|
|
| 51,811 |
|
|
General and administrative |
|
| 57,656 |
|
|
| 58,157 |
|
|
| 171,350 |
|
|
| 165,634 |
|
|
| 99,777 |
|
|
| 74,646 |
|
|
Depreciation and amortization |
|
| 201,903 |
|
|
| 224,867 |
|
|
| 656,639 |
|
|
| 705,249 |
|
|
| 602,367 |
|
|
| 396,647 |
|
|
Other |
|
| 3,093 |
|
|
| 3,779 |
|
|
| 8,608 |
|
|
| 12,364 |
|
|
| 7,184 |
|
|
| 9,589 |
|
|
Total expenses |
|
| 427,383 |
|
|
| 471,941 |
|
|
| 1,385,563 |
|
|
| 1,408,850 |
|
|
| 1,193,591 |
|
|
| 808,367 |
|
|
|
|
|
|
|
|
|
|
|
|
|
|
|
|
|
|
|
|
|
|
|
|
| |||
Operating income before gains on real estate transactions, net |
|
| 574,996 |
|
|
| 410,761 |
|
| ||||||||||||||||
Gains on dispositions of development properties and land, net |
|
| - |
|
|
| 210,206 |
|
| ||||||||||||||||
Gains on other dispositions of investments in real estate, net |
|
| 4,047 |
|
|
| 584,835 |
|
| ||||||||||||||||
Operating income |
|
| 175,491 |
|
|
| 232,624 |
|
|
| 612,649 |
|
|
| 504,170 |
|
|
| 579,043 |
|
|
| 1,205,802 |
|
|
|
|
|
|
|
|
|
|
|
|
|
|
|
|
|
|
|
|
|
|
|
|
| |||
Other income (expense): |
|
|
|
|
|
|
|
|
|
|
|
|
|
|
|
|
|
|
|
|
|
| |||
Earnings from unconsolidated entities, net |
|
| 55,066 |
|
|
| 45,857 |
|
|
| 172,267 |
|
|
| 145,622 |
|
|
| 75,779 |
|
|
| 76,962 |
|
|
Interest expense |
|
| (64,190 | ) |
|
| (75,310 | ) |
|
| (212,456 | ) |
|
| (232,577 | ) |
|
| (136,011 | ) |
|
| (64,064 | ) |
|
Interest and other income, net |
|
| 4,816 |
|
|
| 2,932 |
|
|
| 9,493 |
|
|
| 7,051 |
| |||||||||
Gains on dispositions of investments in real estate and revaluation of equity investments upon acquisition of a controlling interest, net |
|
| 779,053 |
|
|
| 117,296 |
|
|
| 959,384 |
|
|
| 461,963 |
| |||||||||
Foreign currency and derivative losses, net |
|
| (18,872 | ) |
|
| (1,730 | ) |
|
| (46,327 | ) |
|
| (26,277 | ) | |||||||||
Foreign currency and derivative gains and other income, net |
|
| 8,614 |
|
|
| 48,409 |
|
| ||||||||||||||||
Gains (losses) on early extinguishment of debt, net |
|
| - |
|
|
| 1,492 |
|
|
| (30,596 | ) |
|
| 2,484 |
|
|
| 3,275 |
|
|
| (18,165 | ) |
|
Total other income |
|
| 755,873 |
|
|
| 90,537 |
|
|
| 851,765 |
|
|
| 358,266 |
| |||||||||
Total other income (expense) |
|
| (48,343 | ) |
|
| 43,142 |
|
| ||||||||||||||||
Earnings before income taxes |
|
| 931,364 |
|
|
| 323,161 |
|
|
| 1,464,414 |
|
|
| 862,436 |
|
|
| 530,700 |
|
|
| 1,248,944 |
|
|
Total income tax expense |
|
| 17,947 |
|
|
| 15,919 |
|
|
| 42,328 |
|
|
| 36,598 |
| |||||||||
Income tax expense |
|
| (32,071 | ) |
|
| (29,222 | ) |
| ||||||||||||||||
Consolidated net earnings |
|
| 913,417 |
|
|
| 307,242 |
|
|
| 1,422,086 |
|
|
| 825,838 |
|
|
| 498,629 |
|
|
| 1,219,722 |
|
|
Less net earnings attributable to noncontrolling interests |
|
| 35,524 |
|
|
| 26,316 |
|
|
| 70,647 |
|
|
| 58,103 |
|
|
| 34,006 |
|
|
| 68,937 |
|
|
Net earnings attributable to controlling interests |
|
| 877,893 |
|
|
| 280,926 |
|
|
| 1,351,439 |
|
|
| 767,735 |
|
|
| 464,623 |
|
|
| 1,150,785 |
|
|
Less preferred stock dividends |
|
| 1,675 |
|
|
| 1,671 |
|
|
| 5,023 |
|
|
| 5,056 |
|
|
| 1,453 |
|
|
| 1,531 |
|
|
Net earnings attributable to common stockholders |
| $ | 876,218 |
|
| $ | 279,255 |
|
| $ | 1,346,416 |
|
| $ | 762,679 |
|
| $ | 463,170 |
|
| $ | 1,149,254 |
|
|
|
|
|
|
|
|
|
|
|
|
|
|
|
|
|
|
|
|
|
|
|
|
|
| ||
Weighted average common shares outstanding – Basic |
|
| 531,288 |
|
|
| 527,288 |
|
|
| 530,036 |
|
|
| 525,462 |
|
|
| 923,888 |
|
|
| 740,368 |
|
|
Weighted average common shares outstanding – Diluted |
|
| 554,163 |
|
|
| 547,200 |
|
|
| 551,618 |
|
|
| 545,228 |
|
|
| 951,624 |
|
|
| 765,517 |
|
|
|
|
|
|
|
|
|
|
|
|
|
|
|
|
|
|
|
|
|
|
|
|
| |||
Net earnings per share attributable to common stockholders – Basic |
| $ | 1.65 |
|
| $ | 0.53 |
|
| $ | 2.54 |
|
| $ | 1.45 |
|
| $ | 0.50 |
|
| $ | 1.55 |
|
|
|
|
|
|
|
|
|
|
|
|
|
|
|
|
|
|
|
|
|
|
|
|
| |||
Net earnings per share attributable to common stockholders – Diluted |
| $ | 1.63 |
|
| $ | 0.52 |
|
| $ | 2.51 |
|
| $ | 1.44 |
|
| $ | 0.50 |
|
| $ | 1.54 |
|
|
|
|
|
|
|
|
|
|
|
|
|
|
|
|
|
|
| |||||||||
Dividends per common share |
| $ | 0.44 |
|
| $ | 0.42 |
|
| $ | 1.32 |
|
| $ | 1.26 |
| |||||||||
The accompanying notes are an integral part of these Consolidated Financial Statements.
2
2
PROLOGIS, INC.
CONSOLIDATED STATEMENTS OF COMPREHENSIVE INCOME
(Unaudited)
(In thousands)
|
| Three Months Ended |
|
| Nine Months Ended |
|
| Three Months Ended |
| |||||||||||||||
|
| September 30, |
|
| September 30, |
|
| March 31, |
| |||||||||||||||
|
| 2017 |
|
| 2016 |
|
| 2017 |
|
| 2016 |
|
| 2023 |
|
| 2022 |
| ||||||
Consolidated net earnings |
| $ | 913,417 |
|
| $ | 307,242 |
|
| $ | 1,422,086 |
|
| $ | 825,838 |
|
| $ | 498,629 |
|
| $ | 1,219,722 |
|
Other comprehensive income (loss): |
|
|
|
|
|
|
|
|
|
|
|
|
|
|
|
|
|
|
|
|
| |||
Foreign currency translation gains (losses), net |
|
| 4,061 |
|
|
| (48,232 | ) |
|
| 46,890 |
|
|
| (69,832 | ) |
|
| (28,101 | ) |
|
| 189,523 |
|
Unrealized gains (losses) on derivative contracts, net |
|
| 6,091 |
|
|
| 4,696 |
|
|
| 15,457 |
|
|
| (17,122 | ) |
|
| (25,853 | ) |
|
| 13,349 |
|
Comprehensive income |
|
| 923,569 |
|
|
| 263,706 |
|
|
| 1,484,433 |
|
|
| 738,884 |
|
|
| 444,675 |
|
|
| 1,422,594 |
|
Net earnings attributable to noncontrolling interests |
|
| (35,524 | ) |
|
| (26,316 | ) |
|
| (70,647 | ) |
|
| (58,103 | ) |
|
| (34,006 | ) |
|
| (68,937 | ) |
Other comprehensive loss (income) attributable to noncontrolling interests |
|
| (576 | ) |
|
| 2,392 |
|
|
| (49,494 | ) |
|
| (10,840 | ) |
|
| 1,139 |
|
|
| (5,739 | ) |
Comprehensive income attributable to common stockholders |
| $ | 887,469 |
|
| $ | 239,782 |
|
| $ | 1,364,292 |
|
| $ | 669,941 |
|
| $ | 411,808 |
|
| $ | 1,347,918 |
|
|
|
|
|
|
|
|
|
|
|
|
|
|
|
|
|
|
|
|
|
|
| |||
The accompanying notes are an integral part of these Consolidated Financial Statements.
3
CONSOLIDATED STATEMENTSTATEMENTS OF EQUITY
Nine(Unaudited)
(In thousands)
Three Months Ended September 30, 2017March 31, 2023 and 2022
(Unaudited)
|
|
|
| Common Stock |
|
|
|
|
| Accumulated |
|
| Distributions |
|
|
|
|
|
|
| |||||||||||
|
|
|
| Number |
|
|
|
|
| Additional |
|
| Other |
|
| in Excess of |
|
| Non- |
|
|
|
| ||||||||
| Preferred |
|
| of |
|
| Par |
|
| Paid-in |
|
| Comprehensive |
|
| Net |
|
| controlling |
|
| Total |
| ||||||||
| Stock |
|
| Shares |
|
| Value |
|
| Capital |
|
| Loss |
|
| Earnings |
|
| Interests |
|
| Equity |
| ||||||||
Balance at January 1, 2023 | $ | 63,948 |
|
|
| 923,142 |
|
| $ | 9,231 |
|
| $ | 54,065,407 |
|
| $ | (443,609 | ) |
| $ | (457,695 | ) |
| $ | 4,625,811 |
|
| $ | 57,863,093 |
|
Consolidated net earnings |
| - |
|
|
| - |
|
|
| - |
|
|
| - |
|
|
| - |
|
|
| 464,623 |
|
|
| 34,006 |
|
|
| 498,629 |
|
Effect of equity compensation plans |
| - |
|
|
| 288 |
|
|
| 4 |
|
|
| 13,468 |
|
|
| - |
|
|
| - |
|
|
| 51,416 |
|
|
| 64,888 |
|
Capital contributions |
| - |
|
|
| - |
|
|
| - |
|
|
| - |
|
|
| - |
|
|
| - |
|
|
| - |
|
|
| - |
|
Redemption of noncontrolling interests |
| - |
|
|
| 23 |
|
|
| - |
|
|
| 1,304 |
|
|
| - |
|
|
| - |
|
|
| (43,573 | ) |
|
| (42,269 | ) |
Foreign currency translation losses, net |
| - |
|
|
| - |
|
|
| - |
|
|
| - |
|
|
| (27,595 | ) |
|
| - |
|
|
| (506 | ) |
|
| (28,101 | ) |
Unrealized losses on derivative |
| - |
|
|
| - |
|
|
| - |
|
|
| - |
|
|
| (25,220 | ) |
|
| - |
|
|
| (633 | ) |
|
| (25,853 | ) |
Reallocation of equity |
| - |
|
|
| - |
|
|
| - |
|
|
| (22,143 | ) |
|
| - |
|
|
| - |
|
|
| 22,143 |
|
|
| - |
|
Dividends ($0.87 per common share) |
| - |
|
|
| - |
|
|
| - |
|
|
| - |
|
|
| - |
|
|
| (806,505 | ) |
|
| (58,653 | ) |
|
| (865,158 | ) |
Balance at March 31, 2023 | $ | 63,948 |
|
|
| 923,453 |
|
| $ | 9,235 |
|
| $ | 54,058,036 |
|
| $ | (496,424 | ) |
| $ | (799,577 | ) |
| $ | 4,630,011 |
|
| $ | 57,465,229 |
|
|
|
|
| Common Stock |
|
|
|
|
| Accumulated |
|
| Distributions |
|
|
|
|
|
|
| |||||||||||
|
|
|
| Number |
|
|
|
|
| Additional |
|
| Other |
|
| in Excess of |
|
| Non- |
|
|
|
| ||||||||
| Preferred |
|
| of |
|
| Par |
|
| Paid-in |
|
| Comprehensive |
|
| Net |
|
| controlling |
|
| Total |
| ||||||||
| Stock |
|
| Shares |
|
| Value |
|
| Capital |
|
| Income (Loss) |
|
| Earnings |
|
| Interests |
|
| Equity |
| ||||||||
Balance at January 1, 2022 | $ | 63,948 |
|
|
| 739,827 |
|
| $ | 7,398 |
|
| $ | 35,561,608 |
|
| $ | (878,253 | ) |
| $ | (1,327,828 | ) |
| $ | 4,315,337 |
|
| $ | 37,742,210 |
|
Consolidated net earnings |
| - |
|
|
| - |
|
|
| - |
|
|
| - |
|
|
| - |
|
|
| 1,150,785 |
|
|
| 68,937 |
|
|
| 1,219,722 |
|
Effect of equity compensation plans |
| - |
|
|
| 290 |
|
|
| 3 |
|
|
| 4,217 |
|
|
| - |
|
|
| - |
|
|
| 35,947 |
|
|
| 40,167 |
|
Capital contributions |
| - |
|
|
| - |
|
|
| - |
|
|
| - |
|
|
| - |
|
|
| - |
|
|
| 434 |
|
|
| 434 |
|
Redemption of noncontrolling interests |
| - |
|
|
| 72 |
|
|
| 1 |
|
|
| 3,300 |
|
|
| - |
|
|
| - |
|
|
| (29,570 | ) |
|
| (26,269 | ) |
Foreign currency translation gains, net |
| - |
|
|
| - |
|
|
| - |
|
|
| - |
|
|
| 184,152 |
|
|
| - |
|
|
| 5,371 |
|
|
| 189,523 |
|
Unrealized gains on derivative |
| - |
|
|
| - |
|
|
| - |
|
|
| - |
|
|
| 12,981 |
|
|
| - |
|
|
| 368 |
|
|
| 13,349 |
|
Reallocation of equity |
| - |
|
|
| - |
|
|
| - |
|
|
| (22,852 | ) |
|
| - |
|
|
| - |
|
|
| 22,852 |
|
|
| - |
|
Dividends ($0.79 per common share) |
| - |
|
|
| - |
|
|
| - |
|
|
| (10 | ) |
|
| - |
|
|
| (587,382 | ) |
|
| (129,542 | ) |
|
| (716,934 | ) |
Balance at March 31, 2022 | $ | 63,948 |
|
|
| 740,189 |
|
| $ | 7,402 |
|
| $ | 35,546,263 |
|
| $ | (681,120 | ) |
| $ | (764,425 | ) |
| $ | 4,290,134 |
|
| $ | 38,462,202 |
|
(In thousands)
|
|
|
|
| Common Stock |
|
|
|
|
|
| Accumulated |
|
| Distributions |
|
|
|
|
|
|
|
|
| |||||||
|
|
|
|
| Number |
|
|
|
|
|
| Additional |
|
| Other |
|
| in Excess of |
|
| Non- |
|
|
|
|
| |||||
| Preferred |
|
| of |
|
| Par |
|
| Paid-in |
|
| Comprehensive |
|
| Net |
|
| controlling |
|
| Total |
| ||||||||
| Stock |
|
| Shares |
|
| Value |
|
| Capital |
|
| Loss |
|
| Earnings |
|
| Interests |
|
| Equity |
| ||||||||
Balance at January 1, 2017 | $ | 78,235 |
|
|
| 528,671 |
|
| $ | 5,287 |
|
| $ | 19,455,039 |
|
| $ | (937,473 | ) |
| $ | (3,610,007 | ) |
| $ | 3,467,059 |
|
| $ | 18,458,140 |
|
Consolidated net earnings |
| - |
|
|
| - |
|
|
| - |
|
|
| - |
|
|
| - |
|
|
| 1,351,439 |
|
|
| 70,647 |
|
|
| 1,422,086 |
|
Effect of equity compensation plans |
| - |
|
|
| 1,895 |
|
|
| 19 |
|
|
| 58,679 |
|
|
| - |
|
|
| - |
|
|
| 29,980 |
|
|
| 88,678 |
|
Capital contributions |
| - |
|
|
| - |
|
|
| - |
|
|
| - |
|
|
| - |
|
|
| - |
|
|
| 150,076 |
|
|
| 150,076 |
|
Settlement of noncontrolling interests |
| - |
|
|
| - |
|
|
| - |
|
|
| (202,040 | ) |
|
| - |
|
|
| - |
|
|
| (587,976 | ) |
|
| (790,016 | ) |
Conversion of noncontrolling interests |
| - |
|
|
| 1,515 |
|
|
| 15 |
|
|
| 47,711 |
|
|
| - |
|
|
| - |
|
|
| (47,726 | ) |
|
| - |
|
Foreign currency translation gains (losses), net |
| - |
|
|
| - |
|
|
| - |
|
|
| - |
|
|
| (2,191 | ) |
|
| - |
|
|
| 49,081 |
|
|
| 46,890 |
|
Unrealized gains on derivative contracts, net |
| - |
|
|
| - |
|
|
| - |
|
|
| - |
|
|
| 15,044 |
|
|
| - |
|
|
| 413 |
|
|
| 15,457 |
|
Reallocation of equity |
| - |
|
|
| - |
|
|
| - |
|
|
| (8,712 | ) |
|
| - |
|
|
| - |
|
|
| 8,712 |
|
|
| - |
|
Distributions and other |
| - |
|
|
| - |
|
|
| - |
|
|
| (34 | ) |
|
| - |
|
|
| (707,260 | ) |
|
| (124,761 | ) |
|
| (832,055 | ) |
Balance at September 30, 2017 | $ | 78,235 |
|
|
| 532,081 |
|
| $ | 5,321 |
|
| $ | 19,350,643 |
|
| $ | (924,620 | ) |
| $ | (2,965,828 | ) |
| $ | 3,015,505 |
|
| $ | 18,559,256 |
|
The accompanying notes are an integral part of these Consolidated Financial Statements.
4
CONSOLIDATED STATEMENTS OF CASH FLOWS
(Unaudited)
(In thousands)
|
| Nine Months Ended |
|
| Three Months Ended |
| ||||||||||
|
| September 30, |
|
| March 31, |
| ||||||||||
|
| 2017 |
|
| 2016 |
|
| 2023 |
|
| 2022 |
| ||||
Operating activities: |
|
|
|
|
|
|
|
|
|
|
|
|
| |||
Consolidated net earnings |
| $ | 1,422,086 |
|
| $ | 825,838 |
|
| $ | 498,629 |
|
| $ | 1,219,722 |
|
Adjustments to reconcile net earnings to net cash provided by operating activities: |
|
|
|
|
|
|
|
|
|
|
|
|
| |||
Straight-lined rents and amortization of above and below market leases |
|
| (66,234 | ) |
|
| (74,664 | ) |
|
| (143,686 | ) |
|
| (37,374 | ) |
Equity-based compensation awards |
|
| 58,091 |
|
|
| 43,658 |
|
|
| 62,906 |
|
|
| 41,429 |
|
Depreciation and amortization |
|
| 656,639 |
|
|
| 705,249 |
|
|
| 602,367 |
|
|
| 396,647 |
|
Earnings from unconsolidated entities, net |
|
| (172,267 | ) |
|
| (145,622 | ) |
|
| (75,779 | ) |
|
| (76,962 | ) |
Distributions from unconsolidated entities |
|
| 231,441 |
|
|
| 210,439 |
| ||||||||
Net increase in operating receivables from unconsolidated entities |
|
| (19,530 | ) |
|
| (56,992 | ) | ||||||||
Amortization of debt premiums, net of debt issuance costs |
|
| (1,585 | ) |
|
| (13,047 | ) | ||||||||
Gains on dispositions of investments in real estate, net |
|
| (959,384 | ) |
|
| (461,963 | ) | ||||||||
Unrealized foreign currency and derivative losses, net |
|
| 55,646 |
|
|
| 21,266 |
| ||||||||
Operating distributions from unconsolidated entities |
|
| 135,081 |
|
|
| 95,665 |
| ||||||||
Decrease (increase) in operating receivables from unconsolidated entities |
|
| 51,164 |
|
|
| (819 | ) | ||||||||
Amortization of debt discounts and debt issuance costs, net |
|
| 17,623 |
|
|
| 1,980 |
| ||||||||
Gains on dispositions of development properties and land, net |
|
| - |
|
|
| (210,206 | ) | ||||||||
Gains on other dispositions of investments in real estate, net |
|
| (4,047 | ) |
|
| (584,835 | ) | ||||||||
Unrealized foreign currency and derivative losses (gains), net |
|
| 10,113 |
|
|
| (33,273 | ) | ||||||||
Losses (gains) on early extinguishment of debt, net |
|
| 30,596 |
|
|
| (2,484 | ) |
|
| (3,275 | ) |
|
| 18,165 |
|
Deferred income tax benefit |
|
| (197 | ) |
|
| (1,737 | ) | ||||||||
Decrease (increase) in accounts receivable and other assets |
|
| 76,170 |
|
|
| (48,231 | ) | ||||||||
Increase (decrease) in accounts payable and accrued expenses and other liabilities |
|
| 48,841 |
|
|
| (4,699 | ) | ||||||||
Deferred income tax expense |
|
| 3,577 |
|
|
| 7,492 |
| ||||||||
Decrease in other assets |
|
| 21,742 |
|
|
| 107,702 |
| ||||||||
Decrease in accounts payable and accrued expenses and other liabilities |
|
| (62,118 | ) |
|
| (103,806 | ) | ||||||||
Net cash provided by operating activities |
|
| 1,360,313 |
|
|
| 997,011 |
|
|
| 1,114,297 |
|
|
| 841,527 |
|
Investing activities: |
|
|
|
|
|
|
|
|
|
|
|
|
| |||
Real estate development |
|
| (1,095,623 | ) |
|
| (1,225,613 | ) |
|
| (936,921 | ) |
|
| (639,636 | ) |
Real estate acquisitions |
|
| (295,178 | ) |
|
| (280,797 | ) |
|
| (51,866 | ) |
|
| (451,343 | ) |
Duke Transaction, net of cash acquired |
|
| (3,828 | ) |
|
| - |
| ||||||||
Tenant improvements and lease commissions on previously leased space |
|
| (112,442 | ) |
|
| (125,041 | ) |
|
| (78,955 | ) |
|
| (85,024 | ) |
Nondevelopment capital expenditures |
|
| (68,698 | ) |
|
| (66,298 | ) | ||||||||
Proceeds from dispositions and contributions of real estate properties |
|
| 2,354,547 |
|
|
| 1,859,317 |
| ||||||||
Property improvements |
|
| (19,302 | ) |
|
| (18,280 | ) | ||||||||
Proceeds from dispositions and contributions of real estate |
|
| 54,903 |
|
|
| 1,495,260 |
| ||||||||
Investments in and advances to unconsolidated entities |
|
| (244,301 | ) |
|
| (228,588 | ) |
|
| (39,677 | ) |
|
| (34,811 | ) |
Acquisition of a controlling interest in an unconsolidated venture, net of cash received |
|
| (374,605 | ) |
|
| - |
| ||||||||
Return of investment from unconsolidated entities |
|
| 143,604 |
|
|
| 579,134 |
|
|
| 21,169 |
|
|
| 14,302 |
|
Proceeds from repayment of notes receivable backed by real estate |
|
| 32,100 |
|
|
| 201,250 |
| ||||||||
Proceeds from the settlement of net investment hedges |
|
| 7,541 |
|
|
| 16,768 |
|
|
| 5,323 |
|
|
| 3,732 |
|
Payments on the settlement of net investment hedges |
|
| (5,058 | ) |
|
| - |
|
|
| - |
|
|
| (771 | ) |
Net cash provided by investing activities |
|
| 341,887 |
|
|
| 730,132 |
| ||||||||
Net cash provided by (used in) investing activities |
|
| (1,049,154 | ) |
|
| 283,429 |
| ||||||||
Financing activities: |
|
|
|
|
|
|
|
|
|
|
|
|
| |||
Proceeds from issuance of common stock |
|
| 30,684 |
|
|
| 38,101 |
| ||||||||
Dividends paid on common and preferred stock |
|
| (707,260 | ) |
|
| (669,384 | ) |
|
| (806,505 | ) |
|
| (587,382 | ) |
Noncontrolling interests contributions |
|
| 135,857 |
|
|
| 1,026 |
|
|
| - |
|
|
| 434 |
|
Noncontrolling interests distributions |
|
| (132,004 | ) |
|
| (301,268 | ) |
|
| (58,653 | ) |
|
| (129,542 | ) |
Purchase of noncontrolling interests |
|
| (790,016 | ) |
|
| (2,979 | ) | ||||||||
Tax paid for shares withheld |
|
| (19,626 | ) |
|
| (7,862 | ) | ||||||||
Settlement of noncontrolling interests |
|
| (42,269 | ) |
|
| (26,269 | ) | ||||||||
Tax paid with shares withheld |
|
| (18,690 | ) |
|
| (22,602 | ) | ||||||||
Debt and equity issuance costs paid |
|
| (7,020 | ) |
|
| (19,265 | ) |
|
| (17,868 | ) |
|
| (8,058 | ) |
Net payments on credit facilities |
|
| (33,745 | ) |
|
| (3,545 | ) |
|
| (1,337,857 | ) |
|
| (492,552 | ) |
Repurchase and payments of debt |
|
| (2,728,198 | ) |
|
| (1,675,818 | ) | ||||||||
Proceeds from issuance of debt |
|
| 2,294,041 |
|
|
| 1,012,331 |
| ||||||||
Net cash used in financing activities |
|
| (1,957,287 | ) |
|
| (1,628,663 | ) | ||||||||
Repurchase of and payments on debt |
|
| (90,793 | ) |
|
| (332,995 | ) | ||||||||
Proceeds from the issuance of debt |
|
| 2,545,042 |
|
|
| 1,841,450 |
| ||||||||
Net cash provided by financing activities |
|
| 172,407 |
|
|
| 242,484 |
| ||||||||
|
|
|
|
|
|
|
|
|
|
|
|
|
| |||
Effect of foreign currency exchange rate changes on cash |
|
| 16,497 |
|
|
| 12,560 |
|
|
| 6,468 |
|
|
| (10,807 | ) |
Net increase (decrease) in cash and cash equivalents |
|
| (238,590 | ) |
|
| 111,040 |
| ||||||||
Net increase in cash and cash equivalents |
|
| 244,018 |
|
|
| 1,356,633 |
| ||||||||
Cash and cash equivalents, beginning of period |
|
| 807,316 |
|
|
| 264,080 |
|
|
| 278,483 |
|
|
| 556,117 |
|
Cash and cash equivalents, end of period |
| $ | 568,726 |
|
| $ | 375,120 |
|
| $ | 522,501 |
|
| $ | 1,912,750 |
|
See Note 1112 for information on noncash investing and financing activities and other information.
The accompanying notes are an integral part of these Consolidated Financial Statements.
5
PROLOGIS, L.P.
(Unaudited)
(In thousands)
|
|
|
|
|
| ||
| March 31, 2023 |
|
| December 31, 2022 |
| ||
ASSETS |
|
|
|
|
| ||
Investments in real estate properties | $ | 82,385,546 |
|
| $ | 81,623,396 |
|
Less accumulated depreciation |
| 9,508,351 |
|
|
| 9,036,085 |
|
Net investments in real estate properties |
| 72,877,195 |
|
|
| 72,587,311 |
|
Investments in and advances to unconsolidated entities |
| 9,680,097 |
|
|
| 9,698,898 |
|
Assets held for sale or contribution |
| 734,106 |
|
|
| 531,257 |
|
Net investments in real estate |
| 83,291,398 |
|
|
| 82,817,466 |
|
|
|
|
|
|
| ||
Cash and cash equivalents |
| 522,501 |
|
|
| 278,483 |
|
Other assets |
| 4,706,985 |
|
|
| 4,801,499 |
|
Total assets | $ | 88,520,884 |
|
| $ | 87,897,448 |
|
|
|
|
|
|
| ||
LIABILITIES AND CAPITAL |
|
|
|
|
| ||
Liabilities: |
|
|
|
|
| ||
Debt | $ | 25,153,342 |
|
| $ | 23,875,961 |
|
Accounts payable and accrued expenses |
| 1,507,748 |
|
|
| 1,711,885 |
|
Other liabilities |
| 4,394,565 |
|
|
| 4,446,509 |
|
Total liabilities |
| 31,055,655 |
|
|
| 30,034,355 |
|
|
|
|
|
|
| ||
Capital: |
|
|
|
|
| ||
Partners’ capital: |
|
|
|
|
| ||
General partner – preferred |
| 63,948 |
|
|
| 63,948 |
|
General partner – common |
| 52,771,270 |
|
|
| 53,173,334 |
|
Limited partners – common |
| 862,734 |
|
|
| 843,263 |
|
Limited partners – Class A common |
| 462,634 |
|
|
| 464,781 |
|
Total partners’ capital |
| 54,160,586 |
|
|
| 54,545,326 |
|
Noncontrolling interests |
| 3,304,643 |
|
|
| 3,317,767 |
|
Total capital |
| 57,465,229 |
|
|
| 57,863,093 |
|
Total liabilities and capital | $ | 88,520,884 |
|
| $ | 87,897,448 |
|
|
|
|
|
|
|
|
|
| September 30, 2017 |
|
| December 31, |
| ||
| (Unaudited) |
|
| 2016 |
| ||
ASSETS |
|
|
|
|
|
|
|
Investments in real estate properties | $ | 25,977,157 |
|
| $ | 27,119,330 |
|
Less accumulated depreciation |
| 3,977,667 |
|
|
| 3,758,372 |
|
Net investments in real estate properties |
| 21,999,490 |
|
|
| 23,360,958 |
|
Investments in and advances to unconsolidated entities |
| 5,371,758 |
|
|
| 4,230,429 |
|
Assets held for sale or contribution |
| 321,905 |
|
|
| 322,139 |
|
Notes receivable backed by real estate |
| - |
|
|
| 32,100 |
|
Net investments in real estate |
| 27,693,153 |
|
|
| 27,945,626 |
|
|
|
|
|
|
|
|
|
Cash and cash equivalents |
| 568,726 |
|
|
| 807,316 |
|
Other assets |
| 1,392,271 |
|
|
| 1,496,990 |
|
Total assets | $ | 29,654,150 |
|
| $ | 30,249,932 |
|
|
|
|
|
|
|
|
|
LIABILITIES AND CAPITAL |
|
|
|
|
|
|
|
Liabilities: |
|
|
|
|
|
|
|
Debt | $ | 9,721,065 |
|
| $ | 10,608,294 |
|
Accounts payable and accrued expenses |
| 707,049 |
|
|
| 556,179 |
|
Other liabilities |
| 666,780 |
|
|
| 627,319 |
|
Total liabilities |
| 11,094,894 |
|
|
| 11,791,792 |
|
|
|
|
|
|
|
|
|
Capital: |
|
|
|
|
|
|
|
Partners’ capital: |
|
|
|
|
|
|
|
General partner – preferred |
| 78,235 |
|
|
| 78,235 |
|
General partner – common |
| 15,465,516 |
|
|
| 14,912,846 |
|
Limited partners – common |
| 174,354 |
|
|
| 150,173 |
|
Limited partners – Class A common |
| 249,607 |
|
|
| 244,417 |
|
Total partners’ capital |
| 15,967,712 |
|
|
| 15,385,671 |
|
Noncontrolling interests |
| 2,591,544 |
|
|
| 3,072,469 |
|
Total capital |
| 18,559,256 |
|
|
| 18,458,140 |
|
Total liabilities and capital | $ | 29,654,150 |
|
| $ | 30,249,932 |
|
The accompanying notes are an integral part of these Consolidated Financial Statements.
CONSOLIDATED STATEMENTS OF INCOME
(Unaudited)
(In thousands, except per unit amounts)
|
| Three Months Ended |
|
| Nine Months Ended |
| ||||||||||
|
| September 30, |
|
| September 30, |
| ||||||||||
|
| 2017 |
|
| 2016 |
|
| 2017 |
|
| 2016 |
| ||||
Revenues: |
|
|
|
|
|
|
|
|
|
|
|
|
|
|
|
|
Rental |
| $ | 416,427 |
|
| $ | 435,868 |
|
| $ | 1,304,271 |
|
| $ | 1,299,122 |
|
Rental recoveries |
|
| 114,755 |
|
|
| 124,409 |
|
|
| 370,221 |
|
|
| 361,402 |
|
Strategic capital |
|
| 68,042 |
|
|
| 142,581 |
|
|
| 305,741 |
|
|
| 247,119 |
|
Development management and other |
|
| 3,650 |
|
|
| 1,707 |
|
|
| 17,979 |
|
|
| 5,377 |
|
Total revenues |
|
| 602,874 |
|
|
| 704,565 |
|
|
| 1,998,212 |
|
|
| 1,913,020 |
|
Expenses: |
|
|
|
|
|
|
|
|
|
|
|
|
|
|
|
|
Rental |
|
| 128,735 |
|
|
| 140,514 |
|
|
| 429,185 |
|
|
| 427,820 |
|
Strategic capital |
|
| 35,996 |
|
|
| 44,624 |
|
|
| 119,781 |
|
|
| 97,783 |
|
General and administrative |
|
| 57,656 |
|
|
| 58,157 |
|
|
| 171,350 |
|
|
| 165,634 |
|
Depreciation and amortization |
|
| 201,903 |
|
|
| 224,867 |
|
|
| 656,639 |
|
|
| 705,249 |
|
Other |
|
| 3,093 |
|
|
| 3,779 |
|
|
| 8,608 |
|
|
| 12,364 |
|
Total expenses |
|
| 427,383 |
|
|
| 471,941 |
|
|
| 1,385,563 |
|
|
| 1,408,850 |
|
|
|
|
|
|
|
|
|
|
|
|
|
|
|
|
|
|
Operating income |
|
| 175,491 |
|
|
| 232,624 |
|
|
| 612,649 |
|
|
| 504,170 |
|
|
|
|
|
|
|
|
|
|
|
|
|
|
|
|
|
|
Other income (expense): |
|
|
|
|
|
|
|
|
|
|
|
|
|
|
|
|
Earnings from unconsolidated entities, net |
|
| 55,066 |
|
|
| 45,857 |
|
|
| 172,267 |
|
|
| 145,622 |
|
Interest expense |
|
| (64,190 | ) |
|
| (75,310 | ) |
|
| (212,456 | ) |
|
| (232,577 | ) |
Interest and other income, net |
|
| 4,816 |
|
|
| 2,932 |
|
|
| 9,493 |
|
|
| 7,051 |
|
Gains on dispositions of investments in real estate and revaluation of equity investments upon acquisition of a controlling interest, net |
|
| 779,053 |
|
|
| 117,296 |
|
|
| 959,384 |
|
|
| 461,963 |
|
Foreign currency and derivative losses, net |
|
| (18,872 | ) |
|
| (1,730 | ) |
|
| (46,327 | ) |
|
| (26,277 | ) |
Gains (losses) on early extinguishment of debt, net |
|
| - |
|
|
| 1,492 |
|
|
| (30,596 | ) |
|
| 2,484 |
|
Total other income |
|
| 755,873 |
|
|
| 90,537 |
|
|
| 851,765 |
|
|
| 358,266 |
|
Earnings before income taxes |
|
| 931,364 |
|
|
| 323,161 |
|
|
| 1,464,414 |
|
|
| 862,436 |
|
Total income tax expense |
|
| 17,947 |
|
|
| 15,919 |
|
|
| 42,328 |
|
|
| 36,598 |
|
Consolidated net earnings |
|
| 913,417 |
|
|
| 307,242 |
|
|
| 1,422,086 |
|
|
| 825,838 |
|
Less net earnings attributable to noncontrolling interests |
|
| 11,411 |
|
|
| 18,628 |
|
|
| 33,534 |
|
|
| 35,865 |
|
Net earnings attributable to controlling interests |
|
| 902,006 |
|
|
| 288,614 |
|
|
| 1,388,552 |
|
|
| 789,973 |
|
Less preferred unit distributions |
|
| 1,675 |
|
|
| 1,671 |
|
|
| 5,023 |
|
|
| 5,056 |
|
Net earnings attributable to common unitholders |
| $ | 900,331 |
|
| $ | 286,943 |
|
| $ | 1,383,529 |
|
| $ | 784,917 |
|
|
|
|
|
|
|
|
|
|
|
|
|
|
|
|
|
|
Weighted average common units outstanding – Basic |
|
| 537,257 |
|
|
| 532,934 |
|
|
| 536,021 |
|
|
| 531,985 |
|
Weighted average common units outstanding – Diluted |
|
| 554,163 |
|
|
| 547,200 |
|
|
| 551,618 |
|
|
| 545,228 |
|
|
|
|
|
|
|
|
|
|
|
|
|
|
|
|
|
|
Net earnings per unit attributable to common unitholders – Basic |
| $ | 1.65 |
|
| $ | 0.53 |
|
| $ | 2.54 |
|
| $ | 1.45 |
|
|
|
|
|
|
|
|
|
|
|
|
|
|
|
|
|
|
Net earnings per unit attributable to common unitholders – Diluted |
| $ | 1.63 |
|
| $ | 0.52 |
|
| $ | 2.51 |
|
| $ | 1.44 |
|
|
|
|
|
|
|
|
|
|
|
|
|
|
|
|
|
|
Distributions per common unit |
| $ | 0.44 |
|
| $ | 0.42 |
|
| $ | 1.32 |
|
| $ | 1.26 |
|
The accompanying notes are an integral part of these Consolidated Financial Statements.
6
CONSOLIDATED STATEMENTS OF COMPREHENSIVE INCOME
(Unaudited)
(In thousands)thousands, except per unit amounts)
|
| Three Months Ended |
|
| Nine Months Ended |
| ||||||||||
|
| September 30, |
|
| September 30, |
| ||||||||||
|
| 2017 |
|
| 2016 |
|
| 2017 |
|
| 2016 |
| ||||
Consolidated net earnings |
| $ | 913,417 |
|
| $ | 307,242 |
|
| $ | 1,422,086 |
|
| $ | 825,838 |
|
Other comprehensive income (loss): |
|
|
|
|
|
|
|
|
|
|
|
|
|
|
|
|
Foreign currency translation gains (losses), net |
|
| 4,061 |
|
|
| (48,232 | ) |
|
| 46,890 |
|
|
| (69,832 | ) |
Unrealized gains (losses) on derivative contracts, net |
|
| 6,091 |
|
|
| 4,696 |
|
|
| 15,457 |
|
|
| (17,122 | ) |
Comprehensive income |
|
| 923,569 |
|
|
| 263,706 |
|
|
| 1,484,433 |
|
|
| 738,884 |
|
Net earnings attributable to noncontrolling interests |
|
| (11,411 | ) |
|
| (18,628 | ) |
|
| (33,534 | ) |
|
| (35,865 | ) |
Other comprehensive loss (income) attributable to noncontrolling interests |
|
| (313 | ) |
|
| 1,406 |
|
|
| (49,141 | ) |
|
| (13,438 | ) |
Comprehensive income attributable to common unitholders |
| $ | 911,845 |
|
| $ | 246,484 |
|
| $ | 1,401,758 |
|
| $ | 689,581 |
|
|
|
|
|
|
|
|
|
|
|
|
|
|
|
|
|
|
|
| Three Months Ended |
| |||||
|
| March 31, |
| |||||
|
| 2023 |
|
| 2022 |
| ||
Revenues: |
|
|
|
|
|
| ||
Rental |
| $ | 1,633,770 |
|
| $ | 1,076,861 |
|
Strategic capital |
|
| 134,701 |
|
|
| 133,925 |
|
Development management and other |
|
| 116 |
|
|
| 8,342 |
|
Total revenues |
|
| 1,768,587 |
|
|
| 1,219,128 |
|
Expenses: |
|
|
|
|
|
| ||
Rental |
|
| 412,554 |
|
|
| 275,674 |
|
Strategic capital |
|
| 71,709 |
|
|
| 51,811 |
|
General and administrative |
|
| 99,777 |
|
|
| 74,646 |
|
Depreciation and amortization |
|
| 602,367 |
|
|
| 396,647 |
|
Other |
|
| 7,184 |
|
|
| 9,589 |
|
Total expenses |
|
| 1,193,591 |
|
|
| 808,367 |
|
|
|
|
|
|
|
| ||
Operating income before gains on real estate transactions, net |
|
| 574,996 |
|
|
| 410,761 |
|
Gains on dispositions of development properties and land, net |
|
| - |
|
|
| 210,206 |
|
Gains on other dispositions of investments in real estate, net |
|
| 4,047 |
|
|
| 584,835 |
|
Operating income |
|
| 579,043 |
|
|
| 1,205,802 |
|
|
|
|
|
|
|
| ||
Other income (expense): |
|
|
|
|
|
| ||
Earnings from unconsolidated entities, net |
|
| 75,779 |
|
|
| 76,962 |
|
Interest expense |
|
| (136,011 | ) |
|
| (64,064 | ) |
Foreign currency and derivative gains and other income, net |
|
| 8,614 |
|
|
| 48,409 |
|
Gains (losses) on early extinguishment of debt, net |
|
| 3,275 |
|
|
| (18,165 | ) |
Total other income (expense) |
|
| (48,343 | ) |
|
| 43,142 |
|
Earnings before income taxes |
|
| 530,700 |
|
|
| 1,248,944 |
|
Income tax expense |
|
| (32,071 | ) |
|
| (29,222 | ) |
Consolidated net earnings |
|
| 498,629 |
|
|
| 1,219,722 |
|
Less net earnings attributable to noncontrolling interests |
|
| 22,357 |
|
|
| 36,666 |
|
Net earnings attributable to controlling interests |
|
| 476,272 |
|
|
| 1,183,056 |
|
Less preferred unit distributions |
|
| 1,453 |
|
|
| 1,531 |
|
Net earnings attributable to common unitholders |
| $ | 474,819 |
|
| $ | 1,181,525 |
|
|
|
|
|
|
|
| ||
Weighted average common units outstanding – Basic |
|
| 939,054 |
|
|
| 753,159 |
|
Weighted average common units outstanding – Diluted |
|
| 951,624 |
|
|
| 765,517 |
|
|
|
|
|
|
|
| ||
Net earnings per unit attributable to common unitholders – Basic |
| $ | 0.50 |
|
| $ | 1.55 |
|
|
|
|
|
|
|
| ||
Net earnings per unit attributable to common unitholders – Diluted |
| $ | 0.50 |
|
| $ | 1.54 |
|
The accompanying notes are an integral part of these Consolidated Financial Statements.
7
CONSOLIDATED STATEMENT STATEMENTS OF CAPITALCOMPREHENSIVE INCOME
Nine Months Ended September 30, 2017(Unaudited)
(Unaudited)
(In thousands)
| General Partner |
|
| Limited Partners |
|
| Non- |
|
|
|
|
| |||||||||||||||||||||||||||
| Preferred |
|
| Common |
|
| Common |
|
| Class A Common |
|
| controlling |
|
|
|
|
| |||||||||||||||||||||
| Units |
|
| Amount |
|
| Units |
|
| Amount |
|
| Units |
|
| Amount |
|
| Units |
|
| Amount |
|
| Interests |
|
| Total |
| ||||||||||
Balance at January 1, 2017 |
| 1,565 |
|
| $ | 78,235 |
|
|
| 528,671 |
|
| $ | 14,912,846 |
|
|
| 5,323 |
|
| $ | 150,173 |
|
|
| 8,894 |
|
| $ | 244,417 |
|
| $ | 3,072,469 |
|
| $ | 18,458,140 |
|
Consolidated net earnings |
| - |
|
|
| - |
|
|
| - |
|
|
| 1,351,439 |
|
|
| - |
|
|
| 15,202 |
|
|
| - |
|
|
| 21,911 |
|
|
| 33,534 |
|
|
| 1,422,086 |
|
Effect of equity compensation plans |
| - |
|
|
| - |
|
|
| 1,895 |
|
|
| 58,698 |
|
|
| 1,353 |
|
|
| 29,980 |
|
|
| - |
|
|
| - |
|
|
| - |
|
|
| 88,678 |
|
Capital contributions |
| - |
|
|
| - |
|
|
| - |
|
|
| - |
|
|
| - |
|
|
| - |
|
|
| - |
|
|
| - |
|
|
| 150,076 |
|
|
| 150,076 |
|
Settlement of noncontrolling interests |
| - |
|
|
| - |
|
|
| - |
|
|
| (202,040 | ) |
|
| - |
|
|
| - |
|
|
| - |
|
|
| - |
|
|
| (587,976 | ) |
|
| (790,016 | ) |
Conversion of limited partners units |
| - |
|
|
| - |
|
|
| 1,515 |
|
|
| 47,726 |
|
|
| (677 | ) |
|
| (18,753 | ) |
|
| - |
|
|
| - |
|
|
| (28,973 | ) |
|
| - |
|
Foreign currency translation gains (losses), net |
| - |
|
|
| - |
|
|
| - |
|
|
| (2,191 | ) |
|
| - |
|
|
| (25 | ) |
|
| - |
|
|
| (35 | ) |
|
| 49,141 |
|
|
| 46,890 |
|
Unrealized gains on derivative contracts, net |
| - |
|
|
| - |
|
|
| - |
|
|
| 15,044 |
|
|
| - |
|
|
| 170 |
|
|
| - |
|
|
| 243 |
|
|
| - |
|
|
| 15,457 |
|
Reallocation of capital |
| - |
|
|
| - |
|
|
| - |
|
|
| (8,712 | ) |
|
| - |
|
|
| 8,386 |
|
|
| - |
|
|
| 326 |
|
|
| - |
|
|
| - |
|
Distributions and other |
| - |
|
|
| - |
|
|
| - |
|
|
| (707,294 | ) |
|
| - |
|
|
| (10,779 | ) |
|
| - |
|
|
| (17,255 | ) |
|
| (96,727 | ) |
|
| (832,055 | ) |
Balance at September 30, 2017 |
| 1,565 |
|
| $ | 78,235 |
|
|
| 532,081 |
|
| $ | 15,465,516 |
|
|
| 5,999 |
|
| $ | 174,354 |
|
|
| 8,894 |
|
| $ | 249,607 |
|
| $ | 2,591,544 |
|
| $ | 18,559,256 |
|
|
| Three Months Ended |
| |||||
|
| March 31, |
| |||||
|
| 2023 |
|
| 2022 |
| ||
Consolidated net earnings |
| $ | 498,629 |
|
| $ | 1,219,722 |
|
Other comprehensive income (loss): |
|
|
|
|
|
| ||
Foreign currency translation gains (losses), net |
|
| (28,101 | ) |
|
| 189,523 |
|
Unrealized gains (losses) on derivative contracts, net |
|
| (25,853 | ) |
|
| 13,349 |
|
Comprehensive income |
|
| 444,675 |
|
|
| 1,422,594 |
|
Net earnings attributable to noncontrolling interests |
|
| (22,357 | ) |
|
| (36,666 | ) |
Other comprehensive income attributable to noncontrolling interests |
|
| (187 | ) |
|
| (155 | ) |
Comprehensive income attributable to common unitholders |
| $ | 422,131 |
|
| $ | 1,385,773 |
|
|
|
|
|
|
|
| ||
The accompanying notes are an integral part of these Consolidated Financial Statements.
8
IndexPROLOGIS, L.P.
PROLOGIS, L.P.
CONSOLIDATED STATEMENTS OF CASH FLOWSCAPITAL
(Unaudited)
(In thousands)
|
| Nine Months Ended |
| |||||
|
| September 30, |
| |||||
|
| 2017 |
|
| 2016 |
| ||
Operating activities: |
|
|
|
|
|
|
|
|
Consolidated net earnings |
| $ | 1,422,086 |
|
| $ | 825,838 |
|
Adjustments to reconcile net earnings to net cash provided by operating activities: |
|
|
|
|
|
|
|
|
Straight-lined rents and amortization of above and below market leases |
|
| (66,234 | ) |
|
| (74,664 | ) |
Equity-based compensation awards |
|
| 58,091 |
|
|
| 43,658 |
|
Depreciation and amortization |
|
| 656,639 |
|
|
| 705,249 |
|
Earnings from unconsolidated entities, net |
|
| (172,267 | ) |
|
| (145,622 | ) |
Distributions from unconsolidated entities |
|
| 231,441 |
|
|
| 210,439 |
|
Net increase in operating receivables from unconsolidated entities |
|
| (19,530 | ) |
|
| (56,992 | ) |
Amortization of debt premiums, net of debt issuance costs |
|
| (1,585 | ) |
|
| (13,047 | ) |
Gains on dispositions of investments in real estate, net |
|
| (959,384 | ) |
|
| (461,963 | ) |
Unrealized foreign currency and derivative losses, net |
|
| 55,646 |
|
|
| 21,266 |
|
Losses (gains) on early extinguishment of debt, net |
|
| 30,596 |
|
|
| (2,484 | ) |
Deferred income tax benefit |
|
| (197 | ) |
|
| (1,737 | ) |
Decrease (increase) in accounts receivable and other assets |
|
| 76,170 |
|
|
| (48,231 | ) |
Increase (decrease) in accounts payable and accrued expenses and other liabilities |
|
| 48,841 |
|
|
| (4,699 | ) |
Net cash provided by operating activities |
|
| 1,360,313 |
|
|
| 997,011 |
|
Investing activities: |
|
|
|
|
|
|
|
|
Real estate development |
|
| (1,095,623 | ) |
|
| (1,225,613 | ) |
Real estate acquisitions |
|
| (295,178 | ) |
|
| (280,797 | ) |
Tenant improvements and lease commissions on previously leased space |
|
| (112,442 | ) |
|
| (125,041 | ) |
Nondevelopment capital expenditures |
|
| (68,698 | ) |
|
| (66,298 | ) |
Proceeds from dispositions and contributions of real estate properties |
|
| 2,354,547 |
|
|
| 1,859,317 |
|
Investments in and advances to unconsolidated entities |
|
| (244,301 | ) |
|
| (228,588 | ) |
Acquisition of a controlling interest in an unconsolidated venture, net of cash received |
|
| (374,605 | ) |
|
| - |
|
Return of investment from unconsolidated entities |
|
| 143,604 |
|
|
| 579,134 |
|
Proceeds from repayment of notes receivable backed by real estate |
|
| 32,100 |
|
|
| 201,250 |
|
Proceeds from the settlement of net investment hedges |
|
| 7,541 |
|
|
| 16,768 |
|
Payments on the settlement of net investment hedges |
|
| (5,058 | ) |
|
| - |
|
Net cash provided by investing activities |
|
| 341,887 |
|
|
| 730,132 |
|
Financing activities: |
|
|
|
|
|
|
|
|
Proceeds from issuance of common partnership units in exchange for contributions from Prologis, Inc. |
|
| 30,684 |
|
|
| 38,101 |
|
Distributions paid on common and preferred units |
|
| (735,294 | ) |
|
| (698,647 | ) |
Noncontrolling interests contributions |
|
| 135,857 |
|
|
| 1,026 |
|
Noncontrolling interests distributions |
|
| (103,970 | ) |
|
| (272,856 | ) |
Purchase of noncontrolling interests |
|
| (790,016 | ) |
|
| (2,128 | ) |
Tax paid for shares withheld |
|
| (19,626 | ) |
|
| (7,862 | ) |
Debt and capital issuance costs paid |
|
| (7,020 | ) |
|
| (19,265 | ) |
Net payments on credit facilities |
|
| (33,745 | ) |
|
| (3,545 | ) |
Repurchase and payments of debt |
|
| (2,728,198 | ) |
|
| (1,675,818 | ) |
Proceeds from issuance of debt |
|
| 2,294,041 |
|
|
| 1,012,331 |
|
Net cash used in financing activities |
|
| (1,957,287 | ) |
|
| (1,628,663 | ) |
|
|
|
|
|
|
|
|
|
Effect of foreign currency exchange rate changes on cash |
|
| 16,497 |
|
|
| 12,560 |
|
Net increase (decrease) in cash and cash equivalents |
|
| (238,590 | ) |
|
| 111,040 |
|
Cash and cash equivalents, beginning of period |
|
| 807,316 |
|
|
| 264,080 |
|
Cash and cash equivalents, end of period |
| $ | 568,726 |
|
| $ | 375,120 |
|
See Note 11 for information on noncash investingThree Months Ended March 31, 2023 and financing activities and other information.2022
| General Partner |
|
| Limited Partners |
|
| Non- |
|
|
|
| ||||||||||||||||||||||||||||
| Preferred |
|
| Common |
|
| Common |
|
| Class A Common |
|
| controlling |
|
| Total |
| ||||||||||||||||||||||
| Units |
|
| Amount |
|
| Units |
|
| Amount |
|
| Units |
|
| Amount |
|
| Units |
|
| Amount |
|
| Interests |
|
| Capital |
| ||||||||||
Balance at January 1, 2023 |
| 1,279 |
|
| $ | 63,948 |
|
|
| 923,142 |
|
| $ | 53,173,334 |
|
|
| 14,640 |
|
| $ | 843,263 |
|
|
| 8,595 |
|
| $ | 464,781 |
|
| $ | 3,317,767 |
|
| $ | 57,863,093 |
|
Consolidated net earnings |
| - |
|
|
| - |
|
|
| - |
|
|
| 464,623 |
|
|
| - |
|
|
| 7,604 |
|
|
| - |
|
|
| 4,045 |
|
|
| 22,357 |
|
|
| 498,629 |
|
Effect of equity compensation plans |
| - |
|
|
| - |
|
|
| 288 |
|
|
| 13,472 |
|
|
| 843 |
|
|
| 51,416 |
|
|
| - |
|
|
| - |
|
|
| - |
|
|
| 64,888 |
|
Capital contributions |
| - |
|
|
| - |
|
|
| - |
|
|
| - |
|
|
| - |
|
|
| - |
|
|
| - |
|
|
| - |
|
|
| - |
|
|
| - |
|
Redemption of limited partners units |
| - |
|
|
| - |
|
|
| 23 |
|
|
| 1,304 |
|
|
| (386 | ) |
|
| (43,573 | ) |
|
| - |
|
|
| - |
|
|
| - |
|
|
| (42,269 | ) |
Foreign currency translation gains |
| - |
|
|
| - |
|
|
| - |
|
|
| (27,595 | ) |
|
| - |
|
|
| (451 | ) |
|
| - |
|
|
| (242 | ) |
|
| 187 |
|
|
| (28,101 | ) |
Unrealized losses on derivative |
| - |
|
|
| - |
|
|
| - |
|
|
| (25,220 | ) |
|
| - |
|
|
| (412 | ) |
|
| - |
|
|
| (221 | ) |
|
| - |
|
|
| (25,853 | ) |
Reallocation of capital |
| - |
|
|
| - |
|
|
| - |
|
|
| (22,143 | ) |
|
| - |
|
|
| 22,313 |
|
|
| - |
|
|
| (170 | ) |
|
| - |
|
|
| - |
|
Distributions ($0.87 per common unit) |
| - |
|
|
| - |
|
|
| - |
|
|
| (806,505 | ) |
|
| - |
|
|
| (17,426 | ) |
|
| - |
|
|
| (5,559 | ) |
|
| (35,668 | ) |
|
| (865,158 | ) |
Balance at March 31, 2023 |
| 1,279 |
|
| $ | 63,948 |
|
|
| 923,453 |
|
| $ | 52,771,270 |
|
|
| 15,097 |
|
| $ | 862,734 |
|
|
| 8,595 |
|
| $ | 462,634 |
|
| $ | 3,304,643 |
|
| $ | 57,465,229 |
|
|
|
|
|
|
|
|
|
|
|
|
|
|
|
|
|
|
|
|
|
|
|
|
|
|
|
|
|
|
| ||||||||||
| General Partner |
|
| Limited Partners |
|
| Non- |
|
|
|
| ||||||||||||||||||||||||||||
| Preferred |
|
| Common |
|
| Common |
|
| Class A Common |
|
| controlling |
|
| Total |
| ||||||||||||||||||||||
| Units |
|
| Amount |
|
| Units |
|
| Amount |
|
| Units |
|
| Amount |
|
| Units |
|
| Amount |
|
| Interests |
|
| Capital |
| ||||||||||
Balance at January 1, 2022 |
| 1,279 |
|
| $ | 63,948 |
|
|
| 739,827 |
|
| $ | 33,362,925 |
|
|
| 12,354 |
|
| $ | 557,097 |
|
|
| 8,595 |
|
| $ | 360,702 |
|
| $ | 3,397,538 |
|
| $ | 37,742,210 |
|
Consolidated net earnings |
| - |
|
|
| - |
|
|
| - |
|
|
| 1,150,785 |
|
|
| - |
|
|
| 19,856 |
|
|
| - |
|
|
| 12,415 |
|
|
| 36,666 |
|
|
| 1,219,722 |
|
Effect of equity compensation plans |
| - |
|
|
| - |
|
|
| 290 |
|
|
| 4,220 |
|
|
| 837 |
|
|
| 35,947 |
|
|
| - |
|
|
| - |
|
|
| - |
|
|
| 40,167 |
|
Capital contributions |
| - |
|
|
| - |
|
|
| - |
|
|
| - |
|
|
| - |
|
|
| - |
|
|
| - |
|
|
| - |
|
|
| 434 |
|
|
| 434 |
|
Redemption of limited partners units |
| - |
|
|
| - |
|
|
| 72 |
|
|
| 3,301 |
|
|
| (242 | ) |
|
| (29,570 | ) |
|
| - |
|
|
| - |
|
|
| - |
|
|
| (26,269 | ) |
Foreign currency translation gains, net |
| - |
|
|
| - |
|
|
| - |
|
|
| 184,152 |
|
|
| - |
|
|
| 3,222 |
|
|
| - |
|
|
| 1,994 |
|
|
| 155 |
|
|
| 189,523 |
|
Unrealized gains on derivative |
| - |
|
|
| - |
|
|
| - |
|
|
| 12,981 |
|
|
| - |
|
|
| 227 |
|
|
| - |
|
|
| 141 |
|
|
| - |
|
|
| 13,349 |
|
Reallocation of capital |
| - |
|
|
| - |
|
|
| - |
|
|
| (22,852 | ) |
|
| - |
|
|
| 23,144 |
|
|
| - |
|
|
| (292 | ) |
|
| - |
|
|
| - |
|
Distributions ($0.79 per common unit) |
| - |
|
|
| - |
|
|
| - |
|
|
| (587,392 | ) |
|
| - |
|
|
| (13,241 | ) |
|
| - |
|
|
| (5,558 | ) |
|
| (110,743 | ) |
|
| (716,934 | ) |
Balance at March 31, 2022 |
| 1,279 |
|
| $ | 63,948 |
|
|
| 740,189 |
|
| $ | 34,108,120 |
|
|
| 12,949 |
|
| $ | 596,682 |
|
|
| 8,595 |
|
| $ | 369,402 |
|
| $ | 3,324,050 |
|
| $ | 38,462,202 |
|
|
|
|
|
|
|
|
|
|
|
|
|
|
|
|
|
|
|
|
|
|
|
|
|
|
|
|
|
|
| ||||||||||
The accompanying notes are an integral part of these Consolidated Financial Statements.
9
PROLOGIS, L.P.
CONSOLIDATED STATEMENTS OF CASH FLOWS
(Unaudited)
(In thousands)
|
| Three Months Ended |
| |||||
|
| March 31, |
| |||||
|
| 2023 |
|
| 2022 |
| ||
Operating activities: |
|
|
|
|
|
| ||
Consolidated net earnings |
| $ | 498,629 |
|
| $ | 1,219,722 |
|
Adjustments to reconcile net earnings to net cash provided by operating activities: |
|
|
|
|
|
| ||
Straight-lined rents and amortization of above and below market leases |
|
| (143,686 | ) |
|
| (37,374 | ) |
Equity-based compensation awards |
|
| 62,906 |
|
|
| 41,429 |
|
Depreciation and amortization |
|
| 602,367 |
|
|
| 396,647 |
|
Earnings from unconsolidated entities, net |
|
| (75,779 | ) |
|
| (76,962 | ) |
Operating distributions from unconsolidated entities |
|
| 135,081 |
|
|
| 95,665 |
|
Decrease (increase) in operating receivables from unconsolidated entities |
|
| 51,164 |
|
|
| (819 | ) |
Amortization of debt discounts and debt issuance costs, net |
|
| 17,623 |
|
|
| 1,980 |
|
Gains on dispositions of development properties and land, net |
|
| - |
|
|
| (210,206 | ) |
Gains on other dispositions of investments in real estate, net |
|
| (4,047 | ) |
|
| (584,835 | ) |
Unrealized foreign currency and derivative losses (gains), net |
|
| 10,113 |
|
|
| (33,273 | ) |
Losses (gains) on early extinguishment of debt, net |
|
| (3,275 | ) |
|
| 18,165 |
|
Deferred income tax expense |
|
| 3,577 |
|
|
| 7,492 |
|
Decrease in other assets |
|
| 21,742 |
|
|
| 107,702 |
|
Decrease in accounts payable and accrued expenses and other liabilities |
|
| (62,118 | ) |
|
| (103,806 | ) |
Net cash provided by operating activities |
|
| 1,114,297 |
|
|
| 841,527 |
|
Investing activities: |
|
|
|
|
|
| ||
Real estate development |
|
| (936,921 | ) |
|
| (639,636 | ) |
Real estate acquisitions | �� |
| (51,866 | ) |
|
| (451,343 | ) |
Duke Transaction, net of cash acquired |
|
| (3,828 | ) |
|
| - |
|
Tenant improvements and lease commissions on previously leased space |
|
| (78,955 | ) |
|
| (85,024 | ) |
Property improvements |
|
| (19,302 | ) |
|
| (18,280 | ) |
Proceeds from dispositions and contributions of real estate |
|
| 54,903 |
|
|
| 1,495,260 |
|
Investments in and advances to unconsolidated entities |
|
| (39,677 | ) |
|
| (34,811 | ) |
Return of investment from unconsolidated entities |
|
| 21,169 |
|
|
| 14,302 |
|
Proceeds from the settlement of net investment hedges |
|
| 5,323 |
|
|
| 3,732 |
|
Payments on the settlement of net investment hedges |
|
| - |
|
|
| (771 | ) |
Net cash provided by (used in) investing activities |
|
| (1,049,154 | ) |
|
| 283,429 |
|
Financing activities: |
|
|
|
|
|
| ||
Distributions paid on common and preferred units |
|
| (829,490 | ) |
|
| (606,181 | ) |
Noncontrolling interests contributions |
|
| - |
|
|
| 434 |
|
Noncontrolling interests distributions |
|
| (35,668 | ) |
|
| (110,743 | ) |
Redemption of common limited partnership units |
|
| (42,269 | ) |
|
| (26,269 | ) |
Tax paid with shares of the Parent withheld |
|
| (18,690 | ) |
|
| (22,602 | ) |
Debt and equity issuance costs paid |
|
| (17,868 | ) |
|
| (8,058 | ) |
Net payments on credit facilities |
|
| (1,337,857 | ) |
|
| (492,552 | ) |
Repurchase of and payments on debt |
|
| (90,793 | ) |
|
| (332,995 | ) |
Proceeds from the issuance of debt |
|
| 2,545,042 |
|
|
| 1,841,450 |
|
Net cash provided by financing activities |
|
| 172,407 |
|
|
| 242,484 |
|
|
|
|
|
|
|
| ||
Effect of foreign currency exchange rate changes on cash |
|
| 6,468 |
|
|
| (10,807 | ) |
Net increase in cash and cash equivalents |
|
| 244,018 |
|
|
| 1,356,633 |
|
Cash and cash equivalents, beginning of period |
|
| 278,483 |
|
|
| 556,117 |
|
Cash and cash equivalents, end of period |
| $ | 522,501 |
|
| $ | 1,912,750 |
|
See Note 12 for information on noncash investing and financing activities and other information.
The accompanying notes are an integral part of these Consolidated Financial Statements.
10
PROLOGIS, INC. AND PROLOGIS, L.P.
NOTES TO THE CONSOLIDATED FINANCIAL STATEMENTS
(Unaudited)
NOTE 1. GENERAL
Business. Prologis, Inc. (or the “Parent”) commenced operations as a fully integrated real estate company in 1997, elected to be taxed as a real estate investment trust (“REIT”) under the Internal Revenue Code of 1986, as amended (the “Internal Revenue Code” or “IRC”), and believes the current organization and method of operation will enable it to maintain its status as a REIT. The Parent is the general partner of Prologis, L.P. (or the “Operating Partnership” or “OP”). Through the Operating Partnership,OP, we are engaged in the ownership, acquisition, development and management of logistics propertiesfacilities with a focus on key markets in 19 countries on four continents. We invest in real estate through wholly owned subsidiaries and other entities through which we co-invest with partners and investors. We maintain a significant level of ownership in these co-investment ventures, which may be consolidated or unconsolidated based on our level of control of the world’s primary population centers and in those supported by extensive transportation infrastructure.entity. Our current business strategy consists of two operating business segments: Real Estate (Rental Operations and Development) and Strategic Capital. Our Real Estate Operations segmentSegment represents the ownership, leasing and development of logistics properties. Our Strategic Capital segmentSegment represents the management of properties owned by our unconsolidated co-investment ventures and other unconsolidated entities.ventures. See Note 1011 for further discussion of our business segments. Unless otherwise indicated, the Notes to the Consolidated Financial Statements apply to both the Parent and the Operating Partnership.OP. The terms “the Company,” “Prologis,” “we,” “our” or “us” means the Parent and Operating PartnershipOP collectively.
For each share of common stockpreferred or preferredcommon stock the Parent issues, the Operating PartnershipOP issues a corresponding commonpreferred or preferredcommon partnership unit, as applicable, to the Parent in exchange for the contribution of the proceeds from the stock issuance. At September 30, 2017,March 31, 2023, the Parent owned an approximate 97.33%a 97.55% common general partnership interest in the Operating PartnershipOP and 100%substantially all of the preferred units in the Operating Partnership.OP. The remaining approximate 2.67%2.45% common limited partnership interests, which include 8.9 million Class A common limited partnership units (“Class A Units”) in the Operating Partnership,OP, are owned by unaffiliated investors and certain current and former directors and officers of the Parent. Each partner’s percentage interest in the Operating PartnershipOP is determined based on the number of Operating PartnershipOP units held, including the number of Operating PartnershipOP units into which Class A Units are convertible, compared to total Operating PartnershipOP units outstanding at each period end and is used as the basis for the allocation of net income or loss to each partner. At the end of each reporting period, a capital adjustment is made in the Operating PartnershipOP to reflect the appropriate ownership interest for each of the common unitholders. These adjustments are reflected in the line items Reallocation of Equity in the Consolidated StatementStatements of Equity of the Parent and Reallocation of Capital in the Consolidated StatementStatements of Capital.Capital of the OP.
As the sole general partner of the Operating Partnership,OP, the Parent has complete responsibility and discretion in the day-to-day management and control of the Operating PartnershipOP and we operate the Parent and the Operating PartnershipOP as one enterprise. The management of the Parent consists of the same members as the management of the Operating Partnership.OP. These members are officers of the Parent and employees of the Operating PartnershipOP or one of its subsidiaries. As general partner with control of the Operating Partnership,OP, the Parent is the primary beneficiary and therefore consolidates the Operating Partnership.OP. Because the Parent’s only significant asset is its investment in the Operating Partnership,OP, the assets and liabilities of the Parent and the Operating PartnershipOP are the same on their respective financial statements.
Basis of Presentation. The accompanying Consolidated Financial Statements are prepared in accordance with United States (“U.S.”) generally accepted accounting principles (“GAAP”) and are presented in our reporting currency, the U.S. dollar. All material intercompanyIntercompany transactions with consolidated entities have been eliminated.
The accompanying unaudited interim financial information has been prepared according to the rules and regulations of the U.S. Securities and Exchange Commission (“SEC”). Certain information and footnotenote disclosures normally included in our annual financial statements prepared in accordance with GAAP have been condensed or omitted in accordance with such rules and regulations. Our management believes that the disclosures presented in these financial statements are adequate to make the information presented not misleading. In our opinion, all adjustments and eliminations, consisting only of normal recurring adjustments, necessary to present fairly the financial position and results of operations for both the Parent and the Operating PartnershipOP for the reported periods have been included. The results of operations for such interim periods are not necessarily indicative of the results for the full year. The accompanying unaudited interim financial information should be read in conjunction with our Annual Report on Form 10-K for the fiscal year ended December 31, 2016,2022, as filed with the SEC, and other public information.
NOTE 2. DUKE TRANSACTION
Certain amounts includedOn October 3, 2022, we acquired Duke Realty Corporation and Duke Realty Limited Partnership (collectively “Duke” or the “Duke Transaction”). Through the Duke Transaction, we acquired a portfolio primarily comprised of logistics real estate assets, including 494 industrial operating properties, aggregating 144.4 million square feet, which are highly complementary to our U.S. portfolio in terms of product quality, location and growth potential in our key markets. There was approximately 15 million square feet of non-strategic industrial operating properties acquired in the accompanyingDuke Transaction for which our intent is not to operate these properties long term. These assets are classified asother real estate investments within Investments in Real Estate Properties in the Consolidated Financial StatementsBalance Sheets. The portfolio also included properties under development, land for 2016 have been reclassified to conform tofuture development and investments in other ventures.
The Duke Transaction was completed for $23.2 billion through the 2017 financial statement presentation.issuance of equity based on the value of the Prologis common stock and units issued of $18.8 billion, the assumption of debt of $4.2 billion and transaction costs. In connection with the transaction, each
11
New Accounting Pronouncements.
New Accounting Standards Adoptedissued and outstanding share or unit held by a Duke shareholder or unitholder was converted automatically into 0.475 shares of Prologis common stock or common units of Prologis, L.P., respectively, including shares and units under Duke’s equity incentive plan that became fully vested at closing.
The aggregate equity consideration is calculated below (in millions, except price per share):
In January 2017, the Financial Accounting Standards Board (“FASB”) issued an accounting standard update that clarifies the definition of a business. The update adds further guidance that assists preparers in evaluating whether a transaction will be
Number of Prologis shares and units issued upon conversion of |
| 184.80 |
|
Multiplied by price of Prologis' common stock on September 30, 2022 | $ | 101.60 |
|
Fair value of Prologis shares and units issued | $ | 18,776 |
|
We accounted for the Duke Transaction as an asset acquisition and as a result, the transaction costs of an asset or a business. We expect most of our real estate property acquisitions to qualify as asset acquisitions under the standard that permits the capitalization of acquisition costs$239.8 million were capitalized to the basis of the acquired properties. Transaction costs included the direct costs incurred to acquire the real estate property. We adopted this standard on January 1, 2017,assets.
Under acquisition accounting, the total cost or total consideration exchanged is allocated to the real estate properties and related lease intangibles on a prospective basis,relative fair value basis. As the fair value of the properties acquired exceeded the purchase price, we allocated the bargain consideration at a property-level based on the relative fair value of the property in comparison to the total portfolio. All other assets acquired and liabilities assumed, including debt, and real estate assets that we intend to sell in the adoption did not have a significant impactnext twelve months were recorded at fair value. The total purchase price, including transaction costs, was allocated as follows (in millions):
Net investments in real estate | $ | 24,915 |
|
Cash and other assets |
| 441 |
|
Debt |
| (4,162 | ) |
Intangible liabilities, net of intangible assets (1) |
| (1,457 | ) |
Accounts payable, accrued expenses and other liabilities |
| (719 | ) |
Noncontrolling interests |
| (2 | ) |
Total purchase price, including transaction costs | $ | 19,016 |
|
New Accounting Standards Issued but not yet Adopted
Revenue Recognition. In May 2014,Balance Sheets. The acquired lease intangibles from the FASB issued an accounting standard update that requires companies to use a five-step model to determine when to recognize revenue from customer contracts in an effort to increase consistency and comparability throughout global capital markets and across industries. We evaluated each of our revenue streams and their related accounting policies under the standard. Rental revenues and recoveries earned from leasing our operating propertiesDuke Transaction will be assessed withamortized over the adoptionterms of the lease accounting standard update discussed below. Our evaluation under the revenue recognition standard also includes recurring fees and promotes earned from our co-investment ventures as well as sales to third parties and contributions of properties to unconsolidated co-investment ventures. While we do not expect changes in the recognition of recurring fees earned, we may begin recognizing promote fees earlier in the incentive period to the extent it is probable that a revenue reversal will not occur in a future period.
For dispositions of real estate to third parties, we do not expect the standard to impact the recognition of the sale. In February 2017, the FASB issued an additional accounting standard update that provides the accounting treatment for gains and losses from the derecognition of non-financial assets, including the accounting for partial sales of real estate properties. Upon adoption of the standard, we will recognize, on a prospective basis, the entire gain attributed to contributions or sales of real estate properties to unconsolidated co-investment ventures rather than the third-party share we recognize today. For deferred gains from existing partial sales recorded prior to the adoption of the standard, we will continue to recognize these gains into earnings over the lives of the underlying real estate properties. Both the revenue recognition and derecognition of non-financial assets standards are effective for us on January 1, 2018. In addition to the recognition changes discussed above, expanded quantitative and qualitative disclosures regarding revenue recognition will be required for contracts that are subject to these standards. We expect to adopt the standards on a modified retrospective basis.
Leases. In February 2016, the FASB issued an accounting standard update that provides the principles for the recognition, measurement, presentation and disclosure of leases.
As a lessor. The accounting for lessors will remain largely unchanged from current GAAP; however, the standard requires that lessors expense, on an as-incurred basis, certain initial direct costs that are not incremental in negotiating a lease. Under existing standards, these costs are capitalizable and therefore this new standard will result in certain of these costs being expensed as incurred after adoption. This standard may also impact the timing, recognition, presentation and disclosures related to our rental recoveries from tenants earned from leasing our operating properties, although we do not expect a significant impact.
As a lessee. Under the standard, lessees apply a dual approach, classifying leases as either finance or operating leases. A lessee is required to record a right-of-use asset and a lease liability for allrespective leases with a weighted average remaining lease term of greater than 1264 months regardless of their lease classification. We are a lessee of ground leases and office space leases. At December 31, 2016, we had approximately 90 ground and office space leases that will require us to measure and record a right-of-use asset and a lease liability upon adoption of the standard. We are in the process of calculating and estimating the initial right-of-use assets and lease liabilities that will be recorded upon adoption. There have been no significant changes to our ground and office space leases since December 31, 2016.
NOTE 3. REAL ESTATE
The standard is effective for us on January 1, 2019. We are assessing the practical expedients available for implementation under the standard. If the practical expedients are elected, we would not be required to reassess (i) whether an expired or existing contract meets the definition of a lease; (ii) the lease classification at the adoption date for expired or existing leases; and (iii) whether costs previously capitalized as initial direct costs would continue to be amortized. The standard will also require new disclosures within the accompanying notes to the Consolidated Financial Statements. We will continue to assess the method of adoption and the overall impact the adoption will have on the Consolidated Financial Statements.
Derivatives and Hedging. In August 2017, the FASB issued an accounting standard update that simplifies the application of hedge accounting guidance in current GAAP and improves the reporting of hedging relationships to better portray the economic results of an entity’s risk management activities in its financial statements. Among the simplification updates, the standard eliminates the requirement in current GAAP to separately recognize periodic hedge ineffectiveness. Mismatches between the changes in value of the hedged item and hedging instrument may still occur but they will no longer be separately reported. The standard requires the presentation of the earnings effect of the hedging instrument in the same income statement line item in which the earnings effect of the hedged item is reported. The standard is effective for annual and interim reporting periods beginning after December 15, 2018, but early adoption is permitted. We are currently evaluating the impact the adoption of this standard will have on the Consolidated Financial Statements.
Investments in real estate properties consisted of the following (dollars and square feet in thousands):
| Square Feet |
| Number of Buildings |
|
|
| ||||||||||||
| Mar 31, |
| Dec 31, |
| Mar 31, |
| Dec 31, |
| Mar 31, |
| Dec 31, |
| ||||||
| 2023 |
| 2022 |
| 2023 |
| 2022 |
| 2023 |
| 2022 |
| ||||||
Operating properties: |
|
|
|
|
|
|
|
|
|
|
|
| ||||||
Buildings and improvements |
| 600,985 |
|
| 597,362 |
|
| 2,836 |
|
| 2,825 |
| $ | 49,020,423 |
| $ | 48,650,334 |
|
Improved land |
|
|
|
|
|
|
|
|
| 20,549,061 |
|
| 20,388,461 |
| ||||
Development portfolio, including |
|
|
|
|
|
|
|
|
|
|
|
| ||||||
Prestabilized |
| 5,844 |
|
| 4,874 |
|
| 21 |
|
| 15 |
|
| 680,951 |
|
| 597,553 |
|
Properties under development |
| 37,600 |
|
| 44,011 |
|
| 102 |
|
| 121 |
|
| 3,571,692 |
|
| 3,614,601 |
|
Land (1) |
|
|
|
|
|
|
|
|
| 3,444,294 |
|
| 3,338,121 |
| ||||
Other real estate investments (2) |
|
|
|
|
|
|
|
|
| 5,119,125 |
|
| 5,034,326 |
| ||||
Total investments in real estate |
|
|
|
|
|
|
|
|
| 82,385,546 |
|
| 81,623,396 |
| ||||
Less accumulated depreciation |
|
|
|
|
|
|
|
|
| 9,508,351 |
|
| 9,036,085 |
| ||||
Net investments in real estate |
|
|
|
|
|
|
|
| $ | 72,877,195 |
| $ | 72,587,311 |
| ||||
|
|
|
|
|
|
|
|
|
|
|
|
| ||||||
| Square Feet |
|
| Number of Buildings |
|
|
|
| |||||||||||||||
| September 30, |
|
| December 31, |
|
| September 30, |
|
| December 31, |
|
| September 30, |
|
| December 31, |
| ||||||
| 2017 |
|
| 2016 |
|
| 2017 |
|
| 2016 |
|
| 2017 |
|
| 2016 |
| ||||||
Operating properties |
|
|
|
|
|
|
|
|
|
|
|
|
|
|
|
|
|
|
|
|
|
|
|
Buildings and improvements |
| 298,240 |
|
|
| 331,210 |
|
|
| 1,566 |
|
|
| 1,776 |
|
| $ | 16,829,500 |
|
| $ | 17,905,914 |
|
Improved land |
|
|
|
|
|
|
|
|
|
|
|
|
|
|
|
|
| 5,826,773 |
|
|
| 6,037,543 |
|
Development portfolio, including land costs: |
|
|
|
|
|
|
|
|
|
|
|
|
|
|
|
|
|
|
|
|
|
|
|
Prestabilized |
| 7,394 |
|
|
| 8,256 |
|
|
| 24 |
|
|
| 29 |
|
|
| 441,235 |
|
|
| 798,233 |
|
Properties under development |
| 22,189 |
|
|
| 19,539 |
|
|
| 55 |
|
|
| 60 |
|
|
| 1,059,764 |
|
|
| 633,849 |
|
Land (1) |
|
|
|
|
|
|
|
|
|
|
|
|
|
|
|
|
| 1,313,268 |
|
|
| 1,218,904 |
|
Other real estate investments (2) |
|
|
|
|
|
|
|
|
|
|
|
|
|
|
|
|
| 506,617 |
|
|
| 524,887 |
|
Total investments in real estate properties |
|
|
|
|
|
|
|
|
|
|
|
|
|
|
|
|
| 25,977,157 |
|
|
| 27,119,330 |
|
Less accumulated depreciation |
|
|
|
|
|
|
|
|
|
|
|
|
|
|
|
|
| 3,977,667 |
|
|
| 3,758,372 |
|
Net investments in real estate properties |
|
|
|
|
|
|
|
|
|
|
|
|
|
|
|
| $ | 21,999,490 |
|
| $ | 23,360,958 |
|
12
Acquisitions
|
|
|
|
Acquisitions
The following table summarizes our real estate acquisition activity for the three and nine months ended September 30 (dollars and square feet in thousands):
|
| Three Months Ended |
| |||||
|
| 2023 |
|
| 2022 |
| ||
Number of operating properties |
|
| - |
|
|
| 1 |
|
Square feet |
|
| - |
|
|
| 303 |
|
Acres of land |
|
| 120 |
|
|
| 578 |
|
Acquisition cost of net investments in real estate, excluding other real estate investments |
| $ | 40,474 |
|
| $ | 264,485 |
|
|
|
|
|
|
|
| ||
Acquisition cost of other real estate investments |
| $ | 6,185 |
|
| $ | 223,411 |
|
Dispositions
|
|
|
|
|
|
|
|
|
|
|
|
|
|
|
|
|
| Three Months Ended September 30, |
|
| Nine Months Ended September 30, |
| |||||||||||
|
| 2017 |
|
| 2016 |
|
| 2017 |
|
| 2016 |
| ||||
Acquisitions of operating properties from third parties and a controlling interest in an unconsolidated venture |
|
|
|
|
|
|
|
|
|
|
|
|
|
|
|
|
Number of operating properties |
|
| 12 |
|
|
| 1 |
|
|
| 14 |
|
|
| 7 |
|
Square feet |
|
| 6,328 |
|
|
| 42 |
|
|
| 6,478 |
|
|
| 931 |
|
Acquisition value of net investments in real estate properties (1) |
| $ | 703,686 |
|
| $ | 16,795 |
|
| $ | 744,581 |
|
| $ | 86,840 |
|
|
|
The following table summarizes our dispositions of net investments in real estate disposition activity for the threethat include contributions to unconsolidated co-investment ventures and nine months ended September 30dispositions to third parties (dollars and square feet in thousands):
|
| Three Months Ended |
| |||||
|
| 2023 |
|
| 2022 |
| ||
Dispositions of development properties and land, net (1) |
|
|
|
|
|
| ||
Number of properties |
|
| - |
|
|
| 7 |
|
Square feet |
|
| - |
|
|
| 2,583 |
|
Net proceeds |
| $ | - |
|
| $ | 442,555 |
|
Gains on dispositions of development properties and land, net |
| $ | - |
|
| $ | 210,206 |
|
|
|
|
|
|
|
| ||
Other dispositions of investments in real estate, net |
|
|
|
|
|
| ||
Number of properties |
|
| 5 |
|
|
| 102 |
|
Square feet |
|
| 360 |
|
|
| 8,676 |
|
Net proceeds |
| $ | 57,008 |
|
| $ | 1,264,280 |
|
Gains on other dispositions of investments in real estate, net |
| $ | 4,047 |
|
| $ | 584,835 |
|
|
| Three Months Ended September 30, |
|
| Nine Months Ended September 30, |
| ||||||||||
|
| 2017 |
|
| 2016 |
|
| 2017 |
|
| 2016 |
| ||||
Contributions to unconsolidated co-investment ventures (1) |
|
|
|
|
|
|
|
|
|
|
|
|
|
|
|
|
Number of properties |
|
| 201 |
|
|
| 11 |
|
|
| 211 |
|
|
| 21 |
|
Square feet |
|
| 41,776 |
|
|
| 2,657 |
|
|
| 45,420 |
|
|
| 6,676 |
|
Net proceeds (2) |
| $ | 2,356,322 |
|
| $ | 185,811 |
|
| $ | 2,869,428 |
|
| $ | 649,511 |
|
Gains on contributions, net (2) |
| $ | 647,647 |
|
| $ | 29,197 |
|
| $ | 773,715 |
|
| $ | 132,787 |
|
Dispositions to third parties |
|
|
|
|
|
|
|
|
|
|
|
|
|
|
|
|
Number of properties |
|
| 7 |
|
|
| 48 |
|
|
| 45 |
|
|
| 147 |
|
Square feet |
|
| 2,179 |
|
|
| 5,041 |
|
|
| 8,217 |
|
|
| 15,606 |
|
Net proceeds (2) (3) |
| $ | 155,227 |
|
| $ | 410,602 |
|
| $ | 614,906 |
|
| $ | 1,300,209 |
|
Gains on dispositions, net (2) (3) |
| $ | 50,259 |
|
| $ | 88,099 |
|
| $ | 104,522 |
|
| $ | 242,561 |
|
|
|
|
|
|
|
|
|
|
|
|
|
|
|
|
|
|
Total gains on contributions and dispositions, net |
| $ | 697,906 |
|
| $ | 117,296 |
|
| $ | 878,237 |
|
| $ | 375,348 |
|
Gains on revaluation of equity investments upon acquisition of a controlling interest and redemption of investment in co-investment ventures |
|
| 81,147 |
|
|
| - |
|
|
| 81,147 |
|
|
| 86,615 |
|
Total gains on dispositions of investments in real estate and revaluation of equity investments upon acquisition of a controlling interest, net |
| $ | 779,053 |
|
| $ | 117,296 |
|
| $ | 959,384 |
|
| $ | 461,963 |
|
Leases
We recognized lease right-of-use assets of $735.1 million and $735.4 million within Other Assets and lease liabilities of $642.4 million and $638.8 million within Other Liabilities, for land and office space leases in which we are the lessee, on the Consolidated Balance Sheets at March 31, 2023 and December 31, 2022, respectively.
|
|
|
|
|
|
NOTE 3.4. UNCONSOLIDATED ENTITIES
Summary of Investments
We have investments in entities through a variety of ventures. We co-invest in entities that own multiple properties with partners and investors and we provide asset management and property management services to these entities, which we refer to as co-investment ventures. These entities may be consolidated or unconsolidated depending on the structure, our partner’s participation and other rights and our level of control of the entity. This note details our investments in unconsolidated co-investment ventures, which are related parties and accounted for using the equity method of accounting. See Note 67 for more detail regarding our consolidated investments.investments that are not wholly owned.
We also have investments in other ventures, generally with one partner, and that we do not manage, which we account for primarily using the equity method. We refer to our investments in all entities accounted for using the equity method, both unconsolidated co-investment ventures and other ventures, collectively, as unconsolidated entities.
13
The following table summarizes our investments in and advances to our unconsolidated entities (in thousands):
|
| March 31, |
|
| December 31, |
| ||
|
| 2023 |
|
| 2022 |
| ||
Unconsolidated co-investment ventures |
| $ | 8,055,322 |
|
| $ | 8,073,927 |
|
Other ventures (1) |
|
| 1,624,775 |
|
|
| 1,624,971 |
|
Total |
| $ | 9,680,097 |
|
| $ | 9,698,898 |
|
|
| September 30, |
|
| December 31, |
| ||
|
| 2017 |
|
| 2016 |
| ||
Unconsolidated co-investment ventures |
| $ | 5,118,553 |
|
| $ | 4,057,524 |
|
Other ventures |
|
| 253,205 |
|
|
| 172,905 |
|
Totals |
| $ | 5,371,758 |
|
| $ | 4,230,429 |
|
|
|
|
|
|
|
|
|
|
Unconsolidated Co-Investment Ventures
The amounts recognized in Strategic Capital Revenues and Earnings from Unconsolidated Entities, Net depend on the size and operations of the co-investment ventures, the timing of revenues earned through promotes during the life of a venture or upon
liquidation, as well as fluctuations in foreign currency exchange rates. We recognized Strategic Capital Expenses for direct costs associated with the asset management of these ventures and allocated property-level management costs for the properties owned by the ventures. Our ownership interest in these ventures also impacts the earnings we recognize.
The following table summarizes the amountsStrategic Capital Revenues we recognized in the Consolidated Statements of Income related to theour unconsolidated co-investment ventures (in thousands):
|
| Three Months Ended |
| |||||
|
| 2023 |
|
| 2022 |
| ||
Recurring fees |
| $ | 113,557 |
|
| $ | 113,237 |
|
Transactional fees |
|
| 15,080 |
|
|
| 17,229 |
|
Promote revenue |
|
| 320 |
|
|
| - |
|
Total strategic capital revenues from unconsolidated co-investment ventures (1) |
| $ | 128,957 |
|
| $ | 130,466 |
|
|
| Three Months Ended September 30, |
|
| Nine Months Ended September 30, |
| ||||||||||
|
| 2017 |
|
| 2016 |
|
| 2017 |
|
| 2016 |
| ||||
Strategic capital revenues from unconsolidated co-investment ventures, net: |
|
|
|
|
|
|
|
|
|
|
|
|
|
|
|
|
U.S. |
| $ | 16,841 |
|
| $ | 9,565 |
|
| $ | 158,064 |
|
| $ | 27,739 |
|
Other Americas |
|
| 6,216 |
|
|
| 5,806 |
|
|
| 22,131 |
|
|
| 16,885 |
|
Europe |
|
| 26,323 |
|
|
| 113,489 |
|
|
| 78,450 |
|
|
| 161,257 |
|
Asia |
|
| 18,271 |
|
|
| 13,174 |
|
|
| 44,990 |
|
|
| 39,429 |
|
Total |
| $ | 67,651 |
|
| $ | 142,034 |
|
| $ | 303,635 |
|
| $ | 245,310 |
|
|
|
|
|
|
|
|
|
|
|
|
|
|
|
|
|
|
Earnings from unconsolidated co-investment ventures, net: |
|
|
|
|
|
|
|
|
|
|
|
|
|
|
|
|
U.S. |
| $ | 18,307 |
|
| $ | 1,763 |
|
| $ | 25,216 |
|
| $ | 9,140 |
|
Other Americas |
|
| 6,570 |
|
|
| 8,077 |
|
|
| 22,073 |
|
|
| 20,885 |
|
Europe |
|
| 23,848 |
|
|
| 29,802 |
|
|
| 89,622 |
|
|
| 90,395 |
|
Asia |
|
| 5,050 |
|
|
| 4,905 |
|
|
| 23,489 |
|
|
| 12,253 |
|
Total |
| $ | 53,775 |
|
| $ | 44,547 |
|
| $ | 160,400 |
|
| $ | 132,673 |
|
|
|
|
|
|
|
|
|
|
|
|
|
|
|
|
|
|
The following table summarizes the promotes earnedkey property information, financial position and recognized in Strategic Capital Revenues (in thousands):
|
| Three Months Ended September 30, |
|
| Nine Months Ended September 30, |
| ||||||||||
|
| 2017 |
|
| 2016 |
|
| 2017 |
|
| 2016 |
| ||||
Total promote (1) |
| $ | - |
|
| $ | 99,766 |
|
| $ | 150,898 |
|
| $ | 99,766 |
|
Less: Prologis' share |
|
| - |
|
|
| 11,222 |
|
|
| 23,806 |
|
|
| 11,222 |
|
Net promote recognized (third-party share) in strategic capital revenues |
| $ | - |
|
| $ | 88,544 |
|
| $ | 127,092 |
|
| $ | 88,544 |
|
|
|
The following tables summarize the operating information and financial position of our unconsolidated co-investment ventures on a U.S. GAAP basis (not our proportionate share), and the amounts we recognized in the Consolidated Financial Statements related to these ventures (dollars and square feet in millions):
| U.S. |
|
| Other Americas (1) |
|
| Europe |
|
| Asia |
|
| Total |
| |||||||||||||||||||||||||
At: | Mar 31, |
|
| Dec 31, |
|
| Mar 31, |
|
| Dec 31, |
|
| Mar 31, |
|
| Dec 31, |
|
| Mar 31, |
|
| Dec 31, |
|
| Mar 31, |
|
| Dec 31, |
| ||||||||||
Key property information: |
|
|
|
|
|
|
|
|
|
|
|
|
|
|
|
|
|
|
|
|
|
|
|
|
|
|
|
|
| ||||||||||
Ventures |
| 1 |
|
|
| 1 |
|
|
| 2 |
|
|
| 2 |
|
|
| 2 |
|
|
| 2 |
|
|
| 3 |
|
|
| 3 |
|
|
| 8 |
|
|
| 8 |
|
Operating properties |
| 740 |
|
|
| 739 |
|
|
| 260 |
|
|
| 260 |
|
|
| 992 |
|
|
| 989 |
|
|
| 220 |
|
|
| 217 |
|
|
| 2,212 |
|
|
| 2,205 |
|
Square feet |
| 123 |
|
|
| 123 |
|
|
| 60 |
|
|
| 60 |
|
|
| 220 |
|
|
| 219 |
|
|
| 90 |
|
|
| 89 |
|
|
| 493 |
|
|
| 491 |
|
|
|
|
|
|
|
|
|
|
|
|
|
|
|
|
|
|
|
|
|
|
|
|
|
|
|
|
|
|
| ||||||||||
Financial position: |
|
|
|
|
|
|
|
|
|
|
|
|
|
|
|
|
|
|
|
|
|
|
|
|
|
|
|
|
| ||||||||||
Total assets ($) |
| 12,609 |
|
|
| 12,617 |
|
|
| 3,760 |
|
|
| 3,744 |
|
|
| 22,957 |
|
|
| 22,502 |
|
|
| 9,844 |
|
|
| 9,964 |
|
|
| 49,170 |
|
|
| 48,827 |
|
Third-party debt ($) |
| 3,468 |
|
|
| 3,468 |
|
|
| 919 |
|
|
| 919 |
|
|
| 5,426 |
|
|
| 5,315 |
|
|
| 3,827 |
|
|
| 3,811 |
|
|
| 13,640 |
|
|
| 13,513 |
|
Total liabilities ($) |
| 4,179 |
|
|
| 4,143 |
|
|
| 983 |
|
|
| 1,011 |
|
|
| 7,502 |
|
|
| 7,292 |
|
|
| 4,259 |
|
|
| 4,279 |
|
|
| 16,923 |
|
|
| 16,725 |
|
|
|
|
|
|
|
|
|
|
|
|
|
|
|
|
|
|
|
|
|
|
|
|
|
|
|
|
|
|
| ||||||||||
Our investment balance ($) (2) |
| 2,371 |
|
|
| 2,398 |
|
|
| 1,041 |
|
|
| 1,070 |
|
|
| 3,850 |
|
|
| 3,786 |
|
|
| 793 |
|
|
| 820 |
|
|
| 8,055 |
|
|
| 8,074 |
|
Our weighted average ownership (3) |
| 26.2 | % |
|
| 26.2 | % |
|
| 40.6 | % |
|
| 41.0 | % |
|
| 31.0 | % |
|
| 31.0 | % |
|
| 15.2 | % |
|
| 15.2 | % |
|
| 27.4 | % |
|
| 27.4 | % |
|
|
|
|
|
|
|
|
|
|
|
|
|
|
|
|
|
|
|
|
|
|
|
|
|
|
|
|
|
| ||||||||||
| U.S. |
|
| Other Americas (1) |
|
| Europe |
|
| Asia |
|
| Total |
| |||||||||||||||||||||||||
Operating Information: | Mar 31, |
|
| Mar 31, |
|
| Mar 31, |
|
| Mar 31, |
|
| Mar 31, |
|
| Mar 31, |
|
| Mar 31, |
|
| Mar 31, |
|
| Mar 31, |
|
| Mar 31, |
| ||||||||||
For the three months ended: |
|
|
|
|
|
|
|
|
|
|
|
|
|
|
|
|
|
|
|
|
|
|
|
|
|
|
|
|
| ||||||||||
Total revenues ($) |
| 324 |
|
|
| 286 |
|
|
| 103 |
|
|
| 89 |
|
|
| 414 |
|
|
| 356 |
|
|
| 165 |
|
|
| 169 |
|
|
| 1,006 |
|
|
| 900 |
|
Net earnings ($) |
| 101 |
|
|
| 72 |
|
|
| 43 |
|
|
| 33 |
|
|
| 69 |
|
|
| 104 |
|
|
| 27 |
|
|
| 34 |
|
|
| 240 |
|
|
| 243 |
|
|
|
|
|
|
|
|
|
|
|
|
|
|
|
|
|
|
|
|
|
|
|
|
|
|
|
|
|
|
| ||||||||||
Our earnings from unconsolidated |
| 27 |
|
|
| 19 |
|
|
| 16 |
|
|
| 12 |
|
|
| 21 |
|
|
| 31 |
|
|
| 4 |
|
|
| 6 |
|
|
| 68 |
|
|
| 68 |
|
|
| September 30, |
|
| December 31, |
|
| September 30, |
| |||
(dollars and square feet in millions) |
| 2017 |
|
| 2016 |
|
| 2016 |
| |||
U.S. (1): |
|
|
|
|
|
|
|
|
|
|
|
|
Number of ventures |
|
| 1 |
|
|
| 1 |
|
|
| 1 |
|
Number of operating properties owned |
|
| 552 |
|
|
| 369 |
|
|
| 366 |
|
Square feet |
|
| 88 |
|
|
| 50 |
|
|
| 49 |
|
Total assets |
| $ | 7,311 |
|
| $ | 4,238 |
|
| $ | 4,167 |
|
Third-party debt |
| $ | 2,270 |
|
| $ | 1,414 |
|
| $ | 1,421 |
|
Total liabilities |
| $ | 2,473 |
|
| $ | 1,540 |
|
| $ | 1,509 |
|
Our investment balance (2) (3) |
| $ | 1,393 |
|
| $ | 435 |
|
| $ | 514 |
|
Our weighted average ownership (3) (4) |
|
| 27.1 | % |
|
| 14.9 | % |
|
| 17.8 | % |
Other Americas (5): |
|
|
|
|
|
|
|
|
|
|
|
|
Number of ventures |
|
| 1 |
|
|
| 2 |
|
|
| 2 |
|
Number of operating properties owned |
|
| 203 |
|
|
| 213 |
|
|
| 209 |
|
Square feet |
|
| 37 |
|
|
| 42 |
|
|
| 41 |
|
Total assets |
| $ | 2,107 |
|
| $ | 2,793 |
|
| $ | 2,679 |
|
Third-party debt |
| $ | 727 |
|
| $ | 739 |
|
| $ | 671 |
|
Total liabilities |
| $ | 761 |
|
| $ | 814 |
|
| $ | 754 |
|
Our investment balance (2) |
| $ | 564 |
|
| $ | 845 |
|
| $ | 851 |
|
Our weighted average ownership (4) |
|
| 42.9 | % |
|
| 43.9 | % |
|
| 43.7 | % |
Europe (6) (7): |
|
|
|
|
|
|
|
|
|
|
|
|
Number of ventures |
|
| 4 |
|
|
| 4 |
|
|
| 4 |
|
Number of operating properties owned |
|
| 709 |
|
|
| 700 |
|
|
| 694 |
|
Square feet |
|
| 167 |
|
|
| 163 |
|
|
| 160 |
|
Total assets |
| $ | 12,767 |
|
| $ | 10,853 |
|
| $ | 11,291 |
|
Third-party debt |
| $ | 2,742 |
|
| $ | 2,446 |
|
| $ | 2,628 |
|
Total liabilities |
| $ | 3,748 |
|
| $ | 3,283 |
|
| $ | 3,620 |
|
Our investment balance (2) (3) |
| $ | 2,649 |
|
| $ | 2,327 |
|
| $ | 2,565 |
|
Our weighted average ownership (3) (4) |
|
| 33.2 | % |
|
| 35.1 | % |
|
| 36.3 | % |
Asia: |
|
|
|
|
|
|
|
|
|
|
|
|
Number of ventures |
|
| 2 |
|
|
| 2 |
|
|
| 2 |
|
Number of operating properties owned |
|
| 93 |
|
|
| 85 |
|
|
| 79 |
|
Square feet |
|
| 40 |
|
|
| 36 |
|
|
| 34 |
|
Total assets |
| $ | 5,907 |
|
| $ | 5,173 |
|
| $ | 5,439 |
|
Third-party debt |
| $ | 2,186 |
|
| $ | 1,947 |
|
| $ | 2,004 |
|
Total liabilities |
| $ | 2,504 |
|
| $ | 2,239 |
|
| $ | 2,313 |
|
Our investment balance (2) |
| $ | 513 |
|
| $ | 451 |
|
| $ | 493 |
|
Our weighted average ownership (4) |
|
| 15.1 | % |
|
| 15.1 | % |
|
| 15.0 | % |
Total: |
|
|
|
|
|
|
|
|
|
|
|
|
Number of ventures |
|
| 8 |
|
|
| 9 |
|
|
| 9 |
|
Number of operating properties owned |
|
| 1,557 |
|
|
| 1,367 |
|
|
| 1,348 |
|
Square feet |
|
| 332 |
|
|
| 291 |
|
|
| 284 |
|
Total assets |
| $ | 28,092 |
|
| $ | 23,057 |
|
| $ | 23,576 |
|
Third-party debt |
| $ | 7,925 |
|
| $ | 6,546 |
|
| $ | 6,724 |
|
Total liabilities |
| $ | 9,486 |
|
| $ | 7,876 |
|
| $ | 8,196 |
|
Our investment balance (2) |
| $ | 5,119 |
|
| $ | 4,058 |
|
| $ | 4,423 |
|
Our weighted average ownership (4) |
|
| 28.7 | % |
|
| 27.9 | % |
|
| 28.9 | % |
|
| Three Months Ended September 30, |
|
| Nine Months Ended September 30, |
| ||||||||||
(in millions) |
| 2017 |
|
| 2016 |
|
| 2017 |
|
| 2016 |
| ||||
Revenues: |
|
|
|
|
|
|
|
|
|
|
|
|
|
|
|
|
U.S. |
| $ | 160 |
|
| $ | 100 |
|
| $ | 369 |
|
| $ | 296 |
|
Other Americas |
|
| 60 |
|
|
| 63 |
|
|
| 190 |
|
|
| 179 |
|
Europe |
|
| 266 |
|
|
| 232 |
|
|
| 758 |
|
|
| 724 |
|
Asia |
|
| 95 |
|
|
| 91 |
|
|
| 272 |
|
|
| 253 |
|
Total revenues |
| $ | 581 |
|
| $ | 486 |
|
| $ | 1,589 |
|
| $ | 1,452 |
|
|
|
|
|
|
|
|
|
|
|
|
|
|
|
|
|
|
Net earnings: |
|
|
|
|
|
|
|
|
|
|
|
|
|
|
|
|
U.S. |
| $ | 64 |
|
| $ | 11 |
|
| $ | 115 |
|
| $ | 47 |
|
Other Americas |
|
| 19 |
|
|
| 20 |
|
|
| 58 |
|
|
| 53 |
|
Europe |
|
| 63 |
|
|
| 77 |
|
|
| 229 |
|
|
| 218 |
|
Asia |
|
| 30 |
|
|
| 30 |
|
|
| 147 |
|
|
| 74 |
|
Total net earnings |
| $ | 176 |
|
| $ | 138 |
|
| $ | 549 |
|
| $ | 392 |
|
|
|
|
|
|
|
|
|
|
|
|
|
|
|
|
|
|
|
|
|
|
|
|
|
|
|
|
|
|
|
|
14
Equity Commitments Related to Certain Unconsolidated Co-Investment Ventures
The following table summarizes the remainingAt March 31, 2023, our outstanding equity commitments at September 30, 2017 (in millions):were $285.8 million, primarily for Prologis China Logistics Venture. The equity commitments expire from 2023 to 2028 if they have not been previously called. Typically, equity commitments are used for future development and acquisitions in the unconsolidated co-investment ventures.
|
| Equity Commitments |
|
| Expiration Date for Remaining Commitments | |||||||||
|
| Prologis |
|
| Venture Partners |
|
| Total |
|
|
| |||
Prologis Targeted U.S. Logistics Fund |
| $ | - |
|
| $ | 195 |
|
| $ | 195 |
|
| 2019 |
Prologis Targeted Europe Logistics Fund (1) |
|
| - |
|
|
| 623 |
|
|
| 623 |
|
| 2018 – 2019 |
Prologis United Kingdom Logistics Venture (2) |
|
| 37 |
|
|
| 207 |
|
|
| 244 |
|
| 2021 |
Prologis China Logistics Venture |
|
| 294 |
|
|
| 1,665 |
|
|
| 1,959 |
|
| 2020 – 2024 |
Totals |
| $ | 331 |
|
| $ | 2,690 |
|
| $ | 3,021 |
|
|
|
|
|
|
|
NOTE 4.5. ASSETS HELD FOR SALE OR CONTRIBUTION
We havehad investments in certain real estate properties that met the criteria to be classified as held for sale or contribution at September 30, 2017,March 31, 2023 and December 31, 2016. These real estate2022. At the time of classification, these properties arewere expected to be sold to third parties or were recently stabilized and expected to be contributed to unconsolidated co-investment ventures within twelve months. The amounts included in Assets Held for Sale or Contributionrepresented real estate investment balances and the related assets and liabilities for each property.liabilities.
Assets held for sale or contribution consisted of the following (dollars and square feet in thousands):
|
| March 31, |
|
| December 31, |
| ||
|
| 2023 |
|
| 2022 |
| ||
Number of operating properties |
|
| 23 |
|
|
| 21 |
|
Square feet |
|
| 5,771 |
|
|
| 4,061 |
|
Total assets held for sale or contribution |
| $ | 734,106 |
|
| $ | 531,257 |
|
Total liabilities associated with assets held for sale or contribution – included in Other Liabilities |
| $ | 10,533 |
|
| $ | 4,536 |
|
|
| September 30, |
|
| December 31, |
| ||
|
| 2017 |
|
| 2016 |
| ||
Number of operating properties |
|
| 26 |
|
|
| 13 |
|
Square feet |
|
| 4,952 |
|
|
| 4,167 |
|
Total assets held for sale or contribution |
| $ | 321,905 |
|
| $ | 322,139 |
|
Total liabilities associated with assets held for sale or contribution – included in Other Liabilities |
| $ | 7,389 |
|
| $ | 4,984 |
|
NOTE 6. DEBT
All debt is incurred by the Operating Partnership. The Parent does not have any indebtedness, but guarantees the unsecured debt of the Operating Partnership.
OP or its consolidated subsidiaries. The following table summarizes our debt (dollars in thousands):
|
| March 31, 2023 |
|
| December 31, 2022 |
| ||||||||||||||
|
| Weighted Average |
|
| Amount |
|
| Weighted Average |
|
| Amount |
| ||||||||
|
| Interest Rate (1) |
| Years (2) |
|
| Outstanding (3) |
|
| Interest Rate (1) |
| Years (2) |
|
| Outstanding (3) |
| ||||
Credit facilities |
| 2.0% |
|
| 2.3 |
|
| $ | 212,553 |
|
| 4.2% |
|
| 2.8 |
|
| $ | 1,538,461 |
|
Senior notes |
| 2.6% |
|
| 10.7 |
|
|
| 22,399,340 |
|
| 2.3% |
|
| 10.3 |
|
|
| 19,786,253 |
|
Term loans and unsecured |
| 2.4% |
|
| 4.6 |
|
|
| 2,093,006 |
|
| 2.3% |
|
| 4.9 |
|
|
| 2,106,592 |
|
Secured mortgage |
| 3.2% |
|
| 4.0 |
|
|
| 448,443 |
|
| 3.0% |
|
| 4.3 |
|
|
| 444,655 |
|
Total |
| 2.6% |
|
| 10.0 |
|
| $ | 25,153,342 |
|
| 2.5% |
|
| 9.2 |
|
| $ | 23,875,961 |
|
|
| September 30, 2017 |
|
| December 31, 2016 |
| ||||||||||
|
| Weighted Average Interest Rate (1) |
|
| Amount Outstanding (2) |
|
| Weighted Average Interest Rate (1) |
|
| Amount Outstanding |
| ||||
Credit facilities |
|
| - |
|
| $ | - |
|
|
| 1.0 | % |
| $ | 35,023 |
|
Senior notes |
|
| 3.1 | % |
|
| 6,874,108 |
|
|
| 3.3 | % |
|
| 6,417,492 |
|
Term loans |
|
| 1.5 | % |
|
| 1,620,688 |
|
|
| 1.4 | % |
|
| 1,484,523 |
|
Unsecured other |
|
| 6.1 | % |
|
| 13,994 |
|
|
| 6.1 | % |
|
| 14,478 |
|
Secured mortgages |
|
| 5.7 | % |
|
| 812,371 |
|
|
| 4.9 | % |
|
| 979,585 |
|
Secured mortgages of consolidated entities (3) |
|
| 2.8 | % |
|
| 399,904 |
|
|
| 3.0 | % |
|
| 1,677,193 |
|
Totals |
|
| 3.0 | % |
| $ | 9,721,065 |
|
|
| 3.2 | % |
| $ | 10,608,294 |
|
|
|
|
|
March 31, 2023 December 31, 2022 Weighted Average Interest Rate Amount Outstanding % of Total Weighted Average Interest Rate Amount Outstanding % of Total British pound sterling 2.1 % $ 1,263,807 5.0 % 2.1 % $ 1,228,483 5.1 % Canadian dollar 4.9 % 813,415 3.2 % 4.5 % 814,491 3.4 % Euro 1.7 % 9,100,801 36.2 % 1.3 % 7,991,301 33.5 % Japanese yen 1.0 % 3,367,643 13.4 % 1.0 % 3,308,009 13.9 % U.S. dollar 3.6 % 10,607,676 42.2 % 3.6 % 10,533,677 44.1 % Total 2.6 % $ 25,153,342 100.0 % 2.5 % $ 23,875,961 100.0 % |
| ||||||||||||||||||||||||||||||||||||||||||||||||||||||||||||||||||||||||||||||||||||||||||||||||||||||||||||||||||||||||||||||||||||||||||||||||||||||||||||||||||||||||||||||||||||||||||||||||||||||||||||||||||||||||||||||||||||||||||
Credit Facilities
We have aAt March 31, 2023, we had two global senior credit facility (the “Global Facility”), under which wefacilities: the 2021 Global Facility and the 2022 Global Facility. We may draw on both facilities in British pounds sterling, Canadian dollars, euro, Japanese yen, Mexican pesos and U.S. dollars on a revolving basis up to $3.0$2.0 billion and $3.0 billion (subject to currency fluctuations). on the 2021 and 2022 Global Facility, respectively. The 2021 Global Facility is scheduled to initially mature in April 2024 and the 2022 Global Facility in June 2026; however, we can extend the maturity date for each facility by six months on two occasions, subject to the payment of extension fees. We have the ability to increase the
15
2021 Global Facility to $3.8$2.5 billion and the 2022 Global Facility to $4.0 billion, subject to currency fluctuations and obtaining additional lender commitments.
On April 5, 2023, we amended and restated the 2021 Global Facility as the 2023 Global Facility and upsized its borrowing capacity to $3.0 billion (subject to currency fluctuations). The 2023 Global Facility is scheduled to initially mature in June 2027; however, we can extend the maturity date for the facility by six months on two occasions, subject to the payment of extension fees. We have the ability to increase the 2023 Global Facility to $4.0 billion, subject to currency fluctuations and obtaining additional lender commitments.
We also have a Japanese yen revolver (the “Yen Credit Facility”) with total commitments of ¥55.0 billion ($413.0 million at March 31, 2023). We have the ability to increase the borrowing capacity of the Yen Credit Facility to ¥75.0 billion ($563.2 million at March 31, 2023), subject to obtaining additional lender commitments. The Yen Credit Facility is initially scheduled to mature in July 2024; however, we may extend the maturity date for one year, subject to the payment of extension fees.
We refer to the 2021 Global Facility, the 2022 Global Facility and the Yen Credit Facility, collectively, as our “Credit Facilities.” Pricing underfor the Global Facility,Credit Facilities, including the spread over LIBOR,the applicable benchmark and the rates applicable to facility fees and letter of credit fees, varies based on the public debt ratings of the Operating Partnership. The Global Facility is scheduled to mature in April 2020; however, we may extend the maturity date for six months on two occasions, subject to the satisfaction of certain conditions and payment of extension fees.OP.
We also have a Japanese yen revolver (the “Revolver”). In February 2017, we renewed and amended the Revolver to increase our availability from ¥45.0 billion to ¥50.0 billion ($444.4 million at September 30, 2017). We have the ability to increase the Revolver to ¥65.0 billion ($577.8 million at September 30, 2017), subject to obtaining additional lender commitments. Pricing under the Revolver, including the spread over LIBOR, facility fees and letter of credit fees, varies based on the public debt ratings of the Operating
Partnership. The Revolver is scheduled to mature in February 2021; however, we may extend the maturity date for one year, subject to the satisfaction of certain conditions and payment of extension fees.
We refer to the Global Facility and the Revolver, collectively, as our “Credit Facilities.”
The following table summarizes information about our Credit Facilitiesavailable liquidity at September 30, 2017March 31, 2023 (in millions):
|
|
|
| |
Aggregate lender commitments |
|
|
| |
Credit Facilities |
| $ | 5,473 |
|
Less: |
|
|
| |
Borrowings outstanding |
|
| 213 |
|
Outstanding letters of credit |
|
| 39 |
|
Current availability |
|
| 5,221 |
|
Cash and cash equivalents |
|
| 523 |
|
Total liquidity |
| $ | 5,744 |
|
Aggregate lender commitments |
| $ | 3,476 |
|
Less: |
|
|
|
|
Borrowings outstanding |
|
| - |
|
Outstanding letters of credit |
|
| 38 |
|
Current availability |
| $ | 3,438 |
|
Senior Notes
In June 2017, we issued £500.0 million ($645.3 million)The following table summarizes the issuances of senior notes bearing an interestduring the three months ended March 31, 2023 (principal in thousands):
|
| Aggregate Principal |
|
| Issuance Date Weighted Average |
|
| |||||||
Issuance Date |
| Borrowing Currency |
|
| USD (1) |
|
| Interest Rate |
| Years |
| Maturity Dates | ||
January |
| € | 1,250,000 |
|
| $ | 1,354,125 |
|
| 4.1% |
| 13.8 |
| January 2030 – 2043 |
March |
| $ | 1,200,000 |
|
| $ | 1,200,000 |
|
| 4.9% |
| 17.7 |
| June 2033 – 2053 |
Total |
|
|
|
| $ | 2,554,125 |
|
| 4.5% |
| 15.6 |
|
| |
|
|
|
|
|
|
|
|
|
|
|
|
| ||
Term Loans
In March 2017, we enteredcalculate into an unsecured senior term loan agreement (the “2017 Yen Term Loan”) under which we can draw in Japanese yen, of which ¥7.2 billion ($64.0 million at September 30, 2017) matures in March 2027 and bears an interest rate of 0.92% and ¥4.8 billion ($42.7 million at September 30, 2017) matures in March 2028 and bears an interest rate of 1.01%. In the first quarter of 2017, we borrowed ¥12.0 billion ($107.3 million), causing the 2017 Yen Term Loan to be fully drawn at September 30, 2017.
In May 2017, we renewed and amended our existing senior term loan agreement (the “2017 Term Loan,” formerly the “Euro Term Loan”) under which loans can be obtained in British pounds sterling, euro, Japanese yen and U.S. dollars in an aggregate amount not to exceed $500.0 million. We may increasewas the borrowings up to $1.0 billion, subject to obtaining additional lender commitments. We may also pay down and reborrow under this term loan. The 2017 Term Loan bears an interestspot rate of LIBOR plus 0.90% and is scheduled to mature in May 2020; however, we may extendat the maturity date twice, by one year each, subject to the satisfaction of certain conditions and the payment of an extension fee. In the second quarter of 2017, we borrowed $500.0 million. In the third quarter of 2017, we repaid this balance and subsequently borrowed $160.0 million, which remained outstanding at September 30, 2017.settlement date.
Long-Term Debt Maturities
PrincipalScheduled principal payments due on our debt for the remainder of 20172023 and for each of the years inyear through the period endingended December 31, 2026,2027, and thereafter were as follows at September 30, 2017March 31, 2023 (in thousands):
|
| Unsecured |
|
|
|
|
|
| ||||||||||||
|
| Credit |
|
| Senior |
|
| Term Loans |
|
| Secured |
|
|
|
| |||||
Maturity |
| Facilities |
|
| Notes |
|
| and Other |
|
| Mortgage |
|
| Total |
| |||||
2023 (1) |
| $ | - |
|
| $ | - |
|
| $ | - |
|
| $ | 31,619 |
|
| $ | 31,619 |
|
2024 (1) (2) |
|
| 98,365 |
|
|
| 326,250 |
|
|
| - |
|
|
| 95,292 |
|
|
| 519,907 |
|
2025 (3) |
|
| - |
|
|
| 37,544 |
|
|
| 722,420 |
|
|
| 153,480 |
|
|
| 913,444 |
|
2026 (4) |
|
| 114,188 |
|
|
| 1,308,918 |
|
|
| 638,310 |
|
|
| 67,805 |
|
|
| 2,129,221 |
|
2027 |
|
| - |
|
|
| 1,738,332 |
|
|
| 53,787 |
|
|
| 4,156 |
|
|
| 1,796,275 |
|
Thereafter |
|
| - |
|
|
| 19,569,982 |
|
|
| 682,140 |
|
|
| 89,135 |
|
|
| 20,341,257 |
|
Subtotal |
|
| 212,553 |
|
|
| 22,981,026 |
|
|
| 2,096,657 |
|
|
| 441,487 |
|
|
| 25,731,723 |
|
Unamortized premiums (discounts), net |
|
| - |
|
|
| (481,289 | ) |
|
| 946 |
|
|
| 8,554 |
|
|
| (471,789 | ) |
Unamortized debt issuance costs, net |
|
| - |
|
|
| (100,397 | ) |
|
| (4,597 | ) |
|
| (1,598 | ) |
|
| (106,592 | ) |
Total |
| $ | 212,553 |
|
| $ | 22,399,340 |
|
| $ | 2,093,006 |
|
| $ | 448,443 |
|
| $ | 25,153,342 |
|
16
|
| Unsecured |
|
|
|
|
|
|
| |||||||
|
| Senior |
|
| Term Loans |
|
| Secured |
|
|
|
|
| |||
Maturity |
| Notes |
|
| and Other |
|
| Mortgage Debt |
|
| Total |
| ||||
2017 (1) |
| $ | - |
|
| $ | 453 |
|
| $ | 3,180 |
|
| $ | 3,633 |
|
2018 (1) |
|
| 175,000 |
|
|
| 934 |
|
|
| 404,668 |
|
|
| 580,602 |
|
2019 |
|
| - |
|
|
| 1,013 |
|
|
| 446,324 |
|
|
| 447,337 |
|
2020 (2) |
|
| 910,437 |
|
|
| 161,077 |
|
|
| 12,401 |
|
|
| 1,083,915 |
|
2021 |
|
| 1,326,420 |
|
|
| 910 |
|
|
| 14,804 |
|
|
| 1,342,134 |
|
2022 |
|
| 826,420 |
|
|
| 445,170 |
|
|
| 10,815 |
|
|
| 1,282,405 |
|
2023 |
|
| 850,000 |
|
|
| 921,982 |
|
|
| 33,866 |
|
|
| 1,805,848 |
|
2024 |
|
| 826,420 |
|
|
| 874 |
|
|
| 133,551 |
|
|
| 960,845 |
|
2025 |
|
| 750,000 |
|
|
| 950 |
|
|
| 145,671 |
|
|
| 896,621 |
|
2026 |
|
| 590,300 |
|
|
| 591 |
|
|
| 1,232 |
|
|
| 592,123 |
|
Thereafter |
|
| 669,441 |
|
|
| 112,320 |
|
|
| 1,169 |
|
|
| 782,930 |
|
Subtotal |
|
| 6,924,438 |
|
|
| 1,646,274 |
|
|
| 1,207,681 |
|
|
| 9,778,393 |
|
Premiums (discounts), net |
|
| (22,100 | ) |
|
| - |
|
|
| 8,554 |
|
|
| (13,546 | ) |
Debt issuance costs, net |
|
| (28,230 | ) |
|
| (11,592 | ) |
|
| (3,960 | ) |
|
| (43,782 | ) |
Totals |
| $ | 6,874,108 |
|
| $ | 1,634,682 |
|
| $ | 1,212,275 |
|
| $ | 9,721,065 |
|
|
|
|
|
|
|
|
|
|
|
|
|
|
|
|
|
|
|
|
|
|
Financial Debt Covenants
We have $6.9 billion ofOur senior notes, and $1.6 billion of term loans and Credit Facilities outstanding at September 30, 2017, under three separate indentures, as supplemented, which areMarch 31, 2023 were subject to certain financial covenants. We are also subject to financial covenants under our Credit Facilities and certain secured mortgage debt.their related documents. At September 30, 2017,March 31, 2023, we were in compliance with all of our financial debt covenants.
Guarantee of Finance Subsidiary Debt
We have finance subsidiaries as part of our operations in Europe (Prologis Euro Finance LLC), Japan (Prologis Yen Finance LLC) and the U.K. (Prologis Sterling Finance LLC) in order to mitigate our foreign currency risk by borrowing in the currencies in which we invest. These entities are 100% indirectly owned by the OP and all unsecured debt issued or to be issued by each entity is or will be fully and unconditionally guaranteed by the OP. There are no restrictions or limits on the OP’s ability to obtain funds from its subsidiaries by dividend or loan. In reliance on Rule 13-01 of Regulation S-X, the separate financial statements of Prologis Euro Finance LLC, Prologis Yen Finance LLC and Prologis Sterling Finance LLC are not provided.
NOTE 6.7. NONCONTROLLING INTERESTS
Prologis, L.P.
We report noncontrolling interests related to several entities we consolidate but of which we do not own 100% of the equity. These entities include two real estate partnerships that have issued limited partnership units to third parties. Depending on the specific partnership agreements, these limited partnership units are redeemable for cash or, at our option, shares of the Parent’s common stock, generally at a rate of one share of common stock to one unit.limited partnership unit. We also consolidate severalcertain entities in which we do not own 100% of the equity andbut the unitsequity of the entity arethese entities is not convertible or redeemable.exchangeable into our common stock.
Prologis, Inc.
The noncontrolling interests of the Parent include the noncontrolling interests presented indescribed above for the Operating Partnership,OP, as well as the common limited partnership units in the Operating PartnershipOP that are not owned by the Parent. The outstanding limited partnership units receive quarterly cash distributions equal to the quarterly dividends paid on our common stock pursuant to the terms of the applicable partnership agreements.
The following table summarizes our ownership percentages and noncontrolling interests and thethese entities (dollars in thousands):
| Our Ownership Percentage |
|
| Noncontrolling Interests |
|
| Total Assets |
|
| Total Liabilities |
| ||||||||||||||||||||
Mar 31, |
|
| Dec 31, |
|
| Mar 31, |
|
| Dec 31, |
|
| Mar 31, |
|
| Dec 31, |
|
| Mar 31, |
|
| Dec 31, |
| |||||||||
Prologis U.S. Logistics Venture |
| 55.0 | % |
|
| 55.0 | % |
| $ | 3,170,301 |
|
| $ | 3,182,858 |
|
| $ | 7,200,384 |
|
| $ | 7,225,438 |
|
| $ | 150,401 |
|
| $ | 158,453 |
|
Other consolidated entities (1) | various |
|
| various |
|
|
| 134,342 |
|
|
| 134,909 |
|
|
| 1,679,510 |
|
|
| 1,737,311 |
|
|
| 253,241 |
|
|
| 259,524 |
| ||
Prologis, L.P. |
|
|
|
|
|
|
| 3,304,643 |
|
|
| 3,317,767 |
|
|
| 8,879,894 |
|
|
| 8,962,749 |
|
|
| 403,642 |
|
|
| 417,977 |
| ||
Limited partners in Prologis, L.P. (2)(3) |
|
|
| 1,325,368 |
|
|
| 1,308,044 |
|
|
| - |
|
|
| - |
|
|
| - |
|
|
| - |
| ||||||
Prologis, Inc. |
|
|
|
|
|
| $ | 4,630,011 |
|
| $ | 4,625,811 |
|
| $ | 8,879,894 |
|
| $ | 8,962,749 |
|
| $ | 403,642 |
|
| $ | 417,977 |
| ||
|
|
|
|
|
|
|
|
|
|
|
|
|
|
|
|
|
|
|
|
|
|
|
| ||||||||
17
| Our Ownership Percentage |
|
| Noncontrolling Interests |
|
| Total Assets |
|
| Total Liabilities |
| ||||||||||||||||||||
| 2017 |
|
| 2016 |
|
| 2017 |
|
| 2016 |
|
| 2017 |
|
| 2016 |
|
| 2017 |
|
| 2016 |
| ||||||||
Prologis U.S. Logistics Venture |
| 55.0 | % |
|
| 55.0 | % |
| $ | 2,512,472 |
|
| $ | 2,424,800 |
|
| $ | 6,105,053 |
|
| $ | 6,201,278 |
|
| $ | 515,962 |
|
| $ | 797,593 |
|
Prologis North American Industrial Fund (1) | N/A |
|
|
| 66.1 | % |
|
| - |
|
|
| 486,648 |
|
|
| - |
|
|
| 2,479,072 |
|
|
| - |
|
|
| 1,038,708 |
| |
Prologis Brazil Logistics Partners Fund I (2) | N/A |
|
|
| 50.0 | % |
|
| - |
|
|
| 61,836 |
|
|
| - |
|
|
| 131,581 |
|
|
| - |
|
|
| 720 |
| |
Other consolidated entities (3) | various |
|
| various |
|
|
| 79,072 |
|
|
| 99,185 |
|
|
| 845,660 |
|
|
| 866,821 |
|
|
| 30,396 |
|
|
| 34,073 |
| ||
Prologis, L.P. noncontrolling interests |
|
|
|
|
|
|
|
|
| 2,591,544 |
|
|
| 3,072,469 |
|
|
| 6,950,713 |
|
|
| 9,678,752 |
|
|
| 546,358 |
|
|
| 1,871,094 |
|
Limited partners in Prologis, L.P. (4) (5) |
|
|
|
|
|
|
|
|
| 423,961 |
|
|
| 394,590 |
|
|
| - |
|
|
| - |
|
|
| - |
|
|
| - |
|
Prologis, Inc. noncontrolling interests |
|
|
|
|
|
|
|
| $ | 3,015,505 |
|
| $ | 3,467,059 |
|
| $ | 6,950,713 |
|
| $ | 9,678,752 |
|
| $ | 546,358 |
|
| $ | 1,871,094 |
|
|
|
|
|
|
|
|
|
NOTE 7.8. LONG-TERM COMPENSATION
Equity-Based Compensation Plans and Programs
Prologis Outperformance Plan (“POP”)
ParticipationWe have allocated participation points representor a portionpercentage of the compensation pool to participants under our POP corresponding to three-year performance periods beginning every January 1. The fair value of the awards is measured at the grant date and amortized over the period from the grant date to the date at which the awards vest, which ranges from three to ten years. The performance hurdle (“Outperformance Hurdle”) at the end of the initial three-year performance period requires our three-year compound annualized total stockholder return (“TSR”) to exceed a threshold set at the three-year compound annualized TSR for the Morgan Stanley Capital International (“MSCI”) US REIT Index for the same period plus 100 basis points. If the Outperformance Hurdle is met, a compensation pool that canwill be earned if and when certain performance criteria are met underformed equal to 3% of the POP for the applicableexcess value created, subject to a maximum as defined by each performance period. POP awards cannot be paid at a time when we meet the outperformance hurdle yet our absolute TSR is negative. If after seven years our absolute TSR has not been positive, the awards will be forfeited.
We granted participation points for the 20172023 – 20192025 performance period in January 2017,2023, with a fair value of $20.4$28.3 million using a Monte Carlo valuation model that assumed a risk-free interest rate of 1.49%4.2% and an expected volatility of 22.2%.35.0% for Prologis and 31.0% for the MSCI US REIT Index. The 2023 – 2025 performance period has an absolute maximum cap of $100.0 million. If an award is earned at the end of the initial three-year performance period, then 20% of the POP award is paid at the end of the initial performance period and the remaining 80% is subject to additional seven-year cliff vesting. The 20% that is paid at the end of the initial three-year performance period is subject to an additional three-year holding requirement. Awards are in the form of common stock, restricted stock units, POP LTIP Units and LTIP Units.
The POP performance criteria wereOutperformance Hurdle was met for the 20142020 – 20162022 performance period, which resulted in awards for this performance periodof $100.0 million being earned. An aggregate performance pool of $62.2 million wasearned at December 31, 2022 and awarded in January 20172023. Additionally, awards of $22.4 million were earned at December 31, 2022 and awarded in January 2023 for prior performance periods related to the compensation pool in excess of the initial award based on the terms of the POP awards granted prior to 2018. The tables below include POP awards that were earned but are unvested, while any vested awards are reflected within the Consolidated Statements of Equity and Capital. The initial grant date fair value derived using a Monte Carlo valuation model was used in determining the grant date fair value per unit in the tables below.
Other Equity-Based Compensation Plans and Programs
Our other equity-based compensation plans and programs include (i) the Prologis Promote Plan (“PPP”); (ii) the annual long-term incentive (“LTI”) equity award program (“Annual LTI Award”); and (iii) the annual bonus exchange program. Awards under these plans and programs may be issued in the form of restricted stock units (“RSUs”) or LTIP Units at the participant’s election. RSUs and LTIP Units are valued based on the market price of the Parent’s common stock or vested POP LTIP Units.on the date the award is granted and the grant date value is charged to compensation expense over the service period.
Prologis Promote Plan (“PPP”)Summary of Award Activity
The following table details the equity awards granted under the PPP for the nine months ended September 30 (in thousands):RSUs
|
| 2017 |
|
| 2016 |
| ||
RSUs granted |
|
| 88 |
|
|
| 53 |
|
Grant date fair value of RSUs granted |
| $ | 4,800 |
|
| $ | 2,300 |
|
LTIP Units granted |
|
| 203 |
|
|
| 114 |
|
Grant date fair value of LTIP Units granted |
| $ | 11,100 |
|
| $ | 4,900 |
|
Prologis Outperformance Plan Operating Partnership Long-Term Incentive Plan Units (“POP LTIP Units”)
The following table summarizes the activity for the unvested POP LTIP UnitsRSUs for the ninethree months ended September 30, 2017March 31, 2023 (units in thousands):
|
|
|
|
| Weighted Average |
| ||
|
| Unvested RSUs |
|
| Grant Date Fair Value |
| ||
Balance at January 1, 2023 |
|
| 1,533 |
|
| $ | 100.59 |
|
Granted |
|
| 764 |
|
|
| 96.37 |
|
Vested and distributed |
|
| (333 | ) |
|
| 115.60 |
|
Forfeited |
|
| (11 | ) |
|
| 129.01 |
|
Balance at March 31, 2023 |
|
| 1,953 |
|
| $ | 96.22 |
|
|
|
|
|
|
|
| ||
LTIP Units
| ||||
| ||||
|
| |||
|
| |||
|
|
| ||
|
|
| ||
|
| |||
|
|
Operating Partnership Long-Term Incentive Plan Units (“LTIP Units”)
The following table summarizes the activity for LTIP Units for the ninethree months ended September 30, 2017March 31, 2023 (units in thousands):
|
| Unvested |
|
| Weighted Average |
| ||
|
| LTIP Units |
|
| Grant Date Fair Value |
| ||
Balance at January 1, 2023 |
|
| 4,214 |
|
| $ | 73.31 |
|
Granted |
|
| 1,292 |
|
|
| 78.94 |
|
Vested LTIP Units |
|
| (688 | ) |
|
| 105.99 |
|
Balance at March 31, 2023 |
|
| 4,818 |
|
| $ | 70.16 |
|
18
|
| Number of |
|
| Weighted Average |
|
| Number of |
| |||
|
| LTIP Units |
|
| Grant-Date Fair Value |
|
| LTIP Units Vested |
| |||
Balance at January 1, 2017 |
|
| 2,219 |
|
| $ | 40.81 |
|
|
| 743 |
|
Granted |
|
| 1,032 |
|
|
|
|
|
|
|
|
|
Vested POP LTIP Units |
|
| 698 |
|
|
|
|
|
|
|
|
|
Conversion to common limited partnership units |
|
| (234 | ) |
|
|
|
|
|
|
|
|
Balance at September 30, 2017 |
|
| 3,715 |
|
| $ | 45.54 |
|
|
| 1,868 |
|
|
|
|
|
|
|
|
|
|
|
|
|
|
Restricted Stock Units (“RSUs”)
The following table summarizes the activity for RSUs for the nine months ended September 30, 2017 (units in thousands):
|
| Number of |
|
| Weighted Average |
|
| Number of |
| |||
|
| RSUs |
|
| Grant-Date Fair Value |
|
| RSUs Vested |
| |||
Balance at January 1, 2017 |
|
| 1,617 |
|
| $ | 40.58 |
|
|
| 125 |
|
Granted |
|
| 757 |
|
|
|
|
|
|
|
|
|
Vested and distributed |
|
| (802 | ) |
|
|
|
|
|
|
|
|
Forfeited |
|
| (63 | ) |
|
|
|
|
|
|
|
|
Balance at September 30, 2017 |
|
| 1,509 |
|
| $ | 45.35 |
|
|
| 106 |
|
|
|
|
|
|
|
|
|
|
|
|
|
|
Stock Options
We have 0.8 million stock options outstanding and exercisable at September 30, 2017, with a weighted average exercise price of $30.81. The aggregate intrinsic value of exercised options was $24.4 million and $43.9 million for the nine months ended September 30, 2017, and 2016, respectively. No stock options were granted in 2017 or 2016.
NOTE 8.9. EARNINGS PER COMMON SHARE OR UNIT
We determine basic earnings per share or unit based on the weighted average number of shares of common stock or units outstanding during the period. We compute diluted earnings per share or unit based on the weighted average number of shares or units outstanding combined with the incremental weighted average effect from all outstanding potentially dilutive instruments.
The computation of our basic and diluted earnings per share and unit was as follows (in thousands, except per share and unit amounts):
|
| Three Months Ended |
| |||||
|
| March 31, |
| |||||
Prologis, Inc. |
| 2023 |
|
| 2022 |
| ||
Net earnings attributable to common stockholders – Basic |
|
| 463,170 |
|
| $ | 1,149,254 |
|
Net earnings attributable to exchangeable limited partnership units (1) |
|
| 11,743 |
|
|
| 32,338 |
|
Adjusted net earnings attributable to common stockholders – Diluted |
| $ | 474,913 |
|
| $ | 1,181,592 |
|
|
|
|
|
|
|
| ||
Weighted average common shares outstanding – Basic |
|
| 923,888 |
|
|
| 740,368 |
|
Incremental weighted average effect on exchange of limited partnership units (1) |
|
| 23,535 |
|
|
| 21,089 |
|
Incremental weighted average effect of equity awards |
|
| 4,201 |
|
|
| 4,060 |
|
Weighted average common shares outstanding – Diluted (2) |
|
| 951,624 |
|
|
| 765,517 |
|
|
|
|
|
|
|
| ||
Net earnings per share attributable to common stockholders: |
|
|
|
|
|
| ||
Basic |
| $ | 0.50 |
|
| $ | 1.55 |
|
Diluted |
| $ | 0.50 |
|
| $ | 1.54 |
|
|
| Three Months Ended |
| |||||
|
| March 31, |
| |||||
Prologis, L.P. |
| 2023 |
|
| 2022 |
| ||
Net earnings attributable to common unitholders |
| $ | 474,819 |
|
| $ | 1,181,525 |
|
Net earnings attributable to Class A Units |
|
| (4,045 | ) |
|
| (12,415 | ) |
Net earnings attributable to common unitholders – Basic |
|
| 470,774 |
|
|
| 1,169,110 |
|
Net earnings attributable to Class A Units |
|
| 4,045 |
|
|
| 12,415 |
|
Net earnings attributable to exchangeable other limited partnership units |
|
| 94 |
|
|
| 67 |
|
Adjusted net earnings attributable to common unitholders – Diluted |
| $ | 474,913 |
|
| $ | 1,181,592 |
|
|
|
|
|
|
|
| ||
Weighted average common partnership units outstanding – Basic |
|
| 939,054 |
|
|
| 753,159 |
|
Incremental weighted average effect on exchange of Class A Units |
|
| 8,070 |
|
|
| 7,999 |
|
Incremental weighted average effect on exchange of other limited partnership units |
|
| 299 |
|
|
| 299 |
|
Incremental weighted average effect of equity awards of Prologis, Inc. |
|
| 4,201 |
|
|
| 4,060 |
|
Weighted average common units outstanding – Diluted (2) |
|
| 951,624 |
|
|
| 765,517 |
|
|
|
|
|
|
|
| ||
Net earnings per unit attributable to common unitholders: |
|
|
|
|
|
| ||
Basic |
| $ | 0.50 |
|
| $ | 1.55 |
|
Diluted |
| $ | 0.50 |
|
| $ | 1.54 |
|
|
|
| Three Months Ended |
| |||||
|
|
| March 31, |
| |||||
|
|
| 2023 |
|
| 2022 |
| ||
| Class A Units |
|
| 8,070 |
|
|
| 7,999 |
|
| Other limited partnership units |
|
| 299 |
|
|
| 299 |
|
| Equity awards |
|
| 7,773 |
|
|
| 5,839 |
|
| Prologis, L.P. |
|
| 16,142 |
|
|
| 14,137 |
|
| Common limited partnership units |
|
| 15,166 |
|
|
| 12,791 |
|
| Prologis, Inc. |
|
| 31,308 |
|
|
| 26,928 |
|
19
|
| Three Months Ended |
|
| Nine Months Ended |
| ||||||||||
|
| September 30, |
|
| September 30, |
| ||||||||||
Prologis, Inc. |
| 2017 |
|
| 2016 |
|
| 2017 |
|
| 2016 |
| ||||
Net earnings attributable to common stockholders – Basic |
| $ | 876,218 |
|
| $ | 279,255 |
|
| $ | 1,346,416 |
|
| $ | 762,679 |
|
Net earnings attributable to redeemable limited partnership unitholders (1) |
|
| 24,362 |
|
|
| 7,713 |
|
|
| 38,127 |
|
|
| 24,479 |
|
Adjusted net earnings attributable to common stockholders – Diluted |
| $ | 900,580 |
|
| $ | 286,968 |
|
| $ | 1,384,543 |
|
| $ | 787,158 |
|
|
|
|
|
|
|
|
|
|
|
|
|
|
|
|
|
|
Weighted average common shares outstanding – Basic |
|
| 531,288 |
|
|
| 527,288 |
|
|
| 530,036 |
|
|
| 525,462 |
|
Incremental weighted average effect on redemption of limited partnership units (1) |
|
| 15,641 |
|
|
| 14,568 |
|
|
| 16,150 |
|
|
| 17,156 |
|
Incremental weighted average effect of equity awards |
|
| 7,234 |
|
|
| 5,344 |
|
|
| 5,432 |
|
|
| 2,610 |
|
Weighted average common shares outstanding – Diluted (2) |
|
| 554,163 |
|
|
| 547,200 |
|
|
| 551,618 |
|
|
| 545,228 |
|
|
|
|
|
|
|
|
|
|
|
|
|
|
|
|
|
|
Net earnings per share attributable to common stockholders: |
|
|
|
|
|
|
|
|
|
|
|
|
|
|
|
|
Basic |
| $ | 1.65 |
|
| $ | 0.53 |
|
| $ | 2.54 |
|
| $ | 1.45 |
|
Diluted |
| $ | 1.63 |
|
| $ | 0.52 |
|
| $ | 2.51 |
|
| $ | 1.44 |
|
| Three Months Ended |
|
| Nine Months Ended |
| |||||||||||
|
| September 30, |
|
| September 30, |
| ||||||||||
Prologis, L.P. |
| 2017 |
|
| 2016 |
|
| 2017 |
|
| 2016 |
| ||||
Net earnings attributable to common unitholders |
| $ | 900,331 |
|
| $ | 286,943 |
|
| $ | 1,383,529 |
|
| $ | 784,917 |
|
Net earnings attributable to Class A common unitholders |
|
| (14,233 | ) |
|
| (4,641 | ) |
|
| (21,911 | ) |
|
| (12,769 | ) |
Net earnings attributable to common unitholders – Basic |
|
| 886,098 |
|
|
| 282,302 |
|
|
| 1,361,618 |
|
|
| 772,148 |
|
Net earnings attributable to Class A common unitholders |
|
| 14,233 |
|
|
| 4,641 |
|
|
| 21,911 |
|
|
| 12,769 |
|
Net earnings attributable to limited partnership unitholders |
|
| 249 |
|
|
| 25 |
|
|
| 1,014 |
|
|
| 2,241 |
|
Adjusted net earnings attributable to common unitholders – Diluted |
| $ | 900,580 |
|
| $ | 286,968 |
|
| $ | 1,384,543 |
|
| $ | 787,158 |
|
|
|
|
|
|
|
|
|
|
|
|
|
|
|
|
|
|
Weighted average common partnership units outstanding – Basic |
|
| 537,257 |
|
|
| 532,934 |
|
|
| 536,021 |
|
|
| 531,985 |
|
Incremental weighted average effect on conversion of Class A Units |
|
| 8,588 |
|
|
| 8,753 |
|
|
| 8,625 |
|
|
| 8,798 |
|
Incremental weighted average effect on redemption of limited partnership units into common stock of Prologis, Inc. |
|
| 1,084 |
|
|
| 169 |
|
|
| 1,540 |
|
|
| 1,835 |
|
Incremental weighted average effect of equity awards of Prologis, Inc. |
|
| 7,234 |
|
|
| 5,344 |
|
|
| 5,432 |
|
|
| 2,610 |
|
Weighted average common partnership units outstanding – Diluted (2) |
|
| 554,163 |
|
|
| 547,200 |
|
|
| 551,618 |
|
|
| 545,228 |
|
|
|
|
|
|
|
|
|
|
|
|
|
|
|
|
|
|
Net earnings per unit attributable to common unitholders: |
|
|
|
|
|
|
|
|
|
|
|
|
|
|
|
|
Basic |
| $ | 1.65 |
|
| $ | 0.53 |
|
| $ | 2.54 |
|
| $ | 1.45 |
|
Diluted |
| $ | 1.63 |
|
| $ | 0.52 |
|
| $ | 2.51 |
|
| $ | 1.44 |
|
|
|
|
|
|
|
| Three Months Ended |
|
| Nine Months Ended |
| ||||||||||
|
|
| September 30, |
|
| September 30, |
| ||||||||||
|
|
| 2017 |
|
| 2016 |
|
| 2017 |
|
| 2016 |
| ||||
| Total weighted average potentially dilutive limited partnership units |
|
| 9,672 |
|
|
| 10,587 |
|
|
| 10,166 |
|
|
| 10,633 |
|
| Total potentially dilutive stock awards |
|
| 9,934 |
|
|
| 9,220 |
|
|
| 9,038 |
|
|
| 7,783 |
|
| Total Prologis, L.P. |
|
| 19,606 |
|
|
| 19,807 |
|
|
| 19,204 |
|
|
| 18,416 |
|
| Limited partners in Prologis, L.P. |
|
| 5,969 |
|
|
| 5,646 |
|
|
| 5,984 |
|
|
| 6,523 |
|
| Total Prologis, Inc. |
|
| 25,575 |
|
|
| 25,453 |
|
|
| 25,188 |
|
|
| 24,939 |
|
NOTE 9.10. FINANCIAL INSTRUMENTS AND FAIR VALUE MEASUREMENTS
Derivative Financial Instruments
In the normal course of business, our operations are exposed to market risks, including the effect of changes in foreign currency exchange rates and interest rates. To manage these risks, weWe may enter into derivative contracts, such as foreign currency contracts to manage foreign currency exposure, and interest rate swaps to manage the effect of interest rate fluctuations. We do not use derivative financial instruments for trading or speculative purposes. Our derivative financial instruments are customized transactions and are not exchange-traded. Management reviews our hedging program, derivative positions and overall risk management strategy on a regular basis. We enter into only those transactions we believe will be highly effective at offsetting theto offset these underlying risk.market risks. There have been no significant changes in our policy or strategy from what was disclosed in our Annual Report on Form 10-K for the fiscal year ended December 31, 2016.2022.
The following table presents the fair value and classification of our derivative instruments (in thousands):
|
| September 30, 2017 |
|
| December 31, 2016 |
| ||||||||||
|
| Asset |
|
| Liability |
|
| Asset |
|
| Liability |
| ||||
Net investment hedges |
|
|
|
|
|
|
|
|
|
|
|
|
|
|
|
|
British pound sterling denominated |
| $ | - |
|
| $ | - |
|
| $ | 7,439 |
|
| $ | - |
|
Canadian dollar denominated |
|
| - |
|
|
| 7,683 |
|
|
| 1,245 |
|
|
| - |
|
|
|
|
|
|
|
|
|
|
|
|
|
|
|
|
|
|
Forwards and options (1) |
|
|
|
|
|
|
|
|
|
|
|
|
|
|
|
|
British pound sterling denominated |
|
| 4,932 |
|
|
| 7,158 |
|
|
| 16,985 |
|
|
| - |
|
Canadian dollar denominated |
|
| - |
|
|
| 1,709 |
|
|
| 831 |
|
|
| 197 |
|
Euro denominated |
|
| - |
|
|
| 12,144 |
|
|
| 10,933 |
|
|
| - |
|
Japanese yen denominated |
|
| 6,671 |
|
|
| 1,100 |
|
|
| 9,246 |
|
|
| 1,071 |
|
|
|
|
|
|
|
|
|
|
|
|
|
|
|
|
|
|
Interest rate hedges |
|
| 8,707 |
|
|
| - |
|
|
| 435 |
|
|
| - |
|
|
|
|
|
|
|
|
|
|
|
|
|
|
|
|
|
|
Total fair value of derivatives |
| $ | 20,310 |
|
| $ | 29,794 |
|
| $ | 47,114 |
|
| $ | 1,268 |
|
|
|
|
|
|
|
|
|
|
|
|
|
|
|
|
|
|
|
|
Foreign Currency
We primarily manage our foreign currency exposure by borrowing in the currencies in which we invest. We may issue debt in a currency that is not the same functional currency of the borrowing entity to offset the translation and economic exposures related to our net investment in international subsidiaries. To mitigate the impact of the translation from the fluctuations in exchange rates, we may designate this debt as a nonderivative financial instrument hedge. We also hedge our investments in certain international subsidiaries using foreign currency derivative contracts (net investment hedges) to offset the translation and economic exposures related to our investments in these subsidiaries by locking in a forward exchange rate at the inception of the hedge. To the extent we have an effective hedging relationship, we report all changes in fair value of the hedged portion of the nonderivative financial instruments recognized within Other Assets and net investment hedges in equity in the foreign currency translation component of Accumulated Other Comprehensive Loss (“AOCI”) inLiabilities on the Consolidated Balance Sheets. These amounts offsetSheets (in thousands):
|
| March 31, 2023 |
|
| December 31, 2022 |
| ||||||||||
|
| Asset |
|
| Liability |
|
| Asset |
|
| Liability |
| ||||
Undesignated derivatives |
|
|
|
|
|
|
|
|
|
|
|
| ||||
Foreign currency contracts |
|
|
|
|
|
|
|
|
|
|
|
| ||||
Forwards |
|
|
|
|
|
|
|
|
|
|
|
| ||||
Brazilian real |
| $ | - |
|
| $ | 741 |
|
| $ | 35 |
|
| $ | 494 |
|
British pound sterling |
|
| 20,796 |
|
|
| 915 |
|
|
| 29,187 |
|
|
| 648 |
|
Canadian dollar |
|
| 8,316 |
|
|
| 10 |
|
|
| 12,074 |
|
|
| 2 |
|
Chinese renminbi |
|
| 443 |
|
|
| 434 |
|
|
| 657 |
|
|
| 364 |
|
Euro |
|
| 41,794 |
|
|
| 3,051 |
|
|
| 51,317 |
|
|
| 2,801 |
|
Japanese yen |
|
| 33,454 |
|
|
| 807 |
|
|
| 34,022 |
|
|
| 2,344 |
|
Swedish krona |
|
| 5,568 |
|
|
| 26 |
|
|
| 6,292 |
|
|
| - |
|
|
|
|
|
|
|
|
|
|
|
|
|
| ||||
Designated derivatives |
|
|
|
|
|
|
|
|
|
|
|
| ||||
Foreign currency contracts |
|
|
|
|
|
|
|
|
|
|
|
| ||||
Net investment hedges |
|
|
|
|
|
|
|
|
|
|
|
| ||||
British pound sterling |
|
| 16,305 |
|
|
| 555 |
|
|
| 23,534 |
|
|
| - |
|
Canadian dollar |
|
| 18,002 |
|
|
| - |
|
|
| 24,552 |
|
|
| - |
|
Chinese renminbi |
|
| - |
|
|
| 34 |
|
|
| - |
|
|
| - |
|
|
|
|
|
|
|
|
|
|
|
|
|
| ||||
Interest rate swaps |
|
|
|
|
|
|
|
|
|
|
|
| ||||
Cash flow hedges |
|
|
|
|
|
|
|
|
|
|
|
| ||||
Euro |
|
| 2,842 |
|
|
| - |
|
|
| 44,982 |
|
|
| - |
|
U.S. dollar |
|
| - |
|
|
| - |
|
|
| 584 |
|
|
| 29 |
|
Total fair value of derivatives |
| $ | 147,520 |
|
| $ | 6,573 |
|
| $ | 227,236 |
|
| $ | 6,682 |
|
|
|
|
|
|
|
|
|
|
|
|
|
| ||||
Undesignated Derivative Financial Instruments
Foreign Currency Contracts
The following table summarizes the translation adjustments on the underlying net assetsactivity of our foreign investments, which we also record in AOCI. The changes in fair value of the portion of the nonderivative financial instruments that are not designated as hedges are recorded in Foreign Currency and Derivative Losses, Net in the Consolidated Statements of Income. We recognize ineffectiveness, if any, in earnings at the time the ineffectiveness occurred.
We may use foreign currency option contracts, including puts, calls and collars to mitigate foreign currency exchange rate risk associated with the translation of our projected net operating income of our international subsidiaries. These are not designated as hedges as they do not meet hedge accounting requirements. Changes in the fair value of non-hedge designated derivatives are recorded in Foreign Currency and Derivative Losses, Net.
The following tables summarize the activity in ourundesignated foreign currency contracts for the ninethree months ended September 30March 31 (in millions, except for weighted average forward rates and number of active contracts):
| 2023 |
|
| 2022 |
| |||||||||||||||||||||||||||||||||||||||||||||
| CAD |
|
| EUR |
|
| GBP |
|
| JPY |
|
| Other |
|
| Total |
|
| CAD |
|
| EUR |
|
| GBP |
|
| JPY |
| SEK |
|
| Other |
|
| Total |
| |||||||||||||
Notional amounts at January 1 ($) |
| 283 |
|
|
| 601 |
|
|
| 349 |
|
|
| 331 |
|
|
| 81 |
|
|
| 1,645 |
|
|
| 175 |
|
|
| 749 |
|
|
| 383 |
|
|
| 250 |
|
| 85 |
|
|
| 20 |
|
|
| 1,662 |
|
New contracts ($) |
| 6 |
|
|
| 9 |
|
|
| 49 |
|
|
| 27 |
|
|
| 41 |
|
|
| 132 |
|
|
| 45 |
|
|
| 350 |
|
|
| (21 | ) |
|
| 61 |
|
| 9 |
|
|
| 13 |
|
|
| 457 |
|
Matured, expired or settled contracts ($) |
| (54 | ) |
|
| (43 | ) |
|
| (22 | ) |
|
| (21 | ) |
|
| (7 | ) |
|
| (147 | ) |
|
| (16 | ) |
|
| (182 | ) |
|
| (19 | ) |
|
| (22 | ) |
| (4 | ) |
|
| (4 | ) |
|
| (247 | ) |
Notional amounts at March 31 ($) |
| 235 |
|
|
| 567 |
|
|
| 376 |
|
|
| 337 |
|
|
| 115 |
|
|
| 1,630 |
|
|
| 204 |
|
|
| 917 |
|
|
| 343 |
|
|
| 289 |
|
| 90 |
|
|
| 29 |
|
|
| 1,872 |
|
|
|
|
|
|
|
|
|
|
|
|
|
|
|
|
|
|
|
|
|
|
|
|
|
|
|
|
|
|
|
|
|
|
|
|
|
|
| |||||||||||||
Weighted average forward rate at March 31 |
| 1.29 |
|
|
| 1.18 |
|
|
| 1.30 |
|
|
| 110.58 |
|
|
|
|
|
|
|
|
| 1.27 |
|
|
| 1.19 |
|
|
| 1.27 |
|
|
| 104.39 |
|
| 9.30 |
|
|
|
|
|
|
| ||||
Active contracts at March 31 |
| 88 |
|
|
| 94 |
|
|
| 100 |
|
|
| 97 |
|
|
|
|
|
|
|
|
| 81 |
|
|
| 93 |
|
|
| 77 |
|
|
| 85 |
|
| 84 |
|
|
|
|
|
|
| ||||
20
2017 |
|
|
|
|
|
|
|
|
|
|
|
|
|
|
|
|
|
|
|
|
|
|
|
|
|
| Foreign Currency Contracts |
| |||||||||||||||||||||
Local Currency |
| Net Investment Hedges |
|
| Forwards and Options |
| ||||||||||||||||||
|
| CAD |
|
| GBP |
|
| CAD |
|
| EUR |
|
| GBP |
|
| JPY |
| ||||||
Notional amounts at January 1 |
| $ | 133 |
|
| £ | 31 |
|
| $ | 50 |
|
| € | 174 |
|
| £ | 48 |
|
| ¥ | 15,500 |
|
New contracts |
|
| 133 |
|
|
| 100 |
|
|
| 24 |
|
|
| 56 |
|
|
| 107 |
|
|
| 4,000 |
|
Matured, expired or settled contracts |
|
| (133 | ) |
|
| (131 | ) |
|
| (22 | ) |
|
| (72 | ) |
|
| (48 | ) |
|
| (5,400 | ) |
Notional amounts at September 30 |
| $ | 133 |
|
| £ | - |
|
| $ | 52 |
|
| € | 158 |
|
| £ | 107 |
|
| ¥ | 14,100 |
|
|
|
|
|
|
|
|
|
|
|
|
|
|
|
|
|
|
|
|
|
|
|
|
|
|
|
| Foreign Currency Contracts |
| |||||||||||||||||||||
U.S. Dollar |
| Net Investment Hedges |
|
| Forwards and Options |
| ||||||||||||||||||
Notional amounts at January 1 |
| $ | 100 |
|
| $ | 46 |
|
| $ | 38 |
|
| $ | 197 |
|
| $ | 78 |
|
| $ | 144 |
|
New contracts |
|
| 99 |
|
|
| 127 |
|
|
| 19 |
|
|
| 63 |
|
|
| 137 |
|
|
| 38 |
|
Matured, expired or settled contracts |
|
| (100 | ) |
|
| (173 | ) |
|
| (17 | ) |
|
| (81 | ) |
|
| (75 | ) |
|
| (49 | ) |
Notional amounts at September 30 |
| $ | 99 |
|
| $ | - |
|
| $ | 40 |
|
| $ | 179 |
|
| $ | 140 |
|
| $ | 133 |
|
|
|
|
|
|
|
|
|
|
|
|
|
|
|
|
|
|
|
|
|
|
|
|
|
|
Weighted average forward rate at September 30 |
|
| 1.34 |
|
|
| - |
|
|
| 1.30 |
|
|
| 1.13 |
|
|
| 1.31 |
|
|
| 106.11 |
|
Active contracts at September 30 |
|
| 2 |
|
|
| - |
|
|
| 18 |
|
|
| 23 |
|
|
| 19 |
|
|
| 29 |
|
The following table summarizes the undesignated derivative financial instruments exercised and outstanding recognized in realized and unrealized gains (losses), respectively, in Foreign Currency and Derivative Gains and Other Income, Net in the Consolidated Statements of Income (in millions, except for number of exercised contracts):
|
| Three Months Ended |
| |||||
|
| March 31, |
| |||||
|
| 2023 |
|
| 2022 |
| ||
Exercised contracts |
|
| 52 |
|
|
| 32 |
|
Realized gains on the matured, expired or settled contracts |
| $ | 14 |
|
| $ | 15 |
|
Unrealized gains (losses) on the change in fair value of outstanding contracts |
| $ | (14 | ) |
| $ | 15 |
|
2016 |
|
|
|
|
|
|
|
|
|
|
|
|
|
|
|
|
|
|
|
|
|
|
|
|
|
|
|
|
|
| Foreign Currency Contracts |
| |||||||||||||||||||||||||
Local Currency |
| Net Investment Hedges |
|
| Forwards and Options |
| ||||||||||||||||||||||
|
| CAD |
|
| GBP |
|
| JPY |
|
| EUR |
|
| GBP |
|
| JPY |
|
| Other |
| |||||||
Notional amounts at January 1 |
| $ | - |
|
| £ | 238 |
|
| ¥ | - |
|
| € | 275 |
|
| £ | 97 |
|
| ¥ | 12,840 |
|
|
|
|
|
New contracts |
|
| 133 |
|
|
| 60 |
|
|
| 11,189 |
|
|
| 321 |
|
|
| - |
|
|
| 15,460 |
|
|
|
|
|
Matured, expired or settled contracts |
|
| - |
|
|
| (60 | ) |
|
| (11,189 | ) |
|
| (440 | ) |
|
| (36 | ) |
|
| (10,940 | ) |
|
|
|
|
Notional amounts at September 30 |
| $ | 133 |
|
| £ | 238 |
|
| ¥ | - |
|
| € | 156 |
|
| £ | 61 |
|
| ¥ | 17,360 |
|
|
|
|
|
|
|
|
|
|
|
|
|
|
|
|
|
|
|
|
|
|
|
|
|
|
|
|
|
|
|
|
|
|
|
| Foreign Currency Contracts |
| |||||||||||||||||||||||||
U.S. Dollar |
| Net Investment Hedges |
|
| Forwards and Options (1) |
| ||||||||||||||||||||||
Notional amounts at January 1 |
| $ | - |
|
| $ | 386 |
|
| $ | - |
|
| $ | 310 |
|
| $ | 148 |
|
| $ | 109 |
|
| $ | 50 |
|
New contracts |
|
| 100 |
|
|
| 85 |
|
|
| 99 |
|
|
| 359 |
|
|
| - |
|
|
| 147 |
|
|
| 15 |
|
Matured, expired or settled contracts |
|
| - |
|
|
| (100 | ) |
|
| (99 | ) |
|
| (492 | ) |
|
| (55 | ) |
|
| (95 | ) |
|
| (21 | ) |
Notional amounts at September 30 |
| $ | 100 |
|
| $ | 371 |
|
| $ | - |
|
| $ | 177 |
|
| $ | 93 |
|
| $ | 161 |
|
| $ | 44 |
|
|
|
Designated Derivative Financial Instruments
Interest Rate
We may enter into interest rate swap agreementsChanges in the fair value of derivatives that allow us to receive variable-rate amounts from a counterparty in exchange for us making fixed-rate payments over the lifeare designated as net investment hedges of our agreements withoutforeign operations and cash flow hedges are recorded in Accumulated Other Comprehensive Income (Loss) (“AOCI/L”) and reflected within the exchangeOther Comprehensive Income (Loss) table below.
Foreign Currency Contracts
The following table summarizes the activity of our foreign currency contracts designated as net investment hedges for the underlying notional amount.
We report the effective portion of the gain or loss on the derivative as a component of AOCI and reclassify it to Interest Expense over the corresponding period of the hedged item. We recognize any hedge ineffectiveness in Interest Expense at the time the ineffectiveness occurred. During the ninethree months ended September 30, 2017,March 31 (in millions, except for weighted average forward rates and 2016, we had no losses due to hedge ineffectiveness.number of active contracts):
|
| 2023 |
|
| 2022 |
| ||||||||||||||||||||||||||
|
| CAD |
|
| CNH |
|
| GBP |
|
| Total |
|
| BRL |
|
| CAD |
|
| GBP |
|
| Total |
| ||||||||
Notional amounts at January 1 ($) |
|
| 534 |
|
|
| - |
|
|
| 440 |
|
|
| 974 |
|
|
| - |
|
|
| 535 |
|
|
| 432 |
|
|
| 967 |
|
New contracts ($) |
|
| 119 |
|
|
| 100 |
|
|
| - |
|
|
| 219 |
|
|
| 44 |
|
|
| 204 |
|
|
| 229 |
|
|
| 477 |
|
Matured, expired or settled contracts ($) |
|
| (124 | ) |
|
| - |
|
|
| - |
|
|
| (124 | ) |
|
| (44 | ) |
|
| (125 | ) |
|
| (100 | ) |
|
| (269 | ) |
Notional amounts at March 31 ($) |
|
| 529 |
|
|
| 100 |
|
|
| 440 |
|
|
| 1,069 |
|
|
| - |
|
|
| 614 |
|
|
| 561 |
|
|
| 1,175 |
|
|
|
|
|
|
|
|
|
|
|
|
|
|
|
|
|
|
|
|
|
|
|
|
|
| ||||||||
Weighted average forward rate at |
|
| 1.30 |
|
|
| 6.72 |
|
|
| 1.28 |
|
|
|
|
|
| - |
|
|
| 1.26 |
|
|
| 1.35 |
|
|
|
| ||
Active contracts at March 31 |
|
| 6 |
|
|
| 1 |
|
|
| 4 |
|
|
|
|
|
| - |
|
|
| 7 |
|
|
| 5 |
|
|
|
| ||
At September 30, 2017, and December 31, 2016, we had three interest rate swaps outstanding with a notional amount of $271.2 million. We did not enter into or settle any interest rate swaps duringInterest Rate Swaps
The following table summarizes the nine months ended September 30, 2017. During the nine months ended September 30, 2016, we did not enter into any interest rate swap contracts, and we settled ¥105.9 billion ($924.6 million)activity of our interest rate swaps outstanding.designated as cash flow hedges for the three months ended March 31 (in millions):
|
| 2023 |
|
| 2022 |
|
| ||||||||||||||
|
| EUR |
|
| USD |
|
| Total |
|
| EUR |
|
| Total |
|
| |||||
Notional amounts at January 1 ($) |
|
| 447 |
|
|
| 150 |
|
|
| 597 |
|
|
| 165 |
|
|
| 165 |
|
|
New contracts ($) |
|
| 434 |
|
|
| 550 |
|
|
| 984 |
|
|
| 1,004 |
|
|
| 1,004 |
|
|
Matured, expired or settled contracts ($) (1) |
|
| (709 | ) |
|
| (700 | ) |
|
| (1,409 | ) |
|
| (722 | ) |
|
| (722 | ) |
|
Notional amounts at March 31 ($) |
|
| 172 |
|
|
| - |
|
|
| 172 |
|
|
| 447 |
|
|
| 447 |
|
|
Designated Nonderivative Financial Instruments
The following table summarizes our debt and accrued interest, designated as a hedge of our net investment in international subsidiaries at the quarter ended (in millions):
|
| March 31, 2023 |
|
| December 31, 2022 |
| ||
British pound sterling |
| $ | 1,252 |
|
| $ | 1,237 |
|
Canadian dollar |
| $ | 373 |
|
| $ | 370 |
|
21
The following table summarizes the unrealized gains (losses) in Foreign Currency and Derivative Gains and Other Income, Net on the remeasurement of the unhedged portion of our euro denominated debt and accrued interest (in millions):
|
| Three Months Ended |
| |||||
|
| March 31, |
| |||||
|
| 2023 |
|
| 2022 |
| ||
Unrealized gains (losses) on the unhedged portion |
| $ | (4 | ) |
| $ | 15 |
|
Other Comprehensive Income (Loss)
The change in Other Comprehensive Income (Loss)in the Consolidated Statements of Comprehensive Income during the periods presented iswas due to the translation into U.S. dollars from the consolidation of the financial statements of our consolidated subsidiaries whose functional currency is not the U.S. dollar. We recorded gains of $147.6 million and $474.1 million for the three and nine months ended September 30, 2017, respectively, and losses of $40.8 million and $22.0 million for the three and nine months ended September 30, 2016, respectively. The gains and losses recognized in Other Comprehensive Income during these periods were offset by net losses on the translation of our derivative and nonderivative net investment hedges detailed below. This includes the change in fair value forof the effective portion of our derivative and nonderivativefinancial instruments that have been designated as hedges.net investment hedges and cash flow hedges and the translation of the hedged portion of our debt, as discussed above, are also included in Other Comprehensive Income (Loss).
The following table presents the gains and (losses) associated with the changethese changes in fair value for the effective portion of our derivative and nonderivative hedging instruments included in Other Comprehensive Income (Loss) (in thousands):
|
| Three Months Ended |
| |||||
|
| 2023 |
|
| 2022 |
| ||
Derivative net investment hedges (1) |
| $ | (8,163 | ) |
| $ | 4,093 |
|
Debt designated as nonderivative net investment hedges |
|
| (41,499 | ) |
|
| 33,597 |
|
Cumulative translation adjustment |
|
| 21,561 |
|
|
| 151,833 |
|
Total foreign currency translation gains (losses), net |
| $ | (28,101 | ) |
| $ | 189,523 |
|
|
|
|
|
|
|
| ||
Cash flow hedges (1) (2) |
| $ | (19,327 | ) |
| $ | 4,422 |
|
Our share of derivatives from unconsolidated co-investment ventures |
|
| (6,526 | ) |
|
| 8,927 |
|
Total unrealized gains (losses) on derivative contracts, net |
| $ | (25,853 | ) |
| $ | 13,349 |
|
Total change in other comprehensive income (losses) |
| $ | (53,954 | ) |
| $ | 202,872 |
|
|
| Three Months Ended September 30, |
|
| Nine Months Ended September 30, |
| ||||||||||
|
| 2017 |
|
| 2016 |
|
| 2017 |
|
| 2016 |
| ||||
Derivative net investment hedges (1) |
| $ | (3,623 | ) |
| $ | 11,546 |
|
| $ | (13,114 | ) |
| $ | 40,966 |
|
Interest rate and cash flow hedges (2) |
|
| 5,553 |
|
|
| 3,110 |
|
|
| 10,382 |
|
|
| (10,714 | ) |
Our share of derivatives from unconsolidated co-investment ventures |
|
| 538 |
|
|
| 1,586 |
|
|
| 5,075 |
|
|
| (6,408 | ) |
Total derivative instruments |
|
| 2,468 |
|
|
| 16,242 |
|
|
| 2,343 |
|
|
| 23,844 |
|
Nonderivative net investment hedges (3) (4) |
|
| (139,885 | ) |
|
| (19,019 | ) |
|
| (414,077 | ) |
|
| (88,792 | ) |
Total derivative and nonderivative hedging instruments |
| $ | (137,417 | ) |
| $ | (2,777 | ) |
| $ | (411,734 | ) |
| $ | (64,948 | ) |
|
|
|
|
|
|
|
|
|
|
|
|
|
|
|
|
|
|
|
|
|
|
|
|
|
Fair Value Measurements
There have been no significant changes in our policy from what was disclosed in our Annual Report on Form 10-K for the fiscal year ended December 31, 2016.2022.
Fair Value Measurements on a Recurring Basis
At September 30, 2017,March 31, 2023 and December 31, 2016,2022, other than the derivatives discussed previously, we did not have anyhad no significant financial assets or financial liabilities that were measured at fair value on a recurring basis in the Consolidated Financial Statements. All of our derivatives held at September 30, 2017,March 31, 2023 and December 31, 2016,2022, were classified as Level 2 of the fair value hierarchy.
Fair Value Measurements on Nonrecurring Basis
NoAcquired properties and assets we expect to sell or contribute are significant nonfinancial assets that met the criteria to be measured at fair value on a nonrecurring basis at September 30, 2017, orbasis. At March 31, 2023 and December 31, 2016.2022, we estimated the fair value of our properties using Level 2 or Level 3 inputs from the fair value hierarchy. See more information on our acquired properties in Note 3 and assets held for sale or contribution in Note 5.
Fair Value of Financial Instruments
At September 30, 2017,March 31, 2023 and December 31, 2016,2022, the carrying amounts of certain financial instruments, including cash and cash equivalents, restricted cash, accounts and notes receivable, accounts payable and accrued expenses were representative of their fair values because of the short-term nature of these instruments.values.
The differences in the fair value of our debt from the carrying value in the table below arewere the result of differences in interest rates or borrowing spreads that were available to us at September 30, 2017,March 31, 2023 and December 31, 2016,2022, as compared with those in effect when the
22
debt was issued or assumed.assumed, including reduced borrowing spreads due to our improved credit ratings. The senior notes and many of the issuesissuances of secured mortgage debt contain pre-paymentprepayment penalties or yield maintenance provisions that could make the cost of refinancing the debt at lower rates exceed the benefit that would be derived from doing so. We evaluate this on an on-going basis and take the opportunity to refinance our debt at lower rates and longer maturities based on market conditions and other factors. See Note 6 for more information on our debt activity.
The following table reflects the carrying amounts and estimated fair values of our debt (in thousands):
|
| March 31, 2023 |
|
| December 31, 2022 |
| ||||||||||
|
| Carrying Value |
|
| Fair Value |
|
| Carrying Value |
|
| Fair Value |
| ||||
Credit facilities |
| $ | 212,553 |
|
| $ | 212,553 |
|
| $ | 1,538,461 |
|
| $ | 1,538,461 |
|
Senior notes |
|
| 22,399,340 |
|
|
| 19,275,513 |
|
|
| 19,786,253 |
|
|
| 16,604,241 |
|
Term loans and unsecured other |
|
| 2,093,006 |
|
|
| 2,079,813 |
|
|
| 2,106,592 |
|
|
| 2,092,264 |
|
Secured mortgage |
|
| 448,443 |
|
|
| 428,330 |
|
|
| 444,655 |
|
|
| 420,964 |
|
Total |
| $ | 25,153,342 |
|
| $ | 21,996,209 |
|
| $ | 23,875,961 |
|
| $ | 20,655,930 |
|
|
| September 30, 2017 |
|
| December 31, 2016 |
| ||||||||||
|
| Carrying Value |
|
| Fair Value |
|
| Carrying Value |
|
| Fair Value |
| ||||
Credit Facilities |
| $ | - |
|
| $ | - |
|
| $ | 35,023 |
|
| $ | 35,061 |
|
Senior notes |
|
| 6,874,108 |
|
|
| 7,390,221 |
|
|
| 6,417,492 |
|
|
| 6,935,485 |
|
Term loans and unsecured other |
|
| 1,634,682 |
|
|
| 1,653,113 |
|
|
| 1,499,001 |
|
|
| 1,510,661 |
|
Secured mortgages |
|
| 812,371 |
|
|
| 874,491 |
|
|
| 979,585 |
|
|
| 1,055,020 |
|
Secured mortgages of consolidated entities |
|
| 399,904 |
|
|
| 399,515 |
|
|
| 1,677,193 |
|
|
| 1,683,489 |
|
Total debt |
| $ | 9,721,065 |
|
| $ | 10,317,340 |
|
| $ | 10,608,294 |
|
| $ | 11,219,716 |
|
Our current business strategy consists of includes two operating segments: Real Estate (Rental Operations and Development) and Strategic Capital. We generate revenues, earnings, net operating income and cash flows through our segments, as follows:
Real Estate Operations.Segment. This operating segment represents the ownership and development of operating properties and is the largest component of our revenuesrevenue and earnings. We collect rent from our customers through operating leases, including reimbursements for the majority of our property operating costs. Each operating property is considered to be an individual operating segment with similar economic characteristics; these properties are combined within the reportable business segment based on geographic location. OurThe Real Estate Operations segmentSegment also includes development activities that lead to rental operations, including land held for development and properties currently under development.development, and other real estate investments. Within this line of business, we utilize the following: (i) our land bank; (ii) the development and leasing expertise of our local teams; and (iii) our customer relationships; and (iv) our in-depth knowledge in connection with our development activities. Land we own and lease to customers under ground leases is also included in this segment.
Strategic Capital.Capital Segment. This operating segment represents the management of unconsolidated co-investment ventures. We generate strategic capital revenues primarily from our unconsolidated co-investment ventures through asset management and property management services and we earn additional revenues by providing leasing, acquisition, construction, development, financing and disposition services. Depending on the structure of the venture and the returns provided to our partners, we also earn revenues through promotes periodically during the life of a venture or upon liquidation. Each unconsolidated co-investment venture we manage is considered to be an individual operating segment with similar economic characteristics; these ventures are combined within the reportable business segment based on geographic location.
Reconciliations are presented below for: (i) each reportable business segment’s revenues from external customers to Total Revenues; (ii) each reportable business segment’s net operating income from external customers to Operating Incomeand Earnings Before Income Taxes; and (iii) each reportable business segment’s assets to Total Assets. Our chief operating decision makers rely primarily on net operating income and similar measures to make decisions about allocating resources and assessing segment performance. The applicable components of Total Revenues, Operating Income, Earnings Before Income Taxes and Total Assets are allocated to each reportable business segment’s revenues, net operating income and assets. Items that are not directly assignable to a segment, such as certain corporate income and expenses, are not allocated but reflected as reconciling items.
23
The following reconciliations are presented in thousands:
|
| Three Months Ended |
| |||||
|
| 2023 |
|
| 2022 |
| ||
Revenues: |
|
|
|
|
|
| ||
Real estate segment: |
|
|
|
|
|
| ||
U.S. |
| $ | 1,574,567 |
|
| $ | 1,038,991 |
|
Other Americas |
|
| 25,572 |
|
|
| 22,191 |
|
Europe |
|
| 19,156 |
|
|
| 12,008 |
|
Asia |
|
| 14,591 |
|
|
| 12,013 |
|
Total real estate segment |
|
| 1,633,886 |
|
|
| 1,085,203 |
|
Strategic capital segment: |
|
|
|
|
|
| ||
U.S. |
|
| 53,696 |
|
|
| 50,635 |
|
Other Americas |
|
| 14,195 |
|
|
| 11,653 |
|
Europe |
|
| 43,533 |
|
|
| 46,196 |
|
Asia |
|
| 23,277 |
|
|
| 25,441 |
|
Total strategic capital segment |
|
| 134,701 |
|
|
| 133,925 |
|
|
|
|
|
|
|
| ||
Total revenues |
|
| 1,768,587 |
|
|
| 1,219,128 |
|
|
|
|
|
|
|
| ||
Segment net operating income: (1) |
|
|
|
|
|
| ||
Real estate segment: |
|
|
|
|
|
| ||
U.S. (2) |
|
| 1,171,983 |
|
|
| 771,210 |
|
Other Americas |
|
| 19,178 |
|
|
| 16,107 |
|
Europe |
|
| 14,210 |
|
|
| 3,970 |
|
Asia |
|
| 8,777 |
|
|
| 8,653 |
|
Total real estate segment |
|
| 1,214,148 |
|
|
| 799,940 |
|
Strategic capital segment: |
|
|
|
|
|
| ||
U.S. (2) |
|
| 21,567 |
|
|
| 27,677 |
|
Other Americas |
|
| 8,942 |
|
|
| 7,374 |
|
Europe |
|
| 22,604 |
|
|
| 32,463 |
|
Asia |
|
| 9,879 |
|
|
| 14,600 |
|
Total strategic capital segment |
|
| 62,992 |
|
|
| 82,114 |
|
|
|
|
|
|
|
| ||
Total segment net operating income |
|
| 1,277,140 |
|
|
| 882,054 |
|
|
|
|
|
|
|
| ||
Reconciling items: |
|
|
|
|
|
| ||
General and administrative expenses |
|
| (99,777 | ) |
|
| (74,646 | ) |
Depreciation and amortization expenses |
|
| (602,367 | ) |
|
| (396,647 | ) |
Gains on dispositions of development properties and land, net |
|
| - |
|
|
| 210,206 |
|
Gains on other dispositions of investments in real estate, net |
|
| 4,047 |
|
|
| 584,835 |
|
Operating income |
|
| 579,043 |
|
|
| 1,205,802 |
|
|
|
|
|
|
|
| ||
Earnings from unconsolidated entities, net |
|
| 75,779 |
|
|
| 76,962 |
|
Interest expense |
|
| (136,011 | ) |
|
| (64,064 | ) |
Foreign currency and derivative gains and other income, net |
|
| 8,614 |
|
|
| 48,409 |
|
Gains (losses) on early extinguishment of debt, net |
|
| 3,275 |
|
|
| (18,165 | ) |
Earnings before income taxes |
| $ | 530,700 |
|
| $ | 1,248,944 |
|
24
|
| March 31, |
|
| December 31, |
| ||
Segment assets: |
|
|
|
|
|
| ||
Real estate segment: |
|
|
|
|
|
| ||
U.S. |
| $ | 71,965,308 |
|
| $ | 71,858,560 |
|
Other Americas |
|
| 1,899,350 |
|
|
| 1,831,956 |
|
Europe |
|
| 2,159,880 |
|
|
| 1,952,160 |
|
Asia |
|
| 934,822 |
|
|
| 1,031,135 |
|
Total real estate segment |
|
| 76,959,360 |
|
|
| 76,673,811 |
|
Strategic capital segment: (3) |
|
|
|
|
|
| ||
U.S. |
|
| 10,605 |
|
|
| 10,817 |
|
Europe |
|
| 25,280 |
|
|
| 25,280 |
|
Asia |
|
| 224 |
|
|
| 231 |
|
Total strategic capital segment |
|
| 36,109 |
|
|
| 36,328 |
|
Total segment assets |
|
| 76,995,469 |
|
|
| 76,710,139 |
|
|
|
|
|
|
|
| ||
Reconciling items: |
|
|
|
|
|
| ||
Investments in and advances to unconsolidated entities |
|
| 9,680,097 |
|
|
| 9,698,898 |
|
Assets held for sale or contribution |
|
| 734,106 |
|
|
| 531,257 |
|
Cash and cash equivalents |
|
| 522,501 |
|
|
| 278,483 |
|
Other assets |
|
| 588,711 |
|
|
| 678,671 |
|
Total reconciling items |
|
| 11,525,415 |
|
|
| 11,187,309 |
|
Total assets |
| $ | 88,520,884 |
|
| $ | 87,897,448 |
|
|
| Three Months Ended |
|
| Nine Months Ended |
| ||||||||||
|
| September 30, |
|
| September 30, |
| ||||||||||
|
|
| 2017 |
|
|
| 2016 |
|
|
| 2017 |
|
|
| 2016 |
|
Revenues: |
|
|
|
|
|
|
|
|
|
|
|
|
|
|
|
|
Real estate operations segment: |
|
|
|
|
|
|
|
|
|
|
|
|
|
|
|
|
U.S. |
| $ | 478,718 |
|
| $ | 512,759 |
|
| $ | 1,532,706 |
|
| $ | 1,525,623 |
|
Other Americas |
|
| 23,157 |
|
|
| 15,598 |
|
|
| 54,690 |
|
|
| 44,616 |
|
Europe |
|
| 16,369 |
|
|
| 18,967 |
|
|
| 56,676 |
|
|
| 54,975 |
|
Asia |
|
| 16,588 |
|
|
| 14,660 |
|
|
| 48,399 |
|
|
| 40,687 |
|
Total real estate operations segment |
|
| 534,832 |
|
|
| 561,984 |
|
|
| 1,692,471 |
|
|
| 1,665,901 |
|
Strategic capital segment: |
|
|
|
|
|
|
|
|
|
|
|
|
|
|
|
|
U.S. |
|
| 17,340 |
|
|
| 9,940 |
|
|
| 159,925 |
|
|
| 28,876 |
|
Other Americas |
|
| 6,061 |
|
|
| 5,805 |
|
|
| 21,976 |
|
|
| 16,884 |
|
Europe |
|
| 26,289 |
|
|
| 113,577 |
|
|
| 78,524 |
|
|
| 161,686 |
|
Asia |
|
| 18,352 |
|
|
| 13,259 |
|
|
| 45,316 |
|
|
| 39,673 |
|
Total strategic capital segment |
|
| 68,042 |
|
|
| 142,581 |
|
|
| 305,741 |
|
|
| 247,119 |
|
|
|
|
|
|
|
|
|
|
|
|
|
|
|
|
|
|
Total revenues |
|
| 602,874 |
|
|
| 704,565 |
|
|
| 1,998,212 |
|
|
| 1,913,020 |
|
|
|
|
|
|
|
|
|
|
|
|
|
|
|
|
|
|
Segment net operating income: |
|
|
|
|
|
|
|
|
|
|
|
|
|
|
|
|
Real estate operations segment: |
|
|
|
|
|
|
|
|
|
|
|
|
|
|
|
|
U.S. |
|
| 363,802 |
|
|
| 385,837 |
|
|
| 1,144,176 |
|
|
| 1,131,340 |
|
Other Americas |
|
| 16,037 |
|
|
| 10,417 |
|
|
| 36,403 |
|
|
| 29,127 |
|
Europe |
|
| 11,454 |
|
|
| 13,787 |
|
|
| 40,713 |
|
|
| 40,420 |
|
Asia |
|
| 11,711 |
|
|
| 7,650 |
|
|
| 33,386 |
|
|
| 24,830 | �� |
Total real estate operations segment |
|
| 403,004 |
|
|
| 417,691 |
|
|
| 1,254,678 |
|
|
| 1,225,717 |
|
Strategic capital segment: |
|
|
|
|
|
|
|
|
|
|
|
|
|
|
|
|
U.S. |
|
| 1,645 |
|
|
| (577 | ) |
|
| 103,252 |
|
|
| 1,959 |
|
Other Americas |
|
| 3,934 |
|
|
| 2,975 |
|
|
| 14,666 |
|
|
| 9,163 |
|
Europe |
|
| 16,497 |
|
|
| 91,390 |
|
|
| 49,229 |
|
|
| 125,460 |
|
Asia |
|
| 9,970 |
|
|
| 4,169 |
|
|
| 18,813 |
|
|
| 12,754 |
|
Total strategic capital segment |
|
| 32,046 |
|
|
| 97,957 |
|
|
| 185,960 |
|
|
| 149,336 |
|
|
|
|
|
|
|
|
|
|
|
|
|
|
|
|
|
|
Total segment net operating income |
|
| 435,050 |
|
|
| 515,648 |
|
|
| 1,440,638 |
|
|
| 1,375,053 |
|
|
|
|
|
|
|
|
|
|
|
|
|
|
|
|
|
|
Reconciling items: |
|
|
|
|
|
|
|
|
|
|
|
|
|
|
|
|
General and administrative expenses |
|
| 57,656 |
|
|
| 58,157 |
|
|
| 171,350 |
|
|
| 165,634 |
|
Depreciation and amortization expenses |
|
| 201,903 |
|
|
| 224,867 |
|
|
| 656,639 |
|
|
| 705,249 |
|
Operating income |
|
| 175,491 |
|
|
| 232,624 |
|
|
| 612,649 |
|
|
| 504,170 |
|
Earnings from unconsolidated entities, net |
|
| 55,066 |
|
|
| 45,857 |
|
|
| 172,267 |
|
|
| 145,622 |
|
Interest expense |
|
| (64,190 | ) |
|
| (75,310 | ) |
|
| (212,456 | ) |
|
| (232,577 | ) |
Interest and other income, net |
|
| 4,816 |
|
|
| 2,932 |
|
|
| 9,493 |
|
|
| 7,051 |
|
Gains on dispositions of investments in real estate and revaluation of equity investments upon acquisition of a controlling interest, net |
|
| 779,053 |
|
|
| 117,296 |
|
|
| 959,384 |
|
|
| 461,963 |
|
Foreign currency and derivative losses, net |
|
| (18,872 | ) |
|
| (1,730 | ) |
|
| (46,327 | ) |
|
| (26,277 | ) |
Gains (losses) on early extinguishment of debt, net |
|
| - |
|
|
| 1,492 |
|
|
| (30,596 | ) |
|
| 2,484 |
|
Earnings before income taxes |
| $ | 931,364 |
|
| $ | 323,161 |
|
| $ | 1,464,414 |
|
| $ | 862,436 |
|
|
|
|
|
|
|
|
|
|
|
|
|
|
|
|
|
|
| September 30, |
|
| December 31, |
| |||
|
|
| 2017 |
|
|
| 2016 |
|
Assets: |
|
|
|
|
|
|
|
|
Real estate operations segment: |
|
|
|
|
|
|
|
|
U.S. |
| $ | 19,199,770 |
|
| $ | 21,286,422 |
|
Other Americas |
|
| 1,857,678 |
|
|
| 978,476 |
|
Europe |
|
| 1,058,894 |
|
|
| 1,346,589 |
|
Asia |
|
| 1,008,217 |
|
|
| 936,462 |
|
Total real estate operations segment |
|
| 23,124,559 |
|
|
| 24,547,949 |
|
Strategic capital segment: |
|
|
|
|
|
|
|
|
U.S. |
|
| 17,136 |
|
|
| 18,090 |
|
Europe |
|
| 44,990 |
|
|
| 47,635 |
|
Asia |
|
| 748 |
|
|
| 1,301 |
|
Total strategic capital segment |
|
| 62,874 |
|
|
| 67,026 |
|
Total segment assets |
|
| 23,187,433 |
|
|
| 24,614,975 |
|
|
|
|
|
|
|
|
|
|
Reconciling items: |
|
|
|
|
|
|
|
|
Investments in and advances to unconsolidated entities |
|
| 5,371,758 |
|
|
| 4,230,429 |
|
Assets held for sale or contribution |
|
| 321,905 |
|
|
| 322,139 |
|
Notes receivable backed by real estate |
|
| - |
|
|
| 32,100 |
|
Cash and cash equivalents |
|
| 568,726 |
|
|
| 807,316 |
|
Other assets |
|
| 204,328 |
|
|
| 242,973 |
|
Total reconciling items |
|
| 6,466,717 |
|
|
| 5,634,957 |
|
Total assets |
| $ | 29,654,150 |
|
| $ | 30,249,932 |
|
NOTE 11.12. SUPPLEMENTAL CASH FLOW INFORMATION
Our significant noncash investing and financing activities for the ninethree months ended September 30, 2017,March 31, 2023 and 20162022 included the following:
We contributed operating properties owned by NAIFrecognized lease right-of-use assets and lease liabilities related to USLFleases in which we are the third quarterlessee within Other Assets and Other Liabilities on the Consolidated Balance Sheets, including any new leases, renewals and modifications of 2017. See Notes 2, 3$12.1million in 2023 and 5$3.7 million in 2022 for more information on this transaction. As a result, we received $1.1 billion of ownership interest in USLF as a portion of our proceeds from this contribution. In addition, USLF assumed the $19.5 million note receivable backed by real estate we received in the second quarter of 2017both assets and $956.0 million of secured mortgage debt.
We capitalized $20.8$14.7 million and $19.7$10.6 million in 20172023 and 2016,2022, respectively, of equity-based compensation expense resulting from our development and leasing activities.
We issued 0.7 million shares in 2017 of the Parent’s common stock upon redemption of an equal number of common limited partnership units in the Operating Partnership, as disclosed in Note 6, and we issued 1.9 million shares in 2016.
We received $83.6$216.4 million in 2022, of ownership interests in certain unconsolidated co-investment ventures as a portion of our proceeds from the contribution of properties to these entities, during 2017, as disclosed in Note 3. We received $31.8 million of ownership interests in an unconsolidated co-investment venture from the contribution of properties to these entities during 2016.
We paid $232.4$129.9 million and $267.2$62.9 million for interest, net of amounts capitalized, forduring the ninethree months ended September 30, 2017,March 31, 2023 and 2016,2022, respectively.
We paid $29.7$46.2 million and $16.4$30.7 million for income taxes, net of refunds, forduring the ninethree months ended September 30, 2017,March 31, 2023 and 2016,2022, respectively.
25
Report of Independent Registered Public Accounting Firm
The
To the Stockholders and Board of Directors and Stockholders
Prologis, Inc.:
Results of Review of Interim Financial Information
We have reviewed the accompanying consolidated balance sheet of Prologis, Inc. and subsidiaries (the Company) as of September 30, 2017,March 31, 2023, the related consolidated statements of income, and consolidated statements of comprehensive income, for the three-monthequity, and nine-month periods ended September 30, 2017 and 2016, the related consolidated statement of equity for the nine-month period ended September 30, 2017, and the related consolidated statements of cash flows for the nine-monththree-month periods ended September 30, 2017March 31, 2023 and 2016. These2022, and the related notes (collectively, the consolidated interim financial statements are the responsibility of the Company’s management.
We conductedinformation). Based on our reviews, we are not aware of any material modifications that should be made to the consolidated interim financial information for it to be in conformity with U.S. generally accepted accounting principles.
We have previously audited, in accordance with the standards of the Public Company Accounting Oversight Board (United States). (PCAOB), the consolidated balance sheet of the Company as of December 31, 2022, and the related consolidated statements of income, comprehensive income, equity, and cash flows for the year then ended (not presented herein); and in our report dated February 14, 2023, we expressed an unqualified opinion on those consolidated financial statements. In our opinion, the information set forth in the accompanying consolidated balance sheet as of December 31, 2022 is fairly stated, in all material respects, in relation to the consolidated balance sheet from which it has been derived.
Basis for Review Results
This consolidated interim financial information is the responsibility of the Company’s management. We are a public accounting firm registered with the PCAOB and are required to be independent with respect to the Company in accordance with the U.S. federal securities laws and the applicable rules and regulations of the Securities and Exchange Commission and the PCAOB.
We conducted our reviews in accordance with the standards of the PCAOB. A review of consolidated interim financial information consists principally of applying analytical procedures and making inquiries of persons responsible for financial and accounting matters. It is substantially less in scope than an audit conducted in accordance with the standards of the Public Company Accounting Oversight Board (United States),PCAOB, the objective of which is the expression of an opinion regarding the financial statements taken as a whole. Accordingly, we do not express such an opinion.
/s/ KPMG LLP
Denver, Colorado
April 28, 2023
26
Report of Independent Registered Public Accounting Firm
To the Partners of Prologis, L.P. and the Board of Directors of Prologis, Inc.:
Results of Review of Interim Financial Information
We have reviewed the consolidated balance sheet of Prologis, L.P. and subsidiaries (the Operating Partnership) as of March 31, 2023, the related consolidated statements of income, comprehensive income, capital, and cash flows for the three-month periods ended March 31, 2023 and 2022, and the related notes (collectively, the consolidated interim financial information). Based on our reviews, we are not aware of any material modifications that should be made to the consolidated interim financial statements referred to aboveinformation for themit to be in conformity with U.S. generally accepted accounting principles.
As discussed in Note 1 of the consolidated financial statements, the Company adopted Accounting Standards Update 2017-01. The new standard clarifies the definition of a business and was adopted on January 1, 2017 on a prospective basis.
We have previously audited, in accordance with the standards of the Public Company Accounting Oversight Board (United States) (PCAOB), the consolidated balance sheet of Prologis, Inc. and subsidiariesthe Operating Partnership as of December 31, 2016,2022, and the related consolidated statements of income, comprehensive income, equitycapital, and cash flows for the year then ended (not presented herein); and in our report dated February 14, 2017,2023, we expressed an unqualified opinion on those consolidated financial statements. In our opinion, the information set forth in the accompanying consolidated balance sheet as of December 31, 2016,2022 is fairly stated, in all material respects, in relation to the consolidated balance sheet from which it has been derived.
Basis for Review Results
/s/ KPMG LLP
Denver, Colorado
October 27, 2017
Report of Independent Registered Public Accounting Firm
The Partners
Prologis, L.P.:
We have reviewed the accompanyingThis consolidated balance sheet of Prologis, L.P. and subsidiaries (the Operating Partnership) as of September 30, 2017, the related consolidated statements of income, and consolidated statements of comprehensive income for the three-month and nine-month periods ended September 30, 2017 and 2016, the related consolidated statement of capital for the nine-month period ended September 30, 2017, and the related consolidated statements of cash flows for the nine-month periods ended September 30, 2017 and 2016. These consolidatedinterim financial statements areinformation is the responsibility of the Operating Partnership’s management. We are a public accounting firm registered with the PCAOB and are required to be independent with respect to the Operating Partnership in accordance with the U.S. federal securities laws and the applicable rules and regulations of the Securities and Exchange Commission and the PCAOB.
We conducted our reviews in accordance with the standards of the Public Company Accounting Oversight Board (United States).PCAOB. A review of consolidated interim financial information consists principally of applying analytical procedures and making inquiries of persons responsible for financial and accounting matters. It is substantially less in scope than an audit conducted in accordance with the standards of the Public Company Accounting Oversight Board (United States),PCAOB, the objective of which is the expression of an opinion regarding the financial statements taken as a whole. Accordingly, we do not express such an opinion.
Based on our reviews, we are not aware of any material modifications that should be made to the consolidated financial statements referred to above for them to be in conformity with U.S. generally accepted accounting principles.
As discussed in Note 1 of the consolidated financial statements, the Operating Partnership adopted Accounting Standards Update 2017-01. The new standard clarifies the definition of a business and was adopted on January 1, 2017 on a prospective basis.
We have previously audited, in accordance with standards of the Public Company Accounting Oversight Board (United States), the consolidated balance sheet of Prologis, L.P. and subsidiaries as of December 31, 2016, and the related consolidated statements of income, comprehensive income, capital and cash flows for the year then ended (not presented herein); and in our report dated February 14, 2017, we expressed an unqualified opinion on those consolidated financial statements. In our opinion, the information set forth in the accompanying consolidated balance sheet as of December 31, 2016, is fairly stated, in all material respects, in relation to the consolidated balance sheet from which it has been derived.
/s/ KPMG LLP
Denver, ColoradoOctober 27, 2017April 28, 2023
27
ITEM 2. Management’s Discussion andand Analysis of Financial Condition and Results of Operations
The following should be read in conjunction with the Consolidated Financial Statements and related Notes included in Item 1 of this report and our Annual Report on Form 10-K for the fiscal year ended December 31, 2016,2022, as filed with the United States (“U.S.”) Securities and Exchange Commission (“SEC”).
The statements in this report that are not historical facts are forward-looking statements within the meaning of Section 27A of the Securities Act of 1933, as amended, and Section 21E of the Securities Exchange Act of 1934, as amended. These forward-looking statements are based on current expectations, estimates and projections about the industry and markets in which we operate as well as management’s beliefs and assumptions. Such statements involve uncertainties that could significantly impact our financial results. Words such as “expects,” “anticipates,” “intends,” “plans,” “believes,” “seeks”“seeks,” and “estimates” including variations of such words and similar expressions are intended to identify such forward-looking statements, which generally are not historical in nature. All statements that address operating performance, events or developments that we expect or anticipate will occur in the future — including statements relating to rent and occupancy growth, acquisition and development activity, and contribution orand disposition activity, general conditions in the geographic areas where we operate, our debt, capital structure and financial position, our ability to earn revenues from co-investment ventures, form new co-investment ventures and the availability of capital in existing or new co-investment ventures — are forward-looking statements. These statements are not guarantees of future performance and involve certain risks, uncertainties and assumptions that are difficult to predict. Although we believe the expectations reflected in any forward-looking statements are based on reasonable assumptions, we can give no assurance that our expectations will be attained, and therefore actual outcomes and results may differ materially from what is expressed or forecasted in such forward-looking statements. Some of the factors that may affect outcomes and results include, but are not limited to: (i) international, national, international, regional and local economic and political climates;climates and conditions; (ii) changes in global financial markets, interest rates and foreign currency exchange rates; (iii) increased or unanticipated competition for our properties; (iv) risks associated with acquisitions, dispositions and development of properties;properties, including the integration of the operations of significant real estate portfolios; (v) maintenance of REITReal Estate Investment Trust (“REIT”) status, tax structuring and changes in income tax laws and rates; (vi) availability of financing and capital, the levels of debt that we maintain and our credit ratings; (vii) risks related to our investments in our co-investment ventures, including our ability to establish new co-investment ventures; (viii) risks of doing business internationally, including currency risks; (ix) environmental uncertainties, including risks of natural disasters; (x) risks related to global pandemics; and (x)(xi) those additional factors discussed under Part I, Item 1A. Risk Factors in our Annual Report on Form 10-K for the fiscal year ended December 31, 2016.2022. We undertake no duty to update any forward-looking statements appearing in this report except as may be required by law.
Prologis, Inc. is a self-administered and self-managed real estate investment trust (a “REIT”)REIT and is the sole general partner of Prologis, L.P. through which it holds substantially all of its assets. We operate Prologis, Inc. and PrologsPrologis, L.P. as one enterprise and, therefore, our discussion and analysis refers to Prologis, Inc. and its consolidated subsidiaries, including Prologis, L.P. We invest in real estate through wholly owned subsidiaries and other entities through which we co-invest with partners and investors. We have a significant ownership interest in the co-investment ventures, which are either consolidated or unconsolidated based on our level of control of the entity.
We operate, manage and measure the operating performance of our properties on an owned and managed (“O&M”) basis. Our O&M portfolio includes our consolidated properties as well as properties owned by our unconsolidated co-investment ventures, which we manage. We make operating decisions based on our total O&M portfolio as we manage the properties without regard to their ownership. We also evaluate our results based on our proportionate economic ownership of each entity or property included in the O&M portfolio (“our share”), collectively.whether consolidated or unconsolidated, to reflect our share of the financial results of the O&M portfolio.
MANAGEMENT’SIncluded in our discussion below are references to funds from operations (“FFO”) and net operating income (“NOI”), neither of which are United States ("U.S.") generally accepted accounting principles (“GAAP”). See below for a reconciliation of Net Earnings Attributable to Common Stockholders/Unitholders in the Consolidated Statements of Income to our FFO measures and a reconciliation of NOI to Operating Income, the most directly comparable GAAP measures.
MANAGEMENT'S OVERVIEW
Prologis is the global leader in logistics real estate with a focus on high-barrier, high-growth markets across 19 countries.high growth markets. We own, manage and develop well-located, high-quality logistics facilities in 19 countries across four continents. Our portfolio focuses on the consumption markets that matter most. An investment in Prologis taps into key driversworld’s most vibrant centers of economic growth, including consumption, supply chain modernization, e-commercecommerce and urbanization.
Our business is global and many ofour scale across these locations allows us to better serve our customers’ businesses are global. Customers turn to us because they know an efficient supply chain will make their businesses run better, and that a strategic relationship with Prologis will create a competitive advantage. We lease moderndiverse logistics facilities to a diverse base of approximately 5,200 customers.requirements. Our facilities assist the efficient distribution of goods for the world’s best businesses and brands.
We invest in Class-A logistics facilities in the world’s primary population centers with high barriers to entry and supported by extensive transportation infrastructure (major airports, seaports and rail and highway networks). We believe our portfolio is the highest-quality logistics property portfolio in the industry because it is focused in these key markets. Our local teams actively manage theour portfolio which encompassesand provide comprehensive real estate services, including leasing, and property management, development, acquisitions and dispositions. We invest significant capital deploymentinto new logistics properties principally through our development activity and an opportunistic disposition program.third-party acquisitions. The contribution of newly developed properties to our co-investment ventures and the sale of non-strategic properties to third parties allows us to recycle capital back into our development and acquisition activities.
While the majority of our properties in the United States (“U.S.”) are wholly-owned, while our properties outside the U.S. are generally heldwholly owned, we hold a significant ownership interest in co-investment ventures. We are principally an owner/operatorproperties both in the U.S. and a manager/developer outsideinternationally through our investment in the U.S.
We operate our business on an owned and managed basis, including properties that we wholly own and properties that are owned by one of our co-investment ventures. ThisPartnering with the world’s largest institutional investors through co-investment ventures allows us to make decisions based on property operations, regardlessenhance and diversify our real estate returns as well as mitigate our exposure to foreign currency movements.
28
Logistics supply chains have increased dramatically in their importance to our customers and the global economy. The long-term trends of e-commerce adoption and supply chain resiliency continue to drive the need for increased warehouse space to store and distribute goods. This demand has translated into meaningful increases in rents and has resulted in low vacancy. We believe this demand is driven by three primary factors: (i) customer supply chains re-positioning to address the significant shift to e-commerce and heightened service expectations; (ii) overall consumption and household growth; and (iii) our customers’ desire for more supply chain resiliency. We believe these forces will keep demand strong for the long term.
The nature of the services we are providing to our customers is expanding. The scale of our ownership interest. We believe1.2 billion square foot portfolio allows us to provide a platform of solutions to address challenges that companies face in global fulfillment today. Through Prologis Essentials, we focus on innovative ways to meet our customers’ operations, energy and sustainability, mobility and workforce needs. Our customer experience teams, proprietary technology and strategic partnerships are foundational to Prologis Essentials and allow us to provide our customers with unique and actionable insights to drive greater efficiency in their operations.
Our long-standing dedication to Environmental, Social and Governance (“ESG”) practices strengthens our relationships with our customers, investors, employees and the operating fundamentalscommunities in which we do business. The principles of ESG are an important aspect of our ownedbusiness strategy that we believe delivers a strategic business advantage while positively impacting the environment.
Our Global Presence
In October 2022, we completed the acquisition of Duke Realty Corporation and managedDuke Realty Limited Partnership (collectively “Duke”) through a merger transaction that we refer to as the “Duke Transaction” and is detailed in Note 2 to the Consolidated Financial Statements. The Duke portfolio are consistent with thosewas primarily comprised of our consolidated portfolio,logistics real estate assets, including 494 industrial operating properties, aggregating 144 million square feet. The total acquisition price, including transaction costs, was $23.2 billion and therefore we generally look at operating metrics on an ownedwas funded through the issuance of equity and managed basis.the assumption of debt.
At September 30, 2017,March 31, 2023, we owned or had investments in, on a wholly-owned basis or through co-investment ventures, properties and development projects (based on gross book value andexpected to total expected investment, respectively) totaling $56.4approximately 1.2 billion across 687 million square feet (64 million square meters) across four continents. Our investment totals $32.5 billionthe following geographies:
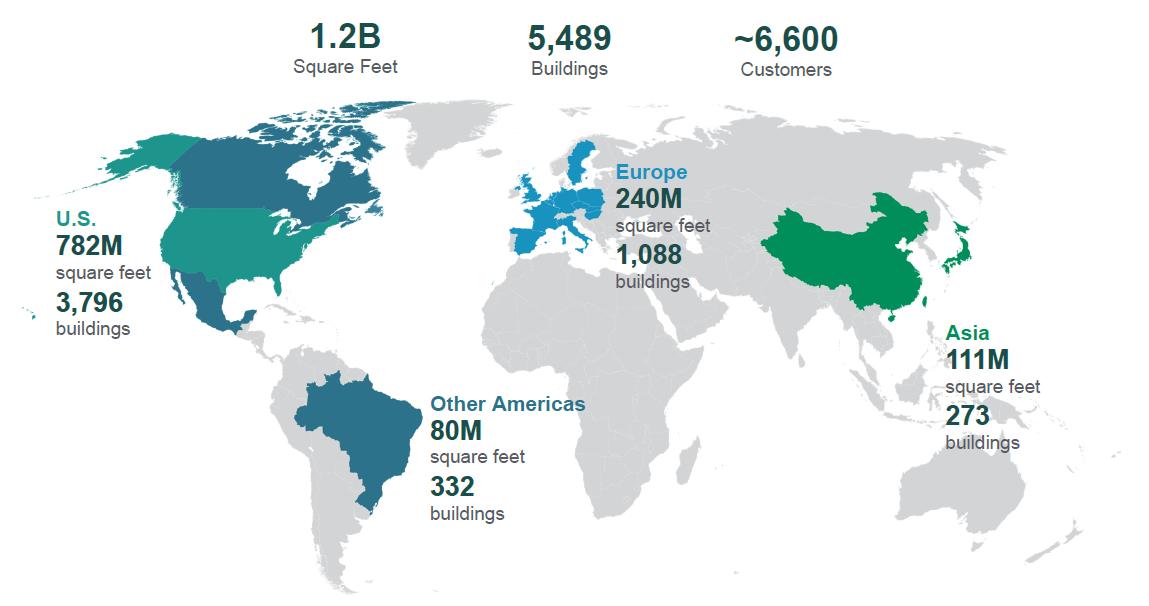
Throughout this discussion, we reflect amounts in U.S. dollars, our reporting currency. Included in these amounts are consolidated and consistsunconsolidated investments denominated in foreign currencies, principally the British pound sterling, Canadian dollar, euro and Japanese yen that are impacted by fluctuations in exchange rates when translated to U.S. dollars. We mitigate our exposure to foreign currency fluctuations by investing outside the U.S. through co-investment ventures, borrowing in the functional currency of our wholly-owned propertiessubsidiaries and our pro rata (or ownership) share of the properties owned by our co-investment ventures.utilizing derivative financial instruments.
29
IndexOperating Segments
Our business comprises two operating segments: Real Estate (Rental Operations and Development) and Strategic Capital. See below for
Below is information summarizing consolidated activity within our consolidated information for the nine months ended September 30, 2017:segments (in millions):
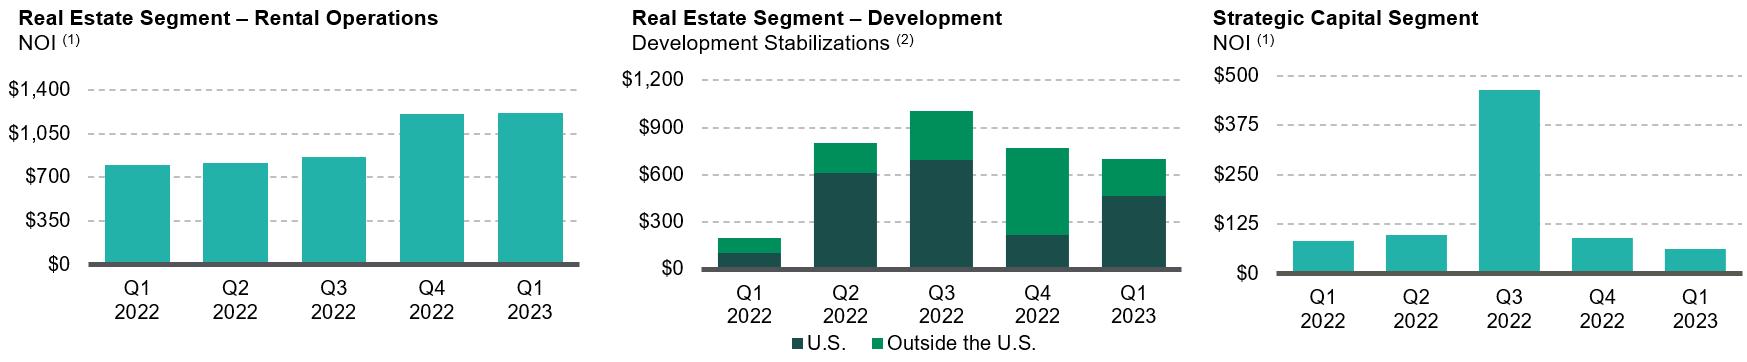
|
|
|
|
|
|
Real Estate OperationsSegment is calculated directly from our Consolidated Financial Statements as Rental Revenues and Development Management and Other Revenues less Rental Expenses and Other Expenses. NOI from the Strategic Capital Segment is calculated directly from our Consolidated Financial Statements as Strategic CapitalRevenues less Strategic CapitalExpenses.
Real Estate Segment
Rental Operations.Rental operations comprisecomprises the largest component of our operating segments and generally contributes approximately85% to 90% of our consolidated revenues, earnings and funds from operations (see below for more information on funds from operations, a non-GAAP measure).FFO. We collect rent from our customers through operating leases, including reimbursements for the majority of our property operating costs. For leases that commenced during the three months ended March 31, 2023, within the consolidated operating portfolio, the weighted average lease term was 58 months. We expect to generate long-term internal growth by increasing rents, maintaining high occupancy rates and controlling expenses. The primary driver of our revenue growth will be the rolling of in-place leases to current market rents when leases expire, as discussed further below. We believe our active portfolio management, coupledcombined with the skills of our property, leasing, maintenance, capital, energy, sustainability and risk management teams will allow us to maximize rental revenuesNOI across our portfolio. The majoritySubstantially all of our consolidated rental revenuesrevenue, NOI and NOIcash flows from rental operations are generated in the U.S. NOI from this segment is calculated directly from
Development. Given the scarcity of modern logistics facilities in our financial statements as rental revenues, rental recoveriestarget markets, our development business provides the opportunity to build to the requirements of our customers while deepening our market presence. We believe we have a competitive advantage due to (i) the strategic locations of our global land bank and development management and other revenues less rental expenses and other expenses.
Development. We use (i) our land bank;redevelopment sites; (ii) the development expertise of our local teams; (iii) the depth of our customer relationships; and (iv) our in-depth local knowledgeability to integrate sustainable design features that result in connection withcost-savings and operational efficiencies for our value creation activities.customers; and (v) our procurement capabilities that allow us to secure high-demand construction materials at lower cost. Successful development and redevelopment efforts provide significant earnings growth as projects are leased, generate income and increase both the rental revenues and the net asset value of our Real Estate Operations segment. We measure the valueSegment. Generally, we create based on the increase in estimated fair value of a stabilized development property, as compared to the costs incurred. We develop properties in the U.S. for long-termlong- term hold or for contribution to Prologis Targeted U.S. Logistics Fund (“USLF”) and outside the U.S. we develop primarily for contribution to our unconsolidated co-investment ventures. Occasionally, we develop for sale to third parties.
Strategic Capital Segment
Real estate is a capital-intensive business that requires growth capital. Our strategic capital business gives us access to third-party capital, both private and public, allowingStrategic Capital Segment allows us to diversify our sources of capital and providing uspartner with a broader range of options to fund our growth, while reducing our exposure to movements in foreign currency. We co-invest with somemany of the world’s largest institutional partners to grow ourinvestors. The business is capitalized principally through private and provide incremental revenues, with a focus onpublic equity of which 95% is either in perpetual open-ended or long-term ventures, and open-ended funds. We also access alternative sources of equity through two publicly traded vehicles: Nipponvehicles (Nippon Prologis REIT, Inc. in Japan and FIBRA Prologis in Mexico.Mexico). We holdalign our interests with our partners by holding significant ownership interests in these ventures (approximately 30% on a weighted average basis at September 30, 2017), aligning our interests with thoseall of our partners.eight unconsolidated co-investment ventures (ranging from 15% to 50%). This structure allows us to reduce our exposure to foreign currency movements for investments outside the U.S.
This segment produces stable,durable, long-term cash flows and generally contributes 10% to 15% of our recurring consolidated revenues, earnings and funds from operations.FFO, all while requiring minimal capital other than our investment in the venture. We generate strategic capital revenues primarily from our unconsolidated co-investment ventures, principally through asset management and property management services. Asset management fees are primarily driven by the quarterly valuation of the real estate properties owned by the respective ventures. We earn additional revenues by providing leasing, acquisition, construction management, development financing and disposition services. In certain ventures, we also have the ability to earn revenues through incentive fees (“promotes” or “promote revenues”) periodically during the life of a venture, upon liquidation of a venture or upon liquidation.stabilization of individual venture assets based primarily on the total return of the investments over certain financial hurdles. We plan to profitably grow this business and increase revenues by increasing our assets under management in existing or new ventures. The majority of the strategic capital revenues excluding promotes, are generated outside the U.S. NOI in this segment is calculated directly from our financial statements as strategic capital revenues less strategic capital expenses and does not include property-related NOI.
30
IndexGrowth Strategies
FUTURE GROWTH
We believe that the quality and scale of our global owned and managed operating portfolio, our ability to build out our land bank, our strategic capital business, the expertise of our team, the depth of our customer relationships and the strength of our balance sheet giveare differentiators that allow us unique competitive advantages. Our plan to growdrive growth in revenues, NOI, earnings, NOI,FFO and cash flows and funds from operations is based onflows.
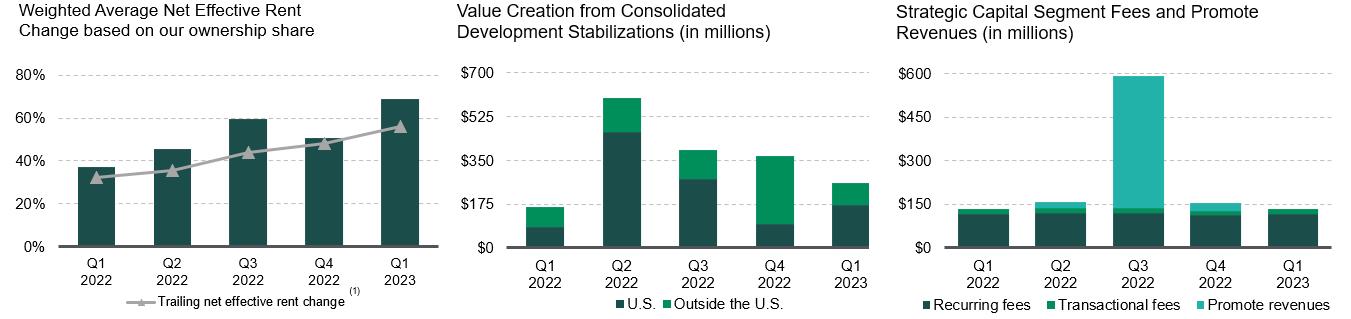
Rent Growth. We expect market rents in our markets to continue to grow forincrease due to healthy demand combined with low vacancy.Due to strong market rent growth over the foreseeablelast several years, our in-place leases have considerable upside potential to drive future driven by demand fororganic NOI growth. We estimate that our lease mark-to-market is approximately 68% (on a net effective basis), which represents the location and qualitygrowth rate from in-place rents to current market rents based on our share of our properties. Strongthe O&M portfolio at March 31, 2023. Therefore, even if there was no additional market rent growth in the last several years has elevated the markfuture, we expect our lease renewals to market of our portfolio. Even if market rents remain flat, our in-place leases have considerable room to rise back to market levels. We estimate that across our owned and managed portfolio, our leases on an aggregate basis are 12% below market; this means that a lease renewal would translate into increasedsignificant increases in future earnings, NOI and cash flow, both on a consolidated basis and through the amounts we recognize from our unconsolidated co-investment ventures based on our ownership. This growth potential is reflected in theincome. We have experienced positive rent change on rollover (comparing the net effective rent (“NER”) of the new lease to the prior lease for the same space) on our owned and managed portfolio. We have experienced positive rent change on rollover forin every quarter since 2013, and we expect this to continue for several more years.
Value Creation from Development. A successful The global nature of our development program provides a wide landscape of opportunities to pursue based on our judgment of market conditions, opportunities and risks. One of the ways in which we create value is through our focus on sourcing well-located land and redevelopment program involves maintaining control of well-positioned land. Onsites through acquisition opportunities, including our innovative approach with Covered Land Plays, which are income-producing assets acquired with the basis ofintention to redevelop for higher and better use as industrial properties. Based on our current estimates, our ownedconsolidated land, including options and managed land bankCovered Land Plays, has the potential to support the development of $9.1$34.0 billion ($38.4 billion on an O&M basis) of total expected investment (“TEI”)TEI of new logistics space. We have additionalmeasure the estimated value creation opportunities from land we have under optionof a development project as the stabilized value above our TEI. As properties are completed and from re-development of land under existing operating buildings. We believe the carrying value of our land bank is below its current fair value, andleased, we expect to realize this value going forward—primarily through development. We have recognizedthe value creation principally through gains realized through contributions of 23% or more on our development stabilizations each year since 2013.
31
SUMMARY OF THE THREE MONTHS ENDED MARCH 31, 2023
Our operating results were strong during the three months ended March 31, 2023. Consistent demand and low vacancy in the global logistics markets drove increases in market rents, which along with our significant lease mark-to-market, translated into positive rent change on rollover and same-store growth in our O&M portfolio. Our O&M operating portfolio occupancy was 98.0% at March 31, 2023 and rent change on leases commenced during the three months ended March 31, 2023 was 68.8%, on a net effective basis, based on our ownership share. We believe our results for the three months ended March 31, 2023 are representative of the health of our business despite a slowing economy. Due to current market conditions, we continue to expect some decline in asset valuations and will remain disciplined as we evaluate capital deployment activities. We anticipate the pace of development starts and contributions into our open ended funds to increase in the second half of the year. We believe we are well-positioned to organically grow revenues given the increase in market rents over the last several years we have invested in a variety of technologies that have allowed us to achieve efficiencies and increase our investments in real estate with minimal increases to general and administrative (“G&A”) expenses. We have increased our owned and managed real estate assets by 21 million square feet (or approximately 3%) over the last two years primarily through development, andhigh lease mark-to-market. However, we have integrated the assets with only minimal increases overhead related to property management and leasing functions, which are reported in rental expenses. We will continue to leverage these technologies to further streamlinebe cautious as we manage our operations and reduce our costs as a percentage of assets under management, along with advanced data analytics to enhance decision-making.
business in this uncertain macroeconomic environment.
Summary of 2017
DuringAt March 31, 2023, the nine months ended September 30, 2017, operating fundamentals remained strong for our owned and managed operating portfolio and we ended the period with occupancy of 96.3%. See below for details of the operating and development activityweighted average remaining maturity of our Owned and Managed Portfolioconsolidated debt was 10 years and the results of our two business segments. In 2017, and through the date of this report, weweighted average interest rate was 2.6%. We completed the following significantfinancing activities as further described induring the accompanying notes to the Consolidated Financial Statements:three months ended March 31, 2023:
During the first nine monthsAt March 31, 2023, we had total available liquidity of 2017, we completed several transactions that further repositioned$5.7 billion, with aggregate availability under our portfoliocredit facilities of $5.2 billion and streamlined our co-investment ventures, including:
|
|
|
|
|
|
|
|
|
|
|
|
As a resultunrestricted cash balances of these activities, we have eight co-investment ventures.
In February,$0.5 billion. On April 5, 2023, we amended and restated our Japanese yen revolver2021 Global Facility as the 2023 Global Facility and increasedupsized it by $1.0 billion, bringing the total borrowing capacity of our credit facilities to ¥50.0 billion ($444 million at September 30, 2017).
In June, weWe issued £500 million ($645 million)$2.6 billion of senior notes with an interest(principal in millions):
|
|
| Aggregate Principal |
|
| Issuance Date Weighted Average |
|
| |||||||
| Issuance Date |
| Borrowing Currency |
|
| USD (1) |
|
| Interest Rate |
| Years |
| Maturity Dates | ||
| January |
| € | 1,250 |
|
| $ | 1,354 |
|
| 4.1% |
| 13.8 |
| January 2030 – 2043 |
| March |
| $ | 1,200 |
|
| $ | 1,200 |
|
| 4.9% |
| 17.7 |
| June 2033 – 2053 |
| Total |
|
|
|
| $ | 2,554 |
|
| 4.5% |
| 15.6 |
|
| |
RESULTS OF OPERATIONS – NINETHREE MONTHS ENDED SEPTEMBER 30, 2017MARCH 31, 2023 AND 20162022
We evaluate our business operations based on the NOI of our two operating segments,segments: Real Estate (Rental Operations and Development) and Strategic Capital. NOI by segment is a non-GAAP financialperformance measure that is calculated using revenues and expenses directly from our financial statements. We consider NOI by segment to be an appropriate supplemental measure of our performance because it helps both management and investors to understand the core operations of our business.operating results.
32
Below is a reconciliation of our NOI by segment per our Consolidated Financial Statements and a reconciliation of NOI by segment to Operating Income per the Consolidated Financial Statements for the ninethree months ended September 30March 31 (in millions). Each segment’s NOI is reconciled to a line item in the Consolidated Financial Statements in the respective segment discussion below.
| 2017 |
|
| 2016 |
| |||||||||||
Real Estate Operations segment – NOI |
| $ | 1,255 |
|
| $ | 1,226 |
| ||||||||
Strategic Capital segment – NOI |
|
| 186 |
|
|
| 149 |
| ||||||||
| 2023 |
|
| 2022 |
| |||||||||||
Real estate segment: |
|
|
|
|
| |||||||||||
Rental revenues |
| $ | 1,634 |
|
| $ | 1,077 |
| ||||||||
Development management and other revenues |
|
| - |
|
|
| 8 |
| ||||||||
Rental expenses |
|
| (413 | ) |
|
| (276 | ) | ||||||||
Other expenses |
|
| (7 | ) |
|
| (9 | ) | ||||||||
Real Estate Segment – NOI |
|
| 1,214 |
|
|
| 800 |
| ||||||||
|
|
|
|
|
| |||||||||||
Strategic capital segment: |
|
|
|
|
| |||||||||||
Strategic capital revenues |
|
| 135 |
|
|
| 134 |
| ||||||||
Strategic capital expenses |
|
| (72 | ) |
|
| (52 | ) | ||||||||
Strategic Capital Segment– NOI |
|
| 63 |
|
|
| 82 |
| ||||||||
|
|
|
|
|
| |||||||||||
General and administrative expenses |
|
| (171 | ) |
|
| (166 | ) |
|
| (100 | ) |
|
| (74 | ) |
Depreciation and amortization expenses |
|
| (657 | ) |
|
| (705 | ) |
|
| (602 | ) |
|
| (397 | ) |
Operating income before gains on real estate transactions, net |
|
| 575 |
|
|
| 411 |
| ||||||||
Gains on dispositions of development properties and land, net |
|
| - |
|
|
| 210 |
| ||||||||
Gains on other dispositions of investments in real estate, net |
|
| 4 |
|
|
| 585 |
| ||||||||
Operating income |
| $ | 613 |
|
| $ | 504 |
|
| $ | 579 |
|
| $ | 1,206 |
|
|
|
|
|
|
|
|
|
| ||||||||
See Note 1011 to the Consolidated Financial Statements for more information on our segments and a reconciliation of each reportable business segment’s NOI to Operating Income and Earnings Before Income Taxes.
Real Estate OperationsSegment
This operating segment principally includes rental revenues, rental recoveriesrevenue and rental expenses recognized from our consolidated properties. We allocate the costs of our property management and leasing functions to the Real Estate Operations segmentSegment through Rental Expenses and to the Strategic Capital segmentSegment through Strategic Capital Expenses based on the sizesquare footage of the relative portfolios as compared toportfolios. In addition, this segment is impacted by our total owneddevelopment, acquisition and managed portfolio. The operating fundamentals in the markets in which we operate continue to be strong, which has driven rents higher, kept occupancies high and has fueled development activity.disposition activities.
Below are the components of Real Estate Operations revenues, expenses andSegment NOI for the ninethree months ended September 30 (in millions),March 31, derived directly from line items in the Consolidated Financial Statements.Statements (in millions):
|
| 2017 |
|
| 2016 |
|
| 2023 |
|
| 2022 |
| ||||
Rental revenues |
| $ | 1,304 |
|
| $ | 1,299 |
|
| $ | 1,634 |
|
| $ | 1,077 |
|
Rental recoveries |
|
| 370 |
|
|
| 361 |
| ||||||||
Development management and other revenues |
|
| 18 |
|
|
| 6 |
|
|
| - |
|
|
| 8 |
|
Rental expenses |
|
| (429 | ) |
|
| (428 | ) |
|
| (413 | ) |
|
| (276 | ) |
Other expenses |
|
| (8 | ) |
|
| (12 | ) |
|
| (7 | ) |
|
| (9 | ) |
Real Estate Operations segment – NOI |
| $ | 1,255 |
|
| $ | 1,226 |
| ||||||||
Real Estate Segment – NOI |
| $ | 1,214 |
|
| $ | 800 |
| ||||||||
|
|
|
|
|
| |||||||||||
33
The change in Real Estate Operations revenues, expenses and NOI are impacted by changes in rental rates, occupancy and capital deployment activities. The following items highlight the key changes inSegment (“RES”) NOI for the ninethree months ended September 30, 2017, fromMarch 31, 2023 compared to the same period in 20162022 of $414 million was impacted by the following activities (in millions):
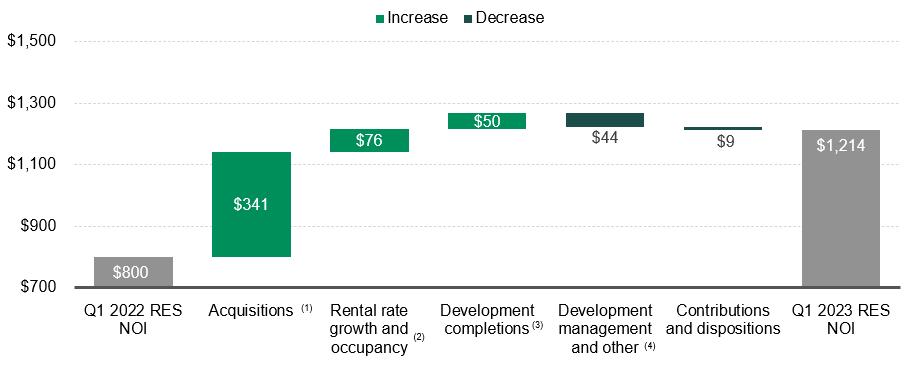
Rent rate and occupancy growth (1) |
| $ | 69 |
|
Development activity (2) |
|
| 35 |
|
Contributions and dispositions (3) |
|
| (96 | ) |
Acquisitions |
|
| 17 |
|
Other |
|
| 4 |
|
Total change in Real Estate Operations segment – NOI |
| $ | 29 |
|
|
|
|
|
|
|
|
|
|
|
|
Below are the key operating metrics of our consolidated operating portfolio:portfolio, which excludes non-strategic industrial properties.
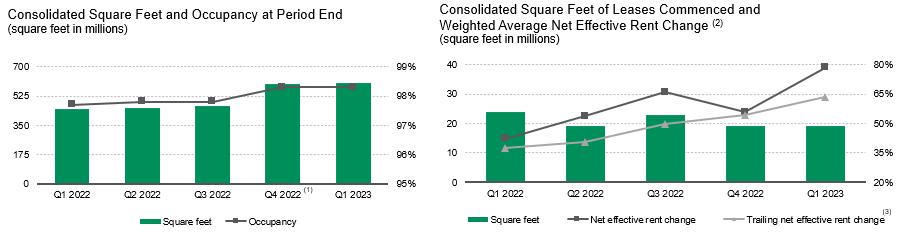
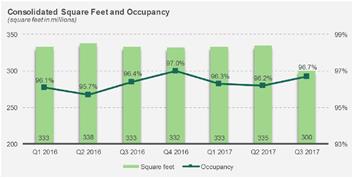
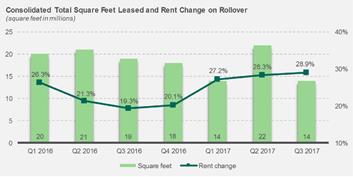
34
Development Activity
The following table summarizes consolidated development activity for the three months ended September 30, 2017 dueMarch 31 (dollars and square feet in millions):
|
| 2023 |
|
| 2022 |
| ||
Starts: |
|
|
|
|
|
| ||
Number of new development buildings during the period |
|
| 2 |
|
|
| 31 |
|
Square feet |
|
| 1 |
|
|
| 7 |
|
TEI |
| $ | 59 |
|
| $ | 1,041 |
|
Percentage of build-to-suits based on TEI |
|
| 100.0 | % |
|
| 36.6 | % |
|
|
|
|
|
|
| ||
Stabilizations: |
|
|
|
|
|
| ||
Number of development buildings stabilized during the period |
|
| 15 |
|
|
| 6 |
|
Square feet |
|
| 6 |
|
|
| 3 |
|
TEI |
| $ | 700 |
|
| $ | 197 |
|
Percentage of build-to-suits based on TEI |
|
| 50.8 | % |
|
| 51.2 | % |
Weighted average stabilized yield (1) |
|
| 6.5 | % |
|
| 6.0 | % |
Estimated value at completion |
| $ | 961 |
|
| $ | 360 |
|
Estimated weighted average margin (2) |
|
| 37.3 | % |
|
| 82.9 | % |
Estimated value creation |
| $ | 261 |
|
| $ | 163 |
|
At March 31, 2023, the contributionconsolidated development portfolio, including properties under development and pre-stabilized properties, was expected to be completed before April 2025 with a TEI of 190$6.8 billion and was 43.4% leased. Our investment in the development portfolio was $4.3 billion at March 31, 2023, leaving $2.5 billion remaining to be spent.
Capital Expenditures
We capitalize costs incurred in improving and leasing our operating properties owned by NAIF to USLF.as part of the investment basis or within other assets. The following graph summarizes capitalized expenditures, excluding development costs of our consolidated operating properties during each quarter:
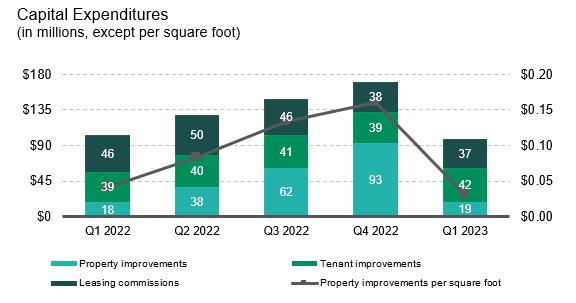
Strategic Capital Segment
This operating segment includes revenues from asset management and other fees, as well as promotesproperty management services, transactional services for acquisition, disposition and leasing activity and promote revenue earned for services performed for ourprimarily from the unconsolidated co-investment ventures. Revenues associated with the Strategic Capital segmentSegment fluctuate because of changes in the size of co-investment ventures under management, the portfolios through acquisitions and dispositions, the fair value of the properties and other transactional activity in the venturesincluding foreign currency exchange rates and the timing of promotes. These revenues are reduced generally by the direct costs associated with the asset management and property-level management expenses for the properties owned by these ventures. We allocate the costs of our property management and leasing functions to the Strategic Capital segmentSegment through Strategic Capital Expenses and to the Real Estate Operations segmentSegment through Rental Expenses based on the sizesquare footage of the relative portfolios as comparedportfolios. For further details regarding the key property information and summarized financial condition and operating results of our unconsolidated co-investment ventures, refer to our total owned and managed portfolio.Note 4 to the Consolidated Financial Statements.
35
Below are the components of Strategic Capital revenues, expenses andSegment NOI for the ninethree months ended September 30,March 31, derived directly from the line items in the Consolidated Financial Statements (in millions):
|
| 2017 |
|
| 2016 |
|
| 2023 |
|
| 2022 |
| ||||
Strategic capital revenues |
| $ | 306 |
|
| $ | 247 |
|
| $ | 135 |
|
| $ | 134 |
|
Strategic capital expenses |
|
| (120 | ) |
|
| (98 | ) |
|
| (72 | ) |
|
| (52 | ) |
Strategic Capital segment – NOI |
| $ | 186 |
|
| $ | 149 |
| ||||||||
Strategic Capital Segment – NOI |
| $ | 63 |
|
| $ | 82 |
| ||||||||
Below is additional detail of our Strategic Capital Segment revenues, expenses and NOI for the ninethree months ended September 30March 31 (in millions):
|
| U.S. (1) |
|
| Other Americas |
|
| Europe |
|
| Asia |
|
| Total |
| |||||||||||||||||||||||||
|
| 2023 |
|
| 2022 |
|
| 2023 |
|
| 2022 |
|
| 2023 |
|
| 2022 |
|
| 2023 |
|
| 2022 |
|
| 2023 |
|
| 2022 |
| ||||||||||
Strategic capital revenues ($) (2) |
|
|
|
|
|
|
|
|
|
|
|
|
|
|
|
|
|
|
|
|
|
|
|
|
|
|
|
|
|
| ||||||||||
Recurring fees (3) |
|
| 46 |
|
|
| 42 |
|
|
| 12 |
|
|
| 11 |
|
|
| 40 |
|
|
| 43 |
|
|
| 20 |
|
|
| 20 |
|
|
| 118 |
|
|
| 116 |
|
Transactional fees (4) |
|
| 8 |
|
|
| 9 |
|
|
| 2 |
|
|
| 1 |
|
|
| 4 |
|
|
| 3 |
|
|
| 3 |
|
|
| 5 |
|
|
| 17 |
|
|
| 18 |
|
Total strategic capital revenues ($) |
|
| 54 |
|
|
| 51 |
|
|
| 14 |
|
|
| 12 |
|
|
| 44 |
|
|
| 46 |
|
|
| 23 |
|
|
| 25 |
|
|
| 135 |
|
|
| 134 |
|
Strategic capital expenses ($) (2) |
|
| (33 | ) |
|
| (23 | ) |
|
| (5 | ) |
|
| (5 | ) |
|
| (21 | ) |
|
| (14 | ) |
|
| (13 | ) |
|
| (10 | ) |
|
| (72 | ) |
|
| (52 | ) |
Strategic Capital Segment– NOI ($) |
|
| 21 |
|
|
| 28 |
|
|
| 9 |
|
|
| 7 |
|
|
| 23 |
|
|
| 32 |
|
|
| 10 |
|
|
| 15 |
|
|
| 63 |
|
|
| 82 |
|
|
|
|
|
|
|
|
|
|
|
|
|
|
|
|
|
|
|
|
|
|
|
|
|
|
|
|
|
|
|
| ||||||||||
|
| 2017 |
|
| 2016 |
| ||
U.S.: |
|
|
|
|
|
|
|
|
Asset management and other fees |
| $ | 31 |
|
| $ | 25 |
|
Leasing commissions, acquisition, development and other transaction fees |
|
| 9 |
|
|
| 4 |
|
Promote (1) |
|
| 120 |
|
|
| - |
|
Strategic capital expenses (2) |
|
| (57 | ) |
|
| (27 | ) |
Subtotal U.S. |
|
| 103 |
|
|
| 2 |
|
Other Americas: |
|
|
|
|
|
|
|
|
Asset management and other fees |
|
| 16 |
|
|
| 16 |
|
Leasing commissions, acquisition, development and other transaction fees |
|
| 2 |
|
|
| 1 |
|
Promote (1) |
|
| 4 |
|
|
| - |
|
Strategic capital expenses |
|
| (7 | ) |
|
| (8 | ) |
Subtotal Other Americas |
|
| 15 |
|
|
| 9 |
|
Europe: |
|
|
|
|
|
|
|
|
Asset management and other fees |
|
| 66 |
|
|
| 63 |
|
Leasing commissions, acquisition, development and other transaction fees |
|
| 10 |
|
|
| 10 |
|
Promote (1) |
|
| 3 |
|
|
| 88 |
|
Strategic capital expenses |
|
| (30 | ) |
|
| (36 | ) |
Subtotal Europe |
|
| 49 |
|
|
| 125 |
|
Asia: |
|
|
|
|
|
|
|
|
Asset management and other fees |
|
| 28 |
|
|
| 28 |
|
Leasing commissions, acquisition, development and other transaction fees |
|
| 17 |
|
|
| 12 |
|
Strategic capital expenses |
|
| (26 | ) |
|
| (27 | ) |
Subtotal Asia |
|
| 19 |
|
|
| 13 |
|
Strategic Capital segment – NOI |
| $ | 186 |
|
| $ | 149 |
|
Approximately 40% of the promote earned by us from the co-investment ventures is paid to our employees as a combination of cash and stock-based awards pursuant to the terms of the PPP and expensed through Strategic Capital Expenses, as vested. The increase in strategic capital expenses is partially due to higher expenses for PPP awards related to promotes earned in the third quarter of 2022.
|
|
|
|
G&A Expenses
G&A expenses were $100 million and $74 million for the three months ended March 31, 2023 and 2022, respectively. G&A expenses increased in 2023 as compared to 2022, principally due to inflationary increases and higher compensation expenses based on our performance. We capitalize certain internal costs that are incremental and directly related to our development and building improvement activities.
The following table summarizes capitalized G&A for the three months ended March 31 (dollars in millions):
|
| 2023 |
|
| 2022 |
| ||
Building and land development activities |
| $ | 37 |
|
| $ | 25 |
|
Operating building improvements and other |
|
| 15 |
|
|
| 11 |
|
Total capitalized G&A expenses |
| $ | 52 |
|
| $ | 36 |
|
Capitalized salaries and related costs as a percent of total salaries and related costs |
|
| 24.5 | % |
|
| 23.4 | % |
36
Depreciation and Amortization Expenses
Depreciation and amortization expenses were $602 million and $397 million for the three months ended March 31, 2023 and 2022.
The change in depreciation and amortization expenses during the three months ended March 31, 2023 from the same period in 2022 of approximately $205 million was impacted by the following activities (in millions):
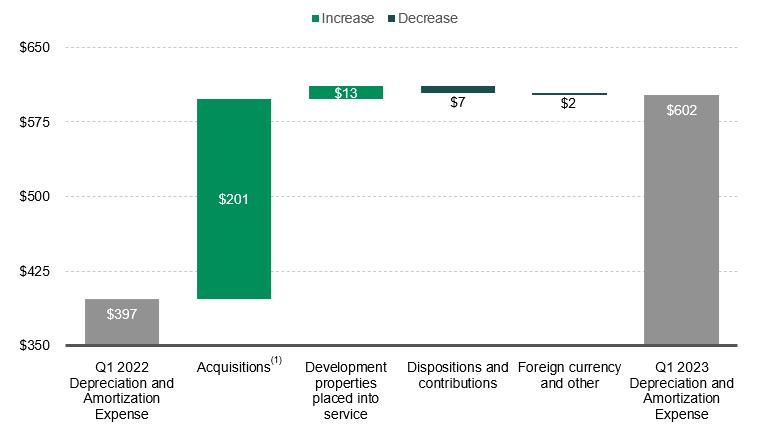
Gains on Real Estate Transactions, Net
During the three months ended March 31, 2023, due to current market conditions we did not contribute any properties to the unconsolidated co-investment ventures and sold a minimal number of properties to third parties. During the three months ended March 31, 2022, we recognized gains on the disposition of development properties and land of $210 million, primarily from the contribution of properties we developed to our unconsolidated co-investment ventures (dollarsin Europe, and square feetwe recognized gains on other dispositions of investments in millions):
|
| September 30, |
|
| December 31, |
|
| September 30, |
| |||
|
| 2017 |
|
| 2016 |
|
| 2016 |
| |||
U.S. (1): |
|
|
|
|
|
|
|
|
|
|
|
|
Number of ventures |
|
| 1 |
|
|
| 1 |
|
|
| 1 |
|
Number of operating properties owned |
|
| 552 |
|
|
| 369 |
|
|
| 366 |
|
Square feet |
|
| 88 |
|
|
| 50 |
|
|
| 49 |
|
Total assets |
| $ | 7,311 |
|
| $ | 4,238 |
|
| $ | 4,167 |
|
Other Americas (2): |
|
|
|
|
|
|
|
|
|
|
|
|
Number of ventures |
|
| 1 |
|
|
| 2 |
|
|
| 2 |
|
Number of operating properties owned |
|
| 203 |
|
|
| 213 |
|
|
| 209 |
|
Square feet |
|
| 37 |
|
|
| 42 |
|
|
| 41 |
|
Total assets |
| $ | 2,107 |
|
| $ | 2,793 |
|
| $ | 2,679 |
|
Europe (3): |
|
|
|
|
|
|
|
|
|
|
|
|
Number of ventures |
|
| 4 |
|
|
| 4 |
|
|
| 4 |
|
Number of operating properties owned |
|
| 709 |
|
|
| 700 |
|
|
| 694 |
|
Square feet |
|
| 167 |
|
|
| 163 |
|
|
| 160 |
|
Total assets |
| $ | 12,767 |
|
| $ | 10,853 |
|
| $ | 11,291 |
|
Asia: |
|
|
|
|
|
|
|
|
|
|
|
|
Number of ventures |
|
| 2 |
|
|
| 2 |
|
|
| 2 |
|
Number of operating properties owned |
|
| 93 |
|
|
| 85 |
|
|
| 79 |
|
Square feet |
|
| 40 |
|
|
| 36 |
|
|
| 34 |
|
Total assets |
| $ | 5,907 |
|
| $ | 5,173 |
|
| $ | 5,439 |
|
Total: |
|
|
|
|
|
|
|
|
|
|
|
|
Number of ventures |
|
| 8 |
|
|
| 9 |
|
|
| 9 |
|
Number of operating properties owned |
|
| 1,557 |
|
|
| 1,367 |
|
|
| 1,348 |
|
Square feet |
|
| 332 |
|
|
| 291 |
|
|
| 284 |
|
Total assets |
| $ | 28,092 |
|
| $ | 23,057 |
|
| $ | 23,576 |
|
|
|
|
|
|
|
real estate of $585 million, primarily due to the sale of non-strategic operating properties to third parties. Historically, we have utilized the proceeds from these transactions primarily to fund our development activities. See Note 3 to the Consolidated Financial Statements for additional information.further information on these transactions.
G&A Expenses
G&A expenses increased $6 million for the nine months ended September 30, 2017, compared to the same period in 2016, primarily due to additional compensation expense based on the company’s performance.
We capitalize certain costs directly related to our development and leasing activities. Capitalized G&A expenses include salaries and related costs, as well as certain other G&A costs. The following table summarizes capitalized G&A amounts for the nine months ended September 30 (dollars in millions):
|
| 2017 |
|
| 2016 |
| ||
Building and land development activities |
| $ | 47 |
|
| $ | 46 |
|
Leasing activities |
|
| 18 |
|
|
| 18 |
|
Operating building improvements and other |
|
| 11 |
|
|
| 12 |
|
Total capitalized G&A expenses |
| $ | 76 |
|
| $ | 76 |
|
Capitalized salaries and related costs as a percent of total salaries and related costs |
|
| 24.9 | % |
|
| 22.1 | % |
Depreciation and Amortization Expenses
The following table highlights the key changes in depreciation and amortization expenses for the nine months ended September 30, 2017, from the same period in 2016 (in millions):
Acquisition of properties |
| $ | 14 |
|
Development properties placed into service |
|
| 24 |
|
Disposition and contribution of properties |
|
| (69 | ) |
Other |
|
| (18 | ) |
Total change in depreciation and amortization expenses |
| $ | (49 | ) |
Our Owned and Managed (“O&M”) Operating Portfolio
We manage our business on an owned and managed basis, which includes properties wholly-owned by us or owned by one of our co-investment ventures. We review our operating fundamentals on an O&M basis, which includes our consolidated properties and properties owned and managed basis.by our unconsolidated co-investment ventures. We believe reviewing thesethe fundamentals this way allows management to understand the entire impact to the financial statements, as it will affect both the Real Estate OperationsSegment and the Strategic Capital segments,Segment, as well as the net earnings we recognize from our unconsolidated co-investment ventures based on our ownership share.ownership. We do not control the unconsolidated co-investment ventures for purposes of GAAP and the presentation of the ventures’ operating information does not represent a legal claim to such items.claim.
Our owned and managedO&M operating portfolio includes operating properties and does not include our development portfolio, value-added properties, under developmentnon-industrial properties or properties that we consider non-strategic and do not have the intent to hold long term that are classified as either held for sale or within other real estate investments. Value-added properties are properties we have either acquired at a discount and believe we could provide greater
37
returns post-stabilization or properties we expect to third parties (square feet in millions):
| September 30, 2017 |
|
| December 31, 2016 |
|
| September 30, 2016 |
| |||||||||||||||||||||||||||
| Number of Properties |
|
| Square Feet |
|
| Percentage Occupied |
|
| Number of Properties |
|
| Square Feet |
|
| Percentage Occupied |
|
| Number of Properties |
|
| Square Feet |
|
| Percentage Occupied |
| |||||||||
Consolidated |
| 1,577 |
|
|
| 300 |
|
|
| 96.7 | % |
|
| 1,777 |
|
|
| 332 |
|
|
| 97.0 | % |
|
| 1,796 |
|
|
| 333 |
|
|
| 96.4 | % |
Unconsolidated |
| 1,554 |
|
|
| 331 |
|
|
| 95.9 | % |
|
| 1,359 |
|
|
| 290 |
|
|
| 97.2 | % |
|
| 1,335 |
|
|
| 282 |
|
|
| 96.8 | % |
Totals |
| 3,131 |
|
|
| 631 |
|
|
| 96.3 | % |
|
| 3,136 |
|
|
| 622 |
|
|
| 97.1 | % |
|
| 3,131 |
|
|
| 615 |
|
|
| 96.6 | % |
Our operating portfolio excludes value-added properties, which are defined as properties that are expected to be repurposed or redevelopedrepurpose to a higher and better use and recently acquired properties that present opportunities to create greater value. We had seven consolidated value-added properties totaling two million square feet and three unconsolidated value-added properties totaling less than one million square feet at September 30, 2017.
Operating Activity
Below isuse. See below for information summarizing the leasing activity ofon our owned and managedO&M operating portfolio:
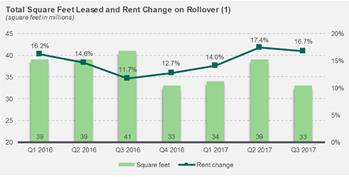
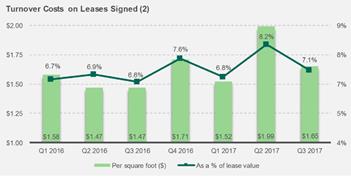
|
|
|
|
We capitalize costs incurred in developing, renovating, rehabilitating and improving our properties as part of the investment basis. The following table summarizes our capital expenditures on previously leased buildings within our owned and managed portfolio for the nine months ended September 30 (in millions):
|
| 2017 |
|
| 2016 |
| ||
Property improvements |
| $ | 115 |
|
| $ | 105 |
|
|
|
|
|
|
|
|
|
|
Turnover costs: |
|
|
|
|
|
|
|
|
Tenant improvements |
|
| 91 |
|
|
| 91 |
|
Leasing commissions |
|
| 87 |
|
|
| 84 |
|
Total turnover costs |
|
| 178 |
|
|
| 175 |
|
Total capital expenditures |
| $ | 293 |
|
| $ | 280 |
|
Our proportionate share of capital expenditures based on ownership (1) |
| $ | 189 |
|
| $ | 184 |
|
|
|
Development Start Activity
The following table summarizes our development starts for the nine months ended September 30 (dollars and square(square feet in millions):
| March 31, 2023 |
|
| December 31, 2022 |
| ||||||||||||||||||
| Number of Properties |
|
| Square |
|
| Percentage Occupied |
|
| Number of Properties |
|
| Square |
|
| Percentage Occupied |
| ||||||
Consolidated |
| 2,833 |
|
|
| 602 |
|
|
| 98.3 | % |
|
| 2,812 |
|
|
| 595 |
|
|
| 98.3 | % |
Unconsolidated |
| 2,192 |
|
|
| 491 |
|
|
| 97.7 | % |
|
| 2,177 |
|
|
| 488 |
|
|
| 98.1 | % |
Total |
| 5,025 |
|
|
| 1,093 |
|
|
| 98.0 | % |
|
| 4,989 |
|
|
| 1,083 |
|
|
| 98.2 | % |
Below are the key leasing metrics of our O&M operating portfolio.
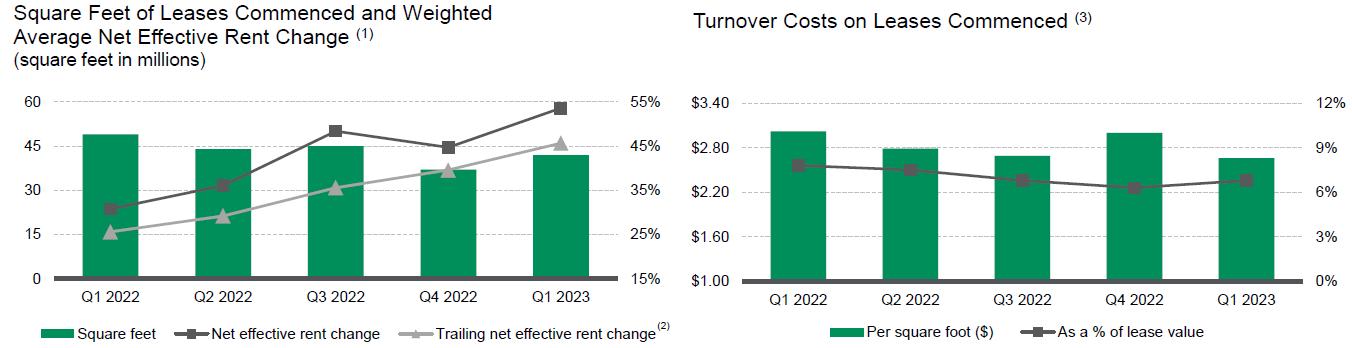
|
| 2017 (1) |
|
| 2016 |
| ||
Number of new development projects during the period |
|
| 57 |
|
|
| 58 |
|
Square feet |
|
| 21 |
|
|
| 16 |
|
TEI |
| $ | 1,841 |
|
| $ | 1,219 |
|
Our proportionate share of TEI (2) |
| $ | 1,641 |
|
| $ | 1,092 |
|
Percentage of build-to-suits based on TEI |
|
| 47.8 | % |
|
| 42.8 | % |
|
|
|
|
Development Stabilization Activity
The following table summarizes our development stabilization activity forcustomers, based on the nine months ended September 30 (dollars andtotal square feet of leases commenced during these periods.
|
| 2017 |
|
| 2016 |
| ||
Number of development projects stabilized during the period |
|
| 68 |
|
|
| 74 |
|
Square feet |
|
| 21 |
|
|
| 24 |
|
TEI |
| $ | 1,718 |
|
| $ | 1,767 |
|
Our proportionate share of TEI (1) |
| $ | 1,513 |
|
| $ | 1,481 |
|
Weighted average expected yield on TEI (2) |
|
| 6.7 | % |
|
| 7.0 | % |
Estimated value at completion |
| $ | 2,200 |
|
| $ | 2,241 |
|
Our proportionate share of estimated value at completion (1) |
| $ | 1,944 |
|
| $ | 1,891 |
|
Estimated weighted average margin |
|
| 28.0 | % |
|
| 26.8 | % |
|
|
|
|
Same Store Analysis
Our same store metrics are non-GAAP financial measures, which are commonly used in the real estate industry and expected from the financial community, on both a net effective and cash basis. We evaluate the operating performance of the operating properties we own and manage using a “same store” analysis because the population of properties in this analysis is consistent from period to period, which eliminatesallows us and investors to analyze our ongoing business operations. We determine our same store metrics on property NOI, which is calculated as rental revenue less rental expense for the effects of changesapplicable properties in the composition of the portfolio. We have defined the same store portfolio,population for both consolidated and unconsolidated properties based on our ownership interest, as further defined below.
We define our same store population for the three months ended September 30, 2017,March 31, 2023 as thosethe properties in our O&M operating portfolio, including the property NOI for both consolidated properties and properties owned and managed properties that were in operationby the unconsolidated co-investment ventures, at January 1, 20162022 and have been in operationowned throughout the same three-month periodsperiod in both 20172022 and 2016 (including development properties that have been completed and available for lease). We have removed all properties that were disposed of to a third party or were classified as held for sale to a third party from the population for both periods.2023. We believe the
factors that affect rental revenues, rental expenses and drivers of property NOI infor the same storeconsolidated portfolio are generally the same as for the total operating portfolio.properties owned by the ventures in which we invest and therefore we evaluate the same store metrics of the O&M portfolio based on Prologis’ ownership in the properties (“Prologis Share”). The same store population excludes properties held for sale to third parties, along with development properties that were not stabilized at the beginning of the period (January 1, 2022) and properties acquired or disposed of to third parties during the period. To derive an appropriate measure of period-to-period operating performance, we remove the effects of foreign currency exchange rate movements by using the recent period endreported period-end exchange rate to translate from local currency into the U.S. dollar for both periods.
Same store is a commonly used measure in the real estate industry. Our same store measures are38
As non-GAAP financial measures, that are calculated beginning with rental revenues, rental recoveries and rental expenses from the financial statements prepared in accordance with GAAP. As our same store measures are non-GAAP financial measures, theymetrics have certain limitations as analytical tools and may vary among real estate companies. As a result, we provide a reconciliation of Rental Revenues less Rental Expenses (“Property NOI”) (from our Consolidated Financial Statements prepared in accordance with U.S. GAAP) to our Same Store Property NOI measures, as follows for the three months ended March 31 (dollars in millions):
|
|
|
|
|
|
| Percentage |
| |||
| 2023 |
|
| 2022 |
|
| Change |
| |||
Reconciliation of Consolidated Property NOI to Same Store Property NOI measures: |
| ||||||||||
|
|
|
|
|
|
|
|
| |||
Rental revenues | $ | 1,634 |
|
| $ | 1,077 |
|
|
|
| |
Rental expenses |
| (413 | ) |
|
| (276 | ) |
|
|
| |
Consolidated Property NOI |
| 1,221 |
|
|
| 801 |
|
|
|
| |
|
|
|
|
|
|
|
|
| |||
Adjustments to derive same store results: |
|
|
|
|
|
|
|
| |||
Property NOI from consolidated properties not included in same store portfolio and |
| (418 | ) |
|
| (71 | ) |
|
|
| |
Property NOI from unconsolidated co-investment ventures included in same store |
| 701 |
|
|
| 645 |
|
|
|
| |
Third parties' share of Property NOI from properties included in same store |
| (567 | ) |
|
| (522 | ) |
|
|
| |
Prologis Share of Same Store Property NOI – Net Effective (2) | $ | 937 |
|
| $ | 853 |
|
|
| 9.9 | % |
Consolidated properties straight-line rent and fair value lease adjustments |
| (18 | ) |
|
| (23 | ) |
|
|
| |
Unconsolidated co-investment ventures straight-line rent and fair value lease |
| (7 | ) |
|
| (24 | ) |
|
|
| |
Third parties' share of straight-line rent and fair value lease adjustments included |
| 6 |
|
|
| 18 |
|
|
|
| |
Prologis Share of Same Store Property NOI – Cash (2)(3) | $ | 918 |
|
| $ | 824 |
|
|
| 11.4 | % |
During the periods presented, certain wholly owned properties were contributed to a co-investment venture and are included in the same store portfolio. Neither our consolidated results nor those of the co-investment ventures, when viewed individually, would be comparable on a same store basis because of the changes in composition of the respective portfolios from period to period (e.g. the results of a contributed property are included in our consolidated results through the contribution date and in the results of the venture subsequent to the contribution date based on our ownership interest at the end of the period). As a result, only line items labeled “Prologis Share of Same Store Property NOI” are comparable period over period.
We manage our business and compensate our executives based on the same store property NOI with explanations of how these metrics are calculated.
The following is a reconciliationresults of our consolidated rental revenues, rental recoveries, rental expenses and property NOI,O&M portfolio at 100% as included inwe manage our portfolio on an ownership blind basis. We calculate those results by including 100% of the Consolidated Statements of Income, to the respective amountsproperties included in our same store portfolio analysis for the three months ended September 30 (dollars in millions):portfolio.
|
|
|
|
|
|
|
|
|
| Percentage |
| |
|
| 2017 |
|
| 2016 |
|
| Change |
| |||
Rental revenues (1) (2) |
|
|
|
|
|
|
|
|
|
|
|
|
Consolidated: |
|
|
|
|
|
|
|
|
|
|
|
|
Rental revenues per the Consolidated Statements of Income |
| $ | 416 |
|
| $ | 436 |
|
|
|
|
|
Rental recoveries per the Consolidated Statements of Income |
|
| 115 |
|
|
| 124 |
|
|
|
|
|
Consolidated adjustments to derive same store results: |
|
|
|
|
|
|
|
|
|
|
|
|
Rental revenues and recoveries of properties not in the same store portfolio – properties developed, acquired and sold to third parties during the period and land subject to ground leases |
|
| (63 | ) |
|
| (57 | ) |
|
|
|
|
Effect of changes in foreign currency exchange rates and other |
|
| (1 | ) |
|
| - |
|
|
|
|
|
Unconsolidated co-investment ventures – rental revenues |
|
| 525 |
|
|
| 456 |
|
|
|
|
|
Same store portfolio – rental revenues (2) |
|
| 992 |
|
|
| 959 |
|
|
| 3.4 | % |
Rental expenses (1) (3) |
|
|
|
|
|
|
|
|
|
|
|
|
Consolidated: |
|
|
|
|
|
|
|
|
|
|
|
|
Rental expenses per the Consolidated Statements of Income |
|
| 129 |
|
|
| 141 |
|
|
|
|
|
Consolidated adjustments to derive same store results: |
|
|
|
|
|
|
|
|
|
|
|
|
Rental expenses of properties not in the same store portfolio – properties developed, acquired and sold to third parties during the period and land subject to ground leases |
|
| (18 | ) |
|
| (17 | ) |
|
|
|
|
Effect of changes in foreign currency exchange rates and other |
|
| 13 |
|
|
| 12 |
|
|
|
|
|
Unconsolidated co-investment ventures – rental expenses |
|
| 116 |
|
|
| 93 |
|
|
|
|
|
Same store portfolio – rental expenses (3) |
|
| 240 |
|
|
| 229 |
|
|
| 4.8 | % |
NOI (1) |
|
|
|
|
|
|
|
|
|
|
|
|
Consolidated: |
|
|
|
|
|
|
|
|
|
|
|
|
Property NOI (calculated as rental revenues and rental recoveries less rental expenses per the Consolidated Statements of Income) |
|
| 402 |
|
|
| 419 |
|
|
|
|
|
Consolidated adjustments to derive same store results: |
|
|
|
|
|
|
|
|
|
|
|
|
Property NOI of properties not in the same store portfolio – properties developed, acquired and sold to third parties during the period and land subject to ground leases |
|
| (45 | ) |
|
| (40 | ) |
|
|
|
|
Effect of changes in foreign currency exchange rates and other |
|
| (14 | ) |
|
| (12 | ) |
|
|
|
|
Unconsolidated co-investment ventures – property NOI |
|
| 409 |
|
|
| 363 |
|
|
|
|
|
Same store portfolio – NOI |
| $ | 752 |
|
| $ | 730 |
|
|
| 2.9 | % |
|
|
|
|
|
|
39
Other Components of Income (Expense)
Earnings from Unconsolidated Entities, Net
We recognized net earnings from unconsolidated entities, which are accounted for using the equity method, of $172$76 million and $146$77 million for the ninethree months ended September 30, 2017,March 31, 2023 and 2016,2022, respectively.
The earnings we recognize can be impacted by: (i) variances in revenues and expenses of each venture; (ii) the size and occupancy rate of the portfolio of properties owned by each venture; (iii) gains or losses from the dispositions of properties;properties and extinguishment of debt; (iv) our ownership interest in each venture; and (v) fluctuations in foreign currency exchange rates used to translate our share of net earnings to U.S. dollars.
See the discussion of our co-investment venturesunconsolidated entities above in the Strategic Capital segmentSegment discussion and in Note 34 to the Consolidated Financial Statements for a further breakdown of our share of net earnings recognized.
Interest Expense
The following table details our net interest expense for the ninethree months ended September 30March 31 (dollars in millions):
|
| 2017 |
|
| 2016 |
|
| 2023 |
|
| 2022 |
| ||||
Gross interest expense |
| $ | 256 |
|
| $ | 292 |
|
| $ | 141 |
|
| $ | 73 |
|
Amortization of premiums, net and debt issuance costs, net |
|
| (2 | ) |
|
| (13 | ) | ||||||||
Amortization of debt discount and debt issuance costs, net |
|
| 18 |
|
|
| 2 |
| ||||||||
Capitalized amounts |
|
| (42 | ) |
|
| (46 | ) |
|
| (23 | ) |
|
| (11 | ) |
Net interest expense |
| $ | 212 |
|
| $ | 233 |
|
| $ | 136 |
|
| $ | 64 |
|
Weighted average effective interest rate |
|
| 3.2 | % |
|
| 3.3 | % | ||||||||
Weighted average effective interest rate during the period |
|
| 2.5 | % |
|
| 1.6 | % | ||||||||
Our overall debt decreased by $887 million from December 31, 2016, to September 30, 2017, primarily from USLF assuming secured debt in conjunction with our contribution of real estate properties. Gross interestInterest expense decreased forincreased during the ninethree months ended September 30, 2017,March 31, 2023, as compared to the same period in 2016, principally2022, primarily due to decreased securedassuming $4.2 billion of debt as a result of the USLF contribution and pay downs, and lower interest rates due to the change in the compositionDuke Transaction with a weighted average interest rate at fair value of our4.9%, which included $2.9 billion of senior notes.notes and a $501 million term loan. Additionally, we issued $2.6 billion of senior notes during the first quarter of 2023 and $3.3 billion during the year ended December 31, 2022, with a weighted average interest rate of 4.5% and 2.3%, respectively, at the issuance date.
See Note 56 to the Consolidated Financial Statements and the Liquidity and Capital Resources section below, for further discussion of our debt and borrowing costs.
Gains on Dispositions of Investments in Real Estate and Revaluation of Equity Investments Upon Acquisition of a Controlling Interest, Net
During the nine months ended September 30, 2017 and 2016, we recognized gains on dispositions of investments in real estate and revaluation of equity investments upon acquisition of a controlling interest, net of $959 million and $462 million, respectively. The increase was primarily from the contribution of 190 operating properties owned by NAIF, which was wholly-owned beginning March 2017, to our unconsolidated co-investment venture USLF in July 2017. See Note 2 and 3 to the Consolidated Financial Statements for further information on these activities.
Foreign Currency and Derivative Losses,Gains and Other Income, Net
We recognized foreign currency and derivative gains and other income, net, of $9 million and $48 million for the three months ended March 31, 2023 and 2022, respectively.
We are exposed to foreign currency exchange risk related to investments in and earnings from our foreign investments. We primarily hedge our foreign currency risk related to our investments by borrowing in the currencies in which we invest thereby providing a natural hedge. We have issued debt in a currency that is not the same functional currency of the borrowing entity and have designated a portion of the debt as a nonderivative net investment hedge. We recognize the remeasurement and settlement of the translation adjustment on the unhedged portion of the debt and accrued interest in unrealized gains or losses. We may use derivative financial instruments to manage foreign currency exchange rate risk related to our earnings. We recognize the change in fair value of the undesignated derivative contracts in unrealized gains and losses. Upon settlement of these transactions, we recognize realized gains or losses.
The following table details our foreign currency and derivative losses,gains, net for the ninethree months ended September 30March 31 (in millions):
|
| 2017 |
|
| 2016 |
| ||
Realized foreign currency and derivative gains (losses): |
|
|
|
|
|
|
|
|
Gains (losses) on the settlement of unhedged derivative transactions |
| $ | 11 |
|
| $ | (1 | ) |
Losses on the settlement of transactions with third parties |
|
| (1 | ) |
|
| (4 | ) |
Total realized foreign currency and derivative gains (losses) |
|
| 10 |
|
|
| (5 | ) |
|
|
|
|
|
|
|
|
|
Unrealized foreign currency and derivative gains (losses), net: |
|
|
|
|
|
|
|
|
Losses on the change in fair value of unhedged derivative transactions |
|
| (64 | ) |
|
| (25 | ) |
Gains on remeasurement of certain assets and liabilities (1) |
|
| 8 |
|
|
| 4 |
|
Total unrealized foreign currency and derivative losses, net |
|
| (56 | ) |
|
| (21 | ) |
Total foreign currency and derivative losses, net |
| $ | (46 | ) |
| $ | (26 | ) |
|
|
|
|
|
|
|
|
|
|
|
|
| 2023 |
|
| 2022 |
| ||
Realized foreign currency and derivative gains (losses), net: |
|
|
|
|
|
| ||
Gains on the settlement of undesignated derivatives |
| $ | 14 |
|
| $ | 15 |
|
Losses on the settlement of transactions with third parties |
| - |
|
|
| (1 | ) | |
Total realized foreign currency and derivative gains, net |
|
| 14 |
|
|
| 14 |
|
|
|
|
|
|
|
| ||
Unrealized foreign currency and derivative gains (losses), net: |
|
|
|
|
|
| ||
Gains (losses) on the change in fair value of undesignated derivatives and unhedged debt |
|
| (18 | ) |
|
| 30 |
|
Gains on remeasurement of certain assets and liabilities |
|
| 8 |
|
|
| 3 |
|
Total unrealized foreign currency and derivative gains (losses), net |
|
| (10 | ) |
|
| 33 |
|
Total foreign currency and derivative gains, net |
| $ | 4 |
|
| $ | 47 |
|
|
|
|
|
|
|
| ||
40
See Note 910 to the Consolidated Financial Statements for more information about our derivative and nonderivative transactions.
Gains (Losses) on Early Extinguishment of Debt, Net
During the nine months ended September 30, 2017, we redeemed $618 million of senior notes and repaid $302 million of secured mortgage debt prior to maturity, which resulted in a loss of $31 million. During the nine months ended September 30, 2016, we repaid $457 million of secured mortgage debt prior to maturity, which resulted in a gain of $2 million.
Income Tax Expense
We recognize current income tax expense for income taxes incurred byrelated to our taxable REIT subsidiaries and in the local, state and local income taxes and taxes incurred in the foreign jurisdictions in which we operate. Our current income tax expense (benefit) fluctuates from period to period based predominantlyprimarily on the timing of our taxable income, including gains on the disposition of properties and fees earned from the dispositions of real estate.co-investment ventures. Deferred income tax expense (benefit) is generally a function of the period’s temporary differences and the utilization of net operating losses generated in prior years that had been previously recognized as deferred income tax assets in taxable subsidiaries operating in the U.S. or in foreign jurisdictions.subsidiaries.
The following table summarizes our income tax expense for the ninethree months ended September 30March 31 (in millions):
|
| 2017 |
|
| 2016 |
|
| 2023 |
|
| 2022 |
| ||||
Current income tax expense (benefit): |
|
|
|
|
|
|
|
|
|
|
|
|
| |||
Income tax expense |
| $ | 30 |
|
| $ | 24 |
|
| $ | 26 |
|
| $ | 23 |
|
Income tax expense on dispositions |
|
| 12 |
|
|
| 15 |
| ||||||||
Income tax expense (benefit) on dispositions |
|
| 2 |
|
|
| (1 | ) | ||||||||
Total current income tax expense |
|
| 42 |
|
|
| 39 |
|
|
| 28 |
|
|
| 22 |
|
|
|
|
|
|
|
|
|
|
|
|
|
|
| |||
Deferred income tax expense (benefit): |
|
|
|
|
|
|
|
| ||||||||
Income tax benefit |
|
| - |
|
|
| (2 | ) | ||||||||
Deferred income tax expense: |
|
|
|
|
| |||||||||||
Income tax expense |
|
| 4 |
|
|
| 7 |
| ||||||||
Total deferred income tax expense |
|
| 4 |
|
|
| 7 |
| ||||||||
Total income tax expense |
| $ | 42 |
|
| $ | 37 |
|
| $ | 32 |
|
| $ | 29 |
|
|
|
|
|
|
|
|
|
| ||||||||
Net Earnings Attributable to Noncontrolling Interests
This amount represents the third-party investors’ share of the earnings generated in consolidated entities in which we do not own 100% of the equity, reduced by the third-party share of fees or promotes payable to us and earned during the period.
The following table summarizes We had net earnings attributable to noncontrolling interests of $34 million and $69 million for the ninethree months ended September 30 (in millions):March 31, 2023 and 2022, respectively. Included in these amounts were $12 million and $32 million for the three months ended March 31, 2023 and 2022, of net earnings attributable to the common limited partnership unitholders of Prologis, L.P.
|
| 2017 |
|
| 2016 |
| ||
Prologis U.S. Logistics Venture |
| $ | 31 |
|
| $ | 14 |
|
Prologis North American Industrial Fund (1) |
|
| 2 |
|
|
| 15 |
|
Other consolidated entities (2) |
|
| 1 |
|
|
| 7 |
|
Prologis, L.P. net earnings attributable to noncontrolling interests |
|
| 34 |
|
|
| 36 |
|
Limited partners in Prologis, L.P. |
|
| 37 |
|
|
| 22 |
|
Prologis, Inc. net earnings attributable to noncontrolling interests |
| $ | 71 |
|
| $ | 58 |
|
|
|
|
|
|
|
|
|
|
|
|
|
|
See Note 67 to the Consolidated Financial Statements for further information on our consolidated co-investment ventures.noncontrolling interests.
Other Comprehensive Income (Loss)
DuringThe key driver of changes in Accumulated Other Comprehensive Income (Loss) (“AOCI/L”) during the ninethree months ended September 30, 2017,March 31, 2023 and 2022, was the currency translation adjustment derived from changes in exchange rates during both periods primarily on our net investments in real estate outside the U.S. and the borrowings we recorded net gains of $47 millionissue in the Statementsfunctional currencies of Comprehensive Income related to foreign currency translationsthe countries where we invest. These borrowings serve as a natural hedge of our foreign subsidiaries into U.S. dollars upon consolidation, offset by net losses on the translation ofinvestments. In addition, we use derivative financial instruments, such as foreign currency forward and option contracts to manage foreign currency exchange rate risk related to our derivativeforeign investments and nonderivative net investment hedges. These gains were principally dueinterest rate swaps to the strengthening of the British pound sterling, euro, Brazilian real and Japanese yen to the U.S. dollar. During the nine months ended September 30, 2016, we recorded net losses of $70 million, principally due to the weakening of the British pound sterling, offset slightly by the strengthening of the Brazilian real, euro and Japanese yen, all to the U.S. dollar.
During the nine months ended September 30, 2017, we recorded unrealized gains of $15 million and during the nine months ended September 30, 2016, we recorded unrealized losses of $17 million in the Statements of Comprehensive Income, related tomanage interest rate risk, that when designated the change in fair value of our cash flow hedges and our share of derivativesis included in our unconsolidated co-investment ventures.AOCI/L.
See Note 910 to the Consolidated Financial Statements for more information on changes in other comprehensive income (loss) and about our derivative and nonderivative transactions.
RESULTS OF OPERATIONS – THREE MONTHS ENDED SEPTEMBER 30, 2017 AND 2016
Except as separately discussed above, the changes in comprehensive income attributable to common stockholders and its components for the three months ended September 30, 2017, as compared to the three months ended September 30, 2016, are similar to the changes for the nine month periods ended on the same dates.
LIQUIDITY AND CAPITAL RESOURCES
Overview
We consider our ability to generate cash from operating activities, distributions from our co-investment ventures, contributions and dispositions of properties and from available financing sources to be adequate to meet our anticipated future development, acquisition, operating, debt service, dividend and distribution requirements.
Given the uncertain macro environment and the impact on real estate valuations, we expect to be cautious as we evaluate capital deployment activities. We anticipate the pace of development starts and contributions into our open ended funds to increase in the second half of the year.
Near-Term Principal Cash Sources and Uses
In addition to dividends to the common and preferred stockholders of Prologis, Inc. and distributions, to the holders of limited partnership units of Prologis, L.P. and our partner in our consolidated co-investment venture, we expect our primary cash needs will consist of the following:
41
completion of the development and leasing of the properties in our consolidated development portfolio (at September 30, 2017, 79 March 31, 2023, 123properties in our development portfolio were 62.5%43.4% leased with a current investment of $1.5$4.3 billion and a TEI of $2.7$6.8 billion when completed and leased, leaving $1.2$2.5 billion remaining to be spent)of estimated additional required investment);
development of new properties that we may hold for long-term investment or subsequently contribute to unconsolidated co-investment ventures, including the acquisition of land in certain markets;
repayment of debt and scheduled principal payments of $4$32 million forin the remainder of 20172023 and $581$520 million in 2018;
additional investments in current unconsolidated entities or new investments inand future unconsolidated co-investment ventures and other ventures;
We expect to fund our cash needs principally from the following sources (subject to market conditions):
Long-term, we may also voluntarily repurchase of our outstanding debt or equity securities (depending on prevailing market conditions, our liquidity, requirements, contractual restrictions and other factors) through cash purchases, open-market purchases, privately negotiated transactions, tender offers or otherwise.
We expect tomay also fund our cash needs principally from the following sources (subjectissuance of equity securities, subject to market conditions):
available unrestricted cash balances ($569 million at September 30, 2017);
property operations;
fees earned for services performed on behalf of the co-investment ventures, including promotes;
distributions received from the co-investment ventures;
proceeds from the disposition of properties, land parcels or other investments to third parties;
proceeds from the contributions of properties to current or future co-investment ventures;
proceeds fromconditions, and through the sale of a portion of our investments in co-investment ventures;
borrowing capacity under our current credit facility arrangements discussed in the following section, other facilities or borrowing arrangements ($3.5 billion at September 30, 2017); and
proceeds from the issuance of debt.
ventures.
We may also generate proceeds from the issuance of equity securities, subject to market conditions.
Debt
Debt
The following table summarizes information about our consolidated debt by currency (dollars in millions):
|
| March 31, 2023 |
|
|
|
|
| December 31, 2022 |
|
|
|
| ||||||||||||
|
| Weighted Average |
|
| Amount |
|
| % of Total |
|
| Weighted Average |
|
| Amount |
|
| % of Total |
| ||||||
British pound sterling |
|
| 2.1 | % |
| $ | 1,264 |
|
|
| 5.0 | % |
|
| 2.1 | % |
| $ | 1,228 |
|
|
| 5.1 | % |
Canadian dollar |
|
| 4.9 | % |
|
| 813 |
|
|
| 3.2 | % |
|
| 4.5 | % |
|
| 815 |
|
|
| 3.4 | % |
Euro |
|
| 1.7 | % |
|
| 9,101 |
|
|
| 36.2 | % |
|
| 1.3 | % |
|
| 7,991 |
|
|
| 33.5 | % |
Japanese yen |
|
| 1.0 | % |
|
| 3,367 |
|
|
| 13.4 | % |
|
| 1.0 | % |
|
| 3,308 |
|
|
| 13.9 | % |
U.S. dollar |
|
| 3.6 | % |
|
| 10,608 |
|
|
| 42.2 | % |
|
| 3.6 | % |
|
| 10,534 |
|
|
| 44.1 | % |
Total debt (1) |
|
| 2.6 | % |
| $ | 25,153 |
|
|
| 100.0 | % |
|
| 2.5 | % |
| $ | 23,876 |
|
|
| 100.0 | % |
|
| September 30, 2017 |
|
| December 31, 2016 |
| ||
Debt outstanding |
| $ | 9,721 |
|
| $ | 10,608 |
|
Weighted average interest rate |
|
| 3.0 | % |
|
| 3.2 | % |
Weighted average maturity in months |
| 66 |
|
| 60 |
| ||
In February 2017, we renewed42
Our credit ratings at March 31, 2023, were A3 from Moody’s with a stable outlook and amendedA from Standard & Poor’s with a stable outlook. These ratings allow us to borrow at an advantageous interest rate. Adverse changes in our Japanese yen revolver (the “Revolver”)credit ratings could negatively impact our business and, increasedin particular, our availability under the Revolverrefinancing and other capital market activities, our ability to ¥50.0 billion ($444 million at September 30, 2017).
In March 2017, we entered into an unsecured senior term loan agreement (the “2017 Yen Term Loan”) under which we can draw in Japanese yen, of which ¥7.2 billion ($64 million at September 30, 2017) matures in March 2027manage debt maturities, our future growth and bears an interest rate of 0.9%our development and ¥4.8 billion ($43 million at September 30, 2017) matures in March 2028 and bears an interest rate of 1.0%. In the first quarter of 2017, we borrowed ¥12.0 billion ($107.3 million), causing the 2017 Yen Term Loanacquisition activity. A securities rating is not a recommendation to be fully drawn at September 30, 2017.
In May 2017, we renewed and amended our existing senior term loan agreement (the “2017 Term Loan,” formerly the “Euro Term Loan”) under which loans can be obtained in British pounds sterling, euro, Japanese yen and U.S. dollars in an aggregate amount not to exceed $500 million. We may pay down and reborrow under the 2017 Term Loan. The 2017 Term Loan bears an interest rate of LIBOR plus 0.9%buy, sell or hold securities and is scheduled to mature in May 2020; however, we may extend the maturity date twice, by one year each, subject to revision or withdrawal at any time by the satisfaction of certain conditions and the payment of an extension fee. In the second quarter of 2017, we borrowed $500 million. In the third quarter of 2017, we repaid this balance and subsequently borrowed $160 million, which remained outstanding at September 30, 2017.rating organization.
In June 2017, we issued £500 million ($645 million) of senior notes with an interest rate of 2.3%, maturing in June 2029, at 99.9% of par value. Following the issuance, we used the cash proceeds to redeem $618 million of previously issued senior notes.
In July 2017, we contributed 190 operating properties owned by NAIF to USLF and received cash proceeds of $720 million that was used to pay down term loans and other borrowings. Also, USLF assumed $956 million of secured mortgage debt related to the properties.
At September 30, 2017, we had credit facilities with an aggregate borrowing capacity of $3.5 billion, of which $3.4 billion was available for borrowing.
At September 30, 2017,March 31, 2023, we were in compliance with all of our financial debt covenants. These covenants include a number of customary financial covenants, for totalsuch as maintaining debt encumbered debtservice coverage ratios, leverage ratios and fixed charge coverage ratios.
See Note 56 to the Consolidated Financial Statements for further discussion on our debt.
Equity Commitments Related to Certain Co-Investment Ventures
Certain co-investment ventures have equity commitments from us and our venture partners. Our venture partners fulfill their equity commitment with cash. We may fulfill our equity commitment through contributions of properties or cash. For more information on
The following table summarizes the remaining equity commitments at March 31, 2023 (dollars in millions):
| Equity Commitments (1) |
|
|
| |||||||||
| Prologis |
|
| Venture |
|
| Total |
|
| Expiration Date | |||
Prologis Targeted U.S. Logistics Fund | $ | - |
|
| $ | 1,125 |
|
| $ | 1,125 |
|
| 2024 – 2026 (2) |
Prologis European Logistics Fund |
| - |
|
|
| 262 |
|
|
| 262 |
|
| 2025 – 2026 (2) |
Prologis China Logistics Venture |
| 252 |
|
|
| 1,318 |
|
|
| 1,570 |
|
| 2023 – 2028 |
Prologis Brazil Logistics Venture |
| 34 |
|
|
| 135 |
|
|
| 169 |
|
| 2026 |
Total | $ | 286 |
|
| $ | 2,840 |
|
| $ | 3,126 |
|
|
|
See the Cash Flow Summary below for more information about our investment activity in our co-investment ventures.
Cash Flow Summary
The following table summarizes our cash flow activity for the ninethree months ended September 30 (inMarch 31(in millions):
|
| 2017 |
|
| 2016 |
| ||
Net cash provided by operating activities |
| $ | 1,360 |
|
| $ | 997 |
|
Net cash provided by investing activities |
| $ | 342 |
|
| $ | 730 |
|
Net cash used in financing activities |
| $ | (1,957 | ) |
| $ | (1,629 | ) |
|
| 2023 |
|
| 2022 |
| ||
Net cash provided by operating activities |
| $ | 1,114 |
|
| $ | 842 |
|
Net cash provided by (used in) investing activities |
| $ | (1,049 | ) |
| $ | 283 |
|
Net cash provided by financing activities |
| $ | 172 |
|
| $ | 242 |
|
Net increase in cash and cash equivalents, including the effect of foreign |
| $ | 244 |
|
| $ | 1,357 |
|
Cash Provided by Operating Activities
Cash provided by and used in operating activities, exclusive of changes in receivables and payables, iswas impacted by the following significant activity:activities during the three months ended March 31, 2023 and 2022:
Real estate operations.Estate Segment. We receive the majority of our operating cash through the net revenues of our Real Estate Operations segment.Segment, including the recovery of our operating costs. Cash flows generated by the Real Estate Segment are impacted by our acquisition, development and disposition activities, which are drivers of NOI recognized during each period. See the Results of Operations section above for further explanation of our Real Estate Operations segment.Segment. The revenues from this segment include noncash adjustments for straight-lined rentrents and amortization of above and below market leases of $66$144 million and $75$37 million for 2017in 2023 and 2016,2022, respectively.
Strategic capital.Capital Segment. We also generate operating cash through our Strategic Capital segmentSegment by providing asset management and property management and other services to our unconsolidated co-investment ventures, including promotes.ventures. See the Strategic Capital Results of Operations section above for the key drivers of the net revenues from our strategic capital revenues and expenses. We earned $88 million ofStrategic Capital Segment. Included in Strategic Capital Revenues is the third-party investors’ share that is owed for promotes, which is recognized in operating activities in the third quarter of 2016, which were included as strategic capital revenues but excluded from cash provided by operating activities asperiod the cash was notis received, untilgenerally the fourth quarter of 2016. Included inafter the cash provided by operating activities for 2016revenue is $30 million of cash received, which represented the third-parties’ share of promotes earned in 2015.
43
G&A expenses.expenses and equity-based compensation awards. We incurred $171$100 million and $166$74 million of G&A costsexpenses in 20172023 and 2016,2022, respectively.
Equity-based compensation awards. We recordrecognized equity-based, noncash compensation expenses of $63 million and $41 million in 2023 and 2022, respectively, which were recorded to Rental Expensesin the Real Estate Operations segment, Segment, Strategic Capital Expenses in the Strategic Capital segmentSegment and G&A expenses. The total amounts expensed were $58 million and $44 million in 2017 and 2016, respectively.
DistributionsOperating distributions from unconsolidated entities. We received $231$135 million and $210$96 million of distributions as a return on our investment from the cash flows generated from the operations of our unconsolidated entities in 20172023 and 2016,2022, respectively. Included in 2016 are distributions of $27 million that represented our share of promotes earned in 2015.
Cash paid for interest, net of amounts capitalized. We paid interest, net of amounts capitalized, of $130 million and income taxes. As disclosed$63 million in Note 11, we2023 and 2022, respectively.
Cash Provided by Investing Activities
RealCash provided by investing activities is driven by proceeds from the sale of real estate development. We invested $1.1 billionassets that include the contribution of properties we developed to our unconsolidated co-investment ventures as well as the sale of operating properties. Contribution and $1.2 billiondisposition activity in 20172023 was significantly lower than in 2022 due to a pause on contributions into our open ended funds given current market conditions and 2016, respectively,minimal sales of properties to third parties. Cash used in investing activities is principally driven by our capital deployment activities of investing in real estate development, acquisitions and leasing costscapital expenditures as discussed above. Acquisition activity includes land for first generation leases. We had 55future development, operating properties under development and 24 properties that were completed but not stabilized at September 30, 2017, and we expect to continue to develop new properties as the opportunities arise.
Real estate acquisitions. We acquired totalother real estate of $295 million, which included 669 acres of land and 2 operating properties in 2017. We acquired total real estate of $281 million, which included 687 acres of land and 7 operating properties in 2016.
Proceeds from contributions and dispositions.We generated cash from contributions and dispositions of real estate properties of $2.4 billion and $1.9 billion during 2017 and 2016, respectively. Included in this amount for 2017 is $720 million from the contribution of operating properties owned by NAIF to USLF.assets. See Notes 2 andNote 3 to the Consolidated Financial Statements for further information on these activities. In addition, the following significant transactions also impacted our cash used in and provided by investing activities during the three months ended March 31, 2023 and 2022:
Investments in and advances to.to our unconsolidated entities.We investinvested cash in our unconsolidated co-investment ventures and other ventures, which representsentities that represented our proportionate share.share, of $40 million and $35 million in 2023 and 2022, respectively. The ventures primarily useused the funds for the acquisition of operating properties, development and repayment of debt. The following table summarizes the cash investments we made in our unconsolidated co-investment ventures for the nine months ended September 30 (in millions):
|
|
| 2017 |
|
| 2016 |
| ||
| Unconsolidated co-investment ventures: |
|
|
|
|
|
|
|
|
| Other Americas |
|
|
|
|
|
|
|
|
| Prologis Brazil Logistics Partners Fund I and related joint ventures |
| $ | 27 |
|
| $ | 32 |
|
| Europe |
|
|
|
|
|
|
|
|
| Europe Logistics Venture 1 |
|
| 19 |
|
|
| - |
|
| Prologis European Logistics Partners Sàrl |
|
| 10 |
|
|
| 124 |
|
| Prologis United Kingdom Logistics Venture |
|
| 31 |
|
|
| - |
|
| Asia |
|
|
|
|
|
|
|
|
| Nippon Prologis REIT, Inc. |
|
| 46 |
|
|
| 34 |
|
| Remaining unconsolidated co-investment ventures |
|
| 13 |
|
|
| 12 |
|
| Total unconsolidated co-investment ventures |
|
| 146 |
|
|
| 202 |
|
|
|
|
|
|
|
|
|
|
|
| Other ventures |
|
| 98 |
|
|
| 27 |
|
| Total investments in and advances to unconsolidated entities |
| $ | 244 |
|
| $ | 229 |
|
|
|
|
|
|
|
|
|
|
|
See Note 34 to the Consolidated Financial Statements for more detail on our unconsolidated co-investment ventures.
Purchase of a controlling interest. We paid net cash of $375 million to acquire a controlling interest in certain joint ventures in Brazil in 2017.
Return of investment.investment from unconsolidated entities.We received distributions from unconsolidated co-investment ventures and other venturesentities as a return of investment of $144$21 million and $579$14 million during 2017in 2023 and 2016,2022, respectively. Included in this amount for 2017 is $84 millionthese amounts were distributions from venture activities including proceeds from property sales, debt refinancing and the dispositionredemption of our investment in ELV and $59 millioncertain unconsolidated entities.
Proceeds from repayment of notes receivable backed by real estate.hedges. We received $32net proceeds of $5 million and $201 million in 2017 and 2016, respectively, for the payment of notes receivable received in connection with dispositions of real estate to third parties.
Cash Used in Financing Activities
Dividends paid on common and preferred stock. We paid dividends of $707 million and $669 million to our common and preferred stockholders during 2017 and 2016, respectively.
Noncontrolling interests contributions. Our partner in U.S. Logistics Venture (“USLV”) made contributions of $136$3 million for the pay downsettlement of secured mortgage debtnet investment hedges in 2017.
Noncontrolling interests distributions.We distributed $132 million2023 and $301 million to various noncontrolling interests in 2017 and 2016,2022, respectively. Distributions in 2017 included $28 million related to proceeds from dispositions of real estate. Distributions in 2016 included $199 million related to proceeds from dispositions of real estate, primarily to our partner in USLV. Included in these amounts in both 2017 and 2016 were $28 million of distributions to common limited partnership unitholders of Prologis, L.P.
Purchase of noncontrolling interests. We paid $710 million to acquire our partner’s interest in NAIF and $80 million to acquire our partner’s interest in the Brazil Fund in 2017.
|
Proceeds from issuance of debt.In 2017, we issued $1.5 billion of term loans, £500 million ($645 million) of senior notes and $148 million of secured mortgage debt and used the net proceeds to repurchase and extinguish senior notes and secured mortgage debt and for general corporate purposes. In 2016, we issued $638 million of term loans and $374 million of secured mortgage debt and used the net proceeds for general corporate purposes. See Note 510 to the Consolidated Financial Statements for more detailfurther information on debt.
Off-Balance Sheet ArrangementsFinancing Activities
Cash provided by and used in financing activities is principally driven by proceeds from and payments on credit facilities and other debt, along with dividends paid on common and preferred stock and noncontrolling interest contributions and distributions.
Our repurchase of and payments on debt and proceeds from the issuance of debt consisted of the following activity for the three months ended March 31 (in millions):
|
| 2023 |
|
| 2022 |
| ||
Repurchase of and payments on debt (including extinguishment costs) |
|
|
|
|
|
| ||
Regularly scheduled debt principal payments and payments at maturity |
| $ | 2 |
|
| $ | 174 |
|
Secured mortgage debt |
|
| - |
|
|
| 159 |
|
Senior notes |
|
| 89 |
|
|
| - |
|
Total |
| $ | 91 |
|
| $ | 333 |
|
|
|
|
|
|
|
| ||
Proceeds from the issuance of debt |
|
|
|
|
|
| ||
Secured mortgage debt |
| $ | 7 |
|
| $ | - |
|
Senior notes |
|
| 2,538 |
|
|
| 1,841 |
|
Total |
| $ | 2,545 |
|
| $ | 1,841 |
|
44
Unconsolidated Co-Investment Venture Debt
We had investments in and advances to our unconsolidated co-investment ventures of $8.1 billion at September 30, 2017, of $5.1 billion.March 31, 2023. These ventures had total third-party debt of $7.9$13.6 billion at September 30, 2017.March 31, 2023with a weighted average remaining maturity of 7 years and weighted average interest rate of 2.9%. The weighted average loan-to-value ratio for all unconsolidated co-investment ventures was 26.2% at March 31, 2023 based on gross book value. Loan-to-value, a non-GAAP measure, was calculated as the percentage of total third-party debt to the gross book value of real estate for each venture and weighted based on the cumulative gross book value of all unconsolidated co-investment ventures.
At September 30, 2017,March 31, 2023, we did not guarantee any third-party debt of the unconsolidated co-investment ventures. In our role as the manager or sponsor, we work with the ventures to refinance their maturing debt. There can be no assurance that the ventures will be able to refinance any maturing indebtedness on terms as favorable as the maturing debt, or at all. If the ventures are unable to refinance the maturing indebtedness with newly issued debt, they may be able to obtain funds by voluntary capital contributions from us
Dividend and our partners or by selling assets. Certain of our ventures also have credit facilities, or unencumbered properties, both of which may be used to obtain funds.Distribution Requirements
Contractual Obligations
Distribution and Dividend Requirements
Our dividend policy on our common stock is to distribute a percentage of our cash flow to ensure that we will meet the dividend requirements of the Internal Revenue Code,IRC, relative to maintaining our REIT status, while still allowing us to retain cash to meet other needs such asfund our capital improvementsdeployment and other investment activities.
Under the IRC, REITs may be subject to certain federal income and excise taxes on undistributed taxable income.
We paid aquarterly cash dividenddividends of $0.44$0.87 and $0.79 per common share in the first three quartersquarter of 2017.2023 and 2022, respectively. Our future common stock dividends, if and as declared, may vary and will be determined by the board of directors (the “Board”)Board based upon the circumstances prevailing at the time, including our financial condition, operating results and REIT distribution requirements, and may be adjusted at the discretion of the Board during the year.
We make distributions on the common limited partnership units outstanding at the same per unit amount as our common stock dividend. The Class A Units in the OP are entitled to a quarterly distribution equal to $0.64665 per unit so long as the common units receive a quarterly distribution of at least $0.40 per unit. We paid a quarterly cash distribution of $0.64665 per Class A Unit in the first quarter of 2023 and 2022.
At September 30, 2017, we had one series ofMarch 31, 2023, our Series Q preferred stock outstanding, the series Q. Thehad an annual dividend rate isof 8.54% per share and the dividends are payable quarterly in arrears.
Pursuant to the terms of our preferred stock, we are restricted from declaring or paying any dividend with respect to our common stock unless and until all cumulative dividends with respect to the preferred stock have been paid and sufficient funds have been set aside for dividends that have been declared for the relevant dividend period with respect to the preferred stock.
Other Commitments
On a continuingan ongoing basis, we are engaged in various stages of negotiations for the acquisition or disposition of individual properties or portfolios of properties.
NEW ACCOUNTING PRONOUNCEMENTS
See Note 1 to the Consolidated Financial Statements.
FUNDS FROM OPERATIONS ATTRIBUTABLE TO COMMON STOCKHOLDERS/UNITHOLDERS (“FFO”)
FFO is a non-GAAP financial measure that is commonly used in the real estate industry. The most directly comparable GAAP measure to FFO is net earnings.
The National Association of Real Estate Investment Trusts (“NAREIT”) defines FFO as earnings computed under GAAP to exclude historical cost depreciation and gains and losses from the sales net of any related tax, along with impairment charges, of previously depreciated properties. We also exclude the gains on revaluation of equity investments upon acquisition of a controlling interest and the gain recognized from a partial sale of our investment, as these are similar to gains from the sales of previously depreciated properties. We exclude similar adjustments from our unconsolidated entities and the third parties’ share of our consolidated co-investment ventures.
Our FFO measures begin with NAREIT’s definition and we make certain adjustments to reflect our business and the way that management plans and executes our business strategy. While not infrequent or unusual, the additional items we adjust for in calculating FFO, as modified by Prologis and Core FFO, both as defined below, are subject to significant fluctuations from period to period. Although these items may have a material impact on our operations and are reflected in our financial statements, the removal of the effects of these items allows us to better understand the core operating performance of our properties over the long term. These
45
items have both positive and negative short-term effects on our results of operations in inconsistent and unpredictable directions that are not relevant to our long-term outlook.
We calculate our FFO measures, as defined below, based on our proportionate ownership share of both our unconsolidated and consolidated ventures. We reflect our share of our FFO measures for unconsolidated ventures by applying our average ownership percentage for the period to the applicable reconciling items on an entity by entity basis. We reflect our share for consolidated ventures in which we do not own 100% of the equity by adjusting our FFO measures to remove the noncontrolling interests share of the applicable reconciling items based on our average ownership percentage for the applicable periods.
These FFO measures are used by management as supplemental financial measures of operating performance and we believe that it is important that stockholders, potential investors and financial analysts understand the measures management uses. We do not use our FFO measures as, nor should they be considered to be, alternatives to net earnings computed under GAAP, as indicators of our operating performance, as alternatives to cash from operating activities computed under GAAP or as indicators of our ability to fund our cash needs.
We analyze our operating performance primarilyprincipally by the rental revenuesrevenue of our real estate and the revenues from our strategic capital business, net of operating, administrative and financing expenses. This income stream is not directly impacted by fluctuations in the market value of our investments in real estate or debt securities.
FFO, as modified by Prologis attributable to common stockholders and stockholders/unitholders (“FFO, as modified by Prologis”)
To arrive at FFO, as modified by Prologis, we adjust the NAREIT defined FFO measure to exclude the impact of foreign currency related items and deferred tax, specifically:
deferred income tax benefits and deferred income tax expenses recognized by our subsidiaries;
current income tax expense related to acquired tax liabilities that were recorded as deferred tax liabilities in an acquisition, to the extent the expense is offset with a deferred income tax benefit in earnings that is excluded from our defined FFO measure;
andunhedged foreign currency exchange gains and losses resulting from (i) debt transactions between us and our foreign consolidated subsidiaries and our foreign unconsolidated entities;
foreign currency exchange gains and losses from the remeasurement (based on current foreign currency exchange rates) of certainentities, (ii) third-party debt ofthat is used to hedge our investment in foreign consolidatedentities, (iii) derivative financial instruments related to any such debt transactions, and unconsolidated entities; and
(iv) mark-to-market adjustments associated with other derivative financial instruments.
We use FFO, as modified by Prologis, so that management, analysts and investors are able to evaluate our performance against other REITs that do not have similar operations or operations in jurisdictions outside the U.S.
Core FFO attributable to common stockholders and stockholders/unitholders (“Core FFO”)
In addition to FFO, as modified by Prologis, we also use Core FFO. To arrive at Core FFO, we adjust FFO, as modified by Prologis, to exclude the following recurring and nonrecurring items that we recognizedrecognize directly in FFO, as modified by Prologis:
gains or losses from the disposition of land and development properties that were developed with the intent to contribute or sell;
income tax expense related to the sale of investments in real estate and third-party acquisition costs related to the acquisition of real estate;
impairment charges recognized related to our investments in real estate generally as a result of our change in intent to contribute or sell these properties;
gains or losses from the early extinguishment of debt and redemption and repurchase of preferred stock; and
expenses related to natural disasters.
We use Core FFO, including by segment and region, to: (i) assess our operating performance as compared to other real estate companies; (ii) evaluate our performance and the performance of our properties in comparison with expected results and results of previous periods; (iii) evaluate the performance of our management; (iv) budget and forecast future results to assist in the allocation of resources; (v) provide guidance to the financial markets to understand our expected operating performance; and (v)(vi) evaluate how a specific potential investment will impact our future results.
Limitations on the use of our FFO measures
While we believe our modified FFO measures are important supplemental measures, neither NAREIT’s nor our measures of FFO should be used alone because they exclude significant economic components of net earnings computed under GAAP and are, therefore, limited as an analytical tool. Accordingly, these are only a few of the many measures we use when analyzing our business. Some of the limitations are:
46
The current income tax expenses and acquisition costs that are excluded from our modified FFO measures represent the taxes and transaction costs that are payable.
Depreciation and amortization of real estate assets are economic costs that are excluded from FFO. FFO is limited, as it does not reflect the cash requirements that may be necessary for future replacements of the real estate assets. Furthermore, the amortization of capital expenditures and leasing costs necessary to maintain the operating performance of logistics facilities are not reflected in FFO.
Gains or losses from non-development property and dispositions orand impairment charges related to expected dispositions represent changes in value of the properties. By excluding these gains and losses, FFO does not capture realized changes in the value of disposed properties arising from changes in market conditions.
The deferred income tax benefits and expenses that are excluded from our modified FFO measures result from the creation of a deferred income tax asset or liability that may have to be settled at some future point. Our modified FFO measures do not currently reflect any income or expense that may result from such settlement.
The foreign currency exchange gains and losses that are excluded from our modified FFO measures are generally recognized based on movements in foreign currency exchange rates through a specific point in time. The ultimate settlement of our foreign currency-denominated net assets is indefinite as to timing and amount. Our FFO measures are limited in that they do not reflect the current period changes in these net assets that result from periodic foreign currency exchange rate movements.
The gains and losses on extinguishment of debt or preferred stock that we exclude from our Core FFO, may provide a benefit or cost to us as we may be settling our debtobligation at less or more than our future obligation.
The natural disaster expenses that we exclude from Core FFO are costs that we have incurred.
We compensate for these limitations by using our FFO measures only in conjunction with net earnings computed under GAAP when making our decisions. This information should be read with our complete Consolidated Financial Statements prepared under GAAP. To assist investors in compensating for these limitations, we reconcile our modified FFO measures to our net earnings computed under GAAP for ninethree months ended September 30March 31 as follows (in millions).:
|
| 2017 |
|
| 2016 |
| ||
FFO |
|
|
|
|
|
|
|
|
Reconciliation of net earnings to FFO measures: |
|
|
|
|
|
|
|
|
Net earnings attributable to common stockholders |
| $ | 1,346 |
|
| $ | 763 |
|
|
|
|
|
|
|
|
|
|
Add (deduct) NAREIT defined adjustments: |
|
|
|
|
|
|
|
|
Real estate related depreciation and amortization |
|
| 633 |
|
|
| 682 |
|
Gains on dispositions of investments in real estate properties and revaluation of equity investments upon acquisition of a controlling interest, net |
|
| (723 | ) |
|
| (302 | ) |
Reconciling items related to noncontrolling interests |
|
| (41 | ) |
|
| (87 | ) |
Our share of reconciling items included in earnings from unconsolidated entities |
|
| 108 |
|
|
| 117 |
|
NAREIT defined FFO |
|
| 1,323 |
|
|
| 1,173 |
|
|
|
|
|
|
|
|
|
|
Add (deduct) our modified adjustments: |
|
|
|
|
|
|
|
|
Unrealized foreign currency and derivative losses, net |
|
| 56 |
|
|
| 22 |
|
Deferred income tax benefit, net |
|
| - |
|
|
| (2 | ) |
Our share of reconciling items included in earnings from unconsolidated entities |
|
| (3 | ) |
|
| 1 |
|
FFO, as modified by Prologis |
|
| 1,376 |
|
|
| 1,194 |
|
|
|
|
|
|
|
|
|
|
Adjustments to arrive at Core FFO: |
|
|
|
|
|
|
|
|
Gains on dispositions of development properties and land, net |
|
| (236 | ) |
|
| (160 | ) |
Current income tax expense on dispositions |
|
| 12 |
|
|
| 15 |
|
Acquisition expenses |
|
| - |
|
|
| 2 |
|
Losses (gains) on early extinguishment of debt, net |
|
| 31 |
|
|
| (2 | ) |
Reconciling items related to noncontrolling interests |
|
| - |
|
|
| 4 |
|
Our share of reconciling items included in earnings from unconsolidated entities |
|
| (5 | ) |
|
| 3 |
|
Core FFO |
| $ | 1,178 |
|
| $ | 1,056 |
|
|
| 2023 |
|
| 2022 |
| ||
Reconciliation of net earnings attributable to common stockholders to FFO measures: |
|
|
|
|
|
| ||
Net earnings attributable to common stockholders |
| $ | 463 |
|
| $ | 1,149 |
|
|
|
|
|
|
|
| ||
Add (deduct) NAREIT defined adjustments: |
|
|
|
|
|
| ||
Real estate related depreciation and amortization |
|
| 590 |
|
|
| 385 |
|
Gains on other dispositions of investments in real estate, net of taxes |
|
| (3 | ) |
|
| (589 | ) |
Reconciling items related to noncontrolling interests |
|
| (18 | ) |
|
| 17 |
|
Our share of reconciling items included in earnings related to unconsolidated entities |
|
| 115 |
|
|
| 82 |
|
NAREIT defined FFO attributable to common stockholders/unitholders |
|
| 1,147 |
|
|
| 1,044 |
|
|
|
|
|
|
|
| ||
Add (deduct) our modified adjustments: |
|
|
|
|
|
| ||
Unrealized foreign currency and derivative losses (gains), net |
|
| 8 |
|
|
| (33 | ) |
Deferred income tax expense |
|
| 4 |
|
|
| 7 |
|
FFO, as modified by Prologis attributable to common stockholders/unitholders |
|
| 1,159 |
|
|
| 1,018 |
|
|
|
|
|
|
|
| ||
Adjustments to arrive at Core FFO: |
|
|
|
|
|
| ||
Gains on dispositions of development properties and land, net |
|
| - |
|
|
| (210 | ) |
Current income tax expense on dispositions |
|
| - |
|
|
| 4 |
|
Losses (gains) on early extinguishment of debt, net |
|
| (3 | ) |
|
| 18 |
|
Reconciling items related to noncontrolling interests |
|
| - |
|
|
| 4 |
|
Our share of reconciling items included in earnings related to unconsolidated entities |
|
| 1 |
|
|
| - |
|
Core FFO attributable to common stockholders/unitholders |
| $ | 1,157 |
|
| $ | 834 |
|
47
ITEM 3. Quantitative and Qualitative Disclosures About Market Risk
We are exposed to the impact of foreign-exchange relatedforeign exchange-related variability and earnings volatility on our foreign investments and interest rate changes. See our risk factors in Part 1, Item 1A. Risk Factors in our Annual Report on Form 10-K for the fiscal year ended December 31, 2016.2022. See also Note 9 to10 in the Consolidated Financial Statements in Item 1 for more information about our foreign operations and derivative financial instruments.
We monitor our market risk exposures using a sensitivity analysis. Our sensitivity analysis estimates the exposure to market risk sensitive instruments assuming a hypothetical 10% adverse change in foreign currency exchange rates or interest rates at September 30, 2017.March 31, 2023. The results of the sensitivity analysis are summarized in the following sections. The sensitivity analysis is of limited predictive value. As a result, revenues and expenses, as well as our ultimate realized gains or losses with respect to interestforeign currency exchange rate and foreign currency exchangeinterest rate fluctuations will depend on the exposures that arise during a future period, hedging strategies at the time and the prevailing interest and foreign currency exchange rates and interest rates.
Foreign Currency Risk
We are exposed to foreign exchange-relatedcurrency exchange variability ofrelated to investments in and earnings from our foreign investments. Foreign currency market risk is the possibility that our financial results of operations or financial position could be better or worse than planned because of changes in foreign currency exchange rates. We primarily hedge our foreign currency risk by borrowing in the currencies in which we invest thereby providing a natural hedge. Additionally, we hedge our foreign currency risk by entering into derivative financial instruments that we designate as net investment hedges, as these amounts offset the translation adjustments on the underlying net assets of our foreign investments. At September 30, 2017,March 31, 2023, after consideration of our ability to borrow in the foreign currencies in which we invest and also derivative and nonderivative financial instruments as discussed in Note 10 to the Consolidated Financial Statements, we had net equity of approximately $1.7 billion, or 8.1% of totalminimal net equity denominated in a currency other than the U.S. dollar, after considerationdollar.
For the three months ended March 31, 2023, $128 million or 7% of our derivative and nonderivative financial instruments. Based on our sensitivity analysis, a 10% adverse changetotal consolidated revenue was denominated in exchange rates would cause a reduction of $172 million to our net equity.
At September 30, 2017, we hadforeign currencies. We enter into other foreign currency contracts, such as forwards, to reduce fluctuations in foreign currency associated with the translation of the future earnings of our international subsidiaries. We have forward contracts whichthat were not designated and qualify as net investment hedges, with an aggregate notional amount of $99 million to hedge a portion of our investmentsdenominated principally in Canada. On the basis of our sensitivity analysis, a weakening of the U.S. dollar against the Canadian dollar by 10% would result in a $10 million negative change in our cash flows on settlement. In addition, we also have British pound sterling, Canadian dollar, euro and Japanese yen forward and option contracts, which were not designated as hedges, and have an aggregate notional amount of $492 million$1.6 billion to mitigate risk associated with the translation of the projected financial resultsfuture earnings of our subsidiaries denominated in Canada, Europethese currencies. The gain or loss on settlement of these contracts is included in our earnings and Japan. Aoffsets the lower or higher translation of earnings from our investments denominated in currencies other than the U.S. dollar. Although the impact to net earnings is mitigated through higher translated U.S. dollar earnings from these currencies, a weakening of the U.S. dollar against these currencies by 10% wouldcould result in a $49$163 million negative change in our net income and cash flowspayment on settlement.settlement of these contracts.
We are also are exposed to the impact of interest rate changes on future earnings and cash flows. At September 30, 2017,To mitigate that risk, we had $1.7 billion of variablegenerally borrow with fixed rate debt outstanding, of which $1.6 billion was outstanding on our term loans and $50 million was outstanding on secured mortgage debt. At September 30, 2017, we had interest rate swap agreementsmay use derivative instruments to fix the interest rate on $299our variable rate debt. At March 31, 2023, $23.7 billion of our debt bore interest at fixed rates and therefore the fair value of these instruments was affected by changes in market interest rates. At March 31, 2023, $2.0 billion of our debt bore interest at variable rates. The following table summarizes the future repayment of debt and scheduled principal payments at March 31, 2023 (dollars in millions):
| 2023 |
|
| 2024 |
|
| 2025 |
|
| 2026 |
|
| Thereafter |
|
| Total |
|
| Fair Value |
| ||||||||
Fixed rate debt (1) |
| $ | 28 |
|
| $ | 258 |
|
| $ | 175 |
|
| $ | 1,313 |
|
| $ | 21,950 |
|
| $ | 23,724 |
|
| $ | 19,992 |
|
Weighted average interest rate (2) |
|
| 3.9 | % |
|
| 1.3 | % |
|
| 3.2 | % |
|
| 3.3 | % |
|
| 2.5 | % |
|
| 2.6 | % |
|
|
| |
|
|
|
|
|
|
|
|
|
|
|
|
|
|
|
|
|
|
|
|
|
| |||||||
Variable rate debt |
|
|
|
|
|
|
|
|
|
|
|
|
|
|
|
|
|
|
|
|
| |||||||
Credit facilities |
| $ | - |
|
| $ | 99 |
|
| $ | - |
|
| $ | 114 |
|
| $ | - |
|
| $ | 213 |
|
| $ | 213 |
|
Secured mortgage debt |
|
| 4 |
|
|
| - |
|
|
| 17 |
|
|
| 64 |
|
|
| - |
|
|
| 85 |
|
|
| 84 |
|
Senior notes |
|
| - |
|
|
| 163 |
|
|
| - |
|
|
| - |
|
|
| - |
|
|
| 163 |
|
|
| 163 |
|
Term loans |
|
| - |
|
|
| - |
|
|
| 721 |
|
|
| 638 |
|
|
| 188 |
|
|
| 1,547 |
|
|
| 1,544 |
|
Total variable rate debt |
| $ | 4 |
|
| $ | 262 |
|
| $ | 738 |
|
| $ | 816 |
|
| $ | 188 |
|
| $ | 2,008 |
|
| $ | 2,004 |
|
48
At March 31, 2023, the weighted average effective interest rate on our variable rate debt was 2.9% which was calculated using an average balance on our credit facilities.facilities throughout the year and our other variable rate debt balances at March 31, 2023. Changes in interest rates can cause interest expense to fluctuate on our variable rate debt. On the basis of our sensitivity analysis, a 10% adverse changeincrease in interest rates based on our average outstanding variable rate debt balances not subject to interest rate swap agreements during the period would result in additional annual interest expense of $1$6 million for the quarter ended March 31, 2023, which equates to a change in interest rates of 929 basis points.points on our average outstanding variable rate debt balances and 2 basis points on our average total debt portfolio balances.
ITEM 4. Controls and Procedures
Controls and Procedures (The Parent)(Prologis, Inc.)
The ParentPrologis, Inc. carried out an evaluation under the supervision and with the participation of management, including the chief executive officerChief Executive Officer and chief financial officer,Chief Financial Officer, of the effectiveness of the disclosure controls and procedures (as defined in Rule 13a-14(c)) under the Securities and Exchange Act of 1934 (the “Exchange Act”) at September 30, 2017. On the basis ofMarch 31, 2023. Based on this evaluation, the chief executive officerChief Executive Officer and the chief financial officerChief Financial Officer have concluded that the disclosure controls and procedures are effective to ensure that the information required to be disclosed by us in reports that are filedwe file or submittedsubmit under the Exchange Act areis recorded, processed, summarized and reported within the time periods specified in the Securities and Exchange Commission (“SEC”)SEC rules and forms.
NoChanges in Internal Control over Financial Reporting
There have not been any changes in thePrologis, Inc.’s internal controlscontrol over financial reporting (as defined in Rule 13a-15(f) under the Exchange Act) that occurred during the most recent fiscal quarter ended March 31, 2023 that have materially affected, or are reasonably likely to materially affect, Prologis, Inc.’s internal control over financial reporting.
Controls and Procedures (The Operating Partnership)(Prologis, L.P.)
The Operating PartnershipPrologis, L.P. carried out an evaluation under the supervision and with the participation of management, including the chief executive officerChief Executive Officer and chief financial officer,Chief Financial Officer, of the effectiveness of the disclosure controls and procedures (as defined in Rule 13a-14(c)) under the Exchange Act at September 30, 2017. On the basis ofMarch 31, 2023. Based on this evaluation, the chief executive officerChief Executive Officer and the chief financial officerChief Financial Officer have concluded that the disclosure controls and procedures are effective to ensure that the information required to be disclosed by us in reports that are filedwe file or submittedsubmit under the Exchange Act areis recorded, processed, summarized and reported within the time periods specified in the SEC rules and forms.
NoChanges in Internal Control over Financial Reporting
There have not been any changes in thePrologis, L.P.’s internal controlscontrol over financial reporting (as defined in Rule 13a-15(f) under the Exchange Act) that occurred during the most recent fiscal quarter ended March 31, 2023 that have materially affected, or are reasonably likely to materially affect, Prologis, L.P.’s internal control over financial reporting.
Prologis and our unconsolidated investeesentities are party to a variety of legal proceedings arising in the ordinary course of business. With respect to any such matters to which we are currently a party, the ultimate disposition of any such matters will not result in a material adverse effect on our business, financial position or results of operations.
At September 30, 2017,March 31, 2023, no material changes had occurred in our risk factors as discussed in Item 1A1A. in our Annual Report on Form 10-K for the fiscal year ended December 31, 2016.2022.
ITEM 2. Unregistered Sales of Equity Securities and Use of Proceeds
During the quarterquarterly period ended September 30, 2017,March 31, 2023, we issued an aggregate of 0.6less than 0.1 million shares of common stock of Prologis, Inc. in connection with the Parent upon redemption of common units of the Operating Partnership. The shares of common stock were issuedPrologis, L.P. in reliance on the exemption from registration requirements of the Securities Act of 1933, as amended, afforded by Section 4(a)(2) thereof.
ITEM 3. Defaults Upon Senior Securities
None.
49
ITEM 4. Mine Safety Disclosures
Not Applicable.
None.On April 27, 2023, the Parent amended the partnership agreement of the Operating Partnership to clarify the allocation and treatment of certain entity level taxes that are attributable to specific limited partners or that relate to tax elections made by specific limited partners.
The exhibits required by this item are set forth on the Exhibit Index attached hereto.
INDEX TO EXHIBITS
Certain of the following documents are filed herewith. Certain other of the following documents that have been previously filed with the Securities and Exchange Commission (“SEC”) and, pursuant to Rule 12-b-32, are incorporated herein by reference.
| |
| |
| |
4.3 | |
4.4 | |
4.5 | |
4.6 | |
4.7 | |
4.8 | |
10.1 | |
10.2 | |
15.1† | |
15.2† | |
| |
31.1† | |
31.2† | |
31.3† | |
31.4† | |
32.1† | |
32.2† | |
101.INS† | Inline XBRL Instance Document – the instance document does not appear in the Interactive Data File because its XBRL tags are embedded within the Inline XBRL Document. |
101.SCH† | Inline XBRL Taxonomy Extension Schema |
101.CAL† | Inline XBRL Taxonomy Extension Calculation Linkbase |
51
101.DEF† | Inline XBRL Taxonomy Extension Definition Linkbase |
101.LAB† | Inline XBRL Taxonomy Extension Label Linkbase |
101.PRE† | Inline XBRL Taxonomy Extension Presentation Linkbase |
| Cover Page Interactive Data File (formatted as Inline XBRL and contained in Exhibit 101). |
† | Filed herewith |
SIGNATURES
52
SIGNATURES
Pursuant to the requirements of Section 13 or 15(d) of the Exchange Act, the registrants have duly caused this report to be signed on their behalf by the undersigned, thereunto duly authorized.
PROLOGIS, INC. | ||
| By: | /s/ |
| Timothy D. Arndt | |
Chief Financial Officer | ||
| By: | /s/ Lori A. Palazzolo |
Lori A. Palazzolo | ||
Managing Director and Chief Accounting Officer | ||
PROLOGIS, L.P. | ||
| ||
By: | Prologis, Inc., its general partner | |
| By: | /s/ |
| Timothy D. Arndt | |
Chief Financial Officer | ||
| By: | /s/ Lori A. Palazzolo |
Lori A. Palazzolo | ||
Managing Director and Chief Accounting Officer | ||
Date: October 27, 2017April 28, 2023
53
53