In January 2017, the FASB issued ASU 2017-04, Simplifying the Test for Goodwill Impairment (Topic 350), which eliminates Step 2 from the goodwill impairment test. ASU 2017-04 is effective for annual and interim periods in fiscal years beginning after December 15, 2019. Early adoption is permitted for interim or annual goodwill impairment tests performed after January 1, 2017 and should be applied prospectively. The Company early adopted this standard as of January 1, 2017, for use in its goodwill impairment testing.
2.3. Property, Plant and Equipment, net
Property, plant and equipment consist of (in millions):
|
| Estimated |
| March 31, 2022 |
|
| December 31, 2021 |
| ||
Information technology assets |
| 1-7 Years |
| $ | 48 |
|
| $ | 48 |
|
Operating equipment (1) |
| 2-15 Years |
|
| 126 |
|
|
| 129 |
|
Buildings and land (2) |
| 5-35 Years |
|
| 92 |
|
|
| 91 |
|
Construction in progress |
|
|
|
| 3 |
|
|
| 3 |
|
Total property, plant and equipment |
|
|
|
| 269 |
|
|
| 271 |
|
Less: accumulated depreciation |
|
|
|
| (163 | ) |
|
| (160 | ) |
Property, plant and equipment, net |
|
|
| $ | 106 |
|
| $ | 111 |
|
|
| Estimated Useful Lives |
| September 30, 2017 |
|
| December 31, 2016 |
| ||
Information technology assets |
| 1-7 Years |
| $ | 48 |
|
| $ | 47 |
|
Operating equipment |
| 2-15 Years |
|
| 93 |
|
|
| 93 |
|
Buildings and land (1)(2) |
| 5-35 Years |
|
| 98 |
|
|
| 95 |
|
Construction in progress |
|
|
|
| 1 |
|
|
| 1 |
|
Total property, plant and equipment |
|
|
|
| 240 |
|
|
| 236 |
|
Less: accumulated depreciation |
|
|
|
| (114 | ) |
|
| (93 | ) |
Property, plant and equipment, net |
|
|
| $ | 126 |
|
| $ | 143 |
|
|
|
|
|
3.4. Accrued Liabilities
Accrued liabilities consist of (in millions)millions):
|
| March 31, 2022 |
|
| December 31, 2021 |
| ||
Compensation and other related expenses |
| $ | 28 |
|
| $ | 35 |
|
Contract liabilities |
|
| 32 |
|
|
| 27 |
|
Taxes (non-income) |
|
| 10 |
|
|
| 12 |
|
Current portion of operating lease liabilities |
|
| 15 |
|
|
| 15 |
|
Other |
|
| 24 |
|
|
| 23 |
|
Total |
| $ | 109 |
|
| $ | 112 |
|
5. Debt
|
| September 30, 2017 |
|
| December 31, 2016 |
| ||
Compensation and other related expenses |
| $ | 36 |
|
| $ | 25 |
|
Customer credits and prepayments |
|
| 27 |
|
|
| 27 |
|
Taxes (non-income) |
|
| 17 |
|
|
| 17 |
|
Other |
|
| 31 |
|
|
| 31 |
|
Total |
| $ | 111 |
|
| $ | 100 |
|
4. Debt
On January 20, 2016, December 14, 2021, the Company entered into an amendment (the “Amendment”) to its existing senior secured revolving credit facility datedwith a syndicate of lenders with Wells Fargo Bank, National Association, serving as the administrative agent (as amended, the “Credit Facility”).
Effective with the amendment, the Credit Facility provides for a $500 million global revolving credit facility, of which up to $50 million is available for the Company’s Canadian subsidiaries, and the maturity is extended to December 14, 2026. The Company has the right, subject to certain conditions, to increase the aggregate principal amount of commitments under the credit facility by $250 million. The Credit Facility also provides a letter of credit sub-facility of $25 million. The obligations under the Credit Facility are secured by substantially all the assets of the Company and its subsidiaries. The Credit Facility contains customary covenants, representations and warranties and events of default. The Company will be required to maintain a fixed charge coverage ratio of at least 1.00:1.00 as of April 18, 2014 (the “Credit Agreement”). The Amendment, among other things, (i) suspends, until the Company elects otherwise,end of each fiscal quarter if excess availability under the Credit Agreement’s minimumFacility falls below the greater of 10% of the borrowing base or $40 million.
Borrowings under the Credit Facility will bear an interest rate at the Company’s option, at (i) the base rate plus an applicable margin based on the Company’s fixed charge coverage ratio effective as(and if applicable, the Company’s leverage ratio); or (ii) the greater of December 30, 2015, (ii) adds a minimum assetLIBOR for the applicable interest period and zero, plus an applicable margin based on the Company’s fixed charge coverage ratio (and if applicable, the Company’s leverage ratio). As part of the amendment, when the fixed charge coverage ratio (as defined in the Credit Agreement), which requiresFacility) is less than or equal to 1.50 to 1.00, the applicable rate for borrowings of base rate loans and Eurocurrency rate loans decreases by 0.250%. The Credit Facility includes a commitment fee on the unused portion of commitments that ranges from 25 to 37.5 basis points. Commitment fees incurred during the ratioperiod were included in other income (expense) in the consolidated statements of operations.
Availability under the valueCredit Facility is determined by a borrowing base comprised of the Company’s eligible assets (value of qualified cash,receivables, eligible inventory and eligible accounts receivable) to the amount of its outstanding obligations under the Credit Agreement is no less than 1.50 to 1.00, (iii) reduces the maximum capitalization ratio (as definedcertain pledged deposits in the Credit Agreement) from 50% to 45%, (iv) increases the applicable interest margin on current borrowings by 75 basis pointsU.S and the current commitment fee by 5 basis points and (v) reduces sub-facilities for standby letters of credit and swingline loans to $40 million and $25 million, respectively. In connection with the Amendment, the Company also entered into a Security Agreement dated as of January 20, 2016 (the “Security Agreement”) pursuant to which it granted the lenders under the Credit Agreement customary security interests in substantially all of the Company’s U.S. assets and in approximately 65% of the equity interests of the Company’s first-tier foreign subsidiaries.
Canada. As of September 30, 2017, March 31, 2022, the Company had borrowed $163 million0 borrowings against its senior secured revolving credit facility,the Credit Facility and had $441approximately $436 million in availability (as defined in the Credit Agreement)Facility) resulting in the excess availability (as defined in the Credit Agreement)Facility) of 72%99%, subject to certain restrictions. Borrowings that result in the excess availability dropping below 25% are conditioned upon compliance with or waiver of a minimum fixed charge ratio (as defined in the Credit Agreement).limitations. The Company wasis not obligated to pay back the borrowingrepay borrowings against the senior secured revolving credit facilitycurrent Credit Facility until the expiration date of April 18, 2019, as such the outstanding borrowing is classified as long term. As of September 30, 2017, the Company was in compliance with all financialdate.
9
covenants in the credit facility. Total commitments under the amended credit facility remain at $750 million and the amended credit facility includes a $250 million accordion feature, subject to certain conditions.
At September 30, 2017, theThe Company issued $5$5 million in letters of credit under its senior revolving credit facilitythe Credit Facility primarily for casualty insurance expiring in July 2018.June 2023.
10
5.6. Accumulated Other Comprehensive Income (Loss)
The components of accumulated other comprehensive income (loss) are as follows (in millions):
|
| Foreign |
| |
|
| Currency |
| |
|
| Translation |
| |
|
| Adjustments |
| |
Balance at December 31, 2016 |
| $ | (142 | ) |
Other comprehensive income |
|
| 38 |
|
Balance at September 30, 2017 |
| $ | (104 | ) |
Foreign Currency | ||||
Translation Adjustments | ||||
Balance at December 31, 2021 | $ | (147 | ) | |
Other comprehensive gain | 2 | |||
Balance at March 31, 2022 | $ | (145 | ) | |
The Company’s reporting currency is the U.S. dollar. A majority of the Company’s international entities in which there is a substantial investment have the local currency as their functional currency. As a result, foreign currency translation adjustments resulting from the process of translating the entities’ financial statements into the reporting currency are reported in other comprehensive income (loss)or loss in accordance with ASC Topic 830, “Foreign Currency Matters.”
6.7. Business Segments
Operating results by reportable segment are as follows (in millions):
| Three Months Ended March 31, |
| |||||
| 2022 |
|
| 2021 |
| ||
Revenue: |
|
|
|
|
| ||
United States | $ | 334 |
|
| $ | 252 |
|
Canada |
| 82 |
|
|
| 58 |
|
International |
| 57 |
|
|
| 51 |
|
Total revenue | $ | 473 |
|
| $ | 361 |
|
Operating profit (loss): |
|
|
|
|
| ||
United States | $ | 14 |
|
| $ | (13 | ) |
Canada |
| 7 |
|
|
| 4 |
|
International |
| 2 |
|
|
| 1 |
|
Total operating profit (loss) | $ | 23 |
|
| $ | (8 | ) |
| Three Months Ended September 30, |
|
| Nine Months Ended September 30, |
|
| ||||||||||
| 2017 |
|
| 2016 |
|
| 2017 |
|
| 2016 |
|
| ||||
Revenue: |
|
|
|
|
|
|
|
|
|
|
|
|
|
|
|
|
United States | $ | 506 |
|
| $ | 372 |
|
| $ | 1,426 |
|
| $ | 1,066 |
|
|
Canada |
| 96 |
|
|
| 67 |
|
|
| 271 |
|
|
| 185 |
|
|
International |
| 95 |
|
|
| 81 |
|
|
| 282 |
|
|
| 318 |
|
|
Total revenue | $ | 697 |
|
| $ | 520 |
|
| $ | 1,979 |
|
| $ | 1,569 |
|
|
Operating profit (loss): |
|
|
|
|
|
|
|
|
|
|
|
|
|
|
|
|
United States | $ | (10 | ) |
| $ | (46 | ) |
| $ | (52 | ) |
| $ | (149 | ) |
|
Canada |
| 4 |
|
|
| (2 | ) |
|
| 9 |
|
|
| (16 | ) |
|
International |
| — |
|
|
| (5 | ) |
|
| 2 |
|
|
| (10 | ) |
|
Total operating loss | $ | (6 | ) |
| $ | (53 | ) |
| $ | (41 | ) |
| $ | (175 | ) |
|
Operating profit (loss) % of revenue: |
|
|
|
|
|
|
|
|
|
|
|
|
|
|
|
|
United States |
| (2.0 | %) |
|
| (12.4 | %) |
|
| (3.6 | %) |
|
| (14.0 | %) |
|
Canada |
| 4.2 | % |
|
| (3.0 | %) |
|
| 3.3 | % |
|
| (8.6 | %) |
|
International |
| 0.0 | % |
|
| (6.2 | %) |
|
| 0.7 | % |
|
| (3.1 | %) |
|
Total operating loss % |
| (0.9 | %) |
|
| (10.2 | %) |
|
| (2.1 | %) |
|
| (11.2 | %) |
|
7.8. Income Taxes
On May 1, 2014, the National Oilwell Varco, Inc. (“NOV”) Board of Directors approved the Spin-Off (the “Spin-Off” or “Separation”) of its distribution business into an independent, publicly traded company named NOW Inc. In connection with the Separation, the Company and NOV entered into a Tax Matters Agreement, dated as of May 29, 2014 (the “Tax Matters Agreement”). The Tax Matters Agreement sets forth the Company and NOV’s rights and obligations related to the allocation of federal, state, local and foreign taxes for periods before and after the Spin-Off, as well as taxes attributable to the Spin-Off, and related matters such as the filing of tax returns and the conduct of IRS and other audits. Pursuant to the Tax Matters Agreement, NOV has prepared and filed the consolidated federal income tax return, and any other tax returns that include both NOV and the Company for all the liability periods ended on or prior to May 30, 2014. The income tax provision (benefit) for periods prior to the Separation has been computed as if NOW were a stand-alone company. NOV will indemnify and hold harmless the Company for any income tax liability for periods
10
before the Separation date. The Company will prepare and file all tax returns that include solely the Company for all taxable periods ending after that date. Settlements of tax payments between NOV and the Company were generally treated as contributions from or distributions to NOV in periods prior to the Separation date.
The effective tax ratesrate for the three and nine months ended September 30, 2017 were (1.6%) and 0.6%,March 31, 2022, was 9.1% compared to (0.2%(5.5%) and 10.3% for the same periods in 2016. Compared tocorresponding period of 2021. In general, the effective tax rate differs from the U.S. statutory rate the effective tax rate was impacted bydue to recurring items, such as lowerdiffering tax rates on income earned in foreign jurisdictions, that is permanently reinvested, offset by nondeductible expenses, state income taxes and the change in valuation allowance recorded against deferred tax assets. Due toFor the three months ended March 31, 2022, the effective tax rate was primarily driven by the recognition of tax expense from earnings in Canada offset by current year realization of deferred tax assets and corresponding release of valuation allowance in the U.S. The current geopolitical conditions and the COVID-19 pandemic have had an impact on the global supply chain and create continuing uncertainty in our industry and thus our outlook,the Company’s short-term results. Consequently, the Company continuesis continuing to utilizerely on the discrete-period method of recording income taxes on a year-to-date effectivefor calculating its interim period tax rateprovision for the three and nine months ended September 30, 2017.March 31, 2022. The Company will evaluate its use of this method each quarter until such time as a return to the annualized estimated effective tax rate method is deemed appropriate.
During the second quarter of 2016, the Company acquired Power Service and recorded a deferred tax liability of $19 million related to basis differences between U.S. GAAP and U.S. Tax associated with the acquisition and step-up to fair value of certain assets, primarily intangible assets. The step up in basis resulted in higher future taxable temporary differences and a corresponding reduction in the valuation allowance recorded against deferred tax assets in the U.S.
To the extent penalties and interest would be assessed on any underpayment of income tax, such accrued amounts would be classified as a component of income tax provision (benefit) in the financial statements consistent with the Company’s policy.
The Company is subject to taxation in the United States,U.S., various states and foreign jurisdictions. The Company has significant operations in the United StatesU.S. and Canada and to a lesser extent in various other international jurisdictions. Tax years that remain subject to examination by major tax jurisdictions vary by legal entity but are generally open in the U.S. for the tax years ending after 20132017 and outside the U.S. for the tax years ending after 2011. The Company is indemnified for any income tax exposures related to the periods prior to the Separation under the Tax Matters Agreement with NOV.2015.
8. Loss9. Earnings (Loss) Per Share (“EPS”)
For the three and nine months ended September 30, 2017 and 2016, 8,141,971 and 8,038,097, 7,430,510 and 7,264,566, respectively, March 31, 2022, approximately 4 million of potentially dilutive shares were excluded from the computation of diluted lossearnings per share due to their antidilutive effect. For the three months ended March 31, 2021, approximately 6 million of potentially dilutive shares were excluded from the computation of diluted earnings per share due to the Company recognizing a net loss for the period. loss.
11
Basic and diluted lossearnings (loss) per share are as follows (in millions, except share data):
| Three Months Ended September 30, |
|
| Nine Months Ended September 30, |
| |||||||||||||||||
| 2017 |
|
| 2016 |
|
| 2017 |
|
| 2016 |
| Three Months Ended March 31, |
| |||||||||
|
|
|
|
|
|
|
|
|
|
|
|
|
|
|
| 2022 |
|
| 2021 |
| ||
Numerator: |
|
|
|
|
|
|
|
|
|
|
|
|
|
|
|
|
|
|
|
| ||
Net loss attributable to the Company's stockholders | $ | (9 | ) |
| $ | (56 | ) |
| $ | (49 | ) |
| $ | (163 | ) | |||||||
Net income (loss) attributable to the Company | $ | 30 |
|
| $ | (10 | ) | |||||||||||||||
Less: net income attributable to participating securities |
| 0 |
|
|
| 0 |
| |||||||||||||||
Net income (loss) attributable to the Company's stockholders | $ | 30 |
|
| $ | (10 | ) | |||||||||||||||
Denominator: |
|
|
|
|
|
|
|
|
|
|
|
|
|
|
|
|
|
|
|
| ||
Weighted average basic common shares outstanding |
| 107,752,427 |
|
|
| 107,473,952 |
|
|
| 107,695,277 |
|
|
| 107,396,681 |
|
| 110,602,943 |
|
|
| 110,071,365 |
|
Effect of dilutive securities |
| — |
|
|
| — |
|
|
| — |
|
|
| — |
|
| 219,574 |
|
|
| 0 |
|
Weighted average diluted common shares outstanding |
| 107,752,427 |
|
|
| 107,473,952 |
|
|
| 107,695,277 |
|
|
| 107,396,681 |
|
| 110,822,517 |
|
|
| 110,071,365 |
|
Loss per share attributable to the Company's stockholders: |
|
|
|
|
|
|
|
|
|
|
|
|
|
|
| |||||||
Earnings (loss) per share attributable to the Company's stockholders: |
|
|
|
|
| |||||||||||||||||
Basic | $ | (0.08 | ) |
| $ | (0.53 | ) |
| $ | (0.45 | ) |
| $ | (1.52 | ) | $ | 0.27 |
|
| $ | (0.09 | ) |
Diluted | $ | (0.08 | ) |
| $ | (0.53 | ) |
| $ | (0.45 | ) |
| $ | (1.52 | ) | $ | 0.27 |
|
| $ | (0.09 | ) |
Under ASC Topic 260, “Earnings Per Share,” requires companies with unvested participating securities to utilize a two-class method forShare”, the computation of net income attributable to the Company per share. The two-class method requires a portion of net income attributable to the Company to be allocated to participating securities, which are unvested awards of share-based payments with non-forfeitable rights to receive dividends or dividend equivalents, if declared. Net losses areloss is not allocated to nonvested sharesunvested awards in periods that the Company determines that those shares are not obligated to participate in losses. For the periods that the Company recognized net income, net income attributable to the Company allocated to these participating securities was excluded from net income attributable to the Company’s stockholders in the numerator of the earnings per share computation.
11
9.10. Stock-based Compensation and Outstanding Awards
In connection with the Separation, the Company and NOV entered into the Employee Matters Agreement which governs the Company and NOV’s compensation and employee benefit obligations with respect to current and former employees of each company, and generally allocates liabilities and responsibilities relating to employee compensation and benefit plans and programs. Such agreement provided the adjustment mechanisms applied as a result of the Spin-Off to convert outstanding NOV equity awards held by Company employees to Company awards.
The Company has a stock-based compensation plan known as the NOW Inc. Long-Term Incentive Plan (the “Plan”). Under the Plan, the Company’s employees are eligible to be granted stock options, restricted stock awards (“RSAs”), restricted stock units and phantom shares (“RSUs”), and performance stock awards (“PSAs”).
For the ninethree months ended September 30, 2017,March 31, 2022, the Company granted 915,037 stock options with a weighted average fair value of $7.07 per share and 194,183664,274 shares of RSAs and RSUs with a weighted average fair value of $19.92$9.62 per share. In addition, the Company grantedshare and PSAs to senior management employees with potential payouts varying from zero0 to 169,346701,668 shares. These options vest over a three-year period from the grant date on a straight-line basis over the requisite service period for each separately vesting portion of the award as if the award was, in-substance, multiple awards. The RSAs and RSUs vest on the first and third anniversary of the date of grant. The PSAs can be earned based on performance against established metrics over a three-year performance period.period set by the Company’s Compensation Committee of the Board of Directors. The PSAs are divided into three equal, independent parts that are subject to three separate performance metrics: (i) one-thirdone-half of the PSAs have a Total Shareholder Return (TSR)(“TSR”) metric, (ii) one-thirdone-quarter of the PSAs have an EBITDA metric, and (iii) one-thirdone-quarter of the PSAs have a WorkingReturn on Capital (WC)Employed (“ROCE”) metric.
Performance against the TSR metric is determined by comparing the performance of the Company’s TSR with the TSR performance of designated peer companies for the three-year performance period. Performance against the EBITDA metric is determined by comparing the performance of the Company’s actual EBITDA average for each of the three-years of the performance period against the EBITDA metrics set by the Company’s Compensation Committee of the Board of Directors.set. Performance against the WCROCE metric is determined by comparing the performance of the Company’s actual WCROCE average for each of the three-years of the performance period against the WCROCE metrics set by the Company’s Compensation Committee of the Board of Directors.set.
Stock-based compensation expense totaled $5 million and $16 millionrecognized for the three and nine months ended September 30, 2017, respectively,March 31, 2022, and $5 million and $172021 totaled $2 million for the same periods in 2016, respectively.both periods.
10.11. Commitments and Contingencies
In connection with the Spin-Off, the Company and NOV entered into a Separation and Distribution Agreement which contains the key provisions related to the separation from NOV and the distribution of the Company’s common stock to NOV shareholders. The Separation and Distribution Agreement separated the assets related to the Company’s business from NOV, along with liabilities related to such assets, which now reside with the Company. In general, the Company agrees to indemnify NOV from liabilities arising from the Company’s business and assets, and NOV agrees to indemnify the Company from liabilities arising from NOV’s business and assets (that remained with NOV), except as otherwise provided in such agreement.
The Company is involved in various claims, regulatory agency audits and pending or threatened legal actions involving a variety of matters.matters with entities such as suppliers, customers, parties to acquisitions and divestitures, government authorities and other external parties. The Company regularly reviews and records the estimated probable liability in an amount believed to be sufficient and continues to periodically reexamine the estimates of probable liabilities and any associated expenses to make appropriate adjustments to such estimates as necessary. These estimated liabilities are based on the Company’s assessment of the nature of these matters, their progress toward resolution, the advice of legal counsel and outside experts as well as management’s intention and past experience regarding the valuation of these claims. The Company has also assessed the potential for additional losses above the amounts accrued as well as potential losses for matters that are not probable but are reasonably possible. The total potential loss on these matters cannot be determined; however,determined. While the Company has established estimates it believes to be reasonable under the facts known, the outcomes of litigation and similar disputes are often difficult to reliably predict and may result in the Company’s opinion, any ultimate liability,decisions or settlements that are contrary to, the extent not otherwise recorded or accrued for, will not materially affect the Company’s financial position, cash flow or results of operations. These estimated liabilities are based on the Company’s assessmentin excess of, the nature of these matters, their progress toward resolution, the advice of legal counsel and outside experts as well as management’s intention and experience.Company's expectations.
12
The Company’s business is affected both directly and indirectly by governmental laws and regulations relating to the oilfield service industry in general, as well as by environmental and safety regulations that specifically apply to the Company’s business. Although the Company has not incurred material costs in connection with its compliance with such laws, there can be no assurance that other developments, such as new environmental laws, regulations and enforcement policies hereunder may not result in additional, presently unquantifiable costs or liabilities to the Company.
The Company does not accrue for contingent losses that, in its judgment, are considered to be reasonably possible, but not probable. Estimating reasonably possible losses also requires the analysis of multiple possible outcomes that often depend on judgments about potential actions by third parties. NOW’s management currently estimates a range of loss for reasonably possible losses for which an estimate can be made is between zero and $15 million in the international segment primarily attributable to accounts receivable with
12
one customer. The Company has accrued its best estimate for loss as of September 30, 2017. Factors underlying this estimated range of loss may change from time to time, and actual results may vary significantly from this estimate.
The Company maintains credit arrangements with several banks providing for short-term borrowing capacity, overdraft protection and other bonding requirements. As of September 30, 2017, these credit arrangements totaled approximately $35 million, of which the Company was contingently liable for approximately $10 million of outstanding standby letters of credit, including bid and performance related bonds, and other bonding requirements. As of March 31, 2022, the Company was contingently liable for approximately $12 million of outstanding standby letters of credit and surety bonds. The Company does not believe, based on historical experience and information currently available, that it is probable that any amounts will be required to be paid.
In 2021, the Company completed an acquisition which included a contingent consideration arrangement that required additional consideration to be paid based on the achievement of a specified performance target over the earn-out period of one year. The fair value of contingent consideration liability included in other current liabilities in the consolidated balance sheet as of December 31, 2021, was approximately $13 million. As of March 31, 2022, the earn-out period was completed and the Company calculated the contingent consideration threshold was not achieved and the contingent liability was removed, resulting in a benefit of approximately $13 million, recognized in other income (expense) in the consolidated statement of operations. However, the Company is currently in disagreement with the sellers on aspects of the agreement. The Company does not believe at this time that resolution of the matter will have a material impact on its consolidated financial statements, but the final outcome has not been determined.
11.12. Derivative Financial Instruments
The Company is exposed to certain risks relating to its ongoing business operations. The primary risk managed by using derivative instruments is foreign currency exchange rate risk. The Company has entered into certain financial derivative instruments to manage this risk.
The derivative financial instruments the Company has entered into are forward exchange contracts which have terms of less than one year to economically hedge foreign currency exchange rate risk on recognized non-functionalnonfunctional currency monetary accounts. The purpose of the Company’s foreign currency economic hedging activities is to economically hedge the Company’s risk from changes in the fair value of non-functionalnonfunctional currency denominated monetary accounts.
The Company records all derivative financial instruments at their fair value in its consolidated balance sheets. None of the derivative financial instruments that the Company holds are designated as either a fair value hedge or cash flow hedge and the gain or loss on the derivative instrument is recorded in earnings. The Company has determined that the fair value of its derivative financial instruments are computed using level 2 inputs (inputs other than quoted prices in active markets for identical assets and liabilities that are observable either directly or indirectly for substantially the full term of the asset or liability) in the fair value hierarchy as the fair value is based on publicly available foreign exchange rates at each financial reporting date.
The table below provides data aboutAs of March 31, 2022 and December 31, 2021, the fair value of the derivative instruments that are recordedCompany’s foreign currency forward contracts totaled an asset of less than $1 million and a liability of less than $1 million in both periods. The Company's foreign currency forward contract assets were included in prepaid and other current assets in the consolidated balance sheets (and the Company's foreign contract liabilities were included in millions):other current liabilities in the consolidated balance sheets.
|
| September 30, 2017 |
|
| December 31, 2016 |
| ||||||||||
|
| Assets |
|
| Liabilities |
|
| Assets |
|
| Liabilities |
| ||||
Derivatives not designated as hedging instruments: |
|
|
|
|
|
|
|
|
|
|
|
|
|
|
|
|
Foreign exchange forward contracts(1) |
| $ | — |
|
| $ | 1 |
|
| $ | 1 |
|
| $ | — |
|
|
|
The table below providesFor the three months ended March 31, 2022 and 2021, the Company recorded a loss of less than $1 million and a gain of less than $1 million, respectively, related to changes in fair value. All gains (losses) recognizedand losses were included in other income (expense) in the accompanying consolidated statements of operations related to the Company’s derivative instruments (in millions):operations. The notional principal associated with those contracts was $7 million and $9 million as of March 31, 2022 and December 31, 2021, respectively.
|
| Three Months Ended September 30, |
|
| Nine Months Ended September 30, |
| ||||||||||
|
| 2017 |
|
| 2016 |
|
| 2017 |
|
| 2016 |
| ||||
Derivatives not designated as hedging instruments: |
|
|
|
|
|
|
|
|
|
|
|
|
|
|
|
|
Foreign exchange forward contracts |
| $ | — |
|
| $ | — |
|
| $ | 2 |
|
| $ | 10 |
|
As of September 30, 2017,March 31, 2022, the Company’s financial instruments do notcontain any credit-risk-related or other contingent features that could cause accelerated payments when the Company’s financial instruments are in net liability positions. The Company does not use derivative financial instruments for trading or speculative purposes.
13
13
Item 2. Management’s Discussion and Analysis of Financial Condition and Results of Operations
Forward-Looking Statements
Some of the information in this document contains, or has incorporated by reference, forward-looking statements within the meaning of Section 27A of the Securities Act of 1933, as amended, and Section 21E of the Securities Exchange Act of 1934, as amended. Statements that are not historical facts, including statements about our beliefs and expectations, are forward-looking statements. Forward-looking statements typically are identified by use of terms such as “may,” “believe,” “anticipate,” “expect,” “plan,” “predict,” “estimate,” “will be” or other similar words and phrases, although some forward-looking statements are expressed differently. You should be aware that our actual results could differ materially from results anticipated in the forward-looking statements due to a number of factors, including, but not limited to, changes in oil and gas prices, changes in the energy markets, customer demand for our products, significant changes in the size of our customers, difficulties encountered in integrating mergers and acquisitions, general volatility in the capital markets, disruptions caused by COVID-19, changes in applicable government regulations, increased borrowing costs, competition between usgeopolitical conditions (including the Ukraine conflict and our former parent company, NOV, the triggering of rightsits regional and obligations by the Spin-Off global impact)or any litigation arising out of or related to the Separation,thereto, impairments in goodwill or other intangiblelong-lived assets and worldwide economic activity. You should also consider carefully the statements under “Risk Factors,” as disclosed in our Form 10-K, which address additional factors that could cause our actual results to differ from those set forth in the forward-looking statements. Given these uncertainties, current or prospective investors are cautioned not to place undue reliance on any such forward-looking statements. We undertake no obligation to update any such factors or forward-looking statements to reflect future events or developments.
Company Overview
We are a global distributor to the oil and gas and industrial markets with a legacy of over 150 years. We operate primarily under the DistributionNOW and Wilson ExportDNOW brands. Through oura network of approximately 300175 locations and approximately 4,6002,300 employees worldwide, we stockoffer a complementary suite of digital procurement channels that, in conjunction with our locations, provides products to the energy and sellindustrial markets around the world.
Additionally, through our growing DigitalNOW® platform, customers can leverage world-class technology across ecommerce, data management and supply chain optimization applications to solve a comprehensive offeringwide array of energy products as well as an extensive selection of products for industrial applications. complex operational and product sourcing challenges to assist in maximizing their return on assets.
Our energy product offering is consumed throughout all sectors of the oil and gasenergy industry – from upstream drilling and completion, exploration and production, (“E&P”), midstream infrastructure development to downstream petroleum refining and petrochemicals – as well as in other industries, such as chemical processing, mining, utilities and industrial manufacturing operations.renewables. The industrial distribution end markets include manufacturing, aerospace, automotive, refineries and engineering and construction.construction firms that perform capital and maintenance projects for their end user clients. We also provide supply chain and materials management solutions to drilling contractors, E&P operators, midstream operators and downstream energy and industrial manufacturing companies around the world.same markets where we sell products.
Our global product offering includes consumable maintenance, repair and operating (“MRO”) supplies, pipe, valves, fittings, flanges, gaskets, fasteners, electrical, instrumentation, artificial lift, pumping solutions, valve actuation and modular process, measurement and control equipment. We also offer procurement, warehouse and inventory management solutions as part of our supply chain and materials management offering. Through focused effort, weWe have developed expertise in providing application systems, andwork processes, parts integration, optimization solutions and after-sales support.
Our solutions include outsourcing theportions or entire functions of our customers’ procurement, inventorywarehouse and warehouseinventory management, logistics, point of issue technology, project management, business process and performance metrics reporting. These solutions allow us to leverage the infrastructure of our SAP™ Enterprise Resource Planning (“ERP”) system and other technologies to streamline our customers’ purchasing process, from requisition to procurement to payment, by digitally managing workflow, improving approval routing and providing robust reporting functionality.
We support land and offshore operations for all the major oil and gas producing regions around the world through our network of locations. Our key markets, beyond North America, include LatinSouth America, the North Sea, the Middle East, Asia Pacific, andportions of the Formerformer Soviet Union (“FSU”).and Africa. Products sold through our locations support greenfield expansion upstream capital projects, midstream infrastructure and transmission and MRO consumables used in day-to-day production. We provide downstream energy and industrial products for petroleum refining, chemical processing, LNGliquefied natural gas terminals, power generation utilities and industrial manufacturing operations and customer on-site locations.
We stock or sell more thanapproximately 300,000 stock keeping units (“SKUs”) through our branch network. Our supplier network consists of thousands of vendors in approximately 40 countries. From our operations in over 20 countries we sell to customers operating in approximately 80 countries. The supplies and equipment stocked by each of our branches isare customized to meet varied and changing local customer demands. The breadth and scale of our offering enhances our value proposition to our customers, suppliers and shareholders.
14
We employ advanced information technologies, including a common ERP platform across most of our business, to provide complete procurement, materialswarehouse and inventory management and logistics coordination to our customers around the globe. Having a common ERP platform allows immediate visibility into the Company’sour inventory assets, operations and financials and operations worldwide, enhancing decision making and efficiency.
14
Demand for our products is driven primarily by the level of oil and gas drilling, completions, servicing, and production, transmission, refining and petrochemical and industrial manufacturing activities. It is also influenced by the global supply and demand for energy, the economy in general and by government policies.geopolitics. Several factors drive spending, such as investment in energy infrastructure, the North American conventional and shale plays, market expectations of future developments in the oil, natural gas, liquids, refined products, petrochemical, plant maintenance and other industrial manufacturing and energy sectors.
We have expanded globally, through acquisitions and organic investments, into Australia, Azerbaijan, Brazil, Canada, China, Colombia, Egypt, England, India, Indonesia, Kazakhstan, Kuwait, Mexico, Netherlands, Norway, Oman, Peru, the Philippines, Russia, Saudi Arabia, Scotland, Singapore, the United Arab Emirates and the United States.States (“U.S.”).
Summary of Reportable Segments
We operate through three reportable segments: United States (“U.S.”), Canada and International. The segment data included in our Management’s Discussion and Analysis (“MD&A”) are presented on a basis consistent with our internal management reporting. Segment information appearing in Note 67 “Business Segments” of the notes to the unaudited consolidated financial statements (Part I, Item 1 of this Form 10-Q) is also presented on this basis.
United States
We have approximately 200115 locations in the U.S., which are geographically positioned to best serve the upstream, midstream and downstream energy and industrial markets.
We offer higher value solutions in key product lines in the U.S. which broaden and deepen our customer relationships and related product line value. Examples of these include artificial lift, pumps, valves and valve actuation, process and production equipment, fluid transfer products, measurement and controls, spoolable and coated steel-pipe and composite pipe, along with many other products required by our customers, which enable them to focus on their core business while we manage varying degrees of their supply chain. We also provide additional value to our customers through the engineering, design, construction, assembly, fabrication and optimization of products and equipment essential to the safe and efficient production, transportation and processing of oil and gas and industrial manufacturing.gas.
Canada
We have a network of approximately 5540 locations in the Canadian oilfield, predominantly in the oil rich provinces of Alberta, Saskatchewan, Manitoba and Saskatchewan in Western Canada.other targeted locations across the country. Our Canada segment primarily serves the energy exploration, production, mining and drilling business, offering customers many of the same products and value-added solutions that we perform in the U.S. In Canada, we also provide training for, and supervise the installation of, jointed and spoolable composite pipe. This product line is supported by inventory, andas well as product and installation expertise to serve our customers.
International
We operate in approximately 20 countries and serve the needs of our international customers from approximately 3520 locations outside of the U.S. and Canada, which are strategically located in major oil and gas development areas. Our approach in these markets is similar to our approach in the U.S.,North America, as our customers turn to us to provide inventoryproducts and supply chain solutions support closer to their drilling and exploration activities. Our long legacy of operating in many international regions, combined with significant expansion into several key markets, provides a competitive advantage as few of our competitors have a presence in most of the global energy producing regions.
In February 2022, Russia invaded Ukraine and is still engaged in active armed conflict against the country. As a result, governments in the European Union, the United States, the United Kingdom, Switzerland, and other countries have enacted additional sanctions against Russia and Russian interests. These sanctions include controls on the export, re-export, and in-country transfer in Russia of certain goods, supplies, and technologies, and the imposition of restrictions on doing business with certain state-owned Russian customers and other investments and business activities in Russia. In order to comply with these sanctions, we began to wind down our operations in Russia. As of March 31, 2022, Russia represented less than one percent of our net book value of assets, and no impairment has occurred. However, the conflict in Ukraine and related sanctions could potentially impact our assets in Russia, which could cause us to take a charge related to those assets.
15
Basis of Presentation
All significant intercompany transactions and accounts have been eliminated. The unaudited consolidated financial information included in this report has been prepared in accordance with GAAPaccounting principles generally accepted in the United States (“GAAP”) for interim financial information and Article 10 of SEC Regulation S-X. The principles for interim financial information do not require the inclusion of all the information and footnotes required by generally accepted accounting principles for complete financial statements. Therefore, these financial statements should be read in conjunction with the financial statements included in the Company’s most recent Annual Report on Form 10-K. In the opinion of our management, the consolidated financial statements include all adjustments, all of which are of a normal recurring nature, necessary for a fair presentation of the results for the interim periods. The results of operations for the three and nine months ended September 30, 2017March 31, 2022, are not necessarily indicative of the results to be expected for the full year.
15
Operating Environment Overview
Our results are dependent on, among other things,factors, the level of worldwide oil and gas drilling and completions, well remediation activity, crude oil and natural gas prices, capital spending by oilfield service companies and drilling contractors, and the worldwide oil and gas inventory levels. Key industry indicators for the thirdfirst quarter of 20172022 and 20162021 and the secondfourth quarter of 20172021 include the following:
|
|
|
|
|
|
|
|
|
| % |
|
|
|
|
|
| % |
|
|
|
|
|
| % |
|
|
| % |
| |||||||||||
|
|
|
|
|
|
|
|
|
| 3Q17 v |
|
|
|
|
|
| 3Q17 v |
|
|
|
|
|
| 1Q22 v |
|
|
| 1Q22 v |
| |||||||||||
|
| 3Q17* |
|
| 3Q16* |
|
| 3Q16 |
|
| 2Q17* |
|
| 2Q17 |
|
| 1Q22* |
|
| 1Q21* |
|
| 1Q21 |
|
| 4Q21* |
|
| 4Q21 |
| ||||||||||
Active Drilling Rigs: |
|
|
|
|
|
|
|
|
|
|
|
|
|
|
|
|
|
|
|
|
|
|
|
|
|
|
|
|
|
|
| |||||||||
U.S. |
|
| 947 |
|
|
| 480 |
|
|
| 97.3 | % |
|
| 892 |
|
|
| 6.2 | % |
| 633 |
|
|
| 392 |
| 61.5 | % |
|
| 559 |
| 13.2 | % | |||||
Canada |
|
| 208 |
|
|
| 121 |
|
|
| 71.9 | % |
|
| 114 |
|
|
| 82.5 | % |
| 198 |
|
|
| 139 |
| 42.4 | % |
|
| 161 |
| 23.0 | % | |||||
International |
|
| 947 |
|
|
| 936 |
|
|
| 1.2 | % |
|
| 958 |
|
|
| (1.1 | %) |
|
| 823 |
|
|
| 698 |
|
|
| 17.9 | % |
|
| 817 |
|
|
| 0.7 | % |
Worldwide |
|
| 2,102 |
|
|
| 1,537 |
|
|
| 36.8 | % |
|
| 1,964 |
|
|
| 7.0 | % |
|
| 1,654 |
|
|
| 1,229 |
|
|
| 34.6 | % |
|
| 1,537 |
|
|
| 7.6 | % |
|
|
|
|
|
|
|
|
|
|
|
|
|
|
|
|
|
|
|
|
|
|
|
|
|
|
|
|
|
|
|
|
| ||||||||
West Texas Intermediate Crude Prices (per barrel) |
| $ | 48.16 |
|
| $ | 44.85 |
|
|
| 7.4 | % |
| $ | 48.24 |
|
|
| (0.2 | %) |
| $ | 94.45 |
|
| $ | 57.79 |
| 63.4 | % |
| $ | 77.45 |
| 21.9 | % | ||||
Natural Gas Prices ($/MMBtu) |
| $ | 2.95 |
|
| $ | 2.88 |
|
|
| 2.4 | % |
| $ | 3.08 |
|
|
| (4.2 | %) |
| $ | 4.66 |
|
| $ | 3.56 |
| 30.9 | % |
| $ | 4.77 |
| (2.3 | %) | ||||
Hot-Rolled Coil Prices (steel) ($/short ton) |
| $ | 621.38 |
|
| $ | 603.87 |
|
|
| 2.9 | % |
| $ | 623.65 |
|
|
| (0.4 | %) |
| $ | 1,383.09 |
|
| $ | 1,113.52 |
| 24.2 | % |
| $ | 1,854.04 |
| (25.4 | %) | ||||
|
|
* Averages for the quarters indicated. See sources on following page.
16
The following table details the U.S., Canadian and international rig activity and West Texas Intermediate oil prices for the past nine quarters ended September 30, 2017:March 31, 2022:
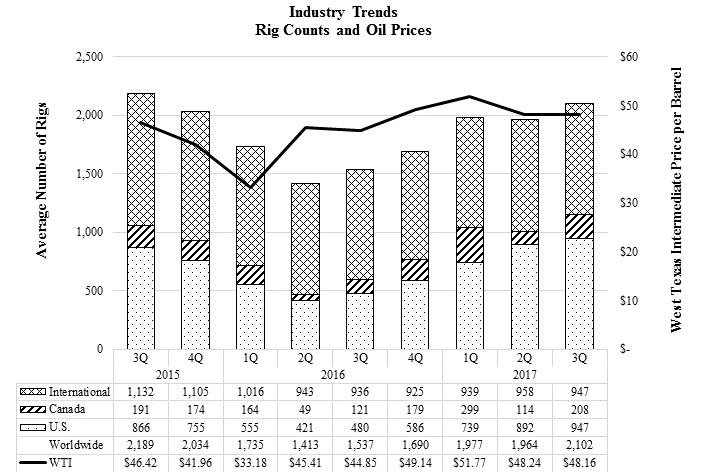
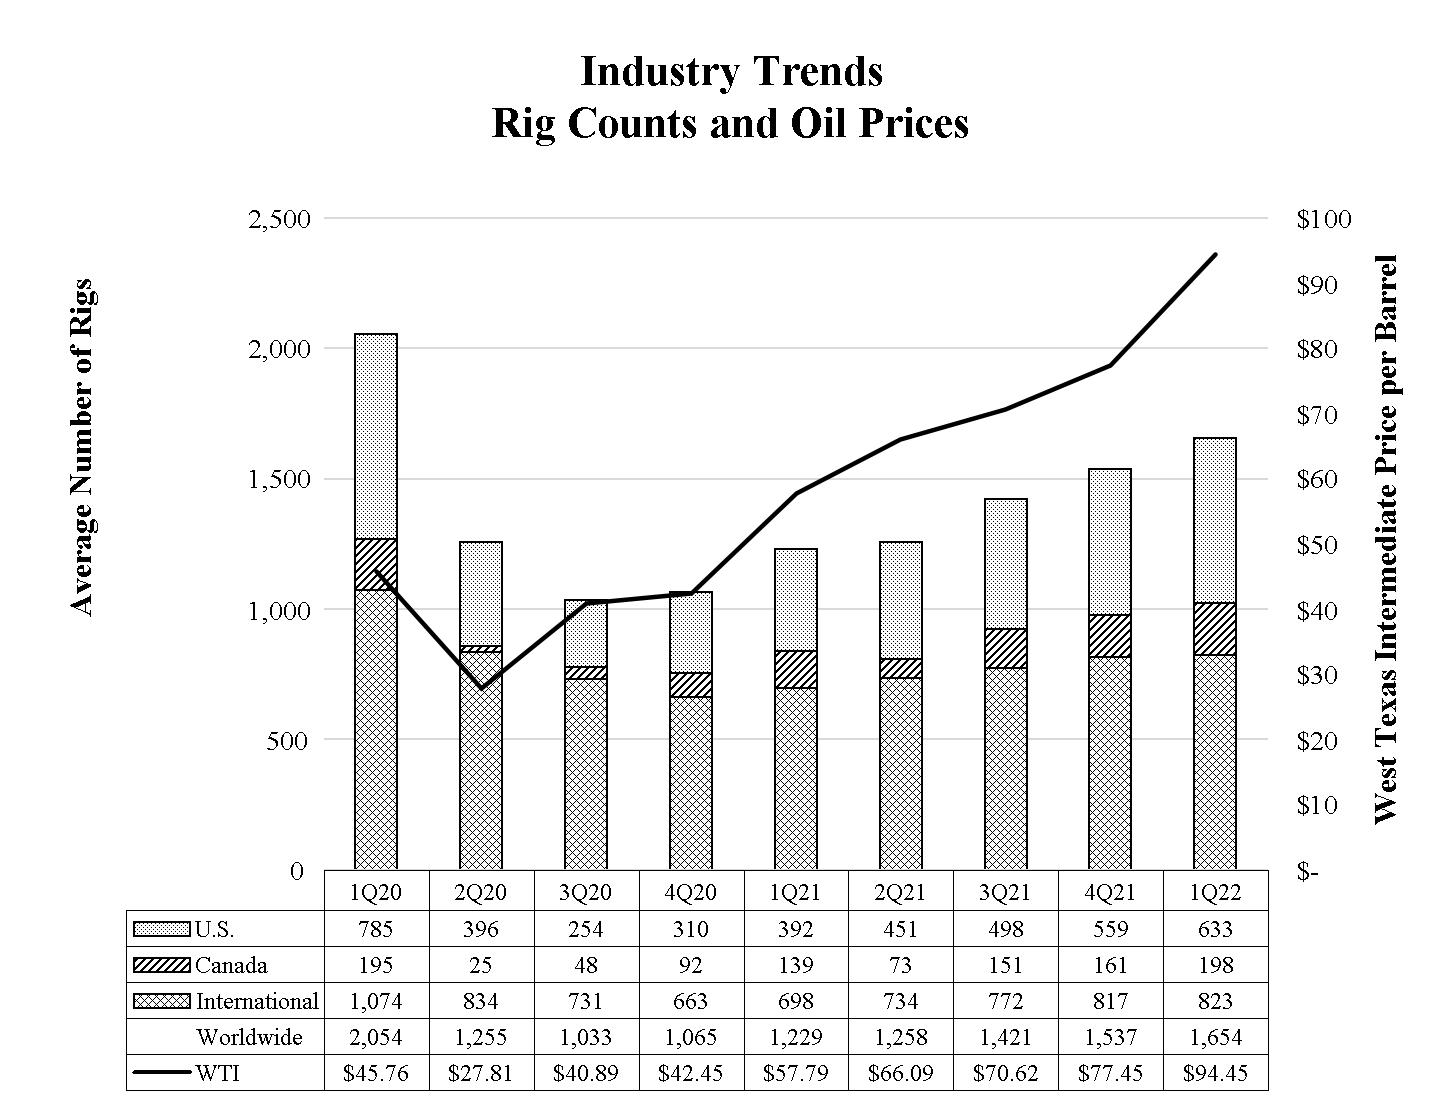
Sources: Rig count: Baker Hughes, Inc. (www.bakerhughes.com); West Texas Intermediate Crude and Natural Gas Prices: Department of Energy, Energy Information Administration (www.eia.doe.gov); Hot-Rolled Coil Prices: American Metal Market SteelBenchmarker™ Hot Roll Coil USA (www.amm.comwww.steelbenchmarker.com).
The worldwide quarterly average rig count increased 7.0%7.6% (from 1,9641,537 rigs to 2,1021,654 rigs) and the U.S. increased 6.2%13.2% (from 892559 rigs to 947633 rigs) in the thirdfirst quarter of 20172022 compared to the secondfourth quarter of 2017.2021. The average price per barrel of West Texas Intermediate Crude declined 0.2%increased 21.9% (from $48.24$77.45 per barrel to $48.16$94.45 per barrel), and natural gas prices declined 4.2%2.3% (from $3.08$4.77 per MMBtu to $2.95$4.66 per MMBtu) in the thirdfirst quarter of 20172022 compared to the secondfourth quarter of 2017.2021. The average price per short ton of Hot-Rolled Coil declined 0.4%25.4% (from $623.65$1,854.04 per short ton to $621.38$1,383.09 per short ton) in the thirdfirst quarter of 20172022 compared to the secondfourth quarter of 2017.2021.
U.S. rig count at October 13, 2017April 14, 2022 was 928693 rigs, down 19up 60 rigs compared tofrom the thirdfirst quarter of 2017 average of 947 rigs.2022 average. The price for West Texas Intermediate Crude was $51.43$106.84 per barrel at October 13, 2017,April 14, 2022, up 6.8%13.1% from the thirdfirst quarter average of 2017.2022 average. The price for natural gas was $2.99$6.94 per MMBtu at October 13, 2017,April 14, 2022, up 1.4%48.9% from the thirdfirst quarter average of 2017.2022 average. The price for Hot-Rolled Coil was $609.63$1,422.00 per short ton at October 9, 2017, down 1.9%April 11, 2022, up 2.8% from the thirdfirst quarter average of 2017.2022 average.
17
17
Executive Summary
For the three and nine months ended September 30, 2017,March 31, 2022, the Company generated a net lossincome of $9 million and $49$30 million on $697 million and $1,979$473 million in revenue. For the three months ended March 31, 2022, revenue respectively. Revenue increased $177$112 million or 34.0%31.0%, and $410net income increased $40 million or 26.1%, for the three and nine months ended September 30, 2017, respectively, when compared to the corresponding periodsperiod of 2016. 2021.
For the three and nine months ended September 30, 2017, net loss improved $47 million and $114 million, respectively, when compared to the corresponding periods of 2016.
For the three and nine months ended September 30, 2017,March 31, 2022, the Company generated an operating profit of $23 million compared to an operating loss of $6$8 million or negative 0.9% of revenue, and $41 million or negative 2.1% of revenue, compared to $53 million or negative 10.2% of revenue, and $175 million or negative 11.2% of revenue, respectively, for the corresponding periodsperiod of 2016.2021.
Outlook
Our outlook for the Company remains tied to crude oil and natural gas commodity prices, global rig countoil and gas drilling and completion expenditures, particularlycompletions activity, oil and gas spending, and global demand for oil, its refined petroleum products, crude oil, natural gas liquids and natural gas production and decline rates. Crude oil and natural gas prices as well as crude oil and natural gas storage levels are primary catalysts for determining customer activity.
Continuing to the date of this filing, uncertainty still exists concerning the COVID-19 pandemic and its impact on the economy and global oil and gas demand as countries and regions address varying caseloads. In addition, the invasion of Ukraine by Russia and the sanctions imposed in North America. Oil pricesresponse to this conflict have increased the level of economic and U.S. oil storage levelspolitical uncertainty. Amid these dynamics, we will continue to be the primary catalysts determining U.S. rig activity. Our approach continues to be to focus on what we can control. We take a long-term approach advancingsupport our customers, optimize our operations, advance our strategic goals and managingmanage the Company based on current market conditions. WeTo navigate this environment, we have undergone a significant cost transformation by taking decisive actions to cut costs, accelerate structural changes and deploy various technologies to optimize processes, increase productivity and continue to rationalize expensessupport our customers and capital where economic activity remains depressedgrow revenue. We will continue to adapt and invest where markets are expanding. position the Company for the market ahead. As conditions evolve, our response may result in various charges in future periods.
We believe that our history of managing through these cycles, paired with our resources and minimal capital expenditure requirements, enablesee the rise in energy transition investments as an opportunity for us to maximizesupply many of the current products and services we provide, as well as an opportunity to partner and source from new opportunities.suppliers to expand our offering, to meet our customers’ needs for their energy transition investments. A number of our larger customers are leading the investments in energy transition projects where we expect to continue to supply them while expanding our offerings to meet their changing requirements. We are also targeting new customers that are not traditional oil and gas customers, those that will play a part in the future of energy transition.
18
Results of Operations
Operating results by reportable segment are as follows (in millions):
| Three Months Ended March 31, |
| |||||
| 2022 |
|
| 2021 |
| ||
Revenue: |
|
|
|
|
| ||
United States | $ | 334 |
|
| $ | 252 |
|
Canada |
| 82 |
|
|
| 58 |
|
International |
| 57 |
|
|
| 51 |
|
Total revenue | $ | 473 |
|
| $ | 361 |
|
Operating profit (loss): |
|
|
|
|
| ||
United States | $ | 14 |
|
| $ | (13 | ) |
Canada |
| 7 |
|
|
| 4 |
|
International |
| 2 |
|
|
| 1 |
|
Total operating profit (loss) | $ | 23 |
|
| $ | (8 | ) |
| Three Months Ended September 30, |
|
| Nine Months Ended September 30, |
|
| ||||||||||
| 2017 |
|
| 2016 |
|
| 2017 |
|
| 2016 |
|
| ||||
Revenue: |
|
|
|
|
|
|
|
|
|
|
|
|
|
|
|
|
United States | $ | 506 |
|
| $ | 372 |
|
| $ | 1,426 |
|
| $ | 1,066 |
|
|
Canada |
| 96 |
|
|
| 67 |
|
|
| 271 |
|
|
| 185 |
|
|
International |
| 95 |
|
|
| 81 |
|
|
| 282 |
|
|
| 318 |
|
|
Total revenue | $ | 697 |
|
| $ | 520 |
|
| $ | 1,979 |
|
| $ | 1,569 |
|
|
Operating profit (loss): |
|
|
|
|
|
|
|
|
|
|
|
|
|
|
|
|
United States | $ | (10 | ) |
| $ | (46 | ) |
| $ | (52 | ) |
| $ | (149 | ) |
|
Canada |
| 4 |
|
|
| (2 | ) |
|
| 9 |
|
|
| (16 | ) |
|
International |
| — |
|
|
| (5 | ) |
|
| 2 |
|
|
| (10 | ) |
|
Total operating loss | $ | (6 | ) |
| $ | (53 | ) |
| $ | (41 | ) |
| $ | (175 | ) |
|
Operating profit (loss) % of revenue: |
|
|
|
|
|
|
|
|
|
|
|
|
|
|
|
|
United States |
| (2.0 | %) |
|
| (12.4 | %) |
|
| (3.6 | %) |
|
| (14.0 | %) |
|
Canada |
| 4.2 | % |
|
| (3.0 | %) |
|
| 3.3 | % |
|
| (8.6 | %) |
|
International |
| 0.0 | % |
|
| (6.2 | %) |
|
| 0.7 | % |
|
| (3.1 | %) |
|
Total operating loss % |
| (0.9 | %) |
|
| (10.2 | %) |
|
| (2.1 | %) |
|
| (11.2 | %) |
|
United States
For the three and nine months ended September 30, 2017,March 31, 2022, revenue was $506 million and $1,426$334 million, an increase of $134$82 million or 36.0% and $360 million or 33.8%, respectively,32.5% when compared to the corresponding periodsperiod of 2016. These increases were2021. For the three months ended March 31, 2022, the increase was primarily driven by a year over year improvementthe fluctuations in U.S. rig count, coupled with an incremental revenue gain of approximately $54 million on a year-to-date basis, from an acquisition completed in the second quarter of 2016.drilling and completions activity.
For the three and nine months ended September 30, 2017,March 31, 2022, the U.S. generated an operating lossprofit of $10$14 million, or negative 2.0% of revenue and $52 million or negative 3.6% of revenue, respectively, an improvement of $36$27 million and $97 million, respectively, when compared to the corresponding periodsperiod of 2016.2021. For the three and nine months ended September 30, 2017, U.S.March 31, 2022, operating losses narrowedprofit increased primarily due to the increasesincrease in volumerevenue discussed above, andcoupled with improved product margins in the periods.margins.
Canada18
Canada
For the three and nine months ended September 30, 2017,March 31, 2022, revenue was $96$82 million, and $271 million, respectively, an increase of $29$24 million or 43.3% and $86 million or 46.5%, respectively,41.4% when compared to the corresponding periodsperiod of 2016. These increases were2021. For the three months ended March 31, 2022, the increase was primarily driven by a year over year improvementthe increase in Canadian rig count.
For the three and nine months ended September 30, 2017,March 31, 2022, Canada generated an operating profit of $4$7 million, or 4.2%an increase of revenue and $9$3 million or 3.3% of revenue, respectively, an improvement of $6 million and $25 million, respectively, when compared to the corresponding periodsperiod of 2016. Operating profits2021. For the three months ended March 31, 2022, operating profit increased in the periods primarily due to the increasesincrease in volumerevenue discussed above, and lower inventory chargespartially offset by a reduction in the periods.Canada Emergency Wage Subsidy.
International
For the three and nine months ended September 30, 2017,March 31, 2022, revenue was $95$57 million, and $282 million, respectively, an increase of $14$6 million or 17.3% and a decline of $36 million or 11.3%, respectively,11.8% when compared to the corresponding periodsperiod of 2016. The2021. For the three months ended March 31, 2022, the increase quarter over quarter iswas primarily driven by a resumptionthe increase in electrical projects in EuropeInternational rig count and increased customer penetration in the Middle East in the third quarter of 2017. The decrease on a year-to-date basis was primarily a result of the completion of large projects in the first half of 2016 that did not repeat, coupled with a softening in the offshore rig market.stronger project activity, partially offset by unfavorable foreign exchange rate impacts.
For the three and nine months ended September 30, 2017,March 31, 2022, the internationalInternational segment generated an operating profit of nil and $2 million, or 0.7%an increase of revenue, respectively, an improvement of $5$1 million and $12 million, respectively, when compared to the corresponding periodsperiod of 2016. Operating profit improvement in2021. For the three months ended September 30, 2017March 31, 2022, operating profit increased primarily due to the increase in revenue discussed above.
Cost of products
For the three months ended March 31, 2022, cost of products was $366 million compared to $286 million for the corresponding period of 2021. For the three months ended March 31, 2022, the increase was primarily due to the increases in volume discussed above, coupled with improved product margins. Operating profit for the nine months ended September 30, 2017 improved primarily due to reduced bad debt charges and realized cost savings.
19
Cost of products
For the three and nine months ended September 30, 2017, cost of products was $562 million and $1,606 million, respectively, compared to $433 million and $1,312 million, respectively, for the corresponding periods in 2016. The changes were primarily due to an increase in revenue offset by a reduction in inventory charges made in the period. Cost of products includes the cost of inventory sold and related items, such as vendor consideration, inventory allowances, amortization of intangibles and inbound and outbound freight.
Warehousing, selling and administrative expenses
For the three and nine months ended September 30, 2017, warehousing, selling and administrative costs were $141 million and $414 million, respectively, compared to $140 million and $432 million, respectively, for the corresponding periods of 2016. For the three months ended September 30, 2017, operatingMarch 31, 2022, warehousing, selling and administrative expenses were essentially in line with$84 million compared to $79 million for the prior period.corresponding period of 2021. For the ninethree months ended September 30, 2017,March 31, 2022, the decrease in operating expenseincrease was related toprimarily driven by reductions in accounts receivable charges, as well as, lower property tax charges due to reduced inventory levels, offset bygovernment wage subsidies and bad debt recoveries realized in the impactcorresponding period of additional operating expenses associated with an acquisition.2021. Warehousing, selling and administrative costsexpenses include general corporate expenses, depreciation and branch location, distribution center and regional expenses (including costs such as compensation, benefits and rent). as well as corporate general selling and administrative expenses.
Other expenseImpairment and other charges
For the three and nine months ended September 30, 2017,March 31, 2022, impairment and other expense was $3 million and $8 million, respectively,charges were nil compared to $3$4 million and $7 million, respectively, for the corresponding periodsperiod of 2016. These charges2021. The Company recognized approximately $4 million related to held-for-sale assets and operating right-of-use assets for the three months ended March 31, 2021.
The Company has committed to close certain foreign subsidiaries in the international segment. Impairment of assets were mainlynot material for the three months ended March 31, 2022; however, accumulated translated gains and losses attributable to interestthe foreign subsidiaries which are components of other comprehensive income (loss) will reclassify to earnings and bankresult in additional charges when liquidations are substantially complete.
19
Other income (expense)
For the three months ended March 31, 2022, other income was $10 million compared to other expense of $1 million for the corresponding period of 2021. For the three months ended March 31, 2022, other income was primarily attributable to a benefit of approximately $13 million related to the decrease of contingent consideration liability associated with utilizing the credit facility and foreign currency exchange rate fluctuations.a prior year acquisition.
Income tax provision (benefit)
The effective tax rate for the three and nine months ended September 30, 2017March 31, 2022, was (1.6%) and 0.6%, respectively,9.1% compared to (0.2%(5.5%) and 10.3%, respectively, for the same periods in 2016. Compared tocorresponding period of 2021. In general, the effective tax rate differs from the U.S. statutory rate the effective tax rate was impacted bydue to recurring items, such as lowerdiffering tax rates on income earned in foreign jurisdictions, that is permanently reinvested, offset by nondeductible expenses, state income taxes and the change in valuation allowance recorded against deferred tax assets. Due toFor the continuing uncertainty in our industry and thus our outlook,three months ended March 31, 2022, the Company continues to utilize the method of recording income taxes on a year-to-date effective tax rate forwas primarily driven by the threerecognition of tax expense from earnings in Canada offset by current year realization of deferred tax assets and nine months ended September 30, 2017. The Company will evaluate its usecorresponding release of this method each quarter until such time as a return tovaluation allowance on deferred tax assets in the annualized estimated effective tax rate method is deemed appropriate.U.S.
20
Non-GAAP Financial Measure and Reconciliation
In an effort to provide investors with additional information regarding our results of operations as determined by GAAP, we disclose a non-GAAP financial measure in our quarterly earnings press releases and other public disclosures.measures. The primary non-GAAP financial measure we focus ondisclose is earnings before interest, taxes, depreciation and amortization, excluding other costs (“EBITDA excluding other costs”). This financial measure excludes the impact of certain amounts as further identified below and hasis not been calculated in accordance with GAAP. A reconciliation of this non-GAAP financial measure, to its most comparable GAAP financial measure, is included below.
We use this non-GAAP financial measureEBITDA excluding other costs internally to evaluate and manage the Company’s operations because we believe it provides useful supplemental information regarding the Company’s ongoing economic performance. We have chosen to provide this information to investors to enable them to perform more meaningful comparisons of operating results. In an effort to better align with management’s evaluation of the Company’s performance and to facilitate comparison of our results to those of peer companies, beginning for the year ended December 31, 2021, EBITDA excluding other costs excludes non-cash stock-based compensation expense. Prior periods presented have been adjusted to conform with the current period presentation.
The following table sets forth the reconciliationreconciliations of EBITDA excluding other costs to itsthe most comparable GAAP financial measuremeasures (in millions):
|
| Three Months Ended March 31, |
| |||||
|
| 2022 |
|
| 2021 |
| ||
GAAP net income (loss) (1) |
| $ | 30 |
|
| $ | (10 | ) |
Interest, net |
|
| — |
|
|
| — |
|
Income tax provision (benefit) |
|
| 3 |
|
|
| 1 |
|
Depreciation and amortization |
|
| 4 |
|
|
| 6 |
|
Other costs: |
|
|
|
|
|
| ||
Stock-based compensation |
|
| 2 |
|
|
| 2 |
|
Other (2) |
|
| (11 | ) |
|
| 4 |
|
EBITDA excluding other costs |
| $ | 28 |
|
| $ | 3 |
|
EBITDA % excluding other costs (3) |
|
| 5.9 | % |
|
| 0.8 | % |
21
|
| Three Months Ended September 30, |
|
| Nine Months Ended September 30, |
| ||||||||||
|
| 2017 |
|
| 2016 |
|
| 2017 |
|
| 2016 |
| ||||
GAAP net loss (1) |
|
| (9 | ) |
|
| (56 | ) |
|
| (49 | ) |
|
| (163 | ) |
Interest, net |
|
| 2 |
|
|
| 1 |
|
|
| 4 |
|
|
| 2 |
|
Income tax provision (benefit) |
|
| — |
|
|
| — |
|
|
| — |
|
|
| (19 | ) |
Depreciation and amortization |
|
| 12 |
|
|
| 14 |
|
|
| 38 |
|
|
| 39 |
|
Other costs (2) |
|
| — |
|
|
| 1 |
|
|
| 1 |
|
|
| 8 |
|
EBITDA excluding other costs |
| $ | 5 |
|
| $ | (40 | ) |
| $ | (6 | ) |
| $ | (133 | ) |
EBITDA % excluding other costs (3) |
|
| 0.7 | % |
|
| (7.7 | %) |
|
| (0.3 | %) |
|
| (8.5 | %) |
|
|
|
|
|
|
21
Liquidity and Capital Resources
We assess liquidity in terms of our ability to generate cash to fund operating, investing and financing activities. We expect to remain in a strong financial position, with resources expected to be available to reinvest in existing businesses, strategic acquisitions and capital expenditures to meet short-short and long-term objectives. We believe that cash on hand, cash generated from expected results of operations and amounts available under our revolving credit facility will be sufficient to fund operations, anticipated working capital needs and other cash requirements, including capital expenditures.
As of September 30, 2017March 31, 2022 and December 31, 2016, the Company2021, we had cash and cash equivalents of $99$293 million and $106$313 million, respectively. As of September 30, 2017, approximately $83March 31, 2022, $92 million of our cash and cash equivalents were maintained in the accounts of our various foreign subsidiaries and, if such amounts were transferred among countries orsubsidiaries. During the first three months of 2022, we repatriated to the U.S., the$10 million from our Canadian operations. The Company may be subject to additional tax liabilities, which would be recognized in our financial statements in themakes a determination each period during which such decisions were made. We currently have theconcerning its intent and ability to permanentlyindefinitely reinvest the cash held by its foreign subsidiaries. The Company has not recorded deferred income taxes on undistributed foreign earnings that it considers to be indefinitely reinvested. Future changes to our indefinite reinvestment assertion could result in additional taxes (withholding and/or state taxes), offset by any available foreign subsidiariestax credits.
We maintain a $500 million five-year senior secured revolving credit facility that will mature on December 14, 2026. Availability under the revolving credit facility is determined by a borrowing base comprised of eligible receivables, eligible inventory and there are currentlycertain pledged deposits in the U.S. and Canada. As of March 31, 2022, we had no plans for the repatriation of such amounts.
At September 30, 2017, the Company had $163 million of borrowings against itsour revolving credit facility.facility, and had approximately $436 million in availability (as defined in the Credit Agreement) resulting in the excess availability (as defined in the Credit Agreement) of 99%, subject to certain restrictions. Availability excluding certain cash deposits was approximately $289million. Borrowings that result in the excess availability dropping below the greater of 10% of the borrowing base or $40 million are conditioned upon compliance with or waiver of a minimum fixed charge ratio (as defined in the Credit Agreement). The credit facility contains usual and customary affirmative and negative covenants for credit facilities of this type including financial covenants. As of September 30, 2017, the Company wasMarch 31, 2022, we were in compliance with all covenants. We continuously monitor compliance with debt covenants. A default, if not waived or amended, would prevent the Companyus from taking certain actions, such as incurring additional debt.
We are often party to certain transactions that require off-balance sheet arrangements such as standby letters of credit and performance
bonds and guarantees that are not reflected in our consolidated balance sheets. These arrangements are made in our normal course of
business and they are not reasonably likely to have a current or future material adverse effect on our financial condition, results of
operations, liquidity or cash flows.
The following table summarizes our net cash flows provided by (used in) operating activities, net cash used in investing activities and net cash provided by financing activities for the periods presented (in millions):
|
| Three Months Ended March 31, |
| |||||
|
| 2022 |
|
| 2021 |
| ||
Net cash provided by (used in) operating activities |
| $ | (22 | ) |
| $ | (4 | ) |
Net cash provided by (used in) investing activities |
|
| 2 |
|
|
| (7 | ) |
Net cash provided by (used in) financing activities |
|
| (1 | ) |
|
| (2 | ) |
|
| Nine Months Ended September 30, |
| |||||
|
| 2017 |
|
| 2016 |
| ||
Net cash provided by (used in) operating activities |
| $ | (107 | ) |
| $ | 186 |
|
Net cash used in investing activities |
|
| (3 | ) |
|
| (191 | ) |
Net cash provided by financing activities |
|
| 97 |
|
|
| 33 |
|
Operating Activities
For the ninethree months ended September 30, 2017,March 31, 2022, net cash used in operating activities was $107$22 million compared to net cash provided by$4 million used in operating activities of $186 million in the corresponding period of 2016.2021. For the ninethree months ended September 30, 2017,March 31, 2022, net cash used in operating activities was primarily driven by andue to a net increase in receivables and inventories of $106 million and $81 million, respectively, offset by an increase in accounts payable and accrued liabilities of $70 million. These increases wereworking capital as a result of growing market activity, partially offset by improved market conditions resulting in higher sales and purchases in the period.operating results.
Investing Activities
For the ninethree months ended September 30, 2017,March 31, 2022, net cash provided by investing activities was $2 million compared to $7 million used in investing activities was $3 million compared to $191 million in the corresponding period of 2016. 2021 related to acquisition and divestiture activity.
Financing Activities
For the ninethree months ended September 30, 2017, the Company paid $3 million in relation to making an Internal Revenue Code Section 338(h)(10) election to treat the Power Service acquisition as an asset purchase for U.S. income tax purposes, as well as, paid $1 million in the second quarter of 2017 related to a first quarter measurement period adjustment for the acquisition, offset by approximately $4 million from proceeds on disposal of assets and an insurance recovery. Purchases of property, plant and equipment were approximately $3 million for the nine months ended September 30, 2017.
Financing Activities
For the nine months ended September 30, 2017,March 31, 2022, net cash provided byused in financing activities was $97$1 million compared to $33$2 million forused in financing activities in the corresponding period of 2016. The2021. For the three months ended March 31, 2022, the activity in the period was primarily attributed to the Company making repayments under, and borrowing against,payments relating to its revolving credit facility.finance lease arrangements.
22
Other
Other
For the ninethree months ended September 30, 2017,March 31, 2022, the effect of the change in exchange rates on cash and cash equivalents was an increase of $6$1 million compared to an increase of $13 millionnil for the corresponding period of 2016. The primary driver of the difference in the impact in 2017 versus 2016 was the strengthening of the British pound compared to the U.S. dollar.2021.
Capital Spending
We intend to pursue additional acquisition candidates, but the timing, size or success of any acquisition effort and the related potential capital commitments cannot be determined with certainty.predicted. We continue to expect to fund future cash acquisitions primarily with cash flowsflow from operations and borrowings, including the undrawnusage of the available portion of the revolving credit facility or new debt issuances, but may also issue additional equity either directly or in connection with acquisitions.facility. There can be no assurance that additional financing for acquisitions will be available at terms acceptable to us.
Critical Accounting Policies and Estimates
For a discussion of the critical accounting policies and estimates that we use in the preparation of our consolidated financial statements, see “Management’s Discussion and Analysis of Financial Condition and Results of Operations” included in our Annual Report on Form 10-K. In preparing the financial statements, we makethe Company makes assumptions, estimates and judgments that affect the amounts reported. WeThe Company periodically evaluate ourevaluates its estimates and judgments that are most critical in nature, which are related to allowance for doubtful accounts, inventory reserves, goodwill, intangible assets, contingent consideration, purchase price allocation of acquisitions, vendor consideration and income taxes. OurIts estimates are based on historical experience and on ourits future expectations that we believethe Company believes are reasonable. The combination of these factors forms the basis for making judgments about the carrying values of assets and liabilities that are not readily apparent from other sources. Actual results mayare likely to differ from our current estimates and those differences may be material.
Generally accepted accounting principles require us to test goodwill and other indefinite-lived intangible assets for impairment at least annually (performed in the fourth quarter) or more frequently whenever events or circumstances occur indicating that goodwill or other indefinite-lived intangible assets might be impaired. Adverse market conditions could result in the recognition of impairment if we determine that the fair values of its reporting units have fallen below their carrying values. Events or circumstances which could require interim testing include (but are not limited to) a significant reduction in worldwide oil and gas prices or drilling; a significant reduction in profitability or cash flow of oil and gas companies or drilling contractors; a significant reduction in worldwide well remediation activity; a significant reduction in capital investment by other oilfield service companies; or a significant increase in worldwide inventories of oil or gas.
23
Item 3. Quantitative and QualitativeQualitative Disclosures About Market Risk
The Company isWe are exposed to certain market risks that are inherent in our financial instruments and arise from changes in interest rates and foreign currency exchange rates. The CompanyWe may enter into derivative financial instrument transactions to manage or reduce market risk but doesdo not enter into derivative financial instrument transactions for speculative purposes. The Company doesWe do not currently have any material outstanding derivative instruments. See Note 1112 “Derivative Financial Instruments” to the consolidated financial statements.
A discussion of our primary market risk exposure in financial instruments is presented below.
Foreign Currency Exchange Rate Risk
The Company hasWe have operations in foreign countries and transactstransact business globally in multiple currencies. ItsOur net assets as well as its revenue,our revenues and costs and expenses denominated in foreign currencies, expose the Companyus to the risk of fluctuations in foreign currency exchange rates against the U.S. dollar. Because we operate globally and nearly one-thirdapproximately 30% of the Company’s revenueour net sales for the ninethree months ended September 30, 2017 wasMarch 31, 2022, were outside the United States,U.S., foreign currency exchange rates can impact the Company’sour financial position, results of operations and competitive position. The Company isWe are a net receiver of foreign currencies and, therefore, benefitsbenefit from a weakening of the U.S. dollar and isare adversely affected by a strengthening of the U.S. dollar relative to the foreign currency. As of September 30, 2017, theMarch 31, 2022, our most significant foreign currency exposure was to the Canadian dollar, andfollowed by the British pound, with less significant foreign currency exposuresexposure to the Australian dollar and Mexican peso.dollar.
The financial statements of foreign subsidiaries are translated into their U.S. dollar equivalents at end-of-period exchange rates for assets and liabilities, while revenue, costs and expenses are translated at average monthly exchange rates. Translation gains and losses are components of other comprehensive income (loss) as reported in the consolidated statements of comprehensive income (loss). For the ninethree months ended September 30, 2017,March 31, 2022, the Company realized a net foreign currency translation incomegain totaling $38$2 million, which was included in other comprehensive income (loss). Upon closure of a foreign subsidiary, the amount attributable to the foreign subsidiary accumulated translation gains and losses are reclassified into earnings as a component of impairment and other charges in the consolidated statements of operations, once the closure is substantially complete.
Foreign currency exchange rate fluctuations generally do not materially affect our earnings since the functional currency is typically the local currency; however, our operations also have net assets not denominated in their functional currency, which exposes us to changes in foreign currency exchange rates that impact our earningsnet income as foreign currency transaction gains and losses. Foreign currency transaction gains and losses arising from fluctuations in currency exchange rates on transactions denominated in currencies other than the functional currency are recognized in the consolidated statements of operations as a component of other expense.income (expense). For the first ninethree months of 2017ended March 31, 2022 and 2016,2021, the Company reported foreign currency transaction losses of $1 million and $2less than $1 million, respectively. Gains and losses are primarily due to exchange rate fluctuations related to monetary asset balances denominated in currencies other than the functional currency and fair value adjustments to economically hedged positions as a result of changes in foreign currency exchange rates.
Some of our revenuethe revenues for our foreign operations are denominated in U.S. dollars and, therefore, changes in foreign currency exchange rates impact earnings to the extent that costs associated with those U.S. dollar revenues are denominated in the local currency. Similarly, some of our revenuerevenues for our foreign operations are denominated in foreign currencies, but have associated U.S. dollar costs, which also give rise to foreign currency exchange rate exposure. In order to mitigate those risks, we may utilize foreign currency forward contracts to better match the currency of the revenues and the associated costs. Although we may utilize foreign currency forward contracts to economically hedge certain foreign currency denominated balances or transactions, we do not currently hedge the net investments in our foreign operations. The counterparties to our forward contracts are major financial institutions. The credit ratings and concentration of risk of these financial institutions are monitored by us on a continuing basis. In the event that the counterparties fail to meet the terms of a foreign currency contract, our exposure is limited to the foreign currency rate differential.
The average foreign exchange rate for the first ninethree months of 2017,2022 compared to the average for the samecorresponding period in 2016,of 2021 decreased by approximately 1% compared to the U.S. dollar based on the aggregated weighted average revenue of our foreign-currency denominated foreign operations. The Canadian dollar, British pound and Mexican pesoAustralian dollar decreased in relation to the U.S. dollar by approximately 8% and 3%less than 1%, respectively, while the Australian dollar and the Canadian dollar increased in relation to the U.S. dollar by approximately 3% and 1%approximately 6%, respectively.
We utilized a sensitivity analysis to measure the potential impact on earnings based on a hypothetical 10% change in foreign currency rates. A 10% change from the levels experienced during the first ninethree months of 20172022 of the U.S. dollar relative to foreign currencies that affected the Company would have resulted in less than a $1 million change in net lossincome for the same period.
24
Commodity Steel Pricing
Our business is sensitive to steel prices, which can impact our product pricing, with steel tubular prices generally having the highest degree of sensitivity. While we cannot predict steel prices, we mitigate this risk by managing our inventory levels, including maintaining sufficient quantity on hand to meet demand, while limiting the risk of overstocking.
Interest Rates
We are subject to interest rate risk with our revolving credit facility. The credit facility requires us to pay interest on outstanding borrowings at variable rates. Each one percentage point change in interest rates associated with the facility would result in a less than $1 million change in our quarterly cash interest expense based on the balance at September 30, 2017.24
Item 4. Controls and Procedures
Evaluation of Disclosure Controls and Procedures
As of the end of the period covered by this report, we carried out an evaluation, under the supervision and with the participation of the Company’s management, including the Company’s Chief Executive Officer and Chief Financial Officer, of the effectiveness of the design and operation of the Company’s disclosure controls and procedures. The Company’s disclosure controls and procedures are designed to provide reasonable assurance that the information required to be disclosed by the Company in the reports it files under the Exchange Act is accumulated and communicated to the Company’s management, including the Company’s Chief Executive Officer and Chief Financial Officer, as appropriate, to allow timely decisions regarding required disclosures and is recorded, processed, summarized and reported within the time period specified in the rules and forms of the Securities and Exchange Commission. Based upon that evaluation, the Company’s Chief Executive Officer and Chief Financial Officer concluded that the Company’s disclosure controls and procedures are effective as of the end of the period covered by this report at a reasonable assurance level.
Changes in Internal Control Over Financial Reporting
There has been no change in our internal control over financial reporting (as defined in Rule 13a-15(f) under the Exchange Act) that occurred during our last fiscal quarter that has materially affected, or is reasonably likely to materially affect, our internal control over financial reporting.
25
PART II—II – OTHER INFORMATION
(a) Exhibits
| (1)Filed as an Exhibit |
|
|
|
|
|
|
|
|
|
|
|
|
We hereby undertake, pursuant to Regulation S-K, Item 601(b), paragraph (4) (iii),our Current Report on Form 8-K filed on May 30, 2014
(2) Filed as an Exhibit to furnishour Amendment No.1 to the U.S. Securities and Exchange Commission, upon request, all constituent instruments defining the rights of holders ofForm 10, as amended, Registration Statement filed on April 8, 2014
(3) Filed as an Exhibit to our long-term debt notQuarterly Report on Form 10-Q filed herewith.on May 7, 2015
(4) Filed as an Exhibit to our Quarterly Report on Form 10-Q filed on November 2, 2016
(5) Filed as an Exhibit to our Current Report on Form 8-K filed on May 1, 2018
(6) Filed as an Exhibit to our Current Report on Form 8-K filed on May 21, 2020
(7) Filed as an Exhibit to our Current Report on Form 8-K filed on June 2, 2020
(8) Filed as an Exhibit to our Current Report on Form 8-K/A filed on February 4, 2022
26
SIGNATURE
SIGNATURE
Pursuant to the requirements of the Securities Exchange Act of 1934, the registrant has duly caused this report to be signed on its behalf by the undersigned thereunto duly authorized.
Date: November 1, 2017
|
| |
| ||
By: | /s/ Mark B. Johnson | |
Mark B. Johnson | ||
Senior Vice President and Chief Financial Officer | ||
27