
UNITED STATES
SECURITIES AND EXCHANGE COMMISSION
Washington, D.C. 20549
Form 10-Q
(Mark One)
☑ | QUARTERLY REPORT PURSUANT TO SECTION 13 OR 15(d) OF THE SECURITIES EXCHANGE ACT OF 1934 |
For the quarterly period ended SeptemberJune 30, 20172018
or
☐ | TRANSITION REPORT PURSUANT TO SECTION 13 OR 15(d) OF THE SECURITIES EXCHANGE ACT OF 1934 |
Commission File Number 001-32318
DEVON ENERGY CORPORATION
(Exact name of registrant as specified in its charter)
Delaware |
| 73-1567067 |
(State or other jurisdiction of incorporation or organization) |
| (I.R.S. Employer identification No.) |
|
| |
333 West Sheridan Avenue, Oklahoma City, Oklahoma |
| 73102-5015 |
(Address of principal executive offices) |
| (Zip code) |
Registrant’s telephone number, including area code: (405) 235-3611
Former name, address and former fiscal year, if changed from last report: Not applicable
Indicate by check mark whether the registrant (1) has filed all reports required to be filed by Section 13 or 15(d) of the Securities Exchange Act of 1934 during the preceding 12 months (or for such shorter period that the registrant was required to file such reports), and (2) has been subject to such filing requirements for the past 90 days. Yes ☑ No ☐
Indicate by check mark whether the registrant has submitted electronically and posted on its corporate Web site, if any, every Interactive Data File required to be submitted and posted pursuant to Rule 405 of Regulation S-T (§232.405 of this chapter) during the preceding 12 months (or for such shorter period that the registrant was required to submit and post such files). Yes ☑ No ☐
Indicate by check mark whether the registrant is a large accelerated filer, an accelerated filer, a non-accelerated filer, smaller reporting company or an emerging growth company. See the definitions of “large accelerated filer,” “accelerated filer,” “smaller reporting company,” and “emerging growth company” in Rule 12b-2 of the Exchange Act.
Large accelerated filer |
| ☑ | Accelerated filer |
| ☐ | Non-accelerated filer |
| ☐ |
Smaller reporting company |
| ☐ | Emerging growth company |
| ☐ |
|
|
|
If an emerging growth company, indicate by check mark if the registrant has elected not to use the extended transition period for complying with any new or revised financial accounting standards provided pursuant to Section 13(a) of the Exchange Act. ☐
Indicate by check mark whether the registrant is a shell company (as defined in Rule 12b-2 of the Act). Yes ☐ No ☑
On OctoberJuly 18, 2017, 525.52018, 508.8 million shares of common stock were outstanding.
FORM 10-Q
Part I. Financial Information |
| ||
Item 1. |
| 6 | |
|
| 6 | |
|
| 7 | |
|
| 8 | |
|
| 9 | |
|
| 10 | |
10 | |||
11 | |||
14 | |||
14 | |||
17 | |||
18 | |||
Note 7 – Restructuring and Transaction Costs and Other Expenses | 18 | ||
19 | |||
Note 9 – Net Earnings (Loss) Per Share From Continuing Operations | 20 | ||
20 | |||
Note 11 – Supplemental Information to Statements of Cash Flows | 21 | ||
21 | |||
21 | |||
22 | |||
22 | |||
23 | |||
23 | |||
24 | |||
24 | |||
25 | |||
26 | |||
27 | |||
Item 2. |
| Management’s Discussion and Analysis of Financial Condition and Results of Operations | 29 |
Item 3. |
|
| |
Item 4. |
|
| |
|
|
|
|
Part II. Other Information |
| ||
Item 1. |
|
| |
Item 1A. |
|
| |
Item 2. |
|
| |
Item 3. |
|
| |
Item 4. |
|
| |
Item 5. |
|
| |
Item 6. |
|
| |
|
|
|
|
|
|
| |
2
Unless the context otherwise indicates, references to “us,” “we,” “our,” “ours,” “Devon” and the “Company” refer to Devon Energy Corporation and its consolidated subsidiaries. All monetary values, other than per unit and per share amounts, are stated in millions of U.S. dollars unless otherwise specified. In addition, the following are other abbreviations and definitions of certain terms used within this Quarterly Report on Form 10-Q:
“2015 Plan”ASC” means the Devon Energy Corporation 2015 Long-Term Incentive Plan.
“2017 Plan” means the Devon Energy Corporation 2017 Long-Term Incentive Plan.Accounting Standards Codification.
“ASU” means Accounting Standards Update.
“Bbl” or “Bbls” means barrel or barrels.
“Boe” means barrel of oil equivalent. Gas proved reserves and production are converted to Boe, at the pressure and temperature base standard of each respective state in which the gas is produced, at the rate of six Mcf of gas per Bbl of oil, based upon the approximate relative energy content of gas and oil. Bitumen and NGL proved reserves and production are converted to Boe on a one-to-one basis with oil.
“Btu” means British thermal units, a measure of heating value.
“Canada” means the division of Devon encompassing oil and gas properties located in Canada. All dollar amounts associated with Canada are in U.S. dollars, unless stated otherwise.
“Canadian Plan” means Devon Canada Corporation Incentive Savings Plan.
“DD&A” means depreciation, depletion and amortization expenses.
“Devon Plan” means Devon Energy Corporation Incentive Savings Plan.
“E&P” means exploration and production activities.
“EnLink” means EnLink Midstream Partners, LP, a master limited partnership.
“FASB” means Financial Accounting Standards Board.
“G&A” means general and administrative expenses.
“GAAP” means U.S. generally accepted accounting principles.
“General Partner” means EnLink Midstream, LLC, the indirect general partner of EnLink.EnLink, and, unless the context otherwise indicates, EnLink Midstream Manager, LLC, the managing member of EnLink Midstream, LLC.
“Inside FERC” refers to the publication Inside FERC’s Gas Market Report.
“LIBOR” means London Interbank Offered Rate.
“LOE” means lease operating expenses.
“MBbls” means thousand barrels.
“MBoe” means thousand Boe.
“Mcf” means thousand cubic feet.
“MMBoe”MMBtu” means million Boe.Btu.
3
“MMcf” means million cubic feet.
“M&M operations” means marketing revenues minus marketing expenses.
“N/M” means not meaningful.
“NGL” or “NGLs” means natural gas liquids.
“NYMEX” means New York Mercantile Exchange.
“OPIS” means Oil Price Information Service.
“SEC” means United States Securities and Exchange Commission.
“Senior Credit Facility” means Devon’s syndicated unsecured revolving line of credit.
“Tax Reform Legislation” means Tax Cuts and Jobs Act.
“TSR” means total shareholder return.
“Upstream operations” means upstream revenues minus production expenses.
“U.S.” means United States of America.
“WTI” means West Texas Intermediate.
“/Bbl” means per barrel.
“/d” means per day.
“/Bbl” means per barrel.
“/MMBtu” means per MMBtu.
4
INFORMATION REGARDING FORWARD-LOOKING STATEMENTS
This report includes “forward-looking statements” as defined by the SEC. Such statements include those concerning strategic plans, our expectations and objectives for future operations, as well as other future events or conditions, and are often identified by use of the words “expects,” “believes,” “will,” “would,” “could,” “forecasts,” “projections,” “estimates,” “plans,” “expectations,” “targets,” “opportunities,” “potential,” “anticipates,” “outlook” and other similar terminology. Such forward-looking statements are based on our examination of historical operating trends, the information used to prepare our December 31, 20162017 reserve reports and other data in our possession or available from third parties. Such statements are subject to a number of assumptions, risks and uncertainties, many of which are beyond our control. Consequently, actual future results could differ materially from our expectations due to a number of factors, including, but not limited to:
the volatility of oil, gas and NGL prices;
uncertainties inherent in estimating oil, gas and NGL reserves;
the extent to which we are successful in acquiring and discovering additional reserves;
the uncertainties, costs and risks involved in explorationoil and development activities;
risks related to our hedging activities;
counterparty credit risks;gas operations;
regulatory restrictions, compliance costs and other risks relating to governmental regulation, including with respect to environmental matters;
risks related to our hedging activities;
counterparty credit risks;
risks relating to our indebtedness;
our ability to successfully complete mergers, acquisitions and divestitures;
the extent to which insurance covers any losses we may experience;cyberattack risks;
our limited control over third parties who operate some of our oil and gas properties;
midstream capacity constraints and potential interruptions in production;
the extent to which insurance covers any losses we may experience;
competition for leases, materials, people and capital;
cyberattacks targeting our systemsability to successfully complete mergers, acquisitions and infrastructure;divestitures; and
any of the other risks and uncertainties discussed in this report, our 2016 Annual Report on Form 10-K and our other filings with the SEC.
• | any of the other risks and uncertainties discussed in this report, our 2017 Annual Report on Form 10-K and our other filings with the SEC. |
All subsequent written and oral forward-looking statements attributable to Devon, or persons acting on its behalf, are expressly qualified in their entirety by the cautionary statements above. We assume no duty to update or revise our forward-looking statements based on new information, future events or otherwise.
5
DEVON ENERGY CORPORATION AND SUBSIDIARIES
CONSOLIDATED COMPREHENSIVE STATEMENTS OF EARNINGS
|
| Three Months Ended September 30, |
|
| Nine Months Ended September 30, |
| ||||||||||
|
| 2017 |
|
| 2016 |
|
| 2017 |
|
| 2016 |
| ||||
|
| (Unaudited) |
| |||||||||||||
|
| (Millions, except per share amounts) |
| |||||||||||||
Oil, gas and NGL sales |
| $ | 1,245 |
|
| $ | 1,113 |
|
| $ | 3,760 |
|
| $ | 3,023 |
|
Oil, gas and NGL derivatives |
|
| (144 | ) |
|
| 79 |
|
|
| 214 |
|
|
| (30 | ) |
Marketing and midstream revenues |
|
| 2,055 |
|
|
| 1,690 |
|
|
| 5,992 |
|
|
| 4,503 |
|
Asset dispositions and other |
|
| — |
|
|
| 1,351 |
|
|
| 10 |
|
|
| 1,351 |
|
Total revenues and other |
|
| 3,156 |
|
|
| 4,233 |
|
|
| 9,976 |
|
|
| 8,847 |
|
Lease operating expenses |
|
| 391 |
|
|
| 355 |
|
|
| 1,176 |
|
|
| 1,215 |
|
Marketing and midstream operating expenses |
|
| 1,813 |
|
|
| 1,480 |
|
|
| 5,319 |
|
|
| 3,884 |
|
General and administrative expenses |
|
| 153 |
|
|
| 141 |
|
|
| 498 |
|
|
| 482 |
|
Production and property taxes |
|
| 71 |
|
|
| 67 |
|
|
| 227 |
|
|
| 220 |
|
Depreciation, depletion and amortization |
|
| 400 |
|
|
| 394 |
|
|
| 1,162 |
|
|
| 1,420 |
|
Asset impairments |
|
| 2 |
|
|
| 319 |
|
|
| 9 |
|
|
| 4,851 |
|
Restructuring and transaction costs |
|
| — |
|
|
| (5 | ) |
|
| — |
|
|
| 266 |
|
Other operating items |
|
| — |
|
|
| 17 |
|
|
| 11 |
|
|
| 41 |
|
Total operating expenses |
|
| 2,830 |
|
|
| 2,768 |
|
|
| 8,402 |
|
|
| 12,379 |
|
Operating income (loss) |
|
| 326 |
|
|
| 1,465 |
|
|
| 1,574 |
|
|
| (3,532 | ) |
Net financing costs |
|
| 127 |
|
|
| 243 |
|
|
| 370 |
|
|
| 570 |
|
Other nonoperating items |
|
| (73 | ) |
|
| 44 |
|
|
| (124 | ) |
|
| 150 |
|
Earnings (loss) before income taxes |
|
| 272 |
|
|
| 1,178 |
|
|
| 1,328 |
|
|
| (4,252 | ) |
Income tax expense (benefit) |
|
| 25 |
|
|
| 171 |
|
|
| 51 |
|
|
| (228 | ) |
Net earnings (loss) |
|
| 247 |
|
|
| 1,007 |
|
|
| 1,277 |
|
|
| (4,024 | ) |
Net earnings (loss) attributable to noncontrolling interests |
|
| 19 |
|
|
| 14 |
|
|
| 59 |
|
|
| (391 | ) |
Net earnings (loss) attributable to Devon |
| $ | 228 |
|
| $ | 993 |
|
| $ | 1,218 |
|
| $ | (3,633 | ) |
Net earnings (loss) per share attributable to Devon: |
|
|
|
|
|
|
|
|
|
|
|
|
|
|
|
|
Basic |
| $ | 0.43 |
|
| $ | 1.90 |
|
| $ | 2.32 |
|
| $ | (7.22 | ) |
Diluted |
| $ | 0.43 |
|
| $ | 1.89 |
|
| $ | 2.31 |
|
| $ | (7.22 | ) |
Comprehensive earnings (loss): |
|
|
|
|
|
|
|
|
|
|
|
|
|
|
|
|
Net earnings (loss) |
| $ | 247 |
|
| $ | 1,007 |
|
| $ | 1,277 |
|
| $ | (4,024 | ) |
Other comprehensive earnings, net of tax: |
|
|
|
|
|
|
|
|
|
|
|
|
|
|
|
|
Foreign currency translation |
|
| 1 |
|
|
| 2 |
|
|
| 1 |
|
|
| 28 |
|
Pension and postretirement plans |
|
| 5 |
|
|
| 11 |
|
|
| 14 |
|
|
| 20 |
|
Other |
|
| — |
|
|
| — |
|
|
| (2 | ) |
|
| — |
|
Other comprehensive earnings, net of tax |
|
| 6 |
|
|
| 13 |
|
|
| 13 |
|
|
| 48 |
|
Comprehensive earnings (loss) |
|
| 253 |
|
|
| 1,020 |
|
|
| 1,290 |
|
|
| (3,976 | ) |
Comprehensive earnings (loss) attributable to noncontrolling interests |
|
| 19 |
|
|
| 14 |
|
|
| 59 |
|
|
| (391 | ) |
Comprehensive earnings (loss) attributable to Devon |
| $ | 234 |
|
| $ | 1,006 |
|
| $ | 1,231 |
|
| $ | (3,585 | ) |
|
| Three Months Ended June 30, |
|
| Six Months Ended June 30, |
| ||||||||||
|
| 2018 |
|
| 2017 |
|
| 2018 |
|
| 2017 |
| ||||
|
| (Unaudited) |
| |||||||||||||
Upstream revenues |
| $ | 1,069 |
|
| $ | 1,332 |
|
| $ | 2,388 |
|
| $ | 2,873 |
|
Marketing revenues |
|
| 1,180 |
|
|
| 833 |
|
|
| 2,059 |
|
|
| 1,692 |
|
Total revenues |
|
| 2,249 |
|
|
| 2,165 |
|
|
| 4,447 |
|
|
| 4,565 |
|
Production expenses |
|
| 572 |
|
|
| 455 |
|
|
| 1,115 |
|
|
| 912 |
|
Exploration expenses |
|
| 68 |
|
|
| 57 |
|
|
| 101 |
|
|
| 152 |
|
Marketing expenses |
|
| 1,160 |
|
|
| 849 |
|
|
| 2,033 |
|
|
| 1,728 |
|
Depreciation, depletion and amortization |
|
| 420 |
|
|
| 369 |
|
|
| 819 |
|
|
| 769 |
|
Asset impairments |
|
| 154 |
|
|
| — |
|
|
| 154 |
|
|
| — |
|
Asset dispositions |
|
| 23 |
|
|
| (22 | ) |
|
| 11 |
|
|
| (30 | ) |
General and administrative expenses |
|
| 153 |
|
|
| 181 |
|
|
| 352 |
|
|
| 376 |
|
Financing costs, net |
|
| 62 |
|
|
| 77 |
|
|
| 449 |
|
|
| 160 |
|
Restructuring and transaction costs |
|
| 94 |
|
|
| — |
|
|
| 94 |
|
|
| — |
|
Other expenses |
|
| 24 |
|
|
| (8 | ) |
|
| 45 |
|
|
| (22 | ) |
Total expenses |
|
| 2,730 |
|
|
| 1,958 |
|
|
| 5,173 |
|
|
| 4,045 |
|
Earnings (loss) from continuing operations before income taxes |
|
| (481 | ) |
|
| 207 |
|
|
| (726 | ) |
|
| 520 |
|
Income tax benefit |
|
| (7 | ) |
|
| (5 | ) |
|
| (41 | ) |
|
| — |
|
Net earnings (loss) from continuing operations |
|
| (474 | ) |
|
| 212 |
|
|
| (685 | ) |
|
| 520 |
|
Net earnings from discontinued operations, net of income tax expense |
|
| 139 |
|
|
| 33 |
|
|
| 197 |
|
|
| 42 |
|
Net earnings (loss) |
|
| (335 | ) |
|
| 245 |
|
|
| (488 | ) |
|
| 562 |
|
Net earnings attributable to noncontrolling interests |
|
| 90 |
|
|
| 26 |
|
|
| 134 |
|
|
| 40 |
|
Net earnings (loss) attributable to Devon |
| $ | (425 | ) |
| $ | 219 |
|
| $ | (622 | ) |
| $ | 522 |
|
Basic net earnings (loss) per share: |
|
|
|
|
|
|
|
|
|
|
|
|
|
|
|
|
Basic earnings (loss) from continuing operations per share |
| $ | (0.92 | ) |
| $ | 0.40 |
|
| $ | (1.33 | ) |
| $ | 0.99 |
|
Basic earnings from discontinued operations per share |
|
| 0.09 |
|
|
| 0.01 |
|
|
| 0.13 |
|
|
| — |
|
Basic net earnings (loss) per share |
| $ | (0.83 | ) |
| $ | 0.41 |
|
| $ | (1.20 | ) |
| $ | 0.99 |
|
Diluted net earnings (loss) per share: |
|
|
|
|
|
|
|
|
|
|
|
|
|
|
|
|
Diluted earnings (loss) from continuing operations per share |
| $ | (0.92 | ) |
| $ | 0.40 |
|
| $ | (1.33 | ) |
| $ | 0.99 |
|
Diluted earnings from discontinued operations per share |
|
| 0.09 |
|
|
| 0.01 |
|
|
| 0.13 |
|
|
| — |
|
Diluted net earnings (loss) per share |
| $ | (0.83 | ) |
| $ | 0.41 |
|
| $ | (1.20 | ) |
| $ | 0.99 |
|
Comprehensive earnings (loss): |
|
|
|
|
|
|
|
|
|
|
|
|
|
|
|
|
Net earnings (loss) |
| $ | (335 | ) |
| $ | 245 |
|
| $ | (488 | ) |
| $ | 562 |
|
Other comprehensive earnings (loss), net of tax: |
|
|
|
|
|
|
|
|
|
|
|
|
|
|
|
|
Foreign currency translation |
|
| (34 | ) |
|
| 28 |
|
|
| (82 | ) |
|
| 36 |
|
Pension and postretirement plans |
|
| 3 |
|
|
| 4 |
|
|
| 7 |
|
|
| 9 |
|
Other comprehensive earnings (loss), net of tax |
|
| (31 | ) |
|
| 32 |
|
|
| (75 | ) |
|
| 45 |
|
Comprehensive earnings (loss) |
|
| (366 | ) |
|
| 277 |
|
|
| (563 | ) |
|
| 607 |
|
Comprehensive earnings attributable to noncontrolling interests |
|
| 90 |
|
|
| 26 |
|
|
| 134 |
|
|
| 40 |
|
Comprehensive earnings (loss) attributable to Devon |
| $ | (456 | ) |
| $ | 251 |
|
| $ | (697 | ) |
| $ | 567 |
|
See accompanying notes to consolidated financial statements
6
DEVON ENERGY CORPORATION AND SUBSIDIARIES
CONSOLIDATED STATEMENTS OF CASH FLOWS
|
|
|
|
|
|
| ||||||||||
|
| Three Months Ended September 30, |
|
| Nine Months Ended September 30, |
| ||||||||||
|
| 2017 |
|
| 2016 |
|
| 2017 |
|
| 2016 |
| ||||
|
| (Unaudited) |
| |||||||||||||
|
| (Millions) |
| |||||||||||||
Cash flows from operating activities: |
|
|
|
|
|
|
|
|
|
|
|
|
|
|
|
|
Net earnings (loss) |
| $ | 247 |
|
| $ | 1,007 |
|
| $ | 1,277 |
|
| $ | (4,024 | ) |
Adjustments to reconcile net earnings (loss) to net cash from operating activities: |
|
|
|
|
|
|
|
|
|
|
|
|
|
|
|
|
Depreciation, depletion and amortization |
|
| 400 |
|
|
| 394 |
|
|
| 1,162 |
|
|
| 1,420 |
|
Asset impairments |
|
| 2 |
|
|
| 319 |
|
|
| 9 |
|
|
| 4,851 |
|
Gains and losses on asset sales |
|
| 1 |
|
|
| (1,351 | ) |
|
| (6 | ) |
|
| (1,351 | ) |
Deferred income tax expense (benefit) |
|
| (14 | ) |
|
| 86 |
|
|
| (20 | ) |
|
| (300 | ) |
Commodity derivatives |
|
| 144 |
|
|
| (79 | ) |
|
| (214 | ) |
|
| 30 |
|
Cash settlements on commodity derivatives |
|
| 24 |
|
|
| 12 |
|
|
| 43 |
|
|
| 15 |
|
Other derivatives and financial instruments |
|
| 9 |
|
|
| 21 |
|
|
| 16 |
|
|
| 329 |
|
Cash settlements on other derivatives and financial instruments |
|
| — |
|
|
| 3 |
|
|
| — |
|
|
| (148 | ) |
Asset retirement obligation accretion |
|
| 16 |
|
|
| 19 |
|
|
| 47 |
|
|
| 58 |
|
Share-based compensation |
|
| 33 |
|
|
| 23 |
|
|
| 122 |
|
|
| 163 |
|
Other |
|
| (85 | ) |
|
| 127 |
|
|
| (134 | ) |
|
| (31 | ) |
Net change in working capital |
|
| 7 |
|
|
| 137 |
|
|
| 94 |
|
|
| 208 |
|
Change in long-term other assets |
|
| 2 |
|
|
| (3 | ) |
|
| 12 |
|
|
| 10 |
|
Change in long-term other liabilities |
|
| (10 | ) |
|
| 12 |
|
|
| 12 |
|
|
| 7 |
|
Net cash from operating activities |
|
| 776 |
|
|
| 727 |
|
|
| 2,420 |
|
|
| 1,237 |
|
Cash flows from investing activities: |
|
|
|
|
|
|
|
|
|
|
|
|
|
|
|
|
Capital expenditures |
|
| (735 | ) |
|
| (421 | ) |
|
| (2,203 | ) |
|
| (1,659 | ) |
Acquisitions of property, equipment and businesses |
|
| (6 | ) |
|
| (3 | ) |
|
| (39 | ) |
|
| (1,641 | ) |
Proceeds from sale of investment |
|
| — |
|
|
| — |
|
|
| 190 |
|
|
| — |
|
Divestitures of property and equipment |
|
| 209 |
|
|
| 1,680 |
|
|
| 323 |
|
|
| 1,889 |
|
Other |
|
| (1 | ) |
|
| 34 |
|
|
| (5 | ) |
|
| 7 |
|
Net cash from investing activities |
|
| (533 | ) |
|
| 1,290 |
|
|
| (1,734 | ) |
|
| (1,404 | ) |
Cash flows from financing activities: |
|
|
|
|
|
|
|
|
|
|
|
|
|
|
|
|
Borrowings of long-term debt, net of issuance costs |
|
| 413 |
|
|
| 816 |
|
|
| 2,208 |
|
|
| 1,662 |
|
Repayments of long-term debt |
|
| (571 | ) |
|
| (2,173 | ) |
|
| (1,950 | ) |
|
| (2,722 | ) |
Payment of installment payable |
|
| — |
|
|
| — |
|
|
| (250 | ) |
|
| — |
|
Net short-term debt repayments |
|
| — |
|
|
| — |
|
|
| — |
|
|
| (626 | ) |
Early retirement of debt |
|
| — |
|
|
| (82 | ) |
|
| (6 | ) |
|
| (82 | ) |
Issuance of common stock |
|
| — |
|
|
| — |
|
|
| — |
|
|
| 1,469 |
|
Issuance of subsidiary units |
|
| 414 |
|
|
| 59 |
|
|
| 486 |
|
|
| 835 |
|
Dividends paid on common stock |
|
| (30 | ) |
|
| (32 | ) |
|
| (95 | ) |
|
| (190 | ) |
Contributions from noncontrolling interests |
|
| 18 |
|
|
| 146 |
|
|
| 47 |
|
|
| 152 |
|
Distributions to noncontrolling interests |
|
| (84 | ) |
|
| (77 | ) |
|
| (247 | ) |
|
| (224 | ) |
Shares exchanged for tax withholdings |
|
| (3 | ) |
|
| (2 | ) |
|
| (67 | ) |
|
| (30 | ) |
Other |
|
| — |
|
|
| (1 | ) |
|
| (2 | ) |
|
| (7 | ) |
Net cash from financing activities |
|
| 157 |
|
|
| (1,346 | ) |
|
| 124 |
|
|
| 237 |
|
Effect of exchange rate changes on cash |
|
| 12 |
|
|
| (9 | ) |
|
| 12 |
|
|
| 5 |
|
Net change in cash and cash equivalents |
|
| 412 |
|
|
| 662 |
|
|
| 822 |
|
|
| 75 |
|
Cash and cash equivalents at beginning of period |
|
| 2,369 |
|
|
| 1,723 |
|
|
| 1,959 |
|
|
| 2,310 |
|
Cash and cash equivalents at end of period |
| $ | 2,781 |
|
| $ | 2,385 |
|
| $ | 2,781 |
|
| $ | 2,385 |
|
|
| Three Months Ended June 30, |
|
| Six Months Ended June 30, |
| ||||||||||
|
| 2018 |
|
| 2017 |
|
| 2018 |
|
| 2017 |
| ||||
|
| (Unaudited) |
| |||||||||||||
Cash flows from operating activities: |
|
|
|
|
|
|
|
|
|
|
|
|
|
|
|
|
Net earnings (loss) |
| $ | (335 | ) |
| $ | 245 |
|
| $ | (488 | ) |
| $ | 562 |
|
Adjustments to reconcile net earnings to net cash from operating activities: |
|
|
|
|
|
|
|
|
|
|
|
|
|
|
|
|
Earnings from discontinued operations, net of tax |
|
| (139 | ) |
|
| (33 | ) |
|
| (197 | ) |
|
| (42 | ) |
Depreciation, depletion and amortization |
|
| 420 |
|
|
| 369 |
|
|
| 819 |
|
|
| 769 |
|
Asset impairments |
|
| 154 |
|
|
| — |
|
|
| 154 |
|
|
| — |
|
Leasehold impairments |
|
| 53 |
|
|
| 22 |
|
|
| 61 |
|
|
| 64 |
|
Accretion on discounted liabilities |
|
| 15 |
|
|
| 15 |
|
|
| 31 |
|
|
| 32 |
|
Total (gains) losses on commodity derivatives |
|
| 497 |
|
|
| (126 | ) |
|
| 538 |
|
|
| (358 | ) |
Cash settlements on commodity derivatives |
|
| (131 | ) |
|
| 11 |
|
|
| (120 | ) |
|
| 19 |
|
(Gains) losses on asset dispositions |
|
| 23 |
|
|
| (22 | ) |
|
| 11 |
|
|
| (30 | ) |
Deferred income tax expense (benefit) |
|
| 20 |
|
|
| (17 | ) |
|
| (18 | ) |
|
| (32 | ) |
Share-based compensation |
|
| 58 |
|
|
| 45 |
|
|
| 96 |
|
|
| 81 |
|
Early retirement of debt |
|
| — |
|
|
| — |
|
|
| 312 |
|
|
| — |
|
Total (gains) losses on foreign exchange |
|
| 31 |
|
|
| (49 | ) |
|
| 81 |
|
|
| (64 | ) |
Settlements of intercompany foreign denominated assets/liabilities |
|
| (244 | ) |
|
| 1 |
|
|
| (243 | ) |
|
| 10 |
|
Other |
|
| (20 | ) |
|
| 23 |
|
|
| (50 | ) |
|
| 11 |
|
Changes in assets and liabilities, net |
|
| (133 | ) |
|
| 102 |
|
|
| (108 | ) |
|
| 133 |
|
Net cash from operating activities - continuing operations |
|
| 269 |
|
|
| 586 |
|
|
| 879 |
|
|
| 1,155 |
|
Cash flows from investing activities: |
|
|
|
|
|
|
|
|
|
|
|
|
|
|
|
|
Capital expenditures |
|
| (602 | ) |
|
| (434 | ) |
|
| (1,253 | ) |
|
| (831 | ) |
Acquisitions of property and equipment |
|
| (10 | ) |
|
| (13 | ) |
|
| (16 | ) |
|
| (33 | ) |
Divestitures of property and equipment |
|
| 560 |
|
|
| 75 |
|
|
| 607 |
|
|
| 107 |
|
Net cash from investing activities - continuing operations |
|
| (52 | ) |
|
| (372 | ) |
|
| (662 | ) |
|
| (757 | ) |
Cash flows from financing activities: |
|
|
|
|
|
|
|
|
|
|
|
|
|
|
|
|
Repayments of long-term debt principal |
|
| — |
|
|
| — |
|
|
| (807 | ) |
|
| — |
|
Early retirement of debt |
|
| — |
|
|
| — |
|
|
| (304 | ) |
|
| — |
|
Repurchases of common stock |
|
| (428 | ) |
|
| — |
|
|
| (499 | ) |
|
| — |
|
Dividends paid on common stock |
|
| (42 | ) |
|
| (33 | ) |
|
| (74 | ) |
|
| (65 | ) |
Shares exchanged for tax withholdings |
|
| (6 | ) |
|
| (3 | ) |
|
| (44 | ) |
|
| (56 | ) |
Net cash from financing activities - continuing operations |
|
| (476 | ) |
|
| (36 | ) |
|
| (1,728 | ) |
|
| (121 | ) |
Effect of exchange rate changes on cash: |
|
|
|
|
|
|
|
|
|
|
|
|
|
|
|
|
Settlements of intercompany foreign denominated assets/liabilities |
|
| 244 |
|
|
| (1 | ) |
|
| 243 |
|
|
| (10 | ) |
Other |
|
| (17 | ) |
|
| 9 |
|
|
| (31 | ) |
|
| 10 |
|
Total effect of exchange rate changes on cash - continuing operations |
|
| 227 |
|
|
| 8 |
|
|
| 212 |
|
|
| — |
|
Net change in cash, cash equivalents and restricted cash of continuing operations |
|
| (32 | ) |
|
| 186 |
|
|
| (1,299 | ) |
|
| 277 |
|
Cash flows from discontinued operations: |
|
|
|
|
|
|
|
|
|
|
|
|
|
|
|
|
Operating activities |
|
| 236 |
|
|
| 151 |
|
|
| 430 |
|
|
| 328 |
|
Investing activities |
|
| (222 | ) |
|
| (215 | ) |
|
| (402 | ) |
|
| (284 | ) |
Financing activities |
|
| 73 |
|
|
| 128 |
|
|
| 112 |
|
|
| 89 |
|
Net change in cash, cash equivalents and restricted cash of discontinued operations |
|
| 87 |
|
|
| 64 |
|
|
| 140 |
|
|
| 133 |
|
Net change in cash, cash equivalents and restricted cash |
|
| 55 |
|
|
| 250 |
|
|
| (1,159 | ) |
|
| 410 |
|
Cash, cash equivalents and restricted cash at beginning of period |
|
| 1,470 |
|
|
| 2,119 |
|
|
| 2,684 |
|
|
| 1,959 |
|
Cash, cash equivalents and restricted cash at end of period |
| $ | 1,525 |
|
| $ | 2,369 |
|
| $ | 1,525 |
|
| $ | 2,369 |
|
|
|
|
|
|
|
|
|
|
|
|
|
|
|
|
|
|
Reconciliation of cash, cash equivalents and restricted cash: |
|
|
|
|
|
|
|
|
|
|
|
|
|
|
|
|
Cash and cash equivalents |
| $ | 1,460 |
|
| $ | 2,358 |
|
| $ | 1,460 |
|
| $ | 2,358 |
|
Restricted cash included in other current assets |
|
| 28 |
|
|
| — |
|
|
| 28 |
|
|
| — |
|
Cash and cash equivalents included in current assets held for sale |
|
| 37 |
|
|
| 11 |
|
|
| 37 |
|
|
| 11 |
|
Total cash, cash equivalents and restricted cash |
| $ | 1,525 |
|
| $ | 2,369 |
|
| $ | 1,525 |
|
| $ | 2,369 |
|
See accompanying notes to consolidated financial statements
7
DEVON ENERGY CORPORATION AND SUBSIDIARIES
|
| September 30, 2017 |
|
| December 31, 2016 |
| ||||||||||
|
| (Unaudited) |
|
|
|
|
|
| June 30, 2018 |
|
| December 31, 2017 |
| |||
|
| (Millions, except share data) |
|
| (Unaudited) |
|
|
|
|
| ||||||
ASSETS |
|
|
|
|
|
|
|
|
|
|
|
|
|
|
|
|
Current assets: |
|
|
|
|
|
|
|
|
|
|
|
|
|
|
|
|
Cash and cash equivalents |
| $ | 2,781 |
|
| $ | 1,959 |
|
| $ | 1,460 |
|
| $ | 2,642 |
|
Accounts receivable |
|
| 1,462 |
|
|
| 1,356 |
|
|
| 1,141 |
|
|
| 989 |
|
Assets held for sale |
|
| — |
|
|
| 193 |
| ||||||||
Current assets held for sale |
|
| 10,764 |
|
|
| 760 |
| ||||||||
Other current assets |
|
| 379 |
|
|
| 264 |
|
|
| 455 |
|
|
| 400 |
|
Total current assets |
|
| 4,622 |
|
|
| 3,772 |
|
|
| 13,820 |
|
|
| 4,791 |
|
Property and equipment, at cost: |
|
|
|
|
|
|
|
| ||||||||
Oil and gas, based on full cost accounting: |
|
|
|
|
|
|
|
| ||||||||
Subject to amortization |
|
| 78,470 |
|
|
| 75,648 |
| ||||||||
Not subject to amortization |
|
| 2,853 |
|
|
| 3,437 |
| ||||||||
Total oil and gas |
|
| 81,323 |
|
|
| 79,085 |
| ||||||||
Midstream and other |
|
| 11,097 |
|
|
| 10,455 |
| ||||||||
Total property and equipment, at cost |
|
| 92,420 |
|
|
| 89,540 |
| ||||||||
Less accumulated depreciation, depletion and amortization |
|
| (75,338 | ) |
|
| (73,350 | ) | ||||||||
Property and equipment, net |
|
| 17,082 |
|
|
| 16,190 |
| ||||||||
Oil and gas property and equipment, based on successful efforts accounting, net |
|
| 12,957 |
|
|
| 13,318 |
| ||||||||
Other property and equipment, net |
|
| 1,164 |
|
|
| 1,266 |
| ||||||||
Total property and equipment, net |
|
| 14,121 |
|
|
| 14,584 |
| ||||||||
Goodwill |
|
| 3,964 |
|
|
| 3,964 |
|
|
| 841 |
|
|
| 841 |
|
Other long-term assets |
|
| 1,891 |
|
|
| 1,987 |
|
|
| 377 |
|
|
| 296 |
|
Long-term assets held for sale |
|
| — |
|
|
| 9,729 |
| ||||||||
Total assets |
| $ | 27,559 |
|
| $ | 25,913 |
|
| $ | 29,159 |
|
| $ | 30,241 |
|
LIABILITIES AND EQUITY |
|
|
|
|
|
|
|
|
|
|
|
|
|
|
|
|
Current liabilities: |
|
|
|
|
|
|
|
|
|
|
|
|
|
|
|
|
Accounts payable |
| $ | 797 |
|
| $ | 642 |
|
| $ | 771 |
|
| $ | 633 |
|
Revenues and royalties payable |
|
| 1,012 |
|
|
| 908 |
|
|
| 959 |
|
|
| 748 |
|
Short-term debt |
|
| 20 |
|
|
| — |
|
|
| 277 |
|
|
| 115 |
|
Current liabilities held for sale |
|
| 5,291 |
|
|
| 991 |
| ||||||||
Other current liabilities |
|
| 1,003 |
|
|
| 1,066 |
|
|
| 1,079 |
|
|
| 828 |
|
Total current liabilities |
|
| 2,832 |
|
|
| 2,616 |
|
|
| 8,377 |
|
|
| 3,315 |
|
Long-term debt |
|
| 10,383 |
|
|
| 10,154 |
|
|
| 5,790 |
|
|
| 6,749 |
|
Asset retirement obligations |
|
| 1,100 |
|
|
| 1,226 |
|
|
| 1,088 |
|
|
| 1,099 |
|
Other long-term liabilities |
|
| 645 |
|
|
| 894 |
|
|
| 624 |
|
|
| 549 |
|
Long-term liabilities held for sale |
|
| — |
|
|
| 3,936 |
| ||||||||
Deferred income taxes |
|
| 665 |
|
|
| 648 |
|
|
| 432 |
|
|
| 489 |
|
Equity: |
|
|
|
|
|
|
|
|
|
|
|
|
|
|
|
|
Common stock, $0.10 par value. Authorized 1.0 billion shares; issued 525 million and 523 million shares in 2017 and 2016, respectively |
|
| 53 |
|
|
| 52 |
| ||||||||
Common stock, $0.10 par value. Authorized 1.0 billion shares; issued 515 million and 525 million shares in 2018 and 2017, respectively |
|
| 51 |
|
|
| 53 |
| ||||||||
Additional paid-in capital |
|
| 7,207 |
|
|
| 7,237 |
|
|
| 6,888 |
|
|
| 7,333 |
|
Accumulated deficit |
|
| (428 | ) |
|
| (1,646 | ) | ||||||||
Retained earnings |
|
| 6 |
|
|
| 702 |
| ||||||||
Accumulated other comprehensive earnings |
|
| 297 |
|
|
| 284 |
|
|
| 1,091 |
|
|
| 1,166 |
|
Treasury stock, at cost, 0.5 million shares in 2018 |
|
| (22 | ) |
|
| — |
| ||||||||
Total stockholders’ equity attributable to Devon |
|
| 7,129 |
|
|
| 5,927 |
|
|
| 8,014 |
|
|
| 9,254 |
|
Noncontrolling interests |
|
| 4,805 |
|
|
| 4,448 |
|
|
| 4,834 |
|
|
| 4,850 |
|
Total equity |
|
| 11,934 |
|
|
| 10,375 |
|
|
| 12,848 |
|
|
| 14,104 |
|
Total liabilities and equity |
| $ | 27,559 |
|
| $ | 25,913 |
|
| $ | 29,159 |
|
| $ | 30,241 |
|
See accompanying notes to consolidated financial statements
8
DEVON ENERGY CORPORATION AND SUBSIDIARIES
CONSOLIDATED STATEMENTS OF EQUITY
|
|
|
|
|
|
|
|
|
|
|
|
|
|
|
|
|
| Accumulated |
|
|
|
|
|
|
|
|
|
|
|
|
| |
|
|
|
|
|
|
|
|
|
| Additional |
|
| Retained |
|
| Other |
|
|
|
|
|
|
|
|
|
|
|
| ||||
|
| Common Stock |
|
| Paid-In |
|
| Earnings |
|
| Comprehensive |
|
| Treasury |
|
| Noncontrolling |
|
| Total |
| |||||||||||
|
| Shares |
|
| Amount |
|
| Capital |
|
| (Accumulated Deficit) |
|
| Earnings |
|
| Stock |
|
| Interests |
|
| Equity |
| ||||||||
|
| (Unaudited) |
| |||||||||||||||||||||||||||||
|
| (Millions) |
| |||||||||||||||||||||||||||||
Nine Months Ended September 30, 2017 |
|
|
|
|
|
|
|
|
|
|
|
|
|
|
|
|
|
|
|
|
|
|
|
|
|
|
|
|
|
|
|
|
Balance as of December 31, 2016 |
|
| 523 |
|
| $ | 52 |
|
| $ | 7,237 |
|
| $ | (1,646 | ) |
| $ | 284 |
|
| $ | — |
|
| $ | 4,448 |
|
| $ | 10,375 |
|
Net earnings |
|
| — |
|
|
| — |
|
|
| — |
|
|
| 1,218 |
|
|
| — |
|
|
| — |
|
|
| 59 |
|
|
| 1,277 |
|
Other comprehensive earnings, net of tax |
|
| — |
|
|
| — |
|
|
| — |
|
|
| — |
|
|
| 13 |
|
|
| — |
|
|
| — |
|
|
| 13 |
|
Restricted stock grants, net of cancellations |
|
| 1 |
|
|
| 1 |
|
|
| — |
|
|
| — |
|
|
| — |
|
|
| — |
|
|
| — |
|
|
| 1 |
|
Common stock repurchased |
|
| — |
|
|
| — |
|
|
| — |
|
|
| — |
|
|
| — |
|
|
| (43 | ) |
|
| — |
|
|
| (43 | ) |
Common stock retired |
|
| — |
|
|
| — |
|
|
| (43 | ) |
|
| — |
|
|
| — |
|
|
| 43 |
|
|
| — |
|
|
| — |
|
Common stock dividends |
|
| — |
|
|
| — |
|
|
| (95 | ) |
|
| — |
|
|
| — |
|
|
| — |
|
|
| — |
|
|
| (95 | ) |
Share-based compensation |
|
| 1 |
|
|
| — |
|
|
| 96 |
|
|
| — |
|
|
| — |
|
|
| — |
|
|
| — |
|
|
| 96 |
|
Subsidiary equity transactions |
|
| — |
|
|
| — |
|
|
| 12 |
|
|
| — |
|
|
| — |
|
|
| — |
|
|
| 545 |
|
|
| 557 |
|
Distributions to noncontrolling interests |
|
| — |
|
|
| — |
|
|
| — |
|
|
| — |
|
|
| — |
|
|
| — |
|
|
| (247 | ) |
|
| (247 | ) |
Balance as of September 30, 2017 |
|
| 525 |
|
| $ | 53 |
|
| $ | 7,207 |
|
| $ | (428 | ) |
| $ | 297 |
|
| $ | — |
|
| $ | 4,805 |
|
| $ | 11,934 |
|
Nine Months Ended September 30, 2016 |
|
|
|
|
|
|
|
|
|
|
|
|
|
|
|
|
|
|
|
|
|
|
|
|
|
|
|
|
|
|
|
|
Balance as of December 31, 2015 |
|
| 418 |
|
| $ | 42 |
|
| $ | 4,996 |
|
| $ | 1,781 |
|
| $ | 230 |
|
| $ | — |
|
| $ | 3,940 |
|
| $ | 10,989 |
|
Net loss |
|
| — |
|
|
| — |
|
|
| — |
|
|
| (3,633 | ) |
|
| — |
|
|
| — |
|
|
| (391 | ) |
|
| (4,024 | ) |
Other comprehensive earnings, net of tax |
|
| — |
|
|
| — |
|
|
| — |
|
|
| — |
|
|
| 48 |
|
|
| — |
|
|
| — |
|
|
| 48 |
|
Restricted stock grants, net of cancellations |
|
| 3 |
|
|
| — |
|
|
| — |
|
|
| — |
|
|
| — |
|
|
| — |
|
|
| — |
|
|
| — |
|
Common stock repurchased |
|
| — |
|
|
| — |
|
|
| — |
|
|
| — |
|
|
| — |
|
|
| (23 | ) |
|
| — |
|
|
| (23 | ) |
Common stock retired |
|
| — |
|
|
| — |
|
|
| (23 | ) |
|
| — |
|
|
| — |
|
|
| 23 |
|
|
| — |
|
|
| — |
|
Common stock dividends |
|
| — |
|
|
| — |
|
|
| (65 | ) |
|
| (125 | ) |
|
| — |
|
|
| — |
|
|
| — |
|
|
| (190 | ) |
Common stock issued |
|
| 103 |
|
|
| 10 |
|
|
| 2,117 |
|
|
| — |
|
|
| — |
|
|
| — |
|
|
| — |
|
|
| 2,127 |
|
Share-based compensation |
|
| — |
|
|
| — |
|
|
| 142 |
|
|
| — |
|
|
| — |
|
|
| — |
|
|
| — |
|
|
| 142 |
|
Subsidiary equity transactions |
|
| — |
|
|
| — |
|
|
| 320 |
|
|
| — |
|
|
| — |
|
|
| — |
|
|
| 896 |
|
|
| 1,216 |
|
Distributions to noncontrolling interests |
|
| — |
|
|
| — |
|
|
| — |
|
|
| — |
|
|
| — |
|
|
| — |
|
|
| (224 | ) |
|
| (224 | ) |
Balance as of September 30, 2016 |
|
| 524 |
|
| $ | 52 |
|
| $ | 7,487 |
|
| $ | (1,977 | ) |
| $ | 278 |
|
| $ | — |
|
| $ | 4,221 |
|
| $ | 10,061 |
|
|
|
|
|
|
|
|
|
|
|
|
|
|
| Retained |
|
| Accumulated |
|
|
|
|
|
|
|
|
|
|
|
|
| ||
|
|
|
|
|
|
|
|
|
| Additional |
|
| Earnings |
|
| Other |
|
|
|
|
|
|
|
|
|
|
|
|
| |||
|
| Common Stock |
|
| Paid-In |
|
| (Accumulated |
|
| Comprehensive |
|
| Treasury |
|
| Noncontrolling |
|
| Total |
| |||||||||||
|
| Shares |
|
| Amount |
|
| Capital |
|
| Deficit) |
|
| Earnings |
|
| Stock |
|
| Interests |
|
| Equity |
| ||||||||
|
| (Unaudited) |
| |||||||||||||||||||||||||||||
Six Months Ended June 30, 2018 |
|
|
|
|
|
|
|
|
|
|
|
|
|
|
|
|
|
|
|
|
|
|
|
|
|
|
|
|
|
|
|
|
Balance as of December 31, 2017 |
|
| 525 |
|
| $ | 53 |
|
| $ | 7,333 |
|
| $ | 702 |
|
| $ | 1,166 |
|
| $ | — |
|
| $ | 4,850 |
|
| $ | 14,104 |
|
Net earnings (loss) |
|
| — |
|
|
| — |
|
|
| — |
|
|
| (622 | ) |
|
| — |
|
|
| — |
|
|
| 134 |
|
|
| (488 | ) |
Other comprehensive loss, net of tax |
|
| — |
|
|
| — |
|
|
| — |
|
|
| — |
|
|
| (75 | ) |
|
| — |
|
|
| — |
|
|
| (75 | ) |
Restricted stock grants, net of cancellations |
|
| 3 |
|
|
| — |
|
|
| — |
|
|
| — |
|
|
| — |
|
|
| — |
|
|
| — |
|
|
| — |
|
Common stock repurchased |
|
| — |
|
|
| (1 | ) |
|
| — |
|
|
| — |
|
|
| — |
|
|
| (555 | ) |
|
| — |
|
|
| (556 | ) |
Common stock retired |
|
| (14 | ) |
|
| (1 | ) |
|
| (532 | ) |
|
| — |
|
|
| — |
|
|
| 533 |
|
|
| — |
|
|
| — |
|
Common stock dividends |
|
| — |
|
|
| — |
|
|
| — |
|
|
| (74 | ) |
|
| — |
|
|
| — |
|
|
| — |
|
|
| (74 | ) |
Share-based compensation |
|
| 1 |
|
|
| — |
|
|
| 89 |
|
|
| — |
|
|
| — |
|
|
| — |
|
|
| — |
|
|
| 89 |
|
Subsidiary equity transactions |
|
| — |
|
|
| — |
|
|
| (2 | ) |
|
| — |
|
|
| — |
|
|
| — |
|
|
| 69 |
|
|
| 67 |
|
Distributions to noncontrolling interests |
|
| — |
|
|
| — |
|
|
| — |
|
|
| — |
|
|
| — |
|
|
| — |
|
|
| (219 | ) |
|
| (219 | ) |
Balance as of June 30, 2018 |
|
| 515 |
|
| $ | 51 |
|
| $ | 6,888 |
|
| $ | 6 |
|
| $ | 1,091 |
|
| $ | (22 | ) |
| $ | 4,834 |
|
| $ | 12,848 |
|
Six Months Ended June 30, 2017 |
|
|
|
|
|
|
|
|
|
|
|
|
|
|
|
|
|
|
|
|
|
|
|
|
|
|
|
|
|
|
|
|
Balance as of December 31, 2016 |
|
| 523 |
|
| $ | 52 |
|
| $ | 7,237 |
|
| $ | (69 | ) |
| $ | 1,054 |
|
| $ | — |
|
| $ | 4,448 |
|
| $ | 12,722 |
|
Net earnings |
|
| — |
|
|
| — |
|
|
| — |
|
|
| 522 |
|
|
| — |
|
|
| — |
|
|
| 40 |
|
|
| 562 |
|
Other comprehensive earnings, net of tax |
|
| — |
|
|
| — |
|
|
| — |
|
|
| — |
|
|
| 45 |
|
|
| — |
|
|
| — |
|
|
| 45 |
|
Restricted stock grants, net of cancellations |
|
| 2 |
|
|
| 1 |
|
|
| — |
|
|
| — |
|
|
| — |
|
|
| — |
|
|
| — |
|
|
| 1 |
|
Common stock repurchased |
|
| — |
|
|
| — |
|
|
| — |
|
|
| — |
|
|
| — |
|
|
| (41 | ) |
|
| — |
|
|
| (41 | ) |
Common stock retired |
|
| — |
|
|
| — |
|
|
| (41 | ) |
|
| — |
|
|
| — |
|
|
| 41 |
|
|
| — |
|
|
| — |
|
Common stock dividends |
|
| — |
|
|
| — |
|
|
| — |
|
|
| (65 | ) |
|
| — |
|
|
| — |
|
|
| — |
|
|
| (65 | ) |
Share-based compensation |
|
| 1 |
|
|
| — |
|
|
| 69 |
|
|
| — |
|
|
| — |
|
|
| — |
|
|
| — |
|
|
| 69 |
|
Subsidiary equity transactions |
|
| — |
|
|
| — |
|
|
| 11 |
|
|
| — |
|
|
| — |
|
|
| — |
|
|
| 106 |
|
|
| 117 |
|
Distributions to noncontrolling interests |
|
| — |
|
|
| — |
|
|
| — |
|
|
| — |
|
|
| — |
|
|
| — |
|
|
| (163 | ) |
|
| (163 | ) |
Balance as of June 30, 2017 |
|
| 526 |
|
| $ | 53 |
|
| $ | 7,276 |
|
| $ | 388 |
|
| $ | 1,099 |
|
| $ | — |
|
| $ | 4,431 |
|
| $ | 13,247 |
|
See accompanying notes to consolidated financial statements
9
DEVON ENERGY CORPORATION AND SUBSIDIARIES
NOTES TO CONSOLIDATED FINANCIAL STATEMENTS
(Unaudited)
The accompanying unaudited interim financial statements and notes of Devon have been prepared pursuant to the rules and regulations of the SEC. Pursuant to such rules and regulations, certain disclosures normally included in financial statements prepared in accordance with U.S. GAAP have been omitted. The accompanying unaudited interim financial statements and notes should be read in conjunction with the financial statements and notes included in Devon’s 20162017 Annual Report on Form 10-K.10-K.
The accompanying unaudited interim financial statements furnished in this report reflect all adjustments that are, in the opinion of management, necessary for a fair statement of Devon’s results of operations and cash flows for the three-month and nine-monthsix-month periods ended SeptemberJune 30, 20172018 and 20162017 and Devon’s financial position as of SeptemberJune 30, 2017.2018. As further discussed in Note 3, during the second quarter of 2018, Devon announced the sale of its interests in the General Partner and EnLink, which closed on July 18, 2018. Activity relating to the General Partner and EnLink have now been classified as discontinued operations within Devon’s consolidated comprehensive statements of earnings and consolidated statements of cash flows. The associated assets and liabilities of EnLink and the General Partner are presented as assets and liabilities held for sale on the consolidated balance sheets.
Recently Adopted Accounting Standards
In January 2017,2018, Devon adopted ASU 2016-09,2014-09, Compensation – Stock Compensation (Topic 718)Revenue from Contracts with Customers (ASC 606), Improvements to Employee Share-Based Payment Accounting. Its objective is to simplify several aspects ofusing the accountingmodified retrospective method. See Note 2 for share-based payments, including income taxes when awards vest or are settled, statutory withholding and forfeitures. As the result of adoption, Devon made certain income tax presentation changes, most notably prospectively presenting excess tax benefits and deficiencies in the consolidated comprehensive statements of earnings and as operating cash flows in the consolidated statements of cash flows. Devon also retrospectively applied the new cash flow statement guidance dictating the presentation of shares exchanged for tax-withholding purposes as a financing activity. Thefurther discussion regarding Devon’s adoption of the new guidance did not materially impactrevenue recognition standard.
In January 2018, Devon adopted ASU 2017-07, Compensation – Retirement Benefits (Topic 715), Improving the Presentation of Net Periodic Pension Cost and Net Periodic Postretirement Benefit Cost. This ASU requires entities to present the service cost component of net periodic benefit cost in the same line item as other employee compensation costs. Only the service cost component of net periodic benefit cost is eligible for capitalization. As a result of the adoption of this ASU, consolidated financial statements for the nine months ended September 30, 2017 or previously reported financial information but could have a more material future impact.statement of earnings presentation changes were applied retrospectively, while service cost component capitalization was applied prospectively.
In January 2017,2018, Devon adopted ASU 2016-18, Statement of Cash Flows (Topic 230): Restricted Cash. This ASU requires an entity to show the FASB issued ASU 2017-04, Intangibles – Goodwill And Other (Topic 350), Simplifyingchanges in the Test for Goodwill Impairment ("ASU 2017-04"). ASU 2017-04 simplifiestotal of cash, cash equivalents, restricted cash, and restricted cash equivalents on the accounting for goodwill impairments by eliminating the requirementstatement of cash flows and to compare the implied fair value of goodwill with its carrying amount as part of step twoprovide a reconciliation of the goodwill impairment test. Under ASU 2017-04, an entity should perform its goodwill impairment test by comparingtotals in the fair valuestatement of cash flows to the related captions in the balance sheet when the cash, cash equivalents, restricted cash, and restricted cash equivalents are presented in more than one line item on the balance sheet. As a reporting unit with its carrying amount. An impairment charge should be recognized for the amount by which the carrying amount exceeds the reporting unit's fair value. However, the impairment loss recognized should not exceed the total amountresult of goodwill allocated to that reporting unit. ASU 2017-04 is effective for annual reporting periods beginning after December 15, 2019, including any interim impairment tests within those annual periods, with early application for interim or annual goodwill impairment tests performed on testing dates after January 1, 2017. In January 2017, Devon elected to early adopt ASU 2017-04, and the adoption had noof this ASU, Devon made changes to the statement of cash flows to include the required presentation and reconciliation of cash, cash equivalents, restricted cash and restricted cash equivalents retrospectively. Other than presentation, adoption of this ASU did not have a material impact on theDevon’s consolidated financial statements. Devon will perform future goodwill impairment tests according to ASU 2017-04.statement of cash flows.
Issued Accounting Standards Not Yet Adopted
The FASB issued ASU 2014-09, Revenue from Contracts with Customers (Topic 606). This ASU will supersede the revenue recognition requirements in Topic 605, Revenue Recognition and industry-specific guidance in Subtopic 932-605, Extractive Activities – Oil and Gas – Revenue Recognition. This ASU provides guidance concerning the recognition and measurement of revenue from contracts with customers. Its objective is to increase the usefulness of information in the financial statements regarding the nature, timing and uncertainty of revenues. The effective date for ASU 2014-09 was delayed through the issuance of ASU 2015-14, Revenue from Contracts with Customers – Deferral of the Effective Date, to annual and interim periods beginning in 2018, with early adoption permitted in 2017. Devon has not early adopted this ASU. The ASU is required to be adopted using either the retrospective transition method, which requires restating previously reported results or the cumulative effect (modified retrospective) transition method, which utilizes a cumulative-effect adjustment to retained earnings in the period of adoption to account for prior period effects rather than restating previously reported results. Devon intends to use the cumulative effect transition method and does not anticipate this ASU will have a material impact on its balance sheet or related consolidated statements of earnings, equity or cash flows. However, Devon continues to evaluate the “gross versus net” presentation of certain revenues and associated expenses in its consolidated statements of earnings. Any presentation changes would have no impact on operating income, earnings or cash flows. Devon does not expect significant changes to its annual disclosures; however, Devon’s quarterly disclosures will expand upon adoption of this ASU. Devon has implemented a process to gather and provide the quarterly disclosures required by the ASU.
10
DEVON ENERGY CORPORATION AND SUBSIDIARIES
NOTES TO CONSOLIDATED FINANCIAL STATEMENTS – (Continued)
(Unaudited)
The FASB issued ASU 2016-02, Leases (Topic 842). This ASU will supersede the lease requirements in Topic 840, Leases. Its objective is to increase transparency and comparability among organizations. This ASU provides guidance requiring lessees to recognize most leases on their balance sheet. Lessor accounting does not significantly change, except for some changes made to align with new revenue recognition requirements. This ASU is effective for Devon beginning January 1, 2019 and will2019. Early adoption is permitted, but Devon does not plan to early adopt. Currently the guidance would be applied using a modified retrospective transition method, which requires applying the new guidance to leases that exist or are entered into after the beginning of the earliest period in the financial statements. EarlyHowever, the FASB recently issued Proposed ASU No. 2018-200, Leases (Topic 842), Targeted Improvements which would allow entities to apply the transition provisions of the new standard at its adoption is permitted, but Devon does not plan to early adopt. Devon isdate instead of at the earliest comparative period presented in the process of evaluating contracts and gathering the necessary terms and data elements for purposes of determining the impact thisconsolidated financial statements. The proposed ASU will have onallow entities to continue to apply the legacy guidance in Topic 840, including its consolidated financial statements and related disclosures. Recently,disclosure requirements, in the comparative periods presented in the year the new leases standard is adopted. Entities that elect this option would still adopt the new leases standard using a modified retrospective transition method, but would recognize a cumulative-effect adjustment to the opening balance of retained earnings in the period of adoption rather than in the earliest period presented. The FASB issued Proposed Accounting Standards Update (ASU)ASU No. 2017-290, 2018-01, Leases (Topic 842), Land Easement Practical Expedient for Transition to Topic 842. This proposed ASU would permit an entity not to apply Topic 842 to land easements and rights-of-way that exist or expired before the effective date of Topic 842 and that were not previously assessed under Topic 840.An entity would
10
DEVON ENERGY CORPORATION AND SUBSIDIARIES
NOTES TO CONSOLIDATED FINANCIAL STATEMENTS – (Continued)
(Unaudited)
continue to apply its current accounting policy for accounting for land easements that existed before the effective date of Topic 842. Once an entity adopts Topic 842, it would apply that Topic prospectively to all new (or modified) land easements and rights-of-way to determine whether the arrangement should be accounted for as a lease. For Devon, these easement and right-of-way contracts represent a relatively small percentage of the aggregate value of contracts being evaluated but represent a significant number of contracts.
BasedDevon has determined its portfolio of leased assets and is reviewing all related contracts to determine the impact the adoption will have on continuing research, Devon estimates a large number of contractsits consolidated financial statements and data elements must be gathered and reviewed to ensure proper accounting of these contracts once this ASU is effective.related disclosures. Devon anticipates the adoption of this standard will significantly impact its consolidated financial statements, systems, processes and controls. Devon is in the process of designing processes and controls and is evaluatinghas implemented a technology requirements and solutionssolution needed to comply with the requirements of this ASU. While Devon cannot currently estimate the quantitative effect that ASU 2016-02 will have on its consolidated financial statements, the adoption will increase asset and liability balances on the consolidated balance sheets due to the required recognition of right-of-use assets and corresponding lease liabilities.
The FASB issued ASU No. 2017-07,2017-12, Compensation – Retirement BenefitsDerivatives and Hedging (Topic 715), Improving the Presentation of Net Periodic Pension Cost and Net Periodic Postretirement Benefit Cost.815): Targeted Improvements to Accounting for Hedging Activities. This ASU will requireexpand hedge accounting for nonfinancial and financial risk components and amend measurement methodologies to more closely align hedge accounting with a company’s risk management activities. The guidance also eliminates the requirement to separately measure and report hedge ineffectiveness. This ASU only applies to entities to present the service cost component of net periodic benefit cost in the same line item as other employee compensation costs and present the other components of net periodic benefit cost outside of operating income in the statement of earnings. Only the service cost component of net periodic benefit cost is eligiblethat elect hedge accounting, which Devon has not for capitalization. Thisderivative financial instruments. This ASU is effective for Devonannual and interim periods beginning January 1, 2018, and presentation changes2019, with early adoption permitted in 2018. The ASU is required to be adopted using a cumulative effect (modified retrospective) transition method, which utilizes a cumulative-effect adjustment to retained earnings in the statementperiod of earnings will be applied retrospectively, while service cost component capitalization will be applied prospectively. Upon adoption to account for prior period effects rather than restating previously reported results. Devon is currently evaluating the provisions of this ASU and assessing the impact it may have on its consolidated financial statements if hedge accounting were elected by Devon will reclassify $7 million, $14 millionin the future.
The FASB issued ASU 2018-02, Income Statement – Reporting Comprehensive Income – Reclassification of Certain Tax Effects from Accumulated Other Comprehensive Income (Topic 220). This ASU allows for a reclassification from accumulated other comprehensive income to retained earnings for stranded tax effects resulting from the Tax Reform Legislation. The ASU is effective for fiscal years beginning after December 15, 2018, including interim periods within those fiscal years and $16 millionallows for early adoption in any interim period after issuance of non-service cost components of net periodic benefit costs for 2017, 2016 and 2015, respectively, as other nonoperating items. Such amounts arethe update. Devon is currently classified in Devon’s G&A. No other changes upon adoptingassessing the impact this ASU are expected to be material.
will have on its consolidated financial statements.
Devon Acquisitions
Impact of ASC 606 Adoption
In January 2016,2018, Devon acquired approximately 80,000 net acres (unaudited)adopted ASC 606 – Revenue from Contracts with Customers (ASC 606) using the modified retrospective method and assetshas applied the standard to all existing contracts. ASC 606 supersedes previous revenue recognition requirements in ASC 605 and includes a five-step revenue recognition model to depict the transfer of goods or services to customers in an amount that reflects the consideration in exchange for those goods or services.
The impact of adoption in the STACK play for approximately $1.5 billion. Devon funded the acquisition with $849 million of cash, after adjustments, and $659 million of common equity shares. The purchase price allocation was approximately $1.3 billion to unproved properties and approximately $200 million to proved properties.current period results is as follows:
2017 Devon Asset Divestitures
In May 2017, Devon announced a program to divest approximately $1 billion of upstream assets. The non-core assets identified for monetization include select portions of the Barnett Shale focused primarily in and around Johnson County and other properties located principally within Devon’s U.S. resource base. Through September 30, 2017, Devon completed divestiture transactions totaling approximately $400 million, before purchase price adjustments. Estimated proved reserves associated with these assets were less than 1% of total U.S. proved reserves.
2016 Devon Asset Divestitures
In the second quarter of 2016, Devon divested non-core assets for approximately $200 million. Estimated proved reserves associated with these assets were less than 1% of total U.S. proved reserves.
In the third quarter of 2016, in several separate transactions with different purchasers, Devon divested non-core upstream assets located in east Texas, the Anadarko Basin and the Midland Basin for approximately $1.7 billion. Estimated proved reserves associated with these assets were approximately 146 MMBoe, or approximately 9% of total U.S. proved reserves.
|
| Three Months Ended June 30, 2018 |
|
| Six Months Ended June 30, 2018 |
| ||||||||||||||||||
|
| Under ASC 606 |
|
| Under ASC 605 |
|
| Increase/ (Decrease) |
|
| Under ASC 606 |
|
| Under ASC 605 |
|
| Increase/ (Decrease) |
| ||||||
Upstream revenues |
| $ | 1,069 |
|
| $ | 1,004 |
|
| $ | 65 |
|
| $ | 2,388 |
|
| $ | 2,261 |
|
| $ | 127 |
|
Marketing revenues |
|
| 1,180 |
|
|
| 1,180 |
|
|
| — |
|
|
| 2,059 |
|
|
| 2,059 |
|
|
| — |
|
Total impacted revenues |
| $ | 2,249 |
|
| $ | 2,184 |
|
| $ | 65 |
|
| $ | 4,447 |
|
| $ | 4,320 |
|
| $ | 127 |
|
|
|
|
|
|
|
|
|
|
|
|
|
|
|
|
|
|
|
|
|
|
|
|
|
|
Production expenses |
| $ | 572 |
|
| $ | 507 |
|
| $ | 65 |
|
| $ | 1,115 |
|
| $ | 988 |
|
| $ | 127 |
|
Marketing expenses |
|
| 1,160 |
|
|
| 1,160 |
|
|
| — |
|
|
| 2,033 |
|
|
| 2,033 |
|
|
| — |
|
Total impacted expenses |
| $ | 1,732 |
|
| $ | 1,667 |
|
| $ | 65 |
|
| $ | 3,148 |
|
| $ | 3,021 |
|
| $ | 127 |
|
|
|
|
|
|
|
|
|
|
|
|
|
|
|
|
|
|
|
|
|
|
|
|
|
|
Loss from continuing operations before income taxes |
| $ | (481 | ) |
| $ | (481 | ) |
| $ | — |
|
| $ | (726 | ) |
| $ | (726 | ) |
| $ | — |
|
11
DEVON ENERGY CORPORATION AND SUBSIDIARIES
NOTES TO CONSOLIDATED FINANCIAL STATEMENTS – (Continued)
(Unaudited)
ProceedsChanges to upstream revenues and production expenses are due to the conclusion that Devon represents the principal and controls a promised product before transferring it to the ultimate third party customer in accordance with the control model in ASC 606. This is a change from previous conclusions reached for these agreements utilizing the principal versus agent indicators under ASC 605 where the assessment was focused on Devon passing title and not control to the processing entity and Devon ultimately receiving a net price from the transactions were used primarilythird-party end customer. As a result, Devon has changed the presentation of revenues and expenses for debt repaymentthese agreements. Revenues related to these agreements are now presented on a gross basis for amounts expected to be received from third-party customers through the marketing process. Gathering, processing and transportation expenses related to support capital investment in Devon’s core resource plays.
The divestiture transactions that closed inthese agreements, incurred prior to the third quartertransfer of 2016 significantly alteredcontrol to the costs and reserves relationship of Devon’s U.S. cost center. Therefore, Devon recognized a $1.4 billion gain incustomer at the third quarter of 2016 associated with these divestitures. A summarytailgate of the gain computation follows.
|
| Three Months Ended September 30, 2016 |
| |
|
| (Millions) |
| |
Proceeds received, net of purchase price adjustments and selling costs |
| $ | 1,653 |
|
Asset retirement obligation assumed by purchasers |
|
| 250 |
|
Total consideration received |
|
| 1,903 |
|
|
|
|
|
|
Allocated oil and gas property basis sold |
|
| 355 |
|
Allocated goodwill |
|
| 197 |
|
Total assets sold |
|
| 552 |
|
|
|
|
|
|
Gain on asset sales |
| $ | 1,351 |
|
natural gas processing facilities, are now presented as production expenses.
EnLink AcquisitionsUpstream Revenues
In January 2016, EnLink acquired Anadarko Basin gatheringUpstream revenues include the sale of oil, gas and processing midstream assets, along with dedicated acreage service rightsNGL production. Oil, gas and service contracts, for approximately $1.4 billion. The purchaseNGL sales are recognized when production is sold to a purchaser at a fixed or determinable price, allocation was $1.0 billion to intangible assetsdelivery has occurred, control has transferred and approximately $400 million to property and equipment. EnLink funded the acquisition with approximately $215 million of General Partner common units and approximately $800 million of cash, primarily funded with the issuance of EnLink preferred units. The remaining $500 millioncollectability of the purchaserevenue is probable. Devon’s performance obligations are satisfied at a point in time. This occurs when control is transferred to the purchaser upon delivery of contract specified production volumes at a specified point. The transaction price wasused to be paid within one year with the option to defer $250 millionrecognize revenue is a function of the finalcontract billing terms. Revenue is invoiced, if required, by calendar month based on volumes at contractually based rates with payment 24 monthstypically received within 30 days of the end of the production month. Taxes assessed by governmental authorities on oil, gas and NGL sales are presented separately from the close date. The first installment payment of $250 million was paid in January 2017. The remaining $250 million payment is reported in other current liabilitiessuch revenues in the accompanying consolidated balance sheets. The accretioncomprehensive statements of earnings.
Natural gas and NGL sales
Under Devon’s natural gas processing contracts, natural gas is delivered to a midstream processing entity at the wellhead or the inlet of the discountmidstream processing entity’s system. The midstream processing entity gathers and processes the natural gas and remits proceeds for the resulting sales of NGLs and residue gas. In these scenarios, Devon evaluates whether it is reported within net financing coststhe principal or the agent in the accompanyingtransaction. Devon has concluded it is the principal under these contracts and the ultimate third party is the customer. Revenue is recognized on a gross basis, with gathering, processing and transportation fees presented as a component of production expenses in the consolidated comprehensive statement of earnings.
In August 2016, EnLink formedcertain natural gas processing agreements, Devon may elect to take residue gas and/or NGLs in-kind at the tailgate of the midstream entity’s processing plant and subsequently market the product. Through the marketing process, the product is delivered to the ultimate third-party purchaser at a joint venturecontractually agreed-upon delivery point, and Devon receives a specified index price from the purchaser. In this scenario, revenue is recognized when control transfers to operatethe purchaser at the delivery point based on the index price received from the purchaser. The gathering, processing and expand its midstream assetscompression fees attributable to the gas processing contract, as well as any transportation fees incurred to deliver the product to the purchaser, are presented as gathering, processing and transportation expense as a component of production expenses in the Delaware Basin. The joint ventureconsolidated comprehensive statement of earnings.
Oil sales
Devon’s oil sales contracts are generally structured in one of two ways. First, production is initially owned 50.1% by EnLink and 49.9% bysold at the joint venture partner. EnLink contributed approximately $244 millionwellhead at an agreed-upon index price, net of existing non-monetary assetspricing differentials. In this scenario, revenue is recognized when control transfers to the joint venturepurchaser at the wellhead at the net price received. Alternatively, production is delivered to the purchaser at a contractually agreed-upon delivery point at which the purchaser takes custody, title and committed an additional $262 million in capital to fund potential future development projects and potential acquisitions. The joint venture partner committed an aggregaterisk of approximately $400 million of capital, including initial cash contributions of approximately $138 million, and granted EnLink call rights beginning in 2021 to acquire increasing portionsloss of the joint venture partner’s interest.product. Under this arrangement, a third party is paid to transport the product and Devon receives a specified index price from the purchaser with no transportation deduction. In this scenario, revenue is recognized when control transfers to the purchaser at the delivery point based on the price received from the purchaser. The third-party costs are recorded as gathering, processing and transportation expense as a component of production expenses in the consolidated comprehensive statement of earnings.
EnLink Asset DivestituresMarketing Revenues
DuringMarketing revenues are generated primarily as a result of Devon selling commodities purchased from third parties. Marketing revenues are recognized when performance obligations are satisfied. This occurs at the first quartertime contract specified products are sold to third parties at a contractually fixed or determinable price, delivery occurs at a specified point or performance has occurred, control has transferred and collectability of 2017, EnLink divested its ownership interest in Howard Energy Partners for approximately $190 million.the revenue is probable. The transaction price used to recognize revenue and invoice customers is based on a contractually stated fee or on a third party published index price plus or minus a known differential. Devon typically
12
DEVON ENERGY CORPORATION AND SUBSIDIARIES
NOTES TO CONSOLIDATED FINANCIAL STATEMENTS – (Continued)
(Unaudited)
receives payment for invoiced amounts within 30 days. Marketing revenues and expenses attributable to oil, gas and NGL purchases are reported on a gross basis when Devon takes control of the products and has risks and rewards of ownership.
Satisfaction of Performance Obligations and Revenue Recognitions
Since Devon has a right to consideration from its customers in amounts that correspond directly to the value that the customer receives from the performance completed on each contract, Devon applies the practical expedient in ASC 606 that allows recognition of revenue in the amount to which there is a right to invoice and prevents the need to estimate a transaction price for each contract and allocating that transaction price to the performance obligations within each contract. Devon recognizes revenue for sales at the time the natural gas, NGLs or crude oil are delivered at a fixed or determinable price.
Transaction Price Allocated to Remaining Performance Obligations
Most of Devon’s contracts are short-term in nature with a contract term of one year or less. Devon applies the practical expedient in ASC 606 exempting the disclosure of the transaction price allocated to remaining performance obligations if the performance obligation is part of a contract that has an original expected duration of one year or less. For contracts with terms greater than one year, Devon applies the practical expedient in ASC 606 exempting the disclosure of the transaction price allocated to remaining performance obligations if the variable consideration is allocated entirely to a wholly unsatisfied performance obligation. Under Devon’s contracts, each unit of product typically represents a separate performance obligation; therefore, future volumes are wholly unsatisfied and disclosure of the transaction price allocated to remaining performance obligations is not required.
Contract Balances
Cash received relating to future performance obligations are deferred and recognized when all revenue recognition criteria are met. Contract liabilities generated from such deferred revenue are not considered material as of June 30, 2018. Devon’s product sales and marketing contracts do not give rise to contract assets under ASC 606.
Disaggregation of Revenue
Revenue from oil, gas and NGL sales and marketing revenues represent revenue from contracts with customers. The following table presents revenue from contracts with customers that are disaggregated based on the type of good. The difference between revenue from external customers in Note 22 and the totals listed below represents the net impact from commodity derivatives.
|
| Three Months Ended June 30, 2018 |
|
| Six Months Ended June 30, 2018 |
| ||||||||||||||||||
|
| U.S. |
|
| Canada |
|
| Total |
|
| U.S. |
|
| Canada |
|
| Total |
| ||||||
Revenues from contracts with customers: |
|
|
|
|
|
|
|
|
|
|
|
|
|
|
|
|
|
|
|
|
|
|
|
|
Oil |
| $ | 808 |
|
| $ | 313 |
|
| $ | 1,121 |
|
| $ | 1,485 |
|
| $ | 543 |
|
| $ | 2,028 |
|
Gas |
|
| 207 |
|
|
| — |
|
|
| 207 |
|
|
| 462 |
|
|
| — |
|
|
| 462 |
|
NGL |
|
| 238 |
|
|
| — |
|
|
| 238 |
|
|
| 436 |
|
|
| — |
|
|
| 436 |
|
Oil, gas and NGL sales |
|
| 1,253 |
|
|
| 313 |
|
|
| 1,566 |
|
|
| 2,383 |
|
|
| 543 |
|
|
| 2,926 |
|
|
|
|
|
|
|
|
|
|
|
|
|
|
|
|
|
|
|
|
|
|
|
|
|
|
Oil |
|
| 766 |
|
|
| 24 |
|
|
| 790 |
|
|
| 1,297 |
|
|
| 41 |
|
|
| 1,338 |
|
Gas |
|
| 160 |
|
|
| — |
|
|
| 160 |
|
|
| 315 |
|
|
| — |
|
|
| 315 |
|
NGL |
|
| 230 |
|
|
| — |
|
|
| 230 |
|
|
| 406 |
|
|
| — |
|
|
| 406 |
|
Total marketing revenues |
|
| 1,156 |
|
|
| 24 |
|
|
| 1,180 |
|
|
| 2,018 |
|
|
| 41 |
|
|
| 2,059 |
|
|
|
|
|
|
|
|
|
|
|
|
|
|
|
|
|
|
|
|
|
|
|
|
|
|
Total revenues from contracts with customers |
| $ | 2,409 |
|
| $ | 337 |
|
| $ | 2,746 |
|
| $ | 4,401 |
|
| $ | 584 |
|
| $ | 4,985 |
|
13
DEVON ENERGY CORPORATION AND SUBSIDIARIES
NOTES TO CONSOLIDATED FINANCIAL STATEMENTS – (Continued)
(Unaudited)
During the second quarter of 2018, Devon sold a portion of its Barnett Shale assets, primarily located in Johnson County for $553 million ($481 million after customary purchase price adjustments). Estimated proved reserves associated with these assets are approximately 10% of total proved reserves. The transaction resulted in an adjustment to Devon’s capitalized costs with no gain recognized in the consolidated statement of earnings. In conjunction with the divestiture, Devon settled certain gas processing contracts and recognized an approximately $40 million settlement expense, which is included in asset dispositions within the consolidated statement of earnings.
In June 2018, Devon announced the sale of its aggregate ownership interests in EnLink and the General Partner for approximately $3.1 billion. The proceeds from the sale will be utilized to increase Devon’s share repurchase program to $4.0 billion, which is discussed further in Note 18. Devon completed the sale of its interests in EnLink and the General Partner in July 2018 and expects to recognize a gain of approximately $2.5 billion in the third quarter. Additional information on these discontinued operations can be found in Note 19.
Objectives and Strategies
Devon periodically enters into derivative financial instruments with respect to a portion of its oil, gas and NGL production to hedge future prices received. Additionally, Devon and EnLink periodically enterenters into derivative financial instruments with respect to a portion of theirits oil, gas and NGL marketing activities. These commodity derivative financial instruments include financial price swaps, basis swaps and costless price collars. Devon periodically enters into interest rate swaps to manage its exposure to interest rate volatility and foreign exchange forward contracts to manage its exposure to fluctuations in the U.S. and Canadian dollar exchange rates. As of SeptemberJune 30, 2017,2018, Devon did not have any open foreign exchange contracts.
12
DEVON ENERGY CORPORATION AND SUBSIDIARIES
NOTES TO CONSOLIDATED FINANCIAL STATEMENTS – (Continued)
(Unaudited)
Devon does not intend to hold or issue derivative financial instruments for speculative trading purposes and has elected not to designate any of its derivative instruments for hedge accounting treatment.
Counterparty Credit Risk
By using derivative financial instruments, Devon is exposed to credit risk. Credit risk is the failure of the counterparty to perform under the terms of the derivative contract. To mitigate this risk, the hedging instruments are placed with a number of counterparties whom Devon believes are acceptable credit risks. It is Devon’s policy to enter into derivative contracts only with investment-grade rated counterparties deemed by management to be competent and competitive market makers. Additionally, Devon’s derivative contracts generally contain provisions that provide for collateral payments if Devon’s or its counterparty’s credit rating falls below certain credit rating levels.
Commodity Derivatives
As of SeptemberJune 30, 2017,2018, Devon had the following open oil derivative positions. The first table presents Devon’s oil derivatives that settle against the average of the prompt month NYMEX WTI futures price. The second table presents Devon’s oil derivatives that settle against the respective indices noted within the table.
|
| Price Swaps |
|
| Price Collars |
|
| Price Swaps |
|
| Price Collars |
| ||||||||||||||||||||||||||||
Period |
| Volume (Bbls/d) |
|
| Weighted Average Price ($/Bbl) |
|
| Volume (Bbls/d) |
|
| Weighted Average Floor Price ($/Bbl) |
|
| Weighted Average Ceiling Price ($/Bbl) |
|
| Volume (Bbls/d) |
|
| Weighted Average Price ($/Bbl) |
|
| Volume (Bbls/d) |
|
| Weighted Average Floor Price ($/Bbl) |
|
| Weighted Average Ceiling Price ($/Bbl) |
| ||||||||||
Q4 2017 |
|
| 82,167 |
|
| $ | 53.87 |
|
|
| 79,200 |
|
| $ | 45.51 |
|
| $ | 57.41 |
| ||||||||||||||||||||
Q1-Q4 2018 |
|
| 22,792 |
|
| $ | 51.13 |
|
|
| 34,121 |
|
| $ | 45.71 |
|
| $ | 55.71 |
| ||||||||||||||||||||
Q3-Q4 2018 |
|
| 89,300 |
|
| $ | 57.96 |
|
|
| 100,200 |
|
| $ | 52.23 |
|
| $ | 62.83 |
| ||||||||||||||||||||
Q1-Q4 2019 |
|
| 1,356 |
|
| $ | 49.79 |
|
|
| 2,096 |
|
| $ | 44.10 |
|
| $ | 54.10 |
|
|
| 50,130 |
|
| $ | 58.95 |
|
|
| 65,790 |
|
| $ | 52.60 |
|
| $ | 62.60 |
|
14
DEVON ENERGY CORPORATION AND SUBSIDIARIES
NOTES TO CONSOLIDATED FINANCIAL STATEMENTS – (Continued)
(Unaudited)
|
| Oil Basis Swaps |
| |||||||
Period |
| Index |
| Volume (Bbls/d) |
|
| Weighted Average Differential to WTI ($/Bbl) |
| ||
Q4 2017 |
| Midland Sweet |
|
| 20,000 |
|
| $ | (0.41 | ) |
Q4 2017 |
| Western Canadian Select |
|
| 87,304 |
|
| $ | (14.57 | ) |
Q1-Q4 2018 |
| Midland Sweet |
|
| 23,000 |
|
| $ | (1.02 | ) |
Q1-Q4 2018 |
| Western Canadian Select |
|
| 59,718 |
|
| $ | (14.85 | ) |
Q1-Q4 2019 |
| Midland Sweet |
|
| 1,000 |
|
| $ | (0.80 | ) |
|
| Oil Basis Swaps |
|
| Oil Basis Collars |
| ||||||||||||||||
Period |
| Index |
| Volume (Bbls/d) |
|
| Weighted Average Differential to WTI ($/Bbl) |
|
| Volume (Bbls/d) |
|
| Weighted Average Floor Differential to WTI ($/Bbl) |
|
| Weighted Average Ceiling Differential to WTI ($/Bbl) |
| |||||
Q3-Q4 2018 |
| Midland Sweet |
|
| 23,000 |
|
| $ | (1.02 | ) |
|
| — |
|
| $ | — |
|
| $ | — |
|
Q3-Q4 2018 |
| Argus LLS |
|
| 12,000 |
|
| $ | 3.95 |
|
|
| — |
|
| $ | — |
|
| $ | — |
|
Q3-Q4 2018 |
| Argus MEH |
|
| 15,832 |
|
| $ | 2.82 |
|
|
| — |
|
| $ | — |
|
| $ | — |
|
Q3-Q4 2018 |
| NYMEX Roll |
|
| 19,989 |
|
| $ | 0.60 |
|
|
| — |
|
| $ | — |
|
| $ | — |
|
Q3-Q4 2018 |
| Western Canadian Select |
|
| 64,859 |
|
| $ | (14.91 | ) |
|
| 1,663 |
|
| $ | (15.50 | ) |
| $ | (13.93 | ) |
Q1-Q4 2019 |
| Midland Sweet |
|
| 28,000 |
|
| $ | (0.46 | ) |
|
| — |
|
| $ | — |
|
| $ | — |
|
Q1-Q4 2019 |
| Argus LLS |
|
| 1,000 |
|
| $ | 4.60 |
|
|
| — |
|
| $ | — |
|
| $ | — |
|
Q1-Q4 2019 |
| Argus MEH |
|
| 16,000 |
|
| $ | 2.84 |
|
|
| — |
|
| $ | — |
|
| $ | — |
|
Q1-Q4 2019 |
| NYMEX Roll |
|
| 22,000 |
|
| $ | 0.53 |
|
|
| — |
|
| $ | — |
|
| $ | — |
|
Q1-Q4 2020 |
| NYMEX Roll |
|
| 22,000 |
|
| $ | 0.32 |
|
|
| — |
|
| $ | — |
|
| $ | — |
|
|
As of SeptemberJune 30, 2017,2018, Devon had the following open natural gas derivative positions. The first table presents Devon’s natural gas derivatives that settle against the Inside FERC first of the month Henry Hub index. The second table presents Devon’s natural gas derivatives that settle against the respective indices noted within the table.
|
| Price Swaps |
|
| Price Collars |
|
| Price Swaps |
|
| Price Collars |
| ||||||||||||||||||||||||||||
Period |
| Volume (MMBtu/d) |
|
| Weighted Average Price ($/MMBtu) |
|
| Volume (MMBtu/d) |
|
| Weighted Average Floor Price ($/MMBtu) |
|
| Weighted Average Ceiling Price ($/MMBtu) |
|
| Volume (MMBtu/d) |
|
| Weighted Average Price ($/MMBtu) |
|
| Volume (MMBtu/d) |
|
| Weighted Average Floor Price ($/MMBtu) |
|
| Weighted Average Ceiling Price ($/MMBtu) |
| ||||||||||
Q4 2017 |
|
| 331,196 |
|
| $ | 3.21 |
|
|
| 455,000 |
|
| $ | 3.03 |
|
| $ | 3.41 |
| ||||||||||||||||||||
Q1-Q4 2018 |
|
| 261,888 |
|
| $ | 3.09 |
|
|
| 149,982 |
|
| $ | 2.99 |
|
| $ | 3.30 |
| ||||||||||||||||||||
Q3-Q4 2018 |
|
| 273,750 |
|
| $ | 2.91 |
|
|
| 242,250 |
|
| $ | 2.76 |
|
| $ | 3.09 |
| ||||||||||||||||||||
Q1-Q4 2019 |
|
| 6,164 |
|
| $ | 3.08 |
|
|
| 8,630 |
|
| $ | 2.92 |
|
| $ | 3.22 |
|
|
| 181,122 |
|
| $ | 2.81 |
|
|
| 146,810 |
|
| $ | 2.65 |
|
| $ | 3.04 |
|
13
|
| Natural Gas Basis Swaps |
| |||||||
Period |
| Index |
| Volume (MMBtu/d) |
|
| Weighted Average Differential to Henry Hub ($/MMBtu) |
| ||
Q3-Q4 2018 |
| Panhandle Eastern Pipe Line |
|
| 120,000 |
|
| $ | (0.51 | ) |
Q3-Q4 2018 |
| El Paso Natural Gas |
|
| 100,000 |
|
| $ | (1.25 | ) |
Q3-Q4 2018 |
| Houston Ship Channel |
|
| 115,000 |
|
| $ | 0.01 |
|
Q3-Q4 2018 |
| Transco Zone 4 |
|
| 15,000 |
|
| $ | (0.03 | ) |
Q1-Q4 2019 |
| Panhandle Eastern Pipe Line |
|
| 54,548 |
|
| $ | (0.78 | ) |
Q1-Q4 2019 |
| El Paso Natural Gas |
|
| 110,000 |
|
| $ | (1.50 | ) |
Q1-Q4 2019 |
| Houston Ship Channel |
|
| 92,500 |
|
| $ | (0.01 | ) |
Q1-Q4 2019 |
| Transco Zone 4 |
|
| 7,397 |
|
| $ | (0.03 | ) |
15
DEVON ENERGY CORPORATION AND SUBSIDIARIES
NOTES TO CONSOLIDATED FINANCIAL STATEMENTS – (Continued)
(Unaudited)
|
| Natural Gas Basis Swaps |
| |||||||
Period |
| Index |
| Volume (MMBtu/d) |
|
| Weighted Average Differential to Henry Hub ($/MMBtu) |
| ||
Q4 2017 |
| Panhandle Eastern Pipe Line |
|
| 150,000 |
|
| $ | (0.34 | ) |
Q4 2017 |
| El Paso Natural Gas |
|
| 80,000 |
|
| $ | (0.13 | ) |
Q4 2017 |
| Houston Ship Channel |
|
| 35,000 |
|
| $ | 0.06 |
|
Q4 2017 |
| Transco Zone 4 |
|
| 205,000 |
|
| $ | 0.03 |
|
Q1-Q4 2018 |
| Panhandle Eastern Pipe Line |
|
| 50,000 |
|
| $ | (0.29 | ) |
As of SeptemberJune 30, 2017,2018, Devon had the following open NGL derivative positions. Devon’s NGL positions settle against the average of the prompt month OPIS Mont Belvieu, Texas index.
|
|
|
| Price Swaps |
|
| Price Collars |
| ||||||||||||||
Period |
| Product |
| Volume (Bbls/d) |
|
| Weighted Average Price ($/Bbl) |
|
| Volume (Bbls/d) |
|
| Weighted Average Floor Price ($/Bbl) |
|
| Weighted Average Ceiling Price ($/Bbl) |
| |||||
Q4 2017 |
| Propane |
|
| 2,663 |
|
| $ | 31.98 |
|
|
| 1,000 |
|
| $ | 28.35 |
|
| $ | 30.45 |
|
As of September 30, 2017, EnLink had the following open derivative positions associated with gas processing and fractionation. EnLink’s NGL positions settle by purity product against the average of the prompt month OPIS Mont Belvieu, Texas index.
|
|
|
|
| |||||||
|
|
|
|
|
| ||||||
|
|
|
|
|
| ||||||
|
|
|
| Price Swaps |
| |||||
Period |
| Product |
| Volume (Bbls/d) |
|
| Weighted Average Price ($/Bbl) |
| ||
Q3-Q4 2018 |
| Ethane |
|
| 6,000 |
|
| $ | 11.73 |
|
Q3-Q4 2018 |
| Natural Gasoline |
|
| 6,500 |
|
| $ | 56.13 |
|
Q3-Q4 2018 |
| Normal Butane |
|
| 7,000 |
|
| $ | 38.69 |
|
Q3-Q4 2018 |
| Propane |
|
| 12,000 |
|
| $ | 33.72 |
|
Q1-Q4 2019 |
| Ethane |
|
| 1,000 |
|
| $ | 11.55 |
|
Q1-Q4 2019 |
| Natural Gasoline |
|
| 4,500 |
|
| $ | 55.93 |
|
Q1-Q4 2019 |
| Normal Butane |
|
| 4,000 |
|
| $ | 33.69 |
|
Q1-Q4 2019 |
| Propane |
|
| 8,500 |
|
| $ | 30.01 |
|
Interest Rate Derivatives
As of SeptemberJune 30, 2017,2018, Devon had the following open interest rate derivative positions:position:
Notional |
|
| Rate Received |
|
| Rate Paid |
|
| Expiration | |||
(Millions) |
|
|
|
|
|
|
|
|
|
|
| |
$ | 750 |
|
| Three Month LIBOR |
|
|
| 2.98% |
|
| December 2048 (1) | |
$ | 100 |
|
|
| 1.76% |
|
| Three Month LIBOR |
|
| January 2019 | |
|
|
Notional |
|
| Rate Received |
|
| Rate Paid |
| Expiration | |
$ | 100 |
|
| 1.76% |
|
| Three Month LIBOR |
| January 2019 |
14
DEVON ENERGY CORPORATION AND SUBSIDIARIES
NOTES TO CONSOLIDATED FINANCIAL STATEMENTS – (Continued)
(Unaudited)
Financial Statement Presentation
The following table presents the net gains and losses by derivative financial instrument type followed by the corresponding individual consolidated comprehensive statements of earnings caption.
|
| Three Months Ended September 30, |
|
| Nine Months Ended September 30, |
| ||||||||||
|
| 2017 |
|
| 2016 |
|
| 2017 |
|
| 2016 |
| ||||
|
| (Millions) |
| |||||||||||||
Commodity derivatives: |
|
|
|
|
|
|
|
|
|
|
|
|
|
|
|
|
Oil, gas and NGL derivatives |
| $ | (144 | ) |
| $ | 79 |
|
| $ | 214 |
|
| $ | (30 | ) |
Marketing and midstream revenues |
|
| (5 | ) |
|
| (1 | ) |
|
| 3 |
|
|
| (7 | ) |
Interest rate derivatives: |
|
|
|
|
|
|
|
|
|
|
|
|
|
|
|
|
Other nonoperating items |
|
| (4 | ) |
|
| (20 | ) |
|
| (19 | ) |
|
| (163 | ) |
Foreign currency derivatives: |
|
|
|
|
|
|
|
|
|
|
|
|
|
|
|
|
Other nonoperating items |
|
| — |
|
|
| — |
|
|
| — |
|
|
| (159 | ) |
Net gains (losses) recognized |
| $ | (153 | ) |
| $ | 58 |
|
| $ | 198 |
|
| $ | (359 | ) |
|
| Three Months Ended June 30, |
|
| Six Months Ended June 30, |
| ||||||||||
|
| 2018 |
|
| 2017 |
|
| 2018 |
|
| 2017 |
| ||||
Commodity derivatives: |
|
|
|
|
|
|
|
|
|
|
|
|
|
|
|
|
Upstream revenues |
| $ | (497 | ) |
| $ | 126 |
|
| $ | (538 | ) |
| $ | 358 |
|
Marketing revenues |
|
| (1 | ) |
|
| 2 |
|
|
| (1 | ) |
|
| 3 |
|
Interest rate derivatives: |
|
|
|
|
|
|
|
|
|
|
|
|
|
|
|
|
Other expenses |
|
| 19 |
|
|
| (20 | ) |
|
| 65 |
|
|
| (15 | ) |
Net gains (losses) recognized |
| $ | (479 | ) |
| $ | 108 |
|
| $ | (474 | ) |
| $ | 346 |
|
The following table presents the derivative fair values by derivative financial instrument type followed by the corresponding individual consolidated balance sheet caption.
|
| September 30, 2017 |
|
| December 31, 2016 |
| ||||||||||
|
| (Millions) |
|
| June 30, 2018 |
|
| December 31, 2017 |
| |||||||
Commodity derivative assets: |
|
|
|
|
|
|
|
|
|
|
|
|
|
|
|
|
Other current assets |
| $ | 39 |
|
| $ | 9 |
|
| $ | 213 |
|
| $ | 203 |
|
Other long-term assets |
|
| 4 |
|
|
| 1 |
|
|
| 27 |
|
|
| 2 |
|
Interest rate derivative assets: |
|
|
|
|
|
|
|
|
|
|
|
|
|
|
|
|
Other current assets |
|
| 1 |
|
|
| 1 |
|
|
| 1 |
|
|
| 1 |
|
Total derivative assets |
| $ | 44 |
|
| $ | 11 |
|
| $ | 241 |
|
| $ | 206 |
|
Commodity derivative liabilities: |
|
|
|
|
|
|
|
|
|
|
|
|
|
|
|
|
Other current liabilities |
| $ | 53 |
|
| $ | 187 |
|
| $ | 647 |
|
| $ | 259 |
|
Other long-term liabilities |
|
| 7 |
|
|
| 16 |
|
|
| 93 |
|
|
| 27 |
|
Interest rate derivative liabilities: |
|
|
|
|
|
|
|
|
|
|
|
|
|
|
|
|
Other current liabilities |
|
| 1 |
|
|
| — |
|
|
| 1 |
|
|
| 64 |
|
Other long-term liabilities |
|
| 61 |
|
|
| 41 |
| ||||||||
Total derivative liabilities |
| $ | 122 |
|
| $ | 244 |
|
| $ | 741 |
|
| $ | 350 |
|
1516
DEVON ENERGY CORPORATION AND SUBSIDIARIES
NOTES TO CONSOLIDATED FINANCIAL STATEMENTS – (Continued)
(Unaudited)
In the second quarter of 2017, Devon’s stockholders approved the 2017 Plan. The 2017 Plan replaces the 2015 Plan. From the effective date of the 2017 Plan, no further awards may be made under the 2015 Plan, and awards previously granted will continue to be governed by the terms of the respective award documents. Subject to the terms of the 2017 Plan, awards may be made for a total of 33.5 million shares of Devon common stock, plus the number of shares available for issuance under the 2015 Plan (including shares subject to outstanding awards under the 2015 Plan that are transferred to the 2017 Plan in accordance with its terms). The 2017 Plan authorizes the Compensation Committee, which consists of independent, non-management members of Devon’s Board of Directors, to grant nonqualified and incentive stock options, restricted stock awards or units, Canadian restricted stock units, performance units and stock appreciation rights to eligible employees. The 2017 Plan also authorizes the grant of nonqualified stock options, restricted stock awards or units and stock appreciation rights to non-employee directors. To calculate the number of shares that may be granted in awards under the 2017 Plan, options and stock appreciation rights represent one share and other awards represent 2.3 shares.
The following table below presents the effects of share-based compensation expense included in Devon’s accompanying consolidated comprehensive statements of earnings. Gross G&A expense for the first nine months of 2017 and 2016 includes $28 million and $18 million, respectively, of unit-based compensation related to grants made under EnLink’s long-term incentive plans.
The vesting for certain share-based awards was accelerated in 2016the second quarter of 2018 in conjunction with the reduction of workforce described in Note 6. For the nine months ended September 30, 2016, approximately $60 million of associated expense for these accelerated awards7 and is included in restructuring and transaction costs in the accompanying consolidated comprehensive statementsstatement of earnings.
|
| Nine Months Ended September 30, |
| |||||
|
| 2017 |
|
| 2016 |
| ||
|
| (Millions) |
| |||||
Gross G&A for share-based compensation |
| $ | 141 |
|
| $ | 117 |
|
Share-based compensation expense capitalized pursuant to the full cost method of accounting for oil and gas properties |
| $ | 31 |
|
| $ | 30 |
|
Related income tax benefit |
| $ | 3 |
|
| $ | 3 |
|
|
| Six Months Ended June 30, |
| |||||
|
| 2018 |
|
| 2017 |
| ||
G&A |
| $ | 68 |
|
| $ | 75 |
|
Exploration expenses |
|
| 2 |
|
|
| 4 |
|
Restructuring and transaction costs |
|
| 26 |
|
|
| — |
|
Total |
| $ | 96 |
|
| $ | 79 |
|
Related income tax benefit |
| $ | 3 |
|
| $ | 3 |
|
Under its approved long-term incentive plan, Devon granted share-based awards to certain employees in the first ninesix months of 2017.2018. The following table presents a summary of Devon’s unvested restricted stock awards and units, performance-based restricted stock awards and performance share units granted under the plan.
|
| Restricted Stock |
|
| Performance-Based |
|
| Performance |
|
| Restricted Stock |
|
| Performance-Based |
|
| Performance |
| ||||||||||||||||||||||||||||||||||||
|
| Awards and Units |
|
| Restricted Stock Awards |
|
| Share Units |
|
| Awards and Units |
|
| Restricted Stock Awards |
|
| Share Units |
| ||||||||||||||||||||||||||||||||||||
|
| Awards and Units |
|
| Weighted Average Grant-Date Fair Value |
|
| Awards |
|
| Weighted Average Grant-Date Fair Value |
|
| Units |
|
|
|
| Weighted Average Grant-Date Fair Value |
|
| Awards and Units |
|
| Weighted Average Grant-Date Fair Value |
|
| Awards |
|
| Weighted Average Grant-Date Fair Value |
|
| Units |
|
|
|
| Weighted Average Grant-Date Fair Value |
| ||||||||||||||
|
| (Thousands, except fair value data) |
|
| (Thousands, except fair value data) |
| ||||||||||||||||||||||||||||||||||||||||||||||||
Unvested at 12/31/16 |
|
| 6,407 |
|
| $ | 34.40 |
|
|
| 585 |
|
| $ | 37.60 |
|
|
| 2,604 |
|
|
| $ | 46.66 |
| |||||||||||||||||||||||||||||
Unvested at 12/31/17 |
|
| 6,328 |
|
| $ | 36.81 |
|
|
| 575 |
|
| $ | 38.92 |
|
|
| 2,758 |
|
|
| $ | 41.21 |
| |||||||||||||||||||||||||||||
Granted |
|
| 2,691 |
|
| $ | 44.87 |
|
|
| 223 |
|
| $ | 44.85 |
|
|
| 1,010 |
|
|
| $ | 52.58 |
|
|
| 3,501 |
|
| $ | 35.89 |
|
|
| — |
|
| $ | — |
|
|
| 845 |
|
|
| $ | 37.40 |
| ||||
Vested |
|
| (2,321 | ) |
| $ | 39.51 |
|
|
| (233 | ) |
| $ | 41.27 |
|
|
| (832 | ) |
|
| $ | 78.19 |
|
|
| (2,843 | ) |
| $ | 38.83 |
|
|
| (231 | ) |
| $ | 43.05 |
|
|
| (571 | ) |
|
| $ | 84.22 |
| ||||
Forfeited |
|
| (252 | ) |
| $ | 36.06 |
|
|
| — |
|
| $ | — |
|
|
| (24 | ) |
|
| $ | 40.70 |
|
|
| (551 | ) |
| $ | 35.54 |
|
|
| — |
|
| $ | — |
|
|
| (91 | ) |
|
| $ | 33.37 |
| ||||
Unvested at 9/30/17 |
|
| 6,525 |
|
| $ | 36.83 |
|
|
| 575 |
|
| $ | 38.92 |
|
|
| 2,758 |
|
| (1 | ) |
| $ | 41.21 |
| |||||||||||||||||||||||||||
Unvested at 6/30/18 |
|
| 6,435 |
|
| $ | 35.52 |
|
|
| 344 |
|
| $ | 36.14 |
|
|
| 2,941 |
|
| (1 | ) |
| $ | 30.25 |
| |||||||||||||||||||||||||||
(1) | A maximum of |
The following table presents the assumptions related to the performance share units granted in 2017,2018, as indicated in the previous summary table.
|
| 2017 |
|
| 2018 |
| ||||||||||||||
Grant-date fair value |
| $ | 51.05 |
| — |
| $ | 53.12 |
|
|
| $36.23 |
|
| — |
| $ | 37.88 |
| |
Risk-free interest rate |
| 1.50% |
|
| 2.28% |
| ||||||||||||||
Volatility factor |
| 45.8% |
|
| 45.8% |
| ||||||||||||||
Contractual term (years) |
| 2.89 |
|
| 2.89 |
| ||||||||||||||
16
DEVON ENERGY CORPORATION AND SUBSIDIARIES
NOTES TO CONSOLIDATED FINANCIAL STATEMENTS – (Continued)
(Unaudited)
The following table presents a summary of the unrecognized compensation cost and the related weighted average recognition period associated with unvested awards and units as of SeptemberJune 30, 2017.2018.
|
|
|
|
|
| Performance-Based |
|
|
|
|
| |
|
| Restricted Stock |
|
| Restricted Stock |
|
| Performance |
| |||
|
| Awards and Units |
|
| Awards |
|
| Share Units |
| |||
Unrecognized compensation cost (millions) |
| $ | 160 |
|
| $ | 6 |
|
| $ | 35 |
|
Weighted average period for recognition (years) |
|
| 2.5 |
|
|
| 1.8 |
|
|
| 2.0 |
|
EnLink Share-Based Awards
In March 2017, the General Partner and EnLink issued restricted incentive units as bonus payments to officers and certain employees. The combined grant fair value was $10 million, and the total cost was recognized in the first quarter of 2017 due to the awards vesting immediately.
The following table presents a summary of the unrecognized compensation cost and the related weighted average recognition period associated with the General Partner’s and EnLink’s unvested restricted incentive units and performance units as of September 30, 2017.
|
| General Partner |
|
| EnLink |
|
|
|
|
|
| Performance-Based |
|
|
|
|
| |||||||||||
|
| Restricted |
|
| Performance |
|
| Restricted |
|
| Performance |
|
| Restricted Stock |
|
| Restricted Stock |
|
| Performance |
| |||||||
|
| Incentive Units |
|
| Units |
|
| Incentive Units |
|
| Units |
|
| Awards and Units |
|
| Awards |
|
| Share Units |
| |||||||
Unrecognized compensation cost (millions) |
| $ | 14 |
|
| $ | 6 |
|
| $ | 15 |
|
| $ | 6 |
| ||||||||||||
Unrecognized compensation cost |
| $ | 161 |
|
| $ | 2 |
|
| $ | 39 |
| ||||||||||||||||
Weighted average period for recognition (years) |
|
| 1.8 |
|
|
| 2.0 |
|
|
| 1.7 |
|
|
| 1.9 |
|
|
| 2.7 |
|
|
| 1.4 |
|
|
| 2.0 |
|
|
|
The following table presents the components of asset impairments.
|
| Three Months Ended September 30, |
|
| Nine Months Ended September 30, |
| ||||||||||
|
| 2017 |
|
| 2016 |
|
| 2017 |
|
| 2016 |
| ||||
|
| (Millions) |
| |||||||||||||
U.S. oil and gas assets |
| $ | — |
|
| $ | 317 |
|
| $ | — |
|
| $ | 2,810 |
|
Canada oil and gas assets |
|
| — |
|
|
| — |
|
|
| — |
|
|
| 1,166 |
|
EnLink goodwill |
|
| — |
|
|
| — |
|
|
| — |
|
|
| 873 |
|
Other assets |
|
| 2 |
|
|
| 2 |
|
|
| 9 |
|
|
| 2 |
|
Total asset impairments |
| $ | 2 |
|
| $ | 319 |
|
| $ | 9 |
|
| $ | 4,851 |
|
Oil and Gas Impairments
Under the full cost method of accounting, capitalized costs of oil and gas properties, net of accumulated DD&A and deferred income taxes, may not exceed the full cost “ceiling” at the end of each quarter. The ceiling is calculated separately for each country and is based on the present value of estimated future net cash flows from proved oil and gas reserves, discounted at 10% per annum, net of related tax effects. Estimated future net cash flows are calculated using end-of-period costs and an unweighted arithmetic average of commodity prices in effect on the first day of each of the previous 12 months.
The oil and gas impairments in 2016 resulted from declines in the U.S. and Canada full cost ceilings. The lower ceiling values resulted primarily from significant decreases in the 12-month average trailing prices for oil, bitumen, gas and NGLs, which significantly reduced proved reserves values and, to a lesser degree, proved reserves.
EnLink Goodwill Impairments
In the first quarter of 2016, EnLink recognized goodwill impairments. See Note 12 for additional details.
17
DEVON ENERGY CORPORATION AND SUBSIDIARIES
NOTES TO CONSOLIDATED FINANCIAL STATEMENTS – (Continued)
(Unaudited)
6.Restructuring and Transaction Costs
The following table summarizes restructuring and transaction costs presented in the accompanying consolidated comprehensive statement of earnings.
|
| September 30, 2016 |
| |||||
|
| Three Months Ended |
|
| Nine Months Ended |
| ||
|
| (Millions) |
| |||||
2016 reduction in workforce: |
|
|
|
|
|
|
|
|
Employee related costs |
| $ | (7 | ) |
| $ | 229 |
|
Lease obligations |
|
| — |
|
|
| 17 |
|
Asset impairments |
|
| — |
|
|
| 3 |
|
Transaction costs |
|
| 2 |
|
|
| 17 |
|
Restructuring and transaction costs |
| $ | (5 | ) |
| $ | 266 |
|
The following table summarizes Devon’s restructuring liabilities.
|
| Other |
|
| Other |
|
|
|
|
| ||
|
| Current |
|
| Long-term |
|
|
|
|
| ||
|
| Liabilities |
|
| Liabilities |
|
| Total |
| |||
|
| (Millions) |
| |||||||||
Balance as of December 31, 2016 |
| $ | 48 |
|
| $ | 62 |
|
| $ | 110 |
|
Changes due to 2016 workforce reductions |
|
| (25 | ) |
|
| (2 | ) |
|
| (27 | ) |
Changes related to prior years' restructurings |
|
| (3 | ) |
|
| (24 | ) |
|
| (27 | ) |
Balance as of September 30, 2017 |
| $ | 20 |
|
| $ | 36 |
|
| $ | 56 |
|
Balance as of December 31, 2015 |
| $ | 13 |
|
| $ | 63 |
|
| $ | 76 |
|
Changes due to 2016 workforce reductions |
|
| 58 |
|
|
| 13 |
|
|
| 71 |
|
Changes related to prior years' restructurings |
|
| 5 |
|
|
| (8 | ) |
|
| (3 | ) |
Balance as of September 30, 2016 |
| $ | 76 |
|
| $ | 68 |
|
| $ | 144 |
|
Reduction in Workforce
In the first nine months of 2016, Devon recognized $229 million in employee-related costs associated with a reduction in workforce. Of these employee-related costs, approximately $60 million resulted from accelerated vesting of share-based grants, which are noncash charges. Additionally, approximately $30 million resulted from estimated settlements of defined retirement benefits.
As a result of the reduction of workforce, Devon ceased using certain office space that was subject to non-cancellable operating lease arrangements. Devon recognized restructuring costs that represent the present value of its future obligations under the leases and impairment charges for leasehold improvements and furniture associated with the office space it ceased using.
Transaction Costs
In the first nine months of 2016, Devon and EnLink recognized transaction costs primarily associated with the closing of the acquisitions discussed in Note 2.
18
DEVON ENERGY CORPORATION AND SUBSIDIARIES
NOTES TO CONSOLIDATED FINANCIAL STATEMENTS – (Continued)
(Unaudited)
Unproved Impairments
During the first six months of 2018 and 2017, Devon impaired certain non-core acreage in the U.S. that it no longer intends to pursue for exploration opportunities, resulting in unproved impairments of $61 million and $62 million, respectively. Unproved impairments are included in exploration expenses in the consolidated comprehensive statements of earnings.
Asset Impairments
During the second quarter of 2018, Devon recognized $109 million of proved asset impairments relating to U.S. non-core assets no longer in its development plans and approximately $45 million of non-oil and gas asset impairments.
Restructuring and transaction costs
In April 2018, Devon announced workforce reductions and other initiatives designed to enhance its operational focus and cost structure. As a result, Devon recognized $94 million in personnel related restructuring expenses during the second quarter of 2018. Of these expenses, $26 million resulted from accelerated vesting of share-based grants, which are noncash charges. Additionally, $15 million resulted from estimated settlements of defined retirement benefits.
The following table summarizes Devon’s restructuring liabilities.
|
| Other |
|
| Other |
|
|
|
|
| ||
|
| Current |
|
| Long-term |
|
|
|
|
| ||
|
| Liabilities |
|
| Liabilities |
|
| Total |
| |||
Balance as of December 31, 2017 |
| $ | 19 |
|
| $ | 31 |
|
| $ | 50 |
|
Changes related to 2018 workforce reductions |
|
| 48 |
|
|
| — |
|
|
| 48 |
|
Changes related to prior years' restructurings |
|
| (1 | ) |
|
| (8 | ) |
|
| (9 | ) |
Balance as of June 30, 2018 |
| $ | 66 |
|
| $ | 23 |
|
| $ | 89 |
|
|
|
|
|
|
|
|
|
|
|
|
|
|
Balance as of December 31, 2016 |
| $ | 48 |
|
| $ | 62 |
|
| $ | 110 |
|
Changes related to prior years' restructurings |
|
| (17 | ) |
|
| (12 | ) |
|
| (29 | ) |
Balance as of June 30, 2017 |
| $ | 31 |
|
| $ | 50 |
|
| $ | 81 |
|
Other Expenses
The following table summarizes Devon’s other expenses presented in the accompanying consolidated comprehensive statement of earnings.
|
| Three Months Ended June 30, |
|
| Six Months Ended June 30, |
| ||||||||||
|
| 2018 | �� |
| 2017 |
|
| 2018 |
|
| 2017 |
| ||||
Foreign exchange (gain) loss, net |
| $ | 31 |
|
| $ | (49 | ) |
| $ | 81 |
|
| $ | (64 | ) |
Asset retirement obligation accretion |
|
| 14 |
|
|
| 14 |
|
|
| 30 |
|
|
| 31 |
|
Other, net |
|
| (21 | ) |
|
| 27 |
|
|
| (66 | ) |
|
| 11 |
|
Total |
| $ | 24 |
|
| $ | (8 | ) |
| $ | 45 |
|
| $ | (22 | ) |
Foreign exchange (gain) loss, net
The U.S. dollar is the functional currency for Devon’s consolidated operations except its Canadian subsidiaries, which use the Canadian dollar as the functional currency. The amounts in the table above includes both unrealized and realized foreign exchange impacts of foreign currency denominated monetary assets and liabilities, including intercompany loans between subsidiaries with different functional currencies. Unrealized gains and losses arise from the remeasurement of these foreign currency denominated
18
DEVON ENERGY CORPORATION AND SUBSIDIARIES
NOTES TO CONSOLIDATED FINANCIAL STATEMENTS – (Continued)
(Unaudited)
monetary assets and liabilities and intercompany loans. Realized gains and losses arise when there are settlements of these foreign currency denominated monetary assets and liabilities and intercompany loans.
Foreign currency denominated intercompany loan activity in the second quarter of 2018 resulted in a realized loss of $244 million as a result of the strengthening of the U.S. dollar in relation to the Canadian dollar. This loss was offset by reversing $254 million of previously recognized unrealized losses on intercompany loan activity.
The following table presents Devon’s total income tax expense (benefit) and a reconciliation of its effective income tax rate to the U.S. statutory income tax rate.
|
| Three Months Ended September 30, |
|
| Nine Months Ended September 30, |
|
| Three Months Ended June 30, |
|
|
| Six Months Ended June 30, |
| ||||||||||||||||||||
|
| 2017 |
|
| 2016 |
|
| 2017 |
|
| 2016 |
|
| 2018 |
|
| 2017 |
|
|
| 2018 |
|
| 2017 |
| ||||||||
|
| (Millions) |
| ||||||||||||||||||||||||||||||
Current income tax expense |
| $ | 39 |
|
| $ | 85 |
|
| $ | 71 |
|
| $ | 72 |
| |||||||||||||||||
Current income tax expense (benefit) |
| $ | (27 | ) |
| $ | 12 |
|
|
| $ | (23 | ) |
| $ | 32 |
| ||||||||||||||||
Deferred income tax expense (benefit) |
|
| (14 | ) |
|
| 86 |
|
|
| (20 | ) |
|
| (300 | ) |
|
| 20 |
|
|
| (17 | ) |
|
|
| (18 | ) |
|
| (32 | ) |
Total income tax expense (benefit) |
| $ | 25 |
|
| $ | 171 |
|
| $ | 51 |
|
| $ | (228 | ) | |||||||||||||||||
Total income tax benefit |
| $ | (7 | ) |
| $ | (5 | ) |
| $ | (41 | ) |
| $ | — |
| |||||||||||||||||
|
|
|
|
|
|
|
|
|
|
|
|
|
|
|
|
|
|
|
|
|
|
|
|
|
|
|
|
|
|
|
|
| |
U.S. statutory income tax rate |
|
| 35 | % |
|
| 35 | % |
|
| 35 | % |
|
| 35 | % |
|
| 21 | % |
|
| 35 | % |
|
| 21 | % |
|
| 35 | % | |
State income taxes |
|
| (1 | %) |
|
| 0 | % |
|
| (0 | %) |
|
| 2 | % | |||||||||||||||||
Audit settlements |
|
| 3 | % |
|
| 0 | % |
|
| 2 | % |
|
| 0 | % | |||||||||||||||||
Other |
|
| (11 | %) |
|
| (7 | %) |
|
| (9 | %) |
|
| (3 | %) | |||||||||||||||||
Deferred tax asset valuation allowance |
|
| (9 | %) |
|
| (35 | %) |
|
| (25 | %) |
|
| (20 | %) |
|
| (11 | %) |
|
| (30 | %) |
|
| (8 | %) |
|
| (34 | %) | |
Non-deductible goodwill impairments |
|
| 0 | % |
|
| 6 | % |
|
| 0 | % |
|
| (9 | %) | |||||||||||||||||
Change in unrecognized tax benefits |
|
| 3 | % |
|
| 7 | % |
|
| 1 | % |
|
| (2 | %) | |||||||||||||||||
Taxation on Canadian operations |
|
| (1 | %) |
|
| 0 | % |
|
| 0 | % |
|
| (3 | %) | |||||||||||||||||
State income taxes |
|
| 0 | % |
|
| 2 | % |
|
| 0 | % |
|
| 1 | % | |||||||||||||||||
Other |
|
| (19 | %) |
|
| 0 | % |
|
| (7 | %) |
|
| 3 | % | |||||||||||||||||
Effective income tax rate |
|
| 9 | % |
|
| 15 | % |
|
| 4 | % |
|
| 5 | % |
|
| 1 | % |
|
| (2 | %) |
|
| 6 | % |
|
| 0 | % | |
Devon estimates its annual effective income tax rate in recording its quarterly provision for income taxes in the various jurisdictions in which it operates. Statutory tax rate changes and other significant or unusual items are recognized as discrete items in the quarter in which they occur.
Throughout 2016 and through Under the first nine months of 2017, Devon continued to maintain a 100% valuation allowance against its U.S. deferred tax assets resulting from prior year cumulative financial losses largely due to full cost impairments. Furthermore, a partial allowance continues to be held against certain Canadian segment deferred tax assets.
Devon provided an additional $796 million toTax Reform Legislation, the U.S. segment valuation allowance in the first nine months of 2016 based on the financial loss recorded during the period. Also, during the third quarter of 2016, Devon’s Canadian segment recorded a $71 million partial valuation allowance. Devoncorporate income tax rate was reduced its U.S. segment valuation allowance by $348 million in the first nine months of 2017 based on the financial income recorded during the period.to 21% effective January 1, 2018.
Also inIn the table above, the “other” effect is primarily composed of permanent differences for which dollar amounts do not increase or decrease in relation to the change in pre-tax earnings. Generally, such items have an insignificant impact on ourDevon’s effective income tax rate. However, these items have a more noticeable impact to ourthe rate in the third quarterfirst six months of 20172018 due to lower relative earnings during the period. During the third quarter of 2017, “other” is primarily related to the taxation of foreign earnings and other financing items.
In the first quarter of 2016, EnLink recorded goodwill impairments totaling $873 million. These impairments are not deductible for purposes of calculating income tax and, therefore, have an impact on the effective tax rate.
Devon is under audit in the U.S. and various foreign jurisdictions as part of its normal course of business. The timingIn the second quarter of resolution2018, Devon realized $14 million of income tax examinations is uncertainbenefits in conjunction with favorable tax settlements as are the amounts and timinga result of tax payments that are part of any audit settlement process.these audits. Devon believes that within the next 12 months it is reasonably possible that certain tax examinations will be resolved by settlement with the taxing authorities.
During the first quarter of 2018, Devon repatriated approximately $92 million from certain international entities. This repatriation had no tax impact.
Throughout 2017 and through the first six months of 2018, Devon continued to maintain a 100% valuation allowance against its U.S. deferred tax assets resulting from prior year cumulative financial losses largely due to oil and gas impairments and significant net operating losses for U.S. federal and state income tax. Devon provided an additional $129 million to its U.S. segment valuation allowance in the first six months of 2018 based on the financial losses recorded during the period. Upon closing of the EnLink divestiture in the third quarter of 2018, Devon expects to record a gain of approximately $2.5 billion. This gain is expected to significantly reduce Devon’s U.S. deferred tax valuation allowance and Devon will further evaluate its position in the third quarter of 2018. Furthermore, a partial allowance continues to be held against certain Canadian segment deferred tax assets. During the second quarter of 2018, the Canadian segment reduced its valuation allowance by approximately $74 million.
In December 2017, the SEC staff issued Staff Accounting Bulletin No. 118, Income Tax Accounting Implications of the Tax Cuts and Jobs Act (SAB 118), which allows Devon to record provisional amounts during a measurement period not to extend beyond one year after the enactment date. As the Tax Reform Legislation was passed late in the fourth quarter of 2017 and ongoing guidance
19
DEVON ENERGY CORPORATION AND SUBSIDIARIES
NOTES TO CONSOLIDATED FINANCIAL STATEMENTS – (Continued)
(Unaudited)
and interpretations are expected over the next 12 months, Devon considers the accounting of the transition tax, deferred tax remeasurements and other items to be incomplete due to the forthcoming guidance and ongoing analysis of Devon’s tax positions. This analysis will be materially complete upon the filing of the 2017 U.S. tax return in the fourth quarter of 2018. Devon expects to complete its analysis within the measurement period in accordance with SAB 118. No material changes to the provisional amounts recorded in the fourth quarter of 2017 have been made during the first six months of 2018.
The following table reconciles net earnings (loss) attributable to Devonfrom continuing operations and weighted-average common shares outstanding used in the calculations of basic and diluted net earnings (loss) per share.share from continuing operations.
|
| Three Months Ended September 30, |
|
| Nine Months Ended September 30, |
|
| Three Months Ended June 30, |
|
| Six Months Ended June 30, |
| ||||||||||||||||||||
|
| 2017 |
|
| 2016 |
|
| 2017 |
|
| 2016 |
|
| 2018 |
|
| 2017 |
|
| 2018 |
|
| 2017 |
| ||||||||
|
| (Millions, except per share amounts) |
| |||||||||||||||||||||||||||||
Net earnings (loss): |
|
|
|
|
|
|
|
|
|
|
|
|
|
|
|
| ||||||||||||||||
Net earnings (loss) attributable to Devon |
| $ | 228 |
|
| $ | 993 |
|
| $ | 1,218 |
|
| $ | (3,633 | ) | ||||||||||||||||
Net earnings (loss) from continuing operations: |
|
|
|
|
|
|
|
|
|
|
|
|
|
|
|
| ||||||||||||||||
Net earnings (loss) from continuing operations |
| $ | (474 | ) |
| $ | 212 |
|
| $ | (685 | ) |
| $ | 520 |
| ||||||||||||||||
Attributable to participating securities |
|
| (2 | ) |
|
| (11 | ) |
|
| (13 | ) |
|
| (1 | ) |
|
| (1 | ) |
|
| (3 | ) |
|
| (1 | ) |
|
| (6 | ) |
Basic and diluted earnings (loss) |
| $ | 226 |
|
| $ | 982 |
|
| $ | 1,205 |
|
| $ | (3,634 | ) | ||||||||||||||||
Basic and diluted earnings (loss) from continuing operations |
| $ | (475 | ) |
| $ | 209 |
|
| $ | (686 | ) |
| $ | 514 |
| ||||||||||||||||
Common shares: |
|
|
|
|
|
|
|
|
|
|
|
|
|
|
|
|
|
|
|
|
|
|
|
|
|
|
|
|
|
|
|
|
Common shares outstanding - total |
|
| 526 |
|
|
| 524 |
|
|
| 525 |
|
|
| 509 |
|
|
| 521 |
|
|
| 526 |
|
|
| 524 |
|
|
| 525 |
|
Attributable to participating securities |
|
| (6 | ) |
|
| (6 | ) |
|
| (6 | ) |
|
| (6 | ) |
|
| (6 | ) |
|
| (6 | ) |
|
| (6 | ) |
|
| (6 | ) |
Common shares outstanding - basic |
|
| 520 |
|
|
| 518 |
|
|
| 519 |
|
|
| 503 |
|
|
| 515 |
|
|
| 520 |
|
|
| 518 |
|
|
| 519 |
|
Dilutive effect of potential common shares issuable |
|
| 3 |
|
|
| 3 |
|
|
| 3 |
|
|
| — |
|
|
| — |
|
|
| 3 |
|
|
| — |
|
|
| 3 |
|
Common shares outstanding - diluted |
|
| 523 |
|
|
| 521 |
|
|
| 522 |
|
|
| 503 |
|
|
| 515 |
|
|
| 523 |
|
|
| 518 |
|
|
| 522 |
|
Net earnings (loss) per share attributable to Devon: |
|
|
|
|
|
|
|
|
|
|
|
|
|
|
|
| ||||||||||||||||
Net earnings (loss) per share from continuing operations: |
|
|
|
|
|
|
|
|
|
|
|
|
|
|
|
| ||||||||||||||||
Basic |
| $ | 0.43 |
|
| $ | 1.90 |
|
| $ | 2.32 |
|
| $ | (7.22 | ) |
| $ | (0.92 | ) |
| $ | 0.40 |
|
| $ | (1.33 | ) |
| $ | 0.99 |
|
Diluted |
| $ | 0.43 |
|
| $ | 1.89 |
|
| $ | 2.31 |
|
| $ | (7.22 | ) |
| $ | (0.92 | ) |
| $ | 0.40 |
|
| $ | (1.33 | ) |
| $ | 0.99 |
|
Antidilutive options (1) |
|
| 2 |
|
|
| 3 |
|
|
| 2 |
|
|
| 3 |
|
|
| 2 |
|
|
| 2 |
|
|
| 2 |
|
|
| 2 |
|
(1) | Amounts represent options to purchase shares of Devon’s common stock that are excluded from the diluted net earnings |
Components of other comprehensive earnings consist of the following:
|
| Three Months Ended September 30, |
|
| Nine Months Ended September 30, |
| ||||||||||||||||||||||||||
|
| 2017 |
|
| 2016 |
|
| 2017 |
|
| 2016 |
|
| Three Months Ended June 30, |
|
| Six Months Ended June 30, |
| ||||||||||||||
|
| (Millions) |
|
| 2018 |
|
| 2017 |
|
| 2018 |
|
| 2017 |
| |||||||||||||||||
Foreign currency translation: |
|
|
|
|
|
|
|
|
|
|
|
|
|
|
|
|
|
|
|
|
|
|
|
|
|
|
|
|
|
|
|
|
Beginning accumulated foreign currency translation |
| $ | 456 |
|
| $ | 450 |
|
| $ | 456 |
|
| $ | 424 |
|
| $ | 1,261 |
|
| $ | 1,234 |
|
| $ | 1,309 |
|
| $ | 1,226 |
|
Change in cumulative translation adjustment |
|
| 17 |
|
|
| (1 | ) |
|
| 31 |
|
|
| 52 |
|
|
| (36 | ) |
|
| 39 |
|
|
| (96 | ) |
|
| 50 |
|
Income tax benefit (expense) |
|
| (16 | ) |
|
| 3 |
|
|
| (30 | ) |
|
| (24 | ) |
|
| 2 |
|
|
| (11 | ) |
|
| 14 |
|
|
| (14 | ) |
Ending accumulated foreign currency translation |
|
| 457 |
|
|
| 452 |
|
|
| 457 |
|
|
| 452 |
|
|
| 1,227 |
|
|
| 1,262 |
|
|
| 1,227 |
|
|
| 1,262 |
|
Pension and postretirement benefit plans: |
|
|
|
|
|
|
|
|
|
|
|
|
|
|
|
|
|
|
|
|
|
|
|
|
|
|
|
|
|
|
|
|
Beginning accumulated pension and postretirement benefits |
|
| (163 | ) |
|
| (185 | ) |
|
| (172 | ) |
|
| (194 | ) |
|
| (139 | ) |
|
| (167 | ) |
|
| (143 | ) |
|
| (172 | ) |
Recognition of net actuarial loss and prior service cost in earnings (1) |
|
| 5 |
|
|
| 7 |
|
|
| 14 |
|
|
| 20 |
|
|
| 3 |
|
|
| 4 |
|
|
| 7 |
|
|
| 9 |
|
Income tax benefit |
|
| — |
|
|
| 4 |
|
|
| — |
|
|
| — |
| ||||||||||||||||
Ending accumulated pension and postretirement benefits |
|
| (158 | ) |
|
| (174 | ) |
|
| (158 | ) |
|
| (174 | ) |
|
| (136 | ) |
|
| (163 | ) |
|
| (136 | ) |
|
| (163 | ) |
Other |
|
| (2 | ) |
|
| — |
|
|
| (2 | ) |
|
| — |
| ||||||||||||||||
Accumulated other comprehensive earnings, net of tax |
| $ | 297 |
|
| $ | 278 |
|
| $ | 297 |
|
| $ | 278 |
|
| $ | 1,091 |
|
| $ | 1,099 |
|
| $ | 1,091 |
|
| $ | 1,099 |
|
(1) | These accumulated other comprehensive earnings components are included in the computation of net periodic benefit cost, which is a component of |
20
DEVON ENERGY CORPORATION AND SUBSIDIARIES
NOTES TO CONSOLIDATED FINANCIAL STATEMENTS – (Continued)
(Unaudited)
|
| Three Months Ended September 30, |
|
| Nine Months Ended September 30, |
|
| Three Months Ended June 30, |
|
| Six Months Ended June 30, |
| ||||||||||||||||||||
|
| 2017 |
|
| 2016 |
|
| 2017 |
|
| 2016 |
|
| 2018 |
|
| 2017 |
|
| 2018 |
|
| 2017 |
| ||||||||
|
| (Millions) |
| |||||||||||||||||||||||||||||
Net change in working capital accounts, net of assets and liabilities assumed: |
|
|
|
|
|
|
|
|
|
|
|
|
|
|
|
| ||||||||||||||||
Changes in assets and liabilities, net |
|
|
|
|
|
|
|
|
|
|
|
|
|
|
|
| ||||||||||||||||
Accounts receivable |
| $ | (215 | ) |
| $ | 81 |
|
| $ | (85 | ) |
| $ | 87 |
|
| $ | (188 | ) |
| $ | 46 |
|
| $ | (151 | ) |
| $ | 74 |
|
Income taxes receivable |
|
| — |
|
|
| 6 |
|
|
| 8 |
|
|
| 107 |
| ||||||||||||||||
Other current assets |
|
| 12 |
|
|
| 98 |
|
|
| (43 | ) |
|
| 242 |
|
|
| (7 | ) |
|
| 11 |
|
|
| (95 | ) |
|
| (13 | ) |
Other long-term assets |
|
| (28 | ) |
|
| 9 |
|
|
| (81 | ) |
|
| 10 |
| ||||||||||||||||
Accounts payable |
|
| 48 |
|
|
| (34 | ) |
|
| 98 |
|
|
| (185 | ) |
|
| 78 |
|
|
| 51 |
|
|
| 82 |
|
|
| 68 |
|
Revenues and royalties payable |
|
| 63 |
|
|
| 40 |
|
|
| 92 |
|
|
| 34 |
|
|
| 146 |
|
|
| (45 | ) |
|
| 212 |
|
|
| 51 |
|
Other current liabilities |
|
| 99 |
|
|
| (54 | ) |
|
| 24 |
|
|
| (77 | ) |
|
| (127 | ) |
|
| 34 |
|
|
| (63 | ) |
|
| (52 | ) |
Net change in working capital |
| $ | 7 |
|
| $ | 137 |
|
| $ | 94 |
|
| $ | 208 |
| ||||||||||||||||
Other long-term liabilities |
|
| (7 | ) |
|
| (4 | ) |
|
| (12 | ) |
|
| (5 | ) | ||||||||||||||||
Total |
| $ | (133 | ) |
| $ | 102 |
|
| $ | (108 | ) |
| $ | 133 |
| ||||||||||||||||
Supplementary cash flow data - total operations: |
|
|
|
|
|
|
|
|
|
|
|
|
|
|
|
| ||||||||||||||||
Interest paid (net of capitalized interest) |
| $ | 49 |
|
| $ | 113 |
|
| $ | 285 |
|
| $ | 402 |
|
| $ | 138 |
|
| $ | 144 |
|
| $ | 214 |
|
| $ | 236 |
|
Income taxes paid (received) |
| $ | — |
|
| $ | (7 | ) |
| $ | (1) |
|
| $ | (130 | ) | ||||||||||||||||
Income taxes received |
| $ | (7 | ) |
| $ | (4 | ) |
| $ | (6 | ) |
| $ | (1 | ) | ||||||||||||||||
Devon’s acquisition of certain STACK assets during the first three months of 2016 included the noncash issuance of Devon common stock. See Note 2 for additional details.
EnLink’s acquisition of Anadarko Basin gathering and processing midstream assets during the first quarter of 2016 included the noncash issuance of General Partner common units. Additionally, EnLink’s formation of a joint venture during the third quarter of 2016 included non-monetary asset contributions. See Note 2 for additional details.
Components of accounts receivable include the following:
|
| September 30, 2017 |
|
| December 31, 2016 |
| ||||||||||
|
| (Millions) |
|
| June 30, 2018 |
|
| December 31, 2017 |
| |||||||
Oil, gas and NGL sales |
| $ | 528 |
|
| $ | 487 |
|
| $ | 597 |
|
| $ | 559 |
|
Joint interest billings |
|
| 111 |
|
|
| 110 |
|
|
| 165 |
|
|
| 134 |
|
Marketing and midstream revenues |
|
| 792 |
|
|
| 708 |
| ||||||||
Marketing revenues |
|
| 357 |
|
|
| 278 |
| ||||||||
Other |
|
| 44 |
|
|
| 69 |
|
|
| 32 |
|
|
| 29 |
|
Gross accounts receivable |
|
| 1,475 |
|
|
| 1,374 |
|
|
| 1,151 |
|
|
| 1,000 |
|
Allowance for doubtful accounts |
|
| (13 | ) |
|
| (18 | ) |
|
| (10 | ) |
|
| (11 | ) |
Net accounts receivable |
| $ | 1,462 |
|
| $ | 1,356 |
|
| $ | 1,141 |
|
| $ | 989 |
|
|
|
Goodwill
Devon performs an annual impairment test of goodwill at October 31, or more frequently if events or changes in circumstances indicate thatThe following table presents the carrying value of a reporting unit may not be recoverable. Sustained weakness in the overall energy sector driven by low commodity prices, together with a decline in EnLink’s unit price, caused a noncash goodwill impairment of $873 million in the first quarter of 2016. This consisted of a full impairment charge of $93 millionaggregate capitalized costs related to EnLink’s Crude and Condensate reporting unit and partial impairments to EnLink’s Texas and General Partner reporting units of $473 million and $307 million, respectively.
Asset Divestitures
During the third quarter of 2016, Devon derecognized $197 million of goodwill in conjunction with the upstreamDevon’s oil and gas asset divestitures discussed in Note 2.and non-oil and gas activities.
|
| June 30, 2018 |
|
| December 31, 2017 |
| ||
Property and equipment, at cost: |
|
|
|
|
|
|
|
|
Proved |
| $ | 47,350 |
|
| $ | 47,295 |
|
Unproved and properties under development |
|
| 2,425 |
|
|
| 2,457 |
|
Total oil and gas |
|
| 49,775 |
|
|
| 49,752 |
|
Less accumulated DD&A |
|
| (36,818 | ) |
|
| (36,434 | ) |
Oil and gas property and equipment, net |
|
| 12,957 |
|
|
| 13,318 |
|
Other property and equipment |
|
| 1,883 |
|
|
| 1,955 |
|
Less accumulated DD&A |
|
| (719 | ) |
|
| (689 | ) |
Other property and equipment, net |
|
| 1,164 |
|
|
| 1,266 |
|
Property and equipment, net |
| $ | 14,121 |
|
| $ | 14,584 |
|
21
DEVON ENERGY CORPORATION AND SUBSIDIARIES
NOTES TO CONSOLIDATED FINANCIAL STATEMENTS – (Continued)
(Unaudited)
The following table presents other intangible assets reported in other long-term assets in the accompanying consolidated balance sheets.
|
| September 30, 2017 |
|
| December 31, 2016 |
| ||
|
| (Millions) |
| |||||
Customer relationships |
| $ | 1,796 |
|
| $ | 1,796 |
|
Accumulated amortization |
|
| (202 | ) |
|
| (172 | ) |
Net intangibles |
| $ | 1,594 |
|
| $ | 1,624 |
|
The weighted-average amortization period for other intangible assets is 15 years. Amortization expense for intangibles was $37 million and $29 million for the three months ended September 30, 2017 and 2016, respectively, and $96 million and $87 million for the nine months ended September 30, 2017 and 2016, respectively. The remaining amortization expense is estimated to be $123 million for each of the next five years.
Components of other current liabilities include the following:
| September 30, 2017 |
|
| December 31, 2016 |
| June 30, 2018 |
|
| December 31, 2017 |
| ||||
| (Millions) |
| ||||||||||||
Installment payment - see Note 2 | $ | 243 |
|
| $ | 249 |
| |||||||
Derivative liabilities | $ | 648 |
|
| $ | 323 |
| |||||||
Income taxes payable |
| 45 |
|
|
| 144 |
| |||||||
Accrued interest payable |
| 204 |
|
|
| 130 |
|
| 81 |
|
|
| 96 |
|
Income taxes payable |
| 197 |
|
|
| 32 |
| |||||||
Derivative liabilities |
| 54 |
|
|
| 187 |
| |||||||
Restructuring liabilities |
| 20 |
|
|
| 48 |
|
| 66 |
|
|
| 19 |
|
Other |
| 285 |
|
|
| 420 |
|
| 239 |
|
|
| 246 |
|
Other current liabilities | $ | 1,003 |
|
| $ | 1,066 |
| $ | 1,079 |
|
| $ | 828 |
|
A summary of debt is as follows:
|
| September 30, 2017 |
|
| December 31, 2016 |
| ||
|
| (Millions) |
| |||||
Devon debt: |
|
|
|
|
|
|
|
|
Debentures and notes |
| $ | 6,933 |
|
| $ | 6,933 |
|
Net discount on debentures and notes |
|
| (30 | ) |
|
| (30 | ) |
Debt issuance costs |
|
| (41 | ) |
|
| (44 | ) |
Total Devon debt |
|
| 6,862 |
|
|
| 6,859 |
|
EnLink debt: |
|
|
|
|
|
|
|
|
Credit facilities |
|
| 74 |
|
|
| 148 |
|
Debentures and notes |
|
| 3,500 |
|
|
| 3,163 |
|
Net premium (discount) on debentures and notes |
|
| (6 | ) |
|
| 9 |
|
Debt issuance costs |
|
| (27 | ) |
|
| (25 | ) |
Total EnLink debt |
|
| 3,541 |
|
|
| 3,295 |
|
Total debt |
|
| 10,403 |
|
|
| 10,154 |
|
Less amount classified as short-term debt (1) |
|
| 20 |
|
|
| — |
|
Total long-term debt |
| $ | 10,383 |
|
| $ | 10,154 |
|
|
| June 30, 2018 |
|
| December 31, 2017 |
| ||
8.25% due July 1, 2018 |
| $ | 20 |
|
| $ | 20 |
|
2.25% due December 15, 2018 |
|
| 95 |
|
|
| 95 |
|
6.30% due January 15, 2019 |
|
| 162 |
|
|
| 162 |
|
4.00% due July 15, 2021 |
|
| 500 |
|
|
| 500 |
|
3.25% due May 15, 2022 |
|
| 1,000 |
|
|
| 1,000 |
|
5.85% due December 15, 2025 |
|
| 485 |
|
|
| 485 |
|
7.50% due September 15, 2027 |
|
| 73 |
|
|
| 73 |
|
7.875% due September 30, 2031 (1) |
|
| 675 |
|
|
| 1,059 |
|
7.95% due April 15, 2032 (1) |
|
| 366 |
|
|
| 789 |
|
5.60% due July 15, 2041 |
|
| 1,250 |
|
|
| 1,250 |
|
4.75% due May 15, 2042 |
|
| 750 |
|
|
| 750 |
|
5.00% due June 15, 2045 |
|
| 750 |
|
|
| 750 |
|
Net discount on debentures and notes |
|
| (25 | ) |
|
| (30 | ) |
Debt issuance costs |
|
| (34 | ) |
|
| (39 | ) |
Total debt |
|
| 6,067 |
|
|
| 6,864 |
|
Less amount classified as short-term debt (2) |
|
| 277 |
|
|
| 115 |
|
Total long-term debt |
| $ | 5,790 |
|
| $ | 6,749 |
|
(1) | These senior notes were included in the 2018 tender offer repurchases discussed below. |
(2) | Short-term debt as of |
22
DEVON ENERGY CORPORATION AND SUBSIDIARIES
NOTES TO CONSOLIDATED FINANCIAL STATEMENTS – (Continued)
(Unaudited)
Devon has a $3.0 billion Senior Credit Facility. As of SeptemberJune 30, 2017,2018, Devon had $59$51 million in outstanding letters of credit under the Senior Credit Facility. There were no outstanding borrowings under the Senior Credit Facility at SeptemberJune 30, 2017.2018. The Senior Credit Facility contains only one material financial covenant. This covenant requires Devon’s ratio of total funded debt to total capitalization, as defined in the credit agreement, to be no greater than 65%. Under the terms of the credit agreement, total capitalization is adjusted to add back noncash financial write-downs such as full cost ceiling impairments or goodwill impairments. As of SeptemberJune 30, 2017,2018, Devon was in compliance with this covenant with a debt-to-capitalization ratio of 18.9%26.1%.
Retirement of Senior Notes
In the thirdfirst quarter of 2016,2018, Devon completed tender offers to repurchase $1.2 billion$807 million in aggregate principal amount of debt securities, using proceeds fromcash on hand. This included $384 million of the asset divestitures discussed in Note 2.7.875% senior notes due September 30, 2031 and $423 million of the 7.95% senior notes due April 15, 2032. Devon recognized a $312 million loss on early retirement of debt, primarily consisting of $82$304 million in cash retirement costs and other fees.$8 million of noncash charges. These costs, along with other minimal noncash charges associated with retiring the debt, are included in net financing costs in the consolidated comprehensive statements of earnings.
EnLink Debt
All of EnLink’s and the General Partner’s debt is non-recourse to Devon.
EnLink has a $1.5 billion unsecured revolving credit facility. As of September 30, 2017, there were $9 million in outstanding letters of credit and no outstanding borrowings under the $1.5 billion credit facility. The General Partner has a $250 million secured revolving credit facility. As of September 30, 2017, the General Partner had $74 million in outstanding borrowings at an average rate of 3.2%. EnLink and the General Partner were in compliance with all financial covenants in their respective credit facilities as of September 30, 2017.
In the second quarter of 2017, EnLink issued $500 million of 5.45% unsecured senior notes due in 2047. The proceeds were used to repay outstanding borrowings under its revolving credit facility and for general partnership purposes. Additionally, in the second quarter of 2017, EnLink redeemed its $163 million 7.125% senior unsecured notes due in 2022. EnLink redeemed the notes at 103.6% of the principal amount, plus accrued unpaid interest, for aggregate cash consideration of $174 million, which resulted in a gain on extinguishment of debt of $9 million during the second quarter of 2017. The gain is included in net financing costs in the consolidated comprehensive statement of earnings.
Net Financing Costs
The following schedule includes the components of net financing costs.
|
| Three Months Ended September 30, |
|
| Nine Months Ended September 30, |
| ||||||||||
|
| 2017 |
|
| 2016 |
|
| 2017 |
|
| 2016 |
| ||||
|
|
|
|
|
|
|
|
|
|
|
|
|
|
|
|
|
Devon net financing costs: |
|
|
|
|
|
|
|
|
|
|
|
|
|
|
|
|
Interest based on debt outstanding |
| $ | 97 |
|
| $ | 120 |
|
| $ | 292 |
|
| $ | 376 |
|
Early retirement of debt |
|
| — |
|
|
| 84 |
|
|
| — |
|
|
| 84 |
|
Capitalized interest |
|
| (19 | ) |
|
| (16 | ) |
|
| (53 | ) |
|
| (47 | ) |
Other |
|
| (1 | ) |
|
| 7 |
|
|
| (3 | ) |
|
| 18 |
|
Total Devon net financing costs |
|
| 77 |
|
|
| 195 |
|
|
| 236 |
|
|
| 431 |
|
EnLink net financing costs: |
|
|
|
|
|
|
|
|
|
|
|
|
|
|
|
|
Interest based on debt outstanding |
|
| 43 |
|
|
| 37 |
|
|
| 125 |
|
|
| 105 |
|
Interest accretion on deferred installment payment |
|
| 7 |
|
|
| 13 |
|
|
| 20 |
|
|
| 39 |
|
Early retirement of debt |
|
| — |
|
|
| — |
|
|
| (9 | ) |
|
| — |
|
Other |
|
| — |
|
|
| (2 | ) |
|
| (2 | ) |
|
| (5 | ) |
Total EnLink net financing costs |
|
| 50 |
|
|
| 48 |
|
|
| 134 |
|
|
| 139 |
|
Total net financing costs |
| $ | 127 |
|
| $ | 243 |
|
| $ | 370 |
|
| $ | 570 |
|
2322
DEVON ENERGY CORPORATION AND SUBSIDIARIES
NOTES TO CONSOLIDATED FINANCIAL STATEMENTS – (Continued)
(Unaudited)
15. Asset Retirement ObligationsIn July 2018, Devon repaid the $20 million of 8.25% Senior Notes at maturity.
Net Financing Costs
The following schedule includes the components of net financing costs.
|
| Three Months Ended June 30, |
|
| Six Months Ended June 30, |
| ||||||||||
|
| 2018 |
|
| 2017 |
|
| 2018 |
|
| 2017 |
| ||||
Interest based on debt outstanding |
| $ | 81 |
|
| $ | 98 |
|
| $ | 177 |
|
| $ | 195 |
|
Early retirement of debt |
|
| — |
|
|
| — |
|
|
| 312 |
|
|
| — |
|
Capitalized interest |
|
| (17 | ) |
|
| (16 | ) |
|
| (35 | ) |
|
| (32 | ) |
Other |
|
| (2 | ) |
|
| (5 | ) |
|
| (5 | ) |
|
| (3 | ) |
Total net financing costs |
| $ | 62 |
|
| $ | 77 |
|
| $ | 449 |
|
| $ | 160 |
|
The following table presents the changes in Devon’s asset retirement obligations.
|
| Nine Months Ended September 30, |
| |||||||||||||
|
| 2017 |
|
| 2016 |
|
| Six Months Ended June 30, |
| |||||||
|
| (Millions) |
|
| 2018 |
|
| 2017 |
| |||||||
Asset retirement obligations as of beginning of period |
| $ | 1,272 |
|
| $ | 1,414 |
|
| $ | 1,138 |
|
| $ | 1,258 |
|
Liabilities incurred and assumed through acquisitions |
|
| 30 |
|
|
| 18 |
|
|
| 22 |
|
|
| 15 |
|
Liabilities settled and divested |
|
| (53 | ) |
|
| (310 | ) |
|
| (64 | ) |
|
| (26 | ) |
Revision of estimated obligation |
|
| (184 | ) |
|
| 70 |
|
|
| 23 |
|
|
| (184 | ) |
Accretion expense on discounted obligation |
|
| 47 |
|
|
| 58 |
|
|
| 30 |
|
|
| 31 |
|
Foreign currency translation adjustment |
|
| 29 |
|
|
| 26 |
|
|
| (22 | ) |
|
| 14 |
|
Asset retirement obligations as of end of period |
|
| 1,141 |
|
|
| 1,276 |
|
|
| 1,127 |
|
|
| 1,108 |
|
Less current portion |
|
| 41 |
|
|
| 46 |
|
|
| 39 |
|
|
| 44 |
|
Asset retirement obligations, long-term |
| $ | 1,100 |
|
| $ | 1,230 |
|
| $ | 1,088 |
|
| $ | 1,064 |
|
During the second quarter of 2018, Devon reduced its asset retirement obligation by $34 million for those obligations that were assumed by purchasers of certain Barnett Shale assets. For additional information, see Note 3.
During the first quarter of 2017, Devon reduced its estimated asset retirement obligations by $184 million, primarily due to changes in the assumed inflation rate and retirement dates for its oil and gas assets.
During the first nine months of 2016, Devon reduced its asset retirement obligation by $285 million for those obligations that were assumed by purchasers of certain upstream U.S. assets. See Note 2 for additional details.
The following table presents the components of net periodic benefit cost for Devon’s pension and postretirement benefit plans.
|
| Pension Benefits |
|
| Postretirement Benefits |
| ||||||||||||||||||||||||||||||||||||||||||||||||||||||||||
|
| Three Months Ended |
|
| Nine Months Ended |
|
| Three Months Ended |
|
| Nine Months Ended |
|
| Pension Benefits |
|
| Postretirement Benefits |
| ||||||||||||||||||||||||||||||||||||||||||||||
|
| September 30, |
|
| September 30, |
|
| September 30, |
|
| September 30, |
|
| Three Months Ended |
|
| Six Months Ended |
|
| Three Months Ended |
|
| Six Months Ended |
| ||||||||||||||||||||||||||||||||||||||||
|
| 2017 |
|
| 2016 |
|
| 2017 |
|
| 2016 |
|
| 2017 |
|
| 2016 |
|
| 2017 |
|
| 2016 |
|
| June 30, |
|
| June 30, |
|
| June 30, |
|
| June 30, |
| ||||||||||||||||||||||||||||
|
| (Millions) |
|
| 2018 |
|
| 2017 |
|
| 2018 |
|
| 2017 |
|
| 2018 |
|
| 2017 |
|
| 2018 |
|
| 2017 |
| |||||||||||||||||||||||||||||||||||||
Service cost |
| $ | 4 |
|
| $ | 3 |
|
| $ | 12 |
|
| $ | 12 |
|
| $ | — |
|
| $ | — |
|
| $ | — |
|
| $ | — |
|
| $ | 3 |
|
| $ | 4 |
|
| $ | 6 |
|
| $ | 8 |
|
| $ | — |
|
| $ | — |
|
| $ | — |
|
| $ | — |
|
Interest cost |
|
| 11 |
|
|
| 9 |
|
|
| 32 |
|
|
| 32 |
|
|
| — |
|
|
| — |
|
|
| — |
|
|
| — |
|
|
| 10 |
|
|
| 11 |
|
|
| 20 |
|
|
| 21 |
|
|
| — |
|
|
| — |
|
|
| — |
|
|
| — |
|
Expected return on plan assets |
|
| (14 | ) |
|
| (14 | ) |
|
| (41 | ) |
|
| (40 | ) |
|
| — |
|
|
| — |
|
|
| — |
|
|
| — |
|
|
| (14 | ) |
|
| (14 | ) |
|
| (28 | ) |
|
| (27 | ) |
|
| — |
|
|
| — |
|
|
| — |
|
|
| — |
|
Amortization of prior service cost (1) |
|
| — |
|
|
| 1 |
|
|
| 1 |
|
|
| 2 |
|
|
| — |
|
|
| — |
|
|
| (1 | ) |
|
| (1 | ) |
|
| 1 |
|
|
| — |
|
|
| 1 |
|
|
| 1 |
|
|
| (1 | ) |
|
| (1 | ) |
|
| (1 | ) |
|
| (1 | ) |
Net actuarial loss (1) |
|
| 5 |
|
|
| 6 |
|
|
| 14 |
|
|
| 19 |
|
|
| — |
|
|
| — |
|
|
| — |
|
|
| — |
|
|
| 3 |
|
|
| 5 |
|
|
| 7 |
|
|
| 9 |
|
|
| — |
|
|
| — |
|
|
| — |
|
|
| — |
|
Net periodic benefit cost (2) |
| $ | 6 |
|
| $ | 5 |
|
| $ | 18 |
|
| $ | 25 |
|
| $ | — |
|
| $ | — |
|
| $ | (1 | ) |
| $ | (1 | ) |
| $ | 3 |
|
| $ | 6 |
|
| $ | 6 |
|
| $ | 12 |
|
| $ | (1 | ) |
| $ | (1 | ) |
| $ | (1 | ) |
| $ | (1 | ) |
(1) | These net periodic benefit costs were reclassified out of other comprehensive |
(2) | The service cost component of net periodic benefit cost is included in G&A expense and the remaining components of net periodic benefit costs are included in other expenses in the |
(2) Net periodic benefit cost is a component of G&A in the accompanying consolidated comprehensive statements of earnings.
|
|
Common Stock Issued
In January 2016, Devon issued approximately 23 million shares of common stock in conjunction with the STACK asset acquisition discussed in Note 2.
In February 2016, Devon issued 79 million shares of common stock to the public, inclusive of 10 million shares sold as part of the underwriters’ option. Net proceeds from the offering were $1.5 billion.
24
DEVON ENERGY CORPORATION AND SUBSIDIARIES
NOTES TO CONSOLIDATED FINANCIAL STATEMENTS – (Continued)
(Unaudited)
In March 2018, Devon announced a share repurchase program to buy up to $1 billion of shares of common stock. In June 2018, in conjunction with the divestiture of its investment in EnLink and the General Partner, Devon announced the expansion of the share repurchase by an additional $3 billion, bringing the total repurchase program to $4 billion. The share repurchase program expires December 31, 2019. During the first six months of 2018, Devon repurchased 13.7 million shares of common stock for $521 million, or $38.01 per share, under this program.
Dividends
The table below summarizes the dividends Devon paid on its common stock.
| Amounts |
|
| Rate |
| Amounts |
|
| Rate Per Share |
| ||||
| (Millions) |
|
| (Per Share) |
| |||||||||
Quarter Ended 2018: |
|
|
|
|
|
|
| |||||||
First quarter 2018 | $ | 32 |
|
| $ | 0.06 |
| |||||||
Second quarter 2018 |
| 42 |
|
| $ | 0.08 |
| |||||||
Total year-to-date | $ | 74 |
|
|
|
|
| |||||||
Quarter Ended 2017: |
|
|
|
|
|
|
|
|
|
|
|
|
|
|
First quarter 2017 | $ | 32 |
|
| $ | 0.06 |
| $ | 32 |
|
| $ | 0.06 |
|
Second quarter 2017 |
| 33 |
|
| $ | 0.06 |
|
| 33 |
|
| $ | 0.06 |
|
Third quarter 2017 |
| 30 |
|
| $ | 0.06 |
| |||||||
Total year-to-date | $ | 95 |
|
|
|
|
| $ | 65 |
|
|
|
|
|
Quarter Ended 2016: |
|
|
|
|
|
|
| |||||||
First quarter 2016 | $ | 125 |
|
| $ | 0.24 |
| |||||||
Second quarter 2016 |
| 33 |
|
| $ | 0.06 |
| |||||||
Third quarter 2016 |
| 32 |
|
| $ | 0.06 |
| |||||||
Total year-to-date | $ | 190 |
|
|
|
|
| |||||||
In response toDevon increased the depressed commodity price environment, Devon reduced its quarterly dividend by 33% to $0.06$0.08 per share in the second quarter of 2016.2018.
Subsidiary Equity Transactions
EnLink has the abilityOn June 6, 2018, Devon announced it had entered into an agreement to sell common units through its “ataggregate ownership interests in EnLink and the market” equity offering programs. InGeneral Partner for approximately $3.1 billion. On July 18, 2018, Devon completed the sale and expects to recognize a gain of approximately $2.5 billion in the third quarter of 2017, EnLink entered into additional equity distribution agreements to sell up to $600 million in common units through2018. As part of the agreement, Devon extended its programs. Future common units that EnLink issues will be issued under the new equity distribution agreement. During the first nine months of 2017, EnLink issued and sold 5 million common units through its programs and generated $92 million in net proceeds.
In September 2017, EnLink issued 400,000 preferred units through an underwritten public offering for net proceeds of approximately $394 million.
During the first nine months of 2016, EnLink issued and sold 7 million common units for net proceeds of $110 million. In conjunction with its acquisition of Anadarko Basinfixed-fee gathering and processing contracts with respect to the Bridgeport and Cana plants with EnLink through 2029.
Upon entering into the agreement to sell its ownership interest in June 2018, Devon concluded that the transaction was a strategic shift and met the requirements of assets held for sale and discontinued operations. As part of its assessment, Devon considered the following: 1) Devon is exiting its entire midstream business ownership; 2) EnLink and the General Partner is a separate reportable segment and is a component of Devon’s business; and 3) the transaction resulted in a material reduction in total assets, duringdebt, revenues, net earnings and operating cash flows. As a result, Devon classified the first quarterresults of 2016,operations and cash flows related to EnLink issued preferred unitsand the General Partner as discussed in Note 2.discontinued operations on its consolidated financial statements. Additionally, Devon ceased depreciation and amortization for all plant, property and equipment and intangible assets classified as assets held for sale on the date the sales agreement was signed.
As of SeptemberJune 30, 2017,2018, Devon’s ownership interest in EnLink was 23%, excluding the interest held by the General Partner. Devon’s controlling ownership interest in the General Partner as of SeptemberJune 30, 20172018 was 64%.
The net gainsfollowing table presents the amounts reported in the consolidated comprehensive statements of earnings as discontinued operations.
24
DEVON ENERGY CORPORATION AND SUBSIDIARIES
NOTES TO CONSOLIDATED FINANCIAL STATEMENTS – (Continued)
(Unaudited)
| Three Months Ended June 30, |
|
| Six Months Ended June 30, |
| |||||||||||
|
| 2018 |
|
| 2017 |
|
| 2018 |
|
| 2017 |
| ||||
Marketing and midstream revenues |
| $ | 1,595 |
|
| $ | 1,094 |
|
| $ | 3,207 |
|
| $ | 2,245 |
|
Marketing and midstream expenses |
|
| 1,269 |
|
|
| 865 |
|
|
| 2,610 |
|
|
| 1,800 |
|
Depreciation, depletion and amortization |
|
| 106 |
|
|
| 137 |
|
|
| 244 |
|
|
| 265 |
|
General and administrative expenses |
|
| 31 |
|
|
| 31 |
|
|
| 58 |
|
|
| 67 |
|
Financing costs, net |
|
| 45 |
|
|
| 39 |
|
|
| 89 |
|
|
| 84 |
|
Other expenses |
|
| (5 | ) |
|
| (15 | ) |
|
| (7 | ) |
|
| (20 | ) |
Total expenses |
|
| 1,446 |
|
|
| 1,057 |
|
|
| 2,994 |
|
|
| 2,196 |
|
Earnings from discontinued operations before income taxes |
|
| 149 |
|
|
| 37 |
|
|
| 213 |
|
|
| 49 |
|
Income tax expense |
|
| 10 |
|
|
| 4 |
|
|
| 16 |
|
|
| 7 |
|
Net earnings from discontinued operations, net of income tax expense |
|
| 139 |
|
|
| 33 |
|
|
| 197 |
|
|
| 42 |
|
Net earnings attributable to noncontrolling interests |
|
| 90 |
|
|
| 26 |
|
|
| 134 |
|
|
| 40 |
|
Net earnings from discontinued operations attributable to Devon |
| $ | 49 |
|
| $ | 7 |
|
| $ | 63 |
|
| $ | 2 |
|
The following table presents the carrying amounts of the assets and losses and related income taxes resulting from these transactions have been recordedliabilities classified as an adjustment to equity, withheld for sale on the change in ownership reflected as an adjustment to noncontrolling interests.consolidated balance sheets.
|
| June 30, 2018 |
|
| December 31, 2017 |
| ||
Cash and cash equivalents |
| $ | 37 |
|
| $ | 31 |
|
Accounts receivable |
|
| 733 |
|
|
| 681 |
|
Other current assets |
|
| 1,658 |
|
|
| 48 |
|
Midstream and other property and equipment, net (1) |
|
| 6,794 |
|
|
| 6,587 |
|
Goodwill (1) |
|
| 1,542 |
|
|
| 1,542 |
|
Other long-term assets (1) |
|
| — |
|
|
| 1,600 |
|
Total assets held for sale |
| $ | 10,764 |
|
| $ | 10,489 |
|
|
|
|
|
|
|
|
|
|
Accounts payable |
| $ | 213 |
|
| $ | 186 |
|
Revenues and royalties payable |
|
| 473 |
|
|
| 432 |
|
Other current liabilities |
|
| 655 |
|
|
| 373 |
|
Long-term debt (1) |
|
| 3,590 |
|
|
| 3,542 |
|
Deferred income taxes (1) |
|
| 360 |
|
|
| 346 |
|
Other long-term liabilities (1) |
|
| — |
|
|
| 48 |
|
Total liabilities held for sale |
| $ | 5,291 |
|
| $ | 4,927 |
|
Distributions to Noncontrolling Interests
EnLink and the General Partner distributed $247 million and $224 million to non-Devon unitholders during the first nine months of 2017 and 2016, respectively.
(1) | These amounts were reclassified to respective current assets and current liabilities held for sale as of June 30, 2018 with the sale of Devon’s interests in EnLink and the General Partner closing in July 2018. |
Devon is party to various legal actions arising in the normal course of business. Matters that are probable of unfavorable outcome to Devon and which can be reasonably estimated are accrued. Such accruals are based on information known about the matters, Devon’s estimates of the outcomes of such matters and its experience in contesting, litigating and settling similar matters. None of the actions are believed by management to involve future amounts that would be material to Devon’s financial position or results of operations after consideration of recorded accruals. Actual amounts could differ materially from management’s estimates.
Royalty Matters
Numerous oil and natural gas producers and related parties, including Devon, have been named in various lawsuits alleging royalty underpayments. Devon is currently named as a defendant in a number of such lawsuits, including some lawsuits in which the plaintiffs seek to certify classes of similarly situated plaintiffs. Among the allegations typically asserted in these suits are claims that Devon used below-market prices, made improper deductions, used improper measurement techniques and entered into gas purchase
25
DEVON ENERGY CORPORATION AND SUBSIDIARIES
NOTES TO CONSOLIDATED FINANCIAL STATEMENTS – (Continued)
(Unaudited)
Numerous oil and natural gas producers and related parties, including Devon, have been named in various lawsuits alleging royalty underpayments. The suits allege that the producers and related parties used below-market prices, made improper deductions, used improper measurement techniques and entered into gas purchase and processing arrangements with affiliates that resulted in underpayment of royalties in connection with oil, natural gas and NGLs produced and sold. Devon is also involved in governmental agency proceedings and royalty audits and is subject to related contracts and regulatory controls in the ordinary course of business, some that may lead to additional royalty claims. Devon does not currently believe that it is subject to material exposure with respect to such royalty matters.
Environmental Matters
Devon is subject to certain environmental, health and safety laws and regulations, including with respect to environmental remediation activities associated with past operations, such as the Comprehensive Environmental Response, Compensation, and Liability Act and similar state statutes. In response to liabilities associated with these activities, loss accruals primarily consist of estimated uninsured remediation costs. Devon’s monetary exposure for environmental matters is not expected to be material.
Other Matters
Devon is involved in other various legal proceedings incidental to its business. However, to Devon’s knowledge, there were no other material pending legal proceedings to which Devon is a party or to which any of its property is subject.
The following table provides carrying value and fair value measurement information for certain of Devon’s financial assets and liabilities. None of the items below are measured using Level 3 inputs. The carrying values of cash, accounts receivable, other current receivables, accounts payable, other current payables and accrued expenses included in the accompanying consolidated balance sheets approximated fair value at SeptemberJune 30, 20172018 and December 31, 2016.2017. Therefore, such financial assets and liabilities are not presented in the following table. Additionally, the fair values of oil and gas assets goodwill and other intangible assetsgoodwill and related impairments are measured as of the impairment date using Level 3 inputs. More information on these items is provided in Note 56.
As discussed further in Note 19, Devon’s announcement of the sale of its aggregate ownership interests in EnLink and Note 12, respectively.the General Partner resulted in Devon reclassifying the related assets and liabilities to held for sale on the consolidated balance sheets.
|
|
|
|
|
|
|
|
|
| Fair Value |
|
|
|
|
|
|
|
|
|
| Fair Value Measurements Using: |
| ||||||||||
|
|
|
|
|
|
|
|
|
| Measurements Using: |
|
| Carrying |
|
| Total Fair |
|
| Level 1 |
|
| Level 2 |
| |||||||||
|
| Carrying |
|
| Total Fair |
|
| Level 1 |
|
| Level 2 |
|
| Amount |
|
| Value |
|
| Inputs |
|
| Inputs |
| ||||||||
|
| Amount |
|
| Value |
|
| Inputs |
|
| Inputs |
| ||||||||||||||||||||
|
| (Millions) |
| |||||||||||||||||||||||||||||
September 30, 2017 assets (liabilities): |
|
|
|
|
|
|
|
|
|
|
|
|
|
|
|
| ||||||||||||||||
June 30, 2018 assets (liabilities): |
|
|
|
|
|
|
|
|
|
|
|
|
|
|
|
| ||||||||||||||||
Cash equivalents |
| $ | 1,510 |
|
| $ | 1,510 |
|
| $ | 1,431 |
|
| $ | 79 |
|
| $ | 321 |
|
| $ | 321 |
|
| $ | 321 |
|
| $ | — |
|
Commodity derivatives |
| $ | 43 |
|
| $ | 43 |
|
| $ | — |
|
| $ | 43 |
|
| $ | 240 |
|
| $ | 240 |
|
| $ | — |
|
| $ | 240 |
|
Commodity derivatives |
| $ | (60 | ) |
| $ | (60 | ) |
| $ | — |
|
| $ | (60 | ) |
| $ | (740 | ) |
| $ | (740 | ) |
| $ | — |
|
| $ | (740 | ) |
Interest rate derivatives |
| $ | 1 |
|
| $ | 1 |
|
| $ | — |
|
| $ | 1 |
|
| $ | 1 |
|
| $ | 1 |
|
| $ | — |
|
| $ | 1 |
|
Interest rate derivatives |
| $ | (62 | ) |
| $ | (62 | ) |
| $ | — |
|
| $ | (62 | ) |
| $ | (1 | ) |
| $ | (1 | ) |
| $ | — |
|
| $ | (1 | ) |
Debt |
| $ | (10,403 | ) |
| $ | (11,480 | ) |
| $ | — |
|
| $ | (11,480 | ) |
| $ | (6,067 | ) |
| $ | (6,572 | ) |
| $ | — |
|
| $ | (6,572 | ) |
Installment payment |
| $ | (243 | ) |
| $ | (244 | ) |
| $ | — |
|
| $ | (244 | ) | ||||||||||||||||
Capital lease obligations |
| $ | (4 | ) |
| $ | (4 | ) |
| $ | — |
|
| $ | (4 | ) | ||||||||||||||||
|
|
|
|
|
|
|
|
|
|
|
|
|
|
|
|
| ||||||||||||||||
December 31, 2016 assets (liabilities): |
|
|
|
|
|
|
|
|
|
|
|
|
|
|
|
| ||||||||||||||||
December 31, 2017 assets (liabilities): |
|
|
|
|
|
|
|
|
|
|
|
|
|
|
|
| ||||||||||||||||
Cash equivalents |
| $ | 1,542 |
|
| $ | 1,542 |
|
| $ | 1,298 |
|
| $ | 244 |
|
| $ | 1,533 |
|
| $ | 1,533 |
|
| $ | 1,454 |
|
| $ | 79 |
|
Commodity derivatives |
| $ | 10 |
|
| $ | 10 |
|
| $ | — |
|
| $ | 10 |
|
| $ | 205 |
|
| $ | 205 |
|
| $ | — |
|
| $ | 205 |
|
Commodity derivatives |
| $ | (203 | ) |
| $ | (203 | ) |
| $ | — |
|
| $ | (203 | ) |
| $ | (286 | ) |
| $ | (286 | ) |
| $ | — |
|
| $ | (286 | ) |
Interest rate derivatives |
| $ | 1 |
|
| $ | 1 |
|
| $ | — |
|
| $ | 1 |
|
| $ | 1 |
|
| $ | 1 |
|
| $ | — |
|
| $ | 1 |
|
Interest rate derivatives |
| $ | (41 | ) |
| $ | (41 | ) |
| $ | — |
|
| $ | (41 | ) |
| $ | (64 | ) |
| $ | (64 | ) |
| $ | — |
|
| $ | (64 | ) |
Debt |
| $ | (10,154 | ) |
| $ | (10,760 | ) |
| $ | — |
|
| $ | (10,760 | ) |
| $ | (6,864 | ) |
| $ | (8,131 | ) |
| $ | — |
|
| $ | (8,131 | ) |
Installment payment |
| $ | (473 | ) |
| $ | (477 | ) |
| $ | — |
|
| $ | (477 | ) | ||||||||||||||||
Capital lease obligations |
| $ | (7 | ) |
| $ | (6 | ) |
| $ | — |
|
| $ | (6 | ) | ||||||||||||||||
26
DEVON ENERGY CORPORATION AND SUBSIDIARIES
NOTES TO CONSOLIDATED FINANCIAL STATEMENTS – (Continued)
(Unaudited)
The following methods and assumptions were used to estimate the fair values in the table above.
Level 1 Fair Value Measurements
Cash equivalents – Amounts consist primarily of money market investments and U.S. and Canadian treasury securities. Thethe fair value approximates the carrying value.
Level 2 Fair Value Measurements
Cash equivalents – Amounts primarily consist primarily of commercial paper and Canadian agency and provincial securities investments. Thethe fair value approximates the carrying value.
Commodity and interest rate derivatives – The fair values of commodity and interest rate derivatives are estimated using internal discounted cash flow calculations based upon forward curves and data obtained from independent third parties for contracts with similar terms or data obtained from counterparties to the agreements.
Debt – Devon’s debt instruments do not actively trade in an established market. The fair values of its debt are estimated based on rates available for debt with similar terms and maturity. The fair value of the credit facility balance is the carrying value.
Installment payment – The fair value of the EnLink installment payment was based on Level 2 inputs from third-party market quotations.
Capital lease obligations – The fair value was calculated using inputs from third-party banks.
Devon manages its operations through distinct operating segments, which are defined primarily by geographic areas. For financial reporting purposes, Devon aggregates its U.S. operating segments into one reporting segment due to the similar nature of the businesses. However, Devon’s Canadian E&P operating segment is reported as a separate reporting segment primarily due to the significant differences between the U.S. and Canadian regulatory environments. Devon’s U.S. and Canadian segments are both primarily engaged in oil and gas E&P activities.
Devon considers EnLink, combined with the General Partner, to be an operatinga segment that is distinct from the U.S. and Canadian operating segments. EnLink’s operations consist of midstream assets and operations located acrossin the U.S. Additionally, EnLink has a management team that is primarily responsible for capital and resource allocation decisions. Therefore,However, with Devon’s recent divestiture announcement, activity related to the General Partner and EnLink ishave now been classified as discontinued operations within Devon’s consolidated comprehensive statements of earnings and consolidated statements of cash flows, and the associated assets and liabilities of EnLink and the General Partner are presented as a separate reporting segment.assets and liabilities held for sale on the consolidated balance sheets. Additional information can be found in Note 19.
27
DEVON ENERGY CORPORATION AND SUBSIDIARIES
NOTES TO CONSOLIDATED FINANCIAL STATEMENTS – (Continued)
(Unaudited)
|
| U.S. |
|
| Canada |
|
| EnLink |
|
| Eliminations |
|
| Total |
| |||||
|
| (Millions) |
| |||||||||||||||||
Three Months Ended September 30, 2017: |
|
|
|
|
|
|
|
|
|
|
|
|
|
|
|
|
|
|
|
|
Revenues from external customers |
| $ | 1,575 |
|
| $ | 358 |
|
| $ | 1,223 |
|
| $ | — |
|
| $ | 3,156 |
|
Asset dispositions and other |
| $ | 1 |
|
| $ | — |
|
| $ | (1 | ) |
| $ | — |
|
| $ | — |
|
Intersegment revenues |
| $ | — |
|
| $ | — |
|
| $ | 174 |
|
| $ | (174 | ) |
| $ | — |
|
Depreciation, depletion and amortization |
| $ | 195 |
|
| $ | 63 |
|
| $ | 142 |
|
| $ | — |
|
| $ | 400 |
|
Interest expense |
| $ | 82 |
|
| $ | 17 |
|
| $ | 49 |
|
| $ | (15 | ) |
| $ | 133 |
|
Asset impairments |
| $ | — |
|
| $ | — |
|
| $ | 2 |
|
| $ | — |
|
| $ | 2 |
|
Earnings before income taxes |
| $ | 167 |
|
| $ | 85 |
|
| $ | 20 |
|
| $ | — |
|
| $ | 272 |
|
Income tax expense |
| $ | (5 | ) |
| $ | 28 |
|
| $ | 2 |
|
| $ | — |
|
| $ | 25 |
|
Net earnings |
| $ | 172 |
|
| $ | 57 |
|
| $ | 18 |
|
| $ | — |
|
| $ | 247 |
|
Net earnings attributable to noncontrolling interests |
| $ | — |
|
| $ | — |
|
| $ | 19 |
|
| $ | — |
|
| $ | 19 |
|
Net earnings (loss) attributable to Devon |
| $ | 172 |
|
| $ | 57 |
|
| $ | (1 | ) |
| $ | — |
|
| $ | 228 |
|
Capital expenditures, including acquisitions |
| $ | 560 |
|
| $ | 103 |
|
| $ | 170 |
|
| $ | — |
|
| $ | 833 |
|
Three Months Ended September 30, 2016: |
|
|
|
|
|
|
|
|
|
|
|
|
|
|
|
|
|
|
|
|
Revenues from external customers |
| $ | 1,653 |
|
| $ | 305 |
|
| $ | 924 |
|
| $ | — |
|
| $ | 2,882 |
|
Asset dispositions and other |
| $ | 1,351 |
|
| $ | — |
|
| $ | — |
|
| $ | — |
|
| $ | 1,351 |
|
Intersegment revenues |
| $ | — |
|
| $ | — |
|
| $ | 180 |
|
| $ | (180 | ) |
| $ | — |
|
Depreciation, depletion and amortization |
| $ | 196 |
|
| $ | 72 |
|
| $ | 126 |
|
| $ | — |
|
| $ | 394 |
|
Interest expense |
| $ | 185 |
|
| $ | 34 |
|
| $ | 49 |
|
| $ | (23 | ) |
| $ | 245 |
|
Asset impairments |
| $ | 317 |
|
| $ | 2 |
|
| $ | — |
|
| $ | — |
|
| $ | 319 |
|
Restructuring and transaction costs |
| $ | (10 | ) |
| $ | 5 |
|
| $ | — |
|
| $ | — |
|
| $ | (5 | ) |
Earnings before income taxes |
| $ | 1,122 |
|
| $ | 37 |
|
| $ | 19 |
|
| $ | — |
|
| $ | 1,178 |
|
Income tax expense |
| $ | 5 |
|
| $ | 159 |
|
| $ | 7 |
|
| $ | — |
|
| $ | 171 |
|
Net earnings (loss) |
| $ | 1,117 |
|
| $ | (122 | ) |
| $ | 12 |
|
| $ | — |
|
| $ | 1,007 |
|
Net earnings attributable to noncontrolling interests |
| $ | — |
|
| $ | — |
|
| $ | 14 |
|
| $ | — |
|
| $ | 14 |
|
Net earnings (loss) attributable to Devon |
| $ | 1,117 |
|
| $ | (122 | ) |
| $ | (2 | ) |
| $ | — |
|
| $ | 993 |
|
Capital expenditures, including acquisitions |
| $ | 277 |
|
| $ | 48 |
|
| $ | 132 |
|
| $ | — |
|
| $ | 457 |
|
Nine Months Ended September 30, 2017: |
|
|
|
|
|
|
|
|
|
|
|
|
|
|
|
|
|
|
|
|
Revenues from external customers |
| $ | 5,547 |
|
| $ | 951 |
|
| $ | 3,468 |
|
| $ | — |
|
| $ | 9,966 |
|
Asset dispositions and other |
| $ | 11 |
|
| $ | — |
|
| $ | (1 | ) |
| $ | — |
|
| $ | 10 |
|
Intersegment revenues |
| $ | — |
|
| $ | — |
|
| $ | 515 |
|
| $ | (515 | ) |
| $ | — |
|
Depreciation, depletion and amortization |
| $ | 556 |
|
| $ | 199 |
|
| $ | 407 |
|
| $ | — |
|
| $ | 1,162 |
|
Interest expense |
| $ | 243 |
|
| $ | 48 |
|
| $ | 133 |
|
| $ | (42 | ) |
| $ | 382 |
|
Asset impairments |
| $ | — |
|
| $ | — |
|
| $ | 9 |
|
| $ | — |
|
| $ | 9 |
|
Earnings before income taxes |
| $ | 1,133 |
|
| $ | 126 |
|
| $ | 69 |
|
| $ | — |
|
| $ | 1,328 |
|
Income tax expense |
| $ | — |
|
| $ | 42 |
|
| $ | 9 |
|
| $ | — |
|
| $ | 51 |
|
Net earnings |
| $ | 1,133 |
|
| $ | 84 |
|
| $ | 60 |
|
| $ | — |
|
| $ | 1,277 |
|
Net earnings attributable to noncontrolling interests |
| $ | — |
|
| $ | — |
|
| $ | 59 |
|
| $ | — |
|
| $ | 59 |
|
Net earnings attributable to Devon |
| $ | 1,133 |
|
| $ | 84 |
|
| $ | 1 |
|
| $ | — |
|
| $ | 1,218 |
|
Property and equipment, net |
| $ | 7,726 |
|
| $ | 2,787 |
|
| $ | 6,569 |
|
| $ | — |
|
| $ | 17,082 |
|
Total assets |
| $ | 13,302 |
|
| $ | 3,761 |
|
| $ | 10,548 |
|
| $ | (52 | ) |
| $ | 27,559 |
|
Capital expenditures, including acquisitions |
| $ | 1,460 |
|
| $ | 275 |
|
| $ | 636 |
|
| $ | — |
|
| $ | 2,371 |
|
Nine Months Ended September 30, 2016: |
|
|
|
|
|
|
|
|
|
|
|
|
|
|
|
|
|
|
|
|
Revenues from external customers |
| $ | 4,320 |
|
| $ | 688 |
|
| $ | 2,488 |
|
| $ | — |
|
| $ | 7,496 |
|
Asset dispositions and other |
| $ | 1,351 |
|
| $ | — |
|
| $ | — |
|
| $ | — |
|
| $ | 1,351 |
|
Intersegment revenues |
| $ | — |
|
| $ | — |
|
| $ | 539 |
|
| $ | (539 | ) |
| $ | — |
|
Depreciation, depletion and amortization |
| $ | 763 |
|
| $ | 284 |
|
| $ | 373 |
|
| $ | — |
|
| $ | 1,420 |
|
Interest expense |
| $ | 400 |
|
| $ | 101 |
|
| $ | 140 |
|
| $ | (66 | ) |
| $ | 575 |
|
Asset impairments |
| $ | 2,810 |
|
| $ | 1,168 |
|
| $ | 873 |
|
| $ | — |
|
| $ | 4,851 |
|
Restructuring and transaction costs |
| $ | 245 |
|
| $ | 15 |
|
| $ | 6 |
|
| $ | — |
|
| $ | 266 |
|
Loss before income taxes |
| $ | (2,040 | ) |
| $ | (1,359 | ) |
| $ | (853 | ) |
| $ | — |
|
| $ | (4,252 | ) |
Income tax expense (benefit) |
| $ | (6 | ) |
| $ | (223 | ) |
| $ | 1 |
|
| $ | — |
|
| $ | (228 | ) |
Net loss |
| $ | (2,034 | ) |
| $ | (1,136 | ) |
| $ | (854 | ) |
| $ | — |
|
| $ | (4,024 | ) |
Net earnings (loss) attributable to noncontrolling interests |
| $ | 1 |
|
| $ | — |
|
| $ | (392 | ) |
| $ | — |
|
| $ | (391 | ) |
Net loss attributable to Devon |
| $ | (2,035 | ) |
| $ | (1,136 | ) |
| $ | (462 | ) |
| $ | — |
|
| $ | (3,633 | ) |
Property and equipment, net |
| $ | 7,196 |
|
| $ | 2,778 |
|
| $ | 6,195 |
|
| $ | — |
|
| $ | 16,169 |
|
Total assets |
| $ | 12,317 |
|
| $ | 4,355 |
|
| $ | 10,197 |
|
| $ | (56 | ) |
| $ | 26,813 |
|
Capital expenditures, including acquisitions |
| $ | 2,454 |
|
| $ | 158 |
|
| $ | 816 |
|
| $ | — |
|
| $ | 3,428 |
|
|
| U.S. |
|
| Canada |
|
| Total |
| |||
Three Months Ended June 30, 2018: |
|
|
|
|
|
|
|
|
|
|
|
|
Revenues from external customers |
| $ | 1,922 |
|
| $ | 327 |
|
| $ | 2,249 |
|
Depreciation, depletion and amortization |
| $ | 342 |
|
| $ | 78 |
|
| $ | 420 |
|
Interest expense |
| $ | 72 |
|
| $ | (3 | ) |
| $ | 69 |
|
Asset impairments |
| $ | 154 |
|
| $ | — |
|
| $ | 154 |
|
Asset dispositions |
| $ | 23 |
|
| $ | — |
|
| $ | 23 |
|
Restructuring and transaction costs |
| $ | 85 |
|
| $ | 9 |
|
| $ | 94 |
|
Loss from continuing operations before income taxes |
| $ | (471 | ) |
| $ | (10 | ) |
| $ | (481 | ) |
Income tax expense (benefit) |
| $ | 13 |
|
| $ | (20 | ) |
| $ | (7 | ) |
Net earnings (loss) from continuing operations |
| $ | (484 | ) |
| $ | 10 |
|
| $ | (474 | ) |
Capital expenditures, including acquisitions |
| $ | 585 |
|
| $ | 60 |
|
| $ | 645 |
|
Three Months Ended June 30, 2017: |
|
|
|
|
|
|
|
|
|
|
|
|
Revenues from external customers |
| $ | 1,891 |
|
| $ | 274 |
|
| $ | 2,165 |
|
Depreciation, depletion and amortization |
| $ | 283 |
|
| $ | 86 |
|
| $ | 369 |
|
Interest expense |
| $ | 81 |
|
| $ | — |
|
| $ | 81 |
|
Asset dispositions |
| $ | (22 | ) |
| $ | — |
|
| $ | (22 | ) |
Earnings (loss) from continuing operations before income taxes |
| $ | 213 |
|
| $ | (6 | ) |
| $ | 207 |
|
Income tax expense (benefit) |
| $ | 2 |
|
| $ | (7 | ) |
| $ | (5 | ) |
Net earnings from continuing operations |
| $ | 211 |
|
| $ | 1 |
|
| $ | 212 |
|
Capital expenditures, including acquisitions |
| $ | 385 |
|
| $ | 71 |
|
| $ | 456 |
|
Six Months Ended June 30, 2018: |
|
|
|
|
|
|
|
|
|
|
|
|
Revenues from external customers |
| $ | 3,801 |
|
| $ | 646 |
|
| $ | 4,447 |
|
Depreciation, depletion and amortization |
| $ | 647 |
|
| $ | 172 |
|
| $ | 819 |
|
Interest expense |
| $ | 319 |
|
| $ | 145 |
|
| $ | 464 |
|
Asset impairments |
| $ | 154 |
|
| $ | — |
|
| $ | 154 |
|
Asset dispositions |
| $ | 11 |
|
| $ | — |
|
| $ | 11 |
|
Restructuring and transaction costs |
| $ | 85 |
|
| $ | 9 |
|
| $ | 94 |
|
Loss from continuing operations before income taxes |
| $ | (587 | ) |
| $ | (139 | ) |
| $ | (726 | ) |
Income tax expense (benefit) |
| $ | 14 |
|
| $ | (55 | ) |
| $ | (41 | ) |
Net loss from continuing operations |
| $ | (601 | ) |
| $ | (84 | ) |
| $ | (685 | ) |
Property and equipment, net |
| $ | 10,031 |
|
| $ | 4,090 |
|
| $ | 14,121 |
|
Total continuing assets (1) |
| $ | 13,247 |
|
| $ | 5,148 |
|
| $ | 18,395 |
|
Capital expenditures, including acquisitions |
| $ | 1,197 |
|
| $ | 149 |
|
| $ | 1,346 |
|
Six Months Ended June 30, 2017: |
|
|
|
|
|
|
|
|
|
|
|
|
Revenues from external customers |
| $ | 3,972 |
|
| $ | 593 |
|
| $ | 4,565 |
|
Depreciation, depletion and amortization |
| $ | 585 |
|
| $ | 184 |
|
| $ | 769 |
|
Interest expense |
| $ | 161 |
|
| $ | 5 |
|
| $ | 166 |
|
Asset dispositions |
| $ | (29 | ) |
| $ | (1 | ) |
| $ | (30 | ) |
Earnings (loss) from continuing operations before income taxes |
| $ | 523 |
|
| $ | (3 | ) |
| $ | 520 |
|
Income tax expense (benefit) |
| $ | 5 |
|
| $ | (5 | ) |
| $ | — |
|
Net earnings from continuing operations |
| $ | 518 |
|
| $ | 2 |
|
| $ | 520 |
|
Property and equipment, net |
| $ | 10,051 |
|
| $ | 4,166 |
|
| $ | 14,217 |
|
Total continuing assets (1) |
| $ | 13,907 |
|
| $ | 5,020 |
|
| $ | 18,927 |
|
Capital expenditures, including acquisitions |
| $ | 731 |
|
| $ | 153 |
|
| $ | 884 |
|
(1) | Total assets in the table above do not include assets held for sale related to Devon’s discontinued operations, which totaled $10.8 billion and $10.2 billion on June 30, 2018 and June 30, 2017, respectively. |
28
Item 2. Management’s Discussion and Analysis of Financial Condition and Results of Operations
The following discussion and analysis addresses material changes in our results of operations and capital resources and uses for the three-month and nine-monthsix-month periods ended SeptemberJune 30, 20172018 compared to the three-month and nine-monthprevious periods ended September 30, 2016 and in our financial condition and liquidity since December 31, 2016.2017. For information regarding our critical accounting policies and estimates, see our 20162017 Annual Report on Form 10-K under “Item 7. Management’s Discussion and Analysis of Financial Condition and Results of Operations.”
Overview of 20172018 Results
Key components of our financial performance as compared to prior quarter are summarized below.
|
| Three Months Ended September 30, |
|
| Nine Months Ended September 30, (3) |
| ||||||||||||||||||
|
| 2017 |
|
| 2016 |
|
| Change |
|
| 2017 |
|
| 2016 |
|
| Change |
| ||||||
|
| (Millions, except per share amounts) |
| |||||||||||||||||||||
Net earnings (loss) attributable to Devon |
| $ | 228 |
|
| $ | 993 |
|
|
| - 77 | % |
| $ | 1,218 |
|
| $ | (3,633 | ) |
|
| N/M |
|
Net earnings (loss) per diluted share attributable to Devon |
| $ | 0.43 |
|
| $ | 1.89 |
|
|
| - 77 | % |
| $ | 2.31 |
|
| $ | (7.22 | ) |
|
| N/M |
|
Core earnings (loss) attributable to Devon (1) |
| $ | 242 |
|
| $ | 47 |
|
|
| +415 | % |
| $ | 636 |
|
| $ | (169 | ) |
|
| N/M |
|
Core earnings (loss) per diluted share attributable to Devon (1) |
| $ | 0.46 |
|
| $ | 0.09 |
|
|
| +411 | % |
| $ | 1.20 |
|
| $ | (0.34 | ) |
|
| N/M |
|
Retained production (MBoe/d) |
|
| 527 |
|
|
| 550 |
|
|
| - 4 | % |
|
| 542 |
|
|
| 578 |
|
|
| - 6 | % |
Total production (MBoe/d) |
|
| 527 |
|
|
| 577 |
|
|
| - 9 | % |
|
| 542 |
|
|
| 635 |
|
|
| - 15 | % |
Realized price per Boe (2) |
| $ | 25.67 |
|
| $ | 20.98 |
|
|
| +22 | % |
| $ | 25.41 |
|
| $ | 17.37 |
|
|
| +46 | % |
Operating cash flow |
| $ | 776 |
|
| $ | 727 |
|
|
| +7 | % |
| $ | 2,420 |
|
| $ | 1,237 |
|
|
| +96 | % |
Capital expenditures, including acquisitions |
| $ | 833 |
|
| $ | 457 |
|
|
| +82 | % |
| $ | 2,371 |
|
| $ | 3,428 |
|
|
| - 31 | % |
Shareholder and noncontrolling interests distributions |
| $ | 114 |
|
| $ | 109 |
|
|
| +5 | % |
| $ | 342 |
|
| $ | 414 |
|
|
| - 17 | % |
Cash and cash equivalents |
|
|
|
|
|
|
|
|
|
|
|
|
| $ | 2,781 |
|
| $ | 2,385 |
|
|
| +17 | % |
Total debt |
|
|
|
|
|
|
|
|
|
|
|
|
| $ | 10,403 |
|
| $ | 11,354 |
|
|
| - 8 | % |
|
| Q2 2018 (3) |
|
| Q1 2018 (3) |
|
| Change |
| |||
Net loss from continuing operations |
| $ | (474 | ) |
| $ | (211 | ) |
|
| - 125 | % |
Net loss per diluted share from continuing operations |
| $ | (0.92 | ) |
| $ | (0.41 | ) |
|
| - 123 | % |
Net earnings attributable to Devon from discontinued operations |
| $ | 49 |
|
| $ | 14 |
|
|
| +259 | % |
Net earnings per diluted share attributable to Devon from discontinued operations |
| $ | 0.09 |
|
| $ | 0.03 |
|
|
| +243 | % |
Net loss attributable to Devon |
| $ | (425 | ) |
| $ | (197 | ) |
|
| - 116 | % |
Net loss per diluted share attributable to Devon |
| $ | (0.83 | ) |
| $ | (0.38 | ) |
|
| - 120 | % |
Core earnings attributable to Devon (1) |
| $ | 177 |
|
| $ | 108 |
|
|
| +65 | % |
Core earnings attributable to Devon per diluted share (1) |
| $ | 0.34 |
|
| $ | 0.20 |
|
|
| +75 | % |
Retained production (MBoe/d) |
|
| 520 |
|
|
| 511 |
|
|
| +2 | % |
Total production (MBoe/d) |
|
| 541 |
|
|
| 544 |
|
|
| - 1 | % |
Realized price per Boe (2) |
| $ | 31.81 |
|
| $ | 27.75 |
|
|
| +15 | % |
Operating cash flow from continuing operations |
| $ | 269 |
|
| $ | 610 |
|
|
| - 56 | % |
Capitalized expenditures, including acquisitions |
| $ | 645 |
|
| $ | 701 |
|
|
| - 8 | % |
Cash and cash equivalents |
| $ | 1,460 |
|
| $ | 1,407 |
|
|
| +4 | % |
Total debt |
| $ | 6,067 |
|
| $ | 6,066 |
|
|
| +0 | % |
(1) | Core earnings |
(2) | Excludes any impact of oil, gas and NGL derivatives. |
(3) | Except for balance sheet amounts, which are presented as of |
During the first ninesix months of 2017,2018, we generated solid operating results with our three-fold strategy of operating in North America’s best resource plays, delivering superior execution and maintaining a high degree of financial strength. Led by our development in the STACK and Delaware Basin, we continued to improve our 90-day initial production rates. With investments in proprietary data tools, predictive analytics and artificial intelligence, we are delivering industry-leading, initial-rate well productivity performance and improving the performance of our established wells. Even though our 2017 production volumes have declined from 2016 due to reduced capital investment, we estimate our highest-margin U.S. oil production from retained assets will exit 2017 at levels approximately 20% higher than year-end 2016.
ComparedWe continue to 2016, commodity prices increased significantlyfocus on our “2020 Vision,” which is our plan through the end of the decade intended to optimize returns and were the primary driver for improvements in Devon’s operating margins, earnings anddeliver top-tier, capital-efficient cash flow duringgrowth. Our 2020 Vision is focused on the following strategic priorities:
Maximize cash flow by optimizing base production and reducing per-unit cash costs;
Improve capital efficiency with a concentration of investment on highest-returning development projects in the Delaware Basin and STACK;
Simplify our portfolio by monetizing non-core assets;
Improve financial strength by reducing debt; and
Return cash to shareholders.
During the first ninesix months of 2018, we made significant progress toward achieving our 2020 Vision. Specifically, we had several key achievements:
Executed on portfolio simplification with the recent monetization of EnLink and the General Partner and the closing of the Johnson County divestiture (our asset sales have now reached approximately $4.2 billion).
Reduced long-term debt by approximately $800 million using cash on hand.
Increased our quarterly common stock dividend 33% to $0.08 per share beginning in the second quarter of 2018.
29
• | Completed a workforce reduction and continue other cost reduction initiatives expected to generate $110 million of annualized savings. |
Authorized and began executing a $4.0 billion share repurchase program.
Increased STACK and Delaware Basin production 30% in the first half of 2018 compared to the first half of 2017.
We exited the thirdsecond quarter of 20172018 with liquidity comprised of $2.8$1.5 billion of cash and $2.9 billion of available credit under our Senior Credit Facility. We have no significant debt maturities until 2021. At September 30, 2017, we also hadWe currently have approximately 65%50% of our remaining 2017 forecastedexpected oil and gas production hedged at an average floor priceprotected for the remainder of $50/Bbl2018. These contracts consist of collars and approximately 66% of our remaining 2017 forecastedswaps based off the WTI oil benchmark and the Henry Hub natural gas production hedged atindex. Additionally, we have entered into regional basis swaps in an average flooreffort to protect price of $3.10/MMBtu.realizations across our portfolio in the U.S. and Canada, including Western Canadian Select and Midland Sweet basis oil hedges. We are building our 20182019 and 20192020 hedge positions at similarmarket prices.
We expectResults of Operations – Q2 2018 vs. Q1 2018
The following graphs, discussion and analysis are intended to provide an understanding of our results of operations and current financial condition. Due to the nature of our business, including an inherently volatile commodity price environment, we have provided a sequential quarter analysis in order to facilitate the review of our operational results and provide further enhancetransparency of our financial strength with our announced $1 billion asset divestiture program.business. Specifically, the graph below shows the change in net earnings from the three months ended March 31, 2018 to the three months ended June 30, 2018. The planned divestitures include select portionsmaterial changes are further discussed by category on the following pages. To facilitate the review, these numbers are being presented before consideration of earnings attributable to noncontrolling interests.

The graph below presents the drivers of the Barnett Shale focused primarily inupstream operations change presented above, with additional details and around Johnson County and other properties located principally within Devon’s U.S. resource base. Through September 30, 2017, we have closed non-core divestitures totaling approximately $400 million under this program.discussion of the drivers following the graph.
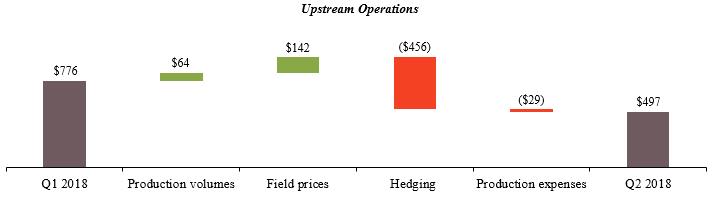
2930
We recently unveiled our “2020 Vision,” which is a strategic plan through the end of the decade intended to deliver top-tier returns on invested capital, while delivering sustainable, long-term growth for our business. We plan to attain leading returns with our 2020 Vision by pursing the following objectives:
|
|
|
|
|
|
|
|
|
|
Production Volumes
30
|
| Q2 2018 |
|
| % of Total |
|
| Q1 2018 |
|
| Change |
| ||||
Oil and bitumen (MBbls/d) |
|
|
|
|
|
|
|
|
|
|
|
|
|
|
|
|
STACK |
|
| 35 |
|
|
| 14 | % |
|
| 35 |
|
|
| - 1 | % |
Delaware Basin |
|
| 46 |
|
|
| 19 | % |
|
| 36 |
|
|
| +29 | % |
Rockies Oil |
|
| 16 |
|
|
| 7 | % |
|
| 18 |
|
|
| - 10 | % |
Heavy Oil |
|
| 17 |
|
|
| 7 | % |
|
| 18 |
|
|
| - 5 | % |
Eagle Ford |
|
| 28 |
|
|
| 11 | % |
|
| 23 |
|
|
| +25 | % |
Barnett Shale |
|
| 1 |
|
|
| 0 | % |
|
| 1 |
|
|
| - 10 | % |
Other |
|
| 10 |
|
|
| 4 | % |
|
| 9 |
|
|
| +14 | % |
Retained assets |
|
| 153 |
|
|
| 62 | % |
|
| 140 |
|
|
| +9 | % |
Divested assets |
|
| — |
|
|
| 0 | % |
|
| — |
|
| N/M |
| |
Total Oil |
|
| 153 |
|
|
| 62 | % |
|
| 140 |
|
|
| +9 | % |
Bitumen |
|
| 92 |
|
|
| 38 | % |
|
| 111 |
|
|
| - 17 | % |
Total Oil and bitumen |
|
| 245 |
|
|
|
|
|
|
| 251 |
|
|
| - 3 | % |
|
| Q2 2018 |
|
| % of Total |
|
| Q1 2018 |
|
| Change |
| ||||
Gas (MMcf/d) |
|
|
|
|
|
|
|
|
|
|
|
|
|
|
|
|
STACK |
|
| 352 |
|
|
| 31 | % |
|
| 344 |
|
|
| +3 | % |
Delaware Basin |
|
| 100 |
|
|
| 9 | % |
|
| 97 |
|
|
| +3 | % |
Rockies Oil |
|
| 18 |
|
|
| 1 | % |
|
| 18 |
|
|
| - 2 | % |
Heavy Oil |
|
| 12 |
|
|
| 1 | % |
|
| 12 |
|
|
| - 4 | % |
Eagle Ford |
|
| 74 |
|
|
| 7 | % |
|
| 63 |
|
|
| +17 | % |
Barnett Shale |
|
| 460 |
|
|
| 41 | % |
|
| 470 |
|
|
| - 2 | % |
Other |
|
| 9 |
|
|
| 1 | % |
|
| 10 |
|
|
| - 7 | % |
Retained assets |
|
| 1,025 |
|
|
| 91 | % |
|
| 1,014 |
|
|
| +1 | % |
Divested assets |
|
| 103 |
|
|
| 9 | % |
|
| 163 |
|
|
| - 37 | % |
Total |
|
| 1,128 |
|
|
|
|
|
|
| 1,177 |
|
|
| - 4 | % |
|
| Q2 2018 |
|
| % of Total |
|
| Q1 2018 |
|
| Change |
| ||||
NGLs (MBbls/d) |
|
|
|
|
|
|
|
|
|
|
|
|
|
|
|
|
STACK |
|
| 38 |
|
|
| 35 | % |
|
| 37 |
|
|
| +5 | % |
Delaware Basin |
|
| 16 |
|
|
| 14 | % |
|
| 11 |
|
|
| +37 | % |
Rockies Oil |
|
| 2 |
|
|
| 2 | % |
|
| 2 |
|
|
| +45 | % |
Eagle Ford |
|
| 13 |
|
|
| 12 | % |
|
| 8 |
|
|
| +67 | % |
Barnett Shale |
|
| 34 |
|
|
| 31 | % |
|
| 31 |
|
|
| +10 | % |
Other |
|
| 2 |
|
|
| 2 | % |
|
| 2 |
|
|
| +5 | % |
Retained assets |
|
| 105 |
|
|
| 96 | % |
|
| 91 |
|
|
| +15 | % |
Divested assets |
|
| 4 |
|
|
| 4 | % |
|
| 6 |
|
|
| - 32 | % |
Total |
|
| 109 |
|
|
|
|
|
|
| 97 |
|
|
| +12 | % |
|
| Q2 2018 |
|
| % of Total |
|
| Q1 2018 |
|
| Change |
| ||||
Combined (MBoe/d) |
|
|
|
|
|
|
|
|
|
|
|
|
|
|
|
|
STACK |
|
| 132 |
|
|
| 25 | % |
|
| 129 |
|
|
| +2 | % |
Delaware Basin |
|
| 79 |
|
|
| 15 | % |
|
| 64 |
|
|
| +24 | % |
Rockies Oil |
|
| 21 |
|
|
| 4 | % |
|
| 23 |
|
|
| - 9 | % |
Heavy Oil |
|
| 111 |
|
|
| 20 | % |
|
| 131 |
|
|
| - 16 | % |
Eagle Ford |
|
| 54 |
|
|
| 10 | % |
|
| 41 |
|
|
| +31 | % |
Barnett Shale |
|
| 111 |
|
|
| 20 | % |
|
| 110 |
|
|
| +0 | % |
Other |
|
| 12 |
|
|
| 2 | % |
|
| 13 |
|
|
| - 5 | % |
Retained assets |
|
| 520 |
|
|
| 96 | % |
|
| 511 |
|
|
| +2 | % |
Divested assets |
|
| 21 |
|
|
| 4 | % |
|
| 33 |
|
|
| - 35 | % |
Total |
|
| 541 |
|
|
|
|
|
|
| 544 |
|
|
| - 1 | % |
Strong performance in the Delaware Basin and Eagle Ford drove retained asset production growth during the second quarter of Operations2018. These production gains were offset by lower production volumes from our heavy oil operations due to a scheduled turnaround at Jackfish 1 as well as by lower production resulting from our Johnson County divestiture.
Oil, Gas and NGL ProductionField Prices
|
| Three Months Ended September 30, |
|
| Nine Months Ended September 30, |
| ||||||||||||||||||
|
| 2017 |
|
| 2016 |
|
| Change |
|
| 2017 |
|
| 2016 |
|
| Change |
| ||||||
Oil (MBbls/d) |
|
|
|
|
|
|
|
|
|
|
|
|
|
|
|
|
|
|
|
|
|
|
|
|
Barnett Shale |
|
| 1 |
|
|
| 1 |
|
|
| - 13 | % |
|
| 1 |
|
|
| 1 |
|
|
| - 22 | % |
Delaware Basin |
|
| 31 |
|
|
| 31 |
|
|
| +0 | % |
|
| 31 |
|
|
| 35 |
|
|
| - 12 | % |
Eagle Ford |
|
| 30 |
|
|
| 33 |
|
|
| - 10 | % |
|
| 38 |
|
|
| 44 |
|
|
| - 15 | % |
Heavy Oil |
|
| 18 |
|
|
| 22 |
|
|
| - 15 | % |
|
| 18 |
|
|
| 23 |
|
|
| - 22 | % |
Rockies Oil |
|
| 12 |
|
|
| 11 |
|
|
| +9 | % |
|
| 13 |
|
|
| 14 |
|
|
| - 9 | % |
STACK |
|
| 27 |
|
|
| 21 |
|
|
| +31 | % |
|
| 24 |
|
|
| 18 |
|
|
| +34 | % |
Other |
|
| 11 |
|
|
| 11 |
|
|
| + 4 | % |
|
| 10 |
|
|
| 12 |
|
|
| - 17 | % |
Retained assets |
|
| 130 |
|
|
| 130 |
|
|
| +0 | % |
|
| 135 |
|
|
| 147 |
|
|
| - 8 | % |
Divested assets |
|
| — |
|
|
| 6 |
|
|
| N/M |
|
|
| — |
|
|
| 13 |
|
|
| N/M |
|
Total |
|
| 130 |
|
|
| 136 |
|
|
| - 5 | % |
|
| 135 |
|
|
| 160 |
|
|
| - 16 | % |
Bitumen (MBbls/d) |
|
|
|
|
|
|
|
|
|
|
|
|
|
|
|
|
|
|
|
|
|
|
|
|
Heavy Oil |
|
| 103 |
|
|
| 115 |
|
|
| - 11 | % |
|
| 109 |
|
|
| 105 |
|
|
| +4 | % |
Gas (MMcf/d) |
|
|
|
|
|
|
|
|
|
|
|
|
|
|
|
|
|
|
|
|
|
|
|
|
Barnett Shale |
|
| 672 |
|
|
| 730 |
|
|
| - 8 | % |
|
| 677 |
|
|
| 752 |
|
|
| - 10 | % |
Delaware Basin |
|
| 90 |
|
|
| 92 |
|
|
| - 3 | % |
|
| 91 |
|
|
| 92 |
|
|
| - 0 | % |
Eagle Ford |
|
| 88 |
|
|
| 85 |
|
|
| +4 | % |
|
| 101 |
|
|
| 111 |
|
|
| - 9 | % |
Heavy Oil |
|
| 16 |
|
|
| 18 |
|
|
| - 11 | % |
|
| 17 |
|
|
| 20 |
|
|
| - 14 | % |
Rockies Oil |
|
| 11 |
|
|
| 19 |
|
|
| - 39 | % |
|
| 14 |
|
|
| 27 |
|
|
| - 47 | % |
STACK |
|
| 313 |
|
|
| 292 |
|
|
| +7 | % |
|
| 300 |
|
|
| 296 |
|
|
| +1 | % |
Other |
|
| 11 |
|
|
| 13 |
|
|
| - 16 | % |
|
| 12 |
|
|
| 14 |
|
|
| - 16 | % |
Retained assets |
|
| 1,201 |
|
|
| 1,249 |
|
|
| - 4 | % |
|
| 1,212 |
|
|
| 1,312 |
|
|
| - 8 | % |
Divested assets |
|
| — |
|
|
| 75 |
|
|
| N/M |
|
|
| — |
|
|
| 165 |
|
|
| N/M |
|
Total |
|
| 1,201 |
|
|
| 1,324 |
|
|
| - 9 | % |
|
| 1,212 |
|
|
| 1,477 |
|
|
| - 18 | % |
NGLs (MBbls/d) |
|
|
|
|
|
|
|
|
|
|
|
|
|
|
|
|
|
|
|
|
|
|
|
|
Barnett Shale |
|
| 36 |
|
|
| 44 |
|
|
| - 18 | % |
|
| 40 |
|
|
| 45 |
|
|
| - 10 | % |
Delaware Basin |
|
| 11 |
|
|
| 12 |
|
|
| - 14 | % |
|
| 10 |
|
|
| 12 |
|
|
| - 19 | % |
Eagle Ford |
|
| 12 |
|
|
| 13 |
|
|
| - 8 | % |
|
| 13 |
|
|
| 18 |
|
|
| - 29 | % |
Rockies Oil |
|
| 1 |
|
|
| 1 |
|
|
| +9 | % |
|
| 1 |
|
|
| 1 |
|
|
| - 2 | % |
STACK |
|
| 32 |
|
|
| 23 |
|
|
| +37 | % |
|
| 30 |
|
|
| 28 |
|
|
| +7 | % |
Other |
|
| 2 |
|
|
| 3 |
|
|
| - 10 | % |
|
| 2 |
|
|
| 3 |
|
|
| - 13 | % |
Retained assets |
|
| 94 |
|
|
| 96 |
|
|
| - 2 | % |
|
| 96 |
|
|
| 107 |
|
|
| - 10 | % |
Divested assets |
|
| — |
|
|
| 8 |
|
|
| N/M |
|
|
| — |
|
|
| 17 |
|
|
| N/M |
|
Total |
|
| 94 |
|
|
| 104 |
|
|
| - 10 | % |
|
| 96 |
|
|
| 124 |
|
|
| - 22 | % |
Combined (MBoe/d) |
|
|
|
|
|
|
|
|
|
|
|
|
|
|
|
|
|
|
|
|
|
|
|
|
Barnett Shale |
|
| 148 |
|
|
| 166 |
|
|
| - 11 | % |
|
| 154 |
|
|
| 171 |
|
|
| - 10 | % |
Delaware Basin |
|
| 57 |
|
|
| 59 |
|
|
| - 3 | % |
|
| 56 |
|
|
| 62 |
|
|
| - 11 | % |
Eagle Ford |
|
| 57 |
|
|
| 61 |
|
|
| - 7 | % |
|
| 67 |
|
|
| 81 |
|
|
| - 17 | % |
Heavy Oil |
|
| 124 |
|
|
| 140 |
|
|
| - 11 | % |
|
| 130 |
|
|
| 132 |
|
|
| - 1 | % |
Rockies Oil |
|
| 16 |
|
|
| 16 |
|
|
| +0 | % |
|
| 17 |
|
|
| 20 |
|
|
| - 17 | % |
STACK |
|
| 111 |
|
|
| 92 |
|
|
| +20 | % |
|
| 104 |
|
|
| 95 |
|
|
| +9 | % |
Other |
|
| 14 |
|
|
| 16 |
|
|
| - 8 | % |
|
| 14 |
|
|
| 17 |
|
|
| - 17 | % |
Retained assets |
|
| 527 |
|
|
| 550 |
|
|
| - 4 | % |
|
| 542 |
|
|
| 578 |
|
|
| - 6 | % |
Divested assets |
|
| — |
|
|
| 27 |
|
|
| N/M |
|
|
| — |
|
|
| 57 |
|
|
| N/M |
|
Total |
|
| 527 |
|
|
| 577 |
|
|
| - 9 | % |
|
| 542 |
|
|
| 635 |
|
|
| - 15 | % |
|
| Q2 2018 |
|
| Realization |
|
| Q1 2018 |
|
| Change |
| ||||
Oil and bitumen (per Bbl) |
|
|
|
|
|
|
|
|
|
|
|
|
|
|
|
|
WTI index |
| $ | 67.83 |
|
|
|
|
|
| $ | 62.93 |
|
|
| +8 | % |
Access Western Blend index |
| $ | 45.56 |
|
|
|
|
|
| $ | 35.44 |
|
|
| +29 | % |
U.S. |
| $ | 65.41 |
|
|
| 96% |
|
| $ | 61.79 |
|
|
| +6 | % |
Canada |
| $ | 31.70 |
|
|
| 47% |
|
| $ | 19.74 |
|
|
| +61 | % |
Realized price, unhedged |
| $ | 50.43 |
|
|
| 74% |
|
| $ | 40.15 |
|
|
| +26 | % |
Cash settlements |
| $ | (5.80 | ) |
|
|
|
|
| $ | (0.10 | ) |
|
|
|
|
Realized price, with hedges |
| $ | 44.63 |
|
|
| 66% |
|
| $ | 40.05 |
|
|
| +11 | % |
|
| Q2 2018 |
|
| Realization |
|
| Q1 2018 |
|
| Change |
| ||||
Gas (per Mcf) |
|
|
|
|
|
|
|
|
|
|
|
|
|
|
|
|
Henry Hub index |
| $ | 2.80 |
|
|
|
|
|
| $ | 3.01 |
|
|
| - 7 | % |
Realized price, unhedged |
| $ | 2.01 |
|
|
| 72% |
|
| $ | 2.41 |
|
|
| - 17 | % |
Cash settlements |
| $ | 0.13 |
|
|
|
|
|
| $ | 0.17 |
|
|
|
|
|
Realized price, with hedges |
| $ | 2.14 |
|
|
| 77% |
|
| $ | 2.58 |
|
|
| - 17 | % |
|
| Q2 2018 |
|
| Realization |
|
| Q1 2018 |
|
| Change |
| ||||
NGLs (per Bbl) |
|
|
|
|
|
|
|
|
|
|
|
|
|
|
|
|
Mont Belvieu blended index (1) |
| $ | 28.05 |
|
|
|
|
|
| $ | 25.88 |
|
|
| +8 | % |
Realized price, unhedged |
| $ | 24.10 |
|
|
| 86% |
|
| $ | 22.56 |
|
|
| +7 | % |
Cash settlements |
| $ | (1.66 | ) |
|
|
|
|
| $ | (0.53 | ) |
|
|
|
|
Realized price, with hedges |
| $ | 22.44 |
|
|
| 80% |
|
| $ | 22.03 |
|
|
| +2 | % |
(1) | Based upon composition of our NGL barrel. |
31
|
| Three Months Ended September 30, |
|
| Nine Months Ended September 30, |
|
| ||||||||||||||||||
|
| 2017 (1) |
|
| 2016 (1) |
|
| Change |
|
| 2017 (1) |
|
| 2016 (1) |
|
| Change |
|
| ||||||
Oil (per Bbl) |
|
|
|
|
|
|
|
|
|
|
|
|
|
|
|
|
|
|
|
|
|
|
|
|
|
U.S. |
| $ | 47.12 |
|
| $ | 42.51 |
|
|
| +11 | % |
| $ | 47.84 |
|
| $ | 36.89 |
|
|
| +30 | % |
|
Canada |
| $ | 35.02 |
|
| $ | 27.46 |
|
|
| +28 | % |
| $ | 32.77 |
|
| $ | 22.26 |
|
|
| +47 | % |
|
Total |
| $ | 45.41 |
|
| $ | 40.12 |
|
|
| +13 | % |
| $ | 45.83 |
|
| $ | 34.78 |
|
|
| +32 | % |
|
Bitumen (per Bbl) |
|
|
|
|
|
|
|
|
|
|
|
|
|
|
|
|
|
|
|
|
|
|
|
|
|
Canada |
| $ | 31.75 |
|
| $ | 23.00 |
|
|
| +38 | % |
| $ | 28.49 |
|
| $ | 17.77 |
|
|
| +60 | % |
|
Gas (per Mcf) |
|
|
|
|
|
|
|
|
|
|
|
|
|
|
|
|
|
|
|
|
|
|
|
|
|
U.S. |
| $ | 2.45 |
|
| $ | 2.24 |
|
|
| +10 | % |
| $ | 2.54 |
|
| $ | 1.70 |
|
|
| +50 | % |
|
NGLs (per Bbl) |
|
|
|
|
|
|
|
|
|
|
|
|
|
|
|
|
|
|
|
|
|
|
|
|
|
U.S. |
| $ | 15.15 |
|
| $ | 9.80 |
|
|
| +55 | % |
| $ | 14.62 |
|
| $ | 8.84 |
|
|
| +65 | % |
|
Combined (per Boe) |
|
|
|
|
|
|
|
|
|
|
|
|
|
|
|
|
|
|
|
|
|
|
|
|
|
U.S. |
| $ | 23.85 |
|
| $ | 20.26 |
|
|
| +18 | % |
| $ | 24.44 |
|
| $ | 17.16 |
|
|
| +42 | % |
|
Canada |
| $ | 31.59 |
|
| $ | 23.23 |
|
|
| +36 | % |
| $ | 28.50 |
|
| $ | 18.15 |
|
|
| +57 | % |
|
Total |
| $ | 25.67 |
|
| $ | 20.98 |
|
|
| +22 | % |
| $ | 25.41 |
|
| $ | 17.37 |
|
|
| +46 | % |
|
|
|
The volume and price changes in the tables above caused the following changes to our commodity sales between the three and nine months ended September 30, 2017 and 2016.
|
| Three Months Ended September 30, |
| |||||||||||||||||
|
| Oil |
|
| Bitumen |
|
| Gas |
|
| NGLs |
|
| Total |
| |||||
|
| (Millions) |
| |||||||||||||||||
2016 sales |
| $ | 502 |
|
| $ | 244 |
|
| $ | 273 |
|
| $ | 94 |
|
| $ | 1,113 |
|
Change due to volumes |
|
| (23 | ) |
|
| (26 | ) |
|
| (25 | ) |
|
| (9 | ) |
|
| (83 | ) |
Change due to prices |
|
| 63 |
|
|
| 83 |
|
|
| 23 |
|
|
| 46 |
|
|
| 215 |
|
2017 sales |
| $ | 542 |
|
| $ | 301 |
|
| $ | 271 |
|
| $ | 131 |
|
| $ | 1,245 |
|
|
|
|
|
|
|
|
|
|
|
|
|
|
|
|
|
|
|
|
|
|
|
| Nine Months Ended September 30, |
| |||||||||||||||||
|
| Oil |
|
| Bitumen |
|
| Gas |
|
| NGLs |
|
| Total |
| |||||
|
|
|
|
|
|
|
|
|
|
|
|
|
|
|
|
|
|
|
|
|
|
| (Millions) |
| |||||||||||||||||
2016 sales |
| $ | 1,523 |
|
| $ | 512 |
|
| $ | 688 |
|
| $ | 300 |
|
| $ | 3,023 |
|
Change due to volumes |
|
| (243 | ) |
|
| 16 |
|
|
| (125 | ) |
|
| (68 | ) |
|
| (420 | ) |
Change due to prices |
|
| 407 |
|
|
| 319 |
|
|
| 279 |
|
|
| 152 |
|
|
| 1,157 |
|
2017 sales |
| $ | 1,687 |
|
| $ | 847 |
|
| $ | 842 |
|
| $ | 384 |
|
| $ | 3,760 |
|
|
| Q2 2018 |
|
| Q1 2018 |
|
| Change |
| |||
Combined (per Boe) |
|
|
|
|
|
|
|
|
|
|
|
|
U.S. |
| $ | 31.97 |
|
| $ | 30.39 |
|
|
| +5 | % |
Canada |
| $ | 31.17 |
|
| $ | 19.45 |
|
|
| +60 | % |
Realized price, unhedged |
| $ | 31.81 |
|
| $ | 27.75 |
|
|
| +15 | % |
Cash settlements |
| $ | (2.68 | ) |
| $ | 0.23 |
|
|
|
|
|
Realized price, with hedges |
| $ | 29.13 |
|
| $ | 27.98 |
|
|
| +4 | % |
Commodity sales increased in the third quarter and the first nine months of 2017 due to price increases for all commodities. The increase in oil and bitumen sales resulted from a higher average WTI crude oil index price. Additionally, our bitumen sales benefited from tighter heavy oil differentials. The increases inOil, gas and NGL sales wereincreased $206 million primarily as a result of higher WTI and Mont Belvieu index prices as well as a significant increase in the average Canadian realizations due to higher North American regionalindustry plant turnarounds and seasonal lower blending requirements. These increases were slightly offset by lower realized gas prices as a result of lower Henry Hub index prices upon which ouras well as natural gas sales are based and higher NGL prices at the Mont Belvieu, Texas hub. transportation constraints.
The increases in sales due to the favorable movement in commodity prices was partially offset by a decline in production volumes. In 2016, we significantly reduced our drilling and completion capital programs in response to depressed commodity prices. Consequently, production from our retained U.S. assets, other than STACK, steadily declined throughout 2016 and into 2017. Our 2016 asset divestiture program also caused our volumes to decline significantly in the third and fourth quarters of 2016. Additionally, Hurricane Harvey negatively impacted our third quarter 2017 production in the Eagle Ford as we temporarily suspended operations.
32
A summary of our open commodity derivative positions is included in Note 3 to the financial statements included in “Part I. Financial Information – Item 1. Financial Statements” of this report. The following tables provide financial information associated with our oil, gas and NGL hedges. The first table presents the cash settlements and fair value gains and losses recognized as components of our revenues. The subsequent tables present our oil, gas and NGL prices with, and without, the effects of the cash settlements. The prices do not include the effects of fair value gains and losses.Hedging
|
|
|
|
|
|
|
|
|
|
|
|
|
|
|
|
|
|
| Three Months Ended September 30, |
|
| Nine Months Ended September 30, |
| ||||||||||
|
| 2017 |
|
| 2016 |
|
| 2017 |
|
| 2016 |
| ||||
|
| (Millions) |
| |||||||||||||
Cash settlements: |
|
|
|
|
|
|
|
|
|
|
|
|
|
|
|
|
Oil derivatives |
| $ | 11 |
|
| $ | 20 |
|
| $ | 29 |
|
| $ | (41 | ) |
Gas derivatives |
|
| 13 |
|
|
| (4 | ) |
|
| 14 |
|
|
| 47 |
|
NGL derivatives |
|
| — |
|
|
| — |
|
|
| — |
|
|
| (2 | ) |
Total cash settlements |
|
| 24 |
|
|
| 16 |
|
|
| 43 |
|
|
| 4 |
|
Gains (losses) on fair value changes: |
|
|
|
|
|
|
|
|
|
|
|
|
|
|
|
|
Oil derivatives |
|
| (157 | ) |
|
| 23 |
|
|
| 72 |
|
|
| (7 | ) |
Gas derivatives |
|
| (7 | ) |
|
| 35 |
|
|
| 101 |
|
|
| (26 | ) |
NGL derivatives |
|
| (4 | ) |
|
| 5 |
|
|
| (2 | ) |
|
| (1 | ) |
Total gains (losses) on fair value changes |
|
| (168 | ) |
|
| 63 |
|
|
| 171 |
|
|
| (34 | ) |
Oil, gas and NGL derivatives |
| $ | (144 | ) |
| $ | 79 |
|
| $ | 214 |
|
| $ | (30 | ) |
|
| Three Months Ended September 30, 2017 |
|
| |||||||||||||||||
|
| Oil |
|
| Bitumen |
|
| Gas |
|
| NGLs |
|
| Boe |
|
| |||||
|
| (Per Bbl) |
|
| (Per Bbl) |
|
| (Per Mcf) |
|
| (Per Bbl) |
|
| (Per Boe) |
|
| |||||
Realized price without hedges |
| $ | 45.41 |
|
| $ | 31.75 |
|
| $ | 2.45 |
|
| $ | 15.15 |
|
| $ | 25.67 |
|
|
Cash settlements of hedges |
|
| 0.96 |
|
|
| — |
|
|
| 0.12 |
|
|
| (0.03 | ) |
|
| 0.52 |
|
|
Realized price, including cash settlements |
| $ | 46.37 |
|
| $ | 31.75 |
|
| $ | 2.57 |
|
| $ | 15.12 |
|
| $ | 26.19 |
|
|
|
|
|
|
|
| �� |
|
|
|
|
|
|
|
|
|
|
|
|
|
|
|
|
| Three Months Ended September 30, 2016 |
|
| |||||||||||||||||
|
| Oil |
|
| Bitumen |
|
| Gas |
|
| NGLs |
|
| Boe |
|
| |||||
|
| (Per Bbl) |
|
| (Per Bbl) |
|
| (Per Mcf) |
|
| (Per Bbl) |
|
| (Per Boe) |
|
| |||||
Realized price without hedges |
| $ | 40.12 |
|
| $ | 23.00 |
|
| $ | 2.24 |
|
| $ | 9.80 |
|
| $ | 20.98 |
|
|
Cash settlements of hedges |
|
| 1.56 |
|
|
| — |
|
|
| (0.04 | ) |
|
| 0.10 |
|
|
| 0.32 |
|
|
Realized price, including cash settlements |
| $ | 41.68 |
|
| $ | 23.00 |
|
| $ | 2.20 |
|
| $ | 9.90 |
|
| $ | 21.30 |
|
|
|
|
|
|
|
|
|
|
|
|
|
|
|
|
|
|
|
|
|
|
|
|
|
| Nine Months Ended September 30, 2017 |
|
| |||||||||||||||||
|
| Oil |
|
| Bitumen |
|
| Gas |
|
| NGLs |
|
| Boe |
|
| |||||
|
| (Per Bbl) |
|
| (Per Bbl) |
|
| (Per Mcf) |
|
| (Per Bbl) |
|
| (Per Boe) |
|
| |||||
Realized price without hedges |
| $ | 45.83 |
|
| $ | 28.49 |
|
| $ | 2.54 |
|
| $ | 14.62 |
|
| $ | 25.41 |
|
|
Cash settlements of hedges |
|
| 0.80 |
|
|
| — |
|
|
| 0.05 |
|
|
| (0.02 | ) |
|
| 0.29 |
|
|
Realized price, including cash settlements |
| $ | 46.63 |
|
| $ | 28.49 |
|
| $ | 2.59 |
|
| $ | 14.60 |
|
| $ | 25.70 |
|
|
|
|
|
|
|
|
|
|
|
|
|
|
|
|
|
|
|
|
|
|
|
|
|
| Nine Months Ended September 30, 2016 |
|
| |||||||||||||||||
|
| Oil |
|
| Bitumen |
|
| Gas |
|
| NGLs |
|
| Boe |
|
| |||||
|
| (Per Bbl) |
|
| (Per Bbl) |
|
| (Per Mcf) |
|
| (Per Bbl) |
|
| (Per Boe) |
|
| |||||
Realized price without hedges |
| $ | 34.78 |
|
| $ | 17.77 |
|
| $ | 1.70 |
|
| $ | 8.84 |
|
| $ | 17.37 |
|
|
Cash settlements of hedges |
|
| (0.94 | ) |
|
| — |
|
|
| 0.12 |
|
|
| (0.06 | ) |
|
| 0.02 |
|
|
Realized price, including cash settlements |
| $ | 33.84 |
|
| $ | 17.77 |
|
| $ | 1.82 |
|
| $ | 8.78 |
|
| $ | 17.39 |
|
|
|
| Q2 2018 |
|
| Q1 2018 |
|
| Change |
| |||
|
| Q |
|
|
|
|
|
|
|
|
| |
Oil |
| $ | (129 | ) |
| $ | (2 | ) |
|
| N/M |
|
Natural gas |
|
| 14 |
|
|
| 18 |
|
|
| - 22 | % |
NGL |
|
| (16 | ) |
|
| (5 | ) |
|
| N/M |
|
Total cash settlements |
|
| (131 | ) |
|
| 11 |
|
|
| N/M |
|
Valuation changes |
|
| (366 | ) |
|
| (52 | ) |
|
| N/M |
|
Total |
| $ | (497 | ) |
| $ | (41 | ) |
|
| N/M |
|
33
Cash settlements as presented in the tables above represent realized gains or losses related to various commodity derivatives. the instruments described in Note 4 in “Part I. Financial Information – Item 1. Financial Statements” in this report.
In addition to cash settlements, we also recognize fair value changes on our oil, gas and NGL derivative instruments in each reporting period. The changes in fair value resulted from new positions and settlements that occurred during each period, as well as the relationshipsrelationship between contract prices and the associated forward curves. Including the cash settlements discussed above, our oil, gas and NGL derivatives incurred a net loss in the third quarter of 2017 and generated a net gain in the third quarter of 2016. Including the cash settlements discussed above, our oil, gas and NGL derivatives generated a net gain during the first nine months of 2017 and incurred a net loss during the first nine months of 2016.
Marketing and Midstream Revenues and Operating Expenses
Production Expenses
|
| Three Months Ended September 30, |
|
| Nine Months Ended September 30, |
| ||||||||||||||||||
|
| 2017 |
|
| 2016 |
|
| Change |
|
| 2017 |
|
| 2016 |
|
| Change |
| ||||||
|
| (Millions) |
| |||||||||||||||||||||
Operating revenues |
| $ | 2,055 |
|
| $ | 1,690 |
|
|
| +22 | % |
| $ | 5,992 |
|
| $ | 4,503 |
|
|
| +33 | % |
Product purchases |
|
| (1,721 | ) |
|
| (1,391 | ) |
|
| +24 | % |
|
| (5,043 | ) |
|
| (3,618 | ) |
|
| +39 | % |
Operations and maintenance expenses |
|
| (92 | ) |
|
| (89 | ) |
|
| +3 | % |
|
| (276 | ) |
|
| (266 | ) |
|
| +4 | % |
Operating profit |
| $ | 242 |
|
| $ | 210 |
|
|
| +15 | % |
| $ | 673 |
|
| $ | 619 |
|
|
| +9 | % |
|
|
|
|
|
|
|
|
|
|
|
|
|
|
|
|
|
|
|
|
|
|
|
|
|
Devon loss |
| $ | (11 | ) |
| $ | (18 | ) |
|
| +39 | % |
| $ | (47 | ) |
| $ | (37 | ) |
|
| -27 | % |
EnLink profit |
|
| 253 |
|
|
| 228 |
|
|
| +11 | % |
|
| 720 |
|
|
| 656 |
|
|
| +10 | % |
Total profit |
| $ | 242 |
|
| $ | 210 |
|
|
| +15 | % |
| $ | 673 |
|
| $ | 619 |
|
|
| +9 | % |
|
| Q2 2018 |
|
| Q1 2018 |
|
| Change |
| |||
LOE |
| $ | 269 |
|
| $ | 241 |
|
|
| +12 | % |
Gathering, processing & transportation |
|
| 224 |
|
|
| 228 |
|
|
| - 2 | % |
Production taxes |
|
| 67 |
|
|
| 59 |
|
|
| +14 | % |
Property taxes |
|
| 12 |
|
|
| 15 |
|
|
| - 20 | % |
Total |
| $ | 572 |
|
| $ | 543 |
|
|
| +5 | % |
Per Boe: |
|
|
|
|
|
|
|
|
|
|
|
|
LOE |
| $ | 5.45 |
|
| $ | 4.91 |
|
|
| +11 | % |
Gathering, processing & transportation |
| $ | 4.55 |
|
| $ | 4.65 |
|
|
| - 2 | % |
Percent of oil, gas and NGL sales: |
|
|
|
|
|
|
|
|
|
|
|
|
Production taxes |
|
| 4.2% |
|
|
| 4.4% |
|
|
| - 3 | % |
The overall increase in marketing and midstream operating margin during the third quarter and the first nine months of 2017 wasProduction expenses increased $29 million primarily due to an increase in EnLink’s throughput volumes related to gas processing and transmission activities, offset by a decline in margins on Devon’s downstream marketing commitments. Devon is actively engaged in optimization activities to improve margins to help offset the costs of downstream commitments; however, we expect those commitments to negatively impactscheduled turnaround expenses incurred at our margins throughout 2017.
Asset Dispositions and Other
In conjunction with the non-core upstream asset divestitures, we recognized a gain during the third quarter of 2016. For further discussion, see Note 2 in “Part I. Financial Information – Item 1. Financial Statements” of this report.
Lease Operating Expenses
|
| Three Months Ended September 30, |
|
| Nine Months Ended September 30, |
| ||||||||||||||||||
|
| 2017 |
|
| 2016 |
|
| Change |
|
| 2017 |
|
| 2016 |
|
| Change |
| ||||||
|
| (Millions, except per Boe amounts) |
| |||||||||||||||||||||
LOE: |
|
|
| |||||||||||||||||||||
U.S. |
| $ | 256 |
|
| $ | 248 |
|
|
| +3 | % |
| $ | 761 |
|
| $ | 886 |
|
|
| - 14 | % |
Canada |
|
| 135 |
|
|
| 107 |
|
|
| +26 | % |
|
| 415 |
|
|
| 329 |
|
|
| +26 | % |
Total |
| $ | 391 |
|
| $ | 355 |
|
|
| +10 | % |
| $ | 1,176 |
|
| $ | 1,215 |
|
|
| - 3 | % |
LOE per Boe: |
|
|
|
|
|
|
|
|
|
|
|
|
|
|
|
|
|
|
|
|
|
|
|
|
U.S. |
| $ | 6.89 |
|
| $ | 6.17 |
|
|
| +12 | % |
| $ | 6.76 |
|
| $ | 6.42 |
|
|
| +5 | % |
Canada |
| $ | 11.81 |
|
| $ | 8.31 |
|
|
| +42 | % |
| $ | 11.70 |
|
| $ | 9.13 |
|
|
| +28 | % |
Total |
| $ | 8.05 |
|
| $ | 6.69 |
|
|
| +20 | % |
| $ | 7.95 |
|
| $ | 6.98 |
|
|
| +14 | % |
Total LOE and LOE per Boe increased during the third quarter of 2017 primarily due to higher transportation of $38 million resulting from tolls on Canada’s Access Pipeline of $27 million, which commenced in the fourth quarter of 2016 subsequent to the sale of our interest in the pipeline, and continued development of the STACK.
Total LOE decreased during the first nine months of 2017 primarily due to our non-core U.S. property divestitures during 2016 and continued well optimization and cost reduction initiatives across our portfolio which have offset industry inflation. These initiatives have been primarily focused on reducing costs associated with water disposal, power and fuel, compression and workovers. These cost savings and non-core divestitures impact were partially offset by Access Pipeline transportation tolls of $87 million during the first nine months of 2017, which was the primary driver of the increase in total LOE per Boe.
34
General and Administrative Expenses
|
| Three Months Ended September 30, |
|
| Nine Months Ended September 30, |
| ||||||||||||||||||
|
| 2017 |
|
| 2016 |
|
| Change |
|
| 2017 |
|
| 2016 |
|
| Change |
| ||||||
|
| (Millions) |
| |||||||||||||||||||||
Gross G&A |
| $ | 196 |
|
| $ | 184 |
|
|
| +7 | % |
| $ | 623 |
|
| $ | 642 |
|
|
| - 3 | % |
Capitalized G&A |
|
| (55 | ) |
|
| (54 | ) |
|
| +3 | % |
|
| (170 | ) |
|
| (183 | ) |
|
| - 7 | % |
Reimbursed G&A |
|
| (19 | ) |
|
| (19 | ) |
|
| +1 | % |
|
| (53 | ) |
|
| (66 | ) |
|
| - 20 | % |
Devon Net G&A |
|
| 122 |
|
|
| 111 |
|
|
| +10 | % |
|
| 400 |
|
|
| 393 |
|
|
| +2 | % |
EnLink Net G&A |
|
| 31 |
|
|
| 30 |
|
|
| +2 | % |
|
| 98 |
|
|
| 89 |
|
|
| +10 | % |
Net G&A |
| $ | 153 |
|
| $ | 141 |
|
|
| +8 | % |
| $ | 498 |
|
| $ | 482 |
|
|
| +3 | % |
Gross G&A increased during the third quarter of 2017 due to an increase in costs related to automation and process improvement initiatives and decreased the first nine months of 2017 largely due to lower Devon employee costs resulting from our 2016 workforce reduction and other cost reduction initiatives. During the first nine months of 2017, reimbursed G&A decreased primarily due to the divestitures of operated properties in 2016. EnLink net G&A increased during the third quarter and for the first nine months of 2017 primarily due to higher employee compensation costs.
Production and Property Taxes
|
| Three Months Ended September 30, |
|
| Nine Months Ended September 30, |
| ||||||||||||||||||
|
| 2017 |
|
| 2016 |
|
| Change |
|
| 2017 |
|
| 2016 |
|
| Change |
| ||||||
|
| (Millions) |
| |||||||||||||||||||||
Production taxes |
| $ | 40 |
|
| $ | 39 |
|
|
| +3 | % |
| $ | 131 |
|
| $ | 110 |
|
|
| +19 | % |
Property and other taxes |
|
| 20 |
|
|
| 19 |
|
|
| +2 | % |
|
| 62 |
|
|
| 79 |
|
|
| - 21 | % |
Devon production and property taxes |
|
| 60 |
|
|
| 58 |
|
|
| +4 | % |
|
| 193 |
|
|
| 189 |
|
|
| +2 | % |
EnLink property taxes |
|
| 11 |
|
|
| 9 |
|
|
| +24 | % |
|
| 34 |
|
|
| 31 |
|
|
| +7 | % |
Production and property taxes |
| $ | 71 |
|
| $ | 67 |
|
|
| +5 | % |
| $ | 227 |
|
| $ | 220 |
|
|
| +3 | % |
Percentage of oil, gas and NGL sales: |
|
|
|
|
|
|
|
|
|
|
|
|
|
|
|
|
|
|
|
|
|
|
|
|
Production taxes |
|
| 3.2 | % |
|
| 3.5 | % |
|
| - 8 | % |
|
| 3.5 | % |
|
| 3.6 | % |
|
| - 4 | % |
Property and other taxes |
|
| 2.5 | % |
|
| 2.6 | % |
|
| - 3 | % |
|
| 2.6 | % |
|
| 3.7 | % |
|
| - 30 | % |
Total |
|
| 5.7 | % |
|
| 6.1 | % |
|
| - 6 | % |
|
| 6.1 | % |
|
| 7.3 | % |
|
| - 17 | % |
Jackfish 1 facility. Production taxes also increased during each period in 2017 on an absolute dollar basis primarily due to anthe increase in our U.S. upstream revenues, on which the majority of our production taxes are assessed.
Exploration Expenses |
|
| Q2 2018 |
|
| Q1 2018 |
|
| Change |
| |||
Unproved impairments |
| $ | 53 |
|
| $ | 8 |
|
|
| +563 | % |
Geological and geophysical |
|
| 6 |
|
|
| 10 |
|
|
| - 40 | % |
Exploration overhead and other |
|
| 9 |
|
|
| 15 |
|
|
| - 40 | % |
Total |
| $ | 68 |
|
| $ | 33 |
|
|
| +106 | % |
Unproved impairments primarily relate to certain non-core acreage in the U.S. that we no longer intend to pursue for exploration opportunities.
Depreciation, Depletion and Amortization |
|
| Q2 2018 |
|
| Q1 2018 |
|
| Change |
| |||
Oil and gas per Boe |
| $ | 8.00 |
|
| $ | 7.63 |
|
|
| +5 | % |
Oil and gas |
| $ | 395 |
|
| $ | 374 |
|
|
| +6 | % |
Other assets |
|
| 25 |
|
|
| 25 |
|
|
| - 1 | % |
Total |
| $ | 420 |
|
| $ | 399 |
|
|
| +5 | % |
Our oil and gas DD&A increased during the second quarter primarily due to the change in production mix from our asset portfolio.
Financing Costs, net |
During the first nine monthsquarter of 2017, property and other taxes decreased primarily as2018, we incurred a result$312 million loss on early retirement of debt. Additionally, interest expense was lower property value assessments from the local taxing authorities across our key operating areas and as a result of our non-core oil and gas property divestitures during 2016. Property taxes do not always change in direct correlation with the change in oil, gas and NGL sales and are generally determined based on the valuation of the underlying assets.
Depreciation, Depletion and Amortization
|
| Three Months Ended September 30, |
|
| Nine Months Ended September 30, |
| ||||||||||||||||||
|
| 2017 |
|
| 2016 |
|
| Change |
|
| 2017 |
|
| 2016 |
|
| Change |
| ||||||
|
| (Millions, except per Boe amounts) |
| |||||||||||||||||||||
DD&A: |
|
|
|
|
|
|
|
|
|
|
|
|
|
|
|
|
|
|
|
|
|
|
|
|
Oil and gas properties |
| $ | 232 |
|
| $ | 239 |
|
|
| - 3 | % |
| $ | 675 |
|
| $ | 930 |
|
|
| - 27 | % |
Other assets |
|
| 26 |
|
|
| 29 |
|
|
| - 9 | % |
|
| 80 |
|
|
| 117 |
|
|
| - 31 | % |
Devon DD&A |
|
| 258 |
|
|
| 268 |
|
|
| - 4 | % |
|
| 755 |
|
|
| 1,047 |
|
|
| - 28 | % |
EnLink DD&A |
|
| 142 |
|
|
| 126 |
|
|
| +13 | % |
|
| 407 |
|
|
| 373 |
|
|
| +9 | % |
Total DD&A |
| $ | 400 |
|
| $ | 394 |
|
|
| +2 | % |
| $ | 1,162 |
|
| $ | 1,420 |
|
|
| - 18 | % |
DD&A per Boe: |
|
|
|
|
|
|
|
|
|
|
|
|
|
|
|
|
|
|
|
|
|
|
|
|
Oil and gas properties |
| $ | 4.78 |
|
| $ | 4.51 |
|
|
| +6 | % |
| $ | 4.56 |
|
| $ | 5.35 |
|
|
| - 15 | % |
35
DD&A from our oil and gas properties decreased in the thirdsecond quarter primarily due to lower production and decreased during the first nine months of 2017 largely due to lower DD&A rates, resulting from the oil and gas asset impairments and non-core U.S. divestures in 2016. DD&A from our other assets decreased2018 due to the divestiture of Access Pipeline in the fourth quarter of 2016.
EnLink’s DD&A increased primarily due to acquisitions made during 2016 and gathering system expansions in 2017.
Asset Impairments
During the third quarter and the first nine months of 2016, we recognized asset impairments totaling $319 million and $4.9 billion, respectively. For further discussion, see debt repayments. See Note 515 in “Part I. Financial Information – Item 1. Financial Statements” ofin this report.report for additional information.
Restructuring and Transaction Costs
Other |
|
| Q2 2018 |
|
| Q1 2018 |
|
| Change |
| |||
Asset impairments |
| $ | 154 |
|
| $ | — |
|
|
| N/M |
|
Asset dispositions |
|
| 23 |
|
|
| (12 | ) |
|
| +292 | % |
Restructuring and transaction costs |
|
| 94 |
|
|
| — |
|
|
| N/M |
|
Other |
|
| 24 |
|
|
| 21 |
|
|
| +14 | % |
Total |
| $ | 295 |
|
| $ | 9 |
|
|
| +3178 | % |
During the first nine monthssecond quarter of 2016,2018, we recognized restructuring costs$109 million of $249proved asset impairments relating to U.S. non-core assets no longer in our development plans and $45 million as a result of a reduction in workforce driven by our cost reduction initiativesnon-oil and divestiture of non-core properties.
During the first nine months of 2016, we recognized transaction costs of $17 million, primarily associated with the closing of the acquisitions discussed in gas asset impairments. See Note 26 in “Part I. Financial Information – Item 1. Financial Statements” ofin this report.
Net Financing Costsreport for additional information.
|
| Three Months Ended September 30, |
|
| Nine Months Ended September 30, |
| ||||||||||||||||||
|
| 2017 |
|
| 2016 |
|
| Change |
|
| 2017 |
|
| 2016 |
|
| Change |
| ||||||
|
| (Millions) |
| |||||||||||||||||||||
Devon net financing costs: |
|
|
|
|
|
|
|
|
|
|
|
|
|
|
|
|
|
|
|
|
|
|
|
|
Interest based on debt outstanding |
| $ | 97 |
|
| $ | 120 |
|
|
| - 19 | % |
| $ | 292 |
|
| $ | 376 |
|
|
| - 22 | % |
Early retirement of debt |
|
| — |
|
|
| 84 |
|
| N/M |
|
|
| — |
|
|
| 84 |
|
| N/M |
| ||
Capitalized interest |
|
| (19 | ) |
|
| (16 | ) |
|
| +21 | % |
|
| (53 | ) |
|
| (47 | ) |
|
| +12 | % |
Other |
|
| (1 | ) |
|
| 7 |
|
|
| - 114 | % |
|
| (3 | ) |
|
| 18 |
|
|
| - 117 | % |
Total Devon net financing costs |
|
| 77 |
|
|
| 195 |
|
|
| - 60 | % |
|
| 236 |
|
|
| 431 |
|
|
| - 45 | % |
EnLink net financing costs: |
|
|
|
|
|
|
|
|
|
|
|
|
|
|
|
|
|
|
|
|
|
|
|
|
Interest based on debt outstanding |
|
| 43 |
|
|
| 37 |
|
|
| +16 | % |
|
| 125 |
|
|
| 105 |
|
|
| +19 | % |
Interest accretion on deferred installment payment |
|
| 7 |
|
|
| 13 |
|
|
| - 46 | % |
|
| 20 |
|
|
| 39 |
|
|
| - 49 | % |
Early retirement of debt |
|
| — |
|
|
| — |
|
| N/M |
|
|
| (9 | ) |
|
| — |
|
| N/M |
| ||
Other |
|
| — |
|
|
| (2 | ) |
|
| N/M |
|
|
| (2 | ) |
|
| (5 | ) |
|
| - 60 | % |
Total EnLink net financing costs |
|
| 50 |
|
|
| 48 |
|
|
| +2 | % |
|
| 134 |
|
|
| 139 |
|
|
| - 3 | % |
Total net financing costs |
| $ | 127 |
|
| $ | 243 |
|
|
| - 48 | % |
| $ | 370 |
|
| $ | 570 |
|
|
| - 35 | % |
Devon’s net financing costs decreasedWe recognized personnel related restructuring charges during the thirdsecond quarter and the first nine months of 2017 primarily due2018 relating to the 2016 repayment of $2.5 billion in borrowings, including scheduled maturities and early retirements funded with asset divestiture proceeds.
EnLink’s interest on debt outstanding increased during the third quarter and the first nine months of 2017 due to increased borrowings. In the first nine months of 2017, EnLink recognized a gain on extinguishment of debt as disclosed in workforce reductions. See Note 147 in “Part I. Financial Information – Item 1. Financial Statements” in this report for additional information.
32
Income Taxes
| |||||||||||||||||||||||||||||||||||||||||||||||||||||||||||||||||||||||||||||||||||||||||||||||||||||||||||||||||||||||
|
| Q2 2018 |
|
| Q1 2018 |
| ||
Current expense (benefit) |
| $ | (27 | ) |
| $ | 4 |
|
Deferred expense (benefit) |
|
| 20 |
|
|
| (38 | ) |
Total benefit |
| $ | (7 | ) |
| $ | (34 | ) |
Effective income tax rate |
|
| 1 | % |
|
| 14 | % |
For discussion on income taxes, see Note 8 in “Part I. Financial Information – Item 1. Financial Statements” in the U.S. segment based on our continuing net operating loss position. For further discussion on income taxes, see Note 7 in “Part I. Financial Information – Item 1. Financial Statements” of this report.
Capital Resources, Uses and Liquidity
Sources and Uses of Cash
The following table presents the major changes in cash and cash equivalents for the nine months ended September 30, 2017 and 2016.
|
| Devon |
|
| EnLink |
|
| Consolidated |
| |||||||||||||||
|
| 2017 |
|
| 2016 |
|
| 2017 |
|
| 2016 |
|
| 2017 |
|
| 2016 |
| ||||||
|
| (Millions) |
| |||||||||||||||||||||
Operating cash flow |
| $ | 1,892 |
|
| $ | 724 |
|
| $ | 528 |
|
| $ | 513 |
|
| $ | 2,420 |
|
| $ | 1,237 |
|
Divestitures of property and equipment |
|
| 321 |
|
|
| 1,884 |
|
|
| 2 |
|
|
| 5 |
|
|
| 323 |
|
|
| 1,889 |
|
Issuance of common stock |
|
| — |
|
|
| 1,469 |
|
|
| — |
|
|
| — |
|
|
| — |
|
|
| 1,469 |
|
Proceeds from sale of investment |
|
| — |
|
|
| — |
|
|
| 190 |
|
|
| — |
|
|
| 190 |
|
|
| — |
|
Capital expenditures |
|
| (1,541 | ) |
|
| (1,235 | ) |
|
| (662 | ) |
|
| (424 | ) |
|
| (2,203 | ) |
|
| (1,659 | ) |
Acquisitions of property, equipment and businesses |
|
| (39 | ) |
|
| (849 | ) |
|
| — |
|
|
| (792 | ) |
|
| (39 | ) |
|
| (1,641 | ) |
Debt activity, net |
|
| — |
|
|
| (1,946 | ) |
|
| 252 |
|
|
| 178 |
|
|
| 252 |
|
|
| (1,768 | ) |
Payment of installment payable |
|
| — |
|
|
| — |
|
|
| (250 | ) |
|
| — |
|
|
| (250 | ) |
|
| — |
|
Shareholder and noncontrolling interests distributions |
|
| (95 | ) |
|
| (190 | ) |
|
| (247 | ) |
|
| (224 | ) |
|
| (342 | ) |
|
| (414 | ) |
EnLink and General Partner distributions |
|
| 199 |
|
|
| 199 |
|
|
| (199 | ) |
|
| (199 | ) |
|
| — |
|
|
| — |
|
Issuance of subsidiary units |
|
| — |
|
|
| — |
|
|
| 486 |
|
|
| 835 |
|
|
| 486 |
|
|
| 835 |
|
Effect of exchange rate and other |
|
| (45 | ) |
|
| (23 | ) |
|
| 30 |
|
|
| 150 |
|
|
| (15 | ) |
|
| 127 |
|
Net change in cash and cash equivalents |
| $ | 692 |
|
| $ | 33 |
|
| $ | 130 |
|
| $ | 42 |
|
| $ | 822 |
|
| $ | 75 |
|
Cash and cash equivalents at end of period |
| $ | 2,639 |
|
| $ | 2,325 |
|
| $ | 142 |
|
| $ | 60 |
|
| $ | 2,781 |
|
| $ | 2,385 |
|
Discontinued Operations |
For discussion on discontinued operations, see Note 19 in “Part I. Financial Information – Item 1. Financial Statements” in this report. Discontinued operations net earnings increased primarily due to higher revenues and lower DD&A expense due to ceasing depreciation and amortization for all plant, property and equipment and intangible assets classified as assets held for sale on the date the agreement regarding the sale of our investment in EnLink and the General Partner was signed.
33
Results of Operations – 2018 vs. 2017
The following graphs, discussion and analysis are intended to provide an understanding of our results of operations and current financial condition. To facilitate the review, these numbers are being presented before consideration of earnings attributable to noncontrolling interests.
Q2 2018 vs. Q2 2017
The graph below shows the change in net earnings from the three months ended June 30, 2017 to the three months ended June 30, 2018. The material changes are further discussed by category below. Further analysis of the upstream operations change has been provided within a supplemental section to our results of operations beginning on page 36.
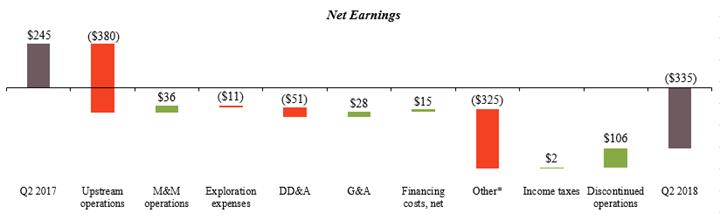
* Other includes asset impairments, asset dispositions, restructuring and transaction costs and other expenses.
Net earnings decreased $580 million during the second quarter of 2018 compared to the second quarter of 2017. The decrease primarily related to a $380 million decrease in upstream operations and a $325 million increase in other. These changes were partially offset by a $106 million increase in earnings from discontinued operations. Upstream operations decreased primarily due to $623 million of valuation changes and cash settlements for commodity derivatives and a $117 million increase in production expenses, partially offset by the $317 million effect of higher field prices primarily related to our oil and NGL production. Other increased primarily due to $154 million of asset impairments and $94 million of restructuring charges recognized in the second quarter of 2018. Discontinued operations net earnings increased primarily due to higher revenues and lower DD&A expense.
34
June 30, 2018 YTD vs. June 30, 2017 YTD
The graph below shows the change in net earnings from the six months ended June 30, 2017 to the six months ended June 30, 2018. The material changes are further discussed by category below. Further analysis of the upstream operations change has been provided within a supplemental section to our results of operations beginning on page 36.

*Other includes asset impairments, asset dispositions, restructuring and transaction costs and other expenses.
Net earnings decreased approximately $1 billion during the six months ended 2018 compared to the same period in 2017. The decrease primarily related to a $688 million decrease in upstream operations, a $356 million increase in other and a $289 million increase in financing costs, net. These changes were partially offset by a $155 million increase in discontinued operations. Upstream revenues decreased primarily due to $896 million of valuation changes and cash settlements for commodity derivatives and a $203 million increase in production expenses, partially offset by the $403 million effect of higher field prices primarily related to our oil and NGL production. Other increased primarily due to $154 million of asset impairments and $94 million of restructuring charges during the second quarter of 2018. Financing costs, net increased $289 million primarily from $312 million of early retirement costs associated with our $800 million debt retirement in 2018. As a result of this early retirement of debt, we estimate that total cash interest expense has been reduced by approximately $64 million on an annualized basis. Discontinued operations net earnings increased primarily due to higher revenues and lower DD&A expense.
Upstream Operations |
The supplemental graphs and charts below present the drivers and details of the upstream operations changes discussed in the previous section.
Q2 2018 vs. Q2 2017

35
June 30, 2018 YTD vs. June 30, 2017 YTD
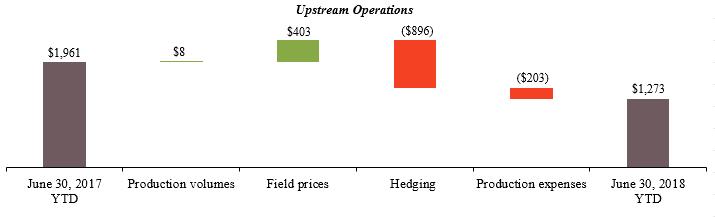
36
|
| Three Months Ended June 30, |
|
| Six Months Ended June 30, |
| ||||||||||||||||||||||||||
|
| 2018 |
|
| % of Total |
|
| 2017 |
|
| Change |
|
| 2018 |
|
| % of Total |
|
| 2017 |
|
| Change |
| ||||||||
Oil and bitumen (MBbls/d) |
|
|
|
|
|
|
|
|
|
|
|
|
|
|
|
|
|
|
|
|
|
|
|
|
|
|
|
|
|
|
|
|
STACK |
|
| 35 |
|
|
| 14 | % |
|
| 25 |
|
|
| +41 | % |
|
| 35 |
|
|
| 14 | % |
|
| 23 |
|
|
| +54 | % |
Delaware Basin |
|
| 46 |
|
|
| 19 | % |
|
| 30 |
|
|
| +54 | % |
|
| 41 |
|
|
| 17 | % |
|
| 30 |
|
|
| +38 | % |
Rockies Oil |
|
| 16 |
|
|
| 7 | % |
|
| 13 |
|
|
| +22 | % |
|
| 17 |
|
|
| 7 | % |
|
| 13 |
|
|
| +30 | % |
Heavy Oil |
|
| 17 |
|
|
| 7 | % |
|
| 17 |
|
|
| +1 | % |
|
| 18 |
|
|
| 7 | % |
|
| 18 |
|
|
| +0 | % |
Eagle Ford |
|
| 28 |
|
|
| 11 | % |
|
| 34 |
|
|
| - 17 | % |
|
| 26 |
|
|
| 10 | % |
|
| 40 |
|
|
| - 36 | % |
Barnett Shale |
|
| 1 |
|
|
| 0 | % |
|
| 1 |
|
|
| - 9 | % |
|
| 1 |
|
|
| 0 | % |
|
| 1 |
|
|
| - 16 | % |
Other |
|
| 10 |
|
|
| 4 | % |
|
| 10 |
|
|
| +0 | % |
|
| 9 |
|
|
| 4 | % |
|
| 10 |
|
|
| - 11 | % |
Retained assets |
|
| 153 |
|
|
| 62 | % |
|
| 130 |
|
|
| +17 | % |
|
| 147 |
|
|
| 59 | % |
|
| 135 |
|
|
| +9 | % |
Divested assets |
|
| — |
|
|
| 0 | % |
|
| 3 |
|
|
| - 99 | % |
|
| — |
|
|
| 0 | % |
|
| 2 |
|
|
| - 100 | % |
Total Oil |
|
| 153 |
|
|
| 62 | % |
|
| 133 |
|
|
| +15 | % |
|
| 147 |
|
|
| 59 | % |
|
| 137 |
|
|
| +7 | % |
Bitumen |
|
| 92 |
|
|
| 38 | % |
|
| 105 |
|
|
| - 12 | % |
|
| 101 |
|
|
| 41 | % |
|
| 112 |
|
|
| - 10 | % |
Total Oil and bitumen |
|
| 245 |
|
|
| 100 | % |
|
| 238 |
|
|
| +3 | % |
|
| 248 |
|
|
| 100 | % |
|
| 249 |
|
|
| - 1 | % |
Gas (MMcf/d) |
|
|
|
|
|
|
|
|
|
|
|
|
|
|
|
|
|
|
|
|
|
|
|
|
|
|
|
|
|
|
|
|
STACK |
|
| 352 |
|
|
| 31 | % |
|
| 298 |
|
|
| +18 | % |
|
| 348 |
|
|
| 30 | % |
|
| 293 |
|
|
| +19 | % |
Delaware Basin |
|
| 100 |
|
|
| 9 | % |
|
| 94 |
|
|
| +6 | % |
|
| 98 |
|
|
| 8 | % |
|
| 91 |
|
|
| +7 | % |
Rockies Oil |
|
| 18 |
|
|
| 1 | % |
|
| 17 |
|
|
| +6 | % |
|
| 18 |
|
|
| 2 | % |
|
| 16 |
|
|
| +14 | % |
Heavy Oil |
|
| 12 |
|
|
| 1 | % |
|
| 14 |
|
|
| - 13 | % |
|
| 12 |
|
|
| 1 | % |
|
| 18 |
|
|
| - 34 | % |
Eagle Ford |
|
| 74 |
|
|
| 7 | % |
|
| 92 |
|
|
| - 19 | % |
|
| 69 |
|
|
| 6 | % |
|
| 103 |
|
|
| - 33 | % |
Barnett Shale |
|
| 460 |
|
|
| 41 | % |
|
| 496 |
|
|
| - 7 | % |
|
| 465 |
|
|
| 40 | % |
|
| 497 |
|
|
| - 6 | % |
Other |
|
| 9 |
|
|
| 1 | % |
|
| 13 |
|
|
| - 32 | % |
|
| 9 |
|
|
| 1 | % |
|
| 12 |
|
|
| - 23 | % |
Retained assets |
|
| 1,025 |
|
|
| 91 | % |
|
| 1,024 |
|
|
| +0 | % |
|
| 1,019 |
|
|
| 88 | % |
|
| 1,030 |
|
|
| - 1 | % |
Divested assets |
|
| 103 |
|
|
| 9 | % |
|
| 184 |
|
|
| - 44 | % |
|
| 133 |
|
|
| 12 | % |
|
| 188 |
|
|
| - 29 | % |
Total |
|
| 1,128 |
|
|
| 100 | % |
|
| 1,208 |
|
|
| - 7 | % |
|
| 1,152 |
|
|
| 100 | % |
|
| 1,218 |
|
|
| - 5 | % |
NGLs (MBbls/d) |
|
|
|
|
|
|
|
|
|
|
|
|
|
|
|
|
|
|
|
|
|
|
|
|
|
|
|
|
|
|
|
|
STACK |
|
| 38 |
|
|
| 35 | % |
|
| 31 |
|
|
| +25 | % |
|
| 38 |
|
|
| 37 | % |
|
| 28 |
|
|
| +32 | % |
Delaware Basin |
|
| 16 |
|
|
| 14 | % |
|
| 10 |
|
|
| +65 | % |
|
| 14 |
|
|
| 13 | % |
|
| 10 |
|
|
| +43 | % |
Rockies Oil |
|
| 2 |
|
|
| 2 | % |
|
| 1 |
|
|
| +104 | % |
|
| 2 |
|
|
| 2 | % |
|
| 1 |
|
|
| +44 | % |
Eagle Ford |
|
| 13 |
|
|
| 12 | % |
|
| 10 |
|
|
| +26 | % |
|
| 10 |
|
|
| 9 | % |
|
| 13 |
|
|
| - 24 | % |
Barnett Shale |
|
| 34 |
|
|
| 31 | % |
|
| 35 |
|
|
| - 2 | % |
|
| 32 |
|
|
| 32 | % |
|
| 35 |
|
|
| - 9 | % |
Other |
|
| 2 |
|
|
| 2 | % |
|
| 3 |
|
|
| - 36 | % |
|
| 2 |
|
|
| 2 | % |
|
| 2 |
|
|
| - 12 | % |
Retained assets |
|
| 105 |
|
|
| 96 | % |
|
| 90 |
|
|
| +17 | % |
|
| 98 |
|
|
| 95 | % |
|
| 89 |
|
|
| +11 | % |
Divested assets |
|
| 4 |
|
|
| 4 | % |
|
| 7 |
|
|
| - 44 | % |
|
| 5 |
|
|
| 5 | % |
|
| 8 |
|
|
| - 34 | % |
Total |
|
| 109 |
|
|
| 100 | % |
|
| 97 |
|
|
| +12 | % |
|
| 103 |
|
|
| 100 | % |
|
| 97 |
|
|
| +6 | % |
Combined (MBoe/d) |
|
|
|
|
|
|
|
|
|
|
|
|
|
|
|
|
|
|
|
|
|
|
|
|
|
|
|
|
|
|
|
|
STACK |
|
| 132 |
|
|
| 25 | % |
|
| 105 |
|
|
| +26 | % |
|
| 131 |
|
|
| 24 | % |
|
| 100 |
|
|
| +31 | % |
Delaware Basin |
|
| 79 |
|
|
| 15 | % |
|
| 55 |
|
|
| +42 | % |
|
| 71 |
|
|
| 13 | % |
|
| 54 |
|
|
| +30 | % |
Rockies Oil |
|
| 21 |
|
|
| 4 | % |
|
| 17 |
|
|
| +19 | % |
|
| 22 |
|
|
| 4 | % |
|
| 17 |
|
|
| +28 | % |
Heavy Oil |
|
| 111 |
|
|
| 20 | % |
|
| 124 |
|
|
| - 11 | % |
|
| 121 |
|
|
| 22 | % |
|
| 133 |
|
|
| - 9 | % |
Eagle Ford |
|
| 54 |
|
|
| 10 | % |
|
| 60 |
|
|
| - 10 | % |
|
| 48 |
|
|
| 9 | % |
|
| 70 |
|
|
| - 32 | % |
Barnett Shale |
|
| 111 |
|
|
| 20 | % |
|
| 118 |
|
|
| - 7 | % |
|
| 110 |
|
|
| 20 | % |
|
| 119 |
|
|
| - 8 | % |
Other |
|
| 12 |
|
|
| 2 | % |
|
| 16 |
|
|
| - 24 | % |
|
| 13 |
|
|
| 3 | % |
|
| 15 |
|
|
| - 14 | % |
Retained assets |
|
| 520 |
|
|
| 96 | % |
|
| 495 |
|
|
| +5 | % |
|
| 516 |
|
|
| 95 | % |
|
| 508 |
|
|
| +2 | % |
Divested assets |
|
| 21 |
|
|
| 4 | % |
|
| 41 |
|
|
| - 47 | % |
|
| 27 |
|
|
| 5 | % |
|
| 42 |
|
|
| - 36 | % |
Total |
|
| 541 |
|
|
| 100 | % |
|
| 536 |
|
|
| +1 | % |
|
| 543 |
|
|
| 100 | % |
|
| 550 |
|
|
| - 1 | % |
Focused development activities in the STACK, Delaware Basin and Rockies resulted in an approximate 30% increase in production compared to the three and six months ended 2017. This strong performance led to the overall growth in our retained assets as compared to 2017. Production increases from our capital focused assets were partially offset by production decreases related to natural production declines in the Barnett Shale, operational issues at Jackfish as well as volumes associated with divested assets.
37
|
| Three Months Ended June 30, |
|
| Six Months Ended June 30, |
| ||||||||||||||||||||||||||
|
| 2018 |
|
| Realization |
|
| 2017 |
|
| Change |
|
| 2018 |
|
| Realization |
|
| 2017 |
|
| Change |
| ||||||||
Oil and bitumen (per Bbl) |
|
|
|
|
|
|
|
|
|
|
|
|
|
|
|
|
|
|
|
|
|
|
|
|
|
|
|
|
|
|
|
|
WTI index |
| $ | 67.83 |
|
|
|
|
|
| $ | 48.32 |
|
|
| +40 | % |
| $ | 65.38 |
|
|
|
|
|
| $ | 50.16 |
|
|
| +30 | % |
Access Western Blend index |
| $ | 45.56 |
|
|
|
|
|
| $ | 35.23 |
|
|
| +29 | % |
| $ | 40.50 |
|
|
|
|
|
| $ | 35.20 |
|
|
| +15 | % |
U.S. |
| $ | 65.41 |
|
|
| 96% |
|
| $ | 46.65 |
|
|
| +40 | % |
| $ | 63.71 |
|
|
| 97% |
|
| $ | 48.18 |
|
|
| +32 | % |
Canada |
| $ | 31.70 |
|
|
| 47% |
|
| $ | 29.05 |
|
|
| +9 | % |
| $ | 25.24 |
|
|
| 39% |
|
| $ | 27.60 |
|
|
| - 9 | % |
Realized price, unhedged |
| $ | 50.43 |
|
|
| 74% |
|
| $ | 37.63 |
|
|
| +34 | % |
| $ | 45.25 |
|
|
| 69% |
|
| $ | 37.48 |
|
|
| +21 | % |
Cash settlements |
| $ | (5.80 | ) |
|
|
|
|
| $ | 0.29 |
|
|
|
|
|
| $ | (2.93 | ) |
|
|
|
|
| $ | 0.39 |
|
|
|
|
|
Realized price, with hedges |
| $ | 44.63 |
|
|
| 66% |
|
| $ | 37.92 |
|
|
| +18 | % |
| $ | 42.32 |
|
|
| 65% |
|
| $ | 37.87 |
|
|
| +12 | % |
Gas (per Mcf) |
|
|
|
|
|
|
|
|
|
|
|
|
|
|
|
|
|
|
|
|
|
|
|
|
|
|
|
|
|
|
|
|
Henry Hub index |
| $ | 2.80 |
|
|
|
|
|
| $ | 3.19 |
|
|
| - 12 | % |
| $ | 2.90 |
|
|
|
|
|
| $ | 3.25 |
|
|
| - 10 | % |
Realized price, unhedged |
| $ | 2.01 |
|
|
| 72% |
|
| $ | 2.50 |
|
|
| - 20 | % |
| $ | 2.21 |
|
|
| 76% |
|
| $ | 2.59 |
|
|
| - 15 | % |
Cash settlements |
| $ | 0.13 |
|
|
|
|
|
| $ | 0.04 |
|
|
|
|
|
| $ | 0.16 |
|
|
|
|
|
| $ | — |
|
|
|
|
|
Realized price, with hedges |
| $ | 2.14 |
|
|
| 77% |
|
| $ | 2.54 |
|
|
| - 16 | % |
| $ | 2.37 |
|
|
| 82% |
|
| $ | 2.59 |
|
|
| - 9 | % |
NGLs (per Bbl) |
|
|
|
|
|
|
|
|
|
|
|
|
|
|
|
|
|
|
|
|
|
|
|
|
|
|
|
|
|
|
|
|
Mont Belvieu blended index (1) |
| $ | 28.05 |
|
|
|
|
|
| $ | 21.78 |
|
|
| +29 | % |
| $ | 26.97 |
|
|
|
|
|
| $ | 22.86 |
|
|
| +18 | % |
Realized price, unhedged |
| $ | 24.10 |
|
|
| 86% |
|
| $ | 13.26 |
|
|
| +82 | % |
| $ | 23.38 |
|
|
| 87% |
|
| $ | 14.36 |
|
|
| +63 | % |
Cash settlements |
| $ | (1.66 | ) |
|
|
|
|
| $ | (0.03 | ) |
|
|
|
|
| $ | (1.13 | ) |
|
|
|
|
| $ | (0.02 | ) |
|
|
|
|
Realized price, with hedges |
| $ | 22.44 |
|
|
| 80% |
|
| $ | 13.23 |
|
|
| +70 | % |
| $ | 22.25 |
|
|
| 82% |
|
| $ | 14.34 |
|
|
| +55 | % |
Combined (per Boe) |
|
|
|
|
|
|
|
|
|
|
|
|
|
|
|
|
|
|
|
|
|
|
|
|
|
|
|
|
|
|
|
|
U.S. |
| $ | 31.97 |
|
|
|
|
|
| $ | 23.58 |
|
|
| +36 | % |
| $ | 31.20 |
|
|
|
|
|
| $ | 24.72 |
|
|
| +26 | % |
Canada |
| $ | 31.17 |
|
|
|
|
|
| $ | 28.50 |
|
|
| +9 | % |
| $ | 24.84 |
|
|
|
|
|
| $ | 27.03 |
|
|
| - 8 | % |
Realized price, unhedged |
| $ | 31.81 |
|
|
|
|
|
| $ | 24.72 |
|
|
| +29 | % |
| $ | 29.79 |
|
|
|
|
|
| $ | 25.28 |
|
|
| +18 | % |
Cash settlements |
| $ | (2.68 | ) |
|
|
|
|
| $ | 0.22 |
|
|
|
|
|
| $ | (1.23 | ) |
|
|
|
|
| $ | 0.19 |
|
|
|
|
|
Total |
| $ | 29.13 |
|
|
|
|
|
| $ | 24.94 |
|
|
| +17 | % |
| $ | 28.56 |
|
|
|
|
|
| $ | 25.47 |
|
|
| +12 | % |
|
|
|
Hedging
|
| Three Months Ended June 30, |
|
| Six Months Ended June 30, |
| ||||||||||||||||||
|
| 2018 |
|
| 2017 |
|
| Change |
|
| 2018 |
|
| 2017 |
|
| Change |
| ||||||
Cash settlements: |
|
|
|
|
|
|
|
|
|
|
|
|
|
|
|
|
|
|
|
|
|
|
|
|
Oil derivatives |
| $ | (129 | ) |
| $ | 6 |
|
|
| N/M |
|
| $ | (131 | ) |
| $ | 18 |
|
|
| N/M |
|
Gas derivatives |
|
| 14 |
|
|
| 4 |
|
|
| N/M |
|
|
| 32 |
|
|
| 1 |
|
| N/M |
| |
NGL derivatives |
|
| (16 | ) |
|
| 1 |
|
|
| N/M |
|
|
| (21 | ) |
|
| — |
|
| N/M |
| |
Total cash settlements |
|
| (131 | ) |
|
| 11 |
|
|
| N/M |
|
|
| (120 | ) |
|
| 19 |
|
|
| N/M |
|
Valuation changes |
|
| (366 | ) |
|
| 115 |
|
|
| N/M |
|
|
| (418 | ) |
|
| 339 |
|
|
| N/M |
|
Oil, gas and NGL derivatives |
| $ | (497 | ) |
| $ | 126 |
|
|
| N/M |
|
| $ | (538 | ) |
| $ | 358 |
|
|
| N/M |
|
Production Expenses
|
| Three Months Ended June 30, |
|
| Six Months Ended June 30, |
| ||||||||||||||||||
|
| 2018 |
|
| 2017 |
|
| Change |
|
| 2018 |
|
| 2017 |
|
| Change |
| ||||||
LOE |
| $ | 269 |
|
| $ | 239 |
|
|
| +12 | % |
| $ | 510 |
|
| $ | 462 |
|
|
| +10 | % |
Gathering, processing & transportation |
|
| 224 |
|
|
| 160 |
|
|
| +40 | % |
|
| 452 |
|
|
| 323 |
|
|
| +40 | % |
Production taxes |
|
| 67 |
|
|
| 41 |
|
|
| +63 | % |
|
| 126 |
|
|
| 96 |
|
|
| +32 | % |
Property taxes |
|
| 12 |
|
|
| 15 |
|
|
| - 18 | % |
|
| 27 |
|
|
| 31 |
|
|
| - 11 | % |
Total |
| $ | 572 |
|
| $ | 455 |
|
|
| +26 | % |
| $ | 1,115 |
|
| $ | 912 |
|
|
| +22 | % |
Per Boe: |
|
|
|
|
|
|
|
|
|
|
|
|
|
|
|
|
|
|
|
|
|
|
|
|
LOE |
| $ | 5.45 |
|
| $ | 4.90 |
|
|
| +11 | % |
| $ | 5.18 |
|
| $ | 4.65 |
|
|
| +11 | % |
Gathering, processing & transportation |
| $ | 4.55 |
|
| $ | 3.28 |
|
|
| +39 | % |
| $ | 4.60 |
|
| $ | 3.24 |
|
|
| +42 | % |
Percent of oil, gas and NGL sales: |
|
|
|
|
|
|
|
|
|
|
|
|
|
|
|
|
|
|
|
|
|
|
|
|
Production taxes |
|
| 4.2 | % |
|
| 3.4 | % |
|
| +26 | % |
|
| 4.3 | % |
|
| 3.8 | % |
|
| +13 | % |
38
As further discussed in Note 2 in “Part I. Financial Information – Item 1. Financial Statements” in this report, in 2018 the presentation of certain processing arrangements changed from a net to a gross presentation. The change resulted in an increase to our upstream revenues and production expenses by $65 million and $127 million, respectively, during the three months and six months ended 2018 with no impact to net earnings.
Capital Resources, Uses and Liquidity
Sources and Uses of Cash
The following table presents the major changes in cash and cash equivalents for the six months ended June 30, 2018 and 2017.
|
| Three months ended June 30, |
|
| Six months ended June 30, |
| ||||||||||
|
| 2018 |
|
| 2017 |
|
| 2018 |
|
| 2017 |
| ||||
Operating cash flow from continuing operations |
| $ | 269 |
|
| $ | 586 |
|
| $ | 879 |
|
| $ | 1,155 |
|
Effect of exchange rate and other |
|
| 221 |
|
|
| 5 |
|
|
| 168 |
|
|
| (56 | ) |
Divestitures of property and equipment |
|
| 560 |
|
|
| 75 |
|
|
| 607 |
|
|
| 107 |
|
Capital expenditures |
|
| (602 | ) |
|
| (434 | ) |
|
| (1,253 | ) |
|
| (831 | ) |
Acquisitions of property and equipment |
|
| (10 | ) |
|
| (13 | ) |
|
| (16 | ) |
|
| (33 | ) |
Debt activity, net |
|
| — |
|
|
| — |
|
|
| (1,111 | ) |
|
| — |
|
Common stock dividends |
|
| (42 | ) |
|
| (33 | ) |
|
| (74 | ) |
|
| (65 | ) |
Repurchases of common stock |
|
| (428 | ) |
|
| — |
|
|
| (499 | ) |
|
| — |
|
Net change in cash, cash equivalents and restricted cash from discontinued operations |
|
| 87 |
|
|
| 64 |
|
|
| 140 |
|
|
| 133 |
|
Net change in cash, cash equivalents and restricted cash |
| $ | 55 |
|
| $ | 250 |
|
| $ | (1,159 | ) |
| $ | 410 |
|
Cash, cash equivalents and restricted cash at end of period |
| $ | 1,525 |
|
| $ | 2,369 |
|
| $ | 1,525 |
|
| $ | 2,369 |
|
Operating Cash Flow
Net cash provided by operating activities decreased 24% as compared to the first six months of 2017.
The three months and six months ended June 30, 2018 operating cash flows included a realized foreign exchange loss of $244 million relating to foreign currency denominated intercompany loan activity as described in Note 7in “Part I. Financial Information – Item 1. Financial Statements” in this report. There was an offset due to the effect of exchange rate and other line in the above table, resulting in no impact to the net change in cash, cash equivalents and restricted cash.
Divestitures of Property and EquipmentOperating Cash Flow
DuringNet cash provided by operating activities decreased 24% as compared to the first ninesix months of 2017,2017.
The three months and six months ended June 30, 2018 operating cash flows included a realized foreign exchange loss of $244 million relating to foreign currency denominated intercompany loan activity as part of our announced divestiture program, we sold non-core U.S. assets for approximately $320 million, net of customary purchase price adjustments. During the first nine months of 2016, we divested certain non-core upstream assetsdescribed in the U.S. for approximately $1.9 billion. For further discussion, see Note 2 in “Part 1. Financial Information – Item 1. Financial Statements” in this report.
Issuance of Common Stock
In February 2016, we issued 79 million shares of our common stock to the public, inclusive of 10 million shares sold as part of the underwriters’ option. Net proceeds from the offering were approximately $1.5 billion.
Proceeds from Sale of Investment
During the first quarter of 2017, EnLink divested its ownership interest in Howard Energy Partners for approximately $190 million. Proceeds were primarily used to pay a portion of the $250 million installment payment related to EnLink’s 2016 acquisition further discussed in Note 2 7in “Part I. Financial Information – Item 1. Financial Statements” in this report.
37
Tablereport. There was an offset due to the effect of Contents
Capital Expendituresexchange rate and Acquisitions of Property, Equipment and Businesses
The amountsother line in the above table, below reflect cash payments for capital expenditures, including cash paid for capital expenditures incurredresulting in prior periods.
|
| Nine Months Ended September 30, |
| |||||
|
| 2017 |
|
| 2016 |
| ||
|
| (Millions) |
| |||||
Oil and gas |
| $ | 1,480 |
|
| $ | 1,212 |
|
Corporate and other |
|
| 61 |
|
|
| 23 |
|
Devon capital expenditures |
|
| 1,541 |
|
|
| 1,235 |
|
EnLink capital expenditures |
|
| 662 |
|
|
| 424 |
|
Total capital expenditures |
| $ | 2,203 |
|
| $ | 1,659 |
|
Devon acquisitions |
|
| 39 |
|
|
| 849 |
|
EnLink acquisitions |
|
| — |
|
|
| 792 |
|
Total acquisitions |
| $ | 39 |
|
| $ | 1,641 |
|
Capital expenditures consist of amounts relatedno impact to our oil and gas exploration and development operations, midstream operations, other corporate activities and EnLink growth and maintenance activities. The vast majority of Devon’s capital expenditures are for the acquisition, drilling and development of oil and gas properties. Devon’s 2017 objectives are to concentrate capital spend in the STACK and Delaware Basin, while investing within cash flow and maintaining significant flexibility. Our capital investment program is driven by a disciplined allocation process focused on returns.
Capital expenditures for midstream operations are primarily for the construction and expansion of oil and gas gathering facilities and pipelines. Midstream capital expenditures are largely impacted by oil and gas development activities.
Acquisition capital for the first nine months of 2016 primarily consisted of Devon’s acquisition of assets in the STACK play for approximately $1.5 billion and EnLink’s acquisition of Anadarko Basin gathering and processing midstream assets for $1.4 billion. Approximately $850 million and $800 million, respectively, was paidnet change in cash, at the closings with the remainder funded with equity considerationcash equivalents and debt. For additional information, see Note 2 in “Part I. Financial Information – Item 1. Financial Statements” in this report.restricted cash.
Debt Activity, Net
During the first nine months of 2017, consolidated net debt borrowings increased $252 million. In May 2017, EnLink issued $500 million of 5.45% senior notes due in 2047 to repay outstanding borrowings under its revolving credit facility and for general partnership purposes. In June 2017, EnLink redeemed its 7.125% senior unsecured notes due in 2022 for aggregate cash consideration of $174 million. Additionally, EnLink reduced its credit facility borrowings $74 million during the first nine months of 2017.
During the first nine months of 2016, our consolidated net debt borrowings decreased $1.8 billion. The decrease was primarily due to completed tender offers to purchase and redeem $1.2 billion of debt securities. For additional information, see Note 14 in “Part I. Financial Information – Item 1. Financial Statements” in this report. The remaining decrease was due to reducing our commercial paper balances by $626 million during the first nine months of 2016.
Payment of Installment Payable
During the first quarter of 2017, EnLink made the first installment payment related to its 2016 acquisition further discussed in Note 2 in “Part I. Financial Information – Item 1. Financial Statements” in this report.
38
Shareholder and Noncontrolling Interests Distributions
The following table summarizes our common stock dividends during the first nine months of 2017 and 2016. In the second quarter of 2016, we decreased our quarterly cash dividend rate to $0.06 per share.
| Amounts |
|
| Rate |
| ||
| (Millions) |
|
| (Per Share) |
| ||
Quarter Ended 2017: |
|
|
|
|
|
|
|
First quarter 2017 | $ | 32 |
|
| $ | 0.06 |
|
Second quarter 2017 |
| 33 |
|
| $ | 0.06 |
|
Third quarter 2017 |
| 30 |
|
| $ | 0.06 |
|
Total year-to-date | $ | 95 |
|
|
|
|
|
Quarter Ended 2016: |
|
|
|
|
|
|
|
First quarter 2016 | $ | 125 |
|
| $ | 0.24 |
|
Second quarter 2016 |
| 33 |
|
| $ | 0.06 |
|
Third quarter 2016 |
| 32 |
|
| $ | 0.06 |
|
Total year-to-date | $ | 190 |
|
|
|
|
|
EnLink and the General Partner distributed $247 million and $224 million to non-Devon unitholders during the first nine months of 2017 and 2016, respectively.
EnLink and General Partner Distributions
Devon received $199 million in distributions from EnLink and the General Partner during the first nine months of 2017 and 2016.
Issuance of Subsidiary Units
During the first nine months of 2017, EnLink issued and sold 5 million common units through its “at the market” programs and generated $92 million in net proceeds. In September 2017, EnLink issued preferred units in an underwritten public offering generating net proceeds of approximately $394 million.
In January 2016, as part of its acquisition of Anadarko Basin gathering and processing midstream assets, EnLink issued 50 million preferred units in a private placement generating cash proceeds of approximately $725 million. General Partner common units were also issued as consideration in the transaction. Additionally, during the first nine months of 2016, EnLink issued and sold 7 million common units for net proceeds of $110 million through its “at the market” programs.
Liquidity
Our primary sources of capital and liquidity are our operating cash flow, asset divestiture proceeds and cash on hand. Additionally, we maintain a commercial paper program, supported by our revolving line of credit, which can be accessed as needed to supplement operating cash flow and cash balances. Available sources of capital and liquidity also include, among other things, debt and equity securities that can be issued pursuant to our shelf registration statement filed with the SEC, as well as the sale of a portion of our common units representing interests in our investment in EnLink and the General Partner. We estimate the combination of these sources of capital will continue to be adequate to fund our planned capital expenditures, future debt repayments and other contractual commitments as discussed in this section.
Operating Cash Flow
Net cash provided by operating activities decreased 24% as compared to the first six months of 2017.
The three months and six months ended June 30, 2018 operating cash flows included a realized foreign exchange loss of $244 million relating to foreign currency denominated intercompany loan activity as described in Note 7in “Part I. Financial Information – Item 1. Financial Statements” in this report. There was an offset due to the effect of exchange rate and other line in the above table, resulting in no impact to the net change in cash, cash equivalents and restricted cash.
Divestitures of Property and Equipment
During the first six months of 2018, we sold non-core U.S. assets, including certain Barnett Shale assets, for $607 million. For additional information, please see Note 3 in “Part I. Financial Information – Item 1. Financial Statements” in this report. During the first six months of 2017, we sold non-core U.S. assets for $107 million.
Capital Expenditures and Acquisitions of Property and Equipment
The amounts in the table below reflect cash payments for capital expenditures, including cash paid for capital expenditures incurred in prior periods.
|
| Three months ended June 30, |
|
| Six months ended June 30, |
| ||||||||||
|
| 2018 |
|
| 2017 |
|
| 2018 |
|
| 2017 |
| ||||
Oil and gas |
| $ | 599 |
|
| $ | 414 |
|
| $ | 1,225 |
|
| $ | 797 |
|
Corporate and other |
|
| 3 |
|
|
| 20 |
|
|
| 28 |
|
|
| 34 |
|
Total capital expenditures |
| $ | 602 |
|
| $ | 434 |
|
| $ | 1,253 |
|
| $ | 831 |
|
Acquisitions |
| $ | 10 |
|
| $ | 13 |
|
| $ | 16 |
|
| $ | 33 |
|
Capital expenditures consist of amounts related to our oil and gas exploration and development operations and other corporate activities. Devon’s 2018 objectives are to concentrate capital spend in the STACK and Delaware Basin, while investing within cash flow and maintaining significant flexibility. Our capital investment program is driven by a disciplined allocation process focused on returns. Our capital expenditures are higher in 2018 due to our continued development in the STACK and Delaware Basin.
39
Debt Activity
During the first six months of 2018, our debt decreased approximately $800 million due to completed tender offers of certain long-term debt. In conjunction with the tender offers, we recognized a $312 million loss on the early retirement of debt, including $304 million of cash retirement costs and fees. For additional information, see Note 15 in “Part I. Financial Information – Item 1. Financial Statements” in this report.
Shareholder Distributions and Stock Activity
The following table summarizes our common stock dividends during the first six months of 2018 and 2017. In the second quarter of 2018, we increased the quarterly dividend to $0.08 per share.
| Amounts |
|
| Rate Per Share |
| ||
Quarter Ended 2018: |
|
|
|
|
|
|
|
First quarter 2018 | $ | 32 |
|
| $ | 0.06 |
|
Second quarter 2018 |
| 42 |
|
| $ | 0.08 |
|
Total year-to-date 2018 | $ | 74 |
|
|
|
|
|
Quarter Ended 2017: |
|
|
|
|
|
|
|
First quarter 2017 | $ | 32 |
|
| $ | 0.06 |
|
Second quarter 2017 |
| 33 |
|
| $ | 0.06 |
|
Total year-to-date 2017 | $ | 65 |
|
|
|
|
|
In March 2018, we announced a share repurchase program to buy up to $1.0 billion of shares of common stock. In June 2018, in conjunction with the announcement of the divestiture of our investment in EnLink and the General Partner, we announced the expansion of the authorized share repurchase by an additional $3.0 billion, bringing the total to $4.0 billion. The share repurchase program expires December 31, 2019. Including unsettled shares, we repurchased 13.7 million shares of common stock for $521 million, or $38.01 per share, under this program through June 30, 2018.
Cash Flows from Discontinued Operations
|
| Three months ended June 30, |
|
| Six months ended June 30, |
| ||||||||||
|
| 2018 |
|
| 2017 |
|
| 2018 |
|
| 2017 |
| ||||
Cash flows from discontinued operations: |
|
|
|
|
|
|
|
|
|
|
|
|
|
|
|
|
Operating activities |
| $ | 236 |
|
| $ | 151 |
|
| $ | 430 |
|
| $ | 328 |
|
Investing activities |
|
| (222 | ) |
|
| (215 | ) |
|
| (402 | ) |
|
| (284 | ) |
Financing activities |
|
| 73 |
|
|
| 128 |
|
|
| 112 |
|
|
| 89 |
|
Net change in cash, cash equivalents and restricted cash of discontinued operations: |
| $ | 87 |
|
| $ | 64 |
|
| $ | 140 |
|
| $ | 133 |
|
Cash flows from discontinued operations relate to operating activities of EnLink and the General Partner. EnLink’s operating cash flow from the first six months of 2018 has increased $102 million from the first six months of 2017 as a result of its continued development activities.
Capital expenditures for EnLink’s midstream operations are primarily for the construction and expansion of oil and gas gathering facilities and pipelines. During the first six months of 2017, EnLink divested its ownership interest in Howard Energy Partners for approximately $190 million, resulting in lower net investing cash outflows as compared to the first six months of 2018.
Devon received $134 million and $133 million in distributions from EnLink and the General Partner during the first six months of 2018 and 2017, respectively. During the first six months of 2017, EnLink issued and sold 4 million common units and generated $72 million in net proceeds, through its “at the market” programs.
Liquidity
Our primary sources of capital and liquidity are our operating cash flow, asset divestiture proceeds and cash on hand. Additionally, we maintain a commercial paper program, supported by our revolving line of credit, which can be accessed as needed to
40
supplement operating cash flow and cash balances. Available sources of capital and liquidity also include, among other things, debt and equity securities that can be issued pursuant to our shelf registration statement filed with the SEC. Additionally, the sale of our aggregate ownership interest in EnLink and the General Partner significantly increased our liquidity in the third quarter and will fund our remaining share repurchase program. We estimate the combination of these sources of capital will continue to be adequate to fund our planned capital expenditures, future debt repayments, share repurchases and other contractual commitments as discussed in this section.
Operating Cash Flow
Our operating cash flow is sensitive to many variables, the most volatile of which are the prices of the oil, bitumen, gas and NGLs we produce and sell. Our consolidated operating cash flow increased approximately $1.2 billion in the first nine months of 2017 compared to the first nine months of 2016 largely due to increases in commodity prices. We expect operating cash flow to continue to be a key source of liquidity as we adjust our capital program to invest within our operating cash flow. Furthermore, proceeds from non-core asset divestitures will provide additional liquidity as needed.
39
To mitigate some of the risk inherent in prices, we utilize various derivative financial instruments to protect a portion of our production against downside price risk. We target hedging approximately 50% of our production in a manner that systematically places hedges for several quarters in advance, allowing us to maintain a disciplined risk management program as it relates to commodity price volatility. We supplement the systematic hedging program with discretionary hedges that take advantage of favorable market conditions. For additional information on our derivative positions in place at SeptemberJune 30, 2017,2018, see Note 34 in “Part I. Financial Information – Item 1. Financial Statements” in this report.
Divestitures of Property and Equipment
To further focus our resource-rich portfolio, we are targeting $5 billion of asset divestiture proceeds. As noted below, we made significant progress to achieving this goal during the first six months of 2018.
In May 2017,2018, we announcedcompleted the sale of our Johnson County asset in the southern part of the Barnett Shale position for $553 million ($481 million after customary purchase price adjustments).
In a programseparate transaction within the Barnett, we formed a partnership in April 2018 under which we will monetize half our working interest across 116 gross undrilled locations for an approximate $75 million payment spread over the next five years. With this agreement, we will also drill and operate up to divest24 wells per year, with volumes dedicated to the EnLink gathering and processing infrastructure.
In June 2018, we entered into an agreement to sell our aggregate ownership interests in EnLink and the General Partner for approximately $3.1 billion. This transaction closed on July 18, 2018.
Overall, the transactions noted above, combined with other previously disclosed asset sales, generated approximately $4.2 billion of total divestiture proceeds. We are also marketing approximately $1 billion of upstream assets. Theseadditional non-core assets identified for monetization include select portions ofacross our U.S. portfolio as we progress toward the Barnett Shale focused primarily in and around Johnson County and other properties located principally within Devon’s U.S. resource base. Through September 30, 2017, Devon completed divestiture transactions totaling approximately $400 million, before purchase price adjustments. The most significant asset remaining in this program is select Barnett Shale leasehold. Data rooms for the Barnett properties opened in September 2017 and initial bids are expected during the fourth quarter of 2017.$5 billion target.
Capital Expenditures
Excluding EnLink,The following table below presents our 2017expected 2018 capital expenditures are expected to range from $2.4 billion to $2.5 billion, including $2.0 billion to $2.1 billion for our exploration and development capital program. Our capital expenditures excluding EnLink were $1.7 billion in the first nine months of 2017 and are forecasted to range from $0.7 billion to $0.8 billion in the fourth quarter of 2017.expenditures.
|
| Q3 2018 - Q4 2018 |
|
| Full Year 2018 |
| ||||||||||||||
|
| (Billions) |
| |||||||||||||||||
Exploration and production |
| $ | 0.9 |
|
| — |
| $ | 1.1 |
|
| $ | 2.2 |
|
| — |
| $ | 2.4 |
|
Total |
| $ | 1.0 |
|
| — |
| $ | 1.3 |
|
| $ | 2.3 |
|
| — |
| $ | 2.6 |
|
Credit Availability
We have a $3.0 billion Senior Credit Facility. As of SeptemberJune 30, 2017,2018, we had approximately $2.9 billion available under this facility, net of $59$51 million in outstanding letters of credit, and were in compliance with the facility’s financial covenant. This credit facility supports our $3.0 billion of short-term credit under our commercial paper program. At SeptemberJune 30, 2017,2018, there were no borrowings under our commercial paper program.
EnLink Liquidity41
EnLink has a $1.5 billion unsecured revolving credit facility. The General Partner has a $250 million secured revolving credit facility. As of September 30, 2017, there were $9 million in outstanding letters of credit and no outstanding borrowings under the $1.5 billion credit facility and $74 million in outstanding borrowings under the $250 million credit facility. All of EnLink’s and the General Partner’s debt is non-recourse to Devon.
In January 2017, EnLink paid the first $250 million installment payment related to the 2016 Anadarko Basin gathering and processing midstream assets acquisition. The remaining $250 million installment payment is payable by January 2018.
We receive debt ratings from the major ratings agencies in the U.S. In determining our debt ratings, the agencies consider a number of qualitative and quantitative items, including, but not limited to, commodity pricing levels, our liquidity, asset quality, reserve mix, debt levels, cost structure, planned asset sales and near-term and long-term production growth opportunities. Our credit rating from Standard and Poor’s Financial Services is BBB with a stable outlook. In March 2017,Our credit rating from Fitch Ratings affirmed ouris BBB+ with a stable outlook. Our credit rating and revised our outlook to stable from negative. In April 2017, Moody’s Investor Service upgraded our credit rating from Ba2 tois Ba1 with a stable outlook. Any rating downgrades may result in additional letters of credit or cash collateral being posted under certain contractual arrangements.
There are no “rating triggers” in anyShare Repurchase Program
During March 2018, our Board of Directors authorized a $1.0 billion share repurchase program of our or EnLink’s contractual debt obligations that would accelerate scheduled maturities should a debt rating fall below a specified level. However, these downgrades could adversely impactcommon stock. In June 2018, in conjunction with the announcement of the divestiture of our and EnLink’s interest rate on any credit facility borrowingsinvestment in EnLink and the abilityGeneral Partner, we announced the expansion of the authorized share repurchase by an additional $3.0 billion, bringing the total to economically access debt markets in$4.0 billion. The share repurchase program expires December 31, 2019. Through July 27, 2018, we had repurchased 23.2 million common shares for $942 million, or $40.65 per share. We expect to complete the future.$4 billion share repurchase program by the first half of 2019.
40
Critical Accounting Estimates
Income Taxes
The amountAs discussed in our 2017 Annual Report on Form 10-K, in December 2017, the SEC staff issued Staff Accounting Bulletin No. 118, Income Tax Accounting Implications of income taxes recorded requires interpretationsthe Tax Cuts and Jobs Act (SAB 118), which allows us to record provisional amounts during a measurement period not to extend beyond one year after the enactment date. As the Tax Reform Legislation was passed late in the fourth quarter of complex rules2017 and regulationsongoing guidance and accounting interpretation are expected over the next 12 months, we consider the accounting of federal, state, provincial and foreignthe transition tax, jurisdictions. We recognize current tax expense based on estimated taxable income for the current period and the applicable statutory tax rates. We routinely assess potential uncertain tax positions and, if required, estimate and establish accruals for such amounts. We have recognized deferred tax assets and liabilities for temporary differences, operating lossesremeasurements, and other items to be incomplete due to the forthcoming guidance and our ongoing analysis of final year-end data and tax carryforwards.positions. We routinely assessexpect to complete our deferred tax assetsanalysis within the measurement period in accordance with SAB 118.
Absent unexpected events and reduce such assets by a valuation allowance if we deem it is more likely than not that some portion or allunexpected effects of the deferred tax assets will not be realized. At September 30, 2017, we continued to haveTax Reform Legislation, Devon expects a 100% valuation allowance against the U.S. deferred tax assets that largely resulted from prior year cumulative financial lossespositive impact on its future after-tax earnings, primarily due to full cost impairments. Further, we continue to record a partial valuation allowance against certain Canadian deferredthe lower federal statutory tax assets.
The accruals for deferred tax assets and liabilities are often based on assumptions that are subject to a significant amount of judgment by management. These assumptions and judgments are reviewed and adjusted as facts and circumstances change. Material changes to our income tax accruals may occur in the future based on the progress of ongoing audits, changes in legislation or resolution of other pending matters.rate.
Non-GAAP Measures
We make reference to “core earnings (loss) attributable to Devon” and “core earnings (loss) per share attributable to Devon” in “Overview of 20172018 Results” in this Item 2.2 that are not required by or presented in accordance with GAAP. These non-GAAP measures are not alternatives to GAAP measures and should not be considered in isolation or as a substitute for analysis of our results reported under GAAP. Core earnings (loss) attributable to Devon, as well as the per share amount, represent net earnings excluding certain noncash and other items that are typically excluded by securities analysts in their published estimates of our financial results. Additionally, we’ve presented our discontinued operations associated with the sale of our aggregate interests in EnLink and the General Partner, separately, to show our results on a go-forward basis. For more information on the results of operations for EnLink and the General Partner, see Note 19 in “Part I. Financial Information – Item 1. Financial Statements”. Our non-GAAP measures are typically used as a quarterly performance measure. Amounts excluded for the third quarter and first nine months of 2017 relate to changes in derivatives and financial instrument fair values and foreign currency, gains and losses on asset sales, dispositions, noncash asset impairments gains(including noncash unproved asset impairments), deferred tax asset valuation allowance, costs associated with early retirement of debt, and deferred tax asset valuation allowance. Amounts excluded for the third quarter and first nine months of 2016 relate tofair value changes in derivatives andderivative financial instrument fair valuesinstruments and foreign currency, noncash asset impairments (including an impairment of goodwill), restructuring and transaction costs gains on asset sales, costs associated with the early retirement of debt2018 workforce reduction and deferred tax asset valuation allowance. settlements relating to minimum volume contract commitments.
We believe these non-GAAP measures facilitate comparisons of our performance to earnings estimates published by securities analysts. We also believe these non-GAAP measures can facilitate comparisons of our performance between periods and to the performance of our peers.
4142
Below are reconciliations of our core earnings (loss) and core earnings (loss) per share attributable to Devon to their comparable GAAP measures.
|
| Three Months Ended September 30, |
|
| Nine Months Ended September 30, |
| Three Months Ended June 30, |
|
| Six Months Ended June 30, |
| ||||||||||||||||||||||||||||||||||||||||||||||||||||
|
| Before tax |
|
| After tax |
|
| After Noncontrolling Interests |
|
| Per Share |
|
| Before tax |
|
| After tax |
|
| After Noncontrolling Interests |
|
| Per Share |
| Before tax |
|
| After tax |
|
| After Noncontrolling Interests |
|
| Per Diluted Share |
|
| Before tax |
|
| After tax |
|
| After Noncontrolling Interests |
|
| Per Diluted Share |
| ||||||||||||||||
2018 |
|
|
|
|
|
|
|
|
|
|
|
|
|
|
|
|
|
|
|
|
|
|
|
|
|
|
|
|
|
|
| ||||||||||||||||||||||||||||||||
Continuing Operations |
|
|
|
|
|
|
|
|
|
|
|
|
|
|
|
|
|
|
|
|
|
|
|
|
|
|
|
|
|
|
| ||||||||||||||||||||||||||||||||
Loss attributable to Devon (GAAP) | $ | (481 | ) |
| $ | (474 | ) |
| $ | (474 | ) |
| $ | (0.92 | ) |
| $ | (726 | ) |
| $ | (685 | ) |
| $ | (685 | ) |
| $ | (1.33 | ) | ||||||||||||||||||||||||||||||||
Adjustments: |
|
|
|
|
|
|
|
|
|
|
|
|
|
|
|
|
|
|
|
|
|
|
|
|
|
|
|
|
|
|
| ||||||||||||||||||||||||||||||||
Asset dispositions |
| 23 |
|
|
| 18 |
|
|
| 18 |
|
|
| 0.03 |
|
|
| 11 |
|
|
| 9 |
|
|
| 9 |
|
|
| 0.02 |
| ||||||||||||||||||||||||||||||||
Asset and exploration impairments |
| 207 |
|
|
| 159 |
|
|
| 159 |
|
|
| 0.31 |
|
|
| 217 |
|
|
| 166 |
|
|
| 166 |
|
|
| 0.32 |
| ||||||||||||||||||||||||||||||||
Deferred tax asset valuation allowance |
| — |
|
|
| 73 |
|
|
| 73 |
|
|
| 0.14 |
|
|
| — |
|
|
| 79 |
|
|
| 79 |
|
|
| 0.15 |
| ||||||||||||||||||||||||||||||||
Early retirement of debt |
| — |
|
|
| — |
|
|
| — |
|
|
| — |
|
|
| 312 |
|
|
| 240 |
|
|
| 240 |
|
|
| 0.46 |
| ||||||||||||||||||||||||||||||||
Fair value changes in financial instruments and foreign currency |
| 376 |
|
|
| 291 |
|
|
| 291 |
|
|
| 0.56 |
|
|
| 437 |
|
|
| 351 |
|
|
| 351 |
|
|
| 0.68 |
| ||||||||||||||||||||||||||||||||
Restructuring and transaction costs |
| 94 |
|
|
| 72 |
|
|
| 72 |
|
|
| 0.14 |
|
|
| 94 |
|
|
| 72 |
|
|
| 72 |
|
|
| 0.14 |
| ||||||||||||||||||||||||||||||||
Core earnings attributable to Devon (Non-GAAP) | $ | 219 |
|
| $ | 139 |
|
| $ | 139 |
|
| $ | 0.26 |
|
| $ | 345 |
|
| $ | 232 |
|
| $ | 232 |
|
| $ | 0.44 |
| ||||||||||||||||||||||||||||||||
Discontinued Operations |
|
|
|
|
|
|
|
|
|
|
|
|
|
|
|
|
|
|
|
|
|
|
|
|
|
|
|
|
|
|
| ||||||||||||||||||||||||||||||||
Earnings attributable to Devon (GAAP) | $ | 149 |
|
| $ | 139 |
|
| $ | 49 |
|
| $ | 0.09 |
|
| $ | 213 |
|
| $ | 197 |
|
| $ | 63 |
|
| $ | 0.13 |
| ||||||||||||||||||||||||||||||||
Adjustments: |
|
|
|
|
|
|
|
|
|
|
|
|
|
|
|
|
|
|
|
|
|
|
|
|
|
|
|
|
|
|
| ||||||||||||||||||||||||||||||||
Fair value changes and minimum volume commitment settlement |
| (36 | ) |
|
| (30 | ) |
|
| (11 | ) | ` |
| (0.01 | ) |
|
| (34 | ) |
|
| (28 | ) |
|
| (10 | ) |
|
| (0.03 | ) | ||||||||||||||||||||||||||||||||
Core earnings attributable to Devon (Non-GAAP) | $ | 113 |
|
| $ | 109 |
|
| $ | 38 |
|
| $ | 0.08 |
|
| $ | 179 |
|
| $ | 169 |
|
| $ | 53 |
|
| $ | 0.10 |
| ||||||||||||||||||||||||||||||||
Total |
|
|
|
|
|
|
|
|
|
|
|
|
|
|
|
|
|
|
|
|
|
|
|
|
|
|
|
|
|
|
| ||||||||||||||||||||||||||||||||
Loss attributable to Devon (GAAP) | $ | (332 | ) |
| $ | (335 | ) |
| $ | (425 | ) |
| $ | (0.83 | ) |
| $ | (513 | ) |
| $ | (488 | ) |
| $ | (622 | ) |
| $ | (1.20 | ) | ||||||||||||||||||||||||||||||||
Adjustments: |
|
|
|
|
|
|
|
|
|
|
|
|
|
|
|
|
|
|
|
|
|
|
|
|
|
|
|
|
|
|
| ||||||||||||||||||||||||||||||||
Continuing Operations |
| 700 |
|
|
| 613 |
|
|
| 613 |
|
|
| 1.18 |
|
|
| 1,071 |
|
|
| 917 |
|
|
| 917 |
|
|
| 1.77 |
| ||||||||||||||||||||||||||||||||
Discontinued Operations |
| (36 | ) |
|
| (30 | ) |
|
| (11 | ) |
|
| (0.01 | ) |
|
| (34 | ) |
|
| (28 | ) |
|
| (10 | ) |
|
| (0.03 | ) | ||||||||||||||||||||||||||||||||
Core earnings attributable to Devon (Non-GAAP) | $ | 332 |
|
| $ | 248 |
|
| $ | 177 |
|
| $ | 0.34 |
|
| $ | 524 |
|
| $ | 401 |
|
| $ | 285 |
|
| $ | 0.54 |
| ||||||||||||||||||||||||||||||||
|
| (Millions, except per share amounts) |
|
|
|
|
|
|
|
|
|
|
|
|
|
|
|
|
|
|
|
|
|
|
|
|
|
|
|
|
|
|
|
| |||||||||||||||||||||||||||||
2017 |
|
|
|
|
|
|
|
|
|
|
|
|
|
|
|
|
|
|
|
|
|
|
|
|
|
|
|
|
|
|
|
|
|
|
|
|
|
|
|
|
|
|
|
|
|
|
|
|
|
|
|
|
|
|
|
|
|
|
|
|
|
|
|
Continuing Operations |
|
|
|
|
|
|
|
|
|
|
|
|
|
|
|
|
|
|
|
|
|
|
|
|
|
|
|
|
|
|
| ||||||||||||||||||||||||||||||||
Earnings attributable to Devon (GAAP) |
| $ | 272 |
|
| $ | 247 |
|
| $ | 228 |
|
| $ | 0.43 |
|
| $ | 1,328 |
|
| $ | 1,277 |
|
| $ | 1,218 |
|
| $ | 2.31 |
| $ | 207 |
|
| $ | 212 |
|
| $ | 212 |
|
| $ | 0.40 |
|
| $ | 520 |
|
| $ | 520 |
|
| $ | 520 |
|
| $ | 0.99 |
|
Adjustments: |
|
|
|
|
|
|
|
|
|
|
|
|
|
|
|
|
|
|
|
|
|
|
|
|
|
|
|
|
|
|
|
|
|
|
|
|
|
|
|
|
|
|
|
|
|
|
|
|
|
|
|
|
|
|
|
|
|
|
|
|
|
|
|
Asset dispositions |
| (22 | ) |
|
| (13 | ) |
|
| (13 | ) |
|
| (0.03 | ) |
|
| (30 | ) |
|
| (19 | ) |
|
| (19 | ) |
|
| (0.04 | ) | ||||||||||||||||||||||||||||||||
Asset and exploration impairments |
| 21 |
|
|
| 13 |
|
|
| 13 |
|
|
| 0.02 |
|
|
| 62 |
|
|
| 39 |
|
|
| 39 |
|
|
| 0.08 |
| ||||||||||||||||||||||||||||||||
Deferred tax asset valuation allowance |
| — |
|
|
| (54 | ) |
|
| (54 | ) |
|
| (0.10 | ) |
|
| — |
|
|
| (155 | ) |
|
| (155 | ) |
|
| (0.30 | ) | ||||||||||||||||||||||||||||||||
Fair value changes in financial instruments and foreign currency |
|
| 106 |
|
|
| 40 |
|
|
| 39 |
|
|
| 0.08 |
|
|
| (292 | ) |
|
| (233 | ) |
|
| (232 | ) |
|
| (0.44 | ) |
| (144 | ) |
|
| (109 | ) |
|
| (109 | ) |
|
| (0.20 | ) |
|
| (389 | ) |
|
| (266 | ) |
|
| (266 | ) |
|
| (0.51 | ) |
Gains and losses on asset sales |
|
| 1 |
|
|
| 1 |
|
|
| — |
|
|
| — |
|
|
| (6 | ) |
|
| (4 | ) |
|
| (4 | ) |
|
| (0.01 | ) | |||||||||||||||||||||||||||||||
Asset impairments |
|
| 2 |
|
|
| 1 |
|
|
| 1 |
|
|
| — |
|
|
| 9 |
|
|
| 7 |
|
|
| 4 |
|
|
| 0.01 |
| |||||||||||||||||||||||||||||||
Early retirement of debt |
|
| — |
|
|
| — |
|
|
| — |
|
|
| — |
|
|
| (9 | ) |
|
| (7 | ) |
|
| (4 | ) |
|
| (0.01 | ) | |||||||||||||||||||||||||||||||
Deferred tax asset valuation allowance |
|
| — |
|
|
| (26 | ) |
|
| (26 | ) |
|
| (0.05 | ) |
|
| — |
|
|
| (346 | ) |
|
| (346 | ) |
|
| (0.66 | ) | |||||||||||||||||||||||||||||||
Core earnings attributable to Devon (Non-GAAP) |
| $ | 381 |
|
| $ | 263 |
|
| $ | 242 |
|
| $ | 0.46 |
|
| $ | 1,030 |
|
| $ | 694 |
|
| $ | 636 |
|
| $ | 1.20 |
| $ | 62 |
|
| $ | 49 |
|
| $ | 49 |
|
| $ | 0.09 |
|
| $ | 163 |
|
| $ | 119 |
|
| $ | 119 |
|
| $ | 0.22 |
|
2016 |
|
|
|
|
|
|
|
|
|
|
|
|
|
|
|
|
|
|
|
|
|
|
|
|
|
|
|
|
|
|
|
| |||||||||||||||||||||||||||||||
Earnings (loss) attributable to Devon (GAAP) |
| $ | 1,178 |
|
| $ | 1,007 |
|
| $ | 993 |
|
| $ | 1.89 |
|
| $ | (4,252 | ) |
| $ | (4,024 | ) |
| $ | (3,633 | ) |
| $ | (7.22 | ) | |||||||||||||||||||||||||||||||
Discontinued Operations |
|
|
|
|
|
|
|
|
|
|
|
|
|
|
|
|
|
|
|
|
|
|
|
|
|
|
|
|
|
|
| ||||||||||||||||||||||||||||||||
Earnings attributable to Devon (GAAP) | $ | 37 |
|
| $ | 33 |
|
| $ | 7 |
|
| $ | 0.01 |
|
| $ | 49 |
|
| $ | 42 |
|
| $ | 2 |
|
| $ | 0.00 |
| ||||||||||||||||||||||||||||||||
Adjustments: |
|
|
|
|
|
|
|
|
|
|
|
|
|
|
|
|
|
|
|
|
|
|
|
|
|
|
|
|
|
|
|
|
|
|
|
|
|
|
|
|
|
|
|
|
|
|
|
|
|
|
|
|
|
|
|
|
|
|
|
|
|
|
|
Fair value changes in financial instruments and foreign currency |
|
| (16 | ) |
|
| (3 | ) |
|
| (3 | ) |
|
| (0.01 | ) |
|
| 201 |
|
|
| 91 |
|
|
| 86 |
|
|
| 0.17 |
| |||||||||||||||||||||||||||||||
Asset impairments |
|
| 319 |
|
|
| 202 |
|
|
| 202 |
|
|
| 0.38 |
|
|
| 4,851 |
|
|
| 3,492 |
|
|
| 3,076 |
|
|
| 6.12 |
| |||||||||||||||||||||||||||||||
Restructuring and transaction costs |
|
| (5 | ) |
|
| (3 | ) |
|
| (3 | ) |
|
| (0.01 | ) |
|
| 266 |
|
|
| 171 |
|
|
| 169 |
|
|
| 0.33 |
| |||||||||||||||||||||||||||||||
Gains on asset sales |
|
| (1,351 | ) |
|
| (787 | ) |
|
| (787 | ) |
|
| (1.48 | ) |
|
| (1,351 | ) |
|
| (787 | ) |
|
| (787 | ) |
|
| (1.56 | ) | |||||||||||||||||||||||||||||||
Early retirement of debt |
|
| 84 |
|
|
| 53 |
|
|
| 53 |
|
|
| 0.10 |
|
|
| 84 |
|
|
| 53 |
|
|
| 53 |
|
|
| 0.11 |
| |||||||||||||||||||||||||||||||
Deferred tax asset valuation allowance |
|
| — |
|
|
| (408 | ) |
|
| (408 | ) |
|
| (0.78 | ) |
|
| — |
|
|
| 867 |
|
|
| 867 |
|
|
| 1.71 |
| |||||||||||||||||||||||||||||||
Asset dispositions, impairments, fair value changes and early retirement of debt |
| (17 | ) |
|
| (13 | ) |
|
| (8 | ) |
| $ | (0.01 | ) |
|
| (11 | ) |
|
| (8 | ) |
|
| (5 | ) |
| $ | 0.00 |
| ||||||||||||||||||||||||||||||||
Core earnings (loss) attributable to Devon (Non-GAAP) |
| $ | 209 |
|
| $ | 61 |
|
| $ | 47 |
|
| $ | 0.09 |
|
| $ | (201 | ) |
| $ | (137 | ) |
| $ | (169 | ) |
| $ | (0.34 | ) | $ | 20 |
|
| $ | 20 |
|
| $ | (1 | ) |
| $ | 0.00 |
|
| $ | 38 |
|
| $ | 34 |
|
| $ | (3 | ) |
| $ | 0.00 |
|
Total |
|
|
|
|
|
|
|
|
|
|
|
|
|
|
|
|
|
|
|
|
|
|
|
|
|
|
|
|
|
|
| ||||||||||||||||||||||||||||||||
Earnings attributable to Devon (GAAP) | $ | 244 |
|
| $ | 245 |
|
| $ | 219 |
|
| $ | 0.41 |
|
| $ | 569 |
|
| $ | 562 |
|
| $ | 522 |
|
| $ | 0.99 |
| ||||||||||||||||||||||||||||||||
Adjustments: |
|
|
|
|
|
|
|
|
|
|
|
|
|
|
|
|
|
|
|
|
|
|
|
|
|
|
|
|
|
|
| ||||||||||||||||||||||||||||||||
Continuing Operations |
| (145 | ) |
|
| (163 | ) |
|
| (163 | ) |
|
| (0.31 | ) |
|
| (357 | ) |
|
| (401 | ) |
|
| (401 | ) |
|
| (0.77 | ) | ||||||||||||||||||||||||||||||||
Discontinued Operations |
| (17 | ) |
|
| (13 | ) |
|
| (8 | ) |
|
| (0.01 | ) |
|
| (11 | ) |
|
| (8 | ) |
|
| (5 | ) |
|
| 0.00 |
| ||||||||||||||||||||||||||||||||
Core earnings attributable to Devon (Non-GAAP) | $ | 82 |
|
| $ | 69 |
|
| $ | 48 |
|
| $ | 0.09 |
|
| $ | 201 |
|
| $ | 153 |
|
| $ | 116 |
|
| $ | 0.22 |
| ||||||||||||||||||||||||||||||||
4243
Item 3. Quantitative and Qualitative Disclosures About Market Risk
Commodity Price Risk
As of SeptemberJune 30, 2017,2018, we have commodity derivatives that pertain to a portion of our production for the last threesix months of 2017,2018, as well as 20182019 and 2019.2020. The key terms to our open oil, gas and NGL derivative financial instruments are presented in Note 34 in “Part I. Financial Information – Item 1. Financial Statements” in this report.
The fair values of our commodity derivatives are largely determined by the forward curves of the relevant price indices. At SeptemberJune 30, 2017,2018, a 10% change in the forward curves associated with our commodity derivative instruments would have changed our net asset positions by approximately $170$522 million.
Interest Rate Risk
As of SeptemberJune 30, 2017,2018, we had total debt of $10.4$6.1 billion. Of this amount, $10.3 billion bearsAll of our debt is based on fixed interest rates averaging 5.3%, and $74 million is comprised of floating rate debt with interest rates averaging 3.2%5.4%.
As of SeptemberJune 30, 2017,2018, we had an open interest rate swap positionsposition that areis presented in Note 34 in “Part I. Financial Information – Item 1. Financial Statements” in this report. The fair valuesvalue of our interest rate swaps areswap is largely determined by estimates of the forward curves of the 3-month LIBOR rate. A 10% change in these forward curves would not have materially impacted our balance sheet at SeptemberJune 30, 2017.2018.
Foreign Currency Risk
Our net assets, net earnings and cash flows from our Canadian subsidiaries are based on the U.S. dollar equivalent of such amounts measured in the Canadian dollar functional currency. Assets and liabilities of the Canadian subsidiaries are translated to U.S. dollars using the applicable exchange rate as of the end of a reporting period. Revenues, expenses and cash flow are translated using an average exchange rate during the reporting period. A 10% unfavorable change in the Canadian-to-U.S. dollar exchange rate would not have materially impacted our SeptemberJune 30, 20172018 balance sheet.
Our non-Canadian foreign subsidiaries have a U.S. dollar functional currency. However, certain of our subsidiaries hold Canadian-dollar cash and engageDevon engages in intercompany loansloan activity between subsidiaries with Canadian subsidiaries that are based in Canadian dollars.different functional currencies. The value of the Canadian-dollar cash andthese foreign currency denominated intercompany loans increases or decreases from the remeasurement into the subsidiaries’ functional currency. Based on the amount of the cash andintercompany loans intoas of June 30, 2018, a 10% change in the U.S. dollar functional currency.foreign currency exchange rates would not have materially impacted our balance sheet.
Item 4. Controls and Procedures
Disclosure Controls and Procedures
We have established disclosure controls and procedures to ensure that material information relating to Devon, including its consolidated subsidiaries, is made known to the officers who certify Devon’s financial reports and to other members of senior management and the Board of Directors.
Based on their evaluation, our principal executive and principal financial officers have concluded that our disclosure controls and procedures (as defined in Rules 13a-15(e) and 15d-15(e) under the Securities Exchange Act of 1934) were effective as of SeptemberJune 30, 20172018 to ensure that the information required to be disclosed by Devon in the reports that it files or submits under the Securities Exchange Act of 1934 is recorded, processed, summarized and reported within the time periods specified in the SEC rules and forms.
Changes in Internal Control Over Financial Reporting
There were no changes in our internal control over financial reporting that occurred during our most recent fiscal quarter that have materially affected, or are reasonably likely to materially affect, our internal control over financial reporting.
4344
We are involved in various legal proceedings incidental to our business. However, to our knowledge as of the date of this report, there were no material pending legal proceedings to which we are a party or to which any of our property is subject.
Please see our 20162017 Annual Report on Form 10-K for additional information regarding certain environmental matters involving the Company.information.
There have been no material changes to the information included in Item 1A. “Risk Factors” in our 20162017 Annual Report on Form 10-K.10-K.
Item 2. Unregistered Sales of Equity Securities and Use of Proceeds
The following table provides information regarding purchases of our common stock that were made by us during the thirdsecond quarter of 2017.
2018 (shares in thousands).
Period |
| Total Number of Shares Purchased (1) |
|
| Average Price Paid per Share |
| ||
July 1 - July 31 |
|
| 48,112 |
|
| $ | 32.08 |
|
August 1 - August 31 |
|
| 16,504 |
|
| $ | 31.69 |
|
September 1 - September 30 |
|
| 1,108 |
|
| $ | 31.81 |
|
Total |
|
| 65,724 |
|
| $ | 31.97 |
|
Period |
| Total Number of Shares Purchased (1) |
|
| Average Price Paid per Share |
|
| Total Number of Shares Purchased As Part of Publicly Announced Plans or Programs (2) |
|
| Maximum Dollar Value of Shares that May Yet Be Purchased Under the Plans or Programs (2) |
| ||||
April 1 - April 30 |
|
| 3,641 |
|
| $ | 33.59 |
|
|
| 3,626 |
|
| $ | 796 |
|
May 1 - May 31 |
|
| 490 |
|
| $ | 38.22 |
|
|
| 396 |
|
| $ | 781 |
|
June 1 - June 30 |
|
| 7,172 |
|
| $ | 42.39 |
|
|
| 7,132 |
|
| $ | 3,479 |
|
Total |
|
| 11,303 |
|
| $ | 39.37 |
|
|
| 11,154 |
|
|
|
|
|
(1) |
|
(2) | On March 7, 2018, we announced a $1.0 billion share repurchase program. On June 6, 2018, we announced the expansion of this program to $4 billion with a December 31, 2019 expiration date. The expansion and extension were contingent upon the closing of the sale of our interests in EnLink and the General Partner, which occurred in July 2018. As of June 30, 2018, we had repurchased 13.7 million common shares for $521 million, or $38.01 per share, under this program. Future purchases under the program will be made in open market or private transactions, or through the use of accelerated share repurchase programs. |
Under the Devon Plan, eligible employees may purchase shares of our common stock through an investment in the Devon Stock Fund, which is administered by an independent trustee. Eligible employees purchased approximately 10,4009,800 shares of our common stock in the thirdsecond quarter of 2017,2018, at then-prevailing stock prices, that they held through their ownership in the Stock Fund. We acquired the shares of our common stock sold under the Devon Plan through open-market purchases.
Similarly, eligible Canadian employees may purchase shares of our common stock through an investment in the Canadian Plan, which is administered by an independent trustee, Sun Life Assurance Company of Canada. Shares sold under the Canadian Plan were acquired through open-market purchases. These shares and any interest in the Canadian Plan were offered and sold in reliance on the exemptions for offers and sales of securities made outside of the U.S., including under Regulation S for offers and sales of securities to employees pursuant to an employee benefit plan established and administered in accordance with the law of a country other than the U.S. In the thirdsecond quarter of 2017,2018, there were approximately 4,200no shares purchased by Canadian employees.
Item 3. Defaults Upon Senior Securities
Not applicable.
Item 4. Mine Safety Disclosures
Not applicable.
Not applicable.
4445
Exhibit Number |
| Description |
|
| |
| ||
2.1 | Purchase Agreement, dated June 5, 2018, by and among Devon Gas Services, L.P., Southwestern Gas Pipeline, L.L.C., EnLink Midstream Manager, LLC, GIP III Stetson I, L.P., GIP III Stetson II, L.P. and, solely for certain purposes described therein, Devon Energy Corporation (incorporated by reference to Exhibit 2.1 to Devon Energy Corporation’s Current Report on Form 8-K filed on June 7, 2018). | |
31.1 |
| |
|
| |
31.2 |
| |
|
| |
32.1 |
| |
|
| |
32.2 |
| |
|
| |
101.INS |
| XBRL Instance Document. |
|
| |
101.SCH |
| XBRL Taxonomy Extension Schema Document. |
|
| |
101.CAL |
| XBRL Taxonomy Extension Calculation Linkbase Document. |
|
| |
101.DEF |
| XBRL Taxonomy Extension Definition Linkbase Document. |
|
| |
101.LAB |
| XBRL Taxonomy Extension Labels Linkbase Document. |
|
| |
101.PRE |
| XBRL Taxonomy Extension Presentation Linkbase Document. |
45
46
Pursuant to the requirements of the Securities Exchange Act of 1934, the registrant has duly caused this report to be signed on its behalf by the undersigned thereunto duly authorized.
|
|
|
| DEVON ENERGY CORPORATION |
|
|
| ||
Date: |
|
|
| /s/ Jeremy D. Humphers |
|
|
|
| Jeremy D. Humphers |
|
|
|
| Senior Vice President and Chief Accounting Officer |
4647