QUARTERLY REPORT FOR THE THREE AND NINE MONTHS ENDED
SEPTEMBER 30, 2017
| Page | |||||||||
| |||||||||
| |||||||||
| |||||||||
| |||||||||
| |||||||||
| |||||||||
| |||||||||
| |||||||||
| |||||||||
| |||||||||
| |||||||||
| |||||||||
| |||||||||
September 30, December 31, 2017 2016 (unaudited) ASSETS CURRENT ASSETS: Cash and cash equivalents $ 134,903 $ 61,029 Restricted cash 21,307 2,414 Marketable securities 17,461 — Accounts receivable, net 33,129 14,694 Due from affiliates 71 — Inventories 16,505 11,055 Prepaid income taxes 5,353 69 Prepaid expenses and other 28,749 12,492 Assets held for sale 143,496 — Total current assets 400,974 101,753 PROPERTY AND EQUIPMENT, NET 1,446,354 612,342 GAMING LICENSES AND OTHER INTANGIBLES, NET 954,962 487,498 GOODWILL 746,482 66,826 NON-OPERATING REAL PROPERTY 18,069 14,219 OTHER ASSETS, NET 18,416 11,406 Total assets $ 3,585,257 $ 1,294,044 LIABILITIES AND STOCKHOLDERS’ EQUITY CURRENT LIABILITIES: Current portion of long-term debt $ 1,068 $ 4,545 Accounts payable 28,328 21,576 Due to affiliates 30 259 Accrued property, gaming and other taxes 40,772 18,790 Accrued payroll and related 57,814 14,588 Accrued interest 13,193 14,634 Deferred proceeds for assets held for sale 20,000 — Accrued other liabilities 57,080 27,648 Liabilities related to assets held for sale 6,790 — Total current liabilities 225,075 102,040 LONG-TERM DEBT, LESS CURRENT PORTION 2,224,054 795,881 DEFERRED INCOME TAXES 251,978 90,385 OTHER LONG-TERM LIABILITIES 30,215 7,287 2,731,322 995,593 COMMITMENTS AND CONTINGENCIES (Note 10) STOCKHOLDERS' EQUITY: Common stock, 100,000,000 shares authorized, 76,804,618 and 47,105,744 issued and outstanding, par value $0.00001 as of September 30, 2017 and December 31, 2016, respectively — — Paid-in capital 745,117 173,879 Retained earnings 108,806 124,560 Accumulated other comprehensive income 12 12 Total stockholders’ equity 853,935 298,451 Total liabilities and stockholders’ equity $ 3,585,257 $ 1,294,044 Three Months Ended Nine Months Ended September 30, September 30, 2017 2016 2017 2016 REVENUES: Casino $ 367,930 $ 184,604 $ 825,833 $ 532,141 Pari-mutuel commissions 5,162 3,527 9,945 7,104 Food and beverage 56,356 38,029 132,307 108,735 Hotel 38,536 28,001 85,473 73,843 Other 15,052 12,095 35,196 33,994 483,036 266,256 1,088,754 755,817 Less-promotional allowances (38,162 ) (24,691 ) (87,776 ) (69,371 ) Net operating revenues 444,874 241,565 1,000,978 686,446 EXPENSES: Casino 184,790 103,272 428,543 299,908 Pari-mutuel commissions 4,601 3,506 9,793 7,761 Food and beverage 26,457 21,046 66,711 61,557 Hotel 10,138 7,956 24,767 23,064 Other 7,792 7,298 18,689 19,990 Marketing and promotions 24,634 11,323 54,845 30,664 General and administrative 68,585 34,094 155,778 98,129 Corporate 7,718 4,426 21,734 15,684 Depreciation and amortization 29,122 15,810 69,635 47,597 Total operating expenses 363,837 208,731 850,495 604,354 GAIN (LOSS) ON SALE OF ASSET OR DISPOSAL OF PROPERTY 4 25 (51 ) (740 ) ACQUISITION CHARGES (2,094 ) (4,750 ) (89,172 ) (5,326 ) EQUITY IN LOSS OF UNCONSOLIDATED AFFILIATE (23 ) — (305 ) — OPERATING INCOME 78,924 28,109 60,955 76,026 OTHER EXPENSE: Interest expense, net (29,183 ) (12,589 ) (69,380 ) (38,375 ) Loss on early retirement of debt, net (10,030 ) — (37,347 ) (155 ) Total other expense (39,213 ) (12,589 ) (106,727 ) (38,530 ) INCOME (LOSS) FROM CONTINUING OPERATIONS BEFORE INCOME TAXES 39,711 15,520 (45,772 ) 37,496 (PROVISION) BENEFIT FOR INCOME TAXES (11,595 ) (5,838 ) 27,625 (13,654 ) INCOME (LOSS) FROM CONTINUING OPERATIONS 28,116 9,682 (18,147 ) 23,842 INCOME FROM DISCONTINUED OPERATIONS, NET OF TAXES 1,438 — 2,393 — NET INCOME (LOSS) $ 29,554 $ 9,682 $ (15,754 ) $ 23,842 Income (loss) per common share attributable to common stockholders - basic: Income (loss) from continuing operations $ 0.36 $ 0.21 $ (0.28 ) $ 0.51 Income from discontinued operations, net of income taxes 0.02 — 0.03 — Net income (loss) attributable to common stockholders $ 0.38 $ 0.21 $ (0.25 ) $ 0.51 Income (loss) per common share attributable to common stockholders - diluted: Income (loss) from continuing operations $ 0.36 $ 0.20 $ (0.28 ) $ 0.50 Income from discontinued operations, net of income taxes 0.02 — 0.03 — Net income (loss) attributable to common stockholders $ 0.38 $ 0.20 $ (0.25 ) $ 0.50 Weighted Average Basic Shares Outstanding 76,902,070 47,193,120 63,821,705 47,106,706 Weighted Average Diluted Shares Outstanding 77,959,689 47,834,644 64,768,174 47,737,592 Three Months Ended Nine Months Ended September 30, September 30, 2017 2016 2017 2016 NET INCOME (LOSS) $ 29,554 $ 9,682 $ (15,754 ) $ 23,842 Other Comprehensive Income (Loss), net of tax: Other Comprehensive Income — — — — Comprehensive Income (Loss), net of tax $ 29,554 $ 9,682 $ (15,754 ) $ 23,842 Nine Months Ended September 30, 2017 2016 CASH FLOWS FROM OPERATING ACTIVITIES: Net (loss) income $ (15,754 ) $ 23,842 Adjustments to reconcile net (loss) income to net cash provided by operating activities: Depreciation and amortization 69,635 47,597 Amortization of deferred financing costs, discount and debt premium 5,041 2,614 Equity in loss of unconsolidated affiliate 305 — Loss on early extinguishment of debt 37,347 155 Change in fair value of acquisition related contingencies 36 1 Stock compensation expense 4,454 2,749 Loss on disposal of assets 51 740 Provision for bad debts 397 308 (Benefit) provision for deferred income taxes (25,535 ) 12,432 Change in operating assets and liabilities: Restricted cash 200 2,876 Sale of trading securities 272 — Accounts receivable (6,939 ) (7,388 ) Inventory 17 265 Prepaid expenses and other assets 2,054 (5,489 ) Interest payable (1,441 ) (7,271 ) Income taxes receivable/payable (1,268 ) — Accounts payable and accrued liabilities 2,959 (1,181 ) Net cash provided by operating activities 71,831 72,250 CASH FLOWS FROM INVESTING ACTIVITIES: Purchase of property and equipment, net (53,181 ) (32,949 ) Reimbursement of capital expenditures from West Virginia regulatory authorities 251 4,113 Restricted cash 1,617 — Proceeds from sale of property and equipment — 1,560 Net cash used in business combinations (1,343,659 ) (491 ) Decrease in other assets, net — 564 Net cash used in investing activities (1,394,972 ) (27,203 ) CASH FLOWS FROM FINANCING ACTIVITIES: Proceeds from issuance of New Term Loan 1,450,000 — Proceeds from issuance of 6% Senior Notes 875,000 — Borrowings under New Revolving Credit Facility 166,953 — Payments under Term Loan (1,062 ) (3,188 ) Payments under New Term Loan (448,125 ) — Payments under New Revolving Credit Facility (166,953 ) — Borrowings (payments) under Revolving Credit Facility 41,000 (74,500 ) Payments under Revolving Credit Facility (29,000 ) — Retirement of Term Loan (417,563 ) — Retirement of Revolving Credit Facility (41,000 ) — Debt premium proceeds 27,500 — Payment of other long-term obligation (23 ) — Payments on capital leases (347 ) (204 ) Debt issuance costs (51,338 ) (463 ) Taxes paid related to net share settlement of equity awards (10,927 ) (1,366 ) Proceeds from exercise of stock options 2,900 1,005 Net cash provided by (used in) financing activities 1,397,015 (78,716 ) INCREASE (DECREASE) IN CASH AND CASH EQUIVALENTS 73,874 (33,669 ) CASH AND CASH EQUIVALENTS, BEGINNING OF YEAR 61,029 78,278 CASH AND CASH EQUIVALENTS, END OF PERIOD $ 134,903 $ 44,609 SUPPLEMENTAL DISCLOSURE OF CASH FLOW INFORMATION Cash paid during the period for interest $ 67,840 $ 43,000 Cash paid during period for income taxes 714 1,406 NON-CASH FINANCING ACTIVITIES Payables for capital expenditures 2,286 1,961 and Significant Accounting Policies Purchase consideration calculation (dollars in thousands, except shares and stock price) Shares Per share Cash paid for outstanding Isle common stock (1) $ 552,050 Shares of ERI common stock issued for Isle common stock (2) 28,468,182 $ 19.12 544,312 Cash paid by ERI to retire Isle's long-term debt (3) 828,000 Shares of ERI common stock for Isle equity awards (4) 10,383 Purchase consideration $ 1,934,745 Nine Months Ended September 30, 2017 September 30, 2016 Net revenues $ 1,291,998 $ 1,317,185 Net income from continuing operations 77,918 22,097 Net income 84,310 28,645 Discontinued Operations Three Months Ended May 1 - September 30, September 30, 2017 2017 Net revenues $ 25,871 $ 44,306 Pretax income from discontinued operations $ 2,388 $ 3,927 Income tax provision from discontinued operations (950 ) (1,534 ) Income from discontinued operations $ 1,438 $ 2,393 Weighted- Weighted- Average Average Equity Grant Date Remaining Aggregate Awards Fair Value Contractual Life Fair Value (in years) (in millions) Unvested outstanding as of December 31, 2016 982,370 $ 6.45 1.41 $ 6.3 Granted (1) 387,204 15.95 Exchanged (2) 860,557 18.94 Forfeited (11,870 ) 15.74 Vested (851,764 ) 18.37 Unvested outstanding as of September 30, 2017 1,366,497 $ 9.49 1.06 $ 13.0 Weighted- Range of Weighted- Average Average Remaining Aggregate Options Exercise Prices Exercise Price Contractual Life Intrinsic Value (in years) (in millions) Outstanding as of December 31, 2016 169,300 $ 2.44 $ 16.27 $ 9.94 0.86 $ 1.2 Exchanged (1) 1,351,168 6.87 15.60 10.12 Expired (51,700 ) 2.44 3.94 2.97 Exercised (1,095,660 ) 6.87 16.27 10.03 Outstanding as of September 30, 2017 373,108 $ 3.94 $ 15.60 $ 11.15 1.10 $ 5.4 Weighted- Weighted- Average Average Grant Date Remaining Aggregate Restricted Stock Fair Value Contractual Life Fair Value (in years) (in millions) Outstanding as of December 31, 2016 — $ — — $ — Exchanged (1) 180,374 19.23 Forfeited (1,602 ) 19.13 Vested (167,963 ) 19.24 Outstanding as of September 30, 2017 10,809 $ 19.13 0.70 $ 0.1 September 30, December 31, 2017 2016 Useful Life (unaudited) Goodwill $ 746,482 $ 66,826 Indefinite Gaming licenses $ 846,374 $ 482,074 Indefinite Trade names 95,850 3,100 Indefinite Trade names 6,700 6,700 1 - 3.5 years Loyalty programs 21,461 7,700 1 - 3 years Subtotal 970,385 499,574 Accumulated amortization trade names (5,811 ) (4,376 ) Accumulated amortization loyalty programs (9,612 ) (7,700 ) Total gaming licenses and other intangible assets $ 954,962 $ 487,498 Non-operating real property $ 18,069 $ 14,219 Land held for development $ 906 $ 906 Other 17,510 10,500 Total other assets, net $ 18,416 $ 11,406 September 30, December 31, 2017 2016 (unaudited) New Term Loan $ 1,001,875 $ — Less: Unamortized discount and debt issuance costs (20,316 ) — Net 981,559 — 6% Senior Notes 875,000 — Plus: Unamortized debt premium 27,359 Less: Unamortized debt issuance costs (21,268 ) — Net 881,091 — 7% Senior Notes 375,000 375,000 Less: Unamortized discount and debt issuance costs (7,421 ) (8,141 ) Net 367,579 366,859 New Revolving Credit Facility — — Less: Unamortized debt issuance costs (9,118 ) — Net (9,118 ) — Term Loan — 418,625 Less: Unamortized discount and debt issuance costs — (12,578 ) Net — 406,047 Revolving Credit Facility — 29,000 Less: Unamortized debt issuance costs — (2,023 ) Net — 26,977 Capital leases 1,061 543 Long-term notes payable 2,950 — Less: Current portion (1,068 ) (4,545 ) Total long-term debt $ 2,224,054 $ 795,881 Year Percentage 2018 105.250 % 2019 103.500 % 2020 101.750 % 2021 and thereafter 100.000 % Year Percentage 2020 104.500 % 2021 103.000 % 2022 101.500 % 2023 and thereafter 100.000 % •Level •Level business. September 30, 2017 December 31, 2016 Carrying Fair Carrying Fair Amount Value Amount Value Financial assets: Cash and cash equivalents $ 134,903 $ 134,903 $ 61,029 $ 61,029 Restricted cash 21,307 21,307 2,414 2,414 Marketable securities 17,461 17,461 — — Financial liabilities: 7% Senior Notes $ 367,579 $ 402,187 $ 366,859 $ 397,500 6% Senior Notes 881,091 916,563 — — New Term Loan 981,559 1,003,177 — — Other long-term debt 2,950 2,950 — — Term Loan — — 406,047 423,858 Revolving Credit Facility — — 26,977 29,000 Acquisition-related contingent considerations 460 460 496 496 The following table Three Months Ended Nine Months Ended September 30, September 30, 2017 2016 2017 2016 (unaudited) (unaudited) Income (loss) from continuing operations $ 28,116 $ 9,682 $ (18,147 ) $ 23,842 Income from discontinued operations, net of income taxes 1,438 — 2,393 — Net income available to common stockholders $ 29,554 $ 9,682 $ (15,754 ) $ 23,842 Shares outstanding: Weighted average shares outstanding - basic 76,902,070 47,193,120 63,821,705 47,106,706 Effect of dilutive securities: Stock options 128,696 63,157 85,977 107,790 RSUs 928,923 578,367 860,492 523,096 Weighted average shares outstanding - diluted 77,959,689 47,834,644 64,768,174 47,737,592 Income (loss) per common share attributable to common stockholders - basic: Income (loss) from continuing operations $ 0.36 $ 0.21 $ (0.28 ) $ 0.51 Income from discontinued operations, net of income taxes 0.02 — 0.03 — Net income (loss) attributable to common stockholders $ 0.38 $ 0.21 $ (0.25 ) $ 0.51 Income (loss) per common share attributable to common stockholders - diluted: Income (loss) from continuing operations $ 0.36 $ 0.20 $ (0.28 ) $ 0.50 Income from discontinued operations, net of income taxes 0.02 — 0.03 — Net income (loss) attributable to common stockholders $ 0.38 $ 0.20 $ (0.25 ) $ 0.50 Balance Sheets. Circus Circus Reno Three months ended Nine months ended September 30, September 30, 2017 2016 2017 2016 (in thousands, unaudited) Revenues and expenses West: Net operating revenues $ 132,775 $ 89,676 $ 293,528 $ 246,608 Operating income 32,556 15,606 50,507 34,825 Midwest: Net operating revenues $ 103,510 $ — $ 171,015 $ — Operating income 24,261 — 39,669 — South: Net operating revenues $ 81,696 $ 33,984 $ 183,425 $ 100,514 Operating income 11,293 6,703 28,280 18,746 East: Net operating revenues $ 126,720 $ 117,905 $ 352,644 $ 339,324 Operating income 21,140 15,102 54,333 43,767 Corporate: Net revenues $ 173 $ — $ 366 $ — Operating loss (10,326 ) (9,302 ) (111,834 ) (21,312 ) Total Reportable Segments Net operating revenues $ 444,874 $ 241,565 $ 1,000,978 $ 686,446 Operating income—Total Reportable Segments 78,924 28,109 60,955 76,026 Reconciliations to Consolidated Net Income (Loss): Operating Income—Total Reportable Segments $ 78,924 $ 28,109 $ 60,955 $ 76,026 Unallocated income and expenses: Interest expense, net (29,183 ) (12,589 ) (69,380 ) (38,375 ) Loss on early retirement of debt (10,030 ) — (37,347 ) (155 ) (Provision) benefit for income taxes (11,595 ) (5,838 ) 27,625 (13,654 ) Net income (loss) from continuing operations $ 28,116 $ 9,682 $ (18,147 ) $ 23,842 Nine Months Ended September 30, 2017 2016 (in thousands, unaudited) Capital Expenditures West $ 30,498 $ 12,270 Midwest 6,545 — South 4,003 4,026 East (1) 6,791 16,278 Corporate 5,344 375 Total $ 53,181 $ 32,949 West Midwest South East Corporate, Other & Eliminations Total Balance sheet as of September 30, 2017 (unaudited) (in thousands) Total assets $ 1,282,981 $ 1,185,266 $ 688,035 $ 1,176,264 $ (747,289 ) $ 3,585,257 Goodwill 154,467 334,276 190,914 66,825 — 746,482 Balance sheet as of December 31, 2016 — Total assets $ 377,688 $ — $ 128,427 $ 850,904 $ (62,975 ) $ 1,294,044 Goodwill — — — 66,826 — 66,826 Balance Sheet Eldorado Resorts, Inc. (Parent Obligor) Guarantor Subsidiaries Non-Guarantor Subsidiaries Consolidating and Eliminating Entries Eldorado Resorts, Inc. Consolidated Current assets $ 31,559 $ 348,082 $ 21,333 $ — $ 400,974 Intercompany receivables 304,637 — 37,077 (341,714 ) — Investments in subsidiaries 2,312,039 — — (2,312,039 ) — Property and equipment, net 5,437 1,434,717 6,200 — 1,446,354 Other assets 68,346 1,717,934 33,425 (81,776 ) 1,737,929 Total assets $ 2,722,018 $ 3,500,733 $ 98,035 $ (2,735,529 ) $ 3,585,257 Current liabilities $ 15,439 $ 182,755 $ 26,881 $ — $ 225,075 Intercompany payables — 341,713 — (341,713 ) — Long-term debt, less current maturities 1,848,573 350,008 25,473 — 2,224,054 Deferred income tax liabilities — 333,754 — (81,776 ) 251,978 Other accrued liabilities 4,083 20,792 5,340 — 30,215 Stockholders’ equity 853,923 2,271,711 40,341 (2,312,040 ) 853,935 Total liabilities and stockholders’ equity $ 2,722,018 $ 3,500,733 $ 98,035 $ (2,735,529 ) $ 3,585,257 Balance Sheet Eldorado Resorts, Inc. (Parent Obligor) Guarantor Subsidiaries Non-Guarantor Subsidiaries Consolidating and Eliminating Entries Eldorado Resorts, Inc. Consolidated Current assets $ 1,800 $ 99,554 $ 399 $ — $ 101,753 Intercompany receivables 388,050 — 1,186 (389,236 ) — Investments in subsidiaries 299,437 808,923 — (1,108,360 ) — Property and equipment, net 1,965 610,377 — — 612,342 Other assets 50,591 585,892 11 (56,545 ) 579,949 Total assets $ 741,843 $ 2,104,746 $ 1,596 $ (1,554,141 ) $ 1,294,044 Current liabilities $ 22,759 $ 79,265 $ 16 $ — $ 102,040 Intercompany payables — 389,236 — (389,236 ) — Long-term debt, less current maturities 420,633 375,248 — — 795,881 Deferred income tax liabilities — 146,930 — (56,545 ) 90,385 Other accrued liabilities 12 7,275 — — 7,287 Stockholders’ equity 298,439 1,106,792 1,580 (1,108,360 ) 298,451 Total liabilities and stockholders’ equity $ 741,843 $ 2,104,746 $ 1,596 $ (1,554,141 ) $ 1,294,044 Eldorado Resorts, Inc. (Parent Obligor) Guarantor Subsidiaries Non-Guarantor Subsidiaries Consolidating and Eliminating Entries Eldorado Resorts, Inc. Consolidated Revenues: Gaming and pari-mutuel commissions $ — $ 820,452 $ 15,326 $ — $ 835,778 Non-gaming — 248,034 4,942 — 252,976 Gross revenues — 1,068,486 20,268 — 1,088,754 Less promotional allowances — (86,858 ) (918 ) — (87,776 ) Net revenues — 981,628 19,350 — 1,000,978 Operating expenses: Gaming and pari-mutuel commissions — 427,680 10,656 — 438,336 Non-gaming — 109,518 649 — 110,167 Marketing and promotions — 53,401 1,444 — 54,845 General and administrative — 152,717 3,061 — 155,778 Corporate 21,413 (1,791 ) 2,112 — 21,734 Management fee (20,064 ) 19,564 500 — — Depreciation and amortization 635 68,767 233 — 69,635 Total operating expenses 1,984 829,856 18,655 — 850,495 Loss on sale of asset or disposal of property (21 ) (30 ) — — (51 ) Acquisition charges (69,628 ) (19,544 ) — — (89,172 ) Equity in loss of unconsolidated affiliate — (305 ) — — (305 ) Operating (loss) income (71,633 ) 131,893 695 — 60,955 Interest expense, net (49,576 ) (19,110 ) (694 ) — (69,380 ) Loss on early retirement of debt, net (37,347 ) — — — (37,347 ) Subsidiary income (loss) 77,197 — — (77,197 ) — (Loss) income before income taxes (81,359 ) 112,783 1 (77,197 ) (45,772 ) Income tax benefit (provision) 64,455 (36,896 ) 66 — 27,625 Income (loss) from continuing operations (16,904 ) 75,887 67 (77,197 ) (18,147 ) Income from discontinued operations, net of taxes 1,150 1,243 — — 2,393 Net income (loss) $ (15,754 ) $ 77,130 $ 67 $ (77,197 ) $ (15,754 ) Eldorado Resorts, Inc. (Parent Obligor) Guarantor Subsidiaries Non-Guarantor Subsidiaries Consolidating and Eliminating Entries Eldorado Resorts, Inc. Consolidated Revenues: Gaming and pari-mutuel commissions $ — $ 539,010 $ 235 $ — $ 539,245 Non-gaming — 216,473 99 — 216,572 Gross revenues — 755,483 334 — 755,817 Less promotional allowances — (69,371 ) — — (69,371 ) Net revenues — 686,112 334 — 686,446 Operating expenses: Gaming and pari-mutuel commissions — 307,669 — — 307,669 Non-gaming — 104,611 — — 104,611 Marketing and promotions — 30,661 3 — 30,664 General and administrative — 98,129 — — 98,129 Corporate 15,414 270 — — 15,684 Management fee (15,496 ) 15,496 — — — Depreciation and amortization 330 47,267 — — 47,597 Total operating expenses 248 604,103 3 — 604,354 Loss on sale of asset or disposal of property — (740 ) — — (740 ) Acquisition charges (5,326 ) — — — (5,326 ) Equity in income of unconsolidated affiliates — — — — — Operating (loss) income (5,574 ) 81,269 331 — 76,026 Interest expense, net (18,607 ) (19,768 ) — (38,375 ) Loss on early retirement of debt (155 ) — — — (155 ) Subsidiary income (loss) 61,814 — (61,814 ) — Income (loss) before income taxes 37,478 61,501 331 (61,814 ) 37,496 Income tax (provision) benefit (13,636 ) (18 ) — — (13,654 ) Net income (loss) $ 23,842 $ 61,483 $ 331 $ (61,814 ) $ 23,842 Eldorado Resorts, Inc. (Parent Obligor) Guarantor Subsidiaries Non-Guarantor Subsidiaries Consolidating and Eliminating Entries Eldorado Resorts, Inc. Consolidated Net cash (used in) provided by operating activities $ (64,426 ) $ 131,253 $ 5,004 $ — $ 71,831 INVESTING ACTIVITIES: Purchase of property and equipment, net (4,128 ) (48,690 ) (363 ) — (53,181 ) Reimbursement of capital expenditures from West Virginia regulatory authorities — 251 — — 251 Restricted cash — 1,649 (32 ) — 1,617 Net cash (used in) provided by business combinations (1,385,978 ) 37,103 5,216 — (1,343,659 ) Net cash used in investing activities (1,390,106 ) (9,687 ) 4,821 — (1,394,972 ) FINANCING ACTIVITIES: Proceeds from issuance of New Term Loan 1,450,000 — — — 1,450,000 Proceeds from issuance of 6% Senior Notes 875,000 — — — 875,000 Proceeds from issuance of New Revolving Credit Facility 166,953 — — — 166,953 Payments on Term Loan (1,062 ) — — — (1,062 ) Payments on New Term Loan (448,125 ) — — — (448,125 ) Payments under New Revolving Credit Facility (166,953 ) — — — (166,953 ) Borrowings under Revolving Credit Facility 41,000 — — — 41,000 Payments under Revolving Credit Facility (29,000 ) — — — (29,000 ) Retirement of Term Loan (417,563 ) — — — (417,563 ) Retirement of Revolving Credit Facility (41,000 ) — — — (41,000 ) Debt premium proceeds 27,500 — — — 27,500 Payment of other long-term obligation (23 ) — — — (23 ) Payments on capital leases — (242 ) (105 ) — (347 ) Debt issuance costs (51,338 ) — — — (51,338 ) Taxes paid related to net share settlement of equity awards (10,927 ) — — — (10,927 ) Net proceeds from (payments to) related parties 72,129 (67,904 ) (4,225 ) — — Proceeds from exercise of stock options 2,900 — — — 2,900 Net cash provided by (used in) financing activities 1,469,491 (68,146 ) (4,330 ) — 1,397,015 INCREASE IN CASH AND CASH EQUIVALENTS 14,959 53,420 5,495 — 73,874 CASH AND CASH EQUIVALENTS, BEGINNING OF YEAR 812 59,885 332 — 61,029 CASH AND CASH EQUIVALENTS, END OF YEAR $ 15,771 $ 113,305 $ 5,827 $ — $ 134,903 Eldorado Resorts, Inc. (Parent Obligor) Guarantor Subsidiaries Non-Guarantor Subsidiaries Consolidating and Eliminating Entries Eldorado Resorts, Inc. Consolidated Net cash (used in) provided by operating activities $ (26,531 ) $ 98,763 $ 18 $ $ 72,250 INVESTING ACTIVITIES: Purchase of property and equipment, net 6 (32,945 ) (10 ) — (32,949 ) Reimbursement of capital expenditures from West Virginia regulatory authorities — 4,113 — — 4,113 Proceeds from sale of property and equipment — 1,560 — — 1,560 Net cash used in business combinations (491 ) — — — (491 ) Increase in other assets — 564 — — 564 Net cash used in investing activities (485 ) (26,708 ) (10 ) — (27,203 ) FINANCING ACTIVITIES: Payments under Term Loan (3,188 ) — — — (3,188 ) Payments under Revolving Credit Facility (74,500 ) — — — (74,500 ) Payments on capital leases — (204 ) — — (204 ) Debt issuance costs (463 ) — — — (463 ) Taxes paid related to net share settlement of equity awards (1,366 ) — — — (1,366 ) Proceeds from exercise of stock options 1,005 — — — 1,005 Net payments to related parties 108,181 (108,249 ) 68 — — Net cash provided by (used in) financing activities 29,669 (108,453 ) 68 — (78,716 ) INCREASE (DECREASE) IN CASH AND CASH EQUIVALENTS 2,653 (36,398 ) 76 — (33,669 ) CASH AND CASH EQUIVALENTS, BEGINNING OF YEAR 657 77,453 168 — 78,278 CASH AND CASH EQUIVALENTS, END OF YEAR $ 3,310 $ 41,055 $ 244 $ — $ 44,609 Key Performance Metrics The key metrics we utilize to measure our profitability and performance are Adjusted EBITDA and Adjusted EBITDA margin. Results of Operations Three Months Ended Nine Months Ended September 30, September 30, 2017 2016 % Change 2017 2016 % Change Net revenues $ 444,874 $ 241,565 84.2 % $ 1,000,978 $ 686,446 45.8 % Operating income 78,924 28,109 180.8 % 60,955 76,026 (19.8 ) % Net income (loss) 29,554 9,682 205.2 % (15,754 ) 23,842 (166.1 ) % Net Revenues for the Three Months Ended September 30, Net Revenues for the Nine Months Ended September 30, 2017 2016 2017 2016 West $ 132,775 $ 89,676 $ 293,528 $ 246,608 Midwest 103,510 — 171,015 — South 81,696 33,984 183,425 100,514 East 126,720 117,905 352,644 339,324 Corporate 173 — 366 — Total $ 444,874 $ 241,565 $ 1,000,978 $ 686,446 Operating Income (Loss) for the Three Months Ended September 30, Operating Income (Loss) for the Nine Months Ended September 30, 2017 2016 2017 2016 West $ 32,556 $ 15,606 $ 50,507 $ 34,825 Midwest 24,261 — 39,669 — South 11,293 6,703 28,280 18,746 East 21,140 15,102 54,333 43,767 Corporate (10,326 ) (9,302 ) (111,834 ) (21,312 ) Total $ 78,924 $ 28,109 $ 60,955 $ 76,026 Three Months Ended September 30, 2017 2016 Variance Percent Revenues: Gaming and Pari-Mutuel Commissions: West $ 83,166 $ 48,067 $ 35,099 73.0 % Midwest 96,330 — 96,330 100.0 % South 76,279 31,505 44,774 142.1 % East 117,317 108,559 8,758 8.1 % Total Gaming and Pari-Mutuel Commissions 373,092 188,131 184,961 98.3 % Non-gaming: West 67,185 54,126 13,059 24.1 % Midwest 14,161 — 14,161 100.0 % South 14,261 9,810 4,451 45.4 % East 14,164 14,189 (25 ) (0.2 ) % Corporate 173 — 173 100.0 % Total Non-gaming 109,944 78,125 31,819 40.7 % Total Gross Revenues 483,036 266,256 216,780 81.4 % Promotional allowances: West (17,576 ) (12,517 ) 5,059 40.4 % Midwest (6,981 ) — 6,981 100.0 % South (8,844 ) (7,331 ) 1,513 20.6 % East (4,761 ) (4,843 ) (82 ) (1.7 ) % Total Promotional Allowances (38,162 ) (24,691 ) 13,471 54.6 % Total Net Revenues 444,874 241,565 203,309 84.2 % Expenses: Gaming and Pari-Mutuel Commissions: West 33,650 21,536 12,114 56.3 % Midwest 42,681 — 42,681 100.0 % South 39,243 17,143 22,100 128.9 % East 73,817 68,099 5,718 8.4 % Total Gaming and Pari-Mutuel Commissions 189,391 106,778 82,613 77.4 % Non-gaming West 29,317 25,862 3,455 13.4 % Midwest 4,667 — 4,667 100.0 % South 4,450 1,762 2,688 152.6 % East 5,953 8,676 (2,723 ) (31.4 ) % Total Non-gaming 44,387 36,300 8,087 22.3 % Marketing and promotions 24,634 11,323 13,311 117.6 % General and administrative 68,585 34,094 34,491 101.2 % Corporate 7,718 4,426 3,292 74.4 % Depreciation and amortization 29,122 15,810 13,312 84.2 % Total Operating Expenses $ 363,837 $ 208,731 $ 155,106 74.3 % Nine Months Ended September 30, 2017 2016 Variance Percent Revenues: Gaming and Pari-Mutuel Commissions: West $ 178,390 $ 132,480 $ 45,910 34.7 % Midwest 159,010 — 159,010 100.0 % South 170,712 92,702 78,010 84.2 % East 327,666 314,063 13,603 4.3 % Total Gaming and Pari-Mutuel Commissions 835,778 539,245 296,533 55.0 % Non-gaming: West 155,417 148,475 6,942 4.7 % Midwest 23,693 — 23,693 100.0 % South 35,758 28,801 6,957 24.2 % East 37,742 39,296 (1,554 ) (4.0 ) % Corporate 366 — 366 100.0 % Total Non-gaming 252,976 216,572 36,404 16.8 % Total Gross Revenues 1,088,754 755,817 332,937 44.0 % Promotional allowances: West (40,279 ) (34,347 ) 5,932 17.3 % Midwest (11,688 ) — 11,688 100.0 % South (23,045 ) (20,989 ) 2,056 9.8 % East (12,764 ) (14,035 ) (1,271 ) (9.1 ) % Total Promotional Allowances (87,776 ) (69,371 ) 18,405 26.5 % Total Net Revenues 1,000,978 686,446 314,532 45.8 % Expenses: Gaming and Pari-Mutuel Commissions: West 75,393 61,196 14,197 23.2 % Midwest 70,561 — 70,561 100.0 % South 88,577 50,585 37,992 75.1 % East 203,805 195,888 7,917 4.0 % Total Gaming and Pari-Mutuel Commissions 438,336 307,669 130,667 42.5 % Non-gaming West 74,815 75,760 (945 ) (1.2 ) % Midwest 7,779 — 7,779 100.0 % South 10,184 5,482 4,702 85.8 % East 17,389 23,369 (5,980 ) (25.6 ) % Total Non-gaming 110,167 104,611 5,556 5.3 % Marketing and promotions 54,845 30,664 24,181 78.9 % General and administrative 155,778 98,129 57,649 58.7 % Corporate 21,734 15,684 6,050 38.6 % Depreciation and amortization 69,635 47,597 22,038 46.3 % Total Operating Expenses $ 850,495 $ 604,354 $ 246,141 40.7 % Corporate & Other Three Months Ended September 30, 2017 Operating Income (Loss) Depreciation and Amortization Stock-Based Compensation Transaction Expenses Severance Expense Other (6) Adjusted EBITDA West $ 32,556 $ 7,654 $ 67 $ — $ 59 $ 43 $ 40,379 Midwest 24,261 7,995 67 — 133 (9 ) 32,447 South 11,293 6,055 29 — 220 5 17,602 East 21,140 6,732 5 — 64 (39 ) 27,902 Corporate (10,326 ) 686 1,207 2,094 — 72 (6,267 ) Total $ 78,924 $ 29,122 $ 1,375 $ 2,094 $ 476 $ 72 $ 112,063 Three Months Ended September 30, 2016 Operating Income (Loss) Depreciation and Amortization Stock-Based Compensation Transaction Expenses Severance Expense Other (6) Adjusted EBITDA Excluding Pre-Acquisition: West $ 15,606 $ 4,864 $ — $ — $ 153 $ (12 ) $ 20,611 Midwest — — — — — — — South 6,703 1,973 — — — — 8,676 East 15,102 8,847 — — 263 (70 ) 24,142 Corporate (9,302 ) 126 717 4,750 — — (3,709 ) Total Excluding Pre-Acquisition $ 28,109 $ 15,810 $ 717 $ 4,750 $ 416 $ (82 ) $ 49,720 Pre-Acquisition (3): West $ 7,160 $ 2,236 $ 6 $ — $ — $ — $ 9,402 Midwest 22,536 10,058 41 — — (952 ) 31,683 South 7,378 4,269 21 — — — 11,668 East (917 ) 694 — — — — (223 ) Corporate (8,115 ) 322 1,200 805 — — (5,788 ) Total Pre-Acquisition $ 28,042 $ 17,579 $ 1,268 $ 805 $ — $ (952 ) $ 46,742 Including Pre-Acquisition: West $ 22,766 $ 7,100 $ 6 $ — $ 153 $ (12 ) $ 30,013 Midwest 22,536 10,058 41 — — (952 ) 31,683 South 14,081 6,242 21 — — — 20,344 East 14,185 9,541 — — 263 (70 ) 23,919 Corporate (17,417 ) 448 1,917 5,555 — — (9,497 ) Total Including Pre-Acquisition (2) $ 56,151 $ 33,389 $ 1,985 $ 5,555 $ 416 $ (1,034 ) $ 96,462 Nine Months Ended September 30, 2017 Operating Income (Loss) Depreciation and Amortization Stock-Based Compensation Transaction Expenses Severance Expense Other (6) Adjusted EBITDA Excluding Pre-Acquisition: West $ 50,507 $ 18,868 $ 119 $ — $ 255 $ 16 $ 69,765 Midwest 39,669 12,961 153 — 135 (2 ) 52,916 South 28,280 12,649 70 — 223 5 41,227 East 54,333 23,885 9 — 86 206 78,519 Corporate (111,834 ) 1,272 4,063 89,172 289 50 (16,988 ) Total Excluding Pre-Acquisition $ 60,955 $ 69,635 $ 4,414 $ 89,172 $ 988 $ 275 $ 225,439 Pre-Acquisition (1): West $ 9,525 $ 3,694 $ 8 $ — $ — $ 4 $ 13,231 Midwest 34,819 11,952 51 — 5 29 46,856 South 19,165 5,694 26 — — 33 24,918 East (1,072 ) 952 — — — — (120 ) Corporate (8,811 ) 371 1,631 286 549 (22 ) (5,996 ) Total Pre-Acquisition $ 53,626 $ 22,663 $ 1,716 $ 286 $ 554 $ 44 $ 78,889 Including Pre-Acquisition: West $ 60,032 $ 22,562 $ 127 $ — $ 255 $ 20 $ 82,996 Midwest 74,488 24,913 204 — 140 27 99,772 South 47,445 18,343 96 — 223 38 66,145 East 53,261 24,837 9 — 86 206 78,399 Corporate (120,645 ) 1,643 5,694 89,458 838 28 (22,984 ) Total Including Pre-Acquisition (2) $ 114,581 $ 92,298 $ 6,130 $ 89,458 $ 1,542 $ 319 $ 304,328 Nine Months Ended September 30, 2016 Operating Income (Loss) Depreciation and Amortization Stock-Based Compensation Transaction Expenses (5) Severance Expense Other (4)(6) Adjusted EBITDA Excluding Pre-Acquisition: West $ 34,825 $ 15,373 $ — $ — $ 153 $ 168 $ 50,519 Midwest — — — — — — — South 18,746 5,883 — — — (50 ) 24,579 East (4) 43,767 25,990 — — 264 1,066 71,087 Corporate (21,312 ) 351 2,749 5,324 1,461 (49 ) (11,476 ) Total Excluding Pre-Acquisition $ 76,026 $ 47,597 $ 2,749 $ 5,324 $ 1,878 $ 1,135 $ 134,709 Pre-Acquisition (3): West $ 20,269 $ 6,528 $ 32 $ — $ — $ — $ 26,829 Midwest 65,403 29,034 129 — — (247 ) 94,319 South 33,557 12,525 69 — — — 46,151 East (3,460 ) 2,861 — — — — (599 ) Corporate (23,635 ) 1,118 3,058 805 870 — (17,784 ) Total Pre-Acquisition $ 92,134 $ 52,066 $ 3,288 $ 805 $ 870 $ (247 ) $ 148,916 Including Pre-Acquisition: West $ 55,094 $ 21,901 $ 32 $ — $ 153 $ 168 $ 77,348 Midwest 65,403 29,034 129 — — (247 ) 94,319 South 52,303 18,408 69 — — (50 ) 70,730 East (4) 40,307 28,851 — — 264 1,066 70,488 Corporate (44,947 ) 1,469 5,807 6,129 2,331 (49 ) (29,260 ) Total Including Pre-Acquisition (2) $ 168,160 $ 99,663 $ 6,037 $ 6,129 $ 2,748 $ 888 $ 283,625 CEI Revolving Credit Facility, were used to tender, redeem, repurchase, defease, and/or satisfy and discharge any and all of the principal amounts, including accrued and unpaid interest, related expenses and fees of both the Year Percentage 2018 105.250 % 2019 103.500 % 2020 101.750 % 2021 and thereafter 100.000 % Year Percentage 2020 104.500 % 2021 103.000 % 2022 101.500 % 2023 and thereafter 100.000 % additional information regarding contractual obligations. Report. consolidated long-term debt as of March 31, 2024. As of Description of Exhibit Method of Filing Filed herewith. Filed herewith. Filed herewith. Filed herewith. Filed herewith. Filed herewith. 101.2 Inline XBRL Taxonomy Extension Schema Document Filed herewith. 101.3 Inline XBRL Taxonomy Extension Calculation Linkbase Document Filed herewith. 101.4 Inline XBRL Taxonomy Extension Definition Linkbase Document Filed herewith. 101.5 Inline XBRL Taxonomy Extension Label Linkbase Document Filed herewith. 101.6 Inline XBRL Taxonomy Extension Presentation Linkbase Document Filed herewith. Date: /s/ Statements.ELDORADO RESORTS,Statements(dollars in thousands)(In millions) March 31, 2024 December 31, 2023 ASSETS CURRENT ASSETS: Cash and cash equivalents $ 726 $ 1,005 Restricted cash 126 122 Accounts receivable, net 551 608 Inventories 44 46 Prepayments and other current assets 290 264 Total current assets 1,737 2,045 Investments in and advances to unconsolidated affiliates 157 157 Property and equipment, net 14,803 14,756 Goodwill 10,990 10,990 Intangible assets other than goodwill 4,487 4,523 Deferred tax asset 48 47 Other long-term assets, net 837 848 Total assets $ 33,059 $ 33,366 LIABILITIES AND STOCKHOLDERS’ EQUITY CURRENT LIABILITIES: Accounts payable $ 439 $ 408 Accrued interest 273 369 Accrued other liabilities 1,729 1,848 Current portion of long-term debt 94 65 Total current liabilities 2,535 2,690 Long-term financing obligations 12,793 12,759 Long-term debt 12,171 12,224 Deferred tax liability 112 102 Other long-term liabilities 860 871 Total liabilities 28,471 28,646 STOCKHOLDERS’ EQUITY: Caesars stockholders’ equity 4,404 4,552 Noncontrolling interests 184 168 Total stockholders’ equity 4,588 4,720 Total liabilities and stockholders’ equity $ 33,059 $ 33,366 condensed notes are an integral part of these consolidated condensed financial statements.(dollars in thousands, except per share data)(unaudited)Three Months Ended March 31, (In millions, except per share data) 2024 2023 NET REVENUES: Casino $ 1,535 $ 1,585 Food and beverage 422 427 Hotel 493 503 Other 292 315 Net revenues 2,742 2,830 OPERATING EXPENSES: Casino 852 828 Food and beverage 263 251 Hotel 137 137 Other 94 107 General and administrative 500 509 Corporate 78 79 Depreciation and amortization 327 300 Transaction and other costs, net 6 16 Total operating expenses 2,257 2,227 Operating income 485 603 OTHER EXPENSE: Interest expense, net (590) (594) Loss on extinguishment of debt (48) (197) Other income 26 3 Total other expense (612) (788) Loss from continuing operations before income taxes (127) (185) Benefit (provision) for income taxes (15) 49 Loss from continuing operations, net of income taxes (142) (136) Net loss (142) (136) Net income attributable to noncontrolling interests (16) — Net loss attributable to Caesars $ (158) $ (136) Net loss per share - basic and diluted: Basic loss per share $ (0.73) $ (0.63) Diluted loss per share $ (0.73) $ (0.63) Weighted average basic shares outstanding 216 215 Weighted average diluted shares outstanding 216 215 condensed notes are an integral part of these consolidated condensed financial statements.(dollars in thousands)(unaudited)Three Months Ended March 31, (In millions) 2024 2023 Net loss $ (142) $ (136) Foreign currency translation adjustments — 2 Other (1) 4 Other comprehensive income (loss), net of tax (1) 6 Comprehensive loss (143) (130) Comprehensive income attributable to noncontrolling interests (16) — Comprehensive loss attributable to Caesars $ (159) $ (130) condensed notes are an integral part of these consolidated condensed financial statements.CASH FLOWS(dollars in thousands)(unaudited)Caesars Stockholders’ Equity Preferred Stock Common Stock Treasury Stock (In millions) Shares Amount Shares Amount Paid-in Capital Accumulated Deficit Accumulated Other Comprehensive Income (Loss) Amount Noncontrolling Interests Total Stockholders’ Equity Balance, December 31, 2023 — $ — 216 $ — $ 7,001 $ (2,523) $ 97 $ (23) $ 168 $ 4,720 Stock-based compensation — — — — 25 — — — — 25 Net loss — — — — — (158) — — 16 (142) Other comprehensive loss, net of tax — — — — — — (1) — — (1) Shares withheld related to net share settlement of stock awards — — — — (14) — — — — (14) Balance, March 31, 2024 — $ — 216 $ — $ 7,012 $ (2,681) $ 96 $ (23) $ 184 $ 4,588 Balance, December 31, 2022 — $ — 215 $ — $ 6,953 $ (3,309) $ 92 $ (23) $ 38 $ 3,751 Stock-based compensation — — — — 27 — — — — 27 Net loss — — — — — (136) — — — (136) Other comprehensive income, net of tax — — — — — — 6 — — 6 Shares withheld related to net share settlement of stock awards — — — — (13) — — — — (13) Balance, March 31, 2023 — $ — 215 $ — $ 6,967 $ (3,445) $ 98 $ (23) $ 38 $ 3,635 condensed notes are an integral part of these consolidated condensed financial statements.
The accompanying notes are an integral part of these consolidated condensed financial statements.Three Months Ended March 31, (In millions) 2024 2023 CASH FLOWS FROM OPERATING ACTIVITIES: Net loss $ (142) $ (136) Adjustments to reconcile net loss to net cash provided by operating activities: Depreciation and amortization 327 300 Amortization of deferred financing costs and discounts 45 55 Provision for doubtful accounts 10 4 Loss on extinguishment of debt 48 197 Non-cash lease amortization 7 15 (Gain) loss on investments (1) 5 Stock compensation expense 25 27 Loss on sale of business and disposal of property and equipment 1 2 Deferred income taxes 15 (50) Other non-cash adjustments to net loss (25) — Change in operating assets and liabilities: Accounts receivable 47 40 Prepaid expenses and other assets (27) (21) Income taxes receivable and payable, net (3) (1) Accounts payable, accrued expenses and other liabilities (247) (263) Net cash provided by operating activities 80 174 CASH FLOWS FROM INVESTING ACTIVITIES: Purchase of property and equipment (264) (272) Proceeds from sale of business, property and equipment, net of cash sold — 1 Other — 40 Net cash used in investing activities (264) (231) CASH FLOWS FROM FINANCING ACTIVITIES: Proceeds from long-term debt and revolving credit facilities 4,825 4,700 Repayments of long-term debt and revolving credit facilities (4,828) (4,630) Financing obligation payments — (1) Debt issuance and extinguishment costs (77) (79) Taxes paid related to net share settlement of equity awards (14) (13) Net cash used in financing activities (94) (23) Decrease in cash, cash equivalents and restricted cash (278) (80) Cash, cash equivalents and restricted cash, beginning of period 1,143 1,303 Cash, cash equivalents and restricted cash, end of period $ 865 $ 1,223 RECONCILIATION OF CASH, CASH EQUIVALENTS AND RESTRICTED CASH TO AMOUNTS REPORTED WITHIN THE CONSOLIDATED CONDENSED BALANCE SHEETS: Cash and cash equivalents $ 726 $ 965 Restricted cash 126 155 Restricted and escrow cash included in other assets, net 13 103 Total cash, cash equivalents and restricted cash $ 865 $ 1,223 SUPPLEMENTAL DISCLOSURE OF CASH FLOW INFORMATION: Cash interest paid for debt $ 327 $ 295 Cash interest paid for rent related to financing obligations 330 320 Income taxes paid, net 3 2 NON-CASH INVESTING AND FINANCING ACTIVITIES: Payables for capital expenditures 245 148 UNAUDITED CONSOLIDATED CONDENSED FINANCIAL STATEMENTSNote 1. Organization and Basis of PresentationOrganizationunaudited consolidated condensed financial statements include the accounts of Eldorado Resorts,Caesars Entertainment, Inc. (“ERI” or the “Company”), a NevadaDelaware corporation, formed in September 2013, and its consolidated subsidiaries. subsidiaries which may be referred to as the “Company,” “CEI,” “Caesars,” “we,” “our,” or “us” within these financial statements.acquired Mountaineer, Presque Isle Downsis a geographically diversified gaming and Scioto Downshospitality company that was founded in September 2014 pursuant to1973 by the Carano family with the opening of the Eldorado Hotel Casino in Reno, Nevada. Beginning in 2005, the Company grew through a merger (the “MTR Merger”) withseries of acquisitions, including the acquisition of MTR Gaming Group, Inc. (“MTR Gaming”) and in November 2015 it acquired Circus Reno and the interests in the Silver Legacy that it did not own prior to such date (the “Reno Acquisition”).Throughout the three and nine months ended September 30, 2017, ERI owned and operated the following properties:Eldorado Resort Casino Reno (“Eldorado Reno”)—A 814-room hotel, casino and entertainment facility connected via an enclosed skywalk to Silver Legacy and Circus Reno located in downtown Reno, Nevada that includes 1,125 slot machines and 46 table games;Silver Legacy Resort Casino (“Silver Legacy”)—A 1,711-room themed hotel and casino connected via an enclosed skywalk to Eldorado Reno and Circus Reno that includes 1,187 slot machines, 63 table games and a 13 table poker room;Circus Circus Reno (“Circus Reno”)—A 1,571-room hotel-casino and entertainment complex connected via an enclosed skywalk to Eldorado Reno and Silver Legacy that includes 720 slot machines and 26 table games;Eldorado Resort Casino Shreveport (“Eldorado Shreveport”)—A 403-room, all suite art deco-style hotel and tri-level riverboat dockside casino situated on the Red River in Shreveport, Louisiana that includes 1,397 slot machines, 52 table games and an eight table poker room;Mountaineer Casino, Racetrack & Resort (“Mountaineer”)—A 357-room hotel, casino and entertainment facility and live thoroughbred horse racing located on the Ohio River at the northern tip of West Virginia’s northwestern panhandle that includes 1,505 slot machines, 36 table games and a 10 table poker room;Presque Isle Downs & Casino (“Presque Isle Downs”)—A casino and live thoroughbred horse racing facility with 1,596 slot machines, 32 table games and a seven table poker room located in Erie, Pennsylvania; andEldorado Gaming Scioto Downs (“Scioto Downs”)—A modern “racino” offering 2,245 video lottery terminals (“VLT”), harness racing and a 118-room third party hotel connected to Scioto Downs located 15 minutes from downtown Columbus, Ohio.In addition, on May 1, 2017, the Company consummated its acquisition of2014, Isle of Capri Casinos, Inc. in 2017, Tropicana Entertainment, Inc. in 2018, Caesars Entertainment Corporation in 2020 and acquiredWilliam Hill PLC in 2021. The Company’s ticker symbol on the following properties:Isle Casino Hotel—Black Hawk (“Isle Black Hawk”)—A land-based casino onThe Company owns, leases, brands or manages an aggregate of 53 domestic properties in 18 states with approximately 10-acre site in Black Hawk, Colorado that includes 99350,500 slot machines, 27 table games, a nine table poker roomvideo lottery terminals and a 238-room hotel;Lady Luck Casino—Black Hawk (“Lady Luck Black Hawk”)—A land-based casino across the intersection from Isle Casino Hotel in Black Hawk, Colorado, that includes 430 slot machines, 10 table games, five poker tables and a 164-room hotel with a parking structure connecting Isle Casino Hotel-Black Hawk and Lady Luck Casino-Black Hawk;Isle Casino Racing Pompano Park (“Pompano”)—A casino and harness racing track on ane-tables, approximately 223-acre owned site in Pompano Beach, Florida, that includes 1,459 slot machines and a 45 table poker room;Isle Casino Bettendorf (“Bettendorf”)—A land-based single-level casino located off of Interstate 74 in Bettendorf, Iowa that includes 978 slot machines and 20 table games with two hotel towers with 509 hotel rooms;Isle Casino Waterloo (“Waterloo”)—A single-level land-based casino in Waterloo, Iowa that includes 940 slot machines, 252,700 table games and a 194-room hotel;Isleapproximately 45,000 hotel rooms as of Capri Casino Hotel Lake Charles (“Lake Charles”)—AMarch 31, 2024. In addition, the Company has other properties in North America that are authorized to use the brands and marks of Caesars Entertainment, Inc., as well as other non-gaming properties. The Company’s primary source of revenue is generated by its casino properties’ gaming vessel on an approximately 19 acre site in Lake Charles, Louisiana, with 1,160 slot machines, 49 table games, including 13 poker tablesoperations, which includes retail and twoonline sports betting and online gaming, and the Company utilizes its hotels, offering 493 rooms;Isle of Capri Casino Lula (“Lula”)—Two dockside casinos in Lula, Mississippi with 879 slot machines and 20 table games, two on-site hotels with a total of 486 rooms and a 28-space RV Park;•Lady Luck Casino Vicksburg (“Vicksburg”)—A dockside casino in Vicksburg, Mississippi that includes 619 slot machines, nine table games and a hotel with a total of 89 rooms;Isle of Capri Casino Boonville (“Boonville”)—A single-level dockside casino in Boonville, Missouri that includes 893 slot machines, 20 table games and a 140-room hotel;Isle Casino Cape Girardeau (“Cape Girardeau”)—A dockside casino and pavilion andrestaurants, bars, entertainment, center in Cape Girardeau, Missouri that includes 881 slot machines, 20 table games and four poker tables;Lady Luck Casino Caruthersville (“Caruthersville”)—A riverboat casino located along the Mississippi River in Caruthersville, Missouri that includes 513 slot machines and nine table games;Isle of Capri Casino Kansas City (“Kansas City”)—A dockside casino located close to downtown Kansas City, Missouri offering 967 slot machines and 18 table games; andLady Luck Casino Nemacolin (“Nemacolin”)—A casino property located on the 2,000-acre Nemacolin Woodlands Resort in Western Pennsylvania that includes 600 slot machines and 28 table games.On August 22, 2016, Isle entered into an agreement to sell Lake Charles for aggregate consideration of $134.5 million, subject to certain adjustments. The transaction (the “Lake Charles Disposition”) remains subject to Louisiana Gaming Control Board approvalracing, retail shops and other customary closing conditionsservices to attract customers to its properties.if obtained,online sports betting, iGaming, horse racing and online poker are included under the transaction is expected to be completed by DecemberCaesars Digital segment. The Company operates the Caesars Sportsbook app, the Caesars Racebook app and the recently launched Caesars Palace Online Casino app. The Company operates retail and online sports wagering in 31 2017.Acquisitionjurisdictions in North America, 26 of Isle of Capri Casinos, Inc.On May 1, 2017 (the “Isle Acquisition Date”), the Company completed its acquisition of Isle of Capri Casinos, Inc. pursuant to the Agreementwhich offer online sports betting, and Plan of Merger (the “Merger Agreement”) datedoperates iGaming in five jurisdictions in North America as of September 19, 2016 with Isle of Capri Casinos, Inc., a Delaware corporation (“Isle” or “Isle of Capri”), Eagle I Acquisition Corp., a Delaware corporation and a direct wholly-owned subsidiary of theMarch 31, 2024. The Company and Eagle II Acquisition Company LLC, a Delaware limited liability company and a direct wholly-owned subsidiary of the Company (the “Isle Acquisition” or the “Isle Merger”). As a result of the Isle Merger, Isle became a wholly-owned subsidiary of ERI and, at the effective time of the Isle Merger, each outstanding share of Isle’s stock converted into the rightexpects to receive $23.00 in cash or 1.638 shares of ERI common stock (the “Stock Consideration”), at the election of the applicable Isle shareholder and subjectcontinue to proration such that the outstanding shares of Isle common stock were exchanged for aggregate consideration comprised of 58% cash, or $552.0 million, and 42% ERI common stock, or 28.5 million newly issued shares of ERI common stock. The total purchase consideration was $1.93 billion (See Note 2).In connection with the Isle Acquisition, the Company completed a debt financing transaction comprised of: (a) a senior secured credit facility in an aggregate principal amount of $1.75 billion with a (i) term loan facility of $1.45 billion and (ii) revolving credit facility of $300.0 million and (b) $375.0 million of senior unsecured notes. The proceeds of such borrowings were used (v) to pay the cash portion of the consideration payable grow its operations in the Isle Merger, (w) refinance all of Isle’s existing credit facilities, (x) redeem or otherwise repurchase all of Isle’s seniorCaesars Digital segment as new jurisdictions legalize retail and senior subordinated notes, (y) refinance the Company’s existing credit facilityonline sports betting and (z) pay transaction fees and expenses related to the foregoing (See iGaming.7 for further discussion of the refinancing transaction and terms of such indebtedness).Acquisition charges attributed to the Isle Acquisition are reported on the accompanying statement of operations related to legal, accounting, financial advisory services, severance, stock awards and other costs totaling $2.1 million and $89.2 million for the three and nine months ended September 30, 2017, respectively, and $4.7 million for the three and nine months ended September 30, 2016. As of September 30, 2017, $0.2 million of accrued costs and expenses related to the Isle Acquisition are included in accrued other liabilities. Additionally, we recognized a loss of $27.3 million for the nine months ended September 30, 2017 related to the extinguishment of Isle debt and the payment of interest and call premiums in conjunction with the Isle Acquisition.The presentation of information herein for periods prior to the Isle Acquisition Date and after the Isle Acquisition Date are not fully comparable because the results of operations for Isle are not included for periods prior to the Isle Acquisition Date. Summary financial results of Isle for the three and nine months ended January 22, 2017 are included in Isle’s Quarterly Report on Form 10-Q as filed with the Securities and Exchange Commission (“SEC”). In conjunction with the Isle Acquisition, Isle is no longer required to file quarterly and annual reports with the SEC, and terminated its registration on May 11, 2017.ReclassificationsCertain reclassifications of prior year presentations have been made to conform to the current period presentation.consolidated financial statementsFinancial Statements of the Company and its subsidiaries have been prepared in accordance with accounting principles generally accepted in the United States (“GAAP”) for interim financial information with the instructions for Form 10-Q and Article 10 of Regulation S-X. Accordingly, they do not include all of the information and notes required by US GAAP for complete financial statements. In the opinion of management, the accompanying unaudited consolidated financial statementsFinancial Statements contain all adjustments, all of which are normal and recurring, considered necessary for a fair presentation and have been included herein.presentation. The results of operations for these interim periods are not necessarily indicative of the operating results for other quarters, for the full year or any future period.executive decision makerpresentation of financial information herein for the periods after our completed divestiture of Rio All-Suite Hotel & Casino in the third quarter of 2023 is not fully comparable to the periods prior to such divestiture.reviews operating results, assesses performance and makes decisions on a “significant market” basis. The Company’s management views eachmeasures certain of its properties as an operating segment. Operating segments are aggregated based on their similar economic characteristics, types of customers, types of servicesfinancial assets and products provided, the regulatory environments in which they operate, and their management and reporting structure. Prior to the Isle Acquisition, the Company’s principal operating activities occurred in three geographic regions: Nevada, Louisiana and parts of the eastern United States. The Company aggregated its operations into three reportable segments based on the similar characteristics of the operating segments within the regions in which they operated. Following the Isle Acquisition, the Company’s principal operating activities occur in four geographic regions and reportable segments based on the similar characteristics of the operating segments within the regions in which the Company operates: West, Midwest, South, and East (See Note 12 for the list of properties included in each segment for the three and nine months ended September 30, 2017 and 2016).These unaudited consolidated financial statements should be read in conjunction with the consolidated financial statements and notes thereto included in the Company’s Annual Report on Form 10-K for the year ended December 31, 2016.Summary of Significant Accounting Policies - UpdatesMarketable securities consist primarily of trading securities held by the Company’s captive insurance subsidiary. The trading securities are primarily debt and equity securities that are purchased with the intention to resell in the near term. The trading securities are carriedliabilities at fair value, with changes in fair value recognized in current period income in the accompanying statements of operations. This accounting policy was implemented as of the Isle Acquisition Date.Recently Issued Accounting Pronouncements – New DevelopmentsIn May 2017, the Financial Accounting Standards Board (“FASB”) issued Accounting Standards Update (“ASU”) No. 2017-09, which amends the scope of modification accounting for share-based payment arrangements. An entity should account for the effects of a modification unless the fair value, vesting conditions, and classification of the awards are the same immediately before and after the modification. The standard is effective for the financial statements issued for annual periods and interim periods within those annual periods, beginning after December 15, 2017, and early adoption is permitted. We anticipate adopting this accounting standard during the first quarter of 2018, and are evaluating the impact on our consolidated financial statements.In May 2014 (amended January 2017), FASB issued ASU No. 2014‑09, “Revenue from Contracts with Customers,” which provides guidance for revenue recognition. The new standard outlines a single comprehensive model for entities to use in accounting for revenue arising from contracts with customers and eliminates existing industry guidance, including revenue recognition guidance specific to the gaming industry. The FASB has also recently issued several amendments to the standard, including narrow-scope improvements and practical expedients (ASU 2016-12) and clarification on accounting for and identifying performance obligations (ASU 2016-10). The core principle of the revenue model indicates that an entity should recognize revenue to depict the transfer of promised goods or services to customers in an amount that reflects the consideration to which the entity expects to be entitled in exchange for those goods or services. The standard is designed to create greater comparability for financial statement users across industries and jurisdictions and also requires enhanced disclosures. The guidance is effective for interim and annual periods beginning after December 15, 2017, and should be applied using the full retrospective method or retrospectively with the cumulative effect initially applying the guidance recognized at the date of initial application. While early adoption is permitted for interim and annual periods beginning after December 15, 2016, we anticipate adopting this standard on January 1, 2018, on a full retrospective basis. We are currently in the process of evaluating the full impact adoption of ASU 2014‑09 (as amended) will have on our consolidated financial statements, including any new considerations with respect to the Isle Acquisition. We anticipate this new standard will likely have a material impact on our consolidated financial statements.We expect the most significant effect upon adoption of ASU 2014-09 (as amended) will likely be related to 1) the accounting for our customer loyalty program (no longer will be recorded at cost, and a deferred revenue model will likely be used to account for the classification and timing of revenue recognized, as well as the classification of related expenses for loyalty point redemptions) and 2) the elimination of promotional allowances (the presentation of goods and services provided to our customers without charge,included in gross revenue with a corresponding reduction in promotional allowances, will no longer be reported as revenue and will be recognized based on relative standalone selling prices for transactions with more than one performance obligation). As a result, we expect that our liability associated with the customer loyalty program will increase, and our gaming revenues will be significantly reduced as the goods and services provided to customers without charge that currently are included in both gross revenues and promotional allowances will be presented on a netrecurring basis, with the majority of the impact resulting in a decrease in casino revenues. The quantitative effects of these changes have not yet been fully determined and are still being analyzed.In February 2016, the FASB issued ASU No. 2016-02 which addresses the recognition and measurement of leases. Under the new guidance, for all leases (with the exception of short-term leases), at the commencement date, lessees will be required to recognize a lease liability, which is a lessee’s obligation to make lease payments arising from a lease, measured on a discounted basis, and a right-of-use (“ROU”) asset, which is an asset that represents the lessee’s right to use, or control the use of, a specified asset for the lease term. Under the new guidance, lessor accounting is largely unchanged. Further, the new lease guidance simplifies the accounting for sale and leaseback transactions primarily because lessees must recognize lease assets and liabilities, which no longer provides a source for off balance sheet financing. The effective date for this update is for the annual and interim periods beginning after December 15, 2018 with early adoption permitted. Lessees and lessors must apply a modified retrospective transition approach for leases existing at, or entered into after, the beginning of the earliest comparative period presented in the consolidated financial statements.Currently, we do not have any material capital leases nor any material operating leases where we are the lessor. Our operating leases, primarily relating to certain ground leases and slot machines or VLTs, will be recorded on the balance sheet as an ROU asset with a corresponding lease liability, which will be amortized using the effective interest rate method as payments are made. The ROU asset will be depreciated on a straight-line basis and recognized as lease expense. The qualitative and quantitative effects of adoption of ASU 2016-02 are still being analyzed, and we are in the process of evaluating the full effect the new guidance will have on our consolidated financial statements including any new considerations with respect to the Isle Acquisition.Note 2. Isle Acquisition and Preliminary Purchase Price AccountingOn May 1, 2017, the Company completed its acquisition of Isle. The total purchase consideration in the Isle Merger was determined with reference to the fair value on the date of the Merger Agreement as follows:(3)In addition to the cash paid to retire the principal amounts outstanding of Isle’s long-term debt, ERI paid $26.6 million in premiums and interest.(4)This amount represents consideration paid for the replacement of Isle’s outstanding equity awards. As discussed in Note 1, Isle’s outstanding equity awards were replaced by ERI equity awards with similar terms. A portion of the fair value of ERI awards issued represents consideration transferred, while a portion represents compensation expense based on the vesting terms of the equity awards.Preliminary Purchase Price AccountingThe following table summarizes the preliminary accounting of the estimated purchase consideration to the identifiable assets acquired and liabilities assumed in the Isle Acquisition as of the Isle Acquisition Date, with the excess recorded as goodwill. The fair values were based on management’s analysis, including preliminary work performed by third-party valuation specialists. The following table summarizes the preliminary purchase price accounting of the acquired assets and liabilities as of September 30, 2017 (dollars in thousands):Current and other assets, net$134,143Property and equipment853,331Goodwill679,656Intangible assets (i)470,811Other noncurrent assets11,025Assets held for sale143,592Total assets2,292,558Current liabilities(138,475)Deferred income taxes (ii)(187,127)Other noncurrent liabilities(26,762)Liabilities related to assets held for sale(5,449)Total liabilities(357,813)Net assets acquired$1,934,745(i)Intangible assets consist of gaming licenses, trade names, and player relationships.(ii)Deferred tax liabilities were derived based on fair value adjustments for property and equipment and identified intangibles.Valuation methodologies under both a market and income approach used for the identifiable net assets acquired in the Isle Acquisition make use of Level 1 and Level 3 inputs including quoted prices in active markets and discounted cash flows using current interest rates and are provisional pending development of a final valuation.Trade receivables and payables, inventory and other current and noncurrent assets and liabilities were valued at the existing carrying values as they represented the estimated fair value of those items at the Isle Acquisition Date, based on management’s judgement and estimates.The fair value of land was determined using the market approach, which arrives at an indication of value by comparing the site being valued to sites that have been recently acquired in arm’s-length transactions. The market data is then adjusted for any significant differences, to the extent known, between the identified comparable sites and the site being valued. Building and site improvements were valued using the cost approach using a direct cost model built on estimates of replacement cost. With respect to personal property components of the assets, personal property assets with an active and identifiable secondary market such as riverboats, gaming equipment, computer equipment and vehicles were valued using the market approach. Other personal property assets such as furniture, fixtures, computer software, and restaurant equipment were valued using the cost approach which is based on replacement or reproduction costs of the asset.The cost approach is an estimation of fair value developed by computing the current cost of replacing a property and subtracting any depreciation resulting from one or more of the following factors: physical deterioration, functional obsolescence, and/or economic obsolescence. The income approach incorporates all tangible and intangible property and served as a ceiling for the fair values of the acquired assets of the ongoing business enterprise, while still taking into account the premise of highest and best use. In the instance where the business enterprise value developed via the income approach was exceeded by the initial fair values of the underlying assets, an adjustment to reflect economic obsolescence was made to the tangible assets on a pro rata basis to reflect the contributory value of each individual asset to the enterprise as a whole.The fair value of the gaming licenses was determined using the excess earnings or replacement cost methodology based on the respective states’ legislation. The excess earnings methodology, which is an income approach methodology that allocates the projected cash flows of the business to the gaming license intangible assets less charges for the use of other identifiable assets of Isle including working capital, fixed assets and other intangible assets. This methodology was considered appropriate as the gaming licenses are the primary asset of Isle and the licenses are linked to each respective facility. Under the respective state’s gaming legislation, the property specific licenses can only be acquired if a theoretical buyer were to acquire each existing facility. The existing licenses could not be acquired and used for a different facility. The properties’ estimated future cash flows were the primary assumption in the respective valuations. Cash flow estimates included net gaming revenue, gaming operating expenses, general and administrative expenses, and tax expense. The replacement cost methodology is a cost approach methodology based on replacement or reproduction cost of the gaming license as an indicator of fair value.Trademarks are valued using the relief from royalty method, which presumes that without ownership of such trademarks, ERI would have to make a stream of payments to a brand or franchise owner in return for the right to use their name. By virtue of this asset, ERI avoids any such payments and record the related intangible value of ERI’s ownership of the brand name. The primary assumptions in the valuation included revenue, pre-tax royalty rate, and tax expense.ERI has preliminarily assigned an indefinite useful life to the gaming licenses, in accordance with its review of the applicable guidance of ASC Topic 350, “Intangibles-Goodwill and Other” (“ASC 350”). The standard required ERI to consider, among other things, the expected use of the asset, the expected useful life of other related asset or asset group, any legal, regulatory, or contractual provisions that may limit the useful life, ERI’s own historical experience in renewing similar arrangements, the effects of obsolescence, demand and other economic factors, and the maintenance expenditures required to obtain the expected cash flows. In that analysis, ERI determined that no legal, regulatory, contractual, competitive, economic or other factors limit the useful lives of these intangible assets. The acquired Isle properties currently have licenses in Pennsylvania, Iowa, Missouri, Mississippi, Florida and Colorado. The renewal of each state’s gaming license depends on a number of factors, including payment of certain fees and taxes, providing certain information to the state’s gaming regulator, and meeting certain inspection requirements. However, ERI’s historical experience has not indicated, nor does ERI expect, any limitations regarding its ability to continue to renew each license. No other competitive, contractual, or economic factor limits the useful lives of these assets. Accordingly, ERI has preliminarily concluded that the useful lives of these licenses are indefinite.For the period from the Isle Acquisition Date through September 30, 2017, Isle generated net revenue of $335.3 million and net income of $30.7 million.Unaudited Pro Forma InformationThe following unaudited pro forma information presents the results of operations of the Company for the nine months ended September 30, 2017 and 2016, which give effect to the Isle Acquisition, the Lake Charles Disposition, and Isle’s sale of the Lady Luck Casino Marquette, which closed on March 13, 2017, as if each of such transactions had occurred on January 1, 2016 (in thousands):These pro forma results do not necessarily represent the results of operations that would have been achieved if the Isle Acquisition had taken place on January 1, 2016, nor are they indicative of the results of operations for future periods. The pro forma amounts include the historical operating results of the Company and Isle prior to the Isle Acquisition, with adjustments factually supportable and directly attributable to the Isle Acquisition.Note 3. Discontinued OperationsOn August 22, 2016, Isle entered into a definitive agreement to sell its casino and hotel property in Lake Charles, Louisiana, for $134.5 million, subject to a customary purchase price adjustment, to an affiliate of Laguna Development Corporation, a Pueblo of a Laguna-owned business based in Albuquerque, New Mexico. The transaction remains subject to Louisiana Gaming Control Board approval and other customary closing conditions and, if obtained, the transaction is expected to be completed by December 31, 2017. Isle received a $20.0 million deposit related to this transaction, which is reflected in restricted cash within current assets in the consolidated balance sheet as of September 30, 2017.As of the Isle Acquisition Date, Lake Charles met the requirements for presentation as assets held for sale and discontinued operation under generally accepted accounting principles. Accordingly, the operations of Lake Charles have been classified as discontinued operations and as assets held for sale for all periods presented.The results of discontinued operations are summarized as follows (in thousands):The assets and liabilities held for sale were as follows (in thousands):September 30,2017Assets:Accounts receivable, net$632Inventories452Prepaid expenses and other833Property and equipment, net59,347Goodwill36,353Gaming licenses and other intangibles, net45,659Other assets, net220Assets held for sale$143,496Liabilities:Accounts payable$1,960Accrued payroll and related1,639Accrued property, gaming and other taxes1,181Accrued other liabilities2,010Liabilities related to assets held for sale$6,790Note 4. Stock-Based CompensationThe Board of Directors (“BOD”) adopted the Eldorado Resorts, Inc. 2015 Equity Incentive Plan (“2015 Plan”) on January 23, 2015 and our shareholders subsequently approved the adoption of the 2015 Plan on June 23, 2015. The Plan permits the granting of stock options, including incentive stock options (“ERI Stock Options”), stock appreciation rights, restricted stock or restricted stock units (“RSUs”), performance awards, and other stock-based awards and dividend equivalents. ERI Stock Options primarily vest ratably over three years and RSUs granted to employees and executive officers primarily vest and become non-forfeitable upon the third anniversary of the date of grant. RSUs granted to non-employee directors vest immediately and are delivered upon the date that is the earlier of termination of service on the BOD or the consummation of a change of control of the Company. The performance awards relate to the achievement of defined levels of performance and are generally measured over a one or two-year performance period depending upon the award agreement. If the performance award levels are achieved, the awards earned will vest and become payable at the end of the vesting period, defined as either a one or two calendar year period following the performance period. Payout ranges are from 0% up to 200% of the award target.Pursuant to the Merger Agreement, the outstanding equity awards of Isle were converted into comparable equity awards of ERI stock as follows:Isle stock options. Each option or other right to acquire Isle common stock (each an “Isle Stock Option”) that was outstanding immediately prior to the Isle Acquisition Date (whether vested or unvested), as of the Isle Acquisition Date, (i) continued to vest or accelerate (if unvested), as the case may be, in accordance with the applicable Isle stock plan, the award agreement pursuant to which such Isle Stock Option was granted and, if applicable, any other relevant agreements (such as an employment agreement), (ii) ceased to represent an option or right to acquire shares of Isle common stock, and (iii) was converted into an option or right to purchase that number of shares ERI common stock equal to the number of shares of Isle common stock subject to the Isle Stock Option multiplied by the Stock Consideration at an exercise price equal to the exercise price of the Isle Stock Option divided by the Stock Consideration,subject to the same restrictions and other terms as are set forth in the Isle equity incentive plan, the award agreement pursuant to which such Isle Stock Option was granted and, if applicable, any other relevant agreements (such as an employment agreement).Isle restricted stock awards. Each share of Isle common stock subject to vesting, repurchase or lapse restrictions (each an “Isle Restricted Share”) that was outstanding under any Isle equity plan or otherwise immediately prior to the Isle Acquisition Date, as of the Isle Acquisition Date, continued to vest or accelerate (if unvested), as the case may be, in accordance with the applicable Isle stock plan, the award agreement pursuant to which such Isle Restricted Share was granted, and, if applicable, any other relevant agreements (such as an employment agreement) and was exchanged for shares of ERI common stock (in an amount equal to the Stock Consideration, with aggregated fractional shares rounded to the nearest whole share) and remain subject to the same restrictions and other terms as are set forth in the Isle stock plan, the award agreement pursuant to which such Isle Restricted Share was granted, and, if applicable, any other relevant agreements (such as an employment agreement).Isle performance stock units. Each performance stock unit (each, an “Isle PSU”) that was outstanding immediately prior to the Isle Acquisition Date, as of the Isle Acquisition Date, (i) continued to vest or accelerate (if unvested), as the case may be, in accordance with the applicable Isle stock plan, the award agreement pursuant to which such Isle PSU was granted, and, if applicable, any other relevant agreements (such as an employment agreement), (ii) was converted into a number of performance stock units in respect of shares of ERI common stock, in an amount equal to the Stock Consideration (with aggregated fractional shares rounded to the nearest whole share) at the target level of performance, and (iii) remain subject to the same restrictions and other terms as are set forth in the Isle stock plan, the award agreement pursuant to which such Isle PSU was granted, and, if applicable, any other relevant agreements (such as an employment agreement).Isle restricted stock units. Each restricted stock unit, deferred stock unit or phantom unit in respect of a share of Isle common stock granted under the applicable Isle stock plan or otherwise, including any such units held in participant accounts under any employee benefit or compensation plan or arrangement of Isle, other than an Isle PSU (each an “Isle RSU”) that was outstanding immediately prior to the Isle Acquisition Date, as of the Isle Acquisition Date, (i) continued to vest or accelerate (if unvested), as the case may be, in accordance with the applicable Isle stock plan, the award agreement pursuant to which such Isle RSU was granted, and, if applicable, any other relevant agreements (such as an employment agreement or applicable employee benefit plan), (ii) was converted into a number of restricted stock units, deferred stock units or phantom units, as applicable, in respect of shares of ERI common stock, in an amount equal to the Stock Consideration (with aggregated fractional shares rounded to the nearest whole share), and (iii) remain subject to the same restrictions and other terms as are set forth in the Isle stock plan, the award agreement pursuant to which such Isle RSU was granted, and, if applicable, any other relevant agreements (such as an employment agreement or applicable employee benefit plan).The Company accounts for stock-based compensation in accordance with ASC Topic 718, “Compensation—Stock Compensation” (“ASC 718”). Total stock-based compensation expense from continuing operations was $1.4 million and $0.7 million for the three months ended September 30, 2017 and 2016, respectively, and $4.5 million and $2.7 million for the nine months ended September 30, 2017 and 2016, respectively. In the first quarter of 2016, the Company’s chief operating officer terminated employment and the chief financial officer retired. In conjunction with the termination and retirement, unvested RSUs totaling 167,511, which were outstanding as of December 31, 2015, immediately vested representing an additional $0.5 million included in stock compensation expense during the first quarter of 2016. Additionally, severance costs totaling $1.4 million were recognized in the first quarter of 2016.These amounts are included in corporate expenses and, in the case of certain property positions, general and administrative expenses in the Company’s consolidated statements of operations. We recognized a reduction in income tax expense of $0.2 million and $0.1 million for the three months ended September 30, 2017 and 2016, respectively, and $0.8 million for both the nine months ended September 30, 2017 and 2016, respectively, for excess tax benefits related to stock-based compensation.On January 27, 2017, the Company granted 298,761 RSUs to executive officers and key employees, and 46,282 RSUs to non-employee members of the BOD under the 2015 Plan. The RSUs had a fair value of $15.50 per unit which was the NASDAQ closing price on that date. An additional 42,161 RSUs were also granted to key employees during the nine months ended September 30, 2017.A summary of the RSU activity for the nine months ended September 30, 2017 is as follows:��(1)Includes 100,829 of performance awards at 100% of target and 286,375 time-based awards at 100% of target.(2)Represents exchanged Isle RSUs as a result of the Isle Acquisition based on the average of the ERI share price on the grant dates.As of September 30, 2017, the Company had approximately $6.4 million of unrecognized compensation expense related to unvested RSUs that is expected to be recognized over a weighted-average period of approximately 1.06 years.A summary of the ERI Stock Option activity for the nine months ended September 30, 2017 is as follows:(1)Represents exchanged Isle Stock Options as a result of the Isle Acquisition.As a result of the Isle Acquisition, we exchanged 1,351,168 non-qualified stock options, which have a maximum term of ten years from the grant date and are exercisable in yearly installments of 20% commencing one year after the grant date. The options have a weighted average per share Isle Acquisition Date fair value of $9.90 utilizing the Black-Scholes-Merton option pricing model with the range of assumptions disclosed in the following table:Weighted average expected volatility40.0%Expected dividend yield0.0%Weighted average expected term (in years)0.66Weighted average risk-free interest rate1.08%Weighted average volatility is calculated using the historical volatility of our stock price over a range of dates equal to the expected term of the grant’s options. The weighted average expected term is calculated using historical data that is representative of the option for which the fair value is to be determined. The expected term represents the period of time that options granted are expected to be outstanding. The weighted average risk-free rate is based on the U.S. Treasury yield curve in effect at the time of the grant for the approximate period of time equivalent to the grant’s expected term. The Company’s unrecognized compensation cost for unvested options was $0.3 million as of September 30, 2017.A summary of the ERI Restricted Stock Awards activity for the nine months ended September 30, 2017 is as follows:(1)Represents exchanged Isle Restricted Stock Awards as a result of the Isle Acquisition.The Company’s unrecognized compensation cost for unvested restricted stock awards was $0.1 million as of September 30, 2017Note 5. Other and Intangible Assets, netOther and intangible assets, net, include the following amounts (in thousands):Goodwill represents the excess of the purchase prices of acquiring MTR Gaming and Isle over the fair market value of the net assets acquired.Gaming licenses represent intangible assets acquired from the purchase of a gaming entity located in a gaming jurisdiction where competition is limited, such as when only a limited number of gaming operators are allowed to operate in the jurisdiction. These gaming license rights are not subject to amortization as the Company has determined that they have an indefinite useful lives.Amortization expense with respect to trade names and the loyalty program for the three and nine months ended September 30, 2017 amounted to $1.7 million and $3.3 million, respectively, and $1.2 million and $3.6 million for the three and nine months ended September 30, 2016, respectively, which is included in depreciation and amortization expense in the consolidated statements of operations. Such amortization expense is expected to be $1.6 million for the remainder of December 31, 2017 and $5.0 million, $4.6 million and $1.5 million for the years ended December 31, 2018, 2019 and 2020, respectively.The Company estimates an annual effective income tax rate based on projected results for the year and applies this rate to income before taxes to calculate income tax expense. Any refinements made due to subsequent information that affects the estimated annual effective income tax rate are reflected as adjustments in the current period.For income tax purposes, the Company amortizes or depreciates certain assets that have been assigned an indefinite life for book purposes. The incremental amortization or depreciation deductions for income tax purposes result in an increase in certain deferred tax liabilities that cannot be used as a source of future taxable income for purposes of measuring the Company's need for a valuation allowance against the net deferred tax assets. Therefore, we expect to record non-cash deferred tax expense as we amortize these assets for tax purposes.For the three months ended September 30, 2017, the Company’s tax expense from continuing operations was $11.6 million and for the nine months ended September 30, 2017, the Company’s tax benefit from continuing operations was $27.6 million. For the three and nine months ended September 30, 2016, the Company’s tax expense from continuing operations was $5.8 million and $13.7 million, respectively. For the three and nine months ended September 30, 2017, the difference between the effective rate and the statutory rate is attributed primarily to non-deductible transaction costs incurred and changes in the effective state tax rate associated with the acquisition of Isle of Capri Casinos, Inc., state and local income taxes and the release of the valuation allowance against certain Pennsylvania deferred tax assets. For the three and nine months ended September 30, 2016, the difference between the effective rate and the statutory rate is attributed primarily to state and local income taxes less excess tax benefits associated with stock compensation and tax credits. As of September 30, 2017 and 2016, there were no unrecognized tax benefits and the Company does not expect a significant increase or decrease to the total amounts of unrecognized tax benefits within the next twelve months.The Company and its subsidiaries file US federal income tax returns and various state and local income tax returns. The Company does not have tax sharing agreements with the other members within the consolidated ERI group. With few exceptions, the Company is no longer subject to US federal or state and local tax examinations by tax authorities for years before 2009.The Company was notified by the Internal Revenue Service in October of 2016 that its federal tax return for the year ended December 31, 2014 had been selected for examination. In September 2017, the IRS informed the Company that they completed the examination of the tax return and made no changes. However, the Company may be subject to audit in the future and the outcome of tax audits cannot be predicted with certainty. If any issues addressed in the Company’s tax audits are resolved in a manner not consistent with the Company’s expectations, we would be required to adjust our provision for income taxes in the period such resolution occurs. While the Company believes its reported results are materially accurate, any significant adjustments could have a material adverse effect on the Company’s results of operations, cash flows and financial position.Long‑term debt consisted of the following (in thousands):In connection with the Isle Acquisition, the Company completed a debt financing transaction comprised of: (a) a senior secured credit facility in an aggregate principal amount of $1.75 billion with a (i) term loan facility of $1.45 billion and (ii) revolving credit facility of $300.0 million and (b) $375.0 million of 6% senior unsecured notes. The proceeds of such borrowings were used (v) to pay the cash portion of the consideration payable in the Isle Merger, (w) refinance all of Isle’s existing credit facilities, (x) redeem or otherwise repurchase all of Isle’s and senior and senior subordinated notes, (y) refinance the Company’s existing credit facility and (z) pay transaction fees and expenses related to the foregoing.On September 13, 2017, the Company issued an additional $500.0 million in aggregate principal amount of its 6% Senior Notes (as defined below) at an issue price equal to 105.5% of the principal amount. The 6% Senior Notes were issued as additional notes under the New Indenture dated March 29, 2017 (as defined below), as supplemented by the Supplemental Indenture dated as of May 1, 2017 (the “Supplemental Indenture”) between the Company, the guarantors party thereto and U.S. Bank National Association, pursuant to which the Company previously issued $375.0 million aggregate principal amount of 6% Senior Notes. The additional 6% Senior Notes formed part of a single class of securities together with the initial 6% Senior Notes for all purposes under the New Indenture, including waivers, amendments, redemptions and offers to purchase.The Company used the proceeds of the offering to repay all of the outstanding borrowings under the New Revolving Credit Facility (as defined below) totaling $78.0 million and used the remainder to repay outstanding borrowings totaling $444.5 million under the New Term Loan plus related accrued interest.Amortization of the debt issuance costs and the discount and premium associated with our indebtedness totaled $2.0 million and $5.0 million for the three and nine months ended September 30, 2017, respectively. Amortization of the debt issuance costs and the discount associated with our indebtedness totaled $0.9 million and $2.6 million, respectively, for the three and nine months ended September 30, 2016. Amortization of debt issuance costs is computed using the effective interest method and is included in interest expense.In accordance with ASC Topic 470-50, “Debt Modifications and Extinguishments” (“ASC 470-50”), the Company recognized a loss totaling $27.3 million for the nine months ended September 30, 2017 as a result of the refinance of the Prior Credit Facility (as defined below) in May 2017. The Company also recognized a loss totaling $10.0 million for the three months ended September 30, 2017 as a result of the issuance of additional 6% Senior Notes in September 2017 resulting in a combined total loss of $37.3 million for the nine months ended September 30, 2017.Scheduled maturities of long‑term debt are $375.0 million in 2023, $1.0 billion in 2024, and $875.0 million in 2025.The Company is a holding company with no independent assets or operations. Our 6% Senior Notes and 7% Senior Notes are fully and unconditionally guaranteed, on a joint and several basis, by the subsidiary guarantors. As of September 30, 2017, there were no significant restrictions on the ability of our subsidiaries to distribute cash to us or our guarantor subsidiaries.Senior Notes7.0% Senior NotesOn July 23, 2015, the Company issued at par $375.0 million in aggregate principal amount of 7.0% senior notes due 2023 (“7% Senior Notes”) pursuant to the Indenture, dated as of July 23, 2015 (the “Indenture”), between the Company and U.S. Bank, National Association, as Trustee. The 7% Senior Notes will mature on August 1, 2023, with interest payable semi-annually in arrears on February 1 and August 1 of each year.On or after August 1, 2018, the Company may redeem all or a portion of the 7% Senior Notes upon not less than 30 nor more than 60 days’ notice, at the redemption prices (expressed as percentages of the principal amount) set forth below plus accrued and unpaid interest and additional interest, if any, on the 7% Senior Notes redeemed, to the applicable redemption date, if redeemed during the twelve month period beginning on August 1 of the years indicated below:Prior to August 1, 2018, the Company may redeem all or a portion of the 7% Senior Notes at a price equal to 100% of the 7% Senior Notes redeemed plus accrued and unpaid interest to the redemption date, plus a make-whole premium. At any time prior to August 1, 2018, the Company is also entitled to redeem up to 35% of the original aggregate principal amount of the 7% Senior Notes with proceeds of certain equity financings at a redemption price equal to 107% of the principal amount of the 7% Senior Notes redeemed, plus accrued and unpaid interest. If the Company experiences certain change of control events (as defined in the Indenture), it must offer to repurchase the 7% Senior Notes at 101% of their principal amount, plus accrued and unpaid interest to the applicable repurchase date. If the Company sells assets under certain circumstances and does not use the proceeds for specified purposes, the Company must offer to repurchase the 7% Senior Notes at 100% of their principal amount, plus accrued and unpaid interest to the applicable repurchase date.The 7% Senior Notes are subject to redemption imposed by gaming laws and regulations of applicable gaming regulatory authorities.The Indenture contains certain covenants limiting, among other things, the Company’s ability and the ability of its subsidiaries (other than its unrestricted subsidiaries) to:pay dividends or distributions or make certain other restricted payments or investments;incur or guarantee additional indebtedness or issue disqualified stock or create subordinated indebtedness that is not subordinated to the 7% Senior Notes or the guarantees of the 7% Senior Notes;create liens;transfer and sell assets;merge, consolidate, or sell, transfer or otherwise dispose of all or substantially all of the Company’s assets;enter into certain transactions with affiliates;create restrictions on dividends or other payments by restricted subsidiaries.These covenants are subject to a number of exceptions and qualifications as set forth in the Indenture. The Indenture also provides for customary events of default which, if any of them occurs, would permit or require the principal of and accrued interest on such 7% Senior Notes to be declared due and payable. As of September 30, 2017, the Company was in compliance with all of the covenants under the Indenture relating to the 7% Senior Notes.6.0% Senior NotesOn March 29, 2017, Eagle II Acquisition Company LLC (“Eagle II”), a wholly-owned subsidiary of the Company, issued $375.0 million aggregate principal amount of 6% Senior Notes due 2025 (the “6% Senior Notes”) pursuant to an indenture, dated as of March 29, 2017 (the “New Indenture”), between Eagle II and U.S. Bank, National Association, as Trustee. The 6% Senior Notes will mature on April 1, 2025, with interest payable semi-annually in arrears on April 1 and October 1, commencing October 1, 2017. The proceeds of the offering, and additional funds in the amount of $1.9 million in respect of interest expected to be accrued on the 6% Senior Notes, were placed in escrow pending satisfaction of certain conditions, including consummation of the Isle Acquisition. In connection with the consummation of the Isle Acquisition on May 1, 2017, the escrowed funds were released and the Company assumed Eagle II’s obligations under the 6% Senior Notes and the New Indenture and certain of the Company’s subsidiaries (including Isle and certain of its subsidiaries) executed guarantees of the Company’s obligations under the 6% Senior Notes.On September 13, 2017, the Company issued an additional $500.0 million principal amount of its 6% Senior Notes at an issue price equal to 105.5% of the principal amount of the 6% Senior Notes. The additional notes were issued pursuant to the New Indenture that governs the 6% Senior Notes. The Company used the proceeds of the offering to repay $78.0 million of outstanding borrowings under the revolving credit facility and used the remainder to repay $444.5 million outstanding borrowings under the term loan facility and related accrued interest.On or after April 1, 2020, the Company may redeem all or a portion of the 6% Senior Notes upon not less than 30 nor more than 60 days’ notice, at the redemption prices (expressed as percentages of the principal amount) set forth below plus accrued and unpaid interest and additional interest, if any, on the 6% Senior Notes redeemed, to the applicable redemption date, if redeemed during the 12-month period beginning on April 1 of the years indicated below:Prior to April 1, 2020, the Company may redeem all or a portion of the 6% Senior Notes at a price equal to 100% of the 6% Senior Notes redeemed plus accrued and unpaid interest to the redemption date, plus a make-whole premium. At any time prior to August 1, 2018, the Company is also entitled to redeem up to 35% of the original aggregate principal amount of the 6% Senior Notes with proceeds of certain equity financings at a redemption price equal to 106% of the principal amount of the 6% Senior Notes redeemed, plus accrued and unpaid interest. If the Company experiences certain change of control events (as defined in the New Indenture), it must offer to repurchase the 6% Senior Notes at 101% of their principal amount, plus accrued and unpaid interest to the applicable repurchase date. If the Company sells assets under certain circumstances and does not use the proceeds for specified purposes, the Company must offer to repurchase the 6% Senior Notes at 100% of their principal amount, plus accrued and unpaid interest to the applicable repurchase date.The 6% Senior Notes are subject to redemption imposed by gaming laws and regulations of applicable gaming regulatory authorities.The New Indenture contains certain covenants limiting, among other things, the Company’s ability and the ability of its subsidiaries (other than its unrestricted subsidiaries) to:pay dividends or distributions or make certain other restricted payments or investments;incur or guarantee additional indebtedness or issue disqualified stock or create subordinated indebtedness that is not subordinated to the 6% Senior Notes or the guarantees of the 6% Senior Notes;create liens;merge, consolidate, or sell, transfer or otherwise dispose of all or substantially all of the Company’s assets;enter into certain transactions with affiliates;engage in lines of business other than the Company’s core business and related businesses; andcreate restrictions on dividends or other payments by restricted subsidiaries.These covenants are subject to a number of exceptions and qualifications as set forth in the New Indenture. The New Indenture also provides for customary events of default which, if any of them occurs, would permit or require the principal of and accrued interest on such 6% Senior Notes to be declared due and payable. As of September 30, 2017, the Company was in compliance with all of the covenants under the New Indenture relating to the 6% Senior Notes.Refinancing of the Term Loan and Revolving Credit FacilityCredit FacilityOn July 23, 2015, the Company entered into a new $425.0 million seven year term loan (the “Term Loan”) and a $150.0 million five year revolving credit facility (the “Revolving Credit Facility” and, together with the Term Loan, the “Prior Credit Facility”).The Term Loan bore interest at a rate per annum of, at the Company’s option, either (x) LIBOR plus 3.25%, with a LIBOR floor of 1.0%, or (y) a base rate plus 2.25%. Borrowings under the Revolving Credit Facility bore interest at a rate per annum of, at the Company’s option, either (x) LIBOR plus a spread ranging from 2.5% to 3.25% or (y) a base rate plus a spread ranging from 1.5% to 2.25%, in each case with the spread determined based on the Company’s total leverage ratio. Additionally, the Company paid a commitment fee on the unused portion of the Revolving Credit Facility not being utilized in the amount of 0.50% per annum.On May 1, 2017, all of the outstanding amounts under the Prior Credit Facility were repaid with proceeds of borrowings under the New Credit Facility and the Prior Credit Facility was terminated.New Credit FacilityOn April 17, 2017, Eagle II entered into a new credit agreement by and among Eagle II, as initial borrower, JPMorgan Chase Bank, N.A., as administrative agent, and the lenders party thereto dated as of April 17, 2017 (the “New Credit Facility”), consisting of a $1.45 billion term loan facility (the “New Term Loan Facility” or “New Term Loan”) and a $300.0 million revolving credit facility (the “New Revolving Credit Facility”), which was undrawn at closing. The proceeds of the New Term Loan Facility, and additional funds in the amount of $4.5 million in respect of interest expected to be accrued on the New Term Loan Facility, were placed in escrow pending satisfaction of certain conditions, including consummation of the Isle Acquisition. In connection with the consummation of the Isle Acquisition on May 1, 2017, the escrowed funds were released and ERI assumed Eagle II’s obligations under the New Credit Facility and certain of ERI’s subsidiaries (including Isle and certain of its subsidiaries) executed guarantees of ERI’s obligations under the New Credit Facility.As of September 30, 2017, the Company had $1.0 billion outstanding on the New Term Loan. There were no borrowings outstanding under the New Revolving Credit Facility as of September 30, 2017. The Company had $291.6 million of available borrowing capacity, after consideration of $8.4 million in outstanding letters of credit, under its New Revolving Credit Facility as of September 30, 2017. At September 30, 2017, the interest rate on the New Term Loan was 3.42%, and the weighted average interest rate on the New Revolving Credit Facility was 4.12% based upon the weighted average interest rate of borrowings outstanding on our New Revolving Credit Facility as of September 30, 2017.The Company applied the net proceeds of the New Term Loan Facility and borrowings under the New Revolving Credit Facility, together with the proceeds of the 6% Senior Notes, and cash on hand, to (i) pay the cash portion of the consideration payable in the Isle Merger, (ii) refinance all of the debt outstanding under Isle’s existing credit facility, (iii) redeem or otherwise repurchase all of Isle’s outstanding senior and senior subordinated notes, (iv) refinance the Company’s Prior Credit Facility and (v) pay fees and costs associated with the foregoing.The Company’s obligations under the New Revolving Credit Facility will mature on April 17, 2022. The Company’s obligations under the New Term Loan Facility will mature on April 17, 2024. The Company was required to make quarterly principal payments in an amount equal to $3.6 million on the New Term Loan Facility on the last day of each fiscal quarter beginning on June 30, 2017 but satisfied this requirement as a result of the principal prepayment of $444.5 million on September 30, 2017 in conjunction with the issuance of the additional 6% Senior Notes. In addition, the Company is required to make mandatory payments of amountsoutstanding under the New Credit Facility with the proceeds of certain casualty events, debt issuances, and asset sales and, depending on its consolidated total leverage ratio, the Company may be required to apply a portion of its excess cash flow to repay amounts outstanding under the New Credit Facility.The interest rate per annum applicable to loans under the New Revolving Credit Facility are, at our option, either (i) LIBOR plus a margin ranging from 1.75% to 2.50% or (ii) a base rate plus a margin ranging from 0.75% to 1.50%, which margin is based on our total leverage ratio. The interest rate per annum applicable to the loans under the New Term Loan Facility is, at our option, either (i) LIBOR plus 2.25%, or (ii) a base rate plus 1.25%; provided, however, that in no event will LIBOR be less than zero or the base rate be less than 1.00% over the term of the New Term Loan Facility or the New Revolving Credit Facility. Additionally, the Company pays a commitment fee on the unused portion of the Revolving Credit Facility not being utilized in the amount of 0.50% per annum.The New Credit Facility contains a number of customary covenants that, among other things, restrict, subject to certain exceptions, the Company’s ability and the ability of the subsidiary guarantors to incur debt; create liens on collateral; engage in mergers, consolidations or asset dispositions; pay dividends or make distributions; make investments, loans or advances; engage in certain transactions with affiliates or subsidiaries; or modify their lines of business.The New Credit Facility is secured by substantially all of the Company’s personal property assets and substantially all personal property assets of each subsidiary that guaranties the New Credit Facility (other than certain subsidiary guarantors designated as immaterial) (the “New Credit Facility Guarantors”), whether owned on the closing date of the New Credit Facility or thereafter acquired, and mortgages on the real property and improvements owned or leased us or the New Credit Facility Guarantors. The New Credit Facility is also secured by a pledge of all of the equity owned by the Company and the New Credit Facility Guarantors (subject to certain gaming law restrictions). The credit agreement governing the New Credit Facility contains a number of customary covenants that, among other things, restrict, subject to certain exceptions, the Company’s ability and the ability of the New Credit Facility Guarantors to incur additional indebtedness, create liens on collateral, engage in mergers, consolidations or asset dispositions, make distributions, make investments, loans or advances, engage in certain transactions with affiliates or subsidiaries or make capital expenditures.The New Credit Facility also includes certain financial covenants, including the requirements that we maintain throughout the term of the New Credit Facility and measured as of the end of each fiscal quarter, and solely with respect to loans under the New Revolving Credit Facility, a maximum consolidated total leverage ratio of not more than 6.50 to 1.00 for the period beginning on the closing date and ending with the fiscal quarter ending December 31, 2018, 6.00 to 1.00 for the period beginning with the fiscal quarter beginning January 1, 2019 and ending with the fiscal quarter ending December 31, 2019, and 5.50 to 1.00 for the period beginning with the fiscal quarter beginning January 1, 2020 and thereafter. The Company will also be required to maintain an interest coverage ratio in an amount not less than 2.00 to 1.00 measured on the last day of each fiscal quarter beginning on the closing date, and ending with the fiscal quarter ending December 31, 2018, 2.50 to 1.00 for the period beginning with the fiscal quarter beginning January 1, 2019 and ending with the fiscal quarter ending December 31, 2019, and 2.75 to 1.00 for the period beginning with the fiscal quarter beginning January 1, 2020 and thereafter.The New Credit Facility contains a number of customary events of default, including, among others, for the non-payment of principal, interest or other amounts, the inaccuracy of certain representations and warranties, the failure to perform or observe certain covenants, a cross default to our other indebtedness including the Notes, certain events of bankruptcy or insolvency; certain ERISA events, the invalidity of certain loan documents, certain changes of control and the loss of certain classes of licenses to conduct gaming. If any event of default occurs, the lenders under the New Credit Facility would be entitled to take various actions, including accelerating amounts outstanding thereunder and taking all actions permitted to be taken by a secured creditor. As of September 30, 2017, the Company was in compliance with the covenants under the New Credit Facility.Note 8. Fair Value of Financial InstrumentsFair value is an exit price, representing the amount that would be received to sell an asset or paid to transfer a liability in an orderly transaction between market participants. Accordingly, fair value is a market based measurement that is determined based on assumptions that market participants would use in pricing an asset or liability. As a basis for considering such assumptions, there is a three‑tier fair valueLevels of the hierarchy which prioritizesprioritize the inputs used to measure fair value and include:measuring fair values as follows:active markets.12: Inputs: Quoted market other than quoted prices in active markets for identical assets or liabilities.Level 2 Inputs: Observable market‑based inputs or unobservable inputs that are corroborated by market data.3 Inputs:3: Unobservable inputs that are not corroborated byreflect the Company’s own assumptions, as there is little, if any, related market data.The following methods and assumptions are used to estimate the fair value of each class of financial instruments for which it is practical to estimate fair value:Equivalents:Equivalentsfunds. Investments in this categoryfunds that can be redeemed immediately at the current net asset value per share. A money market fund is a mutual fund whose investments are primarily in short‑termshort-term debt securities designed to maximize current income with liquidity and capital preservation, usually maintaining per share net asset value at a constant amount, such as one dollar. The carrying amounts approximate the fair value because of the short maturity of those instruments (Level 1).Restricted Cash and Investments:cash equivalents also include cash maintained for gaming operations.unredeemed winning tickets from the Company’s racing operations, funds related to horsemen’s fines and certain simulcastingcash equivalents held in certificates of deposit accounts or money market type funds, that are not subject to remeasurement on a recurring basis, which are restricted to paymentsunder certain operating agreements or restricted for improving horsemen’s facilities and racing purses, cash deposits that serve as collateral for lettersfuture capital expenditures in the normal course of credit, surety bonds and short-term certificates of deposit that serve as collateral for certain bonding requirements. The estimated fair values of our restricted cash and investments are based upon quoted prices available in active markets (Level 1), or quoted prices for similar assets in active and inactive markets (Level 2), and represent the amounts we would expect to receive if we sold our restricted cash and investments.Accounts Receivable and Credit Risk. Financial instruments that potentially subject the Company to concentrations of credit risk consist principally of casino accounts receivable. The Company issues markers to approved casino customers following background checks and assessments of creditworthiness. Trade receivables, including casino and hotel receivables, are typically non‑interest bearing. Accounts are written off when management deems the account to be uncollectible. Recoveries of accounts previously written off are recorded when received. An estimated allowance for doubtful accounts is maintained to reduce the Company’s receivables to their carrying amount, which approximates fair value. The allowance is estimated based on specific review of customer accounts as well as historical collection experience and current economic and business conditions. Management believes that no significant concentrations of credit risk related to receivables existed.There were no transfers between Level 1 and Level 2 investments.Securities: Securities captive insurance subsidiary.deferred compensation plans. The estimated fair values of the Company’s marketable securities are determined on an individual asset basis based upon quoted prices of identical assets available in active markets (Level 1), quoted prices of identical assets in inactive markets, or quoted prices for similar assets in active and inactive markets (Level 2), and represent the amounts wethe Company would expect to receive if wethe Company sold these marketable securities.Long‑ As of both March 31, 2024 and December 31, 2023, the Company held $2 million in Level 1 securities.Three Months Ended March 31, (In millions) 2024 2023 Interest expense $ 607 $ 604 Capitalized interest (15) (6) Interest income (2) (4) Total interest expense, net $ 590 $ 594 (In millions) March 31, 2024 December 31, 2023 Land $ 2,088 $ 2,088 Buildings, riverboats, and leasehold and land improvements 13,622 13,543 Furniture, fixtures, and equipment 2,484 2,409 Construction in progress 932 762 Total property and equipment 19,126 18,802 Less: accumulated depreciation (4,323) (4,046) Total property and equipment, net $ 14,803 $ 14,756 Depreciation Expense Three Months Ended March 31, (In millions) 2024 2023 Depreciation expense $ 291 $ 264 Changes in Carrying Value of Goodwill and Other Intangible Assets Non-Amortizing Intangible Assets (In millions) Amortizing Intangible Assets Goodwill Other Balances as of December 31, 2023 $ 946 $ 10,990 $ 3,577 Amortization expense (36) — — Balances as of March 31, 2024 $ 910 $ 10,990 $ 3,577 Gross Carrying Value and Accumulated Amortization of Intangible Assets Other Than Goodwill March 31, 2024 December 31, 2023 (Dollars in millions) Useful Life Gross Carrying Amount Accumulated Amortization Net Carrying Amount Gross Carrying Amount Accumulated Amortization Net Carrying Amount Amortizing intangible assets Customer relationships 3 - 7 years $ 587 $ (382) $ 205 $ 587 $ (360) $ 227 Gaming rights and other 10 - 34 years 242 (31) 211 242 (28) 214 Trademarks 15 years 313 (96) 217 313 (91) 222 Reacquired rights 24 years 250 (30) 220 250 (28) 222 Technology 6 years 110 (53) 57 110 (49) 61 $ 1,502 $ (592) 910 $ 1,502 $ (556) 946 Non-amortizing intangible assets other than Goodwill Trademarks 1,998 1,998 Gaming rights 1,056 1,056 Caesars Rewards 523 523 3,577 3,577 Total amortizing and non-amortizing intangible assets other than Goodwill, net $ 4,487 $ 4,523 Estimated Five-Year Amortization Remaining 2024 Years Ended December 31, (In millions) 2025 2026 2027 2028 2029 Estimated annual amortization expense $ 93 $ 122 $ 122 $ 80 $ 43 $ 9 March 31, 2024 December 31, 2023 (Dollars in millions) Final Maturity Rates Face Value Book Value Book Value Secured Debt CEI Revolving Credit Facility 2028 variable $ — $ — $ — CEI Term Loan A 2028 variable 703 701 710 CEI Term Loan B 2030 variable 2,475 2,427 2,432 CEI Term Loan B-1 2031 variable 2,900 2,861 — CEI Senior Secured Notes due 2030 2030 7.00% 2,000 1,979 1,978 CEI Senior Secured Notes due 2032 2032 6.50% 1,500 1,482 — CEI Senior Secured Notes due 2025 N/A N/A — — 3,374 CRC Senior Secured Notes N/A N/A — — 983 Unsecured Debt CEI Senior Notes due 2027 2027 8.125% 1,611 1,595 1,593 CEI Senior Notes due 2029 2029 4.625% 1,200 1,188 1,188 Special Improvement District Bonds 2037 4.30% 45 45 45 Long-term notes and other payables 2 2 2 Total debt 12,436 12,280 12,305 Current portion of long-term debt (94) (94) (65) Deferred finance charges associated with the CEI Revolving Credit Facility — (15) (16) Long-term debt $ 12,342 $ 12,171 $ 12,224 Unamortized discounts and deferred finance charges $ 171 $ 150 Fair value $ 12,446 Annual Estimated Debt Service Requirements as of March 31, 2024 Remaining Years Ended December 31, (In millions) 2024 2025 2026 2027 2028 Thereafter Total Annual maturities of long-term debt $ 72 $ 94 $ 94 $ 1,705 $ 616 $ 9,855 $ 12,436 Estimated interest payments 610 870 830 810 650 1,220 4,990 $ 682 $ 964 $ 924 $ 2,515 $ 1,266 $ 11,075 $ 17,426 Debt:loans, other unsecured borrowings, and special improvement district bonds that are contractually due within 12 months. The Company may, from time to time, seek to repurchase or prepay its outstanding indebtedness. Any such purchases or repayments may be funded by existing cash balances or the incurrence of debt. The amount and timing of any repurchase will be based on business and market conditions, capital availability, compliance with debt covenants and other considerations.our long-term debt or other long-term obligations is estimatedhas been calculated primarily based on the quoted market price of the underlying debt issue (Level 1) or, when a quoted market price is not available, the discounted cash flow of future payments utilizing currentborrowing rates available to us for the debtas of similar remaining maturities (Level 2). Debt obligations with a short remaining maturity have a carrying amount that approximates fair value.Acquisition-Related Contingent Consideration: Contingent consideration related to the July 2003 acquisitionMarch 31, 2024 and based on market quotes of Scioto Downs represents the estimate of amounts to be paid to former stockholders of Scioto Downs under certain earn-out provisions. The Company considers the acquisition related contingency’s fair value measurement, which includes forecast assumptions, to be Level 3 withinour publicly traded debt. We classify the fair value of debt within Level 1 and Level 2 in the fair value hierarchy.estimated fair valuesCEI Revolving Credit Facility includes a letter of credit sub-facility of $388 million and contains reserves of $40 million which are available only for certain permitted uses.instrumentscovenant of 7.25:1 until December 31, 2024 and 6.50:1 from and after December 31, 2024. In addition, the CEI Revolving Credit Facility and the CEI Term Loan A include a minimum fixed charge coverage ratio financial covenant of 1.75:1 until December 31, 2024 and 2.0:1 from and after December 31, 2024. From and after the repayment of the CEI Term Loan A, the financial covenants applicable to the CEI Revolving Credit Facility will be tested solely to the extent that certain testing conditions are satisfied. Failure to comply with such covenants could result in an acceleration of the maturity of indebtedness outstanding under the relevant debt document.Three Months Ended March 31, 2024 (In millions) Las Vegas Regional Caesars Digital Managed and Branded Corporate and Other Total Casino $ 239 $ 1,031 $ 266 $ — $ (1) $ 1,535 Food and beverage 287 135 — — — 422 Hotel 362 131 — — — 493 Other 140 68 16 68 — 292 Net revenues $ 1,028 $ 1,365 $ 282 $ 68 $ (1) $ 2,742 Three Months Ended March 31, 2023 (In millions) Las Vegas Regional Caesars Digital Managed and Branded Corporate and Other Total Casino $ 309 $ 1,058 $ 219 $ — $ (1) $ 1,585 Food and beverage 290 137 — — — 427 Hotel 373 130 — — — 503 Other 159 64 19 69 4 315 Net revenues $ 1,131 $ 1,389 $ 238 $ 69 $ 3 $ 2,830 Accounts Receivable, Net (In millions) March 31, 2024 December 31, 2023 Casino $ 222 $ 274 Food and beverage and hotel 133 118 Other 196 216 Accounts receivable, net $ 551 $ 608 follows (amounts in thousands):advance ticket sales, deposits on rooms and convention space, unpaid wagers, iGaming deposits, or future sports bets). These liabilities are generally expected to be recognized as revenue within one year of being purchased, earned, or deposited and are recorded within Accrued other liabilities on the Company’s Balance Sheets. Liabilities expected to be recognized as revenue beyond one year of being purchased, earned, or deposited are recorded within Other long-term liabilities on the Company’s Balance Sheets.representssummarizes the changeactivity related to contract and contract-related liabilities:Outstanding Chip Liability Caesars Rewards Customer Deposits and Other Deferred Revenue (In millions) 2024 2023 2024 2023 2024 2023 Balance at January 1 $ 42 $ 45 $ 86 $ 87 $ 693 $ 693 Balance at March 31 39 38 85 89 631 637 Increase / (decrease) $ (3) $ (7) $ (1) $ 2 $ (62) $ (56) acquisition-related contingent consideration liabilitiesthe arrangement. During the three months ended March 31, 2024 and 2023, we recognized approximately $493 million and $503 million, respectively, which is included in Hotel revenues in the Statements of Operations.period Decemberuse of meeting space. The nonlease components primarily consist of food and beverage and audio/visual services. Revenue from conventions is included in Food and beverage revenue in the Statements of Operations and during the three months ended March 31, 20162024 and 2023, lease revenue related to September 30, 2017:Balance as of December 31, 2016$496Amortization of present value discount(1)50Fair value adjustment for change in consideration expected to be paid(2)4Settlements(90)Balance as of September 30, 2017$460
conventions was approximately $13 million and $14 million, respectively.(1)Changes in present value are included as a component of interest expense in the consolidated statements of operations.
Real Estate Operating Leases(2)Fair value adjustments for changes in earn-out estimates are included in general and administrative expense in the consolidated statements of operations.
Real estate lease revenue is included in Other revenue in the Statements of Operations. During the three months ended March 31, 2024 and 2023, we recognized approximately $35 million and $37 million, respectively.9.8. Earnings per Shareand nine months ended September 30, 2017March 31, 2024 and 2016 (dollars2023:Three Months Ended March 31, (In millions, except per share data) 2024 2023 Net loss attributable to Caesars $ (158) $ (136) Shares outstanding: Weighted average shares outstanding – basic 216 215 Weighted average shares outstanding – diluted 216 215 Net loss per common share attributable to common stockholders – basic: $ (0.73) $ (0.63) Net loss per common share attributable to common stockholders – diluted: $ (0.73) $ (0.63) thousands, exceptwhich the Company generated a net loss from continuing operations, the Weighted average shares outstanding - basic was used in calculating Diluted loss per share amounts):because using diluted shares would have been anti-dilutive to loss per share.Weighted-Average Number of Anti-Dilutive Shares Excluded from the Calculation of Earnings per Share Three Months Ended March 31, (In millions) 2024 2023 Stock-based compensation awards 4 4 Total anti-dilutive common stock 4 4 10. Commitments9. Stock-Based Compensation and ContingenciesLitigation.Stockholders’ Equityis a partymaintains long-term incentive plans which allow for granting stock-based compensation awards to various lawsuits, which have arisendirectors, employees, officers, and consultants or advisers who render services to the Company or its subsidiaries, based on Company Common Stock, including stock options, restricted stock, restricted stock units (“RSUs”), performance stock units (“PSUs”), market-based performance stock units (“MSUs”), stock appreciation rights, and other stock-based awards or dividend equivalents. Forfeitures are recognized in the normal courseperiod in which they occur.business. Estimated lossesOperations totaled $25 million and $27 million during the three months ended March 31, 2024 and 2023, respectively. These amounts are accrued for these lawsuits and claims whenincluded in Corporate expense in the loss is probable and can be estimated. The current liability forCompany’s Statements of Operations.estimated losses associated with those lawsuits is not material to the consolidated financial condition and those estimated losses are not expected to have a material impact on the results of operations.In connection with the Isle Merger, a class action lawsuit was filed by a purported stockholderthree months ended March 31, 2024, as part of the Company alleging breach of fiduciary duty byannual incentive program, the Company boardgranted 1.7 million RSUs to eligible participants with an aggregate fair value of directors$78 million and a ratable vesting period of one to three years. Each RSU represents the right to receive payment in connection withrespect of one share of the Isle Merger. The case was filed on November 8, 2016Company’s Common Stock.Second Judicial District Court of the State of Nevada and is captioned Assad v. Eldorado Resorts, Inc., et. al, case no. CV 16-02312. The lawsuit, which purported to be a class action on behalf of all of the stockholders of the Company, alleged, among other things, breach of fiduciary duty in failing to disclose all material information to stockholders in seeking approval of the issuance of sharesform of Company Common Stock, based on the achievement of specified performance and service conditions. The fair value of the PSUs is based on the market price of our common stock when a mutual understanding of the key terms and conditions of the awards between the Company and recipient is achieved. The awards are remeasured each period until such an understanding is reached. The aggregate value of PSUs granted during the quarter was $4.7 million as of March 31, 2024.Isle Mergerform of Company Common Stock, based on the achievement of specified market and requested injunctive relief.service conditions. The grant date fair value of the MSUs was determined using a Monte-Carlo simulation model. Key assumptions for the Monte-Carlo simulation model are the risk-free interest rate, expected volatility, expected dividends and correlation coefficient. The effect of market conditions is considered in determining the grant date fair value, which is not subsequently revised based on actual performance. The aggregate value of MSUs granted during the three months ended March 31, 2024 was $25 million.suit,three months ended March 31, 2024, 799 thousand, 99 thousand and 19 thousand of RSUs, PSUs and MSUs, respectively, vested under the Plaintiff sought to enjoin2015 Plan.March 31, 2024 December 31, 2023 Quantity Quantity Restricted stock units 2,813,633 50.48 1,922,419 60.11 Performance stock units 358,615 43.74 328,230 46.88 Market-based stock units 1,134,413 73.64 872,019 85.11 shareholder meeting to approveweighted-average grant date fair value for RSUs, weighted-average grant date fair value for PSUs where the sale. The request to enjoingrant date has been achieved, the shareholder meeting lawsuitprice of CEI common stock as of the balance sheet date for PSUs where a grant date has sincenot been withdrawn and, on May 31, 2017, the Court denied plaintiff’s application for an award of attorneys’ fees and expenses. This matter was dismissed by the Court in August 2017.Agreements with Horsemen and Pari-mutuel Clerks. The Federal Interstate Horse Racing Actachieved, and the grant date fair value of the MSUs determined using the Monte-Carlo simulation model.(In millions) Unrealized Net Gains on Derivative Instruments Foreign Currency Translation Adjustments Other Total Balances as of December 31, 2022 $ 94 $ (1) $ (1) $ 92 Other comprehensive income before reclassifications — 2 4 6 Total other comprehensive income, net of tax — 2 4 6 Balances as of March 31, 2023 $ 94 $ 1 $ 3 $ 98 Balances as of December 31, 2023 $ 94 $ — $ 3 $ 97 Other comprehensive loss before reclassifications — — (1) (1) Total other comprehensive loss, net of tax — — (1) (1) Balances as of March 31, 2024 $ 94 $ — $ 2 $ 96 Income Tax Allocation Three Months Ended March 31, (In millions) 2024 2023 Loss from continuing operations before income taxes $ (127) $ (185) Benefit (provision) for income taxes (15) 49 Effective tax rate (11.8) % 26.5 % racing lawsdeferred tax assets will be realized and, as a result, during the second quarter of 2023, the Company reversed the valuation allowance related to these deferred tax assets and recorded an income tax benefit of $940 million. The Company is still carrying a valuation allowance on certain federal and state deferred tax assets that are not more likely than not to be realized in West Virginia, Ohiothe future. The Company has assessed the changes to the valuation allowance, including realization of the disallowed interest expense deferred tax asset, using the integrated approach.Pennsylvania require that, in orderstate valuation allowances against the deferred tax assets for excess business interest expense.simulcast races, westate deferred tax benefits generated from net operating losses becoming available due to elections to treat certain subsidiary corporations as disregarded entities for income tax purposes.writtentax sharing agreements with the horse ownersother members within its consolidated group. The Company is subject to exam by various state and trainers at those racetracks. In addition, in orderforeign tax authorities. With few exceptions, the Company is no longer subject to operate slot machines in West Virginia, we are required to enter into written agreements regardingUS federal or state and local tax assessments by tax authorities for years before 2020, and it is possible that the proceedsamount of the slot machines (a “proceeds agreement”) with a representative of a majority ofliability for unrecognized tax benefits could change during the horse owners and trainers and with a representative of a majority of the pari‑mutuel clerks. In Pennsylvania and Ohio, we must have an agreement with the representative of the horse owners. We have the requisite agreements in place with the horsemen at Mountaineer until December 31, 2018. With respect to the Mountaineer pari‑mutuel clerks, we have a labor agreement in force until November 30, 2017, which will automatically renew for an additional one-year period, and a proceeds agreement until April 14, 2018. We are required to have a proceeds agreement in effect on July 1 of each year with the horsemen and the pari‑mutuel clerks as a condition to renewal of our video lottery license for such year. If the requisite proceeds agreement is not in place as of July 1 of a particular year, Mountaineer’s application for renewal of its video lottery license could be denied, in which case Mountaineer would not be permitted to operate either its slot machines or table games. Scioto Downs has the requisite agreement in place with the OHHA until December 31, 2023, with automatic two-year renewals unless either party requests re‑negotiation pursuant to its terms. Presque Islenext 12 months.Downs has the requisite agreement in place with the Pennsylvania Horsemen’s Benevolent and Protective Association until May 1, 2019. With the exception of the respective Mountaineer, Presque Isle Downs and Scioto Downs horsemen’s agreements and the agreement between Mountaineer and the pari‑mutuel clerks’ union described above, each of the agreements referred to in this paragraph may be terminated upon written notice by either party.AffiliatesThe accompanying balance sheets include the Company’s payable to C.S. &Y.Party and Affiliate Transactions (“CS&Y”) which is an entity partially owned by Recreational Enterprises, Inc. (“REI”). The Company’s Chief Executive Officer and Chairman of the Board, Gary L. Carano, and its Senior Vice President of Regional Operations, Gene Carano, are the directors of REI and members of the Carano family, including Gary L. Carano and Gene Carano, own the equity interests in REI. CS&Y. NoC. S. & Y. Associates (“CSY”) (the “CSY Lease”). CSY is a general partnership in which a trust has an approximate 27% interest. The Company’s Executive Chairman of the Board, Gary L. Carano, and his siblings are direct or indirect beneficiaries of the trust. The CSY Lease expires on June 30, 2057. Annual rent pursuant to the CSY Lease is currently $0.6 million, paid monthly. Annual rent is subject to periodic rent escalations of 1 to 2 percent through the term of the lease. Commensurate with its interest, the trust receives directly from the Company approximately 27% of the rent paid by the Company. As of March 31, 2024 and December 31, 2023, there were no amounts were due to or due from CS&YCSY.September 30, 2017.the joint venture. As of March 31, 2024, the Company has received $116 million in contributions for the project. Subsequent to March 31, 2024, Caesars Virginia, LLC, a subsidiary of CVA Holdco, LLC, entered into a five-year term loan and revolving credit facility agreement totaling $425 million on April 26, 2024.2016,2023, the Company recorded $64 million of income related to the investment, primarily due to the joint venture’s gain on the sale of a land parcel. As of both March 31, 2024 and December 31, 2023, the Company’s payable to CS&Y totaled $0.3investment in the joint venture was $147 million and is reflectedrecorded in Investments in and advances to unconsolidated affiliates on the accompanying balance sheet under “due to affiliates.”The Company holds a 42.1% variable interest in a partnership with other investors that developed a new 118-room Hampton Inn & Suites hotel at Scioto Downs that opened in March 2017. Pursuant to the terms of the partnership agreement, the Company contributed $1.0 million of cash and 2.4 acres of a leasehold immediately adjacent to The Brew Brothers microbrewery and restaurant at Scioto Downs. The partnership constructed the hotel at a cost of $16.0 million and other investor members operate the hotel. As of September 30, 2017, the Company’s receivable from the partnership totaled $71,000 and payable to the partnership totaled $30,000 and are reflected on the accompanying balance sheet under “due from affiliates” and “due to affiliates.”We viewour propertiesthe Company’s casinos as an operating segment. Operating segments are aggregated based on their similar economic characteristics, types of customers, types of services and products provided, and their management and reporting structure. Prior to the Isle Acquisition, theThe Company’s principal operating activities occurredoccur in three geographic regions: Nevada, Louisiana and parts of the eastern United States.four reportable segments. The Company aggregated its operations into three reportable segments are based on the similar characteristics of the operating segments withinwith the regions inway management assesses these results and allocates resources, which they operated as follows:SegmentPropertyStateNevadaEldorado RenoNevadaSilver LegacyNevadaCircus RenoNevadaLouisianaEldorado ShreveportLouisianaEasternPresque Isle DownsPennsylvaniaScioto DownsOhioMountaineerWest VirginiaFollowingis a consolidated view that adjusts for the Isle Acquisition, the Company’s principal operating activities expanded and now occur in four geographic regions andeffect of certain transactions between these reportable segments based on the similar characteristicswithin Caesars: (1) Las Vegas, (2) Regional, (3) Caesars Digital, and (4) Managed and Branded, in addition to Corporate and Other. See table below for a summary of the operatingthese segments. Also, see within the regions in which they operate. when applicable.summarizessets forth certain information regarding our current segments:properties (listed by segment in which each property is reported) as of March 31, 2024:SegmentLas Vegas Regional PropertyStateWestCaesars Atlantic City Eldorado RenoHarveys Lake Tahoe NevadaThe Cromwell Silver LegacyHorseshoe Baltimore NevadaFlamingo Las Vegas Horseshoe Black Hawk NevadaHarrah’s Cherokee Harrah’s Las Vegas Eldorado Gaming Scioto Downs Horseshoe Bossier City Harrah’s Cherokee Valley River Horseshoe Las Vegas Eldorado Resort Casino Reno Horseshoe Council Bluffs Harrah’s Resort Southern California The LINQ Hotel & Casino Grand Victoria Casino Horseshoe Hammond Caesars Windsor Paris Las Vegas Harrah’s Atlantic City Horseshoe Indianapolis Branded Planet Hollywood Resort & Casino Horseshoe Lake Charles Caesars Republic Scottsdale Harrah’s Council Bluffs Horseshoe St. Louis Caesars Southern Indiana Caesars Digital Harrah’s Gulf Coast Horseshoe Tunica Harrah’s Northern California Caesars Digital Harrah’s Hoosier Park Racing & Casino Isle Casino Bettendorf Harrah’s Joliet Isle of Capri Casino Boonville Harrah’s Lake Tahoe Isle of Capri Casino Lula Harrah’s Laughlin Isle Casino Waterloo Harrah’s Metropolis Lady Luck Casino - Black Hawk ColoradoHarrah’s New Orleans Silver Legacy Resort Casino Lady Luck Black HawkColoradoHarrah’s North Kansas City Trop Casino Greenville MidwestHarrah’s Philadelphia Tropicana Atlantic City WaterlooIowaHarrah’s Pompano Beach Tropicana Laughlin Hotel & Casino BettendorfIowaBoonvilleMissouriCape GirardeauMissouriCaruthersvilleMissouriKansas CityMissouriSouthPompanoFloridaEldorado ShreveportLouisianaLulaMississippiVicksburgMississippiEastPresque Isle DownsPennsylvaniaNemacolinPennsylvaniaScioto DownsOhioMountaineerWest Virginia
____________________ourthe Company’s four reportable segments. Amountssegments, in addition to Corporate and Other:Three Months Ended March 31, (In millions) 2024 2023 Las Vegas: Net revenues $ 1,028 $ 1,131 Adjusted EBITDA 440 533 Regional: Net revenues 1,365 1,389 Adjusted EBITDA 433 448 Caesars Digital: Net revenues 282 238 Adjusted EBITDA 5 (4) Managed and Branded: Net revenues 68 69 Adjusted EBITDA 18 19 Corporate and Other: Net revenues (1) 3 Adjusted EBITDA (43) (38) Three Months Ended March 31, (In millions) 2024 2023 Net loss attributable to Caesars $ (158) $ (136) Net income attributable to noncontrolling interests 16 — (Benefit) provision for income taxes 15 (49) (26) (3) Loss on extinguishment of debt 48 197 Interest expense, net 590 594 Depreciation and amortization 327 300 16 28 Stock-based compensation expense 25 27 Adjusted EBITDA $ 853 $ 958 Adjusted EBITDA by Segment: Las Vegas $ 440 $ 533 Regional 433 448 Caesars Digital 5 (4) Managed and Branded 18 19 Corporate and Other (43) (38) pre-acquisition periods (priornon-cash losses on the write down and disposal of assets, professional services for transaction and integration costs, various contract exit or termination costs, pre-opening costs in connection with our temporary facility openings, and non-cash changes in equity method investments.Total Assets - By Segment (In millions) March 31, 2024 December 31, 2023 Las Vegas $ 24,425 $ 24,230 Regional 15,423 15,291 Caesars Digital 999 1,095 Managed and Branded 240 224 (8,028) (7,474) Total $ 33,059 $ 33,366 May 1, 2017) conformreconcile to prior presentationthe Company’s consolidated results.additional operating segments associated“Company,” “CEI,” “Caesars,” “we,” “our,” or “us,” for the three months ended March 31, 2024 and 2023 should be read in conjunction with the Isle Acquisition are incrementalunaudited consolidated condensed financial statements and the notes thereto and other financial information included elsewhere in this Form 10-Q as well as our Annual Report on Form 10-K for the fiscal year ended December 31, 2023 (the “2023 Annual Report”). Capitalized terms used but not defined in this Form 10-Q have the same meanings as in the 2023 Annual Report.the previously disclosed reportable segments.(1)Amounts are before any West Virginia capital expenditure reimbursements.Note 13. Consolidating(i) our Consolidated Condensed Financial InformationCertainStatements as our “Financial Statements,” (ii) our Consolidated Condensed Balance Sheets as our “Balance Sheets,” (iii) our Consolidated Condensed Statements of Operations and Consolidated Condensed Statements of Comprehensive Income (Loss) as our “Statements of Operations,” and (iv) our Consolidated Condensed Statements of Cash Flows as our “Statements of Cash Flows.” References to numbered “Notes” refer to “Notes to Consolidated Condensed Financial Statements” included in Item 1, “Unaudited Financial Statements,” unless otherwise noted.wholly-owned subsidiaries have fullyfuture performance, liquidity and unconditionally guaranteed oncapital resources, and other non-historical statements are forward-looking statements. These forward-looking statements are subject to numerous risks and uncertainties. Our actual results may differ materially from those contained in or implied by any forward-looking statements. See “Cautionary Statements Regarding Forward-Looking Information” in this report.joint and several basis, the payment of all obligations under our 7% Senior Notes, 6% Senior Notes and New Credit Facility.The following wholly-owned subsidiariesnarrative explanation of the financial statements and other statistical data that should be read in conjunction with the accompanying financial statements to enhance an investor’s understanding of our financial condition, changes in financial condition and results of operations. Our objectives are: (i) to provide a narrative explanation of our financial statements that will enable investors to see the Company through the eyes of management; (ii) to enhance the overall financial disclosure and provide the context within which financial information should be analyzed; and (iii) to provide information about the quality of, and potential variability of, our earnings and cash flows so that investors can ascertain the likelihood of whether past performance is indicative of future performance.guarantors, on a jointgeographically diversified gaming and several basis, underhospitality company that was founded in 1973 by the 7% Senior Notes, 6% Senior Notes and New Credit Facility: IsleCarano family with the opening of Capri Casinos LLC;the Eldorado Holdco LLC; Eldorado Resorts LLC; Eldorado Shreveport 1 LLC; Eldorado Shreveport 2 LLC; EldoradoHotel Casino Shreveport Joint Venture;in Reno, Nevada. Beginning in 2005, we grew through a series of acquisitions, including the acquisition of MTR Gaming Group, Inc.; Mountaineer Park Inc.; Presque Isle Downs Inc.; Scioto Downs Inc.; Eldorado Limited Liability Company; Circus and Eldorado Joint Venture, LLC; CC Reno LLC; CCR Newco LLC; Black Hawk Holdings, L.L.C.; IC Holdings Colorado, Inc.; CCSC/Blackhawk, Inc.; IOC-Black Hawk Distribution Company, LLC; IOC-Black Hawk County, Inc.; Isle of Capri Bettendorf, L.C.; PPI, Inc.; Pompano Park Holdings LLC; IOC-Lula, Inc.; IOC-Kansas City, Inc.; IOC-Boonville, Inc.; IOC-Caruthersville, LLC; IOC Cape Girardeau, LLC; IOC-Vicksburg, Inc.; IOC-Vicksburg, L.L.C.; Rainbow Casino-Vicksburg Partnership, L.P.; IOC Holdings L.L.C. and St. Charles Gaming Company, L.L.C. Each of the subsidiaries’ guarantees is joint and several with the guarantees of the other subsidiaries.The consolidating condensed balance sheet as of September 30, 2017 is as follows:The consolidating condensed balance sheet as of December 31, 2016 is as follows:The consolidating condensed statement of operations for the nine months ended September 30, 2017 is as follows:The consolidating condensed statement of operations for the nine months ended September 30, 2016 is as follows:The consolidating condensed statement of cash flows for the nine months ended September 30, 2017 is as follows:The consolidating condensed statement of cash flows for the nine months ended September 30, 2016 is as follows:GeneralEldorado Resorts, Inc. (“ERI” or the “Company”), a Nevada corporation, was formed in September 2013. ERI and its subsidiaries are collectively referred to as “we,” “us,” “our” or the “Company.” The Company acquired Mountaineer, Presque Isle Downs and Scioto Downs in September 2014, pursuant to a merger (the “MTR Merger”) with MTR Gaming Group, Inc. (“MTR Gaming”) and in November 2015 we acquired Circus Reno and the interests in the Silver Legacy that we did not own prior to such date (the “Reno Acquisition”).Throughout the three and nine months ended September 30, 2017, ERI owned and operated the following properties:Eldorado Resort Casino Reno (“Eldorado Reno”)—A 814-room hotel, casino and entertainment facility connected via an enclosed skywalk to Silver Legacy and Circus Reno located in downtown Reno, Nevada that includes 1,125 slot machines and 46 table games;Silver Legacy Resort Casino (“Silver Legacy”)—A 1,711-room themed hotel and casino connected via an enclosed skywalk to Eldorado Reno and Circus Reno that includes 1,187 slot machines, 63 table games and a 13 table poker room;Circus Circus Reno (“Circus Reno”)—A 1,571-room hotel-casino and entertainment complex connected via an enclosed skywalk to Eldorado Reno and Silver Legacy that includes 720 slot machines and 26 table games;Eldorado Resort Casino Shreveport (“Eldorado Shreveport”)—A 403-room, all suite art deco-style hotel and tri-level riverboat dockside casino situated on the Red River in Shreveport, Louisiana that includes 1,397 slot machines, 52 table games and an eight table poker room;Mountaineer Casino, Racetrack & Resort (“Mountaineer”)—A 357-room hotel, casino and entertainment facility and live thoroughbred horse racing located on the Ohio River at the northern tip of West Virginia’s northwestern panhandle that includes 1,505 slot machines, 36 table games and a 10 table poker room;Presque Isle Downs & Casino (“Presque Isle Downs”)—A casino and live thoroughbred horse racing facility with 1,596 slot machines, 32 table games and a seven table poker room located in Erie, Pennsylvania; andEldorado Gaming Scioto Downs (“Scioto Downs”)—A modern “racino” offering 2,245 video lottery terminals (“VLT”), harness racing and a 118-room third party hotel connected to Scioto Downs located 15 minutes from downtown Columbus, Ohio.In addition, on May 1, 2017, the Company consummated its acquisition of Isle of Capri Casinos, Inc. in 2017, Tropicana Entertainment, Inc. in 2018, Caesars Entertainment Corporation in 2020 and acquiredWilliam Hill PLC in 2021. Our ticker symbol on the following properties:Isle Casino Hotel—Black Hawk (“Isle Black Hawk”)—A land-based casino onWe own, lease, brand, or manage an aggregate of 53 domestic properties in 18 states with approximately 10-acre site in Black Hawk, Colorado that includes 99350,500 slot machines, 27 table games, a nine table poker roomvideo lottery terminals and a 238-room hotel;Lady Luck Casino—Black Hawk (“Lady Luck Black Hawk”)—A land-based casino across the intersection from Isle Casino Hotel in Black Hawk, Colorado, that includes 430 slot machines, 10 table games, five poker tables and a 164-room hotel with a parking structure connecting Isle Casino Hotel-Black Hawk and Lady Luck Casino-Black Hawk;Isle Casino Racing Pompano Park (“Pompano”)—A casino and harness racing track on ane-tables, approximately 223-acre owned site in Pompano Beach, Florida, that includes 1,459 slot machines and a 45 table poker room;Isle Casino Bettendorf (“Bettendorf”)—A land-based single-level casino located off of Interstate 74 in Bettendorf, Iowa that includes 978 slot machines and 20 table games with two hotel towers with 509 hotel rooms;Isle Casino Waterloo (“Waterloo”)—A single-level land-based casino in Waterloo, Iowa that includes 940 slot machines, 252,700 table games and a 194-room hotel;IsleAs of Capri Casino Hotel Lake Charles (“Lake Charles”)—A gaming vessel on an approximately 19 acre site in Lake Charles, Louisiana, with 1,160 slot machines, 49 table games, including 13 poker tablesMarch 31, 2024, we owned 22 of our casinos and two hotels offering 493 rooms;Isle of Capri Casino Lula (“Lula”)—Two docksideleased 24 casinos in Lula, Mississippithe U.S. We lease 18 casinos from VICI Properties L.P., a Delaware limited partnership (“VICI”), pursuant to a regional lease, a Las Vegas lease and a Joliet lease (the “VICI Leases”). In addition, we lease six casinos from GLP Capital, L.P., the operating partnership of Gaming and Leisure Properties, Inc. (“GLPI”) pursuant to a Master Lease (as amended, the “GLPI Master Lease”) and a Lumière lease associated with 879 slot machinesour Horseshoe St. Louis property (together with the GLPI Master Lease, the “GLPI Leases”).20 table games, two on-site hotelsconduct retail and online sports wagering across 31 jurisdictions in North America, 26 of which offer online sports betting. Additionally, we operate iGaming in five jurisdictions in North America. The map below illustrates Caesars Digital’s presence as of March 31, 2024: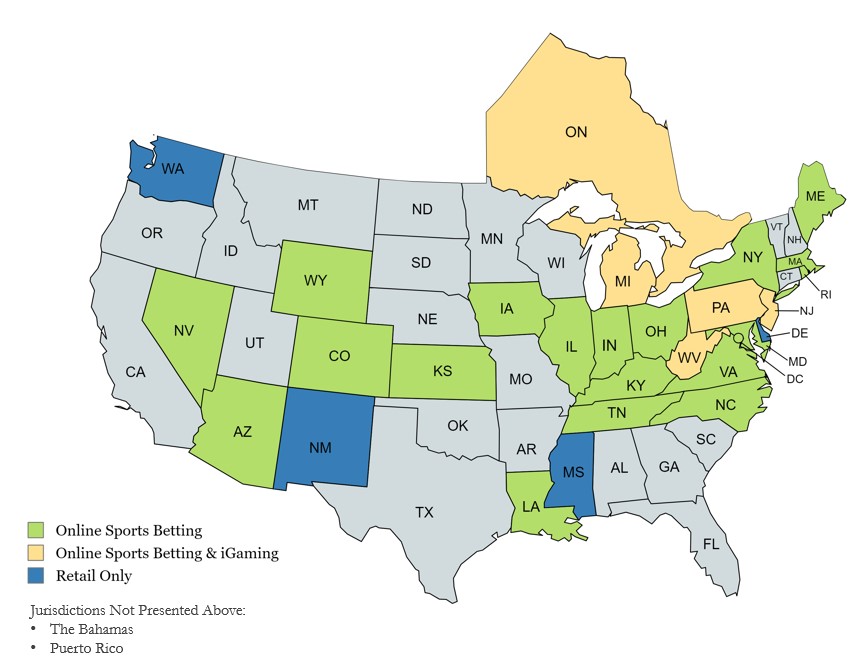
486 rooms and a 28-space RV Park;Lady Luck Casino Vicksburg (“Vicksburg”)—A dockside casino in Vicksburg, Mississippi that includes 619 slot machines, nine table games and a hotel with a total of 89 rooms;•Isle of Capri Casino Boonville (“Boonville”)—A single-level dockside casino in Boonville, Missouri that includes 893 slot machines, 20 table games and a 140-room hotel;Isle Casino Cape Girardeau (“Cape Girardeau”)—A dockside casino and pavilion and entertainment center in Cape Girardeau, Missouri that includes 881 slot machines, 20 table games and four poker tables;Lady Luck Casino Caruthersville (“Caruthersville”)—A riverboat casino located alongapproximately $69 million. We have no further obligation to contribute additional real estate or cash. During the Mississippi River in Caruthersville, Missouri that includes 513 slot machines and nine table games;Isle of Capri Casino Kansas City (“Kansas City”)—A dockside casino located close to downtown Kansas City, Missouri offering 967 slot machines and 18 table games; andLady Luck Casino Nemacolin (“Nemacolin”)—A casino property located on the 2,000-acre Nemacolin Woodlands Resort in Western Pennsylvania that includes 600 slot machines and 28 table games.On August 22, 2016, Isle entered into an agreement to sell Lake Charles for aggregate consideration of $134.5 million, subject to certain adjustments. The transaction (the “Lake Charles Disposition”) remains subject to Louisiana Gaming Control Board approval and other customary closing conditions and, if obtained, the transaction is expected to be completed byyear ended December 31, 2017.Acquisition of Isle of Capri Casinos, Inc.On May 1, 2017 (the “Isle Acquisition Date”), the Company completed its acquisition of Isle of Capri Casinos, Inc. pursuant to the Agreement and Plan of Merger (the “Merger Agreement”) dated as of September 19, 2016 with Isle of Capri Casinos, Inc., a Delaware corporation (“Isle” or “Isle of Capri”), Eagle I Acquisition Corp., a Delaware corporation and a direct wholly-owned subsidiary of the Company, and Eagle II Acquisition Company LLC, a Delaware limited liability company and a direct wholly-owned subsidiary of the Company (the “Isle Acquisition” or the “Isle Merger”). As a result of the Isle Merger, Isle became a wholly-owned subsidiary of ERI and, at the effective time of the Isle Merger, each outstanding share of Isle’s stock converted into the right to receive $23.00 in cash or 1.638 shares of ERI common stock (the “Stock Consideration”), at the election of the applicable Isle shareholder and subject to proration such that the outstanding shares of Isle common stock were exchanged for aggregate consideration comprised of 58% cash, or $552.0 million, and 42% ERI common stock, or 28.5 million newly issued shares of ERI common stock. The total purchase consideration was $1.93 billion.In connection with the Isle Acquisition, the Company completed a debt financing transaction comprised of: (a) a senior secured credit facility in an aggregate principal amount of $1.75 billion with a (i) term loan facility of $1.45 billion and (ii) revolving credit facility of $300.0 million and (b) $375.02023, we recorded $64 million of senior unsecured notes. The proceeds of such borrowings were used (v) to pay the cash portion of the consideration payable in the Isle Merger, (w) refinance all of Isle’s existing credit facilities, (x) redeem or otherwise repurchase all of Isle’s senior and senior subordinated notes, (y) refinance the Company’s existing credit facility and (z) pay transaction fees and expensesincome related to the foregoing.The financial information includedinvestment, primarily due to the joint venture’s gain on the sale of a land parcel. As of both March 31, 2024 and December 31, 2023, our investment in the joint venture was $147 million and is recorded in Investments in and advances to unconsolidated affiliates on the Balance Sheets.Item 2 for periods prior to the Isle MergerMD&A are those of ERI and its subsidiaries. The presentation of information herein for periods prior to the Isle Merger and after the Isle Merger are not fully comparable because the results of operations for Isle are not included for periods prior to the Isle Merger. Summary financial results of Isle for the three and nine months ended January 22, 2017 are included in Isle’s Quarterly Report on Form 10-Q as filedpresented consistent with the Securities and Exchange Commission (‘‘SEC’’). In conjunction with the Isle Acquisition, Isle is no longer required to file quarterly and annual reports with the SEC, and terminated its registration on May 11, 2017.The executive decision maker ofway our Companymanagement reviews operating results, assessassesses performance and makemakes decisions on a “significant market” basis. The Company’s managementManagement views each of its propertiesthe Company’s casinos as an operating segment. Operating segments are aggregated based on their similar economic characteristics, types of customers, types of services and products provided, the regulatory environments in which they operate, and their management and reporting structure. Prior to the Isle Acquisition, the Company’sOur principal operating activities occurred in three geographic regions: Nevada, Louisiana and parts of the eastern United States. The Company aggregated its operations into three reportable segments based on the similar characteristics of the operating segments within the regions in which they operated as follows:SegmentPropertyStateNevadaEldorado RenoNevadaSilver LegacyNevadaCircus RenoNevadaLouisianaEldorado ShreveportLouisianaEasternPresque Isle DownsPennsylvaniaScioto DownsOhioMountaineerWest VirginiaFollowing the Isle Acquisition, the Company’s principal operating activities expanded and now occur in four geographic regionsreportable segments: (1) Las Vegas, (2) Regional, (3) Caesars Digital, and reportable segments based on(4) Managed and Branded, in addition to Corporate and Other.similar characteristicsperiods after our completed divestiture of Rio All-Suite Hotel & Casino (“Rio”) in the third quarter of 2023 is not fully comparable to the periods prior to such divestiture.operating segments withinfactors described in the regionspreceding paragraph and the changing competitive landscape in which they operate. The following table summarizeseach of our current segments:markets, including changes in market and societal trends, as well as by factors discussed elsewhere herein. We recommend that you read this MD&A in conjunction with our unaudited Financial Statements and the notes to those statements included in this Quarterly Report on Form 10-Q.SegmentPropertyStateWestEldorado RenoNevadaSilver LegacyNevadaCircus RenoNevadaIsle Black HawkColoradoLady Luck Black HawkColoradoMidwestWaterlooIowaBettendorfIowaBoonvilleMissouriCape GirardeauMissouriCaruthersvilleMissouriKansas CityMissouriSouthPompanoFloridaEldorado ShreveportLouisianaLulaMississippiVicksburgMississippiEastPresque Isle DownsPennsylvaniaNemacolinPennsylvaniaScioto DownsOhioMountaineerWest Virginiabutour retail and online sports betting, as well as our online gaming. Additionally, we useutilize our hotels, restaurants, bars, entertainment venues, retail shops, racing and other services to attract customers to our properties. Our operating results are highly dependent on the volume and quality of customers visiting and staying at, or visiting, our properties. properties and using our sports betting and iGaming applications.table games drop and slotor handle, which refer to amounts wagered by our customers. The amount of volume we retain, which is not fully controllable by us, is recognized as casino revenues and is referred to as our win or hold. Slot win percentage is typically in the range of approximately 9% to 11% of slot handle for both the Las Vegas and Regional segments. Table game hold percentage is typically in the range of approximately 16% to 23% of table game drop in both the Las Vegas and Regional segments. Sports betting hold is typically in the range of 5% to 10% and iGaming hold typically ranges from 3% to 5%. In addition, hotel occupancy, and price per room designated bywhich is the average daily rate (“ADR”) arepercentage of available hotel rooms occupied during a period, is a key indicatorsindicator for our hotel business. Our calculationbusiness in the Las Vegas segment. See “Results of ADR consists of the average price of occupiedrooms per day including the impact of resort feesOperations” section below. Complimentary and complimentary rooms. Complimentary room rates are determined based on an analysis of retail or cash rates for each customer segment and each type of room product to estimate complimentary rates which are consistent with retail rates. Complimentary rates are reviewed at least annually and on an interim basis if there are significant changes in market conditions. Complimentarydiscounted rooms are treated as occupied rooms in our calculation of hotel occupancy.and nine months ended September 30, 2017March 31, 2024 and 2016.2023:Isle Acquisition – Our resultsand nine months ended September 30, 2017 include incremental revenuesMarch 31, 2024 and expenses for five months (May through September 2017) attributable2023, we increased our promotional spend with the launch of Caesars Sportsbook in North Carolina in March 2024 and Ohio and Massachusetts in January and March 2023, respectively. We adjust our level of investment during the launch period in new jurisdictions based, in part, on prior experience and do not expect such investment to continue at elevated levels subsequent to the twelve propertiesinitial launch periods.acquired inrefinanced $4.4 billion of debt for both periods. See Liquidity and Capital Resources below for 2024 transaction. As a result of these transactions, we recorded loss on early extinguishment of debt on the Isle Acquisition.Acquisition charges related to the Isle Acquisition for legal, accounting, financial advisory services, severance, stock awards and other costs totaled $2.1Statements of Operations of$48 million and $89.2 million for the three and nine months ended September 30, 2017, respectively, and $0.1 million and $0.6 million for the three and nine months ended September 30, 2016.On September 13, 2017, we issued an additional $500 million in aggregate principal amount of 6% Senior Notes at an issue price equal to 105.5% of the principal amount. We used the proceeds of the offering to repay all of the outstanding borrowings under the New Revolving Credit Facility totaling $78.0 million and used the remainder to repay outstanding borrowings totaling $444.5 million under the New Term Loan plus related accrued interest. We recognized a loss of $10.0$197 million, for the three months ended September 30, 2017 as a result ofMarch 31, 2024 and 2023, respectively.issuance of additional debt and retirement of existing debt.Severe Weather – During the third quarter of 2017, Hurricanes Harvey and Irma negatively impactedrelated effects on travel, our South region, specifically our Pompano and Eldorado Shreveport properties, and made travel to those properties impossible or difficult. While Pompano did not sustain any major physical damage, we incurred incremental expenses as a result of the storms and were forced to close the casino for four days and experienced disruption to our business for a longer period of time.Our West segment’s operations are subject to seasonal variation, with our lowest business volume generally occurring during the winter months. The northern Nevada region experienced record snowfall and severe weather conditions, including major snow storms during eleven of the fourteen weekends in the 2017 first quarter, making travel to Reno from northern California, our main feeder market, difficult or impossible due to road closures. As a result, there was a significant adverse effect on business levels, especially hotel occupancy and gaming volume,customers, and our operating performance for the nine months ended September 30, 2017 compared to the same prior year period.Execution of Cost Savings Program – We continue to identify areas to improve property level and consolidated margins through operating and cost efficiencies and exercising financial discipline throughout the Company without impacting the guest experience. In addition to cost savings relating to duplicative executive compensation, legal and accounting fees and other corporate expenses that have been eliminated as a result of the MTR Merger, Reno Acquisition and Isle Acquisition, we have achieved savings in marketing, food and beverage costs, selling, general and administrative expenses, and other operating departments as a result of operating efficiencies and purchasing power of the combined Eldorado organization.Property Enhancement Capital Expenditures – Property enhancement initiatives continued throughout 2016 and into 2017. At Presque Isle Downs, we opened The Brew Brothers in May 2016 and an escalator in July to improve traffic flow to the restaurant. In June 2016, we opened a second smoking patio at Scioto Downs which features a casino bar and 119 new VLTs. In Shreveport, we completed the remodel of the second floor of the casino in December 2016 and added approximately 20 new slot machines. We improved the offerings at Mountaineer with a goal of maintaining a positive customer experience while right sizing the property to maximize free cash flow and operational efficiencies.In September 2016, the Company announced that it plans to invest more than $50 million in facility enhancements to Eldorado Reno, Silver Legacy and Circus Reno. Eldorado’s master plan for the three connected properties, which span eight city blocks in downtown Reno, will be phased over three years, and commenced in the fourth quarter of 2016. Inaddition to the renovation of our guest rooms across the Tri-Properties, each of the three resorts will introduce new restaurant concepts, reinvigorated nightlife and resort amenities. In September 2016, Silver Legacy opened a new $2.0 million 8,500 square foot sports book. Also, in the fourth quarter of 2016, we completed the renovation of the Carnival Midway and opened El Jefe’s Cantina Mexican restaurant and bar at Circus Reno. We also opened Hidden Pizza, a New York style pizza restaurant, at Eldorado Reno.Throughout 2017, capital improvements continued at the Tri-Properties including the renovation of approximately 600 guest rooms at Circus Reno and 153 rooms at Eldorado Reno. Property enhancements that are either already completed or that are expected to come online prior to the end of 2017 include a new poker room and Canter’s Delicatessen at Silver Legacy, new food court with Habit Burger®, Piezzetta Pizza Kitchen® and Panda Express®, 6,700 square foot video arcade, party rooms and bar, renovation of approximately 648 guest rooms, Kanpai Sushi and a new Madame Butterworks Curious Café at Circus Reno, the addition of Starbucks café and showroom renovation at Eldorado Reno and new public spaces across all three properties.A 118-room Hampton Inn Hotel at Scioto Downs developed by a third party opened on March 2017 and since opening continues to drive visitation and spend at the property.With the completion of the Isle Acquisition, we continue to evaluate capital improvement plans across the newly acquired properties.New Regulation – Effective January 1, 2016, the Ohio Lottery Commission enacted new regulation which resulted in the establishment of a $1.0 million progressive slot liability and a corresponding decrease in net slot win for the nine months ended September 30, 2016. The changes are non-cash and related to jackpots established in prior years. The net non-cash impact to Scioto Down’s operating income was $0.6 million for the nine months ended September 30, 2016.operations (dollars in thousands):operations:Three Months Ended March 31, (Dollars in millions) 2024 2023 Net revenues: Las Vegas $ 1,028 $ 1,131 Regional 1,365 1,389 Caesars Digital 282 238 Managed and Branded 68 69 (1) 3 Total $ 2,742 $ 2,830 Net loss $ (142) $ (136) Las Vegas $ 440 $ 533 Regional 433 448 Caesars Digital 5 (4) Managed and Branded 18 19 (43) (38) Total $ 853 $ 958 Net loss margin (5.2) % (4.8) % Adjusted EBITDA margin 31.1 % 33.9 % Operating Results. Isle contributed $201.1 million$335.3 millionOther includes revenues related to certain licensing arrangements and various revenue sharing agreements. Corporate and Other Adjusted EBITDA includes corporate overhead costs, which consist of net revenuescertain expenses, such as: payroll, professional fees and other general and administrative expenses.September 30, 2017March 31, 2024 and 2023” discussion later in this MD&A for a definition of Adjusted EBITDA and a reconciliation of net income (loss) to Adjusted EBITDA.period from the Isle Acquisition Date through September 30, 2017, respectively, consisting primarily of gaming revenues. Including the incremental Isle net operatingthree months ended March 31, 2024 and 2023Three Months Ended March 31, Percent Change (Dollars in millions) 2024 2023 Variance Casino $ 1,535 $ 1,585 $ (50) (3.2) % Food and beverage 422 427 (5) (1.2) % Hotel 493 503 (10) (2.0) % Other 292 315 (23) (7.3) % Net revenues $ 2,742 $ 2,830 $ (88) (3.1) % increased 84.2% and 45.8%, respectively, for the three and nine months ended September 30, 2017 compared to the same prior year periods.Operating income increased 180.8%decreased for the three months ended September 30, 2017March 31, 2024 primarily due to a decline in casino revenues in our Las Vegas segment driven by lower table game hold in addition to the decrease in gaming volume associated with the divestiture of Rio in the third quarter of 2023 and unfavorable timing of major city-wide conventions for the current quarter compared to the same prior year period. This increaseAdditionally, our Regional segment was primarily dueimpacted by inclement weather in several of our regional property locations during the current quarter causing declines in gaming volume. These results were partially offset by improved performance in our Caesars Digital segment and net revenues generated from the opening of our temporary gaming facilities at Caesars Virginia and Harrah’s Columbus Nebraska during the second quarter in 2023.Three Months Ended March 31, Percent Change (Dollars in millions) 2024 2023 Variance Casino $ 852 $ 828 $ 24 2.9 % Food and beverage 263 251 12 4.8 % Hotel 137 137 — — % Other 94 107 (13) (12.1) % General and administrative 500 509 (9) (1.8) % Corporate 78 79 (1) (1.3) % Depreciation and amortization 327 300 27 9.0 % Transaction and other costs, net 6 16 (10) (62.5) % Total operating expenses $ 2,257 $ 2,227 $ 30 1.3 % $39.0 millionour Caesars Digital segment. Food and beverage expenses consist principally of operating income contributed by Islesalaries and wages and costs of goods sold associated with our food and beverage operations. Hotel expenses consist principally of salaries, wages and supplies associated with our hotel operations. Other expenses consist principally of salaries and wages, costs of goods sold and professional talent fees associated with our retail, entertainment and other operations.September 30, 2017. Operating income decreased 19.8% for the nine months ended September 30, 2017 compared to the same prior year period. This decrease was primarily due to acquisition charges related to the Isle Acquisition totaling $89.2 million for the nine months ended September 30, 2017 and was partially offset by $46.3 million of operating income contributed by Isle for the period from the Isle Acquisition Date through September 30, 2017.Net income increased 205.2% for the three months ended September 30, 2017March 31, 2024 as compared to the same prior year period in connection with increased revenues in our Caesars Digital segment. Additionally, our Las Vegas segment’s casino expenses increased for the three months ended March 31, 2024 due to promotional costs associated with special events held over the Super Bowl weekend. We continue to strategically manage our marketing and advertising spend to reduce our casino expenses related to our Caesars Digital segment. Food and beverage expenses have increased mainly due to higher union and non-union wages in addition to increased employee head count in our Las Vegas segment associated with new food and beverage offerings. We continue to focus on labor efficiencies to manage rising labor costs.factors impacting operating income. This increase was partially offset by higher interest expense associated with additional debt in conjunction withprior year period primarily related to recently completed construction projects.Isle Acquisition, the lossthree months ended March 31, 2024 primarily includes non-cash losses on the early retirementwrite down and disposal of debt recorded during the current periodassets and by the recorded income tax provision of $11.6 million. Net income decreased 166.1%non-cash changes in equity method investments. Transaction and other costs, net for the ninethree months ended September 30, 2017March 31, 2023 primarily includes pre-opening costs in connection with new property openings, professional services for integration activities and non-cash changes in equity method investments.Three Months Ended March 31, Percent Change (Dollars in millions) 2024 2023 Variance Interest expense, net $ (590) $ (594) $ 4 0.7 % Loss on extinguishment of debt (48) (197) 149 75.6 % Other income 26 3 23 * Benefit (provision) for income taxes (15) 49 (64) * $89.2 milliona decrease of acquisition chargesinterest expense related to debt service from our efforts to reduce outstanding debt and additional capitalized interest resulting from the ongoing construction of our new permanent facilities. This was slightly offset by the increase from the annual rent escalator associated with our VICI Leases.Isle Acquisition combined with higher interest expensethree months ended March 31, 2024, loss on extinguishment of debt was primarily related to the prepayments of the CEI Senior Secured Notes due 2025 and the Caesars Resort Collection (“CRC”) Senior Secured Notes. For the three months ended March 31, 2023, loss on the early retirementextinguishment of debt offsetting incremental operating income and income tax benefit of $27.6 million.Net Revenues and Operating Income (Loss)The following table highlights our net revenues and operating income (loss) by reportable segment (dollars in thousands):Three Months Ended September 30, 2017 Comparedwas primarily related to the Three Months Ended September 30, 2016Net revenuesprepayments of the CRC Term Loan and operating expenses were as follows (dollars in thousands):Gaming Revenues and Pari-Mutuel Commissions. Isle contributed $187.5 million of gaming revenues and pari-mutuel commissionsOther income for the three months ended September 30, 2017 consistingMarch 31, 2024 primarily represents a change in estimate of slot and table games revenues. As a result, gaming revenues and pari-mutuel commissions increased 98.3%our disputed claims liability.September 30, 2017March 31, 2024 differed from the expected income tax benefit based on the federal tax rate of 21% primarily due to an increase in federal and state valuation allowances against the deferred tax assets for excess business interest expense.Three Months Ended March 31, Percent Change (Dollars in millions) 2024 2023 Variance Net revenues: Casino $ 239 $ 309 $ (70) (22.7) % Food and beverage 287 290 (3) (1.0) % Hotel 362 373 (11) (2.9) % Other 140 159 (19) (11.9) % Net revenues $ 1,028 $ 1,131 $ (103) (9.1) % Table game drop $ 842 $ 939 $ (97) (10.3) % Table game hold % 18.2 % 22.1 % (3.9) pts Slot handle $ 2,549 $ 2,749 $ (200) (7.3) % Hotel occupancy 97.6 % 95.4 % 2.2 pts Adjusted EBITDA $ 440 $ 533 $ (93) (17.4) % Adjusted EBITDA margin 42.8 % 47.1 % (4.3) pts Net income attributable to Caesars $ 198 $ 293 $ (95) (32.4) % Excluding incremental Isle gaming Net revenues and pari-mutuel commissionswere negatively impacted by lower casino volumes associated with the divestiture of $187.5 million, gaming revenues and pari-mutuel commissions declined 1.3% for the three months ended September 30, 2017 compared to the same prior year period. GrowthRio in the West segment attributable to a strong Reno market was offset by a decrease in gaming revenues in the South segment while the East segment remained flat. Reductions in gaming volume driven by decreased high-end playthird quarter of 2023 and the impactunfavorable timing of severe negatively affectedthe South segment. Additionally, a historically low table games hold percentage at Shreveport duringmajor city-wide conventions for the current quarter compared to the same prior year period. In addition, table game hold decreased significantly from the high end of our typical range for the same prior year period to the lower end of our expected range. The Las Vegas segment was also drovenegatively impacted by higher operating costs associated with (a) higher union and non-union wages, (b) increased employee head count associated with new food and beverage offerings and (c) increased promotional costs associated with special events held over the declineSuper Bowl weekend. Other revenue decreased primarily due to lower entertainment revenues from a reduction in casino revenuesheadliner performances in the South segment. Efforts to eliminate unprofitable gaming play via reductions in marketing promotions and incentives across all segments also contributed to the declines in casino volume and positively impacted operating margins for the three months ended September 30, 2017current quarter, compared to the same prior year period.Non-gaming Revenues. Isle contributed $29.2 millionThree Months Ended March 31, Percent Change (Dollars in millions) 2024 2023 Variance Net revenues: Casino $ 1,031 $ 1,058 $ (27) (2.6) % Food and beverage 135 137 (2) (1.5) % Hotel 131 130 1 0.8 % Other 68 64 4 6.3 % Net revenues $ 1,365 $ 1,389 $ (24) (1.7) % Table game drop $ 1,015 $ 1,013 $ 2 0.2 % Table game hold % 21.3 % 21.6 % (0.3) pts Slot handle $ 10,216 $ 10,552 $ (336) (3.2) % Adjusted EBITDA $ 433 $ 448 $ (15) (3.3) % Adjusted EBITDA margin 31.7 % 32.3 % (0.6) pts Net income attributable to Caesars $ 41 $ 75 $ (34) (45.3) % September 30, 2017 resulting in an increase of 40.7% in non-gaming revenues over the same prior year period.Excluding incremental Isle non-gaming revenues of $29.2 million, non-gaming revenues increased 3.4% for the three months ended September 30, 2017 compared to the same prior year period. The West segment increased for the three months ended September 30, 2017 compared to the same prior year period principally due to higher hotel, food and beverage revenuesMarch 31, 2024, as a result of increased visitor traffic and benefitted from the Reno properties’ capital improvements including renovated hotel rooms and new food, beverage and entertainment offerings. The South segment decreased in non-gaming revenues for the three months ended September 30, 2017 compared to the same prior year period, primarily due to decreased foodinclement weather in several of our regional property locations that negatively impacted visitor volume. The Regional segment has also experienced declines in gaming volume from a shift in customer mix as our higher rated play has remained steady with some growth, offset slightly by a reduction in lower tiered and beverage revenuesunrated play. Additionally, the continued impact of competition associated with revisionsnew casino resorts opening in some of our regional markets and ongoing construction disruption from renovation projects at certain of our properties within the segment contributed to complimentary food offers. The Eastthe decline in casino revenues. These negative factors were partially offset by the opening of our temporary gaming facilities at Caesars Virginia and Harrah’s Columbus Nebraska during the second quarter in 2023. decreased for the three months ended September 30, 2017 comparedMarch 31, 2024 was within our typical range.Three Months Ended March 31, Percent Change (Dollars in millions) 2024 2023 Variance Net revenues: $ 266 $ 219 $ 47 21.5 % Other 16 19 (3) (15.8) % Net revenues $ 282 $ 238 $ 44 18.5 % $ 3,379 $ 3,401 $ (22) (0.6) % Sports betting hold % 6.7 % 6.2 % 0.5 pts iGaming handle $ 3,498 $ 2,414 $ 1,084 44.9 % iGaming hold % 3.3 % 3.1 % 0.2 pts Adjusted EBITDA $ 5 $ (4) $ 9 * Adjusted EBITDA margin 1.8 % (1.7) % * Net loss attributable to Caesars $ (34) $ (32) $ (2) (6.3) % the same prior year period in non-gaming revenues primarily due to decreased foodsports betting, iGaming, and beverage revenues resulting from reductions in complimentary food offeringspoker of $86 million and the consolidation of restaurants in an effort to maximize capacity utilization.Promotional Allowances. Promotional allowances, expressed as a percentage of gaming revenues and pari-mutuel commissions, decreased to 10.2%$77 million for the three months ended September 30, 2017 compared to 13.1%March 31, 2024 and 2023, respectively. Promotional and complimentary incentives for the same prior year period. This decline was primarily due to strategic revisions to reduce unprofitable promotional offers across all segments combined with the incremental revenues contributed by the Isle properties which historically have lower promotional allowances as a percentage of gaming revenues.Gaming Expensespoker were $3 million and Pari-Mutuel Commissions. Isle contributed $88.5$4 million of gaming expenses and pari-mutuel commissions for the three months ended September 30, 2017 resulting inMarch 31, 2024 and 2023, respectively.increaseadditional $279 million and $328 million of 77.4% in gaming expenses and pari-mutuel commissions over the same prior year period.Excluding incremental Isle gaming expenses and pari-mutuel commissions, gaming expenses and pari-mutuel commissions decreased 5.5%sports betting handle for the three months ended September 30, 2017March 31, 2024 and 2023, respectively, which is not included in this table, for select wholly-owned and third-party operations for which Caesars Digital provides services and we receive all, or a share of, the net profits. Hold related to these operations was 9.8% and 10.4%, for the three months ended March 31, 2024 and 2023, respectively. Sports betting handle includes $11 million and $12 million for the three months ended March 31, 2024 and 2023, respectively, related to horse racing and pari-mutuel wagers.declines in gaming volume in the Southhigher iGaming handle and East segments combined with savings initiatives targeted at reducing variable expenses along with continued synergies related to the integration of the Tri-Properties in the West segment. Additionally, successful efforts to control costs and maximize departmental profit across all segments also drove the decline in expenses during the current period.Non-gaming Expenses. Isle contributed $9.9 million of non-gaming expenseshold. Sports betting hold improved for the three months ended September 30, 2017 resulting in an increase of 22.3% over the sameMarch 31, 2024 compared to prior year, period.Excluding incremental Isle non-gaminghowever, it remains at the lower end of our expected range due to less favorable hold during large sporting events in the current quarter. Both current year and prior year periods were negatively impacted with increased promotional spend during the launch of Caesars Sportsbook in North Carolina in March of 2024 and Ohio and Massachusetts in January and March of 2023, respectively.non-gaming expenses decreased 5.5%in highly competitive markets during promotional periods may negatively impact Caesars Digital’s net revenues, net income, Adjusted EBITDA and Adjusted EBITDA margin in comparison to current or prior periods.September 30, 2017 comparedMarch 31, 2024 were within our typical range.Three Months Ended March 31, Percent Change (Dollars in millions) 2024 2023 Variance Net revenues: Other $ 68 $ 69 $ (1) (1.4) % Net revenues $ 68 $ 69 $ (1) (1.4) % Adjusted EBITDA $ 18 $ 19 $ (1) (5.3) % Adjusted EBITDA margin 26.5 % 27.5 % (1) pts Net income attributable to Caesars $ 18 $ 19 $ (1) (5.3) % same prior year period. Increased expenses associated with higher non-gaminguse of certain of our brands. These revenue agreements typically include reimbursement of certain costs that we incur directly. Such costs are primarily related to payroll costs incurred on behalf of the properties under management. The revenue related to these reimbursable management costs has a direct impact on our evaluation of Adjusted EBITDA margin which, when excluded, reflects margins typically realized from such agreements. The table below presents the amount included in net revenues and hotel occupancy in the West segment were offset by lower non-gamingtotal operating expenses in the South and East segments. Additionally, the growth in hotel ADR in the West segment contributed to improved non-gaming margins.Marketing and Promotions Expenses. Isle contributed $12.1 million of marketing and promotions expense for the three months ended September 30, 2017 resulting in an increase of 117.6% over the same prior year period. Excluding incremental Isle marketing and promotions expenses, consolidated marketing and promotions expense increased 10.6% for the three months ended September 30, 2017 compared to the same prior year period. This increase was primarily attributable to increased expenses resulting from higher internet advertising spend, new television media production promoting new product offerings in the Reno market and a shift in marketing spend to targeted direct mail and promotional offers across all segments. Additionally, marketing promotional costs associated with casino initiatives are charged to this category to provide consistency among properties following the Isle Acquisition.General and Administrative Expenses. Isle contributed $35.5 million of general and administrative expense for the three months ended September 30, 2017 resulting in an increase of 101.2% over the same prior year period. Excluding incremental Isle general and administrative expenses, consolidated general and administrative expenses decreased 3.0% for the three months ended September 30, 2017 compared to the same 2016 period primarily due to savings in property and general liability insurance costs and payroll and related benefit cost savings programs across all segments.Corporate Expenses. For the three months ended September 30, 2017 compared to the same prior year period, corporate expenses increased primarily due to payroll and other expenses associated with additional corporate costs driven by growth related to the recent Isle Acquisition. Additionally, corporate costs rose as a result of higher stock compensation expense for the three months ended September 30, 2017 compared to the same prior year period due to the three year vesting schedule associated with our long-term incentive plan established in 2015 resulting in three years of grants and related expense in the current period versus two years of grants and related expense in the same prior year period.Depreciation and Amortization Expense. Isle contributed $14.9 million of depreciation expense for the three months ended September 30, 2017 resulting in an increase of 84.2% over the same prior year period. Excluding incremental Isle depreciation and amortization expense, depreciation and amortization expense decreased 13.5% for the three months ended September 30, 2017 compared to the same prior year period mainly due to lower depreciation in all segments due to assets becoming fully depreciated.Three Months Ended March 31, Percent Change (Dollars in millions) 2024 2023 Variance Reimbursable management revenue $ 50 $ 50 $ — — % Reimbursable management cost 50 50 — — % Nine Months Ended September 30, 2017 Compared to the Nine Months Ended September 30, 2016Net revenues and operating expenses were as follows (dollars in thousands):Gaming Revenues and Pari-Mutuel Commissions. Isle contributed $312.8 million of gaming revenues and pari-mutuel commissions for the period from the Isle Acquisition Date through September 30, 2017 consisting primarily of slot and table games revenues. As a result, gaming revenues and pari-mutuel commissions increased 55.0% for the nine months ended September 30, 2017 compared to the same prior year period.Excluding incremental Isle gaming revenues and pari-mutuel commissions of $312.8 million, gaming revenues declined 3.0% for the nine months ended September 30, 2017 compared to the same prior year period due to a decrease in gaming revenues across all segments. The decline in the West segment was mainly attributable to decreases in visitor traffic due to severe weather the northern Nevada region experienced throughout the first quarter of 2017 that resulted in limited access from our main feeder markets combinedwith the absence of a major bowling tournament in the Reno market. Additionally, reductions in gaming volume driven by decreased high-end play, the continued weakness in the energy sector, historically lower table games hold percentage impacted the Shreveport market and severe weather in the third quarter of 2017 negatively impacted the South segment in 2017. Efforts to eliminate unprofitable gaming play via reductions in marketing promotions and incentives across the properties also contributed to the declines in casino volume and positively impacted margins across all segments.Non-gaming Revenues. Isle contributed $48.8 million of non-gaming revenues for the period from the Isle Acquisition Date through September 30, 2017 resulting in an increase of 16.8% over the same prior year period.Excluding incremental Isle non-gaming revenues of $48.8 million, non-gaming revenues decreased 5.9% for the nine months ended September 30, 2017 compared to the same prior year period. The West segment declined for the nine months ended September 30, 2017 compared to the same prior year period principally due to lower hotel, food and beverage revenues resulting from reduced customer traffic due to fewer convention room nights and the absence of a major bowling tournament during the current year. The South segment decreased in non-gaming revenues for the nine months ended September 30, 2017 compared to the same prior year period primarily due to decreased food and beverage revenues associated with revisions to marketing strategies resulting in fewer complimentary food offers and severe weather negatively impacting visitation in 2017. Non-gaming revenues in the East segment decreased for the nine months ended September 30, 2017 compared to the same prior year period primarily due to decreased food and beverage revenues resulting from reductions in complimentary food offers and the consolidation of restaurants in an effort to maximize capacity utilization.Promotional Allowances. Promotional allowances, expressed as a percentage of gaming revenues and pari-mutuel commissions, decreased to 10.5% for the nine months ended September 30, 2017 compared to 12.9% for the same prior year period. This decline was primarily due to strategic revisions to promotional offers across all segments combined with the incremental revenues contributed by the Isle properties which historically have lower promotional allowances as a percentage of gaming revenues.Gaming Expenses and Pari-Mutuel Commissions. Isle contributed $148.3 million of gaming expenses and pari-mutuel commissions for the period from the Isle Acquisition Date through September 30, 2017 resulting in an increase of 42.5% over the same prior year period.Excluding incremental Isle gaming expenses and pari-mutuel commissions, gaming expenses and pari-mutuel commissions decreased 5.7% for the nine months ended September 30, 2017 compared to the same prior year period primarily due to decreases in gaming volume combined with savings initiatives targeted at reducing variable expenses along with continued synergies related to the integration of the Reno properties in the West segment. Additionally, successful efforts to control costs and maximize departmental profit across all segments also drove the decline in expenses during the current period. Non-gaming Expenses. Isle contributed $16.5 million of non-gaming expenses for the period from the Isle Acquisition Date through September 30, 2017 resulting in an increase of 5.3% over the same prior year period.Excluding incremental Isle non-gaming expenses, non-gaming expenses decreased 10.5% for the nine months ended September 30, 2017 compared to the same prior year period across all segments in conjunction with non-gaming revenue declines.Marketing and Promotions Expenses. Isle contributed $20.5 million of marketing and promotions expense for the period from the Isle Acquisition Date through September 30, 2017 resulting in an increase of 78.9% over the same prior year period.Excluding incremental Isle marketing and promotions expenses, consolidated marketing and promotions expense increased 11.8% for the nine months ended September 30, 2017 compared to the same prior year period. This increase was primarily attributable to increased marketing promotional costs associated with casino initiatives that are charged to this category to provide consistency among properties following the Isle Acquisition. Additionally, expenses resulting from higher internet advertising spend, new television media production promoting new product offerings and a shift in marketing spend to targeted direct mail and promotional offers across all segments.General and Administrative Expenses. Isle contributed $59.8 million of marketing and promotions expense for the period from the Isle Acquisition Date through September 30, 2017 resulting in an increase of 58.7% over the same prior year period. Excluding incremental Isle general and administrative expenses, consolidated general and administrative expenses decreased 2.2% for the nine months ended September 30, 2017 compared to the same 2016 period. Savings associated with lower property and general liability insurance costs were partially offset by higher expenses associated with information systems maintenance contracts and professional services. These incremental costs resulted from information technology infrastructure projects targeted at consolidating systems for future savings and efficiencies.Expenses. For the nine months ended September 30, 2017 compared to the same prior year period, corporate costs increased due to payroll and other expenses associated with additional corporate costs driven by growth related to the Isle acquisition and higher stock compensation expense for the nine months ended September 30, 2017 compared to the same prior year period due to the three year vesting schedule associated with our long-term incentive plan established in 2015 resulting in three years of grants and related expense in the current period versus two years of grants and related expense in the same prior year period.Depreciation and Amortization Expense. Isle contributed $24.4 million of depreciation expense for the period from the Isle Acquisition Date through September 30, 2017 resulting in an increase of 46.3% over the same prior year period. Excluding incremental Isle depreciation and amortization expense, depreciation and amortization expense decreased 6.9% for the nine months ended September 30, 2017 compared to the same prior year period mainly due to lower depreciation in all segments due to assets becoming fully depreciated.
____________________Three Months Ended March 31, Percent Change (Dollars in millions) 2024 2023 Variance Net revenues: Casino $ (1) $ (1) $ — — % Other — 4 (4) (100.0) % Net revenues $ (1) $ 3 $ (4) * Adjusted EBITDA $ (43) $ (38) $ (5) (13.2) % beforeBefore Interest, Taxes, Depreciation and Amortization (“Adjusted EBITDA”) and Adjusted EBITDA for the Three and Nine Months Ended September 30, 2017March 31, 2024 and 2016(defined(described below), a non GAAPnon-GAAP financial measure, has been presented as a supplemental disclosure because it is a widely used measure of performance and basis for valuation of companies in our industry and we believe that this non GAAPnon-GAAP supplemental information will be helpful in understanding the Company’sour ongoing operating results. Management has historically used Adjusted EBITDA when evaluating operating performance because we believe that the inclusion or exclusion of certain recurring and non-recurring items is necessary to provide a full understanding of our core operating results and as a means to evaluate period-to-period results. Adjusted EBITDA represents operatingnet income (loss) before interest income or interest expense net of interest capitalized, (benefit) provision for income taxes, depreciation and amortization, stock basedstock-based compensation expense, (gain) loss on extinguishment of debt, impairment charges, other (income) loss, net income (loss) attributable to noncontrolling interests, transaction expenses, severancecosts associated with our acquisitions, developments, and divestitures, and non-cash changes in equity method investments. Adjusted EBITDA also excludes the expense associated with certain of our leases as these transactions were accounted for as financing obligations and other expenses.the associated expense is included in interest expense. Adjusted EBITDA is not a measure of performance or liquidity calculated in accordance with US GAAP,accounting principles generally accepted in the United States (“GAAP”). Adjusted EBITDA is unaudited and should not be considered an alternative to, or more meaningful than, net income (loss) as an indicator of our operating performance. Uses of cash flows that are not reflected in Adjusted EBITDA include capital expenditures, interest payments, income taxes, debt principal repayments, and certain regulatory gaming assessments,payments under our leases withtabletables summarizes our Adjusted EBITDA for our operating segments for the three and nine months ended September 30, 2017March 31, 2024 and 2016,2023, respectively, in addition to reconciling net income (loss) to Adjusted EBITDA to operating income (loss) in accordance with US GAAP (unaudited,(unaudited):Three Months Ended March 31, (In millions) 2024 2023 Net loss attributable to Caesars $ (158) $ (136) Net income attributable to noncontrolling interests 16 — (Benefit) provision for income taxes 15 (49) (26) (3) Loss on extinguishment of debt 48 197 Interest expense, net 590 594 Depreciation and amortization 327 300 16 28 Stock-based compensation expense 25 27 Adjusted EBITDA 853 958 — (11) Same-Store Adjusted EBITDA $ 853 $ 947 thousands):��
(c)Adjustment for pre-disposition results of operations reflecting the subtraction of results of operations for Rio prior to divestiture on October 2, 2023. Such figures are based on unaudited internal financial statements and have not been reviewed by the Company’s auditors for the periods presented. The additional financial information is included to enable the comparison of current results with results of prior periods.(1)Figures for Isle are the four months ended April 30, 2017, the day before the Company acquired Isle on May 1, 2017. The Company reports its financial results on a calendar fiscal year. Prior to the Company’s acquisition of Isle, Isle’s fiscal year typically ended on the last Sunday in April. Isle’s fiscal 2017 and 2016 were 52-week years, which commenced on April 25, 2016 and April 27, 2015, respectively. Such figures were prepared by the Company to reflect Isle’s unaudited consolidated historical net revenues and Adjusted EBITDA for periods corresponding to the Company’s fiscal quarterly calendar. Such figures are based on the unaudited internal financial statements and have not been reviewed by the Company’s auditors and do not conform to GAAP.(2)Total figures for 2016 and 2017 include combined results of operations for Isle and the Company for periods preceding the date that the Company acquired Isle. Such presentation does not conform with GAAP or the Securities and Exchange Commission rules for proforma presentation; however, we believe that the additional financial information will be helpful to investors in comparing current results with results of prior periods. This is non-GAAP data and should not be considered a substitute for data prepared in accordance with GAAP, but should be viewed in addition to the results of operations reported by the Company.(3)Figures are for Isle for the three and nine months ended September 30, 2016. Such figures were prepared by the Company to reflect Isle’s unaudited consolidated historical net revenues, operating income and Adjusted EBITDA for periods corresponding to the Company’s fiscal quarterly calendar. Such figures are based on the unaudited internal financial statements and have not been reviewed by the Company’s auditors and do not conform to GAAP.(4)Effective January 1, 2016, the Ohio Lottery Commission enacted a regulatory change which resulted in the establishment of a $1.0 million progressive slot liability and a corresponding decrease in net slot win during the first quarter of 2016. The changes are non-cash and related primarily to prior years. The net non-cash impact to Adjusted EBITDA was $0.6 million for the nine months ended September 30, 2016.(5)Transaction expenses for the three and nine months ended September 30, 2017 represent acquisition costs related to the Isle Acquisition. Transaction expenses for the three and nine months ended September 30, 2016 represent acquisition costs related to the Reno Acquisition and includes a credit of $2.0 thousand related to S-1 offering costs.(6)Other is comprised of (gain) loss on the sale or disposal of property, equity in loss of unconsolidated affiliate and other regulatory gaming assessments, including the item listed in footnote (4) above.have beenare existing cash on hand, cash flowflows from operations, availability of borrowings under our revolving credit facility and proceeds from the issuance of debt and equity securities. We closedOur cash requirements may fluctuate significantly depending on our decisions with respect to business acquisitions or divestitures and strategic capital and marketing investments.(In millions) March 31, 2024 Cash and cash equivalents $ 726 2,210 Revolver capacity committed to letters of credit (70) Revolver capacity committed as regulatory requirement (46) Total $ 2,820 Isle Acquisition on May 1, 2017 and paid $552.0 million in cash considerationSecured Overnight Financing Rate (“Term SOFR”), subject to a floor of 0.50% or (b) a base rate (the “TLB-1 Base Rate”) determined by reference to the highest of (i) the “Prime Rate” in the Isle Acquisition, refinancedUnited States, (ii) the outstanding Isle indebtednessfederal funds rate plus 0.50% per annum and paid expenses related(iii) the one-month Term SOFR plus 1.00% per annum, in each case, plus an applicable margin. Such applicable margin is 2.75% per annum in the case of any Term SOFR loan and 1.75% per annum in the case of any TLB-1 Base Rate loan. The CEI Term Loan B-1 was issued at a price of 99.75% of the principal amount and will mature on February 6, 2031.Isle AcquisitionCompany, the subsidiary guarantors party thereto, U.S. Bank Trust Company, National Association, as trustee, and U.S. Bank National Association, as collateral agent. The CEI Senior Secured Notes due 2032 rank equally with all existing and future first-priority lien obligations of the Company and the subsidiary guarantors. The CEI Senior Secured Notes due 2032 will mature on February 15, 2032, with interest payable semi-annually on February 15 and August 15 of each year, commencing August 15, 2024.financing described below.operationexpansion and maintenance of our properties, andtaxes, servicing our outstanding indebtedness. Duringindebtedness, and rent payments under our GLPI Master Lease, the VICI Leases and other leases. We make capital expenditures and perform continuing refurbishment and maintenance at our properties to maintain our quality standards. Our capital expenditure requirements for the remainder of 2017,2024 include expansion projects, hotel renovations and continued investment into new markets with our Caesars Sportsbook and iGaming applications in our Caesars Digital segment. In addition, we planmay, from time to spend $26.8 million on capital expenditures and $8.6 milliontime, seek to pay interest onrepurchase or prepay our outstanding indebtedness. Any such purchases or prepayments may be funded by existing cash balances or the incurrence of debt. The amount and timing of any repurchase will be based on business and market conditions, capital availability, compliance with debt covenants and other considerations.Three Months Ended March 31, 2024 Estimate of Remaining Capital Expenditures for 2024 (In millions) Actual Low High Growth and renovation projects $ 79 $ 250 $ 300 Caesars Digital 24 70 90 Maintenance projects 89 200 300 Total estimated capital expenditures from unrestricted cash 192 520 690 72 230 280 Total $ 264 $ 750 $ 970 generatedflows from operations will be sufficient to fund our operations, and capital requirements and service our outstanding indebtedness for the next twelve months.ERI is a holding companyits only significant assets are ownership interests in its subsidiaries. ERI’s ability to fund its obligations depends on the cash flow of its subsidiaries and the ability of its subsidiaries to distribute or otherwise make funds available to ERI.As of September 30, 2017, we had consolidated cash and cash equivalents of $156.2 million, including restricted cash of $21.3 million.Operating Cash Flow. For the nine months ended September 30, 2017, cash flows provided by operating activities totaled $71.8 million compared to $72.3 million during the same prior year period. Master Lease Covenant Compliancedecrease in operating cash was primarily due to transaction costs associated with the Isle Acquisition offset by a benefit in income taxes in the current year combined with changes in the balance sheet accounts in the normal course of business.Investing Cash Flow and Capital Expenditures. Net cash flows used in investing activities totaled $1.4 billion for the nine months ended September 30, 2017 compared to $27.2 million for the same prior year period. Net cash flows used in investing activities for the nine months ended September 30, 2017 was primarily due to cash paid to acquire Isle in addition to $53.2 million in capital expenditures for various property enhancement and maintenance projects and equipment purchases.Financing Cash Flow. Net cash flows provided by financing activities for the nine months ended September 30, 2017 totaled $1.4 billion compared to $78.7 million used in financing activities for the nine months ended September 30, 2016. This increase was primarily related to the issuance of debt associated with the Isle Acquisition, the refinancing of our Term Loan andCEI Revolving Credit Facility, in May 2017the CEI Term Loan A, the CEI Term Loan B, the CEI Term Loan B-1, and the issuance of additional 6%indentures governing the CEI Senior Secured Notes due 2030, the CEI Senior Secured Notes due 2032, the CEI Senior Notes in September 2107. This increase was partially offset by net payments made on our credit facilities throughoutdue 2027, and the nine months ended September 30, 2017.Debt Obligations7%CEI Senior NotesOn July 23, 2015, due 2029 contain covenants which are standard and customary for these types of agreements. These include negative covenants, which, subject to certain exceptions and baskets, limit our ability to (among other items) incur additional indebtedness, make investments, make restricted payments, including dividends, grant liens, sell assets and make acquisitions.Company issued at par $375.0 million in aggregate principal amountCEI Term Loan A include a maximum net total leverage ratio financial covenant of 7.0% senior notes due 2023 (“7% Senior Notes”) pursuant7.25:1 until December 31, 2024 and 6.50:1 from and after December 31, 2024. In addition, the CEI Revolving Credit Facility and the CEI Term Loan A include a minimum fixed charge coverage ratio financial covenant of 1.75:1 until December 31, 2024 and 2.0:1 from and after December 31, 2024. From and after the repayment of the CEI Term Loan A, the financial covenants applicable to the indenture, dated as of July 23, 2015 (the “Indenture”), betweenCEI Revolving Credit Facility will be tested solely to the Company and U.S. Bank, National Association, as Trustee. The 7% Senior Notes will mature on August 1, 2023,extent that certain testing conditions are satisfied. Failure to comply with interest payable semi-annuallysuch covenants could result in arrears on February 1 and August 1 of each year.On or after August 1, 2018, the Company may redeem all or a portionan acceleration of the 7% Senior Notes upon not less than 30 nor more than 60 days’ notice, atmaturity of indebtedness outstanding under the redemption prices (expressed as percentagesrelevant debt document.unpaid interest and additional interest, if any, on the 7% Senior Notes redeemed, to the applicable redemption date, if redeemed during the twelve month period beginning on August 1 of the years indicated below:Prior to August 1, 2018, the Company may redeem all or a portion of the 7% Senior Notes at a price equal to 100% of the 7% Senior Notes redeemed plus accrued and unpaid interest to the redemption date, plus a make-whole premium. At any time prior to August 1, 2018, the Company is also entitled to redeem up to 35% of the original aggregate principal amount of the 7% Senior Notes with proceeds of certain equity financings at a redemption price equal to 107% of the principal amount of the 7% Senior Notesredeemed, plus accrued and unpaid interest. If the Company experiences certain change of control events (as defined in the Indenture), it must offer to repurchase the 7% Senior Notes at 101% of their principal amount, plus accrued and unpaid interest to the applicable repurchase date. If the Company sells assets under certain circumstances and does not use the proceeds for specified purposes, the Company must offer to repurchase the 7% Senior Notes at 100% of their principal amount, plus accrued and unpaid interest to the applicable repurchase date. The 7% Senior Notes are subject to redemption imposed by gaming laws and regulations of applicable gaming regulatory authorities.The Indenture containsVICI Leases contain certain covenants limiting, among other things, the Company’s ability and the abilityrequiring minimum capital expenditures based on a percentage of its subsidiaries (other than its unrestricted subsidiaries) to:pay dividends or distributions or makenet revenues along with maintaining certain other restricted payments or investments;incur or guarantee additional indebtedness or issue disqualified stock or create subordinated indebtedness that is not subordinated to the 7% Senior Notes or the guarantees of the 7% Senior Notes;create liens;transfer and sell assets;merge, consolidate, or sell, transfer or otherwise dispose of all or substantially all of the Company’s assets;enter into certain transactions with affiliates;engage in lines of business other than the Company’s core business and related businesses; andcreate restrictions on dividends or other payments by restricted subsidiaries.These covenants are subject to a number of exceptions and qualifications as set forth in the Indenture. The Indenture also provides for customary events of default which, if any of them occurs, would permit or require the principal of and accrued interest on such 7% Senior Notes to be declared due and payable. As of September 30, 2017, the Company wasMarch 31, 2024, we were in compliance with all of the applicable financial covenants under the Indenture relating to the 7% Senior Notes.6% Senior NotesOn March 29, 2017, Eagle II Acquisition Company LLC (“Eagle II”),described above.wholly-owned subsidiary of the Company, issued $375.0$150 million aggregate principal amount of 6% Senior Notes due 2025common stock repurchase program (the “6% Senior Notes”“Share Repurchase Program”) pursuant to an indenture, dated aswhich we may, from time to time, repurchase shares of common stock on the open market (either with or without a 10b5-1 plan) or through privately negotiated transactions. The Share Repurchase Program has no time limit and may be suspended or discontinued at any time without notice. There is no minimum number of shares of common stock that we are required to repurchase under the Share Repurchase Program.29, 2017 (the “New Indenture”), between Eagle II and U.S. Bank, National Association, as Trustee. The 6% Senior Notes will mature on April 1, 2025, with interest payable semi-annually in arrears on April 1 and October 1, commencing October 1, 2017. The proceeds31, 2024, we have acquired 223,823 shares of the offering, and additional funds in the amount of $1.9 million in respect of interest expected to be accrued on the 6% Notes, were placed in escrow pending satisfaction of certain conditions, including consummation of the Isle Acquisition. In connection with the consummation of the Isle Acquisition on May 1, 2017, the escrowed funds were released and ERI assumed Eagle II’s obligationscommon stock under the 6% Senior Notes and the New Indenture and certain of the Company’s subsidiaries (including Isle and certain of its subsidiaries) executed guarantees of the Company’s obligations under the 6% Senior Notes.On September 13, 2017, the Company issued an additional $500.0 million principal amount of its 6% Senior NotesShare Repurchase Program at an issue price equal to 105.5%aggregate value of $9 million and an average of $40.80 per share. No shares were repurchased during the principal amount of the 6% Senior Notes. The additional notes were issued pursuant to the New Indenture that governs the 6% Senior Notes. The Company used the proceeds of the offering to repay $78.0 million of outstanding borrowings under the revolving credit facilityused the remainder to repay $444.5 million outstanding borrowings under the term loan facility and related accrued interest. As a result of the offering and retirement of existing debt, the Company recognized a loss of $10.0 million2023.September 30, 2017.On or after April 1, 2020, the Company may redeem all or a portion of the 6% Senior Notes upon not less than 30 nor more than 60 days’ notice, at the redemption prices (expressed as percentages of the principal amount) set forth below plus accrued and unpaid interest and additional interest, if any, on the 6% Senior Notes redeemed, to the applicable redemption date, if redeemed during the 12-month period beginning on April 1 of the years indicated below:Prior to April 1, 2020, the Company may redeem all or a portion of the 6% Senior Notes at a price equal to 100% of the 6% Senior Notes redeemed plus accrued and unpaid interest to the redemption date, plus a make-whole premium. At any time prior to August 1, 2018, the Company is also entitled to redeem up to 35% of the original aggregate principal amount of the 6% Senior Notes with proceeds of certain equity financings at a redemption price equal to 106% of the principal amount of the 6% Senior Notes redeemed, plus accrued and unpaid interest. If the Company experiences certain change of control events (as defined in the New Indenture), it must offer to repurchase the 6% Senior Notes at 101% of their principal amount, plus accrued and unpaid interest to the applicable repurchase date. If the Company sells assets under certain circumstances and does not use the proceeds for specified purposes, the Company must offer to repurchase the 6% Senior Notes at 100% of their principal amount, plus accrued and unpaid interest to the applicable repurchase date.The 6% Senior Notes are subject to redemption imposed by gaming laws and regulations of applicable gaming regulatory authorities.The New Indenture contains certain covenants limiting, among other things, the Company’s ability and the ability of its subsidiaries (other than its unrestricted subsidiaries) to:pay dividends or distributions or make certain other restricted payments or investments;incur or guarantee additional indebtedness or issue disqualified stock or create subordinated indebtedness that is not subordinated to the 6% Senior Notes or the guarantees of the 6% Senior Notes;create liens;transfer and sell assets;merge, consolidate, or sell, transfer or otherwise dispose of all or substantially all of the Company’s assets;enter into certain transactions with affiliates;engage in lines of business other than the Company’s core business and related businesses; andcreate restrictions on dividends or other payments by restricted subsidiaries.These covenants are subject to a number of exceptions and qualifications as set forth in the New Indenture. The New Indenture also provides for customary events of default which, if any of them occurs, would permit or require the principal of and accrued interest on such 6% Senior Notes to be declared due and payable. As of September 30, 2017, the Company was in compliance with all of the covenants under the New Indenture relating to the 6% Senior Notes.Credit FacilityOn July 23, 2015, the Company entered into a new $425.0 million seven year term loan (the “Term Loan”) and a $150.0 million five year revolving credit facility (the “Revolving Credit Facility” and, together with the Term Loan, the “Prior Credit Facility”).The Term Loan bore interest at a rate per annum of, at the Company’s option, either (x) LIBOR plus 3.25%, with a LIBOR floor of 1.0%, or (y) a base rate plus 2.25%. Borrowings under the Revolving Credit Facility bore interest at a rate per annum of, at the Company’s option, either (x) LIBOR plus a spread ranging from 2.5% to 3.25% or (y) a base rate plus a spread ranging from 1.5% to 2.25%, in each case with the spread determined based on the Company’s total leverage ratio. Additionally, the Company paid a commitment fee on the unused portion of the Revolving Credit Facility not being utilized in the amount of 0.50% per annum.On May 1, 2017, all of the outstanding amounts under the Prior Credit Facility were repaid with proceeds of borrowings under the New Credit Facility (as defined below) and the Prior Credit Facility was terminated.New Credit FacilityOn April 17, 2017, Eagle II entered into a new credit agreement by and among Eagle II, as initial borrower, JPMorgan Chase Bank, N.A., as administrative agent, and the lenders party thereto dated as of April 17, 2017 (the “New Credit Facility”), consisting of a $1.45 billion term loan facility (the “New Term Loan Facility” or the “New Term Loan”) and a $300.0 million revolving credit facility (the “New Revolving Credit Facility”), which was undrawn at closing. The proceeds of the New Term Loan Facility, and additional funds in the amount of $4.5 million in respect of interest expected to be accrued on the New Term Loan Facility, were placed in escrow pending satisfaction of certain conditions, including consummation of the Isle Acquisition. In connection with the consummation of the Isle Acquisition on May 1, 2017, the escrowed funds were released and ERI assumed Eagle II’s obligations under the New Credit Facility and certain of ERI’s subsidiaries (including Isle and certain of its subsidiaries) executed guarantees of ERI’s obligations under the New Credit Facility.As of September 30, 2017, the Company had $1.0 billion outstanding on the New Term Loan. There were no borrowings outstanding under the New Revolving Credit Facility as of September 30, 2017. The Company had $291.6 million of available borrowing capacity, after consideration of $8.4 million in outstanding letters of credit, under its New Revolving Credit Facility as of September 30, 2017. At September 30, 2017, the interest rate on the New Term Loan was 3.42%, and the weighted average interest rate on the New Revolving Credit Facility was 4.12% based upon the weighted average interest rate of borrowings outstanding on our New Revolving Credit Facility as of September 30, 2017.The Company applied the net proceeds of the New Term Loan Facility and borrowings under the New Revolving Credit Facility totaling $135 million, together with the proceeds of the 6% Senior Notes, and cash on hand, to (i) pay the cash portion of the consideration payable in the Isle Acquisition, (ii) refinance all of the debt outstanding under Isle’s existing credit facility, (iii) redeem or otherwise repurchase all of Isle’s outstanding 5.875% Senior Notes due 2021 and 8.875% Senior Subordinated Notes due 2020, (iv) repay all amounts outstanding under the Company’s Prior Credit Facility and (v) pay fees and costs associated with the Isle Acquisition and such financing transactions.The Company’s obligations under the New Revolving Credit Facility will mature on April 17, 2022. The Company’s obligations under the New Term Loan Facility will mature on April 17, 2024. The Company was required to make quarterly principal payments in an amount equal to $3.6 million on the New Term Loan Facility on the last day of each fiscal quarter beginning on June 30, 2017. The Company satisfied this requirement as a result of the principal prepayment of $444.5 million on September 13, 2017 in conjunction with the issuance of the additional 6% Senior Notes. In addition, the Company is required to make mandatory payments of amounts outstanding under the New Credit Facility with the proceeds of certain casualty events, debt issuances, and asset sales and, depending on its consolidated total leverage ratio, the Company is required to apply a portion of its excess cash flow to repay amounts outstanding under the New Credit Facility.The interest rate per annum applicable to loans under the New Revolving Credit Facility are, at our option, either (i) LIBOR plus a margin ranging from 1.75% to 2.50% or (ii) a base rate plus a margin ranging from 0.75% to 1.50%, which margin is based on our total leverage ratio. The interest rate per annum applicable to the loans under the New Term Loan Facility is, at our option, either (i) LIBOR plus 2.25%, or (ii) a base rate plus 1.25%; provided, however, that in no event will LIBOR be less than zero or the base rate be less than 1.00% over the term of the New Term Loan Facility or the New Revolving Credit Facility. Additionally, the Company pays a commitment fee on the unused portion of the Revolving Credit Facility not being utilized in the amount of 0.50% per annum.The New Credit Facility is secured by substantially all of the Company’s personal property assets and substantially all personal property assets of each subsidiary that guaranties the New Credit Facility (other than certain subsidiary guarantors designated as immaterial) (the “New Credit Facility Guarantors”), whether owned on the closing date of the New Credit Facility or thereafter acquired, and mortgages on the real property and improvements owned or leased us or the New Credit Facility Guarantors. The New Credit Facility is also secured by a pledge of all of the equity owned by us and the New Credit Facility Guarantors (subject to certain gaming law restrictions). The credit agreement governing the New Credit Facility contains a number of customary covenants that, among other things, restrict, subject to certain exceptions, the Company’s ability and the ability of the New Credit Facility Guarantors to incur additional indebtedness, create liens on collateral, engage in mergers, consolidations or asset dispositions, make distributions, make investments, loans or advances, engage in certain transactions with affiliates or subsidiaries or make capital expenditures.The New Credit Facility contains a number of customary covenants that, among other things, restrict, subject to certain exceptions, the Company’s ability and the ability of the subsidiary guarantors to incur debt; create liens on collateral; engage in mergers, consolidations or asset dispositions; pay dividends or make distributions; make investments, loans or advances; engage in certain transactions with affiliates or subsidiaries; or modify their lines of business.The New Credit Facility also includes certain financial covenants, including the requirements that we maintain throughout the term of the New Credit Facility and measured as of the end of each fiscal quarter, and solely with respect to loans under the New Revolving Credit Facility, a maximum consolidated total leverage ratio of not more than 6.50 to 1.00 for the period beginning on the closing date and ending with the fiscal quarter ending DecemberMarch 31, 2018, 6.00 to 1.00 for the period beginning with the fiscal quarter beginning January 1, 2019 and ending with the fiscal quarter ending December 31, 2019, and 5.50 to 1.00 for the period beginning with the fiscal quarter beginning January 1, 2020 and thereafter. The Company will also be required to maintain an interest coverage ratio in an amount not less than 2.00 to 1.00 measured on the last day of each fiscal quarter beginning on the closing date, and ending with the fiscal quarter ending December 31, 2018, 2.50 to 1.00 for the period beginning with the fiscal quarter beginning January 1, 2019 and ending with the fiscal quarter ending December 31, 2019, and 2.75 to 1.00 for the period beginning with the fiscal quarter beginning January 1, 2020 and thereafter.The New Credit Facility contains a number of customary events of default, including, among others, for the non-payment of principal, interest or other amounts, the inaccuracy of certain representations and warranties, the failure to perform or observe certain covenants, a cross default to our other indebtedness including the Notes, certain events of bankruptcy or insolvency; certain ERISAevents, the invalidity of certain loan documents, certain changes of control and the loss of certain classes of licenses to conduct gaming. If any event of default occurs, the lenders under the New Credit Facility would be entitled to take various actions, including accelerating amounts outstanding thereunder and taking all actions permitted to be taken by a secured creditor. As of September 30, 2017, the Company was in compliance with the covenants under the New Credit Facility.Contractual ObligationsOther than the previously discussed 6% Senior Notes, New Credit Facility and Isle leases for real estate and various equipment, there have been no material changes for the three and nine months ended September 30, 20172024 to our contractual obligations as disclosed in Part II, Item 7 of the 2023 Annual Report. See Annual Report on Form 10‑Kunaudited Financial Statements, which is included elsewhere in this report, for the year ended December 31, 2016.andclaims, assessments, environmental remediation andor compliance. These commitments and contingencies are discussed in greater detail, when applicable, in “Part II, Item 1. Legal Proceedings” and Note 105 to our unaudited consolidated financial statements,Financial Statements, both of which are included elsewhere in this report. In addition, new competition may have a material adverse effect on our revenues, and could have a similar adverse effect on our liquidity. See “Part I, Item 1A. Risk Factors—Risks Related to Our Business” which is included elsewhere in ourthe 2023 Annual Report on Form 10-K for the year ended December 31, 2016 and “Part II, Item IA. Risk Factors” which is included in this Quarterly Report on Form 10-Q for the quarter ended September 30, 2017.ourthe 2023 Annual Report on Form 10‑K for the year ended December 31, 2016. Except as described in footnotes 1 and 3 to the accompanying condensed notes of these consolidated financial statements, we believe thereReport. There have been no material changes since December 31, 2016.2023. We have not substantively changed the application of our policies, and there have been no material changes in assumptions or estimation techniques used as compared to prior periods.Off‑Balancethose described in the 2023 Annual Report.We are not party to any off‑balance sheet arrangements.Cautionary Statement Regarding Forward‑Looking InformationThis report includes “forward‑looking statements” within the meaning of Section 27A of the Securities Act of 1933, as amended, and Section 21E of the Securities Exchange Act of 1934, as amended. Forward‑looking statements include statements regarding our strategies, objectives and plans for future development or acquisitions of properties or operations, as well as expectations, future operating results and other information that is not historical information. When used in this report, the terms or phrases such as “anticipates,” “believes,” “projects,” “plans,” “intends,” “expects,” “might,” “may,” “estimates,” “could,” “should,” “would,” “will likely continue,” and variations of such words or similar expressions are intended to identify forward‑looking statements. Forward‑looking statements in this report include, among other things, statements concerning:projections of future results of operations or financial condition;expectations regarding our business and results of operations of our existing casino properties and prospects for future development;expenses and our ability to operate efficiently and our ability to achieve benefits and synergies associated with the Isle Acquisition;expectations regarding trends that will affect our market and the gaming industry generally and the impact of those trends on our business and results of operations;our ability to comply with the covenants in the agreements governing our outstanding indebtedness;our ability to meet our projected debt service obligations, operating expenses, and maintenance capital expenditures;expectations regarding availability of capital resources;•our intention to pursue development opportunities and acquisitions and obtain financing for such development and acquisitions; andthe impact of regulation on our business and our ability to receive and maintain necessary approvals for our existing properties and future projects.Any forward‑looking statement is based upon a number of estimates and assumptions that, while considered reasonable by us, is inherently subject to significant business, economic and competitive uncertainties and contingencies, many of which are beyond our control, and are subject to change. Actual results of operations may vary materially from any forward‑looking statement made herein. Forward‑looking statements should not be regarded as a representation by us or any other person that the forward‑looking statements will be achieved. Undue reliance should not be placed on any forward‑looking statements. Some of the contingencies and uncertainties to which any forward‑looking statement contained herein is subject include, but are not limited to, the following:our substantial indebtedness, including indebtedness incurred in connection with the Isle Acquisition, and significant financial commitments could adversely affect our results of operations and our ability to service such obligations;restrictions and limitations in agreements governing our debt could significantly affect our ability to operate our business and our liquidity;our facilities operate in very competitive environments and we face increasing competition;the ability to successfully integrate ERI’s and Isle’s operations, technologies and employees;the ability to realize growth opportunities and cost synergies from the Isle Merger, and any future acquisitions, in a timely manner or at all;our operations are particularly sensitive to reductions in discretionary consumer spending and are affected by changes in general economic and market conditions;our gaming operations are highly regulated by governmental authorities and the cost of complying or the impact of failing to comply with such regulations;changes in gaming taxes and fees in jurisdictions in which we operate;risks relating to pending claims or future claims that may be brought against us;changes in interest rates and capital and credit markets;our ability to comply with certain covenants in our debt documents;the effect of disruptions to our information technology and other systems and infrastructure;construction factors relating to maintenance and expansion of operations;our ability to attract and retain customers;weather or road conditions limiting access to our properties;the effect of war, terrorist activity, natural disasters and other catastrophic events;the intense competition to attract and retain management and key employees in the gaming industry; andthe other factors set forth in Part I, Item 1A. “Risk Factors” included in our Annual Report on Form 10‑K for the year ended December 31, 2016.In light of these and other risks, uncertainties and assumptions, the forward‑looking events discussed in this report might not occur. Any forward‑looking statement speaks only as of the date on which that statement is made. We do not intend to update publiclycurrently have any forward‑looking statement to reflect events or circumstances that occur after the date on which the statement is made, except as may be required by law.
off-balance sheet arrangements.do not hold any market risk sensitive instruments for trading purposes. Our primary exposureare exposed to market risk ischanges in interest rates primarily from variable rate risk, specifically long‑term U.S. treasury rates and the applicable spreads in the high‑yield investment risk, short‑term and long‑term LIBOR rates, and short‑term Eurodollar rates, and their potential impact onlong-term debt arrangements. We manage our long‑term debt. We attempt to limit our exposure to interest rate risk by managing themonitoring interest rates, including future projected rates, and adjust our mix of our long‑term fixed‑fixed and variable rate borrowings.short‑termno amounts were outstanding under the CEI Revolving Credit Facility. Long-term variable-rate borrowings under the Credit Facility. We do not currently utilize derivative financial instruments for trading or speculative purposes. (See also “Liquidity and Capital Resources” above for additional information related to the refinancingCEI Term Loans represented approximately 49% of our long‑term debt.)September 30, 2017, our long‑term variable‑rate borrowings totaled $1.0 billion under the New Term Loan and represented approximately 44% of our long‑term debt. In conjunction with the issuance of $500 million of additional 6% Senior Notes and the retirement of variable rate debt, this percentage declined from 54% as of DecemberMarch 31, 2016. Based on these changes, as of September 30, 20172024, the weighted average interest raterates on our variable and fixed rate debt was 3.63%were 8.16% and 6.3%6.70%, respectively.washave been no other material changequantitative changes in interest rateour market risk forexposure, or how such risks are managed from the nine months ended September 30, 2017 other than asinformation previously discussed in Liquidityreported under Part II, Item 7A of the 2023 Annual Report.Capital Resources section in Item 2.
(a)Evaluation of Disclosure Controls and Procedures(a)Evaluation of Disclosure Controls and ProceduresChief Executive Officerprincipal executive officer and Chief Financial Officer,principal financial officer, as appropriate, to allow timely decisions regarding required disclosure.13a‑ 15(e)13a-15(e) and 15d‑15(e)15d-15(e)) as of the end of the period covered by this Quarterly Report on Form 10‑Q.10-Q. Based on this evaluation, our Chief Executive Officer and Chief Financial Officer have concluded that our disclosure controls and procedures as of the end of the period covered by this Quarterly Report on Form 10‑Q10-Q are effective to ensure that the information required to be disclosed by us in the reports that we file under the Exchange Act is recorded, processed, summarized, evaluated and reported within the time periods specified in SEC rules and forms and that such information is accumulated and communicated to management, including our Chief Executive Officer and Chief Financial Officer, to allow timely decisions regarding required disclosure.
(b)Changes in Internal Controls(b)Changes in Internal ControlsExcept as noted below, thereOn May 1, 2017, we completed the acquisition1,1. Legal ProceedingsNotesFinancial Statements located elsewhere in this Quarterly Report on Form 10-Q and Note 11 to Unauditedour Consolidated Financial Statements Note 2: Isle Acquisition and Preliminary Purchase Price Accounting, for a discussionincluded in the 2023 Annual Report.acquisitionSecurities Act of 1933, as amended, and related financial data. The CompanySection 21E of the Securities Exchange Act of 1934, as amended. Forward-looking statements include statements regarding our strategies, objectives and plans for future development or acquisitions of properties or operations, as well as expectations, future operating results, trends and other information that is not historical information. When used in this report, the processterms or phrases such as “anticipates,” “believes,” “projects,” “plans,” “intends,” “expects,” “might,” “may,” “estimates,” “could,” “should,” “would,” “will likely continue,” and variations of integrating Islesuch words or similar expressions and their negative forms are intended to identify forward-looking statements. These statements are made on the basis of management’s current views and assumptions regarding future events.internal controls over financial reporting. Ascontrol, and are subject to change. By their nature, forward-looking statements involve risks and uncertainties because they relate to events and depend upon future circumstances that may not occur. Actual results and trends may differ materially from any future results, trends, performance or achievements expressed or implied by such statements. Forward-looking statements speak only as of the date they are made, and we assume no duty to update forward-looking statements. Forward-looking statements should not be regarded as a representation by us or any other person that the forward-looking statements will be achieved. Undue reliance should not be placed on any forward-looking statements. Some of the contingencies and uncertainties to which any forward-looking statement contained herein are subject include, but are not limited to, the following:these integration activities, certain controlsdownturns in the economy and other factors outside our control; be evaluated and may be changed. Excluding the Isle Acquisition, there were no changes in our internal control over financial reporting that have materially affected, or are reasonable likely to materially affect our internal control over financial reporting.market and the gaming industry generally, including expansion of internet betting and gaming, and the impact of those trends on our business and results of operations;OTHER INFORMATIONWe are a party•our ability to various lawsuits, which have arisencomply with the covenants in the normal courseagreements governing our outstanding indebtedness and leases;business. Estimated losses are accruedintention to pursue development opportunities and additional acquisitions and divestitures;these lawsuitsour existing properties and claims when future projects and operation of online sportsbook, poker and gaming;loss is probableimpact of the Data Incident and can be estimated. The currentany other future cybersecurity breaches on our business, financial conditions and results of operations;for the estimated losses associated with those lawsuits is not material to our consolidated financial condition and those estimated losses are not expected to have a material impactmanagement risks on our results of operations.Legal matters are discussedoperations;greater detailour online offerings and technological and strategic initiatives;“Part I, Item 3. Legal Proceedings”agreements governing our debt and Note 16leased properties could significantly affect our ability to operate our business and our liquidity;Consolidated Financial statements includedinformation technology and other systems and infrastructure;Annualreputation or the reputation of our brands;10‑K for10-Q and on our most recent Annual Reports on Form 10-K filed with the year ended December 31, 2016.SEC.
In light of these and other risks, uncertainties and assumptions, the forward-looking events discussed in this report might not occur. These forward-looking statements speak only as of the date on which this statement is made, even if subsequently made available on our website or otherwise, and we do not intend to update publicly any forward-looking statement to reflect events or circumstances that occur after the date on which the statement is made, except as may be required by law.ITEM 1A.ourthe 2023 Annual Report on Form 10‑K for the year ended December 31, 2016.Report. There have been no material changes to those risk factors during the ninethree months ended September 30, 2017, exceptMarch 31, 2024.following additional risk factors relatedpotential sale by Mr. Quatmann of up to 66,241 shares of common stock between June 29, 2024 and June 30, 2025.Isle Acquisition.We face substantial competitionaffirmative defense conditions of Rule 10b5-1(c) under the Securities Exchange Act of 1934, as amended, and Caesars’ policies regarding transactions in the hotel and casino industry and expect that such competition will continueThe gaming industry is characterized by an increasingly high degree of competition among a large number of participants, including land‑based casinos, dockside casinos, riverboat casinos, casinos located on racing tracks and casinos located on Native American reservations and other forms of legalized gaming. We also compete, to a lesser extent, with other forms of legalized gaming and entertainment such as online computer gambling, bingo, pull tab games, card parlors, sports books, fantasy sports websites, “cruise-to-nowhere” operations, pari-mutuel or telephonic betting on horse racing and dog racing, state-sponsored lotteries, jai-alai, and, in the future, may compete with gaming at other venues. In addition, we compete more generally with other forms of entertainment for the discretionary spending of our customers.Gaming competition is intense in mostsecurities of the markets in which we operate. States that already have legalized casino gaming may further expand gaming, and other states that have not yet legalized gaming may do so in the future. Legalized casino gaming in these states and on Native American reservations near our markets or changes to gaming laws in states in which we have operations and in states surrounding our operations could increase competition and could adversely affect our operations. There has been significant competition in our markets as a resultCompany.
41Our operations in certain jurisdictions depend on agreements with third parties.Our operations in several jurisdictions depend on agreements with third parties. If we are unable to renew these agreements on satisfactory terms as they expire, our business may be disrupted and, in the event of disruptions in multiple jurisdictions, could have a material adverse effect on our financial condition and results of operations. For example, Iowa law requires that each gambling venue in Iowa must have a licensed “Qualified Sponsoring Organization,” or QSO, which is a tax-exempt non-profit organization. The QSO must donate the profits it receives from casino operations to educational, civic, public, charitable, patriotic or religious uses. Each of our three Iowa properties has an agreement with a local QSO. We have the right to renew our agreements for Bettendorf and Waterloo when they expire in 2025 and 2018, respectively.We have a management agreement with Nemacolin Woodlands Resort, the owner of the gaming license issued by the Pennsylvania Gaming Control Board allowing operation of a casino at the resort. Under the terms of this agreement, we constructed and currently operate a casino at the resort. Our management agreement is subject to a buy-out provision on or after December 31, 2021, as well as other terms and conditions which could result in termination of the management agreement. The base term of the agreement is ten years, with four, five-year renewal options. Additionally, each party to the management agreement has certain termination rights. If the management agreement is terminated, we will no longer have the right to manage our casino at Nemacolin Woodlands Resort.Our information technology and other systems are subject to cyber security risk including misappropriation of customer information or other breaches of information security.We collect information relating to our guests and employees for various business purposes, including marketing and promotional purposes. The collection and use of personal data are governed by privacy laws and regulations enacted in the United States. We rely on information technology and other systems to maintain and transmit this personal and financial information, credit card settlements, credit card funds transmissions, mailing lists and reservations information. Our information and processes are subject to the ever-changing threat of compromised security, in the form of a risk of potential breach, system failure, computer virus, or unauthorized or fraudulent use by customers, company employees, or employees of third party vendors. The steps we take to deter and mitigate these risks may not be successful, and any resulting compromise or loss of data or systems could adversely impact, operations or regulatory compliance and could result in remedial expenses, fines, litigation, and loss of reputation, potentially impacting our financial results.In addition, third party service providers and other business partners process and maintain proprietary business information and data related to our guests, suppliers and other business partners. Our information technology and other systems that maintain and transmit this information, or those of service providers or business partners, may also be compromised by a malicious third party penetration of our network security or that of a third party service provider or business partner, or impacted by intentional or unintentional actions or inactions by our employees or those of a third party service provider or business partner. As a result, our business information, guest, supplier, and other business partner data may be lost, disclosed, accessed or taken without their consent.Any such loss, disclosure or misappropriation of, or access to, guests’ or business partners’ information or other breach of our information security can result in legal claims or legal proceedings, including regulatory investigations and actions, may have a serious impact on our reputation and may adversely affect our businesses, operating results and financial condition. Furthermore, the loss, disclosure or misappropriation of our business information may adversely affect our reputation, businesses, operating results and financial condition.Some of our casinos are located on leased property. If we default on one or more leases, the applicable lessors could terminate the affected leases and we could lose possession of the affected casino. We lease certain parcels of land on which several of our properties are located. As a ground lessee, we have the right to use the leased land; however, we do not hold fee ownership in the underlying land. Accordingly, with respect to the leased land, we will have no interest in the land or improvements thereon at the expiration of the ground leases. Moreover, since we do not completely control the land underlying the property, a landowner could take certain actions to disrupt our rights in the land leased under the long-term leases which are beyond our control. If the entity owning any leased land chose to disrupt our use either permanently or for a significant period of time, then the value of our assets could be impaired and our business and operations could be adversely affected. If we were to default on any one or more of these leases, the applicable lessors could terminate the affected leases and we could lose possession of the affected land and any improvements on the land, including the hotels and casinos. This would have a significant adverse effect on our business, financial condition and results of operations as we would then be unable to operate all or portions of the affected facilities and may result in the default under our New Credit Facility.None.None.Not applicable.None.ExhibitNumber3.1 Previously filed on Form 8-K filed on June 16, 2023. 10.13.2 Previously filed on Form 8-K filed on August 1, 2022. 4.1 Previously filed on Form 8-K filed on February 7, 2024. 4.2 Filed herewith. 10.1 Previously filed on Form 8-K filed on February 7, 2024. 10.2 Filed herewith. 10.3 31.1Certification of Gary L. Carano pursuant to Rule 13a‑14a and Rule 15d‑14(a) 31.2Filed herewith. 10.6 Filed herewith. 31.1 32.1 32.2101.1Filed herewith. 101.1 Inline XBRL Instance Document 104 Cover Page Interactive Data File (embedded within the Inline XBRL document) Filed herewith. SIGNATURESELDORADO RESORTS,CAESARS ENTERTAINMENT, INC. Date: April 30, 2024 /s/ Thomas R. Reeg Date: November 7, 2017/s/ Gary L. CaranoGary L. Caranoand Chairman of the Board(Principal Executive Officer)November 7, 2017Thomas R. ReegThomas R. ReegPresident and (Principal (Principal Financial Officer)58