The Company’s available-for-sale securities as of September 30, 2017 can be summarized as follows:
|
| At September 30, 2017 |
| |||||||||||||
|
| Cost |
|
| Gross Unrealized Gains |
|
| Gross Unrealized Losses |
|
| Fair Value |
| ||||
|
| (In millions) |
| |||||||||||||
Common stock |
| $ | 0.2 |
|
| $ | — |
|
| $ | (0.1 | ) |
| $ | 0.1 |
|
The Company’s available-for-sale securities as of December 31, 2016 can be summarized as follows:
|
| At December 31, 2016 |
| |||||||||||||
|
| Cost |
|
| Gross Unrealized Gains |
|
| Gross Unrealized Losses |
|
| Fair Value |
| ||||
|
| (In millions) |
| |||||||||||||
Common stock |
| $ | 0.4 |
|
| $ | — |
|
| $ | — |
|
| $ | 0.4 |
|
There is no maturity date for these investments and there have been no sales during the nine months ended September 30, 2017.
NOTE 10:13: STOCKHOLDERS’ EQUITY, (DEFICIT), ACCUMULATED OTHER COMPREHENSIVE INCOME (LOSS), AND REDEEMABLE NONCONTROLLING INTEREST
On May 13, 2022, Platinum closed on an underwritten secondary offering of 3,500,000 shares of its common stock. Concurrently, Ryerson Holding completed a share repurchase from Platinum of 1,613,022 shares of common stock for $47.7 million. Ryerson did 0t offer any shares of its common stock in the transaction and did 0t receive any of the proceeds from the sale of the shares offered by Platinum. The Company funded the share repurchase with cash on hand. Following the closing of these transactions, Platinum's ownership of our common stock decreased from approximately 54% to approximately 43% and Ryerson Holding is no longer a “controlled company” within the meaning of the corporate governance standards of The New York Stock Exchange.
The following table details changes in these accounts:Ryerson Holding Corporation Stockholders’ Equity accounts for the three and six month periods ended June 30, 2022:
|
| Ryerson Holding Corporation Stockholders' Equity (Deficit) |
| |||||||||||||||||||||||||||||||||||||||||
|
|
|
|
|
|
|
|
|
|
|
|
|
|
|
|
|
|
|
|
|
|
|
|
|
| Accumulated Other Comprehensive Income (Loss) |
|
|
|
|
|
|
| |||||||||||
|
| Common Stock |
|
| Treasury Stock |
|
| Capital in Excess of Par Value |
|
| Accumulated Deficit |
|
| Foreign Currency Translation |
|
| Benefit Plan Liabilities |
|
| Unrealized Gain (Loss) on Available- For-Sale Investments |
|
| Non-controlling Interest |
|
| Total Equity |
| |||||||||||||||||
|
| Shares |
|
| Dollars |
|
| Shares |
|
| Dollars |
|
| Dollars |
|
| Dollars |
|
| Dollars |
|
| Dollars |
|
| Dollars |
|
| Dollars |
|
| Dollars |
| |||||||||||
|
| (In millions, except shares in thousands) |
| |||||||||||||||||||||||||||||||||||||||||
Balance at January 1, 2017 |
|
| 37,345 |
|
| $ | 0.4 |
|
|
| 213 |
|
| $ | (6.6 | ) |
| $ | 375.4 |
|
| $ | (112.2 | ) |
| $ | (50.2 | ) |
| $ | (258.7 | ) |
| $ | 1.1 |
|
| $ | 1.5 |
|
| $ | (49.3 | ) |
Net income |
|
| — |
|
|
| — |
|
|
| — |
|
|
| — |
|
|
| — |
|
|
| 17.1 |
|
|
| — |
|
|
| — |
|
|
| — |
|
|
| 0.6 |
|
|
| 17.7 |
|
Foreign currency translation |
|
| — |
|
|
| — |
|
|
| — |
|
|
| — |
|
|
| — |
|
|
| — |
|
|
| 5.5 |
|
|
| — |
|
|
| — |
|
|
| 0.3 |
|
|
| 5.8 |
|
Gain on intra-entity foreign currency transactions |
|
| — |
|
|
| — |
|
|
| — |
|
|
| — |
|
|
| — |
|
|
| — |
|
|
| 3.6 |
|
|
| — |
|
|
| — |
|
|
| — |
|
|
| 3.6 |
|
Changes in defined benefit pension and other post-retirement benefit plans, net of tax of $3.9 |
|
| — |
|
|
| — |
|
|
| — |
|
|
| — |
|
|
| — |
|
|
| — |
|
|
| — |
|
|
| 6.4 |
|
|
| — |
|
|
| — |
|
|
| 6.4 |
|
Unrealized loss on available-for-sale investment, net of tax of $0.1 |
|
| — |
|
|
| — |
|
|
| — |
|
|
| — |
|
|
| — |
|
|
| — |
|
|
| — |
|
|
| — |
|
|
| (0.2 | ) |
|
| — |
|
|
| (0.2 | ) |
Other than temporary impairment, net of tax of $0.1 |
|
| — |
|
|
| — |
|
|
| — |
|
|
| — |
|
|
| — |
|
|
| — |
|
|
| — |
|
|
| — |
|
|
| 0.1 |
|
|
| — |
|
|
| 0.1 |
|
Stock-based compensation expense |
|
| 76 |
|
|
| — |
|
|
| — |
|
|
| — |
|
|
| 1.5 |
|
|
| — |
|
|
| — |
|
|
| — |
|
|
| — |
|
|
| — |
|
|
| 1.5 |
|
Balance at September 30, 2017 |
|
| 37,421 |
|
| $ | 0.4 |
|
|
| 213 |
|
| $ | (6.6 | ) |
| $ | 376.9 |
|
| $ | (95.1 | ) |
| $ | (41.1 | ) |
| $ | (252.3 | ) |
| $ | 1.0 |
|
| $ | 2.4 |
|
| $ | (14.4 | ) |
|
|
|
|
|
|
|
|
|
|
|
|
|
|
|
|
|
|
|
| Accumulated Other |
|
|
|
|
|
|
| |||||||||||||||||
|
| Common |
|
| Treasury |
|
| Capital in |
|
| Retained Earnings |
|
| Foreign |
|
| Benefit Plan |
|
| Interest Rate Swap |
|
| Non-controlling |
|
| Total |
| |||||||||||||||||
|
| Shares |
|
| Dollars |
|
| Shares |
|
| Dollars |
|
| Dollars |
|
| Dollars |
|
| Dollars |
|
| Dollars |
|
| Dollars |
|
| Dollars |
|
| Dollars |
| |||||||||||
|
| (In millions, except shares in thousands) |
| |||||||||||||||||||||||||||||||||||||||||
Balance at January 1, 2022 |
|
| 38,687 |
|
| $ | 0.4 |
|
|
| (293 | ) |
| $ | (8.4 | ) |
| $ | 388.6 |
|
| $ | 321.7 |
|
| $ | (49.1 | ) |
| $ | (114.5 | ) |
| $ | (1.5 | ) |
| $ | 7.4 |
|
| $ | 544.6 |
|
Net income |
|
| — |
|
|
| — |
|
|
| — |
|
|
| — |
|
|
| — |
|
|
| 163.6 |
|
|
| — |
|
|
| — |
|
|
| — |
|
|
| 0.2 |
|
|
| 163.8 |
|
Foreign currency translation |
|
| — |
|
|
| — |
|
|
| — |
|
|
| — |
|
|
| — |
|
|
| — |
|
|
| 1.5 |
|
|
| — |
|
|
| — |
|
|
| — |
|
|
| 1.5 |
|
Changes in defined benefit pension and other post-retirement benefit plans, net of tax of $0.1 |
|
| — |
|
|
| — |
|
|
| — |
|
|
| — |
|
|
| — |
|
|
| — |
|
|
| — |
|
|
| 0.7 |
|
|
| — |
|
|
| — |
|
|
| 0.7 |
|
Share repurchases |
|
| — |
|
|
| — |
|
|
| (20 | ) |
|
| (0.5 | ) |
|
| — |
|
|
| — |
|
|
| — |
|
|
| — |
|
|
| — |
|
|
| — |
|
|
| (0.5 | ) |
Stock-based compensation expense, net |
|
| 371 |
|
|
| — |
|
|
| (77 | ) |
|
| (2.7 | ) |
|
| 1.3 |
|
|
| — |
|
|
| — |
|
|
| — |
|
|
| — |
|
|
| — |
|
|
| (1.4 | ) |
Cash dividends and dividend equivalents |
|
| — |
|
|
| — |
|
|
| — |
|
|
| — |
|
|
| — |
|
|
| (3.9 | ) |
|
| — |
|
|
| — |
|
|
| — |
|
|
| — |
|
|
| (3.9 | ) |
Interest rate swap, net of tax of 0 |
|
| — |
|
|
| — |
|
|
| — |
|
|
| — |
|
|
| — |
|
|
| — |
|
|
| — |
|
|
| — |
|
|
| 0.7 |
|
|
| — |
|
|
| 0.7 |
|
Balance at March 31, 2022 |
|
| 39,058 |
|
| $ | 0.4 |
|
|
| (390 | ) |
| $ | (11.6 | ) |
| $ | 389.9 |
|
| $ | 481.4 |
|
| $ | (47.6 | ) |
| $ | (113.8 | ) |
| $ | (0.8 | ) |
| $ | 7.6 |
|
| $ | 705.5 |
|
Net income |
|
| — |
|
|
| — |
|
|
| — |
|
|
| — |
|
|
| — |
|
|
| 196.4 |
|
|
| — |
|
|
| — |
|
|
| — |
|
|
| — |
|
|
| 196.4 |
|
Foreign currency translation |
|
| — |
|
|
| — |
|
|
| — |
|
|
| — |
|
|
| — |
|
|
| — |
|
|
| (2.2 | ) |
|
| — |
|
|
| — |
|
|
| (0.1 | ) |
|
| (2.3 | ) |
Changes in defined benefit pension and other post-retirement benefit plans, net of tax of $0.4 |
|
| — |
|
|
| — |
|
|
| — |
|
|
| — |
|
|
| — |
|
|
| — |
|
|
| — |
|
|
| 0.2 |
|
|
| — |
|
|
| — |
|
|
| 0.2 |
|
Share repurchases |
|
| — |
|
|
| — |
|
|
| (1,613 | ) |
|
| (47.7 | ) |
|
| — |
|
|
| — |
|
|
| — |
|
|
| — |
|
|
| — |
|
|
| — |
|
|
| (47.7 | ) |
Stock-based compensation expense, net |
|
| 1 |
|
|
| — |
|
|
| — |
|
|
| — |
|
|
| 2.6 |
|
|
| — |
|
|
| — |
|
|
| — |
|
|
| — |
|
|
| — |
|
|
| 2.6 |
|
Cash dividends and dividend equivalents |
|
| — |
|
|
| — |
|
|
| — |
|
|
| — |
|
|
| — |
|
|
| (4.7 | ) |
|
| — |
|
|
| — |
|
|
| — |
|
|
| — |
|
|
| (4.7 | ) |
Interest rate swap, net of tax of $0.2 |
|
| — |
|
|
| — |
|
|
| — |
|
|
| — |
|
|
| — |
|
|
| — |
|
|
| — |
|
|
| — |
|
|
| 0.5 |
|
|
| — |
|
|
| 0.5 |
|
Balance at June 30, 2022 |
|
| 39,059 |
|
| $ | 0.4 |
|
|
| (2,003 | ) |
| $ | (59.3 | ) |
| $ | 392.5 |
|
| $ | 673.1 |
|
| $ | (49.8 | ) |
| $ | (113.6 | ) |
| $ | (0.3 | ) |
| $ | 7.5 |
|
| $ | 850.5 |
|
16
The following table details changes in Ryerson Holding Corporation Stockholders’ Equity accounts for the three and six month periods ended June 30, 2021:
|
|
|
|
|
|
|
|
|
|
|
|
|
|
|
|
|
|
|
| Accumulated Other |
|
|
|
|
|
|
| |||||||||||||||||
|
| Common |
|
| Treasury |
|
| Capital in |
|
| Retained Earnings |
|
| Foreign |
|
| Benefit Plan |
|
| Interest Rate Swap |
|
| Non-controlling |
|
| Total |
| |||||||||||||||||
|
| Shares |
|
| Dollars |
|
| Shares |
|
| Dollars |
|
| Dollars |
|
| Dollars |
|
| Dollars |
|
| Dollars |
|
| Dollars |
|
| Dollars |
|
| Dollars |
| |||||||||||
|
| (In millions, except shares in thousands) |
| |||||||||||||||||||||||||||||||||||||||||
Balance at January 1, 2021 |
|
| 38,330 |
|
| $ | 0.4 |
|
|
| (213 | ) |
| $ | (6.6 | ) |
| $ | 383.1 |
|
| $ | 33.8 |
|
| $ | (47.0 | ) |
| $ | (221.8 | ) |
| $ | (3.1 | ) |
| $ | 6.3 |
|
| $ | 145.1 |
|
Net income |
|
| — |
|
|
| — |
|
|
| — |
|
|
| — |
|
|
| — |
|
|
| 25.3 |
|
|
| — |
|
|
| — |
|
|
| — |
|
|
| 0.3 |
|
|
| 25.6 |
|
Foreign currency translation |
|
| — |
|
|
| — |
|
|
| — |
|
|
| — |
|
|
| — |
|
|
| — |
|
|
| 0.1 |
|
|
| — |
|
|
| — |
|
|
| (0.1 | ) |
|
| — |
|
Changes in defined benefit pension and other post-retirement benefit plans, net of tax of $0.5 |
|
| — |
|
|
| — |
|
|
| — |
|
|
| — |
|
|
| — |
|
|
| — |
|
|
| — |
|
|
| 2.0 |
|
|
| — |
|
|
| — |
|
|
| 2.0 |
|
Stock-based compensation expense |
|
| — |
|
|
| — |
|
|
| — |
|
|
| — |
|
|
| 1.6 |
|
|
| — |
|
|
| — |
|
|
| — |
|
|
| — |
|
|
| — |
|
|
| 1.6 |
|
Interest rate swap, net of tax of $0.1 |
|
| — |
|
|
| — |
|
|
| — |
|
|
| — |
|
|
| — |
|
|
| — |
|
|
| — |
|
|
| — |
|
|
| 0.4 |
|
|
| — |
|
|
| 0.4 |
|
Balance at March 31, 2021 |
|
| 38,330 |
|
| $ | 0.4 |
|
|
| (213 | ) |
| $ | (6.6 | ) |
| $ | 384.7 |
|
| $ | 59.1 |
|
| $ | (46.9 | ) |
| $ | (219.8 | ) |
| $ | (2.7 | ) |
| $ | 6.5 |
|
| $ | 174.7 |
|
Net income |
|
| — |
|
|
| — |
|
|
| — |
|
|
| — |
|
|
| — |
|
|
| 112.9 |
|
|
| — |
|
|
| — |
|
|
| — |
|
|
| 0.4 |
|
|
| 113.3 |
|
Foreign currency translation |
|
| — |
|
|
| — |
|
|
| — |
|
|
| — |
|
|
| — |
|
|
| — |
|
|
| 1.5 |
|
|
| — |
|
|
| — |
|
|
| 0.1 |
|
|
| 1.6 |
|
Changes in defined benefit pension and other post-retirement benefit plans, net of tax of $0.6 |
|
| — |
|
|
| — |
|
|
| — |
|
|
| — |
|
|
| — |
|
|
| — |
|
|
| — |
|
|
| 2.0 |
|
|
| — |
|
|
| — |
|
|
| 2.0 |
|
Stock-based compensation expense |
|
| 357 |
|
|
| — |
|
|
| — |
|
|
| — |
|
|
| 1.5 |
|
|
| — |
|
|
| — |
|
|
| — |
|
|
| — |
|
|
| — |
|
|
| 1.5 |
|
Interest rate swap, net of tax of $0.2 |
|
| — |
|
|
| — |
|
|
| — |
|
|
| — |
|
|
| — |
|
|
| — |
|
|
| — |
|
|
| — |
|
|
| 0.4 |
|
|
| — |
|
|
| 0.4 |
|
Balance at June 30, 2021 |
|
| 38,687 |
|
| $ | 0.4 |
|
|
| (213 | ) |
| $ | (6.6 | ) |
| $ | 386.2 |
|
| $ | 172.0 |
|
| $ | (45.4 | ) |
| $ | (217.8 | ) |
| $ | (2.3 | ) |
| $ | 7.0 |
|
| $ | 293.5 |
|
The following table details changes in accumulated other comprehensive income (loss), net of tax, for the ninesix months ended SeptemberJune 30, 2017:2022:
|
| Changes in Accumulated Other Comprehensive Income (Loss) by Component |
| |||||||||||||
|
| Foreign Currency Translation |
|
| Benefit Plan Liabilities |
|
| Available- For-Sale Investments |
|
| Cash Flow Hedge - Interest Rate Swap |
| ||||
|
| (In millions) |
| |||||||||||||
Balance at January 1, 2017 |
| $ | (50.2 | ) |
| $ | (258.7 | ) |
| $ | 1.1 |
|
| $ | — |
|
Other comprehensive income (loss) before reclassifications |
|
| 9.1 |
|
|
| 7.8 |
|
|
| (0.2 | ) |
|
| (0.3 | ) |
Amounts reclassified from accumulated other comprehensive income (loss) |
|
| — |
|
|
| (1.4 | ) |
|
| 0.1 |
|
|
| 0.3 |
|
Net current-period other comprehensive income (loss) |
|
| 9.1 |
|
|
| 6.4 |
|
|
| (0.1 | ) |
|
| — |
|
Balance at September 30, 2017 |
| $ | (41.1 | ) |
| $ | (252.3 | ) |
| $ | 1.0 |
|
| $ | — |
|
|
| Changes in Accumulated Other Comprehensive |
| |||||||||
|
| Foreign |
|
| Benefit |
|
| Interest Rate Swap |
| |||
|
| (In millions) |
| |||||||||
Balance at January 1, 2022 |
| $ | (49.1 | ) |
| $ | (114.5 | ) |
| $ | (1.5 | ) |
Other comprehensive loss before reclassifications |
|
| (0.7 | ) |
|
| — |
|
|
| — |
|
Amounts reclassified from accumulated other comprehensive income into net income |
|
| — |
|
|
| 0.9 |
|
|
| 1.2 |
|
Net current-period other comprehensive income (loss) |
|
| (0.7 | ) |
|
| 0.9 |
|
|
| 1.2 |
|
Balance at June 30, 2022 |
| $ | (49.8 | ) |
| $ | (113.6 | ) |
| $ | (0.3 | ) |
17
The following table details the reclassifications out of accumulated other comprehensive income (loss) for the three and ninesix month periods ended SeptemberJune 30, 2017:2022:
|
| Reclassifications Out of Accumulated Other Comprehensive Income (Loss) |
| Reclassifications Out of Accumulated Other Comprehensive Income (Loss) | ||||||||||||||||
|
| Amount reclassified from Accumulated |
|
|
|
| Amount reclassified from Accumulated |
| ||||||||||||
|
| Other Comprehensive Income (Loss) |
|
|
|
| Other Comprehensive Income (Loss) |
|
| |||||||||||
|
| Three Months Ended |
|
| Nine Months Ended |
|
| Affected line item in the Condensed |
| Three Months Ended |
|
| Six Months Ended |
|
| Affected line item in the Condensed | ||||
Details about Accumulated Other |
| September 30, 2017 |
|
| Consolidated Statements of |
| June 30, 2022 |
|
| Consolidated Statements of | ||||||||||
Comprehensive Income (Loss) Components |
| (In millions) |
|
| Comprehensive Income |
| (In millions) |
| Comprehensive Income | |||||||||||
Other-than-temporary impairment |
|
|
|
|
|
|
|
|
|
| ||||||||||
Other-than-temporary impairment charge |
| $ | — |
|
| $ | 0.2 |
|
| Other income and (expense), net | ||||||||||
Amortization of defined benefit pension and other post-retirement benefit plan items |
|
|
|
|
|
|
| |||||||||||||
Actuarial loss |
| $ | 0.7 |
|
| $ | 1.2 |
|
| Other income and (expense), net | ||||||||||
Pension settlement |
|
| — |
|
|
| 0.1 |
|
| Other income and (expense), net | ||||||||||
Prior service credits |
|
| (0.1 | ) |
|
| (0.1 | ) |
| Other income and (expense), net | ||||||||||
Total before tax |
|
| 0.6 |
|
|
| 1.2 |
|
| |||||||||||
Tax benefit |
|
| — |
|
|
| (0.1 | ) |
|
|
|
| (0.4 | ) |
|
| (0.3 | ) |
| |
Net of tax |
| $ | — |
|
| $ | 0.1 |
|
|
|
| $ | 0.2 |
|
| $ | 0.9 |
|
| |
Cash flow hedge - interest rate swap |
|
|
|
|
|
|
|
|
|
| ||||||||||
Realized swap interest loss |
| $ | 0.1 |
|
| $ | 0.5 |
|
| Interest and other expense on debt | ||||||||||
Interest rate swap |
|
|
|
|
|
|
| |||||||||||||
Realized swap interest |
| $ | 0.7 |
|
| $ | 1.4 |
|
| Interest and other expense on debt | ||||||||||
Tax benefit |
|
| (0.1 | ) |
|
| (0.2 | ) |
|
|
|
| (0.2 | ) |
|
| (0.2 | ) |
|
|
Net of tax |
| $ | — |
|
| $ | 0.3 |
|
|
|
| $ | 0.5 |
|
| $ | 1.2 |
|
|
|
Amortization of defined benefit pension and other post- retirement benefit plan items |
|
|
|
|
|
|
|
|
|
| ||||||||||
Actuarial (gain) loss |
| $ | 1.9 |
|
| $ | (0.2 | ) |
| Warehousing, delivery, selling, general and administrative | ||||||||||
Prior service credits |
|
| (0.8 | ) |
|
| (2.3 | ) |
| Warehousing, delivery, selling, general and administrative | ||||||||||
Total before tax |
|
| 1.1 |
|
|
| (2.5 | ) |
|
| ||||||||||
Tax provision (benefit) |
|
| (0.3 | ) |
|
| 1.1 |
|
|
| ||||||||||
Net of tax |
| $ | 0.8 |
|
| $ | (1.4 | ) |
|
| ||||||||||
|
| Reclassifications Out of Accumulated Other Comprehensive Income (Loss) | ||||||||
|
| Amount reclassified from Accumulated |
|
|
| |||||
|
| Other Comprehensive Income (Loss) |
|
|
| |||||
|
| Three Months Ended |
|
| Six Months Ended |
|
| Affected line item in the Condensed | ||
Details about Accumulated Other |
| June 30, 2021 |
|
| Consolidated Statements of | |||||
Comprehensive Income (Loss) Components |
| (In millions) |
|
| Comprehensive Income | |||||
Amortization of defined benefit pension and other post-retirement benefit plan items |
|
|
|
|
|
|
|
| ||
Actuarial loss |
| $ | 2.5 |
|
| $ | 4.9 |
|
| Other income and (expense), net |
Pension settlement |
|
| 0.2 |
|
|
| 0.4 |
|
| Other income and (expense), net |
Prior service credits |
|
| (0.1 | ) |
|
| (0.2 | ) |
| Other income and (expense), net |
Total before tax |
|
| 2.6 |
|
|
| 5.1 |
|
|
|
Tax benefit |
|
| (0.6 | ) |
|
| (1.1 | ) |
|
|
Net of tax |
| $ | 2.0 |
|
| $ | 4.0 |
|
|
|
Interest rate swap |
|
|
|
|
|
|
|
| ||
Realized swap interest |
| $ | 0.6 |
|
| $ | 1.1 |
|
| Interest and other expense on debt |
Tax benefit |
|
| (0.2 | ) |
|
| (0.3 | ) |
|
|
Net of tax |
| $ | 0.4 |
|
| $ | 0.8 |
|
|
|
18
NOTE 14: REVENUE RECOGNITION
We are a leading value-added processor and distributor of industrial metals with operations in the United States, Canada, Mexico, and China. We purchase large quantities of metal products from primary producers and sell these materials in smaller quantities to a wide variety of metals-consuming industries. Nearly 80% of the metals products sold are processed by us to a specified thickness, length, width, shape, and surface quality pursuant to specific customer orders.
Disaggregated Revenue
We have 1 operating and reportable segment, metals service centers.
The Company derives substantially all of its sales from the distribution of metals. The following table detailsshows the reclassifications outCompany’s percentage of accumulatedsales by major product line:
|
| Three Months Ended |
|
| Six Months Ended |
| ||||||||||
|
| June 30, |
|
| June 30, |
| ||||||||||
Product Line |
| 2022 |
|
| 2021 |
|
| 2022 |
|
| 2021 |
| ||||
Carbon Steel Flat |
|
| 29 | % |
|
| 31 | % |
|
| 30 | % |
|
| 30 | % |
Carbon Steel Plate |
|
| 10 |
|
|
| 10 |
|
|
| 10 |
|
|
| 10 |
|
Carbon Steel Long |
|
| 13 |
|
|
| 13 |
|
|
| 13 |
|
|
| 13 |
|
Stainless Steel Flat |
|
| 18 |
|
|
| 17 |
|
|
| 18 |
|
|
| 17 |
|
Stainless Steel Plate |
|
| 4 |
|
|
| 5 |
|
|
| 5 |
|
|
| 5 |
|
Stainless Steel Long |
|
| 5 |
|
|
| 4 |
|
|
| 5 |
|
|
| 4 |
|
Aluminum Flat |
|
| 13 |
|
|
| 13 |
|
|
| 12 |
|
|
| 13 |
|
Aluminum Plate |
|
| 2 |
|
|
| 2 |
|
|
| 2 |
|
|
| 2 |
|
Aluminum Long |
|
| 4 |
|
|
| 4 |
|
|
| 4 |
|
|
| 4 |
|
Other |
|
| 2 |
|
|
| 1 |
|
|
| 1 |
|
|
| 2 |
|
Total |
|
| 100 | % |
|
| 100 | % |
|
| 100 | % |
|
| 100 | % |
A significant majority of the Company’s sales are attributable to its U.S. operations. The only operations attributed to foreign countries relate to the Company’s subsidiaries in Canada, China, and Mexico. The following table summarizes consolidated financial information of our operations by geographic location based on where sales originated:
| Three Months Ended June 30, |
|
| Six Months Ended June 30, |
| ||||||||||
| 2022 |
|
| 2021 |
|
| 2022 |
|
| 2021 |
| ||||
Net Sales | (In millions) |
| |||||||||||||
United States |
| 1,589.9 |
|
| $ | 1,276.8 |
|
| $ | 3,193.2 |
|
| $ | 2,302.5 |
|
Foreign countries |
| 153.6 |
|
|
| 142.2 |
|
| $ | 299.1 |
|
|
| 263.8 |
|
Total | $ | 1,743.5 |
|
| $ | 1,419.0 |
|
| $ | 3,492.3 |
|
| $ | 2,566.3 |
|
Revenue is recognized either at a point in time or over time based on if the contract has an enforceable right to payment and the type of product that is being sold to the customer, with products that are determined to have no alternative use being recognized over time. The following table summarizes revenues by the type of item sold:
|
| Three Months Ended June 30, |
|
| Six Months Ended June 30, |
| ||||||||||
Timing of Revenue Recognition |
| 2022 |
|
| 2021 |
|
| 2022 |
|
| 2021 |
| ||||
Revenue on products with an alternative use |
|
| 90 | % |
|
| 90 | % |
|
| 90 | % |
|
| 90 | % |
Revenue on products with no alternative use |
|
| 10 |
|
|
| 10 |
|
|
| 10 |
|
|
| 10 |
|
Total |
|
| 100 | % |
|
| 100 | % |
|
| 100 | % |
|
| 100 | % |
Contract Balances
A receivable is recognized in the period in which an invoice is issued, which is generally when the product is delivered to the customer. Payment terms on invoiced amounts are typically 30 days from the invoice date. We do not have any contracts with significant financing components.
Receivables, which are included in accounts receivables within the Condensed Consolidated Balance Sheet, from contracts with customers were $759.5 million and $633.0 million as of June 30, 2022 and December 31, 2021, respectively.
19
Contract assets, which consist primarily of revenues recognized over time that have not yet been invoiced and estimates of the value of inventory that will be received in conjunction with product returns, are reported in prepaid expenses and other comprehensive income (loss)current assets within the Condensed Consolidated Balance Sheets. Contract liabilities, which consist primarily of accruals associated with amounts that will be paid to customers for volume rebates, cash discounts, sales returns and allowances, estimates of shipping and handling costs associated with performance obligations recorded over time, and bill and hold transactions are reported in other accrued liabilities within the threeCondensed Consolidated Balance Sheets. Significant changes in the contract assets and nine month periods ended Septemberthe contract liabilities balances during the period are as follows:
|
| Contract Assets |
|
| Contract Liabilities |
| ||
|
| (In millions) |
| |||||
Beginning Balance at January 1, 2022 |
| $ | 21.3 |
|
| $ | 15.1 |
|
Contract liability satisfied during the period |
|
| — |
|
|
| (11.9 | ) |
Contract liability incurred during the period |
|
| — |
|
|
| 15.3 |
|
Net change in contract assets and liabilities for products with no alternative use during the period |
|
| (4.5 | ) |
|
| — |
|
Changes to reserves |
|
| 0.5 |
|
|
| 1.0 |
|
Ending Balance at June 30, 2022 |
| $ | 17.3 |
|
| $ | 19.5 |
|
The Company’s performance obligations are typically short-term in nature. As a result, the Company has elected the practical expedient that provides an exemption of the disclosure requirements regarding information about remaining performance obligations on contracts that have original expected durations of one year or less.
NOTE 15: PROVISION FOR CREDIT LOSSES
Provisions for allowances and claims on accounts receivables and contract assets are based upon historical rates, expected trends, and estimates of potential returns, allowances, customer discounts, and incentives. The Company considers all available information when assessing the adequacy of the provision for allowances, claims, and doubtful accounts.
The Company performs ongoing credit evaluations of customers and sets credit limits based upon review of the customers’ current credit information, payment history, and the current economic and industry environments. The Company’s credit loss reserve consists of two parts: a) a provision for estimated credit losses based on historical experience and b) a reserve for specific customer collection issues that the Company has identified. Estimation of credit losses requires adjusting historical loss experience for current economic conditions and judgments about the probable effects of economic conditions on certain customers.
The following table provides a reconciliation of the provision for credit losses reported within the Condensed Consolidated Balance Sheets as of June 30, 2016:2022:
|
| Reclassifications Out of Accumulated Other Comprehensive Income (Loss) | ||||||||
|
| Amount reclassified from Accumulated |
|
|
| |||||
|
| Other Comprehensive Income (Loss) |
|
|
| |||||
|
| Three Months Ended |
|
| Nine Months Ended |
|
| Affected line item in the Condensed | ||
Details about Accumulated Other |
| September 30, 2016 |
|
| Consolidated Statements of | |||||
Comprehensive Income (Loss) Components |
| (In millions) |
|
| Comprehensive Income | |||||
Other-than-temporary impairment |
|
|
|
|
|
|
|
|
|
|
Other-than-temporary impairment charge |
| $ | — |
|
| $ | 2.8 |
|
| Other income and (expense), net |
Tax benefit |
|
| — |
|
|
| (1.1 | ) |
|
|
Net of tax |
| $ | — |
|
| $ | 1.7 |
|
|
|
Amortization of defined benefit pension and other post- retirement benefit plan items |
|
|
|
|
|
|
|
|
|
|
Actuarial loss |
| $ | 1.1 |
|
| $ | 3.4 |
|
| Warehousing, delivery, selling, general and administrative |
Prior service credits |
|
| (0.7 | ) |
|
| (2.2 | ) |
| Warehousing, delivery, selling, general and administrative |
Total before tax |
|
| 0.4 |
|
|
| 1.2 |
|
|
|
Tax benefit |
|
| (0.1 | ) |
|
| (0.4 | ) |
|
|
Net of tax |
| $ | 0.3 |
|
| $ | 0.8 |
|
|
|
| Changes in Provision for Expected Credit Losses |
| |
| (In millions) |
| |
Balance at January 1, 2022 | $ | 2.2 |
|
Current period provision |
| 0.7 |
|
Write-offs charged against allowance |
| (0.3 | ) |
Recoveries |
| 0.3 |
|
Translation |
| 0.1 |
|
Balance at June 30, 2022 | $ | 3.0 |
|
For the three months ended SeptemberJune 30, 2017,2022, the Company recorded an income tax benefitexpense of $0.7$66.8 million compared to income tax expense of $1.6$38.5 million in the prior year. The $0.7 millionincome tax benefitexpense for the three months ended SeptemberJune 30, 20172022 and 2021 primarily represents the reversal of previous uncertain tax provisions due to the lapse of the statute of limitations andrepresent taxes at federal and local statutory rates where the Company operates, but generally excludesexclude any tax benefit for losses in jurisdictions with historical losses.
For the ninesix months ended SeptemberJune 30, 2017,2022, the Company recorded income tax expense of $5.3$121.8 million compared to $14.0$46.1 million in the prior year. The $5.3 millionincome tax expense for the ninesix months ended SeptemberJune 30, 20172022 and 2021 primarily representsrepresent taxes at federal and local statutory rates where the Company operates, but generally excludesexclude any tax benefit for losses in jurisdictions with historical losses.losses. The increase in the income tax provision in the first six months of 2022 compared to the first six months of 2021 is primarily a result of the increase in actual and forecasted earnings between the two periods as conditions have improved year-over-year.
In accordance with
20
As required by ASC 740, “Income Taxes,” the Company assesses the realizability of its deferred tax assets. The Company records a valuation allowance when, based upon the evaluation of all available evidence, it is more-likely-than-not that all or a portion of the deferred tax assets will not be realized. In making this determination, we analyze, among other things, our recent history of earnings, the nature and timing of reversing book-tax temporary differences, tax planning strategies, and future income. The Company maintains a valuation allowance on certain foreign and U.S. federal and state deferred tax assets until such time as in management’s judgment, considering all available positive and negative evidence, the Company determines that these deferred tax assets are more likely than not realizable. The valuation allowance is reviewed quarterly and will be maintained until sufficient positive evidence exists to support the reversal of some or all of the valuation allowance. The valuation allowance was $19.5 million and $20.0$5.0 million at Septemberboth June 30, 20172022 and December 31, 2016, respectively.2021.
The Company accounts for uncertain income tax positions in accordance with ASC 740. We anticipate that certain statutes of limitation will close within the next twelve months resulting in the immaterial reduction of the reserve for uncertain tax benefits related to various intercompany transactions. No changes were recorded in the first six months of 2022, therefore, the balance of $0.8 million at December 31, 2021 remains unchanged.
NOTE 12:17: EARNINGS PER SHARE
Basic earnings per share attributable to Ryerson Holding’s common stock is determined based on earnings for the period divided by the weighted average number of common shares outstanding during the period. Diluted earnings per share attributable to Ryerson Holding’s common stock considers the effect of potential common shares, unless inclusion of the potential common shares would have an antidilutive effect. Stock-based awards with a grant price greater than the average market price of our common stock are excluded from the calculation of diluted earnings per share because the impact would have been antidilutive. The weighted average number of shares excluded as they would have had an antidilutive effect were 145,833199,045 and 96,80899,522 for the three and nine-monthsix-month periods ended SeptemberJune 30, 2017,2022, respectively, and 81,877 and 40,939 for the three and six-month periods ended June 30, 2021, respectively.
The following table sets forth the calculation of basic and diluted earnings per share:
|
| Three Months Ended September 30, |
|
| Nine Months Ended September 30, |
|
| Three Months Ended June 30, |
|
| Six Months Ended June 30, |
| ||||||||||||||||||||
Basic and diluted earnings per share |
|
| 2017 |
|
|
| 2016 |
|
|
| 2017 |
|
|
| 2016 |
|
| 2022 |
|
| 2021 |
|
| 2022 |
|
| 2021 |
| ||||
|
| (In millions, except share and per share data) |
|
| (In millions, except number of shares which are reflected in thousands and per share data) |
| ||||||||||||||||||||||||||
Numerator: |
|
|
|
|
|
|
|
|
|
|
|
|
|
|
|
|
|
|
|
|
|
|
|
|
| |||||||
Net income attributable to Ryerson Holding Corporation |
| $ | 1.7 |
|
| $ | 8.2 |
|
| $ | 17.1 |
|
| $ | 27.3 |
|
| $ | 196.4 |
|
| $ | 112.9 |
|
| $ | 360.0 |
|
| $ | 138.2 |
|
Denominator: |
|
|
|
|
|
|
|
|
|
|
|
|
|
|
|
|
|
|
|
|
|
|
|
|
| |||||||
Weighted average shares outstanding |
|
| 37,190,927 |
|
|
| 35,804,069 |
|
|
| 37,165,552 |
|
|
| 33,343,503 |
|
|
| 37,799 |
|
|
| 38,459 |
|
|
| 38,093 |
|
|
| 38,289 |
|
Dilutive effect of stock-based awards |
|
| 103,781 |
|
|
| 161,615 |
|
|
| 125,041 |
|
|
| 92,009 |
|
|
| 725 |
|
|
| 271 |
|
|
| 779 |
|
|
| 397 |
|
Weighted average shares outstanding adjusted for dilutive securities |
|
| 37,294,708 |
|
|
| 35,965,684 |
|
|
| 37,290,593 |
|
|
| 33,435,512 |
|
|
| 38,524 |
|
|
| 38,730 |
|
|
| 38,872 |
|
|
| 38,686 |
|
|
|
|
|
|
|
|
|
|
|
|
|
|
|
|
|
|
|
|
|
|
|
|
|
|
| |||||||
Earnings per share |
|
|
|
|
|
|
|
|
|
|
|
|
|
|
|
|
|
|
|
|
|
|
|
|
| |||||||
Basic and diluted |
| $ | 0.05 |
|
| $ | 0.23 |
|
| $ | 0.46 |
|
| $ | 0.82 |
| ||||||||||||||||
Basic |
| $ | 5.20 |
|
| $ | 2.94 |
|
| $ | 9.45 |
|
| $ | 3.61 |
| ||||||||||||||||
Diluted |
| $ | 5.10 |
|
| $ | 2.91 |
|
| $ | 9.26 |
|
| $ | 3.57 |
| ||||||||||||||||
NOTE 18: SUBSEQUENT EVENTS
Bond Repurchase. On July 23, 2022, the Company redeemed $50.0 million in aggregate principal amount of the 2028 Notes for $51.5 million, which was at a redemption price of 103.0% of the principal amount, resulting in the recognition of a $1.5 million loss within other income and (expense), net in the third quarter Condensed Consolidated Statement of Comprehensive Income. The Company funded the transaction with cash on hand. As a result of this redemption, 0 2028 Notes remain outstanding. The Company will write-off the remaining balance of the 2028 Notes issuance costs and will record a charge of $0.7 million within other interest and other expense on debt in the third quarter Condensed Consolidated Statement of Comprehensive Income.
Share Repurchase Authorization. On August 3, 2022, the Board of Directors approved a $75.0 million share repurchase authorization after the exhaustion of the previous share repurchase authorization during the second quarter of 2022. Under the authorization, which is effective through August 3, 2024, management has discretion in determining the conditions under which shares may be purchased from time to time.
Dividends. On August 3, 2022 , the Board of Directors declared a quarterly cash dividend in the amount of $0.15 per share of common stock, payable on September 15, 2022 to stockholders of record as of September 1, 2022. Future quarterly dividends, if any, will be subject to Board approval.
21
Item 2. Management’s Discussion and Analysis of Financial Condition and Results of Operations
This Quarterly Report contains “forward-looking statements” within the meaning of the Private Securities Litigation Reform Act of 1995. Such statements can be identified by the use of forward-looking terminology such as “objectives,” “goals,” “preliminary,” “range,” “believes,” “expects,” “may,” “estimates,” “will,” “should,” “plans”“plans,” or “anticipates” or the negative thereof or other variations thereon or comparable terminology, or by discussions of strategy. Readers are cautioned that any such forward-looking statements are not guarantees of future performance and may involve significant risks and uncertainties, and that actual results may vary materially from those anticipated or implied in the forward-looking statements as a result of various factors. These forward-looking statements involve a number of risks and uncertainties that could cause actual results to differ materially from those suggested by the forward-looking statements. Forward-looking statements should, therefore, be considered in light of various factors, including those set forth under “Special Note Regarding Forward-Looking Statements” and “Risk Factors” in our Annual Report on Form 10-K for the year ended December 31, 20162021 filed on March 13, 2017February 23, 2022 and the section entitled “Management’s Discussion and Analysis of Financial Condition and Results of Operations – Industry and Operating Trends” and elsewhere in this Quarterly Report on Form 10-Q. Moreover, we caution you not to place undue reliance on these forward-looking statements, which speak only as of the date they were made. We do not undertake any obligation to publicly release any revisions to these forward-looking statements to reflect events or circumstances after the date of this Quarterly Report or to reflect the occurrence of unanticipated events.
The contents herein are provided for general information purposes only and do not constitute an offer to sell or buy, or a solicitation of an offer to buy, any security (“Security”) of Ryerson Holding or its affiliates in any jurisdiction. Ryerson does not intend to solicit and is not soliciting, any action with respect to any Security or any other contractual relationship with Ryerson. Nothing in this Form 10-Q, individually or taken in the aggregate, constitutes an offer of securities for sale or buy, or a solicitation of an offer to buy, any Security in the United States, or to US persons, or in any other jurisdiction in which such an offer or solicitation is unlawful.
The following discussion should be read in conjunction with our Condensed Consolidated Financial Statements and related Notes thereto in Item 1, “Financial Statements” in this Quarterly Report on Form 10-Q and our Consolidated Financial Statements and related Notes thereto for the year ended December 31, 20162021 in our Annual Report on Form 10-Kfiled on March 13, 2017.February 23, 2022.
Industry and Operating Trends
We are a leading metals service center that distributesproviding value-added processing and provides value-added processingdistribution of industrial metals with operations in the United States, Canada, Mexico, and China. We purchase large quantities of metal products from primary producers and sell these materials in smaller quantities to a wide variety of metals-consuming industries. More than 75%We carry a full line of nearly 75,000 products in stainless steel, aluminum, carbon steel, and alloy steels and a limited line of nickel and red metals in various shapes and forms. In addition to our metals products, we offer numerous value-added processing and fabrication services, and nearly 80% of the metals products soldwe sell are processed by us by bending, beveling, blanking, blasting, burning, cutting-to-length, drilling, embossing, flattening, forming, grinding, laser cutting, machining, notching, painting, perforating, polishing, punching, rolling, sawing, scribing, shearing, slitting, blanking, cutting to lengthstamping, tapping, threading, welding, or other techniques. techniques to process materials to a specified thickness, length, width, shape, and surface quality pursuant to specific customer orders.
Similar to other metals service centers, we maintain substantial inventories of metals to accommodate the short lead times and just-in-time delivery requirements of our customers. Accordingly, we purchase metals in an effort to maintain our inventory at levels that we believe to be appropriate to satisfy the anticipated needs of our customers based upon customer forecasts, historic buying practices, supply agreements with customers, mill lead times, and market conditions. Our commitments to purchase metals are generally at prevailing market prices in effect at the time we place our orders. At the request of our customers, we have entered into swaps in order to mitigate our customers’ risk of volatility in the price of metals and we have entered into metals hedges to mitigate our own risk of volatility in the price of metals. We have no long-term, fixed-price metals purchase contracts. When metals prices decline, customer demands for lower prices and our competitors’ responses to those demands could result in lower sale prices and, consequently, lower gross profits and earnings as we usesell existing metals inventory. When metals prices increase, competitive conditions will influence how much of the price increase we may pass on to our customers.
The metals service center industry is cyclical and volatile in terms of both pricing and demand, and pricing, as such, industrial metals prices are volatile and remain difficult to predict. In the thirdfirst half of 2022, Ryerson experienced stronger pricing compared to the first half of 2021, with average selling prices 42.6% higher, reflective of the strong commodity pricing environment caused by global demand outpacing supply availability, trade disruption due to the Russian war on Ukraine, and customers building inventory in preparation for continued supply chain issues. Changes in average selling prices are primarily driven by commodity metals prices, which impact Ryerson’s selling prices.
Key industry indicators showed slowing growth in the second quarter of 2017, we continue to see improved demand when viewed against2022. This is evidenced by the Institute for Supply Management’s Purchasing Managers’ Index (“PMI”), which reported sequential declines in April, May, and June. Additionally, U.S. Industrial Production decreased year-over year ago period. for the month of June, signifying slowing conditions.
According to the Metal Service Center Institute, U.S.North American service center volumes per day have increaseddeclined by more than three percent4.4% in the first half of 2022 compared to the second quarterfirst half of 2017. In2021. On a North American basis, Ryerson performed better than the third quarterindustry with volumes
22
declining 2.7% over the same period. However, on a quarterly sequential basis, industry volume growth of 2017, we experienced0.3% was greater than Ryerson’s volume decrease of 0.7%. On a quarterly year-over-yearsequential basis, Ryerson end-market demand decreased in the HVAC and food processing and agricultural equipment sectors, but was partially offset by demand growth in shipment volumes to nearly all of our end markets, most notably inthe oil & gas, metal fabrication and machine shops, as well as commercial ground transportation oil & gas, and construction equipment sectors. However, we saw quarterly year-over-year shipment declines in consumer durables.
Overall, a weaker U.S. dollar and improved global pricing conditions narrowed spreads between foreign and domestic steel pricingFirst Six Months 2022 vs. First Six Months 2021 performance highlights
$3.5B |
|
|
| 25.1% |
|
|
| $360M |
| |
Total Revenues |
|
| Gross Margin |
| Net Income Attributable to Ryerson |
| ||||
| 36% increase |
|
| 740 bps increase |
|
| $222M increase | |||
$9.26 |
|
|
| $9.56 |
|
|
| $168M |
| |
Diluted EPS |
|
| Adj. Diluted EPS* |
| Cash from Operating Activities | |||||
| $5.69 increase |
|
| $8.06 increase |
|
| $219M increase | |||
*A reconciliation of the non-GAAP financial measure to the comparable GAAP measure is included in the third quartersubsequent table.
Ryerson generated revenues of 2017. Commodity prices on balance trended higher sequentially from$3.5 billion in the second quarter throughfirst six months of 2022, an increase of 36.1% compared to $2.6 billion for the third quarterfirst six months of 2017 despite continuing volatility in industrial base metal markets. However, elevated import levels and well supplied metals markets muted service center pricing power,2021, with our average selling prices down one percent42.6% higher and tons shipped 4.5% lower. In the first six months of 2022, gross margin expanded to 25.1% compared to 17.7% for the first six months of 2021. Included in the third quarterfirst six months of 20172022 cost of materials sold was LIFO income of $71.6 million, compared to LIFO expense of $188.6 million in the first six months of 2021. Net income attributable to Ryerson Holding Corporation was $360.0 million, or earnings of $9.26 per diluted share, in the first six months of 2022 compared to net income attributable to Ryerson Holding Corporation of $138.2 million, or income of $3.57 per diluted share, for the first six months of 2021.
To provide greater insight into the Company’s operating trends for the first six months of 2022 apart from the period’s one-time transactions, Ryerson provides adjusted net income and adjusted diluted earnings per share figures, which are not U.S. generally accepted accounting principles (“GAAP”) financial measures, to compliment the reported GAAP net income and diluted earnings per share figures. Management uses these metrics to assess year-over-year performance excluding non-recurring transactions. Adjusted net income and adjusted diluted earnings per share do not represent, and should not be used as a substitute for, net income or diluted earnings per share determined in accordance with GAAP. Illustrated in the below table, the first six months of 2022 net income attributable to Ryerson of $360.0 million includes a loss on retirement of debt of $19.8 million and a gain on sale of assets of $3.8 million. After adjusting for these non-core business transactions and the related income tax provision, the adjusted net income attributable to Ryerson for the first six months of 2022 is $371.9 million, an increase of $313.8 million compared to the prior quarter.year-ago adjusted net income attributable to Ryerson of $58.1 million which adjusted a gain on the sale of assets of $107.7 million and related income taxes.
(Dollars and shares in millions, except per share data) |
| First Half 2022 |
|
| First Half 2021 |
| ||
Net income attributable to Ryerson Holding Corporation |
| $ | 360.0 |
|
| $ | 138.2 |
|
Gain on sale of assets |
|
| (3.8 | ) |
|
| (107.7 | ) |
Loss on retirement of debt |
|
| 19.8 |
|
|
| — |
|
Provision (benefit) for income taxes on above items |
|
| (4.1 | ) |
|
| 27.6 |
|
Adjusted net income attributable to Ryerson Holding Corporation |
| $ | 371.9 |
|
| $ | 58.1 |
|
Diluted earnings per share |
| $ | 9.26 |
|
| $ | 3.57 |
|
Adjusted diluted earnings per share |
| $ | 9.56 |
|
| $ | 1.50 |
|
Shares outstanding – diluted |
|
| 38.9 |
|
|
| 38.7 |
|
Recent Developments
After the Russian forces invaded Ukraine on February 24, 2022, the Biden administration issued executive orders prohibiting the importation of goods from covered regions related to Ukraine and Russia. Ryerson takes this very seriously and has reviewed our direct and indirect material purchases to ensure compliance. On April 8, 2022, President Biden signed into law the Suspending Normal Trade Relations with Russia and Belarus Act, which denies "most-favored nation" tariff treatment to products of Russia and Belarus
23
and extends the President’s authority to impose sanctions under the Global Magnitsky Human Rights Accountability Act. Beginning April 9, 2022, the Act imposes a 10.5% import duty on unalloyed primary aluminum and 11.0% on value-add aluminum products. The muted pricing together with higher procuredimport duties are not expected to have a meaningful impact on the availability of aluminum for Ryerson. In 2022, the Company has not purchased material from Russia or the named Ukrainian regions and has no open purchases orders issued to Russian suppliers as of June 30, 2022.
On August 10, 2021, the Senate passed the Infrastructure Investment and Jobs Act, a $1.2 trillion bill which features $550 billion in new federal spending over 5 years. Included in this spending is investment in roads, bridges, and major projects, passenger and freight rail, electrical grid improvements, expansion of broadband access, transit systems, infrastructure for electric vehicles, and improvements to water systems. This bill was signed into law on November 15, 2021. The Company believes that the additional government spending on infrastructure projects under the Infrastructure Investment and Jobs Act may generate additional demand for our products especially within the industrial equipment, construction, green energy, and transportation industries. Accordingly, we anticipate that the Infrastructure Investment and Jobs Act will be beneficial to the Company, but ultimately the impact on the Company’s operations is unclear.
On April 22, 2021, the U.S. International Trade Commission (“USITC”) confirmed the Department of Commerce’s affirmative antidumping duty determinations and injury determinations regarding US imports of common alloy aluminum sheet. As a result, the USITC has issued final antidumping duty orders on U.S. imports of common alloy aluminum sheet from the following sixteen countries: Bahrain, Brazil, Croatia, Egypt, Germany, India, Indonesia, Italy, Oman, Romania, Serbia, Slovenia, South Africa, Spain, Taiwan, and Turkey. Antidumping rates differ greatly depending on country of origin and producing mill and range from the low single digits to as high as 243%. Ryerson anticipates that the actions of the USITC will support the prices of domestically produced aluminum sheet and therefore benefit the Company’s average selling prices.
On March 1, 2018, the White House announced a 25% tariff on all imported steel products and 10% tariff on all imported aluminum products for an indefinite amount of time under Section 232 of the Trade Expansion Act (“Section 232”). These tariffs, while in effect, have discouraged metal costs resultedimports from non-exempt countries and have had a favorable impact on the prices of the products we sell and our results of operations. In October 2021, the US and European Union agreed to revise Section 232 tariffs applied to the import of European steel and aluminum, allowing for the duty-free import of European steel and aluminum into the US, subject to tariff rate quotas. Specifically, the tariff rate quota includes the duty-free import of 3.3 million metric tons of steel melted and poured in margin compression through the third quarterEuropean Union, 18 thousand metric tons of 2017.unwrought aluminum, and 366 thousand metric tons of semi-finished aluminum. The revision is to be applied on January 1, 2022. Tariff rate quotas have since been implemented for Japan and the United Kingdom at 1.25 million metric tons and 0.5 million metric tons, respectively. Effective dates for the revisions are April 1, 2022 for Japan and June 1, 2022 for the United Kingdom.
On January 9, 2017, we acquired The Laserflex Corporation (“Laserflex”), a privately-owned metal fabricator with locations in Columbus, Ohio and Wellford, South Carolina. Laserflex specializes in laser fabrication metal processing and welding and further enhances our existing fabrication and metals processing capabilities.
On February 15, 2017, we acquired Guy Metals, Inc. (“Guy Metals”), a privately-owned metal service center company located in Hammond, Wisconsin. Guy Metals processes stainless and nickel alloy products including its trademarked “Pit Free Dairy” and “Super4” finishes used in food, dairy, pharmaceutical, and beverage applications. Consistent with the Laserflex acquisition, Guy Metals bolsters our value-added processing capabilities to provide additional services to our customers.
Components of Results of Operations
We generate substantially all of our revenue from sales of our metals products. RevenueThe majority of revenue is recognized upon delivery of product to customers. The timing of shipment is substantially the same as the timing of delivery to customers given the proximity of our distribution sites to our customers. Revenues associated with products which we believe have no alternative use, and where the Company has an enforceable right to payment, are recognized on an over-time basis. Over-time revenues are recorded in proportion with the progress made toward completing the performance obligation.
Sales, cost of materials sold, gross profit, and operating expense control are the principal factors that impact our profitability.
Net sales. Our sales volume and pricing isare driven by market demand, which is largely determined by overall industrial production and conditions in the specific industries in which our customers operate. Sales prices are also primarily driven by market factors such as overall demand and availability of product. Our net sales include revenue from product sales, net of returns, allowances, customer discounts, and incentives.
Cost of materials sold. Cost of materials sold includes metal purchase and in-bound freight costs, third-party processing costs, and direct and indirect internal processing costs. The cost of materials sold fluctuates with our sales volume and our ability to purchase metals at competitive prices. Increases in sales volume generally enable us both to improve purchasing leverage with suppliers, as we buy larger quantities of metals inventories, and to reduce operating expenses per ton sold.inventories.
Gross profit. Gross profit is the difference between net sales and the cost of materials sold. Our sales prices to our customers are subject to market competition. Achieving acceptable levels of gross profit is dependent on our acquiring metals at competitive prices, our ability to manage the impact of changing prices, and efficiently managing our internal and external processing costs.
Operating expenses. Optimizing business processes and asset utilization to lower fixed expenses such as employee, facility, and truck fleet costs, which cannot be rapidly reduced in times of declining volume, and maintaining a low fixed cost structure in times of increasing sales volume, have a significant impact on our profitability. Operating expenses include costs related to warehousing and distributing our products as well as selling, general, and administrative expenses.
24
Results of Operations—Operations — Comparison of Three and NineSix Months Ended SeptemberJune 30, 20172022 to Three and NineSix Months Ended SeptemberJune 30, 20162021
The following table sets forth our condensed consolidated statements of income data for the three-month and nine-monthsix-month periods ended SeptemberJune 30, 20172022 and 2016:2021 (certain percentages may not calculate due to rounding):
|
| Three Months Ended June 30, |
|
| Six Months Ended June 30, |
| ||||||||||||||||||||||||||
|
| 2022 |
|
| 2021 |
|
| 2022 |
|
| 2021 |
| ||||||||||||||||||||
|
| $ |
|
| % of Net |
|
| $ |
|
| % of Net |
|
| $ |
|
| % of Net |
|
| $ |
|
| % of Net |
| ||||||||
|
| ($ in millions) |
|
| ($ in millions) |
| ||||||||||||||||||||||||||
Net sales |
| $ | 1,743.5 |
|
|
| 100.0 | % |
| $ | 1,419.0 |
|
|
| 100.0 | % |
| $ | 3,492.3 |
|
|
| 100.0 | % |
| $ | 2,566.3 |
|
|
| 100.0 | % |
Cost of materials sold |
|
| 1,277.6 |
|
|
| 73.3 |
|
|
| 1,162.0 |
|
|
| 81.9 |
|
|
| 2,616.3 |
|
|
| 74.9 |
|
|
| 2,111.4 |
|
|
| 82.3 |
|
Gross profit |
|
| 465.9 |
|
|
| 26.7 |
|
|
| 257.0 |
|
|
| 18.1 |
|
|
| 876.0 |
|
|
| 25.1 |
|
|
| 454.9 |
|
|
| 17.7 |
|
Warehousing, delivery, selling, general, and administrative expenses |
|
| 182.9 |
|
|
| 10.5 |
|
|
| 178.3 |
|
|
| 12.6 |
|
|
| 358.2 |
|
|
| 10.3 |
|
|
| 350.1 |
|
|
| 13.6 |
|
Gain on sale of assets |
|
| (3.8 | ) |
|
| (0.2 | ) |
|
| (87.4 | ) |
|
| (6.2 | ) |
|
| (3.8 | ) |
|
| (0.1 | ) |
|
| (107.7 | ) |
|
| (4.2 | ) |
Operating profit |
|
| 286.8 |
|
|
| 16.4 |
|
|
| 166.1 |
|
|
| 11.7 |
|
|
| 521.6 |
|
|
| 14.9 |
|
|
| 212.5 |
|
|
| 8.3 |
|
Other (expenses) and income |
|
| (23.6 | ) |
|
| (1.4 | ) |
|
| (14.3 | ) |
|
| (1.0 | ) |
|
| (39.6 | ) |
|
| (1.1 | ) |
|
| (27.5 | ) |
|
| (1.1 | ) |
Income before income taxes |
|
| 263.2 |
|
|
| 15.1 |
|
|
| 151.8 |
|
|
| 10.7 |
|
|
| 482.0 |
|
|
| 13.8 |
|
|
| 185.0 |
|
|
| 7.2 |
|
Provision for income taxes |
|
| 66.8 |
|
|
| 3.8 |
|
|
| 38.5 |
|
|
| 2.7 |
|
|
| 121.8 |
|
|
| 3.5 |
|
|
| 46.1 |
|
|
| 1.8 |
|
Net income |
|
| 196.4 |
|
|
| 11.3 |
|
|
| 113.3 |
|
|
| 8.0 |
|
|
| 360.2 |
|
|
| 10.3 |
|
|
| 138.9 |
|
|
| 5.4 |
|
Less: Net income attributable to noncontrolling interest |
|
| — |
|
|
| — |
|
|
| 0.4 |
|
|
| — |
|
|
| 0.2 |
|
|
| — |
|
|
| 0.7 |
|
|
| — |
|
Net income attributable to Ryerson Holding Corporation |
| $ | 196.4 |
|
|
| 11.3 | % |
| $ | 112.9 |
|
|
| 8.0 | % |
| $ | 360.0 |
|
|
| 10.3 | % |
| $ | 138.2 |
|
|
| 5.4 | % |
Basic earnings per share |
| $ | 5.20 |
|
|
|
|
| $ | 2.94 |
|
|
|
|
| $ | 9.45 |
|
|
|
|
| $ | 3.61 |
|
|
|
| ||||
Diluted earnings per share |
| $ | 5.10 |
|
|
|
|
| $ | 2.91 |
|
|
|
|
| $ | 9.26 |
|
|
|
|
| $ | 3.57 |
|
|
|
| ||||
|
| Three Months Ended September 30, |
|
| Nine Months Ended September 30, |
| ||||||||||||||||||||||||||
|
| 2017 |
|
| 2016 |
|
| 2017 |
|
| 2016 |
| ||||||||||||||||||||
|
| $ |
|
| % of Net Sales |
|
| $ |
|
| % of Net Sales |
|
| $ |
|
| % of Net Sales |
|
| $ |
|
| % of Net Sales |
| ||||||||
|
| ($ in millions) |
|
| ($ in millions) |
| ||||||||||||||||||||||||||
Net sales |
| $ | 864.2 |
|
|
| 100.0 | % |
| $ | 735.1 |
|
|
| 100.0 | % |
| $ | 2,554.1 |
|
|
| 100.0 | % |
| $ | 2,177.5 |
|
|
| 100.0 | % |
Cost of materials sold |
|
| 719.2 |
|
|
| 83.2 |
|
|
| 589.7 |
|
|
| 80.2 |
|
|
| 2,108.1 |
|
|
| 82.5 |
|
|
| 1,721.5 |
|
|
| 79.1 |
|
Gross profit |
|
| 145.0 |
|
|
| 16.8 |
|
|
| 145.4 |
|
|
| 19.8 |
|
|
| 446.0 |
|
|
| 17.5 |
|
|
| 456.0 |
|
|
| 20.9 |
|
Warehousing, delivery, selling, general and administrative expenses |
|
| 119.2 |
|
|
| 13.8 |
|
|
| 109.1 |
|
|
| 14.8 |
|
|
| 353.2 |
|
|
| 13.9 |
|
|
| 331.5 |
|
|
| 15.2 |
|
Restructuring and other charges |
|
| — |
|
|
| — |
|
|
| 2.5 |
|
|
| 0.4 |
|
|
| — |
|
|
| — |
|
|
| 2.5 |
|
|
| 0.1 |
|
Operating profit |
|
| 25.8 |
|
|
| 3.0 |
|
|
| 33.8 |
|
|
| 4.6 |
|
|
| 92.8 |
|
|
| 3.6 |
|
|
| 122.0 |
|
|
| 5.6 |
|
Other expenses |
|
| (24.6 | ) |
|
| (2.9 | ) |
|
| (23.8 | ) |
|
| (3.2 | ) |
|
| (69.8 | ) |
|
| (2.7 | ) |
|
| (80.7 | ) |
|
| (3.7 | ) |
Income before income taxes |
|
| 1.2 |
|
|
| 0.1 |
|
|
| 10.0 |
|
|
| 1.4 |
|
|
| 23.0 |
|
|
| 0.9 |
|
|
| 41.3 |
|
|
| 1.9 |
|
Provision (benefit) for income taxes |
|
| (0.7 | ) |
|
| (0.1 | ) |
|
| 1.6 |
|
|
| 0.3 |
|
|
| 5.3 |
|
|
| 0.2 |
|
|
| 14.0 |
|
|
| 0.6 |
|
Net income |
|
| 1.9 |
|
|
| 0.2 |
|
|
| 8.4 |
|
|
| 1.1 |
|
|
| 17.7 |
|
|
| 0.7 |
|
|
| 27.3 |
|
|
| 1.3 |
|
Less: Net income attributable to noncontrolling interest |
|
| 0.2 |
|
|
| — |
|
|
| 0.2 |
|
|
| — |
|
|
| 0.6 |
|
|
| — |
|
|
| — |
|
|
| — |
|
Net income attributable to Ryerson Holding Corporation |
| $ | 1.7 |
|
|
| 0.2 | % |
| $ | 8.2 |
|
|
| 1.1 | % |
| $ | 17.1 |
|
|
| 0.7 | % |
| $ | 27.3 |
|
|
| 1.3 | % |
Basic and diluted earnings per share |
| $ | 0.05 |
|
|
|
|
|
| $ | 0.23 |
|
|
|
|
|
| $ | 0.46 |
|
|
|
|
|
| $ | 0.82 |
|
|
|
|
|
25
The following table shows ourcharts show the Company’s percentage of sales revenue by major product lines for the threesix months ended June 30, 2022 and nine month periods ended September 30, 2017 and 2016:2021:
|
| Three Months Ended September 30, |
|
| Nine Months Ended September 30, |
| ||||||||||
Product Line |
| 2017 |
|
| 2016 |
|
| 2017 |
|
| 2016 |
| ||||
Carbon Steel Flat |
|
| 29 | % |
|
| 29 | % |
|
| 28 | % |
|
| 27 | % |
Carbon Steel Plate |
|
| 10 |
|
|
| 9 |
|
|
| 10 |
|
|
| 9 |
|
Carbon Steel Long |
|
| 12 |
|
|
| 13 |
|
|
| 12 |
|
|
| 14 |
|
Stainless Steel Flat |
|
| 17 |
|
|
| 17 |
|
|
| 18 |
|
|
| 16 |
|
Stainless Steel Plate |
|
| 4 |
|
|
| 4 |
|
|
| 4 |
|
|
| 4 |
|
Stainless Steel Long |
|
| 4 |
|
|
| 3 |
|
|
| 4 |
|
|
| 4 |
|
Aluminum Flat |
|
| 16 |
|
|
| 16 |
|
|
| 15 |
|
|
| 16 |
|
Aluminum Plate |
|
| 3 |
|
|
| 3 |
|
|
| 3 |
|
|
| 3 |
|
Aluminum Long |
|
| 4 |
|
|
| 4 |
|
|
| 4 |
|
|
| 5 |
|
Other |
|
| 1 |
|
|
| 2 |
|
|
| 2 |
|
|
| 2 |
|
Total |
|
| 100 | % |
|
| 100 | % |
|
| 100 | % |
|
| 100 | % |
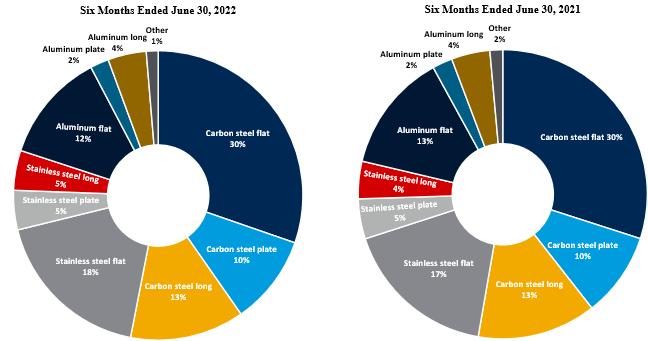
|
| September 30, |
|
| Dollar |
|
| Percentage |
| |||||||
|
| 2017 |
|
| 2016 |
|
| change |
|
| change |
| ||||
|
| ($ in millions) |
|
|
|
|
|
|
|
|
| |||||
Net sales (three-months ended) |
| $ | 864.2 |
|
| $ | 735.1 |
|
| $ | 129.1 |
|
|
| 17.6 | % |
Net sales (nine-months ended) |
| $ | 2,554.1 |
|
| $ | 2,177.5 |
|
| $ | 376.6 |
|
|
| 17.3 | % |
|
|
|
|
|
|
|
|
|
|
|
|
|
|
|
|
|
|
| September 30, |
|
| Tons |
|
| Percentage |
| |||||||
|
| 2017 |
|
| 2016 |
|
| change |
|
| change |
| ||||
|
| (in thousands) |
|
|
|
|
|
|
|
|
| |||||
Tons sold (three-months ended) |
|
| 515 |
|
|
| 480 |
|
|
| 35 |
|
|
| 7.3 | % |
Tons sold (nine-months ended) |
|
| 1,530 |
|
|
| 1,463 |
|
|
| 67 |
|
|
| 4.6 | % |
|
|
|
|
|
|
|
|
|
|
|
|
|
|
|
|
|
|
| September 30, |
|
| Price |
|
| Percentage |
| |||||||
|
| 2017 |
|
| 2016 |
|
| change |
|
| change |
| ||||
Average selling price per ton sold (three-months ended) |
| $ | 1,678 |
|
| $ | 1,531 |
|
| $ | 147 |
|
|
| 9.6 | % |
Average selling price per ton sold (nine-months ended) |
| $ | 1,669 |
|
| $ | 1,488 |
|
| $ | 181 |
|
|
| 12.2 | % |
|
| June 30, |
|
| Dollar |
|
| Percentage |
| |||||||
|
| 2022 |
|
| 2021 |
|
| change |
|
| change |
| ||||
|
| ($ in millions) |
|
|
|
|
|
|
| |||||||
Net sales (three-months ended) |
| $ | 1,743.5 |
|
| $ | 1,419.0 |
|
| $ | 324.5 |
|
|
| 22.9 | % |
Net sales (six-months ended) |
| $ | 3,492.3 |
|
| $ | 2,566.3 |
|
| $ | 926.0 |
|
|
| 36.1 | % |
|
|
|
|
|
|
|
|
|
|
|
|
| ||||
|
| June 30, |
|
| Tons |
|
| Percentage |
| |||||||
|
| 2022 |
|
| 2021 |
|
| change |
|
| change |
| ||||
|
| (in thousands) |
|
|
|
|
|
|
| |||||||
Tons sold (three-months ended) |
|
| 524 |
|
|
| 559 |
|
|
| (35 | ) |
|
| (6.3 | )% |
Tons sold (six-months ended) |
|
| 1,052 |
|
|
| 1,102 |
|
|
| (50 | ) |
|
| (4.5 | )% |
|
| June 30, |
|
| Price |
|
| Percentage |
| |||||||
|
| 2022 |
|
| 2021 |
|
| change |
|
| change |
| ||||
Average selling price per ton sold (three-months ended) |
| $ | 3,327 |
|
| $ | 2,538 |
|
| $ | 789 |
|
|
| 31.1 | % |
Average selling price per ton sold (six-months ended) |
| $ | 3,320 |
|
| $ | 2,329 |
|
| $ | 991 |
|
|
| 42.6 | % |
Revenue for the three-month and nine-monthsix-month periods ended SeptemberJune 30, 20172022 increased from the same periods a year ago due to higher average selling prices caused by higher commodity prices and higher tons sold. Average selling price increased insupply constraints. Compared to the three-month and nine-monthyear ago periods, ended September 30, 2017 from the price levels in the same periods of 2016 reflecting improved economic conditions in the metals market. Averageaverage selling price increased for all of our product lines in the three-month and nine-monthsix-month periods ended SeptemberJune 30, 20172022 with the largest increases in our carbonstainless flat, stainless flatlong, carbon plate, and stainless platealuminum flat products. Tons sold increaseddecreased in the three-month and nine-monthsix-month periods ended SeptemberJune 30, 2017. The2022, compared to the year ago periods, for almost all of our product lines with the largest increases in shipments weredecreases in our stainless long,flat, aluminum flat, aluminum plate, and stainless plate and carbon plate product lines and our stainless long, stainless flat and aluminum flat product lines for the three and nine month periods ending September 30, 2017, respectively.lines.
26
Cost of materials sold
|
| June 30, |
|
|
|
|
|
|
| |||||||||||||||
|
| 2022 |
|
| 2021 |
|
|
|
|
|
|
| ||||||||||||
|
| $ |
|
| % of Net |
|
| $ |
|
| % of Net |
|
| Dollar change |
|
| Percentage change |
| ||||||
|
| ($ in millions) |
|
|
|
|
|
|
| |||||||||||||||
Cost of materials sold (three-months ended) |
| $ | 1,277.6 |
|
|
| 73.3 | % |
| $ | 1,162.0 |
|
|
| 81.9 | % |
| $ | 115.6 |
|
|
| 9.9 | % |
Cost of materials sold (six-months ended) |
| $ | 2,616.3 |
|
|
| 74.9 | % |
| $ | 2,111.4 |
|
|
| 82.3 | % |
| $ | 504.9 |
|
|
| 23.9 | % |
|
|
|
|
|
|
|
|
|
|
|
|
|
|
|
|
|
|
| ||||||
|
| September 30, |
|
|
|
|
|
|
|
|
| |||||||||||||||||||||||||||
|
| 2017 |
|
| 2016 |
|
|
|
|
|
|
|
|
| ||||||||||||||||||||||||
|
| $ |
|
| % of Net Sales |
|
| $ |
|
| % of Net Sales |
|
| Dollar change |
|
| Percentage change |
| ||||||||||||||||||||
|
| ($ in millions) |
|
|
|
|
|
|
|
|
| |||||||||||||||||||||||||||
Cost of materials sold (three-months ended) |
| $ | 719.2 |
|
|
| 83.2 | % |
| $ | 589.7 |
|
|
| 80.2 | % |
| $ | 129.5 |
|
|
| 22.0 | % | ||||||||||||||
Cost of materials sold (nine-months ended) |
| $ | 2,108.1 |
|
|
| 82.5 | % |
| $ | 1,721.5 |
|
|
| 79.1 | % |
| $ | 386.6 |
|
|
| 22.5 | % | ||||||||||||||
|
|
|
|
|
|
|
|
|
|
|
|
|
|
|
|
|
|
|
|
|
|
|
|
| ||||||||||||||
|
| September 30, |
|
| Cost |
|
| Percentage |
| |||||||||||||||||||||||||||||
|
| 2017 |
|
| 2016 |
|
| change |
|
| change |
| ||||||||||||||||||||||||||
Average cost of materials sold per ton sold (three-months ended) |
| $ | 1,396 |
|
| $ | 1,228 |
|
| $ | 168 |
|
|
| 13.7 | % | ||||||||||||||||||||||
Average cost of materials sold per ton sold (nine-months ended) |
| $ | 1,377 |
|
| $ | 1,176 |
|
| $ | 201 |
|
|
| 17.1 | % | ||||||||||||||||||||||
|
| June 30, |
|
| Cost |
|
| Percentage |
| |||||||
|
| 2022 |
|
| 2021 |
|
| change |
|
| change |
| ||||
Average cost of materials sold per ton sold (three-months ended) |
| $ | 2,438 |
|
| $ | 2,078 |
|
| $ | 360 |
|
|
| 17.3 | % |
Average cost of materials sold per ton sold (six-months ended) |
| $ | 2,487 |
|
| $ | 1,916 |
|
| $ | 571 |
|
|
| 29.8 | % |
The increase in cost of materials sold in the three-month and nine-monthsix-month periods ended SeptemberJune 30, 20172022 compared to the same periods a year ago periods is primarily due to anthe increase in average cost of materials sold per ton and the increase inpartially offset by lower tons sold. The average cost of materials sold forincreased across all product lines with the largest increases in our carbon plate, stainlesscarbon flat, and stainless platelong product lines increased more than our other products during both the threethree-month and nine monthsix-month periods of 2017, which was a faster increase than the increase in average selling price per ton for these products.ended June 30, 2022. During the thirdsecond quarter of 2017,2022, LIFO income was $1.7 $73.8 million compared to LIFO expense of $25.1 $104.8million in the thirdsecond quarter of 2016. LIFO expense in the third quarter of 2016 was offset by a $23.7 million credit to adjust the lower of cost or market inventory reserve. In2021. During the first ninesix months of 2017,2022, LIFO expenseincome was $35.7$71.6 million compared to LIFO expense of $5.0 $188.6million in the first ninesix months of 2016. LIFO expense in the first nine months of 2017 was offset by a $23.9 million credit to adjust the lower of cost or market inventory reserve while LIFO expense in the first nine months of 2016 was more than offset by a $25.4 million credit to adjust the lower of cost or market inventory reserve.2021.
Gross profit
|
| September 30, |
|
|
|
|
|
|
|
|
|
| June 30, |
|
|
|
|
|
| |||||||||||||||||||||||||||||
|
| 2017 |
|
| 2016 |
|
|
|
|
|
|
|
|
|
| 2022 |
|
| 2021 |
|
|
|
|
|
| |||||||||||||||||||||||
|
| $ |
|
| % of Net Sales |
|
| $ |
|
| % of Net Sales |
|
| Dollar change |
|
| Percentage change |
|
| $ |
|
| % of Net |
|
| $ |
|
| % of Net |
|
| Dollar change |
|
| Percentage change |
| ||||||||||||
|
| ($ in millions) |
|
|
|
|
|
|
|
|
|
| ($ in millions) |
|
|
|
|
|
| |||||||||||||||||||||||||||||
Gross profit (three-months ended) |
| $ | 145.0 |
|
|
| 16.8 | % |
| $ | 145.4 |
|
|
| 19.8 | % |
| $ | (0.4 | ) |
|
| (0.3 | )% |
| $ | 465.9 |
|
|
| 26.7 | % |
| $ | 257.0 |
|
|
| 18.1 | % |
| $ | 208.9 |
|
|
| 81.3 | % |
Gross profit (nine-months ended) |
| $ | 446.0 |
|
|
| 17.5 | % |
| $ | 456.0 |
|
|
| 20.9 | % |
| $ | (10.0 | ) |
|
| (2.2 | )% | ||||||||||||||||||||||||
Gross profit (six-months ended) |
| $ | 876.0 |
|
|
| 25.1 | % |
| $ | 454.9 |
|
|
| 17.7 | % |
| $ | 421.1 |
|
|
| 92.6 | % | ||||||||||||||||||||||||
Gross profit decreased in the three-month and nine-month periods ended September 30, 2017 compared to the same periods in 2016 as a competitive pricing environment pressured gross profit as a percent of sales. While our revenue per ton increased in the three-month and nine-monthsix-month periods ended SeptemberJune 30, 20172022 compared to the year ago periods as average selling price increased faster than the increase in the average cost of materials sold resulting in an increase in gross margin.
Operating expenses
|
| June 30, |
|
|
|
|
|
|
| |||||||||||||||
|
| 2022 |
|
| 2021 |
|
|
|
|
|
|
| ||||||||||||
|
| $ |
|
| % of Net |
|
| $ |
|
| % of Net |
|
| Dollar change |
|
| Percentage change |
| ||||||
|
| ($ in millions) |
|
|
|
|
|
|
| |||||||||||||||
Warehousing, delivery, selling, general, and administrative expenses (three-months ended) |
| $ | 182.9 |
|
|
| 10.5 | % |
| $ | 178.3 |
|
|
| 12.6 | % |
| $ | 4.6 |
|
|
| 2.6 | % |
Warehousing, delivery, selling, general, and administrative expenses (six-months ended) |
| $ | 358.2 |
|
|
| 10.3 | % |
| $ | 350.1 |
|
|
| 13.6 | % |
| $ | 8.1 |
|
|
| 2.3 | % |
Gain on sale of assets (three-months ended) |
| $ | (3.8 | ) |
|
| (0.2 | )% |
| $ | (87.4 | ) |
|
| (6.2 | )% |
| $ | 83.6 |
|
|
| (95.7 | )% |
Gain on sale of assets (six-months ended) |
| $ | (3.8 | ) |
|
| (0.1 | )% |
| $ | (107.7 | ) |
|
| (4.2 | )% |
| $ | 103.9 |
|
|
| (96.5 | )% |
Warehousing, delivery, selling, general, and administrative expenses increased slightly in the three-month and six-month periods ended June 30, 2022 compared to the year ago periods primarily due to higher facility costs of $6.1 million in the second quarter and $9.5 million in the first six months of 2022 primarily due to higher operating supplies and to higher rent expense after the leaseback of facilities sold in 2021, higher selling, general, and administrative expenses of $4.4 million in the second quarter of 2022 and $7.8 million in the first six months of 2022 primarily due to higher consulting fees and higher travel and entertainment expenses, increased salaries and wages expense of $2.8 million in the second quarter of 2022 and $6.4 million in the first six months of 2022, and increased delivery expenses of $4.0 million in the second quarter of 2022 and $6.0 million in the first six months of 2022 primarily due to higher fuel prices. Partially offsetting the increase in expenses was a decrease in incentive compensation of $14.1 million in the second quarter of 2022 and $21.0 million in the first six months of 2022.
27
The second quarter of 2022 includes a gain on sale of assets of $3.8 million from the sale of a facility in Texas that Ryerson had an option to purchase. In the second quarter of 2021, we recognized a gain of $87.4 million on the sale and leaseback of twelve facilities across the United States. In the first quarter of 2021, we recognized a gain on sale of assets of $20.3 million from the sale and leaseback of our Renton, Washington facility.
Operating profit
|
| June 30, |
|
|
|
|
|
|
| |||||||||||||||
|
| 2022 |
|
| 2021 |
|
|
|
|
|
|
| ||||||||||||
|
| $ |
|
| % of Net |
|
| $ |
|
| % of Net |
|
| Dollar change |
|
| Percentage change |
| ||||||
|
| ($ in millions) |
|
|
|
|
|
|
| |||||||||||||||
Operating profit (three-months ended) |
| $ | 286.8 |
|
|
| 16.4 | % |
| $ | 166.1 |
|
|
| 11.7 | % |
| $ | 120.7 |
|
|
| 72.7 | % |
Operating profit (six-months ended) |
| $ | 521.6 |
|
|
| 14.9 | % |
| $ | 212.5 |
|
|
| 8.3 | % |
| $ | 309.1 |
|
|
| 145.5 | % |
Our operating profit increased in the three-month and six-month periods ended June 30, 2022 compared to the three-month and nine-month periods of 2016, cost of materials sold per ton increased at a faster pace resulting in lower gross margins.
|
| September 30, |
|
|
|
|
|
|
|
|
| |||||||||||||
|
| 2017 |
|
| 2016 |
|
|
|
|
|
|
|
|
| ||||||||||
|
| $ |
|
| % of Net Sales |
|
| $ |
|
| % of Net Sales |
|
| Dollar change |
|
| Percentage change |
| ||||||
|
| ($ in millions) |
|
|
|
|
|
|
|
|
| |||||||||||||
Warehousing, delivery, selling, general and administrative expenses (three months ended) |
| $ | 119.2 |
|
|
| 13.8 | % |
| $ | 109.1 |
|
|
| 14.8 | % |
| $ | 10.1 |
|
|
| 9.3 | % |
Warehousing, delivery, selling, general and administrative expenses (nine months ended) |
| $ | 353.2 |
|
|
| 13.9 | % |
| $ | 331.5 |
|
|
| 15.2 | % |
| $ | 21.7 |
|
|
| 6.5 | % |
Restructuring and other charges (three months ended) |
| $ | — |
|
|
| — |
|
| $ | 2.5 |
|
|
| 0.4 | % |
| $ | (2.5 | ) |
|
| (100.0 | )% |
Restructuring and other charges (nine months ended) |
| $ | — |
|
|
| — |
|
| $ | 2.5 |
|
|
| 0.1 | % |
| $ | (2.5 | ) |
|
| (100.0 | )% |
Total operating expenses increased in the three-month and nine-monthsix-month periods ended SeptemberJune 30, 2017 compared to the same periods in 2016 primarily due to improved demand and higher employment levels as well as general inflationary factors, which combined to increase salaries and wages, benefit costs and delivery expenses. The decrease in our operating expenses as a percentage of sales over these same periods is due to our higher sales levels resulting from higher metals pricing. The $2.5 million restructuring charge in 2016 was related to a facility closure.
Operating profit
|
| September 30, |
|
|
|
|
|
|
|
|
| |||||||||||||
|
| 2017 |
|
| 2016 |
|
|
|
|
|
|
|
|
| ||||||||||
|
| $ |
|
| % of Net Sales |
|
| $ |
|
| % of Net Sales |
|
| Dollar change |
|
| Percentage change |
| ||||||
|
| ($ in millions) |
|
|
|
|
|
|
|
|
| |||||||||||||
Operating profit (three-months ended) |
| $ | 25.8 |
|
|
| 3.0 | % |
| $ | 33.8 |
|
|
| 4.6 | % |
| $ | (8.0 | ) |
|
| (23.7 | )% |
Operating profit (nine-months ended) |
| $ | 92.8 |
|
|
| 3.6 | % |
| $ | 122.0 |
|
|
| 5.6 | % |
| $ | (29.2 | ) |
|
| (23.9 | )% |
Our operating profit decreased in both the three-month and nine-month periods of 2017 compared to the same periods a year ago,2021, primarily due to the declineincrease in gross profit as a percent of salesaverage selling prices discussed above.
Other expenses
|
| September 30, |
|
|
|
|
|
|
|
|
|
| June 30, |
|
|
|
|
|
| |||||||||||||||||||||||||||||
|
| 2017 |
|
| 2016 |
|
|
|
|
|
|
|
|
|
| 2022 |
|
| 2021 |
|
|
|
|
|
| |||||||||||||||||||||||
|
| $ |
|
| % of Net Sales |
|
| $ |
|
| % of Net Sales |
|
| Dollar change |
|
| Percentage change |
|
| $ |
|
| % of Net |
|
| $ |
|
| % of Net |
|
| Dollar change |
|
| Percentage change |
| ||||||||||||
|
| ($ in millions) |
|
|
|
|
|
|
|
|
|
| ($ in millions) |
|
|
|
|
|
| |||||||||||||||||||||||||||||
Interest and other expense on debt (three-months ended) |
| $ | (23.2 | ) |
|
| (2.7 | )% |
| $ | (23.6 | ) |
|
| (3.2 | )% |
| $ | 0.4 |
|
|
| (1.7 | )% |
| $ | (8.3 | ) |
|
| (0.5 | )% |
| $ | (13.6 | ) |
|
| (1.0 | )% |
| $ | (5.3 | ) |
|
| (39.0 | )% |
Interest and other expense on debt (nine-months ended) |
| $ | (67.8 | ) |
|
| (2.7 | )% |
| $ | (67.5 | ) |
|
| (3.1 | )% |
| $ | (0.3 | ) |
|
| 0.4 | % | ||||||||||||||||||||||||
Interest and other expense on debt (six-months ended) |
| $ | (18.6 | ) |
|
| (0.5 | )% |
| $ | (27.1 | ) |
|
| (1.1 | )% |
| $ | (8.5 | ) |
|
| (31.4 | )% | ||||||||||||||||||||||||
Other income and (expense), net (three-months ended) |
| $ | (1.4 | ) |
|
| (0.2 | )% |
| $ | (0.2 | ) |
|
| — |
|
| $ | (1.2 | ) |
|
| 600.0 | % |
| $ | (15.3 | ) |
|
| (0.9 | )% |
| $ | (0.7 | ) |
|
| — |
|
| $ | (14.6 | ) |
|
| (2,085.7 | )% |
Other income and (expense), net (nine-months ended) |
| $ | (2.0 | ) |
|
| — |
|
| $ | (13.2 | ) |
|
| (0.6 | )% |
| $ | 11.2 |
|
|
| (84.8 | )% | ||||||||||||||||||||||||
Other income and (expense), net (six-months ended) |
| $ | (21.0 | ) |
|
| (0.6 | )% |
| $ | (0.4 | ) |
|
| — |
|
| $ | (20.6 | ) |
|
| (5,150.0 | )% | ||||||||||||||||||||||||
Interest and other expense on debt was relatively unchangeddecreased in the three-month and six-month periods ended June 30, 2022 compared to the year ago periods primarily due to the redemption and repurchase of $400.0 million principal amount of our 8.50% senior secured notes due 2028 (the “2028 Notes”) since June 30, 2021. In July 2021, $150.0 million of the 2028 Notes were redeemed and $250.0 million were repurchased and retired in the first six months of 2022. Partially offsetting the impact of lower outstanding 2028 Notes was higher interest expense in the three-month and nine-monthsix-month periods ended June 30, 2022 due to a higher level of 2017borrowings outstanding under our $1.3 billion revolving credit facility (“the Ryerson Credit Facility”) compared to the same periods in 2016 as the interest rate on a portion of our outstanding Notes increased after we redeemed the $569.9 million outstanding balance of our 9.00% Senior Notes due 2017 (the “2017 Notes”), repurchased $121.9 million and thereafter redeemed the remaining outstanding $48.5 million of our 11.25% Senior Notes due 2018 (the “2018 Notes”) and issued $650.0 million of new 11.00% Senior Notes due 2022 (the “2022 Notes”) in 2016, partially offset by a reduction in the amount of our outstanding Notes and lower amortization of debt issuance costs expense. year ago periods.
The other expense in the second quarter and first three-monthsix months of 2022 includes a $14.5 million loss and nine-month periodsa $19.8 million loss, respectively, on the repurchases of 2017 was primarily related tothe 2028 Notes. In addition, the other expense in the second quarter and first six months of 2022 includes $0.7 million of foreign currencyexchange losses. The other expense in the second quarter and first ninesix months of 2016 included2021 includes a $7.2$1.3 million net loss on debt redemptions, foreign currency losses of $3.2 million and a $2.8$1.0 million charge due to an other-than-temporary impairment recognized on an available-for-sale investment.loss, respectively, resulting from the change in the fair value of the embedded derivative connected with the redemption options under the 2028 Notes.
Provision for income taxes. InOur effective income tax rate was 25.4% in the thirdsecond quarter of 2017, the Company recorded an income tax benefit of $0.7 million compared to an income tax expense of $1.6million in the third quarter of 2016. In the first nine months of 2017, the Company recorded income tax expense of $5.3 million compared to $14.0 million2022 and 25.3% in the first ninesix months of 2016.2022 compared to 25.4% in the second quarter of 2021 and 24.9% in the first six months of 2021. The differences between our effective income tax benefit or expense recorded in all
periods primarily represents taxes atrates and the U.S. federal and local statutory rates where the Company operates, but generally exclude any tax benefit for losses in jurisdictions with historical losses. The third quarterrate of 2017 also includes the reversal of previous uncertain tax provisions21.0% were mainly due to state and foreign income taxes partially offset by the lapseeffects of certain discrete items recorded during the statute of limitations.periods.
Earnings per share. Basic and diluted earnings per share was $0.05$5.20 in the thirdsecond quarter of 20172022 and $0.46$9.45 in the first ninesix months of 20172022 compared to basic income per share of $2.94 in the second quarter of 2021 and diluted$3.61 in the first six months of 2021. Diluted earnings per share of $0.23was $5.10 in the thirdsecond quarter of 20162022 and $0.82$9.26 in the first ninesix months of 2016.2022 compared to diluted income per share of $2.91 in the second quarter of 2021 and $3.57 in the first six months of 2021. The changes in earnings per share are due to the results of operations discussed above as well as an increase in the weighted average number of shares outstanding due to the issuance of 5 million shares of common stock in July 2016.above.
Liquidity
28
Liquidity and Cash Flows
Our primary sources of liquidity are cash and cash equivalents, cash flows from operations, and borrowing availability under the $750 million revolving credit facility (the “RyersonRyerson Credit Facility”) that matures on November 16, 2021. ItsFacility. Our principal source of operating cash is from the sale of metals and other materials. ItsOur principal uses of cash are for payments associated with the procurement and processing of metals and other materials inventories, costs incurred for the warehousing and delivery of inventories, and the selling and administrative costs of the business, and capital expenditures, and for interest payments on debt.expenditures.
The following table summarizes the Company’s cash flows:
|
| Nine Months Ended September 30, |
| |||||
|
| 2017 |
|
| 2016 |
| ||
|
| (In millions) |
| |||||
|
|
|
|
|
|
|
|
|
Net cash used in operating activities |
| $ | (93.3 | ) |
| $ | (22.9 | ) |
Net cash used in investing activities |
|
| (61.6 | ) |
|
| (16.3 | ) |
Net cash provided by financing activities |
|
| 144.0 |
|
|
| 47.0 |
|
Effect of exchange rates on cash and cash equivalents |
|
| 3.8 |
|
|
| 2.2 |
|
Net increase (decrease) in cash and cash equivalents |
| $ | (7.1 | ) |
| $ | 10.0 |
|
We had cash and cash equivalents of $73.6$41.4 million at SeptemberJune 30, 2017,2022, compared to $80.7$51.2 million at December 31, 2016. We had $36 million and $31 million of qualified cash pledged as collateral at September 30, 2017 and December 31, 2016, respectively. We had $1,042 million and $964 million of2021. Our total debt outstanding at SeptemberJune 30, 2017 and2022 decreased to $534 million compared to $639 million at December 31, 2016, respectively, and2021 due to income from operations in the first six months of 2022. We had a debt-to-capitalization ratio of 101%39% and 54% at SeptemberJune 30, 20172022 and 105% at December 31, 2016.2021, respectively. We had total liquidity (defined as cash and cash equivalents marketable securities and availability under the Ryerson Credit Facility and foreign debt facilities, less qualified cash pledged as collateral)facilities) of $355$894 million at SeptemberJune 30, 20172022 versus $301$741 million at December 31, 2016.2021. Our net debt (defined as total debt less cash and cash equivalents) was $492 million and $588 million at June 30, 2022 and December 31, 2021, respectively. Total liquidity isand net debt are not a U.S. generally accepted accounting principles (“GAAP”) financial measure.measures. We believe that total liquidity provides additional information for measuring our ability to fund our operations. Total liquidity does not represent, and should not be used as a substitute for, net income or cash flows from operations as determined in accordance with GAAP and total liquidity is not necessarily an indication of whether cash flow will be sufficient to fund our cash requirements. We believe that net debt provides a clearer perspective of the Company’s overall debt profile. Net debt should not be used as a substitute for total debt outstanding as determined in accordance with GAAP.
Below is a reconciliation of cash and cash equivalents to total liquidity:
|
| June 30, 2022 |
|
| December 31, 2021 |
| ||
|
| (In millions) |
| |||||
Cash and cash equivalents |
| $ | 41 |
|
| $ | 51 |
|
Availability under Ryerson Credit Facility and foreign debt facilities |
|
| 853 |
|
|
| 690 |
|
Total liquidity |
| $ | 894 |
|
| $ | 741 |
|
Below is a reconciliation of total debt to net debt:
|
| September 30, 2017 |
|
| December 31, 2016 |
| ||
|
| (In millions) |
| |||||
|
|
|
|
|
|
|
|
|
Cash and cash equivalents |
| $ | 74 |
|
| $ | 81 |
|
Less: Qualified cash pledged as collateral |
|
| (36 | ) |
|
| (31 | ) |
Availability under Ryerson Credit Facility and foreign debt facilities |
|
| 317 |
|
|
| 251 |
|
Total liquidity |
| $ | 355 |
|
| $ | 301 |
|
|
| June 30, 2022 |
|
| December 31, 2021 |
| ||
|
| (In millions) |
| |||||
Total debt |
| $ | 533.5 |
|
| $ | 639.3 |
|
Less: cash and cash equivalents |
|
| (41.4 | ) |
|
| (51.2 | ) |
Net debt |
| $ | 492.1 |
|
| $ | 588.1 |
|
Of the total cash and cash equivalents, as of SeptemberJune 30, 2017, $63.4 2022, $12.5 million was held in subsidiaries outside the United States which is deemed to be permanently reinvested. Ryerson does not currently foresee a need to repatriate earnings from its non-U.S. subsidiaries. Although Ryerson has historically satisfied needs for more capital in the U.S. through debt or equity issuances, Ryerson could elect to repatriate earnings held in foreign jurisdictions, which could result in higher effective tax rates. We have not recorded a deferred tax liability for the effect of a possible repatriation of these earnings as management intends to permanently reinvest these earnings outside of the U.S. Specific plans for reinvestment include funding for future international acquisitions and funding of existing international operations.
29
The following table summarizes the Company’s cash flows:
|
| Six Months Ended June 30, |
| |||||
|
| 2022 |
|
| 2021 |
| ||
|
| (In millions) |
| |||||
Net income |
| $ | 360.2 |
|
| $ | 138.9 |
|
Gain on sale of assets |
|
| (3.8 | ) |
|
| (107.7 | ) |
Loss on retirement of debt |
|
| 19.8 |
|
|
| — |
|
Non-cash (gain) loss from derivatives |
|
| (15.4 | ) |
|
| 40.4 |
|
Change in operating assets and liabilities: |
|
|
|
|
|
| ||
Receivables |
|
| (126.9 | ) |
|
| (275.9 | ) |
Inventories |
|
| (179.9 | ) |
|
| (109.1 | ) |
Accounts payable |
|
| 118.3 |
|
|
| 200.0 |
|
All other operating cash flows |
|
| (4.3 | ) |
|
| 62.3 |
|
Net cash provided by (used in) operating activities |
|
| 168.0 |
|
|
| (51.1 | ) |
Acquisitions, net of cash acquired |
|
| (5.8 | ) |
|
| — |
|
Capital expenditures |
|
| (42.8 | ) |
|
| (13.3 | ) |
Proceeds from sale of property, plant, and equipment |
|
| 7.2 |
|
|
| 165.9 |
|
All other investing cash flows |
|
| (2.0 | ) |
|
| (0.5 | ) |
Net cash provided by (used in) investing activities |
|
| (43.4 | ) |
|
| 152.1 |
|
Repayment of debt |
|
| (268.6 | ) |
|
| (0.9 | ) |
Net proceeds (repayments) of short-term borrowings |
|
| 142.8 |
|
|
| (139.6 | ) |
Net increase in book overdrafts |
|
| 57.0 |
|
|
| 21.6 |
|
Dividends paid to shareholders |
|
| (8.5 | ) |
|
| — |
|
Share repurchases |
|
| (48.2 | ) |
|
| — |
|
All other financing cash flows |
|
| (10.6 | ) |
|
| (5.1 | ) |
Net cash used in financing activities |
|
| (136.1 | ) |
|
| (124.0 | ) |
Effect of exchange rates on cash and cash equivalents |
|
| 1.7 |
|
|
| (0.3 | ) |
Net decrease in cash and cash equivalents |
| $ | (9.8 | ) |
| $ | (23.3 | ) |
Operating activities. NetWorking capital fluctuates throughout the year based on business needs. Working capital needs tend to be counter-cyclical, meaning that in periods of expansion the Company will use cash usedto fund working capital requirements, but in periods of contraction the Company will generate cash from reduced working capital requirements. In the first six months of 2021, working capital requirements increased as average selling prices increased due to supply constraints as mills were slow to come back online after COVID-19 shutdowns in 2020. Similarly in the first six months of 2022, average selling prices continued to increase due to supply constraints and briefly, due to the war between Russia and Ukraine. The first six months of 2022, however, resulted in cash generated from operations, as opposed to a use of cash in the same period of 2021, due to average selling prices being 43% higher, resulting in significantly higher operating profits offsetting a build in working capital.
Investing activities. The Company's main investing activities are capital expenditures and proceeds from the sale of $93.3property, plant, and equipment. Capital expenditures have increased year-over-year to $42.8 million for the first six months of 2022 compared to $13.3 million in the first ninesix months of 2017 was primarily due to an increase in inventory of $117.5 million2021 as the value of inventory andcapital expenditure budget for 2022 was increased to partially utilize the tons in inventory both increased as economic conditions in the metals market improved in the first nine months of 2017, an increase in accounts receivable of $91.5 million resultingproceeds from higher sales levels in the third quarter of 2017 compared to year-end 2016, and pension contributions of $16.5 million. Partially offsetting the cash outflows were an increase in accounts payable of $66.3 million resulting from a higher level of material purchases at the endtwo of the first nine months of 2017 compared2021 sale-leaseback transactions to year-end 2016, non-cash depreciationmodernize operations and amortization expense of $34.1 million and an increaseto invest in accrued liabilities of $22.6 million. Net cash usedtwo new facilities in operating activities of $22.9 million in the first nine months of 2016 was primarily due to an increase in inventory of $67.3 million, an increase in accounts receivable of $54.9 million resulting from higher sales levels in the first nine months of 2016 compared to year-end 2015 and pension contributions of $21.0 million. Offsetting the cash outflows was an increase in accounts payable of $38.2 million due to a higher level of material purchases at the end of the third quarter of 2016 compared to year-end 2015, non-cash depreciation and amortization expense of $31.8 million, net income of $27.3 million and an increase in accrued liabilities of $17.9 million.
Investing activities. During the first nine months of 2017 we paid $49.2 million, net of cash acquired, to acquire all of the issued and outstanding capital stock of The Laserflex Corporation and Guy Metals, Inc. Capital expenditures during the first nine months of 2017 totaled $15.8 million compared to $19.7 million in the first nine months of 2016. 2022. The Company sold property, plant, and equipment and assets held for sale generating cash proceeds of $3.7$7.2 million and $3.2$165.9 million during the first ninesix months of 20172022 and 2016,2021, respectively.
Financing activities. Net cash provided by financing activities in the first ninemonths of 2017 was $144.0 million compared to $47.0 The Company paid $5.8 million in the first ninesix months of 2016. Net2022 to acquire Apogee Steel Fabrication Incorporated and Ford Tool Steels, Inc. See Note 7: Acquisitions within Part I, Item I of this report, for further discussion of the acquisitions.
Financing activities. The Company's main source of liquidity to fund working capital requirements is borrowings on the Ryerson Credit Facility. In the first six months of 2022, we repurchased and retired $250.0 million principal of our 2028 Notes, which was partially offset by an increase of $152.5 million in Credit Facility borrowings. Book overdrafts fluctuate based on the timing of payments. In the first six months of 2022, we repurchased $48.2 million of our common stock. The Company started paying quarterly cash provided by financing activitiesdividends in the third quarter of 2021 and $8.5 million was paid to shareholders in the first ninesix months of 2017 was primarily related2022.
As market conditions warrant and subject to an increaseour contractual restrictions, liquidity position, and other factors, we may from time to time seek to refinance, repurchase, or retire any outstanding debt through cash purchases and/or exchanges for other debt or equity securities in credit facility borrowings of $73.4 million, an increaseopen market transactions, privately negotiated transactions, by tender offer, or otherwise. Any such cash repurchases by us may be funded by cash on hand or by incurring additional debt. The amounts involved in book overdrafts of $60.3 million and proceeds of $22.4 million from sale leaseback transactions. Net cash used in financing activitiesany such transactions, individually or in the first nine months of 2016 was related to the issuance of the 2022 Notes withaggregate, may be material. Furthermore, any such repurchases or exchanges may result in our acquiring and retiring a principalsubstantial amount of $650.0such indebtedness, which would impact the trading liquidity of such indebtedness.
30
Off-Balance Sheet Arrangements. In the normal course of business with customers, vendors, and others, we have entered into off-balance sheet arrangements, such as letters of credit, which totaled $18 million net proceedsas of $71.5 million from the issuanceJune 30, 2022. We do not have any other material off-balance sheet financing arrangements. Our off-balance sheet arrangements are not likely to have a material effect on our current or future financial condition, results of common stock and an increase in book overdrafts of $20.1 million, offset by the early redemption of $569.9 million principal amount of the 2017 Notes and $121.9 million principal amount of the 2018 Notes. operations, liquidity, or capital resources.
Capital Resources
We believe that cash flow from operations and proceeds from the Ryerson Credit Facility will provide sufficient funds to meet our contractual obligations and operating requirements in the normal course of business.
As a result of the acquisitions and net cash used in operating activities in the first nine months of 2017, totalTotal debt in the Condensed Consolidated Balance Sheets in the first nine months of 2017 increasedSheet decreased to $1,041.6 $533.5 million at SeptemberJune 30, 20172022 from $963.5 $639.3 million at December 31, 2016.2021, mainly due to cash generated from operating activities in the first six months of 2022.
Total debt outstanding as of SeptemberJune 30, 20172022 consisted of the following amounts: $385.1$468.5 million borrowingborrowings under the Ryerson Credit Facility, $650.0$50.0 million under the 20222028 Notes, $19.5$17.3 million of foreign debt, and $1.7$5.2 million of other debt, less $14.7$7.5 million of unamortized debt issuance costs. Discussion of each of these borrowings follows.
Ryerson Credit Facility
On November 16, 2016, Ryerson entered into an amendment with respectFor further information, see Note 8: Long Term Debt in Part I, Item I - Notes to its $1.0 billion revolving credit facility (as amended, the “Ryerson Credit Facility”), to reduce the total facility size from $1.0 billion (the “Old Credit Facility”) to $750 million, reduce the interest rate on outstanding borrowings by 25 basis points, reduce commitment fees on amounts not borrowed by 2.5 basis points, and to extend the maturity date to November 16, 2021.
At September 30, 2017, Ryerson had $385.1 million of outstanding borrowings, $15 million of letters of credit issued and $291 million available under the Ryerson Credit Facility compared to $312.0 million of outstanding borrowings, $16 million of letters of credit issued and $225 million available at December 31, 2016. Total credit availability is limited by the amount of eligible accounts receivable, inventory, and qualified cash pledged as collateral under the agreement insofar as Ryerson is subject to a borrowing base comprised of the aggregate of these three amounts, less applicable reserves. Eligible accounts receivable, at any date of determination, is comprised of the aggregate value of all accounts directly created by a borrower (and in the case of Canadian accounts, a Canadian guarantor) in the ordinary course of business arising out of the sale of goods or the rendering of services, each of which has been invoiced, with such receivables adjusted to exclude various ineligible accounts, including, among other things, those to which a borrower (or guarantor, as applicable) does not have sole and absolute title and accounts arising out of a sale to an employee, officer, director, or affiliate of a borrower (or guarantor, as applicable). Eligible inventory, at any date of determination, is comprised of the net orderly liquidation value of all inventory owned by a borrower (and in the case of Canadian accounts, a Canadian guarantor). Qualified cash consists of cash in an eligible deposit account that is subject to customary restrictions and liens in favor of the lenders.
The Ryerson Credit Facility has an allocation of $660 million to the Company’s subsidiaries in the United States and an allocation of $90 million to Ryerson Holding’s Canadian subsidiary that is a borrower. Amounts outstanding under the Ryerson Credit Facility bear interest at (i) a rate determined by reference to (A) the base rate (the highest of the Federal Funds Rate plus 0.50%, Bank of America, N.A.’s prime rate and the one-month LIBOR rate plus 1.00%) or (B) a LIBOR rate or, (ii) for Ryerson Holding’s Canadian subsidiary that is a borrower, (A) a rate determined by reference to the Canadian base rate (the greatest of the Federal Funds Rate plus 0.50%, Bank of America-Canada Branch’s “base rate” for commercial loans in U.S. Dollars made at its “base rate” and the 30 day LIBOR rate plus 1.00%), (B) the prime rate (the greater of Bank of America-Canada Branch’s “prime rate” for commercial loans made by it in Canada in Canadian Dollars and the one-month Canadian bankers’ acceptance rate plus 1.00%) or (C) the bankers’ acceptance rate. The spread over the base rate and prime rate is between 0.25% and 0.50% and the spread over the LIBOR and for the bankers’ acceptances is between 1.25% and 1.50%, depending on the amount available to be borrowed under the Ryerson Credit Facility. Overdue amounts and all amounts owed during the existence of a default bear interest at 2% above the rate otherwise applicable thereto. Ryerson also pays commitment fees on amounts not borrowed at a rate of 0.23%.
We attempt to minimize interest rate risk exposure through the utilization of interest rate swaps, which are derivative financial instruments. During March 2017, we entered into an interest rate swap to fix interest on $150 million of our floating rate debt under the Ryerson Credit Facility at a rate of 1.658% through March 2020. The swap has reset dates and critical terms that match our existing debt and the anticipated critical terms of future debt. The weighted average interest rate on the outstanding borrowings under the Ryerson Credit Facility including the interest rate swap was 2.7 percent and 2.2 percent at September 30, 2017 and December 31, 2016, respectively.
Borrowings under the Ryerson Credit Facility are secured by first-priority liens on all of the inventory, accounts receivables, lockbox accounts and related assets of the borrowers and the guarantors.
The Ryerson Credit Facility also contains covenants that, among other things, restrict Ryerson Holding and its restricted subsidiaries with respect to the incurrence of debt, the creation of liens, transactions with affiliates, mergers and consolidations, sales of assets and acquisitions. The Ryerson Credit Facility also requires that, if availability under the Ryerson Credit Facility declines to a certain level, Ryerson maintain a minimum fixed charge coverage ratio as of the end of each fiscal quarter, and includes defaults upon (among other things) the occurrence of a change of control of Ryerson and a cross-default to other financing arrangements.
The Ryerson Credit Facility contains events of default with respect to, among other things, default in the payment of principal when due or the payment of interest, fees and other amounts due thereunder after a specified grace period, material misrepresentations, failure to perform certain specified covenants, certain bankruptcy events, the invalidity of certain security agreements or guarantees, material judgments and the occurrence of a change of control of Ryerson. If such an event of default occurs, the lenders under the Ryerson Credit Facility will be entitled to various remedies, including acceleration of amounts outstanding under the Ryerson Credit Facility and all other actions permitted to be taken by secured creditors.
The lenders under the Ryerson Credit Facility may reject a borrowing request if any event, circumstance or development has occurred that has had or could reasonably be expected to have a material adverse effect on the Company. If Ryerson Holding, JT Ryerson, any of the other borrowers or any restricted subsidiaries of JT Ryerson becomes insolvent or commences bankruptcy proceedings, all amounts borrowed under the Ryerson Credit Facility will become immediately due and payable.
Net proceeds of short-term borrowings that are reflected in the Consolidated Statements of Cash Flows represent borrowings under the Ryerson Credit Facility with original maturities less than three months.
2022 Notes
On May 24, 2016, JT Ryerson issued $650 million in aggregate principal amount of the 2022 Notes (the “2022 Notes”). The 2022 Notes bear interest at a rate of 11.00% per annum. The 2022 Notes are fully and unconditionally guaranteed on a senior secured
basis by all of our existing and future domestic subsidiaries that are co-borrowers or that have guarantee obligations under the Ryerson Credit Facility.
The 2022 Notes and the related guarantees are secured by a first-priority security interest in substantially all of JT Ryerson’s and each guarantor’s present and future assets located in the United States (other than receivables, inventory, cash, deposit accounts and related general intangibles, certain other assets and proceeds thereof), subject to certain exceptions and customary permitted liens. The 2022 Notes and the related guarantees are also secured on a second-priority basis by a lien on the assets that secure JT Ryerson’s and the Company’s obligations under the Ryerson Credit Facility.
The 2022 Notes will be redeemable, in whole or in part, at any time on or after May 15, 2019 at certain redemption prices. The redemption price for the 2022 Notes if redeemed during the twelve months beginning (i) May 15, 2019 is 105.50%, (ii) May 15, 2020 is 102.75%, and (iii) May 15, 2021 and thereafter is 100.00%. JT Ryerson may redeem some or all of the 2022 Notes before May 15, 2019 at a redemption price of 100.00% of the principal amount, plus accrued and unpaid interest, if any, to the redemption date, plus a “make-whole” premium. In addition, JT Ryerson may redeem up to 35% of the 2022 Notes before May 15, 2019 with respect to the 2022 Notes with the net cash proceeds from certain equity offerings at a price equal to 111.00%, with respect to the 2022 Notes, of the principal amount thereof, plus any accrued and unpaid interest, if any. JT Ryerson may be required to make an offer to purchase the 2022 Notes upon the sale of assets or upon a change of control.
The 2022 Notes contain customary covenants that, among other things, limit, subject to certain exceptions, our ability, and the ability of our restricted subsidiaries, to incur additional indebtedness, pay dividends on our capital stock or repurchase our capital stock, make investments, sell assets, engage in acquisitions, mergers or consolidations or create liens or use assets as security in other transactions. Subject to certain exceptions, JT Ryerson may only pay dividends to Ryerson Holding to the extent of 50% of future net income, once prior losses are offset.
The net proceeds from the issuance of the 2022 Notes, along with borrowings under the Ryerson Credit Facility, were used to (i) repurchase and/or redeem in full the $569.9 million balance of JT Ryerson’s 9% Senior Secured Notes due 2017 (the “2017 Notes”), plus accrued and unpaid interest thereon up to, but not including, the repayment date, (ii) repurchase $95 million of the 11.25% Senior Secured Notes due 2018 (the “2018 Notes”), and (iii) pay related fees, expenses and premiums.
The Company applied the provisions of ASC 470-50, “Modifications and Extinguishments” in accounting for the issuance of the 2022 Notes, redemption of the 2017 Notes and partial repurchase of the 2018 Notes. The evaluation of the accounting under ASC 470-50 was performed on a creditor by creditor basis in order to determine if the terms of the debt were substantially different and, as a result, whether to apply modification or extinguishment accounting. For the lenders where it was determined that the terms of the debt were not substantially different, modification accounting was applied. For the remaining lenders, extinguishment accounting was applied. In connection with this debt modification and extinguishment, the Company recorded a $16.0 million loss within other income and (expense), net on the Condensed Consolidated Statement of Comprehensive Income during 2016, primarily attributed to the costs incurred with third parties for arrangement fees, legal and other services related to the modified debt, as well as redemption fees paid to the creditors and unamortized debt issuance costs written off related to the extinguished debt. Additionally, the costs incurred with third parties for arrangement fees, legal and other services related to the extinguished debt and redemption fees paid to the creditors related to the modified debt were capitalized and are being amortized over the life of the modified debt using the effective interest method.Financial Statements.
During the first nine months of 2016, a principal amount of $27.0 million of the 2018 Notes were repurchased for $18.2 million and retired, resulting in the recognition of an $8.8 million gain within other income and (expense), net on the Condensed Consolidated Statement of Comprehensive Income. Including the $16.0 million loss on the redemption of the $569.9 million balance of the 2017 Notes and repurchase of $95.0 million of the 2018 Notes, the Company recognized a total net loss of $7.2 million within other income and (expense), net on the Condensed Consolidated Statement of Comprehensive Income during the first nine months of 2016.Pension Funding
Foreign Debt
At September 30, 2017, Ryerson China’s foreign borrowings were $19.5 million, which were owed to banks in Asia at a weighted average interest rate of 3.9% per annum and secured by inventory and property, plant and equipment. At December 31, 2016, Ryerson China’s foreign borrowings were $19.2 million, which were owed to banks in Asia at a weighted average interest rate of 4.4% per annum and secured by inventory and property, plant and equipment.
Availability under the foreign credit lines was $26 million at September 30, 2017 and December 31, 2016. Letters of credit issued by our foreign subsidiaries were $6 million at September 30, 2017 and December 31, 2016.
At December 31, 2016,2021, pension liabilities exceeded plan assets by $216$95.8 million. WeThrough the six months ended June 30, 2022, we have made $4.6 million in pension contributions and we anticipate that we will have a totalan additional minimum required pension contribution of approximately $21$2.0 million in 2017the remaining six months of 2022 under the Employee Retirement Income Security Act of 1974 (“ERISA”) and Pension Protection Act in the U.SU.S. and the Ontario Pension Benefits Act in Canada. ThroughThe expected future contributions reflect recent pension funding relief measures under the nine months ended September 30, 2017, we have made $16 millionAmerican Rescue Plan Act (“ARPA”) passed in pension contributions, and anticipate an additional $5 million of contributions in the remaining three months of 2017.March 2021. Future contribution requirements depend on the investment returns on plan assets, the impact of discount rates on pension liabilities, and changes in regulatory requirements. We are unable to determine the amount or timing of any such contributions required by ERISA or whether any such contributions would have a material adverse effect on our financial position or cash flows. We
Changes in returns on plan assets may affect our plan funding, cash flows, and financial condition. Differences between actual plan asset returns and the expected long-term rate of return on plan assets impact the measurement of the following year’s pension expense and pension funding requirements. However, we believe that cash flow from operations and the Ryerson Credit Facility described above will provide sufficient funds to make the minimum required contributioncontributions.
Material Cash Requirements
The Company expects to make approximately $541.0 million in 2017.principal payments to satisfy its debt obligations, consisting of $50.0 million of the 2028 Notes which were redeemed on July 23, 2022, $17.3 million of foreign debt coming due within a year, $5.2 million of other debt coming due through 2025, and $468.5 million for the Ryerson Credit Facility coming due in 2027. Please refer to Part I, Item I - Notes to the Condensed Consolidated Financial Statements, Note 8: Long Term Debt for further information, and Note 18: Subsequent Events.
Off-Balance Sheet ArrangementsThe Company expects to pay approximately $25 million of interest on the 2028 Notes, Ryerson Credit Facility, foreign debt, and other debt over the next 12 months and $102 million thereafter. Interest payments related to the variable rate debt were estimated using the weighted average interest rate for the respective debt instrument, including the effect of the interest rate swaps.
InThe Company leases various assets including real estate, trucks, trailers, mobile equipment, processing equipment, and IT equipment. We have noncancelable operating leases expiring at various times through 2042, and finance leases expiring at various times through 2028. The total amount of future lease payments is estimated to be $257 million, with $36 million over the normal coursenext 12 months. Including leases signed but not yet commenced as of businessJune 30, 2022, total future lease payments is estimated to be $449 million.
Purchase obligations with customers, vendors and others, we havesuppliers are entered into off-balance sheet arrangements, such as letterswhen we receive firm sales commitments with certain of credit, which totaled $21our customers. As of June 30, 2022, we had outstanding purchase obligations of approximately $31.4 million as of September 30, 2017. Additionally, other than normal course long-term operating leases included in the following Contractual Obligations table, we do not have any material off-balance sheet financing arrangements. None of these off-balance sheet arrangements are likely to haveexpiring within a material effect on our current or future financial condition, results of operations, liquidity or capital resources.year.
Contractual Obligations
The following table presents contractual obligations at September 30, 2017:
|
| Payments Due by Period |
| |||||||||||||||||
Contractual Obligations (1) |
| Total |
|
| Less than 1 year |
|
| 1 – 3 years |
|
| 4 – 5 years |
|
| After 5 years |
| |||||
|
| (In millions) |
| |||||||||||||||||
|
|
|
|
|
|
|
|
|
|
|
|
|
|
|
|
|
|
|
|
|
2022 Notes |
|
| 650 |
|
|
| — |
|
|
| — |
|
|
| 650 |
|
|
| — |
|
Ryerson Credit Facility |
|
| 385 |
|
|
| — |
|
|
| — |
|
|
| 385 |
|
|
| — |
|
Foreign Debt |
|
| 20 |
|
|
| 20 |
|
|
| — |
|
|
| — |
|
|
| — |
|
Other Debt |
|
| 1 |
|
|
| 1 |
|
|
| — |
|
|
| — |
|
|
| — |
|
Interest on 2022 Notes, Foreign Debt, Other Debt and Ryerson Credit Facility (2) |
|
| 391 |
|
|
| 82 |
|
|
| 164 |
|
|
| 145 |
|
|
| — |
|
Purchase Obligations (3) |
|
| 27 |
|
|
| 27 |
|
|
| — |
|
|
| — |
|
|
| — |
|
Operating Leases |
|
| 83 |
|
|
| 21 |
|
|
| 30 |
|
|
| 19 |
|
|
| 13 |
|
Pension Withdrawal Liability |
|
| 1 |
|
|
| — |
|
|
| — |
|
|
| — |
|
|
| 1 |
|
Capital Lease Obligations |
|
| 31 |
|
|
| 10 |
|
|
| 15 |
|
|
| 6 |
|
|
| — |
|
Total |
| $ | 1,589 |
|
| $ | 161 |
|
| $ | 209 |
|
| $ | 1,205 |
|
| $ | 14 |
|
|
|
|
|
|
|
We maintain a valuation allowance on certain foreign and U.S. federal and state deferred tax assets until such time as in management’s judgment, considering all available positive and negative evidence, and consistent with its past determinations, we determine that these deferred tax assets are more likely than not realizable.
We anticipate that certain statutes of limitation will close within the next twelve months resulting in the reduction of the reserve for uncertain tax benefits related to various intercompany transactions, with a corresponding income tax benefit of approximately $1.1 million.
31
Recent legislative proposals in the U.S. would repeal the use of the last-in-first-out method of accounting (“LIFO method”) for inventory for U.S. tax purposes. If legislation repealing the use of the LIFO method for tax purposes becomes law, we would expect an increase in the cash taxes we will need to pay over a 10-year period.
Item 3. Quantitative and Qualitative Disclosures About Market Risk
Our primary areas of market risk include changes in interest rates, foreign currency exchange rates, and commodity prices.We continually monitor these risks and develop strategies to manage them.
Interest rate risk
We are exposed to market risk related to our fixed-rate and variable-rate long-term debt. Market risk is the potential loss arising from adverse changes in market rates and prices, such as interest rates. We are exposed to market risk related to our fixed-rate and variable-rate long-term debt. Changes in interest rates may affect the market value of our fixed-rate debt. The estimated fair value of our long-term debt and the current portions thereof using quoted market prices ourof Company debt securities recently traded and market-based prices of similar securities for those securities not recently traded was $1,121$535.0 million at SeptemberJune 30, 20172022 and $1,034$666.8 million at December 31, 20162021 as compared with the carrying value of $1,042$533.5 million and $964$639.3 million at SeptemberJune 30, 20172022 and December 31, 2016,2021, respectively. We manage interest rate risk in our capital structure by holding a combination of variable and fixed-rate debt.
AWe use interest rate swaps to manage our exposure to interest rate changes. As of June 30, 2022, we have one receive variable, pay fixed, interest rate swap to manage the exposure to variable interest rates of the Ryerson Credit Facility. In November 2019, we entered into a forward agreement for $100 million of “pay fixed” interest at 1.539% through November 2022.
Effective November 1, 2020, the Company de-designated its interest rate swaps as cash flow hedges and terminated its hedge accounting treatment. Prior to de-designation, the Company would mark these interest rate swaps to market with all changes in fair value recorded in accumulated other comprehensive income. Subsequent to de-designation, changes in fair value are recorded in current earnings. The fair value of the interest rate swap as of June 30, 2022 was a net asset of $0.3 million. The Company recognized a gain of $1.7 million related to mark-to-market changes and interest expense of $0.9 million in current earnings for the six months ended June 30, 2022. After de-designation, the amounts reclassified from other comprehensive income relate to prior gains and losses that are being amortized into income as the forecasted interest payments affect earnings. The amount reclassified from other comprehensive income for the six months ended June 30, 2022 into earnings was a loss of $1.4 million.
After considering the effects of our interest rate swaps, approximately 20% of our debt was at fixed interest rates as of June 30, 2022. Considering the impact of interest rate swaps, a hypothetical 1% increase in interest rates on variable rate debt would have increased interest expense for the first ninesix months of 20172022 by approximately $1.9$1.8 million.
Foreign exchange rate risk
We are subject to exposure from fluctuationsforeign currency risks primarily through our operations in foreign currencies. WeCanada, Mexico, and China and we use foreign currency exchange contracts to hedgereduce our Canadian subsidiaries’ variability in cash flows from the forecasted payment of currencies other than the functional currency. The Canadian subsidiaries’ foreignexposure to currency price fluctuations. Foreign currency contracts wereare principally used to purchase U.S. dollars. We had foreign currency contracts with a U.S. dollar notional amount of $2.1$3.0 million outstanding at SeptemberJune 30, 20172022 and a liability value of $0.1 million.zero. We do not currently account for these contracts as hedges but rather mark these contracts to market with a corresponding offset to current earnings. For the ninesix months ended SeptemberJune 30, 2017,2022, the Company recognized azero gain or loss of $0.1 million associated with its foreign currency contracts. A hypothetical strengthening or weakening of 10% in the foreign exchange rates underlying the foreign currency contracts from the market rate as of SeptemberJune 30, 20172022 would increase or decrease the fair value of the foreign currency contracts by $0.2$0.3 million.
The currency effects of translating the financial statements of our foreign subsidiaries are included in accumulated other comprehensive loss and will not be recognized in the statementCondensed Consolidated Statements of operationsComprehensive Income until there is a liquidation or sale of those foreign subsidiaries.
Commodity price risk
In general, we purchase metals in an effort to maintain our inventory at levels that we believe to be appropriate to satisfy the anticipated needs of our customers based upon historic buying practices, customer contracts, and market conditions. Our commitments to purchase metals are generally at prevailing market prices in effect at the time we place our orders.
Metal prices can fluctuate significantly due to several factors including changes in foreign and domestic production capacity, raw material availability, metals consumption, and foreign currency rates. Declining metal prices could reduce our revenues, gross profit and net income. From timeDerivative financial instruments are used to time, we may enter into fixed price sales contracts with our customers for certainmanage a limited portion of our inventory components. We may enter into metal commodity futures and options contractsexposure to reduce volatilityfluctuations in the pricecost of these metals.certain commodities. No derivatives are held for trading purposes.
As of SeptemberJune 30, 2017,2022, we had 517 tons of nickel swap contracts and 8,503123,158 tons of hot roll coil swapsswap contracts with a net assetliability value of $0.1$3.0 million, and $0.5 million, respectively. As of September 30, 2017, we had 3,4029,354 tons of zinc swap contracts and 15,717 tons of aluminum swap contracts with a net liability value of $0.7$5.9 million, 550 tons of nickel swap contracts with a net asset value of $1.3 million, and zero, respectively.490,000 gallons of diesel fuel contracts with a net asset value of $0.8 million. We do not currently account for these swaps as hedges, but rather mark these contracts to market with a corresponding offset to current earnings. For the ninesix months ended SeptemberJune 30, 2017, we2022, the Company recognized a gain of $2.6 million associated with our metalits commodity derivatives.
32
A hypothetical strengthening or weakening of 10% in the commodity prices underlying the commodity derivative contracts from the market rate as of SeptemberJune 30, 20172022 would decreaseincrease or increasedecrease the fair value of commodity derivative contracts by $0.8 million.$2.1 million.
Item 4. Controls and Procedures
Evaluation of Disclosure Controls and Procedures
We maintain disclosure controls and procedures that are designed to ensure that information required to be disclosed in our reports filed or submitted under the Securities Exchange Act of 1934, as amended, is recorded, processed, summarized, and reported within the time periods specified in the SEC’s rules and forms and that such information is accumulated and communicated to our management, including our Chief Executive Officer and Chief Financial Officer, as appropriate, to allow for timely decisions regarding required disclosure. In designing and evaluating the disclosure controls and procedures, management recognizes that any controls and procedures, no matter how well designed and operated, can provide only reasonable assurance of achieving the desired
control objectives, and management is required to apply its judgment in evaluating the cost-benefit relationship of possible controls and procedures.
As required by SEC Rule 15d-15(b), we carried out an evaluation, under the supervision and with the participation of our management, including the Chief Executive Officer and Chief Financial Officer, of the effectiveness of the design and operation of our disclosure controls and procedures as of the end of the period covered by this report. Based on the evaluation, our Chief Executive Officer and Chief Financial Officer concluded that our disclosure controls and procedures were effective as of SeptemberJune 30, 2017.2022.
Changes in Internal Controls Over Financial Reporting
There have been no changes in the Company’s internal controls over financial reporting that have materially affected or are reasonably likely to materially affect the Company’s controls over financial reporting during the quarter ended SeptemberJune 30, 2017.2022.
33
PART II. OTHER INFORMATION
In October 2011,Item 1. Legal Proceedings
For information concerning legal proceedings as of June 30, 2022, please refer to Note 10: Commitments and Contingencies in the United States Environmental Protection Agency (the “EPA”) named us as one of more than 100 businesses that may be a potentially responsible party fornotes to the Portland Harbor Superfund Site (“Portland Harbor”). On January 6, 2017, the EPA issued its Record of Decision (“ROD”) regarding the site. The ROD includes a combination of dredging, capping and enhanced natural recovery that would take approximately thirteen years to construct plus additional time for monitored natural recovery, at an estimated present value cost of $1.05 billion. The EPA has not yet allocated responsibility for the contamination among the potentially responsible parties, including JT Ryerson. We do not currently have sufficient information available to us to determine whether the ROD will be executed as currently stated, whether and to what extent JT Ryerson may be held responsible for any of the identified contamination, and how much (if any) of the final plan’s costs might ultimately be allocated to JT Ryerson and therefore, management cannot predict the ultimate outcomeunaudited condensed consolidated financial statements included in Part I, Item 1 of this matter or estimate a range of potential loss atReport on Form 10-Q, which is incorporated into this time.item by reference.
There are various other claims and pending actions against the Company. The amount of liability, if any, for those other claims and actions at September 30, 2017 is not determinable but, in the opinion of management, such liability, if any, will not have a material adverse effect on the Company’s financial position, results of operations or cash flows. We maintain liability insurance coverage to assist in protecting our assets from losses arising from or related to activities associated with business operations.
Item 1A. Risk Factors
Except for the risk factor below, there have been no material changes relating to this Item from those set forth in Item 1A on the Company’s Annual Report on Form 10-K for the year ended December 31, 2016.2021.
The right to receive payment onOur stock price has fluctuated in the 2022 Notespast, has recently been volatile, and may be volatile in the guarantees willfuture, and as a result, investors in our common stock could incur substantial losses.
Our stock price has fluctuated in the past, has recently been volatile, and may be subordinated tovolatile in the liabilities of non-guarantor subsidiaries.
The notesfuture. We may incur rapid and related guarantees are structurally subordinated to all indebtedness ofsubstantial decreases in our subsidiariesstock price in the foreseeable future that are not guarantorsunrelated to our operating performance or prospects.
As a result of this volatility, investors may experience losses on their investment in our common stock. The market price for our common stock may be influenced by many factors, including the 2022 Senior Secured Notes (the “2022 Notes”). While following:
Since the stock price of our common stock has fluctuated in the past, has been recently volatile, and may be volatile in the future, investors in our common stock could incur substantial losses. In the past, following periods of volatility in the market, securities class-action litigation has often been instituted against companies. Such litigation, if instituted against us, could result in substantial costs and diversion of management's attention and resources, which could materially and adversely affect our business, financial condition, results of operations and growth prospects. There can be no guarantee that our stock price will remain at current levels or that future sales of our common stock will not guaranteebe at prices lower than those sold to investors.
34
Item 2. Unregistered Sales of Equity Securities and Use of Proceeds
(c) Issuer Purchases of Equity Securities
We repurchase shares of our common stock from time to time pursuant to our publicly announced share repurchase program. All of our share repurchases during the second quarter of 2022 Notes notwithstanding any such pledge or encumbrancewere made in favora privately negotiated transaction with affiliates of Platinum Equity, LLC. We purchased the following equity securities registered by us pursuant to Section 12 of the 2022 Notes.Exchange Act.
The non-guarantor subsidiaries represented, respectively, 11.8% and 5.2%
Period |
| Total Number of Shares Purchased |
|
| Average Price Paid per Share |
|
| Total Number of Shares Purchased as Part of Publicly Announced Program |
|
| Maximum Dollar Value of Shares that May Yet be Purchased under the Program (1) |
| ||||
|
| (In millions, except shares and per share data) |
| |||||||||||||
April 1, 2022 - April 30, 2022 |
|
| — |
|
| $ | — |
|
|
| — |
|
| $ | 47.7 |
|
May 1, 2022 - May 31, 2022 |
|
| 1,613,022 |
|
|
| 29.56 |
|
|
| 1,613,022 |
|
|
| — |
|
June 1, 2022 - June 30, 2022 |
|
| — |
|
|
| — |
|
|
| — |
|
|
| — |
|
|
|
| 1,613,022 |
|
|
|
|
|
| 1,613,022 |
|
|
|
| ||
(1) On August 4, 2021, the Board of our net sales and EBITDA forDirectors authorized a stock repurchase program that permitted the nine months ended September 30, 2017. In addition, these non-guarantor subsidiaries represented respectively, 14.7% and 9.1%purchase of our assets and liabilities, as of September 30, 2017.
Accordingly, in the event that anyup to $50 million of the non-guarantor subsidiaries or joint venture entities become insolvent, liquidates or otherwise reorganizes:
Company’s outstanding shares of common stock. This program was exhausted during the creditorssecond quarter of 2022. On August 3, 2022, the Board of Directors authorized a new $75 million share repurchase program after the exhaustion of the guarantors (includingprevious share repurchase program. We repurchase shares through open market purchases, privately negotiated transactions, and transactions structured through investment banking institutions under plans relying on Rule 10b5-1 or Rule 10b-18 promulgated under the holdersSecurities Exchange Act of 1934, as amended. Repurchased shares are reverted to the 2022 Notes) will have no right to proceed against such subsidiary’s assets; and
the creditorsstatus of such non-guarantor subsidiary, including trade creditors, will generally be entitled to payment in full from the sale or other disposal of assets of such subsidiary, as direct or indirect shareholder, and will be entitled to receive any distributions from such subsidiary.Treasury Stock.
Items 2, 3, 4, and 5 are not applicableapplicable and have been omitted.
Exhibit
|
| Incorporated by Reference | Filed | ||||||||
| Exhibit Description | Form | File No. | Filing Date | Herewith | ||||||
10.1 | 8K | 001-34735 | June 29, 2022 | ||||||||
31.1 | X | ||||||||||
|
| ||||||||||
31.2 | X | ||||||||||
|
| ||||||||||
32.1* | X | ||||||||||
|
| ||||||||||
32.2* | X | ||||||||||
|
| ||||||||||
101.INS | Inline XBRL Instance Document – the instance document does not appear in the Interactive Data File because its XBRL tags are embedded within the Inline XBRL document. | X | |||||||||
|
| ||||||||||
101.SCH | Inline XBRL Taxonomy Extension Schema | X | |||||||||
|
| ||||||||||
| Inline XBRL Taxonomy Extension Calculation Linkbase Document. | X | |||||||||
101.DEF | Inline XBRL Taxonomy Extension Definition Linkbase | X | |||||||||
|
| ||||||||||
| Inline XBRL Taxonomy | X | |||||||||
|
| ||||||||||
| Inline XBRL Taxonomy | X | |||||||||
|
| ||||||||||
| Cover Page Interactive Data File (embedded within the Inline XBRL | ||||||||||
*In accordance with SEC Release 33-8238, Exhibits 32.1 and 32.2 are being furnished herewith and not filed.
36
SIGNATURE
Pursuant to the requirements of the Securities Exchange Act of 1934, the Company has duly caused this report to be signed on its behalf by the undersigned thereunto duly authorized.
RYERSON HOLDING CORPORATION | ||||
|
| |||
| By: | /s/ | ||
|
| James J. Claussen | ||
Executive Vice President and Chief Financial Officer
| ||||
Date: November 7, 2017August 3, 2022
3437