UNITED STATES
SECURITIES AND EXCHANGE COMMISSION
Washington, D.C. 20549
FORM 10-Q
☒ | QUARTERLY REPORT PURSUANT TO SECTION 13 OR 15(d) OF THE SECURITIES EXCHANGE ACT OF 1934 |
For the quarterly period ended September 30, 2017March 31, 2021
or
☐ | TRANSITION REPORT PURSUANT TO SECTION 13 OR 15(d) OF THE SECURITIES EXCHANGE ACT OF 1934 |
For the transition period from to .
Commission File Number 001-34735
RYERSON HOLDING CORPORATION
(Exact name of registrant as specified in its charter)
| 26-1251524 | |
(State or other jurisdiction of incorporation or organization) | (I.R.S. Employer Identification No.) |
227 W. Monroe St., 27th Floor
Chicago, Illinois 60606
(Address of principal executive offices)
(312) 292-5000
(Registrant’s telephone number, including area code)
Securities registered pursuant to Section 12(b) of the Act:
Title of each class | Trading symbol(s) | Name of each exchange on which registered |
Common Stock, $0.01 par value, 100,000,000 shares authorized | RYI | New York Stock Exchange |
Indicate by check mark whether the registrant (1) has filed all reports required to be filed by Section 13 or 15(d) of the Securities Exchange Act of 1934 during the preceding 12 months (or for such shorter period that the registrant was required to file such reports), and (2) has been subject to such filing requirements for the past 90 days. Yes ☒ No ☐
Indicate by check mark whether the registrant has submitted electronically and posted on its corporate Web site, if any, every Interactive Data File required to be submitted and posted pursuant to Rule 405 of Regulation S-T (§232.405 of this chapter) during the preceding 12 months (or for such shorter period that the registrant was required to submit and post such files). Yes ☒ No ☐
Indicate by check mark whether the registrant is a large accelerated filer, an accelerated filer, a non-accelerated filer, or a smaller reporting company, or an emerging growth company. See definitionthe definitions of “large accelerated filer”, “accelerated filer”,filer,” “accelerated filer,” “smaller reporting company”company,” and “emerging growth company” in Rule 12b-2 of the Exchange Act.
Large accelerated filer | ☐ |
| Accelerated filer | ☒ |
| Emerging growth company | ☐ |
|
|
|
|
|
|
|
|
Non-accelerated filer | ☐ |
| Smaller reporting company | ☐ |
|
|
|
If an emerging growth company, indicate by check mark if the registrant has elected not to use the extended transition period for complying with any new or revised financial accounting standards provided pursuant to Section 13(a) of the Exchange Act.
Yes ☐ No ☐
Indicate by check mark whether the registrant is a shell company (as defined in Rule 12b-2 of the Exchange Act). Yes ☐ No ☒
APPLICABLE ONLY TO CORPORATE ISSUERS:
Indicate the number of shares outstanding of each of the issuer’s classes of common stock, as of the latest practicable date.
As of November 3, 2017,April 30, 2021, there were 37,208,58138,474,594 shares of Common Stock, par value $0.01 per share, outstanding.
RYERSON HOLDING CORPORATION AND SUBSIDIARY COMPANIES
INDEX
|
|
| PAGE NO. |
| |||
|
|
|
|
| Item 1. |
| |
|
|
|
|
|
| 3 | |
|
|
|
|
|
| 4 | |
|
|
|
|
|
| 5 | |
|
|
|
|
|
| Notes to Condensed Consolidated Financial Statements (Unaudited) | 6 |
|
|
|
|
| Item 2. | Management’s Discussion and Analysis of Financial Condition and Results of Operations |
|
|
|
|
|
| Item 3. |
| |
|
|
|
|
| Item 4. |
| |
|
|
| |
| |||
|
|
|
|
| Item 1. |
| |
|
|
|
|
| Item 1A. |
| |
|
|
|
|
| Item 2. |
| |
|
|
|
|
| Item 3. |
| |
|
|
|
|
| Item 4. |
| |
|
|
|
|
| Item 5. |
| |
|
|
|
|
| Item 6. |
| |
|
|
| |
| |||
PART I. FINANCIALFINANCIAL INFORMATION
RYERSON HOLDING CORPORATION AND SUBSIDIARY COMPANIES
Condensed Consolidated Statements of Comprehensive Income (Unaudited)
(In millions, except per share data)
|
| Three Months Ended |
|
| Nine Months Ended |
|
| Three Months Ended |
| |||||||||||||||
|
| September 30, |
|
| September 30, |
|
| March 31, |
| |||||||||||||||
|
| 2017 |
|
| 2016 |
|
| 2017 |
|
| 2016 |
|
| 2021 |
|
| 2020 |
| ||||||
Net sales |
| $ | 864.2 |
|
| $ | 735.1 |
|
| $ | 2,554.1 |
|
| $ | 2,177.5 |
|
| $ | 1,147.3 |
|
| $ | 1,010.3 |
|
Cost of materials sold |
|
| 719.2 |
|
|
| 589.7 |
|
|
| 2,108.1 |
|
|
| 1,721.5 |
|
|
| 949.4 |
|
|
| 814.5 |
|
Gross profit |
|
| 145.0 |
|
|
| 145.4 |
|
|
| 446.0 |
|
|
| 456.0 |
|
|
| 197.9 |
|
|
| 195.8 |
|
Warehousing, delivery, selling, general and administrative |
|
| 119.2 |
|
|
| 109.1 |
|
|
| 353.2 |
|
|
| 331.5 |
| ||||||||
Restructuring and other charges |
|
| — |
|
|
| 2.5 |
|
|
| — |
|
|
| 2.5 |
| ||||||||
Warehousing, delivery, selling, general, and administrative |
|
| 171.8 |
|
|
| 155.7 |
| ||||||||||||||||
Gain on sale of assets |
|
| (20.3 | ) |
|
| — |
| ||||||||||||||||
Operating profit |
|
| 25.8 |
|
|
| 33.8 |
|
|
| 92.8 |
|
|
| 122.0 |
|
|
| 46.4 |
|
|
| 40.1 |
|
Other income and (expense), net |
|
| (1.4 | ) |
|
| (0.2 | ) |
|
| (2.0 | ) |
|
| (13.2 | ) |
|
| 0.3 |
|
|
| 0.9 |
|
Interest and other expense on debt |
|
| (23.2 | ) |
|
| (23.6 | ) |
|
| (67.8 | ) |
|
| (67.5 | ) |
|
| (13.5 | ) |
|
| (21.7 | ) |
Income before income taxes |
|
| 1.2 |
|
|
| 10.0 |
|
|
| 23.0 |
|
|
| 41.3 |
|
|
| 33.2 |
|
|
| 19.3 |
|
Provision (benefit) for income taxes |
|
| (0.7 | ) |
|
| 1.6 |
|
|
| 5.3 |
|
|
| 14.0 |
| ||||||||
Provision for income taxes |
|
| 7.6 |
|
|
| 2.9 |
| ||||||||||||||||
Net income |
|
| 1.9 |
|
|
| 8.4 |
|
|
| 17.7 |
|
|
| 27.3 |
|
|
| 25.6 |
|
|
| 16.4 |
|
Less: Net income attributable to noncontrolling interest |
|
| 0.2 |
|
|
| 0.2 |
|
|
| 0.6 |
|
|
| — |
|
|
| 0.3 |
|
|
| — |
|
Net income attributable to Ryerson Holding Corporation |
| $ | 1.7 |
|
| $ | 8.2 |
|
| $ | 17.1 |
|
| $ | 27.3 |
|
| $ | 25.3 |
|
| $ | 16.4 |
|
Comprehensive income |
| $ | 7.8 |
|
| $ | 6.9 |
|
| $ | 33.4 |
|
| $ | 34.7 |
|
| $ | 28.0 |
|
| $ | 6.2 |
|
Less: Comprehensive income attributable to noncontrolling interest |
|
| 0.2 |
|
|
| 0.1 |
|
|
| 0.9 |
|
|
| — |
|
|
| 0.2 |
|
|
| — |
|
Comprehensive income attributable to Ryerson Holding Corporation |
| $ | 7.6 |
|
| $ | 6.8 |
|
| $ | 32.5 |
|
| $ | 34.7 |
|
| $ | 27.8 |
|
| $ | 6.2 |
|
Basic and diluted earnings per share |
| $ | 0.05 |
|
| $ | 0.23 |
|
| $ | 0.46 |
|
| $ | 0.82 |
| ||||||||
Basic earnings per share |
| $ | 0.66 |
|
| $ | 0.43 |
| ||||||||||||||||
Diluted earnings per share |
| $ | 0.66 |
|
| $ | 0.43 |
| ||||||||||||||||
See Notes to Condensed Consolidated Financial Statements.
3
RYERSON HOLDING CORPORATION AND SUBSIDIARY COMPANIES
Condensed Consolidated Statements of Cash Flows (Unaudited)
(In millions)
|
| Nine Months Ended |
| |||||
|
| September 30, |
| |||||
|
| 2017 |
|
| 2016 |
| ||
Operating activities: |
|
|
|
|
|
|
|
|
Net income |
| $ | 17.7 |
|
| $ | 27.3 |
|
Adjustments to reconcile net income to net cash provided by (used in) operating activities: |
|
|
|
|
|
|
|
|
Depreciation and amortization |
|
| 34.1 |
|
|
| 31.8 |
|
Stock-based compensation |
|
| 1.5 |
|
|
| 1.0 |
|
Deferred income taxes |
|
| 6.9 |
|
|
| 13.4 |
|
Provision for allowances, claims and doubtful accounts |
|
| 0.5 |
|
|
| 2.1 |
|
Loss on retirement of debt |
|
| — |
|
|
| 7.2 |
|
Other-than-temporary impairment charge on available-for-sale investments |
|
| 0.2 |
|
|
| 2.8 |
|
Restructuring and other charges |
|
| — |
|
|
| 2.5 |
|
Premium and fees paid related to debt modification |
|
| — |
|
|
| (15.6 | ) |
Non-cash (gain) loss from derivatives |
|
| 1.9 |
|
|
| (8.2 | ) |
Other items |
|
| (0.7 | ) |
|
| (0.2 | ) |
Change in operating assets and liabilities: |
|
|
|
|
|
|
|
|
Receivables |
|
| (91.5 | ) |
|
| (54.9 | ) |
Inventories |
|
| (117.5 | ) |
|
| (67.3 | ) |
Other assets |
|
| (4.2 | ) |
|
| 13.9 |
|
Accounts payable |
|
| 66.3 |
|
|
| 38.2 |
|
Accrued liabilities |
|
| 22.6 |
|
|
| 17.9 |
|
Accrued taxes payable/receivable |
|
| (2.5 | ) |
|
| 1.3 |
|
Deferred employee benefit costs |
|
| (28.6 | ) |
|
| (36.1 | ) |
Net adjustments |
|
| (111.0 | ) |
|
| (50.2 | ) |
Net cash used in operating activities |
|
| (93.3 | ) |
|
| (22.9 | ) |
Investing activities: |
|
|
|
|
|
|
|
|
Acquisitions, net of cash acquired |
|
| (49.2 | ) |
|
| — |
|
(Increase) Decrease in restricted cash |
|
| (0.3 | ) |
|
| 0.2 |
|
Capital expenditures |
|
| (15.8 | ) |
|
| (19.7 | ) |
Proceeds from sale of property, plant and equipment |
|
| 3.7 |
|
|
| 3.2 |
|
Net cash used in investing activities |
|
| (61.6 | ) |
|
| (16.3 | ) |
Financing activities: |
|
|
|
|
|
|
|
|
Net proceeds from issuance of common stock |
|
| — |
|
|
| 71.5 |
|
Long-term debt issued |
|
| — |
|
|
| 650.0 |
|
Repayment of debt |
|
| (0.1 | ) |
|
| (689.0 | ) |
Net proceeds of short-term borrowings |
|
| 73.4 |
|
|
| 3.2 |
|
Net increase in book overdrafts |
|
| 60.3 |
|
|
| 20.1 |
|
Long-term debt issuance costs |
|
| — |
|
|
| (5.2 | ) |
Principal payments on capital lease obligations |
|
| (12.0 | ) |
|
| (3.9 | ) |
Contributions from non-controlling interest |
|
| — |
|
|
| 0.3 |
|
Proceeds from sale leaseback transactions |
|
| 22.4 |
|
|
| — |
|
Net cash provided by financing activities |
|
| 144.0 |
|
|
| 47.0 |
|
Net increase (decrease) in cash and cash equivalents |
|
| (10.9 | ) |
|
| 7.8 |
|
Effect of exchange rate changes on cash and cash equivalents |
|
| 3.8 |
|
|
| 2.2 |
|
Net change in cash and cash equivalents |
|
| (7.1 | ) |
|
| 10.0 |
|
Cash and cash equivalents—beginning of period |
|
| 80.7 |
|
|
| 63.2 |
|
Cash and cash equivalents—end of period |
| $ | 73.6 |
|
| $ | 73.2 |
|
Supplemental disclosures: |
|
|
|
|
|
|
|
|
Cash paid during the period for: |
|
|
|
|
|
|
|
|
Interest paid to third parties |
| $ | 44.6 |
|
| $ | 49.2 |
|
Income taxes, net |
|
| 1.5 |
|
|
| 1.4 |
|
Noncash investing activities: |
|
|
|
|
|
|
|
|
Asset additions under capital leases and sale-leasebacks |
| $ | 34.6 |
|
| $ | 2.1 |
|
|
| Three Months Ended |
| |||||
|
| March 31, |
| |||||
|
| 2021 |
|
| 2020 |
| ||
Operating activities: |
|
|
|
|
|
|
|
|
Net income |
| $ | 25.6 |
|
| $ | 16.4 |
|
Adjustments to reconcile net income to net cash provided by operating activities: |
|
|
|
|
|
|
|
|
Depreciation and amortization |
|
| 13.6 |
|
|
| 13.3 |
|
Stock-based compensation |
|
| 1.6 |
|
|
| 0.6 |
|
Deferred income taxes |
|
| 4.5 |
|
|
| 14.6 |
|
Provision for allowances, claims, and doubtful accounts |
|
| 1.6 |
|
|
| 1.4 |
|
Gain on sale of assets |
|
| (20.3 | ) |
|
| — |
|
Pension settlement charge |
|
| 0.2 |
|
|
| 0.4 |
|
Gain on retirement of debt |
|
| — |
|
|
| (0.8 | ) |
Non-cash loss from derivatives |
|
| 9.1 |
|
|
| 2.7 |
|
Other items |
|
| — |
|
|
| (0.1 | ) |
Change in operating assets and liabilities: |
|
|
|
|
|
|
|
|
Receivables |
|
| (165.2 | ) |
|
| (69.4 | ) |
Inventories |
|
| (12.3 | ) |
|
| (4.1 | ) |
Other assets and liabilities |
|
| (19.7 | ) |
|
| 5.1 |
|
Accounts payable |
|
| 118.5 |
|
|
| 98.5 |
|
Accrued liabilities |
|
| 13.0 |
|
|
| 16.1 |
|
Accrued taxes payable/receivable |
|
| 0.5 |
|
|
| (14.2 | ) |
Deferred employee benefit costs |
|
| (18.0 | ) |
|
| (7.7 | ) |
Net adjustments |
|
| (72.9 | ) |
|
| 56.4 |
|
Net cash (used in) provided by operating activities |
|
| (47.3 | ) |
|
| 72.8 |
|
Investing activities: |
|
|
|
|
|
|
|
|
Capital expenditures |
|
| (6.5 | ) |
|
| (6.9 | ) |
Proceeds from sale of property, plant, and equipment |
|
| 29.0 |
|
|
| — |
|
Other items |
|
| (0.5 | ) |
|
| — |
|
Net cash provided by (used in) investing activities |
|
| 22.0 |
|
|
| (6.9 | ) |
Financing activities: |
|
|
|
|
|
|
|
|
Repayment of debt |
|
| (0.4 | ) |
|
| (54.2 | ) |
Net proceeds of short-term borrowings |
|
| 1.2 |
|
|
| 168.2 |
|
Net increase (decrease) in book overdrafts |
|
| 9.4 |
|
|
| (31.2 | ) |
Principal payments on finance lease obligations |
|
| (2.5 | ) |
|
| (3.4 | ) |
Other items |
|
| (0.1 | ) |
|
| — |
|
Net cash provided by financing activities |
|
| 7.6 |
|
|
| 79.4 |
|
Net increase (decrease) in cash, cash equivalents, and restricted cash |
|
| (17.7 | ) |
|
| 145.3 |
|
Effect of exchange rate changes on cash, cash equivalents, and restricted cash |
|
| (0.4 | ) |
|
| (0.4 | ) |
Net change in cash, cash equivalents, and restricted cash |
|
| (18.1 | ) |
|
| 144.9 |
|
Cash, cash equivalents, and restricted cash—beginning of period |
|
| 62.5 |
|
|
| 59.8 |
|
Cash, cash equivalents, and restricted cash—end of period |
| $ | 44.4 |
|
| $ | 204.7 |
|
Supplemental disclosures: |
|
|
|
|
|
|
|
|
Cash paid during the period for: |
|
|
|
|
|
|
|
|
Interest paid to third parties, net |
| $ | 22.8 |
|
| $ | 6.5 |
|
Income taxes, net |
|
| 2.3 |
|
|
| 1.9 |
|
Noncash investing activities: |
|
|
|
|
|
|
|
|
Asset additions under operating leases |
|
| 6.1 |
|
|
| 0.4 |
|
Asset additions under finance leases and sale-leasebacks |
|
| 1.7 |
|
|
| 0.1 |
|
See Notes to Condensed Consolidated Financial Statements.
RYERSON HOLDING CORPORATION AND SUBSIDIARY COMPANIES
Condensed Consolidated Balance Sheets
(In millions, except shares)shares and per share data)
|
| September 30, |
|
| December 31, |
|
| March 31, |
|
| December 31, |
| ||||
|
| 2017 |
|
| 2016 |
|
| 2021 |
|
| 2020 |
| ||||
|
| (unaudited) |
|
|
|
|
|
| (unaudited) |
|
|
|
|
| ||
Assets |
|
|
|
|
|
|
|
|
|
|
|
|
|
|
|
|
Current assets: |
|
|
|
|
|
|
|
|
|
|
|
|
|
|
|
|
Cash and cash equivalents |
| $ | 73.6 |
|
| $ | 80.7 |
|
| $ | 43.3 |
|
| $ | 61.4 |
|
Restricted cash |
|
| 1.3 |
|
|
| 1.0 |
|
|
| 1.1 |
|
|
| 1.1 |
|
Receivables less provision for allowances, claims and doubtful accounts of $5.6 in 2017 and $4.6 in 2016 |
|
| 425.4 |
|
|
| 326.0 |
| ||||||||
Receivables less provisions of $2.1 at March 31, 2021 and $1.7 at December 31, 2020 |
|
| 544.1 |
|
|
| 378.9 |
| ||||||||
Inventories |
|
| 691.7 |
|
|
| 563.4 |
|
|
| 617.2 |
|
|
| 604.5 |
|
Prepaid expenses and other current assets |
|
| 30.7 |
|
|
| 26.7 |
|
|
| 89.4 |
|
|
| 57.5 |
|
Total current assets |
|
| 1,222.7 |
|
|
| 997.8 |
|
|
| 1,295.1 |
|
|
| 1,103.4 |
|
Property, plant, and equipment, at cost |
|
| 727.6 |
|
|
| 668.7 |
|
|
| 819.1 |
|
|
| 822.9 |
|
Less: Accumulated depreciation |
|
| 309.7 |
|
|
| 280.5 |
|
|
| 407.2 |
|
|
| 401.1 |
|
Property, plant and equipment, net |
|
| 417.9 |
|
|
| 388.2 |
| ||||||||
Deferred income taxes |
|
| 8.6 |
|
|
| 24.4 |
| ||||||||
Property, plant, and equipment, net |
|
| 411.9 |
|
|
| 421.8 |
| ||||||||
Operating lease assets |
|
| 110.6 |
|
|
| 108.3 |
| ||||||||
Other intangible assets |
|
| 48.5 |
|
|
| 40.8 |
|
|
| 42.2 |
|
|
| 43.2 |
|
Goodwill |
|
| 115.3 |
|
|
| 103.2 |
|
|
| 121.2 |
|
|
| 120.3 |
|
Deferred charges and other assets |
|
| 4.3 |
|
|
| 4.3 |
|
|
| 5.2 |
|
|
| 5.1 |
|
Total assets |
| $ | 1,817.3 |
|
| $ | 1,558.7 |
|
| $ | 1,986.2 |
|
| $ | 1,802.1 |
|
Liabilities |
|
|
|
|
|
|
|
|
|
|
|
|
|
|
|
|
Current liabilities: |
|
|
|
|
|
|
|
|
|
|
|
|
|
|
|
|
Accounts payable |
| $ | 362.5 |
|
| $ | 230.4 |
|
| $ | 493.2 |
|
| $ | 365.1 |
|
Salaries, wages and commissions |
|
| 38.0 |
|
|
| 36.8 |
| ||||||||
Salaries, wages, and commissions |
|
| 62.7 |
|
|
| 43.1 |
| ||||||||
Other accrued liabilities |
|
| 62.0 |
|
|
| 37.7 |
|
|
| 98.9 |
|
|
| 78.3 |
|
Short-term debt |
|
| 20.2 |
|
|
| 19.2 |
|
|
| 18.1 |
|
|
| 13.8 |
|
Current portion of operating lease liabilities |
|
| 21.8 |
|
|
| 20.7 |
| ||||||||
Current portion of deferred employee benefits |
|
| 8.3 |
|
|
| 8.3 |
|
|
| 6.6 |
|
|
| 6.6 |
|
Total current liabilities |
|
| 491.0 |
|
|
| 332.4 |
|
|
| 701.3 |
|
|
| 527.6 |
|
Long-term debt |
|
| 1,021.4 |
|
|
| 944.3 |
|
|
| 723.3 |
|
|
| 726.2 |
|
Deferred employee benefits |
|
| 261.1 |
|
|
| 298.8 |
|
|
| 211.6 |
|
|
| 231.6 |
|
Noncurrent operating lease liabilities |
|
| 92.3 |
|
|
| 93.0 |
| ||||||||
Deferred income taxes |
|
| 63.3 |
|
|
| 58.2 |
| ||||||||
Other noncurrent liabilities |
|
| 58.2 |
|
|
| 32.5 |
|
|
| 19.7 |
|
|
| 20.4 |
|
Total liabilities |
|
| 1,831.7 |
|
|
| 1,608.0 |
|
|
| 1,811.5 |
|
|
| 1,657.0 |
|
Commitments and contingencies |
|
|
|
|
|
|
|
|
|
|
|
|
|
|
|
|
Equity |
|
|
|
|
|
|
|
|
|
|
|
|
|
|
|
|
Ryerson Holding Corporation stockholders’ equity (deficit): |
|
|
|
|
|
|
|
| ||||||||
Preferred stock, $0.01 par value; 7,000,000 shares authorized and no shares issued at 2017 and 2016 |
|
| — |
|
|
| — |
| ||||||||
Common stock, $0.01 par value; 100,000,000 shares authorized; 37,421,081 and 37,345,117 shares issued at 2017 and 2016, respectively |
|
| 0.4 |
|
|
| 0.4 |
| ||||||||
Ryerson Holding Corporation stockholders’ equity: |
|
|
|
|
|
|
|
| ||||||||
Preferred stock, $0.01 par value; 7,000,000 shares authorized and 0 shares issued at March 31, 2021 and December 31, 2020 |
|
| — |
|
|
| — |
| ||||||||
Common stock, $0.01 par value; 100,000,000 shares authorized; 38,329,897 shares issued at March 31, 2021 and December 31, 2020 |
|
| 0.4 |
|
|
| 0.4 |
| ||||||||
Capital in excess of par value |
|
| 376.9 |
|
|
| 375.4 |
|
|
| 384.7 |
|
|
| 383.1 |
|
Accumulated deficit |
|
| (95.1 | ) |
|
| (112.2 | ) | ||||||||
Treasury stock at cost – Common stock of 212,500 shares in 2017 and 2016 |
|
| (6.6 | ) |
|
| (6.6 | ) | ||||||||
Retained earnings |
|
| 59.1 |
|
|
| 33.8 |
| ||||||||
Treasury stock at cost – Common stock of 212,500 shares at March 31, 2021 and December 31, 2020 |
|
| (6.6 | ) |
|
| (6.6 | ) | ||||||||
Accumulated other comprehensive loss |
|
| (292.4 | ) |
|
| (307.8 | ) |
|
| (269.4 | ) |
|
| (271.9 | ) |
Total Ryerson Holding Corporation stockholders’ equity (deficit) |
|
| (16.8 | ) |
|
| (50.8 | ) | ||||||||
Total Ryerson Holding Corporation stockholders’ equity |
|
| 168.2 |
|
|
| 138.8 |
| ||||||||
Noncontrolling interest |
|
| 2.4 |
|
|
| 1.5 |
|
|
| 6.5 |
|
|
| 6.3 |
|
Total equity (deficit) |
|
| (14.4 | ) |
|
| (49.3 | ) | ||||||||
Total equity |
|
| 174.7 |
|
|
| 145.1 |
| ||||||||
Total liabilities and equity |
| $ | 1,817.3 |
|
| $ | 1,558.7 |
|
| $ | 1,986.2 |
|
| $ | 1,802.1 |
|
See Notes to Condensed Consolidated Financial Statements.
RYERSON HOLDING CORPORATION AND SUBSIDIARY COMPANIES
Notes to Condensed Consolidated Financial Statements (Unaudited)
NOTE 1: FINANCIAL STATEMENTS
Ryerson Holding Corporation (“Ryerson Holding”), a Delaware corporation, is the parent company of Joseph T. Ryerson & Son, Inc. (“JT Ryerson”), a Delaware corporation. Affiliates of Platinum Equity, LLC (“Platinum”) own approximately 21,037,500 shares of our common stock, which is approximately 57%55% of our issued and outstanding common stock.
We are a leading value-added processor and distributor of industrial metals service center, with operations in the United States through JT Ryerson, in Canada through our indirect wholly-owned subsidiary Ryerson Canada, Inc., a Canadian corporation (“Ryerson Canada”), and in Mexico through our indirect wholly-owned subsidiary Ryerson Metals de Mexico, S. de R.L. de C.V., a Mexican corporation (“Ryerson Mexico”). In addition to our North American operations, we conduct materials processing and distribution operations in China through an indirect wholly-owned subsidiary, Ryerson China Limited (“Ryerson China”)., a Chinese limited liability company. Unless the context indicates otherwise, Ryerson Holding, JT Ryerson, Ryerson Canada, Ryerson China, and Ryerson Mexico together with their subsidiaries, are collectively referred to herein as “Ryerson,” “we,” “us,” “our,” or the “Company.”
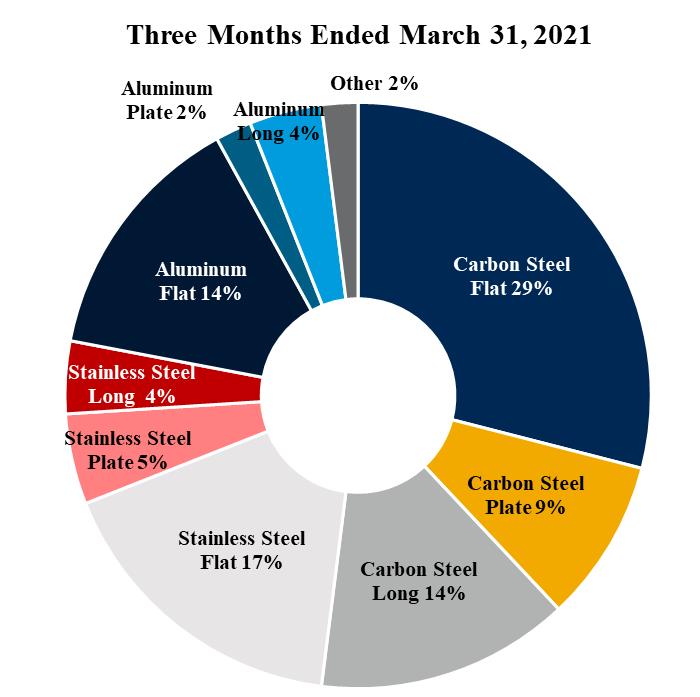
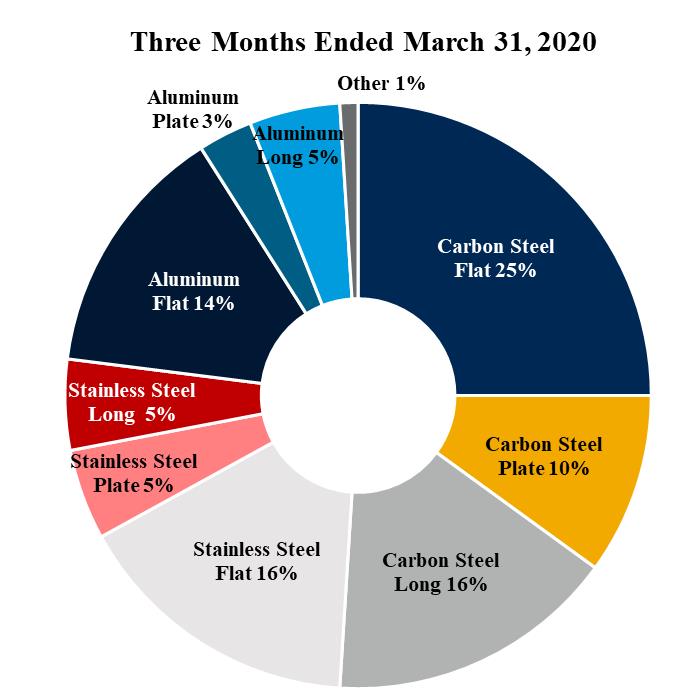
The following table shows our percentage of sales by major product lines for the three and nine months ended September 30, 2017 and 2016, respectively:
|
| Three Months Ended |
|
| Nine Months Ended |
| ||||||||||
|
| September 30, |
|
| September 30, |
| ||||||||||
Product Line |
| 2017 |
|
| 2016 |
|
| 2017 |
|
| 2016 |
| ||||
Carbon Steel Flat |
|
| 29 | % |
|
| 29 | % |
|
| 28 | % |
|
| 27 | % |
Carbon Steel Plate |
|
| 10 |
|
|
| 9 |
|
|
| 10 |
|
|
| 9 |
|
Carbon Steel Long |
|
| 12 |
|
|
| 13 |
|
|
| 12 |
|
|
| 14 |
|
Stainless Steel Flat |
|
| 17 |
|
|
| 17 |
|
|
| 18 |
|
|
| 16 |
|
Stainless Steel Plate |
|
| 4 |
|
|
| 4 |
|
|
| 4 |
|
|
| 4 |
|
Stainless Steel Long |
|
| 4 |
|
|
| 3 |
|
|
| 4 |
|
|
| 4 |
|
Aluminum Flat |
|
| 16 |
|
|
| 16 |
|
|
| 15 |
|
|
| 16 |
|
Aluminum Plate |
|
| 3 |
|
|
| 3 |
|
|
| 3 |
|
|
| 3 |
|
Aluminum Long |
|
| 4 |
|
|
| 4 |
|
|
| 4 |
|
|
| 5 |
|
Other |
|
| 1 |
|
|
| 2 |
|
|
| 2 |
|
|
| 2 |
|
Total |
|
| 100 | % |
|
| 100 | % |
|
| 100 | % |
|
| 100 | % |
Results of operations for any interim period are not necessarily indicative of results of any otherfuture periods or for the year. The condensed consolidated financial statements as of September 30, 2017March 31, 2021 and for the three-monththree months ended March 31, 2021 and nine-month periods ended September 30, 2017 and 20162020 are unaudited, but in the opinion of management, include all adjustments, consisting of normal recurring adjustments, necessary for a fair presentation of results for such periods. The year-end condensed consolidated balance sheet data contained in this report was derived from audited financial statements, but does not include all disclosures required by U.S. generally accepted accounting principles generally accepted in the United States of America.(“GAAP”). These condensed consolidated financial statements should be read in conjunction with the consolidated financial statements and related notes contained in the Company’s Annual Report on Form 10-K for the year ended December 31, 2016.2020.
NOTENOTE 2: RECENT ACCOUNTING PRONOUNCEMENTS
Impact of Recently Issued Accounting Standards—Adopted
In March 2016,December 2019, the Financial Accounting Standards Board (“FASB”) issued Accounting StandardStandards Update (“ASU”) 2016-07, 2019-12, “InvestmentsIncome Taxes – Equity Method and Joint Ventures: Simplifying the Transition to the Equity Method of Accounting. for Income Taxes.” The amendment eliminates the retroactive adjustments to an investment upon it qualifyingguidance removes certain exceptions for the equity method of accounting as a result of an increase in the level of ownership interest or degree of influence by the investor. ASU 2016-07 requires that the equity method investor add the cost of acquiring the additional interest in the investee to the current basis of the investor's previously held interest and adopt the equity method of accounting as of the date the investment qualifiesrecognizing deferred taxes for equity method accounting.investments, performing intraperiod allocation, and calculating income taxes in interim periods. The update was effectiveASU also adds guidance to reduce complexity in certain areas, including recognizing deferred taxes for interimgoodwill and annual reporting periods beginning after December 15, 2016.allocating taxes to members of a consolidated group, among others. We adopted this guidance for our fiscal year beginningas of January 1, 2017. The adoption of this guidance did not have an2021 and there was no impact onto our consolidated financial statements.
In January 2017, the FASB issued ASU 2017-01, “Clarifying the Definition of a Business”. The guidance in ASU 2017-01 was issued to provide clarity of the definition of a business with the objective to assist entities in the evaluation of whether a transaction should be accounted for as an acquisition of assets or a business. The update is effective for fiscal years beginning after December 15, 2017, and is to be applied on a prospective basis. Early adoption is permitted. We adopted this guidance for our fiscal year beginning January 1, 2017. The adoption of this guidance did not have an impact on our consolidated financial statements.
In January 2017, the FASB issued ASU 2017-04, “Simplifying the Test for Goodwill Impairment”. The objective of the guidance in ASU 2017-04 is to simplify how an entity is required to test goodwill for impairment by eliminating Step 2 from the goodwill impairment test. To test goodwill under this amendment, an entity should perform its annual impairment test by comparing the fair value of a reporting unit with its carrying amount. An impairment charge is recognized in the amount that the carrying amount exceeds the reporting unit’s fair value; however, the loss should not exceed the total amount of goodwill allocated to the reporting unit. The update is effective for fiscal years beginning after December 15, 2020, and is to be applied on a prospective basis. Early adoption is permitted. We adopted this guidance for our fiscal year beginning January 1, 2017. The adoption of this guidance did not have an impact on our consolidated financial statements.
In August 2017, the FASB issued ASU 2017-12, “Targeted Improvements to Accounting for Hedging Activities”. The objective of the amendments is to better align an entity’s risk management activities and financial reporting for hedging relationships. Changes are made to both the designation and measurement guidance for qualifying hedging relationships and the presentation of hedge results. Certain targeted improvements are also made to simplify the application of hedge accounting guidance and ease the administrative burden of hedge documentation requirements and assessing hedge effectiveness. The update is effective for fiscal years beginning after December 15, 2018, and the amended presentation and disclosure guidance is to be applied on a prospective basis. Early adoption is permitted in any interim or annual period. We adopted this guidance effective July 1, 2017. The adoption of this guidance did not have an impact on our consolidated financial statements.
Impact of Recently Issued Accounting Standards—Not Yet Adopted
In May 2014,No accounting pronouncements have been issued that we have not yet adopted.
NOTE 3: CASH, CASH EQUIVALENTS, AND RESTRICTED CASH
The following table provides a reconciliation of cash, cash equivalents, and restricted cash reported within the FASB issued ASU 2014-09, “Revenue from Contracts with Customers,” which creates Accounting Standards Codification (“ASC”) 606 “Revenue from Contracts with Customers” and supersedes the revenue recognition requirements in ASC 605 “Revenue Recognition.” The guidance in ASU 2014-09 and subsequently issued amendments outlines a comprehensive model for all entities to use in accounting for revenue arising from contracts with customers as well as required disclosures. Under the new standard, recognition of revenue occurs when a customer obtains control of promised goods or services in an amountCondensed Consolidated Balance Sheets that reflects the consideration which the entity expects to receive in exchange for those goods or services. The new standard requires additional disclosure of the nature, amount, timing, and uncertainty of revenue and cash flows arising from contracts with customers including significant judgments and changes in judgments. The new standard permits two methods of adoption: the full retrospective method or the modified retrospective transition method. We will adopt the new standard effective January 1, 2018 using the modified retrospective transition method with the cumulative effect recordedsum to the opening balance of retained earnings as of the date of adoption.
We have established a project management team to analyze the impact of the new standard. The team is evaluating our different revenue streams and reviewing representative contracts with customers to identify if there are differences that would result from the application of the new standard as compared to our current accounting policies and practices. Under the new standard, the Company expects to recognize revenue on an over time basis for a subset of revenues associated with custom fabricated products instead of upon delivery of the fabricated product to the customer. The Company has not yet completed the process of quantifying the effects on our consolidated financial statements of the changes that may result from adoption. The Company is implementing new business processes and internal controls in order to recognize revenue in accordance with the new standard. We believe our implementation of the new standard is progressing in a timely manner to allow for proper recognition, presentation, and disclosure upon adoption.
In January 2016, the FASB issued ASU 2016-01, "Financial Instruments – Overall: Recognition and Measurement of Financial Assets and Financial Liabilities." The amendments in ASU 2016-01 change the accounting for non-consolidated equity investments that are not accounted for under the equity method of accounting by requiring changes in fair value to be recognized in net income. Under current guidance, changes in fair value for investments of this nature are recognized in accumulated other comprehensive income as a component of stockholders’ equity. Additionally, ASU 2016-01 simplifies the impairment assessment of equity investments without readily determinable fair values; requires entities to use the exit price when estimating the fair value of financial instruments; and modifies various presentation disclosure requirements for financial instruments. The amendments should be applied by means of a cumulative-effect adjustment to the balance sheet astotal of the beginning of the fiscal year of adoption. The amendments related to equity securities without readily determinable fair values (including disclosure requirements) should be applied prospectively to equity investments that exist as of the date of adoption. The update is effective for interim and annual reporting periods beginning after December 15, 2017. Early adoption is permitted. We will adopt this guidance for our fiscal year beginning
January 1, 2018. We do not expect the adoption of this guidance to have a material impact on our consolidated financial statements. Our available-for-sale investment as of September 30, 2017 has a fair value of $0.1 million.
In February 2016, the FASB issued ASU 2016-02, “Leases” codifiedending cash balances shown in ASC 842, “Leases.” The guidance requires lessees to recognize assets and liabilities on the balance sheet for the rights and obligations created by all leases with terms of more than 12 months. The amendment also will require disclosures designed to give financial statement users information on the amount, timing, and uncertainty of cash flows arising from leases. These disclosures include qualitative and quantitative information. The update is effective for interim and annual reporting periods beginning after December 15, 2018. Entities are required to use a modified retrospective approach for leases that exist or are entered into after the beginning of the earliest comparative period in the financial statements, and have the option to use certain relief. Full retrospective application is prohibited. Early adoption is permitted. We will adopt this guidance for our fiscal year beginning January 1, 2019. The Company is working to gather lists of all leases and is in the process of implementing a lease software to be used for lease tracking, reporting and disclosures. We are still assessing the impact of adoption on our consolidated financial statements.
In June 2016, the FASB issued ASU 2016-13, “Financial Instruments – Credit Losses: Measurement of Credit Losses on Financial Instruments.” The amendment requires financial assets measured at amortized cost basis to be presented at the net amount expected to be collected, thus eliminating the probable initial recognition threshold and instead reflecting the current estimate of all expected credit losses. The amendment also requires that credit losses relating to available-for-sale debt securities be recorded through an allowance for credit losses rather than a write-down, thus enabling the ability to record reversals of credit losses in current period net income. The update is effective for interim and annual reporting periods beginning after December 15, 2019. An entity will apply the amendment through a cumulative-effect adjustment to retained earnings as of the beginning of the first reporting period in which the guidance is effective (that is, a modified-retrospective approach). A prospective transition approach is required for debt securities for which an-other-than-temporary impairment had been recognized before the effective date. The effect of a prospective transition approach is to maintain the same amortized cost basis before and after the effective date of this update. Early adoption is permitted only for fiscal years beginning after December 15, 2018, including interim periods within those fiscal years. We will adopt this guidance for our fiscal year beginning January 1, 2020. We are still assessing the impact of adoption on our consolidated financial statements.
In August 2016, the FASB issued ASU 2016-15, “Statement of Cash Flows – Classification of Certain Cash Receipts and Certain Cash Payments.” The amendments address the diversity in practice in how certain cash receipts and cash payments are presented and classified in the statement of cash flows. The update is effective for interim and annual reporting periods beginning after December 15, 2017. The amendments should be applied using a retrospective transition method to each period presented. If it is impracticable to apply the amendments retrospectively for some of the issues, the amendments for those issues would be applied prospectively as of the earliest date practicable. Early adoption is permitted. We will adopt this guidance for our fiscal year beginning January 1, 2018. The adoption of this guidance is not expected to have a material impact on our consolidated financial statements.
In October 2016, the FASB issued ASU 2016-16, “Income Taxes – Intra-Entity Transfers of Assets Other Than Inventory.” The amendment requires an entity to recognize the income tax consequences of an intra-entity transfer of an asset other than inventory when the transfer occurs. The update is effective for interim and annual reporting periods beginning after December 15, 2017. The amendments should be applied on a modified retrospective basis through a cumulative-effect adjustment directly to retained earnings as of the beginning of the period of adoption. Early adoption is permitted. We will adopt this guidance for our fiscal year beginning January 1, 2018. The adoption of this guidance is not expected to have a material impact on our consolidated financial statements.
In November 2016, the FASB issued ASU 2016-18 “Statement of Cash Flows – Restricted Cash.” The amendment requires entities to include in their cash and cash-equivalent balances in the statement of cash flows those amounts that are deemed to be restricted cash and restricted cash equivalents. The ASU does not define the terms “restricted cash” and “restricted cash equivalents.” The amendment is effective for interim and annual reporting periods beginning after December 15, 2017. The amendments should be applied using a retrospective transition method to each period presented. Early adoption is permitted. We will adopt this guidance for our fiscal year beginning January 1, 2018. The adoption of this guidance is not expected to have a material impact on our consolidated financial statements.
In March 2017, the FASB issued ASU 2017-07, “Compensation – Retirement Benefits: Improving the Presentation of Net Periodic Pension Cost and Net Periodic Post Retirement Benefit Cost”. The amendment requires entities to disaggregate the service cost component from the other components of net benefit cost and limits the capitalization of net benefit cost to only the service cost component. The amendment also provides explicit guidance on how to present the service cost component and the other components of net benefit cost in the statement of comprehensive income. The amendments are effective for interim and annual reporting periods beginning after December 15, 2017. The disclosure requirements of the amendments should be applied retrospectively and the requirements concerning capitalization of the net service costs should be applied prospectively. We will adopt this guidance for our
fiscal year beginning January 1, 2018. Adoption of this guidance will result in a reclass within the lines of the Condensed Consolidated Statements of Comprehensive Income, with no impact on gross margins, and is not expected to have a material impact on our consolidated financial statements.Cash Flows:
|
| March 31, |
|
| December 31, |
| ||
|
| 2021 |
|
| 2020 |
| ||
|
| (In millions) |
| |||||
Cash and cash equivalents |
| $ | 43.3 |
|
| $ | 61.4 |
|
Restricted cash |
|
| 1.1 |
|
|
| 1.1 |
|
Total cash, cash equivalents, and restricted cash |
| $ | 44.4 |
|
| $ | 62.5 |
|
In May 2017,We had cash restricted for the FASB issued ASU 2017-09, “Compensation – Stock Compensation: Scopepurposes of Modification Accounting”. The amendment provides guidance about which changes to the terms and conditionscovering letters of a share-based payment award require an entity to apply the accounting guidance on modifications to share-based payment awards. The guidance is effectivecredit that can be presented for interim and annual reporting periods beginning after December 15, 2017. We will adopt this guidance for our fiscal year beginning January 1, 2018. The adoption of this guidance is not expected to have a material impact on our consolidated financial statements.potential insurance claims.
NOTE 3:4: INVENTORIES
The Company primarily uses the last-in, first-out (LIFO) method of valuing inventory. Interim LIFO calculations are based on actual inventory levels.
Inventories, at stated LIFO value, were classified at September 30, 2017March 31, 2021 and December 31, 20162020 as follows:
|
| September 30, |
|
| December 31, |
| ||
|
| 2017 |
|
| 2016 |
| ||
|
| (In millions) |
| |||||
In process and finished products |
| $ | 691.7 |
|
| $ | 563.4 |
|
|
| March 31, |
|
| December 31, |
| ||
|
| 2021 |
|
| 2020 |
| ||
|
| (In millions) |
| |||||
In process and finished products |
| $ | 617.2 |
|
| $ | 604.5 |
|
If current cost had been used to value inventories, such inventories would have been $79$21 million higher and $115$63 million lower than reported at September 30, 2017March 31, 2021 and December 31, 2016,2020, respectively. Approximately 89%90% and 90%91% of inventories are accounted for under the LIFO method at September 30, 2017March 31, 2021 and December 31, 2016,2020, respectively. Non-LIFO inventories consist primarily of inventory at our foreign facilities using the weighted-averagemoving average cost and the specific cost methods. Substantially all of our inventories consist of finished products.
Inventories are stated at the lower of cost or market value. We record amounts required, if any, to reduce the carrying value of inventory to its lower of cost or market as a charge to cost of materials sold. The lower of cost or market reserve totaled zero and $23.9 million at September 30, 2017 and December 31, 2016, respectively.
The Company has consignment inventory at certain customer locations, which totaled $11.2$6.0 million and $11.1$4.8 million at September 30, 2017March 31, 2021 and December 31, 2016,2020, respectively.
NOTE 5: LEASES
The Company leases various assets including real estate, trucks, trailers, mobile equipment, processing equipment, and IT equipment. The Company has noncancelable operating leases expiring at various times through 2032 and finance leases expiring at various times through 2027.
The following table summarizes the location and amount of lease assets and lease liabilities reported in our Condensed Consolidated Balance Sheet as of March 31, 2021 and December 31, 2020:
|
|
|
| March 31, |
|
| December 31, |
| ||
Leases |
| Balance Sheet Location |
| 2021 |
|
| 2020 |
| ||
|
|
|
| (In millions) |
| |||||
Assets |
|
|
|
|
|
|
|
|
|
|
Operating lease assets |
| Operating lease assets |
| $ | 110.6 |
|
| $ | 108.3 |
|
Finance lease assets |
| Property, plant, and equipment, net(a) |
|
| 41.0 |
|
|
| 45.5 |
|
Total lease assets |
|
|
| $ | 151.6 |
|
| $ | 153.8 |
|
Liabilities |
|
|
|
|
|
|
|
|
|
|
Current |
|
|
|
|
|
|
|
|
|
|
Operating |
| Current portion of operating lease liabilities |
| $ | 21.8 |
|
| $ | 20.7 |
|
Finance |
| Other accrued liabilities |
|
| 8.5 |
|
|
| 9.0 |
|
Noncurrent |
|
|
|
|
|
|
|
|
|
|
Operating |
| Noncurrent operating lease liabilities |
|
| 92.3 |
|
|
| 93.0 |
|
Finance |
| Other noncurrent liabilities |
|
| 13.8 |
|
|
| 14.3 |
|
Total lease liabilities |
|
|
| $ | 136.4 |
|
| $ | 137.0 |
|
(a) | Finance lease assets were recorded net of accumulated amortization of $20.5 million and $21.0 million as of March 31, 2021 and December 31, 2020, respectively. |
The following table summarizes the location and amount of lease expense reported in our Condensed Consolidated Statements of Comprehensive Income for the three months ended March 31, 2021 and 2020:
|
|
|
| Three Months Ended March 31, |
| |||||
Lease Expense |
| Location of Lease Expense Recognized in Income |
| 2021 |
|
| 2020 |
| ||
|
|
|
| (In millions) |
| |||||
Operating lease expense |
| Warehousing, delivery, selling, general, and administrative |
| $ | 6.2 |
|
| $ | 6.0 |
|
Finance lease expense |
|
|
|
|
|
|
|
|
|
|
Amortization of lease assets |
| Warehousing, delivery, selling, general, and administrative |
|
| 1.5 |
|
|
| 1.6 |
|
Interest on lease liabilities |
| Interest and other expense on debt |
|
| 0.2 |
|
|
| 0.3 |
|
Variable lease expense |
| Warehousing, delivery, selling, general, and administrative |
|
| 0.8 |
|
|
| 0.8 |
|
Short-term lease expense |
| Warehousing, delivery, selling, general, and administrative |
|
| 0.5 |
|
|
| 0.8 |
|
Total lease expense |
|
|
| $ | 9.2 |
|
| $ | 9.5 |
|
The following table presents maturity analysis of lease liabilities at March 31, 2021:
Maturity of Lease Liabilities |
| Operating Leases(a) |
|
| Finance Leases |
| ||
|
| (In millions) |
| |||||
2021 |
| $ | 19.0 |
|
| $ | 7.2 |
|
2022 |
|
| 22.5 |
|
|
| 6.9 |
|
2023 |
|
| 17.9 |
|
|
| 4.4 |
|
2024 |
|
| 16.5 |
|
|
| 3.5 |
|
2025 |
|
| 12.9 |
|
|
| 1.1 |
|
After 2025 |
|
| 39.3 |
|
|
| 0.6 |
|
Total lease payments |
|
| 128.1 |
|
|
| 23.7 |
|
Less: Interest(b) |
|
| (14.0 | ) |
|
| (1.4 | ) |
Present value of lease liabilities(c) |
| $ | 114.1 |
|
| $ | 22.3 |
|
(a) | There were 0 operating leases with options to extend lease terms that are reasonably certain of being exercised or operating leases signed but not yet commenced. |
(b) | Calculated using the discount rate for each lease. |
(c) | Includes the current portion of $21.8 million for operating leases and $8.5 million for finance leases. |
The following table shows the weighted-average remaining lease term and discount rate for operating and finance leases, respectively, at March 31, 2021 and December 31, 2020:
|
| March 31, |
|
| December 31, |
| ||
Lease Term and Discount Rate |
| 2021 |
|
| 2020 |
| ||
|
|
|
|
|
|
|
|
|
Weighted-average remaining lease term (years) |
|
|
|
|
|
|
|
|
Operating leases |
|
| 7.0 |
|
|
| 7.3 |
|
Finance leases |
|
| 2.9 |
|
|
| 2.8 |
|
Weighted-average discount rate |
|
|
|
|
|
|
|
|
Operating leases |
|
| 3.3 | % |
|
| 3.4 | % |
Finance leases |
|
| 4.2 | % |
|
| 4.4 | % |
Information reported in our Condensed Consolidated Statement of Cash Flows for the three months ended March 31, 2021 and 2020 is summarized below:
|
| Three Months Ended March 31, |
| |||||
Other Information |
| 2021 |
|
| 2020 |
| ||
|
| (In millions) |
| |||||
Cash paid for amounts included in the measurement of lease liabilities |
|
|
|
|
|
|
|
|
Operating cash flows from operating leases |
| $ | 6.8 |
|
| $ | 6.2 |
|
Operating cash flows from finance leases |
|
| 0.2 |
|
|
| 0.3 |
|
Financing cash flows from finance leases |
|
| 2.5 |
|
|
| 3.4 |
|
Assets obtained in exchange for lease obligations: |
|
|
|
|
|
|
|
|
Operating leases |
|
| 6.1 |
|
|
| 0.4 |
|
Finance leases |
|
| 1.7 |
|
|
| 0.1 |
|
NOTE 4:6: GOODWILL AND OTHER INTANGIBLE ASSETS
Goodwill, which represents the excess of cost over the fair value of net assets acquired, amounted to $115.3$121.2 million and $103.2$120.3 million at September 30, 2017March 31, 2021 and December 31, 2016,2020, respectively. We recognized $12.1 million of goodwill during the first nine months of 2017 related to the acquisitions discussed in Note 5: Acquisitions. Pursuant to ASC 350, “Intangibles – Goodwill and Other,” we review the recoverability of goodwill annually as of October 1 or whenever significant events or changes occur which might impair the recovery of recorded amounts. The most recently completed impairment test of goodwill was performed as of October 1, 2016,2020, and it was determined that no0 impairment existed in 2016.existed.
Other intangible assets with finite useful lives continue to be amortized over their useful lives. During the first nine months of 2017 we recognized $12.2 million in intangibles related to the acquisitions discussed in Note 5: Acquisitions. We review the recoverability of our long-lived assets whenever events or changes in circumstances indicate the carrying amount of such assets may not be recoverable.
Our Critical Accounting Policies and Estimates for goodwill and intangibles assets are disclosed in Note 1 to the Consolidated Financial Statements and in Management's Discussion and Analysis of our Annual Report on Form 10-K for the fiscal year ended December 31, 2020. We continue to monitor the significant global economic uncertainty as a result of the COVID-19 pandemic to assess the outlook for demand for our products and the impact on our business and our overall financial performance. A lack of further recovery or a deterioration in current market conditions, a trend of weaker than expected financial performance in our business, or a lack of further recovery or a decline in the Company’s market capitalization, among other factors, could result in an impairment charge in future periods which could have a material adverse effect on our financial statements.
NOTE 5: ACQUISITIONS
On January 19, 2017, Ryerson Holding acquired The Laserflex Corporation (“Laserflex”), a privately-owned metal fabricator specializing in laser fabrication metal processing and welding with locations in Columbus, Ohio and Wellford, South Carolina. The acquisition is not material to our consolidated financial statements.
On February 15, 2017, Ryerson Holding acquired Guy Metals, Inc. (“Guy Metals”), a privately-owned metal service center company located in Hammond, Wisconsin. The acquisition is not material to our consolidated financial statements.
Long-term debt consisted of the following at September 30, 2017March 31, 2021 and December 31, 2016:2020:
|
| September 30, |
|
| December 31, |
|
| March 31, |
|
| December 31, |
| ||||
|
| 2017 |
|
| 2016 |
|
| 2021 |
|
| 2020 |
| ||||
|
| (In millions) |
|
| (In millions) |
| ||||||||||
Ryerson Credit Facility |
| $ | 385.1 |
|
| $ | 312.0 |
|
| $ | 282.0 |
|
| $ | 285.0 |
|
11.00% Senior Secured Notes due 2022 |
|
| 650.0 |
|
|
| 650.0 |
| ||||||||
8.50% Senior Secured Notes due 2028 |
|
| 450.0 |
|
|
| 450.0 |
| ||||||||
Foreign debt |
|
| 19.5 |
|
|
| 19.2 |
|
|
| 16.3 |
|
|
| 12.1 |
|
Other debt |
|
| 1.7 |
|
|
| — |
|
|
| 7.4 |
|
|
| 7.8 |
|
Unamortized debt issuance costs and discounts |
|
| (14.7 | ) |
|
| (17.7 | ) |
|
| (14.3 | ) |
|
| (14.9 | ) |
Total debt |
|
| 1,041.6 |
|
|
| 963.5 |
|
|
| 741.4 |
|
|
| 740.0 |
|
Less: Short-term foreign debt |
|
| 19.5 |
|
|
| 19.2 |
|
|
| 16.3 |
|
|
| 12.1 |
|
Less: Other short-term debt |
|
| 0.7 |
|
|
| — |
|
|
| 1.8 |
|
|
| 1.7 |
|
Total long-term debt |
| $ | 1,021.4 |
|
| $ | 944.3 |
|
| $ | 723.3 |
|
| $ | 726.2 |
|
Ryerson Credit Facility
OnOn November 16, 2016, Ryerson entered into an amendment with respect to its $1.0 billion revolving credit facility (as amended, the “Ryerson“Old Credit Facility”), to reduce the total facility size from $1.0 billion (the “Old Credit Facility”) to $750 million, reduce the interest rate on outstanding borrowings by 25 basis points, reduce commitment fees on amounts not borrowed by 2.5 basis points, and to extend the maturity date to November 16, 2021. The Old Credit Facility was amended a second time on June 28, 2018, to increase the facility size from $750 million to $1.0 billion. On September 23, 2019, a third amendment was entered into to supplement the facility and add a U.S. “first-in, last-out” sub-facility of $67.9 million (the “Old FILO Facility”). The Old FILO Facility was equal in subordination with the other borrowings under the revolving credit facility and matured as of June 30, 2020. The Old FILO Facility supplemented
our borrowing capacity by providing additional collateral on eligible accounts receivable and inventory. On November 5, 2020, Ryerson entered into a fourth amendment to extend the maturity date to November 5, 2025 (as amended, the “Ryerson Credit Facility” or “Credit Facility”). The aggregate facility size of $1.0 billion remained unchanged. The fourth amendment also added the ability to convert up to $100 million of commitments under the Ryerson Credit Facility into a “first-in, last-out” sub-facility (the “FILO Facility”). Subject to certain limitations, such conversion can be made from time to time (but no more than twice in the aggregate) prior to the date that is two years after November 5, 2020.
At September 30, 2017March 31, 2021, Ryerson had $385.1$282 million of outstanding borrowings, $15$11 million of letters of credit issued, and $291$509 million available under the Ryerson Credit Facility compared to $312.0$285 million of outstanding borrowings, $16$11 million of letters of credit issued, and $225$277 million available at December 31, 2016.2020. Total credit availability is limited by the amount of eligible accounts receivable, inventory, and qualified cash pledged as collateral under the agreement insofar as Ryerson is subject to a borrowing base comprised of the aggregate of these three amounts, less applicable reserves. Eligible accounts receivable, at any date of determination, is comprised of the aggregate value of all accounts directly created by a borrower (and in the case of Canadian accounts, a Canadian guarantor) in the ordinary course of business arising out of the sale of goods or the rendering of services, each of which has been invoiced, with such receivables adjusted to exclude various ineligible accounts, including, among other things, those to which a borrower (or guarantor, as applicable) does not have sole and absolute title and accounts arising out of a sale to an employee, officer, director, or affiliate of a borrower (or guarantor, as applicable). Eligible inventory, at any date of determination, is comprised of the net orderly liquidation value of all inventory owned by a borrower (and in the case of Canadian accounts, a Canadian guarantor).borrower. Qualified cash consists of cash in an eligible deposit account that is subject to customary restrictions and liens in favor of the lenders.
The Ryerson Credit Facility has an allocation of $660 million to the Company’s subsidiaries in the United States and an allocation of $90 million to Ryerson Holding’s Canadian subsidiary that is a borrower. Amounts outstanding under the Ryerson Credit Facility bear interest at (i) a rate determined by reference to (A) the base rate (the highest of the Federal Funds Rate plus 0.50%, Bank of America, N.A.’s prime rate, and the one-month LIBOR rate plus 1.00%, however, in no event shall the base rate be less than 1.25%), or (B) a LIBOR rate (with a floor of 0.25%) or, (ii) for Ryerson Holding’s Canadian subsidiary that is a borrower, (A) a rate determined by reference to the Canadian base rate (the greatest of the Federal Funds Rate plus 0.50%, Bank of America-Canada Branch’s “base rate” for commercial loans in U.S. Dollars made at its “base rate”, and the 30 day LIBOR rate plus 1.00%), (B) the prime rate (the greater of Bank of America-Canada Branch’s “prime rate” for commercial loans made by it in Canada in Canadian Dollars and the one-month Canadian bankers’ acceptance rate (with a floor of 0.25%) plus 1.00%), or (C) the bankers’ acceptance rate. Therate, however, in no event shall the Canadian base rate or the Canadian prime rate be less than 1.25%). Until November 5, 2021 the spread over the base rate and prime rate is fixed at 0.50% and the spread over the LIBOR for the bankers’ acceptances is fixed at 1.50%. After November 5, 2021, the spread over the base rate and prime rate will be between 0.25% and 0.50% and the spread over the LIBOR and for the bankers’ acceptances iswill be between 1.25% and 1.50%, depending on the amount available to be borrowed under the Ryerson Credit Facility. The spread with respect to the FILO Facility, if any, will be determined at the time the commitments under the Ryerson Credit Facility are converted into such FILO Facility. Ryerson also pays commitment fees on amounts not borrowed at a rate of 0.225%. Overdue amounts and all amounts owed during the existence of a default bear interest at 2%2.00% above the rate otherwise applicable thereto. Ryerson also pays commitment fees on amounts not borrowed at a rate of 0.23%.Loans advanced under the FILO Facility may only be prepaid if all then outstanding revolving loans are repaid in full.
We attempt to minimize interest rate risk exposure through the utilization of interest rate swaps, which are derivative financial instruments. During March 2017,In June 2019, we entered into an interest rate swap to fix interest on $150$60 million of our floating rate debt under the Ryerson Credit Facility at a rate of 1.658%1.729% through March 2020. TheJune 2022. In November 2019, we entered into another interest rate swap has reset dates and critical terms that matchto fix interest on $100 million of our existingfloating rate debt andunder the anticipated critical termsRyerson Credit Facility at a rate of future debt.1.539% through November 2022. The weighted average interest rate on the outstanding borrowings under the Ryerson Credit Facility including the interest rate swap swaps was 2.7 percent2.7% and 2.2 percent2.9% at September 30, 2017March 31, 2021 and December 31, 2016,2020, respectively.
Borrowings under the Ryerson Credit Facility are secured by first-priority liens on all of the inventory, accounts receivables, lockbox accounts, and related assets of the borrowers and the guarantors.
The Ryerson Credit Facility also contains covenants that, among other things, restrict Ryerson Holding and its restricted subsidiaries with respect to the incurrence of debt, the creation of liens, transactions with affiliates, mergers and consolidations, sales of assets, and acquisitions. The Ryerson Credit Facility also requires that, if availability under the Ryerson Credit Facility declines to a certain level, Ryerson maintain a minimum fixed charge coverage ratio as of the end of each fiscal quarter, and includes defaults upon (among other things) the occurrence of a change of control of Ryerson and a cross-default to other financing arrangements.
The Ryerson Credit Facility contains events of default with respect to, among other things, default in the payment of principal when due or the payment of interest, fees, and other amounts due thereunder after a specified grace period, material misrepresentations, failure to perform certain specified covenants, certain bankruptcy events, the invalidity of certain security agreements or guarantees, material judgments, and the occurrence of a change of control of Ryerson. If such an event of default occurs, the lenders under the Ryerson Credit Facility will be entitled to various remedies, including acceleration of amounts outstanding under the Ryerson Credit Facility and all other actions permitted to be taken by secured creditors.
The lenders under the Ryerson Credit Facility maycould reject a borrowing request if any event, circumstance, or development has occurred that has had or could reasonably be expected to have a material adverse effect on the Company. If Ryerson Holding, JT Ryerson, any of the other borrowers, or any restricted subsidiaries of JT Ryerson becomes insolvent or commences bankruptcy proceedings, all amounts borrowed under the Ryerson Credit Facility will become immediately due and payable.
Net proceeds of short-term borrowings that are reflected in the Condensed Consolidated Statements of Cash Flows represent borrowings under the Ryerson Credit Facility with original maturities less than three months.
20222028 Notes
On May 24, 2016,July 22, 2020, JT Ryerson issued $650$500 million in aggregate principal amount of the 2022 Notesits 8.50% senior secured notes due 2028 (the “2022“2028 Notes”). The 20222028 Notes bear interest at a rate of 11.00%8.50% per annum. The 20222028 Notes are fully and unconditionally guaranteed on a senior secured basis by all of our existing and future domestic subsidiaries that are co-borrowers or that have guarantee obligations under the Ryerson Credit Facility. The net proceeds from the issuance of the 2028 Notes, along with available cash, were used to (i) redeem all of the 11.0% Senior Secured Notes due 2022 (the “2022 Notes”) and (ii) pay related transaction fees, expenses, and premiums. During the fourth quarter of 2020, a principal amount of $50.0 million of the 2028 Notes was redeemed for $51.5 million and retired. As a result, $450 million in aggregate principal amount remained outstanding at March 31, 2021.
The 20222028 Notes and the related guarantees are secured by a first-priority security interest in substantially all of JT Ryerson’s and each guarantor’s present and future assets located in the United States (other than receivables, inventory, cash deposit accounts and related general intangibles, certain other assets, and proceeds thereof)thereof, which are secured pursuant to a second-priority security interest), subject to certain exceptions and customary permitted liens. The 2022 Notes and the related guarantees are also secured on a second-priority basis by a lien on the assets that secure JT Ryerson’s and the Company’s obligations under the Ryerson Credit Facility.
The 20222028 Notes will be redeemable, in whole or in part, at any time on or after May 15, 2019August 1, 2023 at certain redemption prices. The redemption price for the 20222028 Notes if redeemed during the twelve months beginning (i) May 15, 2019August 1, 2023 is 105.50%104.250%, (ii) May 15, 2020August 1, 2024 is 102.75%102.125%, and (iii) May 15, 2021August 1, 2025 and thereafter is 100.00%100.000%. All redemption amounts also include accrued and unpaid interest, if any, to, but not including, the redemption date. JT Ryerson may also redeem some or all of the 20222028 Notes before May 15, 2019August 1, 2023 at a redemption price of 100.00%100.000% of the principal amount, plus accrued and unpaid interest, if any, to, but not including, the redemption date, plus a “make-whole” premium. In addition, JT Ryerson may redeem up to 35%40% of the 2022outstanding 2028 Notes before May 15, 2019 with respect to the 2022 NotesAugust 1, 2023 with the net cash proceeds from certain equity offerings at a price equal to 111.00%, with respect to the 2022 Notes,108.500% of the principal amount thereof,of the Notes, plus accrued but unpaid interest, if any, to, but not including, the redemption date. Furthermore, JT Ryerson may redeem the 2028 Notes at any time and from time to time prior to August 1, 2023 in an aggregate principal amount equal to up to 10% of the original aggregate principal amount of the 2028 Notes during each twelve month period commencing on July 22, 2020 at a redemption price of 103.000%, plus accrued and unpaid interest, if any.any, to, but not including, the redemption date. JT Ryerson may also redeem the 2028 Notes at any time prior to August 1, 2022 in an aggregate principal amount equal to $100.0 million on a one-time basis from the net cash proceeds received from the sale of real property, at a redemption price of 104.000% plus accrued and unpaid interest, if any, to, but not including, the redemption date. In addition, JT Ryerson may be required to make an offer to purchase the 20222028 Notes upon the sale of certain assets or upon a change of control.
The 2022Company evaluated the redemption options within the 2028 Notes for embedded derivatives and determined that one redemption option required bifurcation as it is not clearly and closely related to the debt agreement. The Company recorded the
embedded derivative as of December 31, 2020 based on a fair value of $2.3 million within other current assets in the Condensed Consolidated Balance Sheet. As of March 31, 2021, the fair value was determined to be $2.6 million with the change of $0.3 million recognized within other income and (expense), net on the Condensed Consolidated Statements of Comprehensive Income. Refer to Note 10: Derivatives and Fair Value Measurements for further discussion of the embedded derivative.
The 2028 Notes contain customary covenants that, among other things, limit, subject to certain exceptions, our ability, and the ability of our restricted subsidiaries, to incur additional indebtedness, pay dividends on our capital stock or repurchase our capital stock, make investments, sell assets, engage in acquisitions, mergers, or consolidations, or create liens or use assets as security in other transactions. Subject to certain exceptions, JT Ryerson may only pay dividends to Ryerson Holding to
During the extentfirst three months of 50%2020, a principal amount of future net income, once prior losses are offset.
The net proceeds from the issuance$54.6 million of the 2022 Notes along with borrowings under the Ryerson Credit Facility, were used to (i) repurchase and/or redeem in full the $569.9 million balance of JT Ryerson’s 9% Senior Secured Notes due 2017 (the “2017 Notes”), plus accrued and unpaid interest thereon up to, but not including, the repayment date, (ii) repurchase $95 million of the 11.25% Senior Secured Notes due 2018 (the “2018 Notes”), and (iii) pay related fees, expenses and premiums.
The Company applied the provisions of ASC 470-50, “Modifications and Extinguishments” in accounting for the issuance of the 2022 Notes, redemption of the 2017 Notes and partial repurchase of the 2018 Notes. The evaluation of the accounting under ASC 470-50 was performed on a creditor by creditor basis in order to determine if the terms of the debt were substantially different and, as a result, whether to apply modification or extinguishment accounting. For the lenders where it was determined that the terms of the debt were not substantially different, modification accounting was applied. For the remaining lenders, extinguishment accounting was applied. In connection with this debt modification and extinguishment, the Company recorded a $16.0 million loss within other income and (expense), net on the Condensed Consolidated Statement of Comprehensive Income during 2016, primarily attributed to the costs incurred with third parties for arrangement fees, legal and other services related to the modified debt, as well as redemption
fees paid to the creditors and unamortized debt issuance costs written off related to the extinguished debt. Additionally, the costs incurred with third parties for arrangement fees, legal and other services related to the extinguished debt and redemption fees paid to the creditors related to the modified debt were capitalized and are being amortized over the life of the modified debt using the effective interest method.
During the first nine months of 2016, a principal amount of $27.0 million of the 2018 Notes were repurchased for $18.2$53.8 million and retired, resulting in the recognition of an $8.8a $0.8 million gain within other income and (expense), net on the Condensed Consolidated Statement of Comprehensive Income. Including the $16.0 million loss on the redemption of the $569.9 million balance of the 2017 Notes and repurchase of $95.0 million of the 2018 Notes, the Company recognized a total net loss of $7.2 million within other income and (expense), net on the Condensed Consolidated Statement of Comprehensive Income during the first nine months of 2016.
Foreign Debt
At September 30, 2017,March 31, 2021, Ryerson China’s foreign borrowings were $19.5$16.3 million, which were owed to banks in Asia at a weighted average interest rate of 3.9%3.8% per annum and secured by inventory and property, plant, and equipment. At December 31, 2016,2020, Ryerson China’s foreign borrowings were $19.2$12.1 million, which were owed to banks in Asiaat a weighted average interest rate of 4.4%3.6% per annum and secured by inventory and property, plant, and equipment.
Availability under the foreign credit lines was $26$31 million and $35 million at September 30, 2017March 31, 2021 and December 31, 2016.2020, respectively. Letters of credit issued by our foreign subsidiaries were $5 million and $6 million at September 30, 2017March 31, 2021 and December 31, 2016.2020, respectively.
NOTE 7:8: EMPLOYEE BENEFITS
The following table summarizes the components of net periodic benefit cost (credit) cost for the three months ended March 31, 2021 and nine month periods ended September 30, 2017 and 20162020 for the Ryerson pension plans and postretirement benefitsbenefit plans other than pension:
|
| Three Months Ended September 30, |
| |||||||||||||
|
| Pension Benefits |
|
| Other Benefits |
| ||||||||||
|
| 2017 |
|
| 2016 |
|
| 2017 |
|
| 2016 |
| ||||
|
| (In millions) |
| |||||||||||||
Components of net periodic benefit (credit) cost |
|
|
|
|
|
|
|
|
|
|
|
|
|
|
|
|
Interest cost |
| $ | 6 |
|
| $ | 8 |
|
| $ | 1 |
|
| $ | 1 |
|
Expected return on assets |
|
| (10 | ) |
|
| (12 | ) |
|
| — |
|
|
| — |
|
Recognized actuarial (gain) loss |
|
| 4 |
|
|
| 3 |
|
|
| (2 | ) |
|
| (2 | ) |
Amortization of prior service credit |
|
| — |
|
|
| — |
|
|
| (1 | ) |
|
| (1 | ) |
Net periodic benefit credit |
| $ | — |
|
| $ | (1 | ) |
| $ | (2 | ) |
| $ | (2 | ) |
|
| Nine Months Ended September 30, |
|
| Three Months Ended March 31, |
| ||||||||||||||||||||||||||
|
| Pension Benefits |
|
| Other Benefits |
|
| Pension Benefits |
|
| Other Benefits |
| ||||||||||||||||||||
|
| 2017 |
|
| 2016 |
|
| 2017 |
|
| 2016 |
|
| 2021 |
|
| 2020 |
|
| 2021 |
|
| 2020 |
| ||||||||
|
| (In millions) |
|
| (In millions) |
| ||||||||||||||||||||||||||
Components of net periodic benefit (credit) cost |
|
|
|
|
|
|
|
|
|
|
|
|
|
|
|
| ||||||||||||||||
Components of net periodic benefit cost (credit) |
|
|
|
|
|
|
|
|
|
|
|
|
|
|
|
| ||||||||||||||||
Service cost |
| $ | 1 |
|
| $ | 1 |
|
| $ | — |
|
| $ | — |
|
| $ | 0.9 |
|
| $ | 0.8 |
|
| $ | 0.1 |
|
| $ | 0.1 |
|
Interest cost |
|
| 19 |
|
|
| 22 |
|
|
| 2 |
|
|
| 2 |
|
|
| 3.0 |
|
|
| 5.2 |
|
|
| 0.3 |
|
|
| 0.4 |
|
Expected return on assets |
|
| (31 | ) |
|
| (34 | ) |
|
| — |
|
|
| — |
|
|
| (5.9 | ) |
|
| (8.1 | ) |
|
| — |
|
|
| — |
|
Settlement charge |
|
| 0.2 |
|
|
| 0.4 |
|
|
| — |
|
|
| — |
| ||||||||||||||||
Recognized actuarial (gain) loss |
|
| 11 |
|
|
| 9 |
|
|
| (6 | ) |
|
| (6 | ) |
|
| 3.9 |
|
|
| 4.2 |
|
|
| (1.5 | ) |
|
| (1.7 | ) |
Amortization of prior service credit |
|
| — |
|
|
| — |
|
|
| (2 | ) |
|
| (2 | ) |
|
| — |
|
|
| — |
|
|
| (0.1 | ) |
|
| (0.5 | ) |
Net periodic benefit credit |
| $ | — |
|
| $ | (2 | ) |
| $ | (6 | ) |
| $ | (6 | ) | ||||||||||||||||
Net periodic benefit cost (credit) |
| $ | 2.1 |
|
| $ | 2.5 |
|
| $ | (1.2 | ) |
| $ | (1.7 | ) | ||||||||||||||||
Effective May 19, 2017, the Company froze the benefits accrued under a portionComponents of its definednet periodic benefit pension plan for certain wage employees. The freeze impacted a significant number of active accruing participants, therefore, curtailment accounting was requiredcost (credit), excluding service cost, are included in Other income and the pension plan was remeasured as of May 31, 2017. The remeasurement resulted(expense), net in a curtailment loss of $0.1 million, which was recorded within warehousing, delivery, selling, general and administrative expense within the condensedour Condensed Consolidated Statement of Comprehensive Income. As a result of the remeasurement, the discount rate decreased from 4.14% to 3.86% and the expected long-term rate of return on pension assets increased from 6.75% to 6.95% due to improved expectations of returns on pension assets. See our Annual Report on form 10-K for further information on these assumptions.
The Company has contributed $16$17 millionto the pension plan fundfunds through the ninethree months ended September 30, 2017March 31, 2021, and anticipates that it will have a minimum required pension contribution funding of approximately $5 million for the remaining threenine months of 2017.2021. The expected future contributions reflect recent pension funding relief measures under the American Rescue Plan Act (“ARPA”) passed in March 2021. We will continue to monitor and updated our expected future contributions as further guidance related to ARPA is released.
NOTE 8:9: COMMITMENTS AND CONTINGENCIES
In October 2011, the United States Environmental Protection Agency (the “EPA”) named usJT Ryerson as one of more than 100 businesses that may be a potentially responsible party (“PRP”) for the Portland Harbor Superfund Site (the “PHS Site”). On January 6, 2017, the EPA issued itsan initial Record of Decision (“ROD”) regarding the site. The ROD includes a combination of dredging, capping, and enhanced natural recovery that would take approximately thirteen years to construct plus additional time for monitored natural recovery, at an estimated present value cost of $1.05 billion. In a change from its prior stance, at a December 4, 2018 meeting with the Portland Harbor Participation and Common Interest Group (“PCI Group”), of which JTR is a member, the EPA indicated that it expected PRPs to submit a plan during 2019 to start remediation of the river and harbor per the original ROD within the next two to three years. The EPA also indicated that it expected allocation of amounts among the parties to be determined in the same two to three-year time frame. The EPA invited certain PRPs to a May 2, 2019 meeting to discuss starting the remedial design process. The EPA did not include JT Ryerson in those meetings.
The EPA met with various PRPs throughout 2019 and 2020 regarding remedial design. Included in those meetings was Schnitzer Steel, which is developing a remedial design plan for the river area which includes the area where the former JT Ryerson facilities were located. The EPA did not include JT Ryerson in those meetings. Schnitzer’s 2020 disclosures acknowledged that Schnitzer is the legal successor to the prior operators (including JT Ryerson) in the designated area. On February 12, 2021, the EPA announced that one hundred percent (100%) of the PHS Site is now in the active remedial design phase.
The EPA has stated that it is willing to consider de minimis settlements, which JT Ryerson is trying to pursue; however, the EPA has not begun meeting with any of the smaller parties who have requested de minimis or de micromis status, stating that it does not have sufficient information to determine whether any parties meet such criteria and does not intend to begin those considerations until after the remedial design work is completed. It has met with selected parties that we believe to be larger targets. JT Ryerson has not been invited to meet with the EPA. As a result of the ongoing negotiations and filings over the ROD and the EPA’s decision not to meet with smaller parties, we cannot determine how allocations will be made and whether a de minimus settlement can be reached with the EPA.
The PCI Group has engaged a third party to prepare cost estimates for each of the Sediment Management Areas at the site. That work is still in progress and is expected to be completed in the summer of 2021. Once the cost estimates are completed, the voting parties of the PCI Group (which does not include JTR) will likely begin the advocacy process, which is anticipated to be completed sometime in 2022. Once the advocacy process is completed, the Allocation Team will prepare a proposed allocation of costs after which the eventual mediation process in which JTR can participate will likely commence. This is also currently anticipated to occur sometime in 2022 or 2023.
As the EPA has not yet allocated responsibility for the contamination among the potentially responsible parties, including JT Ryerson. WeRyerson, we do not currently have sufficient information available to us to determine whether the ROD will be executed as currently stated, whether and to what extent JT Ryerson may be held responsible for any of the identified contamination, and how much (if any) of the final plan’s costs might ultimately be allocated to JT Ryerson. Therefore, management cannot predict the ultimate outcome of this matter or estimate a range of potential loss at this time.
There are various other claims and pending actions against the Company. The amount of liability, if any, for those claims and actions at September 30, 2017March 31, 2021 is not determinable but, in the opinion of management, such liability, if any, will not have a material adverse effect on the Company’s financial position, results of operations, or cash flows. We maintain liability insurance coverage to assist in protecting our assets from losses arising from or related to activities associated with business operations.
NOTE 9:10: DERIVATIVES AND FAIR VALUE MEASUREMENTS
Derivatives
The Company is exposedmay use derivatives to certain risks relatingpartially offset its business exposure to its ongoing business operations. The primary risks managed by using derivative instruments arecommodity price, foreign currency, and interest rate risk,fluctuations and their related impact on expected future cash flows and certain existing assets and liabilities. However, the Company may choose not to hedge certain exposures for a variety of reasons including, but not limited to, Company policy, accounting considerations, or the prohibitive economic cost of hedging particular exposures. There can be no assurance the hedges will offset more than a portion of the financial impact resulting from movements in commodity pricing, foreign currency risk, and commodity price risk.exchange, or interest rates. Interest rate swaps are entered into to manage interest rate risk associated with the Company’s floating-rate borrowings. We use foreign currency exchange contracts to hedge our Canadian subsidiaries’ variability in cash flows in our Canada, Mexico, and China operations when a payment currency is different from the forecasted payment of currencies other than theour functional currency. From time to time, we may enter into fixed price sales contracts with our customers for certain of our inventory components, and in these instances, wecomponents. We may enter into metal commodity futures and options contracts to reduce volatility in the price of these metals. We may also enter into fixed price natural gas contracts and diesel fuel price swapsderivative contracts to manage the price risk of forecasted purchases of natural gas and diesel fuel.
We have a2 receive variable, pay fixed, interest rate swapswaps to manage the exposure to variable interest rates of the Ryerson Credit Facility. In March 2017,June 2019, we entered into a forward agreement for $150$60 million of “pay fixed” interest at 1.658%, “receive variable”1.729% through June 2022 and in November 2019, we entered into a forward agreement for $100 million of “pay fixed” interest rate swap to manageat 1.539% through November 2022. Upon entering into the risk of increasing variable interest rates. Theswaps, the interest rate reset dates and critical terms matchmatched the terms of our existing debt and anticipated critical terms of future debt under the Old Credit Facility, however, this was no longer the case once the Ryerson Credit Facility.Facility was amended on November 5, 2020. As such, effective November 1, 2020 the Company de-designated its interest rate swaps and terminated its hedge accounting treatment. Prior to de-designation, the Company marked these interest rate swaps to market with changes in fair value being recorded in accumulated other comprehensive income. Subsequent to de-designation, changes in fair value are recorded in current earnings. The unrealized loss on the hedges as of the de-designation date remains in accumulated other comprehensive income and is being amortized into earnings as the forecasted interest payments affect earnings. The fair value of the interest rate swapswaps as of September 30, 2017March 31, 2021 was zero. a net liability of $3.4 million.
The Company currently does not account for its commodity contracts and foreign exchange derivative contracts as hedges but rather marks them to market with a corresponding offset to current earnings. The Company accounts for its interest rate swap ashas made an accounting policy election to offset the fair value of derivative liabilities with related cash collateral. As of March 31, 2021, and December 31, 2020, the Company had a cash flow hedgebalance of floating-rate borrowings with changes in fair value being recorded in accumulated other comprehensive income.0 held by the counterparty.
The Company regularly reviews the creditworthiness of its derivative counterparties and does not expect to incur a significant loss from the failure of any counterparties to perform under any agreements.
In connection with the redemption options under the 2028 Notes, the Company recorded an embedded derivative in other current assets on its Condensed Consolidated Balance Sheet, with the offset to other income and (expense), net within the Condensed Consolidated Statement of Comprehensive Income, see Note 7: Long-term debt, for further details. Embedded derivatives are separated from the host contract and carried at fair value when: (a) the embedded derivative possesses economic characteristics that are not clearly and closely related to the economic characteristics of the host contract; (b) the instrument is not measured at fair value under other applicable GAAP standards, and (c) a separate, stand-alone instrument with the same terms would qualify as a derivative instrument. The Company has concluded that the embedded derivative within the 2028 Notes met these criteria and, as such, must be valued separate and apart from the 2028 Notes at fair value each reporting period.
The following table summarizes the location and fair value amount of our derivative instruments reported in our Condensed Consolidated Balance Sheets as of September 30, 2017March 31, 2021 and December 31, 2016:2020:
|
| Asset Derivatives |
|
| Liability Derivatives |
| ||||||||||||||||||||||||||||||||||
|
| Balance Sheet Location |
| September 30, 2017 |
|
| December 31, 2016 |
|
| Balance Sheet Location |
| September 30, 2017 |
|
| December 31, 2016 |
|
| Asset Derivatives |
|
| Liability Derivatives |
| ||||||||||||||||||
|
| (In millions) |
|
| Balance Sheet Location |
| March 31, 2021 |
|
| December 31, 2020 |
|
| Balance Sheet Location |
| March 31, 2021 |
|
| December 31, 2020 |
| |||||||||||||||||||||
Derivatives not designated as hedging instruments under ASC 815 |
|
|
|
|
|
|
|
|
|
|
|
|
|
|
|
|
|
|
|
|
| (In millions) |
| |||||||||||||||||
Metal commodity contracts |
| Prepaid expenses and other current assets |
| $ | 31.4 |
|
| $ | 16.0 |
|
| Other accrued liabilities |
| $ | 36.9 |
|
| $ | 11.9 |
| ||||||||||||||||||||
2028 Notes embedded derivative |
| Prepaid expenses and other current assets |
|
| 2.6 |
|
|
| 2.3 |
|
| Other accrued liabilities |
|
| — |
|
|
| — |
| ||||||||||||||||||||
Foreign exchange contracts |
| Prepaid expenses and other current assets |
| $ | — |
|
| $ | — |
|
| Other accrued liabilities |
| $ | 0.1 |
|
| $ | — |
|
| Prepaid expenses and other current assets |
|
| — |
|
|
| — |
|
| Other accrued liabilities |
|
| 0.1 |
|
|
| 0.2 |
|
Metal commodity contracts |
| Prepaid expenses and other current assets |
|
| 2.2 |
|
|
| 2.0 |
|
| Other accrued liabilities |
|
| 2.3 |
|
|
| 0.2 |
| ||||||||||||||||||||
Interest rate swaps |
| Deferred charges and other assets |
|
| — |
|
|
| — |
|
| Other noncurrent liabilities |
|
| 3.4 |
|
|
| 4.0 |
| ||||||||||||||||||||
Total derivatives |
|
|
| $ | 2.2 |
|
| $ | 2.0 |
|
|
|
| $ | 2.4 |
|
| $ | 0.2 |
|
|
|
| $ | 34.0 |
|
| $ | 18.3 |
|
|
|
| $ | 40.4 |
|
| $ | 16.1 |
|
AsThe following table presents the volume of September 30, 2017the Company’s activity in derivative instruments as of March 31, 2021 and December 31, 2016, the Company’s foreign currency exchange contracts had a U.S. dollar notional amount of $2.1 million and $2.3 million, respectively. As of September 30, 2017 and December 31, 2016, the Company had 517 tons and 296 tons, respectively, of nickel swap contracts related to forecasted purchases. As of September 30, 2017 and December 31, 2016, the Company had 8,503 tons and 11,998 tons, respectively, of hot roll coil swap contracts related to forecasted purchases. The Company has aluminum swap contracts related to forecasted purchases, which had a notional amount of 15,717 tons and 8,466 tons as of September 30, 2017 and December 31, 2016, respectively. As of September 30, 2017 and December 31, 2016, the Company has zero gallons and 39,000 gallons, respectively, of diesel fuel swap contracts related to forecasted purchases. The Company had 3,402 tons and zero tons of zinc contracts as of September 30, 2017 and December 31, 2016, respectively. As of September 30, 2017, the Company had a notional amount of $150 million of the Ryerson Credit Facility hedged by an interest rate swap.2020:
|
| Notional Amount |
|
|
| |||||
Derivative Instruments |
| At March 31, 2021 |
|
| At December 31, 2020 |
|
| Unit of Measurement | ||
Hot roll coil swap contracts |
|
| 133,059 |
|
|
| 125,220 |
|
| Tons |
Aluminum swap contracts |
|
| 15,676 |
|
|
| 20,264 |
|
| Tons |
Nickel swap contracts |
|
| 638 |
|
|
| 345 |
|
| Tons |
Foreign currency exchange contracts |
| 4.8 million |
|
| 7.4 million |
|
| U.S. dollars | ||
Interest rate swap contracts |
| 160 million |
|
| 160 million |
|
| U.S. dollars | ||
The following table summarizes the location and amount of gains and losses on derivatives not designated as hedging instruments reported in our Condensed Consolidated Statements of Comprehensive Income for the three and nine months ended September 30, 2017March 31, 2021 and 2016:2020:
|
|
|
| Amount of Gain/(Loss) Recognized in Income on Derivatives |
|
|
|
| Amount of Gain/(Loss) Recognized in Income on Derivatives |
|
| Amount of Gain/ (Loss) Reclassified from Other Comprehensive Income into Income |
| |||||||||||||||||||||||
Derivatives not designated as hedging instruments |
| Location of Gain/(Loss) Recognized in Income |
| Three Months Ended September 30, |
|
| Nine Months Ended September 30, |
| ||||||||||||||||||||||||||||
under ASC 815 |
| on Derivatives |
| 2017 |
|
| 2016 |
|
| 2017 |
|
| 2016 |
| ||||||||||||||||||||||
|
|
|
| (In millions) |
|
|
|
| Three Months Ended March 31, |
|
| Three Months Ended March 31, |
| |||||||||||||||||||||||
Derivatives not designated as hedging instruments under ASC 815 |
| Location of Gain/(Loss) Recognized in Income on Derivatives |
| 2021 |
|
| 2020 |
|
| 2021 |
|
| 2020 |
| ||||||||||||||||||||||
Metal commodity contracts |
| Cost of materials sold |
| $ | 0.8 |
|
| $ | 1.7 |
|
| $ | 2.6 |
|
| $ | 9.0 |
|
| Cost of materials sold |
| $ | (10.7 | ) |
| $ | (2.0 | ) |
| $ | — |
|
| $ | — |
|
Diesel fuel commodity contracts |
| Warehousing, delivery, selling, general and administrative |
|
| — |
|
|
| — |
|
|
| — |
|
|
| 0.1 |
| ||||||||||||||||||
2028 Notes embedded derivative |
| Other income and (expense), net |
|
| 0.3 |
|
|
| — |
|
|
| — |
|
|
| — |
| ||||||||||||||||||
Foreign exchange contracts |
| Other income and (expense), net |
|
| — |
|
|
| — |
|
|
| (0.1 | ) |
|
| (0.1 | ) |
| Other income and (expense), net |
|
| 0.1 |
|
|
| 0.2 |
|
|
| — |
|
|
| — |
|
Interest rate swaps |
| Interest and other expense on debt |
|
| — |
|
|
| — |
|
|
| (0.5 | ) |
|
| — |
| ||||||||||||||||||
Total |
|
|
| $ | 0.8 |
|
| $ | 1.7 |
|
| $ | 2.5 |
|
| $ | 9.0 |
|
|
|
| $ | (10.3 | ) |
| $ | (1.8 | ) |
| $ | (0.5 | ) |
| $ | — |
|
As of March 31, 2021, the portion of the interest rate swap fair value that would be reclassified into earnings during the next 12 months as interest expense is approximately $2.2 million.
The following table summarizes the location and amount of gains and losses on derivatives designated as hedging instruments reported in our Condensed Consolidated Statements of Comprehensive Income for the three and nine months ended September 30, 2017March 31, 2021 and 2016:2020:
|
|
|
| Amount of Gain/(Loss) Reclassified from Accumulated Other Comprehensive Income into Income |
|
|
|
| Amount of Gain/(Loss) Reclassified from Accumulated Other Comprehensive Income into Income |
| ||||||||||||||||||
Derivatives designated as hedging instruments |
| Location of Gain/(Loss) Recognized in Income |
| Three Months Ended September 30, |
|
| Nine Months Ended September 30, |
|
| Location of Gain/(Loss) Recognized in Income |
| Three Months Ended March 31, |
| |||||||||||||||
under ASC 815 |
| on Derivatives |
| 2017 |
|
| 2016 |
|
| 2017 |
|
| 2016 |
|
| on Derivatives |
| 2021 |
|
| 2020 |
| ||||||
|
|
|
| (In millions) |
|
|
|
| (In millions) |
| ||||||||||||||||||
Interest Rate Swaps |
| Interest and other expense on debt |
| $ | (0.1 | ) |
| $ | — |
|
| $ | (0.5 | ) |
| $ | — |
| ||||||||||
Interest rate swaps |
| Interest and other expense on debt |
| $ | — |
|
| $ | (0.1 | ) | ||||||||||||||||||
As of September 30, 2017, the portion of the interest rate swap fair value that would be reclassified into earnings during the next 12 months as interest expense is approximately $0.3 million.
Fair Value Measurements
To increase consistency and comparability in fair value measurements, ASC 820 establishes a fair value hierarchy that prioritizes the inputs to valuation techniques used to measure fair value into three levels as follows:
| 1. | Level 1 – quoted prices (unadjusted) in active markets for identical assets or liabilities that the Company has the ability to access as of the reporting date. |
| 2. | Level 2 – inputs other than quoted prices included within Level 1 that are directly observable for the asset or liability or indirectly observable through corroboration with observable market data. |
| 3. | Level 3 – unobservable inputs, such as internally-developed pricing models for the asset or liability due to little or no market activity for the asset or liability. |
The following table presents assets and liabilities measured and recorded at fair value on our Condensed Consolidated Balance Sheet on a recurring basis and their level within the fair value hierarchy as of September 30, 2017:March 31, 2021:
|
| At September 30, 2017 |
|
| At March 31, 2021 |
| ||||||||||||||||||
|
| Level 1 |
|
| Level 2 |
|
| Level 3 |
|
| Level 1 |
|
| Level 2 |
|
| Level 3 |
| ||||||
|
| (In millions) |
|
| (In millions) |
| ||||||||||||||||||
Assets |
|
|
|
|
|
|
|
|
|
|
|
|
|
|
|
|
|
|
|
|
|
|
|
|
Prepaid and other current assets: |
|
|
|
|
|
|
|
|
|
|
|
| ||||||||||||
Common stock—available-for-sale investment |
| $ | 0.1 |
|
| $ | — |
|
| $ | — |
| ||||||||||||
Derivatives: |
|
|
|
|
|
|
|
|
|
|
|
|
|
|
|
|
|
|
|
|
|
|
|
|
Derivatives not designated as hedging instruments under ASC 815: |
|
|
|
|
|
|
|
|
|
|
|
|
|
|
|
|
|
|
|
|
|
|
|
|
Metal commodity contracts |
| $ | — |
|
| $ | 2.2 |
|
| $ | — |
|
| $ | — |
|
| $ | 31.4 |
|
| $ | — |
|
2028 Notes embedded derivative |
|
| — |
|
|
| — |
|
|
| 2.6 |
| ||||||||||||
Total derivatives |
| $ | — |
|
| $ | 31.4 |
|
| $ | 2.6 |
| ||||||||||||
Liabilities |
|
|
|
|
|
|
|
|
|
|
|
|
|
|
|
|
|
|
|
|
|
|
|
|
Derivatives: |
|
|
|
|
|
|
|
|
|
|
|
|
|
|
|
|
|
|
|
|
|
|
|
|
Derivatives not designated as hedging instruments under ASC 815: |
|
|
|
|
|
|
|
|
|
|
|
|
|
|
|
|
|
|
|
|
|
|
|
|
Foreign Exchange Contracts |
| $ | — |
|
| $ | 0.1 |
|
| $ | — |
| ||||||||||||
Metal commodity contracts |
|
| — |
|
|
| 2.3 |
|
|
| — |
|
| $ | — |
|
| $ | 36.9 |
|
| $ | — |
|
Total derivatives liabilities |
| $ | — |
|
| $ | 2.4 |
|
| $ | — |
| ||||||||||||
Foreign exchange contracts |
|
| — |
|
|
| 0.1 |
|
|
| — |
| ||||||||||||
Interest rate swaps |
|
| — |
|
|
| 3.4 |
|
|
| — |
| ||||||||||||
Total derivatives |
| $ | — |
|
| $ | 40.4 |
|
| $ | — |
| ||||||||||||
The following table presents assets and liabilities measured and recorded at fair value on our Condensed Consolidated Balance Sheet on a recurring basis and their level within the fair value hierarchy as of December 31, 2016:2020:
|
| At December 31, 2016 |
|
| At December 31, 2020 |
| ||||||||||||||||||
|
| Level 1 |
|
| Level 2 |
|
| Level 3 |
|
| Level 1 |
|
| Level 2 |
|
| Level 3 |
| ||||||
|
| (In millions) |
|
| (In millions) |
| ||||||||||||||||||
Assets |
|
|
|
|
|
|
|
|
|
|
|
|
|
|
|
|
|
|
|
|
|
|
|
|
Prepaid and other current assets: |
|
|
|
|
|
|
|
|
|
|
|
| ||||||||||||
Common stock – available-for-sale investment |
| $ | 0.4 |
|
| $ | — |
|
| $ | — |
| ||||||||||||
Derivatives: |
|
|
|
|
|
|
|
|
|
|
|
|
|
|
|
|
|
|
|
|
|
|
|
|
Derivatives not designated as hedging instruments under ASC 815: |
|
|
|
|
|
|
|
|
|
|
|
|
|
|
|
|
|
|
|
|
|
|
|
|
Metal commodity contracts |
| $ | — |
|
| $ | 2.0 |
|
| $ | — |
|
| $ | — |
|
| $ | 16.0 |
|
| $ | — |
|
2028 Notes embedded derivative |
|
| — |
|
|
| — |
|
|
| 2.3 |
| ||||||||||||
Total derivatives |
| $ | — |
|
| $ | 16.0 |
|
| $ | 2.3 |
| ||||||||||||
Liabilities |
|
|
|
|
|
|
|
|
|
|
|
|
|
|
|
|
|
|
|
|
|
|
|
|
Derivatives: |
|
|
|
|
|
|
|
|
|
|
|
|
|
|
|
|
|
|
|
|
|
|
|
|
Derivatives not designated as hedging instruments under ASC 815: |
|
|
|
|
|
|
|
|
|
|
|
|
|
|
|
|
|
|
|
|
|
|
|
|
Metal commodity contracts |
| $ | — |
|
| $ | 0.2 |
|
| $ | — |
|
| $ | — |
|
| $ | 11.9 |
|
| $ | — |
|
Foreign exchange contracts |
|
| — |
|
|
| 0.2 |
|
|
| — |
| ||||||||||||
Interest rate swaps |
|
| — |
|
|
| 4.0 |
|
|
| — |
| ||||||||||||
Total derivatives |
| $ | — |
|
| $ | 16.1 |
|
| $ | — |
| ||||||||||||
The fair value of each commodity, diesel fuel, and swap derivative contract is determined using Level 2 inputs and the market approach valuation technique, as described in ASC 820. The Company has various commodity derivatives to lock in nickel and zinc prices for varying time periods. The fair value of these derivatives is determined based on the spot price each individual contract was purchased at and compared with the one-month daily average actual spot price on the London Metals Exchange for nickel and zinc on the valuation date. The Company also has commodity derivatives to lock in hot roll coil, diesel fuel, iron ore, nickel, and aluminum prices for varying time periods. The fair value of hot roll coil, diesel fuel, iron ore, nickel, and aluminum derivatives is determined based on the spot price each individual contract was purchased at and compared with the one-month daily average actual spot price on the Chicago Mercantile Exchange (hot roll coil and diesel fuel), the Singapore Exchange (iron ore), and the London Metals Exchange (nickel and aluminum), respectively, for the commodity on the valuation date. The Company has various commodity derivatives to lock in diesel prices for varying time periods. The fair value of these derivatives is determined based on the spot price each individual contract was purchased at and compared with the one-month daily average actual spot price of the Platts Index for Gulf Coast Ultra Low Sulfur Diesel on the valuation date. In addition, the Company has numerous foreign exchange contracts to hedge our Canadian subsidiaries’ variability in cash flows when a payment currency is different from the forecasted payment of currencies other than theour functional currency, the Canadian dollar.currency. The Company defines the fair value of foreign exchange contracts as the amount of the difference between the contracted and current market value at the end of the period. The Company estimates the current market value of foreign exchange contracts by obtaining month-end market quotes of foreign exchange rates and forward rates for contracts with similar terms. The Company uses the exchange rates provided by Reuters. Each commodity and foreign exchange contract term varies in the number of months, but in general, contracts are between 31 to 12 months in length. The fair value of our interest rate swap is based on the sum of all future net present value cash flows for the fixed and floating leg of the swap. The future cash flows are derived based on the terms of our interest rate swap, as well as published discount factors, and projected forward London Interbank Offered Rates.LIBOR rates.
The fair value of the embedded derivative is determined using Level 3 inputs based on the Black-Derman-Toy lattice model and the “with-and-without” approach. This method estimates the value of the 2028 Notes both with and without the embedded derivative. The value of the embedded derivative is the difference between the two methods. The value of the 2028 Notes with the embedded derivative is based on recent trading prices of the 2028 Notes (Level 1 inputs). Determining the value of the 2028 Notes without the embedded derivative requires significant judgements made by management such as the probability of redemption linked transactions occurring, the cash flows expected to be generated from these transactions, as well as the timing of these transactions (Level 3 inputs). The embedded derivative asset balance as of March 31, 2021 and December 31, 2020 was $2.6 million and $2.3 million, respectively. For the three months ended March 31, 2021, a gain of $0.3 million was recorded within other income and (expense), net within the Condensed Consolidated Statement of Comprehensive Income. Changes to the projections made by the Company’s management after March 31, 2021 can affect the future value of this asset.
The changes in financial instruments measured at fair value for which the Company has used Level 3 inputs to determine fair value are as follows:
| 2028 Notes embedded derivative |
| |
| (in millions) |
| |
As of January 1, 2021 | $ | 2.3 |
|
Unrealized gain recorded in net income |
| 0.3 |
|
As of March 31, 2021 | $ | 2.6 |
|
The carrying and estimated fair values of our financial instruments at September 30, 2017March 31, 2021 and December 31, 20162020 were as follows:
|
| At September 30, 2017 |
|
| At December 31, 2016 |
|
| At March 31, 2021 |
|
| At December 31, 2020 |
| ||||||||||||||||||||
|
| Carrying Amount |
|
| Fair Value |
|
| Carrying Amount |
|
| Fair Value |
|
| Carrying Amount |
|
| Fair Value |
|
| Carrying Amount |
|
| Fair Value |
| ||||||||
|
| (In millions) |
|
| (In millions) |
| ||||||||||||||||||||||||||
Cash and cash equivalents |
| $ | 73.6 |
|
| $ | 73.6 |
|
| $ | 80.7 |
|
| $ | 80.7 |
|
| $ | 43.3 |
|
| $ | 43.3 |
|
| $ | 61.4 |
|
| $ | 61.4 |
|
Restricted cash |
|
| 1.3 |
|
|
| 1.3 |
|
|
| 1.0 |
|
|
| 1.0 |
|
|
| 1.1 |
|
|
| 1.1 |
|
|
| 1.1 |
|
|
| 1.1 |
|
Receivables less provision for allowances, claims and doubtful accounts |
|
| 425.4 |
|
|
| 425.4 |
|
|
| 326.0 |
|
|
| 326.0 |
| ||||||||||||||||
Receivables less provisions |
|
| 544.1 |
|
|
| 544.1 |
|
|
| 378.9 |
|
|
| 378.9 |
| ||||||||||||||||
Accounts payable |
|
| 362.5 |
|
|
| 362.5 |
|
|
| 230.4 |
|
|
| 230.4 |
|
|
| 493.2 |
|
|
| 493.2 |
|
|
| 365.1 |
|
|
| 365.1 |
|
Long-term debt, including current portion |
|
| 1,041.6 |
|
|
| 1,120.7 |
|
|
| 963.5 |
|
|
| 1,034.2 |
|
|
| 741.4 |
|
|
| 796.2 |
|
|
| 740.0 |
|
|
| 800.3 |
|
The estimated fair value of the Company’s cash and cash equivalents, restricted cash, receivables less provision for allowances, claims and doubtful accountsprovisions, and accounts payable approximate their carrying amounts due to the short-term nature of these financial instruments. The estimated fair value of the Company’s long-term debt and the current portions thereof is determined by using quoted market prices of Company debt securities (Level 2 inputs).
Assets Held for Sale
The Company had zero and $3.6 million of assets held for sale, classified within “prepaid expenses and other current assets,” as of September 30, 2017 and December 31, 2016, respectively. The fair values less costs to sell of long-lived assets held for sale are assessed each reporting period that they remain classified as held for sale. Any increase or decrease in the held for sale long-lived asset’s fair value less cost to sell is reported as an adjustment to its carrying amount, except that the adjusted carrying amount cannot exceed the carrying amount of the long-lived asset at the time it was initially classified as held for sale. The fair values of each property were determined based on appraisals obtained from a third-party, pending sales contracts, or recent listing agreements with third-party brokerage firms (Level 2 inputs).
The following table presents those assets that were measured and recorded at fair value on our Condensed Consolidated Balance Sheet on a non-recurring basis and their level within the fair value hierarchy at December 31, 2016:
|
| At December 31, 2016 |
| |||||||||
|
| Level 1 |
|
| Level 2 |
|
| Level 3 |
| |||
|
| (In millions) |
| |||||||||
Assets |
|
|
|
|
|
|
|
|
|
|
|
|
Prepaid expenses and other current assets – assets held for sale |
| $ | — |
|
| $ | 3.6 |
|
| $ | — |
|
Available-For-Sale Investments
The Company has classified investments made during 2010 and 2012 as available-for-sale at the time of their purchase. Investments classified as available-for-sale are recorded at fair value with the related unrealized gains and losses included in accumulated other comprehensive income. Management evaluates investments in an unrealized loss position on whether an other-than-temporary impairment has occurred on a periodic basis. Factors considered by management in assessing whether an other-than-temporary impairment has occurred include: the nature of the investment; whether the decline in fair value is attributable to specific adverse conditions affecting the investment; the financial condition of the investee; the severity and the duration of the impairment; and whether we intend to sell the investment or will be required to sell the investment before recovery of its amortized cost basis. When it is determined that an other-than-temporary impairment has occurred, the investment is written down to its market value at the end of the period in which it is determined that an other-than-temporary decline has occurred.
During the second quarter of 2017 the financial condition of the investee declined, therefore, management determined that an other-than-temporary impairment occurred and thus recognized a $0.2 million impairment charge within other income and (expense), net in the second quarter of 2017. As of September 30, 2017, the investment has been in an unrealized loss position from its adjusted cost basis for three months. Management does not currently intend to sell the investment before recovery of its adjusted cost basis. Realized gains and losses are recorded within the Condensed Consolidated Statement of Comprehensive Income upon sale of the security and are based on specific identification.
The Company’s available-for-sale securities as of September 30, 2017 can be summarized as follows:
|
| At September 30, 2017 |
| |||||||||||||
|
| Cost |
|
| Gross Unrealized Gains |
|
| Gross Unrealized Losses |
|
| Fair Value |
| ||||
|
| (In millions) |
| |||||||||||||
Common stock |
| $ | 0.2 |
|
| $ | — |
|
| $ | (0.1 | ) |
| $ | 0.1 |
|
The Company’s available-for-sale securities as of December 31, 2016 can be summarized as follows:
|
| At December 31, 2016 |
| |||||||||||||
|
| Cost |
|
| Gross Unrealized Gains |
|
| Gross Unrealized Losses |
|
| Fair Value |
| ||||
|
| (In millions) |
| |||||||||||||
Common stock |
| $ | 0.4 |
|
| $ | — |
|
| $ | — |
|
| $ | 0.4 |
|
There is no maturity date for these investments and there have been no sales during the nine months ended September 30, 2017.
NOTE 10:11: STOCKHOLDERS’ EQUITY, (DEFICIT), ACCUMULATED OTHER COMPREHENSIVE INCOME (LOSS), AND REDEEMABLE NONCONTROLLING INTEREST
The following table details changes in these accounts:
Ryerson Holding Corporation Stockholders’ Equity accounts for the three months ended March 31, 2021:
|
| Ryerson Holding Corporation Stockholders' Equity (Deficit) |
| |||||||||||||||||||||||||||||||||||||||||
|
|
|
|
|
|
|
|
|
|
|
|
|
|
|
|
|
|
|
|
|
|
|
|
|
| Accumulated Other Comprehensive Income (Loss) |
|
|
|
|
|
|
| |||||||||||
|
| Common Stock |
|
| Treasury Stock |
|
| Capital in Excess of Par Value |
|
| Accumulated Deficit |
|
| Foreign Currency Translation |
|
| Benefit Plan Liabilities |
|
| Unrealized Gain (Loss) on Available- For-Sale Investments |
|
| Non-controlling Interest |
|
| Total Equity |
| |||||||||||||||||
|
| Shares |
|
| Dollars |
|
| Shares |
|
| Dollars |
|
| Dollars |
|
| Dollars |
|
| Dollars |
|
| Dollars |
|
| Dollars |
|
| Dollars |
|
| Dollars |
| |||||||||||
|
| (In millions, except shares in thousands) |
| |||||||||||||||||||||||||||||||||||||||||
Balance at January 1, 2017 |
|
| 37,345 |
|
| $ | 0.4 |
|
|
| 213 |
|
| $ | (6.6 | ) |
| $ | 375.4 |
|
| $ | (112.2 | ) |
| $ | (50.2 | ) |
| $ | (258.7 | ) |
| $ | 1.1 |
|
| $ | 1.5 |
|
| $ | (49.3 | ) |
Net income |
|
| — |
|
|
| — |
|
|
| — |
|
|
| — |
|
|
| — |
|
|
| 17.1 |
|
|
| — |
|
|
| — |
|
|
| — |
|
|
| 0.6 |
|
|
| 17.7 |
|
Foreign currency translation |
|
| — |
|
|
| — |
|
|
| — |
|
|
| — |
|
|
| — |
|
|
| — |
|
|
| 5.5 |
|
|
| — |
|
|
| — |
|
|
| 0.3 |
|
|
| 5.8 |
|
Gain on intra-entity foreign currency transactions |
|
| — |
|
|
| — |
|
|
| — |
|
|
| — |
|
|
| — |
|
|
| — |
|
|
| 3.6 |
|
|
| — |
|
|
| — |
|
|
| — |
|
|
| 3.6 |
|
Changes in defined benefit pension and other post-retirement benefit plans, net of tax of $3.9 |
|
| — |
|
|
| — |
|
|
| — |
|
|
| — |
|
|
| — |
|
|
| — |
|
|
| — |
|
|
| 6.4 |
|
|
| — |
|
|
| — |
|
|
| 6.4 |
|
Unrealized loss on available-for-sale investment, net of tax of $0.1 |
|
| — |
|
|
| — |
|
|
| — |
|
|
| — |
|
|
| — |
|
|
| — |
|
|
| — |
|
|
| — |
|
|
| (0.2 | ) |
|
| — |
|
|
| (0.2 | ) |
Other than temporary impairment, net of tax of $0.1 |
|
| — |
|
|
| — |
|
|
| — |
|
|
| — |
|
|
| — |
|
|
| — |
|
|
| — |
|
|
| — |
|
|
| 0.1 |
|
|
| — |
|
|
| 0.1 |
|
Stock-based compensation expense |
|
| 76 |
|
|
| — |
|
|
| — |
|
|
| — |
|
|
| 1.5 |
|
|
| — |
|
|
| — |
|
|
| — |
|
|
| — |
|
|
| — |
|
|
| 1.5 |
|
Balance at September 30, 2017 |
|
| 37,421 |
|
| $ | 0.4 |
|
|
| 213 |
|
| $ | (6.6 | ) |
| $ | 376.9 |
|
| $ | (95.1 | ) |
| $ | (41.1 | ) |
| $ | (252.3 | ) |
| $ | 1.0 |
|
| $ | 2.4 |
|
| $ | (14.4 | ) |
|
|
|
|
|
|
|
|
|
|
|
|
|
|
|
|
|
|
|
|
|
|
|
|
|
| Accumulated Other Comprehensive Income (Loss) |
|
|
|
|
|
|
|
|
| |||||||||
|
| Common Stock |
|
| Treasury Stock |
|
| Capital in Excess of Par Value |
|
| Retained Earnings |
|
| Foreign Currency Translation |
|
| Benefit Plan Liabilities |
|
| Interest Rate Swap |
|
| Non-controlling Interest |
|
| Total Equity |
| |||||||||||||||||
|
| Shares |
|
| Dollars |
|
| Shares |
|
| Dollars |
|
| Dollars |
|
| Dollars |
|
| Dollars |
|
| Dollars |
|
| Dollars |
|
| Dollars |
|
| Dollars |
| |||||||||||
|
| (In millions, except shares in thousands) |
| |||||||||||||||||||||||||||||||||||||||||
Balance at January 1, 2021 |
|
| 38,330 |
|
| $ | 0.4 |
|
|
| 213 |
|
| $ | (6.6 | ) |
| $ | 383.1 |
|
| $ | 33.8 |
|
| $ | (47.0 | ) |
| $ | (221.8 | ) |
| $ | (3.1 | ) |
| $ | 6.3 |
|
| $ | 145.1 |
|
Net income |
|
| — |
|
|
| — |
|
|
| — |
|
|
| — |
|
|
| — |
|
|
| 25.3 |
|
|
| — |
|
|
| — |
|
|
| — |
|
|
| 0.3 |
|
|
| 25.6 |
|
Foreign currency translation |
|
| — |
|
|
| — |
|
|
| — |
|
|
| — |
|
|
| — |
|
|
| — |
|
|
| 0.1 |
|
|
| — |
|
|
| — |
|
|
| (0.1 | ) |
|
| — |
|
Changes in defined benefit pension and other post-retirement benefit plans, net of tax of $0.5 |
|
| — |
|
|
| — |
|
|
| — |
|
|
| — |
|
|
| — |
|
|
| — |
|
|
| — |
|
|
| 2.0 |
|
|
| — |
|
|
| — |
|
|
| 2.0 |
|
Stock-based compensation expense |
|
| — |
|
|
| — |
|
|
| — |
|
|
| — |
|
|
| 1.6 |
|
|
| — |
|
|
| — |
|
|
| — |
|
|
| — |
|
|
| — |
|
|
| 1.6 |
|
Interest rate swap, net of tax of $0.1 |
|
| — |
|
|
| — |
|
|
| — |
|
|
| — |
|
|
| — |
|
|
| — |
|
|
| — |
|
|
| — |
|
|
| 0.4 |
|
|
| — |
|
|
| 0.4 |
|
Balance at March 31, 2021 |
|
| 38,330 |
|
| $ | 0.4 |
|
|
| 213 |
|
| $ | (6.6 | ) |
| $ | 384.7 |
|
| $ | 59.1 |
|
| $ | (46.9 | ) |
| $ | (219.8 | ) |
| $ | (2.7 | ) |
| $ | 6.5 |
|
| $ | 174.7 |
|
The following table details changes in Ryerson Holding Corporation Stockholders’ Equity accounts for the three months ended March 31, 2020:
|
|
|
|
|
|
|
|
|
|
|
|
|
|
|
|
|
|
|
|
|
|
|
|
|
| Accumulated Other Comprehensive Income (Loss) |
|
|
|
|
|
|
|
|
| |||||||||
|
| Common Stock |
|
| Treasury Stock |
|
| Capital in Excess of Par Value |
|
| Retained Earnings |
|
| Foreign Currency Translation |
|
| Benefit Plan Liabilities |
|
| Cash Flow Hedge- Interest Rate Swap |
|
| Non-controlling Interest |
|
| Total Equity |
| |||||||||||||||||
|
| Shares |
|
| Dollars |
|
| Shares |
|
| Dollars |
|
| Dollars |
|
| Dollars |
|
| Dollars |
|
| Dollars |
|
| Dollars |
|
| Dollars |
|
| Dollars |
| |||||||||||
|
| (In millions, except shares in thousands) |
| |||||||||||||||||||||||||||||||||||||||||
Balance at January 1, 2020 |
|
| 37,996 |
|
| $ | 0.4 |
|
|
| 213 |
|
| $ | (6.6 | ) |
| $ | 381.2 |
|
| $ | 99.6 |
|
| $ | (48.6 | ) |
| $ | (253.1 | ) |
| $ | (0.3 | ) |
| $ | 6.0 |
|
| $ | 178.6 |
|
Net income |
|
| — |
|
|
| — |
|
|
| — |
|
|
| — |
|
|
| — |
|
|
| 16.4 |
|
|
| — |
|
|
| — |
|
|
| — |
|
|
| — |
|
|
| 16.4 |
|
Foreign currency translation |
|
| — |
|
|
| — |
|
|
| — |
|
|
| — |
|
|
| — |
|
|
| — |
|
|
| (8.5 | ) |
|
| — |
|
|
| — |
|
|
| — |
|
|
| (8.5 | ) |
Changes in defined benefit pension and other post-retirement benefit plans, net of tax of $0.6 |
|
| — |
|
|
| — |
|
|
| — |
|
|
| — |
|
|
| — |
|
|
| — |
|
|
| — |
|
|
| 1.8 |
|
|
| — |
|
|
| — |
|
|
| 1.8 |
|
Stock-based compensation expense |
|
| — |
|
|
| — |
|
|
| — |
|
|
| — |
|
|
| 0.6 |
|
|
| — |
|
|
| — |
|
|
| — |
|
|
| — |
|
|
| — |
|
|
| 0.6 |
|
Cash flow hedge - interest rate swap, net of tax of $1.2 |
|
| — |
|
|
| — |
|
|
| — |
|
|
| — |
|
|
| — |
|
|
| — |
|
|
| — |
|
|
| — |
|
|
| (3.5 | ) |
|
| — |
|
|
| (3.5 | ) |
Balance at March 31, 2020 |
|
| 37,996 |
|
| $ | 0.4 |
|
|
| 213 |
|
| $ | (6.6 | ) |
| $ | 381.8 |
|
| $ | 116.0 |
|
| $ | (57.1 | ) |
| $ | (251.3 | ) |
| $ | (3.8 | ) |
| $ | 6.0 |
|
| $ | 185.4 |
|
The following table details changes in accumulated other comprehensive income (loss), net of tax, for the ninethree months ended September 30, 2017:
March 31, 2021:
|
| Changes in Accumulated Other Comprehensive Income (Loss) by Component |
| |||||||||||||
|
| Foreign Currency Translation |
|
| Benefit Plan Liabilities |
|
| Available- For-Sale Investments |
|
| Cash Flow Hedge - Interest Rate Swap |
| ||||
|
| (In millions) |
| |||||||||||||
Balance at January 1, 2017 |
| $ | (50.2 | ) |
| $ | (258.7 | ) |
| $ | 1.1 |
|
| $ | — |
|
Other comprehensive income (loss) before reclassifications |
|
| 9.1 |
|
|
| 7.8 |
|
|
| (0.2 | ) |
|
| (0.3 | ) |
Amounts reclassified from accumulated other comprehensive income (loss) |
|
| — |
|
|
| (1.4 | ) |
|
| 0.1 |
|
|
| 0.3 |
|
Net current-period other comprehensive income (loss) |
|
| 9.1 |
|
|
| 6.4 |
|
|
| (0.1 | ) |
|
| — |
|
Balance at September 30, 2017 |
| $ | (41.1 | ) |
| $ | (252.3 | ) |
| $ | 1.0 |
|
| $ | — |
|
|
| Changes in Accumulated Other Comprehensive Income (Loss) by Component, net of tax |
| |||||||||
|
| Foreign Currency Translation |
|
| Benefit Plan Liabilities |
|
| Interest Rate Swap |
| |||
|
| (In millions) |
| |||||||||
Balance at January 1, 2021 |
| $ | (47.0 | ) |
| $ | (221.8 | ) |
| $ | (3.1 | ) |
Other comprehensive income before reclassifications |
|
| 0.1 |
|
|
| — |
|
|
| — |
|
Amounts reclassified from accumulated other comprehensive income into net income |
|
| — |
|
|
| 2.0 |
|
|
| 0.4 |
|
Net current-period other comprehensive income |
|
| 0.1 |
|
|
| 2.0 |
|
|
| 0.4 |
|
Balance at March 31, 2021 |
| $ | (46.9 | ) |
| $ | (219.8 | ) |
| $ | (2.7 | ) |
The following table details the reclassifications out of accumulated other comprehensive income (loss) for the three and nine month periods ended September 30, 2017:
|
| Reclassifications Out of Accumulated Other Comprehensive Income (Loss) | ||||||||
|
| Amount reclassified from Accumulated |
|
|
| |||||
|
| Other Comprehensive Income (Loss) |
|
|
| |||||
|
| Three Months Ended |
|
| Nine Months Ended |
|
| Affected line item in the Condensed | ||
Details about Accumulated Other |
| September 30, 2017 |
|
| Consolidated Statements of | |||||
Comprehensive Income (Loss) Components |
| (In millions) |
|
| Comprehensive Income | |||||
Other-than-temporary impairment |
|
|
|
|
|
|
|
|
|
|
Other-than-temporary impairment charge |
| $ | — |
|
| $ | 0.2 |
|
| Other income and (expense), net |
Tax benefit |
|
| — |
|
|
| (0.1 | ) |
|
|
Net of tax |
| $ | — |
|
| $ | 0.1 |
|
|
|
Cash flow hedge - interest rate swap |
|
|
|
|
|
|
|
|
|
|
Realized swap interest loss |
| $ | 0.1 |
|
| $ | 0.5 |
|
| Interest and other expense on debt |
Tax benefit |
|
| (0.1 | ) |
|
| (0.2 | ) |
|
|
Net of tax |
| $ | — |
|
| $ | 0.3 |
|
|
|
Amortization of defined benefit pension and other post- retirement benefit plan items |
|
|
|
|
|
|
|
|
|
|
Actuarial (gain) loss |
| $ | 1.9 |
|
| $ | (0.2 | ) |
| Warehousing, delivery, selling, general and administrative |
Prior service credits |
|
| (0.8 | ) |
|
| (2.3 | ) |
| Warehousing, delivery, selling, general and administrative |
Total before tax |
|
| 1.1 |
|
|
| (2.5 | ) |
|
|
Tax provision (benefit) |
|
| (0.3 | ) |
|
| 1.1 |
|
|
|
Net of tax |
| $ | 0.8 |
|
| $ | (1.4 | ) |
|
|
The following table details the reclassifications out of accumulated other comprehensive income (loss) for the three months ended March 31, 2021:
|
| Reclassifications Out of Accumulated Other Comprehensive Income (Loss) | ||||||||
|
| Amount reclassified from Accumulated |
|
|
| |||||
|
| Other Comprehensive Income (Loss) |
|
|
| |||||
|
| Three Months Ended |
|
| Affected line item in the Consolidated | |||||
Details about Accumulated Other |
| March 31, 2021 |
|
| March 31, 2020 |
|
| Statements of | ||
Comprehensive Income (Loss) Components |
| (In millions) |
|
| Operations / Consolidated Balance Sheets | |||||
Amortization of defined benefit pension and other post-retirement benefit plan items |
|
|
|
|
|
|
|
|
|
|
Actuarial loss |
| $ | 2.4 |
|
| $ | 2.5 |
|
| Other income and (expense), net |
Pension settlement |
|
| 0.2 |
|
|
| 0.4 |
|
| Other income and (expense), net |
Prior service credits |
|
| (0.1 | ) |
|
| (0.5 | ) |
| Other income and (expense), net |
Total before tax |
|
| 2.5 |
|
|
| 2.4 |
|
|
|
Tax benefit |
|
| (0.5 | ) |
|
| (0.6 | ) |
|
|
Net of tax |
| $ | 2.0 |
|
| $ | 1.8 |
|
|
|
Cash flow hedge - Interest rate swap |
|
|
|
|
|
|
|
|
|
|
Realized swap interest (prior to de-designation) |
| $ | — |
|
| $ | 0.1 |
|
| Interest and other expense on debt |
Realized swap interest (subsequent to de-designation) |
|
| 0.5 |
|
|
| — |
|
| Interest and other expense on debt |
Tax benefit |
|
| (0.1 | ) |
|
| — |
|
|
|
Net of tax |
| $ | 0.4 |
|
| $ | 0.1 |
|
|
|
NOTE 12: REVENUE RECOGNITION
We are a leading value-added processor and nine month periods ended September 30, 2016:distributor of industrial metals with operations in the United States, Canada, Mexico, and China. We purchase large quantities of metal products from primary producers and sell these materials in smaller quantities to a wide variety of metals-consuming industries. More than 75% of the metals products sold are processed by us by bending, beveling, blanking, blasting, burning, cutting-to-length, drilling, embossing, flattening, forming, grinding, laser cutting, machining, notching, painting, perforating, polishing, punching, rolling, sawing, scribing, shearing, slitting, stamping, tapping, threading, welding, or other techniques to process materials to a specified thickness, length, width, shape, and surface quality pursuant to specific customer orders.
Disaggregated Revenue
We have 1 operating and reportable segment, metals service centers.
The Company derives substantially all of its sales from the distribution of metals. The following table shows the Company’s percentage of sales by major product line:
|
| Reclassifications Out of Accumulated Other Comprehensive Income (Loss) | ||||||||
|
| Amount reclassified from Accumulated |
|
|
| |||||
|
| Other Comprehensive Income (Loss) |
|
|
| |||||
|
| Three Months Ended |
|
| Nine Months Ended |
|
| Affected line item in the Condensed | ||
Details about Accumulated Other |
| September 30, 2016 |
|
| Consolidated Statements of | |||||
Comprehensive Income (Loss) Components |
| (In millions) |
|
| Comprehensive Income | |||||
Other-than-temporary impairment |
|
|
|
|
|
|
|
|
|
|
Other-than-temporary impairment charge |
| $ | — |
|
| $ | 2.8 |
|
| Other income and (expense), net |
Tax benefit |
|
| — |
|
|
| (1.1 | ) |
|
|
Net of tax |
| $ | — |
|
| $ | 1.7 |
|
|
|
Amortization of defined benefit pension and other post- retirement benefit plan items |
|
|
|
|
|
|
|
|
|
|
Actuarial loss |
| $ | 1.1 |
|
| $ | 3.4 |
|
| Warehousing, delivery, selling, general and administrative |
Prior service credits |
|
| (0.7 | ) |
|
| (2.2 | ) |
| Warehousing, delivery, selling, general and administrative |
Total before tax |
|
| 0.4 |
|
|
| 1.2 |
|
|
|
Tax benefit |
|
| (0.1 | ) |
|
| (0.4 | ) |
|
|
Net of tax |
| $ | 0.3 |
|
| $ | 0.8 |
|
|
|
|
| Three Months Ended |
| |||||
|
| March 31, |
| |||||
Product Line |
| 2021 |
|
| 2020 |
| ||
Carbon Steel Flat |
|
| 29 | % |
|
| 25 | % |
Carbon Steel Plate |
|
| 9 |
|
|
| 10 |
|
Carbon Steel Long |
|
| 14 |
|
|
| 16 |
|
Stainless Steel Flat |
|
| 17 |
|
|
| 16 |
|
Stainless Steel Plate |
|
| 5 |
|
|
| 5 |
|
Stainless Steel Long |
|
| 4 |
|
|
| 5 |
|
Aluminum Flat |
|
| 14 |
|
|
| 14 |
|
Aluminum Plate |
|
| 2 |
|
|
| 3 |
|
Aluminum Long |
|
| 4 |
|
|
| 5 |
|
Other |
|
| 2 |
|
|
| 1 |
|
Total |
|
| 100 | % |
|
| 100 | % |
A significant majority of the Company’s sales are attributable to its U.S. operations. The only operations attributed to foreign countries relate to the Company’s subsidiaries in Canada, China, and Mexico. The following table summarizes consolidated financial information of our operations by geographic location based on where sales originated:
| Three Months Ended March 31, |
| |||||
| 2021 |
|
| 2020 |
| ||
Net Sales | (In millions) |
| |||||
United States |
| 1,025.7 |
|
| $ | 913.5 |
|
Foreign countries |
| 121.6 |
|
|
| 96.8 |
|
Total | $ | 1,147.3 |
|
| $ | 1,010.3 |
|
Revenue is recognized either at a point in time or over time based on if the contract has an enforceable right to payment and the type of product that is being sold to the customer, with products that are determined to have no alternative use being recognized over time. The following table summarizes revenues by the type of item sold:
|
| Three Months Ended March 31, |
| |||||
Timing of Revenue Recognition |
| 2021 |
|
| 2020 |
| ||
Revenue on products with an alternative use |
|
| 90 | % |
|
| 88 | % |
Revenue on products with no alternative use |
|
| 10 |
|
|
| 12 |
|
Total |
|
| 100 | % |
|
| 100 | % |
Contract Balances
A receivable is recognized in the period in which an invoice is issued, which is generally when the product is delivered to the customer. Payment terms on invoiced amounts are typically 30 days from the invoice date. We do not have any contracts with significant financing components.
Receivables, which are included in accounts receivables within the Condensed Consolidated Balance Sheet, from contracts with customers were $546.2 million and $380.7 million as of March 31, 2021 and December 31, 2020, respectively.
Contract assets, which consist primarily of revenues recognized over time that have not yet been invoiced and estimates of the value of inventory that will be received in conjunction with product returns, are reported in prepaid expenses and other current assets within the Condensed Consolidated Balance Sheets. Contract liabilities, which consist primarily of accruals associated with amounts that will be paid to customers for volume rebates, cash discounts, sales returns and allowances, estimates of shipping and handling costs associated with performance obligations recorded over time, and bill and hold transactions are reported in other accrued liabilities within the Condensed Consolidated Balance Sheets. Significant changes in the contract assets and the contract liabilities balances during the period are as follows:
|
| Contract Assets |
|
| Contract Liabilities |
| ||
|
| (In millions) |
| |||||
Beginning Balance at January 1, 2021 |
| $ | 10.8 |
|
| $ | 10.8 |
|
Contract liability satisfied during the period |
|
| — |
|
|
| (4.1 | ) |
Contract liability incurred during the period |
|
| — |
|
|
| 5.8 |
|
Net change in contract assets and liabilities for products with no alternative use during the period |
|
| 1.4 |
|
|
| — |
|
Changes to reserves |
|
| 0.6 |
|
|
| 0.1 |
|
Ending Balance at March 31, 2021 |
| $ | 12.8 |
|
| $ | 12.6 |
|
The Company’s performance obligations are typically short-term in nature. As a result, the Company has elected the practical expedient that provides an exemption of the disclosure requirements regarding information about remaining performance obligations on contracts that have original expected durations of one year or less.
NOTE 13: PROVISION FOR CREDIT LOSSES
Provisions for allowances and claims on accounts receivables and contract assets are based upon historical rates, expected trends, and estimates of potential returns, allowances, customer discounts, and incentives. The Company considers all available information when assessing the adequacy of the provision for allowances, claims, and doubtful accounts.
The Company performs ongoing credit evaluations of customers and sets credit limits based upon review of the customers’ current credit information, payment history, and the current economic and industry environments. The Company’s credit loss reserve
consists of two parts: a) a provision for estimated credit losses based on historical experience and b) a reserve for specific customer collection issues that the Company has identified. Estimation of credit losses requires adjusting historical loss experience for current economic conditions and judgments about the probable effects of economic conditions on certain customers. We have reviewed recent events and circumstances due to the ongoing COVID-19 pandemic in relation to our provision for credit losses and have not made any material adjustments as of March 31, 2021.
The following table provides a reconciliation of the provision for credit losses reported within the Condensed Consolidated Balance Sheets as of March 31, 2021:
| Changes in Provision for Expected Credit Losses |
| |
| (In millions) |
| |
Balance at January 1, 2021 | $ | 1.7 |
|
Current period provision |
| 0.5 |
|
Write-offs charged against allowance |
| (0.2 | ) |
Recoveries |
| 0.1 |
|
Balance at March 31, 2021 | $ | 2.1 |
|
NOTE 11:14: INCOME TAXES
For the three months ended September 30, 2017,March 31, 2021, the Company recorded an income tax benefitexpense of $0.7$7.6 million compared to income tax expense of $1.6$2.9 million in the prior year. The $0.7 million tax benefitexpense for the three months ended September 30, 2017March 31, 2021 and 2020 primarily represents the reversal of previous uncertain tax provisions due to the lapse of the statute of limitations andrepresent taxes at federal and local statutory rates where the Company operates, but generally excludesexclude any tax benefit for losses in jurisdictions with historical losses.
For the nine months ended September 30, 2017, the Company recorded income The higher effective tax expense of $5.3 million compared to $14.0 millionrate in the prior year. The $5.3 million tax expense forfirst three months of 2021 is primarily a result of the nine months ended September 30, 2017 primarily represents taxes at federalsignificant changes in actual and local statutory rates whereforecasted earnings between the Company operates, but generally excludes any tax benefit for losses in jurisdictions with historical losses.two periods as business conditions begin to return to pre-pandemic levels.
In accordance withAs required by ASC 740, “Income Taxes,” the Company assesses the realizability of its deferred tax assets. The Company records a valuation allowance when, based upon the evaluation of all available evidence, it is more-likely-than-not that all or a portion of the deferred tax assets will not be realized. In making this determination, we analyze, among other things, our recent history of earnings, the nature and timing of reversing book-tax temporary differences, tax planning strategies, and future income. The Company maintains a valuation allowance on certain foreign and U.S. federal and state deferred tax assets until such time as in management’s judgment, considering all available positive and negative evidence, the Company determines that these deferred tax assets are more likely than not realizable. The valuation allowance is reviewed quarterly and will be maintained until sufficient positive evidence exists to support the reversal of some or all of the valuation allowance.allowance. The valuation allowance was $19.5$6.2 million at March 31, 2021 and $6.6 million December 31, 2020.
The U.S. Tax Cuts and Jobs Act (the “Act”) subjects a U.S. shareholder to tax on global intangible low-taxed income (“GILTI”) earned by certain foreign subsidiaries. The FASB Staff Q&A, Topic 740, No. 5, Accounting for Global Intangible Low-Taxed Income, states that an entity can make an accounting policy election to either recognize deferred taxes for temporary basis differences expected to reverse as GILTI in future years or provide for the tax expense related to GILTI in the year the tax is incurred. After considering the two options, the Company has elected to provide for the tax expense related to GILTI in the year the tax will occur. For the three-months ended March 31, 2021 and 2020, we have included a tax expense of $0.1 million and $20.0$1.2 million, respectively, related to GILTI as part of our tax provision.
The Company accounts for uncertain income tax positions in accordance with ASC 740. We anticipate that certain statutes of limitation will close within the next twelve months resulting in the reduction of the reserve for uncertain tax benefits related to various intercompany transactions. No changes in the first quarter of 2021 were recorded, therefore, the balance of $1.7 million at September 30, 2017 and December 31, 2016, respectively.2020 remains unchanged.
NOTE 12:15: EARNINGS PER SHARE
Basic earnings per share attributable to Ryerson Holding’s common stock is determined based on earnings for the period divided by the weighted average number of common shares outstanding during the period. Diluted earnings per share attributable to Ryerson Holding’s common stock considers the effect of potential common shares, unless inclusion of the potential common shares would have an antidilutive effect.Stock-based awards with a grant price greater than the average market price of our common stock are excluded from the calculation of diluted earnings per share because the impact would have been antidilutive. The weighted average number of shares excluded were 145,833 and 96,808 for the three and nine-month periods ended September 30, 2017, respectively.
The following table sets forth the calculation of basic and diluted earnings per share:
|
| Three Months Ended September 30, |
|
| Nine Months Ended September 30, |
|
| Three Months Ended March 31, |
| |||||||||||||||
Basic and diluted earnings per share |
|
| 2017 |
|
|
| 2016 |
|
|
| 2017 |
|
|
| 2016 |
|
|
| 2021 |
|
|
| 2020 |
|
|
| (In millions, except share and per share data) |
|
| (In millions, except share and per share data) |
| ||||||||||||||||||
Numerator: |
|
|
|
|
|
|
|
|
|
|
|
|
|
|
|
|
|
|
|
|
|
|
|
|
Net income attributable to Ryerson Holding Corporation |
| $ | 1.7 |
|
| $ | 8.2 |
|
| $ | 17.1 |
|
| $ | 27.3 |
|
| $ | 25.3 |
|
| $ | 16.4 |
|
Denominator: |
|
|
|
|
|
|
|
|
|
|
|
|
|
|
|
|
|
|
|
|
|
|
|
|
Weighted average shares outstanding |
|
| 37,190,927 |
|
|
| 35,804,069 |
|
|
| 37,165,552 |
|
|
| 33,343,503 |
|
|
| 38,117,397 |
|
|
| 37,783,761 |
|
Dilutive effect of stock-based awards |
|
| 103,781 |
|
|
| 161,615 |
|
|
| 125,041 |
|
|
| 92,009 |
|
|
| 523,052 |
|
|
| 441,568 |
|
Weighted average shares outstanding adjusted for dilutive securities |
|
| 37,294,708 |
|
|
| 35,965,684 |
|
|
| 37,290,593 |
|
|
| 33,435,512 |
|
|
| 38,640,449 |
|
|
| 38,225,329 |
|
|
|
|
|
|
|
|
|
|
|
|
|
|
|
|
|
|
|
|
|
|
|
|
|
|
Earnings per share |
|
|
|
|
|
|
|
|
|
|
|
|
|
|
|
|
|
|
|
|
|
|
|
|
Basic and diluted |
| $ | 0.05 |
|
| $ | 0.23 |
|
| $ | 0.46 |
|
| $ | 0.82 |
| ||||||||
Basic |
| $ | 0.66 |
|
| $ | 0.43 |
| ||||||||||||||||
Diluted |
| $ | 0.66 |
|
| $ | 0.43 |
| ||||||||||||||||
This Quarterly Report contains “forward-looking statements” within the meaning of the Private Securities Litigation Reform Act of 1995. Such statements can be identified by the use of forward-looking terminology such as “objectives,” “goals,” “preliminary,” “range,” “believes,” “expects,” “may,” “estimates,” “will,” “should,” “plans”“plans,” or “anticipates” or the negative thereof or other variations thereon or comparable terminology, or by discussions of strategy. Readers are cautioned that any such forward-looking statements are not guarantees of future performance and may involve significant risks and uncertainties, and that actual results may vary materially from those anticipated or implied in the forward-looking statements as a result of various factors. These forward-looking statements involve a number of risks and uncertainties that could cause actual results to differ materially from those suggested by the forward-looking statements. Forward-looking statements should, therefore, be considered in light of various factors, including those set forth under “Special Note Regarding Forward-Looking Statements” and “Risk Factors” in our Annual Report on Form 10-K for the year ended December 31, 20162020 filed on March 13, 2017February 24, 2021 and the section entitled “Management’s Discussion and Analysis of Financial Condition and Results of Operations – Industry and Operating Trends” and elsewhere in this Quarterly Report on Form 10-Q. Moreover, we caution you not to place undue reliance on these forward-looking statements, which speak only as of the date they were made. We do not undertake any obligation to publicly release any revisions to these forward-looking statements to reflect events or circumstances after the date of this Quarterly Report or to reflect the occurrence of unanticipated events.
The following discussion should be read in conjunction with our Condensed Consolidated Financial Statements and related Notes thereto in Item 1, “Financial Statements” in this Quarterly Report on Form 10-Q and our Consolidated Financial Statements and related Notes thereto for the year ended December 31, 20162020 in our Annual Report on Form 10-Kfiled on March 13, 2017.February 24, 2021.
Industry and Operating Trends
We are a leading metals service center that distributesproviding value-added processing and provides value-added processingdistribution of industrial metals with operations in the United States, Canada, Mexico, and China. We purchase large quantities of metal products from primary producers and sell these materials in smaller quantities to a wide variety of metals-consuming industries. MoreWe carry a full line of nearly 75,000 products in stainless steel, aluminum, carbon steel, and alloy steels and a limited line of nickel and red metals in various shapes and forms. In addition to our metals products, we offer numerous value-added processing and fabrication services, and more than 75% of the metals products soldwe sell are processed by us by bending, beveling, blanking, blasting, burning, cutting-to-length, drilling, embossing, flattening, forming, grinding, laser cutting, machining, notching, painting, perforating, polishing, punching, rolling, sawing, scribing, shearing, slitting, blanking, cutting to lengthstamping, tapping, threading, welding, or other techniques. techniques to process materials to a specified thickness, length, width, shape, and surface quality pursuant to specific customer orders.
Similar to other metals service centers, we maintain substantial inventories of metals to accommodate the short lead times and just-in-time delivery requirements of our customers. Accordingly, we purchase metals in an effort to maintain our inventory at levels that we believe to be appropriate to satisfy the anticipated needs of our customers based upon customer forecasts, historic buying practices, supply agreements with customers, mill lead times, and market conditions. Our commitments to purchase metals are generally at prevailing market prices in effect at the time we place our orders. At the request of our customers, we have entered into swaps in order to mitigate our customers’ risk of volatility in the price of metals and we have entered into metals hedges to mitigate our own risk of volatility in the price of metals. We have no long-term, fixed-price metals purchase contracts. When metals prices decline, customer demands for lower prices and our competitors’ responses to those demands could result in lower sale prices and, consequently, lower gross profits and earnings as we usesell existing metals inventory. When metals prices increase, competitive conditions will influence how much of the price increase we may pass on to our customers.
The metals service center industry is cyclical and volatile in terms of both pricing and demand, and pricing, as such, industrial metals prices are volatile and remain difficult to predict. In the thirdfirst three months of 2021, Ryerson experienced stronger pricing and weaker demand compared to the three-month period ended March 31, 2020, with average selling prices 18.4% higher and shipments 4.1% lower, reflective of the improved commodity environment and still recovering demand fundamentals. Changes in average selling prices are primarily driven by commodity metals prices, which impact Ryerson’s selling prices over the subsequent three to six-month period.
Key industry indicators that reported weakness as demand conditions were impacted by temporary customer closures as a result of the COVID-19 pandemic showed continued improvement in the first quarter of 2017, we continue2021. This is evidenced by the Institute for Supply Management’s Purchasing Managers’ Index (“PMI”), which reported strength in January, February and March with readings above 50%, indicating general expansion in factory activity and marking 10 consecutive months of expanding activity. Additionally, after 18 months of contraction, U.S. Industrial Production increased in March 2021 compared to seeMarch 2020 by 1.0%, illustrating improved demand when viewed against the year ago period. conditions.
According to the Metal Service Center Institute, U.S.North American service center volumes per day have increaseddeclined by more than1.2% in the first three percentmonths of 2021 compared to the second quarterfirst three months of 2017. In2020. On a North American basis, Ryerson experienced demand contraction more severe than the third quarter of 2017, weindustry, with tons sold down by 6.1% over the same period. Year-over-year North American demand softness was experienced quarterly year-over-year growthmost strongly in shipment volumes to nearly all of our end markets, most notably in commercial ground transportation,food & agriculture, industrial equipment, metal fabrication & machine shop and oil & gas and construction equipment sectors. However, we saw quarterly year-over-year shipment declines in consumer durables.
Overall, a weaker U.S. dollar and improved global pricing conditions narrowed spreads between foreign and domestic steel pricing inAt the third quarter of 2017. Commodity prices on balance trended higher sequentially fromsame time, the second quarter through the third quarter of 2017 despite continuing volatility in industrial base metal markets. However, elevated import levels and well supplied metals markets muted service center pricing power, with our average selling prices down one percent in the third quarter of 2017 compared to the prior quarter. The muted pricing together with higher procured metal costs resulted in margin compression through the third quarter of 2017.
On January 9, 2017, we acquired The Laserflex Corporation (“Laserflex”), a privately-owned metal fabricator with locations in Columbus, Ohio and Wellford, South Carolina. Laserflex specializes in laser fabrication metal processing and welding and further enhances our existing fabrication and metals processing capabilities.
On February 15, 2017, we acquired Guy Metals, Inc. (“Guy Metals”), a privately-owned metal service center company located in Hammond, Wisconsin. Guy Metals processes stainless and nickel alloy products including its trademarked “Pit Free Dairy” and “Super4” finishes used in food, dairy, pharmaceutical, and beverage applications. Consistentsectors with the Laserflex acquisition, Guy Metals bolsters our value-added processing capabilities to provide additional services to our customers.strongest North American year-over-year growth were HVAC, consumer durable and construction.
The global outbreak of COVID-19 was declared a pandemic by the World Health Organization and a national emergency by the U.S. government over a year ago. As of the date of this filing, and COVID-19 continues to be a substantial risk factor for business operations and the Company continues to monitor and address these risks and uncertainties as conditions develop. While we are encouraged by U.S. vaccination rates, we note recent national and international trends and confirmed cases, and therefore remain committed to our implemented policies and procedures to continue protecting the health and welfare of our employees first and foremost while operating as an essential business.
Led by our dedicated COVID-19 response team, we continue to follow the United States Centers for Disease Control and Prevention and other relevant local guidance in the U.S., as well as corresponding authorities in Canada, Mexico, and China, carefully monitoring COVID-19 data in the areas in which we operate, and continue to be both safe and nimble in executing our internal response. We remain committed to operating our business under COVID-19 safety policies until we are certain that related risks have subsided. To support the sustainability of current circumstances, we are supporting our workforce beyond contraction prevention by reinforcing the importance of mental health and promoting the use of existing benefits such as prescription delivery and telemedicine. Further, we have encouraged our workforce to receive the flu and COVID-19 vaccines, and in some locations we have provided the opportunity to receive the COVID-19 vaccine on-site.
The extent of the impact of the COVID-19 pandemic on our operational and financial performance will depend on future developments, including the duration and spread of the pandemic and related actions taken by the U.S. government and state and local government officials to prevent disease spread, all of which are uncertain and cannot be predicted. At this time, our business and the business of our customers continue to be impacted by economic pressures as well as supply chain disruptions and tightness stemming from COVID-19. This is perpetuated by increasing demand momentum, and the ultimate impact of COVID-19 remains uncertain.
The Company continues to closely monitor its liquidity position as market conditions improve. Specifically, we continue to actively manage relationships with our customers and vendors to ensure that we balance our receivables and payables cycles, conduct receivables risk assessments, limit discretionary spending and non-essential travel, and have contingency plans in place to reduce costs while supporting business operations should conditions decline. Due to our effective cash management actions and the strong commodity pricing environment, as of March 31, 2021, Ryerson had liquidity of $583 million, composed of $540 million of availability under the Ryerson Credit Facility and foreign debt facilities, and $43 million of cash and cash equivalents.
Q1 2021 vs. Q1 2020 Performance Highlights
$1.15B |
|
|
| 17.2% |
|
|
| $25M |
| |
Total Revenues |
|
| Gross Margin |
| Net Income Attributable to Ryerson |
| ||||
| 14% increase |
|
| 220 bps decrease |
|
| $9M increase | |||
$0.66 |
|
|
| $0.26 |
|
|
| ($47M) |
| |
Diluted EPS |
|
| Diluted Adj. EPS* |
| Cash from Operating Activities | |||||
| $0.23 increase |
|
| $0.15 decrease |
|
| $120M decrease | |||
*A reconciliation of the non-GAAP financial measure to the comparable GAAP measure is included in the subsequent table.
Ryerson achieved revenues of $1.15 billion in the first quarter of 2021, an increase of 13.6% compared to $1.01 billion for the first quarter of 2020, with average selling prices 18.4% higher and tons shipped 4.1% lower. Gross margin contracted to 17.2% due to higher cost of goods sold recognition, compared to 19.4% for the first quarter of 2020. Included in first quarter of 2021 cost of materials sold was LIFO expense of $83.8 million, compared to LIFO income of $20.2 million in the first quarter of 2020. Net income attributable to Ryerson Holding Corporation was $25.3 million, or earnings of $0.66 per diluted share, in the first quarter of 2021 compared to $16.4 million of net income attributable to Ryerson Holding Corporation, or $0.43 per diluted share, for the first quarter of 2020.
To provide greater insight into the Company’s first quarter 2021 operating trends apart from the quarter’s one-time transactions, Ryerson provides adjusted net income and diluted adjusted earnings per share figures, which are not U.S. generally accepted accounting principles (“GAAP”) financial measures, to compliment the reported GAAP net income and diluted earnings per share figures. Management uses these metrics to assess year-over-year performance excluding non-recurring transactions. Adjusted net income and adjusted diluted earnings per share do not represent, and should not be used as a substitute for, net income or earnings per share determined in accordance with GAAP. Illustrated in the below table, first quarter 2021 net income attributable to Ryerson of
$25.3 million includes a gain of $20.3 million generated from the sale of the Renton, Washington facility. After adjusting for this non-core business transaction and the related income tax provision, the adjusted net income attributable to Ryerson for the first quarter of 2021 is $10.2 million, a decrease of $5.6 million compared to the year-ago adjusted net income attributable to Ryerson of $15.8 million which included an adjustment for a gain on retirement of debt related to repurchases of the then 11.00% Senior Secured Notes due 2022 (the “2022 Notes”) and related income taxes.
(Dollars and shares in millions, except per share data) |
| Q1 2021 |
|
| Q1 2020 |
| ||
Net income attributable to Ryerson Holding Corporation |
| $ | 25.3 |
|
| $ | 16.4 |
|
Gain on sale of assets |
|
| (20.3 | ) |
|
| — |
|
Gain on retirement of debt |
|
| — |
|
|
| (0.8 | ) |
Provision for income taxes |
|
| 5.2 |
|
|
| 0.2 |
|
Adjusted net income attributable to Ryerson Holding Corporation |
| $ | 10.2 |
|
| $ | 15.8 |
|
Diluted earnings per share |
| $ | 0.66 |
|
| $ | 0.43 |
|
Diluted adjusted earnings per share |
|
| 0.26 |
|
|
| 0.41 |
|
Shares outstanding – diluted |
|
| 38.6 |
|
|
| 38.2 |
|
Recent Developments
On March 31, 2021, President Biden introduced the American Jobs Plan, a broad $2 trillion, 8-year infrastructure plan. This plan is largely viewed as an opening bid as Congress starts the formal process of developing infrastructure spending legislation. To offset some of the plan’s costs, the Biden Administration proposed a series of tax changes including raising the corporate tax rate to 28%. While changes to corporate taxation, including a higher corporate income tax rate, would adversely affect the Company, we believe the additional government spending on infrastructure projects contemplated under the American Jobs Plan, as proposed, may generate additional demand for our products especially within the industrial equipment, construction, green energy, and transportation industries. Accordingly, we would anticipate that the Jobs Plan would be beneficial to the Company, but ultimately the impact on the Company’s operations and ability to attract new business and retain existing customers is unclear. The prospects for this proposal also remain unclear.
On April 22, 2021, the U.S. International Trade Commission (“USITC”) confirmed the Department of Commerce’s affirmative antidumping duty determinations and injury determinations regarding US imports of common alloy aluminum sheet. As a result, the USITC will issue final antidumping duty orders on U.S. imports of common alloy aluminum sheet from the following sixteen countries: Bahrain, Brazil, Croatia, Egypt, Germany, India, Indonesia, Italy, Oman, Romania, Serbia, Slovenia, South Africa, Spain, Taiwan, and Turkey. Antidumping rates differ greatly depending on country of origin and producing mill and range from the low single digits to as high as 243%. Ryerson anticipates that the actions of the USITC will support the prices of domestically produced aluminum sheet and therefore benefit the Company’s average selling prices.
On March 1, 2018, the White House announced a 25% tariff on all imported steel products and 10% tariff on all imported aluminum products for an indefinite amount of time under Section 232 (“Section 232”) of the Trade Expansion Act. Application of the tariffs commenced March 23, 2018, with temporary or long-term exemptions for a number of countries and subject to a product exemption process. These tariffs, while in effect, have discouraged metal imports from non-exempt countries and have had a favorable impact on the prices of the products we sell and our results of operations. The removal of the Section 232 tariffs could lead to increased levels of imported metals into the U.S. and result in domestic steel producers decreasing the prices of the metals they sell. A rapid decline in metal prices from current levels could result in a significant adverse effect on our revenues, gross profit, and net income. With the current supply constraints and the new administration in the White House, the removal of the Section 232 tariffs is still uncertain.
Components of Results of Operations
We generate substantially all of our revenue from sales of our metals products. RevenueThe majority of revenue is recognized upon delivery of product to customers. The timing of shipment is substantially the same as the timing of delivery to customers given the proximity of our distribution sites to our customers. Revenues associated with products which we believe have no alternative use, and where the Company has an enforceable right to payment, are recognized on an over-time basis. Over-time revenues are recorded in proportion with the progress made toward completing the performance obligation.
Sales, cost of materials sold, gross profit, and operating expense control are the principal factors that impact our profitability.
Net sales. Our sales volume and pricing isare driven by market demand, which is largely determined by overall industrial production and conditions in the specific industries in which our customers operate. Sales prices are also primarily driven by market factors such as overall demand and availability of product. Our net sales include revenue from product sales, net of returns, allowances, customer discounts, and incentives.
Cost of materials sold. Cost of materials sold includes metal purchase and in-bound freight costs, third-party processing costs, and direct and indirect internal processing costs. The cost of materials sold fluctuates with our sales volume and our ability to purchase metals at competitive prices. Increases in sales volume generally enable us both to improve purchasing leverage with suppliers, as we buy larger quantities of metals inventories, and to reduce operating expenses per ton sold.inventories.
Gross profit. Gross profit is the difference between net sales and the cost of materials sold. Our sales prices to our customers are subject to market competition. Achieving acceptable levels of gross profit is dependent on our acquiring metals at competitive prices, our ability to manage the impact of changing prices, and efficiently managing our internal and external processing costs.
Operating expenses. Optimizing business processes and asset utilization to lower fixed expenses such as employee, facility, and truck fleet costs, which cannot be rapidly reduced in times of declining volume, and maintaining a low fixed cost structure in times of increasing sales volume, have a significant impact on our profitability. Operating expenses include costs related to warehousing and distributing our products as well as selling, general, and administrative expenses.
Results of Operations—Operations — Comparison of Three and Nine Months Ended September 30, 2017March 31, 2021 to Three and Nine Months Ended September 30, 2016March 31, 2020
The following table sets forth our condensed consolidated statements of income data for the three-monththree months ended March 31, 2021 and nine-month periods ended September 30, 2017 and 2016:2020:
|
| Three Months Ended September 30, |
|
| Nine Months Ended September 30, |
|
| Three Months Ended March 31, |
| |||||||||||||||||||||||||||||||||||||||
|
| 2017 |
|
| 2016 |
|
| 2017 |
|
| 2016 |
|
| 2021 |
|
| 2020 |
| ||||||||||||||||||||||||||||||
|
| $ |
|
| % of Net Sales |
|
| $ |
|
| % of Net Sales |
|
| $ |
|
| % of Net Sales |
|
| $ |
|
| % of Net Sales |
|
| $ |
|
| % of Net Sales |
|
| $ |
|
| % of Net Sales |
| ||||||||||||
|
| ($ in millions) |
|
| ($ in millions) |
|
| ($ in millions) |
| |||||||||||||||||||||||||||||||||||||||
Net sales |
| $ | 864.2 |
|
|
| 100.0 | % |
| $ | 735.1 |
|
|
| 100.0 | % |
| $ | 2,554.1 |
|
|
| 100.0 | % |
| $ | 2,177.5 |
|
|
| 100.0 | % |
| $ | 1,147.3 |
|
|
| 100.0 | % |
| $ | 1,010.3 |
|
|
| 100.0 | % |
Cost of materials sold |
|
| 719.2 |
|
|
| 83.2 |
|
|
| 589.7 |
|
|
| 80.2 |
|
|
| 2,108.1 |
|
|
| 82.5 |
|
|
| 1,721.5 |
|
|
| 79.1 |
|
|
| 949.4 |
|
|
| 82.8 |
|
|
| 814.5 |
|
|
| 80.6 |
|
Gross profit |
|
| 145.0 |
|
|
| 16.8 |
|
|
| 145.4 |
|
|
| 19.8 |
|
|
| 446.0 |
|
|
| 17.5 |
|
|
| 456.0 |
|
|
| 20.9 |
|
|
| 197.9 |
|
|
| 17.2 |
|
|
| 195.8 |
|
|
| 19.4 |
|
Warehousing, delivery, selling, general and administrative expenses |
|
| 119.2 |
|
|
| 13.8 |
|
|
| 109.1 |
|
|
| 14.8 |
|
|
| 353.2 |
|
|
| 13.9 |
|
|
| 331.5 |
|
|
| 15.2 |
| ||||||||||||||||
Restructuring and other charges |
|
| — |
|
|
| — |
|
|
| 2.5 |
|
|
| 0.4 |
|
|
| — |
|
|
| — |
|
|
| 2.5 |
|
|
| 0.1 |
| ||||||||||||||||
Warehousing, delivery, selling, general, and administrative expenses |
|
| 171.8 |
|
|
| 15.0 |
|
|
| 155.7 |
|
|
| 15.4 |
| ||||||||||||||||||||||||||||||||
Gain on sale of assets |
|
| (20.3 | ) |
|
| (1.8 | ) |
|
| — |
|
|
| — |
| ||||||||||||||||||||||||||||||||
Operating profit |
|
| 25.8 |
|
|
| 3.0 |
|
|
| 33.8 |
|
|
| 4.6 |
|
|
| 92.8 |
|
|
| 3.6 |
|
|
| 122.0 |
|
|
| 5.6 |
|
|
| 46.4 |
|
|
| 4.0 |
|
|
| 40.1 |
|
|
| 4.0 |
|
Other expenses |
|
| (24.6 | ) |
|
| (2.9 | ) |
|
| (23.8 | ) |
|
| (3.2 | ) |
|
| (69.8 | ) |
|
| (2.7 | ) |
|
| (80.7 | ) |
|
| (3.7 | ) | ||||||||||||||||
Other (expenses) and income |
|
| (13.2 | ) |
|
| (1.1 | ) |
|
| (20.8 | ) |
|
| (2.1 | ) | ||||||||||||||||||||||||||||||||
Income before income taxes |
|
| 1.2 |
|
|
| 0.1 |
|
|
| 10.0 |
|
|
| 1.4 |
|
|
| 23.0 |
|
|
| 0.9 |
|
|
| 41.3 |
|
|
| 1.9 |
|
|
| 33.2 |
|
|
| 2.9 |
|
|
| 19.3 |
|
|
| 1.9 |
|
Provision (benefit) for income taxes |
|
| (0.7 | ) |
|
| (0.1 | ) |
|
| 1.6 |
|
|
| 0.3 |
|
|
| 5.3 |
|
|
| 0.2 |
|
|
| 14.0 |
|
|
| 0.6 |
| ||||||||||||||||
Provision for income taxes |
|
| 7.6 |
|
|
| 0.7 |
|
|
| 2.9 |
|
|
| 0.3 |
| ||||||||||||||||||||||||||||||||
Net income |
|
| 1.9 |
|
|
| 0.2 |
|
|
| 8.4 |
|
|
| 1.1 |
|
|
| 17.7 |
|
|
| 0.7 |
|
|
| 27.3 |
|
|
| 1.3 |
|
|
| 25.6 |
|
|
| 2.2 |
|
|
| 16.4 |
|
|
| 1.6 |
|
Less: Net income attributable to noncontrolling interest |
|
| 0.2 |
|
|
| — |
|
|
| 0.2 |
|
|
| — |
|
|
| 0.6 |
|
|
| — |
|
|
| — |
|
|
| — |
|
|
| 0.3 |
|
|
| — |
|
|
| — |
|
|
| — |
|
Net income attributable to Ryerson Holding Corporation |
| $ | 1.7 |
|
|
| 0.2 | % |
| $ | 8.2 |
|
|
| 1.1 | % |
| $ | 17.1 |
|
|
| 0.7 | % |
| $ | 27.3 |
|
|
| 1.3 | % |
| $ | 25.3 |
|
|
| 2.2 | % |
| $ | 16.4 |
|
|
| 1.6 | % |
Basic and diluted earnings per share |
| $ | 0.05 |
|
|
|
|
|
| $ | 0.23 |
|
|
|
|
|
| $ | 0.46 |
|
|
|
|
|
| $ | 0.82 |
|
|
|
|
| ||||||||||||||||
Basic earnings per share |
| $ | 0.66 |
|
|
|
|
|
| $ | 0.43 |
|
|
|
|
| ||||||||||||||||||||||||||||||||
Diluted earnings per share |
| $ | 0.66 |
|
|
|
|
|
| $ | 0.43 |
|
|
|
|
| ||||||||||||||||||||||||||||||||
Net sales
The following table shows ourcharts show the Company’s percentage of sales revenue by major product lines for the three months ended March 31, 2021 and nine month periods ended September 30, 2017 and 2016:2020:
|
| Three Months Ended September 30, |
|
| Nine Months Ended September 30, |
| ||||||||||
Product Line |
| 2017 |
|
| 2016 |
|
| 2017 |
|
| 2016 |
| ||||
Carbon Steel Flat |
|
| 29 | % |
|
| 29 | % |
|
| 28 | % |
|
| 27 | % |
Carbon Steel Plate |
|
| 10 |
|
|
| 9 |
|
|
| 10 |
|
|
| 9 |
|
Carbon Steel Long |
|
| 12 |
|
|
| 13 |
|
|
| 12 |
|
|
| 14 |
|
Stainless Steel Flat |
|
| 17 |
|
|
| 17 |
|
|
| 18 |
|
|
| 16 |
|
Stainless Steel Plate |
|
| 4 |
|
|
| 4 |
|
|
| 4 |
|
|
| 4 |
|
Stainless Steel Long |
|
| 4 |
|
|
| 3 |
|
|
| 4 |
|
|
| 4 |
|
Aluminum Flat |
|
| 16 |
|
|
| 16 |
|
|
| 15 |
|
|
| 16 |
|
Aluminum Plate |
|
| 3 |
|
|
| 3 |
|
|
| 3 |
|
|
| 3 |
|
Aluminum Long |
|
| 4 |
|
|
| 4 |
|
|
| 4 |
|
|
| 5 |
|
Other |
|
| 1 |
|
|
| 2 |
|
|
| 2 |
|
|
| 2 |
|
Total |
|
| 100 | % |
|
| 100 | % |
|
| 100 | % |
|
| 100 | % |
|
| September 30, |
|
| Dollar |
|
| Percentage |
| |||||||
|
| 2017 |
|
| 2016 |
|
| change |
|
| change |
| ||||
|
| ($ in millions) |
|
|
|
|
|
|
|
|
| |||||
Net sales (three-months ended) |
| $ | 864.2 |
|
| $ | 735.1 |
|
| $ | 129.1 |
|
|
| 17.6 | % |
Net sales (nine-months ended) |
| $ | 2,554.1 |
|
| $ | 2,177.5 |
|
| $ | 376.6 |
|
|
| 17.3 | % |
|
|
|
|
|
|
|
|
|
|
|
|
|
|
|
|
|
|
| September 30, |
|
| Tons |
|
| Percentage |
| |||||||
|
| 2017 |
|
| 2016 |
|
| change |
|
| change |
| ||||
|
| (in thousands) |
|
|
|
|
|
|
|
|
| |||||
Tons sold (three-months ended) |
|
| 515 |
|
|
| 480 |
|
|
| 35 |
|
|
| 7.3 | % |
Tons sold (nine-months ended) |
|
| 1,530 |
|
|
| 1,463 |
|
|
| 67 |
|
|
| 4.6 | % |
|
|
|
|
|
|
|
|
|
|
|
|
|
|
|
|
|
|
| September 30, |
|
| Price |
|
| Percentage |
| |||||||
|
| 2017 |
|
| 2016 |
|
| change |
|
| change |
| ||||
Average selling price per ton sold (three-months ended) |
| $ | 1,678 |
|
| $ | 1,531 |
|
| $ | 147 |
|
|
| 9.6 | % |
Average selling price per ton sold (nine-months ended) |
| $ | 1,669 |
|
| $ | 1,488 |
|
| $ | 181 |
|
|
| 12.2 | % |
|
| March 31, |
|
| Dollar |
|
| Percentage |
| |||||||
|
| 2021 |
|
| 2020 |
|
| change |
|
| change |
| ||||
|
| ($ in millions) |
|
|
|
|
|
|
|
|
| |||||
Net sales |
| $ | 1,147.3 |
|
| $ | 1,010.3 |
|
| $ | 137.0 |
|
|
| 13.6 | % |
|
|
|
|
|
|
|
|
|
|
|
|
|
|
|
|
|
|
| March 31, |
|
| Tons |
|
| Percentage |
| |||||||
|
| 2021 |
|
| 2020 |
|
| change |
|
| change |
| ||||
|
| (in thousands) |
|
|
|
|
|
|
|
|
| |||||
Tons sold |
|
| 543 |
|
|
| 566 |
|
|
| (23 | ) |
|
| (4.1 | )% |
|
|
|
|
|
|
|
|
|
|
|
|
|
|
|
|
|
|
| March 31, |
|
| Price |
|
| Percentage |
| |||||||
|
| 2021 |
|
| 2020 |
|
| change |
|
| change |
| ||||
Average selling price per ton sold |
| $ | 2,113 |
|
| $ | 1,785 |
|
| $ | 328 |
|
|
| 18.4 | % |
Revenue for thethree-month and nine-month periodsperiod ended September 30, 2017March 31, 2021 increased from the same periodsperiod a year ago duereflecting metals market business conditions that began to higher average selling prices and higher tons sold. Average selling price increasedimprove in the three-month and nine-month periods ended September 30, 2017 fromsecond half of 2020 after declining sharply at the price levels inbeginning of the same periodsglobal outbreak of 2016 reflecting improved economic conditions inCOVID-19. Compared to the metals market. Averageyear ago period, average selling price increased for all of our product lines in the three-month and nine-month periodsperiod ended September 30, 2017March 31, 2021 with the largest increases in our carbon flat, stainless flatcarbon plate, and stainless plate products. Tons sold increaseddecreased in the three-month and nine-month periodsperiod ended September 30, 2017. The largest increases in shipments wereMarch 31, 2021 overall, with decreases in our stainlesscarbon plate, carbon long, stainless plate and carbonstainless plate product lines, andpartially offset by increases from our stainless long, stainlessaluminum flat and aluminumcarbon flat product lines for the three and nine month periods ending September 30, 2017, respectively.
lines.
Cost of materials sold
|
| March 31, |
|
|
|
|
|
|
|
|
| |||||||||||||
|
| 2021 |
|
| 2020 |
|
|
|
|
|
|
|
|
| ||||||||||
|
| $ |
|
| % of Net Sales |
|
| $ |
|
| % of Net Sales |
|
| Dollar change |
|
| Percentage change |
| ||||||
|
| ($ in millions) |
|
|
|
|
|
|
|
|
| |||||||||||||
Cost of materials sold |
| $ | 949.4 |
|
|
| 82.8 | % |
| $ | 814.5 |
|
|
| 80.6 | % |
| $ | 134.9 |
|
|
| 16.6 | % |
|
|
|
|
|
|
|
|
|
|
|
|
|
|
|
|
|
|
|
|
|
|
|
|
|
|
| September 30, |
|
|
|
|
|
|
|
|
| |||||||||||||||||||||||||||
|
| 2017 |
|
| 2016 |
|
|
|
|
|
|
|
|
| ||||||||||||||||||||||||
|
| $ |
|
| % of Net Sales |
|
| $ |
|
| % of Net Sales |
|
| Dollar change |
|
| Percentage change |
| ||||||||||||||||||||
|
| ($ in millions) |
|
|
|
|
|
|
|
|
| |||||||||||||||||||||||||||
Cost of materials sold (three-months ended) |
| $ | 719.2 |
|
|
| 83.2 | % |
| $ | 589.7 |
|
|
| 80.2 | % |
| $ | 129.5 |
|
|
| 22.0 | % | ||||||||||||||
Cost of materials sold (nine-months ended) |
| $ | 2,108.1 |
|
|
| 82.5 | % |
| $ | 1,721.5 |
|
|
| 79.1 | % |
| $ | 386.6 |
|
|
| 22.5 | % | ||||||||||||||
|
|
|
|
|
|
|
|
|
|
|
|
|
|
|
|
|
|
|
|
|
|
|
|
| ||||||||||||||
|
| September 30, |
|
| Cost |
|
| Percentage |
| |||||||||||||||||||||||||||||
|
| 2017 |
|
| 2016 |
|
| change |
|
| change |
| ||||||||||||||||||||||||||
Average cost of materials sold per ton sold (three-months ended) |
| $ | 1,396 |
|
| $ | 1,228 |
|
| $ | 168 |
|
|
| 13.7 | % | ||||||||||||||||||||||
Average cost of materials sold per ton sold (nine-months ended) |
| $ | 1,377 |
|
| $ | 1,176 |
|
| $ | 201 |
|
|
| 17.1 | % | ||||||||||||||||||||||
|
| March 31, |
|
| Cost |
|
| Percentage |
| |||||||
|
| 2021 |
|
| 2020 |
|
| change |
|
| change |
| ||||
Average cost of materials sold per ton sold |
| $ | 1,748 |
|
| $ | 1,439 |
|
| $ | 309 |
|
|
| 21.5 | % |
The increase in cost of materials sold in the three-month and nine-month periodsperiod ended September 30, 2017March 31, 2021 compared to the same periods a year ago period is primarily due to anthe increase in average cost of materials sold per ton, andpartially offset by the increasedecrease in tons sold. The average cost of materials sold forincreased across all product lines with the largest increase in our carbon plate, stainlesscarbon flat, and stainless plate product lines increased more than our other products during both the three and nine month periodsthree-month period ended March 31, 2021. During the first quarter of 2017, which2021, LIFO expense was a faster increase than$83.8 million compared to LIFO income of $20.2million in the first quarter of 2020.
Gross profit
|
| March 31, |
|
|
|
|
|
|
|
|
| |||||||||||||
|
| 2021 |
|
| 2020 |
|
|
|
|
|
|
|
|
| ||||||||||
|
| $ |
|
| % of Net Sales |
|
| $ |
|
| % of Net Sales |
|
| Dollar change |
|
| Percentage change |
| ||||||
|
| ($ in millions) |
|
|
|
|
|
|
|
|
| |||||||||||||
Gross profit |
| $ | 197.9 |
|
|
| 17.2 | % |
| $ | 195.8 |
|
|
| 19.4 | % |
| $ | 2.1 |
|
|
| 1.1 | % |
Gross profit was relatively unchangedin the three-month period ended March 31, 2021 compared to the year ago period as the increase in average selling price per ton for these products. During the third quarter of 2017, LIFO income was $1.7 million compared to LIFO expense of $25.1 million in the third quarter of 2016. LIFO expense in the third quarter of 2016 was offset by a $23.7 million credit to adjust the lower of cost or market inventory reserve. In the first nine months of 2017, LIFO expense was $35.7 million compared to LIFO expense of $5.0 millionincrease in the first nine monthsaverage cost of 2016. LIFO expense inmaterials sold. While the first nine months of 2017 was offset by a $23.9 million credit to adjust the lower of cost or market inventory reserve while LIFO expense in the first nine months of 2016 was more than offset by a $25.4 million credit to adjust the lower of cost or market inventory reserve.
Gross profit
|
| September 30, |
|
|
|
|
|
|
|
|
| |||||||||||||
|
| 2017 |
|
| 2016 |
|
|
|
|
|
|
|
|
| ||||||||||
|
| $ |
|
| % of Net Sales |
|
| $ |
|
| % of Net Sales |
|
| Dollar change |
|
| Percentage change |
| ||||||
|
| ($ in millions) |
|
|
|
|
|
|
|
|
| |||||||||||||
Gross profit (three-months ended) |
| $ | 145.0 |
|
|
| 16.8 | % |
| $ | 145.4 |
|
|
| 19.8 | % |
| $ | (0.4 | ) |
|
| (0.3 | )% |
Gross profit (nine-months ended) |
| $ | 446.0 |
|
|
| 17.5 | % |
| $ | 456.0 |
|
|
| 20.9 | % |
| $ | (10.0 | ) |
|
| (2.2 | )% |
Gross profit decreased in the three-month and nine-month periods ended September 30, 2017 compared to the same periods in 2016 as a competitive pricing environment pressured gross profit as a percent of sales. While our revenueaverage selling price per ton sold increased in the three-month and nine-month periodsthree months period ended September 30, 2017March 31, 2021 as compared to the three-month and nine-month periods of 2016,three months ended March 31, 2020, average cost of materials sold per ton sold increased at a faster pace resulting in a decrease in gross margin.
Operating expenses
|
| March 31, |
|
|
|
|
|
|
|
|
| |||||||||||||
|
| 2021 |
|
| 2020 |
|
|
|
|
|
|
|
|
| ||||||||||
|
| $ |
|
| % of Net Sales |
|
| $ |
|
| % of Net Sales |
|
| Dollar change |
|
| Percentage change |
| ||||||
|
| ($ in millions) |
|
|
|
|
|
|
|
|
| |||||||||||||
Warehousing, delivery, selling, general, and administrative expenses |
| $ | 171.8 |
|
|
| 15.0 | % |
| $ | 155.7 |
|
|
| 15.4 | % |
| $ | 16.1 |
|
|
| 10.3 | % |
Gain on sale of assets |
| $ | (20.3 | ) |
|
| (1.8 | )% |
| $ | — |
|
|
| — |
|
| $ | (20.3 | ) |
|
| — |
|
Total operating expenses decreased in the three-month period ended March 31, 2021 compared to the year ago period primarily due to a gain on sale of assets of $20.3 million recognized from the sale and leaseback of our Renton, Washington facility in the first quarter of 2021, a decrease in salary and wages of $6.0 million as workforce reductions in 2020 resulted in a lower gross margins.headcount, and a decrease in selling, general, and administrative costs of $2.8 million mainly from the lower travel and entertainment expenses. Partially offsetting the decreases were a $20.6 million increase in incentive compensation, higher benefit costs of $3.0 million mainly resulting from higher medical costs, and higher operating supplies of $0.9 million.
|
| September 30, |
|
|
|
|
|
|
|
|
| |||||||||||||
|
| 2017 |
|
| 2016 |
|
|
|
|
|
|
|
|
| ||||||||||
|
| $ |
|
| % of Net Sales |
|
| $ |
|
| % of Net Sales |
|
| Dollar change |
|
| Percentage change |
| ||||||
|
| ($ in millions) |
|
|
|
|
|
|
|
|
| |||||||||||||
Warehousing, delivery, selling, general and administrative expenses (three months ended) |
| $ | 119.2 |
|
|
| 13.8 | % |
| $ | 109.1 |
|
|
| 14.8 | % |
| $ | 10.1 |
|
|
| 9.3 | % |
Warehousing, delivery, selling, general and administrative expenses (nine months ended) |
| $ | 353.2 |
|
|
| 13.9 | % |
| $ | 331.5 |
|
|
| 15.2 | % |
| $ | 21.7 |
|
|
| 6.5 | % |
Restructuring and other charges (three months ended) |
| $ | — |
|
|
| — |
|
| $ | 2.5 |
|
|
| 0.4 | % |
| $ | (2.5 | ) |
|
| (100.0 | )% |
Restructuring and other charges (nine months ended) |
| $ | — |
|
|
| — |
|
| $ | 2.5 |
|
|
| 0.1 | % |
| $ | (2.5 | ) |
|
| (100.0 | )% |
Total operating expenses increased in the three-month and nine-month periods ended September 30, 2017 compared to the same periods in 2016 primarily due to improved demand and higher employment levels as well as general inflationary factors, which combined to increase salaries and wages, benefit costs and delivery expenses. The decrease in our operating expenses as a percentage of sales over these same periods is due to our higher sales levels resulting from higher metals pricing. The $2.5 million restructuring charge in 2016 was related to a facility closure.
Operating profit
|
| September 30, |
|
|
|
|
|
|
|
|
| |||||||||||||
|
| 2017 |
|
| 2016 |
|
|
|
|
|
|
|
|
| ||||||||||
|
| $ |
|
| % of Net Sales |
|
| $ |
|
| % of Net Sales |
|
| Dollar change |
|
| Percentage change |
| ||||||
|
| ($ in millions) |
|
|
|
|
|
|
|
|
| |||||||||||||
Operating profit (three-months ended) |
| $ | 25.8 |
|
|
| 3.0 | % |
| $ | 33.8 |
|
|
| 4.6 | % |
| $ | (8.0 | ) |
|
| (23.7 | )% |
Operating profit (nine-months ended) |
| $ | 92.8 |
|
|
| 3.6 | % |
| $ | 122.0 |
|
|
| 5.6 | % |
| $ | (29.2 | ) |
|
| (23.9 | )% |
|
| March 31, |
|
|
|
|
|
|
|
|
| |||||||||||||
|
| 2021 |
|
| 2020 |
|
|
|
|
|
|
|
|
| ||||||||||
|
| $ |
|
| % of Net Sales |
|
| $ |
|
| % of Net Sales |
|
| Dollar change |
|
| Percentage change |
| ||||||
|
| ($ in millions) |
|
|
|
|
|
|
|
|
| |||||||||||||
Operating profit |
| $ | 46.4 |
|
|
| 4.0 | % |
| $ | 40.1 |
|
|
| 4.0 | % |
| $ | 6.3 |
|
|
| 15.7 | % |
Our operating profit decreasedincreased in both the three-month and nine-month periods of 2017period ended March 31, 2021 compared to the same periods a year ago,three-month period ended March 31, 2020, primarily due to the declinedecrease in gross profit as a percent of salesoperating expenses discussed above.
Other expenses
|
| September 30, |
|
|
|
|
|
|
|
|
| |||||||||||||
|
| 2017 |
|
| 2016 |
|
|
|
|
|
|
|
|
| ||||||||||
|
| $ |
|
| % of Net Sales |
|
| $ |
|
| % of Net Sales |
|
| Dollar change |
|
| Percentage change |
| ||||||
|
| ($ in millions) |
|
|
|
|
|
|
|
|
| |||||||||||||
Interest and other expense on debt (three-months ended) |
| $ | (23.2 | ) |
|
| (2.7 | )% |
| $ | (23.6 | ) |
|
| (3.2 | )% |
| $ | 0.4 |
|
|
| (1.7 | )% |
Interest and other expense on debt (nine-months ended) |
| $ | (67.8 | ) |
|
| (2.7 | )% |
| $ | (67.5 | ) |
|
| (3.1 | )% |
| $ | (0.3 | ) |
|
| 0.4 | % |
Other income and (expense), net (three-months ended) |
| $ | (1.4 | ) |
|
| (0.2 | )% |
| $ | (0.2 | ) |
|
| — |
|
| $ | (1.2 | ) |
|
| 600.0 | % |
Other income and (expense), net (nine-months ended) |
| $ | (2.0 | ) |
|
| — |
|
| $ | (13.2 | ) |
|
| (0.6 | )% |
| $ | 11.2 |
|
|
| (84.8 | )% |
|
| March 31, |
|
|
|
|
|
|
|
|
| |||||||||||||
|
| 2021 |
|
| 2020 |
|
|
|
|
|
|
|
|
| ||||||||||
|
| $ |
|
| % of Net Sales |
|
| $ |
|
| % of Net Sales |
|
| Dollar change |
|
| Percentage change |
| ||||||
|
| ($ in millions) |
|
|
|
|
|
|
|
|
| |||||||||||||
Interest and other expense on debt |
| $ | (13.5 | ) |
|
| (1.2 | )% |
| $ | (21.7 | ) |
|
| (2.1 | )% |
| $ | (8.2 | ) |
|
| (37.8 | )% |
Other income and (expense), net |
| $ | 0.3 |
|
|
| 0.1 | % |
| $ | 0.9 |
|
|
| — |
|
| $ | (0.6 | ) |
|
| (66.7 | )% |
Interest and other expense on debt decreased in the three-month period ended March 31, 2021 compared to the year ago period primarily due to the redemption of our 2022 Notes which had an outstanding balance of $533.3 million at March 31, 2020. The 2022 Notes were replaced by a lower level of debt at a lower interest rate with the issuance of $500.0 million of the 8.50% Senior Secured Notes due 2028 (the “2028 Notes”). In October 2020, $50.0 million of the 2028 Notes were redeemed. In addition, interest and other expense on debt was relatively unchangedlower in the three-month period ended March 31, 2021 due to a lower level of Credit Facility borrowings outstanding compared to the year ago period related to lower working capital requirements during 2021 and lower interest rates on credit facility borrowings. In addition, Credit Facility borrowings were at a lower level at March 31, 2021 compared to a year ago when excess funds were borrowed to maintain access to cash during the COVID-19 pandemic. The other income in the first three-month and nine-month periodsquarter of 2017 compared to2021 includes a $0.3 million gain resulted from the same periods in 2016 as the interest rate on a portion of our outstanding Notes increased after we redeemed the $569.9 million outstanding balance of our 9.00% Senior Notes due 2017 (the “2017 Notes”), repurchased $121.9 million and thereafter redeemed the remaining outstanding $48.5 million of our 11.25% Senior Notes due 2018 (the “2018 Notes”) and issued $650.0 million of new 11.00% Senior Notes due 2022 (the “2022 Notes”) in 2016, partially offset by a reductionchange in the amountfair value of our outstanding Notes and lower amortization of debt issuance costs expense.the embedded derivative connected with the redemption options under the 2028 Notes. The other expenseincome in the first three-month and nine-month periodsquarter of 2017 was primarily related to foreign currency losses. The first nine months2020 includes a $0.8 million gain on the repurchase of 2016 included a $7.2 million net loss on debt redemptions, foreign currency losses of $3.2 million and a $2.8 million charge due to an other-than-temporary impairment recognized on an available-for-sale investment.the 2022 Notes.
Provision for income taxes. In the thirdfirst quarter of 2017, the Company recorded an income tax benefit of $0.7 million compared to an income tax expense of $1.6million in the third quarter of 2016. In the first nine months of 2017,2021, the Company recorded income tax expense of $5.3$7.6 million compared to $14.0$2.9 million in the first nine monthsquarter of 2016.2020. The income tax benefit or expense recorded in all
periods primarily represents taxes at federal and local statutory rates where the Company operates, but generally excludeexcludes any tax benefit for losses in jurisdictions with historical losses. The third quarter of 2017 also includes the reversal of previous uncertain tax provisions due to the lapse of the statute of limitations.
Earnings per share. Basic and diluted earnings per share was $0.05 in the third quarter of 2017 and $0.46were $0.66 in the first nine monthsquarter of 20172021 compared to basic and diluted earnings per share of $0.23 in the third quarter of 2016 and $0.82$0.43 in the first nine monthsquarter of 2016.2020. The changes in earnings per share are due to the results of operations discussed above as well as an increase in the weighted average number of shares outstanding due to the issuance of 5 million shares of common stock in July 2016.above.
Liquidity and Cash Flows
Our primary sources of liquidity are cash and cash equivalents, cash flows from operations, and borrowing availability under the $750 million revolving credit facility (the “RyersonRyerson Credit Facility”) that matures on November 16, 2021. ItsFacility. Our principal source of operating cash is from the sale of metals and other materials. ItsOur principal uses of cash are for payments associated with the procurement and processing of metals and other materials inventories, costs incurred for the warehousing and delivery of inventories, and the selling and administrative costs of the business, capital expenditures, and for interest payments on debt.
The following table summarizesglobal COVID-19 pandemic has led to disruption and volatility in the Company’sglobal capital markets, which, depending on future developments, could adversely impact our capital resources and liquidity in the future. As a proactive, precautionary measure, we borrowed approximately $166 million under the Ryerson Credit Facility in the first quarter of 2020 to maintain access to cash flows:
|
| Nine Months Ended September 30, |
| |||||
|
| 2017 |
|
| 2016 |
| ||
|
| (In millions) |
| |||||
|
|
|
|
|
|
|
|
|
Net cash used in operating activities |
| $ | (93.3 | ) |
| $ | (22.9 | ) |
Net cash used in investing activities |
|
| (61.6 | ) |
|
| (16.3 | ) |
Net cash provided by financing activities |
|
| 144.0 |
|
|
| 47.0 |
|
Effect of exchange rates on cash and cash equivalents |
|
| 3.8 |
|
|
| 2.2 |
|
Net increase (decrease) in cash and cash equivalents |
| $ | (7.1 | ) |
| $ | 10.0 |
|
during the COVID-19 pandemic. We reduced this balance to approximately $40 million as of December 31, 2020 and $20 million as of March 31, 2021. Accordingly, we had cash and cash equivalents of $73.643.3 million at September 30, 2017March 31, 2021, compared to $80.7$61.4 million at December 31, 2016. We had $36 million and $31 million of qualified cash pledged as collateral at September 30, 2017 and December 31, 2016, respectively. We had $1,042 million and $964 million of2020. Our total debt outstanding at September 30, 2017 andMarch 31, 2021 increased slightly to $741 million compared to $740 million total debt outstanding at December 31, 2016, respectively, and2020. We had a debt-to-capitalization ratio of 101%81% and 84% at September 30, 2017March 31, 2021 and 105% at December 31, 2016.2020 respectively. We had total liquidity (defined as cash and cash equivalents marketable securities and availability under the Ryerson Credit Facility and foreign debt facilities, less qualified cash pledged as collateral)facilities) of $355$583 million at September 30, 2017March 31, 2021 versus $301$373 million at December 31, 2016.2020. Our net debt (defined as total debt less cash and cash equivalents) was $698 million and $679 million at March 31, 2021 and December 31, 2020, respectively. Total liquidity isand net debt are not a U.S. generally accepted accounting principles (“GAAP”)GAAP financial measure.measures. We believe that total liquidity provides additional information for measuring
our ability to fund our operations. Total liquidity does not represent, and should not be used as a substitute for, net income or cash flows from operations as determined in accordance with GAAP and total liquidity is not necessarily an indication of whether cash flow will be sufficient to fund our cash requirements. We believe that net debt provides a clearer perspective of the Company’s overall debt situation given the excess borrowings discussed above. Net debt should not be used as a substitute for total debt outstanding as determined in accordance with GAAP.
Below is a reconciliation of cash and cash equivalents to total liquidity:
|
| September 30, 2017 |
|
| December 31, 2016 |
|
| March 31, 2021 |
|
| December 31, 2020 |
| ||||
|
| (In millions) |
|
| (In millions) |
| ||||||||||
|
|
|
|
|
|
|
|
|
|
|
|
|
|
|
|
|
Cash and cash equivalents |
| $ | 74 |
|
| $ | 81 |
|
| $ | 43 |
|
| $ | 61 |
|
Less: Qualified cash pledged as collateral |
|
| (36 | ) |
|
| (31 | ) | ||||||||
Availability under Ryerson Credit Facility and foreign debt facilities |
|
| 317 |
|
|
| 251 |
|
|
| 540 |
|
|
| 312 |
|
Total liquidity |
| $ | 355 |
|
| $ | 301 |
|
| $ | 583 |
|
| $ | 373 |
|
Below is a reconciliation of total debt to net debt:
|
| March 31, 2021 |
|
| December 31, 2020 |
| ||
|
| (In millions) |
| |||||
|
|
|
|
|
|
|
|
|
Total debt |
| $ | 741 |
|
| $ | 740 |
|
Less: cash and cash equivalents |
|
| (43 | ) |
|
| (61 | ) |
Net debt |
| $ | 698 |
|
| $ | 679 |
|
Of the total cash and cash equivalents, as of September 30, 2017,March 31, 2021, $63.4 14.1 million was held in subsidiaries outside the United States which is deemed to be permanently reinvested. Ryerson does not currently foresee a need to repatriate earnings from its non-U.S. subsidiaries. Although Ryerson has historically satisfied needs for more capital in the U.S. through debt or equity issuances, Ryerson could elect to repatriate earnings held in foreign jurisdictions, which could result in higher effective tax rates. We have not recorded a deferred tax liability for the effect of a possible repatriation of these earnings as management intends to permanently reinvest these earnings outside of the U.S. Specific plans for reinvestment include funding for future international acquisitions and funding of existing international operations.
The following table summarizes the Company’s cash flows:
|
| Three Months Ended March 31, |
| |||||
|
| 2021 |
|
| 2020 |
| ||
|
| (In millions) |
| |||||
Net income |
| $ | 25.6 |
|
| $ | 16.4 |
|
Depreciation and amortization |
|
| 13.6 |
|
|
| 13.3 |
|
Deferred income taxes |
|
| 4.5 |
|
|
| 14.6 |
|
Gain on sale of assets |
|
| (20.3 | ) |
|
| — |
|
Change in operating assets and liabilities: |
|
|
|
|
|
|
|
|
Receivables |
|
| (165.2 | ) |
|
| (69.4 | ) |
Inventories |
|
| (12.3 | ) |
|
| (4.1 | ) |
Accounts payable |
|
| 118.5 |
|
|
| 98.5 |
|
Accrued liabilities |
|
| 13.0 |
|
|
| 16.1 |
|
Deferred employee benefit costs |
|
| (18.0 | ) |
|
| (7.7 | ) |
Other operating asset and liability balances |
|
| (19.2 | ) |
|
| (9.1 | ) |
All other operating cash flows |
|
| 12.5 |
|
|
| 4.2 |
|
Net cash provided by (used in) operating activities |
|
| (47.3 | ) |
|
| 72.8 |
|
Capital expenditures |
|
| (6.5 | ) |
|
| (6.9 | ) |
Proceeds from sale of property, plant, and equipment |
|
| 29.0 |
|
|
| — |
|
All other investing cash flows |
|
| (0.5 | ) |
|
| — |
|
Net cash provided by (used in) investing activities |
|
| 22.0 |
|
|
| (6.9 | ) |
Repayment of debt |
|
| (0.4 | ) |
|
| (54.2 | ) |
Net proceeds of short-term borrowings |
|
| 1.2 |
|
|
| 168.2 |
|
Net increase (decrease) in book overdrafts |
|
| 9.4 |
|
|
| (31.2 | ) |
All other financing cash flows |
|
| (2.6 | ) |
|
| (3.4 | ) |
Net cash provided by financing activities |
|
| 7.6 |
|
|
| 79.4 |
|
Effect of exchange rates on cash and cash equivalents |
|
| (0.4 | ) |
|
| (0.4 | ) |
Net increase (decrease) in cash and cash equivalents |
| $ | (18.1 | ) |
| $ | 144.9 |
|
Operating activities. NetWorking capital fluctuates throughout the year based on business needs. Working capital needs tend to be counter-cyclical, meaning that in periods of expansion the Company will use cash usedto fund working capital requirements, but in operating activitiesperiods of $93.3 million incontraction the first nine months of 2017 was primarily due to an increase in inventory of $117.5 million as the value of inventory and the tons in inventory both increased as economic conditions in the metals market improved in the first nine months of 2017, anCompany will generate cash from reduced working capital requirements. The increase in accounts receivable in both first quarter periods is the result of $91.5 million resulting from higher sales levels during the second half of the first quarter compared to the second half of the fourth quarter of the prior year. Inventory levels did not increase significantly in the thirdfirst quarter of 2017 compared to year-end 2016, and pension contributions of $16.5 million. Partially offsetting the cash outflows2021 as stronger metals market conditions were anoffset by supply constraints in replacing tons in inventory.The increase in accounts payable of $66.3 million resulting from a higher level of material purchases at the end of the first ninequarter in both periods is related to increased purchases and operating activities in the first quarter associated with increased sales compared to the fourth quarter of the prior year.
Investing activities. The Company's main investing activities are capital expenditures and proceeds from the sale of property, plant, and equipment. Capital expenditures have decreased slightly year-over-year to $6.5 million for the first three months of 20172021 compared to year-end 2016, non-cash depreciation and amortization expense of $34.1 million and an increase in accrued liabilities of $22.6 million. Net cash used in operating activities of $22.9$6.9 million in the first ninethree months of 2016 was primarily due to an increase in inventory of $67.3 million, an increase in accounts receivable of $54.9 million resulting from higher sales levels in the first nine months of 2016 compared to year-end 2015 and pension contributions of $21.0 million. Offsetting the cash outflows was an increase in accounts payable of $38.2 million due to a higher level of material purchases at the end of the third quarter of 2016 compared to year-end 2015, non-cash depreciation and amortization expense of $31.8 million, net income of $27.3 million and an increase in accrued liabilities of $17.9 million.
Investing activities. During the first nine months of 2017 we paid $49.2 million, net of cash acquired, to acquire all of the issued and outstanding capital stock of The Laserflex Corporation and Guy Metals, Inc. Capital expenditures during the first nine months of 2017 totaled $15.8 million compared to $19.7 million in the first nine months of 2016. 2020. The Company sold property, plant, and equipment and assets held for sale generating cash proceeds of $3.7 million and $3.2$29.0 million during the first ninethree months of 2017 and 2016, respectively.2021.
Financing activities. The Company's main source of liquidity to fund working capital requirements is borrowings on its Credit Facility. Net cash provided by financing activities in the first ninethree months of 20172021 was $144.0$7.6 million compared to $47.0$79.4 million in the first ninethree months of 2016.2020. Net cash provided by financing activities in the first ninethree months of 20172021 was primarily related to an increase in credit facility borrowings of $73.4 million, an increase in book overdrafts of $60.3 million and proceeds of $22.4 million from sale leaseback transactions.$9.4 million. Net cash used inprovided by financing activities in the first ninethree months of 20162020 was primarily related to approximately $166 million of additional funds borrowed at March 31, 2020 to maintain access to cash during the issuanceCOVID-19 pandemic, partially offset by the repurchase of the$54.2 million of our 2022 Notes withand a principal amount of $650.0 million, net proceeds of $71.5 million from the issuance of common stock and an increasedecrease in book overdrafts of $20.1$31.2 million offsetin the first quarter of 2020.
As market conditions warrant and subject to our contractual restrictions, liquidity position, and other factors, we may from time to time seek to repurchase or retire our outstanding debt through cash purchases and/or exchanges for other debt or equity securities in open market transactions, privately negotiated transactions, by tender offer, or otherwise. Any such cash repurchases by us may be funded by cash on hand or incurring new debt. The amounts involved in any such transactions, individually or in the early redemption of $569.9 million principalaggregate, may be material. Furthermore, any such repurchases or exchanges may result in our acquiring and retiring a substantial amount of such indebtedness, which would impact the 2017 Notestrading liquidity of such indebtedness.
In the normal course of business with customers, vendors, and $121.9others, we have entered into off-balance sheet arrangements, such as letters of credit, which totaled $16 million principal amountas of the 2018 Notes. March 31, 2021. We do not have any other material off-balance sheet financing arrangements. Our off-balance sheet arrangements are not likely to have a material effect on our current or future financial condition, results of operations, liquidity, or capital resources.
Capital Resources
We believe that cash flow from operations and proceeds from the Ryerson Credit Facility will provide sufficient funds to meet our contractual obligations and operating requirements in the normal course of business.
As a result ofTotal debt in the acquisitions andCondensed Consolidated Balance Sheet increased to $741.4 million at March 31, 2021 from $740.0 million at December 31, 2020, mainly due to the net cash used in operating activities in the first ninethree months of 2017, total2021, partially offset by a reduction in cash on hand to lower debt in the Condensed Consolidated Balance Sheets in the first nine months of 2017 increased to $1,041.6 million at September 30, 2017balances as well as cash generated from $963.5 million at December 31, 2016.asset sale proceeds.
Total debt outstanding as of September 30, 2017March 31, 2021 consisted of the following amounts: $385.1$282.0 million borrowingborrowings under the Ryerson Credit Facility, $650.0$450.0 million under the 20222028 Notes, $19.5$16.3 million of foreign debt, and $1.7$7.4 million of other debt, less $14.7$14.3 million of unamortized debt issuance costs. Discussion of each of these borrowings follows.
Ryerson Credit Facility
On November 16, 2016, Ryerson entered into an amendment with respectFor further information, see Note 7: Long Term Debt in Part I, Item I - Notes to its $1.0 billion revolving credit facility (as amended, the “Ryerson Credit Facility”), to reduce the total facility size from $1.0 billion (the “Old Credit Facility”) to $750 million, reduce the interest rate on outstanding borrowings by 25 basis points, reduce commitment fees on amounts not borrowed by 2.5 basis points, and to extend the maturity date to November 16, 2021.
At September 30, 2017, Ryerson had $385.1 million of outstanding borrowings, $15 million of letters of credit issued and $291 million available under the Ryerson Credit Facility compared to $312.0 million of outstanding borrowings, $16 million of letters of credit issued and $225 million available at December 31, 2016. Total credit availability is limited by the amount of eligible accounts receivable, inventory, and qualified cash pledged as collateral under the agreement insofar as Ryerson is subject to a borrowing base comprised of the aggregate of these three amounts, less applicable reserves. Eligible accounts receivable, at any date of determination, is comprised of the aggregate value of all accounts directly created by a borrower (and in the case of Canadian accounts, a Canadian guarantor) in the ordinary course of business arising out of the sale of goods or the rendering of services, each of which has been invoiced, with such receivables adjusted to exclude various ineligible accounts, including, among other things, those to which a borrower (or guarantor, as applicable) does not have sole and absolute title and accounts arising out of a sale to an employee, officer, director, or affiliate of a borrower (or guarantor, as applicable). Eligible inventory, at any date of determination, is comprised of the net orderly liquidation value of all inventory owned by a borrower (and in the case of Canadian accounts, a Canadian guarantor). Qualified cash consists of cash in an eligible deposit account that is subject to customary restrictions and liens in favor of the lenders.
The Ryerson Credit Facility has an allocation of $660 million to the Company’s subsidiaries in the United States and an allocation of $90 million to Ryerson Holding’s Canadian subsidiary that is a borrower. Amounts outstanding under the Ryerson Credit Facility bear interest at (i) a rate determined by reference to (A) the base rate (the highest of the Federal Funds Rate plus 0.50%, Bank of America, N.A.’s prime rate and the one-month LIBOR rate plus 1.00%) or (B) a LIBOR rate or, (ii) for Ryerson Holding’s Canadian subsidiary that is a borrower, (A) a rate determined by reference to the Canadian base rate (the greatest of the Federal Funds Rate plus 0.50%, Bank of America-Canada Branch’s “base rate” for commercial loans in U.S. Dollars made at its “base rate” and the 30 day LIBOR rate plus 1.00%), (B) the prime rate (the greater of Bank of America-Canada Branch’s “prime rate” for commercial loans made by it in Canada in Canadian Dollars and the one-month Canadian bankers’ acceptance rate plus 1.00%) or (C) the bankers’ acceptance rate. The spread over the base rate and prime rate is between 0.25% and 0.50% and the spread over the LIBOR and for the bankers’ acceptances is between 1.25% and 1.50%, depending on the amount available to be borrowed under the Ryerson Credit Facility. Overdue amounts and all amounts owed during the existence of a default bear interest at 2% above the rate otherwise applicable thereto. Ryerson also pays commitment fees on amounts not borrowed at a rate of 0.23%.
We attempt to minimize interest rate risk exposure through the utilization of interest rate swaps, which are derivative financial instruments. During March 2017, we entered into an interest rate swap to fix interest on $150 million of our floating rate debt under the Ryerson Credit Facility at a rate of 1.658% through March 2020. The swap has reset dates and critical terms that match our existing debt and the anticipated critical terms of future debt. The weighted average interest rate on the outstanding borrowings under the Ryerson Credit Facility including the interest rate swap was 2.7 percent and 2.2 percent at September 30, 2017 and December 31, 2016, respectively.
Borrowings under the Ryerson Credit Facility are secured by first-priority liens on all of the inventory, accounts receivables, lockbox accounts and related assets of the borrowers and the guarantors.
The Ryerson Credit Facility also contains covenants that, among other things, restrict Ryerson Holding and its restricted subsidiaries with respect to the incurrence of debt, the creation of liens, transactions with affiliates, mergers and consolidations, sales of assets and acquisitions. The Ryerson Credit Facility also requires that, if availability under the Ryerson Credit Facility declines to a certain level, Ryerson maintain a minimum fixed charge coverage ratio as of the end of each fiscal quarter, and includes defaults upon (among other things) the occurrence of a change of control of Ryerson and a cross-default to other financing arrangements.
The Ryerson Credit Facility contains events of default with respect to, among other things, default in the payment of principal when due or the payment of interest, fees and other amounts due thereunder after a specified grace period, material misrepresentations, failure to perform certain specified covenants, certain bankruptcy events, the invalidity of certain security agreements or guarantees, material judgments and the occurrence of a change of control of Ryerson. If such an event of default occurs, the lenders under the Ryerson Credit Facility will be entitled to various remedies, including acceleration of amounts outstanding under the Ryerson Credit Facility and all other actions permitted to be taken by secured creditors.
The lenders under the Ryerson Credit Facility may reject a borrowing request if any event, circumstance or development has occurred that has had or could reasonably be expected to have a material adverse effect on the Company. If Ryerson Holding, JT Ryerson, any of the other borrowers or any restricted subsidiaries of JT Ryerson becomes insolvent or commences bankruptcy proceedings, all amounts borrowed under the Ryerson Credit Facility will become immediately due and payable.
Net proceeds of short-term borrowings that are reflected in the Consolidated Statements of Cash Flows represent borrowings under the Ryerson Credit Facility with original maturities less than three months.
2022 Notes
On May 24, 2016, JT Ryerson issued $650 million in aggregate principal amount of the 2022 Notes (the “2022 Notes”). The 2022 Notes bear interest at a rate of 11.00% per annum. The 2022 Notes are fully and unconditionally guaranteed on a senior secured
basis by all of our existing and future domestic subsidiaries that are co-borrowers or that have guarantee obligations under the Ryerson Credit Facility.
The 2022 Notes and the related guarantees are secured by a first-priority security interest in substantially all of JT Ryerson’s and each guarantor’s present and future assets located in the United States (other than receivables, inventory, cash, deposit accounts and related general intangibles, certain other assets and proceeds thereof), subject to certain exceptions and customary permitted liens. The 2022 Notes and the related guarantees are also secured on a second-priority basis by a lien on the assets that secure JT Ryerson’s and the Company’s obligations under the Ryerson Credit Facility.
The 2022 Notes will be redeemable, in whole or in part, at any time on or after May 15, 2019 at certain redemption prices. The redemption price for the 2022 Notes if redeemed during the twelve months beginning (i) May 15, 2019 is 105.50%, (ii) May 15, 2020 is 102.75%, and (iii) May 15, 2021 and thereafter is 100.00%. JT Ryerson may redeem some or all of the 2022 Notes before May 15, 2019 at a redemption price of 100.00% of the principal amount, plus accrued and unpaid interest, if any, to the redemption date, plus a “make-whole” premium. In addition, JT Ryerson may redeem up to 35% of the 2022 Notes before May 15, 2019 with respect to the 2022 Notes with the net cash proceeds from certain equity offerings at a price equal to 111.00%, with respect to the 2022 Notes, of the principal amount thereof, plus any accrued and unpaid interest, if any. JT Ryerson may be required to make an offer to purchase the 2022 Notes upon the sale of assets or upon a change of control.
The 2022 Notes contain customary covenants that, among other things, limit, subject to certain exceptions, our ability, and the ability of our restricted subsidiaries, to incur additional indebtedness, pay dividends on our capital stock or repurchase our capital stock, make investments, sell assets, engage in acquisitions, mergers or consolidations or create liens or use assets as security in other transactions. Subject to certain exceptions, JT Ryerson may only pay dividends to Ryerson Holding to the extent of 50% of future net income, once prior losses are offset.
The net proceeds from the issuance of the 2022 Notes, along with borrowings under the Ryerson Credit Facility, were used to (i) repurchase and/or redeem in full the $569.9 million balance of JT Ryerson’s 9% Senior Secured Notes due 2017 (the “2017 Notes”), plus accrued and unpaid interest thereon up to, but not including, the repayment date, (ii) repurchase $95 million of the 11.25% Senior Secured Notes due 2018 (the “2018 Notes”), and (iii) pay related fees, expenses and premiums.
The Company applied the provisions of ASC 470-50, “Modifications and Extinguishments” in accounting for the issuance of the 2022 Notes, redemption of the 2017 Notes and partial repurchase of the 2018 Notes. The evaluation of the accounting under ASC 470-50 was performed on a creditor by creditor basis in order to determine if the terms of the debt were substantially different and, as a result, whether to apply modification or extinguishment accounting. For the lenders where it was determined that the terms of the debt were not substantially different, modification accounting was applied. For the remaining lenders, extinguishment accounting was applied. In connection with this debt modification and extinguishment, the Company recorded a $16.0 million loss within other income and (expense), net on the Condensed Consolidated Statement of Comprehensive Income during 2016, primarily attributed to the costs incurred with third parties for arrangement fees, legal and other services related to the modified debt, as well as redemption fees paid to the creditors and unamortized debt issuance costs written off related to the extinguished debt. Additionally, the costs incurred with third parties for arrangement fees, legal and other services related to the extinguished debt and redemption fees paid to the creditors related to the modified debt were capitalized and are being amortized over the life of the modified debt using the effective interest method.Financial Statements.
During the first nine months of 2016, a principal amount of $27.0 million of the 2018 Notes were repurchased for $18.2 million and retired, resulting in the recognition of an $8.8 million gain within other income and (expense), net on the Condensed Consolidated Statement of Comprehensive Income. Including the $16.0 million loss on the redemption of the $569.9 million balance of the 2017 Notes and repurchase of $95.0 million of the 2018 Notes, the Company recognized a total net loss of $7.2 million within other income and (expense), net on the Condensed Consolidated Statement of Comprehensive Income during the first nine months of 2016.
Foreign Debt
At September 30, 2017, Ryerson China’s foreign borrowings were $19.5 million, which were owed to banks in Asia at a weighted average interest rate of 3.9% per annum and secured by inventory and property, plant and equipment. At December 31, 2016, Ryerson China’s foreign borrowings were $19.2 million, which were owed to banks in Asia at a weighted average interest rate of 4.4% per annum and secured by inventory and property, plant and equipment.
Availability under the foreign credit lines was $26 million at September 30, 2017 and December 31, 2016. Letters of credit issued by our foreign subsidiaries were $6 million at September 30, 2017 and December 31, 2016.
At December 31, 2016,2020, pension liabilities exceeded plan assets by $216$154 million. WeThrough the three months ended March 31, 2021, we have made $17 million in pension contributions and we anticipate that we will have a totalan additional minimum required pension contribution of approximately $21$5 million in 2017the remaining nine months of 2021 under the Employee Retirement Income Security Act of 1974 (“ERISA”) and Pension Protection Act in the U.SU.S. and the Ontario Pension Benefits Act in Canada. ThroughThe expected future contributions reflect recent pension funding relief measures under the nine months ended September 30, 2017, we have made $16 millionAmerican Rescue Plan Act (“ARPA”) passed in pensionMarch 2021. We will continue to monitor and update our expected contributions and anticipate an additional $5 million of contributions in the remaining three months of 2017. as further guidance related to ARPA is released. Future contribution requirements depend on the investment returns on plan assets, the impact of discount rates on pension liabilities, and changes in regulatory requirements. We are unable to determine the amount or timing of any such contributions required by ERISA or whether any such contributions would have a material adverse effect on our financial position or cash flows. We
As financial markets continue to stabilize from the negative effects of COVID-19, the return on our pension assets continue to be impacted. Changes in returns on plan assets may affect our plan funding, cash flows, and financial condition. Differences between actual plan asset returns and the expected long-term rate of return on plan assets impact the measurement of the following year’s pension expense and pension funding requirements. However, we believe that cash flow from operations and the Ryerson Credit Facility described above will provide sufficient funds to make the minimum required contributioncontributions in 2017.2021.
Off-Balance Sheet ArrangementsMaterial Cash Requirements
The Company expects to make approximately $756 million in principal payments to satisfy its debt obligations, consisting of $16 million in foreign debt coming due within a year, $8 million of other debt coming due between 2021 through 2024, $282 million for the Ryerson Credit Facility coming due in 2025, and $450 million for the 2028 Notes due in 2028. Please refer to Part I, Item I - Notes to the Condensed Consolidated Financial Statements, Note 7: Long Term Debt for further information.
The Company expects to pay approximately $47 million of interest on the 2028 Notes, Ryerson Credit Facility, foreign debt, and other debt over the next 12 months and $271 million thereafter. Interest payments related to the variable rate debt were estimated using the weighted average interest rate for the Ryerson Credit Facility, including the effect of the interest rate swap.
The Company leases various assets including real estate, trucks, trailers, mobile equipment, processing equipment, and IT equipment. We have noncancelable operating leases expiring at various times through 2032, and finance leases expiring at various times through 2027. The total amount of future lease payments is estimated to be $152 million with $34 million for the next 12 months. Please refer to Part I, Item I - Notes to the Condensed Consolidated Financial Statements, Note 5: Leases for further information.
Purchase obligations with suppliers are entered into when we receive firm sales commitments with certain of our customers. As of March 31, 2021, we had outstanding purchase obligations of approximately $34 million expiring within a year.
Income Taxes
In accordance with ASC 740, “Income Taxes,” the normal course of business with customers, vendors and others, we have entered into off-balance sheet arrangements, such as letters of credit, which totaled $21 million as of September 30, 2017. Additionally, other than normal course long-term operating leases included inCompany calculates its quarterly tax provision based on an estimated effective tax rate for the following Contractual Obligations table, we do not have any material off-balance sheet financing arrangements. None of these off-balance sheet arrangements are likelyyear, applies it to have a material effect on our current or future financial condition,the results of operations, liquidity or capital resources.
Contractual Obligations
The following table presents contractual obligations at September 30, 2017:each interim period, and then adjusts that amount by certain discrete items. Due to volatile macro-economic conditions associated with the COVID-19 pandemic, we may experience fluctuations in our forecasted earnings before income taxes as a result of events which cannot be predicted. As such, the Company's effective tax rate could be subject to unusual volatility as forecasted earnings before income taxes change.
|
| Payments Due by Period |
| |||||||||||||||||
Contractual Obligations (1) |
| Total |
|
| Less than 1 year |
|
| 1 – 3 years |
|
| 4 – 5 years |
|
| After 5 years |
| |||||
|
| (In millions) |
| |||||||||||||||||
|
|
|
|
|
|
|
|
|
|
|
|
|
|
|
|
|
|
|
|
|
2022 Notes |
|
| 650 |
|
|
| — |
|
|
| — |
|
|
| 650 |
|
|
| — |
|
Ryerson Credit Facility |
|
| 385 |
|
|
| — |
|
|
| — |
|
|
| 385 |
|
|
| — |
|
Foreign Debt |
|
| 20 |
|
|
| 20 |
|
|
| — |
|
|
| — |
|
|
| — |
|
Other Debt |
|
| 1 |
|
|
| 1 |
|
|
| — |
|
|
| — |
|
|
| — |
|
Interest on 2022 Notes, Foreign Debt, Other Debt and Ryerson Credit Facility (2) |
|
| 391 |
|
|
| 82 |
|
|
| 164 |
|
|
| 145 |
|
|
| — |
|
Purchase Obligations (3) |
|
| 27 |
|
|
| 27 |
|
|
| — |
|
|
| — |
|
|
| — |
|
Operating Leases |
|
| 83 |
|
|
| 21 |
|
|
| 30 |
|
|
| 19 |
|
|
| 13 |
|
Pension Withdrawal Liability |
|
| 1 |
|
|
| — |
|
|
| — |
|
|
| — |
|
|
| 1 |
|
Capital Lease Obligations |
|
| 31 |
|
|
| 10 |
|
|
| 15 |
|
|
| 6 |
|
|
| — |
|
Total |
| $ | 1,589 |
|
| $ | 161 |
|
| $ | 209 |
|
| $ | 1,205 |
|
| $ | 14 |
|
|
|
|
|
|
|
We maintain a valuation allowance on certain foreign and U.S. federal and state deferred tax assets until such time as in management’s judgment, considering all available positive and negative evidence, and consistent with its past determinations, we determine that these deferred tax assets are more likely than not realizable.
We anticipate that certain statutes of limitation will close within the next twelve months resulting in the reduction of $0.7 million in the reserve for uncertain tax benefits related to various intercompany transactions, with a corresponding income tax benefit of approximately $1.1 million.
transactions.
Recent legislative proposals in the U.S. would repeal the use of the last-in-first-out method of accounting (“LIFO method”) for inventory for U.S. tax purposes. If legislation repealing the use of the LIFO method for tax purposes becomes law, we would expect an increase in the cash taxes we will need to pay over a 10-year period.
Our primary areas of market risk include changes in interest rates, foreign currency exchange rates, and commodity prices.We continually monitor these risks and develop strategies to manage them.
Interest rate risk
We are exposed to market risk related to our fixed-rate and variable-rate long-term debt. Market risk is the potential loss arising from adverse changes in market rates and prices, such as interest rates. We are exposed to market risk related to our fixed-rate and variable-rate long-term debt. Changes in interest rates may affect the market value of our fixed-rate debt. The estimated fair value of our long-term debt and the current portions thereof using quoted market prices ourof Company debt securities recently traded and market-based prices of similar securities for those securities not recently traded was $1,121796.2 million at September 30, 2017March 31, 2021 and $1,034$800.3 million at December 31, 20162020 as compared with the carrying value of $1,042$741.4 million and $964$740.0 million at September 30, 2017March 31, 2021 and December 31, 2016,2020, respectively. We manage interest rate risk in our capital structure by holding a combination of variable and fixed-rate debt.
AWe use interest rate swaps to manage our exposure to interest rate changes. As of March 31, 2021, we have 2 receive variable, pay fixed, interest rate swaps to manage the exposure to variable interest rates of the Ryerson Credit Facility. In June 2019, we entered into a forward agreement for $60 million of “pay fixed” interest at 1.729% through June 2022 and in November 2019, we entered into a forward agreement for $100 million of “pay fixed” interest at 1.539% through November 2022.
Effective November 1, 2020, the Company de-designated its interest rate swaps as cash flow hedges and terminated its hedge accounting treatment. Prior to de-designation, the Company would mark these interest rate swaps to market with all changes in fair value recorded in accumulated other comprehensive income. Subsequent to de-designation, changes in fair value are recorded in current earnings. The fair value of the interest rate swaps as of March 31, 2021 was a net liability of $3.4 million. The Company recognized a gain of $0.6 million related to mark-to-market changes and interest expense of $0.6 million in current earnings for three months ended March 31, 2021. After de-designation, the amounts reclassified from other comprehensive income relate to prior gains and losses that are being amortized into income as the forecasted interest payments affect earnings. The amount reclassified from other comprehensive income for the three-month period ended March 31, 2021 into earnings was a loss of $0.5 million.
After considering the effects of our interest rate swaps, 81% of our debt was at fixed interest rates as of March 31, 2021. Considering the impact of interest rate swaps, a hypothetical 1% increase in interest rates on variable rate debt would have increased interest expense for the first ninethree months of 20172021 by approximately $1.9 million.million
Foreign exchange rate risk
We are subject to exposure from fluctuationsforeign currency risks primarily through our operations in foreign currencies. WeCanada, Mexico, and China and we use foreign currency exchange contracts to hedgereduce our Canadian subsidiaries’ variability in cash flows from the forecasted payment of currencies other than the functional currency. The Canadian subsidiaries’ foreignexposure to currency price fluctuations. Foreign currency contracts wereare principally used to purchase U.S. dollars. We had foreign currency contracts with a U.S. dollar notional amount of $2.1 $4.8 million outstanding at September 30, 2017March 31, 2021 and a net liability value of $0.1 million. We do not currently account for these contracts as hedges but rather mark these contracts to market with a corresponding offset to current earnings. For the ninethree months ended September 30, 2017,March 31, 2021, the Company recognized a loss of $0.1 million loss associated with its foreign currency contracts. A hypothetical strengthening or weakening of 10% in the foreign exchange rates underlying the foreign currency contracts from the market rate as of September 30, 2017March 31, 2021 would increase or decrease the fair value of the foreign currency contracts by $0.2 million.$0.5 million and $0.6 million, respectively.
The currency effects of translating the financial statements of our foreign subsidiaries are included in accumulated other comprehensive loss and will not be recognized in the statementcondensed consolidated statements of operationscomprehensive income until there is a liquidation or sale of those foreign subsidiaries.
Commodity price risk
In general, we purchase metals in an effort to maintain our inventory at levels that we believe to be appropriate to satisfy the anticipated needs of our customers based upon historic buying practices, customer contracts, and market conditions. Our commitments to purchase metals are generally at prevailing market prices in effect at the time we place our orders.
Metal prices can fluctuate significantly due to several factors including changes in foreign and domestic production capacity, raw material availability, metals consumption, and foreign currency rates. Declining metal prices could reduce our revenues, gross profit and net income. From timeDerivative financial instruments are used to time, we may enter into fixed price sales contracts with our customers for certainmanage a limited portion of our inventory components. We may enter into metal commodity futures and options contractsexposure to reduce volatilityfluctuations in the pricecost of these metals.certain commodities. No derivatives are held for trading purposes.
As of September 30, 2017March 31, 2021, we had 517 tons of nickel swap contracts and 8,503133,059 tons of hot roll coil swaps contracts with a net liability value of $12.6 million, 15,676 tons of aluminum swap contracts with a net asset value of $0.1$6.1 million, and $0.5 million, respectively. As638 tons of September 30, 2017, we had 3,402 tons of zinc swap contracts and 15,717 tons of aluminumnickel swap contracts with a net liabilityasset value of $0.7$1.0 million and zero, respectively. . We do not currently account for these swaps as hedges, but rather mark these contracts to market with a corresponding offset to current earnings. For the ninethree months ended September 30, 2017March 31, 2021, wethe Company recognized a gainloss of $2.6$10.7 million associated with our metalits commodity derivatives.
A hypothetical strengthening or weakening of 10% in the commodity prices underlying the commodity derivative contracts from the market rate as of September 30, 2017March 31, 2021 would decreaseincrease or increasedecrease the fair value of commodity derivative contracts by $0.8$1.8 million.
Evaluation of Disclosure Controls and Procedures
We maintain disclosure controls and procedures that are designed to ensure that information required to be disclosed in our reports filed or submitted under the Securities Exchange Act of 1934, as amended, is recorded, processed, summarized, and reported within the time periods specified in the SEC’s rules and forms and that such information is accumulated and communicated to our management, including our Chief Executive Officer and Chief Financial Officer, as appropriate, to allow for timely decisions regarding required disclosure. In designing and evaluating the disclosure controls and procedures, management recognizes that any controls and procedures, no matter how well designed and operated, can provide only reasonable assurance of achieving the desired
control objectives, and management is required to apply its judgment in evaluating the cost-benefit relationship of possible controls and procedures.
As required by SEC Rule 15d-15(b), we carried out an evaluation, under the supervision and with the participation of our management, including the Chief Executive Officer and Chief Financial Officer, of the effectiveness of the design and operation of our disclosure controls and procedures as of the end of the period covered by this report. Based on the evaluation, our Chief Executive Officer and Chief Financial Officer concluded that our disclosure controls and procedures were effective as of September 30, 2017.March 31, 2021.
Changes in Internal Controls Over Financial Reporting
There have been no changes in the Company’s internal controls over financial reporting that have materially affected or are reasonably likely to materially affect the Company’s controls over financial reporting during the quarter ended September 30, 2017.March 31, 2021.
PART II. OTHER INFORMATION
In October 2011,For information concerning legal proceedings as of March 31, 2021, please refer to Note 9 – “Commitments and Contingencies” in the United States Environmental Protection Agency (the “EPA”) named us as one of more than 100 businesses that may be a potentially responsible party fornotes to the Portland Harbor Superfund Site (“Portland Harbor”). On January 6, 2017, the EPA issued its Record of Decision (“ROD”) regarding the site. The ROD includes a combination of dredging, capping and enhanced natural recovery that would take approximately thirteen years to construct plus additional time for monitored natural recovery, at an estimated present value cost of $1.05 billion. The EPA has not yet allocated responsibility for the contamination among the potentially responsible parties, including JT Ryerson. We do not currently have sufficient information available to us to determine whether the ROD will be executed as currently stated, whether and to what extent JT Ryerson may be held responsible for any of the identified contamination, and how much (if any) of the final plan’s costs might ultimately be allocated to JT Ryerson and therefore, management cannot predict the ultimate outcomeunaudited condensed consolidated financial statements included in Part I, Item 1 of this matter or estimate a range of potential loss atReport on Form 10-Q, which is incorporated into this time.
There are various other claims and pending actions against the Company. The amount of liability, if any, for those other claims and actions at September 30, 2017 is not determinable but, in the opinion of management, such liability, if any, will not have a material adverse effect on the Company’s financial position, results of operations or cash flows. We maintain liability insurance coverage to assist in protecting our assets from losses arising from or related to activities associated with business operations.item by reference.
Except for the risk factorfactors below, there have been no material changes relating to this Item from those set forth in Item 1A on the Company’s Annual Report on Form 10-K for the year ended December 31, 2016.2020.
The right to receive payment on the 20222028 Notes and the guarantees will be subordinated to the liabilities of non-guarantor subsidiaries.
The notes and related guarantees are structurally subordinated to all indebtedness of our subsidiaries that are not guarantors of the 20222028 Senior Secured Notes (the “2022“2028 Notes”). While the indenture governing the 20222028 Notes limits the indebtedness and activities of these non-guarantor subsidiaries, holders of indebtedness of, and trade creditors of, non-guarantor subsidiaries, including lenders under bank financing agreements, are entitled to payments of their claims from the assets of such subsidiaries before those assets are made available for distribution to any guarantor, as direct or indirect shareholder. While the non-guarantor subsidiaries have agreed under the indenture not to pledge or encumber their assets (other than with respect to permitted liens) without equally and ratably securing the notes, they will not guarantee the 20222028 Notes notwithstanding any such pledge or encumbrance in favor of the 20222028 Notes.
The non-guarantor subsidiaries represented, respectively, 11.8%10.6% and 5.2%20.8% of our net sales and EBITDA for the ninethree months ended September 30, 2017.March 31, 2021. In addition, these non-guarantor subsidiaries represented respectively, 14.7%12.7% and 9.1%8.1% of our assets and liabilities, as of September 30, 2017.March 31, 2021.
Accordingly, in the event that any of the non-guarantor subsidiaries or joint venture entities become insolvent, liquidates, or otherwise reorganizes:
the creditors of the guarantors (including the holders of the 2022 Notes) will have no right to proceed against such subsidiary’s assets; and
• | the creditors of the guarantors (including the holders of the 2028 Notes) will have no right to proceed against such subsidiary’s assets; and |
the creditors of such non-guarantor subsidiary, including trade creditors, will generally be entitled to payment in full from the sale or other disposal of assets of such subsidiary, as direct or indirect shareholder, and will be entitled to receive any distributions from such subsidiary.
• | the creditors of such non-guarantor subsidiary, including trade creditors, will generally be entitled to payment in full from the sale or other disposal of assets of such subsidiary, as direct or indirect shareholder, and will be entitled to receive any distributions from such subsidiary. |
Items 2, 3, 4, and 5 are not applicableapplicable and have been omitted.
Exhibit | Incorporated by Reference | Filed | ||||||||||
|
| Exhibit Description | Form | File No. | Filing Date | Herewith | ||||||
| ||||||||||||
10.1 | Ryerson Holding Corporation 2014 Omnibus Incentive Plan Nonqualified Stock Option Agreement | X | ||||||||||
31.1 | X | |||||||||||
|
| |||||||||||
31.2 | X | |||||||||||
|
| |||||||||||
32.1* | X | |||||||||||
|
| |||||||||||
32.2* | X | |||||||||||
|
| |||||||||||
101.INS | Inline XBRL Instance Document – the instance document does not appear in the Interactive Data File because its XBRL tags are embedded within the Inline XBRL document. | X | ||||||||||
|
| |||||||||||
101.SCH | Inline XBRL Taxonomy Extension Schema | X | ||||||||||
101.CAL | Inline XBRL Taxonomy Extension Calculation Linkbase Document. | X | ||||||||||
|
| |||||||||||
101.DEF | Inline XBRL Taxonomy Extension Definition Linkbase | X | ||||||||||
|
| |||||||||||
|
| |||||||||||
|
| |||||||||||
101.LAB | Inline XBRL Taxonomy Extension Label Linkbase | X | ||||||||||
|
| |||||||||||
101.PRE | Inline XBRL Taxonomy Extension Presentation Linkbase | X | ||||||||||
104 | Cover Page Interactive Data File (embedded within the Inline XBRL document) | |||||||||||
*In accordance with SEC Release 33-8238, Exhibits 32.1 and 32.2 are being furnished herewith and not filed.
SIGNATURE
Pursuant to the requirements of the Securities Exchange Act of 1934, the Company has duly caused this report to be signed on its behalf by the undersigned thereunto duly authorized.
RYERSON HOLDING CORPORATION | ||||
|
| |||
By: | /s/ | |||
|
Executive Vice President and Chief Financial Officer
| |||
Date: November 7, 2017May 5, 2021
3436