| |
| x | QUARTERLY REPORT PURSUANT TO SECTION 13 OR 15(d) OF THE SECURITIES EXCHANGE ACT OF 1934 |
March 31, 2020
| |
| ¨ | TRANSITION REPORT PURSUANT TO SECTION 13 OR 15(d) OF THE SECURITIES EXCHANGE ACT OF 1934 |

WMIH Corp.
|
| |||
| Delaware | 91-1653725 | |||
| (State or other jurisdiction of | ( Identification No.) | |||
|
| |||
8950 Cypress Waters Blvd, Coppell, TX | 75019 | |||
| (Address of principal executive offices) | (Zip Code) | |||
| (469) 549-2000 | ||||
| Registrant’s telephone number, including area code | ||||
| Title of each class | Trading Symbol(s) | Name of each exchange on which registered |
| Common stock, $0.01 par value per share | COOP | The Nasdaq Stock Market |
(206) 922-2957
(Registrant’s telephone number, including area code)
|
|
|
| |||||||
| ¨ |
| x | |||||||
| Non-Accelerated Filer | ¨ | Smaller reporting company |
| |||||||
| Emerging growth company |
| ¨ | ||||||||
Indicate the number
|
| |||
|
| |||
Forward-Looking Statements
Certain information included in this Quarterly Report on Form 10-Q and the documents incorporated herein by reference contain “forward-looking statements” within the meaning of the Private Securities Litigation Reform Act of 1995, Section 27A of the Securities Act of 1933, as amended (the “Securities Act”), and Section 21E of the Securities Exchange Act of 1934, as amended (the “Exchange Act”). All statements other than statements of historical fact included in this Quarterly Report on Form 10-Q that address activities, events, conditions or developments that we expect, believe or anticipate will or may occur in the future are forward-looking statements. Forward-looking statements give our current expectations and projections relating to our financial condition, results of operations, plans, objectives, future performance and business and these statements are not guarantees of future performance. These statements can be identified by the fact that they do not relate strictly to historical or current facts. Forward-looking statements may include the words “anticipate,” “estimate,” “expect,” “project,” “intend,” “plan,” “believe,” “strategy,” “future,” “opportunity,” “may,” “should,” “will,” “would,” “will be,” “will continue,” “will likely result” and similar expressions. Such forward-looking statements involve risks and uncertainties that may cause actual events, results or performance to differ materially from those indicated by such statements. Some of these risks are identified and discussed under Risk Factors in Part I, Item 1A of our Annual Report on Form 10-K for the year ended December 31, 2016. These risk factors will be important to consider in determining future results and should be reviewed in their entirety. These forward-looking statements are expressed in good faith and we believe there is a reasonable basis for them. However, there can be no assurance that the events, results or trends identified in these forward-looking statements will occur or be achieved. Forward-looking statements speak only as of the date they are made, and we do not undertake to update any forward-looking statement, except as required by law.
* * * * *
As used in this Quarterly Report on Form 10-Q, unless the context requires otherwise, (i) the terms “Company,” “we,” “us,” or “our” refer to WMIH Corp. (formerly WMI Holdings Corp.) and its subsidiaries on a consolidated basis; (ii) “WMIH” refers only to WMIH Corp., without regard to its subsidiaries; (iii) “WMIHC” refers only to WMI Holdings Corp., without regard to its subsidiaries; (iv) “WMMRC” means WM Mortgage Reinsurance Company, Inc. (a wholly-owned subsidiary of WMIH); and (v) “WMIIC” means WMI Investment Corp. (a wholly-owned subsidiary of WMIH).
1
FORM 10-Q
INDEX
| |||
| Page | |||
| PART I | |||
| Item 1. | |||
Consolidated Balance Sheets as of March 31, 2020 (unaudited) and December 31, 2019 | |||
Consolidated Statements of Operations (unaudited) for the Three Months Ended March 31, 2020 and Three Months Ended March 31, 2019 | |||
Consolidated Statements of Stockholders’ Equity (unaudited) for the Three Months Ended March 31, 2020 and Three Months Ended March 31, 2019 | |||
Consolidated Statements of Cash Flows (unaudited) for the Three Months Ended March 31, 2020 and Three Months Ended March 31, 2019 | |||
| |||
| Item 2. |
| ||
| Item 3. |
| ||
| Item 4. |
| ||
| PART II | |||
| Item 1. |
| ||
| Item 1A. |
| ||
| |||
| Item 2. |
| ||
| Item 3. | |||
| Item 4. | |||
| Item 5. | |||
| Item 6. | |||
2
FINANCIAL INFORMATION
WMIH CORP. AND SUBSIDIARIES
CONDENSED
(Unaudited)
| September 30, 2017 |
|
| December 31, 2016 (1) |
| ||
ASSETS: |
|
|
|
|
|
|
|
Investments held in trust: |
|
|
|
|
|
|
|
Fixed-maturity securities | $ | 9,022 |
|
| $ | 29,206 |
|
Cash equivalents held in trust |
| 6,804 |
|
|
| 2,176 |
|
Total investments held in trust |
| 15,826 |
|
|
| 31,382 |
|
Cash and cash equivalents |
| 25,542 |
|
|
| 2,491 |
|
Fixed-maturity securities |
| 1,400 |
|
|
| 47,625 |
|
Restricted cash |
| 577,220 |
|
|
| 573,347 |
|
Derivative asset - embedded conversion feature |
| 111,877 |
|
|
| 80,651 |
|
Accrued investment income |
| 109 |
|
|
| 187 |
|
Other assets |
| 764 |
|
|
| 507 |
|
Total assets | $ | 732,738 |
|
| $ | 736,190 |
|
LIABILITIES, REDEEMABLE CONVERTIBLE PREFERRED STOCK AND STOCKHOLDERS’ EQUITY |
|
|
|
|
|
|
|
Liabilities: |
|
|
|
|
|
|
|
Notes payable - principal | $ | — |
|
| $ | 18,774 |
|
Notes payable - interest |
| — |
|
|
| 203 |
|
Losses and loss adjustment reserves |
| 705 |
|
|
| 811 |
|
Losses payable |
| 29 |
|
|
| 53 |
|
Unearned premiums |
| 33 |
|
|
| 270 |
|
Accrued ceding commissions |
| 57 |
|
|
| 22 |
|
Loss contract reserve |
| — |
|
|
| 5,645 |
|
Other liabilities |
| 13,774 |
|
|
| 14,063 |
|
Total liabilities |
| 14,598 |
|
|
| 39,841 |
|
Commitments and contingencies |
|
|
|
|
|
|
|
Redeemable convertible series B preferred stock, $0.00001 par value; 600,000 shares issued and outstanding as of September 30, 2017 and December 31, 2016; aggregate liquidation preference of $600,000,000 as of September 30, 2017 and December 31, 2016 |
| 502,213 |
|
|
| 502,213 |
|
Stockholders’ equity: |
|
|
|
|
|
|
|
Convertible series A preferred stock, $0.00001 par value; 1,000,000 shares issued and outstanding as of September 30, 2017 and December 31, 2016; aggregate liquidation preference of $10 as of September 30, 2017 and December 31, 2016 |
| — |
|
|
| — |
|
Common stock, $0.00001 par value; 3,500,000,000 authorized; 206,714,132 and 206,380,800 shares issued and outstanding as of September 30, 2017 and December 31, 2016, respectively |
| 2 |
|
|
| 2 |
|
Additional paid-in capital |
| 108,830 |
|
|
| 108,415 |
|
Retained earnings |
| 107,095 |
|
|
| 85,719 |
|
Total stockholders’ equity |
| 215,927 |
|
|
| 194,136 |
|
Total liabilities, redeemable convertible preferred stock and stockholders’ equity | $ | 732,738 |
|
| $ | 736,190 |
|
The
| March 31, 2020 | December 31, 2019 | ||||||
| (unaudited) | |||||||
| Assets | |||||||
| Cash and cash equivalents | $ | 579 | $ | 329 | |||
| Restricted cash | 266 | 283 | |||||
| Mortgage servicing rights, $3,109 and $3,496 at fair value, respectively | 3,115 | 3,502 | |||||
| Advances and other receivables, net of reserves of $193 and $175, respectively | 685 | 988 | |||||
| Reverse mortgage interests, net of reserves of $3 and $3, respectively | 5,955 | 6,279 | |||||
| Mortgage loans held for sale at fair value | 3,922 | 4,077 | |||||
| Property and equipment, net of accumulated depreciation of $65 and $55, respectively | 111 | 112 | |||||
| Deferred tax assets, net | 1,411 | 1,345 | |||||
| Other assets | 1,569 | 1,390 | |||||
| Total assets | $ | 17,613 | $ | 18,305 | |||
| Liabilities and Stockholders’ Equity | |||||||
| Unsecured senior notes, net | $ | 2,259 | $ | 2,366 | |||
| Advance facilities, net | 489 | 422 | |||||
| Warehouse facilities, net | 4,551 | 4,575 | |||||
| Payables and other liabilities | 1,965 | 2,016 | |||||
| MSR related liabilities - nonrecourse at fair value | 1,285 | 1,348 | |||||
| Mortgage servicing liabilities | 53 | 61 | |||||
| Other nonrecourse debt, net | 4,945 | 5,286 | |||||
| Total liabilities | 15,547 | 16,074 | |||||
| Commitments and contingencies (Note 18) | |||||||
| Preferred stock at $0.00001 - 10 million shares authorized, 1 million shares issued and outstanding, respectively; aggregate liquidation preference of ten dollars, respectively | — | — | |||||
| Common stock at $0.01 par value - 300 million shares authorized, 92.0 million and 91.1 million shares issued, respectively | 1 | 1 | |||||
| Additional paid-in-capital | 1,108 | 1,109 | |||||
| Retained earnings | 961 | 1,122 | |||||
| Total Mr. Cooper stockholders’ equity | 2,070 | 2,232 | |||||
| Non-controlling interests | (4 | ) | (1 | ) | |||
| Total stockholders’ equity | 2,066 | 2,231 | |||||
| Total liabilities and stockholders’ equity | $ | 17,613 | $ | 18,305 | |||
(1)Balances derived from audited financial statements as of December 31, 2016.(unaudited).
3
CONDENSED
(Unaudited)
| Three months ended September 30, 2017 |
|
| Three months ended September 30, 2016 |
|
| Nine months ended September 30, 2017 |
|
| Nine months ended September 30, 2016 |
| ||||
Revenues: |
|
|
|
|
|
|
|
|
|
|
|
|
|
|
|
Premiums earned | $ | 344 |
|
| $ | 786 |
|
| $ | 1,103 |
|
| $ | 2,426 |
|
Net investment income |
| 1,943 |
|
|
| 498 |
|
|
| 4,826 |
|
|
| 1,747 |
|
Total revenues |
| 2,287 |
|
|
| 1,284 |
|
|
| 5,929 |
|
|
| 4,173 |
|
Operating expenses: |
|
|
|
|
|
|
|
|
|
|
|
|
|
|
|
Losses and loss adjustment expense |
| 48 |
|
|
| 183 |
|
|
| 207 |
|
|
| 702 |
|
Ceding commission expense |
| 44 |
|
|
| 75 |
|
|
| 137 |
|
|
| 234 |
|
General and administrative expense |
| 2,117 |
|
|
| 1,357 |
|
|
| 5,915 |
|
|
| 4,878 |
|
Loss contract reserve reduction |
| (210 | ) |
|
| (565 | ) |
|
| (5,645 | ) |
|
| (2,362 | ) |
Interest expense |
| 579 |
|
|
| 636 |
|
|
| 1,788 |
|
|
| 1,994 |
|
Total operating expenses |
| 2,578 |
|
|
| 1,686 |
|
|
| 2,402 |
|
|
| 5,446 |
|
Net operating (loss) income |
| (291 | ) |
|
| (402 | ) |
|
| 3,527 |
|
|
| (1,273 | ) |
Other (income) expense: |
|
|
|
|
|
|
|
|
|
|
|
|
|
|
|
Other (income) |
| (123 | ) |
|
| — |
|
|
| (123 | ) |
|
| — |
|
Unrealized (gain) loss on change in fair value of derivative embedded conversion feature |
| (38,579 | ) |
|
| 16,243 |
|
|
| (31,226 | ) |
|
| (62,587 | ) |
Total other (income) expense |
| (38,702 | ) |
|
| 16,243 |
|
|
| (31,349 | ) |
|
| (62,587 | ) |
Income (loss) before income taxes |
| 38,411 |
|
|
| (16,645 | ) |
|
| 34,876 |
|
|
| 61,314 |
|
Income tax expense (benefit) |
| — |
|
|
| — |
|
|
| — |
|
|
| — |
|
Net income (loss) |
| 38,411 |
|
|
| (16,645 | ) |
|
| 34,876 |
|
|
| 61,314 |
|
Redeemable convertible series B preferred stock dividends |
| (4,500 | ) |
|
| (4,500 | ) |
|
| (13,500 | ) |
|
| (13,500 | ) |
Net income (loss) attributable to common and participating stockholders | $ | 33,911 |
|
| $ | (21,145 | ) |
| $ | 21,376 |
|
| $ | 47,814 |
|
Basic net income (loss) per share attributable to common stockholders (Note 12) | $ | 0.06 |
|
| $ | (0.10 | ) |
| $ | 0.04 |
|
| $ | 0.10 |
|
Shares used in computing basic net income (loss) per share |
| 202,660,492 |
|
|
| 202,341,209 |
|
|
| 202,573,315 |
|
|
| 202,247,275 |
|
Diluted net income (loss) per share attributable to common stockholders (Note 12) | $ | 0.06 |
|
| $ | (0.10 | ) |
| $ | 0.04 |
|
| $ | 0.09 |
|
Shares used in computing diluted net income (loss) per share |
| 212,726,121 |
|
|
| 202,341,209 |
|
|
| 212,638,944 |
|
|
| 237,575,014 |
|
The
| Three Months Ended March 31, 2020 | Three Months Ended March 31, 2019 | ||||||
| Revenues: | |||||||
| Service related, net | $ | (53 | ) | $ | 84 | ||
| Net gain on mortgage loans held for sale | 331 | 166 | |||||
| Total revenues | 278 | 250 | |||||
| Expenses: | |||||||
| Salaries, wages and benefits | 246 | 215 | |||||
| General and administrative | 198 | 228 | |||||
| Total expenses | 444 | 443 | |||||
| Other income (expenses), net: | |||||||
| Interest income | 118 | 134 | |||||
| Interest expense | (192 | ) | (189 | ) | |||
| Other income, net | 1 | 15 | |||||
| Total other income (expenses), net | (73 | ) | (40 | ) | |||
| Loss before income tax benefit | (239 | ) | (233 | ) | |||
| Less: Income tax benefit | (68 | ) | (47 | ) | |||
| Net loss | (171 | ) | (186 | ) | |||
| Less: Net loss attributable to non-controlling interests | (3 | ) | — | ||||
| Net loss attributable to Mr. Cooper | (168 | ) | (186 | ) | |||
| Less: Undistributed earnings attributable to participating stockholders | — | — | |||||
| Net loss attributable to common stockholders | $ | (168 | ) | $ | (186 | ) | |
| Net loss per common share attributable to Mr. Cooper: | |||||||
| Basic | $ | (1.84 | ) | $ | (2.05 | ) | |
| Diluted | $ | (1.84 | ) | $ | (2.05 | ) | |
4
statements (unaudited).
CONDENSED
PREFERRED STOCK AND STOCKHOLDERS’ EQUITY
(Unaudited)
| Series B Redeemable Convertible Preferred Stock |
|
|
| Series A Convertible Preferred Stock |
|
|
| Common Stock |
|
|
|
|
|
|
|
|
|
|
|
|
| |||||||||||||||
| Shares |
|
| Amount |
|
|
| Shares |
|
| Amount |
|
|
| Shares |
|
| Amount |
|
| Additional paid-in capital |
|
| (Accumulated deficit) retained earnings |
|
| Total stockholders’ equity |
| |||||||||
Balance at January 1, 2016 |
| 600,000 |
|
|
| 502,213 |
|
|
|
| 1,000,000 |
|
|
| — |
|
|
|
| 206,168,035 |
|
|
| 2 |
|
|
| 107,757 |
|
|
| (97,981 | ) |
|
| 9,778 |
|
Net income |
| — |
|
|
| — |
|
|
|
| — |
|
|
| — |
|
|
|
| — |
|
|
| — |
|
|
| — |
|
|
| 201,700 |
|
|
| 201,700 |
|
Redeemable convertible series B preferred stock dividends |
| — |
|
|
| — |
|
|
|
| — |
|
|
| — |
|
|
|
| — |
|
|
| — |
|
|
| — |
|
|
| (18,000 | ) |
|
| (18,000 | ) |
Issuance of common stock under restricted stock compensation arrangement |
| — |
|
|
| — |
|
|
|
| — |
|
|
| — |
|
|
|
| 212,765 |
|
|
| — |
|
|
| — |
|
|
| — |
|
|
| — |
|
Equity-based compensation |
| — |
|
|
| — |
|
|
|
| — |
|
|
| — |
|
|
|
| — |
|
|
| — |
|
|
| 658 |
|
|
| — |
|
|
| 658 |
|
Balance at December 31, 2016 |
| 600,000 |
|
|
| 502,213 |
|
|
|
| 1,000,000 |
|
|
| — |
|
|
|
| 206,380,800 |
|
|
| 2 |
|
|
| 108,415 |
|
|
| 85,719 |
|
|
| 194,136 |
|
Net income |
| — |
|
|
| — |
|
|
|
| — |
|
|
| — |
|
|
|
| — |
|
|
| — |
|
|
| — |
|
|
| 34,876 |
|
|
| 34,876 |
|
Redeemable convertible series B preferred stock dividends |
| — |
|
|
| — |
|
|
|
| — |
|
|
| — |
|
|
|
| — |
|
|
| — |
|
|
| — |
|
|
| (13,500 | ) |
|
| (13,500 | ) |
Issuance of common stock under restricted stock compensation arrangement |
| — |
|
|
| — |
|
|
|
| — |
|
|
| — |
|
|
|
| 333,332 |
|
|
| — |
|
|
| — |
|
|
| — |
|
|
| — |
|
Equity-based compensation |
| — |
|
|
| — |
|
|
|
| — |
|
|
| — |
|
|
|
| — |
|
|
| — |
|
|
| 415 |
|
|
| — |
|
|
| 415 |
|
Balance at September 30, 2017 |
| 600,000 |
|
| $ | 502,213 |
|
|
|
| 1,000,000 |
|
| $ | — |
|
|
|
| 206,714,132 |
|
| $ | 2 |
|
| $ | 108,830 |
|
| $ | 107,095 |
|
| $ | 215,927 |
|
The
| Preferred Stock | Common Stock | |||||||||||||||||||||||||||||||||
| Shares (in thousands) | Amount | Shares (in thousands) | Amount | Additional Paid-in Capital | Retained Earnings | Total Mr. Cooper Stockholders’ Equity | Non-controlling Interests | Total Equity | ||||||||||||||||||||||||||
| Balance at January 1, 2019 | 1,000 | $ | — | 90,821 | $ | 1 | $ | 1,093 | $ | 848 | $ | 1,942 | $ | 3 | $ | 1,945 | ||||||||||||||||||
| Shares issued / (surrendered) under incentive compensation plan | — | — | 221 | — | (2 | ) | — | (2 | ) | — | (2 | ) | ||||||||||||||||||||||
| Share-based compensation | — | — | — | — | 4 | — | 4 | — | 4 | |||||||||||||||||||||||||
| Net loss | — | — | — | — | — | (186 | ) | (186 | ) | — | (186 | ) | ||||||||||||||||||||||
| Balance at March 31, 2019 | 1,000 | $ | — | 91,042 | $ | 1 | $ | 1,095 | $ | 662 | $ | 1,758 | $ | 3 | $ | 1,761 | ||||||||||||||||||
| Balance at January 1, 2020 | 1,000 | $ | — | 91,118 | $ | 1 | $ | 1,109 | $ | 1,122 | $ | 2,232 | $ | (1 | ) | $ | 2,231 | |||||||||||||||||
| Shares issued / (surrendered) under incentive compensation plan | — | — | 852 | — | (5 | ) | — | (5 | ) | — | (5 | ) | ||||||||||||||||||||||
| Share-based compensation | — | — | — | — | 4 | — | 4 | — | 4 | |||||||||||||||||||||||||
| Cumulative effect adjustments pursuant to the adoption of ASU 2016-13 | — | — | — | — | — | 7 | 7 | — | 7 | |||||||||||||||||||||||||
| Net loss | — | — | — | — | — | (168 | ) | (168 | ) | (3 | ) | (171 | ) | |||||||||||||||||||||
| Balance at March 31, 2020 | 1,000 | $ | — | 91,970 | $ | 1 | $ | 1,108 | $ | 961 | $ | 2,070 | $ | (4 | ) | $ | 2,066 | |||||||||||||||||
5
statements (unaudited).
CONDENSED
(Unaudited)
| Nine months ended September 30, 2017 |
| Nine months ended September 30, 2016 |
| ||
Cash flows from operating activities: |
|
|
|
|
|
|
Net income | $ | 34,876 |
| $ | 61,314 |
|
Adjustments to reconcile net income to net cash (used in) operating activities: |
|
|
|
|
|
|
Amortization of premium or discount on fixed maturity securities |
| 108 |
|
| 247 |
|
Net realized loss (gain) on sale of investments |
| 63 |
|
| (19 | ) |
Unrealized (gain) on trading securities |
| (67 | ) |
| (83 | ) |
Unrealized (gain) on derivative embedded conversion feature |
| (31,226 | ) |
| (62,587 | ) |
Equity-based compensation |
| 415 |
|
| 484 |
|
Changes in assets and liabilities: |
|
|
|
|
|
|
Accrued investment income |
| 78 |
|
| (18 | ) |
Other assets |
| (257 | ) |
| (270 | ) |
Cash equivalents held in trust |
| (4,628 | ) |
| 1,358 |
|
Restricted cash |
| (3,873 | ) |
| (1,476 | ) |
Losses and loss adjustment reserves |
| (106 | ) |
| (2,733 | ) |
Losses payable |
| (24 | ) |
| (395 | ) |
Unearned premiums |
| (237 | ) |
| (463 | ) |
Accrued ceding commission expense |
| 35 |
|
| (8 | ) |
Accrued interest on notes payable |
| (203 | ) |
| (24 | ) |
Loss contract reserve |
| (5,645 | ) |
| (2,362 | ) |
Other liabilities |
| (289 | ) |
| (626 | ) |
Total adjustments |
| (45,856 | ) |
| (68,975 | ) |
Net cash used in operating activities |
| (10,980 | ) |
| (7,661 | ) |
Cash flows from investing activities: |
|
|
|
|
|
|
Purchase of investments |
| (19,973 | ) |
| (130,469 | ) |
Proceeds from sales and maturities of investments |
| 86,278 |
|
| 146,920 |
|
Net cash provided by investing activities |
| 66,305 |
|
| 16,451 |
|
Cash flows from financing activities: |
|
|
|
|
|
|
Redeemable convertible series B preferred stock dividends |
| (13,500 | ) |
| (13,500 | ) |
Notes payable – principal repayments |
| (18,774 | ) |
| (2,185 | ) |
Net cash used in financing activities |
| (32,274 | ) |
| (15,685 | ) |
Increase (decrease) in cash and cash equivalents |
| 23,051 |
|
| (6,895 | ) |
Cash and cash equivalents, beginning of period |
| 2,491 |
|
| 9,924 |
|
Cash and cash equivalents, end of period | $ | 25,542 |
| $ | 3,029 |
|
Supplementary disclosure of cash flow information: |
|
|
|
|
|
|
Cash paid during the period: |
|
|
|
|
|
|
Interest | $ | 1,991 |
| $ | 2,008 |
|
The
| Three Months Ended March 31, 2020 | Three Months Ended March 31, 2019 | ||||||
| Operating Activities | |||||||
| Net loss | $ | (171 | ) | $ | (186 | ) | |
| Adjustments to reconcile net loss to net cash attributable to operating activities: | |||||||
| Deferred tax benefit | (68 | ) | (47 | ) | |||
| Net gain on mortgage loans held for sale | (331 | ) | (166 | ) | |||
| Interest income on reverse mortgage loans | (62 | ) | (82 | ) | |||
| Provision for reserves | 8 | 11 | |||||
| Fair value changes and amortization/accretion of mortgage servicing rights/liabilities | 526 | 379 | |||||
| Fair value changes in excess spread financing | (35 | ) | (69 | ) | |||
| Fair value changes in mortgage servicing rights financing liability | 6 | 2 | |||||
| Fair value changes in mortgage loans held for investment | — | (1 | ) | ||||
| Amortization of premiums, net of discount accretion | 23 | 2 | |||||
| Depreciation and amortization for property and equipment and intangible assets | 19 | 21 | |||||
| Share-based compensation | 4 | 4 | |||||
| Other loss | 7 | — | |||||
| Repurchases of forward loan assets out of Ginnie Mae securitizations | (919 | ) | (364 | ) | |||
| Mortgage loans originated and purchased for sale, net of fees | (12,375 | ) | (5,717 | ) | |||
| Sales proceeds and loan payment proceeds for mortgage loans held for sale and held for investment | 13,724 | 6,197 | |||||
| Changes in assets and liabilities: | |||||||
| Advances and other receivables | 300 | 120 | |||||
| Reverse mortgage interests | 400 | 614 | |||||
| Other assets | (91 | ) | (216 | ) | |||
| Payables and other liabilities | (255 | ) | (217 | ) | |||
| Net cash attributable to operating activities | 710 | 285 | |||||
| Investing Activities | |||||||
| Acquisitions, net of cash acquired | — | (85 | ) | ||||
| Property and equipment additions, net of disposals | (12 | ) | (10 | ) | |||
| Purchase of forward mortgage servicing rights, net of liabilities incurred | (27 | ) | (130 | ) | |||
| Proceeds on sale of forward and reverse mortgage servicing rights | 43 | 243 | |||||
| Net cash attributable to investing activities | 4 | 18 | |||||
| Three Months Ended March 31, 2020 | Three Months Ended March 31, 2019 | ||||||
| Financing Activities | |||||||
| (Decrease) increase in warehouse facilities | (25 | ) | 307 | ||||
| Increase (decrease) in advance facilities | 68 | (30 | ) | ||||
| Repayment of notes payable | — | (294 | ) | ||||
| Proceeds from sale of HECM securitizations | — | 20 | |||||
| Repayment of HECM securitizations | (99 | ) | (127 | ) | |||
| Proceeds from issuance of participating interest financing in reverse mortgage interests | 55 | 86 | |||||
| Repayment of participating interest financing in reverse mortgage interests | (330 | ) | (494 | ) | |||
| Proceeds from the issuance of excess spread financing | 24 | 245 | |||||
| Settlements and repayments of excess spread financing | (58 | ) | (50 | ) | |||
| Issuance of unsecured senior debt | 600 | — | |||||
| Repayment of nonrecourse debt – legacy assets | — | (3 | ) | ||||
| Redemption and repayment of unsecured senior notes | (698 | ) | — | ||||
| Repayment of finance lease liability | (1 | ) | (1 | ) | |||
| Surrender of shares relating to stock vesting | (5 | ) | (2 | ) | |||
| Debt financing costs | (12 | ) | (1 | ) | |||
| Net cash attributable to financing activities | (481 | ) | (344 | ) | |||
| Net increase (decrease) in cash, cash equivalents, and restricted cash | 233 | (41 | ) | ||||
| Cash, cash equivalents, and restricted cash - beginning of period | 612 | 561 | |||||
Cash, cash equivalents, and restricted cash - end of period(1) | $ | 845 | $ | 520 | |||
| Supplemental Disclosures of Cash Activities | |||||||
| Cash paid for interest expense | $ | 89 | $ | 74 | |||
(1) | The following table provides a reconciliation of cash, cash equivalents and restricted cash to amount reported within the consolidated balance sheets. |
| March 31, 2020 | March 31, 2019 | ||||||
| Cash and cash equivalents | $ | 579 | $ | 181 | |||
| Restricted cash | 266 | 339 | |||||
| Total cash, cash equivalents, and restricted cash | $ | 845 | $ | 520 | |||
6
NOTES TO CONDENSED CONSOLIDATED FINANCIAL STATEMENTS
(Unaudited)
Unless otherwise indicated, financial information, including dollar values statedlargest home loan originators and servicers in the textcountry focused on delivering a variety of the notesservicing and lending products, services and technologies. Xome provides real estate data as well as a range of services including real estate brokerage, title, closing, valuation and field services to financial statements,lenders, investors and consumers. The Company’s corporate website is expressed in thousands.
References herein, unless the context requires otherwise, to (i) the terms “Company,” “we,” “us” or “our” generally are intended to refer to WMIH Corp. (formerly WMI Holdings Corp.) and its subsidiaries on a consolidated basis; (ii) “WMIH” refers only to WMIH Corp. without regard to its subsidiaries; (iii) “WMIHC” refers only to WMI Holdings Corp. without regard to its subsidiaries; (iv) “WMMRC” means WM Mortgage Reinsurance Company, Inc. (a wholly-owned subsidiary of WMIH); and (v) “WMIIC” means WMI Investment Corp. (a wholly-owned subsidiary of WMIH)located at
Note 1: The Company has provided a glossary of terms, which defines certain industry-specific and its Subsidiaries
WMIH Corp.
other terms that are used herein, in the MD&A section of this Form 10-Q.
WMIH, formerly known as WMIHC and Washington Mutual, Inc. (“WMI”), is the direct parent of WM Mortgage Reinsurance Company, Inc., a Hawaii corporation (“WMMRC”), and WMI Investment Corp., a Delaware corporation (“WMIIC”). Since the emergence from bankruptcy on March 19, 2012, our business activities consist of operating WMMRC’s legacy reinsurance business in runoff mode. In addition, we are actively seeking acquisition opportunities across a broad array of industries with a specific focus in the financial services industry, including targets with consumer finance, specialty finance, leasing and insurance operations.
As of September 30, 2017, WMIH was authorized to issue up to 3,500,000,000 shares of common stock, and up to 10,000,000 shares of preferred stock (in one or more series), in each case with a par value of $0.00001 per share. As of September 30, 2017 and December 31, 2016, 206,714,132 and 206,380,800 shares, respectively, of WMIH’s common stock were issued and outstanding. As of September 30, 2017 and December 31, 2016, 1,000,000 shares of WMIH’s Series A Convertible Preferred Stock (the “Series A Preferred Stock”) were issued and outstanding. As of September 30, 2017 and December 31, 2016, 600,000 shares of WMIH’s 3% Series B Convertible Preferred Stock (the “Series B Preferred Stock”) were issued and outstanding.
While we remain committed to consummating an acquisition, we also are mindful that the Company’s Series B Preferred Stock is redeemable on January 5, 2018 if we have not consummated a Qualified Acquisition, as more fully described in Note 6: Service Agreements and Related Party Transactions, or executed a definitive agreement to consummate an Acquisition (as such term is defined in Article VI of WMIH’s Amended and Restated Certificate of Incorporation (the “Certificate of Incorporation”)), prior to that date. Accordingly, as previously disclosed, we formed the Finance Committee of the Company’s Board of Directors (the “Finance Committee”), comprised solely of independent directors, to explore potential financing and refinancing alternatives, including the potential restructuring or refinancing of the Series B Preferred Stock. The Finance Committee has retained financial advisors to provide certain financial advisory services in connection with the Finance Committee’s mandate to review the Company’s capital structure and potential financing alternatives. There can be no assurance that any transaction, including a refinancing of the Series B Preferred Stock, will occur or if so on what terms.
WMMRC
WMMRC is a wholly-owned subsidiary of WMIH. Prior to August 2008 (at which time WMMRC became a direct subsidiary of WMI)WMIH merged with and into Nationstar Mortgage Holdings Inc. (“Nationstar”), WMMRC waswith Nationstar continuing as a wholly-owned subsidiary of FA Out-of-State Holdings, Inc., a second-tier subsidiary of Washington Mutual Bank (“WMB”) and third-tier subsidiary of WMI. WMMRC is a pure captive insurance company domiciled in the State of Hawaii. WMMRC was incorporated on February 25, 2000, and received a Certificate of Authority, dated March 2, 2000, from the Insurance Division of the State of Hawaii.
WMMRC was originally organized to reinsure private mortgage insurance risk for seven primary mortgage insurers then offering private mortgage insurance on loans originated or purchased by former subsidiaries of WMI. The seven primary mortgage insurers are United Guaranty Residential Insurance Company (“UGRIC”), Genworth Mortgage Insurance Corporation (“GMIC”), Mortgage Guaranty Insurance Corporation (“MGIC”), PMI Mortgage Insurance Company (“PMI”), Radian Guaranty Incorporated (“Radian”), Republic Mortgage Insurance Company (“RMIC”) and Triad Guaranty Insurance Company (“Triad”WMIH (the “Merger”).
7
Due Prior to the then deteriorating performanceMerger, WMIH had limited operations other than its reinsurance business that operated in the mortgage guarantee markets and the closure and receivership of WMB, the reinsurance agreements with each of the primary mortgage insurers were terminated or placed into runoff during 2008. The agreements with UGRIC and Triad were placed into runoff effective May 31, 2008. The agreements with all other primary mortgage insurers were placed into runoff effective September 26, 2008.mode. As a result effective September 26, 2008, WMMRC’s continuing operations consisted solely of the runoffMerger, shares of coverage associatedNationstar common stock were delisted from the New York Stock Exchange. Following the Merger closing, the combined company traded on NASDAQ under the ticker symbol “WMIH” until October 10, 2018, when WMIH changed its name to “Mr. Cooper Group Inc.” and its ticker symbol to “COOP”.
WMIIC
WMIIC does not currently have any operations and is fully eliminated upon consolidation.
Note 2: Significant Accounting Policies
Basis of Presentation
WMIH resumed timely filing of all periodic reports for a reporting company under the Exchange Act for all periods after emergence from bankruptcy on March 19, 2012 (the “Effective Date”).
The accompanying unaudited condensed consolidated financial statements have been prepared pursuant to the rules and regulations of the Securities and Exchange Commission (“SEC”) for quarterly reporting. Certain information and footnote disclosures normally included inSEC. Accordingly, the financial statements do not include all of the information and prepared in accordance with generally accepted accounting principles in the United States of America (“GAAP”) have been condensed or omitted pursuant to such rules and regulations; however, the Company believes that the disclosures included are appropriate. The condensed consolidated balance sheet as of December 31, 2016, included herein, was derived from the audited consolidatedfootnotes required by GAAP for complete financial statements as of that date.
These interim unaudited condensed consolidated financial statements and notes thereto should be read in conjunction with the Company’s audited consolidated financial statements and notes thereto filedincluded in the Company’s Annual ReportReports on Form 10-K filed withfor the SEC on March 14, 2017. Interim information presented in the unaudited condensedyear ended December 31, 2019.
All significant intercompanyas cost method investments. Intercompany balances and transactions and balanceson consolidated entities have been eliminatedeliminated. Business combinations are included in preparing the condensed consolidated financial statements.
statements from their respective dates of acquisition.
| Final Estimated Fair Value of Net Assets Acquired: | |||
| Cash and cash equivalents | $ | 37 | |
| Restricted cash | 2 | ||
| Mortgage servicing rights | 271 | ||
| Advances and other receivables | 84 | ||
| Mortgage loans held for sale | 536 | ||
| Mortgage loans held for investment | 1 | ||
| Property and equipment | 8 | ||
| Other assets | 483 | ||
| Fair value of assets acquired | 1,422 | ||
Notes payable(1) | 294 | ||
| Advance facilities | 13 | ||
| Warehouse facilities | 393 | ||
| Payables and other liabilities | 530 | ||
| Other nonrecourse debt | 129 | ||
| Fair value of liabilities assumed | 1,359 | ||
| Total fair value of net tangible assets acquired | 63 | ||
| Intangible assets: | |||
Customer relationships(2) | 13 | ||
| Goodwill | 40 | ||
| Final purchase price | $ | 116 | |
(1) | Notes payable was subsequently paid off in February 2019 after the consummation of the acquisition. |
(2) | The estimated fair values for customer relationships were measured using the excess earnings method and were determined to have a remaining useful life of 10 years. |
| Three Months Ended March 31, 2019 | |||
| Pro forma financial information | (unaudited) | ||
| Pro forma total revenues | $ | 269 | |
| Pro forma net loss | $ | (184 | ) |
| MSRs and Related Liabilities | March 31, 2020 | December 31, 2019 | |||||
| Forward MSRs - fair value | $ | 3,109 | $ | 3,496 | |||
| Reverse MSRs - amortized cost | 6 | 6 | |||||
| Mortgage servicing rights | $ | 3,115 | $ | 3,502 | |||
| Mortgage servicing liabilities - amortized cost | $ | 53 | $ | 61 | |||
| Excess spread financing - fair value | $ | 1,242 | $ | 1,311 | |||
| Mortgage servicing rights financing - fair value | 43 | 37 | |||||
| MSR related liabilities - nonrecourse at fair value | $ | 1,285 | $ | 1,348 | |||
| Forward MSRs - Fair Value | Three Months Ended March 31, 2020 | Three Months Ended March 31, 2019 | |||||
| Fair value - beginning of period | $ | 3,496 | $ | 3,665 | |||
| Additions: | |||||||
| Servicing retained from mortgage loans sold | 123 | 66 | |||||
Purchases of servicing rights(1) | 24 | 409 | |||||
| Dispositions: | |||||||
| Sales of servicing assets | — | (260 | ) | ||||
| Changes in fair value: | |||||||
| Changes in valuation inputs or assumptions used in the valuation model | (401 | ) | (332 | ) | |||
| Other changes in fair value | (133 | ) | (67 | ) | |||
| Fair value - end of period | $ | 3,109 | $ | 3,481 | |||
(1) | Purchases of servicing rights during the three months ended March 31, 2019 includes $271 of mortgage servicing rights that were acquired from Pacific Union. See Note 2, Acquisitions, for further discussion. |
8
Fair Valuetherefore, behave more like the interest sensitive portfolio. Interest sensitive portfolios generally consist of Certain Financial Instruments
Fair value is defined as the price that would be received to sell an asset or paid to transfer a liability in an orderly transaction between market participants at the measurement date. Generally,lower delinquency, single-family conforming residential forward mortgage loans for assets that are reportedagency investors.
| March 31, 2020 | December 31, 2019 | ||||||||||||||
| Forward MSRs - UPB and fair value breakdown | UPB | Fair Value | UPB | Fair Value | |||||||||||
| Acquisition Pools | |||||||||||||||
| Credit sensitive | $ | 138,726 | $ | 1,386 | $ | 147,895 | $ | 1,613 | |||||||
| Interest sensitive | 151,908 | 1,723 | 148,887 | 1,883 | |||||||||||
| Total | $ | 290,634 | $ | 3,109 | $ | 296,782 | $ | 3,496 | |||||||
| Investors Pools | |||||||||||||||
Agency(1) | $ | 238,956 | $ | 2,618 | $ | 240,688 | $ | 2,944 | |||||||
Non-agency(2) | 51,678 | 491 | 56,094 | 552 | |||||||||||
| Total | $ | 290,634 | $ | 3,109 | $ | 296,782 | $ | 3,496 | |||||||
(1) | Agency investors primarily consist of government sponsored enterprises (“GSE”), such as the Federal National Mortgage Association (“Fannie Mae” or “FNMA”) and the Federal Home Loan Mortgage Corp (“Freddie Mac” or “FHLMC”), and the Government National Mortgage Association (“Ginnie Mae” or “GNMA”). |
(2) | Non-agency investors consist of investors in private-label securitizations. |
| Forward MSRs - Key inputs and assumptions | March 31, 2020 | December 31, 2019 | |||
| Total MSR Portfolio | |||||
| Discount rate | 9.7 | % | 9.7 | % | |
| Prepayment speeds | 13.4 | % | 13.1 | % | |
| Average life | 5.7 years | 5.8 years | |||
| Acquisition Pools: | |||||
| Credit Sensitive | |||||
| Discount rate | 10.2 | % | 10.4 | % | |
| Prepayment speeds | 13.0 | % | 12.7 | % | |
| Average life | 5.9 years | 6.0 years | |||
| Interest Sensitive | |||||
| Discount rate | 9.1 | % | 9.1 | % | |
| Prepayment speeds | 13.8 | % | 13.5 | % | |
| Average life | 5.5 years | 5.7 years | |||
| Investor Pools: | |||||
| Agency | |||||
| Discount rate | 9.0 | % | 9.0 | % | |
| Prepayment speeds | 13.2 | % | 13.0 | % | |
| Average life | 5.6 years | 5.8 years | |||
| Non-agency | |||||
| Discount rate | 12.6 | % | 12.6 | % | |
| Prepayment speeds | 14.3 | % | 13.8 | % | |
| Average life | 6.1 years | 6.2 years | |||
| Discount Rate | Total Prepayment Speeds | ||||||||||||||
| Forward MSRs - Hypothetical Sensitivities | 100 bps Adverse Change | 200 bps Adverse Change | 10% Adverse Change | 20% Adverse Change | |||||||||||
| March 31, 2020 | |||||||||||||||
| Mortgage servicing rights | $ | (111 | ) | $ | (214 | ) | $ | (158 | ) | $ | (305 | ) | |||
| December 31, 2019 | |||||||||||||||
| Mortgage servicing rights | $ | (127 | ) | $ | (245 | ) | $ | (165 | ) | $ | (317 | ) | |||
one factor may lead to changes in other factors, which could impact the above hypothetical effects.
| Three Months Ended March 31, | |||||||||||||||
| 2020 | 2019 | ||||||||||||||
| Reverse MSRs and Liabilities - Amortized Cost | Assets | Liabilities | Assets | Liabilities | |||||||||||
| Balance - beginning of period | $ | 6 | $ | 61 | $ | 11 | $ | 71 | |||||||
| Amortization/accretion | — | (8 | ) | — | (18 | ) | |||||||||
Adjustments(1) | — | — | (4 | ) | 37 | ||||||||||
| Balance - end of the period | $ | 6 | $ | 53 | $ | 7 | $ | 90 | |||||||
| Fair value - end of period | $ | 6 | $ | 27 | $ | 7 | $ | 75 | |||||||
(1) | Reverse MSR and MSL net adjustments recorded by the Company during the three months ended March 31, 2019 primarily relate to the fair value adjustments for reverse MSR and MSL assumed from the Merger resulting from the revised cost to service assumption used in the valuation of reverse MSR and MSL during the measurement period. |
| Excess Spread Financing Assumptions | March 31, 2020 | December 31, 2019 | |||
| Discount rate | 11.6 | % | 11.6 | % | |
| Prepayment speeds | 12.8 | % | 12.6 | % | |
| Recapture rate | 18.6 | % | 20.1 | % | |
| Average life | 5.7 years | 5.8 years | |||
excess spread financing fair value when applying certain unfavorable variations of key assumptions to these liabilities for the dates indicated:
| Discount Rate | Prepayment Speeds | ||||||||||||||
| Excess Spread Financing - Hypothetical Sensitivities | 100 bps Adverse Change | 200 bps Adverse Change | 10% Adverse Change | 20% Adverse Change | |||||||||||
| March 31, 2020 | |||||||||||||||
| Excess spread financing | $ | 43 | $ | 89 | $ | 48 | $ | 98 | |||||||
| December 31, 2019 | |||||||||||||||
| Excess spread financing | $ | 46 | $ | 95 | $ | 46 | $ | 96 | |||||||
The carrying valuethe relationship of the loss contract reserve approximates itschange in assumptions to the fair value andmay not be linear. Additionally, the impact of a variation in a particular assumption on the fair value is based on valuation methodologies using discounted cash flows at interest ratescalculated while holding other assumptions constant. In reality, changes in one factor may lead to changes in other factors, which approximatecould impact the Company’s weighted-average cost of capital.
Theabove hypothetical effects. Also, a positive change in the above assumptions would not necessarily correlate with the corresponding decrease in the net carrying valueamount of the derivative embedded conversion feature of the Series B Preferred Stock is adjusted to itsexcess spread financing. Excess Spread financing’s cash flow assumptions that are utilized in determining fair value as determined using Level 3 inputs described below under fair value measurement.
The carrying value of notes payable approximates fair value based on time to maturity, underlying collateral, and prevailing interest rates.
Fair Value Measurement
The Company’s estimates of fair value for financial assets and financial liabilities are based on the framework establishedrelated cash flow assumptions used in the Financial Accounting Standards Boardfinanced MSRs. Any fair value change recognized in the financed MSRs attributable to related cash flows assumptions would inherently have an inverse impact on the carrying amount of the related excess spread financing.
| Mortgage Servicing Rights Financing Assumptions | March 31, 2020 | December 31, 2019 | |||
| Advance financing rates | 1.7 | % | 3.5 | % | |
| Annual advance recovery rates | 18.4 | % | 18.8 | % | |
| Total Revenues - Servicing | Three Months Ended March 31, 2020 | Three Months Ended March 31, 2019 | |||||
Contractually specified servicing fees(1) | $ | 297 | $ | 281 | |||
Other service-related income(1) | 49 | 50 | |||||
Incentive and modification income(1) | 10 | 7 | |||||
Late fees(1) | 27 | 25 | |||||
| Reverse servicing fees | 6 | 9 | |||||
Mark-to-market adjustments(2) | (383 | ) | (293 | ) | |||
Counterparty revenue share(3) | (76 | ) | (48 | ) | |||
Amortization, net of accretion(4) | (76 | ) | (23 | ) | |||
| Total revenues - Servicing | $ | (146 | ) | $ | 8 | ||
(1) | The Company recognizes revenue on an earned basis for services performed. Amounts include subservicing related revenues. |
(2) | Mark-to-market (“MTM”) adjustments include fair value adjustments on MSR, excess spread financing and MSR financing liabilities. The amount of MSR MTM includes the impact of negative modeled cash flows which have been transferred to reserves on advances and other receivables. The negative modeled cash flows relate to advances and other receivables associated with inactive and liquidated loans that are no longer part of the MSR portfolio. The impact of negative modeled cash flows for the Company was $10 and $11 for the three months ended March 31, 2020 and 2019, respectively. |
(3) | Counterparty revenue share represents the excess servicing fee that the Company pays to the counterparties under the excess spread financing arrangements and the payments made associated with MSR financing arrangements. |
(4) | Amortization for the Company is net of excess spread accretion of $68 and $36 and MSL accretion of $8 and $18 for the three months ended March 31, 2020 and 2019, respectively. |
| Advances and Other Receivables, Net | March 31, 2020 | December 31, 2019 | |||||
| Servicing advances, net of $125 and $131 discount, respectively | $ | 688 | $ | 970 | |||
| Receivables from agencies, investors and prior servicers, net of $21 and $21 discount, respectively | 190 | 193 | |||||
| Reserves | (193 | ) | (175 | ) | |||
| Total advances and other receivables, net | $ | 685 | $ | 988 | |||
| Reserves for Advances and Other Receivables | Three Months Ended March 31, 2020 | Three Months Ended March 31, 2019 | |||||
| Balance - beginning of period | $ | 168 | $ | 47 | |||
Provision and other additions(1) | 30 | 30 | |||||
| Write-offs | (5 | ) | (6 | ) | |||
| Balance - end of period | $ | 193 | $ | 71 | |||
(1) | The Company recorded a provision of $10 and $11 through the MTM adjustments in revenues - service related, net, in the consolidated statements of operations for the three months ended March 31, 2020 and 2019, respectively, for inactive and liquidated loans that are no longer part of the MSR portfolio. Other additions represent reclassifications of required reserves provisioned within other balance sheet accounts as associated serviced loans become inactive or liquidate. |
| Three Months Ended March 31, 2020 | Three Months Ended March 31, 2019 | ||||||||||||||
| Purchase Discounts | Servicing Advances | Receivables from Agencies, Investors and Prior Servicers | Servicing Advances | Receivables from Agencies, Investors and Prior Servicers | |||||||||||
| Balance - beginning of period | $ | 131 | $ | 21 | $ | 205 | $ | 48 | |||||||
| Addition from acquisition | — | — | 19 | — | |||||||||||
| Utilization of purchase discounts | (6 | ) | — | (55 | ) | — | |||||||||
| Balance - end of period | $ | 125 | $ | 21 | $ | 169 | $ | 48 | |||||||
| Reverse Mortgage Interests, Net | March 31, 2020 | December 31, 2019 | |||||
| Participating interests in HECM mortgage-backed securities (“HMBS”), net of $16 and $10 purchase discount and premium, respectively | $ | 4,027 | $ | 4,292 | |||
| Other interests securitized, net of $44 and $56 purchase discount, respectively | 851 | 938 | |||||
| Unsecuritized interests, net of $69 and $68 purchase discount, respectively | 1,080 | 1,052 | |||||
| Reserves | (3 | ) | (3 | ) | |||
| Total reverse mortgage interests, net | $ | 5,955 | $ | 6,279 | |||
| Unsecuritized interests | March 31, 2020 | December 31, 2019 | |||||
| Repurchased HECM loans (exceeds 98% MCA) | $ | 782 | $ | 789 | |||
HECM related receivables(1) | 257 | 250 | |||||
| Funded borrower draws not yet securitized | 64 | 67 | |||||
| Real estate owned (“REO”) related receivables | 46 | 14 | |||||
| Purchase discount, net | (69 | ) | (68 | ) | |||
| Total unsecuritized interests | $ | 1,080 | $ | 1,052 | |||
(1) | HECM related receivables consist primarily of receivables from FNMA for corporate advances and service fees and claims receivables from the U.S. Department of Housing and Urban Development (“HUD”) on reverse mortgage interests. |
| Reserves for reverse mortgage interests | Three Months Ended March 31, 2020 | Three Months Ended March 31, 2019 | |||||
| Balance - beginning of period | $ | 3 | $ | 13 | |||
| Provision (release), net | — | — | |||||
| Write-offs | — | (5 | ) | ||||
| Balance - end of period | $ | 3 | $ | 8 | |||
| Three Months Ended March 31, 2020 | |||||||||||
| Purchase premiums and discounts for reverse mortgage interests | Net Discount for Participating Interests in HMBS(1) | Net Discount for Other Interest Securitized(1) | Net Discount for Unsecuritized Interests(1) | ||||||||
| Balance - beginning of period | $ | 10 | $ | (56 | ) | $ | (68 | ) | |||
Utilization of purchase discounts(2) | — | 5 | 5 | ||||||||
| (Amortization)/Accretion | (44 | ) | 17 | 2 | |||||||
Transfers(3) | 18 | (10 | ) | (8 | ) | ||||||
| Balance - end of period | $ | (16 | ) | $ | (44 | ) | $ | (69 | ) | ||
| Three Months Ended March 31, 2019 | |||||||||||
| Purchase premiums and discounts for reverse mortgage interests | Net Premium for Participating Interests in HMBS(1) | Net Discount for Other Interest Securitized(1) | Net Discount for Unsecuritized Interests(1) | ||||||||
| Balance - beginning of period | $ | 58 | $ | (100 | ) | $ | (122 | ) | |||
Adjustments(4) | (16 | ) | (2 | ) | (6 | ) | |||||
Utilization of purchase discounts(2) | — | 6 | 22 | ||||||||
| (Amortization)/Accretion | (14 | ) | (15 | ) | 18 | ||||||
Transfers(3) | 8 | (1 | ) | (7 | ) | ||||||
| Balance - end of period | $ | 36 | $ | (112 | ) | $ | (95 | ) | |||
(1) | Net position as certain items are in a premium/(discount) position, based on the characteristics of underlying tranches of loans. |
(2) | Utilization of purchase discounts on liquidated loans, for which the remaining receivable was written-off. |
(3) | Transfer of premium/(discount) based on the transfer of associated loans between categories consistent with the underlying loan characteristics. |
(4) | Adjustments to premium/(discount) due to revised cost to service assumption utilized in the valuation of reverse mortgage assets and liabilities acquired from the Merger during the measurement period. |
| Mortgage Loans Held for Sale | March 31, 2020 | December 31, 2019 | |||||
| Mortgage loans held for sale – UPB | $ | 3,735 | $ | 3,949 | |||
Mark-to-market adjustment(1) | 187 | 128 | |||||
| Total mortgage loans held for sale | $ | 3,922 | $ | 4,077 | |||
(1) | The mark-to-market adjustment is recorded in net gain on mortgage loans held for sale in the consolidated statements of operations. |
| March 31, 2020 | December 31, 2019 | ||||||||||||||
| Mortgage Loans Held for Sale | UPB | Fair Value | UPB | Fair Value | |||||||||||
Non-accrual(1) | $ | 33 | $ | 23 | $ | 29 | $ | 22 | |||||||
(1) | Non-accrual - UPB includes $28 and $25 of UPB related to Ginnie Mae repurchased loans as of March 31, 2020 and December 31, 2019, respectively. |
| Mortgage Loans Held for Sale | Three Months Ended March 31, 2020 | Three Months Ended March 31, 2019 | |||||
| Balance - beginning of period | $ | 4,077 | $ | 1,631 | |||
| Loans sold | (13,510 | ) | (6,088 | ) | |||
Mortgage loans originated and purchased, net of fees(1) | 12,375 | 6,253 | |||||
| Repurchase of loans out of Ginnie Mae securitizations | 919 | 364 | |||||
| Changes in fair value | 61 | 10 | |||||
Net transfers of mortgage loans held for sale(2) | — | — | |||||
| Balance - end of period | $ | 3,922 | $ | 2,170 | |||
(1) | Mortgage loans originated and purchased during the three months ended March 31, 2019 includes $536 of loans held for sale that were acquired from Pacific Union. See Note 2, Acquisitions, for further discussion. |
(2) | Amount reflects transfers to other assets for loans transitioning into REO status and transfers to advances and other receivables, net for claims made on certain government insurance mortgage loans. Transfers out are net of transfers in upon receipt of proceeds from an REO sale or claim filing. |
| Net lease cost | Three Months Ended March 31, 2020 | Three Months Ended March 31, 2019 | |||||
| Operating lease cost | $ | 10 | $ | 8 | |||
| Short-term lease cost | — | 1 | |||||
| Sublease income | (1 | ) | — | ||||
| Net lease cost | $ | 9 | $ | 9 | |||
| Operating leases | Three Months Ended March 31, 2020 | Three Months Ended March 31, 2019 | |||||
| Cash paid for amounts included in the measurement of lease liabilities: | |||||||
| Operating cash flows from operating leases | $ | 10 | $ | 6 | |||
| Leased assets obtained in exchange for new operating lease liabilities | $ | — | $ | 127 | |||
| Weighted average remaining lease term | 5.6 years | 5.5 years | |||||
| Weighted average discount rate | 5.0 | % | 5.0 | % | |||
| Year Ending December 31, | Operating Leases | |||
2020(1) | $ | 37 | ||
| 2021 | 29 | |||
| 2022 | 20 | |||
| 2023 | 16 | |||
| 2024 | 11 | |||
| 2025 and thereafter | 30 | |||
| Total future minimum lease payments | 143 | |||
| Less: imputed interest | 18 | |||
| Total operating lease liabilities | $ | 125 | ||
(1) | Excluding the three months ended March 31, 2020. |
| Other assets | March 31, 2020 | December 31, 2019 | |||||
| Loans subject to repurchase right from Ginnie Mae | $ | 468 | $ | 560 | |||
| Derivative financial instruments | 294 | 153 | |||||
| Trade receivables and accrued revenues | 143 | 126 | |||||
| Goodwill | 120 | 120 | |||||
| Right-of-use assets | 111 | 121 | |||||
| Intangible assets | 61 | 74 | |||||
| Other | 372 | 236 | |||||
| Total other assets | $ | 1,569 | $ | 1,390 | |||
| March 31, 2020 | Three Months Ended March 31, 2020 | ||||||||||||
| Derivative Financial Instruments | Expiration Dates | Outstanding Notional | Fair Value | Recorded Gains/(Losses) | |||||||||
| Assets | |||||||||||||
| Mortgage loans held for sale | |||||||||||||
| Loan sale commitments | 2020 | $ | 2,598 | $ | 111 | $ | 79 | ||||||
| Derivative financial instruments | |||||||||||||
| IRLCs | 2020 | 6,923 | 263 | 128 | |||||||||
| LPCs | 2020 | 834 | 25 | 13 | |||||||||
| Forward MBS trades | 2020 | 886 | 6 | — | |||||||||
| Eurodollar futures | 2020-2021 | 6 | — | — | |||||||||
| Total derivative financial instruments - assets | $ | 8,649 | $ | 294 | $ | 141 | |||||||
| Liabilities | |||||||||||||
| Derivative financial instruments | |||||||||||||
| IRLCs | 2020 | $ | 22 | $ | — | $ | — | ||||||
| LPCs | 2020 | 10 | — | (3 | ) | ||||||||
| Forward MBS trades | 2020 | 10,229 | 223 | 211 | |||||||||
| Eurodollar futures | 2020-2021 | 6 | — | — | |||||||||
| Total derivative financial instruments - liabilities | $ | 10,267 | $ | 223 | $ | 208 | |||||||
| March 31, 2019 | Three Months Ended March 31, 2019 | ||||||||||||
| Derivative Financial Instruments | Expiration Dates | Outstanding Notional | Fair Value | Recorded Gains/(Losses) | |||||||||
| Assets | |||||||||||||
| Mortgage loans held for sale | |||||||||||||
| Loan sale commitments | 2019 | $ | 365 | $ | 17 | $ | (9 | ) | |||||
| Derivative financial instruments | |||||||||||||
| IRLCs | 2019 | 2,557 | 69 | 9 | |||||||||
| LPCs | 2019 | 216 | 2 | 1 | |||||||||
| Forward MBS trades | 2019 | 410 | 1 | (1 | ) | ||||||||
| Eurodollar futures | 2019-2021 | 7 | — | — | |||||||||
| Total derivative financial instruments - assets | $ | 3,190 | $ | 72 | $ | 9 | |||||||
| Liabilities | |||||||||||||
| Derivative financial instruments | |||||||||||||
| LPCs | 2019 | $ | 52 | $ | — | $ | — | ||||||
| Forward MBS trades | 2019 | 3,804 | 22 | (3 | ) | ||||||||
| Eurodollar futures | 2019-2021 | 13 | — | — | |||||||||
| Total derivative financial instruments - liabilities | $ | 3,869 | $ | 22 | $ | (3 | ) | ||||||
| March 31, 2020 | December 31, 2019 | |||||||||||||||||||||||||
| Advance Facilities | Interest Rate | Maturity Date | Collateral | Capacity Amount | Outstanding | Collateral Pledged | Outstanding | Collateral pledged | ||||||||||||||||||
$325 advance facility(1) | LIBOR+1.5% to 6.5% | August 2021 | Servicing advance receivables | $ | 325 | $ | 223 | $ | 283 | $ | 224 | $ | 285 | |||||||||||||
$250 advance facility(2) | LIBOR+1.5% to 2.6% | December 2020 | Servicing advance receivables | 250 | 118 | 138 | 98 | 167 | ||||||||||||||||||
| $200 advance facility | LIBOR+2.5% | January 2021 | Servicing advance receivables | 200 | 83 | 117 | 63 | 125 | ||||||||||||||||||
$125 advance facility(3) | LIBOR+1.5% to 7.4% | July 2020 | Servicing advance receivables | 125 | 66 | 76 | 37 | 88 | ||||||||||||||||||
| Advance facilities principal amount | 490 | $ | 614 | 422 | $ | 665 | ||||||||||||||||||||
| Unamortized debt issuance costs | (1 | ) | — | |||||||||||||||||||||||
| Advance facilities, net | $ | 489 | $ | 422 | ||||||||||||||||||||||
(1) | The capacity amount was subsequently increased to $425 in April 2020 with a maturity date of October 2021. |
(2) | This advance facility was subsequently terminated and transferred to another advance facility in April 2020. |
(3) | The capacity amount was subsequently increased to $875 in April 2020 with a maturity date of April 2021. |
| March 31, 2020 | December 31, 2019 | |||||||||||||||||||||||||
| Warehouse Facilities | Interest Rate | Maturity Date | Collateral | Capacity Amount | Outstanding | Collateral pledged | Outstanding | Collateral pledged | ||||||||||||||||||
| $1,500 warehouse facility | LIBOR+1.0% | June 2020 | Mortgage loans or MBS | $ | 1,500 | $ | 1,214 | $ | 1,160 | $ | 759 | $ | 733 | |||||||||||||
| $1,200 warehouse facility | LIBOR+1.5% to 3.0% | November 2020 | Mortgage loans or MBS | 1,200 | 566 | 602 | 683 | 724 | ||||||||||||||||||
| $1,000 warehouse facility | LIBOR+1.4% to 2.3% | September 2020 | Mortgage loans or MBS | 1,000 | 593 | 608 | 762 | 783 | ||||||||||||||||||
$800 warehouse facility(1) | LIBOR+2.1% to 3.8% | April 2021 | Mortgage loans or MBS | 800 | 528 | 639 | 589 | 656 | ||||||||||||||||||
| $750 warehouse facility | LIBOR+1.4% to 2.8% | September 2020 | Mortgage loans or MBS | 750 | 347 | 355 | 411 | 425 | ||||||||||||||||||
| $700 warehouse facility | LIBOR+1.3% to 2.2% | November 2020 | Mortgage loans or MBS | 700 | 628 | 649 | 469 | 488 | ||||||||||||||||||
| $600 warehouse facility | LIBOR+2.0% | February 2021 | Mortgage loans or MBS | 600 | 169 | 203 | 174 | 202 | ||||||||||||||||||
| $500 warehouse facility | LIBOR+2.0% to 4.0% | May 2020 | Mortgage loans or MBS | 500 | 22 | 23 | 336 | 349 | ||||||||||||||||||
| $200 warehouse facility | LIBOR+1.4% | January 2021 | Mortgage loans or MBS | 200 | 100 | 101 | 136 | 136 | ||||||||||||||||||
| $200 warehouse facility | LIBOR+1.2% | April 2021 | Mortgage loans or MBS | 200 | 21 | 21 | 27 | 27 | ||||||||||||||||||
| $200 warehouse facility | LIBOR+2.0% | May 2020 | Mortgage loans or MBS | 200 | 59 | 83 | 54 | 78 | ||||||||||||||||||
| $200 warehouse facility | LIBOR+1.3% | October 2020 | Mortgage loans or MBS | 200 | — | — | — | — | ||||||||||||||||||
| $50 warehouse facility | LIBOR+2.0% to 6.0% | June 2020 | Mortgage loans or MBS | 50 | 4 | 6 | 11 | 15 | ||||||||||||||||||
| $40 warehouse facility | LIBOR+3.3% | September 2020 | Mortgage loans or MBS | 40 | 6 | 7 | 5 | 6 | ||||||||||||||||||
| Warehouse facilities principal amount | 4,257 | 4,457 | 4,416 | 4,622 | ||||||||||||||||||||||
| MSR Facility | ||||||||||||||||||||||||||
| $400 warehouse facility | LIBOR+3.5% or 6.1% | January 2023 | Mortgage loans or MBS | 400 | 150 | 836 | 150 | 945 | ||||||||||||||||||
| $400 warehouse facility | LIBOR+2.3% | December 2020 | Mortgage loans or MBS | 400 | 75 | 190 | — | 200 | ||||||||||||||||||
$150 warehouse facility(1) | LIBOR+2.8% | April 2021 | Mortgage loans or MBS | 150 | 40 | 119 | — | 130 | ||||||||||||||||||
| $50 warehouse facility | LIBOR+2.8% | August 2020 | Mortgage loans or MBS | 50 | 30 | 71 | 10 | 84 | ||||||||||||||||||
| MSR facilities principal amount | 295 | 1,216 | 160 | 1,359 | ||||||||||||||||||||||
| Warehouse and MSR facilities principal amount | 4,552 | $ | 5,673 | 4,576 | $ | 5,981 | ||||||||||||||||||||
| Unamortized debt issuance costs | (1 | ) | (1 | ) | ||||||||||||||||||||||
| Warehouse facilities, net | $ | 4,551 | $ | 4,575 | ||||||||||||||||||||||
| Pledged Collateral: | ||||||||||||||||||||||||||
| Mortgage loans held for sale | $ | 3,659 | $ | 3,748 | $ | 3,826 | $ | 3,931 | ||||||||||||||||||
| Reverse mortgage interests | 598 | 709 | 590 | 691 | ||||||||||||||||||||||
| MSR | 295 | 1,216 | 160 | 1,359 | ||||||||||||||||||||||
(1) | Total capacity amount for this facility is $800 of which $150 is a sublimit for MSR financing. |
| Unsecured senior notes | March 31, 2020 | December 31, 2019 | |||||
| $950 face value, 8.125% interest rate payable semi-annually, due July 2023 | $ | 950 | $ | 950 | |||
| $750 face value, 9.125% interest rate payable semi-annually, due July 2026 | 750 | 750 | |||||
$600 face value, 6.000% interest rate payable semi-annually, due January 2027(1) | 600 | — | |||||
$600 face value, 6.500% interest rate payable semi-annually, due July 2021(2) | — | 492 | |||||
$300 face value, 6.500% interest rate payable semi-annually, due June 2022(2) | — | 206 | |||||
| Unsecured senior notes principal amount | 2,300 | 2,398 | |||||
| Unamortized debt issuance costs, premium and discount | (41 | ) | (32 | ) | |||
| Unsecured senior notes, net | $ | 2,259 | $ | 2,366 | |||
(1) | On January 16, 2020, the Company completed an offering of $600 aggregate principal amount of 6.000% Senior Notes due 2027 (the “2027 notes”). |
(2) | This note was redeemed in full on February 15, 2020 using the net proceeds of the 2027 notes offering, together with cash on hand. |
| Year Ending December 31, | Amount | |||
| 2020 | $ | — | ||
| 2021 | — | |||
| 2022 | — | |||
| 2023 | 950 | |||
| 2024 | — | |||
| Thereafter | 1,350 | |||
| Total unsecured senior notes principal amount | $ | 2,300 | ||
| March 31, 2020 | December 31, 2019 | ||||||||||||||||
| Other nonrecourse debt | Issue Date | Maturity Date | Class of Note | Collateral Amount | Outstanding | Outstanding | |||||||||||
Participating interest financing(1) | — | — | — | $ | — | $ | 4,045 | $ | 4,284 | ||||||||
| Securitization of nonperforming HECM loans | |||||||||||||||||
| Trust 2019-2 | November 2019 | November 2029 | A, M1, M2, M3, M4, M5 | 306 | 297 | 333 | |||||||||||
| Trust 2019-1 | June 2019 | June 2029 | A, M1, M2, M3, M4, M5 | 286 | 269 | 302 | |||||||||||
| Trust 2018-3 | November 2018 | November 2028 | A, M1, M2, M3, M4, M5 | 209 | 190 | 209 | |||||||||||
| Trust 2018-2 | July 2018 | July 2028 | A, M1, M2, M3, M4, M5 | 157 | 137 | 148 | |||||||||||
| Other nonrecourse debt principal amount | 4,938 | 5,276 | |||||||||||||||
| Unamortized debt issuance costs, premium and discount | 7 | 10 | |||||||||||||||
| Other nonrecourse debt, net | $ | 4,945 | $ | 5,286 | |||||||||||||
(1) | Amounts represent the Company’s participating interest in GNMA HMBS securitized portfolios. |
| Payables and other liabilities | March 31, 2020 | December 31, 2019 | |||||
| Loans subject to repurchase right from Ginnie Mae | $ | 468 | $ | 560 | |||
| Payables to servicing and subservicing investors | 407 | 423 | |||||
| Derivative financial instruments | 223 | 15 | |||||
| Payable to GSEs and securitized trusts | 148 | 182 | |||||
| Operating lease liabilities | 125 | 135 | |||||
| Other liabilities | 594 | 701 | |||||
| Total payables and other liabilities | $ | 1,965 | $ | 2,016 | |||
| Repurchase Reserves | Three Months Ended March 31, 2020 | Three Months Ended March 31, 2019 | |||||
| Balance - beginning of period | $ | 25 | $ | 8 | |||
| Provisions | 5 | 8 | |||||
| Releases | (1 | ) | — | ||||
| Balance - end of period | $ | 29 | $ | 16 | |||
| March 31, 2020 | December 31, 2019 | ||||||||||||||
| Consolidated transactions with VIEs | Transfers Accounted for as Secured Borrowings | Reverse Secured Borrowings | Transfers Accounted for as Secured Borrowings | Reverse Secured Borrowings | |||||||||||
| Assets | |||||||||||||||
| Restricted cash | $ | 53 | $ | 43 | $ | 66 | $ | 42 | |||||||
Reverse mortgage interests, net(1) | — | 4,878 | — | 5,230 | |||||||||||
| Advances and other receivables, net | 498 | — | 540 | — | |||||||||||
| Total assets | $ | 551 | $ | 4,921 | $ | 606 | $ | 5,272 | |||||||
| Liabilities | |||||||||||||||
Advance facilities(2) | $ | 407 | $ | — | $ | 359 | $ | — | |||||||
| Payables and other liabilities | — | 1 | 1 | 1 | |||||||||||
| Participating interest financing | — | 4,045 | — | 4,284 | |||||||||||
| HECM Securitizations (HMBS) | |||||||||||||||
| Trust 2019-2 | — | 297 | — | 333 | |||||||||||
| Trust 2019-1 | — | 269 | — | 302 | |||||||||||
| Trust 2018-3 | — | 190 | — | 209 | |||||||||||
| Trust 2018-2 | — | 137 | — | 148 | |||||||||||
| Total liabilities | $ | 407 | $ | 4,939 | $ | 360 | $ | 5,277 | |||||||
(1) | Amounts include net purchase discount of $60 and $46 as of March 31, 2020 and December 31, 2019, respectively. |
(2) | Amounts include the Nationstar agency advance financing facility and notes payable recorded by the Nationstar Mortgage Advance Receivable Trust, and the Nationstar Agency Advance Receivables Trust. Refer to Notes Payable in Note 10, Indebtedness, for additional information. |
| Unconsolidated securitization trusts | March 31, 2020 | December 31, 2019 | |||||
| Total collateral balances - UPB | $ | 1,460 | $ | 1,503 | |||
| Total certificate balances | $ | 1,467 | $ | 1,512 | |||
| Principal Amount of Transferred Loans 60 Days or More Past Due | March 31, 2020 | December 31, 2019 | |||||
| Unconsolidated securitization trusts | $ | 184 | $ | 193 | |||
| Computation of earnings per share | Three Months Ended March 31, 2020 | Three Months Ended March 31, 2019 | |||||
| Net loss attributable to Mr. Cooper | $ | (168 | ) | $ | (186 | ) | |
| Less: Undistributed earnings attributable to participating stockholders | — | — | |||||
| Net loss attributable to common stockholders | $ | (168 | ) | $ | (186 | ) | |
| Net loss per common share attributable to Mr. Cooper: | |||||||
| Basic | $ | (1.84 | ) | $ | (2.05 | ) | |
| Diluted | $ | (1.84 | ) | $ | (2.05 | ) | |
| Weighted average shares of common stock outstanding (in thousands): | |||||||
| Basic | 91,385 | 90,828 | |||||
Dilutive effect of stock awards(1) | — | — | |||||
Dilutive effect of participating securities(1) | — | — | |||||
| Diluted | 91,385 | 90,828 | |||||
(1) | Due to year-to-date loss, the Company excluded potential common shares from the computation of diluted EPS because inclusion would be antidilutive. |
| Income taxes | Three Months Ended March 31, 2020 | Three Months Ended March 31, 2019 | |||||
| Loss before income tax benefit | $ | (239 | ) | $ | (233 | ) | |
| Income tax benefit | $ | (68 | ) | $ | (47 | ) | |
Effective tax rate(1) | 28.4 | % | 20.3 | % | |||
(1) | Effective tax rate is calculated using whole numbers. |
The three levels of the hierarchy are as follows:
(e.g., Level 1–Inputs to the valuation methodology are1 representing quoted prices for identical assets or liabilities traded in an active markets.
market; Level 2–Inputs to the valuation methodology include quoted prices for similar assets or liabilities in active markets, quoted prices for identical or similar assets or liabilities in markets that are not active,2 representing values using observable inputs other than quoted prices that are observable for the asset or liabilityincluded within Level 1; and market corroborated inputs.
Level 3–Valuations3 representing estimated values based on models where significant inputs are not observable. unobservable inputs).
Fair values are based on quoted pricesCompany in active markets when availableestimating fair values:
9
Fixed-maturity securities consistportfolio, and estimated participating income. Discounted cash flows are applied based on collateral stratifications and include loan rate type, loan status (active vs. inactive), and securitization. Prices are also influenced from both internal models and other observable inputs. The Company determined fair value for all loans based on the applicable tranches established during the Merger valuation. Tranches are segregated based on participation percentages, original loan status as of U.S. Treasury securities, obligationsthe Merger date, and interest rate types, and loan status (active vs inactive). Prices are also influenced from both internal models and other observable inputs, including applicable forward interest rate curves. Additionally, historical loss factors are considered within the overall valuation. Because of U.S. government sponsored agenciesthe unobservable nature of the valuation inputs, the Company classifies these valuations as Level 3 in the fair value disclosures. See
Investments Held in Trust
Investments held in trust consist of cash equivalents, which include highly liquid overnight money market instruments, and fixed-maturity securitiesunderlying mortgage loans which are held in trust forbased on observable market data. The Company adjusts the benefit of the primary insurers, as more fully described in Note 3: Insurance Activity and Note 4: Investment Securities, and are subject to the restrictionsoutstanding IRLCs with prospective borrowers based on distribution of net assets of subsidiaries as described below.
Third Party Restrictions on Distribution of Net Assets of Wholly-Owned Subsidiaries
The net assets of WMMRC are subject to restrictions on distribution from multiple sources, including the primary insurers who have approval control of distributions from the trust,an expectation that it will be exercised, and the Insurance Division of the State of Hawaii who has approval authority over distributions or intercompany advances. As more fully described in Note 14: Subsequent Events, a distribution from WMMRC to WMIH of up to $10.7 million was approved by the Insurance Division of the State of Hawaii on September 13, 2017.
Premium Recognition
Premiums assumed are earned on a daily pro-rata basis over the underlying policy terms. Premiums assumed relating to the unexpired portion of policies in force at the balance sheet dateloan will be funded. IRLCs and LPCs are recorded in derivative financial instruments in the consolidated balance sheets. These commitments are classified as unearned premiums. Unearned premiums also include a reserve for post default premium reserves. Post default premium reserves occur when a loan isLevel 2 in a default position and the servicer continues to advancefair value disclosures, as the premiums. If the loan ultimately goes to claim, the premiums advanced during the period of defaultvaluations are subject to recapture. The Company records a default premium reserve based on information provided by the underlying mortgage insurers when they provide information on the default premium reserve separately from other reserves. The change in the post default premium reserve is reflected as a reduction or increase, as the case may be, in premiums assumed.market observable inputs. The Company has entered into Eurodollar futures contracts as part of its hedging strategy. The futures contracts are measured at fair value on a recurring basis and classified as Level 2 in the fair value disclosures as the valuation is based on market observable data. Derivative financial instruments are recorded unearned premiums totaling $33 thousandin other assets and $0.3 million aspayables and other liabilities within the consolidated balance sheets. See
is considered Level 1 from the market observable inputs used to determine fair value. See
Note 10, Indebtedness, for more information.| March 31, 2020 | |||||||||||||||
| Recurring Fair Value Measurements | |||||||||||||||
| Fair value - Recurring basis | Total Fair Value | Level 1 | Level 2 | Level 3 | |||||||||||
| Assets | |||||||||||||||
| Mortgage loans held for sale | $ | 3,922 | $ | — | $ | 3,922 | $ | — | |||||||
| Forward mortgage servicing rights | 3,109 | — | — | 3,109 | |||||||||||
| Derivative financial instruments | |||||||||||||||
| IRLCs | 263 | — | 263 | — | |||||||||||
| Forward MBS trades | 6 | — | 6 | — | |||||||||||
| LPCs | 25 | — | 25 | — | |||||||||||
| Total assets | $ | 7,325 | $ | — | $ | 4,216 | $ | 3,109 | |||||||
| Liabilities | |||||||||||||||
| Derivative financial instruments | |||||||||||||||
| Forward MBS trades | $ | 223 | $ | — | $ | 223 | $ | — | |||||||
| Mortgage servicing rights financing | 43 | — | — | 43 | |||||||||||
| Excess spread financing | 1,242 | — | — | 1,242 | |||||||||||
| Total liabilities | $ | 1,508 | $ | — | $ | 223 | $ | 1,285 | |||||||
| December 31, 2019 | |||||||||||||||
| Recurring Fair Value Measurements | |||||||||||||||
| Fair value - Recurring basis | Total Fair Value | Level 1 | Level 2 | Level 3 | |||||||||||
| Assets | |||||||||||||||
| Mortgage loans held for sale | $ | 4,077 | $ | — | $ | 4,077 | $ | — | |||||||
| Forward mortgage servicing rights | 3,496 | — | — | 3,496 | |||||||||||
| Derivative financial instruments | |||||||||||||||
| IRLCs | 135 | — | 135 | — | |||||||||||
| Forward MBS trades | 7 | — | 7 | — | |||||||||||
| LPCs | 12 | — | 12 | — | |||||||||||
| Total assets | $ | 7,727 | $ | — | $ | 4,231 | $ | 3,496 | |||||||
| Liabilities | |||||||||||||||
| Derivative financial instruments | |||||||||||||||
| Forward MBS trades | $ | 12 | $ | — | $ | 12 | $ | — | |||||||
| LPCs | 3 | — | 3 | — | |||||||||||
| Mortgage servicing rights financing | 37 | — | — | 37 | |||||||||||
| Excess spread financing | 1,311 | — | — | 1,311 | |||||||||||
| Total liabilities | $ | 1,363 | $ | — | $ | 15 | $ | 1,348 | |||||||
| Three Months Ended March 31, 2020 | |||||||||||
| Assets | Liabilities | ||||||||||
| Fair value - Level 3 assets and liabilities | Mortgage servicing rights | Excess spread financing | Mortgage servicing rights financing | ||||||||
| Balance - beginning of period | $ | 3,496 | $ | 1,311 | $ | 37 | |||||
| Total gains or losses included in earnings | (534 | ) | (35 | ) | 6 | ||||||
| Purchases, issuances, sales, repayments and settlements | |||||||||||
| Purchases | 24 | — | — | ||||||||
| Issuances | 123 | 24 | — | ||||||||
| Settlements and repayments | — | (58 | ) | — | |||||||
| Balance - end of period | $ | 3,109 | $ | 1,242 | $ | 43 | |||||
| Three Months Ended March 31, 2019 | |||||||||||
| Assets | Liabilities | ||||||||||
| Fair value - Level 3 assets and liabilities | Mortgage servicing rights | Excess spread financing | Mortgage servicing rights financing | ||||||||
| Balance - beginning of period | $ | 3,665 | $ | 1,184 | $ | 32 | |||||
| Total gains or losses included in earnings | (399 | ) | (69 | ) | 2 | ||||||
| Purchases, issuances, sales, repayments and settlements | |||||||||||
| Purchases | 409 | — | — | ||||||||
| Issuances | 66 | 245 | — | ||||||||
| Sales | (260 | ) | — | — | |||||||
| Settlements and repayments | — | (51 | ) | — | |||||||
| Balance - end of period | $ | 3,481 | $ | 1,309 | $ | 34 | |||||
| March 31, 2020 | |||||||||||||||
Carrying Amount | Fair Value | ||||||||||||||
| Financial instruments | Level 1 | Level 2 | Level 3 | ||||||||||||
| Financial assets | |||||||||||||||
| Cash and cash equivalents | $ | 579 | $ | 579 | $ | — | $ | — | |||||||
| Restricted cash | 266 | 266 | — | — | |||||||||||
| Advances and other receivables, net | 685 | — | — | 685 | |||||||||||
| Reverse mortgage interests, net | 5,955 | — | — | 6,015 | |||||||||||
| Mortgage loans held for sale | 3,922 | — | 3,922 | — | |||||||||||
| Derivative financial instruments | 294 | — | 294 | — | |||||||||||
| Financial liabilities | |||||||||||||||
Unsecured senior notes(1) | 2,259 | 2,055 | — | — | |||||||||||
Advance facilities(1) | 489 | — | 489 | — | |||||||||||
Warehouse facilities(1) | 4,551 | — | 4,551 | — | |||||||||||
| Mortgage servicing rights financing liability | 43 | — | — | 43 | |||||||||||
| Excess spread financing | 1,242 | — | — | 1,242 | |||||||||||
| Derivative financial instruments | 223 | — | 223 | — | |||||||||||
Participating interest financing(1) | 4,056 | — | — | 4,056 | |||||||||||
HECM Securitization (HMBS)(1) | |||||||||||||||
| Trust 2019-2 | 295 | — | — | 295 | |||||||||||
| Trust 2019-1 | 268 | — | — | 268 | |||||||||||
| Trust 2018-3 | 189 | — | — | 189 | |||||||||||
| Trust 2018-2 | 137 | — | — | 137 | |||||||||||
(1) | The amounts are presented net of unamortized debt issuance costs, premium and discount. |
| December 31, 2019 | |||||||||||||||
Carrying Amount | Fair Value | ||||||||||||||
| Financial instruments | Level 1 | Level 2 | Level 3 | ||||||||||||
| Financial assets | |||||||||||||||
| Cash and cash equivalents | $ | 329 | $ | 329 | $ | — | $ | — | |||||||
| Restricted cash | 283 | 283 | — | — | |||||||||||
| Advances and other receivables, net | 988 | — | — | 988 | |||||||||||
| Reverse mortgage interests, net | 6,279 | — | — | 6,318 | |||||||||||
| Mortgage loans held for sale | 4,077 | — | 4,077 | — | |||||||||||
| Derivative financial instruments | 153 | — | 153 | — | |||||||||||
| Financial liabilities | |||||||||||||||
Unsecured senior notes(1) | 2,366 | 2,505 | — | — | |||||||||||
| Advance facilities | 422 | — | 422 | — | |||||||||||
Warehouse facilities(1) | 4,575 | — | 4,575 | — | |||||||||||
| Mortgage servicing rights financing liability | 37 | — | — | 37 | |||||||||||
| Excess spread financing | 1,311 | — | — | 1,311 | |||||||||||
| Derivative financial instruments | 15 | — | 15 | — | |||||||||||
Participating interest financing(1) | 4,299 | — | — | 4,299 | |||||||||||
HECM Securitization (HMBS)(1) | |||||||||||||||
| Trust 2019-2 | 331 | — | — | 331 | |||||||||||
| Trust 2019-1 | 300 | — | — | 300 | |||||||||||
| Trust 2018-3 | 208 | — | — | 208 | |||||||||||
| Trust 2018-2 | 148 | — | — | 148 | |||||||||||
(1) | The amounts are presented net of unamortized debt issuance costs, premium and discount. |
10
Cashrespective selling and Cash Equivalents
Cash and cash equivalents include cash on hand, amounts due from banks, U.S. Treasury bills and overnight investments. Except as described above in Investments Held in Trust, the Company considers all amounts that are invested in highly liquid overnight money market instruments to be cash equivalents. The Federal Deposit Insurance Corporation (“FDIC”) insures amounts on deposit with each financial institution up to limits as prescribed by law. The Companyservicing agreements. In addition, these investors may hold funds with financial institutionsrequire capital ratios in excess of the FDIC insured amount, however,stated requirements to approve large servicing transfers. To the extent that these requirements are not met, the Company’s secondary market investors may utilize a range of remedies ranging from sanctions, suspension or ultimately termination of the Company’s selling and servicing agreements, which would prohibit the Company has not experienced any losses in such accountsfrom further originating or securitizing these specific types of mortgage loans or being an approved servicer. The Company’s various capital requirements related to its outstanding selling and management believes it is not exposed to any significant credit risk on cash and cash equivalents.
Restricted Cash
Restricted cash includes (i) amounts held for the express purposes of paying principal, interest and related feesservicing agreements are measured based on the Runoff Notes (as defined in Note 7: Notes Payable) pursuant to the termsCompany’s operating subsidiary, Nationstar Mortgage LLC. As of the Indentures (as defined in Note 7: Notes Payable) and (ii) proceeds of the Series B Preferred Stock offering held in escrow.
Ceding Commission Expense
The Company is required to pay a ceding commission to certain primary insurers pursuant to certain reinsurance agreements.
Losses and Loss Adjustment Reserves
The losses and loss adjustment reserves include case basis estimates of reported losses and supplemental amounts for incurred but not reported (“IBNR”) losses. A default is considered the incident (e.g., the failure to make timely payment of mortgage payments) that may give rise to a claim for mortgage insurance. In establishing the losses and loss adjustment reserve,March 31, 2020, the Company based its estimates primarily on the ceded loss and loss adjustment reserves as provided by the primary mortgage guaranty carriers.
WMMRC has recorded reserves at the ceded case reserves and IBNR loss levels established and reported by the primary mortgage guaranty carriers as of September 30, 2017 and December 31, 2016, respectively. Management believes that the recorded aggregate liability for unpaid losses and loss adjustment expenses at period end represents the Company’s best estimate, based upon the available data, of the amount necessary to cover the current cost of losses. However, due to the inherent uncertainty arising from fluctuations in the persistency rate of mortgage insurance claims, the Company’s size and lack of prior operating history, external factors such as future changes in regional or national economic conditions, judicial decisions, federal and state legislation related to mortgage restructuring and foreclosure restrictions, claims denials and coverage rescissions by primary carriers and other factors beyond the Company’s control, it is not presently possible to determine whether actual loss experience will conform to the assumptions used in determining the estimated amounts for such liability at the balance sheet date. Accordingly, the ultimate liability could be significantly higher or lower, as the case may be, than the amount indicated in the financial statements and there can be no assurance that the reserve amounts recorded will be sufficient. As adjustments to these estimates become necessary, such adjustments are reflected in current operations.
Loss Contract Reserve
A loss contract reserve relating to contractual obligations of WMMRC was established at March 19, 2012 as a result of applying fresh start accounting and in compliance with Accounting Standards Codification (“ASC”) 805-10-55-21 (b) (1) which defines a loss contract as “a contract in which the unavoidable costs of meeting the obligation under the contract exceed the economic benefits expected to be received under it.” The value of this reserve is analyzed quarterlyits selling and is adjusted accordingly. The adjustment (if any) to the reserve produces an expense or contra-expense in the condensed consolidated statements of operations.
Derivative Embedded Conversion Feature
servicing capital requirements.
Other Liabilities
11
At September 30, 2017, the total balance of $13.8 million of other liabilities is comprised of $12.3 million of accrued fees relating to the Series B Preferred Stock offering, an accrual for professional fees and recurring business expenses currently payable of approximately $0.8 million and $0.7 million of accrued dividends relating to the Series B Preferred Stock. The accrued fees would be paidMaking Home Affordable loan modification programs.
Comprehensive Income
The Company has no comprehensive income other than the net income disclosed in the condensed consolidated statement of operations.
Net Income Per Common Share
In calculating earnings per share,its industry, the Company follows the two-class method, which distinguishes between the classes of securities based on the proportionate participation rights of each security type in the Company's undistributed income. The Series A Preferred Stock and the Series B Preferred Stock are treated as one class for purposes of applying the two-class method, because they have substantially equal rights and share equally on an as converted basis with respect to income available to WMIH common stockholders.
Basic net income per WMIH common share is computed by dividing net income attributable to WMIH’s common stockholders by the weighted-average number of common shares outstanding for the period after subtracting the weighted-average of any unvested restricted shares outstanding, as these are subject to repurchase. Basic net income attributable to common stockholders is computed by deducting preferred dividends and the basic calculation of undistributed earnings attributable to participating securities from net income.
Diluted net income per WMIH common share is computed by dividing net income attributable to WMIH’s common stockholders by the weighted-average number of common shares outstanding during the period after subtracting the weighted-average of any unvested restricted shares outstanding, as these are subject to repurchase and adding any potentially dilutive WMIH common stock equivalents outstanding duringindemnification claims and may continue to receive claims in the period. Diluted net income attributablefuture, regarding alleged breaches of representations and warranties relating to common stockholdersthe sale of mortgage loans, the placement of mortgage loans into securitization trusts or the servicing of mortgage loans securitizations. The Company is computedalso subject to legal actions or proceedings related to loss sharing and indemnification provisions of its various acquisitions. Certain of the pending or threatened legal proceedings include claims for substantial compensatory, punitive and/or statutory damages or claims for an indeterminate amount of damages.
If common stock equivalents exist,its residential loan servicing and origination practices, bankruptcy and collections practices, its financial reporting and other aspects of its businesses. These matters include investigations by the Consumer Financial Protection Bureau (the “CFPB”), the Securities and Exchange Commission, the Executive Office of the United States Trustees, the Department of Justice, the Office of the Special Inspector General for the Troubled Asset Relief Program, the U.S. Department of Housing and Urban Development, the multi-state committee of mortgage banking regulators and various State Attorneys General. These specific matters and other pending or potential future investigations, subpoenas, examinations or inquiries may lead to administrative, civil or criminal proceedings or settlements, and possibly result in periods where there is a net loss, diluted net loss per common share would be equal toremedies including fines, penalties, restitution, or less than basic net loss per common share, since the effect of including any common stock equivalents would be antidilutive.
Equity-Based Compensation
On May 22, 2012, WMIH’s Board of Directors (the “Board” or “Board of Directors”) approvedalterations in the Company’s 2012 Long-Term Incentive Plan (the “2012 Plan”) so that awardsbusiness practices, and additional expenses and collateral costs. Responding to these matters requires the Company to devote substantial resources, resulting in higher costs and lower net cash flows.
Income Taxes
The Company follows the asset and liability method of accounting for income taxes. Under this method, deferred tax assets and liabilities are recognized for the future income tax consequences attributable to differences between the carrying amounts and tax bases of assets and liabilities and losses carried forward and tax credits. Deferred tax assets and liabilities are measured using enacted tax rates and laws applicable to the years in which the differences are expected to reverse. The effect on deferred tax assets and liabilities of a change in tax rates is recognized in income in the period that includes the enactment date. A valuation allowance is provided to the extent that it is more likely than not that deferred tax assets will not be realized.
12
The Company recognizes the financial statement effects of a tax position when it is more likely than not, based on the technical merits, that the position will be sustained upon examination. Penalties and interest, of which there are none, would be reflected in income tax expense. Tax years are open to the extent the Company has net operating loss (“NOL”) carry-forwards available to be utilized currently.
Dividend Policy
WMIH has paid no dividends on its common stock on or after the Effective Date and currently has no plans to pay a dividend on its common stock.
WMIH has declared and paid $13.5 million and $18.0 million of dividends on its Series B Preferred Stock for the nine months ended September 30, 2017 and the year ended December 31, 2016, respectively. Additionally, WMIH hasamount accrued unpaid and undeclared dividends of $0.7 million, based on the Series B Preferred Stock 3% interest rate, as of both September 30, 2017March 31, 2020. Moreover, if the discussions do not result in a settlement, the regulators and December 31, 2016.
New Accounting Pronouncements
The Company has reviewed new accounting pronouncements issued between August 9, 2017, the filing date of our most recent prior Form 10-Q,State Attorneys General may seek to exercise their enforcement authority through litigation or other proceedings and the filing date of this Form 10-Qseek injunctive relief, damages, restitution and has determined that no pronouncements issued are relevant to the Company, and/orcivil monetary penalties, which could have a material impactadverse effect on the Company’s consolidatedbusiness, reputation, financial position,condition and results of operations or disclosure requirements.
13
The Company, through WMMRC, reinsures mortgage guaranty risks of mortgage loans originated by affiliates ofoperations.
All agreements between WMMRC and the primary mortgage insurers are on an excess of loss basis, except for a reinsurance treaty with GMIC during 2008, which is reinsured on a 50% quota share basis. Pursuant to the excess of loss reinsurance treaties, WMMRC reinsures a second loss layer which ranges from 5% to 10% of the risk in force in excess of the primary mortgage insurer’s first loss percentage which range from 4% to 5%. Each calendar year, or book year, is treated separately from other years when calculating losses. In return for accepting a portion of the risk, WMMRC receives, net of ceding commission, a percentage of the premiumCFPB notified Nationstar that, ranges from 25% to 40%.
As security for the ceding insurers, WMMRC has entered into separate trust agreements with each of the primary mortgage insurance companies whereby a portion of the funds from premiums assumed are held in trust accounts for the benefit of each separate insurer. Pursuant to the terms of the reinsurance agreements, WMMRC is required to keep such assets in trust for a minimum of five years and is subject to claims for up to ten years from termination of obligations arising from the last year in which insurance business was written prior to runoff. Release of funds from the trust by WMMRC requires approval from the primary mortgage insurance companies.
Premiums assumed and earned are as follows for the periods ended September 30, 2017 and 2016, respectively:
| Three months ended September 30, 2017 |
|
| Three months ended September 30, 2016 |
|
| Nine months ended September 30, 2017 |
|
| Nine months ended September 30, 2016 |
| ||||
Premiums assumed | $ | 342 |
|
| $ | 739 |
|
| $ | 866 |
|
| $ | 1,963 |
|
Change in unearned premiums |
| 2 |
|
|
| 47 |
|
|
| 237 |
|
|
| 463 |
|
Premiums earned | $ | 344 |
|
| $ | 786 |
|
| $ | 1,103 |
|
| $ | 2,426 |
|
The components of the liability for losses and loss adjustment reserves are as follows as of September 30, 2017 and December 31, 2016, respectively:
| September 30, 2017 |
|
| December 31, 2016 |
| ||
Case-basis reserves | $ | 174 |
|
| $ | 553 |
|
IBNR reserves |
| 1 |
|
|
| — |
|
Premium deficiency reserves |
| 530 |
|
|
| 258 |
|
Total losses and loss adjustment reserves | $ | 705 |
|
| $ | 811 |
|
Losses and loss adjustment reserve activity are as follows for the nine months ended September 30, 2017 and the year ended December 31, 2016, respectively:
|
|
|
|
|
|
|
|
| Nine months ended September 30, 2017 |
|
| Year ended December 31, 2016 |
| ||
Balance at beginning of period | $ | 811 |
|
| $ | 5,063 |
|
Incurred (released) - prior periods |
| 207 |
|
|
| (669 | ) |
Paid or terminated - prior periods |
| (313 | ) |
|
| (3,583 | ) |
Total losses and loss adjustment reserves | $ | 705 |
|
| $ | 811 |
|
The loss contract reserve balance is analyzed and adjusted quarterly. The balance in the reserve was zero and $5.6 million as of September 30, 2017 and December 31, 2016, respectively. The value of this reserve decreased by $5.6 million during the nine months ended September 30, 2017 and decreased by $2.3 million during the nine months ended September 30, 2016. In periods during which a reduction in the loss contract reserve occurs, a corresponding decrease in expense is reflected in the condensed consolidated statement of operations for the respective period.
14
The amortized cost, gross unrealized gains, gross unrealized losses and estimated fair values of total fixed-maturity securities and total fixed-maturity securities held in trust at September 30, 2017, are as follows:
| September 30, 2017 |
| |||||||||||||
Class of securities: | Amortized Cost |
|
| Gross Unrealized Gains |
|
| Gross Unrealized Losses |
|
| Estimated Fair Value |
| ||||
U.S. government treasury securities | $ | 250 |
|
| $ | — |
|
| $ | — |
|
| $ | 250 |
|
Obligations of U.S. government sponsored enterprises |
| 2,749 |
|
|
| — |
|
|
| (7 | ) |
|
| 2,742 |
|
Corporate debt securities |
| 3,683 |
|
|
| — |
|
|
| (2 | ) |
|
| 3,681 |
|
Foreign corporate debt securities |
| 3,750 |
|
|
| — |
|
|
| (1 | ) |
|
| 3,749 |
|
Total fixed-maturity securities |
| 10,432 |
|
|
| — |
|
|
| (10 | ) |
|
| 10,422 |
|
Less total unrestricted fixed-maturity securities |
| 1,402 |
|
|
| — |
|
|
| (2 | ) |
|
| 1,400 |
|
Total fixed-maturity securities held in trust | $ | 9,030 |
|
| $ | — |
|
| $ | (8 | ) |
| $ | 9,022 |
|
The amortized cost, gross unrealized gains, gross unrealized losses and estimated fair values of total fixed-maturity securities and total fixed-maturity securities held in trust at December 31, 2016, are as follows:
| December 31, 2016 |
| |||||||||||||
Class of securities: | Amortized Cost |
|
| Gross Unrealized Gains |
|
| Gross Unrealized Losses |
|
| Estimated Fair Value |
| ||||
U.S. government treasury securities | $ | 249 |
|
| $ | — |
|
| $ | — |
|
| $ | 249 |
|
Obligations of U.S. government sponsored enterprises |
| 59,450 |
|
|
| 1 |
|
|
| (80 | ) |
|
| 59,371 |
|
Corporate debt securities |
| 11,415 |
|
|
| 9 |
|
|
| (9 | ) |
|
| 11,415 |
|
Foreign corporate debt securities |
| 5,798 |
|
|
| 5 |
|
|
| (7 | ) |
|
| 5,796 |
|
Total fixed-maturity securities |
| 76,912 |
|
|
| 15 |
|
|
| (96 | ) |
|
| 76,831 |
|
Less total unrestricted fixed-maturity securities |
| 47,635 |
|
|
| — |
|
|
| (10 | ) |
|
| 47,625 |
|
Total fixed-maturity securities held in trust | $ | 29,277 |
|
| $ | 15 |
|
| $ | (86 | ) |
| $ | 29,206 |
|
Amortized cost and estimated fair value of fixed-maturity securities at September 30, 2017 by contractual maturity are as follows:
| Amortized Cost |
|
| Estimated Fair Value |
| ||
Maturity in: |
|
|
|
|
|
|
|
2017 | $ | 6,750 |
|
| $ | 6,749 |
|
2018 |
| 3,682 |
|
|
| 3,673 |
|
Total fixed-maturity securities | $ | 10,432 |
|
| $ | 10,422 |
|
Actual maturities may differ from contractual maturities because certain borrowers have the right to call or prepay obligations with or without call or prepayment penalties.
Net investment income for the three and nine months ended September 30, 2017 and 2016, respectively, is summarized as follows:
| Three months ended September 30, 2017 |
|
| Three months ended September 30, 2016 |
|
| Nine months ended September 30, 2017 |
|
| Nine months ended September 30, 2016 |
| ||||
Investment income: |
|
|
|
|
|
|
|
|
|
|
|
|
|
|
|
Amortization of premium or discount on fixed-maturity securities | $ | (32 | ) |
| $ | (74 | ) |
| $ | (108 | ) |
| $ | (247 | ) |
Investment income on fixed-maturity securities |
| 72 |
|
|
| 233 |
|
|
| 403 |
|
|
| 792 |
|
Interest income on cash and cash equivalents |
| 1,895 |
|
|
| 405 |
|
|
| 4,527 |
|
|
| 1,100 |
|
Realized net (loss) gain from sale of investments |
| (36 | ) |
|
| 18 |
|
|
| (63 | ) |
|
| 19 |
|
Unrealized gain (loss) on trading securities held at period end |
| 44 |
|
|
| (84 | ) |
|
| 67 |
|
|
| 83 |
|
Net investment income | $ | 1,943 |
|
| $ | 498 |
|
| $ | 4,826 |
|
| $ | 1,747 |
|
15
The following table shows how the Company’s investments are categorized in accordance with fair value measurement, asthe CFPB’s discretionary Notice and Opportunity to Respond and Advise (“NORA”) process, the CFPB’s Office of
September 30, 2017:
| September 30, 2017 |
| |||||||||||||
| Level 1 |
|
| Level 2 |
|
| Level 3 |
|
| Total |
| ||||
Class of securities: |
|
|
|
|
|
|
|
|
|
|
|
|
|
|
|
U.S. government treasury securities | $ | 250 |
|
| $ | — |
|
| $ | — |
|
| $ | 250 |
|
Obligations of U.S. government sponsored enterprises |
| 1,497 |
|
|
| 1,245 |
|
|
| — |
|
|
| 2,742 |
|
Corporate debt securities |
| 3,151 |
|
|
| 530 |
|
|
| — |
|
|
| 3,681 |
|
Foreign corporate debt securities |
| 3,749 |
|
|
| — |
|
|
| — |
|
|
| 3,749 |
|
Total fixed-maturity securities |
| 8,647 |
|
|
| 1,775 |
|
|
| — |
|
|
| 10,422 |
|
Money market funds |
| 32,007 |
|
|
| — |
|
|
| — |
|
|
| 32,007 |
|
Total | $ | 40,654 |
|
| $ | 1,775 |
|
| $ | — |
|
| $ | 42,429 |
|
Enforcement is considering whether to recommend that the CFPB take enforcement action against the Company, alleging violations of the Real Estate Settlement Procedures Act, the Consumer Financial Protection Act, and the Homeowners Protection Act, which stems from a 2014 examination. The following table shows howpurpose of a NORA letter is to provide a party being investigated an opportunity to present its position to the CFPB before an enforcement action may be recommended or commenced. The CFPB may seek to exercise its enforcement authority through settlement, administrative proceedings or litigation and seek injunctive relief, damages, restitution and civil monetary penalties, which could have a material adverse effect on the Company’s investments are categorized in accordance with fair value measurement, asbusiness, reputation, financial condition and results of December 31, 2016:
| December 31, 2016 |
| |||||||||||||
| Level 1 |
|
| Level 2 |
|
| Level 3 |
|
| Total |
| ||||
Class of securities: |
|
|
|
|
|
|
|
|
|
|
|
|
|
|
|
U.S. government treasury securities | $ | 249 |
|
| $ | — |
|
| $ | — |
|
| $ | 249 |
|
Obligations of U.S. government sponsored enterprises |
| 47,489 |
|
|
| 11,882 |
|
|
| — |
|
|
| 59,371 |
|
Corporate debt securities |
| 7,033 |
|
|
| 4,382 |
|
|
| — |
|
|
| 11,415 |
|
Foreign corporate debt securities |
| 5,796 |
|
|
| — |
|
|
| — |
|
|
| 5,796 |
|
Total fixed-maturity securities |
| 60,567 |
|
|
| 16,264 |
|
|
| — |
|
|
| 76,831 |
|
Money market funds |
| 4,548 |
|
|
| — |
|
|
| — |
|
|
| 4,548 |
|
Total | $ | 65,115 |
|
| $ | 16,264 |
|
| $ | — |
|
| $ | 81,379 |
|
A review of the fair value hierarchy classifications of the Company’s investments is conducted quarterly. Changes in the observability of valuation inputs may result in a reclassification for certain financial assets or liabilities. Reclassifications are reported as transfers in or transfers out of the applicable Level at the end of the calendar quarter in which the reclassifications occur. During the nine months ended September 30, 2017 and the year ended December 31, 2016, $0.9 million and $11.0 million, respectively, of investments were transferred from Level 2 to Level 1 as a result of improving market conditions for short-term and investment grade corporate securities.
| January 1, 2017 to September 30, 2017 |
| January 1, 2016 to December 31, 2016 |
| |||||||||||
| Transfers |
|
| Transfers |
|
| Transfers |
|
| Transfers |
| ||||
Class of securities: |
|
|
|
|
|
|
|
|
|
|
|
|
|
|
|
Corporate debt securities | $ | — |
|
| $ | 901 |
|
| $ | — |
|
| $ | 5,737 |
|
Foreign corporate debt securities |
| — |
|
|
| — |
|
|
| — |
|
|
| 5,295 |
|
Total transfers | $ | — |
|
| $ | 901 |
|
| $ | — |
|
| $ | 11,032 |
|
16
For the nine months ended September 30, 2017, the Company recorded net income attributable to common and participating stockholders of approximately $21.4 million.operations. The Company projects tax losses for the year ending December 31, 2017. Due to this projected tax loss and the existence of NOL carry-forwards which have a 100% valuation allowance recorded to reduce them to zero, the Company has not recorded an income taxaccrual related to this matter as of March 31, 2020 because it does not believe that the possible loss or range of loss arising from any such action is estimable. The Company is continuing to cooperate with the CFPB.
The Company files a consolidated federal income tax return. Pursuantfund borrowers’ draws to a tax sharing agreement, WMMRC’s federal income tax liability is calculated on a separate return basis determined by applying 35% to taxable income,the loan customers as required in accordance with the provisions of the Internal Revenue Code of 1986, as amended (the “Code”), that apply to property and casualty insurance companies. WMIH, as WMMRC’s parent, pays federal income taxes on behalf of WMMRC and settles the federal income tax obligation on a current basis in accordance with the tax sharingloan agreement. WMMRC made no tax payments to WMIH during the nine months ended September 30, 2017 or the year ended December 31, 2016 associated with the Company’s tax liability from the preceding year.
Deferred federal income taxes arise from temporary differences between the valuation of assets and liabilities as determined for financial reporting purposes and income tax purposes. Temporary differences principally relate to discounting of loss reserves, accruals, derivate instruments, net operating losses and unrealized gains and losses on investments. As of September 30, 2017March 31, 2020 and December 31, 2016,2019, the Company’s maximum unfunded advance obligation to fund borrower draws related to these MSRs and loans was approximately $2,504 and $2,617, respectively. Upon funding any portion of these draws, the Company recorded a valuation allowance equalexpects to 100%securitize and sell the advances in transactions that will be accounted for as secured borrowings.
| Three Months Ended March 31, 2020 | |||||||||||||||||||||||||||
| Financial information by segment | Servicing | Originations | Xome | Elimination | Total Operating Segments | Corporate/Other | Consolidated | ||||||||||||||||||||
| Revenues | |||||||||||||||||||||||||||
| Service related, net | $ | (180 | ) | $ | 20 | $ | 106 | $ | (1 | ) | $ | (55 | ) | $ | 2 | $ | (53 | ) | |||||||||
| Net gain on mortgage loans held for sale | 34 | 297 | — | — | 331 | — | 331 | ||||||||||||||||||||
| Total revenues | (146 | ) | 317 | 106 | (1 | ) | 276 | 2 | 278 | ||||||||||||||||||
| Total expenses | 149 | 166 | 96 | (1 | ) | 410 | 34 | 444 | |||||||||||||||||||
| Other income (expenses), net: | |||||||||||||||||||||||||||
| Interest income | 83 | 34 | — | — | 117 | 1 | 118 | ||||||||||||||||||||
| Interest expense | (113 | ) | (27 | ) | — | — | (140 | ) | (52 | ) | (192 | ) | |||||||||||||||
| Other income (expenses), net | — | — | 1 | — | 1 | — | 1 | ||||||||||||||||||||
| Total other income (expenses), net | (30 | ) | 7 | 1 | — | (22 | ) | (51 | ) | (73 | ) | ||||||||||||||||
| (Loss) income before income tax (benefit) expense | $ | (325 | ) | $ | 158 | $ | 11 | $ | — | $ | (156 | ) | $ | (83 | ) | $ | (239 | ) | |||||||||
| Depreciation and amortization for property and equipment and intangible assets | $ | 3 | $ | 3 | $ | 3 | $ | — | $ | 9 | $ | 10 | $ | 19 | |||||||||||||
| Total assets | $ | 10,142 | $ | 9,608 | $ | 534 | $ | (5,964 | ) | $ | 14,320 | $ | 3,293 | $ | 17,613 | ||||||||||||
| Three Months Ended March 31, 2019 | |||||||||||||||||||||||||||
| Financial information by segment | Servicing | Originations | Xome | Elimination | Total Operating Segments | Corporate/Other | Consolidated | ||||||||||||||||||||
| Revenues | |||||||||||||||||||||||||||
| Service related, net | $ | (27 | ) | $ | 15 | $ | 96 | $ | — | $ | 84 | $ | — | $ | 84 | ||||||||||||
| Net gain on mortgage loans held for sale | 35 | 131 | — | — | 166 | — | 166 | ||||||||||||||||||||
| Total revenues | 8 | 146 | 96 | — | 250 | — | 250 | ||||||||||||||||||||
| Total expenses | 195 | 104 | 99 | — | 398 | 45 | 443 | ||||||||||||||||||||
| Other income (expenses), net: | |||||||||||||||||||||||||||
| Interest income | 115 | 17 | — | — | 132 | 2 | 134 | ||||||||||||||||||||
| Interest expense | (114 | ) | (18 | ) | — | — | (132 | ) | (57 | ) | (189 | ) | |||||||||||||||
| Other income, net | — | 4 | 11 | — | 15 | — | 15 | ||||||||||||||||||||
| Total other income (expenses), net | 1 | 3 | 11 | — | 15 | (55 | ) | (40 | ) | ||||||||||||||||||
| (Loss) income before income tax (benefit) expense | $ | (186 | ) | $ | 45 | $ | 8 | $ | — | $ | (133 | ) | $ | (100 | ) | $ | (233 | ) | |||||||||
| Depreciation and amortization for property and equipment and intangible assets | $ | 4 | $ | 3 | $ | 4 | $ | — | $ | 11 | $ | 10 | $ | 21 | |||||||||||||
| Total assets | $ | 13,642 | $ | 4,865 | $ | 502 | $ | (4,100 | ) | $ | 14,909 | $ | 2,737 | $ | 17,646 | ||||||||||||
On March 19, 2012, WMIH emerged from bankruptcy. Prior to emergence, WMI abandoned the stockeffect of WMB, thereby generating a worthless stock deduction of approximately $8.37 billion which gave rise to a NOL for the year ended December 31, 2012. Under Section 382 of the Code (“Section 382”), and basedeach such new factor on the Company’s analysis,our business. Although we believe that the Company experienced an “ownership change” (generally definedassumptions underlying the forward-looking statements contained herein are reasonable, any of the assumptions could be inaccurate, and any of these statements included herein may prove to be inaccurate. Given the significant uncertainties inherent in the forward-looking statements included herein, the inclusion of such information should not be regarded as a greater than 50% change (by value) in our equity ownership over a three-year period) on March 19, 2012, and our ability to use our pre-change of control NOLs andrepresentation by us or any other pre-change tax attributes against our post-change income was limited. The Section 382 limitation is applied annually so as to limit the use of our pre-change NOLs to an amount that generally equals the value of our stock immediately before the ownership change multiplied by a designated federal long-term tax-exempt rate. Due to applicable limitations under Section 382 and a reduction of tax attributes due to cancellation of indebtedness, a portion of these NOLs were limited and will expire unused. We believeperson that the total availableresults or conditions described in such statements or our objectives and utilizable NOL carry-forward at December 31, 2016 was approximately $6.0 billion. At September 30, 2017, there was no limitation on the useplans will be achieved. Please refer to
The Company accounts for uncertain tax positions in accordance with the income tax accounting guidance. The Company has analyzed filing positions in the federal and state jurisdictions where it is required to file tax returns, as well as the open tax years in these jurisdictions. Tax years 2011 to present are subject to examination by the Internal Revenue Service. The Company believes that its federal income tax filing positions and deductions will be sustained on audit and does not anticipate any adjustments that will result in a material change to its financial position. Therefore, no reserves for uncertain federal income tax positions have been recorded. The Company recognizes interest and penalties related to unrecognized tax benefits as a component of the provision for federal income taxes. The Company did not incur any federal income tax related interest income, interest expense or penalties for the nine months ended September 30, 2017 or for the year ended December 31, 2016.
Note 6: Service Agreements and Related Party Transactions
WMMRC has engaged a Hawaii-based service provider, Marsh Management Services, Inc., to provide accounting and related management services for its operations. In exchange for performing these services, WMMRC pays such service provider a management fee.
WMIH entered into an Investment Management Agreement and an Administrative Services Agreement with WMMRC on March 19, 2012. Each of these agreements was approved by WMMRC’s primary regulator, the Insurance Division of the State of Hawaii. Total amounts incurred under these agreements totaled $1.0 million and $1.0 million for the nine months ended September 30, 2017 and 2016, respectively. The expense and related income eliminate on consolidation. These agreements are described below.
Under the terms of such Investment Management Agreement, WMIH receives from WMMRC a fee equal to the product of (x) the ending dollar amount of assets under management during the calendar month in question and (y) .002 divided by 12. WMIH is responsible for investing the funds of WMMRC based on applicable investment criteria and subject to rules and regulations to which WMMRC is subject.
17
Under the terms of such Administrative Services Agreement, WMIH receives from WMMRC a fee of $110 thousand per month. WMIH is responsible for providing administrative services to support, among other things, supervision, governance, financial administration and reporting, risk management and claims management as may be necessary, together with such other general or specific administrative services that may be reasonably required or requested by WMMRC in the ordinary course of its business.
On March 22, 2012, WMIH and the WMI Liquidating Trust (the “Trust”) entered into a Transition Services Agreement (the “TSA”). Pursuant to the TSA, the Trust makes available certain services and employees. The TSA provides the Company with basic infrastructure and support services to facilitate the Company’s operations. The TSA, as amended, extends the term of the agreement through January 31, 2019 with automatic renewals thereafter for successive additional three-month terms, subject to non-renewal at the end of any additional term upon written notice by either party at least 30 days prior to the expiration of the additional term.
In connection with implementing the Company’s Seventh Amended Joint Plan of Affiliated Debtors Pursuant to Chapter 11 of the United States Bankruptcy Code (as modified, the “Plan”), certain holders of specified “Allowed Claims” had the right to elect to receive such holder’s “Pro Rata Share of the Common Stock Allotment.” Essentially, the Plan defines the “Pro Rata Share of the Common Stock Allotment” as a pro rata share of ten million (10,000,000) shares of WMIH’s common stock (i.e. five percent (5%)) issued and outstanding on the Effective Date. Holders exercising the foregoing election did so in lieu of receiving (i) 50% of such holder’s interest in and to certain litigation proceeds that could be realized by the Trust on account of certain claims and causes of action asserted by the Trust as contemplated by the Plan (“Litigation Proceeds”), and (ii) some or all of the Runoff Notes to which such holder may be entitled (if such holder elected to receive Runoff Notes in accordance with the terms of the Plan).
If a holder exercised the election described above and, as a result of such election, received shares of WMIH’s common stock, then such holder’s share of Runoff Notes to which the election was effective (i.e., One Dollar ($1.00) of original principal amount of Runoff Notes for each share of WMIH’s common stock) were not issued. In addition, as a result of making the aforementioned election, such holders conveyed to WMIH, and WMIH retained an economic interest in Litigation Proceeds, if any, recovered by the Trust in connection with certain litigation brought by the Trust as contemplated by the Plan. Distributions, if any, to WMIH on account of the foregoing will be effected in accordance with the Plan and the court order confirming the Plan.
On or about October 14, 2014, the Trust filed a lawsuit in King County Superior Court in the State of Washington against 16 former directors and officers of WMI (the “D&O Litigation”). The Trust’s complaint alleged, among other things, that the defendants named therein breached their fiduciary duties to WMI and committed corporate waste and fraud by squandering WMI’s financial resources. In connection with the settlement of the D&O Litigation, during the year ended December 31, 2015, among the Trust, certain former directors and officers of WMI and certain insurance carriers that underwrote director and officer liability insurance policies for the benefit of WMI and its affiliates (including such former directors and officers), such insurance carriers agreed to pay the Trust $37.0 million, of which $3.0 million would be placed into a segregated reserve account (the “RSA Reserve”) to be administered by a third party pursuant to the terms of a Reserve Settlement Agreement (the “RSA”).
During the years ended December 31, 2016 and 2015, WMIH had other income of $123 thousand and $7.8 million, respectively, as a result of its receipt of net Litigation Proceeds related to the D&O Litigation. As of September 30, 2017, $1.5 million remained in the RSA Reserve. Under the RSA, funds are released from the RSA Reserve to the Trust if and when certain designated conditions are satisfied. If and when these funds are released to the Trust, and to the extent WMIH is entitled to receive such funds in accordance with the Plan, it is anticipated the Trust will make payments to WMIH in an amount equal to WMIH’s share of Litigation Proceeds as provided under the Plan. Due to the contingent nature of future distributions from the RSA Reserve, there can be no assurance that WMIH will receive any distributions from the remaining balance in the RSA Reserve in the future. During the nine months ended September 30, 2017, WMIH has recorded income from Litigation Proceeds of $123 thousand. As of September 30, 2017, WMIH has not received any Litigation Proceeds, other than as described above.
In preparation for the offering of the Series B Preferred Stock, WMIH engaged KKR Capital Markets LLC (“KCM”), an affiliate of KKR & Co. L.P., to act as a joint book-running manager for the Series B Preferred Stock offering. KCM also acted as an initial purchaser of the Series B Preferred Stock. During the year ended December 31, 2015, as a result of satisfying a post-closing covenant to reincorporate in the State of Delaware within 180 days following the closing of the Series B Preferred Stock offering, we paid $8.25 million to KCM. Upon consummation of a “Qualified Acquisition” (as such term is defined in Article VI of the Certificate of Incorporation), we will pay KCM an additional fee (the “KCM Deferred Fee”) of $8.25 million. We have recorded the KCM Deferred Fee in “other liabilities” on our condensed consolidated balance sheet and this amount was included in “accrued fees relating to Series B Preferred Stock issuance” on our condensed consolidated statements of cash flows.
Note 7: Notes Payable
On the Effective Date, WMIH issued $110.0 million aggregate principal amount of its 13% Senior First Lien Notes due 2030 (the “First Lien Notes”) under an indenture, dated as of March 19, 2012 (the “First Lien Indenture”), between WMIH and Wilmington Trust, National Association, as Trustee. Additionally, WMIH issued $20.0 million aggregate principal amount of its 13% Senior Second Lien Notes due 2030 (the “Second Lien Notes” and, together with the First Lien Notes, the “Runoff Notes”) under an indenture, dated as of March 19, 2012 (the “Second Lien Indenture” and, together with the First Lien Indenture, the “Indentures”), between WMIH and Law Debenture Trust Company of New York, as Trustee. On January 5, 2017, The Law Debenture Trust Company of New York notified WMIH that it had completed the transfer of substantially all of its corporate trust business to Delaware Trust Company, and that Delaware Trust Company had become the successor trustee under the Second Lien Indenture. The Runoff Notes were scheduled to mature on March 19, 2030 and pay interest quarterly.
The Runoff Notes were secured by, and had a specified priority in right of payment in, a securities or deposit account into which WMIH was required to deposit distributions it received of Runoff Proceeds (as defined in the Indentures) (the “Collateral Account”). WMIH agreed to cause WMMRC, while the Runoff Notes were outstanding, to deposit all distributions, dividends or other receipts in respect of Runoff Proceeds Distributions (as defined in the Indentures) on the date paid to WMIH in the Collateral Account established in accordance with the terms of the Indentures. On any interest payment date, payments were made from the Collateral Account and from any other Runoff Proceeds Distributions in the priority set forth in the Indentures. In connection with certain interest payments due and payable in respect of the First and Second Lien Notes, WMIH elected, consistent with the terms of the Indentures, to issue payment-in-kind notes in lieu of making such interest payments in cash when no cash was available.
As of April 15, 2015, the First Lien Notes were fully redeemed by the Company, and on April 27, 2015, the First Lien Indenture was satisfied and discharged.
Second Lien Note principal outstanding totaled zero and approximately $18.8 million as of September 30, 2017 and December 31, 2016, respectively. Approximately $18.8 million of Second Lien Note principal was paid during the nine months ended September 30, 2017, and $2.9 million of Second Lien Note principal was paid during the year ended December 31, 2016. Interest on Second Lien Notes paid in cash totaled approximately $2.0 million during each of the nine months ended September 30, 2017 and 2016. As of September 29, 2017, the Second Lien Notes were fully redeemed by the Company, and on October 2, 2017, the Second Lien Indenture was satisfied and discharged. As a result of the satisfaction and discharge of the Second Lien Indenture the Collateral Account was subsequently closed and remaining funds transferred to cash and cash equivalents to be used for general corporate purposes. For more information see Note 14: Subsequent Events.
Note 8: Financing Arrangements
As of September 30, 2017, the Company had no debt financing arrangements in place. As of December 31, 2016, the Company had no debt financing arrangements in place other than the Second Lien Notes which are described in Note 7: Notes Payable.
Note 9: Capital Stock and Derivative Instruments
On the Effective Date, all shares of common and preferred equity securities previously issued by WMI were cancelled and extinguished. As of the Effective Date, and pursuant to WMIHC’s Amended and Restated Articles of Incorporation (the “Articles”), WMIHC was authorized to issue up to 500,000,000 shares of common stock and up to 5,000,000 shares of blank check preferred stock, in one or more series, each with a par value of $0.00001 per share. 200,000,000 shares of common stock were issued by WMIHC pursuant to the Plan and in reliance on Section 1145 of the United States Bankruptcy Code on the Effective Date.
On the Reincorporation Date all shares of common and preferred equity securities previously issued by WMIHC automatically were converted into one share of the substantially similar common stock, Series A Preferred Stock or Series B Preferred Stock, as applicable, of WMIH. At the same time, each outstanding option, right or warrant to acquire shares of WMIH’s common stock was converted into an option, right or warrant to acquire an equal number of shares of WMIH’s common stock under the same terms and conditions as the original options, rights or warrants. As of the Reincorporation Date, and pursuant to the Certificate of Incorporation, WMIH is authorized to issue up to 3,500,000,000 shares of common stock and up to 10,000,000 shares of blank check preferred stock, in one or more series, each with a par value of $0.00001 per share.
All of the terms of the agreements described below and attributed to WMIH are also attributable to WMIHC relative to the various agreements and instruments prior to the Reincorporation Date. The references to WMIH are based on the date this Form 10-Q has been filed. The references would have been to WMIHC prior to the Reincorporation Date.
19
On January 30, 2014, WMIH entered into (i) an investment agreement, dated as of January 30, 2014 (the “Investment Agreement”), with KKR Fund Holdings L.P. (“KKR Fund”) and, for limited purposes, KKR Management Holdings L.P., and (ii) an investor rights agreement, dated as of January 30, 2014 (the “Investor Rights Agreement”), with KKR Fund. On January 30, 2014, pursuant to the Investment Agreement, WMIH issued 1,000,000 shares of its Series A Preferred Stock having the terms, rights, obligations and preferences contained in the Articles of Amendment of WMIH dated January 30, 2014 for a purchase price equal to $11.1 million and has issued to KKR Fund warrants to purchase, in the aggregate, 61.4 million shares of WMIH’s common stock, 30.7 million of which have an exercise price of $1.32 per share and 30.7 million of which have an exercise price of $1.43 per share (together, the “Warrants”).
The Series A Preferred Stock has rights substantially similar to those associated with WMIH’s common stock, with the exception of a liquidation preference, conversion rights and customary anti-dilution protections. The Series A Preferred Stock has a liquidation preference equal to the greater of (i) $10.00 per one million shares of Series A Preferred Stock plus declared but unpaid dividends on such shares and (ii) the amount that the holder would be entitled to in a relevant transaction had the Series A Preferred Stock been converted to common stock of WMIH. The Series A Preferred Stock is convertible at a conversion price of $1.10 per share into shares of common stock of WMIH either at the option of the holder or automatically upon transfer by KKR Fund to a non-affiliated party. As a result of the calculation of a beneficial conversion feature as required by ASC topic 470 - Debt a preferred deemed dividend of $9.5 million was recorded in conjunction with the issuance of the Series A Preferred Stock. This preferred deemed dividend resulted in an increase to our accumulated deficit, and an increase in additional paid in capital. Further, KKR Fund, as the holder of the Series A Preferred Stock and the Warrants, has received other rights pursuant to the Investor Rights Agreement as described below.
The Warrants have a five-year term from the date of issuance and are subject to customary structural adjustment provisions for stock splits, combinations, recapitalizations and other similar transactions. KKR Fund’s rights as a holder of the Series A Preferred Stock and the Warrants, and the rights of any subsequent holder that is an affiliate of KKR Fund (together with KKR Fund, the “Series A Holders”) are governed by the Investor Rights Agreement.
In accordance with the Investor Rights Agreement, except for the issuance of WMIH’s common stock in respect of the Warrants and the Series A Preferred Stock, KKR Fund and its affiliates shall not purchase or acquire any equity securities of WMIH or its subsidiaries without WMIH’s prior written consent, subject to certain exceptions.
The Investor Rights Agreement also provides the Series A Holders with registration rights, including three long form demand registration rights, unlimited short form demand registration rights and customary piggyback registration rights with respect to WMIH’s common stock (and WMIH’s common stock underlying the Series A Preferred Stock and the Warrants), subject to certain minimum thresholds, customary blackout periods and lockups of 180 days. On July 1, 2015, WMIH filed a shelf registration statement (the “Initial Registration Statement”) covering resales of Series B Preferred Stock and WMIH’s common stock issuable upon mandatory conversion of the Series B Preferred Stock. On November 23, 2015, WMIH amended the Initial Registration Statement to cover WMIH’s common stock issuable upon conversion of the Series A Preferred Stock and shares of WMIH’s common stock issuable upon exercise of warrants issued in connection with the issuance of our Series A Preferred Stock currently outstanding (as amended, the “Registration Statement”). The Registration Statement was declared effective under the Securities Act on November 25, 2015.
For as long as the Series A Holders beneficially own any shares of common stock of WMIH or Series A Preferred Stock or any of the Warrants, WMIH has agreed to provide customary Rule 144A information rights, to provide the Series A Holders with regular audited and unaudited financial statements and to allow the Series A Holders or their representatives to inspect WMIH’s books and records.
The foregoing description of (i) the Investor Rights Agreement is qualified in its entirety by reference to the Investor Rights Agreement, which was filed with the SEC as Exhibit 4.2 on Form 8-K on January 31, 2014, and incorporated by reference, (ii) the Warrants are qualified in their entirety by reference to the Form of Tranche A Warrant and Form of Tranche B Warrant, which were filed with the SEC as Exhibits 4.3 and 4.4, respectively, on Form 8-K on January 31, 2014, and incorporated by reference, (iii) the Series A Preferred Stock is qualified in its entirety by reference to the Articles of Amendment of WMIH dated January 30, 2014, which were filed with the SEC as Exhibit 4.5 on Form 8-K on January 31, 2014, and incorporated by reference, the Form of Series A Convertible Preferred Stock Certificate, which was filed with the SEC as Exhibit 4.6 on Form 8-K on January 31, 2014, and incorporated by reference, and the Certificate of Incorporation, which was filed with the SEC as Exhibit 3.1 on Form 8-K12G3 on May 13, 2015, and incorporated by reference, and (iv) the Investment Agreement is qualified in its entirety by reference to the Investment Agreement, which was filed with the SEC as Exhibit 10.1 on Form 8-K on January 31, 2014, and incorporated by reference.
On January 5, 2015, WMIH, in connection with an offering of 600,000 shares of its Series B Preferred Stock, filed with the Secretary of State of Washington Articles of Amendment of Articles of Incorporation (the “Articles of Amendment”) containing the Designation of Rights and Preferences of the 3% Series B Convertible Preferred Stock (the “Certificate of Designation”) creating the Series B Preferred Stock and designating the rights and preferences of the Series B Preferred Stock.
20
The foregoing descriptions of the Articles of Amendment and the Certificate of Designation are qualified in their entirety by the provisions of the Articles of Amendment and the Certificate of Designation, filed as Exhibits 3.1 and 4.1 to a Form 8-K on January 5, 2015, respectively, and incorporated by reference herein, and the Certificate of Incorporation, which was filed with the SEC as Exhibit 3.1 on Form 8-K12G3 on May 13, 2015, and incorporated by reference.
On January 5, 2015, in connection with the offering and pursuant to that certain Purchase Agreement, dated December 19, 2014 (the “Purchase Agreement”), by and among WMIH, Citigroup Global Markets Inc. (“Citi”) and KCM (KCM and Citi together, the “Initial Purchasers”), WMIH entered into a Registration Rights Agreement with the Initial Purchasers (the “Registration Rights Agreement”), pursuant to which WMIH has agreed that, subject to certain conditions, WMIH will use its reasonable efforts to (i) file a shelf registration statement covering resales of WMIH’s common stock issuable upon mandatory conversion of the Series B Preferred Stock no later than six months after January 5, 2015 (the “Issue Date”); (ii) file a shelf registration statement covering resales of the Series B Preferred Stock no later than one year after the Issue Date; and (iii) cause each of these shelf registration statements to be declared effective under the Securities Act. On July 1, 2015, WMIH filed the Initial Registration Statement covering resales of Series B Preferred Stock and shares of WMIH’s common stock issuable upon mandatory conversion of the Series B Preferred Stock. On November 23, 2015, WMIH amended the Initial Registration Statement to cover WMIH’s common stock issuable upon conversion of the Series A Preferred Stock and shares of WMIH’s common stock issuable upon exercise of warrants issued in connection with the issuance of our Series A Preferred Stock currently outstanding. The Registration Statement was declared effective under the Securities Act on November 25, 2015.
The foregoing description of the Registration Rights Agreement is qualified in its entirety by the provisions of the Registration Rights Agreement, filed on Form 8-K on January 5, 2015, as Exhibit 10.1 and incorporated by reference herein.
On January 5, 2015, in connection with the offering and pursuant to the Purchase Agreement, WMIH entered into an Escrow Agreement (the “Escrow Agreement”) with Citibank, N.A., as Escrow Agent (the “Escrow Agent”), pursuant to which WMIH caused to be deposited with the Escrow Agent the amount of $598.5 million, representing the proceeds of the offering of Series B Preferred Stock less offering fees payable on the Issue Date but before payment of other offering fees and expenses (including fees contingent upon future events). These net proceeds have been, and will be, released from escrow from time to time to WMIH as instructed by WMIH in amounts necessary to (i) pay certain fees related to the offering that may become payable to the Initial Purchasers, (ii) finance WMIH’s efforts to explore and/or fund, in whole or in part, acquisitions, whether completed or not, including reasonable attorney fees and expenses related thereto, accounting expenses, due diligence and financial advisor fees and expenses, (iii) pay certain amounts that may become payable to the holders of the Series B Preferred Stock upon the occurrence of certain put events, (iv) pay certain amounts that would become payable to the holders of the Series B Preferred Stock upon a mandatory redemption of the Series B Preferred Stock, and (v) pay certain expenses related to the offering. The entire net proceeds will be released from escrow as instructed by WMIH upon consummation of a Qualified Acquisition (as defined in Article VI of the Certificate of Incorporation). If a Qualified Acquisition is not consummated by January 5, 2018, and no Acquisitions (as defined in Article VI of the Certificate of Incorporation) have been consummated such that all of the Series B Preferred Stock remains outstanding and has not been converted to WMIH’s common stock, the outstanding Series B Preferred Stock becomes redeemable. The aggregate redemption costs, assuming all 600,000 shares remain outstanding, of all of the Series B Preferred Stock is $600.0 million, plus accrued and unpaid dividends, if any, whether or not declared. As of September 30, 2017 and December 31, 2016, the balance remaining in the escrow account totaled approximately $577.2 million and $572.9 million, respectively. The foregoing description of the Escrow Agreement is qualified in its entirety by the provisions of the Escrow Agreement, filed on Form 8-K on January 5, 2015, as Exhibit 10.2 and incorporated by reference herein.
If the Series B Preferred Stock is redeemed or determined likely to be redeemed, the Company would be required to record a charge to earnings of approximately $97.8 million to accrete the value of the Series B Preferred Stock to the $600 million redemption value. The Company continues to pursue its business strategy of consummating an acquisition, and to explore potential financing and refinancing alternatives, and as of September 30, 2017, the Company has determined that recording for accretion to the Series B Preferred Stock’s redemption value is not required.
21
The Series B Preferred Stock are hybrid financial instruments that blend characteristics of both equity and debt securities. The terms of the Series B Preferred Stock provide for either redemption of the principal and interest for cash at maturity or in the event of certain predetermined circumstances (“Forward Component”) or mandatory conversion into WMIH’s common stock (“Embedded Conversion Feature” or “ECF”). The Series B Preferred Stock also embody contingent equity-linked share price protections on the ECF in the form of a variable conversion price based on a 20 trading day average of volume weighted-average price. Upon any conversion of Series B Preferred Stock in accordance with its terms, the Series B Preferred Stock shall convert based on the outstanding principal and accrued interest, subject to a floor of $1.75 per share of WMIH’s common stock and a maximum of $2.25 per share. As a result, the Company determined that the Series B Preferred Stock contain certain embedded derivative features. Management’s evaluation resulted in the conclusion that the compound derivative financial instrument required bifurcation and separately accounted for the embedded conversion feature option as a derivative. A derivative liability results primarily when the Company average stock price (as defined in the Certificate of Incorporation) exceeds the conversion price, including the ceiling conversion price of $2.25, as defined by the Certificate of Incorporation. A derivative asset results primarily when the Company’s average stock price is less than the conversion price, including the floor price of $1.75. The aggregate fair value of the embedded conversion feature was a liability of $66.2 million on the date of issuance of the Series B Preferred Stock. At September 30, 2017, September 30, 2016 and December 31, 2016, the fair value of the embedded conversion feature was an asset of $111.9 million, a liability of $58.3 million and an asset of $80.7 million, respectively. Any change in the fair value of the embedded conversion feature will constitute other income or expense, as the case may be, in the applicable reporting period. Upon conversion or redemption of the Series B Preferred Stock, any asset or liability related to the embedded conversion feature would be eliminated. During the year ended December 31, 2016, the fair value of the embedded conversion feature changed by $201.5 million and this change is included as other income in the condensed consolidated statement of operations for the year ended December 31, 2016. During the three and nine months ended September 30, 2017, the fair value of the derivative asset increased by $38.6 million and $31.2 million, respectively. During the three and nine months ended September 30, 2016, the fair value of the derivative liability increased by $16.2 million and decreased by $62.6 million, respectively. The change in fair value is included as other income or expense, as the case may be, in the condensed consolidated statement of operations for the respective periods.
On June 1, 2017 and on June 1, 2016, WMIH issued restricted stock grants to members of the Board totaling $0.4 million and $0.5 million, respectively, of aggregate fair value. The restricted shares noted above vest over a three-year period.
On May 15, 2015, WMIH issued restricted stock grants to our Chief Executive Officer, William C. Gallagher, and our Chief Operating Officer, Thomas L. Fairfield, in conjunction with employment agreements totaling $9.8 million of aggregate fair value (the “Exec Grants”) based on the $2.76 trading price of WMIH shares at the close of business on the date issued. WMIH may be required to issue additional shares if the conversion price applicable to the Series B Preferred Stock is less than $2.25 per share. The Exec Grants will vest in full and will be recognized as compensation expense upon the consummation of a Qualified Acquisition, subject to the executives continued employment with the Company until such time. The foregoing description of the restricted stock agreement does not purport to be complete and is subject to, and qualified in its entirety by, the full text of the Gallagher Restricted Stock Agreement and the Fairfield Restricted Stock Agreement (the “Executive Agreements”), which were filed as Exhibit 10.3 and Exhibit 10.5, respectively, of Form 8-K12G3 filed on May 13, 2015 and incorporated herein by reference. The fair market value of the Exec Grants as of September 30, 2017 approximates $4.3 million as a result of the terms of the Executive Agreements which would result in additional share issuances if the value is below $2.25 per share limited to a maximum of shares based on a minimum conversion price of $1.75 per share. The stock price was $0.95 per share at the close of the market on September 30, 2017 and if the Exec Grants had vested then the minimum conversion price of $1.75 per share would have been utilized, therefore, a total of 1,015,874 additional shares (the “Exec Additional Shares”) would have been required to be issued, 507,937 additional shares each to both Mr. Gallagher and Mr. Fairfield.
22
The unamortized value related to the unvested restricted share grants totals $5.0 million and $7.7 million at September 30, 2017 and December 31, 2016, respectively.
The unamortized value of $5.0 million at September 30, 2017, if all are ultimately vested, would be amortized according to the following schedule. The fair value of the Exec Grants will vest and be recognized on the date of the consummation of a Qualified Acquisition. Additionally, any Exec Additional Shares required to be issued, would be issued and immediately vest on the date of the consummation of a Qualified Acquisition.
Amortization Schedule (in thousands) |
| September 30, 2017 unamortized dollar value |
| |
4th quarter 2017 |
| $ | 103 |
|
1st quarter 2018 |
|
| 98 |
|
2nd quarter 2018 |
|
| 71 |
|
3rd quarter 2018 |
|
| 71 |
|
4th quarter 2018 |
|
| 71 |
|
1st quarter 2019 |
|
| 66 |
|
2nd quarter 2019 |
|
| 36 |
|
3rd quarter 2019 |
|
| 36 |
|
4th quarter 2019 |
|
| 36 |
|
1st quarter 2020 |
|
| 31 |
|
Unamortized fair-value - subject to vesting schedule |
|
| 619 |
|
Unamortized fair-value - event dependent |
|
| 4,343 |
|
Total unamortized dollar value |
|
| 4,962 |
|
|
|
|
|
|
Equity-based compensation totaled $0.4 million and $0.5 million for the nine months ended September 30, 2017 and September 30, 2016, respectively. The restricted stock awards were issued at the fair market value determined to be the trading price at the close of business on the respective date the awards were granted.
A summary of WMIH’s restricted stock award activity for the nine months ended September 30, 2017 and year ended December 31, 2016 is presented below:
|
| Number of restricted stock awards outstanding |
|
| Weighted-average grant date fair value |
|
| Aggregate fair value (in thousands) |
| |||
Outstanding—January 1, 2016 |
|
| 6,168,035 |
|
|
| 2.1230 |
|
|
| 13,095 |
|
Restricted stock awards granted during 2016 |
|
| 212,765 |
|
|
| 2.3500 |
|
|
| 500 |
|
Restricted stock awards released or forfeited during 2016 |
|
| — |
|
|
| — |
|
|
| — |
|
Outstanding—December 31, 2016 |
|
| 6,380,800 |
|
| $ | 2.1306 |
|
| $ | 13,595 |
|
Restricted stock awards granted during 2017 |
|
| 333,332 |
|
|
| 1.2000 |
|
|
| 400 |
|
Restricted stock awards released or forfeited during 2017 |
|
| — |
|
|
| — |
|
|
| — |
|
Outstanding—September 30, 2017 |
|
| 6,714,132 |
|
| $ | 2.0844 |
|
| $ | 13,995 |
|
WMIH has issued the total number of shares subject to the restricted stock grants, however, until vested they are subject to repurchase. Shares subject to repurchase totaled 4,053,640 on September 30, 2017 and 4,039,591 on December 31, 2016. The Exec Grants vest upon future events, and are not time specific, and for this reason we have used 1st quarter 2018 as the vesting date in the following table as this date corresponds with the Series B Preferred Stock potential redemption date. The shares subject to repurchase at September 30, 2017 will vest, assuming circumstances remain unchanged, according to the following schedule:
|
| |||
|
| |||
|
| |||
|
| |||
|
| |||
|
| |||
|
| |||
|
| |||
|
| |||
|
| |||
|
| |||
|
| |||
Pursuant to a restricted stock agreement, WMIH has the right, but not the obligation, to repurchase any unvested (but issued) shares of common stock subject to the restricted stock agreement at $0.0001 per share upon the termination of service in the case of a director, or in the case of the Exec Grants, on January 5, 2018 if the Series B Preferred Stock are redeemed or as a result of certain circumstances as defined by the terms of the Exec Grants.
A summary of WMIH’s restricted shares issued and subject to repurchase as of September 30, 2017 and December 31, 2016 is presented below:
|
| |||
|
| |||
|
| |||
|
| |||
|
|
| ||
|
| |||
|
| |||
|
| |||
|
|
| ||
|
| |||
On June 1, 2017 and June 1, 2016, WMIH issued 333,332 and 212,765 restricted stock grants, respectively, to members of the Board totaling $0.4 million and $0.5 million, respectively, of aggregate fair value. The share price was determined based on the closing sales price of $1.20 and $2.35 on the respective dates of the awards.
As of September 30, 2017 and December 31, 2016, 206,714,132 and 206,380,800, respectively, of WMIH’s common stock were issued and outstanding. As of September 30, 2017 and December 31, 2016, 1,000,000 shares of the Series A Preferred Stock were issued and outstanding. As of September 30, 2017 and December 31, 2016, 600,000 shares of the Series B Preferred Stock were issued and outstanding. As of September 30, 2017 and December 31, 2016, 61,400,000 warrants to purchase WMIH’s common stock were issued and outstanding.
See Note 12: Net Income Per Common Share for further information on shares used for EPS calculations.
Note 10: Pending Litigation
As of September 30, 2017, the Company was not a party to, or aware of, any pending legal proceedings or investigations requiring disclosure at this time.
24
Note 11: Restriction on Distribution of Net Assets from Subsidiary
WMMRC has net assets totaling $17.7 millionthese and $33.8 million as of September 30, 2017 and December 31, 2016, respectively. These net assets are not immediately available for distribution to WMIH due to restrictions imposed by trust agreements, and the requirement that the Insurance Division of the State of Hawaii must approve dividends from WMMRC. Prior to September 29, 2017, when the Second Lien Notes were fully redeemed by the Company and October 2, 2017 when the Second Lien Indenture was satisfied and dischargedother risk factors affecting us., distributions from WMMRC to WMIH were further restricted by the terms of the Runoff Notes and Indentures described in Note 7: Notes Payable. As more fully described in Note 14: Subsequent Events, a distribution from WMMRC to WMIH of up to $10.7 million was approved by the Insurance Division of the State of Hawaii on September 13, 2017.
Note 12: Net Income (Loss) Per Common Share
In calculating earnings per share, the Company follows the two-class method, which distinguishes between the classes of securities based on the proportionate participation rights of each security type in the Company's undistributed income. The Series A Preferred Stock and the Series B Preferred Stock are treated as one class for purposes of applying the two-class method, because they have substantially equal rights and share equally on an as converted basis with respect to income available to WMIH common stockholders.
Basic net income per WMIH share attributable to common stockholders is computed by dividing net income attributable to WMIH’s common stockholders by the weighted-average number of common shares outstanding for the period after subtracting the weighted-average of any unvested restricted shares outstanding, as these shares are subject to repurchase. Basic net income attributable to common stockholders is computed by deducting preferred dividends and the basic calculation of undistributed earnings attributable to participating securities from net income.
Diluted net income per WMIH share is computed by dividing net income attributable to WMIH’s common stockholders for the period by the weighted-average number of common shares outstanding after subtracting the weighted-average of any incremental unvested restricted shares outstanding and adding any potentially dilutive common equivalent shares outstanding during the period, if dilutive. Potentially dilutive common equivalent shares are comprised of the incremental common shares issuable upon the exercise of warrants for WMIH’s common stock and the potential conversion of preferred shares to common shares and the dilutive effect of unvested restricted stock. Diluted net income attributable to common stockholders is computed by deducting preferred dividends and the diluted calculation of undistributed earnings attributable to participating securities from net income.
The dilutive effect of outstanding warrants and restricted stock subject to repurchase is reflected in diluted earnings per share by application of the treasury stock method. There would be no dilutive effects from any equity instruments for periods presented reflecting a net loss, therefore diluted net loss per share would be the same as basic net loss for periods that reflect a net loss attributable to common stockholders. Certain unvested restricted shares and convertible preferred stock are excluded from the calculation of diluted earnings per share until the non-market based contingency occurs.
The following table presents the calculation of basic net (loss) income per share for periods presented:
(in thousands, except per share data):
| Three months ended September 30, 2017 |
|
| Three months ended September 30, 2016 |
|
| Nine months ended September 30, 2017 |
|
| Nine months ended September 30, 2016 |
| ||||
Numerator for basic net income (loss) per share: |
|
|
|
|
|
|
|
|
|
|
|
|
|
|
|
Net income (loss) | $ | 38,411 |
|
| $ | (16,645 | ) |
| $ | 34,876 |
|
| $ | 61,314 |
|
Less: Series B preferred stock dividends |
| (4,500 | ) |
|
| (4,500 | ) |
|
| (13,500 | ) |
|
| (13,500 | ) |
Less: undistributed earnings attributed to participating securities (basic calculation) |
| (21,541 | ) |
|
| — |
|
|
| (13,581 | ) |
|
| (27,625 | ) |
Basic net income (loss) attributable to common stockholders | $ | 12,370 |
|
| $ | (21,145 | ) |
| $ | 7,795 |
|
| $ | 20,189 |
|
Denominator for basic net income (loss) per share: |
|
|
|
|
|
|
|
|
|
|
|
|
|
|
|
Weighted-average shares outstanding |
| 206,714,132 |
|
|
| 206,380,800 |
|
|
| 206,529,762 |
|
|
| 206,261,993 |
|
Weighted-average unvested restricted shares outstanding |
| (4,053,640 | ) |
|
| (4,039,591 | ) |
|
| (3,956,447 | ) |
|
| (4,014,718 | ) |
Denominator for basic net income (loss) per share |
| 202,660,492 |
|
|
| 202,341,209 |
|
|
| 202,573,315 |
|
|
| 202,247,275 |
|
Basic net income (loss) per share attributable to common stockholders | $ | 0.06 |
|
| $ | (0.10 | ) |
| $ | 0.04 |
|
| $ | 0.10 |
|
The following table presents the calculation of diluted net (loss) income per share for periods presented:
(in thousands, except per share data):
| Three months ended September 30, 2017 |
|
| Three months ended September 30, 2016 |
|
| Nine months ended September 30, 2017 |
|
| Nine months ended September 30, 2016 |
| ||||
Numerator for diluted net income (loss) per share: |
|
|
|
|
|
|
|
|
|
|
|
|
|
|
|
Net income (loss) | $ | 38,411 |
|
| $ | (16,645 | ) |
| $ | 34,876 |
|
| $ | 61,314 |
|
Less: Series B preferred stock dividends |
| (4,500 | ) |
|
| (4,500 | ) |
|
| (13,500 | ) |
|
| (13,500 | ) |
Less: undistributed earnings attributed to participating securities (diluted calculation) |
| (21,541 | ) |
|
| — |
|
|
| (13,581 | ) |
|
| (26,241 | ) |
Diluted net income (loss) attributable to common stockholders | $ | 12,370 |
|
| $ | (21,145 | ) |
| $ | 7,795 |
|
| $ | 21,573 |
|
Denominator for diluted net income (loss) per share: |
|
|
|
|
|
|
|
|
|
|
|
|
|
|
|
Weighted-average shares outstanding |
| 206,714,132 |
|
|
| 206,380,800 |
|
|
| 206,529,762 |
|
|
| 206,261,993 |
|
Weighted-average unvested restricted shares outstanding |
| (4,053,640 | ) |
|
| (4,039,591 | ) |
|
| (3,956,447 | ) |
|
| (4,014,718 | ) |
Effect of dilutive potential shares |
| 10,065,629 |
|
|
| — |
|
|
| 10,065,629 |
|
|
| 35,327,739 |
|
Denominator for diluted net income (loss) per share |
| 212,726,121 |
|
|
| 202,341,209 |
|
|
| 212,638,944 |
|
|
| 237,575,014 |
|
Diluted net income (loss) per share attributable to common stockholders | $ | 0.06 |
|
| $ | (0.10 | ) |
| $ | 0.04 |
|
| $ | 0.09 |
|
The following table summarizes shares subject to exercise or vesting conditions as more fully described in Note 9: Capital Stock and Derivative Instruments. These shares could potentially be dilutive in future periods if we realize net income attributable to common and participating stockholders and the contingent or unvested stock is converted to WMIH common stock. The cash payment of $84.4 million, which would be received upon exercise of the warrants, has not been considered as an offset to the dilutive shares under warrants outstanding below.
|
| Potential dilution to common stock |
| |||||
|
| Minimum shares |
|
| Maximum shares |
| ||
Restricted shares subject to vesting |
|
| 4,053,640 |
|
|
| 4,053,640 |
|
Series A Preferred Stock |
|
| 10,065,629 |
|
|
| 10,065,629 |
|
Warrants outstanding |
|
| 61,400,000 |
|
|
| 61,400,000 |
|
Dilutive shares to be issued if Series B Preferred Stock conversion is below $2.25 |
|
| — |
|
|
| 1,015,872 |
|
Series B Preferred Stock |
|
| 266,666,667 |
|
|
| 342,857,143 |
|
Potential dilutive shares if converted to common stock |
|
| 342,185,936 |
|
|
| 419,392,284 |
|
Note 13: Fair Value Measurement
We use a fair-value approach to value certain assets and liabilities. Fair value is the price that would be received to sell an asset or paid to transfer a liability in an orderly transaction between market participants at the measurement date. As such, fair value is a market-based measurement that should be determined based on assumptions that market participants would use in pricing an asset or liability. We use a fair value hierarchy, which distinguishes between assumptions based on market data (observable inputs) and an entity’s own assumptions (unobservable inputs). The hierarchy consists of three levels:
|
|
|
|
|
|
Determining which category an asset or liability falls within the fair value accounting guidance hierarchy requires significant judgment. We evaluate our hierarchy disclosures each quarter. Assets and liabilities measured at fair value on a recurring basis are summarized as follows:
The financial instrument that is measured at fair value on a recurring basis is summarized as follows as of September 30, 2017:
|
| (in thousands) |
| |||||||||||||
Assets |
| Level 1 |
|
| Level 2 |
|
| Level 3 |
|
| September 30, 2017 |
| ||||
Derivative embedded conversion feature |
| $ | — |
|
| $ | — |
|
| $ | 111,877 |
|
| $ | 111,877 |
|
The financial instrument that is measured at fair value on a recurring basis is summarized as follows as of December 31, 2016:
|
| (in thousands) |
| |||||||||||||
Assets |
| Level 1 |
|
| Level 2 |
|
| Level 3 |
|
| December 31, 2016 |
| ||||
Derivative embedded conversion feature |
| $ | — |
|
| $ | — |
|
| $ | 80,651 |
|
| $ | 80,651 |
|
The following table shows the change in Level 3 assets and liabilities measured at fair value on a recurring basis for the year ended December 31, 2016 and the nine months ended September 30, 2017:
|
| Derivative asset (liability) embedded conversion feature (in thousands) |
| |
Balance, January 1, 2016 |
| $ | (120,848 | ) |
Unrealized gain on change in fair value |
|
| 201,499 |
|
Balance, December 31, 2016 |
|
| 80,651 |
|
Unrealized gain on change in fair value |
|
| 31,226 |
|
Balance, September 30, 2017 |
| $ | 111,877 |
|
On January 5, 2015, WMIH raised $600.0 million of capital (less transaction costs) through the issuance of 600,000 shares of Series B Preferred Stock. The shares carry a liquidation preference of $1,000 per share, equal to the purchase price, and a mandatory redemption right three years from issuance date at a price equal to the purchase price, plus accrued dividends at 3% per annum.
The proceeds from the issuance of the Series B Preferred Stock are to be used to pursue strategic acquisitions. If one or more acquisitions are made on or prior to January 5, 2018 (or such later time as may be permitted pursuant to the terms governing the Series B Preferred Stock), then some or all of such Series B Preferred Stock shall be mandatorily converted into common stock of WMIH at a conversion price that is the lesser of:
|
|
|
|
The mandatory conversion feature of the Series B Preferred Stock is subject to fair value accounting and, in connection therewith, since the time of issuance, the Company has used a binomial lattice option model to determine fair value of the Series B Preferred Stock. The fair value of the Series B Preferred Stock embedded conversion feature is revalued each balance sheet date utilizing the binomial lattice option model. The fair value computations are reported in the condensed consolidated statement of operations as unrealized gain or (loss) on change in fair value of derivative embedded conversion feature, respectively.
Such binomial lattice option model utilizes several inputs to determine such fair value. Such inputs include WMIH’s common stock price as of each reporting date, as well as variable assumptions including, but not limited to, volatility of our stock price, the risk free interest rate, the probability that the Company consummates a Qualified Acquisition and the time of completing any such Qualified Acquisition.
As of September 30, 2017 the following variable assumptions were included in the binomial option model: expected stock price volatility over the term of the convertible preferred securities was estimated at 60%, as compared to 40% as of December 31, 2016; the risk-free interest rate was estimated at 1.1% as compared to 0.6% as of December 31, 2016; the probability of the Company consummating a Qualified Acquisition was estimated at 50% as compared with 90% as of December 31, 2016; and the anticipated timing of the Company consummating a Qualified Acquisition was estimated at 6 months from both September 30, 2017 and December 31, 2016.
The foregoing assumptions were adopted by the Company’s management in order to determine the market value of the embedded conversion feature applicable to the Series B Preferred Stock. Such assumptions necessarily involved and continue to involve the exercise of management’s judgement, as well as the judgement of the third party the Company uses in connection with the embedded derivative valuation process and for no other purpose. Such assumptions are monitored and adjusted from time to time. As assumptions and circumstances change, results may differ and past assumptions and valuations are not indicative of future assumptions or results.
Our reported net income attributable to common and participating stockholders (“Year to Date Net Income” or “Year to Date Net Loss”) was approximately $21.4 million for the nine months ended September 30, 2017. The change to our net income attributable to common and participating stockholders resulting from the calculation of the fair value of the embedded conversion feature is analyzed at the end of each reporting period to assess the impact of a 10% change to the various inputs and the result of each change to Year to Date Net Income is highlighted in the following scenarios. If the closing stock price of our common stock had been 10% lower, our Year to Date Net Income would have been approximately $17.7 million higher ($39.1 million). If the closing stock price of our common stock had been 10% higher, our Year to Date Net Income would have been approximately $17.6 million less ($3.8 million). If our volatility assumption on September 30, 2017 had been 10% lower, our Year to Date Net Income would have been approximately $3.0 million higher ($24.4 million). If our volatility assumption had been 10% higher, our Year to Date Net Income would have been approximately $3.3 million less ($18.1 million). If our probability of a transaction occurring assumption on September 30, 2017 had been 10% lower, our Year to Date Net Income would have been approximately $22.4 million less resulting in Year to Date Net Loss of $1.0 million. If our probability of a transaction occurring assumption had been 10% higher, our Year to Date Net Income would have been approximately $22.4 million higher ($43.8 million).
Note 14: Subsequent Events
On October 23, 2017, the reinsurance agreement with Radian was commuted and the related trust assets were released to WMMRC. On September 13, 2017, the Insurance Division of the State of Hawaii approved this commutation.
On September 13, 2017, the Insurance Division of the State of Hawaii approved a transfer of up to $10.7 million from funds which were held in trust at WMMRC as of September 30, 2017. As of the date of the filing of this Form 10-Q, these funds have not been transferred to WMIH; however, they are no longer held in trust and are available for general corporate purposes.
On October 2, 2017, the Second Lien Indenture was satisfied and discharged. As a result of the satisfaction and discharge of the Second Lien Indenture the Collateral Account was subsequently closed and remaining funds transferred to cash and cash equivalents to be used for general corporate purposes. For more information see Note 7: Notes Payable.
|
|
The following
References as used herein, unless the context requires otherwise, to (i) the “Company,” “we,” “us,” or “our” refer to WMIH Corp. (formerly WMI Holdings Corp.) and its subsidiaries on a consolidated basis; (ii) “WMIH” refers only to WMIH Corp., without regard to its subsidiaries; (iii) “WMIHC” refers only to WMI Holdings Corp., without regard to its subsidiaries; (iv) “WMMRC” refers to WM Mortgage Reinsurance Company, Inc. (a wholly-owned subsidiary of WMIH); and (v) “WMIIC” refers to WMI Investment Corp. (a wholly-owned subsidiary of WMIH).
FORWARD-LOOKING STATEMENTS AND INFORMATION
This quarterly report includes forward-looking statements, within the meaning of the Private Securities Litigation Reform Act of 1995, Section 27A of the Securities Act of 1933, as amended (the “Securities Act”), and Section 21E of the Securities Exchange Act of 1934, as amended (the “Exchange Act”). All statements other than statements of historical fact included in this report that address activities, events, conditions or developments that we expect, believe or anticipate will or may occur in the future are forward-looking statements. Forward-looking statements give our current expectations and projections relating to our financial condition, results of operations, plans, objectives, future performance and business and these statements are not guarantees of future performance. These statements can be identified by the fact that they do not relate strictly to historical or current facts. Forward-looking statements may include the words “anticipate,” “estimate,” “expect,” “project,” “intend,” “plan,” “believe,” “strategy,” “future,” “opportunity,” “may,” “should,” “will,” “would,” “will be,” “will continue,” “will likely result” and similar expressions. Such forward-looking statements involve risks and uncertainties that may cause actual events, results or performance to differ materially from those indicated by such statements. These risks are identified and discussed in the Company’s Annual Report on Form 10-K for the year ended December 31, 2016 under Risk Factors2019. The following discussion contains, in Part I, Item 1A. These risk factors will be importantaddition to consider in determining future results and should be reviewed in their entirety. Thesethe historical information, forward-looking statements that include risks, assumptions and uncertainties that could cause actual results to differ materially from those anticipated by such statements.
| Overview |
OVERVIEW
Our Business Strategy and Operating Environment
WMIH Corp. (“WMIH”) is a corporation duly organized and existing under the laws of the State of Delaware. On May 11, 2015, WMIH merged with its parent corporation, WMI Holdings Corp., a Washington corporation (“WMIHC”), with WMIH as the surviving corporationsignificant investment in the merger (the “Merger”). The Merger occurred as part of the reincorporation of WMIHC from the State of Washington to the State of Delaware effective May 11, 2015 (the “Reincorporation Date”).
WMIH, formerly known as WMIHC and Washington Mutual, Inc. (“WMI”), is the direct parent of WM Mortgage Reinsurance Company, Inc. (“WMMRC”) and WMI Investment Corp. (“WMIIC”), which has no assets or liabilities. Since emergence from bankruptcy on March 19, 2012 (the “Effective Date”), we have had limited operations other than WMMRC’s legacy reinsurance business, which is being operated in runoff mode. We continue to operate WMMRC’s business in runoff mode and our primary strategic objective is to consummate one or more acquisitions of an operating business, either through a merger, purchase, business combination or other form of acquisition, and grow our business.
We continue to seek, identify and evaluate acquisition opportunities of varying sizes across an array of industries for the purpose of facilitating an acquisition by WMIH of one or more operating businesses. Our management team meets regularly with our Board of Directors (the “Board” or “Board of Directors”), the Finance Committee of the Board (the “Finance Committee”) and the Corporate Strategy and Development Committee of the Board (the “CS&D Committee”), as the case may be, to discuss and evaluate potential acquisition targets. During the nine months ended September 30, 2017 and the year ended December 31, 2016, the Finance Committee, the CS&D Committee and the Board of Directors met formally and informally numerous times to assess various opportunities. We have focused primarily on acquisition targets in the financial services industry, including targets with consumer finance, commercial finance, specialty finance, leasing and insurance operations. We also may review potential targets in other industries, such as information technology, industrials, business services, healthcare and other sectors.
29
On January 5, 2015, we announced that WMIH had completed an offering (the “Series B Preferred Stock Financing”) of 600,000 shares of its 3% Series B Convertible Preferred Stock, par value $0.00001, liquidation preference $1,000 per share (the “Series B Preferred Stock”) in the amount of aggregate gross proceeds equal to $600 million. Net proceeds of $598.5 million were deposited into an escrow account and have been, and will be, released from escrow to us from time to time in amounts needed to finance our efforts to explore and fund, in whole or in part, certain acquisitions, whether completed or not, including reasonable attorney fees and expenses, accounting expenses, due diligence and financial advisor fees and expenses. For furthertechnology. More information on the Series B Preferred Stock FinancingCompany is available at , see Note 9: Capital Stockinvestors.mrcoopergroup.com. Information contained on our websites is not, and Derivative Instruments,should not be deemed to the condensed consolidated financial statements in Item 1 of Part Ibe, a part of this Quarterly Reportreport.
WMIHtangible equity of 12% or higher. Key strategic priorities include the following:
Assuming all 600,000 shares are outstanding on the Series B Redemption Date, the aggregate redemption cost will be $600.0 million, plus accruedpipeline. We slowed correspondent production, and unpaid dividends, if any, whether or not declared. If, priorclosed our wholesale lending channel, which had only been marginally profitable and reallocated those resources to the Series B Redemption Date, we publicly announce that we have entered into a definitive agreement for an Acquisition,direct-to-consumer channel. As the Series B Redemption Date willforeclosure process is currently on hold, with moratoriums in place at the national level and in some local markets, Xome’s revenues, particularly revenues of Exchange division, are expected to be extended to the earlier to occur of (i) July 5, 2018, and (ii) the day immediately following (x) the date such definitive agreement is terminated or (y) the date such Acquisition is closed. The consummation of an Acquisition would result in the mandatory conversion of some or all of the Series B Preferred Stock into common stock in accordance with provisions set forth in Article VI of the Certificate of Incorporation.
While we remain focused on identifying an Acquisition and executing definitive documentation relating to or consummating an Acquisition on or prior to the Series B Redemption Date we can provide no assurance that we will be able to do so and, if so, on what terms.negatively impacted. In the eventshort term, however once the moratoriums are lifted, we are requiredexpect Xome to redeem the Series B Preferred Stock, our available cash, absent a new financing, will be substantially depleted and our abilityreturn to (i) utilize our net operating loss (“NOL”) carry-forward, (ii) access significant alternative uses of capital and (iii) to continue business operations would likely be significantly and adversely impaired.
As previously disclosed, the Finance Committee is authorized, among other things, (i) to review the long-term financial structure, objectives and policies of the Company, and to make recommendations to the Board regarding such structure, objectives and policies, if appropriate, (ii) to evaluate the financing requirements of the Company and management’s proposed financing and refinancing plans and to recommend to the Board those actions, authorizations, filings and applications necessary and appropriate to enable management to execute such plans and (iii) to consider and make recommendations to the Board regarding the terms, timing, amount and other material factors (e.g., potential dilution of existing shareholders and the impact of any financing or restructuring on the Company’s tax attributes under Section 382 of the Code),profitability. See liquidity discussion related to the possible restructuring or amendment of the Company’s outstanding equity securities, issuance of new equity securitiesCOVID-19 pandemic in one or more private or public transactions, redemption of outstanding securities, or other transactions related to the Company’s outstanding securities, capital structure or fundraising to meet the Company’s future liquidity
In connection with the foregoing, and as has previously been disclosed, the Finance Committee has retained financial advisors to help the Company assess its overall capital structure and liquidity requirements and to develop potential financing alternatives. As part of these efforts, as of the date of this report, the Finance Committee and its advisers are engaged in discussions relating to, among other things, a possible restructuring or amendment of the Series B Preferred Stock. We can provide no assurance we will be able to restructure, amend or refinance the Series B Preferred Stock and, if so, on what terms.
With respect to our current operations, the Company currently operates a single business through its subsidiary, WMMRC, whose sole activity is the reinsurance of mortgage insurance policies. WMMRC has been operated in runoff mode since September 26, 2008. Since that date, WMMRC has not underwritten any new policies (and by extension any new risk). WMMRC, through predecessor companies, began reinsuring risks in 1997 and continued reinsuring risks through September 25, 2008.
30
MD&A.
WMMRC previously commuted three reinsurance agreements, one each, in 2009, 2012 and 2014, respectively, and the related trust assets were distributed in accordance with the commutation agreements. On October 23, 2017, the reinsurance agreement with Radian was commuted and the related trust assets were released to WMMRC. On September 13, 2017, the Insurance Division of the State of Hawaii approved this commutation and a distribution of up to $10.7 million to WMIH. As of the date of the filing of this Form 10-Q, this distribution has not yet been completed. For more information see Note 14: Subsequent Events to the condensed consolidated financial statements in Item 1 of Part I of this Quarterly Report on Form 10-Q. We also may seek opportunities to extract excess capital through commutation of one or more of WMMRC’s remaining reinsurance agreements or otherwise, with a view toward accelerating the distribution of trust assets in excess of the amounts needed to pay claims.
Beginning in 2006, the U.S. housing market and related credit markets experienced a multi-year downturn. During that period, housing prices declined materially, credit guidelines tightened, delays in mortgage servicing and foreclosure activities occurred, and deterioration in the credit performance of mortgage loans occurred. In addition, the macro-economic environment during that period demonstrated limited economic growth, stubbornly high unemployment, and limited median wage gains. Beginning in 2012, home prices began to rise again. The current outlook for the housing market is optimistic with low interest rates, steady employment growth, increased household formation rates and less restrictive credit conditions. Nevertheless, WMMRC’s operating environment remains somewhat uncertain as much of its results over the next two years will be directly affected by the inventory of pending defaulted mortgages at its ceding companies arising primarily from mortgages originated in calendar years 2007 and 2008. However, its financial exposure to that environment has been materially reduced as the remaining net aggregate risk exposure has decreased due to the runoff nature of its operations.
Our Financial Information
The financial information in this Quarterly Report on Form 10-Q has been derived from our condensed consolidated financial statements.
Critical Accounting Policies
Our condensed consolidated financial statements are prepared in accordance with generally accepted accounting principles in the United States (“GAAP”), which requires management to make estimates and assumptions that affect reported and disclosed amounts of assets and liabilities and the reported amounts of revenues and expenses during the reporting period. We believe that the critical accounting policies set forth in the accompanying condensed consolidated financial statements describe the more significant judgments and estimates used in the preparation of our condensed consolidated financial statements. These accounting policies pertain to premium revenues and risk transfer, valuation of investments, loss and loss adjustment expense reserves, our values under fresh start accounting, the resulting loss contract reserve and the valuation of the derivative instrument relating to the embedded conversion feature of the Series B Preferred Stock. If actual events differ significantly from the underlying judgments or estimates used by management in the application of these accounting policies, there could be a material effect on our results of operations and financial condition.
Recently issued accounting standards and their impact on the Company have been presented under “New Accounting Pronouncements” in Note 2: Significant Accounting Policies to the condensed consolidated financial statements in Item 1 of Part I of this Quarterly Report on Form 10-Q.
Segments
The Company manages its business on the basis of one operating segment, mortgage reinsurance, in accordance with GAAP. Within the mortgage reinsurance segment, our current risks arise solely from the reinsurance of mortgage insurance policies that were placed on certain residential mortgage loans prior to the bankruptcy of WMI. The majority of these policies were required by mortgage lenders as a stipulation to approve the mortgage loans. The mortgage insurance policies protect the beneficiaries of the policy from all or a portion of default-related losses.
Overview of Revenues and Expenses
Because WMIH has no current significant operations of its own, its cash flow is derived almost entirely from earnings on its investment portfolio, and payments it receives from, and dividends paid by, WMMRC. All dividends received by WMIH from
31
WMMRC that constituted Runoff Proceeds, historically, were required to be distributed to holders of WMIH’s Second Lien Notes in accordance with the terms of the Second Lien Indenture as described below in this Item 2 under “Notes Payable.” As of September 29, 2017, the Second Lien Notes were fully redeemed by the Company and the Second Lien Indenture was satisfied and discharged, therefore future distributions from WMMRC to WMIH will be available for general corporate purposes.
WMMRC’s revenues consist primarily of the following:
net premiums earned on reinsurance contracts;
positive changes to (and corresponding releases from) loss reserves; and
net investment income and net gains (losses) on WMMRC’s investment portfolio.
WMMRC’s expenses consist primarily of the following:
underwriting expenses; and
general and administrative expenses.
32
Results of Operations for the three and nine months ended September 30, 2017 and September 30, 2016
For the three and nine months ended September 30, 2017, we reported
| Table 1. Consolidated Operations |
| Three Months Ended March 31, 2020 | Three Months Ended March 31, 2019 | $ Change | % Change | |||||||||||
| Revenues - operational | $ | 661 | $ | 543 | $ | 118 | 22 | % | ||||||
| Revenues - Mark-to-market | (383 | ) | (293 | ) | (90 | ) | 31 | % | ||||||
| Total revenues | 278 | 250 | 28 | 11 | % | |||||||||
| Total expenses | 444 | 443 | 1 | — | % | |||||||||
| Total other income (expenses), net | (73 | ) | (40 | ) | (33 | ) | 83 | % | ||||||
| Loss before income tax expense benefit | (239 | ) | (233 | ) | (6 | ) | 3 | % | ||||||
| Less: Income tax benefit | (68 | ) | (47 | ) | (21 | ) | 45 | % | ||||||
| Net loss | (171 | ) | (186 | ) | 15 | (8 | )% | |||||||
| Less: Net loss attributable to non-controlling interests | (3 | ) | — | (3 | ) | (100 | )% | |||||||
| Net loss attributable to Mr. Cooper | $ | (168 | ) | $ | (186 | ) | $ | 18 | (10 | )% | ||||
For the three months ended September 30, 2017, we reported net income attributable to common and participating stockholders of $33.9 million compared to a net loss attributable to common and participating stockholders of $21.1 millionnegative mark-to-market (“MTM”) adjustments for the three months ended September 30, 2016. This $55.0 million reductionMarch 31, 2020 compared to the same period in net loss attributable to common and participating stockholders, when comparing2019. Total expenses for the three months ended September 30, 2017 toMarch 31, 2020 were consistent with the same period in 2019.
| Table 2. Provision for Income Taxes | ||||
| Three Months Ended March 31, 2020 | Three Months Ended March 31, 2019 | $ Change | % Change | |||||||||||
| Income tax benefit | $ | (68 | ) | $ | (47 | ) | $ | (21 | ) | 45 | % | |||
Effective tax rate(1) | 28.4 | % | 20.3 | % | ||||||||||
(1) | Effective tax rate is calculated using whole numbers. |
| Segment Results | ||||
| Table 3. Segment Results |
| Three Months Ended March 31, 2020 | |||||||||||||||||||||||||||
| Servicing | Originations | Xome | Elimination | Total Operating Segments | Corporate/Other | Consolidated | |||||||||||||||||||||
| Revenues | |||||||||||||||||||||||||||
| Service related, net | $ | (180 | ) | $ | 20 | $ | 106 | $ | (1 | ) | $ | (55 | ) | $ | 2 | $ | (53 | ) | |||||||||
| Net gain on mortgage loans held for sale | 34 | 297 | — | — | 331 | — | 331 | ||||||||||||||||||||
| Total revenues | (146 | ) | 317 | 106 | (1 | ) | 276 | 2 | 278 | ||||||||||||||||||
| Total expenses | 149 | 166 | 96 | (1 | ) | 410 | 34 | 444 | |||||||||||||||||||
| Other income (expenses), net: | |||||||||||||||||||||||||||
| Interest income | 83 | 34 | — | — | 117 | 1 | 118 | ||||||||||||||||||||
| Interest expense | (113 | ) | (27 | ) | — | — | (140 | ) | (52 | ) | (192 | ) | |||||||||||||||
| Other income (expenses), net | — | — | 1 | — | 1 | — | 1 | ||||||||||||||||||||
| Total other income (expenses), net | (30 | ) | 7 | 1 | — | (22 | ) | (51 | ) | (73 | ) | ||||||||||||||||
| (Loss) income before income tax (benefit) expense | $ | (325 | ) | $ | 158 | $ | 11 | $ | — | $ | (156 | ) | $ | (83 | ) | $ | (239 | ) | |||||||||
| Three Months Ended March 31, 2019 | |||||||||||||||||||||||||||
| Servicing | Originations | Xome | Elimination | Total Operating Segments | Corporate/Other | Consolidated | |||||||||||||||||||||
| Revenues | |||||||||||||||||||||||||||
| Service related, net | $ | (27 | ) | $ | 15 | $ | 96 | $ | — | $ | 84 | $ | — | $ | 84 | ||||||||||||
| Net gain on mortgage loans held for sale | 35 | 131 | — | — | 166 | — | 166 | ||||||||||||||||||||
| Total revenues | 8 | 146 | 96 | — | 250 | — | 250 | ||||||||||||||||||||
| Total expenses | 195 | 104 | 99 | — | 398 | 45 | 443 | ||||||||||||||||||||
| Other income (expenses), net: | |||||||||||||||||||||||||||
| Interest income | 115 | 17 | — | — | 132 | 2 | 134 | ||||||||||||||||||||
| Interest expense | (114 | ) | (18 | ) | — | — | (132 | ) | (57 | ) | (189 | ) | |||||||||||||||
| Other income, net | — | 4 | 11 | — | 15 | — | 15 | ||||||||||||||||||||
| Total other income (expenses), net | 1 | 3 | 11 | — | 15 | (55 | ) | (40 | ) | ||||||||||||||||||
| (Loss) income before income tax (benefit) expense | $ | (186 | ) | $ | 45 | $ | 8 | $ | — | $ | (133 | ) | $ | (100 | ) | $ | (233 | ) | |||||||||
| Servicing Segment | ||||
| Table 4. Servicer Ratings | ||||
Fitch(1) | Moody’s(2) | S&P(3) | |||
| Rating date | January 2020 | May 2019 | May 2019 | ||
| Residential | RPS2- | Not Rated | Above Average | ||
| Master Servicer | RMS2+ | SQ2 | Above Average | ||
| Special Servicer | RSS2- | Not Rated | Above Average | ||
| Subprime Servicer | RPS2- | Not Rated | Above Average | ||
(1) | Fitch Rating Scale of 1 (Highest Performance) to 5 (Low/No Proficiency) |
(2) | Moody’s Rating Scale of SQ1 (Strong Ability/Stability) to SQ5 (Weak Ability/Stability) |
(3) | S&P’s Rating Scale of Strong to Weak |
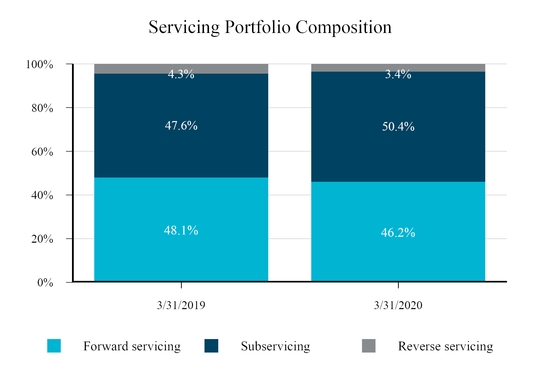
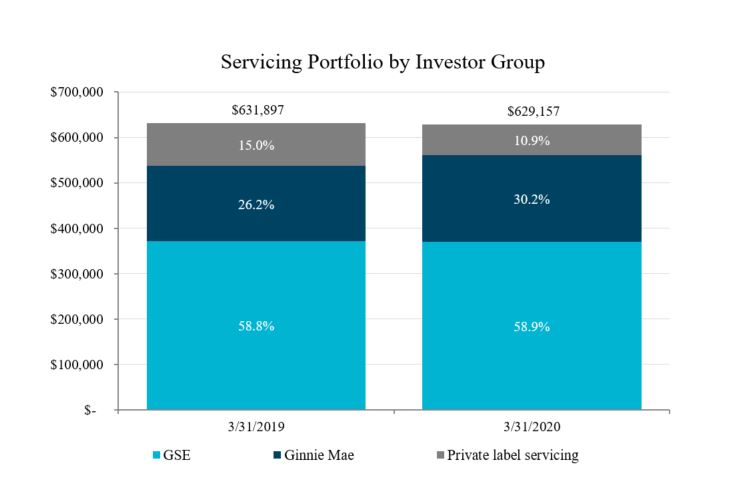
| Table 5. Servicing Segment Results of Operations | ||||
| Three Months Ended March 31, 2020 | Three Months Ended March 31, 2019 | $ Change | % Change | |||||||||||
| Revenues | ||||||||||||||
| Operational | $ | 313 | $ | 324 | $ | (11 | ) | (3 | )% | |||||
| Amortization, net of accretion | (76 | ) | (23 | ) | (53 | ) | 230 | % | ||||||
| Mark-to-market | (383 | ) | (293 | ) | (90 | ) | 31 | % | ||||||
| Total revenues | (146 | ) | 8 | (154 | ) | (1,925 | )% | |||||||
| Total expenses | 149 | 195 | (46 | ) | (24 | )% | ||||||||
| Total other income (expenses), net | (30 | ) | 1 | (31 | ) | (3,100 | )% | |||||||
| Loss before income tax benefit | $ | (325 | ) | $ | (186 | ) | $ | (139 | ) | 75 | % | |||
| Table 6. Servicing Portfolio - Unpaid Principal Balances | ||||
| Three Months Ended March 31, 2020 | Three Months Ended March 31, 2019 | ||||||
| Average UPB | |||||||
| Forward MSRs | $ | 303,578 | $ | 308,984 | |||
Subservicing and other(1) | 310,160 | 239,468 | |||||
| Reverse loans | 22,059 | 27,472 | |||||
| Total average UPB | $ | 635,797 | $ | 575,924 | |||
| March 31, 2020 | March 31, 2019 | ||||||
| Ending UPB | |||||||
| Forward MSRs | |||||||
| Agency | $ | 238,956 | $ | 238,937 | |||
| Non-agency | 51,678 | 64,755 | |||||
| Total forward MSRs | 290,634 | 303,692 | |||||
Subservicing and other(1) | |||||||
| Agency | 302,060 | 273,786 | |||||
| Non-agency | 14,873 | 27,405 | |||||
| Total subservicing and other | 316,933 | 301,191 | |||||
| Reverse loans | |||||||
| MSR | 2,332 | 3,559 | |||||
| MSL | 13,360 | 15,928 | |||||
| Securitized loans | 5,898 | 7,527 | |||||
| Total reverse portfolio serviced | 21,590 | 27,014 | |||||
| Total ending UPB | $ | 629,157 | $ | 631,897 | |||
(1) | Subservicing and other includes (i) loans we service for others, (ii) residential mortgage loans originated but have yet to be sold, and (iii) agency REO balances for which we own the mortgage servicing rights. |
| Table 7. Forward Servicing and Subservicing and Other Portfolio UPB Rollforward | ||||
| Three Months Ended March 31, 2020 | Three Months Ended March 31, 2019 | ||||||||||||||||||||||
| Forward MSR | Subservicing and Other | Total | Forward MSR | Subservicing and Other | Total | ||||||||||||||||||
| Balance - beginning of period | $ | 296,782 | $ | 323,983 | $ | 620,765 | $ | 295,481 | $ | 223,886 | $ | 519,367 | |||||||||||
| Additions: | |||||||||||||||||||||||
| Originations | 11,635 | 662 | 12,297 | 4,891 | 404 | 5,295 | |||||||||||||||||
| Acquisitions / Increase in subservicing | (673 | ) | 23,352 | 22,679 | 13,404 | 84,406 | 97,810 | ||||||||||||||||
| Deductions: | |||||||||||||||||||||||
| Dispositions | (40 | ) | (10,359 | ) | (10,399 | ) | (133 | ) | (1,118 | ) | (1,251 | ) | |||||||||||
| Principal reductions and other | (2,748 | ) | (2,965 | ) | (5,713 | ) | (2,827 | ) | (2,317 | ) | (5,144 | ) | |||||||||||
Voluntary reductions(1) | (13,864 | ) | (17,672 | ) | (31,536 | ) | (6,297 | ) | (3,975 | ) | (10,272 | ) | |||||||||||
Involuntary reductions(2) | (387 | ) | (68 | ) | (455 | ) | (762 | ) | (95 | ) | (857 | ) | |||||||||||
| Net changes in loans serviced by others | (71 | ) | — | (71 | ) | (65 | ) | — | (65 | ) | |||||||||||||
| Balance - end of period | $ | 290,634 | $ | 316,933 | $ | 607,567 | $ | 303,692 | $ | 301,191 | $ | 604,883 | |||||||||||
(1) | Voluntary reductions are related to loan payoffs by customers. |
(2) | Involuntary reductions refer to loan chargeoffs. |
Table 8. Key Performance Metrics - Forward Servicing and Subservicing Portfolio(1) | ||||
| March 31, 2020 | March 31, 2019 | ||||||
| Loan count | 3,506,998 | 3,616,323 | |||||
Average loan amount(2) | $ | 173,231 | $ | 167,266 | |||
Average coupon - credit sensitive(3) | 4.7 | % | 4.9 | % | |||
Average coupon - interest sensitive(3) | 4.3 | % | 4.3 | % | |||
Average coupon - agency(3) | 4.4 | % | 4.4 | % | |||
Average coupon - non-agency(3) | 4.7 | % | 4.8 | % | |||
60+ delinquent (% of loans)(4) | 1.9 | % | 2.4 | % | |||
90+ delinquent (% of loans)(4) | 1.6 | % | 2.1 | % | |||
120+ delinquent (% of loans)(4) | 1.4 | % | 1.9 | % | |||
| Total prepayment speed (12-month constant prepayment rate) | 19.2 | % | 8.2 | % | |||
(1) | Characteristics and key performance metrics of our servicing portfolio exclude UPB and loan counts acquired but not yet boarded and currently serviced by others. |
(2) | Average loan amount is presented in whole dollar amounts. |
(3) | The weighted average coupon amounts presented in the table above are only reflective of our owned forward MSR portfolio that is reported at fair value. |
(4) | Loan delinquency is based on the current contractual due date of the loan. In the case of a completed loan modification, delinquency is based on the modified due date of the loan. |
| Table 9. Forward Loan Modifications and Workout Units | ||||
| Three Months Ended March 31, 2020 | Three Months Ended March 31, 2019 | Amount Change | % Change | ||||||||
| Modifications | 4,715 | 5,189 | (474 | ) | (9 | )% | |||||
| Workouts | 3,994 | 4,401 | (407 | ) | (9 | )% | |||||
| Total modifications and workout units | 8,709 | 9,590 | (881 | ) | (9 | )% | |||||
| Table 10. Servicing - Revenues | ||||
| Three Months Ended March 31, 2020 | Three Months Ended March 31, 2019 | $ Change | % Change | ||||||||||||||||||||
| Amt | bps(1) | Amt | bps(1) | Amt | bps(1) | Amt | bps(1) | ||||||||||||||||
| Forward MSR Operational Revenue | |||||||||||||||||||||||
| Base servicing fees | $ | 250 | 16 | $ | 240 | 17 | $ | 10 | (1) | 4 | % | (6 | )% | ||||||||||
Modification fees(2) | 3 | — | 3 | — | — | — | — | % | — | % | |||||||||||||
Incentive fees(2) | 4 | — | 1 | — | 3 | — | 300 | % | — | % | |||||||||||||
Late payment fees(2) | 23 | 2 | 19 | 2 | 4 | — | 21 | % | — | % | |||||||||||||
Other ancillary revenues(2) | 38 | 2 | 48 | 3 | (10 | ) | (1) | (21 | )% | (33 | )% | ||||||||||||
| Total forward MSR operational revenue | 318 | 20 | 311 | 22 | 7 | (2) | 2 | % | (9 | )% | |||||||||||||
Base subservicing fees and other subservicing revenue(3) | 65 | 4 | 52 | 4 | 13 | — | 25 | % | — | % | |||||||||||||
| Reverse servicing fees | 6 | — | 9 | — | (3 | ) | — | (33 | )% | — | % | ||||||||||||
| Total servicing fee revenue | 389 | 24 | 372 | 26 | 17 | (2) | 5 | % | (8 | )% | |||||||||||||
| MSR financing liability costs | (8 | ) | — | (12 | ) | (1) | 4 | 1 | (33 | )% | 100 | % | |||||||||||
| Excess spread costs - principal | (68 | ) | (4) | (36 | ) | (2) | (32 | ) | (2) | 89 | % | 100 | % | ||||||||||
| Total operational revenue | 313 | 20 | 324 | 23 | (11 | ) | (3) | (3 | )% | (13 | )% | ||||||||||||
| Amortization, net of accretion | |||||||||||||||||||||||
| Forward MSR amortization | (152 | ) | (10) | (79 | ) | (6) | (73 | ) | (4) | 92 | % | 67 | % | ||||||||||
| Excess spread accretion | 68 | 4 | 36 | 3 | 32 | 1 | 89 | % | 33 | % | |||||||||||||
| Reverse MSL accretion | 8 | 1 | 18 | 1 | (10 | ) | — | (56 | )% | — | % | ||||||||||||
| Reverse MSR amortization | — | — | 2 | — | (2 | ) | — | (100 | )% | — | % | ||||||||||||
| Total amortization, net of accretion | (76 | ) | (5) | (23 | ) | (2) | (53 | ) | (3) | 230 | % | 150 | % | ||||||||||
| Mark-to-Market Adjustments | |||||||||||||||||||||||
MSR MTM(3) | (412 | ) | (26) | (360 | ) | (25) | (52 | ) | (1) | 14 | % | 4 | % | ||||||||||
| Excess spread / financing MTM | 29 | 2 | 67 | 5 | (38 | ) | (3) | (57 | )% | (60 | )% | ||||||||||||
| Total MTM adjustments | (383 | ) | (24) | (293 | ) | (20) | (90 | ) | (4) | 31 | % | 20 | % | ||||||||||
| Total revenues - Servicing | $ | (146 | ) | (9) | $ | 8 | 1 | $ | (154 | ) | (10) | (1,925 | )% | (1,000 | )% | ||||||||
(1) | Calculated basis points (“bps”) are as follows: Annualized dollar amount/Total average UPB X 10000. |
(2) | Certain ancillary and other non-base fees related to subservicing operations are separately presented as other subservicing revenues. |
(3) | The amount of MSR MTM includes the impact of negative modeled cash flows which have been transferred to reserves on advances and other receivables. The negative modeled cash flows relate to advances and other receivables associated with inactive and liquidated loans that are no longer part of the MSR portfolio. The impact of negative modeled cash flows was $10 and $11 for the three months ended March 31, 2020 and 2019, respectively. |
| Table 11. Servicing - Expenses | ||||
| Three Months Ended March 31, 2020 | Three Months Ended March 31, 2019 | Change | % Change | ||||||||||||||||||||
| Amt | bps(1) | Amt | bps(1) | Amt | bps(1) | Amt | bps(1) | ||||||||||||||||
| Salaries, wages and benefits | $ | 86 | 5 | $ | 86 | 6 | $ | — | (1) | — | % | (17 | )% | ||||||||||
| General and administrative | |||||||||||||||||||||||
| Servicing support fees | 25 | 2 | 39 | 3 | (14 | ) | (1) | (36 | )% | (33 | )% | ||||||||||||
| Corporate and other general and administrative expenses | 35 | 2 | 39 | 3 | (4 | ) | (1) | (10 | )% | (33 | )% | ||||||||||||
| Foreclosure and other liquidation related expenses | — | — | 27 | 2 | (27 | ) | (2) | (100 | )% | (100 | )% | ||||||||||||
| Depreciation and amortization | 3 | — | 4 | — | (1 | ) | — | (25 | )% | — | % | ||||||||||||
| Total general and administrative expenses | 63 | 4 | 109 | 8 | (46 | ) | (4) | (42 | )% | (50 | )% | ||||||||||||
| Total expenses - Servicing | $ | 149 | 9 | $ | 195 | 14 | $ | (46 | ) | (5) | (24 | )% | (36 | )% | |||||||||
(1) | Calculated basis points (“bps”) are as follows: Annualized dollar amount/Total average UPB X 10000. |
| Table 12. Servicing - Other Income (Expenses), Net | ||||
| Three Months Ended March 31, 2020 | Three Months Ended March 31, 2019 | Change | % Change | ||||||||||||||||||||
| Amt | bps(1) | Amt | bps(1) | Amt | bps(1) | Amt | bps(1) | ||||||||||||||||
| Income earned on Reverse mortgage interest | $ | 43 | 3 | $ | 82 | 6 | $ | (39 | ) | (3) | (48 | )% | (50 | )% | |||||||||
| Other interest income | 40 | 2 | 33 | 2 | 7 | — | 21 | % | — | % | |||||||||||||
| Interest income | 83 | 5 | 115 | 8 | (32 | ) | (3) | (28 | )% | (38 | )% | ||||||||||||
| Reverse mortgage interest expense | (52 | ) | (3) | (71 | ) | (5) | 19 | 2 | (27 | )% | (40 | )% | |||||||||||
| Advance interest expense | (5 | ) | — | (9 | ) | (1) | 4 | 1 | (44 | )% | 100 | % | |||||||||||
| Other interest expense | (56 | ) | (4) | (34 | ) | (2) | (22 | ) | (2) | 65 | % | 100 | % | ||||||||||
| Interest expense | (113 | ) | (7) | (114 | ) | (8) | 1 | 1 | (1 | )% | (13 | )% | |||||||||||
| Total other income (expenses), net - Servicing | $ | (30 | ) | (2) | $ | 1 | — | $ | (31 | ) | (2) | (3,100 | )% | (100 | )% | ||||||||
| Weighted average cost - advance facilities | 3.0 | % | 4.7 | % | (1.7 | )% | (36 | )% | |||||||||||||||
| Weighted average cost - excess spread financing | 9.0 | % | 9.0 | % | — | % | — | % | |||||||||||||||
(1) | Calculated basis points (“bps”) are as follows: Annualized dollar amount/Total average UPB X 10000. |
| Table 13. Servicing Portfolios and Related Liabilities | ||||
| March 31, 2020 | December 31, 2019 | ||||||||||||||||||
| UPB | Carrying Amount | bps | UPB | Carrying Amount | bps | ||||||||||||||
| Forward MSRs - acquisition pool: | |||||||||||||||||||
| Credit sensitive | $ | 138,726 | $ | 1,386 | 100 | $ | 147,895 | $ | 1,613 | 109 | |||||||||
| Interest sensitive | 151,908 | 1,723 | 113 | 148,887 | 1,883 | 126 | |||||||||||||
| Total forward MSRs - fair value | $ | 290,634 | $ | 3,109 | 107 | $ | 296,782 | $ | 3,496 | 118 | |||||||||
| Forward MSRs - investor pool: | |||||||||||||||||||
| Agency | $ | 238,956 | $ | 2,618 | 110 | $ | 240,688 | $ | 2,944 | 122 | |||||||||
| Non-agency | 51,678 | 491 | 95 | 56,094 | 552 | 98 | |||||||||||||
| Total forward MSRs - fair value | $ | 290,634 | $ | 3,109 | 107 | $ | 296,782 | $ | 3,496 | 118 | |||||||||
| Total forward MSRs | $ | 290,634 | $ | 3,109 | $ | 296,782 | $ | 3,496 | |||||||||||
Subservicing and other(1) | |||||||||||||||||||
| Agency | 302,060 | N/A | 308,532 | N/A | |||||||||||||||
| Non-agency | 14,873 | N/A | 15,451 | N/A | |||||||||||||||
| Total subservicing and other | 316,933 | N/A | 323,983 | N/A | |||||||||||||||
| Reverse portfolio - amortized cost | |||||||||||||||||||
| MSR | 2,332 | 6 | 2,508 | 6 | |||||||||||||||
| MSL | 13,360 | (53 | ) | 13,994 | (61 | ) | |||||||||||||
| Securitized loans | 5,898 | 5,955 | 6,223 | 6,279 | |||||||||||||||
| Total reverse portfolio serviced | 21,590 | 5,908 | 22,725 | 6,224 | |||||||||||||||
| Total servicing portfolio unpaid principal balance | $ | 629,157 | $ | 9,017 | $ | 643,490 | $ | 9,720 | |||||||||||
(1) | Subservicing and other amounts include loans we service for others, residential mortgage loans originated but have yet to be sold and agency REO balances for which we own the mortgage servicing rights. |
| Table 14. MSRs - Fair Value, Rollforward | ||||
| Three Months Ended March 31, 2020 | Three Months Ended March 31, 2019 | ||||||
| Fair value - beginning of period | $ | 3,496 | $ | 3,665 | |||
| Additions: | |||||||
| Servicing retained from mortgage loans sold | 123 | 66 | |||||
| Purchases of servicing rights | 24 | 409 | |||||
| Dispositions: | |||||||
| Sales and cancellation of servicing assets | — | (260 | ) | ||||
| Changes in fair value: | |||||||
| Due to changes in valuation inputs or assumptions used in the valuation model: | |||||||
| Credit sensitive | (181 | ) | (121 | ) | |||
| Interest sensitive | (220 | ) | (211 | ) | |||
| Other changes in fair value: | |||||||
| Scheduled principal payments | (23 | ) | (22 | ) | |||
Disposition of negative MSRs and other(1) | 20 | 12 | |||||
| Prepayments | |||||||
| Voluntary prepayments | |||||||
| Credit sensitive | (24 | ) | (19 | ) | |||
| Interest sensitive | (102 | ) | (32 | ) | |||
| Involuntary prepayments | |||||||
| Credit sensitive | (1 | ) | (2 | ) | |||
| Interest sensitive | (3 | ) | (4 | ) | |||
| Fair value - end of period | $ | 3,109 | $ | 3,481 | |||
(1) | Amounts primarily represent negative fair values reclassified from the MSR asset to reserves as underlying loans are removed from the MSR and other reclassification adjustments. |
| Table 15. MSRs - Fair Value | ||||
| March 31, 2020 | March 31, 2019 | ||||
| Total MSRs Portfolio | |||||
| Discount rate | 9.7 | % | 10.3 | % | |
| Prepayment speeds | 13.4 | % | 13.0 | % | |
| Average life | 5.7 years | 6.0 years | |||
| Acquisition Pools: | |||||
| Credit Sensitive | |||||
| Discount rate | 10.2 | % | 11.3 | % | |
| Prepayment speeds | 13.0 | % | 13.5 | % | |
| Average life | 5.9 years | 6.0 years | |||
| Interest Sensitive | |||||
| Discount rate | 9.1 | % | 9.4 | % | |
| Prepayment speeds | 13.8 | % | 12.5 | % | |
| Average life | 5.5 years | 6.1 years | |||
| Investor Pools: | |||||
| Agency | |||||
| Discount rate | 9.0 | % | 9.4 | % | |
| Prepayment speeds | 13.2 | % | 12.4 | % | |
| Average life | 5.6 years | 6.1 years | |||
| Non-Agency | |||||
| Discount rate | 12.6 | % | 13.6 | % | |
| Prepayment speeds | 14.3 | % | 15.4 | % | |
| Average life | 6.1 years | 5.9 years | |||
| Table 16. Excess Spread Financing | ||||
| Three Months Ended March 31, 2020 | Three Months Ended March 31, 2019 | ||||||
| Fair value - beginning of period | $ | 1,311 | $ | 1,184 | |||
| Additions: | |||||||
| New financings | 24 | 245 | |||||
| Deductions: | |||||||
| Settlements and repayments | (58 | ) | (51 | ) | |||
| Changes in fair value: | |||||||
| Credit Sensitive | (2 | ) | (32 | ) | |||
| Interest Sensitive | (33 | ) | (37 | ) | |||
| Fair value - end of period | $ | 1,242 | $ | 1,309 | |||
| Key Weighted-Average Assumptions: | March 31, 2020 | March 31, 2019 | |||||
| Total Excess Spread Portfolio | |||||||
| Discount rate | 11.6 | % | 10.4 | % | |||
| Prepayment speeds | 12.8 | % | 12.9 | % | |||
| Recapture rate | 18.6 | % | 20.4 | % | |||
| Average life | 5.7 years | 5.9 years | |||||
| Credit Sensitive | |||||||
| Discount rate | 12.3 | % | 10.9 | % | |||
| Prepayment speeds | 12.3 | % | 13.2 | % | |||
| Recapture rate | 18.4 | % | 21.7 | % | |||
| Average life | 5.9 years | 5.9 years | |||||
| Interest Sensitive | |||||||
| Discount rate | 10.3 | % | 9.1 | % | |||
| Prepayment speeds | 13.5 | % | 12.4 | % | |||
| Recapture rate | 19.8 | % | 17.3 | % | |||
| Average life | 5.5 years | 6.1 years | |||||
| Table 17. MSRs Financing Liability - Rollforward | ||||
| Three Months Ended March 31, 2020 | Three Months Ended March 31, 2019 | ||||||
| Fair value - beginning of period | $ | 37 | $ | 32 | |||
| Changes in fair value: | |||||||
| Changes in valuation inputs or assumptions used in the valuation model | 9 | 6 | |||||
| Other changes in fair value | (3 | ) | (4 | ) | |||
| Fair value - end of period | $ | 43 | $ | 34 | |||
| March 31, 2020 | March 31, 2019 | ||||||
| Weighted-Average Assumptions | |||||||
| Advance financing rates | 1.7 | % | 3.9 | % | |||
| Annual advance recovery rates | 18.4 | % | 19.3 | % | |||
| Table 18. Leveraged Portfolio Characteristics | ||||
| March 31, 2020 | March 31, 2019 | ||||||
| Owned forward servicing portfolio - unencumbered | $ | 85,124 | $ | 88,995 | |||
| Owned forward servicing portfolio - encumbered | 205,510 | 214,697 | |||||
| Subserviced forward servicing portfolio and other | 316,933 | 301,191 | |||||
| Total unpaid principal balance | $ | 607,567 | $ | 604,883 | |||
| Table 19. Reverse - Mortgage Portfolio Characteristics | ||||
| March 31, 2020 | March 31, 2019 | ||||||
| Loan count | 158,838 | 184,807 | |||||
| Ending unpaid principal balance | $ | 21,590 | $ | 27,014 | |||
Average loan amount(1) | $ | 135,924 | $ | 146,173 | |||
| Average coupon | 3.3 | % | 4.4 | % | |||
| Average borrower age | 81 | 80 | |||||
(1) | Average loan amount is presented in whole dollar amounts. |
| Originations Segment | ||||
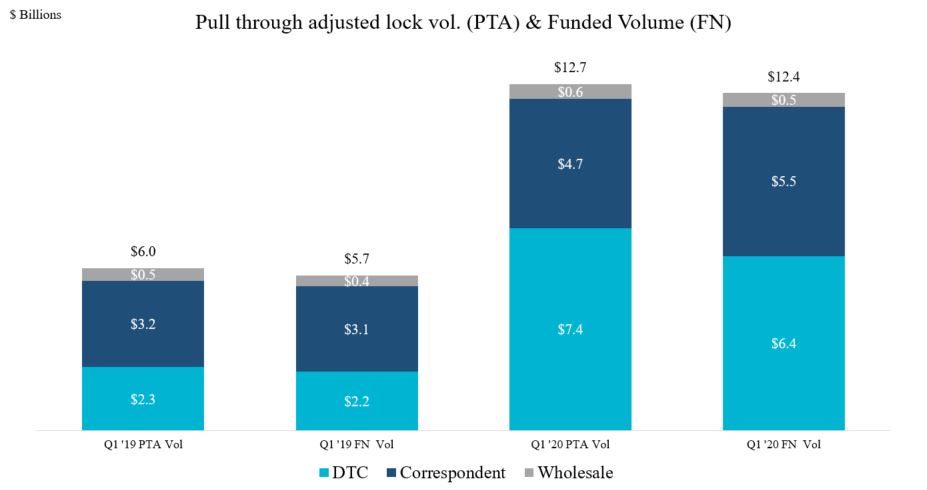
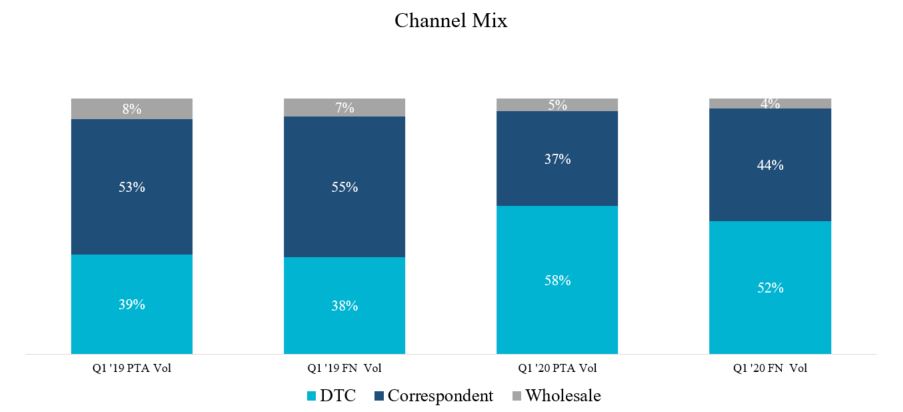
| Table 20. Originations Segment Results of Operations | ||||
| Three Months Ended March 31, 2020 | Three Months Ended March 31, 2019 | $ Change | % Change | |||||||||||
| Total revenues | $ | 317 | $ | 146 | $ | 171 | 117 | % | ||||||
| Total expenses | 166 | 104 | 62 | 60 | % | |||||||||
| Total other income (expenses), net | 7 | 3 | 4 | 133 | % | |||||||||
| Income before income tax expense | $ | 158 | $ | 45 | $ | 113 | 251 | % | ||||||
| Originations Margin | ||||||||||||||
| Revenue | $ | 317 | $ | 146 | $ | 171 | 117 | % | ||||||
| Pull through adjusted lock volume | $ | 12,677 | $ | 5,960 | $ | 6,717 | 113 | % | ||||||
Revenue as a percentage of pull through adjusted lock volume(1) | 2.50 | % | 2.45 | % | 0.05 | % | 2 | % | ||||||
| Expenses | $ | 166 | $ | 104 | $ | 62 | 60 | % | ||||||
| Funded volume | $ | 12,359 | $ | 5,716 | $ | 6,643 | 116 | % | ||||||
Expenses as a percentage of funded volume(2) | 1.34 | % | 1.82 | % | (0.48 | )% | (26 | )% | ||||||
| Originations Margin | 1.16 | % | 0.63 | % | 0.53 | % | 84 | % | ||||||
(1) | Calculated on pull-through adjusted lock volume as revenue is recognized at the time of loan lock. |
(2) | Calculated on funded volume as expenses are incurred based on closing of the loan. |
| Table 21. Originations - Revenues | ||||
| Three Months Ended March 31, 2020 | Three Months Ended March 31, 2019 | $ Change | % Change | |||||||||||
| Service related, net - Originations | $ | 20 | $ | 15 | $ | 5 | 33 | % | ||||||
| Net gain on mortgage loans held for sale | ||||||||||||||
| Net gain on loans originated and sold | 183 | 72 | 111 | 154 | % | |||||||||
| Capitalized servicing rights | 119 | 61 | 58 | 95 | % | |||||||||
| Provision for repurchase reserves, net of release | (5 | ) | (2 | ) | (3 | ) | 150 | % | ||||||
| Total net gain on mortgage loans held for sale | 297 | 131 | 166 | 127 | % | |||||||||
| Total revenues - Originations | $ | 317 | $ | 146 | $ | 171 | 117 | % | ||||||
| Key Metrics | ||||||||||||||
Consumer direct lock pull through adjusted volume(1) | $ | 7,423 | $ | 2,333 | $ | 5,090 | 218 | % | ||||||
Other locked pull through adjusted volume(1) | 5,254 | 3,627 | 1,627 | 45 | % | |||||||||
| Total pull through adjusted volume | $ | 12,677 | $ | 5,960 | $ | 6,717 | 113 | % | ||||||
| Funded volume | $ | 12,359 | $ | 5,716 | $ | 6,643 | 116 | % | ||||||
| Volume of loans sold | $ | 13,255 | $ | 6,235 | $ | 7,020 | 113 | % | ||||||
| Recapture percentage | 29.8 | % | 27.5 | % | 2.3 | % | 7 | % | ||||||
| Purchase as a percentage of funded volume | 26.0 | % | 51.7 | % | (25.7 | )% | (50 | )% | ||||||
| Value of capitalized servicing on retained settlements | 137 | bps | 141 | bps | (4) bps | (3 | )% | |||||||
(1) | Pull through adjusted volume represents the expected funding from locks taken during the period. |
| Table 22. Originations - Expenses | ||||
| Three Months Ended March 31, 2020 | Three Months Ended March 31, 2019 | $ Change | % Change | |||||||||||
| Salaries, wages and benefits | $ | 117 | $ | 69 | $ | 48 | 70 | % | ||||||
| General and administrative | ||||||||||||||
| Loan origination expenses | 16 | 10 | 6 | 60 | % | |||||||||
| Corporate and other general and administrative expenses | 18 | 14 | 4 | 29 | % | |||||||||
| Marketing and professional service fees | 12 | 8 | 4 | 50 | % | |||||||||
| Depreciation and amortization | 3 | 3 | — | — | % | |||||||||
| Total general and administrative | 49 | 35 | 14 | 40 | % | |||||||||
| Total expenses - Originations | $ | 166 | $ | 104 | $ | 62 | 60 | % | ||||||
| Table 23. Originations - Other Income (Expenses), Net | ||||
| Three Months Ended March 31, 2020 | Three Months Ended March 31, 2019 | $ Change | % Change | |||||||||||
| Interest income | $ | 34 | $ | 17 | $ | 17 | 100 | % | ||||||
| Interest expense | (27 | ) | (18 | ) | (9 | ) | 50 | % | ||||||
| Other income, net | — | 4 | (4 | ) | (100 | )% | ||||||||
| Total other income (expenses), net - Originations | $ | 7 | $ | 3 | $ | 4 | 133 | % | ||||||
| Weighted average note rate - mortgage loans held for sale | 3.8 | % | 4.9 | % | (1.1 | )% | (22 | )% | ||||||
| Weighted average cost of funds (excluding facility fees) | 3.2 | % | 4.7 | % | (1.5 | )% | (32 | )% | ||||||
| Xome Segment | ||||
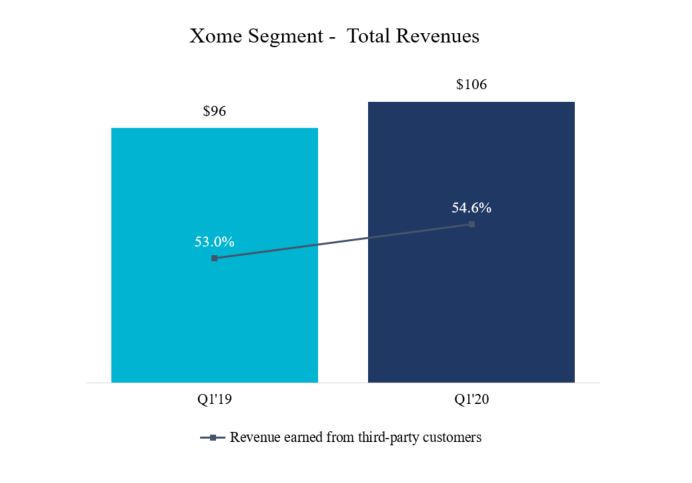
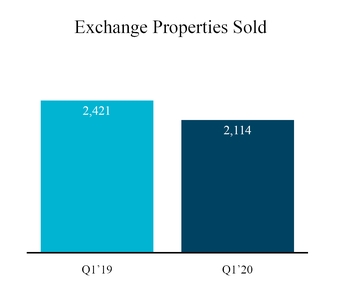
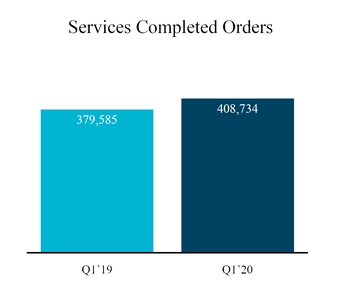
| Table 24. Xome Segment Results of Operations | ||||
| Three Months Ended March 31, 2020 | Three Months Ended March 31, 2019 | $ Change | % Change | |||||||||||
| Xome - Operations | ||||||||||||||
| Total revenues | $ | 106 | $ | 96 | $ | 10 | 10 | % | ||||||
| Total expenses | 96 | 99 | (3 | ) | (3 | )% | ||||||||
| Total other income (expenses), net | 1 | 11 | (10 | ) | (91 | )% | ||||||||
| Income before income tax expense | $ | 11 | $ | 8 | $ | 3 | 38 | % | ||||||
| Income before taxes margin - Xome | 10.4 | % | 8.3 | % | 2.1 | % | 25 | % | ||||||
| Xome - Revenues | ||||||||||||||
| Exchange | $ | 16 | $ | 20 | $ | (4 | ) | (20 | )% | |||||
| Services | 85 | 71 | 14 | 20 | % | |||||||||
| Data/Technology | 5 | 5 | — | — | % | |||||||||
| Total revenues - Xome | $ | 106 | $ | 96 | $ | 10 | 10 | % | ||||||
| Key Metrics | ||||||||||||||
| Exchange properties sold | 2,114 | 2,421 | (307 | ) | (13 | )% | ||||||||
| Average Exchange properties under management | 17,777 | 6,634 | 11,143 | 168 | % | |||||||||
| Services completed orders | 408,734 | 379,585 | 29,149 | 8 | % | |||||||||
| Percentage of revenue earned from third-party customers | 54.6 | % | 53.0 | % | 1.6 | % | 3 | % | ||||||
| Xome - Expenses | ||||||||||||||
| Salaries, wages and benefits | $ | 35 | $ | 38 | $ | (3 | ) | (8 | )% | |||||
| General and administrative | ||||||||||||||
| Operational expenses | 58 | 57 | 1 | 2 | % | |||||||||
| Depreciation and amortization | 3 | 4 | (1 | ) | (25 | )% | ||||||||
| Total general and administrative | 61 | 61 | — | — | % | |||||||||
| Total expenses - Xome | $ | 96 | $ | 99 | $ | (3 | ) | (3 | )% | |||||
| Corporate/Other Segment | ||||
| Table 25. Corporate/Other Segment Results of Operations | ||||
| Three Months Ended March 31, 2020 | Three Months Ended March 31, 2019 | $ Change | % Change | |||||||||||
| Corporate/Other - Operations | ||||||||||||||
| Total revenues | $ | 2 | $ | — | $ | 2 | 100 | % | ||||||
| Total expenses | 34 | 45 | (11 | ) | (24 | )% | ||||||||
| Total other income (expenses), net | (51 | ) | (55 | ) | 4 | (7 | )% | |||||||
| Loss before income tax benefit - Corporate/Other | $ | (83 | ) | $ | (100 | ) | $ | 17 | (17 | )% | ||||
| Corporate/Other - Expenses | ||||||||||||||
| Salaries, wages and benefits | $ | 8 | $ | 22 | $ | (14 | ) | (64 | )% | |||||
| General and administrative | ||||||||||||||
| Operational expenses | 8 | 13 | (5 | ) | (38 | )% | ||||||||
| Depreciation and amortization | 10 | 10 | — | — | % | |||||||||
| Loss on impairment of assets | 8 | — | 8 | 100 | % | |||||||||
| Total general and administrative | 26 | 23 | 3 | 13 | % | |||||||||
| Total expenses - Corporate/Other | $ | 34 | $ | 45 | $ | (11 | ) | (24 | )% | |||||
| Corporate/Other - Other Income (Expenses), Net | ||||||||||||||
| Total interest income | $ | 1 | $ | 2 | $ | (1 | ) | (50 | )% | |||||
| Interest expense on unsecured senior notes | (51 | ) | (51 | ) | — | — | % | |||||||
| Other interest expense | (1 | ) | (6 | ) | 5 | (83 | )% | |||||||
| Total interest expense | (52 | ) | (57 | ) | 5 | (9 | )% | |||||||
| Total other income (expenses), net - Corporate/Other | $ | (51 | ) | $ | (55 | ) | $ | 4 | (7 | )% | ||||
| Weighted average cost - unsecured senior notes | 7.8 | % | 7.9 | % | (0.1 | )% | (1 | )% | ||||||
| Changes in Financial Position | ||||
| Table 26. Changes in Assets | ||||
| March 31, 2020 | December 31, 2019 | $ Change | % Change | |||||||||||
| Cash and cash equivalents | $ | 579 | $ | 329 | $ | 250 | 76 | % | ||||||
| Mortgage servicing rights | 3,115 | 3,502 | (387 | ) | (11 | )% | ||||||||
| Advances and other receivables, net | 685 | 988 | (303 | ) | (31 | )% | ||||||||
| Reverse mortgage interests, net | 5,955 | 6,279 | (324 | ) | (5 | )% | ||||||||
| Mortgage loans held for sale at fair value | 3,922 | 4,077 | (155 | ) | (4 | )% | ||||||||
| Deferred tax assets, net | 1,411 | 1,345 | 66 | 5 | % | |||||||||
| Other | 1,946 | 1,785 | 161 | 9 | % | |||||||||
| Total assets | $ | 17,613 | $ | 18,305 | $ | (692 | ) | (4 | )% | |||||
| Table 27. Changes in Liabilities and Stockholders’ Equity | ||||
| March 31, 2020 | December 31, 2019 | $ Change | % Change | |||||||||||
| Unsecured senior notes, net | $ | 2,259 | $ | 2,366 | $ | (107 | ) | (5 | )% | |||||
| Advance facilities, net | 489 | 422 | 67 | 16 | % | |||||||||
| Warehouse facilities, net | 4,551 | 4,575 | (24 | ) | (1 | )% | ||||||||
| MSR related liabilities - nonrecourse at fair value | 1,285 | 1,348 | (63 | ) | (5 | )% | ||||||||
| Other nonrecourse debt, net | 4,945 | 5,286 | (341 | ) | (6 | )% | ||||||||
| Other liabilities | 2,018 | 2,077 | (59 | ) | (3 | )% | ||||||||
| Total liabilities | 15,547 | 16,074 | (527 | ) | (3 | )% | ||||||||
| Total stockholders’ equity | 2,066 | 2,231 | (165 | ) | (7 | )% | ||||||||
| Total liabilities and stockholders’ equity | $ | 17,613 | $ | 18,305 | $ | (692 | ) | (4 | )% | |||||
| Liquidity and Capital Resources | ||||
| Table 28. Operating Cash Flow | ||||
| Three Months Ended March 31, 2020 | Three Months Ended March 31, 2019 | $ Change | % Change | |||||||||||
| Net loss | $ | (171 | ) | $ | (186 | ) | $ | 15 | (8 | )% | ||||
| Fair value changes in MSRs, MSR related liabilities and mortgage loans held for investment | 497 | 311 | 186 | 60 | % | |||||||||
| Deferred tax benefit | (68 | ) | (47 | ) | (21 | ) | 45 | % | ||||||
| Other non-cash adjustments to net loss | (332 | ) | (210 | ) | (122 | ) | 58 | % | ||||||
| Originations net sales activities | 430 | 116 | 314 | 271 | % | |||||||||
| Changes in working capital | 354 | 301 | 53 | 18 | % | |||||||||
| Net cash attributable to operating activities | $ | 710 | $ | 285 | $ | 425 | 149 | % | ||||||
| Table 29. Investing Cash Flows | ||||
| Three Months Ended March 31, 2020 | Three Months Ended March 31, 2019 | $ Change | % Change | |||||||||||
| Acquisitions, net | $ | — | $ | (85 | ) | $ | 85 | (100 | )% | |||||
| Purchase of forward mortgage servicing rights, net of liabilities incurred | (27 | ) | (130 | ) | 103 | (79 | )% | |||||||
| Proceeds on sale of forward and reverse mortgage servicing rights | 43 | 243 | (200 | ) | (82 | )% | ||||||||
| Other | (12 | ) | (10 | ) | (2 | ) | 20 | % | ||||||
| Net cash attributable to investing activities | $ | 4 | $ | 18 | $ | (14 | ) | (78 | )% | |||||
| Table 30. Financing Cash Flow | ||||
| Three Months Ended March 31, 2020 | Three Months Ended March 31, 2019 | $ Change | % Change | |||||||||||
| (Decrease) increase in warehouse facilities | $ | (25 | ) | $ | 307 | $ | (332 | ) | (108 | )% | ||||
| Increase (decrease) in advance facilities | 68 | (30 | ) | 98 | (327 | )% | ||||||||
| Repayment of notes payable | — | (294 | ) | 294 | (100 | )% | ||||||||
| Redemption and repayment of unsecured senior notes and nonrecourse debt | (698 | ) | (3 | ) | (695 | ) | 23,167 | % | ||||||
| Issuance of unsecured senior debt | 600 | — | 600 | 100 | % | |||||||||
| Issuance of excess spread financing | 24 | 245 | (221 | ) | (90 | )% | ||||||||
| Settlements and repayments of excess spread financing | (58 | ) | (50 | ) | (8 | ) | 16 | % | ||||||
| Decrease of participating interest financing | (275 | ) | (408 | ) | 133 | (33 | )% | |||||||
| Changes in HECM securitizations | (99 | ) | (107 | ) | 8 | (7 | )% | |||||||
| Other | (18 | ) | (4 | ) | (14 | ) | 350 | % | ||||||
| Net cash attributable to financing activities | $ | (481 | ) | $ | (344 | ) | $ | (137 | ) | 40 | % | |||
| ▪ | Base of $2.5 plus 25 basis points of outstanding UPB for total loans serviced. |
| ▪ | Tangible Net Worth comprises of total equity less goodwill, intangible assets, affiliate receivables and certain pledged assets. |
| ▪ | The sum of (i) base of $2.5 plus 35 basis points of the issuer’s total single-family effective outstanding obligations, and (ii) base of $5 plus 1% of the total effective HMBS outstanding obligations. |
| ▪ | Tangible Net Worth is defined as total equity less goodwill, intangible assets, affiliate receivables and certain pledged assets. Effective for fiscal year 2020, under the Ginnie Mae MBS Guide, the issuers will no longer be permitted to include deferred tax assets when computing the minimum net worth requirement. |
| ▪ | In addition to the minimum net worth requirement, we are also required to hold a ratio of Tangible Net Worth to Total Assets (excluding HMBS securitizations) greater than 6%. |
| ▪ | 3.5 basis points of total Agency servicing. |
| ▪ | Incremental 200 basis points of total nonperforming Agency, measured as 90+ delinquencies, servicing in excess of 6% of the total Agency servicing UPB. |
| ▪ | Allowable assets for liquidity may include: cash and cash equivalents (unrestricted), available for sale or held for trading investment grade securities (e.g., Agency MBS, Obligations of GSEs, US Treasury Obligations); and unused/available portion of committed servicing advance lines. |
| ▪ | Maintain liquid assets equal to the greater of $1 or 10 basis points of our outstanding single-family MBS. |
| ▪ | Maintain liquid assets equal to at least 20% of our net worth requirement for HECM MBS. |
For the nine months ended September 30, 2017, we reported net income attributable to common and participating stockholders of $21.4 million compared to net income attributable to common and participating stockholders of $47.8 million for the nine months ended September 30, 2016. This $26.4 million decline in net income attributable to common and participating stockholders, when comparing the nine months ended September 30, 2017 to the nine months ended September 30, 2016, is primarily the result of the change in fair value of an embedded derivative. This embedded derivative was recorded as a result of the variable conversion feature in our Series B Preferred Stock and the change in fair value is reflected on our condensed consolidated statements of operations as the other income or expense item “change in fair value of derivative embedded conversion feature” which resulted in $31.2 million of other income for the nine months ended September 30, 2017, compared to other income of $62.6 million for the nine months ended September 30, 2016. This item is solely attributable to a change in fair value of the derivative embedded conversion feature, which is further described above. In addition to this change, the other large variance was the positive impact from the loss contract reserve decreasing by $5.6 million for the nine months ended September 30, 2017, as compared to $2.3 million in the same period in 2016.
33
The total revenue for the three and nine months ended September 30, 2017 was $2.3 million and $5.9 million, respectively, compared to revenue of $1.3 million and $4.2 million, respectively, for the three and nine months ended September 30, 2016. The increase in revenue is attributable to improved earnings on our investment portfolio including the restricted cash equivalents, however, WMMRC continues to experience decreasing premium revenue due to operating in runoff mode. In addition, because WMMRC is operating in runoff mode, we expect premiums-earned revenue to continue to decrease, as no new business is being undertaken.
Underwriting expenses (defined as losses and loss adjustment expenses and ceding commission expenses) decreased by $0.2 million to a $0.1 million expense for the three months ended September 30, 2017 compared to an expense of $0.3 million for the three months ended September 30, 2016. Underwriting expenses decreased by $0.6 million to a $0.3 million expense for the nine months ended September 30, 2017 compared to an expense of $0.9 million for the nine months ended September 30, 2016. This decrease was primarily the result of the $0.5 million and $1.0 million additional premium deficiency reserves which were recorded during the three and nine months ended September 30, 2016, respectively, compared to a minimal change and a $0.2 million increase in the premium deficiency reserve during the three and nine months ended September 30, 2017, respectively. These changes in expense are related to the operation of WMMRC in runoff mode and the corresponding decrease in revenues and the change in premium deficiency reserves as further described below in this Item 2 of Part I under “Losses or Benefits Incurred and Losses and Loss Adjustment Expenses.” As more fully described in Note 2: Significant Accounting Policies to the condensed consolidated financial statements in Item 1 of Part I of this Quarterly Report on Form 10-Q, due to the current condition of the mortgage insurance market, WMMRC has recorded reserves based on ceded case reserves and incurred but not recorded (“IBNR”) loss levels established and reported by the primary mortgage guaranty carriers as of each reporting period. Management believes that its estimate of aggregate liability for unpaid losses and loss adjustment expenses as of September 30, 2017 represents its best estimate, based upon the available data, of the amount necessary to cover the current cost of losses.
additional information.
| Table 31. Debt | ||||
| March 31, 2020 | December 31, 2019 | ||||||
| Advance facilities, net | $ | 489 | $ | 422 | |||
| Warehouse facilities, net | 4,551 | 4,575 | |||||
| Unsecured senior notes, net | 2,259 | 2,366 | |||||
For the three and nine months ended September 30, 2017, our investment portfolio reported net investment income of $1.9 million and $4.8 million, respectively, as comparedprovide us with financing facilities to net investment income of $0.5 million and $1.7 million, respectively, for the three and nine months ended September 30, 2016. The increase in investment income is primarily the result of higher short term interest rates during 2017 compared to 2016. The components of the investment income are more fully described below in this Item 2 of Part I, under “Net Investment Income.”
General and Administrative Expenses
For the three and nine months ended September 30, 2017 our general and administrative expenses totaled $2.1 million and $5.9 million, respectively, compared to $1.4 million and $4.9 million for the three and nine months ended September 30, 2016. General and administrative expenses primarily increased due to expenses related to assistance with transaction sourcing and debt and equity restructuring activities.
Interest Expense
For the three and nine months ended September 30, 2017, we incurred $0.6 million and $1.8 million, respectively, of interest expense on the Second Lien Notes, which is further described below in this Item 2 of Part I, under “Notes Payable.” This compares to $0.6 million and $2.0 million of interest expense, all of which related to the Second Lien Notes, which was incurred during the three and nine months ended September 30, 2016, respectively. The interest related to Second Lien Notes decreased primarily due to the reduction of Second Lien Note principal balances by $18.8 million during the nine months ended September 30, 2017 and by $2.9 million during the year ended December 31, 2016. Because sufficient Runoff Proceeds have not always been available to pay accrued interest on the Runoff Notes,fund a portion of our servicing advances.
34
Unrealized Gain (Loss) on Change in Fair Value of Derivative
The fair value of the derivative embedded conversion feature is revalued each reportable balance sheet date with the decrease or increase in fair value being reported in the consolidated statements of operations as unrealized gain or (loss) on change in fair value of derivative embedded conversion feature, respectively. The primary factors affecting the fair value of the embedded conversion featurecontractual maturities are the probability of occurrence and timing of a Qualified Acquisition, our stock price and our stock price volatility. During the three and nine months ended September 30, 2017, the fair value of the asset increased by $38.6 million and $31.2 million, respectively, and unrealized income was recorded. During the three and nine months ended September 30, 2016, the fair value of the liability increased by $16.2 million and decreased by $62.6 million, respectively, resulting in the recognition of a respective unrealized loss and gain.
Net Income (Loss)
The net operating (loss) income for the three and nine months ended September 30, 2017 totaled an operating loss of $0.3 million and operating income of $3.5 million, respectively, compared to net operating losses of $0.4 million and $1.3 million, respectively, for the three and nine months ended September 30, 2016.
For the three and nine months ended September 30, 2017, we reported net income attributable to common and participating stockholders of $33.9 million and $21.4 million, respectively. This result compares to net loss attributable to common and participating stockholders of $21.1 million and net income attributable to common and participating stockholders $47.8 million, for the three and nine months ended September 30, 2016, respectively.
The primary factors impacting the change in net operating (loss) income and the change in net income (loss) attributable to common and participating stockholders for the three and nine months ended September 30, 2017 compared to the results for the three and nine months ended September 30, 2016, are summarized in the tables below.
Three months ended September 30, 2017 versus three months ended September 30, 2016 summary of change in net operating (loss) income and net income (loss) attributable to common and participating stockholders (in thousands):
|
|
|
|
|
|
|
|
|
|
| |||||
| Three months ended September 30, 2017 |
|
| Three months ended September 30, 2016 |
|
| Percentage change favorable (unfavorable) |
|
| Dollar value change favorable (unfavorable) |
| ||||
Net revenues | $ | 2,287 |
|
| $ | 1,284 |
|
|
| 78 | % |
| $ | 1,003 |
|
Underwriting expense (net) |
| 92 |
|
|
| 258 |
|
|
| 64 | % |
|
| 166 |
|
General and administrative expenses |
| 2,117 |
|
|
| 1,357 |
|
|
| (56 | %) |
|
| (760 | ) |
Loss contract reserve reduction |
| (210 | ) |
|
| (565 | ) |
|
| (63 | %) |
|
| (355 | ) |
Interest expense |
| 579 |
|
|
| 636 |
|
|
| 9 | % |
|
| 57 |
|
Net operating (loss) |
| (291 | ) |
|
| (402 | ) |
|
| 28 | % |
|
| 111 |
|
Other income |
| 123 |
|
|
| — |
|
| N/A |
|
|
| 123 |
| |
Unrealized gain (loss) on change in value of derivative embedded conversion feature |
| 38,579 |
|
|
| (16,243 | ) |
|
| 338 | % |
|
| 54,822 |
|
Redeemable convertible series B preferred stock dividends |
| (4,500 | ) |
|
| (4,500 | ) |
|
| 0 | % |
|
| — |
|
Net income (loss) attributable to common and participating stockholders | $ | 33,911 |
|
| $ | (21,145 | ) |
|
| 260 | % |
| $ | 55,056 |
|
| Table 32. Contractual Maturities - Unsecured Senior Notes | ||||
| Year Ending December 31, | Amount | |||
| 2020 | $ | — | ||
| 2021 | — | |||
| 2022 | — | |||
| 2023 | 950 | |||
| 2024 | — | |||
| Thereafter | 1,350 | |||
| Unsecured senior notes principal amount | 2,300 | |||
| Unamortized debt issuance costs, premium and discount | (41 | ) | ||
| Unsecured senior notes, net | $ | 2,259 | ||
Nine months ended September 30, 2017 versus nine months ended September 30, 2016 summary
|
|
|
|
|
|
|
|
|
|
| |||||
| Nine months ended September 30, 2017 |
|
| Nine months ended September 30, 2016 |
|
| Percentage change favorable (unfavorable) |
|
| Dollar value change favorable (unfavorable) |
| ||||
Net revenues | $ | 5,929 |
|
| $ | 4,173 |
|
|
| 42 | % |
| $ | 1,756 |
|
Underwriting expenses (net) |
| 344 |
|
|
| 936 |
|
|
| 63 | % |
|
| 592 |
|
General and administrative expenses |
| 5,915 |
|
|
| 4,878 |
|
|
| (21 | %) |
|
| (1,037 | ) |
Loss contract reserve reduction |
| (5,645 | ) |
|
| (2,362 | ) |
|
| 139 | % |
|
| 3,283 |
|
Interest expense |
| 1,788 |
|
|
| 1,994 |
|
|
| 10 | % |
|
| 206 |
|
Net operating income (loss) |
| 3,527 |
|
|
| (1,273 | ) |
|
| 377 | % |
|
| 4,800 |
|
Other income |
| 123 |
|
|
| — |
|
| N/A |
|
|
| 123 |
| |
Unrealized gain on change in fair value of derivative liability - embedded conversion feature |
| 31,226 |
|
|
| 62,587 |
|
|
| (50 | %) |
|
| (31,361 | ) |
Redeemable convertible series B preferred stock dividends |
| (13,500 | ) |
|
| (13,500 | ) |
|
| 0 | % |
|
| — |
|
Net income attributable to common and participating stockholders | $ | 21,376 |
|
| $ | 47,814 |
|
|
| (55 | %) |
| $ | (26,438 | ) |
Comprehensive Income
The Company has no comprehensive income other thanour outstanding contractual obligations were made from the net incomeamounts previously disclosed in the condensed consolidated statement of operations.
Premiums Earned
The majority of WMMRC’s reinsurance contracts require premiums to be written and earned monthly. In a few cases, the premiums earned reflect the pro rata inclusion into income of premiums written over the life of the reinsurance contracts. Details of premiums earned are provided in the following table:
| Three months ended September 30, 2017 |
|
| Three months ended September 30, 2016 |
|
| Nine months ended September 30, 2017 |
|
| Nine months ended September 30, 2016 |
| ||||
Premiums assumed | $ | 342 |
|
| $ | 739 |
|
| $ | 866 |
|
| $ | 1,963 |
|
Change in unearned premiums |
| 2 |
|
|
| 47 |
|
|
| 237 |
|
|
| 463 |
|
Premiums earned | $ | 344 |
|
| $ | 786 |
|
| $ | 1,103 |
|
| $ | 2,426 |
|
For the three and nine months ended September 30, 2017, premiums earned totaled $0.3 million and $1.1 million, respectively, a decrease of $0.5 million and $1.3 million, respectively, when compared to premiums earned of $0.8 million and $2.4 million, respectively, for the three and nine months ended September 30, 2016. The Company’s premiums earned are expected to continue to decrease due to WMMRC operating in runoff mode.
Losses or Benefits Incurred and Losses and Loss Adjustment Expenses
Losses incurred include losses paid and changes in loss reserves, including reserves for IBNR losses, premium deficiency reserves net of actual and estimated loss recoverable amounts. Details of net losses or benefits incurred for the three and nine months ended September 30, 2017 and September 30, 2016, respectively, are provided in the following table:
| Three months ended September 30, 2017 |
|
| Three months ended September 30, 2016 |
|
| Nine months ended September 30, 2017 |
|
| Nine months ended September 30, 2016 |
| ||||
Losses and loss adjustment expense | $ | 48 |
|
| $ | 183 |
|
| $ | 207 |
|
| $ | 702 |
|
36
We establish reserves for each contract based on estimates of the ultimate cost of all losses including losses incurred but not reported. These estimated reserves are based on reports received from ceding companies, industry data and historical experience as well as our own actuarial estimates. Quarterly, we review these estimates on a contract by contract basis and adjust the estimates as we deem necessary based on updated information and our internal actuarial estimates.
For the three and nine months ended September 30, 2017, the loss ratios were 14% and 19%, respectively, compared to loss ratios of 23% and 29%, respectively, for the three and nine months ended September 30, 2016. The loss or benefit ratio is calculated by dividing incurred benefit or losses for the period by earned premiums. The ratio provides a measure of underwriting profit or loss. Loss reinsurance contracts (which represent the significant majority of our loss exposure) are generally structured with limits set on the aggregate amount of losses that can be incurred over the life of such contract. Upon reaching such limits, no additional losses may be realized under the terms of the contract. Nevertheless, even when applicable contract limits are reached, revenues from premiums collected continue to be ceded for the remaining life of the contract. Beginning in 2013, a majority of WMMRC’s reinsurance arrangements for the 2006 through 2008 book years reached their respective loss limits. As a result, WMMRC does not expect to incur any additional losses for those book years; however, WMMRC may continue to realize revenues from those book years, to the extent premiums are ceded therefrom.
The components of the liability for losses and loss adjustment reserves are as follows at September 30, 2017 and December 31, 2016, respectively:
| September 30, 2017 |
|
| December 31, 2016 |
| ||
Case-basis reserves | $ | 174 |
|
| $ | 553 |
|
IBNR reserves |
| 1 |
|
|
| — |
|
Premium deficiency reserves |
| 530 |
|
|
| 258 |
|
Total losses and loss adjustment reserves | $ | 705 |
|
| $ | 811 |
|
Losses and loss adjustment reserve activity are as follows for the periods ended September 30, 2017 and December 31, 2016, respectively:
|
|
|
|
|
|
|
|
| Nine months ended September 30, 2017 |
|
| Year ended December 31, 2016 |
| ||
Balance at beginning of period | $ | 811 |
|
| $ | 5,063 |
|
Incurred (released) - prior periods |
| 207 |
|
|
| (669 | ) |
Paid or terminated - prior periods |
| (313 | ) |
|
| (3,583 | ) |
Total losses and loss adjustment reserves | $ | 705 |
|
| $ | 811 |
|
Net Investment Income
The increase in investment income during the three and nine months ended September 30, 2017 compared to the same periods in 2016 is primarily the result of higher short term interest rates during 2017 as compared to 2016. A summary of our net investment income for the periods ended September 30, 2017 and 2016, respectively, is as follows:
| Three months ended September 30, 2017 |
|
| Three months ended September 30, 2016 |
|
| Nine months ended September 30, 2017 |
|
| Nine months ended September 30, 2016 |
| ||||
Investment income: |
|
|
|
|
|
|
|
|
|
|
|
|
|
|
|
Amortization of premium or discount on fixed-maturity securities | $ | (32 | ) |
| $ | (74 | ) |
| $ | (108 | ) |
| $ | (247 | ) |
Investment income on fixed-maturity securities |
| 72 |
|
|
| 233 |
|
|
| 403 |
|
|
| 792 |
|
Interest income on cash and cash equivalents |
| 1,895 |
|
|
| 405 |
|
|
| 4,527 |
|
|
| 1,100 |
|
Realized net (loss) gain from sale of investments |
| (36 | ) |
|
| 18 |
|
|
| (63 | ) |
|
| 19 |
|
Unrealized gain (loss) on trading securities held at period end |
| 44 |
|
|
| (84 | ) |
|
| 67 |
|
|
| 83 |
|
Net investment income | $ | 1,943 |
|
| $ | 498 |
|
| $ | 4,826 |
|
| $ | 1,747 |
|
37
The Company has no current tax expense or liability due as a result of its tax loss position for periods ended September 30, 2017, September 30, 2016 and December 31, 2016. More detailed information regarding the Company’s tax position including NOL carry-forwards is provided in Note 6: Income Taxes to the consolidated financial statements in Item 8 of the Annual Report on Form 10-K for the year ended December 31, 20162019 except for the following, in connection with the issuance of the 2027 notes and in Note 5: Income Taxesredemption of the 2021 and 2022 notes during the three months ended March 31, 2020:
| Table 33. Contractual Obligations | ||||
| Less than 1 Year | 1-3 Years | 3-5 Years | More than 5 Years | Total | |||||||||||||||
| Unsecured senior notes | $ | — | $ | — | $ | 950 | $ | 1,350 | $ | 2,300 | |||||||||
| Interest payment from unsecured senior notes | 182 | 363 | 248 | 175 | 968 | ||||||||||||||
| Total | $ | 182 | $ | 363 | $ | 1,198 | $ | 1,525 | $ | 3,268 | |||||||||
| Critical Accounting Policies | ||||
The Company files aour consolidated federal income tax return. Pursuantfinancial statements, the use of other judgments, estimates and assumptions could result in material differences in our results of operations or financial condition. Fair value measurements considered to a tax sharing agreement, WMMRC’s federal income tax liability is calculatedbe Level 3 representing estimated values based on a separate return basis determined by applying 35% to taxable income, in accordance with the provisions of the Internal Revenue Code (the “Code”) that apply to mortgage insurance companies. WMIH, as WMMRC’s parent, pays federal income taxes on behalf of WMMRC and settles the federal income tax obligation on a current basis in accordance with the tax sharing agreement. WMMRC made no tax payments to WMIH during the periods ended September 30, 2017 and December 31, 2016 associated with the Company’s tax liability from the current or preceding periods.
Deferred federal income taxes arise from temporary differences betweensignificant unobservable inputs include (i) the valuation of assetsMSRs, (ii) the valuation of excess spread financing and liabilities as determined for financial reporting purposes and income tax purposes. Temporary differences principally relate to discounting of loss reserves, recognition of unearned premiums, changes in value of loss contract reserves and embedded derivatives, net operating losses and unrealized gains and losses on investments.
We believe WMIH experienced an ownership change under Section 382(iii) the valuation of the Code in connection with its bankruptcy plan becoming effective. Priormortgage servicing rights financing liability. For further information on our critical accounting policies, please refer to emergence from bankruptcy, WMI abandoned the stock of Washington Mutual Bank, thereby generating a worthless stock deduction of approximately $8.37 billion, which gave rise to a NOL carry-forwardCompany’s Annual Reports on Form 10-K for the year ended December 31, 2012. We believe that the total available and utilizable NOL carry-forward at2019. There have been no material changes to our critical accounting policies since December 31, 2016 was approximately $6.0 billion and at September 30, 20172019. During the three months ended March 31, 2020, we believeupdated the policies for reserves related to certain financial assets that there was no limit under Section 382are subject to CECL accounting in connection with adoption of the CodeASU 2016-13. The update did not have material impact on the useconsolidated financial statements. See
On November 2, 2017, the Ways and Means Committee of the U.S. House of Representatives introduced a bill containing various amendments to the Internal Revenue Code, including, among other things changes to corporate income tax rates and certain provisions governing NOLs. There can be no assurance that the bill will be approved in its current form or at all and the final form of any tax legislation that is enacted could contain provisions that adversely affect the utility or potential value of the Company’s NOLs.
Investments
General
We hold investments at both WMIH and WMMRC and the two portfolios consist entirely of fixed income instruments, excluding funds in overnight money market funds, totaling $10.4 million and $76.8 million as of September 30, 2017 and December 31, 2016, respectively. The Company held $577.2 million and $572.9 million of restricted cash from the Series B Preferred Stock Financing in its escrow account at September 30, 2017 and December 31, 2016, respectively.
The value of the consolidated Company’s total cash and investments decreased during the nine months ended September 30, 2017. Cash and investments, which excludes restricted cash of $577.2 million and $573.3 million at September 30, 2017 and December 31, 2016, respectively, totaled $42.8 million and $81.5 million at September 30, 2017 and December 31, 2016, respectively. The primary factors that contributed to this decrease in investments were (i) the payment of a total of $13.5 million in Series B Preferred Stock cash dividends during the nine months ended September 30, 2017; and (ii) the redemption in full of the $18.8 million of Second Lien Notes which were outstanding at December 31, 2016, and the payment of related interest of approximately $2.0 million.
We work with investment broker dealers and, in the case of WMMRC, collateral trustees, in determining whether a market for a financial instrument is active or inactive. We regularly obtain indicative pricing from market makers and from multiple dealers and compare the level of pricing variances as a way to observe market liquidity for certain investment securities. We also obtain trade history and live market quotations from publicly quoted sources, such as Bloomberg, for trade volume and frequency observation. While we obtain market pricing information from broker dealers, the ultimate fair value of our investments is based on portfolio statements provided by financial institutions that hold our accounts.
During the nine months ended September 30, 2017 and the year ended December 31, 2016, we transferred $0.9 million and $11.0 million, respectively, of corporate securities that mature within 12 months from Level 2 to Level 1, due to improved liquidity in capital markets for those securities. Please refer to Note 4: Investment Securities to the condensed consolidated financial statements which is incorporated herein for details.
38
WMIH’s investments are valued at fair value and any unrealized gains or losses are reflected in net investment incomeall amendments in the condensed consolidated statementssame period permitted. The Company is currently assessing the impact of income. At September 30, 2017 and at December 31, 2016, WMIH had zero and $45.0 million, respectively, of investments in obligations of U.S. government sponsored enterprises, all of which will mature within the respective next 12 months. WMIH also had $25.0 million and $2.1 million in cash and cash equivalents at September 30, 2017 and December 31, 2016, respectively.
WMMRC
WMMRC’s investments are valued at fair value and any unrealized gains or losses are reflected in net investment income in the condensed consolidated statements of operations. At September 30, 2017, approximately 89% of WMMRC’s cash and investments were held in four trusts for the benefit of primary mortgage insurers with whom WMMRC established agreements to reinsure private mortgage insurance risk. The total portfolio, excluding funds in overnight money market instruments, was valued at approximately $10.4 million and $31.9 million at September 30, 2017 and December 31, 2016, respectively. At September 30, 2017, approximately 90% of the portfolio consisted of securities that will mature within the next 12 months and the remainder of the securities will mature between one and two years from September 30, 2017. WMMRC also had $7.3 million in cash and cash equivalents at September 30, 2017.
Liquidity and Capital Resources
General
WMIH is organized as a holding company and has limited operations of its own. With respect to its own operations, WMIH’s continuing cash needs are limited to the payment of general and administrative expenses, costs related to possible acquisitions, dividends on the Series B Preferred Stock and, prior to the redemption thereof, principal and interest payments on the Second Lien Notes described below in this Item 2 of Part I, under “Notes Payable.” As of September 29, 2017, the Second Lien Notes were fully redeemed by the Company and, as of October 2, 2017, the Second Lien Indenture was satisfied and discharged.
Our significant business operations are conducted through our wholly-owned reinsurance subsidiary, WMMRC, which formerly underwrote risks associated with our mortgage reinsurance programs,ASU 2019-12, but has been operated in runoff and has not written any new business since September 26, 2008. There are restrictions on WMMRC’s ability to pay dividends which are described in more detail below. WMIH does not currently expect to pay dividendsbelieve it will have a material impact on its common shares.
WMMRC may seek opportunities to commute one or moreconsolidated financial statements.
In regard to the Series B Preferred Stock, we are required (ifInflation and when declared by our BoardChanging Prices
The repayment of $18.8 million of Second Lien Notes and the $13.5 million in dividends on our Series B Preferred Stock were our largest uses of cash during the nine months ended September 30, 2017. The Second Lien Notesnotes thereto presented herein have been paid in full, however, the dividend obligation is likely to continue to be a significant financial obligation of the Company until we either consummate a Qualified Acquisition or redeem or repurchase the Series B Preferred Stock.
Unless we consummate a Qualified Acquisition, or enter into a definitive agreement to consummate an Acquisition (or the Series B Redemption Date is extendedprepared in accordance with GAAP, which requires the measurement of financial position and operating results in terms of historical dollars without considering the Series B Preferred Stock), we will be required to redeem the Series B Preferred Stock on the Series B Redemption Date. Consummation of an Acquisition would cause the conversion into common stock of shares of Series B Preferred Stock having an aggregate liquidation preference equal to the cash proceeds utilizedchanges in the Acquisition (unlessrelative purchasing power of money over time due to inflation. The impact of inflation is reflected in the Acquisition is a Qualified Acquisition, in which caseincreased cost of our operations. Unlike most industrial companies, nearly all of the Series B Preferred Stock would be converted into common stock). The redemption of the Series B Preferred Stock would substantially deplete our available cash for acquisitionsassets and business operations; could have a material adverse effect on our financial condition; and could adversely impact our ability to continue business operations. While we continue to work diligently to identify and consummate an Acquisition, there can be no assurance that we will consummate, or enter into a definitive agreement to consummate, an Acquisition prior to the Series B Redemption Date.
39
In connection with the foregoing, and because weliabilities are mindful of the adverse consequences that could result upon a redemption of the Series B Preferred Stock, our Finance Committee and management have been working with financial advisorsmonetary in an effort to amend and extend the terms of the Series B Preferred Stock. We can provide no assurance we will be able to restructure, amend or refinance the Series B Preferred Stock and, if so, on what terms. For additional information regarding the foregoing, please see “Item 2. Management’s Discussion and Analysis of Financial Condition and Results of Operations – Overview – Our Business Strategy and Operating Environment”.
Liquidity Management
The objective of liquidity management is to ensure the Company has the continuing ability to maintain cash flows that are adequate to fund operations and meet obligations and other commitments on a timely and cost-effective basis. The Company establishes and maintains liquidity guidelines for WMIH as well as for WMMRC, its principal operating subsidiary. Funds held by WMMRC are not available to WMIH to satisfy its liquidity needs. Any dividend or payment by WMMRC to WMIH must be approved by the Insurance Division of the State of Hawaii. In light of the restrictions on dividends applicable to WMMRC, WMIH’s principal sources of liquidity are its unrestricted investments, investment income derived from these investments and fees paid to WMIH by WMMRC with respect to services provided pursuant to the two services agreements approved by the Insurance Division of the State of Hawaii. Additionally, WMIH also has approximately $577.2 million of restricted cash held in escrow, which was received by WMIH in connection with the Series B Preferred Stock Financing. Because of the runoff nature of WMMRC’s business, as discussed above, all cash available to WMMRC is primarily used to pay reinsurance losses and loss adjustment expenses, ceding commissions, dividends to WMIH to pay interest and principal obligations on the Runoff Notes (prior to the full redemption which occurred on September 29, 2017), and general and administrative expenses.
The Company monitors operating activities, forecasts liquidity needs and adjusts composition of investment securities in order to address liquidity needs. The Company currently has negative monthly cash flows primarily due to loss expenses at WMMRC, general and administrative costs and dividend payments on the Series B Preferred Stock.nature. As a result, interest rates have a greater impact on our performance than do the Company maintains a very high quality and short duration investment portfolio in order to match its liability profile at botheffects of general levels of inflation. Further, interest rates do not necessarily move in the consolidated organization.
WMMRC has net assets totaling $17.7 millionsame direction or to the same extent as the prices of goods and $33.8 million asservices.
Capital Structure and Management
WMIH’s capital structure consists of stockholders’ equity, Series B Preferred Stock proceeds held in escrow which is classified as mezzanine and no term debt as of September 30, 2017. We issued term debt of $130.0 million represented by the Runoff Notes on the Effective Date. The First Lien Notes were redeemed in their entirety on April 15, 2015 and the First Lien Indenture was satisfied and discharged on April 27, 2015. The Second Lien Notes were redeemed in their entirety on September 29, 2017 and the Second Lien Indenture was satisfied and discharged on October 2, 2017
On the Effective Date, all shares of common and preferred equity securities previously issued by WMI were cancelled and extinguished. Prior to reincorporation, WMIH was authorized to issue up to 500,000,000 shares of common stock and up to 5,000,000 shares of preferred stock, each with a par value of $0.00001 per share. Upon reincorporation in Delaware, which is more fully described in Note 1: The Company and its Subsidiaries to the condensed consolidated financial statements in Part I, Item 1 of this Quarterly Report on Form 10-Q, and pursuant to WMIH’s Amended and Restated Certificate of Incorporation (“Certificate of Incorporation”), WMIH is authorized to issue up to 3,500,000,000 shares of common stock and up to 10,000,000 shares of preferred stock, each with a par value of $0.00001 per share. As of September 30, 2017, 206,714,132 shares of WMIH’s common stock were issued and outstanding, and 1,600,000 shares of its preferred stock were issued and outstanding.
40
On January 30, 2014, pursuant to an Investment Agreement, WMIH issued 1,000,000 shares of Series A Convertible Preferred Stock (the “Series A Preferred Stock”) for a purchase price of $11.1 million and warrants to purchase 61,400,000 shares of WMIH’s common stock, 30,700,000 of which have an exercise price of $1.32 per share and 30,700,000 of which have an exercise price of $1.43 per share. The Series A Preferred Stock has rights substantially similar to those associated with WMIH’s common stock, with the exception of a liquidation preference, conversion rights and customary anti-dilution protections. The Series A Preferred Stock has a liquidation preference equal to the greater of (i) $10.00 per one million shares of Series A Preferred Stock plus declared but unpaid dividends on such shares and (ii) the amount that the holder would be entitled to in a relevant transaction had the Series A Preferred Stock been converted to common stock of WMIH. The Series A Preferred Stock is convertible at a conversion price of $1.10 per share into shares of common stock of WMIH, either at the option of the holder or automatically upon transfer by KKR Fund Holdings L.P. (“KKR Fund”) to a non-affiliated party. As a result of the calculation of a beneficial conversion feature as required by Accounting Standards Codification 470, a preferred deemed dividend of $9.5 million was recorded in conjunction with the issuance of the Series A Preferred Stock. This preferred deemed dividend resulted in an increase to our accumulated deficit and an increase in additional paid in capital. Further, KKR Fund, as the holder of the Series A Preferred Stock and the warrants, has received other rights pursuant to the Investor Rights Agreement as more fully described in Note 9: Capital Stock and Derivative Instruments to our condensed consolidated financial statements in Part I, Item 1 of this Quarterly Report on Form 10-Q.
On January 5, 2015, WMIH announced that it had completed the Series B Preferred Stock Financing and issued 600,000 shares of Series B Preferred Stock for aggregate gross proceeds of $600.0 million, pursuant to the Purchase Agreement with Citigroup Global Markets Inc. and KKR Capital Markets LLC (together the “Initial Purchasers”). In connection with the Series B Preferred Stock Financing, WMIH entered into an Escrow Agreement (the “Escrow Agreement”) with Citibank, N.A., as Escrow Agent, pursuant to which WMIH caused to be deposited with the Escrow Agent the amount of $598.5 million representing the net proceeds of the Series B Preferred Stock Financing less offeringexcess fees payable on January 5, 2015 but before payment of other offering fees and expenses (including fees contingent upon future events). These net proceeds will be released from escrow from time to time to WMIH as instructed by WMIH in amounts necessary to, among other things, explore and/or fund, in whole or in part, acquisitions, whether completed or not. The entire net proceeds will be released from escrow as instructed by WMIH as needed to consummate a Qualified Acquisition.
In connection with the Series B Preferred Stock Financing, WMIH filed with the Secretary of State of Washington Articles of Amendment of Articles of Incorporation (the “Articles of Amendment”) containing the Certificate of Designation creating the Series B Preferred Stock and designating the rights and preferences of the Series B Preferred Stock. Holders of shares of the Series B Preferred Stock are entitled to receive, when, as and if declared, cumulative regular dividends at an annual rate of 3% per share of the liquidation preference of $1,000 per share of Series B Preferred Stock, payable in cash. On each date that WMIH closes any Acquisition, outstanding shares of Series B Preferred Stock having an aggregate liquidation preference equal to the net proceeds of the offering utilized in such Acquisition (as defined below), on a pro rata basis,basis.
The foregoing transactions pertaining to the Series A Preferred Stock and Series B Preferred Stock are more fully described in Note 9: Capital Stock and Derivative Instruments to the condensed consolidated financial statements in Item 1 of Part I of this Quarterly Report on Form 10-Q.
WMIH may, subject to market conditions, determine to incur additional indebtedness or raise additional equity capital in connection with undertaking one or more acquisitions.
While WMIH is not subject to regulatory capital requirements, WMMRC is required to comply with various solvency and liquidity requirements pursuant to the insurance laws of the State of Hawaii. WMMRC is required to maintain minimum capital and surplus requirements of an amount established under applicable Hawaii law and deemed appropriate Property acquired by the Insurance Division of the State of Hawaii. As of September 30, 2017, management believes that WMMRC is compliant with applicable statutory solvency, liquidity and minimum capital and surplus requirements. The payment of dividends by WMMRC is subject to statutory restrictions imposed by Hawaii insurance laws and regulations and requires approval from the Insurance Division of the State of Hawaii. In addition, the Second Lien Indenture, prior to the discharge and release on September 29, 2017, imposed restrictions on WMMRC business activities. During the nine months ended September 30, 2017 and the year ended December 31, 2016, WMMRC paid $16.0 million and $5.7 million, respectively, in dividends to WMIH.
41
On the Effective Date, WMI and WMIIC (together, the “Debtors”) (and now the WMI Liquidating Trust (the “Trust”)servicer on behalf of the Debtors) continuedowner of a mortgage loan or pool of mortgage loans, usually through foreclosure or a deed-in-lieu of foreclosure on a defaulted loan. The servicer or a third-party real estate management firm is responsible for selling the REO. Net proceeds of the sale are returned to dispute whether the interestsowner of certain formerthe related loan or loans. In most cases, the sale of REO does not generate enough to pay off the balance of the loan underlying the REO, causing a loss to the owner of the related mortgage loan.
The liquidating trusteeloans for the activities of the Trust, William Kosturos (the “Liquidating Trustee”subservicer.
Notes Payable
On the Effective Date, WMIH issued $110.0 million aggregate principal amount of its 13% Senior First Lien Notes due 2030 (the “First Lien Notes”) under an Indenture, dated asprincipal outstanding on a mortgage loan or a pool of March 19, 2012 (the “First Lien Indenture”), between WMIH and Wilmington Trust, National Association, as Trustee. In addition, WMIH issued $20.0 million aggregate principal amount of its 13% Senior Second Lien Notes due 2030 (the “Second Lien Notes” and,mortgage loans. UPB is used together with the First Lien Notes,servicing fees and ancillary incomes as a means of estimating the “Runoff Notes”) under an Indenture, dated asfuture revenue stream for a servicer.
Contractual Obligations, Commitments and Contingencies
WMMRC has engaged a Hawaii-based service provider, Marsh Management Services Inc., to provide accounting and related management services for its operations. In exchange for performing these services, WMMRC pays such service provider a management fee.
On March 19, 2012, WMIH entered into an Investment Management Agreement with WMMRC. Under the terms of this agreement, WMIH receives a fee from WMMRC equalloans back to the productoriginator at a date certain, or on demand, against the transfer of (x)funds from the ending dollar amountoriginator.
On March 19, 2012, WMIH entered into an Administrative Services Agreement with WMMRC. Under the terms of this agreement, WMIH receivesa lender acquires refinancing and purchase money mortgage loans from WMMRC a fee of $110 thousand per month. WMIH is responsible for providing administrative services to support, among other things, supervision, governance, financial administration and reporting, risk management and claims management as may be necessary, together with such other general or specific administrative services that may be reasonably required or requested by WMMRC in the ordinary course of its business. The Administrative Services Agreement has been approved by the Insurance Division of the State of Hawaii.
Total amounts incurred under the Investment Management Agreement and Administrative Services Agreement totaled $1.0 million and $1.0 million for the nine months ended September 30, 2017 and 2016, respectively. The expense and related income eliminate on consolidation.
42
On March 22, 2012, WMIH and the WMI Liquidating Trust (the “Trust”) entered into a Transition Services Agreement (the “TSA”). Pursuant to the TSA, the Trust makes available certain services and employees to the Company. The TSA provided the Company with office space (prior to the Company entering into its own lease) for its current employees and continues to provide basic infrastructure and support services to facilitate the Company’s operations. The TSA as amended, extends the term of the agreement through January 31, 2018, with automatic renewals thereafter for successive additional three-month terms, subject to non-renewal at the end of any additional term upon written notice by either party at least 30 days prior to the expiration of the additional term.
In connection with implementing the Plan, certain holders of specified “Allowed Claims” had the right to elect to receive such holder’s “Pro Rata Share of the Common Stock Allotment.” Essentially, the Plan defines the “Pro Rata Share of the Common Stock Allotment” as a pro rata share of ten million (10,000,000) shares of WMIH’s common stock (i.e. five percent (5%)) issued and outstanding on the Effective Date. Holders exercising the foregoing election did so in lieu of receiving (i) 50% of such holder’s interest in and to certain litigation proceeds that could be realized by the Trust on account of certain claims and causes of action asserted by the Trust as contemplated by the Plan (“Litigation Proceeds”), and (ii) some or all of the Runoff Notes to which such holder may be entitled (if such holder elected to receive Runoff Notes in accordance with the terms of the Plan).
If a holder exercised the election described above and, as a result of such election, received shares of WMIH’s common stock, then such holder’s share of Runoff Notes to which the election was effective (i.e., One Dollar ($1.00) of original principal amount of Runoff Notes for each share of WMIH’s common stock) were not issued. In addition, as a result of making the aforementioned election, such holders conveyed to WMIH, and WMIH retained an economic interest in Litigation Proceeds, if any, recovered by the Trust in connection with certain litigation brought by the Trust as contemplated by the Plan. Distributions, if any, to WMIH on account of the foregoing will be effected in accordance with the Plan and the court order confirming the Plan.
On or about October 14, 2014, the Trust filed a lawsuit in King County Superior Court in the State of Washington against 16 former directors and officers of WMI (the “D&O Litigation”). The Trust’s complaint alleged, among other things, that the defendants named therein breached their fiduciary duties to WMI and committed corporate waste and fraud by squandering WMI’s financial resources. In connection with the settlement of the D&O Litigation, during the year ended December 31, 2015, among the Trust, certain former directors and officers of WMI and certain insurance carriers that underwrote director and officer liability insurance policies for the benefit of WMI and its affiliates (including such former directors and officers), such insurance carriers agreed to pay the Trust $37.0 million, of which $3.0 million was placed into a segregated reserve account (the “RSA Reserve”) to be administered by a third party pursuant tocorrespondent lenders where the terms of a Reserve Settlement Agreement (the “RSA”).
Duringlender funds the year ended December 31, 2016 and 2015, WMIH had other income of $123 thousand and $7.8 million, respectively, as a result of its receipt of its share of net Litigation Proceeds related to the D&O Litigation. As of September 30, 2017, $1.5 million remained in the RSA Reserve. Under the RSA, funds are released from the RSA Reserve to the Trust if and when certain designated conditions are satisfied. If and when these funds are released to the Trust, and to the extent WMIH is entitled to receive such funds in accordance with the Plan, it is anticipated the Trust will make payments to WMIH in an amount equal to WMIH’s share of Litigation Proceeds as provided under the Plan. Due to the contingent nature of future distributions from the RSA Reserve, there can be no assurance that WMIH will receive any distributions from the remaining balance in the RSA Reserve in the future. During the nine months ended September 30, 2017, WMIH has recorded income from Litigation Proceeds of $123 thousand. As of September 30, 2017, WMIH had not received any Litigation Proceeds, other than as described above.
As a member of the Litigation Subcommittee of the Trust, Mr. Willingham, who serves as a WMIH Board member and Chairman of the WMIH Audit Committee, participates in overseeing the prosecution of recovery claims by the Trust.
As a result of the Company’s reorganization in bankruptcy, an intangible asset was identified related to reinsurance contracts which were held by WMMRC. The contracts were evaluated to determine whether the value attributable to such contracts was either above market or in a loss contract position. After taking such evaluation into consideration, a loss contract reserve totaling $63.1 million was recorded on the Effective Date. The reserve will be evaluated at each reporting date for changes to its value. As of September 30, 2017 and December 31, 2016, the loss contract reserve was analyzed and determined to have a value of zero and $5.6 million, respectively. The value of this reserve decreased by $5.6 million during the nine months ended September 30, 2017 and decreased by $2.3 million during the nine months ended September 30, 2016. The value of this reserve has been reduced to zero, primarily due to the extraction of cash proceeds from WMMRC occurring earlier than initially projected and the elimination of the higher cost of capital associated with the Runoff Notes which have now been paid in their entirety. For additional information see Note 2: Significant Accounting Policies in Item 1 of Part I of this Quarterly Report on Form 10-Q.
43
As of January 30, 2014, pursuant to the terms and conditions of the Investment Agreement, WMIH sold to KKR Fund 1,000,000 shares of Series A Preferred Stock, having the terms, rights, obligations and preferences contained in the Certificate of Incorporation, for a purchase price equal to $11.1 million and issued to KKR Fund warrants to purchase, in the aggregate, 61.4 million shares of WMIH’s common stock, 30.7 million of which have an exercise price of $1.32 per share and 30.7 million of which have an exercise price of $1.43 per share (together, the “Warrants”). KKR Fund’s rights as a holder of the Series A Preferred Stock and the Warrants, and the rights of any subsequent holder that is an affiliate of KKR Fund (together with KKR Fund, the “Holders”) are governed by the Investor Rights Agreement. The Investor Rights Agreement provides the Holders with registration rights, including three long form demand registration rights, unlimited short form demand registration rights and customary piggyback registration rights with respect to WMIH’s common stock (and WMIH’s common stock underlying the Series A Preferred Stock and the Warrants), subject to certain minimum thresholds, customary blackout periods and lockups of 180 days. On July 1, 2015, WMIH filed a shelf registration statement (the “Initial Registration Statement”) covering resales of Series B Preferred Stock and WMIH’s common stock issuable upon mandatory conversion of the Series B Preferred Stock. On November 23, 2015, WMIH amended the Initial Registration Statement to cover WMIH’s common stock issuable upon conversion of the Series A Preferred Stock and shares of WMIH’s common stock issuable upon exercise of warrants issued in connection with the issuance of our Series A Preferred Stock currently outstanding (as amended, the “Registration Statement”). The Registration Statement was declared effective under the Securities Act on November 25, 2015. Moreover, for as long as the Holders beneficially own any shares of common stock of WMIH or Series A Preferred Stock or any of the Warrants, WMIH has agreed to provide customary Rule 144A information rights, to provide the Holders with regular audited and unaudited financial statements and to allow the Holders or their representatives to inspect WMIH’s books and records. For further information on the Investment Agreement and the Investor Rights Agreement, see Note 8: Financing Arrangements and Note 9: Capital Stock and Derivative Instruments, to the condensed consolidated financial statements in Item 1 of Part I of this Quarterly Report on Form 10-Q.loan.
In conjunction with the Series B Preferred Stock Financing, the Company is contractually committed to make certain fee payments if future events occur. These fees are recorded and presented on our condensed consolidated balance sheets as other liabilities. At September 30, 2017, the total balance of $13.8 million of other liabilities is comprised of $12.3 million of accrued fees relating to the Series B Preferred Stock Financing, an accrual for professional fees currently payable of approximately $0.8 million, $0.7 million of accrued dividends relating to the Series B Preferred Stock and several small accruals for recurring business expenses.
Off-Balance Sheet Financing Arrangements
We have no obligations, assets or liabilities which would be considered off-balance sheet arrangements. We do not participate in transactions that create relationships with unconsolidated entities or financial partnerships, often referred to as variable interest entities, which would have been established for the purpose of facilitating off-balance sheet arrangements.
|
We are principally exposed
interest rate risk;
credit risk; and
liquidity risk.
There have been no material changes to our market risks as disclosed in our Annual Report on Form 10-K for the year ended December 31, 2016.
| Table 34. Change in Fair Value | ||||
| March 31, 2020 | |||||||
| Down 25 bps | Up 25 bps | ||||||
| Increase (decrease) in assets | |||||||
| Mortgage servicing rights at fair value | $ | (229 | ) | $ | 235 | ||
| Mortgage loans held for sale at fair value | 10 | (12 | ) | ||||
| Derivative financial instruments: | |||||||
| Interest rate lock commitments | 31 | (37 | ) | ||||
| Total change in assets | (188 | ) | 186 | ||||
| Increase (decrease) in liabilities | |||||||
| Mortgage servicing rights liabilities at fair value | (5 | ) | 4 | ||||
| Excess spread financing at fair value | (46 | ) | 51 | ||||
| Derivative financial instruments: | |||||||
| Forward MBS trades | 36 | (44 | ) | ||||
| Total change in liabilities | (15 | ) | 11 | ||||
| Total, net change | $ | (173 | ) | $ | 175 | ||
|
Procedures
(1)Act is recorded, processed, summarized, and reported within the time periods specified in the Securities and Exchange CommissionSEC’s rules and forms, and
(2) that such information is accumulated and communicated to the Company’sour management, including the Company’s principal executiveour Chief Executive Officer and principal financial officers, or persons performing similar functions,Chief Financial Officer, as appropriate, to allow timely decisions regarding required disclosure.
There was
45
|
As
|
In addition
46
Unregistered Sales of Equity Securities and Use of Proceeds
| ||||||
| Incorporated by Reference | ||||||
| Exhibit Number | Description | Form | File No. | Exhibit | Filing Date | Filed or Furnished Herewith |
| 10.1** | X | |||||
| 10.2** | X | |||||
| 10.3 | X | |||||
| 31.1 | X | |||||
| 31.2 | X | |||||
| 32.1 | X | |||||
| 32.2 | X | |||||
| 101.INS | XBRL Instance Document | X | ||||
| 101.SCH | XBRL Taxonomy Extension Schema Document | X | ||||
| 101.CAL | XBRL Taxonomy Extension Calculation Linkbase Document | X | ||||
| 101.DEF | XBRL Taxonomy Extension Definition Linkbase Document | X | ||||
| 101.LAB | XBRL Taxonomy Extension Label Linkbase Document | X | ||||
| 101.PRE | XBRL Taxonomy Extension Presentation Linkbase Document | X | ||||
The following exhibits are filed
|
|
| Incorporated by reference |
| |||||||||||||||||||||||
Exhibit Number |
| Exhibit Description | Form |
|
| Exhibit |
|
| Filing Date |
|
| Filed Herewith |
| ||||||||||||||
|
|
|
|
|
|
|
|
|
|
|
|
|
|
|
|
|
| ||||||||||
3.1 |
| Amended and Restated Certificate of Incorporation of WMIH Corp. |
| 8-K12G3 |
|
|
| 3.1 |
|
|
| 5/13/15 |
|
|
|
|
| ||||||||||
�� |
|
|
|
|
|
|
|
|
|
|
|
|
|
|
|
|
| ||||||||||
3.2 |
|
| 8-K12G3 |
|
|
| 3.2 |
|
|
| 5/13/15 |
|
|
|
|
| |||||||||||
|
|
|
|
|
|
|
|
|
|
|
|
|
|
|
|
|
| ||||||||||
12.1 |
|
|
|
|
|
|
|
|
|
|
|
|
|
| X |
| |||||||||||
|
|
|
|
|
|
|
|
|
|
|
|
|
|
|
|
|
| ||||||||||
31.1 |
|
|
|
|
|
|
|
|
|
|
|
|
|
| X |
| |||||||||||
31.2 |
|
|
|
|
|
|
|
|
|
|
|
|
|
|
| X |
| ||||||||||
32.1 |
|
|
|
|
|
|
|
|
|
|
|
|
|
|
| X |
| ||||||||||
101.INS |
|
XBRL Instance Document. |
|
|
|
|
|
|
|
|
|
|
|
|
| X |
| ||||||||||
101.SCH |
|
XBRL Taxonomy Extension Schema Document. |
|
|
|
|
|
|
|
|
|
|
|
|
| X |
| ||||||||||
101.CAL |
|
XBRL Taxonomy Extension Calculation Linkbase Document. |
|
|
|
|
|
|
|
|
|
|
|
|
| X |
| ||||||||||
101.DEF |
|
XBRL Taxonomy Extension Definition Linkbase Document. |
|
|
|
|
|
|
|
|
|
|
|
|
| X |
| ||||||||||
101.LAB |
|
XBRL Taxonomy Extension Label Linkbase Document. |
|
|
|
|
|
|
|
|
|
|
|
|
| X |
| ||||||||||
101.PRE |
|
XBRL Taxonomy Extension Presentation Linkbase Document. |
|
|
|
|
|
|
|
|
|
|
|
|
| X |
| ||||||||||
| ||||
| ||||
|
| /s/ | ||
| Date |
|
| ||
| Jay Bray (Principal Executive Officer) | |||
|
|
| ||
| April 30, 2020 |
|
| ||
| Date |
|
Christopher G. Marshall Vice Chairman & Chief Financial Officer (Principal Financial and Accounting Officer) | ||
48