
| |||||
| ☒ | QUARTERLY REPORT PURSUANT TO SECTION 13 OR 15(d) OF THE SECURITIES EXCHANGE ACT OF 1934 | ||||
2020
| |||||
| ☐ | TRANSITION REPORT PURSUANT TO SECTION 13 OR 15(d) OF THE SECURITIES EXCHANGE ACT OF 1934 | ||||
WMIH Corp.
|
| |||||||||||||
Delaware | 91-1653725 | |||||||||||||
| (State or other jurisdiction of | ( Identification No.) | |||||||||||||
|
| |||||||||||||
8950 Cypress Waters Blvd, Coppell, TX | 75019 | |||||||||||||
| (Address of principal executive offices) | (Zip Code) | |||||||||||||
| (469) 549-2000 | ||||||||||||||
| Registrant’s telephone number, including area code | ||||||||||||||
| Title of each class | Trading Symbol(s) | Name of each exchange on which registered | ||||||
| Common stock, $0.01 par value per share | COOP | The Nasdaq Stock Market | ||||||
(206) 922-2957
(Registrant’s telephone number, including area code)
|
|
|
| ||||||||||||||
| Large Accelerated Filer | ¨ | Accelerated Filer | x | ||||||||||||||
| ¨ |
| Smaller reporting company | ☐ | |||||||||||||
| Emerging growth company | ☐ | ||||||||||||||||
Indicate the number
|
| |||||||
|
| |||||||
Forward-Looking Statements
Certain information included in this Quarterly Report on Form 10-Q and the documents incorporated herein by reference contain “forward-looking statements” within the meaning of the Private Securities Litigation Reform Act of 1995, Section 27A of the Securities Act of 1933, as amended (the “Securities Act”), and Section 21E of the Securities Exchange Act of 1934, as amended (the “Exchange Act”). All statements other than statements of historical fact included in this Quarterly Report on Form 10-Q that address activities, events, conditions or developments that we expect, believe or anticipate will or may occur in the future are forward-looking statements. Forward-looking statements give our current expectations and projections relating to our financial condition, results of operations, plans, objectives, future performance and business and these statements are not guarantees of future performance. These statements can be identified by the fact that they do not relate strictly to historical or current facts. Forward-looking statements may include the words “anticipate,” “estimate,” “expect,” “project,” “intend,” “plan,” “believe,” “strategy,” “future,” “opportunity,” “may,” “should,” “will,” “would,” “will be,” “will continue,” “will likely result” and similar expressions. Such forward-looking statements involve risks and uncertainties that may cause actual events, results or performance to differ materially from those indicated by such statements. Some of these risks are identified and discussed under Risk Factors in Part I, Item 1A of our Annual Report on Form 10-K for the year ended December 31, 2016. These risk factors will be important to consider in determining future results and should be reviewed in their entirety. These forward-looking statements are expressed in good faith and we believe there is a reasonable basis for them. However, there can be no assurance that the events, results or trends identified in these forward-looking statements will occur or be achieved. Forward-looking statements speak only as of the date they are made, and we do not undertake to update any forward-looking statement, except as required by law.
* * * * *
As used in this Quarterly Report on Form 10-Q, unless the context requires otherwise, (i) the terms “Company,” “we,” “us,” or “our” refer to WMIH Corp. (formerly WMI Holdings Corp.) and its subsidiaries on a consolidated basis; (ii) “WMIH” refers only to WMIH Corp., without regard to its subsidiaries; (iii) “WMIHC” refers only to WMI Holdings Corp., without regard to its subsidiaries; (iv) “WMMRC” means WM Mortgage Reinsurance Company, Inc. (a wholly-owned subsidiary of WMIH); and (v) “WMIIC” means WMI Investment Corp. (a wholly-owned subsidiary of WMIH).
1
FORM 10-Q
INDEX
Page | |||||||||||
| Item 1. | |||||||||||
Consolidated Balance Sheets as of June 30, 2020 (unaudited) and December 31, 2019 | |||||||||||
Consolidated Statements of Operations (unaudited) for the Three and Six Months Ended June 30, 2020 and 2019 | |||||||||||
Consolidated Statements of Stockholders’ Equity (unaudited) for the Three and Six Months Ended June 30, 2020 and 2019 | |||||||||||
Consolidated Statements of Cash Flows (unaudited) for the Six Months Ended June 30, 2020 and 2019 | |||||||||||
| |||||||||||
| Item 2. |
| ||||||||||
| Item 3. |
| ||||||||||
| Item 4. |
| ||||||||||
| PART II | |||||||||||
| Item 1. |
| ||||||||||
| Item 1A. |
| ||||||||||
| |||||||||||
| Item 2. |
| ||||||||||
| Item 3. | |||||||||||
| Item 4. | |||||||||||
| Item 5. | |||||||||||
| Item 6. | |||||||||||
September 30, 2017 December 31, 2016 (1) ASSETS: Investments held in trust: Fixed-maturity securities $ 9,022 $ 29,206 Cash equivalents held in trust 6,804 2,176 Total investments held in trust 15,826 31,382 Cash and cash equivalents 25,542 2,491 Fixed-maturity securities 1,400 47,625 Restricted cash 577,220 573,347 Derivative asset - embedded conversion feature 111,877 80,651 Accrued investment income 109 187 Other assets 764 507 Total assets $ 732,738 $ 736,190 LIABILITIES, REDEEMABLE CONVERTIBLE PREFERRED STOCK AND STOCKHOLDERS’ EQUITY Liabilities: Notes payable - principal $ — $ 18,774 Notes payable - interest — 203 Losses and loss adjustment reserves 705 811 Losses payable 29 53 Unearned premiums 33 270 Accrued ceding commissions 57 22 Loss contract reserve — 5,645 Other liabilities 13,774 14,063 Total liabilities 14,598 39,841 Commitments and contingencies Redeemable convertible series B preferred stock, $0.00001 par value; 600,000 shares issued and outstanding as of September 30, 2017 and December 31, 2016; aggregate liquidation preference of $600,000,000 as of September 30, 2017 and December 31, 2016 502,213 502,213 Stockholders’ equity: Convertible series A preferred stock, $0.00001 par value; 1,000,000 shares issued and outstanding as of September 30, 2017 and December 31, 2016; aggregate liquidation preference of $10 as of September 30, 2017 and December 31, 2016 — — Common stock, $0.00001 par value; 3,500,000,000 authorized; 206,714,132 and 206,380,800 shares issued and outstanding as of September 30, 2017 and December 31, 2016, respectively 2 2 Additional paid-in capital 108,830 108,415 Retained earnings 107,095 85,719 Total stockholders’ equity 215,927 194,136 Total liabilities, redeemable convertible preferred stock and stockholders’ equity $ 732,738 $ 736,190 (unaudited). Three months ended September 30, 2017 Three months ended September 30, 2016 Nine months ended September 30, 2017 Nine months ended September 30, 2016 Revenues: Premiums earned $ 344 $ 786 $ 1,103 $ 2,426 Net investment income 1,943 498 4,826 1,747 Total revenues 2,287 1,284 5,929 4,173 Operating expenses: Losses and loss adjustment expense 48 183 207 702 Ceding commission expense 44 75 137 234 General and administrative expense 2,117 1,357 5,915 4,878 Loss contract reserve reduction (210 ) (565 ) (5,645 ) (2,362 ) Interest expense 579 636 1,788 1,994 Total operating expenses 2,578 1,686 2,402 5,446 Net operating (loss) income (291 ) (402 ) 3,527 (1,273 ) Other (income) expense: Other (income) (123 ) — (123 ) — Unrealized (gain) loss on change in fair value of derivative embedded conversion feature (38,579 ) 16,243 (31,226 ) (62,587 ) Total other (income) expense (38,702 ) 16,243 (31,349 ) (62,587 ) Income (loss) before income taxes 38,411 (16,645 ) 34,876 61,314 Income tax expense (benefit) — — — — Net income (loss) 38,411 (16,645 ) 34,876 61,314 Redeemable convertible series B preferred stock dividends (4,500 ) (4,500 ) (13,500 ) (13,500 ) Net income (loss) attributable to common and participating stockholders $ 33,911 $ (21,145 ) $ 21,376 $ 47,814 Basic net income (loss) per share attributable to common stockholders (Note 12) $ 0.06 $ (0.10 ) $ 0.04 $ 0.10 Shares used in computing basic net income (loss) per share 202,660,492 202,341,209 202,573,315 202,247,275 Diluted net income (loss) per share attributable to common stockholders (Note 12) $ 0.06 $ (0.10 ) $ 0.04 $ 0.09 Shares used in computing diluted net income (loss) per share 212,726,121 202,341,209 212,638,944 237,575,014 statements (unaudited). Series B Redeemable Convertible Preferred Stock Series A Convertible Preferred Stock Common Stock Shares Amount Shares Amount Shares Amount Additional paid-in capital (Accumulated deficit) retained earnings Total stockholders’ equity Balance at January 1, 2016 600,000 502,213 1,000,000 — 206,168,035 2 107,757 (97,981 ) 9,778 Net income — — — — — — — 201,700 201,700 Redeemable convertible series B preferred stock dividends — — — — — — — (18,000 ) (18,000 ) Issuance of common stock under restricted stock compensation arrangement — — — — 212,765 — — — — Equity-based compensation — — — — — — 658 — 658 Balance at December 31, 2016 600,000 502,213 1,000,000 — 206,380,800 2 108,415 85,719 194,136 Net income — — — — — — — 34,876 34,876 Redeemable convertible series B preferred stock dividends — — — — — — — (13,500 ) (13,500 ) Issuance of common stock under restricted stock compensation arrangement — — — — 333,332 — — — — Equity-based compensation — — — — — — 415 — 415 Balance at September 30, 2017 600,000 $ 502,213 1,000,000 $ — 206,714,132 $ 2 $ 108,830 $ 107,095 $ 215,927 statements (unaudited). Nine months ended September 30, 2017 Nine months ended September 30, 2016 Cash flows from operating activities: Net income $ 34,876 $ 61,314 Adjustments to reconcile net income to net cash (used in) operating activities: Amortization of premium or discount on fixed maturity securities 108 247 Net realized loss (gain) on sale of investments 63 (19 ) Unrealized (gain) on trading securities (67 ) (83 ) Unrealized (gain) on derivative embedded conversion feature (31,226 ) (62,587 ) Equity-based compensation 415 484 Changes in assets and liabilities: Accrued investment income 78 (18 ) Other assets (257 ) (270 ) Cash equivalents held in trust (4,628 ) 1,358 Restricted cash (3,873 ) (1,476 ) Losses and loss adjustment reserves (106 ) (2,733 ) Losses payable (24 ) (395 ) Unearned premiums (237 ) (463 ) Accrued ceding commission expense 35 (8 ) Accrued interest on notes payable (203 ) (24 ) Loss contract reserve (5,645 ) (2,362 ) Other liabilities (289 ) (626 ) Total adjustments (45,856 ) (68,975 ) Net cash used in operating activities (10,980 ) (7,661 ) Cash flows from investing activities: Purchase of investments (19,973 ) (130,469 ) Proceeds from sales and maturities of investments 86,278 146,920 Net cash provided by investing activities 66,305 16,451 Cash flows from financing activities: Redeemable convertible series B preferred stock dividends (13,500 ) (13,500 ) Notes payable – principal repayments (18,774 ) (2,185 ) Net cash used in financing activities (32,274 ) (15,685 ) Increase (decrease) in cash and cash equivalents 23,051 (6,895 ) Cash and cash equivalents, beginning of period 2,491 9,924 Cash and cash equivalents, end of period $ 25,542 $ 3,029 Supplementary disclosure of cash flow information: Cash paid during the period: Interest $ 1,991 $ 2,008 other terms that are used herein, in the MD&A section of this Form 10-Q. statements from their respective dates of acquisition. excess spread financing fair value when applying certain unfavorable variations of key assumptions to these liabilities for the dates indicated: (e.g., Level market; Level Level The Three months ended September 30, 2017 Three months ended September 30, 2016 Nine months ended September 30, 2017 Nine months ended September 30, 2016 Premiums assumed $ 342 $ 739 $ 866 $ 1,963 Change in unearned premiums 2 47 237 463 Premiums earned $ 344 $ 786 $ 1,103 $ 2,426 September 30, 2017 December 31, 2016 Case-basis reserves $ 174 $ 553 IBNR reserves 1 — Premium deficiency reserves 530 258 Total losses and loss adjustment reserves $ 705 $ 811 Nine months ended September 30, 2017 Year ended December 31, 2016 Balance at beginning of period $ 811 $ 5,063 Incurred (released) - prior periods 207 (669 ) Paid or terminated - prior periods (313 ) (3,583 ) Total losses and loss adjustment reserves $ 705 $ 811 September 30, 2017 Class of securities: Amortized Cost Gross Unrealized Gains Gross Unrealized Losses Estimated Fair Value U.S. government treasury securities $ 250 $ — $ — $ 250 Obligations of U.S. government sponsored enterprises 2,749 — (7 ) 2,742 Corporate debt securities 3,683 — (2 ) 3,681 Foreign corporate debt securities 3,750 — (1 ) 3,749 Total fixed-maturity securities 10,432 — (10 ) 10,422 Less total unrestricted fixed-maturity securities 1,402 — (2 ) 1,400 Total fixed-maturity securities held in trust $ 9,030 $ — $ (8 ) $ 9,022 December 31, 2016 Class of securities: Amortized Cost Gross Unrealized Gains Gross Unrealized Losses Estimated Fair Value U.S. government treasury securities $ 249 $ — $ — $ 249 Obligations of U.S. government sponsored enterprises 59,450 1 (80 ) 59,371 Corporate debt securities 11,415 9 (9 ) 11,415 Foreign corporate debt securities 5,798 5 (7 ) 5,796 Total fixed-maturity securities 76,912 15 (96 ) 76,831 Less total unrestricted fixed-maturity securities 47,635 — (10 ) 47,625 Total fixed-maturity securities held in trust $ 29,277 $ 15 $ (86 ) $ 29,206 Amortized Cost Estimated Fair Value Maturity in: 2017 $ 6,750 $ 6,749 2018 3,682 3,673 Total fixed-maturity securities $ 10,432 $ 10,422 Three months ended September 30, 2017 Three months ended September 30, 2016 Nine months ended September 30, 2017 Nine months ended September 30, 2016 Investment income: Amortization of premium or discount on fixed-maturity securities $ (32 ) $ (74 ) $ (108 ) $ (247 ) Investment income on fixed-maturity securities 72 233 403 792 Interest income on cash and cash equivalents 1,895 405 4,527 1,100 Realized net (loss) gain from sale of investments (36 ) 18 (63 ) 19 Unrealized gain (loss) on trading securities held at period end 44 (84 ) 67 83 Net investment income $ 1,943 $ 498 $ 4,826 $ 1,747 September 30, 2017 Level 1 Level 2 Level 3 Total Class of securities: U.S. government treasury securities $ 250 $ — $ — $ 250 Obligations of U.S. government sponsored enterprises 1,497 1,245 — 2,742 Corporate debt securities 3,151 530 — 3,681 Foreign corporate debt securities 3,749 — — 3,749 Total fixed-maturity securities 8,647 1,775 — 10,422 Money market funds 32,007 — — 32,007 Total $ 40,654 $ 1,775 $ — $ 42,429 December 31, 2016 Level 1 Level 2 Level 3 Total Class of securities: U.S. government treasury securities $ 249 $ — $ — $ 249 Obligations of U.S. government sponsored enterprises 47,489 11,882 — 59,371 Corporate debt securities 7,033 4,382 — 11,415 Foreign corporate debt securities 5,796 — — 5,796 Total fixed-maturity securities 60,567 16,264 — 76,831 Money market funds 4,548 — — 4,548 Total $ 65,115 $ 16,264 $ — $ 81,379 January 1, 2017 to September 30, 2017 January 1, 2016 to December 31, 2016 Transfers Transfers Transfers Transfers Class of securities: Corporate debt securities $ — $ 901 $ — $ 5,737 Foreign corporate debt securities — — — 5,295 Total transfers $ — $ 901 $ — $ 11,032 Amortization Schedule (in thousands) September 30, 2017 unamortized dollar value 4th quarter 2017 $ 103 1st quarter 2018 98 2nd quarter 2018 71 3rd quarter 2018 71 4th quarter 2018 71 1st quarter 2019 66 2nd quarter 2019 36 3rd quarter 2019 36 4th quarter 2019 36 1st quarter 2020 31 Unamortized fair-value - subject to vesting schedule 619 Unamortized fair-value - event dependent 4,343 Total unamortized dollar value 4,962 Number of restricted stock awards outstanding Weighted-average grant date fair value Aggregate fair value (in thousands) Outstanding—January 1, 2016 6,168,035 2.1230 13,095 Restricted stock awards granted during 2016 212,765 2.3500 500 Restricted stock awards released or forfeited during 2016 — — — Outstanding—December 31, 2016 6,380,800 $ 2.1306 $ 13,595 Restricted stock awards granted during 2017 333,332 1.2000 400 Restricted stock awards released or forfeited during 2017 — — — Outstanding—September 30, 2017 6,714,132 $ 2.0844 $ 13,995 Three months ended September 30, 2017 Three months ended September 30, 2016 Nine months ended September 30, 2017 Nine months ended September 30, 2016 Numerator for basic net income (loss) per share: Net income (loss) $ 38,411 $ (16,645 ) $ 34,876 $ 61,314 Less: Series B preferred stock dividends (4,500 ) (4,500 ) (13,500 ) (13,500 ) Less: undistributed earnings attributed to participating securities (basic calculation) (21,541 ) — (13,581 ) (27,625 ) Basic net income (loss) attributable to common stockholders $ 12,370 $ (21,145 ) $ 7,795 $ 20,189 Denominator for basic net income (loss) per share: Weighted-average shares outstanding 206,714,132 206,380,800 206,529,762 206,261,993 Weighted-average unvested restricted shares outstanding (4,053,640 ) (4,039,591 ) (3,956,447 ) (4,014,718 ) Denominator for basic net income (loss) per share 202,660,492 202,341,209 202,573,315 202,247,275 Basic net income (loss) per share attributable to common stockholders $ 0.06 $ (0.10 ) $ 0.04 $ 0.10 Three months ended September 30, 2017 Three months ended September 30, 2016 Nine months ended September 30, 2017 Nine months ended September 30, 2016 Numerator for diluted net income (loss) per share: Net income (loss) $ 38,411 $ (16,645 ) $ 34,876 $ 61,314 Less: Series B preferred stock dividends (4,500 ) (4,500 ) (13,500 ) (13,500 ) Less: undistributed earnings attributed to participating securities (diluted calculation) (21,541 ) — (13,581 ) (26,241 ) Diluted net income (loss) attributable to common stockholders $ 12,370 $ (21,145 ) $ 7,795 $ 21,573 Denominator for diluted net income (loss) per share: Weighted-average shares outstanding 206,714,132 206,380,800 206,529,762 206,261,993 Weighted-average unvested restricted shares outstanding (4,053,640 ) (4,039,591 ) (3,956,447 ) (4,014,718 ) Effect of dilutive potential shares 10,065,629 — 10,065,629 35,327,739 Denominator for diluted net income (loss) per share 212,726,121 202,341,209 212,638,944 237,575,014 Diluted net income (loss) per share attributable to common stockholders $ 0.06 $ (0.10 ) $ 0.04 $ 0.09 Potential dilution to common stock Minimum shares Maximum shares Restricted shares subject to vesting 4,053,640 4,053,640 Series A Preferred Stock 10,065,629 10,065,629 Warrants outstanding 61,400,000 61,400,000 Dilutive shares to be issued if Series B Preferred Stock conversion is below $2.25 — 1,015,872 Series B Preferred Stock 266,666,667 342,857,143 Potential dilutive shares if converted to common stock 342,185,936 419,392,284 (in thousands) Assets Level 1 Level 2 Level 3 September 30, 2017 Derivative embedded conversion feature $ — $ — $ 111,877 $ 111,877 (in thousands) Assets Level 1 Level 2 Level 3 December 31, 2016 Derivative embedded conversion feature $ — $ — $ 80,651 $ 80,651 Derivative asset (liability) embedded conversion feature (in thousands) Balance, January 1, 2016 $ (120,848 ) Unrealized gain on change in fair value 201,499 Balance, December 31, 2016 80,651 Unrealized gain on change in fair value 31,226 Balance, September 30, 2017 $ 111,877 Results of Operations 2019. The Three months ended September 30, 2017 Three months ended September 30, 2016 Percentage change favorable (unfavorable) Dollar value change favorable (unfavorable) Net revenues $ 2,287 $ 1,284 78 % $ 1,003 Underwriting expense (net) 92 258 64 % 166 General and administrative expenses 2,117 1,357 (56 %) (760 ) Loss contract reserve reduction (210 ) (565 ) (63 %) (355 ) Interest expense 579 636 9 % 57 Net operating (loss) (291 ) (402 ) 28 % 111 Other income 123 — N/A 123 Unrealized gain (loss) on change in value of derivative embedded conversion feature 38,579 (16,243 ) 338 % 54,822 Redeemable convertible series B preferred stock dividends (4,500 ) (4,500 ) 0 % — Net income (loss) attributable to common and participating stockholders $ 33,911 $ (21,145 ) 260 % $ 55,056 Nine months ended September 30, 2017 Nine months ended September 30, 2016 Percentage change favorable (unfavorable) Dollar value change favorable (unfavorable) Net revenues $ 5,929 $ 4,173 42 % $ 1,756 Underwriting expenses (net) 344 936 63 % 592 General and administrative expenses 5,915 4,878 (21 %) (1,037 ) Loss contract reserve reduction (5,645 ) (2,362 ) 139 % 3,283 Interest expense 1,788 1,994 10 % 206 Net operating income (loss) 3,527 (1,273 ) 377 % 4,800 Other income 123 — N/A 123 Unrealized gain on change in fair value of derivative liability - embedded conversion feature 31,226 62,587 (50 %) (31,361 ) Redeemable convertible series B preferred stock dividends (13,500 ) (13,500 ) 0 % — Net income attributable to common and participating stockholders $ 21,376 $ 47,814 (55 %) $ (26,438 ) Three months ended September 30, 2017 Three months ended September 30, 2016 Nine months ended September 30, 2017 Nine months ended September 30, 2016 Premiums assumed $ 342 $ 739 $ 866 $ 1,963 Change in unearned premiums 2 47 237 463 Premiums earned $ 344 $ 786 $ 1,103 $ 2,426 Three months ended September 30, 2017 Three months ended September 30, 2016 Nine months ended September 30, 2017 Nine months ended September 30, 2016 Losses and loss adjustment expense $ 48 $ 183 $ 207 $ 702 September 30, 2017 December 31, 2016 Case-basis reserves $ 174 $ 553 IBNR reserves 1 — Premium deficiency reserves 530 258 Total losses and loss adjustment reserves $ 705 $ 811 Nine months ended September 30, 2017 Year ended December 31, 2016 Balance at beginning of period $ 811 $ 5,063 Incurred (released) - prior periods 207 (669 ) Paid or terminated - prior periods (313 ) (3,583 ) Total losses and loss adjustment reserves $ 705 $ 811 Three months ended September 30, 2017 Three months ended September 30, 2016 Nine months ended September 30, 2017 Nine months ended September 30, 2016 Investment income: Amortization of premium or discount on fixed-maturity securities $ (32 ) $ (74 ) $ (108 ) $ (247 ) Investment income on fixed-maturity securities 72 233 403 792 Interest income on cash and cash equivalents 1,895 405 4,527 1,100 Realized net (loss) gain from sale of investments (36 ) 18 (63 ) 19 Unrealized gain (loss) on trading securities held at period end 44 (84 ) 67 83 Net investment income $ 1,943 $ 498 $ 4,826 $ 1,747 June 30, 2020, we were in compliance with our seller/servicer financial requirements for FHFA and Ginnie Mae. Procedures Incorporated by reference Exhibit Number Exhibit Description Form Exhibit Filing Date Filed Herewith 3.1 Amended and Restated Certificate of Incorporation of WMIH Corp. 8-K12G3 3.1 5/13/15 �� 3.2 8-K12G3 3.2 5/13/15 12.1 X 31.1 X 31.2 X 32.1 X 101.INS XBRL Instance Document. X 101.SCH XBRL Taxonomy Extension Schema Document. X 101.CAL XBRL Taxonomy Extension Calculation Linkbase Document. X 101.DEF XBRL Taxonomy Extension Definition Linkbase Document. X 101.LAB XBRL Taxonomy Extension Label Linkbase Document. X 101.PRE XBRL Taxonomy Extension Presentation Linkbase Document. X Jay Bray PART IFINANCIAL INFORMATIONWMIH CORP. AND SUBSIDIARIESCONDENSED Item 1. Financial StatementsMR. COOPER GROUP INC.CONSOLIDATED BALANCE SHEETS(in thousands,millions of dollars, except share data)(Unaudited)June 30, 2020 December 31, 2019 (unaudited) Assets Cash and cash equivalents $ 1,041 $ 329 Restricted cash 260 283 Mortgage servicing rights, $2,757 and $3,496 at fair value, respectively 2,763 3,502 Advances and other receivables, net of reserves of $216 and $175, respectively 668 988 Reverse mortgage interests, net of purchase discount of $127 and $114, respectively 5,709 6,279 Mortgage loans held for sale at fair value 3,179 4,077 Property and equipment, net of accumulated depreciation of $75 and $55, respectively 115 112 Deferred tax assets, net 1,391 1,345 Other assets 2,174 1,390 Total assets $ 17,300 $ 18,305 Liabilities and Stockholders’ Equity Unsecured senior notes, net $ 2,261 $ 2,366 Advance facilities, net 475 422 Warehouse facilities, net 4,031 4,575 Payables and other liabilities 2,460 2,016 MSR related liabilities - nonrecourse at fair value 1,173 1,348 Mortgage servicing liabilities 48 61 Other nonrecourse debt, net 4,707 5,286 Total liabilities 15,155 16,074 Commitments and contingencies (Note 16) Preferred stock at $0.00001 - 10 million shares authorized, 1 million shares issued and outstanding, respectively; aggregate liquidation preference of 10 dollars, respectively — — Common stock at $0.01 par value - 300 million shares authorized, 92.0 million and 91.1 million shares issued, respectively 1 1 Additional paid-in-capital 1,114 1,109 Retained earnings 1,034 1,122 Total Mr. Cooper stockholders’ equity 2,149 2,232 Non-controlling interests (4) (1) Total stockholders’ equity 2,145 2,231 Total liabilities and stockholders’ equity $ 17,300 $ 18,305 TheSee accompanying notes are an integral part ofto the condensed consolidated financial statements.(1)Balances derived from audited financial statements as of December 31, 2016.3CONDENSEDMR. COOPER GROUP INC.UNAUDITED CONSOLIDATED STATEMENTS OF OPERATIONS(in thousands,millions of dollars, except for earnings per share amounts and share data)(Unaudited) Three Months Ended June 30, Six Months Ended June 30, 2020 2019 2020 2019 Revenues: Service related, net $ 12 $ 137 $ (41) $ 221 Net gain on mortgage loans held for sale 618 262 949 428 Total revenues 630 399 908 649 Expenses: Salaries, wages and benefits 248 238 494 453 General and administrative 171 254 369 482 Total expenses 419 492 863 935 Interest income 76 162 194 296 Interest expense (177) (187) (369) (376) Other income, net — 1 1 16 Total other expenses, net (101) (24) (174) (64) Income (loss) before income tax expense (benefit) 110 (117) (129) (350) Less: Income tax expense (benefit) 37 (29) (31) (76) Net income (loss) 73 (88) (98) (274) Less: Net loss attributable to non-controlling interests — (1) (3) (1) Net income (loss) attributable to Mr. Cooper 73 (87) (95) (273) Less: Undistributed earnings attributable to participating stockholders 1 — — — Net income (loss) attributable to common stockholders $ 72 $ (87) $ (95) $ (273) Net income (loss) per common share attributable to Mr. Cooper: Basic $ 0.78 $ (0.96) $ (1.04) $ (3.00) Diluted $ 0.77 $ (0.96) $ (1.04) $ (3.00) TheSee accompanying notes are an integral part ofto the condensed consolidated financial statements.4CONDENSEDMR. COOPER GROUP INC.UNAUDITED CONSOLIDATED STATEMENTS OF CHANGES IN REDEEMABLE CONVERTIBLEPREFERRED STOCK AND STOCKHOLDERS’ EQUITY(in thousands,millions of dollars, except share amounts)(Unaudited)Preferred Stock Common Stock Shares
(in thousands)Amount Shares
(in thousands)Amount Additional Paid-in Capital Retained Earnings Total Mr. Cooper Stockholders’ Equity Non-controlling Interests Total
EquityBalance at March 31, 2019 1,000 $ — 91,042 $ 1 $ 1,095 $ 662 $ 1,758 $ 3 $ 1,761 Shares issued under incentive compensation plan — — 19 — — — — — — Share-based compensation — — — — 5 — 5 — 5 Net loss — — — — — (87) (87) (1) (88) Balance at June 30, 2019 1,000 $ — 91,061 $ 1 $ 1,100 $ 575 $ 1,676 $ 2 $ 1,678 Balance at March 31, 2020 1,000 $ — 91,970 $ 1 $ 1,108 $ 961 $ 2,070 $ (4) $ 2,066 Shares issued under incentive compensation plan — — 52 — — — — — — Share-based compensation — — — — 6 — 6 — 6 Net income — — — — — 73 73 — 73 Balance at June 30, 2020 1,000 $ — 92,022 $ 1 $ 1,114 $ 1,034 $ 2,149 $ (4) $ 2,145 TheSee accompanying notes are an integral part ofto the condensed consolidated financial statements.5CONDENSEDMR. COOPER GROUP INC.UNAUDITED CONSOLIDATED STATEMENTS OF STOCKHOLDERS’ EQUITY(millions of dollars, except share data)Preferred Stock Common Stock Shares
(in thousands)Amount Shares
(in thousands)Amount Additional Paid-in Capital Retained Earnings Total Mr. Cooper Stockholders’ Equity Non-controlling Interests Total
EquityBalance at January 1, 2019 1,000 $ — 90,821 $ 1 $ 1,093 $ 848 $ 1,942 $ 3 $ 1,945 Shares issued / (surrendered) under incentive compensation plan — — 240 — (2) — (2) — (2) Share-based compensation — — — — 9 — 9 — 9 Net loss — — — — — (273) (273) (1) (274) Balance at June 30, 2019 1,000 $ — 91,061 $ 1 $ 1,100 $ 575 $ 1,676 $ 2 $ 1,678 Balance at January 1, 2020 1,000 $ — 91,118 $ 1 $ 1,109 $ 1,122 $ 2,232 $ (1) $ 2,231 Shares issued / (surrendered) under incentive compensation plan — — 904 — (5) — (5) — (5) Share-based compensation — — — — 10 — 10 — 10 Cumulative effect adjustments pursuant to the adoption of ASU 2016-13 — — — — — 7 7 — 7 Net loss — — — — — (95) (95) (3) (98) Balance at June 30, 2020 1,000 $ — 92,022 $ 1 $ 1,114 $ 1,034 $ 2,149 $ (4) $ 2,145 See accompanying notes to the consolidated financial statements (unaudited).6MR. COOPER GROUP INC.UNAUDITED CONSOLIDATED STATEMENTS OF CASH FLOWS(in thousands)(Unaudited)Six Months Ended June 30, 2020 2019 Operating Activities Net loss $ (98) $ (274) Adjustments to reconcile net loss to net cash attributable to operating activities: Deferred tax benefit (49) (76) Net gain on mortgage loans held for sale (949) (428) Interest income on reverse mortgage loans (117) (167) Provision for servicing and non-servicing reserves 11 30 Fair value changes and amortization/accretion of mortgage servicing rights/liabilities 999 695 Fair value changes in excess spread financing (101) (74) Fair value changes in mortgage servicing rights financing liability 12 11 Fair value changes in mortgage loans held for investment — (3) Amortization of premiums, net of discount accretion 34 (25) Depreciation and amortization for property and equipment and intangible assets 37 45 Share-based compensation 10 9 Other loss 8 — Repurchases of forward loan assets out of Ginnie Mae securitizations (2,092) (715) Mortgage loans originated and purchased for sale, net of fees (23,110) (15,727) Sales proceeds and loan payment proceeds for mortgage loans held for sale and held for investment 26,606 15,429 Changes in assets and liabilities: Advances and other receivables 313 249 Reverse mortgage interests 751 1,056 Other assets (616) (118) Payables and other liabilities 417 31 Net cash attributable to operating activities 2,066 (52) Investing Activities Acquisitions, net of cash acquired — (85) Property and equipment additions, net of disposals (26) (27) Purchase of forward mortgage servicing rights, net of liabilities incurred (31) (409) Proceeds on sale of forward and reverse mortgage servicing rights 43 279 Net cash attributable to investing activities (14) (242) TheContinued on following page. See accompanying notes are an integral partto the consolidated financial statements (unaudited).7MR. COOPER GROUP INC.UNAUDITED CONSOLIDATED STATEMENTS OF CASH FLOWS(Continued)(millions of dollars)Six Months Ended June 30, 2020 2019 Financing Activities (Decrease) increase in warehouse facilities (544) 1,173 Increase (decrease) in advance facilities 58 (40) Repayment of notes payable — (294) Proceeds from HECM securitizations — 398 Proceeds from sale of HECM securitizations — 20 Repayment of HECM securitizations (168) (434) Proceeds from issuance of participating interest financing in reverse mortgage interests 99 156 Repayment of participating interest financing in reverse mortgage interests (598) (1,004) Proceeds from the issuance of excess spread financing 24 437 Settlements and repayments of excess spread financing (110) (119) Issuance of unsecured senior debt 600 — Repayment of nonrecourse debt – legacy assets — (6) Redemption and repayment of unsecured senior notes (698) — Repayment of finance lease liability (1) (2) Surrender of shares relating to stock vesting (5) (2) Debt financing costs (20) (1) Net cash attributable to financing activities (1,363) 282 Net increase (decrease) in cash, cash equivalents, and restricted cash 689 (12) Cash, cash equivalents, and restricted cash - beginning of period 612 561 Cash, cash equivalents, and restricted cash - end of period(1)$ 1,301 $ 549 Supplemental Disclosures of Cash Activities Cash paid for interest expense $ 89 $ 74 Net cash paid (refunded) for income taxes $ 3 $ (1) (1)The following table provides a reconciliation of cash, cash equivalents and restricted cash to amount reported within the consolidated balance sheets.June 30, 2020 June 30, 2019 Cash and cash equivalents $ 1,041 $ 245 Restricted cash 260 304 Total cash, cash equivalents, and restricted cash $ 1,301 $ 549 See accompanying notes to the consolidated financial statements (unaudited).8MR COOPER GROUP INC.NOTES TO CONSOLIDATED FINANCIAL STATEMENTS (UNAUDITED)(millions of dollars, unless otherwise stated)1. Nature of Business and Basis of PresentationNature of BusinessMr. Cooper Group Inc., collectively with its consolidated subsidiaries, (“Mr. Cooper”, the “Company”, “we”, “us” or “our”) provides servicing, origination and transaction-based services related to single family residences throughout the United States with operations under its primary brands: Mr. Cooper® and Xome®. Mr. Cooper is one of the condensed consolidated financial statements.6NOTES TO CONDENSED CONSOLIDATED FINANCIAL STATEMENTS(Unaudited)Unless otherwise indicated, financial information, including dollar values statedlargest home loan originators and servicers in the textcountry focused on delivering a variety of the notesservicing and lending products, services and technologies. Xome provides real estate services including real estate brokerage, title, closing, valuation and field services to financial statements,lenders, investors and consumers. The Company’s corporate website is expressed in thousands.References herein, unless the context requires otherwise, to (i) the terms “Company,” “we,” “us” or “our” generally are intended to refer to WMIH Corp. (formerly WMI Holdings Corp.) and its subsidiaries on a consolidated basis; (ii) “WMIH” refers only to WMIH Corp. without regard to its subsidiaries; (iii) “WMIHC” refers only to WMI Holdings Corp. without regard to its subsidiaries; (iv) “WMMRC” means WM Mortgage Reinsurance Company, Inc. (a wholly-owned subsidiary of WMIH); and (v) “WMIIC” means WMI Investment Corp. (a wholly-owned subsidiary of WMIH)located at Note 1: The Company has provided a glossary of terms, which defines certain industry-specific and its SubsidiariesWMIH Corp.Mr. Cooper, which was previously known as WMIH Corp. (“WMIH”), is a corporation duly organized and existing under the laws of the Statestate of Delaware. OnDelaware since May 11, 2015, WMIH merged with its parent corporation, WMI Holdings Corp., a Washington corporation2015. On July 31, 2018, Wand Merger Corporation (“WMIHC”Merger Sub”), with WMIH as the surviving corporation in the merger (the “Merger”). The Merger occurred as part of the reincorporation of WMIHC from the State of Washington to the State of Delaware effective May 11, 2015 (the “Reincorporation Date”).WMIH, formerly known as WMIHC and Washington Mutual, Inc. (“WMI”), is the direct parent of WM Mortgage Reinsurance Company, Inc., a Hawaii corporation (“WMMRC”), and WMI Investment Corp., a Delaware corporation (“WMIIC”). Since the emergence from bankruptcy on March 19, 2012, our business activities consist of operating WMMRC’s legacy reinsurance business in runoff mode. In addition, we are actively seeking acquisition opportunities across a broad array of industries with a specific focus in the financial services industry, including targets with consumer finance, specialty finance, leasing and insurance operations.As of September 30, 2017, WMIH was authorized to issue up to 3,500,000,000 shares of common stock, and up to 10,000,000 shares of preferred stock (in one or more series), in each case with a par value of $0.00001 per share. As of September 30, 2017 and December 31, 2016, 206,714,132 and 206,380,800 shares, respectively, of WMIH’s common stock were issued and outstanding. As of September 30, 2017 and December 31, 2016, 1,000,000 shares of WMIH’s Series A Convertible Preferred Stock (the “Series A Preferred Stock”) were issued and outstanding. As of September 30, 2017 and December 31, 2016, 600,000 shares of WMIH’s 3% Series B Convertible Preferred Stock (the “Series B Preferred Stock”) were issued and outstanding.While we remain committed to consummating an acquisition, we also are mindful that the Company’s Series B Preferred Stock is redeemable on January 5, 2018 if we have not consummated a Qualified Acquisition, as more fully described in Note 6: Service Agreements and Related Party Transactions, or executed a definitive agreement to consummate an Acquisition (as such term is defined in Article VI of WMIH’s Amended and Restated Certificate of Incorporation (the “Certificate of Incorporation”)), prior to that date. Accordingly, as previously disclosed, we formed the Finance Committee of the Company’s Board of Directors (the “Finance Committee”), comprised solely of independent directors, to explore potential financing and refinancing alternatives, including the potential restructuring or refinancing of the Series B Preferred Stock. The Finance Committee has retained financial advisors to provide certain financial advisory services in connection with the Finance Committee’s mandate to review the Company’s capital structure and potential financing alternatives. There can be no assurance that any transaction, including a refinancing of the Series B Preferred Stock, will occur or if so on what terms.WMMRCWMMRC is a wholly-owned subsidiary of WMIH. Prior to August 2008 (at which time WMMRC became a direct subsidiary of WMI)WMIH merged with and into Nationstar Mortgage Holdings Inc. (“Nationstar”), WMMRC waswith Nationstar continuing as a wholly-owned subsidiary of FA Out-of-State Holdings, Inc., a second-tier subsidiary of Washington Mutual Bank (“WMB”) and third-tier subsidiary of WMI. WMMRC is a pure captive insurance company domiciled in the State of Hawaii. WMMRC was incorporated on February 25, 2000, and received a Certificate of Authority, dated March 2, 2000, from the Insurance Division of the State of Hawaii.WMMRC was originally organized to reinsure private mortgage insurance risk for seven primary mortgage insurers then offering private mortgage insurance on loans originated or purchased by former subsidiaries of WMI. The seven primary mortgage insurers are United Guaranty Residential Insurance Company (“UGRIC”), Genworth Mortgage Insurance Corporation (“GMIC”), Mortgage Guaranty Insurance Corporation (“MGIC”), PMI Mortgage Insurance Company (“PMI”), Radian Guaranty Incorporated (“Radian”), Republic Mortgage Insurance Company (“RMIC”) and Triad Guaranty Insurance Company (“Triad”WMIH (the “Merger”).7Due Prior to the then deteriorating performanceMerger, WMIH had limited operations other than its reinsurance business that operated in the mortgage guarantee markets and the closure and receivership of WMB, the reinsurance agreements with each of the primary mortgage insurers were terminated or placed into runoff during 2008. The agreements with UGRIC and Triad were placed into runoff effective May 31, 2008. The agreements with all other primary mortgage insurers were placed into runoff effective September 26, 2008.mode. As a result effective September 26, 2008, WMMRC’s continuing operations consisted solely of the runoffMerger, shares of coverage associatedNationstar common stock were delisted from the New York Stock Exchange. Following the Merger closing, the combined company traded on NASDAQ under the ticker symbol “WMIH” until October 10, 2018, when WMIH changed its name to “Mr. Cooper Group Inc.” and its ticker symbol to “COOP”.Basis of PresentationThe consolidated interim financial statements of the Company have been prepared in accordance with mortgages placed with the primary mortgage carriers prior to September 26, 2008. In runoff, an insurerU.S. generally writes no new business but continues to service its obligations under in force policiesaccepted accounting principles (“GAAP”) for interim financial information and otherwise continues as a licensed insurer. The reinsurance agreements with Triad, PMI and UGRIC were commuted on August 31, 2009, October 2, 2012 and April 3, 2014, respectively, and the related trust assets were distributed in accordance with the commutation agreements. On October 23, 2017,instructions to Form 10-Q and Article 10 of Regulation S-X as promulgated by the reinsurance agreement with Radian was commuted and the related trust assets were released to WMMRC. On September 13, 2017, the Insurance Division of the State of Hawaii approved this commutation and a related distribution of up to $10.7 million to WMIH, which distribution has not been completed as of the date of the filing of this Form 10-Q. For more information see Note 14: Subsequent Events. As a result, WMMRC’s current continuing operations, subsequent to the Radian commutation, consist solely of the runoff of coverage associated with mortgages placed with the following three remaining carriers, GMIC, MGIC and RMIC.WMIICWMIIC does not currently have any operations and is fully eliminated upon consolidation.Note 2: Significant Accounting PoliciesBasis of PresentationWMIH resumed timely filing of all periodic reports for a reporting company under the Exchange Act for all periods after emergence from bankruptcy on March 19, 2012 (the “Effective Date”). The accompanying unaudited condensed consolidated financial statements have been prepared pursuant to the rules and regulations of the Securities and Exchange Commission (“SEC”) for quarterly reporting. Certain information and footnote disclosures normally included inSEC. Accordingly, the financial statements do not include all of the information and prepared in accordance with generally accepted accounting principles in the United States of America (“GAAP”) have been condensed or omitted pursuant to such rules and regulations; however, the Company believes that the disclosures included are appropriate. The condensed consolidated balance sheet as of December 31, 2016, included herein, was derived from the audited consolidatedfootnotes required by GAAP for complete financial statements as of that date.These interim unaudited condensed consolidated financial statements and notes thereto should be read in conjunction with the Company’s audited consolidated financial statements and notes thereto filedincluded in the Company’s Annual ReportReports on Form 10-K filed withfor the SEC on March 14, 2017. Interim information presented in the unaudited condensedyear ended December 31, 2019.The interim consolidated financial statements has been prepared by management. Inare unaudited; however, in the opinion of management, the financial statements include all adjustments, consisting of normal recurring items, considered necessary for a fair presentation and that all such adjustments are of a normal, recurring nature and necessary for the fair statement of the results of the interim periods have been included. Dollar amounts are reported in millions, except per share data and other key metrics, unless otherwise noted.The Company evaluated subsequent events through the date these interim consolidated financial position,statements were issued.Basis of ConsolidationThe consolidated financial statements include the accounts of the Company, its wholly-owned subsidiaries, other entities in which the Company has a controlling financial interest and those variable interest entities (“VIE”) where the Company’s wholly-owned subsidiaries are the primary beneficiaries. Assets and liabilities of VIEs and their respective results of operations are consolidated from the date that the Company became the primary beneficiary through the date the Company ceases to be the primary beneficiary. The Company applies the equity method of accounting to investments where it is able to exercise significant influence, but not control, over the policies and cash flows for the periods presented in accordance with GAAP. The results of operations for the nine months ended September 30, 2017 are not necessarily indicativeprocedures of the results to be expectedentity and owns less than 50% of the voting interests. Investments in certain companies over which the Company does not exert significant influence are accounted for the full year ending December 31, 2017.All significant intercompanyas cost method investments. Intercompany balances and transactions and balanceson consolidated entities have been eliminatedeliminated. Business combinations are included in preparing the condensed consolidated financial statements.Use of EstimatesThe preparation of the consolidated financial statements in conformity with GAAP requires management to make estimates and assumptions that affect the amounts reported amounts of assetsin the consolidated financial statements and liabilities and disclosure of contingent assets and liabilities at the date of the financial statements. Management has made significant estimates in certain areas, including valuing certain financial instruments, other assets and liabilities, the determination of the contingent risk liabilities, and in determining appropriate insurance reserves.accompanying notes. Actual results could differ substantially from those estimates.8Fair Valuethese estimates due to factors such as adverse changes in the economy, changes in interest rates, secondary market pricing for loans held for sale and derivatives, strength of Certainunderwriting and servicing practices, changes in prepayment assumptions, declines in home prices or discrete events adversely affecting specific borrowers, uncertainties in the economy from the COVID-19 pandemic, and such differences could be material.9Recent Accounting Guidance AdoptedAccounting Standards Update No. 2016-13, Financial InstrumentsFair value - Credit Losses (Topic 326), (“ASU 2016-13”) requires expected credit losses for financial instruments held at the reporting date to be measured based on historical experience, current conditions and reasonable and supportable forecasts, which is definedreferred to as the price that would be received to sellcurrent expected credit loss (“CECL”) methodology. The update eliminates the initial recognition of credit losses on an asset or paid to transfer a liabilityincurred basis in current GAAP and instead reflects an orderly transaction between market participants atentity’s current estimate of all expected credit losses over the measurement date. Generally,life of the asset. Previously, when credit losses were measured under GAAP, an entity generally only considered past events and current conditions in measuring the incurred loss. The new standard will reflect management’s best estimate of all expected credit losses for the Company’s financial assets that are recognized at amortized cost. The guidance was effective for the Company as of January 1, 2020, with a cumulative-effect adjustment to retained earnings as of that date.Based upon management’s scoping analysis, the Company determined that reverse mortgage interests, net of reserves, advances and other receivables, net of reserves, and certain financial instruments included in other assets are within the scope of ASU 2016-13. Certain financial instruments within these respective line items have been determined to have limited expected credit-related losses due to the contractual servicing agreements with agencies and loan product guarantees. For advances and other receivables, net, the Company determined that the majority of estimated losses are due to servicing operational errors and credit-related losses are not significant because of the contractual relationships with the agencies. For reverse mortgage interests the Company determined that the guarantee from Federal Housing Administration (“FHA”) on Home Equity Conversion Mortgage (“HECM“) loan products limits credit-related losses to an immaterial amount with substantially all losses related to servicing operational errors. For other assets, primarily trade receivables, the Company determined that these are short-term in nature (less than one year), and the estimated credit-related losses over the life of these receivables are similar to those resulting from the Company’s existing loss reserve process. For each of the aforementioned financial instruments carried at amortized cost, the Company enhanced its processes to consider and include the requirements of ASU 2016-13, as applicable, into the determination of credit-related losses.On January 1, 2020, the Company adopted ASU 2016-13 using the modified retrospective method for the above-mentioned financial assets. Results for reporting periods after January 1, 2020 are presented under ASU 2016-13 while prior period amounts continue to be reported in accordance with previously applicable GAAP. The Company recorded transition adjustments aggregating to a net increase of $9, or $7 after tax, to retained earnings and a reduction of $7 to the advances and other receivables reserve and a $2 reduction in the other assets reserves, as of January 1, 2020 for the cumulative effect of adopting ASU 2016-13.In connection with adoption of ASU 2016-13, the Company updated its accounting policies as follows:For certain financial instruments included in advances and other receivables, net, and certain trade receivables and accrued revenues included in other assets that within the scope of ASU 2016-13, the reserve methodology was revised to consider CECL losses. The revised CECL methodology considers expected lifetime loss rates calculated from historical data using a weighted average life to determine the current expected credit loss required. Due to the nature of the financial instrument, reverse mortgage interests, net of reserves, and advances and other receivables had limited impact from the adoption of CECL to the reserve methodology. See Note 4, Advances and Other Receivables, Net, Note 5, Reverse Mortgage Interests, Net, and Note 7, Other Assets, for additional information.Factors that influenced management’s current estimate of expected credit losses for certain advances and other receivables and certain trade receivables and accrued revenues included the following: historical collection and loss rates, passage of time, weighted average life of receivables, and various qualitative factors including current economic conditions.Factors that influenced management’s current estimate of expected credit related losses for certain reverse mortgage interests included the following: historical collection and loss rates, foreclosure timelines, and values of underlying collateral.Accounting Standards Update No. 2018-13, Fair Value Measurement (Topic 820)- Changes to the Disclosure Requirements for Fair Value Measurement, (“ASU 2018-13”) removes the requirement to disclose the amount of and reasons for transfers between Level 1 and Level 2 fair value measurement methodologies, the policy for timing of transfers between levels and the valuation processes for Level 3 fair value measurements. It also adds a requirement to disclose changes in unrealized gains and losses for the period included in other comprehensive income for recurring Level 3 fair value measurements held at the end of the reporting period and the range and weighted average of significant unobservable inputs used to develop Level 3 measurements. For certain unobservable inputs, entities may disclose other quantitative information in lieu of the weighted average if the other quantitative information would be a more reasonable and rational method to reflect the distribution of unobservable inputs used to develop Level 3 fair value measurements. The Company adopted ASU 2018-13 on January 1, 2020. The guidance does not have a material impact to the disclosures currently provided by the Company.102. AcquisitionsAcquisition of Pacific Union Financial, LLCOn February 1, 2019, the Company completed the acquisition of all the limited liability units of Pacific Union Financial, LLC (“Pacific Union”), a California limited liability company. Pacific Union was a privately held company that was engaged in the origination, as well as servicing of residential mortgage loans, and operated throughout the United States. The acquisition allows the Company to expand its servicing portfolio and increase its mortgage lending volume and capabilities.The acquisition has been accounted for in accordance with Accounting Standards Codification 805, Business Combinations, using the acquisition method of accounting. Under the acquisition method of accounting, the Company allocated the purchase price of the acquisition to identifiable assets acquired and liabilities assumed based on their estimated fair values as of the acquisition date. The determination of fair value estimates requires management to make certain estimates about discount rates, future expected cash flows, market conditions, and other future events that are highly subjective in nature and may require adjustments. The final purchase price was $116, paid in cash. Based on the allocation of fair value, goodwill of $40 was recorded, which represents the excess of the purchase price over the estimated fair value of tangible and intangible assets acquired, net of the liabilities assumed. The goodwill is primarily attributable to the assembled workforce and synergies with the Company’s current operations. $28 and $12 of the goodwill is assigned to the Originations and Servicing segments, respectively, based on expected cash flows, and is expected to be deductible for tax purposes.Final Estimated Fair Value of Net Assets Acquired: Cash and cash equivalents $ 37 Restricted cash 2 Mortgage servicing rights 271 Advances and other receivables 84 Mortgage loans held for sale 536 Mortgage loans held for investment 1 Property and equipment 8 Other assets 483 Fair value of assets acquired 1,422 Notes payable(1)294 Advance facilities 13 Warehouse facilities 393 Payables and other liabilities 530 Other nonrecourse debt 129 Fair value of liabilities assumed 1,359 Total fair value of net tangible assets acquired 63 Intangible assets: Customer relationships(2)13 Goodwill 40 Final purchase price $ 116 (1)Notes payable was subsequently paid off in February 2019 after the consummation of the acquisition.(2)The estimated fair values for customer relationships were measured using the excess earnings method and were determined to have a remaining useful life of 10 years.The Company incurred total acquisition costs of $2 during the three months ended June 30, 2019, of which $1 is included in salaries, wages and benefits expense and $1 in general and administrative expense in the Company’s consolidated statements of operations. The Company incurred total acquisition costs of $4 during the six months ended June 30, 2019, of which $2 is included in salaries, wages and benefits expense and $2 in general and administrative expense in the Company’s consolidated statements of operations. The acquisition costs were primarily related to legal, accounting and consulting services. There were 0 acquisition costs incurred by the Company during the six months ended June 30, 2020.11For the three and six months ended June 30, 2019, the operations contributed by this acquisition generated total revenues of $79 and $118 and income before income tax of $36 and $50, respectively, which are reported in the Company’s consolidated statements of operations.The following unaudited pro forma financial information presents the combined results of operations for the three and six months ended June 30, 2019, as if the acquisition had occurred on January 1, 2019:Three Months Ended June 30, 2019 Six Months Ended June 30, 2019 Pro forma financial information (unaudited) (unaudited) Pro forma total revenues $ 399 $ 668 Pro forma net loss $ (87) $ (271) 3. Mortgage Servicing Rights and Related LiabilitiesThe following table sets forth the carrying value of the Company’s mortgage servicing rights (“MSRs”) and the related liabilities. In estimating the fair value of all servicing rights and related liabilities, the impact of the COVID-19 pandemic was considered in the determination of key assumptions.MSRs and Related Liabilities June 30, 2020 December 31, 2019 Forward MSRs - fair value $ 2,757 $ 3,496 Reverse MSRs - amortized cost 6 6 Mortgage servicing rights $ 2,763 $ 3,502 Mortgage servicing liabilities - amortized cost $ 48 $ 61 Excess spread financing - fair value $ 1,124 $ 1,311 Mortgage servicing rights financing - fair value 49 37 MSR related liabilities - nonrecourse at fair value $ 1,173 $ 1,348 Mortgage Servicing RightsThe Company owns and records at fair value the rights to service traditional residential mortgage (“forward”) loans for others, either as a result of purchase transactions or from the retained servicing associated with the sales and securitizations of loans originated. MSRs are comprised of servicing rights of both agency and non-agency loans.12The following table sets forth the activities of forward MSRs:Six Months Ended June 30, Forward MSRs - Fair Value 2020 2019 Fair value - beginning of period $ 3,496 $ 3,665 Additions: Servicing retained from mortgage loans sold 249 169 Purchases of servicing rights(1)24 689 Dispositions: Sales of servicing assets — (294) Changes in fair value: Changes in valuation inputs or assumptions used in the valuation model (717) (542) Other changes in fair value (295) (182) Fair value - end of period $ 2,757 $ 3,505 (1)Purchases of servicing rights during the six months ended June 30, 2019 includes $271 of mortgage servicing rights that were acquired from Pacific Union. See Note 2, Acquisitions, for further discussion. In addition, in January 2019, the Company uses quoted market pricesentered into a subservicing contract for $24 billion in mortgages, which were subsequently purchased in May 2019, resulting in additional $253 servicing rights in the second quarter of 2019.From time to time, the Company sells its ownership interest in certain MSRs and is retained as the subservicer for the sold assets. The Company has evaluated the sale accounting requirements related to these transactions, including the Company’s continued involvement as the subservicer, and concluded that these transactions qualify for sale accounting treatment. During the six months ended June 30, 2020 and 2019, the Company sold $71 and $22,932 in unpaid principal balance (“UPB”) of forward MSRs, of which NaN and $20,560 were retained by the Company as subservicer, respectively.MSRs measured at fair value are primarily segregated between credit sensitive and interest sensitive pools (referred to herein as “acquisition pools”). Credit sensitive pools are primarily impacted by borrower performance under specified repayment terms, which most directly impacts involuntary prepayments and delinquency rates. Interest sensitive pools are primarily impacted by changes in forecasted interest rates, which in turn impact voluntary prepayment speeds. The Company assesses whether acquired portfolios are more credit sensitive or valuation modelsinterest sensitive in nature on the date of acquisition, and no subsequent changes are made. Numerous factors are considered in making this assessment, including loan-to-value ratios, FICO scores, percentage of portfolio previously modified, portfolio seasoning and similar criteria.Credit sensitive portfolios generally consist of higher delinquency, single-family non-conforming residential forward mortgage loans serviced for agency and non-agency investors. Due to estimate theirthe Company’s focus on recapture and modifications, significant amounts of the credit sensitive portfolio have been re-underwritten and, therefore, behave more like the interest sensitive portfolio. Interest sensitive portfolios generally consist of lower delinquency, single-family conforming residential forward mortgage loans for agency investors.MSRs measured at fair value. These models incorporate inputsvalue are also segregated between investor type into agency and non-agency pools (referred to herein as “investor pools”) based upon contractual servicing agreements with investors at the respective balance sheet date to evaluate the MSR portfolio and fair value of the portfolio.13The following table provides a breakdown of UPB and fair value for the Company’s forward MSRs:June 30, 2020 December 31, 2019 Forward MSRs - UPB and fair value breakdown UPB Fair Value UPB Fair Value Acquisition Pools Credit sensitive $ 131,105 $ 1,307 $ 147,895 $ 1,613 Interest sensitive 146,870 1,450 148,887 1,883 Total $ 277,975 $ 2,757 $ 296,782 $ 3,496 Investor Pools Agency(1)$ 228,680 $ 2,308 $ 240,688 $ 2,944 Non-agency(2)49,295 449 56,094 552 Total $ 277,975 $ 2,757 $ 296,782 $ 3,496 (1)Agency investors primarily consist of government sponsored enterprises (“GSE”), such as forward yield curves, market volatilitiesthe Federal National Mortgage Association (“Fannie Mae” or “FNMA”) and pricing spreads, utilizing market-basedthe Federal Home Loan Mortgage Corp (“Freddie Mac” or “FHLMC”), and the Government National Mortgage Association (“Ginnie Mae” or “GNMA”).(2)Non-agency investors consist of investors in private-label securitizations.The Company used the following key weighted-average inputs where readily available. The degree of management judgment involvedand assumptions in estimating the fair value of forward MSRs:Forward MSRs - Key inputs and assumptions June 30, 2020 December 31, 2019 Total MSR Portfolio Discount rate 9.5 % 9.7 % Prepayment speeds 14.2 % 13.1 % Average life 5.3 years 5.8 years Acquisition Pools: Credit Sensitive Discount rate 9.9 % 10.4 % Prepayment speeds 12.6 % 12.7 % Average life 5.6 years 6.0 years Interest Sensitive Discount rate 9.0 % 9.1 % Prepayment speeds 15.8 % 13.5 % Average life 4.9 years 5.7 years Investor Pools: Agency Discount rate 8.9 % 9.0 % Prepayment speeds 14.4 % 13.0 % Average life 5.2 years 5.8 years Non-agency Discount rate 12.0 % 12.6 % Prepayment speeds 13.4 % 13.8 % Average life 5.6 years 6.2 years 14The following table shows the hypothetical effect on the fair value of the Company’s forward MSRs when applying certain unfavorable variations of key assumptions to these assets for the dates indicated:Discount Rate Total Prepayment Speeds Forward MSRs - Hypothetical Sensitivities 100 bpsAdverseChange200 bpsAdverseChange10%AdverseChange20%AdverseChangeJune 30, 2020 Mortgage servicing rights $ (104) $ (201) $ (175) $ (335) December 31, 2019 Mortgage servicing rights $ (127) $ (245) $ (165) $ (317) These hypothetical sensitivities should be evaluated with care. The effect on fair value of a financial instrument or10% adverse change in assumptions generally cannot be determined because the relationship of the change in assumptions to the fair value may not be linear. Additionally, the impact of a variation in a particular assumption on the fair value is calculated while holding other asset is dependent uponassumptions constant. In reality, changes in one factor may lead to changes in other factors, which could impact the availabilityabove hypothetical effects.Reverse Mortgage Servicing Rights and Liabilities - Amortized CostThe Company services certain HECM reverse mortgage loans with an unpaid principal balance of quoted market prices or observable market inputs. For financial instruments that are actively traded$20,758 and $22,725 as of June 30, 2020 and December 31, 2019, respectively. The following table sets forth the activities of reverse MSRs and mortgage servicing liabilities (“MSL”):Six Months Ended June 30, 2020 2019 Reverse MSRs and Liabilities - Amortized Cost Assets Liabilities Assets Liabilities Balance - beginning of period $ 6 $ 61 $ 11 $ 71 Amortization/accretion — (13) (1) (28) Adjustments(1)— — (4) 37 Balance - end of the period $ 6 $ 48 $ 6 $ 80 Fair value - end of period $ 6 $ 12 $ 7 $ 44 (1)Reverse MSR and MSL net adjustments recorded by the Company during the six months ended June 30, 2019 primarily relate to the fair value adjustments for reverse MSR and MSL assumed from the Merger resulting from the revised cost to service assumption used in the marketplacevaluation of reverse MSR and MSL during the measurement period.Management evaluates reverse MSRs and MSLs each reporting period for impairment. Based on management’s assessment at June 30, 2020, 0 impairment or whose values are basedincreased obligation was needed.Excess Spread Financing - Fair ValueIn order to finance the acquisition of certain MSRs on readily available market value data, little judgment is necessary when estimatingvarious Portfolios, the instrument’s fair value. When observable market pricesCompany has entered into sale and data are not readily available, significant management judgment often is necessaryassignment agreements with third parties and sold to estimate fair value. In those cases, different assumptions could result in significant changes in valuation.The Company classifies fixed-maturity investments as trading securities, which are recorded at fair value. As such, changes in unrealized gains and losses on investments held atthese entities the balance sheet date are recognized and reported asright to receive a componentspecified percentage of net investment income on the condensed consolidated statement of operations. The Company believes fair value provides better matching of investment earnings to potentialexcess cash flow generated from the investmentportfolios in excess of a fixed base servicing fee per loan. The Company retains all the base servicing fee, ancillary income and interest float earnings on principal along with interest payments and escrows, and also incurs costs to service the specified pool. The Company is the legal owner and the servicer of the portfolios and provides all servicing and advancing functions.In connection with the above transactions, the Company entered into recapture agreement obligations with third parties that require the Company to transfer the new loan or a replacement loan of similar economic characteristics into the respective portfolio if the Company recaptures any loan in the portfolio. The new or replacement loan will be governed by the same terms set forth in the sale and reduces subjectivity related to evaluating other-than-temporary impairmentassignment agreement described above. Accordingly, a recapture assumption is included within excess spread valuation.15The Company used the following weighted-average assumptions in the Company’s valuation of excess spread financing:Excess Spread Financing Assumptions June 30, 2020 December 31, 2019 Discount rate 12.0 % 11.6 % Prepayment speeds 13.4 % 12.6 % Recapture rate 18.7 % 20.1 % Average life 5.4 years 5.8 years The following table shows the hypothetical effect on the Company’s investment portfolio.Discount Rate Prepayment Speeds Excess Spread Financing - Hypothetical Sensitivities 100 bpsAdverseChange200 bpsAdverseChange10%AdverseChange20%AdverseChangeJune 30, 2020 Excess spread financing $ 38 $ 78 $ 47 $ 97 December 31, 2019 Excess spread financing $ 46 $ 95 $ 46 $ 96 These hypothetical sensitivities should be evaluated with care. The carryingeffect on fair value of cash and cash equivalents, restricted cash, accounts payable and accrued liabilities approximate their respective fair valuesa 10% variation in assumptions generally cannot be determined because of their short-term nature.The carrying valuethe relationship of the loss contract reserve approximates itschange in assumptions to the fair value andmay not be linear. Additionally, the impact of a variation in a particular assumption on the fair value is based on valuation methodologies using discounted cash flows at interest ratescalculated while holding other assumptions constant. In reality, changes in one factor may lead to changes in other factors, which approximatecould impact the Company’s weighted-average cost of capital.Theabove hypothetical effects. Also, a positive change in the above assumptions would not necessarily correlate with the corresponding decrease in the net carrying valueamount of the derivative embedded conversion feature of the Series B Preferred Stock is adjusted to itsexcess spread financing. Excess spread financing’s cash flow assumptions that are utilized in determining fair value as determined using Level 3 inputs described below under fair value measurement. The carrying value of notes payable approximates fair value based on time to maturity, underlying collateral, and prevailing interest rates.Fair Value MeasurementThe Company’s estimates of fair value for financial assets and financial liabilities are based on the framework establishedrelated cash flow assumptions used in the Financial Accounting Standards Boardfinanced MSRs. Any fair value change recognized in the financed MSRs attributable to related cash flows assumptions would inherently have an inverse impact on the carrying amount of the related excess spread financing.Mortgage Servicing Rights Financing - Fair Value MeasurementsFrom December 2013 through June 2014, the Company entered into agreements to sell a contractually specified base servicing fee component of certain MSRs and Disclosuresservicing advances under specified terms to a joint venture capitalized by third-party investors. The purpose of this transaction was to facilitate the financing of advances for private label mortgages. The Company continues to be the named servicer, and, for accounting guidance.purposes, ownership of the MSR resides with the Company. Accordingly, the Company records the MSR and an MSR financing liability associated with this transaction in the consolidated balance sheets. The frameworkMSR financing liability reflects the incremental costs of this transaction relative to the market participant assumptions contained in the MSR valuation. The Company had MSR financing liability of $49 and $37 as of June 30, 2020 and December 31, 2019, respectively.The following table sets forth the weighted-average assumptions used in the valuation of the mortgage servicing rights financing liability:Mortgage Servicing Rights Financing Assumptions June 30, 2020 December 31, 2019 Advance financing rates 4.3 % 3.5 % Annual advance recovery rates 18.6 % 18.8 % 16Servicing Segment RevenuesThe following table sets forth the items comprising total revenues for the Servicing segment:Three Months Ended June 30, Six Months Ended June 30, Total Revenues - Servicing 2020 2019 2020 2019 Contractually specified servicing fees(1)$ 285 $ 307 $ 582 $ 588 Other service-related income(1)62 32 111 82 Incentive and modification income(1)8 10 18 17 Late fees(1)20 27 47 52 Reverse servicing fees 7 8 13 17 Mark-to-market adjustments(2)(261) (231) (644) (524) Counterparty revenue share(3)(88) (70) (164) (118) Amortization, net of accretion(4)(102) (56) (178) (79) Total revenues - Servicing $ (69) $ 27 $ (215) $ 35 (1)The Company recognizes revenue on an earned basis for services performed. Amounts include subservicing related revenues.(2)Mark-to-market (“MTM”) adjustments include fair value adjustments on MSR, excess spread financing and MSR financing liabilities. The amount of MSR MTM includes the impact of negative modeled cash flows which have been transferred to reserves on advances and other receivables. The negative modeled cash flows relate to advances and other receivables associated with inactive and liquidated loans that are no longer part of the MSR portfolio. The impact of negative modeled cash flows was $3 and $17 for the three months ended June 30, 2020 and 2019 and $13 and $28 for the six months ended June 30, 2020 and 2019, respectively.(3)Counterparty revenue share represents the excess servicing fee that the Company pays to the counterparties under the excess spread financing arrangements and the payments made associated with MSR financing arrangements.(4)Amortization is net of excess spread accretion of $79 and $59 and MSL accretion of $5 and $11 for the three months ended June 30, 2020 and 2019, respectively. For the six months ended June 30, 2020 and 2019, amortization is net of excess spread accretion of $147 and $95 and MSL accretion of $13 and $29, respectively.4. Advances and Other Receivables, NetAdvances and other receivables, net, consists of the following:Advances and Other Receivables, Net June 30, 2020 December 31, 2019 Servicing advances, net of $117 and $131 purchase discount, respectively$ 695 $ 970 Receivables from agencies, investors and prior servicers, net of $21 and $21 purchase discount, respectively 189 193 Reserves (216) (175) Total advances and other receivables, net $ 668 $ 988 The Company, as loan servicer, is contractually responsible to advance funds on behalf of the borrower and investor primarily for loan principal and interest, property taxes and hazard insurance and foreclosure costs. Advances are primarily recovered through reimbursement from the investor, proceeds from sale of loan collateral, mortgage insurance claims or the borrower. Reserves for advances and other receivables on loans liquidated or purchased out of the MSR portfolio are established within advances and other receivables.17The following table sets forth the activities of the servicing reserves for advances and other receivables:Three Months Ended June 30, Six Months Ended June 30, Reserves for Advances and Other Receivables 2020 2019 2020 2019 Balance - beginning of period $ 193 $ 71 $ 168 $ 47 Provision and other additions(1)29 37 59 67 Write-offs (6) (10) (11) (16) Balance - end of period $ 216 $ 98 $ 216 $ 98 (1)The Company recorded a provision of $3 and $17 through the MTM adjustments in revenues - service related, net, in the consolidated statements of operations for the three months ended June 30, 2020 and 2019, respectively, and $13 and $28 for the six months ended June 30, 2020 and 2019, respectively, for inactive and liquidated loans that are no longer part of the MSR portfolio. Other additions represent reclassifications of required reserves provisioned within other balance sheet accounts as associated serviced loans become inactive or liquidate.Purchase Discount for Advances and Other ReceivablesIn connection with the acquisition of Pacific Union in February 2019, the Company recorded the acquired advances and other receivables at estimated fair value as of the acquisition date, which resulted in a purchase discount of $19. Refer to Note 2, Acquisitions, for discussion of the Pacific Union acquisition. In 2018, the Company recorded the acquired advances and other receivables in connection with the Merger at estimated fair value as of the acquisition date, which resulted in a purchase discount of $302.As of June 30, 2020, a total of $183 purchase discount has been utilized, with $138 purchase discount remaining.The following tables set forth the activities of the purchase discounts for advances and other receivables:Three Months Ended June 30, 2020 Three Months Ended June 30, 2019 Purchase Discount for Advances and Other Receivables Servicing Advances Receivables from Agencies, Investors and Prior Servicers Servicing Advances Receivables from Agencies, Investors and Prior Servicers Balance - beginning of period $ 125 $ 21 $ 169 $ 48 Utilization of purchase discounts (8) — (13) — Balance - end of period $ 117 $ 21 $ 156 $ 48 Six Months Ended June 30, 2020 Six Months Ended June 30, 2019 Purchase Discount for Advances and Other Receivables Servicing Advances Receivables from Agencies, Investors and Prior Servicers Servicing Advances Receivables from Agencies, Investors and Prior Servicers Balance - beginning of period $ 131 $ 21 $ 205 $ 48 Addition from acquisition — — 19 — Utilization of purchase discounts (14) — (68) — Balance - end of period $ 117 $ 21 $ 156 $ 48 Credit Loss for Advances and Other ReceivablesAs described in Note 1, Nature of Business and Basis of Presentation, advances and other receivables are within the scope of ASU 2016-13, and the Company modified its accounting policy regarding its assessment of reserves for credit-related losses in accordance with CECL framework. During the three and six months ended June 30, 2020, the Company increased the CECL reserve by $8 and $14, respectively. As of June 30, 2020, the total CECL reserve was $31, of which $14 and $17 was recorded in reserves and purchase discount for advances and other receivables, respectively.Based upon the Company’s application of ASU 2016-13, the Company determined that the credit-related risk associated with applicable financial instruments typically increase with the passage of time. The CECL reserve methodology considers these financial instruments collectible to a point in time of 39 months. Any projected remaining balance at the end of the collection period is considered a loss and factors into the overall CECL loss rate required.185. Reverse Mortgage Interests, NetReverse mortgage interests, net, consists of the following:Reverse Mortgage Interests, Net June 30, 2020 December 31, 2019 Participating interests in HECM mortgage-backed securities (“HMBS”) $ 3,873 $ 4,282 Other interests securitized 825 994 Unsecuritized interests 1,138 1,117 Purchase discount, net (127) (114) Total reverse mortgage interests, net $ 5,709 $ 6,279 Participating Interests in HMBSParticipating interests in HMBS consist of the Company’s reverse mortgage interests in HECM loans which have been transferred to GNMA and subsequently securitized through the issuance of HMBS. The Company does not own these loans, but due to HMBS program buyout requirements, such interests are consolidated in Company’s consolidated balance sheets. The Company does not originate reverse mortgages, but during the six months ended June 30, 2020 and 2019, a total of $95 and $149 in UPB associated with new draws on existing loans was transferred to GNMA and securitized by the Company, respectively.In March 2019, the Company entered into an agreement with Fannie Mae for the transfer of reverse mortgage loans. As a result, $61 was transferred from Fannie Mae and securitized into GNMA HMBS during the six months ended June 30, 2019. There was no such activity during the six months ended June 30, 2020.Other Interests SecuritizedOther interests securitized consist of reverse mortgage interests that no longer meet HMBS program eligibility criteria primarily because they have reached 98% of their Max Claim Amount (“MCA”), which is established at origination and in accordance with HMBS program guidelines, requiring a repurchase of loans from the respective HMBS trust. These reverse mortgage interests have subsequently been transferred to private securitization trusts and are accounted for as a secured borrowing. No such securitizations occurred during the six months ended June 30, 2020. During the six months ended June 30, 2019, the Company securitized a total of $398 UPB through Trust 2019-1 and a total of $249 UPB from Trust 2017-2 was called and the related debt was extinguished. The Company sold $20 UPB of Trust 2018-3 during the six months ended June 30, 2019. Refer to Other Nonrecourse Debt in Note 9, Indebtedness for additional information.Unsecuritized InterestsUnsecuritized interests in reverse mortgages consist of the following:Unsecuritized interests June 30, 2020 December 31, 2019 Repurchased HECM loans (exceeds 98% MCA) $ 804 $ 789 HECM related receivables(1)244 250 Funded borrower draws not yet securitized 53 64 Real estate owned (“REO”) related receivables 37 14 Total unsecuritized interests $ 1,138 $ 1,117 (1)HECM related receivables consist primarily of receivables from FNMA for corporate advances and service fees and claims receivables from the U.S. Department of Housing and Urban Development (“HUD”) on reverse mortgage interests.Unsecuritized interests include repurchased HECM loans for which the Company is required to repurchase from the HMBS pool when the outstanding principal balance of the HECM loan is equal to or greater than 98% of the MCA established at origination and in accordance with HMBS program guidelines. These unsecuritized interests are primarily financed through available warehouse lines. The Company repurchased a total of $686 and $1,457 of HECM loans out of GNMA HMBS securitizations during the six months ended June 30, 2020 and 2019, respectively, of which $186 and $371 were subsequently assigned to a third party in accordance with applicable servicing agreements, respectively. To the extent a loan is not subject to applicable servicing agreements and assigned to a third party, the loan is either subject to assignment to HUD, per contractual obligations with GNMA, liquidated via a payoff from the borrower or liquidated via a foreclosure according to the terms of the underlying mortgage. The Company assigned a total of $461 and $983 of HECM loans to HUD during the six months ended June 30, 2020 and 2019, respectively.19Purchase Discount, net, for Reverse Mortgage InterestsIn connection with the Merger, the Company recorded the acquired reverse mortgage interests at estimated fair value as of the acquisition date, which resulted in a net purchase discount of $256 associated with financial and operational losses on reverse mortgage interests associated with servicing the loans through foreclosure and collateral liquidation. The premium and discount are amortized and accreted, respectively, based on the effective yield method, whereby the Company updates its prepayment assumptions for actual prepayments on a quarterly basis. Consistent with the Company’s accounting policy, the Company calculates reserve requirements on the reverse mortgage interest portfolio each reporting period and compares such calculated reserve requirements against the remaining net purchase discount. If the calculated reserve requirements exceed the remaining net purchase discount, the Company will record an additional reserve and associated provision to general and administrative expense. No additional reserves were required to be recorded as of June 30, 2020.The following table sets forth the activities of the purchase discounts, net, for reverse mortgage interests:Three Months Ended June 30, Six Months Ended June 30, Purchase discount, net, for reverse mortgage interests(1)2020 2019 2020 2019 Balance - beginning of period $ (129) $ (171) $ (114) $ (164) Adjustments(2)— — — (24) Utilization of purchase discounts(3)9 12 19 40 Amortization, net of accretion (7) (4) (32) (15) Balance - end of period $ (127) $ (163) $ (127) $ (163) (1)Net position as certain items are in a premium/(discount) position, based on the characteristics of underlying tranches of loans.(2)Adjustments during the six months ended June 30, 2019 due to revised cost to service assumption utilized in the valuation of reverse mortgage assets and liabilities acquired from the Merger.(3)Utilization of purchase discounts on liquidated loans, for which the remaining receivable was written-off.Credit Loss for Reverse Mortgage InterestsAs described in Note 1, Nature of Business and Basis of Presentation, reverse mortgage interests are within the scope of ASU 2016-13, requiring an assessment of reserves regarding credit-related losses in accordance with the CECL framework. Upon applying ASU 2016-13, the Company determined that credit-related losses are immaterial given the government insured nature of the HECM loan product. Any expected credit-related losses are contemplated in the Company’s existing reserve methodology due to the nature of this financial instrument. Accordingly, no cumulative effect adjustment was required upon adoption of ASU 2016-13 on January 1, 2020 and no additional CECL reserve was recorded as of June 30, 2020.The credit-risk characteristics of reverse mortgage interests do not vary with time as the financial instruments have no contractual life or financial profile as the primary counterparty is the government agency insuring the loans.Reverse Mortgage Interest IncomeThe Company accrues interest income for its participating interest in reverse mortgages based on the stated rates underlying HECM loans, in accordance with FHA guidelines. Total interest earned on the Company’s reverse mortgage interests was $55 and $85 for the three months ended June 30, 2020 and 2019, respectively, and $117 and $167 for the six months ended June 30, 2020 and 2019, respectively.6. Mortgage Loans Held for SaleThe Company maintains a strategy of originating and purchasing residential mortgage loan products primarily for the purpose of selling to GSEs or other third-party investors in the secondary market on a servicing-retained basis. The Company purchases closed loans through its correspondent channel and assists customers currently in the Company’s servicing portfolio with refinancing of loans or new home purchases through its direct-to-consumer channel. Generally, all newly originated mortgage loans held for sale are securitized and transferred to GSEs or delivered to third-party purchasers shortly after origination on a servicing-retained basis.20Mortgage loans held for sale are recorded at fair value as set forth below:Mortgage Loans Held for Sale June 30, 2020 December 31, 2019 Mortgage loans held for sale – UPB $ 3,033 $ 3,949 Mark-to-market adjustment(1)146 128 Total mortgage loans held for sale $ 3,179 $ 4,077 (1)The mark-to-market adjustment is recorded in net gain on mortgage loans held for sale in the consolidated statements of operations.The following table sets forth the activities of mortgage loans held for sale:Six Months Ended June 30, Mortgage Loans Held for Sale 2020 2019 Balance - beginning of period $ 4,077 $ 1,631 Loans sold (26,149) (15,203) Mortgage loans originated and purchased, net of fees 23,110 16,263 Repurchase of loans out of Ginnie Mae securitizations 2,092 715 Changes in fair value 42 16 Net transfers of mortgage loans held for sale(1)7 — Balance - end of period $ 3,179 $ 3,422 (1)Amount reflects transfers to other assets for loans transitioning into REO status and transfers to advances and other receivables, net, for claims made on certain government insurance mortgage loans. Transfers out are net of transfers in upon receipt of proceeds from an REO sale or claim filing.For the six months ended June 30, 2020 and 2019, the Company received proceeds of $26,606 and $15,422, respectively, on the sale of mortgage loans held for sale, resulting in gains of $457 and $219, respectively.The Company has the right to repurchase any individual loan in a Ginnie Mae securitization pool if that loan meets certain criteria, including having not received borrower payments for greater than 90 days. The majority of Ginnie Mae repurchased loans are repurchased in connection with loan modifications and loan resolution activity, with the intent to re-pool into new Ginnie Mae securitizations upon re-performance of the loan or to otherwise sell to third-party investors. Therefore, these loans are classified as held for sale.The Company accrues interest income as earned and places loans on non-accrual status after any portion of principal or interest has been delinquent for more than 90 days. Accrued interest is recorded as interest income in the consolidated statements of operations.The total UPB and fair value of mortgage loans held for sale on non-accrual status was as follows:June 30, 2020 December 31, 2019 Mortgage Loans Held for Sale UPB Fair Value UPB Fair Value Non-accrual(1)$ 35 $ 25 $ 29 $ 22 (1)Non-accrual UPB includes $27 and $25 of UPB related to Ginnie Mae repurchased loans as of June 30, 2020 and December 31, 2019, respectively.The total UPB of mortgage loans held for sale for which the Company has begun formal foreclosure proceedings was $21 and $21 as of June 30, 2020 and December 31, 2019, respectively.217. Other AssetsOther assets consist of the following:Other assets June 30, 2020 December 31, 2019 Loans subject to repurchase right from Ginnie Mae $ 1,171 $ 560 Derivative financial instruments 391 153 Trade receivables and accrued revenues 133 126 Goodwill 120 120 Operating lease right-of-use assets 108 121 Intangible assets 54 74 Other 197 236 Total other assets $ 2,174 $ 1,390 Loans Subject to Repurchase Right from Ginnie MaeForward loans are sold to Ginnie Mae in conjunction with the issuance of mortgage backed securities. The Company, as the issuer of the mortgage backed securities, has the unilateral right to repurchase any individual loan in a Ginnie Mae securitization pool if that loan meets certain criteria, including payments not being received from borrowers for greater than 90 days. Once the Company has the unilateral right to repurchase a delinquent loan, it has effectively regained control over the loan and recognizes these rights to the loan on its consolidated balance sheets and establishes a corresponding repurchase liability regardless of the Company’s intention to repurchase the loan. Loans subject to repurchase from Ginnie Mae as of June 30, 2020 include $818 loans in forbearance related to the Coronavirus Aid, Relief, and Economic Security Act (“CARES Act”) whereby no payments have been received from borrowers for greater than 90 days.Derivative Financial InstrumentsSee Note 8, Derivative Financial Instruments, for further details on derivative financial instruments.Trade Receivables and Accrued RevenuesTrade receivables and accrued revenues are primarily comprised of trade receivables and service fees earned but not received based upon the terms of the Company’s servicing and subservicing agreements. As described in Note 1, Nature of Business and Basis of Presentation, certain trade receivables and accrued revenues included in other assets are within the scope of ASU 2016-13, requiring an assessment of CECL losses. As of June 30, 2020, the total CECL reserve was $4.The credit-risk characteristics of trade receivables included in other assets and within the scope of ASU 2016-13 do not change with time as they are primarily short-term in nature. However, the Company does monitor the financial status of customers to determine if any specific loss considerations are required.Goodwill and Intangible AssetsIn 2019, the Company recorded goodwill and intangible assets of $40 and $13, respectively, in connection with the acquisition of Pacific Union. See further discussion in Note 2, Acquisitions. The Company recorded a $4 impairment of technology intangible assets within Corporate/Other segment during the six months ended June 30, 2020 in connection with an ancillary business. The impairment charges were included in the general and administrative expenses in the consolidated statements of operations. There was 0 impairment expense for intangible assets during the six months ended June 30, 2019.Operating Lease Right-of-Use (“ROU”) AssetsOperating lease ROU assets represent the Company’s right to use an underlying leased asset during the lease term.OtherOther primarily includes prepaid expenses, margin call deposits, REO, tax receivables, receivables related to recent loan transfers and various receivables due from investors. REO includes $6 and $11 of REO-related receivables with government insurance as of June 30, 2020 and December 31, 2019, respectively, limiting loss exposure to the Company.228. Derivative Financial InstrumentsDerivative instruments are used as part of the overall strategy to manage exposure to market risks primarily associated with fluctuations in interest rates related to originations. Derivative instruments utilized by the Company primarily include interest rate lock commitments (“IRLCs”), loan purchase commitments (“LPCs”), forward Mortgage Backed Securities (“MBS”) purchase commitments, Eurodollar and Treasury futures and interest rate swap agreements.Associated with the Company’s derivatives are $23 and $6 in collateral deposits on derivative instruments recorded in other assets on the Company’s consolidated balance sheets as of June 30, 2020 and December 31, 2019, respectively. The Company does not offset fair value amounts recognized for derivative instruments with amounts collected or deposited on derivative instruments in the consolidated balance sheets.The following tables provide the outstanding notional balances, fair values of outstanding positions and recorded gains/(losses) for the derivative financial instruments:June 30, 2020 Six Months Ended June 30, 2020 Derivative Financial Instruments Expiration
DatesOutstanding
NotionalFair
ValueRecorded Gains/(Losses) Assets Mortgage loans held for sale Loan sale commitments 2020 $ 1,673 $ 81 $ 48 Derivative financial instruments IRLCs 2020 9,227 370 235 LPCs 2020 1,823 18 6 Forward MBS trades 2020 1,239 3 (3) Eurodollar futures 2020-2021 6 — — Total derivative financial instruments - assets $ 12,295 $ 391 $ 238 Liabilities Derivative financial instruments LPCs 2020 $ 55 $ — $ (2) Forward MBS trades 2020 10,119 50 37 Eurodollar futures 2020-2021 5 — — Total derivative financial instruments - liabilities $ 10,179 $ 50 $ 35 23June 30, 2019 Six Months Ended June 30, 2019 Derivative Financial Instruments Expiration
DatesOutstanding
NotionalFair
ValueRecorded Gains/(Losses) Assets Mortgage loans held for sale Loan sale commitments 2019 $ 1,659 $ 47 $ 21 Derivative financial instruments IRLCs 2019 3,649 110 51 LPCs 2019 1,327 17 15 Forward MBS trades 2019 762 1 (1) Eurodollar futures 2019-2021 8 — — Total derivative financial instruments - assets $ 5,746 $ 128 $ 65 Liabilities Derivative financial instruments IRLCs 2019 $ 4 $ — $ — LPCs 2019 212 1 1 Forward MBS trades 2019 4,932 30 6 Eurodollar futures 2019-2021 12 — — Total derivative financial instruments - liabilities $ 5,160 $ 31 $ 7 9. IndebtednessNotes PayableJune 30, 2020 December 31, 2019 Advance Facilities Interest Rate Maturity Date Collateral Capacity Amount Outstanding Collateral Pledged Outstanding Collateral pledged $875 advance facility(1)CP+2.5% to 6.5% April 2021 Servicing advance receivables $ 875 $ 193 $ 220 $ 37 $ 88 $425 advance facility(2)LIBOR+2.8% to 6.5% October 2021 Servicing advance receivables 425 211 273 224 285 $250 advance facility(3)LIBOR+1.5% to 2.6% December 2020 Servicing advance receivables 250 — — 98 167 $200 advance facility LIBOR+2.5% January 2021 Servicing advance receivables 200 76 106 63 125 Advance facilities principal amount 480 $ 599 422 $ 665 Unamortized debt issuance costs (5) — Advance facilities, net $ 475 $ 422 (1)The capacity amount for this advance facility increased from $125 to $875 in April 2020.(2)The capacity amount for this advance facility increased from $325 to $425 in April 2020.(3)This advance facility was terminated and transferred to another advance facility in April 2020.24June 30, 2020 December 31, 2019 Warehouse Facilities Interest Rate Maturity Date Collateral Capacity Amount Outstanding Collateral pledged Outstanding Collateral pledged $1,500 warehouse facility LIBOR+1.7% June 2021 Mortgage loans or MBS $ 1,500 $ 669 $ 637 $ 759 $ 733 $1,200 warehouse facility LIBOR+1.5% to 3.0% November 2020 Mortgage loans or MBS 1,200 568 606 683 724 $800 warehouse facility(1)LIBOR+2.1% to 3.8% April 2021 Mortgage loans or MBS 800 642 700 589 656 $750 warehouse facility LIBOR+1.4% to 2.8% September 2020 Mortgage loans or MBS 750 572 583 411 425 $700 warehouse facility LIBOR+1.3% to 2.2% November 2020 Mortgage loans or MBS 700 624 644 469 488 $600 warehouse facility LIBOR+2.2% February 2021 Mortgage loans or MBS 600 233 278 174 202 $500 warehouse facility LIBOR+2.5% to 4.0% May 2021 Mortgage loans or MBS 500 — 1 336 349 $250 warehouse facility(2)LIBOR+1.4% to 2.3% September 2020 Mortgage loans or MBS 250 — — 762 783 $200 warehouse facility LIBOR+1.4% January 2021 Mortgage loans or MBS 200 175 175 136 136 $200 warehouse facility LIBOR+2.5% May 2021 Mortgage loans or MBS 200 50 74 54 78 $200 warehouse facility LIBOR+1.8% April 2021 Mortgage loans or MBS 200 19 19 27 27 $200 warehouse facility LIBOR+1.3% October 2020 Mortgage loans or MBS 200 — — — — $50 warehouse facility LIBOR+1.8% to 4.8% April 2021 Mortgage loans or MBS 50 31 36 11 15 $40 warehouse facility LIBOR+3.3% September 2020 Mortgage loans or MBS 40 4 4 5 6 Warehouse facilities principal amount 3,587 3,757 4,416 4,622 MSR Facility $450 warehouse facility(3)LIBOR+5.1% May 2021 MSR 450 300 628 150 945 $400 warehouse facility LIBOR+2.3% December 2020 MSR 400 75 176 — 200 $150 warehouse facility(1)LIBOR+3.8% April 2021 MSR 150 40 117 — 130 $50 warehouse facility LIBOR+2.8% August 2020 MSR 50 30 87 10 84 MSR facilities principal amount 445 1,008 160 1,359 Warehouse and MSR facilities principal amount 4,032 $ 4,765 4,576 $ 5,981 Unamortized debt issuance costs (1) (1) Warehouse facilities, net $ 4,031 $ 4,575 Pledged Collateral: Mortgage loans held for sale $ 2,963 $ 3,016 $ 3,826 $ 3,931 Reverse mortgage interests 624 741 590 691 MSR 445 1,008 160 1,359 (1)Total capacity amount for this facility is $800 of which $150 is a sublimit for MSR financing.(2)The capacity amount for this warehouse facility decreased from $1,000 to $250 in May 2020.(3)The capacity amount for this MSR facility increased from $400 to $450 in May 2020.25Unsecured Senior NotesUnsecured senior notes consist of the following:Unsecured senior notes June 30, 2020 December 31, 2019 $950 face value, 8.125% interest rate payable semi-annually, due July 2023 $ 950 $ 950 $750 face value, 9.125% interest rate payable semi-annually, due July 2026 750 750 $600 face value, 6.000% interest rate payable semi-annually, due January 2027(1)600 — $600 face value, 6.500% interest rate payable semi-annually, due July 2021(2)— 492 $300 face value, 6.500% interest rate payable semi-annually, due June 2022(2)— 206 Unsecured senior notes principal amount 2,300 2,398 Unamortized debt issuance costs, premium and discount (39) (32) Unsecured senior notes, net $ 2,261 $ 2,366 (1)On January 16, 2020, the Company completed an offering of $600 aggregate principal amount of 6.000% Senior Notes due 2027 (the “2027 Notes”).(2)This note was redeemed in full on February 15, 2020 using the net proceeds of the 2027 Notes offering, together with cash on hand.The ratios included in the indentures for the unsecured senior notes are incurrence-based compared to the customary ratio covenants that are often found in credit agreements that require a company to maintain a certain ratio. The incurrence-based covenants limit the issuer(s) and restricted subsidiaries ability to incur additional indebtedness, pay dividends, make certain investments, create liens, consolidate, merge or sell substantially all of their assets or enter into certain transactions with affiliates. The indentures contain certain events of default, including (subject, in some cases, to customary cure periods and materiality thresholds) defaults based on (i) the failure to make payments under the applicable indenture when due, (ii) breach of covenants, (iii) cross-defaults to certain other indebtedness, (iv) certain bankruptcy or insolvency events, (v) material judgments and (vi) invalidity of material guarantees.The indentures provide that on or before certain fixed dates, the Company may redeem up to 40% of the aggregate principal amount of the unsecured senior notes with the net proceeds of certain equity offerings at fixed redemption prices, plus accrued and unpaid interest, to the redemption dates, subject to compliance with certain conditions. In addition, the Company may redeem all or a portion of the unsecured senior notes at any time on or after certain fixed dates at the applicable redemption prices set forth in the indentures plus accrued and unpaid interest, to the redemption dates. No notes were repurchased or redeemed during the three months ended June 30, 2020. During the six months ended June 30, 2020, the Company repaid $100 in principal of outstanding notes. Additionally, the Company redeemed $598 in principal of outstanding notes during the six months ended June 30, 2020, resulting in a gain of $1. No notes were repurchased or redeemed during the three and six months ended June 30, 2019.As of June 30, 2020, the expected maturities of the Company’s unsecured senior notes based on contractual maturities are as follows:Year Ending December 31, Amount 2020 $ — 2021 — 2022 — 2023 950 2024 — Thereafter 1,350 Total unsecured senior notes principal amount $ 2,300 26Other Nonrecourse DebtOther nonrecourse debt consists of the following:June 30, 2020 December 31, 2019 Other nonrecourse debt Issue Date Maturity Date Class of Note Collateral Amount Outstanding Outstanding Participating interest financing(1)— — — $ — $ 3,875 $ 4,284 Securitization of nonperforming HECM loans Trust 2019-2 November 2019 November 2029 A, M1, M2, M3, M4, M5 287 274 333 Trust 2019-1 June 2019 June 2029 A, M1, M2, M3, M4, M5 264 244 302 Trust 2018-3 November 2018 November 2028 A, M1, M2, M3, M4, M5 200 179 209 Trust 2018-2 July 2018 July 2028 A, M1, M2, M3, M4, M5 149 127�� 148 Other nonrecourse debt principal amount 4,699 5,276 Unamortized debt issuance costs, premium and discount 8 10 Other nonrecourse debt, net $ 4,707 $ 5,286 (1)Amounts represent the Company’s participating interest in GNMA HMBS securitized portfolios.Participating Interest FinancingParticipating interest financing represents the obligation of HMBS pools to third-party security holders. The Company issues HMBS in connection with the securitization of borrower draws and accrues interest on HECM loans. Proceeds are received in exchange for securitized advances on the HECM loan amounts transferred to GNMA, and the Company retains a beneficial interest (referred to as a “participating interest”) in the securitization trust in which the HECM loans and HMBS obligations are held and assume both issuer and servicer responsibilities in accordance with GNMA HMBS program guidelines. Monthly cash flows generated from the HECM loans are used to service the HMBS obligations. The interest rate is based on the underlying HMBS rate with a range of 0.6% to 5.6%.Securitizations of Nonperforming HECM LoansFrom time to time, the Company securitizes its interests in non-performing reverse mortgages. The transactions provide investors with the ability to invest in a pool of both non-performing HECM loans secured by one-to-four-family residential properties and a pool of REO properties acquired through foreclosure of a deed in lieu of foreclosure in connection with HECM loans that are covered by FHA insurance. The transactions provide the Company with access to liquidity for the non-performing HECM loan portfolio, ongoing servicing fees, and potential residual returns. The transactions are structured as secured borrowings with the reverse mortgage loans included in the consolidated financial statements as reverse mortgage interests and the related financing included in other nonrecourse debt. Interest is accrued at a rate of 2.3% to 6.0% on the outstanding securitized notes and recorded as interest expense in consolidated statements of operations. The HECM securitizations are callable with expected weighted average lives of less than one to three years. The Company may re-securitize the previously called loans from earlier HECM securitizations to achieve a lower cost of funds.Financial CovenantsThe Company’s credit facilities contain various financial covenants which primarily relate to required tangible net worth amounts, liquidity reserves, leverage requirements, and profitability requirements, which are measured at the Company’s operating subsidiary, Nationstar Mortgage LLC. The Company was in compliance with its required financial covenants as of June 30, 2020.2710. Payables and Other LiabilitiesPayables and other liabilities consist of the following:Payables and other liabilities June 30, 2020 December 31, 2019 Loans subject to repurchase right from Ginnie Mae $ 1,171 $ 560 Payables to servicing and subservicing investors 345 423 Payable to GSEs and securitized trusts 129 182 Operating lease liabilities 121 135 Derivative financial instruments 50 15 Other liabilities 644 701 Total payables and other liabilities $ 2,460 $ 2,016 Loans Subject to Repurchase Right from Ginnie MaeSee Note 7, Other Assets, for a description of assets and liabilities related to loans subject to repurchase right from Ginnie Mae. Loans subject to repurchase from Ginnie Mae as of June 30, 2020 include $818 loans in forbearance related to the CARES Act whereby no payments have been received from borrowers for greater than 90 days.Payables to Servicing and Subservicing Investors and Payables to GSEs and Securitized TrustsPayables to servicing and subservicing investors, GSEs and securitized trusts represent amounts due to investors, GSEs and securitized trusts in connection with loans serviced that are paid from collections of the underlying loans, insurance proceeds or proceeds from property disposal.Derivative Financial InstrumentsSee Note 8, Derivative Financial Instruments, for further details on derivative financial instruments.Operating Lease LiabilitiesOperating lease liabilities represent the Company’s obligation to make lease payments arising from a lease, measured on a discount basis.Other LiabilitiesOther liabilities primarily include accrued bonus and payroll, accrued interest, accrued legal expenses, payables to insurance carriers and insurance cancellation reserves, repurchase reserves, accounts payable and other accrued liabilities. Payables to insurance carriers and insurance cancellation reserves consist of insurance premiums received from borrower payments awaiting disbursement to the insurance carrier and/or amounts due to third-party investors on liquidated loans.The following table sets forth the activities of the repurchase reserves:Three Months Ended June 30, Six Months Ended June 30, Repurchase Reserves 2020 2019 2020 2019 Balance - beginning of period $ 29 $ 16 $ 25 $ 8 Provisions 4 8 9 16 Releases (4) (1) (5) (1) Balance - end of period $ 29 $ 23 $ 29 $ 23 The provision for repurchases represents an estimate of losses to be incurred on the repurchase of loans or indemnification of purchaser’s losses related to forward loans. Certain sale contracts and GSE standards require the Company to repurchase a loan or indemnify the purchaser or insurer for losses if a borrower fails to make initial loan payments or if the accompanying mortgage loan fails to meet certain customary representations and warranties with respect to underwriting standards.The Company regularly evaluates the adequacy of repurchase reserves based on trends in repurchase and indemnification requests, actual loss experience, settlement negotiation, estimated future loss exposure and other relevant factors including economic conditions. Current loss rates have significantly declined attributable to stronger underwriting standards and due to the falloff of loans underwritten prior to the mortgage loan crisis period prior to 2008. The Company believes its reserve balance as of June 30, 2020 is sufficient to cover loss exposure associated with repurchase contingencies.2811. Securitizations and FinancingsVariable Interest Entities (VIEs)In the normal course of business, the Company enters into various types of on- and off-balance sheet transactions with special purpose entities (“SPEs”) determined to be VIEs, which primarily consist of securitization trusts established for a limited purpose. Generally, these SPEs are formed for the purpose of securitization transactions in which the Company transfers assets to an SPE, which then issues to investors various forms of debt obligations supported by those assets.The Company has determined that the SPEs created in connection with the (i) Nationstar Mortgage Advance Receivables Trust (NMART), (ii) Nationstar Agency Advance Financing Trust (NAAFT) and (iii) Nationstar Advance Agency Receivables Trust (NAART) should be consolidated as the Company is the primary beneficiary of each of these entities. Also, the Company consolidated 4 reverse mortgage SPEs as it is the primary beneficiary of each of these entities. These SPEs include the Nationstar HECM Loan Trusts.A summary of the assets and liabilities of the Company’s transactions with VIEs included in the Company’s consolidated financial statements is presented below:June 30, 2020 December 31, 2019 Consolidated transactions with VIEs Transfers
Accounted for as
Secured
BorrowingsReverse Secured Borrowings Transfers
Accounted for as
Secured
BorrowingsReverse Secured Borrowings Assets Restricted cash $ 95 $ 27 $ 66 $ 42 Reverse mortgage interests, net(1)— 4,639 — 5,230 Advances and other receivables, net 492 — 540 — Total assets $ 587 $ 4,666 $ 606 $ 5,272 Liabilities Advance facilities(2)$ 399 $ — $ 359 $ — Payables and other liabilities 1 1 1 1 Participating interest financing — 3,875 — 4,284 HECM Securitizations (HMBS) Trust 2019-2 — 274 — 333 Trust 2019-1 — 244 — 302 Trust 2018-3 — 179 — 209 Trust 2018-2 — 127 — 148 Total liabilities $ 400 $ 4,700 $ 360 $ 5,277 (1)Amounts include net purchase discount of $59 and $46 as of June 30, 2020 and December 31, 2019, respectively.(2)Amounts include the Nationstar agency advance financing facility and notes payable recorded by the Nationstar Mortgage Advance Receivable Trust, and the Nationstar Agency Advance Receivables Trust. Refer to Notes Payable in Note 9, Indebtedness, for additional information.The following table shows a summary of the outstanding collateral and certificate balances for securitization trusts for which the Company was the transferor, including any retained beneficial interests and MSRs, that were not consolidated by the Company:Unconsolidated securitization trusts June 30, 2020 December 31, 2019 Total collateral balances - UPB $ 1,422 $ 1,503 Total certificate balances $ 1,421 $ 1,512 The Company has not retained any variable interests in the unconsolidated securitization trusts that were outstanding as of June 30, 2020 and December 31, 2019 and therefore does not have a significant maximum exposure to loss related to these unconsolidated VIEs.29A summary of mortgage loans transferred by the Company to unconsolidated securitization trusts that are 60 days or more past due are presented below:Principal Amount of Transferred Loans 60 Days or More Past Due June 30, 2020 December 31, 2019 Unconsolidated securitization trusts $ 239 $ 193 12. Earnings Per ShareThe Company computes earnings per share using the two-class method, which is an earnings allocation formula that determines earnings per share for common stock and any participating securities according to dividends declared (whether paid or unpaid) and participation rights in undistributed earnings. The Series A Preferred Stock is considered participating securities because it has dividend rights determined on an as-converted basis in the event of Company’s declaration of a dividend or distribution for common shares.The following table sets forth the computation of basic and diluted net income (loss) per common share (amounts in millions, except per share amounts):Three Months Ended June 30, Six Months Ended June 30, Computation of earnings per share 2020 2019 2020 2019 Net income (loss) attributable to Mr. Cooper $ 73 $ (87) $ (95) $ (273) Less: Undistributed earnings attributable to participating stockholders 1 — — — Net income (loss) attributable to common stockholders $ 72 $ (87) $ (95) $ (273) Net income (loss) per common share attributable to Mr. Cooper: Basic $ 0.78 $ (0.96) $ (1.04) $ (3.00) Diluted $ 0.77 $ (0.96) $ (1.04) $ (3.00) Weighted average shares of common stock outstanding (in thousands): Basic 91,997 91,054 91,691 90,978 Dilutive effect of stock awards(1)176 — — — Dilutive effect of participating securities(1)839 — — — Diluted 93,012 91,054 91,691 90,978 (1)For periods with net loss, the Company excluded potential common shares from the computation of diluted EPS because inclusion would be antidilutive.13. Income TaxesThe following table sets forth the computation of the effective tax rate:Three Months Ended June 30, Six Months Ended June 30, 2020 2019 2020 2019 Income (loss) before income tax expense (benefit) $ 110 $ (117) $ (129) $ (350) Income tax expense (benefit) $ 37 $ (29) $ (31) $ (76) Effective tax rate(1)33.4 % 24.6 % 24.1 % 21.7 % (1)Effective tax rate is calculated using whole numbers.30For the three and six months ended June 30, 2020, the effective tax rate differed from the statutory federal rate of 21% primarily due to state income taxes, as well as unfavorable permanent differences including executive compensation disallowed under Internal Revenue Code Section 162(m). The effective tax rate increased in the three and six months ended June 30, 2020, as compared to the same periods in 2019, primarily attributable to the increased relative unfavorable tax impacts of the permanent differences on the annual effective rate.For the three and six months ended June 30, 2019, the effective tax rate differed from the statutory federal rate of 21% primarily due to permanent differences including executive compensation disallowed under Internal Revenue Code Section 162(m) and nondeductible meals and entertainment expenses, as well as other recurring items such as the state tax benefit.14. Fair Value MeasurementsFair value is a market-based measurement, not an entity-specific measurement, and should be determined based on the assumptions that market participants would use in pricing the asset or liability. As a basis for considering market participant assumptions in fair value measurements, a three-tiered fair value hierarchy has been established based on the level of observable inputs used in valuation and requires that observable inputs be used in the valuations when available. The disclosuremeasurement of fair value estimates in the fair value accounting guidance hierarchy is based on whether the significant inputs into the valuation are observable. In determining the level of the hierarchy in which the estimate is disclosed, the highest priority is given to unadjusted quoted prices in active markets and the lowest priority to unobservable inputs that reflect the Company’s significant market assumptions.The three levels of the hierarchy are as follows:1–Inputs to the valuation methodology are1 representing quoted prices for identical assets or liabilities traded in an active markets.2–Inputs to the valuation methodology include quoted prices for similar assets or liabilities in active markets, quoted prices for identical or similar assets or liabilities in markets that are not active,2 representing values using observable inputs other than quoted prices that are observable for the asset or liabilityincluded within Level 1; and market corroborated inputs.3–Valuations3 representing estimated values based on models where significant inputs are not observable. unobservable inputs).The unobservable inputs reflectfollowing describes the Company’s ownmethods and assumptions aboutused by the inputs that market participants would use.Fair values are based on quoted pricesCompany in active markets when availableestimating fair values:Cash and Cash Equivalents, Restricted Cash (Level 1). – The carrying amount reported in the consolidated balance sheets approximates fair value.Mortgage Loans Held for Sale (Level 2) – The Company receivesoriginates mortgage loans in the quoted prices fromU.S. that it intends to sell into Fannie Mae, Freddie Mac and Ginnie Mae MBS. Additionally, the Company holds mortgage loans that it intends to sell into the secondary markets via whole loan sales or securitizations. The Company measures newly originated prime residential mortgage loans held for sale at fair value.Mortgage loans held for sale are typically pooled together and sold into certain exit markets, depending upon underlying attributes of the loan, such as agency eligibility, product type, interest rate and credit quality. Mortgage loans held for sale are valued on a third party, nationally recognized pricing service. When quotedrecurring basis using a market approach by utilizing either: (i) the fair value of securities backed by similar mortgage loans, adjusted for certain factors to approximate the fair value of a whole mortgage loan, (ii) current commitments to purchase loans or (iii) recent observable market trades for similar loans, adjusted for credit risk and other individual loan characteristics. As these prices are not available,derived from market observable inputs, the Company utilizesclassifies these valuations as Level 2 in the fair value disclosures.The Company may acquire mortgage loans held for sale from various securitization trusts for which it acts as servicer through the exercise of various clean-up call options as permitted through the respective pooling and servicing agreements. The Company has elected to account for these loans at the lower of cost or market. The Company classifies these valuations as Level 2 in the fair value disclosures.The Company may also purchase loans out of a pricing serviceGinnie Mae securitization pool if that loan meets certain criteria, including being delinquent greater than 90 days. The Company has elected to determinecarry these loans at fair value. See Note 6, Mortgage Loans Held for Sale, for more information.Mortgage Servicing Rights – Fair Value (Level 3) – The Company estimates the fair value of its forward MSRs on a recurring basis using a process that combines the use of a discounted cash flow model and analysis of current market data to arrive at an estimate of fair value. The cash flow assumptions and prepayment assumptions used in the model are based on various factors, with the key assumptions being mortgage prepayment speeds, discount rates, ancillary revenues, earnings on escrow and costs to service. These assumptions are generated and applied based on collateral stratifications including product type, remittance type, geography, delinquency and coupon dispersion. These assumptions require the use of judgment by the Company and can have a significant impact on the fair value of the MSRs. Quarterly, management obtains third-party valuations to assess the reasonableness of the fair value calculations provided by the internal cash flow model. Because of the nature of the valuation inputs, the Company classifies these valuations as Level 3 in the fair value disclosures. See Note 3, Mortgage Servicing Rights and Related Liabilities, for more information.31Advances and Other Receivables, Net (Level 3) - Advances and other receivables, net are valued at their net realizable value after taking into consideration the reserves. Advances have no stated maturity. Their net realizable value approximates fair value as the net present value based on discounted cash flow is not materially different from the net realizable value. See Note 4, Advances and Other Receivables, Net for more information.Reverse Mortgage Interests, Net (Level 3) – The Company’s reverse mortgage interests are primarily comprised of HECM loans that are insured by FHA and guaranteed by Ginnie Mae upon securitization. Quarterly, the Company estimates fair value using discounted cash flows, obtained from a third-party and supplemented with historical loss experience on similar assets, with the discount rate approximating that of similar financial instruments, as observed from recent trades with the HMBS. Key assumptions within the model are based on market participant benchmarks and include discount rates, cost to service, weighted average life of the portfolio, and estimated participating income. Discounted cash flows are applied based on collateral stratifications and include loan rate type, loan status (active vs. inactive), and securitization. Prices are also influenced from both internal models and other observable inputs. The Company determined fair value for all loans based on the applicable tranches established during the Merger valuation. Tranches are segregated based on participation percentages, original loan status as of the Merger date, and interest rate types, and loan status (active vs inactive). Prices are also influenced from both internal models and other observable inputs, including applicable forward interest rate curves. Additionally, historical loss factors are considered within the overall valuation. Because of the unobservable nature of the valuation inputs, the Company classifies these valuations as Level 3 in the fair value disclosures. See Note 5, Reverse Mortgage Interests, Net for more information.Derivative Financial Instruments (Level 3 and Level 2) – The Company enters into a variety of derivative financial instruments as part of its hedging strategy and measures these instruments at fair value on a recurring basis in the consolidated balance sheets. Derivative instruments utilized by the Company primarily include IRLCs, LPCs, forward MBS trades, Eurodollar and Treasury futures and interest rate swap agreements.During the three months ended June 30, 2020, the Company changed the fair value classification of its IRLCs and LPCs derivatives from Level 2 to Level 3. IRLCs and LPCs are carried at fair value primarily based on secondary market prices for underlying mortgage loans, which is observable data, with adjustments made to such observable data for the inherent value of servicing, which is an unobservable input. The fair value is generallyalso subject to adjustments for the estimated using current market inputs for similar financial instruments with comparable termspull-through rate. The impact of the unobservable input to the overall valuation of IRLCs and credit quality, commonly referred to as matrix pricing (Level 2). These valuation techniques involve some levelLPCs was previously much less significant, resulting in a classification of management estimation and judgment. The Company recognizes transfers between levelsLevel 2 in the fair value hierarchy atas of December 31, 2019. During the endthree months ended June 30,2020, market interest rates continued to decline and fell to record lows, which drove an increase in the volume of the reporting period.9Fixed-maturity securities consistCompany’s IRLCs and LPCs and increased the impact of U.S. Treasury securities, obligationsthe unobservable input on the overall valuation of U.S. government sponsored agenciesIRLCs and domestic and foreign corporate debt securities. Fixed-maturity securities heldLPCs. Such increased impact of the unobservable input on the overall valuation resulted in trusta classification of Level 3 in the fair value hierarchy as of June 30, 2020.For other derivatives, they are exchange-traded or traded within highly active dealer markets. In order to determine the fair value of these instruments, the Company utilizes the exchange price or dealer market price for the benefit ofparticular derivative contract; therefore, the primary insurersCompany classifies these contracts as Level 2 in the fair value disclosure.Derivative financial instruments are recorded in other assets and payables and other liabilities within the consolidated balance sheets. See Note 9, Derivative Financial Instruments, for more fully described in Note 3: Insurance Activity. Investments in fixed-maturity securities areinformation.Advance Facilities and Warehouse Facilities (Level 2) – As the underlying warehouse and advance finance facilities bear interest at a rate that is periodically adjusted based on a market index, the carrying amount reported at their estimated fair values and are classified as trading securities in accordance with applicable accounting guidance. Realized gains and lossesamortized cost on the saleconsolidated balance sheets approximates fair value. See Note 9, Indebtedness, for more information.Unsecured Senior Notes (Level 1) – The fair value of fixed-maturity securities are determined using the specific identification method and are reported as a component of net investment income within the condensed consolidated statement of operations.Investments Held in TrustInvestments held in trust consist of cash equivalents, which include highly liquid overnight money market instruments, and fixed-maturity securitiesunsecured senior notes, which are held in trust for the benefit of the primary insurers, as more fully described in Note 3: Insurance Activitycarried at amortized cost, is based on quoted market prices and Note 4: Investment Securities, and are subject to the restrictions on distribution of net assets of subsidiaries as described below.Third Party Restrictions on Distribution of Net Assets of Wholly-Owned SubsidiariesThe net assets of WMMRC are subject to restrictions on distribution from multiple sources, including the primary insurers who have approval control of distributionsis considered Level 1 from the trust, and the Insurance Division of the State of Hawaii who has approval authority over distributions or intercompany advances. Asmarket observable inputs used to determine fair value. See fully described in Note 14: Subsequent Events, a distribution from WMMRC to WMIH of up to $10.7 million was approved by the Insurance Division of the State of Hawaii on September 13, 2017.Premium RecognitionPremiums assumed are earnedinformation.Excess Spread Financing (Level 3) – The Company estimates fair value on a daily pro-ratarecurring basis over the underlying policy terms. Premiums assumed relating to the unexpired portion of policies in force at the balance sheet date are recorded as unearned premiums. Unearned premiums also include a reserve for post default premium reserves. Post default premium reserves occur when a loan is in a default position and the servicer continues to advance the premiums. If the loan ultimately goes to claim, the premiums advanced during the period of default are subject to recapture. The Company records a default premium reserve based on information provided by the underlying mortgage insurers when they provide information on the default premium reserve separately from other reserves. The change in the post default premium reserve is reflected as a reduction or increase, as the case may be, in premiums assumed. The Company has recorded unearned premiums totaling $33 thousand and $0.3 million as of September 30, 2017 and December 31, 2016, respectively.The Company recognizes premium deficiencies when there is a probable loss on an insurance contract. Premium deficiencies are recognized if the sum of the present value of future expected lossesdiscounted cash flows with the discount rate approximating current market value for similar financial instruments. The cash flow assumptions and loss adjustment expenses, unamortized deferred acquisition costs,prepayment assumptions used in the model are based on various factors, with the key assumptions being mortgage prepayment speeds, average life, recapture rates and maintenance costs, excluding intercompany charges, exceeddiscount rate. As these prices are derived from a combination of internally developed valuation models and quoted market prices based on the value of the underlying MSRs, the Company classifies these valuations as Level 3 in the fair value disclosures. Excess spread financing is recorded in MSR related liabilities within the consolidated balance sheets. See 32Mortgage Servicing Rights Financing Liability (Level 3) - The Company estimates fair value on a recurring basis based on the present value of future expected discounted cash flows with the discount rate approximating current market value for similar financial instruments. The cash flow assumptions and prepayment assumptions used in the model are based on various factors, with the key assumptions being advance financing rates and annual advance recovery rates. As these assumptions are derived from internally developed valuation models based on the value of the underlying MSRs, the Company classifies these valuations as Level 3 in the fair value disclosures. Mortgage servicing rights financing liability is recorded in MSR related liabilities within the consolidated balance sheets. See Note 3, Mortgage Servicing Rights and Related Liabilities, for more information.Participating Interest Financing (Level 3) – The Company estimates fair value based on the present value of future unearned premiumsexpected discounted cash flows with the discount rate approximating that of similar financial instruments. As the prices are derived from both internal models and anticipated investment income. Premium deficiency reserves have beenother observable inputs, the Company classifies these valuations as Level 3 in the fair value disclosures. Participating interest financing is recorded totaling $0.5 millionin other nonrecourse debt within the consolidated balance sheets. See Note 5, Reverse Mortgage Interests, Net, and $0.3 millionNote 9, Indebtedness, for more information.HECM Securitizations (Level 3) – The Company estimates fair value using a market approach by utilizing the fair value of executed HECM securitizations. Since the executed HECM securitizations are private placements, the Company classifies these valuations as Level 3 in the fair value disclosures. HECM securitizations are recorded at amortized cost in other nonrecourse debt within the consolidated balance sheets. See Note 9, Indebtedness, for more information.33The following tables present the estimated carrying amount and fair value of Septemberthe Company’s financial instruments and other assets and liabilities measured at fair value on a recurring basis: June 30, 2020 Recurring Fair Value Measurements Fair value - Recurring basis Total Fair Value Level 1 Level 2 Level 3 Assets Mortgage loans held for sale $ 3,179 $ — $ 3,179 $ — Forward mortgage servicing rights 2,757 — — 2,757 Derivative financial instruments IRLCs 370 — — 370 Forward MBS trades 3 — 3 — LPCs 18 — — 18 Total assets $ 6,327 $ — $ 3,182 $ 3,145 Liabilities Derivative financial instruments Forward MBS trades $ 50 $ — $ 50 $ — Mortgage servicing rights financing 49 — — 49 Excess spread financing 1,124 — — 1,124 Total liabilities $ 1,223 $ — $ 50 $ 1,173 December 31, 2019 Recurring Fair Value Measurements Fair value - Recurring basis Total Fair Value Level 1 Level 2 Level 3 Assets Mortgage loans held for sale $ 4,077 $ — $ 4,077 $ — Forward mortgage servicing rights 3,496 — — 3,496 Derivative financial instruments IRLCs 135 — 135 — Forward MBS trades 7 — 7 — LPCs 12 — 12 — Total assets $ 7,727 $ — $ 4,231 $ 3,496 Liabilities Derivative financial instruments Forward MBS trades $ 12 $ — $ 12 $ — LPCs 3 — 3 — Mortgage servicing rights financing 37 — — 37 Excess spread financing 1,311 — — 1,311 Total liabilities $ 1,363 $ — $ 15 $ 1,348 34The tables below present a reconciliation for all of the Company’s Level 3 assets and liabilities measured at fair value on a recurring basis:Six Months Ended June 30, 2020 Assets Liabilities Fair value - Level 3 assets and liabilities Forward mortgage servicing rights IRLCs Excess spread financing Mortgage servicing rights financing Balance - beginning of period $ 3,496 $ 135 $ 1,311 $ 37 Total gains or losses included in earnings (1,012) 235 (101) 12 Purchases, issuances, sales, repayments and settlements Purchases 24 — — — Issuances 249 — 24 — Settlements and repayments — — (110) — Balance - end of period $ 2,757 $ 370 $ 1,124 $ 49 Six Months Ended June 30, 2019 Assets Liabilities Fair value - Level 3 assets and liabilities Forward mortgage servicing rights Excess spread financing Mortgage servicing rights financing Balance - beginning of period $ 3,665 $ 1,184 $ 32 Total gains or losses included in earnings (724) (74) 11 Purchases, issuances, sales, repayments and settlements Purchases 689 — — Issuances 169 438 — Sales (294) — — Settlements and repayments — (119) — Balance - end of period $ 3,505 $ 1,429 $ 43 As of June 30, 20172020 and December 31, 2016,2019, the Company had 0 mortgage loans held for investment as the related portfolio was sold in September 2019. During the six months ended June 30, 2019, the Company had an immaterial change in mortgage loans held for investment.As of June 30, 2020 and December 31, 2019, the Company had LPCs assets of $18 and $12, respectively. Intercompany administrative costs are excluded from the computation of premium deficiencies.Company’s premium deficiency analysis was performed on a single book basis and includes all book years and reinsurance treaties aggregated together using assumptions based on the actuarial best estimates at the balance sheet date. The calculation for premium deficiency requires significant judgment and includes estimates of future expected premiums, claims, loss adjustment expenses and investment incomeCompany had less than $1 LPCs liabilities as of June 30, 2020 and LPCs liabilities of $3 as of December 31, 2019. During the balance sheet date. Tosix months ended June 30, 2020, the extent ultimate lossesCompany had an immaterial change in LPCs assets and liabilities.No transfers were made in or out of Level 3 fair value assets and liabilities for the Company for the six months ended June 30, 2020 and 2019, with the exception of the change in classification for IRLCs of $370 and LPCs of $18 from Level 2 fair value assets to Level 3 fair value assets during the three months ended June 30, 2020.35The tables below present a summary of the estimated carrying amount and fair value of the Company’s financial instruments: June 30, 2020 Carrying
AmountFair Value Financial instruments Level 1 Level 2 Level 3 Financial assets Cash and cash equivalents $ 1,041 $ 1,041 $ — $ — Restricted cash 260 260 — — Advances and other receivables, net 668 — — 668 Reverse mortgage interests, net 5,709 — — 5,736 Mortgage loans held for sale 3,179 — 3,179 — Derivative financial instruments 391 — 3 388 Financial liabilities Unsecured senior notes(1)2,261 2,307 — — Advance facilities(1)475 — 475 — Warehouse facilities(1)4,031 — 4,031 — Mortgage servicing rights financing liability 49 — — 49 Excess spread financing 1,124 — — 1,124 Derivative financial instruments 50 — 50 — Participating interest financing(1)3,886 — — 3,857 HECM Securitization (HMBS)(1)Trust 2019-2 272 — — 272 Trust 2019-1 243 — — 243 Trust 2018-3 179 — — 179 Trust 2018-2 127 — — 127 (1)The amounts are higher or premiumspresented net of unamortized debt issuance costs, premium and discount.36December 31, 2019 Carrying
AmountFair Value Financial instruments Level 1 Level 2 Level 3 Financial assets Cash and cash equivalents $ 329 $ 329 $ — $ — Restricted cash 283 283 — — Advances and other receivables, net 988 — — 988 Reverse mortgage interests, net 6,279 — — 6,318 Mortgage loans held for sale 4,077 — 4,077 — Derivative financial instruments 153 — 153 — Financial liabilities Unsecured senior notes(1)2,366 2,505 — — Advance facilities(1)422 — 422 — Warehouse facilities(1)4,575 — 4,575 — Mortgage servicing rights financing liability 37 — — 37 Excess spread financing 1,311 — — 1,311 Derivative financial instruments 15 — 15 — Participating interest financing(1)4,299 — — 4,299 HECM Securitization (HMBS)(1)Trust 2019-2 331 — — 331 Trust 2019-1 300 — — 300 Trust 2018-3 208 — — 208 Trust 2018-2 148 — — 148 (1)The amounts are lower than estimated, additionalpresented net of unamortized debt issuance costs, premium deficiency reserves may be requiredand discount.15. Capital RequirementsCertain of the Company’s secondary market investors require minimum net worth (“capital”) requirements, as specified in the future.10Cashrespective selling and Cash EquivalentsCash and cash equivalents include cash on hand, amounts due from banks, U.S. Treasury bills and overnight investments. Except as described above in Investments Held in Trust, the Company considers all amounts that are invested in highly liquid overnight money market instruments to be cash equivalents. The Federal Deposit Insurance Corporation (“FDIC”) insures amounts on deposit with each financial institution up to limits as prescribed by law. The Companyservicing agreements. In addition, these investors may hold funds with financial institutionsrequire capital ratios in excess of the FDIC insuredstated requirements to approve large servicing transfers. To the extent that these requirements are not met, the Company’s secondary market investors may utilize a range of remedies ranging from sanctions, suspension or ultimately termination of the Company’s selling and servicing agreements, which would prohibit the Company from further originating or securitizing these specific types of mortgage loans or being an approved servicer. The Company’s various capital requirements related to its outstanding selling and servicing agreements are measured based on the Company’s operating subsidiary, Nationstar Mortgage LLC. As of June 30, 2020, the Company was in compliance with its selling and servicing capital requirements.16. Commitments and ContingenciesLitigation and RegulatoryThe Company and its subsidiaries are routinely and currently involved in a significant number of legal proceedings, including, but not limited to, judicial, arbitration, regulatory and governmental proceedings related to matters that arise in connection with the conduct of the Company’s business. The legal proceedings are at varying stages of adjudication, arbitration or investigation and are generally based on alleged violations of consumer protection, securities, employment, contract, tort, common law fraud and other numerous laws, including, without limitation, the Equal Credit Opportunity Act, Fair Debt Collection Practices Act, Fair Credit Reporting Act, Real Estate Settlement Procedures Act, National Housing Act, Homeowners Protection Act, Service Member’s Civil Relief Act, Telephone Consumer Protection Act, Truth in Lending Act, Financial Institutions Reform, Recovery, and Enforcement Act of 1989, unfair, deceptive or abusive acts or practices in violation of the Dodd-Frank Act, the Securities Act of 1933, the Securities Exchange Act of 1934, the Home Mortgage Disclosure Act, Title 11 of the United States Code (aka the “Bankruptcy Code”), False Claims Act and Making Home Affordable loan modification programs.37In addition, along with others in its industry, the Company is subject to repurchase and indemnification claims and may continue to receive claims in the future, regarding alleged breaches of representations and warranties relating to the sale of mortgage loans, the placement of mortgage loans into securitization trusts or the servicing of mortgage loans securitizations. The Company is also subject to legal actions or proceedings related to loss sharing and indemnification provisions of its various acquisitions. Certain of the pending or threatened legal proceedings include claims for substantial compensatory, punitive and/or statutory damages or claims for an indeterminate amount however,of damages.The Company’s business is also subject to extensive examinations, investigations and reviews by various federal, state and local governmental, regulatory and enforcement agencies. The Company has historically had a number of open investigations with these agencies and that trend continues. The Company is currently the subject of various governmental or regulatory investigations, subpoenas, examinations and inquiries related to its residential loan servicing and origination practices, bankruptcy and collections practices, its financial reporting and other aspects of its businesses. These matters include investigations by the Consumer Financial Protection Bureau (the “CFPB”), the Securities and Exchange Commission, the Executive Office of the United States Trustees, the Department of Justice, the Office of the Special Inspector General for the Troubled Asset Relief Program, the U.S. Department of Housing and Urban Development, the multi-state committee of mortgage banking regulators and various State Attorneys General. These specific matters and other pending or potential future investigations, subpoenas, examinations or inquiries may lead to administrative, civil or criminal proceedings or settlements, and possibly result in remedies including fines, penalties, restitution, or alterations in the Company’s business practices, and additional expenses and collateral costs. The Company is cooperating fully in these matters. Responding to these matters requires the Company to devote substantial resources, resulting in higher costs and lower net cash flows. Adverse results in any of these matters could further increase the Company’s operating expenses and reduce its revenues, require it to change business practices and limit its ability to grow and otherwise materially and adversely affect its business, reputation, financial condition or results of operation.In particular, as previously disclosed, the Company continues to progress towards resolution of certain legacy regulatory matters with (i) the CFPB, (ii) the multi-state committee of mortgage banking regulators and various State Attorneys General and (iii) the Executive Office of the United States Trustee, all of which involve examination findings in prior years for alleged violations of certain laws related to the Company’s business practices. The Company believes that it has reached a settlement in principle to resolve these matters with each of these parties. Accordingly, the Company has recorded an additional accrual during the three months ended June 30, 2020 in addition to amounts previously accrued and believes that it has fully accrued for these matters.The Company seeks to resolve all legal proceedings and other matters in the manner management believes is in the best interest of the Company and contests liability, allegations of wrongdoing and, where applicable, the amount of damages or scope of any penalties or other relief sought as appropriate in each pending matter. The Company has entered into agreements with a number of entities and regulatory agencies that toll applicable limitations periods with respect to their claims.On at least a quarterly basis, the Company assesses its liabilities and contingencies in connection with outstanding legal and regulatory and governmental proceedings utilizing the latest information available. Where available information indicates that it is probable, a liability has been incurred, and the Company can reasonably estimate the amount of the loss, an accrued liability is established. The actual costs of resolving these proceedings may be substantially higher or lower than the amounts accrued.As a legal matter develops, the Company, in conjunction with any outside counsel handling the matter, evaluates on an ongoing basis whether such matter presents a loss contingency that is both probable and estimable. If, at the time of evaluation, the loss contingency is not both probable and reasonably estimable, the matter will continue to be monitored for further developments that would make such loss contingency both probable and reasonably estimable. Once the matter is deemed to be both probable and reasonably estimable, the Company will establish an accrued liability and record a corresponding amount to legal-related expense. The Company will continue to monitor the matter for further developments that could affect the amount of the accrued liability that has been previously established. Legal-related expense for the Company, which includes legal settlements and the fees paid to external legal service providers, of $12 and $27 for the three and six months ended June 30, 2020, respectively and $21 and $32 for the three and six months ended June 30, 2019, respectively, was included in general and administrative expenses on the consolidated statements of operations.38For a number of matters for which a loss is probable or reasonably possible in future periods, whether in excess of a related accrued liability or where there is no accrued liability, the Company may be able to estimate a range of possible loss. In determining whether it is possible to provide an estimate of loss or range of possible loss, the Company reviews and evaluates its material legal matters on an ongoing basis, in conjunction with any outside counsel handling the matter. For those matters for which an estimate is possible, management currently believes the aggregate range of reasonably possible loss is $2 to $18 in excess of the accrued liability (if any) related to those matters as of June 30, 2020. This estimated range of possible loss is based upon currently available information and is subject to significant judgment, numerous assumptions and known and unknown uncertainties. The matters underlying the estimated range will change from time to time, and actual results may vary substantially from the current estimate. Those matters for which an estimate is not possible are not included within the estimated range. Therefore, this estimated range of possible loss represents what management believes to be an estimate of possible loss only for certain matters meeting these criteria. It does not represent the Company’s maximum loss exposure and the Company cannot provide assurance that its litigations reserves will not need to be adjusted in the future. Thus, the Company’s exposure and ultimate losses may be higher, possibly significantly so, than the amounts accrued or this aggregate amount.In the Company’s experience, legal proceedings are inherently unpredictable. One or more of the following factors frequently contribute to this inherent unpredictability: the proceeding is in its early stages; the damages sought are unspecified, unsupported or uncertain; it is unclear whether a case brought as a class action will be allowed to proceed on that basis or, if permitted to proceed as a class action, how the class will be defined; the other party is seeking relief other than or in addition to compensatory damages (including, in the case of regulatory and governmental investigations and inquiries, the possibility of fines and penalties); the matter presents meaningful legal uncertainties, including novel issues of law; the Company has not experiencedengaged in meaningful settlement discussions; discovery has not started or is not complete; there are significant facts in dispute; predicting possible outcomes depends on making assumptions about future decisions of courts or governmental or regulatory bodies or the behavior of other parties; and there are a large number of parties named as defendants (including where it is uncertain how damages or liability, if any, will be shared among multiple defendants). Generally, the less progress that has been made in the proceedings or the broader the range of potential results, the harder it is for the Company to estimate losses in such accountsor ranges of losses that is reasonably possible the Company could incur.Based on current knowledge, and after consultation with counsel, management believes that the current legal accrued liability within payables and accrued liabilities, is appropriate, and the amount of any incremental liability arising from these matters is not expected to have a material adverse effect on the consolidated financial condition of the Company, although the outcome of such proceedings could be material to the Company’s operating results and cash flows for a particular period depending, on among other things, the level of the Company’s revenues or income for such period. However, in the event of significant developments on existing cases, it is possible that the ultimate resolution, if unfavorable, may be material to the Company’s consolidated financial statements.Other Loss ContingenciesAs part of the Company’s ongoing operations, it acquires servicing rights of forward and reverse mortgage loan portfolios that are subject to indemnification based on the representations and warranties of the seller. From time to time, the Company will seek recovery under these representations and warranties for incurred costs. The Company believes all balances sought from sellers recorded in advances and other receivables and reverse mortgage interests represent valid claims. However, the Company acknowledges that the claims process can be prolonged due to the required time to perfect claims at the loan level. Because of the required time to perfect or remediate these claims, management relies on the sufficiency of documentation supporting the claim, current negotiations with the counterparty and other evidence to evaluate whether a reserve is required for non-recoverable balances. In the absence of successful negotiations with the seller, all amounts claimed may not exposedbe recovered. Balances may be written-off and charged against earnings when management identifies amounts where recoverability from the seller is not likely. As of June 30, 2020, the Company believes all recorded balances for which recovery is sought from the seller are valid claims, and no evidence suggests additional reserves are warranted.Loan and Other CommitmentsThe Company enters into IRLCs with prospective borrowers whereby the Company commits to lend a certain loan amount under specific terms and interest rates to the borrower. The Company also enters into LPCs with prospective sellers. These loan commitments are treated as derivatives and are carried at fair value. See Note 8, Derivative Financial Instruments, for more information.39The Company had certain reverse MSRs, reverse MSLs and reverse mortgage loans related to approximately $20,758 and $22,725 of UPB in reverse mortgage loans as of June 30, 2020 and December 31, 2019, respectively. As a servicer for these reverse mortgage loans, among other things, the Company is obligated to fund borrowers’ draws to the loan customers as required in accordance with the loan agreement. As of June 30, 2020 and December 31, 2019, the Company’s maximum unfunded advance obligation to fund borrower draws related to these reverse MSRs and loans was approximately $2,408 and $2,617, respectively. Upon funding any significant credit riskportion of these draws, the Company expects to securitize and sell the advances in transactions that will be accounted for as secured borrowings.17. Business Segment ReportingThe Company’s segments are based upon the Company’s organizational structure, which focuses primarily on the services offered. Corporate functional expenses are allocated to individual segments based on the actual cost of services performed based on direct resource utilization, estimate of percentage use for shared services or headcount percentage for certain functions. Facility costs are allocated to individual segments based on cost per headcount for specific facilities utilized. Group insurance costs are allocated to individual segments based on global cost per headcount. Non-allocated corporate expenses include the administrative costs of executive management and other corporate functions that are not directly attributable to Company’s operating segments. Revenues generated on inter-segment services performed are valued based on similar services provided to external parties.In the second quarter of 2020, the Company updated its presentation of segment assets to be aligned with a change in the reporting package provided to the Chief Operating Decision Maker. The presentation change had no impact on the segments' operations. Assets allocated to the Servicing segment include MSRs; advances and other receivables, except for co-issue MSR holdback; Servicing related mortgage loans held for sale; and other assets including property, plant and equipment, lease-related assets, prepaid assets, and goodwill. Assets allocated to Originations segment include co-issue MSR holdback in advances and other receivables; Originations related mortgage loans held for sale; derivative assets; and other assets including property, plant and equipment, lease-related assets, prepaid assets, and goodwill. Assets allocated to the Xome segment include cash and cash equivalents.Restricted CashRestrictedequivalents; tax-related assets; receivables; and other assets including property, plant and equipment, lease-related assets, prepaid assets, goodwill, and other intangible assets. All assets that are not specifically identified or allocated to a reporting segment are reported as part of Corporate/Other segment, and include cash includes (i) amounts held forand cash equivalents; tax-related assets; and intangibles assets excluding goodwill and assets allocated to Xome. Eliminations are also included in Corporate/Other segment. Prior year financial information has been adjusted retrospectively to reflect the express purposes of paying principal, interest and related fees onupdated presentation.The following tables present financial information by segment: Three Months Ended June 30, 2020 Financial information by segment Servicing Originations Xome Corporate/Other Consolidated Revenues Service related, net $ (114) $ 21 $ 106 $ (1) $ 12 Net gain on mortgage loans held for sale 45 573 — — 618 Total revenues (69) 594 106 (1) 630 Total expenses 122 167 95 35 419 Interest income 57 19 — — 76 Interest expense (117) (13) — (47) (177) Other income (expenses), net — — 1 (1) — Total other (expenses) income, net (60) 6 1 (48) (101) (Loss) income before income tax (benefit) expense $ (251) $ 433 $ 12 $ (84) $ 110 Depreciation and amortization for property and equipment and intangible assets $ 5 $ 4 $ 3 $ 6 $ 18 Total assets $ 10,736 $ 3,592 $ 135 $ 2,837 $ 17,300 40Three Months Ended June 30, 2019 Financial information by segment Servicing Originations Xome Corporate/Other Consolidated Revenues Service related, net $ 9 $ 20 $ 108 $ — $ 137 Net gain on mortgage loans held for sale 18 244 — — 262 Total revenues 27 264 108 — 399 Total expenses 189 145 101 57 492 Interest income 136 23 — 3 162 Interest expense (109) (25) — (53) (187) Other income, net — 1 — — 1 Total other income (expenses), net 27 (1) — (50) (24) (Loss) income before income tax (benefit) expense $ (135) $ 118 $ 7 $ (107) $ (117) Depreciation and amortization for property and equipment and intangible assets $ 4 $ 6 $ 3 $ 11 $ 24 Total assets $ 12,906 $ 3,462 $ 112 $ 1,925 $ 18,405 Six Months Ended June 30, 2020 Financial information by segment Servicing Originations Xome Corporate/Other Consolidated Revenues Service related, net $ (294) $ 41 $ 212 $ — $ (41) Net gain on mortgage loans held for sale 79 870 — — 949 Total revenues (215) 911 212 — 908 Total expenses 271 333 191 68 863 Interest income 140 53 — 1 194 Interest expense (230) (40) — (99) (369) Other income (expense), net — — 2 (1) 1 Total other (expenses) income, net (90) 13 2 (99) (174) (Loss) income before income tax (benefit) expense $ (576) $ 591 $ 23 $ (167) $ (129) Depreciation and amortization for property and equipment and intangible assets $ 8 $ 7 $ 6 $ 16 $ 37 Total assets $ 10,736 $ 3,592 $ 135 $ 2,837 $ 17,300 Six Months Ended June 30, 2019 Financial information by segment Servicing Originations Xome Corporate/Other Consolidated Revenues Service related, net $ (18) $ 35 $ 204 $ — $ 221 Net gain on mortgage loans held for sale 53 375 — — 428 Total revenues 35 410 204 — 649 Total expenses 384 249 200 102 935 Interest income 251 40 — 5 296 Interest expense (223) (43) — (110) (376) Other income, net — 5 11 — 16 Total other income (expenses), net 28 2 11 (105) (64) (Loss) income before income tax (benefit) expense $ (321) $ 163 $ 15 $ (207) $ (350) Depreciation and amortization for property and equipment and intangible assets $ 8 $ 9 $ 7 $ 21 $ 45 Total assets $ 12,906 $ 3,462 $ 112 $ 1,925 $ 18,405 41CAUTIONS REGARDING FORWARD-LOOKING STATEMENTSThis report contains forward-looking statements within the Runoff Notes (as defined in Note 7: Notes Payable) pursuant to the termsmeaning of the Indentures (as definedU.S. federal securities laws. These forward-looking statements include, without limitation, statements concerning plans, objectives, goals, projections, strategies, core initiatives, future events or performance, and underlying assumptions and other statements, which are not statements of historical facts, including the projected impact of COVID-19 on our business, financial performance and operating results. When used in Note 7: Notes Payable)this discussion, the words “anticipate,” “appears,” “believe,” “foresee,” “intend,” “should,” “expect,” “estimate,” “project,” “plan,” “may,” “could,” “will,” “are likely” and (ii) proceedssimilar expressions are intended to identify forward-looking statements. These statements involve predictions of the Series B Preferred Stock offering heldour future financial condition, performance, plans and strategies and are thus dependent on a number of factors including, without limitation, assumptions and data that may be imprecise or incorrect. Specific factors that may impact performance or other predictions of future actions have, in escrow.Ceding Commission ExpenseThe Company is required to pay a ceding commission to certain primary insurers pursuant to certain reinsurance agreements.Losses and Loss Adjustment ReservesThe losses and loss adjustment reserves include case basis estimates of reported losses and supplemental amounts for incurredmany but not reported (“IBNR”) losses. A default is considered the incident (e.g., the failureall cases, been identified in connection with specific forward-looking statements. As with any projection or forecast, forward-looking statements are inherently susceptible to make timely payment of mortgage payments) that may give rise to a claim for mortgage insurance. In establishing the lossesuncertainty and loss adjustment reserve, the Company based its estimates primarily on the ceded loss and loss adjustment reserves as provided by the primary mortgage guaranty carriers.WMMRC has recorded reserves at the ceded case reserves and IBNR loss levels established and reported by the primary mortgage guaranty carriers as of September 30, 2017 and December 31, 2016, respectively. Management believes that the recorded aggregate liability for unpaid losses and loss adjustment expenses at period end represents the Company’s best estimate, based upon the available data, of the amount necessary to cover the current cost of losses. However, due to the inherent uncertainty arising from fluctuations in the persistency rate of mortgage insurance claims, the Company’s size and lack of prior operating history, external factors such as future changes in regionalcircumstances, and we are under no obligation to, and express disclaim any obligation, to update or national economic conditions, judicial decisions, federal and state legislation related to mortgage restructuring and foreclosure restrictions, claims denials and coverage rescissions by primary carriers and other factors beyond the Company’s control, it is not presently possible to determinealter our forward-looking statements, whether actual loss experience will conform to the assumptions used in determining the estimated amounts for such liability at the balance sheet date. Accordingly, the ultimate liability could be significantly higher or lower, as the case may be, than the amount indicated in the financial statements and there can be no assurance that the reserve amounts recorded will be sufficient. As adjustments to these estimates become necessary, such adjustments are reflected in current operations.Loss Contract ReserveA loss contract reserve relating to contractual obligations of WMMRC was established at March 19, 2012 as a result of applying fresh start accountingnew information, future events or otherwise.A number of important factors exist that could cause future results to differ materially from historical performance and these forward-looking statements. Factors that might cause such a difference include, but are not limited to:•the severity and duration of the COVID-19 pandemic; the pandemic’s impact on the U.S. and global economies; and federal, state and local governmental responses to the pandemic•our ability to maintain or grow the size of our servicing portfolio;•our ability to maintain or grow our originations volume and profitability;•our ability to recapture voluntary prepayments related to our existing servicing portfolio;•our shift in compliance with Accounting Standards Codification (“ASC”) 805-10-55-21 (b) (1)the mix of our servicing portfolio to subservicing, which defines a loss contract as “a contractis highly concentrated;•delays in which the unavoidableour ability to collect or be reimbursed for servicing advances;•our ability to obtain sufficient liquidity and capital to operate our business;•changes in prevailing interest rates;•our ability to finance and recover costs of meeting the obligation under the contract exceed the economicour reverse servicing operations;•our ability to successfully implement our strategic initiatives;•our ability to realize anticipated benefits expectedof our previous acquisitions;•our ability to use net operating loss carryforwards and other tax attributes;•changes in our business relationships or changes in servicing guidelines with Fannie Mae, Freddie Mac and Ginnie Mae;•Xome’s ability to compete in highly competitive markets;•our ability to pay down debt;•our ability to manage legal and regulatory examinations and enforcement investigations and proceedings, compliance requirements and related costs;•our ability to prevent cyber intrusions and mitigate cyber risks; and•our ability to maintain our licenses and other regulatory approvals.All of these factors are difficult to predict, contain uncertainties that may materially affect actual results and may be received under it.” The value of this reservebeyond our control. New factors emerge from time to time, and it is analyzed quarterly and is adjusted accordingly. The adjustment (if any)not possible for our management to the reserve produces an expensepredict all such factors or contra-expense in the condensed consolidated statements of operations.Derivative Embedded Conversion FeatureThe Company has recorded a derivative embedded conversion feature of the Series B Preferred Stock which is adjusted to its fair value as determined using Level 3 inputs described above under Fair Value Measurement. The change in fair value of the derivative embedded conversion feature is calculated at each reporting date and recorded as other income or other expense on the condensed consolidated statement of operations.Other Liabilities11At September 30, 2017, the total balance of $13.8 million of other liabilities is comprised of $12.3 million of accrued fees relating to the Series B Preferred Stock offering, an accrual for professional fees and recurring business expenses currently payable of approximately $0.8 million and $0.7 million of accrued dividends relating to the Series B Preferred Stock. The accrued fees would be paid in the event of a Qualified Acquisition, as more fully described in Note 6: Service Agreements and Related Party Transactions.Comprehensive IncomeThe Company has no comprehensive income other than the net income disclosed in the condensed consolidated statement of operations.Net Income Per Common ShareIn calculating earnings per share, the Company follows the two-class method, which distinguishes between the classes of securities based on the proportionate participation rights of each security type in the Company's undistributed income. The Series A Preferred Stock and the Series B Preferred Stock are treated as one class for purposes of applying the two-class method, because they have substantially equal rights and share equally on an as converted basis with respect to income available to WMIH common stockholders.Basic net income per WMIH common share is computed by dividing net income attributable to WMIH’s common stockholders by the weighted-average number of common shares outstanding for the period after subtracting the weighted-average of any unvested restricted shares outstanding, as these are subject to repurchase. Basic net income attributable to common stockholders is computed by deducting preferred dividends and the basic calculation of undistributed earnings attributable to participating securities from net income.Diluted net income per WMIH common share is computed by dividing net income attributable to WMIH’s common stockholders by the weighted-average number of common shares outstanding during the period after subtracting the weighted-average of any unvested restricted shares outstanding, as these are subject to repurchase, and adding any potentially dilutive WMIH common stock equivalents outstanding during the period. Diluted net income attributable to common stockholders is computed by deducting preferred dividends and the diluted calculation of undistributed earnings attributable to participating securities from net income.If common stock equivalents exist, in periods where there is a net loss, diluted net loss per common share would be equal to or less than basic net loss per common share, sinceassess the effect of including any common stock equivalents would be antidilutive.Equity-Based CompensationOn May 22, 2012, WMIH’s Board of Directors (the “Board” or “Board of Directors”) approved the Company’s 2012 Long-Term Incentive Plan (the “2012 Plan”) so that awards of restricted stock could be made to its non-employee directors and to have a plan in place for awards of equity based compensation to executives and others in connection with the Company’s operations and future strategic plans. A total of 2.0 million shares of WMIH’s common stock were initially reserved for future issuance under the 2012 Plan, which became effective upon the Board approvaleach such new factor on May 22, 2012. On February 10, 2014, the Board approved and adopted a First Amendment to the 2012 Plan, pursuant to which the number of shares of WMIH’s common stock reserved and available for grants under the 2012 Plan was increased from 2.0 million shares to 3.0 million shares, and the terms of the 2012 Plan were modified to permit such an increase through action of the Board, except when stockholder approval is necessary to comply with any applicable law, regulation or rule of any stock exchange on which WMIH’s shares are listed, quoted or traded. On February 25, 2015, the number of shares authorized and available for awards under the 2012 Plan was increased from 3.0 million to 12.0 million shares of WMIH’s common stock, subject to approval of stockholders of WMIH. This approval was received at the Company’s Annual Meeting of Stockholders on April 28, 2015. The 2012 Plan provides for the granting of restricted shares and other cash and share based awards. The value of restricted stock is generally determined using the fair market value determined to be the trading price at the close of business on the respective date the awards were granted.Income TaxesThe Company follows the asset and liability method of accounting for income taxes. Under this method, deferred tax assets and liabilities are recognized for the future income tax consequences attributable to differences between the carrying amounts and tax bases of assets and liabilities and losses carried forward and tax credits. Deferred tax assets and liabilities are measured using enacted tax rates and laws applicable to the years in which the differences are expected to reverse. The effect on deferred tax assets and liabilities of a change in tax rates is recognized in income in the period that includes the enactment date. A valuation allowance is provided to the extent that it is more likely than not that deferred tax assets will not be realized.12The Company recognizes the financial statement effects of a tax position when it is more likely than not, based on the technical merits, that the position will be sustained upon examination. Penalties and interest, of which there are none, would be reflected in income tax expense. Tax years are open to the extent the Company has net operating loss (“NOL”) carry-forwards available to be utilized currently.Dividend PolicyWMIH has paid no dividends on its common stock on or after the Effective Date and currently has no plans to pay a dividend on its common stock.WMIH has declared and paid $13.5 million and $18.0 million of dividends on its Series B Preferred Stock for the nine months ended September 30, 2017 and the year ended December 31, 2016, respectively. Additionally, WMIH has accrued unpaid and undeclared dividends of $0.7 million, based on the Series B Preferred Stock 3% interest rate, as of both September 30, 2017 and December 31, 2016.New Accounting PronouncementsThe Company has reviewed new accounting pronouncements issued between August 9, 2017, the filing date of our most recent prior Form 10-Q, and the filing date of this Form 10-Q and has determined that no pronouncements issued are relevant to the Company, and/or have a material impact on the Company’s consolidated financial position, results of operations or disclosure requirements. 13The Company, through WMMRC, reinsures mortgage guaranty risks of mortgage loans originated by affiliates of the Company during the period from 1997 through 2008. WMMRC is (or was) a party to reinsurance agreements with UGRIC, GMIC, MGIC, PMI, Radian, RMIC and Triad. The agreements with UGRIC and Triad were placed into runoff effective May 31, 2008. The agreements with all other primary mortgage insurers were placed into runoff effective September 26, 2008. The reinsurance agreements with Triad, PMI and UGRIC were commuted on August 31, 2009, October 2, 2012 and April 3, 2014, respectively. On October 23, 2017, the reinsurance agreement with Radian was commuted and the related trust assets were released to WMMRC. For more information see Note 14: Subsequent Events.All agreements between WMMRC and the primary mortgage insurers are on an excess of loss basis, except for a reinsurance treaty with GMIC during 2008, which is reinsured on a 50% quota share basis. Pursuant to the excess of loss reinsurance treaties, WMMRC reinsures a second loss layer which ranges from 5% to 10% of the risk in force in excess of the primary mortgage insurer’s first loss percentage which range from 4% to 5%. Each calendar year, or book year, is treated separately from other years when calculating losses. In return for accepting a portion of the risk, WMMRC receives, net of ceding commission, a percentage of the premium that ranges from 25% to 40%.As security for the ceding insurers, WMMRC has entered into separate trust agreements with each of the primary mortgage insurance companies whereby a portion of the funds from premiums assumed are held in trust accounts for the benefit of each separate insurer. Pursuant to the terms of the reinsurance agreements, WMMRC is required to keep such assets in trust for a minimum of five years and is subject to claims for up to ten years from termination of obligations arising from the last year in which insurance business was written prior to runoff. Release of funds from the trust by WMMRC requires approval from the primary mortgage insurance companies.Premiums assumed and earned are as follows for the periods ended September 30, 2017 and 2016, respectively:The components of the liability for losses and loss adjustment reserves are as follows as of September 30, 2017 and December 31, 2016, respectively:Losses and loss adjustment reserve activity are as follows for the nine months ended September 30, 2017 and the year ended December 31, 2016, respectively: The loss contract reserve balance is analyzed and adjusted quarterly. The balance in the reserve was zero and $5.6 million as of September 30, 2017 and December 31, 2016, respectively. The value of this reserve decreased by $5.6 million during the nine months ended September 30, 2017 and decreased by $2.3 million during the nine months ended September 30, 2016. In periods during which a reduction in the loss contract reserve occurs, a corresponding decrease in expense is reflected in the condensed consolidated statement of operations for the respective period. 14The amortized cost, gross unrealized gains, gross unrealized losses and estimated fair values of total fixed-maturity securities and total fixed-maturity securities held in trust at September 30, 2017, are as follows: The amortized cost, gross unrealized gains, gross unrealized losses and estimated fair values of total fixed-maturity securities and total fixed-maturity securities held in trust at December 31, 2016, are as follows:Amortized cost and estimated fair value of fixed-maturity securities at September 30, 2017 by contractual maturity are as follows:Actual maturities may differ from contractual maturities because certain borrowers have the right to call or prepay obligations with or without call or prepayment penalties.Net investment income for the three and nine months ended September 30, 2017 and 2016, respectively, is summarized as follows:15The following table shows how the Company’s investments are categorized in accordance with fair value measurement, as ofSeptember 30, 2017:The following table shows how the Company’s investments are categorized in accordance with fair value measurement, as of December 31, 2016:A review of the fair value hierarchy classifications of the Company’s investments is conducted quarterly. Changes in the observability of valuation inputs may result in a reclassification for certain financial assets or liabilities. Reclassifications are reported as transfers in or transfers out of the applicable Level at the end of the calendar quarter in which the reclassifications occur. During the nine months ended September 30, 2017 and the year ended December 31, 2016, $0.9 million and $11.0 million, respectively, of investments were transferred from Level 2 to Level 1 as a result of improving market conditions for short-term and investment grade corporate securities.
from Level 1 to
Level 2
from Level 2
to Level 1
from Level 1 to
Level 2
from Level 2
to Level 116For the nine months ended September 30, 2017, the Company recorded net income attributable to common and participating stockholders of approximately $21.4 million. The Company projects tax losses for the year ending December 31, 2017. Due to this projected tax loss and the existence of NOL carry-forwards which have a 100% valuation allowance recorded to reduce them to zero, the Company has not recorded an income tax expense or benefit for the nine months ended September 30, 2017. The Company recorded no income tax expense or benefit for the year ended December 31, 2016 due to tax losses in that period.The Company files a consolidated federal income tax return. Pursuant to a tax sharing agreement, WMMRC’s federal income tax liability is calculated on a separate return basis determined by applying 35% to taxable income, in accordance with the provisions of the Internal Revenue Code of 1986, as amended (the “Code”), that apply to property and casualty insurance companies. WMIH, as WMMRC’s parent, pays federal income taxes on behalf of WMMRC and settles the federal income tax obligation on a current basis in accordance with the tax sharing agreement. WMMRC made no tax payments to WMIH during the nine months ended September 30, 2017 or the year ended December 31, 2016 associated with the Company’s tax liability from the preceding year.Deferred federal income taxes arise from temporary differences between the valuation of assets and liabilities as determined for financial reporting purposes and income tax purposes. Temporary differences principally relate to discounting of loss reserves, accruals, derivate instruments, net operating losses and unrealized gains and losses on investments. As of September 30, 2017 and December 31, 2016, the Company recorded a valuation allowance equal to 100% of the net deferred federal income tax asset due to uncertainty regarding the Company’s ability to realize these benefits in the future.On March 19, 2012, WMIH emerged from bankruptcy. Prior to emergence, WMI abandoned the stock of WMB, thereby generating a worthless stock deduction of approximately $8.37 billion which gave rise to a NOL for the year ended December 31, 2012. Under Section 382 of the Code (“Section 382”), and based on the Company’s analysis,business. Although we believe that the Company experienced an “ownership change” (generally definedassumptions underlying the forward-looking statements contained herein are reasonable, any of the assumptions could be inaccurate, and any of these statements included herein may prove to be inaccurate. Given the significant uncertainties inherent in the forward-looking statements included herein, the inclusion of such information should not be regarded as a greater than 50% change (by value) in our equity ownership over a three-year period) on March 19, 2012, and our ability to use our pre-change of control NOLs andrepresentation by us or any other pre-change tax attributes against our post-change income was limited. The Section 382 limitation is applied annually so as to limit the use of our pre-change NOLs to an amount that generally equals the value of our stock immediately before the ownership change multiplied by a designated federal long-term tax-exempt rate. Due to applicable limitations under Section 382 and a reduction of tax attributes due to cancellation of indebtedness, a portion of these NOLs were limited and will expire unused. We believeperson that the total availableresults or conditions described in such statements or our objectives and utilizable NOL carry-forward at December 31, 2016 was approximately $6.0 billion. At September 30, 2017, there was no limitation on the useplans will be achieved. Please refer to these NOLs. These NOLs will begin to expireFinancial Condition and Results of Operations, included in 2031. The Company’s ability to utilize the NOLs or realize any benefits related to the NOLs is subject to a number of risks. (See Part I-Item 1A. Risk Factorsthis report and in our Annual Report on Form 10-K for the year ended December 31, 2016).The Company accounts for uncertain tax positions in accordance with the income tax accounting guidance. The Company has analyzed filing positions in the federal and state jurisdictions where it is required to file tax returns, as well as the open tax years in these jurisdictions. Tax years 2011 to present are subject to examination by the Internal Revenue Service. The Company believes that its federal income tax filing positions and deductions will be sustained on audit and does not anticipate any adjustments that will result in a material change to its financial position. Therefore, no reserves for uncertain federal income tax positions have been recorded. The Company recognizes interest and penalties related to unrecognized tax benefits as a component of the provision for federal income taxes. The Company did not incur any federal income tax related interest income, interest expense or penalties for the nine months ended September 30, 2017 or for the year ended December 31, 2016.Note 6: Service Agreements and Related Party TransactionsWMMRC has engaged a Hawaii-based service provider, Marsh Management Services, Inc., to provide accounting and related management services for its operations. In exchange for performing these services, WMMRC pays such service provider a management fee.WMIH entered into an Investment Management Agreement and an Administrative Services Agreement with WMMRC on March 19, 2012. Each of these agreements was approved by WMMRC’s primary regulator, the Insurance Division of the State of Hawaii. Total amounts incurred under these agreements totaled $1.0 million and $1.0 million for the nine months ended September 30, 2017 and 2016, respectively. The expense and related income eliminate on consolidation. These agreements are described below.Under the terms of such Investment Management Agreement, WMIH receives from WMMRC a fee equal to the product of (x) the ending dollar amount of assets under management during the calendar month in question and (y) .002 divided by 12. WMIH is responsible for investing the funds of WMMRC based on applicable investment criteria and subject to rules and regulations to which WMMRC is subject.17Under the terms of such Administrative Services Agreement, WMIH receives from WMMRC a fee of $110 thousand per month. WMIH is responsible for providing administrative services to support, among other things, supervision, governance, financial administration and reporting, risk management and claims management as may be necessary, together with such other general or specific administrative services that may be reasonably required or requested by WMMRC in the ordinary course of its business.On March 22, 2012, WMIH and the WMI Liquidating Trust (the “Trust”) entered into a Transition Services Agreement (the “TSA”). Pursuant to the TSA, the Trust makes available certain services and employees. The TSA provides the Company with basic infrastructure and support services to facilitate the Company’s operations. The TSA, as amended, extends the term of the agreement through January 31, 2019 with automatic renewals thereafter for successive additional three-month terms, subject to non-renewal at the end of any additional term upon written notice by either party at least 30 days prior to the expiration of the additional term.In connection with implementing the Company’s Seventh Amended Joint Plan of Affiliated Debtors Pursuant to Chapter 11 of the United States Bankruptcy Code (as modified, the “Plan”), certain holders of specified “Allowed Claims” had the right to elect to receive such holder’s “Pro Rata Share of the Common Stock Allotment.” Essentially, the Plan defines the “Pro Rata Share of the Common Stock Allotment” as a pro rata share of ten million (10,000,000) shares of WMIH’s common stock (i.e. five percent (5%)) issued and outstanding on the Effective Date. Holders exercising the foregoing election did so in lieu of receiving (i) 50% of such holder’s interest in and to certain litigation proceeds that could be realized by the Trust on account of certain claims and causes of action asserted by the Trust as contemplated by the Plan (“Litigation Proceeds”), and (ii) some or all of the Runoff Notes to which such holder may be entitled (if such holder elected to receive Runoff Notes in accordance with the terms of the Plan).If a holder exercised the election described above and, as a result of such election, received shares of WMIH’s common stock, then such holder’s share of Runoff Notes to which the election was effective (i.e., One Dollar ($1.00) of original principal amount of Runoff Notes for each share of WMIH’s common stock) were not issued. In addition, as a result of making the aforementioned election, such holders conveyed to WMIH, and WMIH retained an economic interest in Litigation Proceeds, if any, recovered by the Trust in connection with certain litigation brought by the Trust as contemplated by the Plan. Distributions, if any, to WMIH on account of the foregoing will be effected in accordance with the Plan and the court order confirming the Plan.On or about October 14, 2014, the Trust filed a lawsuit in King County Superior Court in the State of Washington against 16 former directors and officers of WMI (the “D&O Litigation”). The Trust’s complaint alleged, among other things, that the defendants named therein breached their fiduciary duties to WMI and committed corporate waste and fraud by squandering WMI’s financial resources. In connection with the settlement of the D&O Litigation, during the year ended December 31, 2015, among the Trust, certain former directors and officers of WMI and certain insurance carriers that underwrote director and officer liability insurance policies for the benefit of WMI and its affiliates (including such former directors and officers), such insurance carriers agreed to pay the Trust $37.0 million, of which $3.0 million would be placed into a segregated reserve account (the “RSA Reserve”) to be administered by a third party pursuant to the terms of a Reserve Settlement Agreement (the “RSA”).During the years ended December 31, 2016 and 2015, WMIH had other income of $123 thousand and $7.8 million, respectively, as a result of its receipt of net Litigation Proceeds related to the D&O Litigation. As of September 30, 2017, $1.5 million remained in the RSA Reserve. Under the RSA, funds are released from the RSA Reserve to the Trust if and when certain designated conditions are satisfied. If and when these funds are released to the Trust, and to the extent WMIH is entitled to receive such funds in accordance with the Plan, it is anticipated the Trust will make payments to WMIH in an amount equal to WMIH’s share of Litigation Proceeds as provided under the Plan. Due to the contingent nature of future distributions from the RSA Reserve, there can be no assurance that WMIH will receive any distributions from the remaining balance in the RSA Reserve in the future. During the nine months ended September 30, 2017, WMIH has recorded income from Litigation Proceeds of $123 thousand. As of September 30, 2017, WMIH has not received any Litigation Proceeds, other than as described above. In preparation for the offering of the Series B Preferred Stock, WMIH engaged KKR Capital Markets LLC (“KCM”), an affiliate of KKR & Co. L.P., to act as a joint book-running manager for the Series B Preferred Stock offering. KCM also acted as an initial purchaser of the Series B Preferred Stock. During the year ended December 31, 2015, as a result of satisfying a post-closing covenant to reincorporate in the State of Delaware within 180 days following the closing of the Series B Preferred Stock offering, we paid $8.25 million to KCM. Upon consummation of a “Qualified Acquisition” (as such term is defined in Article VI of the Certificate of Incorporation), we will pay KCM an additional fee (the “KCM Deferred Fee”) of $8.25 million. We have recorded the KCM Deferred Fee in “other liabilities” on our condensed consolidated balance sheet and this amount was included in “accrued fees relating to Series B Preferred Stock issuance” on our condensed consolidated statements of cash flows.Note 7: Notes PayableOn the Effective Date, WMIH issued $110.0 million aggregate principal amount of its 13% Senior First Lien Notes due 2030 (the “First Lien Notes”) under an indenture, dated as of March 19, 2012 (the “First Lien Indenture”), between WMIH and Wilmington Trust, National Association, as Trustee. Additionally, WMIH issued $20.0 million aggregate principal amount of its 13% Senior Second Lien Notes due 2030 (the “Second Lien Notes” and, together with the First Lien Notes, the “Runoff Notes”) under an indenture, dated as of March 19, 2012 (the “Second Lien Indenture” and, together with the First Lien Indenture, the “Indentures”), between WMIH and Law Debenture Trust Company of New York, as Trustee. On January 5, 2017, The Law Debenture Trust Company of New York notified WMIH that it had completed the transfer of substantially all of its corporate trust business to Delaware Trust Company, and that Delaware Trust Company had become the successor trustee under the Second Lien Indenture. The Runoff Notes were scheduled to mature on March 19, 2030 and pay interest quarterly.The Runoff Notes were secured by, and had a specified priority in right of payment in, a securities or deposit account into which WMIH was required to deposit distributions it received of Runoff Proceeds (as defined in the Indentures) (the “Collateral Account”). WMIH agreed to cause WMMRC, while the Runoff Notes were outstanding, to deposit all distributions, dividends or other receipts in respect of Runoff Proceeds Distributions (as defined in the Indentures) on the date paid to WMIH in the Collateral Account established in accordance with the terms of the Indentures. On any interest payment date, payments were made from the Collateral Account and from any other Runoff Proceeds Distributions in the priority set forth in the Indentures. In connection with certain interest payments due and payable in respect of the First and Second Lien Notes, WMIH elected, consistent with the terms of the Indentures, to issue payment-in-kind notes in lieu of making such interest payments in cash when no cash was available.As of April 15, 2015, the First Lien Notes were fully redeemed by the Company, and on April 27, 2015, the First Lien Indenture was satisfied and discharged.Second Lien Note principal outstanding totaled zero and approximately $18.8 million as of September 30, 2017 and December 31, 2016, respectively. Approximately $18.8 million of Second Lien Note principal was paid during the nine months ended September 30, 2017, and $2.9 million of Second Lien Note principal was paid during the year ended December 31, 2016. Interest on Second Lien Notes paid in cash totaled approximately $2.0 million during each of the nine months ended September 30, 2017 and 2016. As of September 29, 2017, the Second Lien Notes were fully redeemed by the Company, and on October 2, 2017, the Second Lien Indenture was satisfied and discharged. As a result of the satisfaction and discharge of the Second Lien Indenture the Collateral Account was subsequently closed and remaining funds transferred to cash and cash equivalents to be used for general corporate purposes. For more information see Note 14: Subsequent Events.Note 8: Financing ArrangementsAs of September 30, 2017, the Company had no debt financing arrangements in place. As of December 31, 2016, the Company had no debt financing arrangements in place other than the Second Lien Notes which are described in Note 7: Notes Payable.Note 9: Capital Stock and Derivative InstrumentsOn the Effective Date, all shares of common and preferred equity securities previously issued by WMI were cancelled and extinguished. As of the Effective Date, and pursuant to WMIHC’s Amended and Restated Articles of Incorporation (the “Articles”), WMIHC was authorized to issue up to 500,000,000 shares of common stock and up to 5,000,000 shares of blank check preferred stock, in one or more series, each with a par value of $0.00001 per share. 200,000,000 shares of common stock were issued by WMIHC pursuant to the Plan and in reliance on Section 1145 of the United States Bankruptcy Code on the Effective Date.On the Reincorporation Date all shares of common and preferred equity securities previously issued by WMIHC automatically were converted into one share of the substantially similar common stock, Series A Preferred Stock or Series B Preferred Stock, as applicable, of WMIH. At the same time, each outstanding option, right or warrant to acquire shares of WMIH’s common stock was converted into an option, right or warrant to acquire an equal number of shares of WMIH’s common stock under the same terms and conditions as the original options, rights or warrants. As of the Reincorporation Date, and pursuant to the Certificate of Incorporation, WMIH is authorized to issue up to 3,500,000,000 shares of common stock and up to 10,000,000 shares of blank check preferred stock, in one or more series, each with a par value of $0.00001 per share.All of the terms of the agreements described below and attributed to WMIH are also attributable to WMIHC relative to the various agreements and instruments prior to the Reincorporation Date. The references to WMIH are based on the date this Form 10-Q has been filed. The references would have been to WMIHC prior to the Reincorporation Date.19On January 30, 2014, WMIH entered into (i) an investment agreement, dated as of January 30, 2014 (the “Investment Agreement”), with KKR Fund Holdings L.P. (“KKR Fund”) and, for limited purposes, KKR Management Holdings L.P., and (ii) an investor rights agreement, dated as of January 30, 2014 (the “Investor Rights Agreement”), with KKR Fund. On January 30, 2014, pursuant to the Investment Agreement, WMIH issued 1,000,000 shares of its Series A Preferred Stock having the terms, rights, obligations and preferences contained in the Articles of Amendment of WMIH dated January 30, 2014 for a purchase price equal to $11.1 million and has issued to KKR Fund warrants to purchase, in the aggregate, 61.4 million shares of WMIH’s common stock, 30.7 million of which have an exercise price of $1.32 per share and 30.7 million of which have an exercise price of $1.43 per share (together, the “Warrants”). The Series A Preferred Stock has rights substantially similar to those associated with WMIH’s common stock, with the exception of a liquidation preference, conversion rights and customary anti-dilution protections. The Series A Preferred Stock has a liquidation preference equal to the greater of (i) $10.00 per one million shares of Series A Preferred Stock plus declared but unpaid dividends on such shares and (ii) the amount that the holder would be entitled to in a relevant transaction had the Series A Preferred Stock been converted to common stock of WMIH. The Series A Preferred Stock is convertible at a conversion price of $1.10 per share into shares of common stock of WMIH either at the option of the holder or automatically upon transfer by KKR Fund to a non-affiliated party. As a result of the calculation of a beneficial conversion feature as required by ASC topic 470 - Debt a preferred deemed dividend of $9.5 million was recorded in conjunction with the issuance of the Series A Preferred Stock. This preferred deemed dividend resulted in an increase to our accumulated deficit, and an increase in additional paid in capital. Further, KKR Fund, as the holder of the Series A Preferred Stock and the Warrants, has received other rights pursuant to the Investor Rights Agreement as described below.The Warrants have a five-year term from the date of issuance and are subject to customary structural adjustment provisions for stock splits, combinations, recapitalizations and other similar transactions. KKR Fund’s rights as a holder of the Series A Preferred Stock and the Warrants, and the rights of any subsequent holder that is an affiliate of KKR Fund (together with KKR Fund, the “Series A Holders”) are governed by the Investor Rights Agreement. In accordance with the Investor Rights Agreement, except for the issuance of WMIH’s common stock in respect of the Warrants and the Series A Preferred Stock, KKR Fund and its affiliates shall not purchase or acquire any equity securities of WMIH or its subsidiaries without WMIH’s prior written consent, subject to certain exceptions.The Investor Rights Agreement also provides the Series A Holders with registration rights, including three long form demand registration rights, unlimited short form demand registration rights and customary piggyback registration rights with respect to WMIH’s common stock (and WMIH’s common stock underlying the Series A Preferred Stock and the Warrants), subject to certain minimum thresholds, customary blackout periods and lockups of 180 days. On July 1, 2015, WMIH filed a shelf registration statement (the “Initial Registration Statement”) covering resales of Series B Preferred Stock and WMIH’s common stock issuable upon mandatory conversion of the Series B Preferred Stock. On November 23, 2015, WMIH amended the Initial Registration Statement to cover WMIH’s common stock issuable upon conversion of the Series A Preferred Stock and shares of WMIH’s common stock issuable upon exercise of warrants issued in connection with the issuance of our Series A Preferred Stock currently outstanding (as amended, the “Registration Statement”). The Registration Statement was declared effective under the Securities Act on November 25, 2015.For as long as the Series A Holders beneficially own any shares of common stock of WMIH or Series A Preferred Stock or any of the Warrants, WMIH has agreed to provide customary Rule 144A information rights, to provide the Series A Holders with regular audited and unaudited financial statements and to allow the Series A Holders or their representatives to inspect WMIH’s books and records.The foregoing description of (i) the Investor Rights Agreement is qualified in its entirety by reference to the Investor Rights Agreement, which was filed with the SEC as Exhibit 4.2 on Form 8-K on January 31, 2014, and incorporated by reference, (ii) the Warrants are qualified in their entirety by reference to the Form of Tranche A Warrant and Form of Tranche B Warrant, which were filed with the SEC as Exhibits 4.3 and 4.4, respectively, on Form 8-K on January 31, 2014, and incorporated by reference, (iii) the Series A Preferred Stock is qualified in its entirety by reference to the Articles of Amendment of WMIH dated January 30, 2014, which were filed with the SEC as Exhibit 4.5 on Form 8-K on January 31, 2014, and incorporated by reference, the Form of Series A Convertible Preferred Stock Certificate, which was filed with the SEC as Exhibit 4.6 on Form 8-K on January 31, 2014, and incorporated by reference, and the Certificate of Incorporation, which was filed with the SEC as Exhibit 3.1 on Form 8-K12G3 on May 13, 2015, and incorporated by reference, and (iv) the Investment Agreement is qualified in its entirety by reference to the Investment Agreement, which was filed with the SEC as Exhibit 10.1 on Form 8-K on January 31, 2014, and incorporated by reference.On January 5, 2015, WMIH, in connection with an offering of 600,000 shares of its Series B Preferred Stock, filed with the Secretary of State of Washington Articles of Amendment of Articles of Incorporation (the “Articles of Amendment”) containing the Designation of Rights and Preferences of the 3% Series B Convertible Preferred Stock (the “Certificate of Designation”) creating the Series B Preferred Stock and designating the rights and preferences of the Series B Preferred Stock.20The foregoing descriptions of the Articles of Amendment and the Certificate of Designation are qualified in their entirety by the provisions of the Articles of Amendment and the Certificate of Designation, filed as Exhibits 3.1 and 4.1 to a Form 8-K on January 5, 2015, respectively, and incorporated by reference herein, and the Certificate of Incorporation, which was filed with the SEC as Exhibit 3.1 on Form 8-K12G3 on May 13, 2015, and incorporated by reference.On January 5, 2015, in connection with the offering and pursuant to that certain Purchase Agreement, dated December 19, 2014 (the “Purchase Agreement”), by and among WMIH, Citigroup Global Markets Inc. (“Citi”) and KCM (KCM and Citi together, the “Initial Purchasers”), WMIH entered into a Registration Rights Agreement with the Initial Purchasers (the “Registration Rights Agreement”), pursuant to which WMIH has agreed that, subject to certain conditions, WMIH will use its reasonable efforts to (i) file a shelf registration statement covering resales of WMIH’s common stock issuable upon mandatory conversion of the Series B Preferred Stock no later than six months after January 5, 2015 (the “Issue Date”); (ii) file a shelf registration statement covering resales of the Series B Preferred Stock no later than one year after the Issue Date; and (iii) cause each of these shelf registration statements to be declared effective under the Securities Act. On July 1, 2015, WMIH filed the Initial Registration Statement covering resales of Series B Preferred Stock and shares of WMIH’s common stock issuable upon mandatory conversion of the Series B Preferred Stock. On November 23, 2015, WMIH amended the Initial Registration Statement to cover WMIH’s common stock issuable upon conversion of the Series A Preferred Stock and shares of WMIH’s common stock issuable upon exercise of warrants issued in connection with the issuance of our Series A Preferred Stock currently outstanding. The Registration Statement was declared effective under the Securities Act on November 25, 2015.The foregoing description of the Registration Rights Agreement is qualified in its entirety by the provisions of the Registration Rights Agreement, filed on Form 8-K on January 5, 2015, as Exhibit 10.1 and incorporated by reference herein.On January 5, 2015, in connection with the offering and pursuant to the Purchase Agreement, WMIH entered into an Escrow Agreement (the “Escrow Agreement”) with Citibank, N.A., as Escrow Agent (the “Escrow Agent”), pursuant to which WMIH caused to be deposited with the Escrow Agent the amount of $598.5 million, representing the proceeds of the offering of Series B Preferred Stock less offering fees payable on the Issue Date but before payment of other offering fees and expenses (including fees contingent upon future events). These net proceeds have been, and will be, released from escrow from time to time to WMIH as instructed by WMIH in amounts necessary to (i) pay certain fees related to the offering that may become payable to the Initial Purchasers, (ii) finance WMIH’s efforts to explore and/or fund, in whole or in part, acquisitions, whether completed or not, including reasonable attorney fees and expenses related thereto, accounting expenses, due diligence and financial advisor fees and expenses, (iii) pay certain amounts that may become payable to the holders of the Series B Preferred Stock upon the occurrence of certain put events, (iv) pay certain amounts that would become payable to the holders of the Series B Preferred Stock upon a mandatory redemption of the Series B Preferred Stock, and (v) pay certain expenses related to the offering. The entire net proceeds will be released from escrow as instructed by WMIH upon consummation of a Qualified Acquisition (as defined in Article VI of the Certificate of Incorporation). If a Qualified Acquisition is not consummated by January 5, 2018, and no Acquisitions (as defined in Article VI of the Certificate of Incorporation) have been consummated such that all of the Series B Preferred Stock remains outstanding and has not been converted to WMIH’s common stock, the outstanding Series B Preferred Stock becomes redeemable. The aggregate redemption costs, assuming all 600,000 shares remain outstanding, of all of the Series B Preferred Stock is $600.0 million, plus accrued and unpaid dividends, if any, whether or not declared. As of September 30, 2017 and December 31, 2016, the balance remaining in the escrow account totaled approximately $577.2 million and $572.9 million, respectively. The foregoing description of the Escrow Agreement is qualified in its entirety by the provisions of the Escrow Agreement, filed on Form 8-K on January 5, 2015, as Exhibit 10.2 and incorporated by reference herein.If the Series B Preferred Stock is redeemed or determined likely to be redeemed, the Company would be required to record a charge to earnings of approximately $97.8 million to accrete the value of the Series B Preferred Stock to the $600 million redemption value. The Company continues to pursue its business strategy of consummating an acquisition, and to explore potential financing and refinancing alternatives, and as of September 30, 2017, the Company has determined that recording for accretion to the Series B Preferred Stock’s redemption value is not required.21The Series B Preferred Stock are hybrid financial instruments that blend characteristics of both equity and debt securities. The terms of the Series B Preferred Stock provide for either redemption of the principal and interest for cash at maturity or in the event of certain predetermined circumstances (“Forward Component”) or mandatory conversion into WMIH’s common stock (“Embedded Conversion Feature” or “ECF”). The Series B Preferred Stock also embody contingent equity-linked share price protections on the ECF in the form of a variable conversion price based on a 20 trading day average of volume weighted-average price. Upon any conversion of Series B Preferred Stock in accordance with its terms, the Series B Preferred Stock shall convert based on the outstanding principal and accrued interest, subject to a floor of $1.75 per share of WMIH’s common stock and a maximum of $2.25 per share. As a result, the Company determined that the Series B Preferred Stock contain certain embedded derivative features. Management’s evaluation resulted in the conclusion that the compound derivative financial instrument required bifurcation and separately accounted for the embedded conversion feature option as a derivative. A derivative liability results primarily when the Company average stock price (as defined in the Certificate of Incorporation) exceeds the conversion price, including the ceiling conversion price of $2.25, as defined by the Certificate of Incorporation. A derivative asset results primarily when the Company’s average stock price is less than the conversion price, including the floor price of $1.75. The aggregate fair value of the embedded conversion feature was a liability of $66.2 million on the date of issuance of the Series B Preferred Stock. At September 30, 2017, September 30, 2016 and December 31, 2016, the fair value of the embedded conversion feature was an asset of $111.9 million, a liability of $58.3 million and an asset of $80.7 million, respectively. Any change in the fair value of the embedded conversion feature will constitute other income or expense, as the case may be, in the applicable reporting period. Upon conversion or redemption of the Series B Preferred Stock, any asset or liability related to the embedded conversion feature would be eliminated. During the year ended December 31, 2016, the fair value of the embedded conversion feature changed by $201.5 million and this change is included as other income in the condensed consolidated statement of operations for the year ended December 31, 2016. During the three and nine months ended September 30, 2017, the fair value of the derivative asset increased by $38.6 million and $31.2 million, respectively. During the three and nine months ended September 30, 2016, the fair value of the derivative liability increased by $16.2 million and decreased by $62.6 million, respectively. The change in fair value is included as other income or expense, as the case may be, in the condensed consolidated statement of operations for the respective periods.On June 1, 2017 and on June 1, 2016, WMIH issued restricted stock grants to members of the Board totaling $0.4 million and $0.5 million, respectively, of aggregate fair value. The restricted shares noted above vest over a three-year period.On May 15, 2015, WMIH issued restricted stock grants to our Chief Executive Officer, William C. Gallagher, and our Chief Operating Officer, Thomas L. Fairfield, in conjunction with employment agreements totaling $9.8 million of aggregate fair value (the “Exec Grants”) based on the $2.76 trading price of WMIH shares at the close of business on the date issued. WMIH may be required to issue additional shares if the conversion price applicable to the Series B Preferred Stock is less than $2.25 per share. The Exec Grants will vest in full and will be recognized as compensation expense upon the consummation of a Qualified Acquisition, subject to the executives continued employment with the Company until such time. The foregoing description of the restricted stock agreement does not purport to be complete and is subject to, and qualified in its entirety by, the full text of the Gallagher Restricted Stock Agreement and the Fairfield Restricted Stock Agreement (the “Executive Agreements”), which were filed as Exhibit 10.3 and Exhibit 10.5, respectively, of Form 8-K12G3 filed on May 13, 2015 and incorporated herein by reference. The fair market value of the Exec Grants as of September 30, 2017 approximates $4.3 million as a result of the terms of the Executive Agreements which would result in additional share issuances if the value is below $2.25 per share limited to a maximum of shares based on a minimum conversion price of $1.75 per share. The stock price was $0.95 per share at the close of the market on September 30, 2017 and if the Exec Grants had vested then the minimum conversion price of $1.75 per share would have been utilized, therefore, a total of 1,015,874 additional shares (the “Exec Additional Shares”) would have been required to be issued, 507,937 additional shares each to both Mr. Gallagher and Mr. Fairfield.22The unamortized value related to the unvested restricted share grants totals $5.0 million and $7.7 million at September 30, 2017 and December 31, 2016, respectively.The unamortized value of $5.0 million at September 30, 2017, if all are ultimately vested, would be amortized according to the following schedule. The fair value of the Exec Grants will vest and be recognized on the date of the consummation of a Qualified Acquisition. Additionally, any Exec Additional Shares required to be issued, would be issued and immediately vest on the date of the consummation of a Qualified Acquisition. Equity-based compensation totaled $0.4 million and $0.5 million for the nine months ended September 30, 2017 and September 30, 2016, respectively. The restricted stock awards were issued at the fair market value determined to be the trading price at the close of business on the respective date the awards were granted.A summary of WMIH’s restricted stock award activity for the nine months ended September 30, 2017 and year ended December 31, 2016 is presented below:WMIH has issued the total number of shares subject to the restricted stock grants, however, until vested they are subject to repurchase. Shares subject to repurchase totaled 4,053,640 on September 30, 2017 and 4,039,591 on December 31, 2016. The Exec Grants vest upon future events, and are not time specific, and for this reason we have used 1st quarter 2018 as the vesting date in the following table as this date corresponds with the Series B Preferred Stock potential redemption date. The shares subject to repurchase at September 30, 2017 will vest, assuming circumstances remain unchanged, according to the following schedule:Vesting schedule of shares subject to repurchaseSeptember 30, 2017 unvested shares4th quarter 2017—1st quarter 20183,774,6842nd quarter 2018—3rd quarter 2018—4th quarter 2018—1st quarter 2019167,8482nd quarter 2019—3rd quarter 2019—4th quarter 2019—1st quarter 2020111,108Total unvested shares4,053,640Pursuant to a restricted stock agreement, WMIH has the right, but not the obligation, to repurchase any unvested (but issued) shares of common stock subject to the restricted stock agreement at $0.0001 per share upon the termination of service in the case of a director, or in the case of the Exec Grants, on January 5, 2018 if the Series B Preferred Stock are redeemed or as a result of certain circumstances as defined by the terms of the Exec Grants.A summary of WMIH’s restricted shares issued and subject to repurchase as of September 30, 2017 and December 31, 2016 is presented below:Vesting schedule of shares subject to repurchaseUnvested sharesShares subject to repurchase—January 1, 20164,197,396Shares issued subject to vesting during 2016212,765Unvested shares repurchased during 2016—Shares vested during 2016(370,570)Shares subject to repurchase—December 31, 20164,039,591Shares issued subject to vesting during 2017333,332Unvested shares repurchased during 2017—Shares vested during 2017(319,283)Shares subject to repurchase—September 30, 20174,053,640On June 1, 2017 and June 1, 2016, WMIH issued 333,332 and 212,765 restricted stock grants, respectively, to members of the Board totaling $0.4 million and $0.5 million, respectively, of aggregate fair value. The share price was determined based on the closing sales price of $1.20 and $2.35 on the respective dates of the awards.As of September 30, 2017 and December 31, 2016, 206,714,132 and 206,380,800, respectively, of WMIH’s common stock were issued and outstanding. As of September 30, 2017 and December 31, 2016, 1,000,000 shares of the Series A Preferred Stock were issued and outstanding. As of September 30, 2017 and December 31, 2016, 600,000 shares of the Series B Preferred Stock were issued and outstanding. As of September 30, 2017 and December 31, 2016, 61,400,000 warrants to purchase WMIH’s common stock were issued and outstanding.See Note 12: Net Income Per Common Share for further information on shares used for EPS calculations.Note 10: Pending LitigationAsthese and other risk factors affecting us.42Item 2.Management’s Discussion and Analysis of September 30, 2017, the Company was not a party to, or awareFinancial Condition and Results of any pending legal proceedings or investigations requiring disclosure at this time.24Management’s discussion and analysis of Net Assets from SubsidiaryWMMRC has net assets totaling $17.7 millionfinancial condition and $33.8 million as of September 30, 2017 and December 31, 2016, respectively. These net assets are not immediately available for distribution to WMIH due to restrictions imposed by trust agreements, and the requirement that the Insurance Division of the State of Hawaii must approve dividends from WMMRC. Prior to September 29, 2017, when the Second Lien Notes were fully redeemed by the Company and October 2, 2017 when the Second Lien Indenture was satisfied and discharged, distributions from WMMRC to WMIH were further restricted by the terms of the Runoff Notes and Indentures described in Note 7: Notes Payable. As more fully described in Note 14: Subsequent Events, a distribution from WMMRC to WMIH of up to $10.7 million was approved by the Insurance Division of the State of Hawaii on September 13, 2017.Note 12: Net Income (Loss) Per Common ShareIn calculating earnings per share, the Company follows the two-class method, which distinguishes between the classes of securities based on the proportionate participation rights of each security type in the Company's undistributed income. The Series A Preferred Stock and the Series B Preferred Stock are treated as one class for purposes of applying the two-class method, because they have substantially equal rights and share equally on an as converted basis with respect to income available to WMIH common stockholders.Basic net income per WMIH share attributable to common stockholders is computed by dividing net income attributable to WMIH’s common stockholders by the weighted-average number of common shares outstanding for the period after subtracting the weighted-average of any unvested restricted shares outstanding, as these shares are subject to repurchase. Basic net income attributable to common stockholders is computed by deducting preferred dividends and the basic calculation of undistributed earnings attributable to participating securities from net income.Diluted net income per WMIH share is computed by dividing net income attributable to WMIH’s common stockholders for the period by the weighted-average number of common shares outstanding after subtracting the weighted-average of any incremental unvested restricted shares outstanding and adding any potentially dilutive common equivalent shares outstanding during the period, if dilutive. Potentially dilutive common equivalent shares are comprised of the incremental common shares issuable upon the exercise of warrants for WMIH’s common stock and the potential conversion of preferred shares to common shares and the dilutive effect of unvested restricted stock. Diluted net income attributable to common stockholders is computed by deducting preferred dividends and the diluted calculation of undistributed earnings attributable to participating securities from net income.The dilutive effect of outstanding warrants and restricted stock subject to repurchase is reflected in diluted earnings per share by application of the treasury stock method. There would be no dilutive effects from any equity instruments for periods presented reflecting a net loss, therefore diluted net loss per share would be the same as basic net loss for periods that reflect a net loss attributable to common stockholders. Certain unvested restricted shares and convertible preferred stock are excluded from the calculation of diluted earnings per share until the non-market based contingency occurs.The following table presents the calculation of basic net (loss) income per share for periods presented:(in thousands, except per share data):The following table presents the calculation of diluted net (loss) income per share for periods presented:(in thousands, except per share data):The following table summarizes shares subject to exercise or vesting conditions as more fully described in Note 9: Capital Stock and Derivative Instruments. These shares could potentially be dilutive in future periods if we realize net income attributable to common and participating stockholders and the contingent or unvested stock is converted to WMIH common stock. The cash payment of $84.4 million, which would be received upon exercise of the warrants, has not been considered as an offset to the dilutive shares under warrants outstanding below.Note 13: Fair Value MeasurementWe use a fair-value approach to value certain assets and liabilities. Fair value is the price that would be received to sell an asset or paid to transfer a liability in an orderly transaction between market participants at the measurement date. As such, fair value is a market-based measurement that should be determined based on assumptions that market participants would use in pricing an asset or liability. We use a fair value hierarchy, which distinguishes between assumptions based on market data (observable inputs) and an entity’s own assumptions (unobservable inputs). The hierarchy consists of three levels:•Level 1 — Inputs to the valuation methodology are quoted prices for identical assets or liabilities traded in active markets;•Level 2 — Inputs to the valuation methodology include quoted prices for similar assets or liabilities in active markets, quoted prices for identical or similar assets or liabilities in markets that are not active, inputs other than quoted prices that are observable for the asset or liability and market corroborated inputs; and•Level 3 — Valuations based on models where significant inputs are not observable. The unobservable inputs reflect the Company’s own assumptions about the inputs that market participants would use.Determining which category an asset or liability falls within the fair value accounting guidance hierarchy requires significant judgment. We evaluate our hierarchy disclosures each quarter. Assets and liabilities measured at fair value on a recurring basis are summarized as follows:The financial instrument that is measured at fair value on a recurring basis is summarized as follows as of September 30, 2017:The financial instrument that is measured at fair value on a recurring basis is summarized as follows as of December 31, 2016:The following table shows the change in Level 3 assets and liabilities measured at fair value on a recurring basis for the year ended December 31, 2016 and the nine months ended September 30, 2017:On January 5, 2015, WMIH raised $600.0 million of capital (less transaction costs) through the issuance of 600,000 shares of Series B Preferred Stock. The shares carry a liquidation preference of $1,000 per share, equal to the purchase price, and a mandatory redemption right three years from issuance date at a price equal to the purchase price, plus accrued dividends at 3% per annum.The proceeds from the issuance of the Series B Preferred Stock are to be used to pursue strategic acquisitions. If one or more acquisitions are made on or prior to January 5, 2018 (or such later time as may be permitted pursuant to the terms governing the Series B Preferred Stock), then some or all of such Series B Preferred Stock shall be mandatorily converted into common stock of WMIH at a conversion price that is the lesser of:i)$2.25 per share of WMIH common stock; andii)the arithmetic average of daily volume weighted-average prices of WMIH’s common stock during the 20 trading day period ending on the trading day immediately preceding the public announcement by WMIH of its entry into a definitive agreement for such acquisition, subject to a floor of $1.75 per share of WMIH common stock.The mandatory conversion feature of the Series B Preferred Stock is subject to fair value accounting and, in connection therewith, since the time of issuance, the Company has used a binomial lattice option model to determine fair value of the Series B Preferred Stock. The fair value of the Series B Preferred Stock embedded conversion feature is revalued each balance sheet date utilizing the binomial lattice option model. The fair value computations are reported in the condensed consolidated statementresults of operations as unrealized gain or (loss) on change in fair value of derivative embedded conversion feature, respectively.Such binomial lattice option model utilizes several inputs to determine such fair value. Such inputs include WMIH’s common stock price as of each reporting date, as well as variable assumptions including, but not limited to, volatility of our stock price, the risk free interest rate, the probability that the Company consummates a Qualified Acquisition and the time of completing any such Qualified Acquisition.As of September 30, 2017 the following variable assumptions were included in the binomial option model: expected stock price volatility over the term of the convertible preferred securities was estimated at 60%, as compared to 40% as of December 31, 2016; the risk-free interest rate was estimated at 1.1% as compared to 0.6% as of December 31, 2016; the probability of the Company consummating a Qualified Acquisition was estimated at 50% as compared with 90% as of December 31, 2016; and the anticipated timing of the Company consummating a Qualified Acquisition was estimated at 6 months from both September 30, 2017 and December 31, 2016.The foregoing assumptions were adopted by the Company’s management in order to determine the market value of the embedded conversion feature applicable to the Series B Preferred Stock. Such assumptions necessarily involved and continue to involve the exercise of management’s judgement, as well as the judgement of the third party the Company uses in connection with the embedded derivative valuation process and for no other purpose. Such assumptions are monitored and adjusted from time to time. As assumptions and circumstances change, results may differ and past assumptions and valuations are not indicative of future assumptions or results.Our reported net income attributable to common and participating stockholders (“Year to Date Net Income” or “Year to Date Net Loss”MD&A”) was approximately $21.4 million for the nine months ended September 30, 2017. The change to our net income attributable to common and participating stockholders resulting from the calculation of the fair value of the embedded conversion feature is analyzed at the end of each reporting period to assess the impact of a 10% change to the various inputs and the result of each change to Year to Date Net Income is highlighted in the following scenarios. If the closing stock price of our common stock had been 10% lower, our Year to Date Net Income would have been approximately $17.7 million higher ($39.1 million). If the closing stock price of our common stock had been 10% higher, our Year to Date Net Income would have been approximately $17.6 million less ($3.8 million). If our volatility assumption on September 30, 2017 had been 10% lower, our Year to Date Net Income would have been approximately $3.0 million higher ($24.4 million). If our volatility assumption had been 10% higher, our Year to Date Net Income would have been approximately $3.3 million less ($18.1 million). If our probability of a transaction occurring assumption on September 30, 2017 had been 10% lower, our Year to Date Net Income would have been approximately $22.4 million less resulting in Year to Date Net Loss of $1.0 million. If our probability of a transaction occurring assumption had been 10% higher, our Year to Date Net Income would have been approximately $22.4 million higher ($43.8 million).Note 14: Subsequent EventsOn October 23, 2017, the reinsurance agreement with Radian was commuted and the related trust assets were released to WMMRC. On September 13, 2017, the Insurance Division of the State of Hawaii approved this commutation.On September 13, 2017, the Insurance Division of the State of Hawaii approved a transfer of up to $10.7 million from funds which were held in trust at WMMRC as of September 30, 2017. As of the date of the filing of this Form 10-Q, these funds have not been transferred to WMIH; however, they are no longer held in trust and are available for general corporate purposes.On October 2, 2017, the Second Lien Indenture was satisfied and discharged. As a result of the satisfaction and discharge of the Second Lien Indenture the Collateral Account was subsequently closed and remaining funds transferred to cash and cash equivalents to be used for general corporate purposes. For more information see Note 7: Notes Payable.Item 2.Management’s Discussion and Analysis of Financial Condition and Results of Operations.The following discussion should be read in conjunction with ourthe accompanying unaudited consolidated financial statements and the related notes, included in Item 1 of Part I of this Quarterly Report on Form 10-Q. The following is a discussion and analysis ofconjunction with our results of operations for the three and nine months ended September 30, 2017 and 2016 and financial condition as of September 30, 2017 and December 31, 2016 (dollars in thousands, except share and per share data and as otherwise indicated).References as used herein, unless the context requires otherwise, to (i) the “Company,” “we,” “us,” or “our” refer to WMIH Corp. (formerly WMI Holdings Corp.) and its subsidiaries on a consolidated basis; (ii) “WMIH” refers only to WMIH Corp., without regard to its subsidiaries; (iii) “WMIHC” refers only to WMI Holdings Corp., without regard to its subsidiaries; (iv) “WMMRC” refers to WM Mortgage Reinsurance Company, Inc. (a wholly-owned subsidiary of WMIH); and (v) “WMIIC” refers to WMI Investment Corp. (a wholly-owned subsidiary of WMIH).FORWARD-LOOKING STATEMENTS AND INFORMATIONThis quarterly report includes forward-looking statements, within the meaning of the Private Securities Litigation Reform Act of 1995, Section 27A of the Securities Act of 1933, as amended (the “Securities Act”), and Section 21E of the Securities Exchange Act of 1934, as amended (the “Exchange Act”). All statements other than statements of historical fact included in this report that address activities, events, conditions or developments that we expect, believe or anticipate will or may occur in the future are forward-looking statements. Forward-looking statements give our current expectations and projections relating to our financial condition, results of operations, plans, objectives, future performance and business and these statements are not guarantees of future performance. These statements can be identified by the fact that they do not relate strictly to historical or current facts. Forward-looking statements may include the words “anticipate,” “estimate,” “expect,” “project,” “intend,” “plan,” “believe,” “strategy,” “future,” “opportunity,” “may,” “should,” “will,” “would,” “will be,” “will continue,” “will likely result” and similar expressions. Such forward-looking statements involve risks and uncertainties that may cause actual events, results or performance to differ materially from those indicated by such statements. These risks are identified and discussed in the Company’s Annual Report on Form 10-K for the year ended December 31, 2016 under Risk Factors2019. The following discussion contains, in Part I, Item 1A. These risk factors will be importantaddition to consider in determining future results and should be reviewed in their entirety. Thesethe historical information, forward-looking statements that include risks, assumptions and uncertainties that could cause actual results to differ materially from those anticipated by such statements.Dollar amounts are expressedreported in good faithmillions, except per share data and we believe there isother key metrics, unless otherwise noted.We have provided a reasonable basis for them. However, there can be no assuranceglossary of terms, which defines certain industry-specific and other terms that are used herein, at the events, results or trends identified in these forward-looking statements will occur or be achieved. Forward-looking statements speak only asend of the date theyMD&A section.Overview We are made,a leading servicer and originator of residential mortgage loans, and a provider of real estate services through our Xome subsidiary. Our purpose is to keep the dream of homeownership alive, and we do not undertakethis as a servicer by helping mortgage borrowers manage what is typically their largest financial asset, and by helping our investors maximize the returns from their portfolios of residential mortgages. We have a track record of significant growth, having expanded our servicing portfolio from $10 billion in 2006 to update any forward-looking statement, except as required by law. Therefore, you should not rely on these statements being current$596 billion as of any time other than the time atJune 30, 2020. We believe this track record reflects our strong operating capabilities, which this document was filed with the Securitiesinclude a proprietary low-cost servicing platform, strong loss mitigation skills, a commitment to compliance, a customer-centric culture, a demonstrated ability to retain customers, growing origination capabilities, and Exchange Commission.OVERVIEWOur Business Strategy and Operating EnvironmentWMIH Corp. (“WMIH”) is a corporation duly organized and existing under the laws of the State of Delaware. On May 11, 2015, WMIH merged with its parent corporation, WMI Holdings Corp., a Washington corporation (“WMIHC”), with WMIH as the surviving corporationsignificant investment in the merger (the “Merger”). The Merger occurred as part of the reincorporation of WMIHC from the State of Washington to the State of Delaware effective May 11, 2015 (the “Reincorporation Date”).WMIH, formerly known as WMIHC and Washington Mutual, Inc. (“WMI”), is the direct parent of WM Mortgage Reinsurance Company, Inc. (“WMMRC”) and WMI Investment Corp. (“WMIIC”), which has no assets or liabilities. Since emergence from bankruptcy on March 19, 2012 (the “Effective Date”), we have had limited operations other than WMMRC’s legacy reinsurance business, which is being operated in runoff mode. We continue to operate WMMRC’s business in runoff mode and our primary strategic objective is to consummate one or more acquisitions of an operating business, either through a merger, purchase, business combination or other form of acquisition, and grow our business.We continue to seek, identify and evaluate acquisition opportunities of varying sizes across an array of industries for the purpose of facilitating an acquisition by WMIH of one or more operating businesses. Our management team meets regularly with our Board of Directors (the “Board” or “Board of Directors”), the Finance Committee of the Board (the “Finance Committee”) and the Corporate Strategy and Development Committee of the Board (the “CS&D Committee”), as the case may be, to discuss and evaluate potential acquisition targets. During the nine months ended September 30, 2017 and the year ended December 31, 2016, the Finance Committee, the CS&D Committee and the Board of Directors met formally and informally numerous times to assess various opportunities. We have focused primarily on acquisition targets in the financial services industry, including targets with consumer finance, commercial finance, specialty finance, leasing and insurance operations. We also may review potential targets in other industries, such as information technology, industrials, business services, healthcare and other sectors.29On January 5, 2015, we announced that WMIH had completed an offering (the “Series B Preferred Stock Financing”) of 600,000 shares of its 3% Series B Convertible Preferred Stock, par value $0.00001, liquidation preference $1,000 per share (the “Series B Preferred Stock”) in the amount of aggregate gross proceeds equal to $600 million. Net proceeds of $598.5 million were deposited into an escrow account and have been, and will be, released from escrow to us from time to time in amounts needed to finance our efforts to explore and fund, in whole or in part, certain acquisitions, whether completed or not, including reasonable attorney fees and expenses, accounting expenses, due diligence and financial advisor fees and expenses. For furthertechnology. More information on the Series B Preferred Stock Financing, see Note 9: Capital StockCompany is available at Derivative Instruments,should not be deemed to the condensed consolidated financial statements in Item 1 of Part Ibe, a part of this Quarterly Reportreport.Our strategy is to position the Company for sustainable long-term growth, drive improved efficiency and profitability, and generate a return on Form 10-Q.WMIH continuestangible equity of 12% or higher. Key strategic priorities include the following:•Strengthen our balance sheet by reducing leverage, building liquidity, and managing interest rate and credit risk;•Improve efficiency by driving continuous improvement in unit costs for Servicing, Originations, and Xome, as well as by taking corporate actions to evaluate acquisition opportunitieseliminate costs throughout the organizations•Grow and workstrengthen our customer base in each of our segments•Reinvent the customer experience by acting as the customer’s advocate and by harnessing technology to deliver user-friendly digital solutions•Sustain the talent of our people and the culture of our organization•Maintain strong relationships with our strategic partner, an affiliate of KKR & CO. L.P. (together with its affiliates, “KKR”), to identify, consider and evaluate potential mergers, acquisitions, business combinationsagencies, investors, regulators, and other strategic opportunities.counterparties and a strong reputation for compliance and customer service.Impact of the COVID-19 PandemicThe COVID-19 pandemic introduces unprecedented uncertainty in the economy, including the risk of a significant employment shock and recessionary conditions, with implications for the health and safety of our employees, borrower delinquency rates, servicing advances, origination volumes, the availability of financing, and our overall profitability and liquidity. We have taken aggressive steps to address these risks, including moving in excess of 95% of our staff to work-from-home status as well as implementing other practices for mitigating the risk of the pandemic, including restrictions on non-essential travel and face-to-face meetings and enhanced sanitization of our facilities. We have also implemented the provisions of the Coronavirus Aid, Relief, and Economic Security Act (CARES Act), which makes available forbearance plans for up to one year for borrowers under government and government agency mortgage programs, which we have extended to borrowers in our private label mortgage servicing portfolio. As of September 30, 2017, and throughJuly 27, 2020, approximately 197,000 or 5.9% of our customers were on a forbearance plan, down from a peak of 7.1% at the dateend of the filing of this Form 10-Q, we had not entered into definitive documentation relating to an acquisition or consummated an acquisition. IfJune 2020. The numbers are subsequently falling as we have not entered into definitive documentation relatingthe first tranche of borrowers rolling off of 90-day plans, either because they remained current all the way through, or because they no longer desire to an Acquisition (as defined below), or consummated a Qualified Acquisition (as defined below), on or priordefer payments and elected to January 5, 2018, we will be required to redeem all of the outstanding Series B Preferred Stock on January 5, 2018 (the “Series B Redemption Date”). A “Qualified Acquisition” means an Acquisition (as defined below) that, taken together, with prior Acquisitions (if any), collectively utilizes aggregate net proceeds of the Series B Preferred Stock Financing of $450 million. “Acquisition” means any acquisition by the Company (or any of its direct or indirect wholly-owned subsidiaries),come off. We include loans in a single transaction or a series of transactions, whether by purchase, merger or otherwise, of all or substantially all of the assets of, or equity interests in, or a business line, unit or division of, any person.Assuming all 600,000 shares are outstanding on the Series B Redemption Date, the aggregate redemption cost will be $600.0 million, plus accrued and unpaid dividends, if any, whether or not declared. If, prior to the Series B Redemption Date, we publicly announce that we have entered into a definitive agreement for an Acquisition, the Series B Redemption Date will be extended to the earlier to occur of (i) July 5, 2018, and (ii) the day immediately following (x) the date such definitive agreement is terminated or (y) the date such Acquisition is closed. The consummation of an Acquisition would result in the mandatory conversion of some or all of the Series B Preferred Stock into common stock in accordance with provisions set forth in Article VI of the Certificate of Incorporation.While we remain focused on identifying an Acquisition and executing definitive documentation relating to or consummating an Acquisition on or prior to the Series B Redemption Date we can provide no assurance that we will be able to do so and, if so, on what terms. In the event we are required to redeem the Series B Preferred Stock, our available cash, absent a new financing, will be substantially depleted and our ability to (i) utilize our net operating loss (“NOL”) carry-forward, (ii) access significant alternative uses of capital and (iii) to continue business operations would likely be significantly and adversely impaired.As previously disclosed, the Finance Committee is authorized, among other things, (i) to review the long-term financial structure, objectives and policies of the Company, and to make recommendations to the Board regarding such structure, objectives and policies, if appropriate, (ii) to evaluate the financing requirements of the Company and management’s proposed financing and refinancing plans and to recommend to the Board those actions, authorizations, filings and applications necessary and appropriate to enable management to execute such plans and (iii) to consider and make recommendations to the Board regarding the terms, timing, amount and other material factors (e.g., potential dilution of existing shareholders and the impact of any financing or restructuring on the Company’s tax attributes under Section 382 of the Code),forbearance related to the possible restructuring or amendmentCARES Act, whereby no payments have been received from borrowers for greater than 90 days, in loans subject to repurchase right from Ginnie Mae in other assets and payables and other liabilities on a gross basis. The balance was43Depending on how long the pandemic continues to disrupt the economy and employment, our Servicing segment could experience a cost-to-service increase as we deal with higher delinquencies and foreclosures. We expect servicing costs to be moderately elevated for loans on forbearance, however investor incentives should more than offset the elevated costs. As the pandemic began to impact the mortgage capital markets, our Originations segment took several steps to rapidly de-risk the pipeline and slowed correspondent production. Our Originations segment has experienced volume growth and higher margins as a result of the Company’s outstanding equity securities, issuance of new equity securitieslower interest rate environment, which more than offset the decline in one or more private or public transactions, redemption of outstanding securities, or other transactionsour Servicing segment. As the foreclosure process is currently on hold, with moratoriums in place at the national level and in some local markets, Xome’s revenue from the Exchange division has been, and is expected to continue to be, negatively impacted. However, Xome’s revenue from the Services division has benefited from the lower interest rate environment and increase in Originations volume and has helped balance out the decrease in Exchange’s revenues. Once the moratoriums are lifted, we expect Xome to contribute meaningfully to our consolidated results. See liquidity discussion related to the Company’s outstanding securities, capital structure or fundraising to meet the Company’s future liquidityCOVID-19 pandemic in Liquidity and capital resources needs,Capital Resources section in each case as the Finance Committee deems appropriate.In connection with the foregoing, and as has previously been disclosed, the Finance Committee has retained financial advisors to help the Company assess its overall capital structure and liquidity requirements and to develop potential financing alternatives. As part of these efforts, as of the date of this report, the Finance Committee and its advisers are engaged in discussions relating to, among other things, a possible restructuring or amendment of the Series B Preferred Stock. We can provide no assurance we will be able to restructure, amend or refinance the Series B Preferred Stock and, if so, on what terms.With respect to our current operations, the Company currently operates a single business through its subsidiary, WMMRC, whose sole activity is the reinsurance of mortgage insurance policies. WMMRC has been operated in runoff mode since September 26, 2008. Since that date, WMMRC has not underwritten any new policies (and by extension any new risk). WMMRC, through predecessor companies, began reinsuring risks in 1997 and continued reinsuring risks through September 25, 2008.30All of WMMRC’s reinsurance agreements are on an excess of loss basis, except for a reinsurance treaty with Genworth Mortgage Insurance Corporation during 2008, which is reinsured on a 50% quota share basis. Pursuant to the excess of loss reinsurance treaties, WMMRC reinsures a second loss layer which ranges from 5% to 10% of the risk in force in excess of the primary mortgage insurer’s first loss percentages which range from 4% to 5%. Each calendar year, or book year, is treated separately from other years when calculating losses. In return for accepting a portion of the risk, WMMRC receives, net of ceding commission, a percentage of the premium that ranges from 25% to 40%.WMMRC previously commuted three reinsurance agreements, one each, in 2009, 2012 and 2014, respectively, and the related trust assets were distributed in accordance with the commutation agreements. On October 23, 2017, the reinsurance agreement with Radian was commuted and the related trust assets were released to WMMRC. On September 13, 2017, the Insurance Division of the State of Hawaii approved this commutation and a distribution of up to $10.7 million to WMIH. As of the date of the filing of this Form 10-Q, this distribution has not yet been completed. For more information see Note 14: Subsequent Events to the condensed consolidated financial statements in Item 1 of Part I of this Quarterly Report on Form 10-Q. We also may seek opportunities to extract excess capital through commutation of one or more of WMMRC’s remaining reinsurance agreements or otherwise, with a view toward accelerating the distribution of trust assets in excess of the amounts needed to pay claims.Beginning in 2006, the U.S. housing market and related credit markets experienced a multi-year downturn. During that period, housing prices declined materially, credit guidelines tightened, delays in mortgage servicing and foreclosure activities occurred, and deterioration in the credit performance of mortgage loans occurred. In addition, the macro-economic environment during that period demonstrated limited economic growth, stubbornly high unemployment, and limited median wage gains. Beginning in 2012, home prices began to rise again. The current outlook for the housing market is optimistic with low interest rates, steady employment growth, increased household formation rates and less restrictive credit conditions. Nevertheless, WMMRC’s operating environment remains somewhat uncertain as much of its results over the next two years will be directly affected by the inventory of pending defaulted mortgages at its ceding companies arising primarily from mortgages originated in calendar years 2007 and 2008. However, its financial exposure to that environment has been materially reduced as the remaining net aggregate risk exposure has decreased due to the runoff nature of its operations.Our Financial InformationThe financial information in this Quarterly Report on Form 10-Q has been derived from our condensed consolidated financial statements.Critical Accounting PoliciesOur condensed consolidated financial statements are prepared in accordance with generally accepted accounting principles in the United States (“GAAP”), which requires management to make estimates and assumptions that affect reported and disclosed amounts of assets and liabilities and the reported amounts of revenues and expenses during the reporting period. We believe that the critical accounting policies set forth in the accompanying condensed consolidated financial statements describe the more significant judgments and estimates used in the preparation of our condensed consolidated financial statements. These accounting policies pertain to premium revenues and risk transfer, valuation of investments, loss and loss adjustment expense reserves, our values under fresh start accounting, the resulting loss contract reserve and the valuation of the derivative instrument relating to the embedded conversion feature of the Series B Preferred Stock. If actual events differ significantly from the underlying judgments or estimates used by management in the application of these accounting policies, there could be a material effect on our results of operations and financial condition.Recently issued accounting standards and their impact on the Company have been presented under “New Accounting Pronouncements” in Note 2: Significant Accounting Policies to the condensed consolidated financial statements in Item 1 of Part I of this Quarterly Report on Form 10-Q.SegmentsThe Company manages its business on the basis of one operating segment, mortgage reinsurance, in accordance with GAAP. Within the mortgage reinsurance segment, our current risks arise solely from the reinsurance of mortgage insurance policies that were placed on certain residential mortgage loans prior to the bankruptcy of WMI. The majority of these policies were required by mortgage lenders as a stipulation to approve the mortgage loans. The mortgage insurance policies protect the beneficiaries of the policy from all or a portion of default-related losses.Overview of Revenues and ExpensesBecause WMIH has no current significant operations of its own, its cash flow is derived almost entirely from earnings on its investment portfolio, and payments it receives from, and dividends paid by, WMMRC. All dividends received by WMIH from31WMMRC that constituted Runoff Proceeds, historically, were required to be distributed to holders of WMIH’s Second Lien Notes in accordance with the terms of the Second Lien Indenture as described below in this Item 2 under “Notes Payable.” As of September 29, 2017, the Second Lien Notes were fully redeemed by the Company and the Second Lien Indenture was satisfied and discharged, therefore future distributions from WMMRC to WMIH will be available for general corporate purposes. WMMRC’s revenues consist primarily of the following:MD&A.net premiums earned on reinsurance contracts;positive changes to (and corresponding releases from) loss reserves; andnet investment income and net gains (losses) on WMMRC’s investment portfolio.WMMRC’s expenses consist primarily of the following:underwriting expenses; andgeneral and administrative expenses.32 for the three and nine months ended September 30, 2017 and September 30, 2016 For the three and nine months ended September 30, 2017, we reported aTable 1. Consolidated Operations Three Months Ended June 30, 2020 2019 $ Change % Change Revenues - operational(1)$ 891 $ 630 $ 261 41 % Revenues - Mark-to-market (261) (231) (30) 13 % Total revenues 630 399 231 58 % Total expenses 419 492 (73) (15) % Total other expenses, net (101) (24) (77) 321 % Income (loss) before income tax expense (benefit) 110 (117) 227 (194) % Less: Income tax expense (benefit) 37 (29) 66 (228) % Net income (loss) 73 (88) 161 (183) % Less: Net loss attributable to non-controlling interests — (1) 1 (100) % Net income (loss) attributable to Mr. Cooper $ 73 $ (87) $ 160 (184) % (1)Revenues - operational consists of total revenues, excluding mark-to-market.We recorded net operating loss of $0.3 million and net operating income of $3.5 million, respectively. This compares to net operating losses of $0.4 million and $1.3 million for the three and nine months ended September 30, 2016, respectively. The components that gave rise to a net operating loss for the three months and net operating income for the nine months ended September 30, 2017 and net operating losses for the three and nine months ended September 30, 2016 are summarized in the tables below under the Net Income (Loss) section. The most significant variances between the comparative three month periods ended September 30, 2017 and September 30, 2016 include (i) increased revenue of approximately $1.0 million, (ii) an increase in general and administrative expense of $0.8 million, (iii) a minimal change in interest expense of $0.1 million, (iv) a net decrease in underwriting expense of $0.2 million and (v) a reduction of the loss contract reserve of $0.2 million$73 during the three months ended SeptemberJune 30, 2017 versus2020 compared to a reductionnet loss of $0.5 million$88 during the same period in 2016.2019. The loss contract reserve decrease, during the three and nine months ended September 30, 2017, is attributednet income in 2020 was primarily due to changes in the expected timing of assets being released from trust accounts held at WMMRC which are discounted to present value. When assets are expected to be released from trust earlier than anticipated, a smaller present value discount is applied to the loss contract reserve, thus reducing the reserve. For more information see Note 14: Subsequent Events to the condensed consolidated financial statements in Part I, Item 1 of this Quarterly Report on Form 10-Q. The most significant variances between the comparative nine month periods ended September 30, 2017 and September 30, 2016 include (i) an increase in revenue of approximately $1.7 million, (ii)total revenues and a decrease in total expenses, partially offset by an increase in general total other expenses, net. Consolidated operational revenues increased primarily due to increased revenue in our Originations segment, driven by higher originations volume predominately in the direct-to-consumer (”DTC”) channel, partially offset by an increase in negative mark-to-market (“MTM”) adjustments for the three months ended June 30, 2020 compared to the same period in 2019. Refer to Table 10. Servicing - Revenues and administrativeTable 21. Originations - Revenues for further discussion.Total expenses for the three months ended June 30, 2020 decreased compared to the same period in 2019 primarily due to lower foreclosure and other liquidation related expenses and recoveries in our Servicing segment, primarily driven by operational improvements of the reverse portfolio with respect to assignments and adherence to HUD curtailment guidelines. The decrease in total expenses was partially offset by higher total expense of $1.0 million (iii)in our Originations segment, primarily attributable to higher originations volume in the lower interest rate environment.Total other expenses, net, increased for the three months ended June 30, 2020 compared to the same period in 2019 primarily due to a reductiondecrease in interest expenseincome in our Servicing segment, partially offset by a decrease in interest expense. Refer to Table 12. Servicing - Other (Expenses) Income, Net for further discussion.44Table 1.1 Consolidated Operations Six Months Ended June 30, 2020 2019 $ Change % Change Revenues - operational(1)$ 1,552 $ 1,173 $ 379 32 % Revenues - Mark-to-market (644) (524) (120) 23 % Total revenues 908 649 259 40 % Total expenses 863 935 (72) (8) % Total other expenses, net (174) (64) (110) 172 % Loss before income tax benefit (129) (350) 221 (63) % Less: Income tax benefit (31) (76) 45 (59) % Net loss (98) (274) 176 (64) % Less: Net loss attributable to non-controlling interests (3) (1) (2) 200 % Net loss attributable to Mr. Cooper $ (95) $ (273) $ 178 (65) % (1)Revenues - operational consists of $0.2 million, (iv)total revenues, excluding mark-to-market.We recorded a net decrease in underwriting expenseloss of $0.6 million and (v) a reduction of the loss contract reserve of $5.6 million$98 during the ninesix months ended SeptemberJune 30, 2017 versus2020 compared to a reductionnet loss of $2.3 million$274 during the same period in 2016.For2019. The net loss in 2020 was lower primarily due to an increase in total revenues and decrease in total expenses. Consolidated operational revenues increased primarily due to increased revenue in our Originations segment, driven by higher originations volume predominately in the threeDTC channel, partially offset by an increase in negative MTM adjustments for the six months ended SeptemberJune 30, 2017, we reported net income attributable to common and participating stockholders of $33.9 million2020 compared to a net loss attributablethe same period in 2019. Refer to commonparticipating stockholders of $21.1 millionTable 21.1 Originations - Revenues for further discussion.Total expenses for the threesix months ended SeptemberJune 30, 2016. This $55.0 million reduction2020 decreased compared with the same period in net loss attributable2019 primarily due to commonlower foreclosure and participating stockholders, when comparingother liquidation related expenses in our Servicing segment primarily driven by operational improvements of the threereverse portfolio with respect to assignments and adherence to HUD curtailment guidelines. In addition, total expenses in our Corporate/Other segment were higher in the six months ended SeptemberJune 30, 20172019 due to acquisition and integration expenses related to the threePacific Union acquisition and the acquisition of the Seterus mortgage servicing platform and assumption of assets related thereto from IBM (“Seterus acquisition”) in February 2019. Partially offsetting the decrease in total expenses in our Servicing segment and Corporate/Other segment was an increase in total expenses in our Originations segment primarily driven by higher originations volume in a declining interest rate environment.Total other expenses, net, increased for the six months ended SeptemberJune 30, 2016, is2020 compared to the same period in 2019 primarily thedue to a decrease in interest income and other income, net, partially offset by a decrease in interest expense. Interest income decreased primarily due to a decrease in other interest income in our Servicing segment due to lower income earned on custodial balances driven by lower LIBOR rates and a decrease in income earned on reverse mortgage interest, as a result of the decline in the reverse mortgage interests balance. Other income, net, was lower in the six months ended June 30, 2020 primarily due to income related to the change in fair value of the contingent consideration recorded in 2019 for the acquisition of Assurant Mortgage Solutions (“AMS”).Table 2. Provision for Income Taxes Three Months Ended June 30, 2020 2019 $ Change % Change Income tax expense (benefit) $ 37 $ (29) $ 66 (228) % Effective tax rate(1)33.4 % 24.6 % (1)Effective tax rate is calculated using whole numbers.45For the three months ended June 30, 2020, we had an embedded derivative. This embedded derivativeincome tax expense compared to an income tax benefit for the same period ended in 2019. The effective tax rate for the three months ended June 30, 2020 was 33.4% as compared to the effective tax rate of 24.6% for the three months ended June 30, 2019. The change in effective tax rate is primarily attributable to the increased relative unfavorable tax impacts of permanent differences such as nondeductible executive compensation and nondeductible meals and entertainment expenses on the annual effective rate, and discrete tax items in the three months ended June 30, 2020 as compared to the three months ended June 30, 2019.Table 2.1. Provision for Income Taxes Six Months Ended June 30, 2020 2019 $ Change % Change Income tax benefit $ (31) $ (76) $ 45 (59) % Effective tax rate(1)24.1 % 21.7 % (1)Effective tax rate is calculated using whole numbers.For the six months ended June 30, 2020 and 2019, we had an income tax benefit. The effective tax rate for the six months ended June 30, 2020 was 24.1% as compared to the effective tax rate of 21.7% for the six months ended June 30, 2019. The change in effective tax rate is primarily attributable to the increased relative unfavorable tax impacts of permanent differences such as nondeductible executive compensation and nondeductible meals and entertainment expenses on the annual effective rate, and discrete tax items in the six months ended June 30, 2020 as compared to the six months ended June 30, 2019.Segment Results Our operations are conducted through four segments: Servicing, Originations, Xome, and Corporate/Other.•The Servicing segment performs operational activities on behalf of investors or owners of the underlying mortgages, including collecting and disbursing borrower payments, investor reporting, customer service, modifying loans where appropriate to help borrowers stay current, and when necessary performing collections, foreclosures, and the sale of REO.•The Originations segment originates residential mortgage loans through our direct-to-consumer channel, which provides refinance options for our existing customers, and through our correspondent channel which purchases or originates loans from mortgage bankers. Our wholesale channel was shut down during the three months ended June 30, 2020 and subsequently ceased originating loans and funded out the remaining pipeline.•The Xome segment provides a variety of real estate services to mortgage originators, mortgage and real estate investors, and mortgage servicers, including valuation, title, and field services, and operates an exchange which facilitates the sale of foreclosed properties.•The Corporate/Other segment represents unallocated overhead expenses, including the costs of executive management and other corporate functions that are not directly attributable to our operating segments, interest expense on our senior unsecured notes, and the results of a legacy mortgage investment portfolio, which consists of non-prime and non-conforming residential mortgage loans that were transferred to a securitization trust (“Trust 2009-A”) in 2009. We collapsed Trust 2009-A and executed the sale of the loans held in the trust in September 2019. The Corporate/Other segment also includes inter-segment eliminations.46Table 3. Segment Results Three Months Ended June 30, 2020 Servicing Originations Xome Corporate/Other Consolidated Revenues Service related, net $ (114) $ 21 $ 106 $ (1) $ 12 Net gain on mortgage loans held for sale 45 573 — — 618 Total revenues (69) 594 106 (1) 630 Total expenses 122 167 95 35 419 Interest income 57 19 — — 76 Interest expense (117) (13) — (47) (177) Other income (expenses), net — — 1 (1) — Total other (expenses) income, net (60) 6 1 (48) (101) (Loss) income before income tax (benefit) expense $ (251) $ 433 $ 12 $ (84) $ 110 Three Months Ended June 30, 2019 Servicing Originations Xome Corporate/Other Consolidated Revenues Service related, net $ 9 $ 20 $ 108 $ — $ 137 Net gain on mortgage loans held for sale 18 244 — — 262 Total revenues 27 264 108 — 399 Total expenses 189 145 101 57 492 Interest income 136 23 — 3 162 Interest expense (109) (25) — (53) (187) Other income, net — 1 — — 1 Total other income (expenses), net 27 (1) — (50) (24) (Loss) income before income tax (benefit) expense $ (135) $ 118 $ 7 $ (107) $ (117) 47Table 3.1 Segment Results Six Months Ended June 30, 2020 Servicing Originations Xome Corporate/Other Consolidated Revenues Service related, net $ (294) $ 41 $ 212 $ — $ (41) Net gain on mortgage loans held for sale 79 870 — — 949 Total revenues (215) 911 212 — 908 Total expenses 271 333 191 68 863 Interest income 140 53 — 1 194 Interest expense (230) (40) — (99) (369) Other income (expenses), net — — 2 (1) 1 Total other (expenses) income, net (90) 13 2 (99) (174) (Loss) income before income tax (benefit) expense $ (576) $ 591 $ 23 $ (167) $ (129) Six Months Ended June 30, 2019 Servicing Originations Xome Corporate/Other Consolidated Revenues Service related, net $ (18) $ 35 $ 204 $ — $ 221 Net gain on mortgage loans held for sale 53 375 — — 428 Total revenues 35 410 204 — 649 Total expenses 384 249 200 102 935 Interest income 251 40 — 5 296 Interest expense (223) (43) — (110) (376) Other income, net — 5 11 — 16 Total other income (expenses), net 28 2 11 (105) (64) (Loss) income before income tax (benefit) expense $ (321) $ 163 $ 15 $ (207) $ (350) 48Servicing Segment The Servicing segment’s strategy is to generate income by growing the portfolio and maximizing the servicing margin. We believe several competitive strengths have been critical to our long-term growth as a servicer, including our low-cost platform, our skill in mitigating losses for investors, our commitment to strong customer service and regulatory compliance, our history of successfully boarding new loans, and the ability to retain existing customers by offering attractive refinance options. We believe that our operational capabilities are reflected in strong servicer ratings.Table 4. Servicer Ratings Fitch(1)Moody’s(2)S&P(3)Rating date January 2020 May 2019 May 2019 Residential RPS2- Not Rated Above Average Master Servicer RMS2+ SQ2 Above Average Special Servicer RSS2- Not Rated Above Average Subprime Servicer RPS2- Not Rated Above Average (1)Fitch Rating Scale of 1 (Highest Performance) to 5 (Low/No Proficiency)(2)Moody’s Rating Scale of SQ1 (Strong Ability/Stability) to SQ5 (Weak Ability/Stability)(3)S&P Rating Scale of Strong to WeakServicing Portfolio CompositionAs of June 30, 2020, the unpaid principal balance in our servicing portfolio consisted of approximately $278.0 billion in forward loans, $296.8 billion in subservicing and other, and $20.8 billion in reverse mortgage loans.•The term “forward” refers to loans we service which are not “reverse mortgages,” as discussed below.•Our subservicing portfolio consists of loans where we perform the servicing responsibilities for a contractual fee, but do not own the servicing rights and therefore do not record an MSR on our balance sheet.•Reverse mortgage loans, most commonly HECMs, provide seniors 62 and older with a loan upon which draws can be made periodically. The draws are secured by the equity in the borrower’s home. We have acquired our reverse mortgages in prior years through several transactions and the portfolio is now in run-off mode. For a significant portion of our reverse mortgages, we record MSRs on our balance sheet, similar to the accounting for forward mortgages, except in cases where the costs of servicing are expected to exceed revenues, in which case a Mortgage Servicing Liability (“MSL”) is created. Additionally, due to program requirements, we consolidate certain reverse mortgages on our balance sheet and accrue interest income and expense.49The charts below set forth the portfolio mix between forward MSR, subserviced and other, and reverse mortgage loans, and the composition of our servicing portfolio ending UPB by investor group ($ in Millions) as of June 30, 2020 and 2019: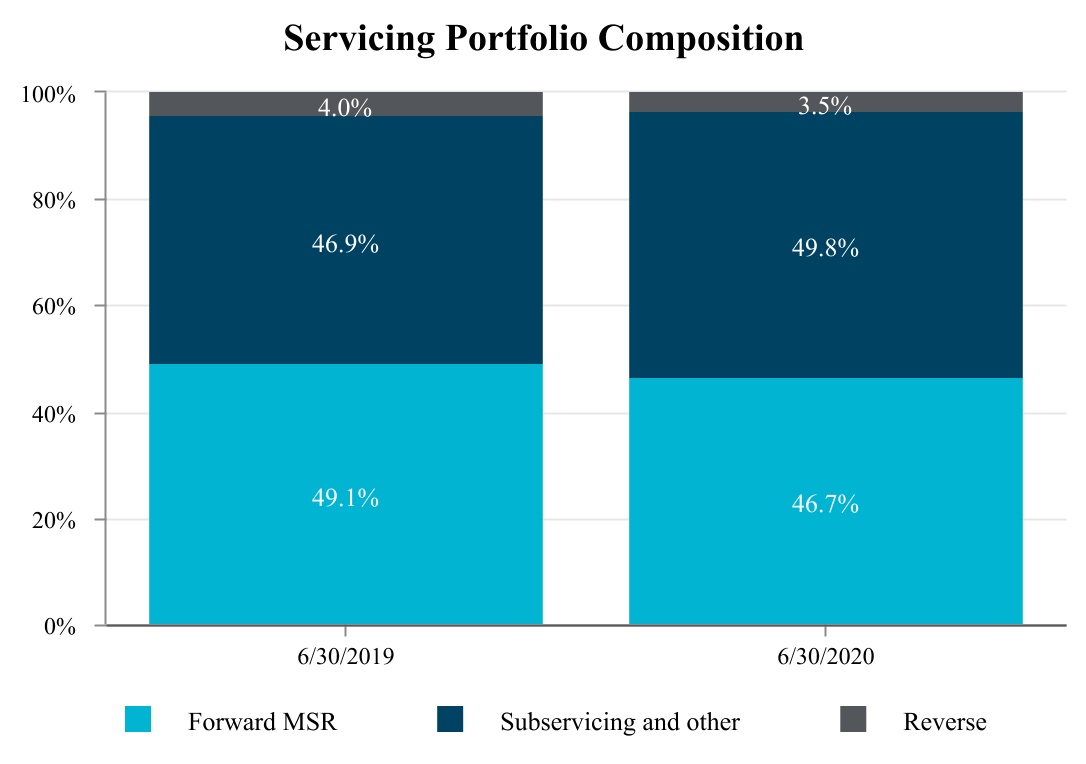
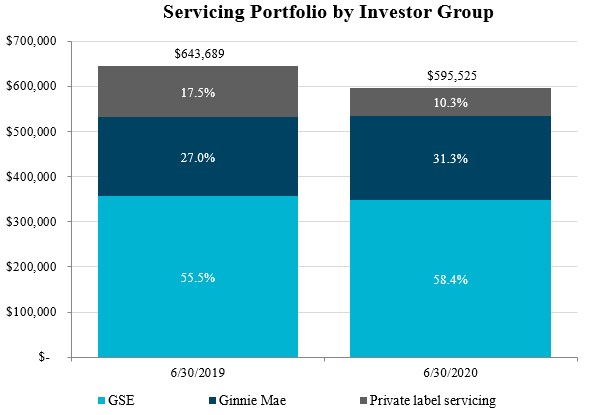 50The following tables set forth the results of operations for the Servicing segment:
Table 5. Servicing Segment Results of Operations Three Months Ended June 30, 2020 2019 $ Change % Change Revenues Operational $ 294 $ 314 $ (20) (6) % Amortization, net of accretion (102) (56) (46) 82 % Mark-to-market (261) (231) (30) 13 % Total revenues (69) 27 (96) (356) % Total expenses 122 189 (67) (35) % Total other (expenses) income, net (60) 27 (87) (322) % Loss before income tax benefit $ (251) $ (135) $ (116) 86 % For the three months ended June 30, 2020, we incurred a loss before income tax benefit of $251 compared to $135 for the same period in 2019. The change in loss before income tax benefit was primarily due to a decrease in total revenues, partially offset by a decrease in total expenses. Total revenues decreased during three months ended June 30, 2020 compared to the same period in 2019, primarily due to an increase in amortization of forward MSRs as a result of elevated prepayments driven by the declining interest rate environment. Additionally, negative mark-to-market revenues increased during the three months ended June 30, 2020 compared to the same period in 2019 due to the lower interest rate environment. Total expenses for the three months ended June 30, 2020 decreased compared to the same period in 2019 primarily due to a decrease in foreclosure and other liquidation expenses and a decrease in salaries, wages and benefits. The decrease in foreclosure and other liquidation expenses was mainly driven by operational improvements of the reverse portfolio with respect to assignments and adherence to HUD curtailment guidelines, in addition to improved performance of $15 on loss recoveries related to settlement with a prior servicer. The decrease in salaries, wages and benefits was primarily due to improved operational efficiencies, , which included consolidation of one of our servicing centers.Total other (expenses) income, net, for the three months ended June 30, 2020 decreased compared to the same period in 2019 primarily due to a decrease in interest income. The decrease in interest income was primarily due to lower income earned on custodial balances driven by lower LIBOR rates and a decrease in income earned on reverse mortgage interest, primarily driven by the decline in the reverse mortgage interests balance. Refer to Table 10. Servicing - Revenues, Table 11. Servicing - Expenses and Table 12. Servicing - Other (Expenses) Income, Net, for further discussions on the changes in total revenues, total expenses and total other (expenses) income, net, respectively.Table 5.1 Servicing Segment Results of Operations Six Months Ended June 30, 2020 2019 $ Change % Change Revenues Operational $ 607 $ 638 $ (31) (5) % Amortization, net of accretion (178) (79) (99) 125 % Mark-to-market (644) (524) (120) 23 % Total revenues (215) 35 (250) (714) % Total expenses 271 384 (113) (29) % Total other (expenses) income, net (90) 28 (118) (421) % Loss before income tax benefit $ (576) $ (321) $ (255) 79 % 51For the six months ended June 30, 2020, we incurred a loss before income tax benefit of $576 compared to $321 for the same period in 2019. The change in loss before income tax benefit was primarily due to a decrease in total revenues, partially offset by a decrease in total expenses. Total revenues decreased primarily as a result of elevated negative mark-to-market revenues during the six months ended June 30, 2020 compared to the same period in 2019. Amortization, net of accretion, for the six months ended June 30, 2020 increased compared to the same period in 2019, primarily due to an increase in amortization of forward MSRs as a result of elevated prepayments driven by the declining interest rate environment. Total expenses for the six months ended June 30, 2020 decreased compared to the same period in 2019 primarily due to a decrease in foreclosure and other liquidation expenses and a decrease in salaries, wages and benefits. The decrease in foreclosure and other liquidation expenses was primarily driven by operational improvements of the reverse portfolio with respect to assignments and adherence to HUD curtailment guidelines, in addition to improved performance of $15 on loss recoveries related to settlement with a prior servicer. The decrease in salaries, wages and benefits was primarily due to improved operational efficiencies, which included consolidation of one of our servicing centers.Total other (expenses) income, net, for the six months ended June 30, 2020 decreased compared to the same period in 2019 primarily due to a decrease in interest income. The decrease in interest income was primarily due to a decrease in other interest income due to lower interest income earned on custodial balances driven by lower LIBOR rates and a decrease in income earned on reverse mortgage interest, primarily driven by the decline in the reverse mortgage interests balance. Refer to Table 10.1 Servicing - Revenues, Table 11.1 Servicing - Expenses and Table 12.1 Servicing - Other (Expenses) Income, Net, for further discussions on the changes in total revenues, total expenses and total other (expenses) income, net, respectively.Table 6. Servicing Portfolio - Unpaid Principal Balances Three Months Ended June 30, Six Months Ended June 30, 2020 2019 2020 2019 Average UPB Forward MSRs $ 289,707 $ 315,333 $ 296,446 $ 312,158 Subservicing and other(1)301,680 297,924 306,121 268,696 Reverse loans 21,058 26,028 21,559 26,750 Total average UPB $ 612,445 $ 639,285 $ 624,126 $ 607,604 June 30, 2020 June 30, 2019 Ending UPB Forward MSRs Agency $ 228,680 $ 254,543 Non-agency 49,295 61,469 Total forward MSRs 277,975 316,012 Subservicing and other(1)Agency 286,710 253,846 Non-agency 10,082 48,262 Total subservicing and other 296,792 302,108 Reverse loans MSR 2,190 3,127 MSL 12,891 15,374 Securitized loans 5,677 7,068 Total reverse portfolio serviced 20,758 25,569 Total ending UPB $ 595,525 $ 643,689 (1)Subservicing and other includes (i) loans we service for others, (ii) residential mortgage loans originated but have yet to be sold, and (iii) agency REO balances for which we own the mortgage servicing rights.52The following tables provide a rollforward of our forward MSR and subservicing and other portfolio UPB:Table 7. Forward Servicing and Subservicing and Other Portfolio UPB Rollforward Three Months Ended June 30, 2020 Three Months Ended June 30, 2019 Forward MSR Subservicing and Other Total Forward MSR Subservicing and Other Total Balance - beginning of period $ 290,634 $ 316,933 $ 607,567 $ 303,692 $ 301,191 $ 604,883 Additions: Originations 9,478 1,024 10,502 9,521 399 9,920 Acquisitions / Increase in subservicing(1)(1,634) 16,908 15,274 20,073 12,715 32,788 Deductions: Dispositions (31) (9,751) (9,782) (2,239) (675) (2,914) Principal reductions and other (2,678) (2,168) (4,846) (3,031) (2,669) (5,700) Voluntary reductions(2)(17,435) (26,113) (43,548) (11,113) (8,665) (19,778) Involuntary reductions(3)(251) (41) (292) (807) (188) (995) Net changes in loans serviced by others (108) — (108) (84) — (84) Balance - end of period $ 277,975 $ 296,792 $ 574,767 $ 316,012 $ 302,108 $ 618,120 (1)Includes transfers to/from Subservicing and Other.(2)Voluntary reductions are related to loan payoffs by customers.(3)Involuntary reductions refer to loan chargeoffs.During the three months ended June 30, 2020, our forward MSR UPB decreased primarily due to increased voluntary reductions driven by the low interest rate environment. During the three months ended June 30, 2020, our subservicing and other portfolio ending UPB decreased primarily driven by increased voluntary reductions in the low interest rate environment and increased dispositions due to various MSR sales, partially offset by portfolio growth from our subservicing clients.Table 7.1 Forward Servicing and Subservicing and Other Portfolio UPB Rollforward Six Months Ended June 30, 2020 Six Months Ended June 30, 2019 Forward MSR Subservicing and Other Total Forward MSR Subservicing and Other Total Balance - beginning of period $ 296,782 $ 323,983 $ 620,765 $ 295,481 $ 223,886 $ 519,367 Additions: Originations 21,113 1,686 22,799 14,412 803 15,215 Acquisitions / Increase in subservicing(1)(2,307) 40,260 37,953 33,477 97,121 130,598 Deductions: Dispositions (71) (20,110) (20,181) (2,372) (1,793) (4,165) Principal reductions and other (5,426) (5,133) (10,559) (5,858) (4,986) (10,844) Voluntary reductions(2)(31,299) (43,785) (75,084) (17,410) (12,640) (30,050) Involuntary reductions(3)(638) (109) (747) (1,569) (283) (1,852) Net changes in loans serviced by others (179) — (179) (149) — (149) Balance - end of period $ 277,975 $ 296,792 $ 574,767 $ 316,012 $ 302,108 $ 618,120 (1)Includes transfers to/from Subservicing and Other.53(2)Voluntary reductions are related to loan payoffs by customers.(3)Involuntary reductions refer to loan chargeoffs.During the six months ended June 30, 2020, our forward MSR UPB decreased primarily due to increased voluntary reductions in the low interest rate environment, partially offset by increased origination volumes. During the six months ended June 30, 2020, our subservicing and other portfolio ending UPB decreased primarily driven by increased voluntary reductions in the low interest rate environment and increased dispositions due to various MSR sales, partially offset by portfolio growth from our subservicing clients.The table below summarizes the overall performance of the forward servicing and subservicing portfolio:Table 8. Key Performance Metrics - Forward Servicing and Subservicing Portfolio(1)June 30, 2020 June 30, 2019 Loan count(2)3,360,826 3,637,538 Average loan amount(3)$ 171,022 $ 169,935 Average coupon - credit sensitive(4)4.7 % 4.8 % Average coupon - interest sensitive(4)4.2 % 4.4 % Average coupon - agency(4)4.4 % 4.5 % Average coupon - non-agency(4)4.7 % 4.8 % 60+ delinquent (% of loans)(5)4.7 % 2.3 % 90+ delinquent (% of loans)(5)2.2 % 2.0 % 120+ delinquent (% of loans)(5)1.6 % 1.8 % Three Months Ended June 30, Six Months Ended June 30, 2020 2019 2020 2019 Total prepayment speed (12-month constant prepayment rate) 26.0 % 13.0 % 22.6 % 10.8 % (1)Characteristics and key performance metrics of our servicing portfolio exclude UPB and loan counts acquired but not yet boarded and currently serviced by others.(2)As of June 30, 2020, loan count includes 195,423 loans in forbearance related to the CARES Act, whereby the borrowers have failed to make at least one payment.(3)Average loan amount is presented in whole dollar amounts.(4)The weighted average coupon amounts presented in the table above are only reflective of our owned forward MSR portfolio that is reported at fair value.(5)Loan delinquency is based on the current contractual due date of the loan. In the case of a completed loan modification, delinquency is based on the modified due date of the loan. Loan delinquency includes loans in forbearance.Delinquency is a significant assumption in determining the mark-to-market adjustment and is a key indicator of MSR portfolio performance. Delinquent loans contribute to lower MSR values due to higher costs to service and increased carrying costs of advances. Due to the COVID-19 pandemic and the implementation of the CARES Act, loans greater than 60 days delinquent have increased as of June 30, 2020 compared to the same period in 2019.Table 9. Forward Loan Modifications and Workout Units Three Months Ended June 30, 2020 2019 Amount Change % Change Modifications 4,329 5,632 (1,303) (23) % Workouts 34,355 6,476 27,879 430 % Total modifications and workout units 38,684 12,108 26,576 219 % Total modifications and workouts during the three months ended June 30, 2020 increased compared to the same period in 2019 primarily due to an increase in workouts related to loans impacted by the COVID-19 pandemic which successfully exited their forbearance plans.54Table 9.1 Forward Loan Modifications and Workout Units Six Months Ended June 30, 2020 2020 2019 Amount Change % Change Modifications 9,044 10,821 (1,777) (16) % Workouts 38,349 10,877 27,472 253 % Total modifications and workout units 47,393 21,698 25,695 118 % Total modifications and workouts during the six months ended June 30, 2020 increased compared to the same period in 2019 primarily due to an increase in workouts related to loans impacted by the COVID-19 pandemic which successfully exited their forbearance plans.The following tables provide the composition of revenues for the Servicing segment:Table 10. Servicing - Revenues Three Months Ended June 30, 2020 2019 $ Change % Change Amt bps(1)Amt bps(1)Amt bps(1)Amt bps(1)Forward MSR Operational Revenue Base servicing fees $ 239 16 $ 257 16 $ (18) — (7) % — % Modification fees(2)2 — 6 — (4) — (67) % — % Incentive fees(2)5 — 1 — 4 — 400 % — % Late payment fees(2)16 1 20 2 (4) (1) (20) % (50) % Other ancillary revenues(2)44 3 30 2 14 1 47 % 50 % Total forward MSR operational revenue 306 20 314 20 (8) — (3) % — % Base subservicing fees and other subservicing revenue(3)69 5 62 4 7 1 11 % 25 % Reverse servicing fees 7 — 8 — (1) — (13) % — % Total servicing fee revenue 382 25 384 24 (2) 1 (1) % 4 % MSR financing liability costs (9) (1) (11) (1) 2 — (18) % — % Excess spread costs - principal (79) (5) (59) (3) (20) (2) 34 % 67 % Total operational revenue 294 19 314 20 (20) (1) (6) % (5) % Amortization, net of accretion Forward MSR amortization (186) (12) (125) (8) (61) (4) 49 % 50 % Excess spread accretion 79 5 59 3 20 2 34 % 67 % Reverse MSL accretion 5 — 11 1 (6) (1) (55) % (100) % Reverse MSR amortization — — (1) — 1 — 100 % — % Total amortization, net of accretion (102) (7) (56) (4) (46) (3) 82 % 75 % Mark-to-Market Adjustments MSR MTM(3)(321) (21) (227) (14) (94) (7) 41 % 50 % Excess spread / financing MTM 60 4 (4) — 64 4 (1,600) % 100 % Total MTM adjustments (261) (17) (231) (14) (30) (3) 13 % 21 % Total revenues - Servicing $ (69) (5) $ 27 2 $ (96) (7) (356) % (350) % (1)Calculated basis points (“bps”) are as follows: Annualized dollar amount/Total average UPB X 10000.(2)Certain ancillary and other non-base fees related to subservicing operations are separately presented as other subservicing revenues.(3)The amount of MSR MTM includes the impact of negative modeled cash flows which have been transferred to reserves on advances and other receivables. The negative modeled cash flows relate to advances and other receivables associated with inactive and liquidated loans that are no longer part of the MSR portfolio. The impact of negative modeled cash flows was $3 and $17 for the three months ended June 30, 2020 and 2019, respectively.55Forward - Due to the decrease of the forward MSR portfolio’s UPB, base servicing fee revenue decreased for the three months ended June 30, 2020 as compared to the same period in 2019. Other ancillary revenues increased primarily due to higher sales lead incentives due to increased portfolio recapture activity. Incentive fee revenue increased primarily due to higher investor incentives driven by better overall performance.Forward MSR amortization increased for the three months ended June 30, 2020 as compared to the same period in 2019, primarily due to higher prepayments driven by the lower interest rate environment.Total negative MTM adjustments increased for the three months ended June 30, 2020 as compared to the same period in 2019 primarily due to the declining interest rate environment during 2020.Subservicing - Subservicing fees increased for the three months ended June 30, 2020 as compared to the same period in 2019, primarily due to higher average subservicing portfolio UPB.Reverse - Servicing fees and reverse MSL accretion on reverse mortgage portfolios for the three months ended June 30, 2020 decreased as compared to the same period in 2019, primarily due to the decline in the reverse mortgage portfolio.Table 10.1 Servicing - Revenues Six Months Ended June 30, 2020 2019 $ Change % Change Amt bps(1)Amt bps(1)Amt bps(1)Amt bps(1)Forward MSR Operational Revenue Base servicing fees $ 489 16 $ 497 17 $ (8) (1) (2) % (6) % Modification fees(2)5 — 9 — (4) — (44) % — % Incentive fees(2)9 — 2 — 7 — 350 % — % Late payment fees(2)39 1 39 1 — — — % — % Other ancillary revenues(2)82 3 78 3 4 — 5 % — % Total forward MSR operational revenue 624 20 625 21 (1) (1) — % (5) % Base subservicing fees and other subservicing revenue(3)134 5 114 4 20 1 18 % 25 % Reverse servicing fees 13 — 17 — (4) — (24) % — % Total servicing fee revenue 771 25 756 25 15 — 2 % — % MSR financing liability costs (17) (1) (23) (1) 6 — (26) % — % Excess spread costs - principal (147) (5) (95) (3) (52) (2) 55 % 67 % Total operational revenue 607 19 638 21 (31) (2) (5) % (10) % Amortization, net of accretion Forward MSR amortization (338) (11) (204) (7) (134) (4) 66 % 57 % Excess spread accretion 147 5 95 3 52 2 55 % 67 % Reverse MSL accretion 13 — 29 1 (16) (1) (55) % (100) % Reverse MSR amortization — — 1 — (1) — (100) % — % Total amortization, net of accretion (178) (6) (79) (3) (99) (3) 125 % 100 % Mark-to-Market Adjustments MSR MTM(3)(733) (23) (587) (19) (146) (4) 25 % 21 % Excess spread / financing MTM 89 3 63 2 26 1 41 % 50 % Total MTM adjustments (644) (20) (524) (17) (120) (3) 23 % 18 % Total revenues - Servicing $ (215) (7) $ 35 1 $ (250) (8) (714) % (800) % 56(1)Calculated basis points (“bps”) are as follows: Annualized dollar amount/Total average UPB X 10000.(2)Certain ancillary and other non-base fees related to subservicing operations are separately presented as other subservicing revenues.(3)The amount of MSR MTM includes the impact of negative modeled cash flows which have been transferred to reserves on advances and other receivables. The negative modeled cash flows relate to advances and other receivables associated with inactive and liquidated loans that are no longer part of the MSR portfolio. The impact of negative modeled cash flows was $13 and $28 for the six months ended June 30, 2020 and 2019, respectively.Forward - Due to the decrease of the forward MSR portfolio’s UPB, base servicing fee revenue decreased for the six months ended June 30, 2020 as compared to the same period in 2019. Incentive fee revenue increased primarily due to higher investor incentives driven by better overall performance.Forward MSR amortization increased for the six months ended June 30, 2020 as compared to the same period in 2019, primarily due to higher prepayments driven by the lower interest rate environment.Total negative MTM adjustments increased for the six months ended June 30, 2020 as compared to the same period in 2019 primarily due to the declining interest rate environment during 2020.Subservicing - Subservicing fees increased for the six months ended June 30, 2020 as compared to the same period in 2019 primarily due to a higher average subservicing portfolio UPB.Reverse - Servicing fees and reverse MSL accretion on reverse mortgage portfolios for the six months ended June 30, 2020 decreased as compared to the same period in 2019, primarily due to the decline in the reverse mortgage portfolio. Reverse MSL accretion was further impacted by $6 pertaining to accumulated accretion recorded during the six months ended June 30, 2019 related to fair value adjustments for MSL assumed from the Merger. The fair value adjustment resulted from the revised cost to service assumption used in the valuation of MSL during the measurement period.The tables below summarize expenses for the Servicing segment:Table 11. Servicing - Expenses Three Months Ended June 30, 2020 2019 Change % Change Amt bps(1)Amt bps(1)Amt bps(1)Amt bps(1)Salaries, wages and benefits $ 75 5 $ 90 6 $ (15) (1) (17) % (17) % General and administrative Servicing support fees 27 2 24 2 3 — 13 % — % Corporate and other general and administrative expenses 32 2 39 2 (7) — (18) % — % Foreclosure and other liquidation related expenses (recoveries), net (17) (1) 32 2 (49) (3) (153) % (150) % Depreciation and amortization 5 — 4 — 1 — 25 % — % Total general and administrative expenses 47 3 99 6 (52) (3) (53) % (50) % Total expenses - Servicing $ 122 8 $ 189 12 $ (67) (4) (35) % (33) % (1)Calculated basis points (“bps”) are as follows: Annualized dollar amount/Total average UPB X 10000.Total expenses decreased during the three months ended June 30, 2020 compared to the same period in 2019, primarily driven by a decrease in foreclosure and other liquidation expenses (recoveries), net. Foreclosure and other liquidation related expenses (recoveries), net, decreased primarily due to operational improvements of the reverse portfolio with respect to assignments and adherence to HUD curtailment guidelines, in addition to improved performance of $15 on loss recoveries related to settlement with a prior servicer. Salaries, wages and benefits decreased in 2020 compared to the same period in 2019 primarily due to operational efficiencies which included consolidation of one of our servicing centers.57Table 11.1 Servicing - Expenses Six Months Ended June 30, 2020 2019 Change % Change Amt bps(1)Amt bps(1)Amt bps(1)Amt bps(1)Salaries, wages and benefits $ 161 5 $ 176 6 $ (15) (1) (9) % (17) % General and administrative Servicing support fees 52 2 63 2 (11) — (17) % — % Corporate and other general and administrative expenses 67 2 78 3 (11) (1) (14) % (33) % Foreclosure and other liquidation related expenses (recoveries), net (17) — 59 2 (76) (2) (129) % (100) % Depreciation and amortization 8 — 8 — — — — % — % Total general and administrative expenses 110 4 208 7 (98) (3) (47) % (43) % Total expenses - Servicing $ 271 9 $ 384 13 $ (113) (4) (29) % (31) % (1)Calculated basis points (“bps”) are as follows: Annualized dollar amount/Total average UPB X 10000.Total expenses decreased during the six months ended June 30, 2020 compared to the same period in 2019, primarily driven by a decrease in foreclosure and other liquidation expenses (recoveries), net. Foreclosure and other liquidation related expenses (recoveries), net decreased primarily due to operational improvements of the reverse portfolio with respect to assignments and adherence to HUD curtailment guidelines, in addition to improved performance of $15 on loss recoveries related to a settlement with a prior servicer during the six months ended June 30, 2020. Servicing support fees decreased in 2020 compared to the same period in 2019 primarily due to lower legal and tax service expenses. The decrease in Corporate and other general and administrative expenses in 2020 compared to the same period in 2019 was primarily driven by lower occupancy expenses. Salaries, wages and benefits decreased in 2020 compared to the same period in 2019 primarily due to improved operational efficiencies which included consolidation of one of our servicing centers.Table 12. Servicing - Other (Expenses) Income, Net Three Months Ended June 30, 2020 2019 Change % Change Amt bps(1)Amt bps(1)Amt bps(1)Amt bps(1)Income earned on Reverse mortgage interest $ 54 4 $ 86 6 $ (32) (2) (37) % (33) % Other interest income 3 — 50 3 (47) (3) (94) % (100) % Interest income 57 4 136 9 (79) (5) (58) % (56) % Reverse mortgage interest expense (51) (3) (46) (3) (5) — 11 % — % Advance interest expense (8) (1) (8) (1) — — — % — % Other interest expense (58) (4) (55) (3) (3) (1) 5 % 33 % Interest expense (117) (8) (109) (7) (8) (1) 7 % 14 % Total other (expenses) income, net - Servicing $ (60) (4) $ 27 2 $ (87) (6) (322) % (300) % Weighted average cost - advance facilities 2.9 % 5.5 % (2.6) % (47) % Weighted average cost - excess spread financing 9.0 % 8.9 % 0.1 % 1 % (1)Calculated basis points (“bps”) are as follows: Annualized dollar amount/Total average UPB X 10000.58For the three months ended June 30, 2020, we had total other expenses, net, of $60 compared to total other income, net, of $27 for the same period in 2019. The change was primarily due to a decrease in interest income, mainly driven by lower interest income earned on custodial balances driven by lower LIBOR rates. Income earned on reverse mortgage interest decreased due to the decline in the reverse mortgage interests balance and the amortization of a net asset premium into income. Interest expense increased for the three months ended June 30, 2020 as compared to the same period in 2019, primarily due to an increase in other interest expense and reverse mortgage interest expense. Other interest expense increased due to higher bank fees and higher compensating interest expense. The increase in reverse mortgage interest expense was primarily driven by lower bond premium amortization, partially offset by the decline in the reverse mortgage interest portfolio.Table 12.1 Servicing - Other (Expenses) Income, Net Six Months Ended June 30, 2020 2019 Change % Change Amt bps(1)Amt bps(1)Amt bps(1)Amt bps(1)Income earned on Reverse mortgage interest $ 97 3 $ 168 5 $ (71) (2) (42) % (40) % Other interest income 43 1 83 3 (40) (2) (48) % (67) % Interest income 140 4 251 8 (111) (4) (44) % (50) % Reverse mortgage interest expense (103) (3) (117) (4) 14 1 (12) % (25) % Advance interest expense (13) — (17) — 4 — (24) % — % Other interest expense (114) (4) (89) (3) (25) (1) 28 % 33 % Interest expense (230) (7) (223) (7) (7) — 3 % — % Total other (expenses) income, net - Servicing $ (90) (3) $ 28 1 $ (118) (4) (421) % (400) % Weighted average cost - advance facilities 3.0 % 5.1 % (2.1) % (41) % Weighted average cost - excess spread financing 9.0 % 8.9 % 0.1 % 1 % (1)Calculated basis points (“bps”) are as follows: Annualized dollar amount/Total average UPB X 10000.For the six months ended June 30, 2020, we had total other expenses, net, of $90 compared to total other income, net, of $28 for the same period in 2019. The change was primarily due to a decrease in interest income, mainly driven by lower interest income earned on custodial balances driven by lower LIBOR rates. Income earned on reverse mortgage interest decreased due to the decline in the reverse mortgage interests balance and the amortization of a net asset premium into income. Interest expense remained relatively flat for the six months ended June 30, 2020 as compared to the same period in 2019.59Servicing Portfolio and Related LiabilitiesThe table below summarizes the servicing portfolio and related liabilities in the Servicing segment:Table 13. Servicing Portfolios and Related Liabilities June 30, 2020 December 31, 2019 UPB Carrying Amount bps UPB Carrying Amount bps Forward MSRs - acquisition pool: Credit sensitive $ 131,105 $ 1,307 100 $ 147,895 $ 1,613 109 Interest sensitive 146,870 1,450 99 148,887 1,883 126 Total forward MSRs - fair value $ 277,975 $ 2,757 99 $ 296,782 $ 3,496 118 Forward MSRs - investor pool: Agency $ 228,680 $ 2,308 101 $ 240,688 $ 2,944 122 Non-agency 49,295 449 91 56,094 552 98 Total forward MSRs - fair value $ 277,975 $ 2,757 99 $ 296,782 $ 3,496 118 Total forward MSRs $ 277,975 $ 2,757 $ 296,782 $ 3,496 Subservicing and other(1)Agency 286,710 N/A 308,532 N/A Non-agency 10,082 N/A 15,451 N/A Total subservicing and other 296,792 N/A 323,983 N/A Reverse portfolio - amortized cost MSR 2,190 6 2,508 6 MSL 12,891 (48) 13,994 (61) Securitized loans 5,677 5,709 6,223 6,279 Total reverse portfolio serviced 20,758 5,667 22,725 6,224 Total servicing portfolio unpaid principal balance $ 595,525 $ 8,424 $ 643,490 $ 9,720 (1)Subservicing and other amounts include loans we service for others, residential mortgage loans originated but have yet to be sold and agency REO balances for which we own the mortgage servicing rights.As of June 30, 2020, when measuring the fair value of the portfolio as a basis point of the unpaid principal balance, our credit sensitive pool decreased in value by 9 bps and interest sensitive pool decreased in value by 27 bps, compared to December 31, 2019 primarily due to higher forecasted prepayment speeds as a result of the variable conversion featuredeclining interest rate environment in 2020.We assess whether acquired portfolios are more credit sensitive or interest sensitive in nature on the date of acquisition. We consider numerous factors in making this assessment, with the primary factors consisting of the overall portfolio delinquency characteristics, portfolio seasoning and residential mortgage loan composition. Interest rate sensitive portfolios typically consist of single-family conforming residential forward mortgage loans serviced for GSEs or other third-party investors. Credit sensitive portfolios primarily consist of higher delinquency single-family non-conforming residential forward mortgage loans in private-label securitizations.60The following table sets forth the activities of forward MSRs:Table 14. Forward MSRs - Fair Value, Rollforward Three Months Ended June 30, Six Months Ended June 30, 2020 2019 2020 2019 Fair value - beginning of period $ 3,109 $ 3,481 $ 3,496 $ 3,665 Additions: Servicing retained from mortgage loans sold 126 103 249 169 Purchases of servicing rights — 280 24 689 Dispositions: Sales and cancellation of servicing assets — (34) — (294) Changes in fair value: Due to changes in valuation inputs or assumptions used in the valuation model: Credit sensitive (40) (35) (221) (156) Interest sensitive (276) (175) (496) (386) Other changes in fair value: Scheduled principal payments (24) (23) (47) (45) Disposition of negative MSRs and other(1)25 11 45 23 Prepayments Voluntary prepayments Credit sensitive (26) (26) (50) (45) Interest sensitive (135) (70) (237) (102) Involuntary prepayments Credit sensitive — (2) (1) (4) Interest sensitive (2) (5) (5) (9) Fair value - end of period $ 2,757 $ 3,505 $ 2,757 $ 3,505 (1)Amounts primarily represent negative fair values reclassified from the MSR asset to reserves as underlying loans are removed from the MSR and other reclassification adjustments.61The following table sets forth the weighted-average key assumptions in estimating the fair value of forward MSRs:Table 15. MSRs - Fair Value June 30, 2020 June 30, 2019 Total MSRs Portfolio Discount rate 9.5 % 9.7 % Prepayment speeds 14.2 % 13.7 % Average life 5.3 years 5.8 years Acquisition Pools: Credit Sensitive Discount rate 9.9 % 10.6 % Prepayment speeds 12.6 % 13.5 % Average life 5.6 years 5.9 years Interest Sensitive Discount rate 9.0 % 8.9 % Prepayment speeds 15.8 % 13.9 % Average life 4.9 years 5.6 years Investor Pools: Agency Discount rate 8.9 % 9.0 % Prepayment speeds 14.4 % 13.5 % Average life 5.2 years 5.7 years Non-Agency Discount rate 12.0 % 12.6 % Prepayment speeds 13.4 % 14.5 % Average life 5.6 years 6.0 years The weighted-average discount rate for total MSRs portfolio decreased as of June 30, 2020 compared to the same period in 2019 due to the declining interest rate environment in 2020. Weighted-average life for total MSRs portfolio decreased due to the increase in prepayment speeds, which was attributable to the interest rate decline period over period.The discount rate, which is used to determine the present value of estimated future net servicing income, is based on the required rate of return market investors would expect for an asset with similar risk characteristics. The discount rate is determined through review of recent market transactions as well as comparing the discount rate to those utilized by third-party valuation specialists.Total prepayment speeds represent the annual rate at which borrowers are forecasted to repay their mortgage loan principal, which includes estimates for both voluntary and involuntary borrower liquidations. The expected weighted-average life represents the total years we expect to service the MSR.The key assumptions were separately applied to the servicing of loans in forbearance to account for differences in the underlying estimate of future servicing revenues related to those loans.62Excess Spread FinancingAs further disclosed in Note 3, Mortgage Servicing Rights and Related Liabilities,we have entered into sale and assignment agreements treated as financing arrangements whereby the acquirer has the right to receive a specified percentage of the excess cash flow generated from an MSR.The servicing fees associated with an MSR can be segregated into (i) a base servicing fee and (ii) an excess servicing fee. The base servicing fee, along with ancillary income and other revenues, is designed to cover costs incurred to service the specified pool plus a reasonable margin. The remaining servicing fee is considered excess. We sell a percentage of the excess fee as a method for efficiently financing acquired MSRs and the purchase of loans.Excess spread financings are recorded at fair value, and the impact of fair value adjustments on future revenues and capital resources varies primarily due to (i) prepayment speeds and (ii) our Series B Preferred Stockability to recapture mortgage prepayments through the origination platform. See Note 3, Mortgage Servicing Rights and Related Liabilities, for additional information regarding the range of assumptions and sensitivities related to the measurement of the excess spread financing liability as of June 30, 2020 and December 31, 2019.The following table sets forth the change in fairthe excess spread financing and the related weighted-average assumptions:Table 16. Excess Spread Financing Three Months Ended June 30, Six Months Ended June 30, 2020 2019 2020 2019 Fair value - beginning of period $ 1,242 $ 1,309 $ 1,311 $ 1,184 Additions: New financings — 193 24 438 Deductions: Settlements and repayments (52) (68) (110) (119) Changes in fair value: Credit Sensitive (22) 17 (24) (15) Interest Sensitive (44) (22) (77) (59) Fair value - end of period $ 1,124 $ 1,429 $ 1,124 $ 1,429 Key Weighted-Average Assumptions: June 30, 2020 June 30, 2019 Total Excess Spread Portfolio Discount rate 12.0 % 9.6 % Prepayment speeds 13.4 % 13.1 % Recapture rate 18.7 % 20.2 % Average life 5.4 years 5.7 years Credit Sensitive Discount rate 12.7 % 10.3 % Prepayment speeds 12.7 % 13.1 % Recapture rate 20.3 % 22.3 % Average life 5.6 years 5.8 years Interest Sensitive Discount rate 10.7 % 8.4 % Prepayment speeds 14.6 % 12.9 % Recapture rate 15.8 % 17.4 % Average life 5.1 years 5.4 years 63The following table sets forth the change in the MSRs financing liability and the related weighted-average assumptions:Table 17. MSRs Financing Liability - Rollforward Three Months Ended June 30, Six Months Ended June 30, 2020 2019 2020 2019 Fair value - beginning of period $ 43 $ 34 $ 37 $ 32 Changes in fair value: Changes in valuation inputs or assumptions used in the valuation model 9 13 18 19 Other changes in fair value (3) (4) (6) (8) Fair value - end of period $ 49 $ 43 $ 49 $ 43 June 30, 2020 June 30, 2019 Weighted-Average Assumptions Advance financing rates 4.3 % 3.7 % Annual advance recovery rates 18.6 % 19.3 % We entered into several sale agreements whereby we sold the right to receive repayment of servicing advances on private-label servicing advances and the right to receive a portion of the base fee component on the related MSRs, and also transferred the obligations to make future advances. These transactions are recorded as an MSR financing liability in our consolidated balance sheets and represent the incremental costs relative to the market participant assumptions contained in the MSR valuation. Changes in the value of the MSR financing liability are recorded against servicing revenue and interest imputed on the outstanding liability is reflected on our condensed consolidated statements of operationsrecorded as the other income or expense item, “change ininterest expense.We estimate fair value of the MSR financing liability based on the present value of future expected discounted cash flows with the discount rate approximating current market rate for similar financial instruments. The cash flow assumptions and prepayment assumptions used in the model are based on various factors, with the key assumptions being advance financing rates and annual advance recovery rates.The following table provides an overview of our forward servicing portfolio and amounts that involve excess spread financing with our co-investment partners for the periods indicated:Table 18. Leveraged Portfolio Characteristics June 30, 2020 June 30, 2019 Owned forward servicing portfolio - unencumbered $ 83,683 $ 87,007 Owned forward servicing portfolio - encumbered 194,292 229,005 Subserviced forward servicing portfolio and other 296,792 302,108 Total unpaid principal balance $ 574,767 $ 618,120 The encumbered forward servicing portfolio consists of residential mortgage loans included within our excess spread financing transactions and MSR financing liability. Subserviced and other amounts include (1) loans serviced for others, (2) residential mortgage loans originated but not yet sold and (3) agency REO balances for which we own the mortgage servicing rights.64Reverse MSRs, MSLs and Participating Interests in Reverse Mortgages - Amortized CostThe table below provides detail of the characteristics and key performance metrics of the reverse servicing portfolio, which is included in reverse MSRs, MSLs and participating interests in reverse mortgages. Such assets are recorded at amortized cost.Table 19. Reverse Mortgage Portfolio Characteristics June 30, 2020 June 30, 2019 Loan count 154,313 180,899 Ending unpaid principal balance $ 20,758 $ 25,569 Average loan amount(1)$ 134,516 $ 141,342 Average coupon 2.2 % 4.3 % Average borrower age 81 80 (1)Average loan amount is presented in whole dollar amounts.Historically, we acquired servicing rights and participating interests in reverse mortgage portfolios. Reverse mortgage loans, most commonly HECMs, provide seniors 62 and older with a loan upon which draws can be made periodically. The draws are secured by the equity in the borrower’s home. For acquired servicing rights, an MSR or MSL is established on the acquisition date at fair value, as applicable, based on the expected discounted cash flow from servicing the reverse portfolio.Each quarter, we accrete the MSL to revenues - service related, net of the respective portfolios’ run-off. The MSL is assessed for increased obligation based on its fair value, using a variety of assumptions, with the key assumptions being discount rates, prepayment speeds and borrower life expectancy. The MSLs are stratified based on predominant risk characteristics of the underlying serviced loans. Impairment, if any, represents the excess of amortized cost of an individual stratum over its estimated fair value and is recognized through an increase in the valuation allowance.Based on our assessment, no impairment or increased obligation was required to be recorded for reverse MSRs and MSLs as of June 30, 2020.Originations Segment The strategy of our Originations segment is to originate or acquire new loans for the servicing portfolio at a more attractive cost than purchasing MSRs in bulk transactions and to retain our existing customers by providing them with attractive refinance options. The Originations segment plays a strategically important role because its profitability is typically counter cyclical to that of the Servicing segment. Furthermore, by originating or acquiring loans at a more attractive cost than would be the case in bulk MSR acquisitions, the Originations segment improves our overall profitability and cash flow. Growing the Originations segment has been a strategic focus for us for several years.The Originations segment includes three channels:•Our direct-to-consumer lending channel relies on our call centers, our website, and mobile apps to interact with customers. Our primary focus is to assist our customers with a refinance or home purchase by providing them with a needs-based approach to understanding their current mortgage options.•Our correspondent lending channel acquires newly originated residential mortgage loans that have been underwritten to investor guidelines. This includes both conventional and government-insured loans that qualify for inclusion in securitizations that are guaranteed by the GSEs. Our correspondent lending channel enables us to replenish servicing portfolio run-off typically at a better rate of return than traditional bulk or flow acquisitions.•Our wholesale lending channel works with mortgage brokers to source loans which are underwritten and funded by us in our name. Counterparty risk is mitigated through quality and compliance monitoring and all brokers are subject to our eligibility requirements coupled with an annual recertification process. We shut down our wholesale lending operations during the three months ended June 30, 2020 and subsequently ceased originating loans and funded out the remaining pipeline.65The charts below set forth the pull through adjusted lock volume and funded volume by channel and channel mix ($ in Billions):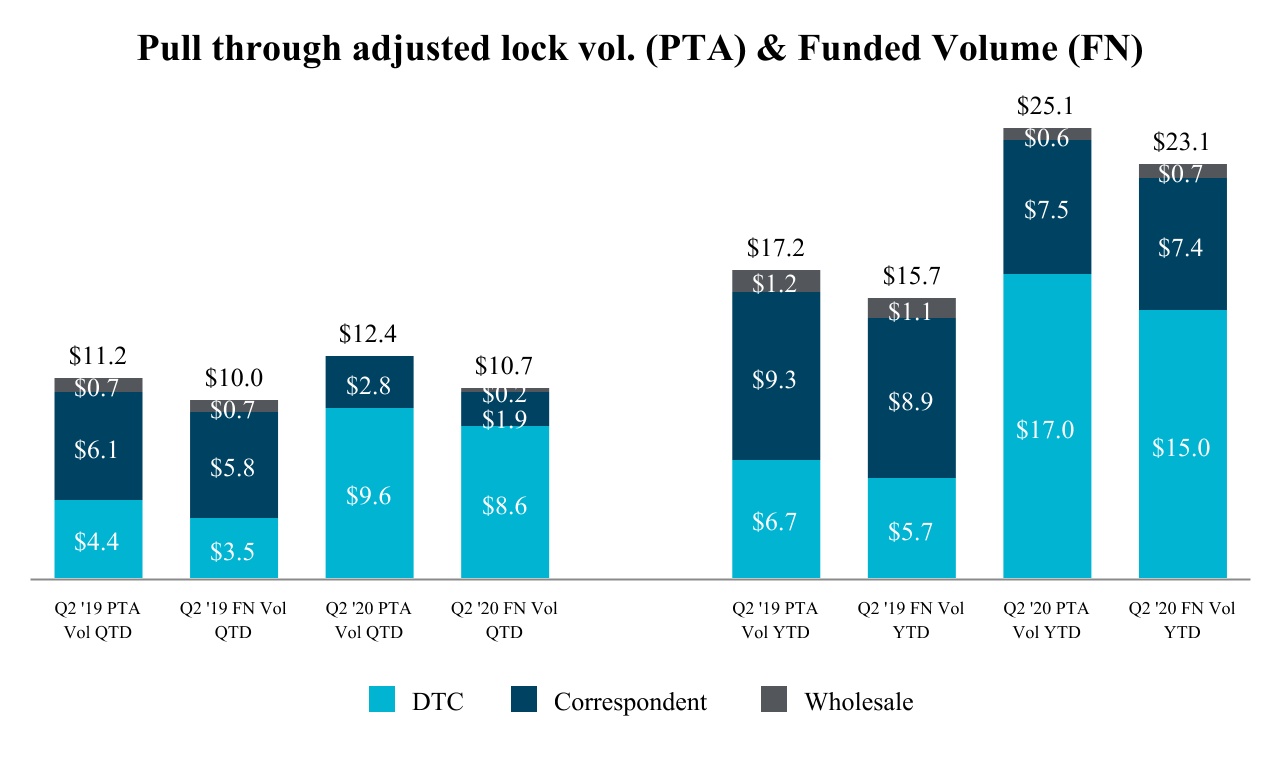
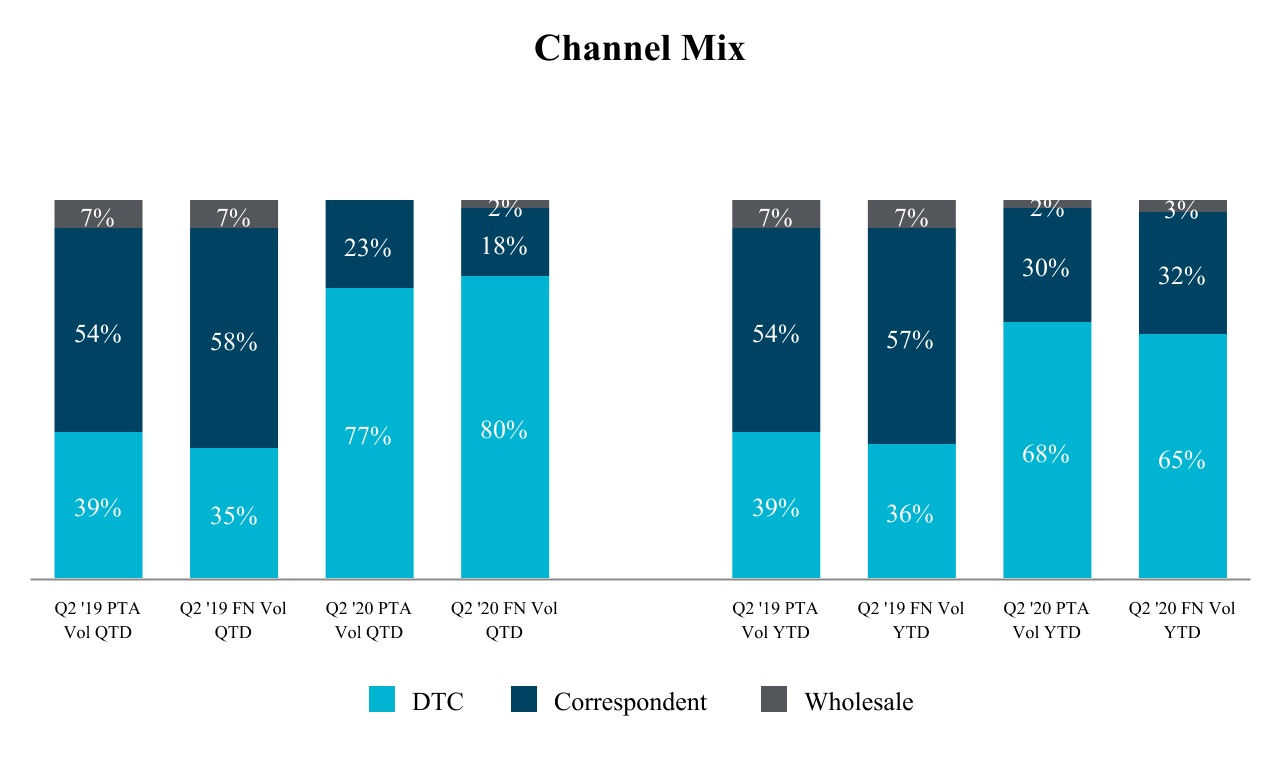 66The following tables set forth the results of operations for the Originations segment:
Table 20. Originations Segment Results of Operations Three Months Ended June 30, 2020 2019 $ Change % Change Total revenues $ 594 $ 264 $ 330 125 % Total expenses 167 145 22 15 % Total other income (expenses), net 6 (1) 7 (700) % Income before income tax expense $ 433 $ 118 $ 315 267 % Originations Margin Revenue $ 594 $ 264 $ 330 125 % Pull through adjusted lock volume $ 12,394 $ 11,197 $ 1,197 11 % Revenue as a percentage of pull through adjusted lock volume(1)4.79 % 2.36 % 2.43 % 103 % Expenses $ 167 $ 145 $ 22 15 % Funded volume $ 10,729 $ 9,996 $ 733 7 % Expenses as a percentage of funded volume(2)1.56 % 1.45 % 0.11 % 8 % Originations Margin 3.23 % 0.91 % 2.32 % 255 % (1)Calculated on pull-through adjusted lock volume as revenue is recognized at the time of loan lock.(2)Calculated on funded volume as expenses are incurred based on closing of the loan.Income before income tax expense increased for the three months ended June 30, 2020 as compared to the same period in 2019 primarily due to an increase in revenues driven by origination volume growth, predominately in the DTC channel. In response to the COVID-19 pandemic, we slowed operations in the correspondent channel in order to prioritize cash build and de-risk the pipeline. The growth in origination volume was primarily due to declining interest rates. The Originations Margin for the three months ended June 30, 2020 increased as compared to the same period in 2019 primarily due to higher revenue as a percentage of pull through adjusted lock volume driven by an increase in volume from the DTC channel.67Table 20.1 Originations Segment Results of Operations Six Months Ended June 30, 2020 2019 $ Change % Change Total revenues $ 911 $ 410 $ 501 122 % Total expenses 333 249 84 34 % Total other income, net 13 2 11 550 % Income before income tax expense $ 591 $ 163 $ 428 263 % Originations Margin Revenue $ 911 $ 410 $ 501 122 % Pull through adjusted lock volume $ 25,071 $ 17,157 $ 7,914 46 % Revenue as a percentage of pull through adjusted lock volume(1)3.63 % 2.39 % 1.24 % 52 % Expenses $ 333 $ 249 $ 84 34 % Funded volume $ 23,088 $ 15,712 $ 7,376 47 % Expenses as a percentage of funded volume(2)1.44 % 1.58 % (0.14) % (9) % Originations Margin 2.19 % 0.81 % 1.38 % 170 % (1)Calculated on pull-through adjusted lock volume as revenue is recognized at the time of loan lock.(2)Calculated on funded volume as expenses are incurred based on closing of the loan.Income before tax expense increased for the six months ended June 30, 2020 as compared to the same period in 2019 primarily due to an increase in revenues driven by origination volume growth predominately in the DTC channel. In response to the COVID-19 pandemic, we slowed operations in the correspondent channel in order to prioritize cash build and de-risk the pipeline. The growth in origination volume was primarily due to declining interest rates. The Originations Margin for the six months ended June 30, 2020 increased as compared to the same period in 2019 due to higher revenue as a percentage of pull through adjusted lock volume driven by an increase in volume from the DTC channel.Originations Segment RevenuesService related fee, net - Originations refers to fees collected from customers for originated loans and from other lenders for loans purchased through the correspondent channel, and includes loan application, underwriting, and other similar fees.Net gain on loans originated and sold represents the gains and losses from the origination, purchase, and sale of loans and related derivative - embedded conversion feature”instruments. Gains from the origination and sale of loans are affected by the volume and margin of our originations activity and is impacted by fluctuation in interest rates.Capitalized servicing rights represents the fair value attributed to mortgage servicing rights at the time in which resultedthey are retained in $38.6 millionconnection with the sale of loans during the period.68Total revenues for the Originations segment are set forth in the tables below:Table 21. Originations - Revenues Three Months Ended June 30, 2020 2019 $ Change % Change Service related, net - Originations $ 21 $ 20 $ 1 5 % Net gain on mortgage loans held for sale Net gain on loans originated and sold 453 152 301 198 % Capitalized servicing rights 123 100 23 23 % Provision for repurchase reserves, net of release (3) (8) 5 (63) % Total net gain on mortgage loans held for sale 573 244 329 135 % Total revenues - Originations $ 594 $ 264 $ 330 125 % Key Metrics Consumer direct lock pull through adjusted volume(1)$ 9,595 $ 4,390 $ 5,205 119 % Other locked pull through adjusted volume(1)2,799 6,807 (4,008) (59) % Total pull through adjusted volume $ 12,394 $ 11,197 $ 1,197 11 % Funded volume $ 10,729 $ 9,996 $ 733 7 % Volume of loans sold $ 11,172 $ 9,089 $ 2,083 23 % Recapture percentage(2)26.1 % 23.1 % 3.0 % 13 % Refinance recapture percentage(3)30.9 % 43.7 % (12.8) % (29) % Purchase as a percentage of funded volume 10.3 % 52.8 % (42.5) % (80) % Value of capitalized servicing on retained settlements 133 bps 149 bps (16) bps (11) % (1)Pull through adjusted volume represents the expected funding from locks taken during the period.(2)Recapture percentage includes both purchase and refinance origination and payoff activity.(3)Refinance recapture percentage excludes purchase originations and purchase payoff activity.Total revenues increased for the three months ended June 30, 2020 compared to the same period in 2019 primarily driven by the higher origination volumes in a declining interest rate environment and higher volumes from the DTC channel. Total revenue increased $330 or 125% period over period as consumer direct lock pull through adjusted volume increased 119% during the same period.69Table 21.1 Originations - Revenues Six Months Ended June 30, 2020 2019 $ Change % Change Service related, net - Originations $ 41 $ 35 $ 6 17 % Net gain on mortgage loans held for sale Net gain on loans originated and sold 636 224 412 184 % Capitalized servicing rights 242 161 81 50 % Provision for repurchase reserves, net of release (8) (10) 2 (20) % Total net gain on mortgage loans held for sale 870 375 495 132 % Total revenues - Originations $ 911 $ 410 $ 501 122 % Key Metrics Consumer direct lock pull through adjusted volume(1)$ 17,018 $ 6,723 $ 10,295 153 % Other locked pull through adjusted volume(1)8,053 10,434 (2,381) (23) % Total pull through adjusted volume $ 25,071 $ 17,157 $ 7,914 46 % Funded volume $ 23,088 $ 15,712 $ 7,376 47 % Volume of loans sold $ 24,427 $ 15,324 $ 9,103 59 % Recapture percentage(2)27.5 % 24.9 % 2.6 % 10 % Refinance recapture percentage(3)33.4 % 46.9 % (13.5) % (29) % Purchase as a percentage of funded volume 18.7 % 52.4 % (33.7) % (64) % Value of capitalized servicing on retained settlements 135 bps 146 bps (11) bps (8) % (1)Pull through adjusted volume represents the expected funding from locks taken during the period.(2)Recapture percentage includes both purchase and refinance origination and payoff activity.(3)Refinance recapture percentage excludes purchase originations and purchase payoff activity.Total revenues increased for the six months ended June 30, 2020 compared to the same period in 2019 primarily driven by the higher origination volumes in a declining interest rate environment and higher volumes from the DTC channel. Total revenue increased $501 or 122% period over period as consumer direct lock pull through adjusted volume increased 153% during the same period.The tables below summarize expenses for the Originations segment:Table 22. Originations - Expenses Three Months Ended June 30, 2020 2019 $ Change % Change Salaries, wages and benefits $ 120 $ 88 $ 32 36 % General and administrative Loan origination expenses 16 17 (1) (6) % Corporate and other general and administrative expenses 16 13 3 23 % Marketing and professional service fees 11 21 (10) (48) % Depreciation and amortization 4 6 (2) (33) % Total general and administrative 47 57 (10) (18) % Total expenses - Originations $ 167 $ 145 $ 22 15 % 70Total expenses for the three months ended June 30, 2020 increased when compared to the same period in 2019 primarily due to growth in origination volumes, which was driven by the low interest rate environment. The origination volume growth contributed to the increase in salaries, wages and benefits, due to increased compensation and headcount related costs. The increase in salaries, wages and benefits was partially offset by a decrease in marketing and professional service fee expenses which were higher in 2019 due to a $10 legal reserve.Table 22.1 Originations - Expenses Six Months Ended June 30, 2020 2019 $ Change % Change Salaries, wages and benefits $ 237 $ 157 $ 80 51 % General and administrative Loan origination expenses 32 27 5 19 % Corporate and other general and administrative expenses 34 27 7 26 % Marketing and professional service fees 23 29 (6) (21) % Depreciation and amortization 7 9 (2) (22) % Total general and administrative 96 92 4 4 % Total expenses - Originations $ 333 $ 249 $ 84 34 % Total expenses for the six months ended June 30, 2020 increased when compared to the same period in 2019 primarily due to growth in origination volumes, which was driven by the low interest rate environment. The origination volume growth contributed to the increase in salaries, wages and benefits, due to increased compensation and headcount related costs, and loan origination expenses. In addition, corporate and other general and administrative expenses increased during the six months ended June 30, 2020 primarily driven by higher outsourcing costs, partially offset by a decrease in marketing and professional service fee expenses. Marketing and professional service fee expenses were higher in 2019 primarily due to a $10 legal reserve.The tables below summarize other income (expenses), net, for the Originations segment: Table 23. Originations - Other Income (Expenses), Net Three Months Ended June 30, 2020 2019 $ Change % Change Interest income $ 19 $ 23 $ (4) (17) % Interest expense (13) (25) 12 (48) % Other income, net — 1 (1) (100) % Total other income (expenses), net - Originations $ 6 $ (1) $ 7 (700) % Weighted average note rate - mortgage loans held for sale 3.3 % 4.4 % (1.1) % (25) % Weighted average cost of funds (excluding facility fees) 2.6 % 4.3 % (1.7) % (40) % Interest income relates primarily to mortgage loans held for sale. Interest expense is associated with the warehouse facilities utilized to finance newly originated loans.Interest income for the three months ended SeptemberJune 30, 2017,2020 decreased when compared to the same period in 2019 primarily driven by a lower average note rate on mortgage loans held for sale, partially offset by higher funded volume. The decrease in interest income was offset by a decrease in interest expense due to a lower cost of funds.71Table 23.1 Originations - Other Income, Net Six Months Ended June 30, 2020 2019 $ Change % Change Interest income $ 53 $ 40 $ 13 33 % Interest expense (40) (43) 3 (7) % Other income, net — 5 (5) (100) % Total other income, net - Originations $ 13 $ 2 $ 11 550 % Weighted average note rate - mortgage loans held for sale 3.5 % 4.6 % (1.1) % (24) % Weighted average cost of funds (excluding facility fees) 2.9 % 4.5 % (1.6) % (36) % Interest income for the six months ended June 30, 2020 increased when compared to the same period in 2019 primarily driven by higher funded volume, partially offset by lower average note rate on mortgage loans held for sale. The increase in interest income was partially offset by a decrease in other income, net. Other income, net, was higher in 2019 due to recognition of incentives we received related to our financing of certain loans satisfying certain customer relief characteristics. In September 2018, we entered into a master repurchase agreement that provided us with incentives to finance mortgage loans satisfying certain consumer relief characteristics as provided in the agreement. We recorded $5 in other income, net, related to such incentives for the six months ended June 30, 2019. The master repurchase agreement expired during the third quarter of 2019.Xome Segment Xome is a real estate services company that provides services for mortgage originators and servicers, including Mr. Cooper, as well as mortgage and real estate investors. Xome is strategically important because it generates fee income that complements our servicing and origination businesses without requiring a significant amount of capital or exposing us to the same level of interest rate or credit risk.Xome is organized into three divisions: Exchange, Services and Data/Technology.•The Exchange division consists of the Xome.com auction platform which utilizes proprietary technology designed to provide efficient execution for sales of foreclosed properties.•The Services division includes title, escrow, collateral valuation and field services related to real estate investments or transactions including purchases, sales, refinances and defaults.•The Data/Technology division contains a diversified set of businesses that provide technology solutions to real estate service providers, aggregators, and a variety of investors. This includes providing aggregation, standardization and licensing for one of the nation’s largest set of MLS, public records and neighborhood demographic data.72The charts below set forth Xome’s total revenues ($ in Millions), Exchange properties sold, and Services completed orders: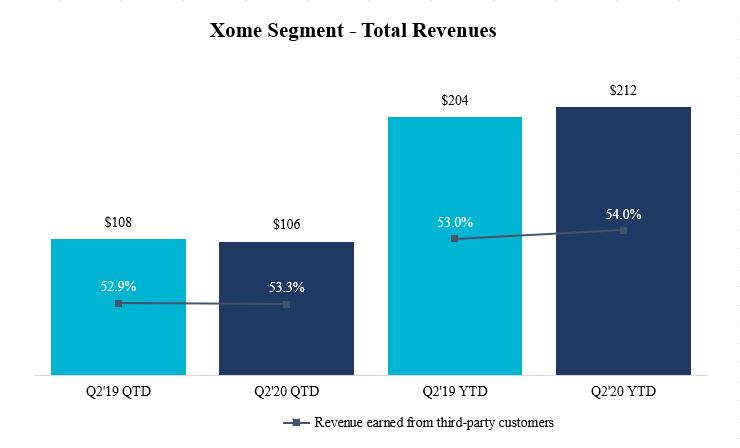
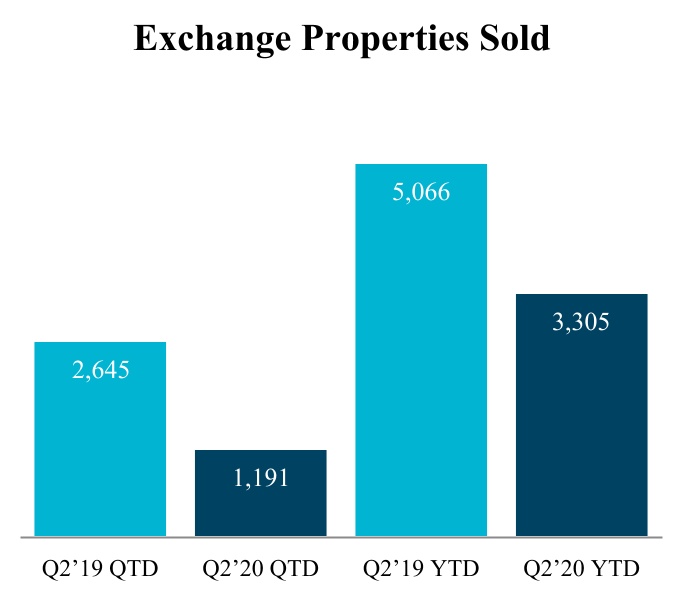
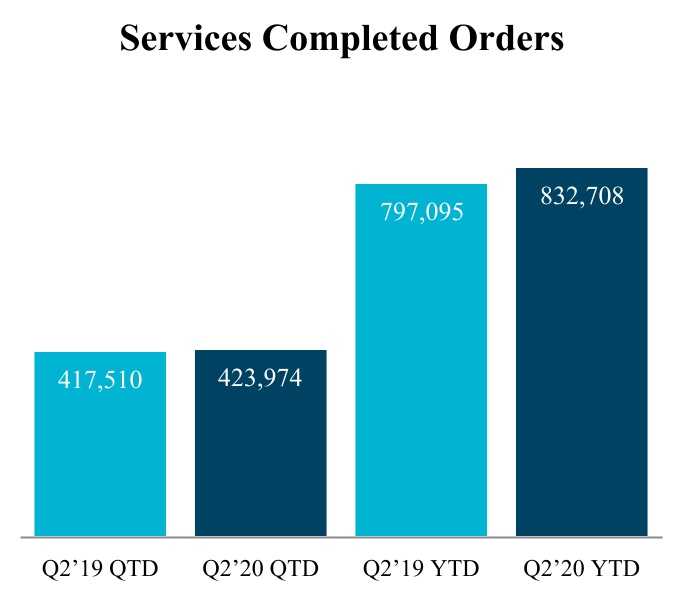 73The following tables set forth the results of operations for the Xome segment:
Table 24. Xome Segment Results of Operations Three Months Ended June 30, 2020 2019 $ Change % Change Xome - Operations Total revenues $ 106 $ 108 $ (2) (2) % Total expenses 95 101 (6) (6) % Total other income, net 1 — 1 100 % Income before income tax expense $ 12 $ 7 $ 5 71 % Pre-tax margin 11.3 % 6.5 % 4.8 % 74 % Xome - Revenues Exchange $ 9 $ 20 $ (11) (55) % Services 94 82 12 15 % Data/Technology 3 6 (3) (50) % Total revenues - Xome $ 106 $ 108 $ (2) (2) % Key Metrics Exchange properties sold 1,191 2,645 (1,454) (55) % Average Exchange properties under management 17,438 6,693 10,745 161 % Services completed orders 423,974 417,510 6,464 2 % Percentage of revenue earned from third-party customers 53.3 % 52.9 % 0.4 % 1 % Xome - Expenses Salaries, wages and benefits $ 33 $ 36 $ (3) (8) % General and administrative Operational expenses 59 62 (3) (5) % Depreciation and amortization 3 3 — — % Total general and administrative 62 65 (3) (5) % Total expenses - Xome $ 95 $ 101 $ (6) (6) % Income before income tax expense of $16.2 millionincreased for the three months ended SeptemberJune 30, 2016. This item is solely2020 as compared to the same period in 2019 primarily due to a decrease in total expenses. The decrease in total expenses was due to a decrease in both salaries, wages and benefits and operational expenses primarily driven by operational efficiencies. Total revenues remained relatively flat during the three months ended June 30, 2020 as compared to the same period in 2019 primarily due to a decrease in Exchange revenues attributable to a decrease in defaults and foreclosures nationwide, offset by an increase in Services revenues from higher volume of units for title and close, and field services.74Table 24.1 Xome Segment Results of Operations Six Months Ended June 30, 2020 2019 $ Change % Change Xome - Operations Total revenues $ 212 $ 204 $ 8 4 % Total expenses 191 200 (9) (5) % Total other income, net 2 11 (9) (82) % Income before income tax expense $ 23 $ 15 $ 8 53 % Pre-tax margin 10.8 % 7.4 % 3.4 % 46 % Xome - Revenues Exchange $ 25 $ 40 $ (15) (38) % Services 179 153 26 17 % Data/Technology 8 11 (3) (27) % Total revenues - Xome $ 212 $ 204 $ 8 4 % Key Metrics Exchange properties sold 3,305 5,066 (1,761) (35) % Average Exchange properties under management 17,608 6,484 11,124 172 % Services completed orders 832,708 797,095 35,613 4 % Percentage of revenue earned from third-party customers 54.0 % 53.0 % 1.0 % 2 % Xome - Expenses Salaries, wages and benefits $ 68 $ 74 $ (6) (8) % General and administrative Operational expenses 117 119 (2) (2) % Depreciation and amortization 6 7 (1) (14) % Total general and administrative 123 126 (3) (2) % Total expenses - Xome $ 191 $ 200 $ (9) (5) % Income before income tax expense increased for the six months ended June 30, 2020 as compared to the same period in 2019 due to an increase in total revenues and decrease in total expenses, partially offset by a decrease in total other income, net. The increase in total revenues was driven by an increase in Services revenues from higher volumes of units for title and close, and field services, partially offset by a decrease in Exchange revenues due to the decrease in defaults and foreclosures nationwide. The decrease in total expenses was primarily due to a decrease in salaries, wages and benefits driven by operational efficiencies. The decrease in total other income, net, was due to the change in fair value of the derivative–embedded conversion feature and is a non-cash item. Fluctuationscontingent consideration of $11 recorded in 2019 in connection with the priceacquisition of WMIH’s common stock directly impactAMS.75Corporate/Other Segment The following tables set forth the fair valueresults of operations for the derivative instrument. The fair value of this derivative instrument is analyzed each period and should not be relied upon to produce changes of this magnitude on an on-going basis as it could also resultCorporate/Other segment:Table 25. Corporate/Other Segment Results of Operations Three Months Ended June 30, 2020 2019 $ Change % Change Corporate/Other - Operations Total revenues $ (1) $ — $ (1) (100) % Total expenses 35 57 (22) (39) % Total other expenses, net (48) (50) 2 (4) % Loss before income tax benefit - Corporate/Other $ (84) $ (107) $ 23 (21) % Corporate/Other - Expenses Salaries, wages and benefits $ 20 $ 24 $ (4) (17) % General and administrative Operational expenses 9 22 (13) (59) % Depreciation and amortization 6 11 (5) (45) % Total general and administrative 15 33 (18) (55) % Total expenses - Corporate/Other $ 35 $ 57 $ (22) (39) % Corporate/Other - Other Expenses, Net Total interest income $ — $ 3 $ (3) (100) % Interest expense Interest expense on unsecured senior notes (47) (51) 4 (8) % Other interest expense — (2) 2 100 % Total interest expense (47) (53) 6 (11) % Other expenses, net (1) — (1) (100) % Total other expenses, net - Corporate/Other $ (48) $ (50) $ 2 (4) % Weighted average cost - unsecured senior notes 7.9 % 7.9 % — % — % Loss before income tax benefit decreased in a non-cash expense or benefit in future periods. The fair value of the embedded conversion feature will become equity upon conversion of the Series B Preferred Stock, or be reduced to zero upon redemption of the Series B Preferred Stock, as the case may be. For additional details on the derivative–embedded conversion feature, see Note 9: Capital Stock and Derivative Instruments and Note 13: Fair Value Measurement to the condensed consolidated financial statements in Part I, Item 1 of this Quarterly Report on Form 10-Q. In addition to this change, several other items had a favorable impact on earnings for the three months ended SeptemberJune 30, 2017, including net revenues and decreased interest expense. Our revenues increased2020 as compared to the same period in 2019 primarily due to improved earningsa decrease in total expenses. Total expenses were higher in the three months ended June 30, 2019 due to acquisition and integration expenses related to the Pacific Union acquisition and the Seterus acquisition in February 2019. Depreciation and amortization decreased in the three months ended June 30, 2020 as compared to the same period in 2019 primarily due to a decrease in amortization of intangible assets.Other expenses, net for the Corporate/Other segment consists of interest expense on our investmentunsecured senior notes, the interest income and expense from our legacy portfolio, includingand other interest related to a revolving facility used for general corporate purposes.The change in total other expenses, net, in the restricted cash equivalents. Interestthree months ended June 30, 2020 as compared to the same period in 2019 was primarily due to a decrease in interest expense decreasedon unsecured senior notes as a result of the reductionrepayment and redemption of the 2021 and 2022 unsecured senior notes, partially offset by the issuance of the 2027 unsecured senior notes which was completed in our Runoff Note balances discussed further below. The loss contract reserveJanuary 2020.76Table 25.1 Corporate/Other Segment Results of Operations Six Months Ended June 30, 2020 2019 $ Change % Change Corporate/Other - Operations Total revenues $ — $ — $ — — % Total expenses 68 102 (34) (33) % Total other expenses, net (99) (105) 6 (6) % Loss before income tax benefit - Corporate/Other $ (167) $ (207) $ 40 (19) % Corporate/Other - Expenses Salaries, wages and benefits $ 28 $ 46 $ (18) (39) % General and administrative Operational expenses 16 35 (19) (54) % Depreciation and amortization 16 21 (5) (24) % Loss on impairment of assets 8 — 8 100 % Total general and administrative 40 56 (16) (29) % Total expenses - Corporate/Other $ 68 $ 102 $ (34) (33) % Corporate/Other - Other Expenses, Net Total interest income $ 1 $ 5 $ (4) (80) % Interest expense Interest expense on unsecured senior notes (98) (102) 4 (4) % Other interest expense (1) (8) 7 (88) % Total interest expense (99) (110) 11 (10) % Other expenses, net (1) — (1) (100) % Total other expenses, net - Corporate/Other $ (99) $ (105) $ 6 (6) % Weighted average cost - unsecured senior notes 7.9 % 7.9 % — % — % Loss before income tax benefit decreased by $0.2 million in the threesix months ended SeptemberJune 30, 2017,2020 as compared to $0.5 millionthe same period in the three months ended September 30, 2016, resulting in a positive improvement to operating income. Underwriting expenses were lower on a comparative basis,2019 primarily due to smaller increasesa decrease in premium deficiency reservestotal expenses. Total expenses were higher in the threesix months ended SeptemberJune 30, 20172019 due to acquisition and integration expenses related to the Pacific Union acquisition and the Seterus acquisition in February 2019. The decrease in salaries, wage and benefits and operational expenses was partially offset by an $8 loss on impairment of assets in connection with an ancillary business in 2020.The change in total other expenses, net, in the six months ended June 30, 2020 as compared to increasesthe same period in premium deficiency reserves during the three months ended September 30, 2016 as further described below2019 was primarily due to a decrease in this Item 2 of Part I, under “Losses or Benefits Incurred and Losses and Loss Adjustment Expenses.”For the nine months ended September 30, 2017, we reported net income attributable to common and participating stockholders of $21.4 million compared to net income attributable to common and participating stockholders of $47.8 million for the nine months ended September 30, 2016. This $26.4 million decline in net income attributable to common and participating stockholders, when comparing the nine months ended September 30, 2017 to the nine months ended September 30, 2016, is primarily the result of the change in fair value of an embedded derivative. This embedded derivative was recordedother interest expense as a result of lower commitment and facility fees, which were higher in 2019 due to the variable conversion feature in our Series B Preferred Stock andPacific Union acquisition.77Changes in Financial Position The following table sets forth the change in fair value is reflectedassets for the periods presented:Table 26. Changes in Assets June 30, 2020 December 31, 2019 $ Change % Change Cash and cash equivalents $ 1,041 $ 329 $ 712 216 % Mortgage servicing rights 2,763 3,502 (739) (21) % Advances and other receivables, net 668 988 (320) (32) % Reverse mortgage interests, net 5,709 6,279 (570) (9) % Mortgage loans held for sale at fair value 3,179 4,077 (898) (22) % Deferred tax assets, net 1,391 1,345 46 3 % Other 2,549 1,785 764 43 % Total assets $ 17,300 $ 18,305 $ (1,005) (5) % Total assets as of June 30, 2020 decreased $1,005 or 5% compared with December 31, 2019 primarily due to the decrease in mortgage loans held for sale, mortgage servicing rights, reverse mortgage interests, net, and advances and other receivables, net. Mortgage loans held for sale decreased $898 primarily due to a larger quantity of loans sold in 2020. Mortgage servicing rights decreased primarily due to a negative mark-to-market adjustment of $644 driven by declining interest rates. Reverse mortgage interests, net, decreased $570 primarily due to the collection on participating interests in HMBS. Advances and other receivables, net, decreased primarily due to recoveries on advances through claim proceeds, customer payments and servicing transfers. The decrease in assets was partially offset by an increase in cash and cash equivalents, and other. Cash and cash equivalents was higher as of June 30, 2020 compared with December 31, 2019 primarily due to strong operating cash flow and additional funds drawn on our condensed consolidated statementsMSR facilities given the market risk at the end of operations as the other income or expense item “changequarter in fair valuerelation to the COVID-19 pandemic. Other increased primarily due to an increase in loans subject to repurchase by Ginnie Mae, which include loans in forbearance plans due to the impact of the COVID-19 pandemic and implementation of the CARES Act, and an increase in derivative embedded conversion feature” which resultedfinancials instruments due to the low interest rate environment.The following table sets forth the change in $31.2 million of other incomeliabilities and stockholders’ equity for the nineperiods presented:Table 27. Changes in Liabilities and Stockholders’ Equity June 30, 2020 December 31, 2019 $ Change % Change Unsecured senior notes, net $ 2,261 $ 2,366 $ (105) (4) % Advance facilities, net 475 422 53 13 % Warehouse facilities, net 4,031 4,575 (544) (12) % MSR related liabilities - nonrecourse at fair value 1,173 1,348 (175) (13) % Other nonrecourse debt, net 4,707 5,286 (579) (11) % Other 2,508 2,077 431 21 % Total liabilities 15,155 16,074 (919) (6) % Total stockholders’ equity 2,145 2,231 (86) (4) % Total liabilities and stockholders’ equity $ 17,300 $ 18,305 $ (1,005) (5) % Total stockholders’ equity at June 30, 2020 decreased $86 or 4% compared with the balance as of December 31, 2019 primarily due to net loss of $98 during the six months ended SeptemberJune 30, 2017,2020. Total liabilities at June 30, 2020 decreased $919 or 6% compared with the balance as of December 31, 2019 primarily due to a decrease in other nonrecourse debt, net, and warehouse facilities, net, partially offset by an increase in other. Other nonrecourse debt, net, decreased $579 primarily due to repayments of reverse mortgage related nonrecourse debt. Warehouse facilities, net, decreased $544 primarily due to lower Originations funded volume as of June 30, 2020 compared to other incomeDecember 31, 2019. Other increased primarily due to an increase in loans subject to repurchase by Ginnie Mae, which include loans in forbearance plans due to the impact of $62.6 million for the nineCOVID-19 pandemic and implementation of the CARES Act, and an increase in derivative financials instruments due to the low interest rate environment.78Liquidity and Capital Resources We measure liquidity by unrestricted cash and availability of borrowings on our MSR facilities. Our cash and cash equivalents on hand increased to $1,041 as of June 30, 2020 from $329 as of December 31, 2019. We benefited from strong operating cash flow and drew down cash from our MSR facilities to ensure we were prepared to deal with a severe economic scenario resulting from the COVID-19 pandemic.As of June 30, 2020, we had $1,008 collateral pledged against the MSR facilities, of which we could borrow an additional $555. During the six months ended SeptemberJune 30, 2016. This item is solely attributable to a change in fair value2020, operating activities generated cash totaling $2,066. As of June 30, 2020, total available borrowing capacity was $9,590, of which $5,078 was unused.The economic impact of the derivative embedded conversion feature,COVID-19 pandemic could result in an increase in servicing advances and liquidity demands related to the utilization of forbearance programs offered by the CARES Act. We did see an increase in forbearance plans over the second quarter of 2020, but the forbearance rate has subsequently declined. Based on current modeling of expected forbearance rates within our portfolio, we believe that we are well-positioned to manage an increase in advances. In April 2020, we expanded our committed advance facility capacity by $850, including an expansion of capacity for private label advances for $200, which is further described above. In additionwe believe will be adequate for our needs. We plan to this change, the other large variance was the positive impactfinance GNMA advances with existing MSR lines and corporate cash flow. For non-agency servicing, we are reimbursed for advances relatively quickly, which should limit growth in balances with even higher forbearance rates.Sources and Uses of CashOur primary sources of funds for liquidity include: (i) servicing fees and ancillary revenues; (ii) payments received from sale or securitization of loans; (iii) payments from the loss contract reserve decreasing by $5.6 millionliquidation or securitization of our outstanding participating interests in reverse mortgage loans; (iv) advance and warehouse facilities, other secured borrowings and the unsecured senior notes; and (v) payments received in connection with the sale of advance receivables and excess spread.Our primary uses of funds for liquidity include: (i) funding of servicing advances, which continue to increase due to the nineCOVID-19 pandemic; (ii) originations of loans; (iii) payment of interest expenses; (iv) payment of operating expenses; (v) repayment of borrowings and repurchases or redemptions of outstanding indebtedness; (vi) payments for acquisitions of MSRs; (vii) scheduled and unscheduled draws on our serviced reverse residential mortgage loans; and (viii) payment of our technology expenses.We believe that our cash flows from operating activities, as well as capacity through existing facilities, provide adequate resources to fund our anticipated ongoing cash requirements. We rely on these facilities to fund operating activities. As the facilities mature, we anticipate renewal of these facilities will be achieved. Future debt maturities will be funded with cash and cash equivalents, cash flow from operating activities and, if necessary, future access to capital markets. We continue to optimize the use of balance sheet cash to avoid unnecessary interest carrying costs.Cash FlowsThe table below presents the major sources and uses of cash flow for operating activities:Table 28. Operating Cash Flow Six Months Ended June 30, 2020 2019 $ Change % Change Net loss $ (98) $ (274) $ 176 (64) % Deferred tax benefit (49) (76) 27 (36) % Other non-cash adjustments to net loss (966) (536) (430) 80 % Fair value changes in MSRs, MSR related liabilities and mortgage loans held for investment 910 629 281 45 % Originations net sales activities 1,404 (1,013) 2,417 (239) % Changes in working capital 865 1,218 (353) (29) % Net cash attributable to operating activities $ 2,066 $ (52) $ 2,118 (4,073) % 79Our operating activities generated cash of $2,066 during the six months ended SeptemberJune 30, 2017, as2020 compared to $2.3 millioncash used of $52 in the same period in 2016.33total revenue for the three and nine months ended September 30, 2017 was $2.3 million and $5.9 million, respectively, compared to revenue of $1.3 million and $4.2 million, respectively, for the three and nine months ended September 30, 2016. The increase in revenue is attributable to improved earnings on our investment portfolio including the restricted cash equivalents, however, WMMRC continues to experience decreasing premium revenue due to operating in runoff mode. In addition, because WMMRC is operating in runoff mode, we expect premiums-earned revenue to continue to decrease, as no new business is being undertaken.Underwriting expenses (defined as losses and loss adjustment expenses and ceding commission expenses) decreased by $0.2 million to a $0.1 million expense for the three months ended September 30, 2017 compared to an expense of $0.3 million for the three months ended September 30, 2016. Underwriting expenses decreased by $0.6 million to a $0.3 million expense for the nine months ended September 30, 2017 compared to an expense of $0.9 million for the nine months ended September 30, 2016. This decreasechange was primarily the result of the $0.5 million and $1.0 million additional premium deficiency reserves which were recorded during the three and nine months ended September 30, 2016, respectively, compared to a minimal change and a $0.2 million increase in the premium deficiency reserve during the three and nine months ended September 30, 2017, respectively. These changes in expense are related to the operation of WMMRC in runoff mode and the corresponding decrease in revenues and the change in premium deficiency reserves as further described below in this Item 2 of Part I under “Losses or Benefits Incurred and Losses and Loss Adjustment Expenses.” As more fully described in Note 2: Significant Accounting Policies to the condensed consolidated financial statements in Item 1 of Part I of this Quarterly Report on Form 10-Q, due to the current conditioncash generated from originations net sales activities.Cash generated from originations net sales activities was $1,404 during the six months ended June 30, 2020 compared to $1,013 cash used in the same period in 2019. The change was primarily due to an increase in proceeds of $11,177 on the mortgage insurance market, WMMRC has recorded reserves based on ceded case reserves and incurred but not recorded (“IBNR”) loss levels established and reportedsales of previously originated loans, partially offset by higher funding of $7,383 for loan origination activities driven by the primarydeclining interest rate environment and an increase in funds used of $1,377 to repurchase forward loan assets out of Ginnie Mae securitizations.The change in cash attributable to operating activities due to fair value changes in MSRs, MSR related liabilities and mortgage guaranty carriers as of each reporting period. Management believes that its estimate of aggregate liabilityloans held for unpaid losses and loss adjustment expenses as of Septemberinvestment during the six months ended June 30, 2017 represents its best estimate, based upon the available data, of the amount necessary to cover the current cost of losses.As of September 30, 2017, the loss contract reserve was analyzed and determined to have a value of zero2020 increased $281 when compared to $5.6 million at December 31, 2016.the same period in 2019. The change was primarily due to an increase in fair value changes and amortization/accretion of mortgage servicing rights/liabilities of $304, primarily due to the negative mark-to-market adjustment for the six months ended June 30, 2020.The change in cash attributable to operating activities due to other non-cash adjustments to net loss contract reserve decreased by $0.2 million and $5.6 million, respectively, during the three and ninesix months ended SeptemberJune 30, 20172020 increased $430 when compared to the same period in 2019 primarily due to the $521 increase in net gain on mortgage loans held for sale primarily driven by the higher origination volumes in a declining interest rate environment.The table below presents the major sources and decreased by $0.5 million and $2.3 millionuses of cash flow for investing activities:Table 29. Investing Cash Flows Six Months Ended June 30, 2020 2019 $ Change % Change Acquisitions, net $ — $ (85) $ 85 (100) % Purchase of forward mortgage servicing rights, net of liabilities incurred (31) (409) 378 (92) % Proceeds on sale of forward and reverse mortgage servicing rights 43 279 (236) (85) % Other (26) (27) 1 (4) % Net cash attributable to investing activities $ (14) $ (242) $ 228 (94) % Our investing activities used cash of $14 during the three and ninesix months ended SeptemberJune 30, 2016, respectively. Consequently, there2020 compared to $242 during the same period in 2019. The decrease in cash used in investing activities was primarily due to a related reductiondecrease of expenses due$378 in cash used for the purchase of forward mortgage servicing rights, net of liabilities incurred. In addition, during the six months ended June 30, 2019, we used $85 cash in connection with the Pacific Union and Seterus acquisitions. The decrease in cash used was partially offset by a decrease in cash generated of $236 from proceeds on sale of forward mortgage servicing rights.80The table below presents the major sources and uses of cash flow for financing activities:Table 30. Financing Cash Flow Six Months Ended June 30, 2020 2019 $ Change % Change (Decrease) increase in warehouse facilities $ (544) $ 1,173 $ (1,717) (146) % Increase (decrease) in advance facilities 58 (40) 98 (245) % Repayment of notes payable — (294) 294 (100) % Redemption and repayment of unsecured senior notes and nonrecourse debt (698) (6) (692) 11,533 % Issuance of unsecured senior debt 600 — 600 100 % Issuance of excess spread financing 24 437 (413) (95) % Settlements and repayments of excess spread financing (110) (119) 9 (8) % Decrease of participating interest financing (499) (848) 349 (41) % Changes in HECM securitizations (168) (16) (152) 950 % Other (26) (5) (21) 420 % Net cash attributable to financing activities $ (1,363) $ 282 $ (1,645) (583) % Our financing activities used cash of $1,363 during the six months ended June 30, 2020 compared to cash generated of $282 in the same period in 2019. Contributing to the change in valuecash used was the $1,717 change in warehouse facilities due to a net pay down of $544 in warehouse facilities during the loss contract reserve for the three and ninesix months ended SeptemberJune 30, 2017. The loss contract reserve was established at2020 compared to a valuenet increase of $63.1 million on March 19, 2012 as a result$1,173 in the same period in 2019. Additionally, cash used in the redemption and repayment of our reorganization. The loss contract reserve decreaseunsecured senior debt and nonrecourse debt during the three and ninesix months ended SeptemberJune 30, 2017 is attributed primarily to changes in the expected timing of assets being released from trust accounts held at WMMRC. For more information see Note 14: Subsequent Events to the condensed consolidated financial statements in Part I, Item 1 of this Quarterly Report on Form 10-Q. For the three and nine months ended September 30, 2017, our investment portfolio reported net investment income of $1.9 million and $4.8 million, respectively, as compared to net investment income of $0.5 million and $1.7 million, respectively, for the three and nine months ended September 30, 2016. The increase in investment income is primarily the result of higher short term interest rates during 2017 compared to 2016. The components of the investment income are more fully described below in this Item 2 of Part I, under “Net Investment Income.”General and Administrative ExpensesFor the three and nine months ended September 30, 2017 our general and administrative expenses totaled $2.1 million and $5.9 million, respectively, compared to $1.4 million and $4.9 million for the three and nine months ended September 30, 2016. General and administrative expenses primarily2020 increased due to expenses related to assistance with transaction sourcing and debt and equity restructuring activities.Interest ExpenseFor the three and nine months ended September 30, 2017, we incurred $0.6 million and $1.8 million, respectively, of interest expense on the Second Lien Notes, which is further described below in this Item 2 of Part I, under “Notes Payable.” This compares to $0.6 million and $2.0 million of interest expense, all of which related to the Second Lien Notes, which was incurred during the three and nine months ended September 30, 2016, respectively. The interest related to Second Lien Notes decreased primarily due to the reduction of Second Lien Note principal balances by $18.8 million during the nine months ended September 30, 2017 and by $2.9 million during the year ended December 31, 2016. Because sufficient Runoff Proceeds have not always been available to pay accrued interest on the Runoff Notes, a portion of our obligation to pay interest on the Runoff Notes has been satisfied using the “pay-in-kind” or “PIK” feature available under the Indentures. The accrued interest is converted to PIK Notes at the next payment date if there is not sufficient cash available to satisfy the required interest payment. For the nine months ended September 30, 2017 and 2016, no PIK Notes were issued in satisfaction of our obligation to pay interest on the Second Lien Notes. For the nine months ended September 30, 2017 and September 30, 2016, respectively, $2.0 million and $2.0 million, of interest was paid in cash.34Unrealized Gain (Loss) on Change in Fair Value of DerivativeThe fair value of the derivative embedded conversion feature is revalued each reportable balance sheet date with the decrease or increase in fair value being reported in the consolidated statements of operations as unrealized gain or (loss) on change in fair value of derivative embedded conversion feature, respectively. The primary factors affecting the fair value of the embedded conversion feature are the probability of occurrence and timing of a Qualified Acquisition, our stock price and our stock price volatility. During the three and nine months ended September 30, 2017, the fair value of the asset increased by $38.6 million and $31.2 million, respectively, and unrealized income was recorded. During the three and nine months ended September 30, 2016, the fair value of the liability increased by $16.2 million and decreased by $62.6 million, respectively, resulting in the recognition of a respective unrealized loss and gain.Net Income (Loss)The net operating (loss) income for the three and nine months ended September 30, 2017 totaled an operating loss of $0.3 million and operating income of $3.5 million, respectively, compared to net operating losses of $0.4 million and $1.3 million, respectively, for the three and nine months ended September 30, 2016.For the three and nine months ended September 30, 2017, we reported net income attributable to common and participating stockholders of $33.9 million and $21.4 million, respectively. This result compares to net loss attributable to common and participating stockholders of $21.1 million and net income attributable to common and participating stockholders $47.8 million, for the three and nine months ended September 30, 2016, respectively.The primary factors impacting the change in net operating (loss) income and the change in net income (loss) attributable to common and participating stockholders for the three and nine months ended September 30, 2017 compared to the results for the three and nine months ended September 30, 2016, are summarized in the tables below.Three months ended September 30, 2017 versus three months ended September 30, 2016 summary of change in net operating (loss) income and net income (loss) attributable to common and participating stockholders (in thousands):Nine months ended September 30, 2017 versus nine months ended September 30, 2016 summary of change in net operating (loss) and net income attributable to common and participating stockholders (in thousands): Comprehensive IncomeThe Company has no comprehensive income other than the net income disclosed in the condensed consolidated statement of operations.Premiums EarnedThe majority of WMMRC’s reinsurance contracts require premiums to be written and earned monthly. In a few cases, the premiums earned reflect the pro rata inclusion into income of premiums written over the life of the reinsurance contracts. Details of premiums earned are provided in the following table:For the three and nine months ended September 30, 2017, premiums earned totaled $0.3 million and $1.1 million, respectively, a decrease of $0.5 million and $1.3 million, respectively, when compared to premiums earned of $0.8 million and $2.4 million, respectively, for the three and nine months ended September 30, 2016. The Company’s premiums earned are expected to continue to decrease due to WMMRC operating in runoff mode.Losses or Benefits Incurred and Losses and Loss Adjustment ExpensesLosses incurred include losses paid and changes in loss reserves, including reserves for IBNR losses, premium deficiency reserves net of actual and estimated loss recoverable amounts. Details of net losses or benefits incurred for the three and nine months ended September 30, 2017 and September 30, 2016, respectively, are provided in the following table:36We establish reserves for each contract based on estimates of the ultimate cost of all losses including losses incurred but not reported. These estimated reserves are based on reports received from ceding companies, industry data and historical experience as well as our own actuarial estimates. Quarterly, we review these estimates on a contract by contract basis and adjust the estimates as we deem necessary based on updated information and our internal actuarial estimates.For the three and nine months ended September 30, 2017, the loss ratios were 14% and 19%, respectively, compared to loss ratios of 23% and 29%, respectively, for the three and nine months ended September 30, 2016. The loss or benefit ratio is calculated by dividing incurred benefit or losses for the period by earned premiums. The ratio provides a measure of underwriting profit or loss. Loss reinsurance contracts (which represent the significant majority of our loss exposure) are generally structured with limits set on the aggregate amount of losses that can be incurred over the life of such contract. Upon reaching such limits, no additional losses may be realized under the terms of the contract. Nevertheless, even when applicable contract limits are reached, revenues from premiums collected continue to be ceded for the remaining life of the contract. Beginning in 2013, a majority of WMMRC’s reinsurance arrangements for the 2006 through 2008 book years reached their respective loss limits. As a result, WMMRC does not expect to incur any additional losses for those book years; however, WMMRC may continue to realize revenues from those book years, to the extent premiums are ceded therefrom.The components of the liability for losses and loss adjustment reserves are as follows at September 30, 2017 and December 31, 2016, respectively:Losses and loss adjustment reserve activity are as follows for the periods ended September 30, 2017 and December 31, 2016, respectively:Net Investment IncomeThe increase in investment income during the three and nine months ended September 30, 2017$692 compared to the same periodsperiod in 2016 is primarily2019 due to the resultrepayment and redemption of higher short term interest rates during 2017 asthe 2021 and 2022 unsecured senior notes in February 2020. The cash generated from the issuance of excess spread financing decreased $413 due to a decline in excess spread financing deals in the six months ended June 30, 2020 compared to 2016. A summarythe same period in 2019.The change in cash used was partially offset by an increase in cash generated of our net investment income for the periods ended September 30, 2017 and 2016, respectively, is as follows:37The Company has no current tax expense or liability$600 due as a result of its tax loss position for periods ended September 30, 2017, September 30, 2016 and December 31, 2016. More detailed information regarding the Company’s tax position including NOL carry-forwards is provided in Note 6: Income Taxes to the consolidated financial statements in Item 8issuance of the Annual Report on Form 10-K for the year ended December 31, 2016 and2027 unsecured senior notes in Note 5: Income TaxesJanuary 2020. In addition, cash used in participating interest financing decreased in 2020 primarily due to a lower repayment of participating interest financing in 2020 compared to the condensed consolidatedsame period in 2019. Further, during the six months ended June 30, 2019, cash of $294 was used to pay off the notes payable assumed from the Pacific Union acquisition.Capital ResourcesCapital Structure and DebtWe require access to external financing resources from time to time depending on our cash requirements, assessments of current and anticipated market conditions and after-tax cost of capital. If needed, we believe additional capital could be raised through a combination of issuances of equity, corporate indebtedness, asset-backed acquisition financing and/or cash from operations. Our access to capital markets can be impacted by factors outside our control, including economic conditions.Financial CovenantsOur credit facilities contain various financial statementscovenants, which primarily relate to required tangible net worth amounts, liquidity reserves, leverage requirements, and profitability requirements. These covenants are measured at our operating subsidiary, Nationstar Mortgage LLC. As of June 30, 2020, we were in Part I, Item 1compliance with our required financial covenants.Seller/Servicer Financial RequirementsWe are also subject to net worth, capital ratio and liquidity requirements established by the Federal Housing Finance Agency (“FHFA”) for Fannie Mae and Freddie Mac Seller/Servicers, and Ginnie Mae for single family issuers. In both cases, these requirements apply to our operating subsidiary, Nationstar Mortgage LLC. As of this Quarterly Report on Form 10-Q.81Minimum Net WorthThe Company files a consolidated federal income tax return. Pursuant to a tax sharing agreement, WMMRC’s federal income tax liabilityminimum net worth requirement for Fannie Mae and Freddie Mac is calculated on a separate returndefined as follows:▪Base of $2.5 plus 25 basis determined by applying 35% to taxable income, in accordance with the provisionspoints of outstanding UPB for total loans serviced.▪Tangible Net Worth comprises of total equity less goodwill, intangible assets, affiliate receivables and certain pledged assets.The minimum net worth requirement for Ginnie Mae is defined as follows:▪The sum of (i) base of $2.5 plus 35 basis points of the Internal Revenue Code (the “Code”) that apply to mortgage insurance companies. WMIH, as WMMRC’s parent, pays federal income taxes on behalfissuer’s total single-family effective outstanding obligations, and (ii) base of WMMRC and settles the federal income tax obligation on a current basis in accordance with the tax sharing agreement. WMMRC made no tax payments to WMIH during the periods ended September 30, 2017 and December 31, 2016 associated with the Company’s tax liability from the current or preceding periods.Deferred federal income taxes arise from temporary differences between the valuation of assets and liabilities as determined for financial reporting purposes and income tax purposes. Temporary differences principally relate to discounting of loss reserves, recognition of unearned premiums, changes in value of loss contract reserves and embedded derivatives, net operating losses and unrealized gains and losses on investments.We believe WMIH experienced an ownership change under Section 382$5 plus 1% of the Codetotal effective HMBS outstanding obligations.▪Tangible Net Worth is defined as total equity less goodwill, intangible assets, affiliate receivables and certain pledged assets. Effective for fiscal year 2020, under the Ginnie Mae MBS Guide, the issuers will no longer be permitted to include deferred tax assets when computing the minimum net worth requirement.Minimum Capital Ratio▪In addition to the minimum net worth requirement, we are also required to hold a ratio of Tangible Net Worth to Total Assets (excluding HMBS securitizations) greater than 6%.Minimum LiquidityThe minimum liquidity requirement for Fannie Mae and Freddie Mac is defined as follows:▪3.5 basis points of total Agency Mortgage Servicing, plus▪Incremental 200 basis points times the sum of the following:•The total UPB of nonperforming (90 or more days delinquent) Agency Mortgage Servicing that is not in connection with its bankruptcy plan becoming effective. Priorforbearance, plus•The total UPB of nonperforming (90 or more days delinquent) Agency Mortgage Servicing that is in forbearance and which were delinquent at the time it entered forbearance, plus•30% of the UPB of nonperforming (90 or more days delinquent) Agency Mortgage Servicing that is in forbearance and which were current at the time it entered forbearance▪This liquidity must only be maintained to emergence from bankruptcy, WMI abandoned the stockextend this sum exceeds 6% of Washington Mutual Bank, thereby generating a worthless stock deduction of approximately $8.37 billion, which gave rise to a NOL carry-forward for the year ended December 31, 2012. We believe that the total available and utilizable NOL carry-forward at December 31, 2016 was approximately $6.0 billion and at September 30, 2017 we believe that there was no limit under Section 382 of the Code on the use of these NOLs. As of September 30, 2017 and December 31, 2016, the Company recorded a valuation allowance equal to 100% of the net deferred federal income tax asset due to uncertainty regarding the Company’s ability to realize these benefits in the future.On November 2, 2017, the Ways and Means Committee of the U.S. House of Representatives introduced a bill containing various amendments to the Internal Revenue Code, including, among other things changes to corporate income tax rates and certain provisions governing NOLs. There can be no assurance that the bill will be approved in its current form or at all and the final form of any tax legislation that is enacted could contain provisions that adversely affect the utility or potential value of the Company’s NOLs.InvestmentsGeneralWe hold investments at both WMIH and WMMRC and the two portfolios consist entirely of fixed income instruments, excluding funds in overnight money market funds, totaling $10.4 million and $76.8 million as of September 30, 2017 and December 31, 2016, respectively. The Company held $577.2 million and $572.9 million of restricted cash from the Series B Preferred Stock Financing in its escrow account at September 30, 2017 and December 31, 2016, respectively.The value of the consolidated Company’s total cash and investments decreased during the nine months ended September 30, 2017. Cash and investments, which excludes restricted cash of $577.2 million and $573.3 million at September 30, 2017 and December 31, 2016, respectively, totaled $42.8 million and $81.5 million at September 30, 2017 and December 31, 2016, respectively. The primary factors that contributed to this decrease in investments were (i) the payment of a total of $13.5 million in Series B Preferred Stock cash dividends during the nine months ended September 30, 2017; and (ii) the redemption in full of the $18.8 million of Second Lien Notes which were outstanding at December 31, 2016, and the payment of related interest of approximately $2.0 million.We work with investment broker dealers and, in the case of WMMRC, collateral trustees, in determining whether a marketAgency Mortgage Servicing UPB.▪Allowable assets for a financial instrument is active or inactive. We regularly obtain indicative pricing from market makers and from multiple dealers and compare the level of pricing variances as a way to observe market liquidity for certain investment securities. We also obtain trade history and live market quotations from publicly quoted sources, such as Bloomberg, for trade volume and frequency observation. While we obtain market pricing information from broker dealers, the ultimate fair value of our investments is based on portfolio statements provided by financial institutions that hold our accounts.During the nine months ended September 30, 2017 and the year ended December 31, 2016, we transferred $0.9 million and $11.0 million, respectively, of corporate securities that mature within 12 months from Level 2 to Level 1, due to improved liquidity in capital markets for those securities. Please refer to Note 4: Investment Securities to the condensed consolidated financial statements in Item 1 of Part I of this Quarterly Report on Form 10-Q, for additional information regarding our investment securities.38WMIH’s investments are valued at fair value and any unrealized gains or losses are reflected in net investment income in the condensed consolidated statements of income. At September 30, 2017 and at December 31, 2016, WMIH had zero and $45.0 million, respectively, of investments in obligations of U.S. government sponsored enterprises, all of which will mature within the respective next 12 months. WMIH also had $25.0 million and $2.1 million inmay include: cash and cash equivalents at September 30, 2017 and December 31, 2016, respectively.WMMRCWMMRC’s investments are valued at fair value and any unrealized gains or losses are reflected in net investment income in the condensed consolidated statements of operations. At September 30, 2017, approximately 89% of WMMRC’s cash and investments were held in four trusts for the benefit of primary mortgage insurers with whom WMMRC established agreements to reinsure private mortgage insurance risk. The total portfolio, excluding funds in overnight money market instruments, was valued at approximately $10.4 million and $31.9 million at September 30, 2017 and December 31, 2016, respectively. At September 30, 2017, approximately 90% of the portfolio consisted of securities that will mature within the next 12 months and the remainder of the securities will mature between one and two years from September 30, 2017. WMMRC also had $7.3 million in cash and cash equivalents at September 30, 2017.Liquidity and Capital ResourcesGeneralWMIH is organized as a holding company and has limited operations of its own. With respect to its own operations, WMIH’s continuing cash needs are limited to the payment of general and administrative expenses, costs related to possible acquisitions, dividends on the Series B Preferred Stock and, prior to the redemption thereof, principal and interest payments on the Second Lien Notes described below in this Item 2 of Part I, under “Notes Payable.” As of September 29, 2017, the Second Lien Notes were fully redeemed by the Company and, as of October 2, 2017, the Second Lien Indenture was satisfied and discharged.Our significant business operations are conducted through our wholly-owned reinsurance subsidiary, WMMRC, which formerly underwrote risks associated with our mortgage reinsurance programs, but has been operated in runoff and has not written any new business since September 26, 2008. There are restrictions on WMMRC’s ability to pay dividends which are described in more detail below. WMIH does not currently expect to pay dividends on its common shares.WMMRC may seek opportunities to commute one or more of its remaining reinsurance agreements, with a view toward accelerating the distribution of trust assets in excess of the amount needed to pay claims. Any such distributions would be(unrestricted), available for general corporate purposes. There can be no assurance that any such commutations will be consummated,sale or if so, on what terms.In regard to the Series B Preferred Stock, we are required (ifheld for trading investment grade securities (e.g., Agency MBS, Obligations of GSEs, US Treasury Obligations); and when declared by our Board and until the Series B Preferred Stockunused/available portion of committed servicing advance lines.The minimum liquidity requirement for Ginnie Mae is converted, redeemed or repurchased) to pay cumulative regular dividends out of funds legally available therefor at an annual rate of 3% per share of the liquidation preference of $1,000 per share of Series B Preferred Stock. WMIH has declared and paid $13.5 million, $13.5 million and $18.0 million of dividends on its Series B Preferred Stock during the nine months ended September 30, 2017 and 2016 and the year ended December 31, 2016, respectively, and has accrued an additional $0.7 million of dividends based on the 3% interest rate during each of the periods ended September 30, 2017 and 2016 and the year ended December 31, 2016, respectively.The repayment of $18.8 million of Second Lien Notes and the $13.5 million in dividends on our Series B Preferred Stock were our largest uses of cash during the nine months ended September 30, 2017. The Second Lien Notes have been paid in full, however, the dividend obligation is likely to continue to be a significant financial obligation of the Company until we either consummate a Qualified Acquisition or redeem or repurchase the Series B Preferred Stock.Unless we consummate a Qualified Acquisition, or enter into a definitive agreement to consummate an Acquisition (or the Series B Redemption Date is extended in accordance with the terms of the Series B Preferred Stock), we will be required to redeem the Series B Preferred Stock on the Series B Redemption Date. Consummation of an Acquisition would cause the conversion into common stock of shares of Series B Preferred Stock having an aggregate liquidation preference equal to the cash proceeds utilized in the Acquisition (unless the Acquisition is a Qualified Acquisition, in which case all of the Series B Preferred Stock would be converted into common stock). The redemption of the Series B Preferred Stock would substantially deplete our available cash for acquisitions and business operations; could have a material adverse effect on our financial condition; and could adversely impact our ability to continue business operations. While we continue to work diligently to identify and consummate an Acquisition, there can be no assurance that we will consummate, or enter into a definitive agreement to consummate, an Acquisition prior to the Series B Redemption Date.39In connection with the foregoing, and because we are mindful of the adverse consequences that could result upon a redemption of the Series B Preferred Stock, our Finance Committee and management have been working with financial advisors in an effort to amend and extend the terms of the Series B Preferred Stock. We can provide no assurance we will be able to restructure, amend or refinance the Series B Preferred Stock and, if so, on what terms. For additional information regarding the foregoing, please see “Item 2. Management’s Discussion and Analysis of Financial Condition and Results of Operations – Overview – Our Business Strategy and Operating Environment”.Liquidity ManagementThe objective of liquidity management is to ensure the Company has the continuing ability to maintain cash flows that are adequate to fund operations and meet obligations and other commitments on a timely and cost-effective basis. The Company establishes and maintains liquidity guidelines for WMIHdefined as well as for WMMRC, its principal operating subsidiary. Funds held by WMMRC are not available to WMIH to satisfy its liquidity needs. Any dividend or payment by WMMRC to WMIH must be approved by the Insurance Division of the State of Hawaii. In light of the restrictions on dividends applicable to WMMRC, WMIH’s principal sources of liquidity are its unrestricted investments, investment income derived from these investments and fees paid to WMIH by WMMRC with respect to services provided pursuant to the two services agreements approved by the Insurance Division of the State of Hawaii. Additionally, WMIH also has approximately $577.2 million of restricted cash held in escrow, which was received by WMIH in connection with the Series B Preferred Stock Financing. Because of the runoff nature of WMMRC’s business, as discussed above, all cash available to WMMRC is primarily used to pay reinsurance losses and loss adjustment expenses, ceding commissions, dividends to WMIH to pay interest and principal obligations on the Runoff Notes (prior to the full redemption which occurred on September 29, 2017), and general and administrative expenses.The Company monitors operating activities, forecasts liquidity needs and adjusts composition of investment securities in order to address liquidity needs. The Company currently has negative monthly cash flows primarily due to loss expenses at WMMRC, general and administrative costs and dividend payments on the Series B Preferred Stock. As a result, the Company maintains a very high quality and short duration investment portfolio in order to match its liability profile at both levels of the consolidated organization.WMMRC has netfollows:▪Maintain liquid assets totaling $17.7 million and $33.8 million as of September 30, 2017 and December 31, 2016, respectively. These net assets are not immediately available for distribution to WMIH due to restrictions imposed by the trust arrangements referenced above, and the requirement that the Insurance Division of the State of Hawaii must approve dividends from WMMRC. Distributions from WMMRC to WMIH were, prior to full redemption on September 29, 2017, further restricted by the terms of the Runoff Notes described in Note 7: Notes Payable to the condensed consolidated financial statements in Item 1 of Part I of this Quarterly Report on Form 10-Q. Additionally, as more fully described in Note 14: Subsequent Events to the condensed consolidated financial statements in Item 1 of Part I of this Quarterly Report on Form 10-Q, a distribution from WMMRC to WMIH of up to $10.7 million was approved by the Insurance Division of the State of Hawaii on September 13, 2017.Capital Structure and ManagementWMIH’s capital structure consists of stockholders’ equity, Series B Preferred Stock proceeds held in escrow which is classified as mezzanine and no term debt as of September 30, 2017. We issued term debt of $130.0 million represented by the Runoff Notes on the Effective Date. The First Lien Notes were redeemed in their entirety on April 15, 2015 and the First Lien Indenture was satisfied and discharged on April 27, 2015. The Second Lien Notes were redeemed in their entirety on September 29, 2017 and the Second Lien Indenture was satisfied and discharged on October 2, 2017On the Effective Date, all shares of common and preferred equity securities previously issued by WMI were cancelled and extinguished. Prior to reincorporation, WMIH was authorized to issue up to 500,000,000 shares of common stock and up to 5,000,000 shares of preferred stock, each with a par value of $0.00001 per share. Upon reincorporation in Delaware, which is more fully described in Note 1: The Company and its Subsidiaries to the condensed consolidated financial statements in Part I, Item 1 of this Quarterly Report on Form 10-Q, and pursuant to WMIH’s Amended and Restated Certificate of Incorporation (“Certificate of Incorporation”), WMIH is authorized to issue up to 3,500,000,000 shares of common stock and up to 10,000,000 shares of preferred stock, each with a par value of $0.00001 per share. As of September 30, 2017, 206,714,132 shares of WMIH’s common stock were issued and outstanding, and 1,600,000 shares of its preferred stock were issued and outstanding.40On January 30, 2014, pursuant to an Investment Agreement, WMIH issued 1,000,000 shares of Series A Convertible Preferred Stock (the “Series A Preferred Stock”) for a purchase price of $11.1 million and warrants to purchase 61,400,000 shares of WMIH’s common stock, 30,700,000 of which have an exercise price of $1.32 per share and 30,700,000 of which have an exercise price of $1.43 per share. The Series A Preferred Stock has rights substantially similar to those associated with WMIH’s common stock, with the exception of a liquidation preference, conversion rights and customary anti-dilution protections. The Series A Preferred Stock has a liquidation preference equal to the greater of (i) $10.00 per one million shares$1 or 10 basis points of Series A Preferred Stock plus declared but unpaid dividendsour outstanding single-family MBS.▪Maintain liquid assets equal to at least 20% of our net worth requirement for HECM MBS.Secured Debt to Gross Tangible Asset RatioUnder the Ginnie Mae guide, we are also required to maintain a secured debt to gross tangible asset ratios no greater than 60%.Since we have a Ginnie Mae single-family servicing portfolio that exceeds $75 billion in UPB, we are also required to obtain an external primary servicer rating and issuer credit ratings from two different rating agencies and receive a minimum rating of a B or its equivalent. Effective for fiscal year 2020, we are permitted to satisfy minimum liquidity requirements using a combination of AAA rated government securities that are marked to market in addition to cash and certain cash equivalents.In addition, Fannie Mae or Freddie Mac may require capital ratios in excess of stated requirements. Refer to Note 15, Capital Requirements, for additional information.82Table 31. Debt June 30, 2020 December 31, 2019 Advance facilities, net $ 475 $ 422 Warehouse facilities, net 4,031 4,575 Unsecured senior notes, net 2,261 2,366 Advance FacilitiesAs part of our normal course of business, we borrow money to fund servicing advances. Our servicing agreements require that we advance our own funds to meet contractual principal and interest payments for certain investors, and to pay taxes, insurance, foreclosure costs and various other items that are required to preserve the assets being serviced. Delinquency rates and prepayment speeds affect the size of servicing advance balances, and we exercise our ability to stop advancing principal and interest where the pooling and servicing agreements permit, where the advance is deemed to be non-recoverable from future proceeds. These servicing requirements affect our liquidity. We rely upon several counterparties to provide us with financing facilities to fund a portion of our servicing advances.Warehouse FacilitiesLoan origination activities generally require short-term liquidity in excess of amounts generated by our operations. The loans we originate are financed through several warehouse lines on such sharesa short-term basis. We typically hold the loans for approximately 30 days and (ii)then sell or place the amount thatloans in government securitizations in order to repay the holder would be entitledborrowings under the warehouse lines. Our ability to in a relevant transaction hadfund current operations depends upon our ability to secure these types of short-term financings on acceptable terms and to renew or replace the Series A Preferred Stock been converted to common stock of WMIH. The Series A Preferred Stock is convertible at a conversion price of $1.10 per share into shares of common stock of WMIH, either at the option of the holder or automatically upon transfer by KKR Fund Holdings L.P. (“KKR Fund”) to a non-affiliated party. financings as they expire.As a result of the calculation of a beneficial conversion feature as required by Accounting Standards Codification 470, a preferred deemed dividend of $9.5 million was recorded in conjunction with the issuance of the Series A Preferred Stock. This preferred deemed dividend resulted in an increase to our accumulated deficit and an increase in additional paid in capital. Further, KKR Fund, as the holder of the Series A Preferred Stock and the warrants, has received other rights pursuant to the Investor Rights Agreement as more fully described in Note 9: Capital Stock and Derivative Instruments to our condensed consolidated financial statements in Part I, Item 1 of this Quarterly Report on Form 10-Q.On January 5, 2015, WMIH announced that it had completed the Series B Preferred Stock Financing and issued 600,000 shares of Series B Preferred Stockservicer for aggregate gross proceeds of $600.0 million, pursuant to the Purchase Agreement with Citigroup Global Markets Inc. and KKR Capital Markets LLC (together the “Initial Purchasers”). In connection with the Series B Preferred Stock Financing, WMIH entered into an Escrow Agreement (the “Escrow Agreement”) with Citibank, N.A., as Escrow Agent, pursuant to which WMIH caused to be deposited with the Escrow Agent the amount of $598.5 million representing the net proceeds of the Series B Preferred Stock Financing less offering fees payable on January 5, 2015 but before payment of other offering fees and expenses (including fees contingent upon future events). These net proceeds will be released from escrow from time to time to WMIH as instructed by WMIH in amounts necessary to,reverse mortgage loans, among other things, explore and/orwe are required to fund borrower draws on the loans. We typically pool borrower draws for approximately 30 days before including them in whole or in part, acquisitions, whethera HMBS securitization. As of June 30, 2020, unsecuritized borrower draws totaled $53, and our maximum unfunded advance obligation related to these reverse mortgage loans was $2,408.Unsecured Senior NotesIn 2018 and 2020, we completed or not. The entire net proceeds will be released from escrow as instructed by WMIH as needed to consummate a Qualified Acquisition.In connection with the Series B Preferred Stock Financing, WMIH filed with the Secretaryofferings of State of Washington Articles of Amendment of Articles of Incorporation (the “Articles of Amendment”) containing the Certificate of Designation creating the Series B Preferred Stock and designating the rights and preferences of the Series B Preferred Stock. Holders of shares of the Series B Preferred Stock are entitled to receive, when, as and if declared, cumulative regular dividends at an annual rate of 3% per share of the liquidation preference of $1,000 per share of Series B Preferred Stock, payable in cash. On each date that WMIH closes any Acquisition, outstanding shares of Series B Preferred Stock having an aggregate liquidation preference equalunsecured senior notes, which maturnet proceedsholders of these notes at interest rates ranging from 6.000% to 9.125%. Refer to Note 10, Payables and Other Liabilities, for the offering utilized in such Acquisition (as defined below), on a pro rata basis, will automatically convert into sharescontractual maturities of WMIH’s common stock. In addition, on the date WMIH closes a Qualified Acquisition, all outstanding shares of Series B Preferred Stock will automatically convert into shares of WMIH’s common stock. Each date that WMIH closes an Acquisition (including a Qualified Acquisition) will be a “Mandatory Conversion Date.” Unless the Series B Preferred Stock has been previously repurchased at the option of a holder upon the occurrence of certain put events or mandatorily converted, WMIH will redeem all outstanding shares of Series B Preferred Stock, if any, on the Series B Redemption Date, which is the third anniversary of January 5, 2015 (or January 5, 2018). The reincorporation of WMIH from the State of Washington to the State of Delaware resulted in the increase of the size of its Board of Directors from 7 to up to 11 members and increased WMIH’s authorized number of shares of common stock in an amount sufficient to permit the conversion of all shares of Series B Preferred Stock (collectively, the “Reincorporation”). The foregoing transactions pertaining to the Series A Preferred Stock and Series B Preferred Stock are more fully described in Note 9: Capital Stock and Derivative Instruments to the condensed consolidated financial statements in Item 1 of Part I of this Quarterly Report on Form 10-Q.WMIH may, subject to market conditions, determine to incur additional indebtedness or raise additional equity capital in connection with undertaking one or more acquisitions.While WMIH is not subject to regulatory capital requirements, WMMRC is required to comply with various solvency and liquidity requirements pursuant to the insurance laws of the State of Hawaii. WMMRC is required to maintain minimum capital and surplus requirements of an amount established under applicable Hawaii law and deemed appropriate by the Insurance Division of the State of Hawaii. unsecured senior notes.Contractual ObligationsAs of SeptemberJune 30, 2017, management believes that WMMRC is compliant with applicable statutory solvency, liquidity and minimum capital and surplus requirements. The payment of dividends by WMMRC is subject to statutory restrictions imposed by Hawaii insurance laws and regulations and requires approval from the Insurance Division of the State of Hawaii. In addition, the Second Lien Indenture, prior to the discharge and release on September 29, 2017, imposed restrictions on WMMRC business activities. During the nine months ended September 30, 2017 and the year ended December 31, 2016, WMMRC paid $16.0 million and $5.7 million, respectively, in dividends to WMIH.41On the Effective Date, WMI and WMIIC (together, the “Debtors”) (and now the WMI Liquidating Trust (the “Trust”) on behalf of the Debtors) continued to dispute whether the interests of certain former holders of “Equity Interests” or “Claims” (in each case as those terms are defined in the Company’s Seventh Amended Joint Plan of Affiliated Debtors Pursuant to Chapter 11 of the United States Bankruptcy Code (as modified, the “Plan”)) against the Debtors should be allowed. As a result, pursuant to the Plan, on the Effective Date, a “Disputed Equity Escrow” (as defined in the Plan) was created for the benefit of each holder of a “Disputed Equity Interest” (as defined in the Plan). Such Disputed Equity Escrow was created to hold shares of WMIH’s common stock (as well as any dividends, gains or income attributable in respect of such common stock) allocable, on a pro rata basis, to each holder of such a Disputed Equity Interest if and when such Disputed Equity Interest becomes an “Allowed Equity Interest” (as such term is defined in the Plan). All such Equity Interests will constitute Disputed Equity Interests pursuant to the Plan until such time, or from time to time, as each Disputed Equity Interest has been compromised and settled or allowed or disallowed by a final order of the bankruptcy court.The liquidating trustee of the Trust, William Kosturos (the “Liquidating Trustee”), acts as escrow agent with respect to the Disputed Equity Escrow. As of December 31, 2016, 1,546,294 shares of WMIH’s common stock were held in the Disputed Equity Escrow. Until such time as all of WMIH’s common stock has been distributed from the Disputed Equity Escrow in accordance with the Plan (e.g., as a result of all “Disputed Equity Claims” (as such term is defined in the Plan) becoming Allowed Equity Interests or all Disputed Equity Claims being disallowed), the Liquidating Trustee is vested with the authority to exercise voting or consent rights with respect to such stock; provided, however, that the Liquidating Trustee is obligated to vote or consent, as the case may be, as to such stock in the same proportion as all other holders of WMIH’s common stock have voted or consented, in each case on an issue-by-issue basis. The Trust has no right to or entitlement in any shares of WMIH’s common stock held in the Disputed Equity Escrow. Additionally, WMIH does not have any right to, or interest in, any shares of its common stock held by the Disputed Equity Escrow.Notes PayableOn the Effective Date, WMIH issued $110.0 million aggregate principal amount of its 13% Senior First Lien Notes due 2030 (the “First Lien Notes”) under an Indenture, dated as of March 19, 2012 (the “First Lien Indenture”), between WMIH and Wilmington Trust, National Association, as Trustee. In addition, WMIH issued $20.0 million aggregate principal amount of its 13% Senior Second Lien Notes due 2030 (the “Second Lien Notes” and, together with the First Lien Notes, the “Runoff Notes”) under an Indenture, dated as of March 19, 2012 (the “Second Lien Indenture” and, together with the First Lien Indenture, the “Indentures”), between WMIH and Law Debenture Trust Company of New York, as Trustee. On January 5, 2017, we were notified by The Law Debenture Company of New York that it had completed the transfer of substantially all of its corporate trust business to Delaware Trust Company, and that Delaware Trust Company had become the successor trustee under the Second Lien Indenture. The First Lien Notes were redeemed in their entirety on April 15, 2015, and the First Lien Indenture was satisfied and discharged on April 27, 2015. The Second Lien Notes were redeemed in their entirety on September 29, 2017, and the Second Lien Indenture was satisfied and discharged on October 2, 2017.Contractual Obligations, Commitments and ContingenciesWMMRC has engaged a Hawaii-based service provider, Marsh Management Services Inc., to provide accounting and related management services for its operations. In exchange for performing these services, WMMRC pays such service provider a management fee.On March 19, 2012, WMIH entered into an Investment Management Agreement with WMMRC. Under the terms of this agreement, WMIH receives a fee from WMMRC equal to the product of (x) the ending dollar amount of assets under management during the calendar month in question and (y) .002 divided by 12. WMIH is responsible for investing the funds of WMMRC based on applicable investment criteria and subject to rules and regulations to which WMMRC is subject. The Investment Management Agreement has been approved by the Insurance Division of the State of Hawaii.On March 19, 2012, WMIH entered into an Administrative Services Agreement with WMMRC. Under the terms of this agreement, WMIH receives from WMMRC a fee of $110 thousand per month. WMIH is responsible for providing administrative services to support, among other things, supervision, governance, financial administration and reporting, risk management and claims management as may be necessary, together with such other general or specific administrative services that may be reasonably required or requested by WMMRC in the ordinary course of its business. The Administrative Services Agreement has been approved by the Insurance Division of the State of Hawaii.Total amounts incurred under the Investment Management Agreement and Administrative Services Agreement totaled $1.0 million and $1.0 million for the nine months ended September 30, 2017 and 2016, respectively. The expense and related income eliminate on consolidation.42On March 22, 2012, WMIH and the WMI Liquidating Trust (the “Trust”) entered into a Transition Services Agreement (the “TSA”). Pursuant to the TSA, the Trust makes available certain services and employees to the Company. The TSA provided the Company with office space (prior to the Company entering into its own lease) for its current employees and continues to provide basic infrastructure and support services to facilitate the Company’s operations. The TSA as amended, extends the term of the agreement through January 31, 2018, with automatic renewals thereafter for successive additional three-month terms, subject to non-renewal at the end of any additional term upon written notice by either party at least 30 days prior to the expiration of the additional term.In connection with implementing the Plan, certain holders of specified “Allowed Claims” had the right to elect to receive such holder’s “Pro Rata Share of the Common Stock Allotment.” Essentially, the Plan defines the “Pro Rata Share of the Common Stock Allotment” as a pro rata share of ten million (10,000,000) shares of WMIH’s common stock (i.e. five percent (5%)) issued and outstanding on the Effective Date. Holders exercising the foregoing election did so in lieu of receiving (i) 50% of such holder’s interest in and to certain litigation proceeds that could be realized by the Trust on account of certain claims and causes of action asserted by the Trust as contemplated by the Plan (“Litigation Proceeds”), and (ii) some or all of the Runoff Notes to which such holder may be entitled (if such holder elected to receive Runoff Notes in accordance with the terms of the Plan).If a holder exercised the election described above and, as a result of such election, received shares of WMIH’s common stock, then such holder’s share of Runoff Notes to which the election was effective (i.e., One Dollar ($1.00) of original principal amount of Runoff Notes for each share of WMIH’s common stock) were not issued. In addition, as a result of making the aforementioned election, such holders conveyed to WMIH, and WMIH retained an economic interest in Litigation Proceeds, if any, recovered by the Trust in connection with certain litigation brought by the Trust as contemplated by the Plan. Distributions, if any, to WMIH on account of the foregoing will be effected in accordance with the Plan and the court order confirming the Plan.On or about October 14, 2014, the Trust filed a lawsuit in King County Superior Court in the State of Washington against 16 former directors and officers of WMI (the “D&O Litigation”). The Trust’s complaint alleged, among other things, that the defendants named therein breached their fiduciary duties to WMI and committed corporate waste and fraud by squandering WMI’s financial resources. In connection with the settlement of the D&O Litigation, during the year ended December 31, 2015, among the Trust, certain former directors and officers of WMI and certain insurance carriers that underwrote director and officer liability insurance policies for the benefit of WMI and its affiliates (including such former directors and officers), such insurance carriers agreed to pay the Trust $37.0 million, of which $3.0 million was placed into a segregated reserve account (the “RSA Reserve”) to be administered by a third party pursuant to the terms of a Reserve Settlement Agreement (the “RSA”).During the year ended December 31, 2016 and 2015, WMIH had other income of $123 thousand and $7.8 million, respectively, as a result of its receipt of its share of net Litigation Proceeds related to the D&O Litigation. As of September 30, 2017, $1.5 million remained in the RSA Reserve. Under the RSA, funds are released from the RSA Reserve to the Trust if and when certain designated conditions are satisfied. If and when these funds are released to the Trust, and to the extent WMIH is entitled to receive such funds in accordance with the Plan, it is anticipated the Trust will make payments to WMIH in an amount equal to WMIH’s share of Litigation Proceeds as provided under the Plan. Due to the contingent nature of future distributions from the RSA Reserve, there can be no assurance that WMIH will receive any distributions from the remaining balance in the RSA Reserve in the future. During the nine months ended September 30, 2017, WMIH has recorded income from Litigation Proceeds of $123 thousand. As of September 30, 2017, WMIH had not received any Litigation Proceeds, other than as described above.As a member of the Litigation Subcommittee of the Trust, Mr. Willingham, who serves as a WMIH Board member and Chairman of the WMIH Audit Committee, participates in overseeing the prosecution of recovery claims by the Trust.As a result of the Company’s reorganization in bankruptcy, an intangible asset was identified related to reinsurance contracts which were held by WMMRC. The contracts were evaluated to determine whether the value attributable to such contracts was either above market or in a loss contract position. After taking such evaluation into consideration, a loss contract reserve totaling $63.1 million was recorded on the Effective Date. The reserve will be evaluated at each reporting date for changes to its value. As of September 30, 2017 and December 31, 2016, the loss contract reserve was analyzed and determined to have a value of zero and $5.6 million, respectively. The value of this reserve decreased by $5.6 million during the nine months ended September 30, 2017 and decreased by $2.3 million during the nine months ended September 30, 2016. The value of this reserve has been reduced to zero, primarily due to the extraction of cash proceeds from WMMRC occurring earlier than initially projected and the elimination of the higher cost of capital associated with the Runoff Notes which have now been paid in their entirety. For additional information see Note 2: Significant Accounting Policies in Item 1 of Part I of this Quarterly Report on Form 10-Q.43As of January 30, 2014, pursuant to the terms and conditions of the Investment Agreement, WMIH sold to KKR Fund 1,000,000 shares of Series A Preferred Stock, having the terms, rights, obligations and preferences contained in the Certificate of Incorporation, for a purchase price equal to $11.1 million and issued to KKR Fund warrants to purchase, in the aggregate, 61.4 million shares of WMIH’s common stock, 30.7 million of which have an exercise price of $1.32 per share and 30.7 million of which have an exercise price of $1.43 per share (together, the “Warrants”). KKR Fund’s rights as a holder of the Series A Preferred Stock and the Warrants, and the rights of any subsequent holder that is an affiliate of KKR Fund (together with KKR Fund, the “Holders”) are governed by the Investor Rights Agreement. The Investor Rights Agreement provides the Holders with registration rights, including three long form demand registration rights, unlimited short form demand registration rights and customary piggyback registration rights with respect to WMIH’s common stock (and WMIH’s common stock underlying the Series A Preferred Stock and the Warrants), subject to certain minimum thresholds, customary blackout periods and lockups of 180 days. On July 1, 2015, WMIH filed a shelf registration statement (the “Initial Registration Statement”) covering resales of Series B Preferred Stock and WMIH’s common stock issuable upon mandatory conversion of the Series B Preferred Stock. On November 23, 2015, WMIH amended the Initial Registration Statement to cover WMIH’s common stock issuable upon conversion of the Series A Preferred Stock and shares of WMIH’s common stock issuable upon exercise of warrants issued in connection with the issuance of our Series A Preferred Stock currently outstanding (as amended, the “Registration Statement”). The Registration Statement was declared effective under the Securities Act on November 25, 2015. Moreover, for as long as the Holders beneficially own any shares of common stock of WMIH or Series A Preferred Stock or any of the Warrants, WMIH has agreed to provide customary Rule 144A information rights, to provide the Holders with regular audited and unaudited financial statements and to allow the Holders or their representatives to inspect WMIH’s books and records. For further information on the Investment Agreement and the Investor Rights Agreement, see Note 8: Financing Arrangements and Note 9: Capital Stock and Derivative Instruments, to the condensed consolidated financial statements in Item 1 of Part I of this Quarterly Report on Form 10-Q.In conjunction with the Series B Preferred Stock Financing, the Company is contractually committed to make certain fee payments if future events occur. These fees are recorded and presented on our condensed consolidated balance sheets as other liabilities. At September 30, 2017, the total balance of $13.8 million of other liabilities is comprised of $12.3 million of accrued fees relating to the Series B Preferred Stock Financing, an accrual for professional fees currently payable of approximately $0.8 million, $0.7 million of accrued dividends relating to the Series B Preferred Stock and several small accruals for recurring business expenses.Off-Balance Sheet Financing ArrangementsWe have no obligations, assets or liabilities which would be considered off-balance sheet arrangements. We do not participate in transactions that create relationships with unconsolidated entities or financial partnerships, often referred to as variable interest entities, which would have been established for the purpose of facilitating off-balance sheet arrangements.We are principally exposed to three types of market risk:interest rate risk;credit risk; andliquidity risk.There have been2020, no material changes to our market risks asoutstanding contractual obligations were made from the amounts previously disclosed in our Annual Report on Form 10-K for the year ended December 31, 2016.Less than 1 Year 1-3 Years 3-5 Years More than 5 Years Total Unsecured senior notes $ — $ — $ 950 $ 1,350 $ 2,300 Interest payment from unsecured senior notes 182 363 248 175 968 Total $ 182 $ 363 $ 1,198 $ 1,525 $ 3,268 83Critical Accounting Policies Various elements of our accounting policies, by their nature, are inherently subject to estimation techniques, valuation assumptions and other subjective assessments. In particular, we have identified the following policies that, due to the judgment, estimates and assumptions inherent in those policies, are critical to an understanding of our consolidated financial statements. These policies relate to fair value measurements, particularly those determined to be Level 3 as discussed in Note 14, Fair Value Measurements, in notes to consolidated financial statements, business combinations and goodwill, and valuation and realization of deferred tax assets. We believe that the judgment, estimates and assumptions used in the preparation of our consolidated financial statements are appropriate given the factual circumstances at the time. However, given the sensitivity of these critical accounting policies on our consolidated financial statements, the use of other judgments, estimates and assumptions could result in material differences in our results of operations or financial condition. Fair value measurements considered to be Level 3 representing estimated values based on significant unobservable inputs include (i) the valuation of MSRs, (ii) the valuation of excess spread financing, (iii) the valuation of the mortgage servicing rights financing liability and (iv) the valuation of IRLCs and LPCs. For further information on our critical accounting policies, please refer to the Company’s Annual Reports on Form 10-K for the year ended December 31, 2019. There have been no material changes to our critical accounting policies since December 31, 2019. During the three months ended March 31, 2020, we updated the policies for reserves related to certain financial assets that are subject to CECL accounting in connection with adoption of ASU 2016-13. The update did not have material impact on the consolidated financial statements. See Note 1, Nature of Business and Basis of Presentation, in the consolidated financial statements which is incorporated herein for details.Recent Accounting DevelopmentsBelow lists recently issued accounting pronouncements applicable to us but not yet effective.Accounting Standards Update 2019-12, Income Taxes (Topic 740) - Simplifying the Accounting for Income Taxes (“ASU 2019-12”) simplifies accounting for income taxes by removing certain exceptions from the general principles in Topic 740 including elimination of the exception to the incremental approach for intraperiod tax allocation when there is a loss from continuing operations and income or a gain from other items such as other comprehensive income. ASU 2019-12 also clarifies and amends certain guidance in Topic 740. ASU 2019-12 is effective for public companies for fiscal years beginning after December 15, 2020, including interim periods, with early adoption of all amendments in the same period permitted. We are currently assessing the impact of ASU 2019-12, but does not believe it will have a material impact on our consolidated financial statements.Accounting Standards Update 2020-04, Reference Rate Reform (Topic 848): Facilitation of the Effects of Reference Rate Reform on Financial Reporting (“ASU 2020-04”) provides temporary optional expedients and exceptions for applying generally accepted accounting principles to contract modifications, hedge accounting and other transactions affected by the transitioning away from reference rates that are expected to be discontinued, such as interbank offered rates and LIBOR. If LIBOR ceases to exist or if the methods of calculating LIBOR change from current methods for any reasons, interest rates on our floating rate loans, obligation derivatives, and other financial instruments tied to LIBOR rates, may be affected and need renegotiation with its lenders. ASU 2020-04 is effective March 12, 2020 through December 31, 2022. We are currently assessing the impact of ASU 2020-04 on our consolidated financial statements.Impact of Inflation and Changing PricesOur consolidated financial statements and notes thereto presented herein have been prepared in accordance with GAAP, which requires the measurement of financial position and operating results in terms of historical dollars without considering the changes in the relative purchasing power of money over time due to inflation. The impact of inflation is reflected in the increased cost of our operations. Unlike most industrial companies, nearly all of our assets and liabilities are monetary in nature. As a result, interest rates have a greater impact on our performance than do the effects of general levels of inflation. Further, interest rates do not necessarily move in the same direction or to the same extent as the prices of goods and services.84GLOSSARY OF TERMSThis Glossary of Terms defines some of the terms that are used throughout this report and does not represent a complete list of all defined terms used.Advance Facility. A secured financing facility to fund advance receivables which is backed by a pool of mortgage servicing advance receivables made by a servicer to a certain pool of mortgage loans.Agency. Government entities guaranteeing the mortgage investors that the principal amount of the loan will be repaid; the Federal Housing Administration, the Department of Veterans Affairs, the US Department of Agriculture and Ginnie Mae (and collectively, the “Agencies”)Agency Conforming Loan. A mortgage loan that meets all requirements (loan type, maximum amount, LTV ratio and credit quality) for purchase by Fannie Mae, Freddie Mac, or insured by the FHA, USDA or guaranteed by the VA or sold into Ginnie Mae.Asset-Backed Securities (“ABS”). A financial security whose income payments and value is derived from and collateralized (or “backed”) by a specified pool of underlying receivables or other financial assets.Bulk acquisitions or purchases. MSR portfolio acquired on non-retained basis through an open market bidding process.Base Servicing Fee. The servicing fee retained by the servicer, expressed in basis points, in an excess MSR arrangement in exchange for the provision of servicing functions on a portfolio of mortgage loans, after which the servicer and the co-investment partner share the excess fees on a pro rata basis.Conventional Mortgage Loans. A mortgage loan that is not guaranteed or insured by the FHA, the VA or any other government agency. Although a conventional loan is not insured or guaranteed by the government, it can still follow the guidelines of GSEs and be sold to the GSEs.Correspondent lender, lending channel or relationship. A correspondent lender is a lender that funds loans in their own name and then sells them off to larger mortgage lenders. A correspondent lender underwrites the loans to the standards of an investor and provides the funds at close.Credit-Sensitive Loan. A mortgage loan with certain characteristics such as low borrower credit quality, relaxed original underwriting standards and high LTV, which we believe indicates that the mortgage loan presents an elevated credit risk of borrower default versus payoff.Delinquent Loan. A mortgage loan that is 30 or more days past due from its contractual due date.Department of Veterans Affairs (“VA”). The VA is a cabinet-level department of the U.S. federal government, which guarantees certain home loans for qualified borrowers eligible for securitization with GNMA.Direct-to-consumer originations (“DTC”). A type of mortgage loan origination pursuant to which a lender markets refinancing and purchase money mortgage loans directly to selected consumers through telephone call centers, the Internet or other means.Excess Servicing Fees. In an excess MSR arrangement, the servicing fee cash flows on a portfolio of mortgage loans after payment of the base servicing fee.Excess Spread. MSRs with a co-investment partner where the servicer receives a base servicing fee and the servicer and co-investment partner share the excess servicing fees. This co-investment strategy reduces the required upfront capital from the servicer when purchasing or investing in MSRs.Federal National Mortgage Association (“Fannie Mae” or “FNMA”). FNMA was federally chartered by the U.S. Congress in 1938 to support liquidity, stability, and affordability in the secondary mortgage market, where existing mortgage-related assets are purchased and sold. Fannie Mae buys mortgage loans from lenders and resells them as mortgage-backed securities in the secondary mortgage market.85Federal Housing Administration (“FHA”). The FHA is a U.S. federal government agency within the Department of Housing and Urban Development (HUD). It provides mortgage insurance on loans made by FHA-approved lenders in compliance with FHA guidelines throughout the United States.Federal Housing Finance Agency (“FHFA”). A U.S. federal government agency that is the regulator and conservator of Fannie Mae and Freddie Mac and the regulator of the 12 Federal Home Loan Banks.Federal Home Loan Mortgage Corporation (“Freddie Mac” or “FHLMC”). Freddie Mac was chartered by Congress in 1970 to stabilize the nation’s residential mortgage markets and expand opportunities for homeownership and affordable rental housing. Freddie Mac participates in the secondary mortgage market by purchasing mortgage loans and mortgage-related securities for investment and by issuing guaranteed mortgage-related securities.Government National Mortgage Association (“Ginnie Mae” or “GNMA”). GNMA is a self-financing, wholly owned U.S. Government corporation within HUD. Ginnie Mae guarantees the timely payment of principal and interest on MBS backed by federally insured or guaranteed loans - mainly loans insured by the FHA or guaranteed by the VA. Ginnie Mae securities are the only MBS to carry the full faith and credit guarantee of the U.S. federal government.Government-Sponsored Enterprise (“GSE”). Certain entities established by the U.S. Congress to provide liquidity, stability and affordability in residential housing. These agencies are Fannie Mae, Freddie Mac and the 12 Federal Home Loan Banks.Home Equity Conversion Mortgage (“HECM”). Reverse mortgage loans issued by FHA. HECMs provide seniors aged 62 and older with a loan secured by their home which can be taken as a lump sum, line of credit, or scheduled payments. HECM loan balances grow over the loan term through borrower draws of scheduled payments or line of credit draws as well as through the accrual of interest and FHA mortgage insurance premiums. In accordance with FHA guidelines, HECMs are designed to repay through foreclosure and subsequent liquidation of loan collateral after the loan becomes due and payable. Shortfalls experienced by the servicer of the HECM through the foreclosure and liquidation process can be claimed to FHA in accordance with applicable guidelines.HECM mortgage-backed securities (“HMBS”). A type of asset-backed security that is secured by a group of HECM loans.Interest Rate Lock Commitments (“IRLC”). Agreements under which the interest rate and the maximum amount of the mortgage loan are set prior to funding the mortgage loan.Interest-Sensitive Loan. A mortgage loan which is primarily impacted by changes in forecasted interest rates, which in turn impacts voluntary prepayment speed. Interest-sensitive loans typically consist of single-family conforming residential forward mortgage loans serviced for GSEs or other third-party investors.Loan Modification. Temporary or permanent modifications to loan terms with the borrower, including the interest rate, amortization period and term of the borrower’s original mortgage loan. Loan modifications are usually made to loans that are in default, or in imminent danger of defaulting.Loan-to-Value Ratio (“LTV”). The unpaid principal balance of a mortgage loan as a percentage of the total appraised or market value of the property that secures the loan. An LTV over 100% indicates that the UPB of the mortgage loan exceeds the value of the property.Lock period. A set of periods of time that a lender will guarantee a specific rate is set prior to funding the mortgage loan.Loss Mitigation. The range of servicing activities provided by a servicer in an attempt to minimize the losses suffered by the owner of a defaulted mortgage loan. Loss mitigation techniques include short-sales, deed-in-lieu of foreclosures and loan modifications, among other options.Mortgage-Backed Securities (“MBS”). A type of asset-backed security that is secured by a group of mortgage loans.Mortgage Servicing Right (“MSRs”). The right and obligation to service a loan or pool of loans and to receive a servicing fee as well as certain ancillary income. MSRs may be bought and sold, resulting in the transfer of loan servicing obligations. MSRs are designated as such when the benefits of servicing the loans are expected to adequately compensate the servicer for performing the servicing.86MSR Facility. A line of credit backed by mortgage servicing rights that is used for financing purposes. In certain cases, these lines may be a sub-limit of another warehouse facility or alternatively exist on a stand-alone basis. These facilities allow for same or next day draws at the request of the borrower.Mortgage Servicing Liability (“MSL”).The right and obligation to service a loan or pool of loans and to receive a servicing fee as well as certain ancillary income. MSLs may be bought and sold, resulting in the transfer of loan servicing obligations. MSLs are designated as such when the benefits of servicing the loans are not expected to adequately compensate the servicer for performing the servicing.Non-Conforming Loan. A mortgage loan that does not meet the standards of eligibility for purchase or securitization by Fannie Mae, Freddie Mac or Ginnie Mae.Originations. The process through which a lender provides a mortgage loan to a borrower.Pull through adjusted lock volume. Represents the expected funding from locks taken during the period.Prepayment Speed. The rate at which voluntary mortgage prepayments occur or are projected to occur. The statistic is calculated on an annualized basis and expressed as a percentage of the outstanding principal balance.Primary Servicer. The servicer that owns the right to service a mortgage loan or pool of mortgage loans. This differs from a subservicer, which has a contractual agreement with the primary servicer to service a mortgage loan or pool of mortgage loans in exchange for a subservicing fee based upon portfolio volume and characteristics.Prime Mortgage Loan. Generally, a high-quality mortgage loan that meets the underwriting standards set by Fannie Mae or Freddie Mac and is eligible for purchase or securitization in the secondary mortgage market. Prime Mortgage loans generally have lower default risk and are made to borrowers with excellent credit records and a monthly income at least three to four times greater than their monthly housing expenses (mortgage payments plus taxes and other debt payments) as well as significant other assets. Mortgages not classified as prime mortgage loans are generally called either sub-prime or Alt-A.Private Label Securitizations. Securitizations that do not meet the criteria set by Fannie Mae, Freddie Mac or Ginnie Mae.Real Estate Owned (”REO”). Property acquired by the servicer on behalf of the owner of a mortgage loan or pool of mortgage loans, usually through foreclosure or a deed-in-lieu of foreclosure on a defaulted loan. The servicer or a third-party real estate management firm is responsible for selling the REO. Net proceeds of the sale are returned to the owner of the related loan or loans. In most cases, the sale of REO does not generate enough to pay off the balance of the loan underlying the REO, causing a loss to the owner of the related mortgage loan.Recapture. The refinancing of a loan currently in the portfolio, or the financing of a customer’s new purchase which resulted in the payoff of an existing loan.Refinancing. The process of working with existing borrowers to refinance their mortgage loans. By refinancing loans for borrowers we currently service, we retain the servicing rights, thereby extending the longevity of the servicing cash flows.Reverse Mortgage Loan. A reverse mortgage loan, most commonly a Home Equity Conversion Mortgage, enables seniors to borrow against the value of their home, and no payment of principal or interest is required until the death of the borrower or the sale of the home. These loans are designed to go through the foreclosure and claim process to recover loan balance.Servicing. The performance of contractually specified administrative functions with respect to a mortgage loan or pool of mortgage loans. Duties of a servicer typically include, among other things, collecting monthly payments, maintaining escrow accounts, providing periodic monthly statements to the borrower and monthly reports to the loan owners or their agents, managing insurance, monitoring delinquencies, executing foreclosures (as necessary), and remitting fees to guarantors, trustees and service providers. A servicer is generally compensated with a specific fee outlined in the contract established prior to the commencement of the servicing activities.87Servicing Advances. In the course of servicing loans, servicers are required to make advances that are reimbursable from collections on the related mortgage loan or pool of loans. There are typically three types of servicing advances: P&I advances, T&I Advances and Corporate Advances.(i) P&I advances cover scheduled payments of principal and interest that have not been timely paid by borrowers. P&I Advances serve to facilitate the cash flows paid to holders of securities issued by the residential MBS trust. The servicer is not the insurer or guarantor of the MBS and thus has the right to cease the advancing of P&I, when the servicer deems the next advance nonrecoverable. (ii) T&I advances pay specified expenses associated with the preservation of a mortgaged property or the liquidation of defaulted mortgage loans, including but not limited to property taxes, insurance premiums or other property-related expenses that have not been timely paid by borrowers in order for the lien holder to maintain its interest in the property. (iii) Corporate advances pay costs, fees and expenses incurred in foreclosing upon, preserving defaulted loans and selling REO, including attorneys’ and other professional fees and expenses incurred in connection with foreclosure and liquidation or other legal proceedings arising in the course of servicing the defaulted mortgage loans. Servicing advances are reimbursed to the servicer if and when the borrower makes a payment on the underlying mortgage loan at the time the loan is modified or upon liquidation of the underlying mortgage loan but are primarily the responsibility of the investor/owner of the loan. The types of servicing advances that a servicer must make are set forth in its servicing agreement with the owner of the mortgage loan or pool of mortgage loans. In some instances, a servicer is allowed to cease Servicing Advances, if those advances will not be recoverable from the property securing the loan.Subservicing. Subservicing is the process of outsourcing the duties of the primary servicer to a third-party servicer. The third-party servicer performs the servicing responsibilities for a fee and is typically not responsible for making servicing advances, which are subsequently reimbursed by the primary servicer. The primary servicer is contractually liable to the owner of the loans for the activities of the subservicer.Unpaid Principal Balance (“UPB”). The amount of principal outstanding on a mortgage loan or a pool of mortgage loans. UPB is used together with the servicing fees and ancillary incomes as a means of estimating the future revenue stream for a servicer.U.S. Department of Agriculture (“USDA”). The USDA is a cabinet-level department of the U.S. federal government, which guarantees certain home loans for qualified borrowers.Warehouse Facility. A type of line of credit facility used to temporarily finance mortgage loan originations to be sold in the secondary market. Pursuant to a warehouse facility, a loan originator typically agrees to transfer to a counterparty certain mortgage loans against the transfer of funds by the counterpart, with a simultaneous agreement by the counterpart to transfer the loans back to the originator at a date certain, or on demand, against the transfer of funds from the originator.Wholesale Originations. A type of mortgage loan origination pursuant to which a lender acquires refinancing and purchase money mortgage loans from third party correspondent lenders where the lender funds the loan.88Item 3. Quantitative and Qualitative Disclosures about Market RiskRefer to the discussion included in Part II, Item 7A of our Annual Report on Form 10-K for the year ended December 31, 2019. There have been no material changes in the types of market risks faced by us since December 31, 2019 except for the broad effects of the COVID-19 pandemic. As we cannot predict the duration or scope of the COVID-19 pandemic, the negative financial impact to our results cannot be reasonably estimated at this time.Sensitivity AnalysisWe assess our market risk based on changes in interest rates utilizing a sensitivity analysis. The sensitivity analysis measures the potential impact on fair values based on hypothetical changes (increases and decreases) in interest rates.We use a duration-based model in determining the impact of interest rate shifts on our loan portfolio, certain other interest-bearing liabilities measured at fair value and interest rate derivatives portfolios. The primary assumption used in these models is that an increase or decrease in the benchmark interest rate produces a parallel shift in the yield curve across all maturities.We utilize a discounted cash flow analysis to determine the fair value of MSRs and the impact of parallel interest rate shifts on MSRs. The primary assumptions in this model are prepayment speeds, earnings related to float and market discount rates. However, this analysis ignores the impact of interest rate changes on certain material variables, such as the benefit or detriment on the value of future loan originations, non-parallel shifts in the spread relationships between MBS, swaps and U.S. Treasury rates and changes in primary and secondary mortgage market spreads. For mortgage loans, IRLCs and forward delivery commitments on MBS, we rely on a model in determining the impact of interest rate shifts. In addition, the primary assumption used for IRLCs, is the borrower’s propensity to close their mortgage loans under the commitment.Our total market risk is influenced by a wide variety of factors including market volatility and the liquidity of the markets. There are certain limitations inherent in the sensitivity analysis presented, including the necessity to conduct the analysis based on a single point in time and the inability to include the complex market reactions that normally would arise from the market shifts modeled.We used June 30, 2020 market rates on our instruments to perform the sensitivity analysis. The estimates are based on the market risk sensitive portfolios described in the preceding paragraphs and assume instantaneous, parallel shifts in interest rate yield curves. These sensitivities are hypothetical and presented for illustrative purposes only. Changes in fair value based on variations in assumptions generally cannot be extrapolated because the relationship of the change in fair value may not be linear.The following table summarizes the estimated change in the fair value of our assets and liabilities sensitive to interest rates as of June 30, 2020 given hypothetical instantaneous parallel shifts in the yield curve. Results could differ materially.Table 33. Change in Fair Value June 30, 2020 Down 25 bps Up 25 bps Increase (decrease) in assets Mortgage servicing rights at fair value $ (114) $ 127 Mortgage loans held for sale at fair value 11 (14) Derivative financial instruments: Interest rate lock commitments 42 (54) Forward MBS trades (3) 4 Total change in assets (64) 63 Increase (decrease) in liabilities Mortgage servicing rights financing at fair value (4) 4 Excess spread financing at fair value (17) 20 Derivative financial instruments: Forward MBS trades 43 (55) Total change in liabilities 22 (31) Total, net change $ (86) $ 94 89Item 4.Controls and ProceduresEvaluation of disclosure controlsDisclosure Controls and procedures.Our management, has evaluated, under the supervision and with the participation of our Chief Executive Officer and Interim Chief Financial Officer, evaluated the effectiveness of theour disclosure controls and procedures pursuant to Rule 13a-15(b) under the Securities Exchange Act of the Company1934, as amended (“Exchange Act”), as of SeptemberJune 30, 2017. 2020.Based on thatthis evaluation, our Chief Executive Officer and Interim Chief Financial Officer have concluded that, as of SeptemberJune 30, 2017, the2020, our disclosure controls and procedures (as definedare effective. Disclosure controls and procedures are designed at a reasonable assurance level and are effective to provide reasonable assurance that information we are required to disclose in Rules 13a-15(e) and 15d-15(e)reports that we file or submit under the Exchange Act) were effective in ensuring that information required to be disclosed by the Company in reports the Company files or submits under the Exchange Act:(1)Act is recorded, processed, summarized, and reported within the time periods specified in the Securities and Exchange CommissionSEC’s rules and forms, and(2) that such information is accumulated and communicated to the Company’sour management, including the Company’s principal executiveour Chief Executive Officer and principal financial officers, or persons performing similar functions,Chief Financial Officer, as appropriate, to allow timely decisions regarding required disclosure.Changes in Internal Control Overover Financial ReportingThere wasDuring the three months ended June 30, 2020, no changechanges in the Company’sour internal control over financial reporting (asoccurred that term is defined in Rules 13a-15(f) and 15d-15(f) under the Exchange Act) during its most recent fiscal quarter that hashave materially affected, or isare reasonably likely to materially affect, the Company’sour internal control over financial reporting.45Limitations on Effectiveness of Controls and ProceduresIn designing and evaluating the disclosure controls and procedures, management recognizes that any controls and procedures, no matter how well designed and operated, can provide only reasonable assurance of achieving the desired control objectives.90PART II—II – OTHER INFORMATIONAs of September 30, 2017, the Company was notItem 1.Legal ProceedingsWe are a partystate licensed, non-bank mortgage lender, servicer and ancillary services provider. From time to or awaretime, we and our subsidiaries are involved in a number of any pending legal proceedings, including, but not limited to, judicial, arbitration, regulatory and governmental proceedings relating to matters that arise in connection with the conduct of our business. These legal proceedings are generally based on alleged violations of federal, state and local laws and regulations governing our mortgage servicing and lending activities including, without limitation, consumer protection laws, but may also include alleged violations of securities, employment, contract, tort, common law fraud and other laws. Legal proceedings include open and pending examinations, information gathering requests and investigations by governmental, regulatory and enforcement agencies as well as litigation in judicial forums and arbitration proceedings.Our business is subject to extensive examinations, investigations and reviews by various federal, state and local governmental, regulatory and enforcement agencies. We have historically had and continue to have a number of open investigations with these agencies. We continue to receive governmental and regulatory requests for information, subpoenas, examinations and other inquiries. We are currently the subject of various governmental or regulatory investigations, requiring disclosure at this time.subpoenas, examinations and inquiries related to our residential loan servicing and origination practices, bankruptcy and collections practices, financial reporting and other aspects of our businesses. These matters include investigations by the Consumer Financial Protection Bureau (the “CFPB”), the Securities and Exchange Commission, the Executive Office of the United States Trustees, the Department of Justice, the Office of the Special Inspector General for the Troubled Asset Relief Program, the U.S. Department of Housing and Urban Development, the multi-state coalition of mortgage banking regulators and various State Attorneys General. These specific matters and other pending or potential future investigations, subpoenas, examinations or inquiries may lead to administrative, civil or criminal proceedings or settlements and possibly result in remedies including fines, penalties, restitution, or alterations in our business practices and in additional expenses and collateral costs. We are cooperating fully in these matters. Responding to these matters requires us to devote substantial resources, resulting in higher costs and lower net cash flows. Adverse results in any of these matters could further increase our operating expenses and reduce our revenues, require us to change business practices and limit our ability to grow and otherwise materially and adversely affect our business, reputation, financial condition or results of operation.In particular, as previously disclosed, we continue to progress towards resolution of certain legacy regulatory matters with (i) the CFPB, (ii) the multi-state committee of mortgage banking regulators and various State Attorneys General and (iii) the Executive Office of the United States Trustee, all of which involve examination findings in prior years for alleged violations of certain laws related to our business practices. We believe that we have reached a settlement in principle to resolve these matters with each of these parties. Accordingly, we recorded an additional accrual during the three months ended June 30, 2020 in addition to amounts previously accrued and believe that we have fully accrued for these matters.Item 1A.Risk FactorsThere have been no material changes or additions to the information set forth in this Quarterly Report on Form 10-Q, you should carefully consider therisk factors discussed in “Part I-Item 1A. Riskpreviously disclosed under “Risk Factors” included in our Annual Report on Form 10-K filed for the year ended December 31, 2016. There have been no material changes in2019, and our risk factors from those disclosed in such Annual Report.46The following exhibits are filed or incorporated by reference as part of this Quarterly Report on Form 10-Q.Item 2.Unregistered Sales of Equity Securities and Use of Proceeds
We did not make any repurchases of our shares during the three months ended June 30, 2020.Item 3. Defaults Upon Senior SecuritiesNone.Item 4.Mine Safety DisclosuresNot applicable.Item 5.Other InformationNone.91Item 6.ExhibitsIncorporated by Reference Exhibit
NumberDescription Form File No. Exhibit Filing Date Filed or Furnished Herewith 31.1 X 31.2 X 32.1 X 32.2 X 101.INS Inline XBRL Instance Document - the instance document does not appear in the Interactive Data File because its XBRL tags are embedded within the Inline XBRL document. X 101.SCH Inline XBRL Taxonomy Extension Schema Document X 101.CAL Inline XBRL Taxonomy Extension Calculation Linkbase Document X 101.DEF Inline XBRL Taxonomy Extension Definition Linkbase Document X 101.LAB Inline XBRL Taxonomy Extension Label Linkbase Document X 101.PRE Inline XBRL Taxonomy Extension Presentation Linkbase Document X 104 Cover Page Interactive Data File (formatted as Inline XBRL and contained in Exhibits 101.) X 92SIGNATURESPursuant to the requirements of the Securities Exchange Act of 1934, the registrant has duly caused this report to be signed on its behalf by the undersigned thereunto duly authorized.WMIH CORP.(Registrant)Dated: November 9, 2017By:/s/ William C. GallagherJuly 30, 2020 Name:William C. GallagherDate Title:
Chief Executive Officer
(Principal Executive Officer)Dated: November 9, 2017By:/s/ Timothy F. JaegerJuly 30, 2020 Name:Timothy F. JaegerDate Title:InterimChristopher G. Marshall
Vice Chairman & Chief Financial Officer
(Principal Financial and Accounting Officer)4893