
000-55931
FORM 10-Q
(Mark One)
| ||
| ☒ | QUARTERLY REPORT PURSUANT TO SECTION 13 OR 15(d) OF THE SECURITIES EXCHANGE ACT OF 1934 | ||||
2021
| |||||
| ☐ | TRANSITION REPORT PURSUANT TO SECTION 13 OR 15(d) OF THE SECURITIES EXCHANGE ACT OF 1934 | ||||
000-55931

|
| ||||||||||||||||
Maryland | 81-0696966 | ||||||||||||||||
| (State or other jurisdiction of
| (I.R.S. Employer
| ||||||||||||||||
| 345 Park Avenue | |||||||||||||||||
| New York | , | NY | 10154 | ||||||||||||||
| (Address of principal executive offices) | (Zip Code) | ||||||||||||||||
345 Park Avenue
New York, New York 10154
(Address of principal executive offices) (Zip Code)
(212) 583-5000
(
code: (212) 583-5000
| Title of each class | Trading Symbol(s) | Name of each exchange on which registered | ||||||||||||
| Large accelerated filer |
| ☐ | Accelerated filer | ☐ | |||||||||||||
| Non-accelerated filer |
|
| Smaller reporting company | ☐ | |||||||||||||
| Emerging growth company |
| ☐ | |||||||||||||||
ITEM 1. ITEM 2. ITEM 3. ITEM 4. PART II. ITEM 1. ITEM 1A. ITEM 2. ITEM 3. ITEM 4. ITEM 5. ITEM 6. September 30, December 31, 2017 2016 Assets Investments in real estate, net $ 2,234,133 $ — Investments in real estate-related securities 644,371 — Cash and cash equivalents 30,820 200 Restricted cash 105,881 — Intangible assets, net 88,510 — Other assets 23,754 — Total assets $ 3,127,469 $ 200 Liabilities and Equity Mortgage notes, term loan, and revolving credit facility, net $ 1,155,391 $ — Repurchase agreements 478,455 — Affiliate line of credit 122,676 — Due to affiliates 101,983 86 Subscriptions received in advance 98,435 — Accounts payable, accrued expenses, and other liabilities 58,103 29 Total liabilities $ 2,015,043 $ 115 Commitments and contingencies — — Equity Preferred stock, $0.01 par value per share, 100,000,000 shares authorized; none issued and outstanding as of September 30, 2017 and December 31, 2016 — — Common stock — Class S shares, $0.01 par value per share, 500,000,000 shares authorized; 98,779,308 and no shares issued and outstanding as of September 30, 2017 and December 31, 2016, respectively 988 — Common stock — Class T shares, $0.01 par value per share, 500,000,000 shares authorized; 2,208,763 and no shares issued and outstanding as of September 30, 2017 and December 31, 2016, respectively 22 — Common stock — Class D shares, $0.01 par value per share, 500,000,000 shares authorized; 1,225,700 and no shares issued and outstanding as of September 30, 2017 and December 31, 2016, respectively 12 — Common stock — Class I shares, $0.01 par value per share, 500,000,000 shares authorized; 23,277,430 and 20,000 shares issued and outstanding as of September 30, 2017 and December 31, 2016, respectively 233 — Additional paid-in capital 1,177,444 200 Accumulated deficit and cumulative distributions (75,129 ) (115 ) Total stockholders' equity 1,103,570 85 Non-controlling interests 8,856 — Total equity 1,112,426 85 Total liabilities and equity $ 3,127,469 $ 200 Three Months Ended September 30, Nine Months Ended September 30, For the Period March 2, 2016 (date of initial capitalization) through September 30, 2017 2016 2017 2016 Revenues Rental revenue $ 33,599 $ — $ 55,727 $ — Tenant reimbursement income 3,230 — 5,503 — Hotel revenue 9,874 — 15,048 — Other revenue 2,201 — 3,409 — Total revenues 48,904 — 79,687 — Expenses Rental property operating 15,938 — 25,632 — Hotel operating 6,668 — 9,617 — General and administrative 1,716 — 5,969 — Management fee 3,712 — 3,712 — Performance participation allocation 5,711 — 10,952 — Depreciation and amortization 40,359 — 65,145 — Total expenses 74,104 — 121,027 — Other income (expense) Income from real estate-related securities 4,026 — 7,435 — Interest income 36 — 418 — Interest expense (10,866 ) — (16,413 ) — Other expenses (27 ) (55 ) Total other (expense) income (6,831 ) — (8,615 ) — Net loss before income tax (32,031 ) — (49,955 ) — Income tax benefit 184 — 140 — Net loss $ (31,847 ) $ — $ (49,815 ) $ — Net loss attributable to non-controlling interests $ 122 $ — $ 122 $ — Net loss attributable to BREIT stockholders $ (31,725 ) $ — $ (49,693 ) $ — Net loss per share of common stock — basic and diluted $ (0.28 ) $ — $ (0.66 ) $ — Weighted-average shares of common stock outstanding, basic and diluted 112,585,463 20,000 75,771,929 20,000 Par Value Accumulated Common Common Common Common Additional Deficit and Total Stock Stock Stock Stock Paid-in Cumulative Stockholders' Non-controlling Total Class S Class T Class D Class I Capital Distributions Equity Interests Equity Balance at December 31, 2016 $ — $ — $ — $ — $ 200 $ (115 ) $ 85 $ — $ 85 Common stock issued 978 22 12 230 1,262,811 — 1,264,053 — 1,264,053 Offering costs — — — — (98,938 ) — (98,938 ) — (98,938 ) Distribution reinvestment 10 — — 3 13,481 — 13,494 — 13,494 Common stock repurchased — — — — (187 ) — (187 ) — (187 ) Amortization of restricted stock grants — — — — 77 — 77 — 77 Net loss — — — — — (49,693 ) (49,693 ) (122 ) (49,815 ) Distributions declared on common stock — — — — — (25,321 ) (25,321 ) — (25,321 ) Contributions from non-controlling interests — — — — — — — 8,978 8,978 Balance at September 30, 2017 $ 988 $ 22 $ 12 $ 233 $ 1,177,444 $ (75,129 ) $ 1,103,570 $ 8,856 $ 1,112,426 Nine Months Ended September 30, 2017 For the Period March 2, 2016 (date of initial capitalization) through September 30, 2016 Cash flows from operating activities: Net loss $ (49,815 ) — Adjustments to reconcile net loss to net cash provided by operating activities: Depreciation and amortization 65,145 — Unrealized gain on changes in fair value of financial instruments (993 ) — Realized loss on settlement of real estate-related securities 177 — Straight-line rent adjustment (1,118 ) — Amortization of above- and below-market lease intangibles (792 ) — Amortization of below-market and prepaid ground lease intangibles 156 — Amortization of deferred financing costs 771 — Amortization of restricted stock grants 77 — Bad debt expense 709 — Change in assets and liabilities: (Increase) / decrease in other assets (10,824 ) — Increase / (decrease) in due to affiliates 18,523 — Increase / (decrease) in accounts payable, accrued expenses, and other liabilities 22,244 — Net cash provided by operating activities 44,260 — Cash flows from investing activities: Acquisitions of real estate (2,245,885 ) — Capital improvements to real estate (3,290 ) — Pre-acquisition costs (9,201 ) — Purchase of real estate-related securities (660,151 ) — Proceeds from settlement of real estate-related securities 16,596 — Net cash used in investing activities (2,901,931 ) — Cash flows from financing activities: Proceeds from issuance of common stock 1,264,053 — Offering costs paid (15,388 ) — Subscriptions received in advance 98,435 — Repurchase of common stock (187 ) — Borrowings from mortgage notes, term loan, and revolving credit facility 1,055,913 — Borrowings under repurchase agreements 491,026 — Settlement of repurchase agreements (12,571 ) — Borrowings from affiliate line of credit 617,650 — Repayments on affiliate line of credit (495,150 ) — Payment of deferred financing costs (12,384 ) — Contributions from non-controlling interests 8,978 — Distributions (6,203 ) — Net cash provided by financing activities 2,994,172 — Net change in cash and cash equivalents and restricted cash 136,501 — Cash and cash equivalents and restricted cash, beginning of period $ 200 $ 200 Cash and cash equivalents and restricted cash, end of period $ 136,701 $ 200 Reconciliation of cash and cash equivalents and restricted cash to the consolidated balance sheets: Cash and cash equivalents $ 30,820 $ 200 Restricted cash 105,881 — Total cash and cash equivalents and restricted cash $ 136,701 $ 200 Non-cash investing and financing activities: Assumption of mortgage notes in conjunction with acquisitions of real estate $ 107,369 — Assumption of other liabilities in conjunction with acquisitions of real estate $ 17,093 — Accrued capital expenditures and acquisition related costs $ 314 — Accrued pre-acquisition costs $ 905 — Accrued distributions $ 5,624 — Accrued stockholder servicing fee due to affiliate $ 75,998 — Accrued offering costs due to affiliate $ 7,552 — Distribution reinvestment $ 13,494 — Accrued deferred financing costs $ 307 — the real estate group of Blackstone, a leading global investment manager. The Company Certain of the joint ventures formed by the Company provide the other partner a profits interest based on certain internal rate of return hurdles being achieved. Any profits interest due to the other partner is reported within non-controlling interests. Investments in Real Estate Class S Class T Class D Class I Selling commissions and dealer manager fees (% of transaction price) up to 3.5% up to 3.5% — — Stockholder servicing fee (% of NAV) 0.85% 0.85% 0.25% — Recent Accounting Pronouncements September 30, 2017 Building and building improvements $ 1,850,698 Land and land improvements 367,012 Furniture, fixtures and equipment 40,364 Total 2,258,074 Accumulated depreciation (23,941 ) Investments in real estate, net $ 2,234,133 Property Name Ownership Interest Number of Properties Location Sector Acquisition Date Purchase Price(1) Hyatt Place UC Davis(2) 100% 1 Davis, CA Hotel Jan. 2017 $ 32,687 Sonora Canyon 100% 1 Mesa, AZ Multifamily Feb. 2017 40,983 Stockton 100% 1 Stockton, CA Industrial Feb. 2017 32,751 Bakers Centre 100% 1 Philadelphia, PA Retail Mar. 2017 54,223 TA Multifamily Portfolio 100% 6 Various(3) Multifamily Apr. 2017 432,593 HS Industrial Portfolio 100% 38 Various(4) Industrial Apr. 2017 405,930 Emory Point(2) 100% 1 Atlanta, GA Multifamily(5) May 2017 201,578 Nevada West 100% 3 Las Vegas, NV Multifamily May 2017 170,965 Hyatt Place San Jose Downtown 100% 1 San Jose, CA Hotel June 2017 65,321 Mountain Gate & Trails 100% 2 Las Vegas, NV Multifamily June 2017 83,572 Elysian West 100% 1 Las Vegas, NV Multifamily July 2017 107,027 Florida Select-Service 4-Pack 100% 4 Tampa & Orlando, FL Hotel July 2017 58,973 Hyatt House Downtown Atlanta 100% 1 Atlanta, GA Hotel Aug. 2017 35,332 Harbor 5 100% 5 Dallas, TX Multifamily Aug. 2017 146,161 Gilbert Multifamily 90% 2 Gilbert, AZ Multifamily Sept. 2017 147,039 Domain & GreenVue Multifamily 100% 2 Dallas, TX Multifamily Sept. 2017 134,452 Fairfield Industrial 100% 11 Fairfield, NJ Industrial Sept. 2017 74,283 ACG II Multifamily Portfolio 94% 4 Various (6) Multifamily Sept. 2017 148,038 85 $ 2,371,908 TA Multifamily Portfolio HS Industrial Portfolio Emory Point Nevada West All Other Total Building and building improvements $ 337,889 $ 345,391 $ 171,709 $ 145,305 $ 847,905 $ 1,848,199 Land and land improvements 68,456 45,081 — 17,409 235,876 366,822 Furniture, fixtures and equipment 4,651 — 3,040 2,833 28,892 39,416 In-place lease intangibles 21,880 20,793 11,207 5,418 46,094 105,392 Below-market ground lease intangibles — — — — 4,683 4,683 Above-market lease intangibles 24 2,726 84 — 465 3,299 Below-market lease intangibles (307 ) (8,061 ) (576 ) — (3,749 ) (12,693 ) Prepaid ground lease rent — — 16,114 — — 16,114 Other intangibles — — — — 676 676 Total purchase price $ 432,593 $ 405,930 $ 201,578 $ 170,965 $ 1,160,842 $ 2,371,908 Assumed mortgage notes(1) — — — — 108,971 108,971 Net purchase price $ 432,593 $ 405,930 $ 201,578 $ 170,965 $ 1,051,871 $ 2,262,937 September 30, 2017 Intangible assets: In-place lease intangibles $ 104,735 Below-market ground lease intangibles 4,683 Above-market lease intangibles 3,299 Prepaid ground lease rent 16,114 Other 676 Total intangible assets 129,507 Accumulated amortization: In-place lease amortization (40,496 ) Below-market ground lease amortization (62 ) Above-market lease amortization (314 ) Prepaid ground lease rent amortization (94 ) Other (31 ) Total accumulated amortization (40,997 ) Intangible assets, net $ 88,510 Intangible liabilities: Below-market lease intangibles $ 12,693 Accumulated amortization (1,106 ) Intangible liabilities, net $ 11,587 In-place Lease Intangibles Below-market Ground Lease Intangibles Above-market Lease Intangibles Pre-paid Ground Lease Intangibles Below-market Lease Intangibles 2017 (remaining) $ 23,448 $ 22 $ 194 $ 57 $ (743 ) 2018 20,145 89 722 227 (2,745 ) 2019 6,370 89 496 227 (2,060 ) 2020 5,264 89 473 227 (1,866 ) 2021 4,101 89 442 227 (1,617 ) Thereafter 4,911 4,243 658 15,055 (2,556 ) $ 64,239 $ 4,621 $ 2,985 $ 16,020 $ (11,587 ) Number of Investments Credit Rating(1) Collateral Weighted Average Coupon(2) Weighted Average Maturity Date Face Amount Cost Basis Fair Value 5 BBB Office, Hospitality, Industrial, Retail L+2.16% 4/28/2030 $ 132,034 $ 132,034 $ 132,363 11 BB Hospitality, Office, Retail, Multifamily L+3.22% 4/5/2034 333,578 333,466 333,777 8 B Hospitality, Office, Multifamily L+4.12% 11/30/2032 177,950 177,878 178,231 24 $ 643,562 $ 643,378 $ 644,371 Property Interest Rate(1) Maturity Dates Principal Balance Amortization Period Prepayment Provisions(2) TA Multifamily (excluding 55 West) 3.76% 6/1/2024 $ 211,249 Interest Only Yield Maintenance Industrial Properties - Term Loan L+2.10% 6/1/2022 146,000 Interest Only Spread Maintenance Industrial Properties - Revolving Credit Facility L+2.10% 6/1/2022 146,000 Interest Only None Emory Point 3.66% 5/5/2024 130,000 Interest Only(4) Yield Maintenance Nevada West 3.75% 9/1/2024 121,380 Interest Only Yield Maintenance Elysian West 3.77% 9/1/2024 75,400 Interest Only Yield Maintenance 55 West (part of TA Multifamily Portfolio) L+2.18% 5/9/2022(3) 63,600 Interest Only Spread Maintenance Mountain Gate & Trails 3.75% 9/1/2024 59,985 Interest Only Yield Maintenance Gilbert Vistara 4.09% 10/1/2028 48,129 Interest Only Yield Maintenance Gilbert Redstone 4.92% 4/10/2029 40,484 Interest Only(5) Yield Maintenance ACG II - Highlands 3.62% 10/1/2024 27,715 Interest Only Yield Maintenance Sonora Canyon 3.76% 6/1/2024 26,455 Interest Only Yield Maintenance ACG II - Brooks Landing 4.60% 10/6/2025 24,500 Interest Only Yield Maintenance ACG II - Woodlands 4.83% 3/6/2024 23,485 Interest Only(5) Yield Maintenance ACG II - Sterling Pointe 5.36% 1/6/2024 18,900 Interest Only(5) Yield Maintenance Total principal balance 1,163,282 Deferred financing costs, net (9,493 ) Premium on assumed debt, net 1,602 Mortgage notes, term loan, and revolving credit facility, net $ 1,155,391 Year Amount 2017 (remaining) $ — 2018 227 2019 510 2020 622 2021 834 Thereafter 1,161,089 Total $ 1,163,282 Facility Interest Rate(1) Maturity Dates(2) Security Interests Collateral Assets(3) Outstanding Balance Prepayment Provisions Citi MRA L+1.25% - L+1.70% 10/16/2017 - 12/28/2017 CMBS $ 580,899 $ 429,294 None RBC MRA L+1.25% - L+1.45% 10/20/2017 CMBS 63,472 49,161 None $ 644,371 $ 478,455 September 30, 2017 December 31, 2016 Real estate taxes payable $ 15,867 $ — Intangible liabilities, net 11,587 — Accounts payable and accrued expenses 9,501 — Tenant security deposits 5,685 — Distribution payable 5,624 — Accrued interest expense 4,397 — Prepaid rental income 4,098 — Other 1,344 29 Total $ 58,103 $ 29 Classification Number of Shares (in thousands) Par Value Preferred Stock 100,000 $ 0.01 Class S Shares 500,000 $ 0.01 Class T Shares 500,000 $ 0.01 Class D Shares 500,000 $ 0.01 Class I Shares 500,000 $ 0.01 Total 2,100,000 Nine Months Ended September 30, 2017 Class S Class T Class D Class I Total Beginning balance — — — 20 20 Common stock issued 97,801 2,206 1,221 22,932 124,160 Distribution reinvestment 993 3 5 313 1,314 Common stock repurchased (15 ) — — (4 ) (19 ) Directors’ restricted stock grant(1) — — — 16 16 Ending balance 98,779 2,209 1,226 23,277 125,491 Class S Class I Class D Class T Aggregate distributions declared per share of common stock $ 0.3245 $ 0.3245 $ 0.2471 $ 0.2030 Stockholder servicing fee per share of common stock (0.0598 ) — (0.0108 ) (0.0289 ) Net distributions declared per share of common stock $ 0.2647 $ 0.3245 $ 0.2363 $ 0.1741 September 30, 2017 December 31, 2016 Accrued stockholder servicing fee $ 75,998 $ — Performance participation allocation 10,952 — Advanced organization and offering costs 9,389 — Accrued management fee 3,712 — Accrued affiliate service provider expenses 1,797 — Advanced expenses 135 86 Total $ 101,983 $ 86 Year Future Commitments 2017 (remaining) $ 60 2018 239 2019 239 2020 239 2021 239 Thereafter 13,233 Total $ 14,249 Year Future Minimum Rents 2017 (remaining) $ 9,562 2018 37,139 2019 31,378 2020 28,275 2021 24,021 Thereafter 59,734 Total $ 190,109 September 30, 2017 Multifamily $ 1,588,958 Industrial 524,988 Hotel 200,301 Retail 55,644 Real Estate-Related Securities 646,373 Other (Corporate) 111,205 Total assets $ 3,127,469 Multifamily Industrial Hotel Retail Real Estate- Related Securities Total Revenues: Rental revenue $ 24,911 $ 7,737 $ — $ 951 $ — $ 33,599 Tenant reimbursement income 964 2,036 — 230 — 3,230 Hotel revenue — — 9,874 — — 9,874 Other revenue 2,182 7 — 12 — 2,201 Total revenues 28,057 9,780 9,874 1,193 — 48,904 Expenses: Rental property operating 12,588 3,029 — 321 — 15,938 Hotel operating — — 6,668 — — 6,668 Total expenses 12,588 3,029 6,668 321 — 22,606 Income from real estate-related securities — — — — 4,026 4,026 Segment net operating income $ 15,469 $ 6,751 $ 3,206 $ 872 $ 4,026 $ 30,324 Depreciation and amortization $ 32,606 $ 5,408 $ 1,862 $ 483 $ — $ 40,359 Other income (expense): General and administrative (1,716 ) Management fee (3,712 ) Performance participation allocation (5,711 ) Interest income 36 Interest expense (10,866 ) Other expenses (27 ) Income tax benefit 184 Net loss $ (31,847 ) Net loss attributable to non-controlling interests 122 Net loss attributable to BREIT stockholders $ (31,725 ) Multifamily Industrial Hotel Retail Real Estate- Related Securities Total Revenues: Rental revenue $ 39,466 $ 14,357 $ — $ 1,904 $ — $ 55,727 Tenant reimbursement income 1,472 3,703 — 328 — 5,503 Hotel revenue — — 15,048 — — 15,048 Other revenue 3,385 6 — 18 — 3,409 Total revenues 44,323 18,066 15,048 2,250 — 79,687 Expenses: Rental property operating 19,473 5,664 — 495 — 25,632 Hotel operating — — 9,617 — — 9,617 Total expenses 19,473 5,664 9,617 495 — 35,249 Income from real estate-related securities — — — — 7,435 7,435 Segment net operating income $ 24,850 $ 12,402 $ 5,431 $ 1,755 $ 7,435 $ 51,873 Depreciation and amortization $ 51,205 $ 9,852 $ 3,119 $ 969 $ — $ 65,145 Other income (expense): General and administrative (5,969 ) Management fee (3,712 ) Performance participation allocation (10,952 ) Interest income 418 Interest expense (16,413 ) Other expenses (55 ) Income tax benefit 140 Net loss $ (49,815 ) Net loss attributable to non-controlling interests 122 Net loss attributable to BREIT stockholders $ (49,693 ) Sector and Property/Portfolio Name Number of Properties Location Acquisition Date Ownership Interest(1) Acquisition Price (in thousands)(2) Sq. Feet (in thousands)/ Number of Rooms/Units Occupancy Rate(3) Multifamily: TA Multifamily Portfolio 6 Various(4) Apr. 2017 100% $ 432,593 2,514 units 94% Emory Point 1 Atlanta, GA May 2017 100% 201,578 750 units 100% Nevada West Multifamily 3 Las Vegas, NV May 2017 100% 170,965 972 units 92% Gilbert Multifamily 2 Gilbert, AZ Sept. 2017 90% 147,039 748 units 93% ACG II Multifamily 4 Various(5) Sept. 2017 94% 148,038 932 units 98% Harbor 5 5 Dallas, TX Aug. 2017 100% 146,161 1,192 units 94% Domain & GreenVue Multifamily 2 Dallas, TX Sept. 2017 100% 134,452 803 units 84% Elysian West 1 Las Vegas, NV July 2017 100% 107,027 466 units 91% Mountain Gate & Trails 2 Las Vegas, NV June 2017 100% 83,572 539 units 96% Sonora Canyon 1 Mesa, AZ Feb. 2017 100% 40,983 388 units 93% Total Multifamily 27 1,612,408 9,304 units Industrial: HS Industrial Portfolio 38 Various(4) Apr. 2017 100% 405,930 5,972 sq. ft. 96% Fairfield Industrial 11 Fairfield, NJ Sept. 2017 100% 74,283 578 sq. ft. 100% Stockton 1 Stockton, CA Feb. 2017 100% 32,751 878 sq. ft. 87% Total Industrial 50 512,964 7,428 sq. ft. Hotel: Hyatt Place San Jose Downtown 1 San Jose, CA June 2017 100% 65,321 236 rooms 83% Florida Select-Service 4-Pack 4 Tampa & Orlando, FL July 2017 100% 58,973 469 rooms 71% Hyatt House Downtown Atlanta 1 Atlanta, GA Aug. 2017 100% 35,332 150 rooms 78% Hyatt Place UC Davis 1 Davis, CA Jan. 2017 100% 32,687 127 rooms 87% Total Hotel 7 192,313 982 rooms Retail: Bakers Centre 1 Philadelphia, PA Mar. 2017 100% 54,223 237 sq. ft. 95% Total Retail 1 54,223 237 sq. ft. Total Investments in Real Estate 85 $ 2,371,908 Number of Investments Credit Rating(1) Collateral Weighted Average Coupon(2) Weighted Average Maturity Date Face Amount Cost Basis Fair Value 5 BBB Office, Hospitality, Industrial, Retail L+2.16% 4/28/2030 $ 132,034 $ 132,034 $ 132,363 11 BB Hospitality, Office, Retail, Multifamily L+3.22% 4/5/2034 333,578 333,466 333,777 8 B Hospitality, Office, Multifamily L+4.12% 11/30/2032 177,950 177,878 178,231 24 $ 643,562 $ 643,378 $ 644,371 Three Months Ended Nine Months Ended September 30, 2017 September 30, 2017 Rental revenue Multifamily $ 24,911 $ 39,466 Industrial 7,737 14,357 Retail 951 1,904 Total rental revenue 33,599 55,727 Hotel revenue 9,874 15,048 Total rental and hotel revenue $ 43,473 $ 70,775 Year Number of Expiring Leases Annualized Base Rent(1) % of Total Annualized Base Rent Expiring Square Feet % of Total Square Feet Expiring 2017 (remainder) 1 $ 418 1% 131 2% 2018 24 6,906 16% 1,129 15% 2019 19 5,575 13% 982 13% 2020 16 3,960 9% 641 9% 2021 21 8,082 18% 1,465 20% 2022 16 5,781 13% 907 12% 2023 19 6,341 14% 1,099 15% 2024 9 1,579 4% 190 3% 2025 8 2,937 7% 484 7% 2026 4 571 1% 73 1% Thereafter 4 1,720 4% 189 3% Total 141 $ 43,870 100% 7,290 100% Three Months Ended September 30, 2017 Nine Months Ended September 30, 2017 Property Average Daily Rate RevPAR Average Daily Rate RevPAR Hyatt Place UC Davis $ 160 $ 143 $ 165 $ 144 Hyatt Place San Jose Downtown $ 197 $ 163 $ 213 $ 177 Florida Select-Service 4-Pack $ 107 $ 76 $ 108 $ 76 Hyatt House Downtown Atlanta $ 175 $ 136 $ 175 $ 136 Three Months Ended September 30, 2017 Nine Months Ended September 30, 2017 Revenues Rental revenue $ 33,599 $ 55,727 Tenant reimbursement income 3,230 5,503 Hotel revenue 9,874 15,048 Other revenue 2,201 3,409 Total revenues 48,904 79,687 Expenses Rental property operating 15,938 25,632 Hotel operating 6,668 9,617 General and administrative 1,716 5,969 Management fee 3,712 3,712 Performance participation allocation 5,711 10,952 Depreciation and amortization 40,359 65,145 Total expenses 74,104 121,027 Other income (expense) Income from real estate-related securities 4,026 7,435 Interest income 36 418 Interest expense (10,866 ) (16,413 ) Other expense (27 ) (55 ) Total other (expense) income (6,831 ) (8,615 ) Income before income tax (32,031 ) (49,955 ) Income tax benefit 184 140 Net loss (31,847 ) (49,815 ) Net loss attributable to non-controlling interests 122 122 Net loss attributable to BREIT stockholders $ (31,725 ) $ (49,693 ) Three Months Ended September 30, 2017 Nine Months Ended September 30, 2017 Net loss attributable to BREIT stockholders $ (31,725 ) $ (49,693 ) Adjustments: Real estate depreciation and amortization 40,359 65,145 Amount attributable to non-controlling interests for above adjustment (169 ) (169 ) Funds from Operations attributable to BREIT stockholders $ 8,465 $ 15,283 Three Months Ended September 30, 2017 Nine Months Ended September 30, 2017 Funds from Operations attributable to BREIT stockholders $ 8,465 $ 15,283 Adjustments: Straight-line rental income (551 ) (1,118 ) Amortization of above- and below-market lease intangibles (427 ) (792 ) Amortization of below-market and prepaid ground lease intangible 79 156 Organization costs — 1,838 Unrealized gains (losses) from changes in the fair value of real estate-related securities 641 (966 ) Amortization of restricted stock awards 25 77 Performance participation allocation 5,711 10,952 Adjusted Funds from Operations attributable to BREIT stockholders $ 13,943 $ 25,430 Components of NAV September 30, 2017 Investments in real property $ 2,437,266 Investments in real estate-related securities 644,371 Cash and cash equivalents 30,820 Restricted cash 105,881 Other assets 22,553 Debt obligations (1,756,385 ) Subscriptions received in advance (98,435 ) Other liabilities (48,836 ) Accrued performance participation allocation (10,952 ) Management fee payable (3,712 ) Accrued stockholder servicing fees(1) (744 ) Non-controlling interests in joint venture (9,025 ) Net Asset Value $ 1,312,802 Number of outstanding shares 125,491 NAV Per Share Class S Shares Class I Shares Class D Shares Class T Shares Total Monthly NAV $ 1,033,848 $ 243,433 $ 12,718 $ 22,803 $ 1,312,802 Number of outstanding shares 98,779 23,277 1,226 2,209 125,491 NAV Per Share $ 10.4662 $ 10.4579 $ 10.3763 $ 10.3239 Property Type Discount Rate Exit Capitalization Rate Multifamily 7.8% 5.7% Industrial 7.1% 6.7% Hospitality 9.8% 9.5% Input Hypothetical Change Multifamily Investment Values Industrial Investment Values Hospitality Investment Values Discount Rate 0.25% decrease +1.9% +1.5% +0.9% (weighted average) 0.25% increase (1.9%) (1.5%) (0.9%) Exit Capitalization Rate 0.25% decrease +2.8% +2.4% +1.9% (weighted average) 0.25% increase (2.7%) (2.2%) (1.8%) Reconciliation of Stockholders’ Equity to NAV September 30, 2017 Stockholders’ equity under U.S. GAAP $ 1,103,570 Adjustments: Accrued stockholder servicing fee 75,254 Organization and offering costs 9,389 Unrealized real estate appreciation 60,080 Accumulated depreciation and amortization 64,509 NAV $ 1,312,802 Three Months Ended September 30, 2017 Nine Months Ended September 30, 2017 Amount Percentage Amount Percentage Distributions Paid in cash $ 5,033 33 % $ 8,221 32 % Reinvested in shares 10,018 67 % 17,100 68 % Total distributions $ 15,051 100 % $ 25,321 100 % Sources of Distributions Cash flows from operating activities $ 15,051 100 % $ 25,321 100 % Offering proceeds — — % — — % Total sources of distributions $ 15,051 100 % $ 25,321 100 % Cash flows from operating activities $ 24,776 $ 44,260 Funds from Operations $ 8,465 $ 15,283 Indebtedness Interest Rate(1) Maturity Dates(2)(3) Maximum Facility Size Principal Balance Loans secured by our properties: TA Multifamily (excluding 55 West) 3.76% 6/1/2024 N/A $ 211,249 Industrial Properties - Term Loan L+2.10% 6/1/2022 N/A 146,000 Industrial Properties - Revolving Credit Facility L+2.10% 6/1/2022 146,000 146,000 Emory Point 3.66% 5/5/2024 N/A 130,000 Nevada West 3.75% 9/1/2024 N/A 121,380 Elysian West 3.77% 9/1/2024 N/A 75,400 55 West (part of TA Multifamily Portfolio) L+2.18% 5/9/2022(2) N/A 63,600 Mountain Gate & Trails 3.75% 9/1/2024 N/A 59,985 Gilbert Vistara 4.09% 10/1/2028 N/A 48,129 Gilbert Redstone 4.92% 4/10/2029 N/A 40,484 ACG II - Highlands 3.62% 10/1/2024 N/A 27,715 Sonora Canyon 3.76% 6/1/2024 N/A 26,455 ACG II - Brooks Landing 4.60% 10/6/2025 N/A 24,500 ACG II - Woodlands 4.83% 3/6/2024 N/A 23,485 ACG II - Sterling Pointe 5.36% 1/6/2024 N/A 18,900 Total loans secured by our properties 1,163,282 Repurchase agreement borrowings: Citi MRA L+1.25% - L+1.70% 10/16/2017 - 12/28/2017 N/A 429,294 RBC MRA L+1.25% - L+1.45% 10/20/2017 N/A 49,161 BAML MRA — — N/A — Total repurchase agreement borrowings 478,455 Line of Credit L+2.25% 1/23/2018 250,000 122,676 Citi Line of Credit(4) L+2.25% 10/26/2018 300,000 — Total indebtedness $ 1,764,413 Nine Months Ended September 30, 2017 Cash flows provided by operating activities $ 44,260 Cash flows used in investing activities (2,901,931 ) Cash flows provided by financing activities 2,994,172 Net increase in cash and cash equivalents and restricted cash $ 136,501 See Note 2 — “Summary of Significant Accounting Policies” to our condensed consolidated financial statements in this quarterly report on Form 10-Q for a discussion concerning recent accounting pronouncements. Obligations Total Less than 1 year 1-3 years 3-5 years More than 5 years Organizational and offering costs $ 9,389 $ 1,408 $ 3,756 $ 3,756 $ 469 Ground leases 14,249 239 478 478 13,054 Indebtedness (1) 1,947,404 524,129 89,108 381,789 952,378 Total $ 1,971,042 $ 525,776 $ 93,342 $ 386,023 $ 965,901 year ended December 31, 2020. Real Estate Debt Class S Shares Class I Shares Class D Shares Class T Shares Total Offering proceeds: Shares sold 98,779,308 23,241,230 1,225,700 2,208,763 125,455,001 Gross offering proceeds $ 997,265 $ 231,177 $ 12,454 $ 23,157 $ 1,264,053 Selling commissions and dealer manager fees (11,431 ) — — (659 ) (12,090 ) Accrued stockholder servicing fees (4,008 ) — (6 ) (28 ) (4,042 ) Other offering costs — — — — — Net offering proceeds $ 981,826 $ 231,177 $ 12,448 $ 22,470 $ 1,247,921 Use of offering proceeds: Purchase of real estate (2,245,885 ) Capital improvements to real estate (3,290 ) Pre-acquisition costs (9,201 ) Purchase of real estate-related securities (660,151 ) Proceeds from settlement of real estate-related securities 16,596 Repurchase of common stock (187 ) Borrowings from mortgage notes, term loan, and revolving credit facility 1,055,913 Borrowings under repurchase agreements 491,026 Settlement of repurchase agreements (12,571 ) Borrowings from Line of Credit 617,650 Repayments on Line of Credit (495,150 ) Payment of deferred financing costs (12,384 ) Contributions from non-controlling interests 8,978 Distributions to stockholders (6,203 ) Working capital 37,758 Cash and cash equivalents $ 30,820 quarter based on the average of the aggregate NAV per month over the prior three months. All unsatisfied repurchase requests must be resubmitted after the start of the next month or quarter, or upon the recommencement of the share repurchase plan, as applicable. Period Total Number of Shares Redeemed or Repurchased Average Price Paid per Share Total Number of Shares Purchased as Part of Publicly Announced Plans or Programs Maximum Number of Shares that May Yet Be Purchased Pursuant to the Program July 1 – July 31, 2017 — $ — — (1) August 1 - August 31, 2017 3,594 9.80 3,594 (1) September 1 - September 30, 2017 15,327 9.90 15,327 (1) Total 18,921 $ 9.85 18,921 (1) 32.1 + 32.2 + 101.INS Inline XBRL Instance Document 101.SCH Inline XBRL Taxonomy Extension Schema Document 101.SCH Inline XBRL Taxonomy Extension Calculation Linkbase Document 101.LAB Inline XBRL Taxonomy Extension Label Linkbase Document 101.PRE Inline XBRL Taxonomy Extension Presentation Linkbase Document 101.DEF Inline XBRL Taxonomy Extension Definition Linkbase Document /s/ Frank Cohen Date Frank Cohen Chief Executive Officer (Principal Executive Officer) /s/ Date Chief Financial Officer and Treasurer (Principal Financial TABLE OF CONTENTSPART I. 346233738393939404141414243ITEM 1. FINANCIAL STATEMENTSCondensed Consolidated Balance Sheets (Unaudited)(in thousands, except share and per share data) June 30, 2021 December 31, 2020 Assets Investments in real estate, net $ 33,951,388 $ 32,457,713 Investments in unconsolidated entities (includes $422,616 and $0 at fair value as of June 30, 2021 and December 31, 2020, respectively)1,242,531 816,220 Investments in real estate debt 5,729,378 4,566,306 Cash and cash equivalents 1,680,991 333,388 Restricted cash 2,243,237 711,135 Other assets 3,134,330 1,799,253 Total assets $ 47,981,855 $ 40,684,015 Liabilities and Equity Mortgage notes, term loans, and secured revolving credit facilities, net $ 19,662,010 $ 19,976,161 Secured financings of investments in real estate debt 350,598 2,140,993 Unsecured revolving credit facilities 0 0 Due to affiliates 1,318,639 887,660 Other liabilities 3,344,477 1,465,194 Total liabilities 24,675,724 24,470,008 Commitments and contingencies 0 0 Redeemable non-controlling interests 43,646 30,056 Equity Common stock — Class S shares, $0.01 par value per share, 3,000,000 shares authorized; 921,838 and 702,853 shares issued and outstanding as of June 30, 2021 and December 31, 2020, respectively 9,218 7,029 Common stock — Class I shares, $0.01 par value per share, 6,000,000 shares authorized; 1,326,271 and 927,080 shares issued and outstanding as of June 30, 2021 and December 31, 2020, respectively 13,262 9,270 Common stock — Class T shares, $0.01 par value per share, 500,000 shares authorized; 50,188 and 45,943 shares issued and outstanding as of June 30, 2021 and December 31, 2020, respectively 502 459 Common stock — Class D shares, $0.01 par value per share, 500,000 shares authorized; 181,506 and 124,141 shares issued and outstanding as of June 30, 2021 and December 31, 2020, respectively 1,815 1,241 Additional paid-in capital 26,842,197 19,059,045 Accumulated deficit and cumulative distributions (4,008,476) (3,224,318) Total stockholders' equity 22,858,518 15,852,726 Non-controlling interests attributable to third party joint ventures 153,817 143,253 Non-controlling interests attributable to BREIT OP unitholders 250,150 187,972 Total equity 23,262,485 16,183,951 Total liabilities and equity $ 47,981,855 $ 40,684,015 See accompanying notes to condensed consolidated financial statements.1Condensed Consolidated Statements of Operations (Unaudited)(in thousands, except share and per share data)Three Months Ended June 30, Six Months Ended June 30, 2021 2020 2021 2020 Revenues Rental revenue $ 680,809 $ 553,717 $ 1,333,725 $ 1,085,812 Hospitality revenue 102,660 21,781 160,803 149,253 Other revenue 26,714 17,249 49,110 32,564 Total revenues 810,183 592,747 1,543,638 1,267,629 Expenses Rental property operating 247,985 187,035 485,690 355,423 Hospitality operating 75,093 44,523 130,773 143,829 General and administrative 7,789 6,913 14,749 13,595 Management fee 92,183 53,423 165,278 102,925 Performance participation allocation 299,373 0 442,588 0 Impairment of investments in real estate 0 6,126 0 6,126 Depreciation and amortization 399,621 347,352 800,008 676,157 Total expenses 1,122,044 645,372 2,039,086 1,298,055 Other income (expense) Income from unconsolidated entities 70,028 25,336 104,710 38,605 Income (loss) from investments in real estate debt 116,573 492,889 355,934 (523,258) Net gain on dispositions of real estate 7,372 0 22,802 371 Interest income 9 233 95 1,980 Interest expense (181,529) (176,579) (363,147) (365,083) Loss on extinguishment of debt (2,757) 0 (6,173) (1,237) Other income (expense) 125,583 29,078 233,529 (19,770) Total other income (expense) 135,279 370,957 347,750 $ (868,392) Net (loss) income $ (176,582) $ 318,332 $ (147,698) $ (898,818) Net (income) loss attributable to non-controlling interests in third party joint ventures $ (264) $ 966 $ (323) $ 1,203 Net (income) loss attributable to non-controlling interests in BREIT OP 2,089 (4,859) 1,736 $ 11,967 Net (loss) income attributable to BREIT stockholders $ (174,757) $ 314,439 $ (146,285) $ (885,648) Net (loss) income per share of common stock — basic and diluted $ (0.08) $ 0.20 $ (0.07) $ (0.59) Weighted-average shares of common stock outstanding, basic and diluted 2,315,262 1,585,584 2,127,915 1,492,549 See accompanying notes to condensed consolidated financial statements.2Condensed Consolidated StatementStatements of Changes in Equity (Unaudited)(in thousands)thousands, except per share data)Par Value Accumulated
Deficit and
Cumulative
DistributionsNon-
controlling
Interests
Attributable
to Third Party
Joint VenturesNon-
controlling
Interests
Attributable
to BREIT OP
UnitholdersCommon
Stock
Class SCommon
Stock
Class ICommon
Stock
Class TCommon
Stock
Class DAdditional
Paid-in
CapitalTotal
Stockholders'
EquityTotal
EquityBalance at March 31, 2021 $ 7,835 $ 10,427 $ 471 $ 1,470 $ 21,507,160 $ (3,485,251) $ 18,042,112 $ 142,932 $ 254,072 $ 18,439,116 Common stock issued 1,363 2,919 30 339 5,595,388 — 5,600,039 — — 5,600,039 Offering costs — — — — (184,323) — (184,323) — — (184,323) Distribution reinvestment 61 67 4 11 173,079 — 173,222 — — 173,222 Common stock/units repurchased (41) (152) (3) (5) (242,356) — (242,557) — (160) (242,717) Amortization of compensation awards — 1 — — 124 — 125 — 692 817 Net loss ($195 allocated to redeemable non‑controlling interests) — — — — — (174,757) (174,757) 457 (2,087) (176,387) Distributions declared on common stock ($0.1615 gross per share) — — — — — (348,468) (348,468) — — (348,468) Contributions from non-controlling interests — — — — — — — 14,597 2,150 16,747 Distributions to and redemptions of non-controlling interests — — — — — — — (4,169) (4,517) (8,686) Allocation to redeemable non-controlling interests — — — — (6,875) — (6,875) — — (6,875) Balance at June 30, 2021 $ 9,218 $ 13,262 $ 502 $ 1,815 $ 26,842,197 $ (4,008,476) $ 22,858,518 $ 153,817 $ 250,150 $ 23,262,485 Par Value Accumulated
Deficit and
Cumulative
DistributionsNon-
controlling
Interests
Attributable
to Third Party
Joint VenturesNon-
controlling
Interests
Attributable
to BREIT OP
UnitholdersCommon
Stock
Class SCommon
Stock
Class ICommon
Stock
Class TCommon
Stock
Class DAdditional
Paid-in
CapitalTotal
Stockholders'
EquityTotal
EquityBalance at March 31, 2020 $ 6,111 $ 7,830 $ 439 $ 964 $ 16,278,758 $ (2,830,046) $ 13,464,056 $ 161,305 $ 190,241 $ 13,815,602 Common stock issued 258 474 12 73 875,751 — 876,568 — — 876,568 Offering costs — — — — (28,581) — (28,581) — — (28,581) Distribution reinvestment 54 51 3 8 123,128 — 123,244 — — 123,244 Common stock/units repurchased (101) (156) (14) (13) (297,305) — (297,589) — (1,420) (299,009) Amortization of compensation awards — 1 — — 99 — 100 — 500 600 Net income ($310 loss allocated to redeemable non‑controlling interests)— — — — — 314,439 314,439 (651) 4,854 318,642 Distributions declared on common stock ($0.1577 gross per share) — — — — — (234,382) (234,382) — — (234,382) Contributions from non-controlling interests — — — — — — — 1,916 1,257 3,173 Distributions to and redemptions of non-controlling interests — — — — — — — (3,111) (3,439) (6,550) Allocation to redeemable non-controlling interests — — — — 206 — 206 — — 206 Balance at June 30, 2020 $ 6,322 $ 8,200 $ 440 $ 1,032 $ 16,952,056 $ (2,749,989) $ 14,218,061 $ 159,459 $ 191,993 $ 14,569,513 See accompanying notes to condensed consolidated financial statements.Condensed Consolidated Statements of Changes in Equity (Unaudited)(in thousands, except per share data) Par Value Accumulated
Deficit and
Cumulative
Distributions Non-
controlling
Interests
Attributable
to Third Party
Joint VenturesNon-
controlling
Interests
Attributable
to BREIT OP
Unitholders Common
Stock
Class SCommon
Stock
Class ICommon
Stock
Class TCommon
Stock
Class DAdditional
Paid-in
CapitalTotal
Stockholders'
EquityTotal
EquityBalance at December 31, 2020 $ 7,029 $ 9,270 $ 459 $ 1,241 $ 19,059,045 $ (3,224,318) $ 15,852,726 $ 143,253 $ 187,972 $ 16,183,951 Common stock issued 2,180 4,371 44 566 8,511,302 — 8,518,463 — — 8,518,463 Offering costs — — — — (291,617) — (291,617) — — (291,617) Distribution reinvestment 118 125 7 21 323,125 — 323,396 — — 323,396 Common stock/units repurchased (109) (506) (8) (13) (750,252) — (750,888) (129) (1,450) (752,467) Amortization of compensation awards — 2 — — 244 — 246 — 1,869 2,115 Net loss ($538 allocated to redeemable non‑controlling interests) — — — — — (146,285) (146,285) 859 (1,734) (147,160) Distributions declared on common stock ($0.3215 gross per share) — — — — — (637,873) (637,873) — — (637,873) Contributions from non-controlling interests — — — — — — — 16,826 72,466 89,292 Distributions to and redemptions of non-controlling interests — — — — — — — (6,992) (8,973) (15,965) Allocation to redeemable non-controlling interests — — — — (9,650) — (9,650) — — (9,650) Balance at June 30, 2021 $ 9,218 $ 13,262 $ 502 $ 1,815 $ 26,842,197 $ (4,008,476) $ 22,858,518 $ 153,817 $ 250,150 $ 23,262,485 Par Value Accumulated Deficit and
Cumulative
Distributions Non-
controlling
Interests
Attributable
to Third Party
Joint VenturesNon-
controlling
Interests
Attributable
to BREIT OP
Unitholders Common
Stock
Class SCommon
Stock
Class ICommon
Stock
Class TCommon
Stock
Class DAdditional
Paid-in
CapitalTotal
Stockholders'
EquityTotal
EquityBalance at December 31, 2019 $ 5,308 $ 4,743 $ 398 $ 847 $ 11,716,721 $ (1,422,885) $ 10,305,132 $ 157,795 $ 151,721 $ 10,614,648 Common stock issued 1,243 3,713 60 214 5,946,595 — 5,951,825 — — 5,951,825 Offering costs — — — — (126,380) — (126,380) — — (126,380) Distribution reinvestment 99 88 6 15 227,958 — 228,166 — — 228,166 Common stock/units repurchased (328) (346) (24) (44) (812,734) — (813,476) — (1,755) (815,231) Amortization of compensation awards — 2 — — 198 — 200 — 1,000 1,200 Net loss ($1,010 allocated to redeemable non-controlling interests) — — — — — (885,648) (885,648) (208) (11,952) (897,808) Distributions declared on common stock ($0.3169 gross per share) — — — — — (441,456) (441,456) — — (441,456) Contributions from non-controlling interests — — — — — — — 11,171 59,893 71,064 Distributions to and redemptions of non-controlling interests — — — — — — — (9,299) (6,914) (16,213) Allocation to redeemable non-controlling interests — — — — (302) — (302) — — (302) Balance at June 30, 2020 $ 6,322 $ 8,200 $ 440 $ 1,032 $ 16,952,056 $ (2,749,989) $ 14,218,061 $ 159,459 $ 191,993 $ 14,569,513 See accompanying notes to condensed consolidated financial statements.4Blackstone Real Estate Income Trust, Inc.Condensed Consolidated Statements of Cash Flows (Unaudited)(in thousands) Six Months Ended June 30, 2021 2020 Cash flows from operating activities: Net loss $ (147,698) $ (898,818) Adjustments to reconcile net loss to net cash provided by operating activities: Management fee Management fee 165,278 102,925 Performance participation allocation Performance participation allocation 442,588 0 Impairment of investments in real estate Impairment of investments in real estate 0 6,126 Depreciation and amortization 800,008 676,157 Net gain on dispositions of real estate Net gain on dispositions of real estate (22,802) (371) Loss on extinguishment of debt Loss on extinguishment of debt 6,173 1,237 Unrealized (gain) loss on changes in fair value of financial instruments Unrealized (gain) loss on changes in fair value of financial instruments (492,756) 648,455 Income from unconsolidated entities Income from unconsolidated entities (104,710) (38,605) Distributions from unconsolidated entities Distributions from unconsolidated entities 52,215 35,091 Other items Other items (4,895) (23,964) Change in assets and liabilities: (Increase) / decrease in other assets (70,386) (36,825) Increase / (decrease) in due to affiliates (1,880) 5,775 Increase / (decrease) in other liabilities Increase / (decrease) in other liabilities 52,107 7,612 Net cash provided by operating activities 673,242 484,795 Cash flows from investing activities: Acquisitions of real estate (2,087,840) (2,939,159) Capital improvements to real estate (171,046) (144,293) Proceeds from disposition of real estate Proceeds from disposition of real estate 94,977 4,488 Pre-acquisition costs and deposits Pre-acquisition costs and deposits (51,025) (11,671) Investment in unconsolidated entities Investment in unconsolidated entities (364,758) (808,312) Purchase of investments in real estate debt Purchase of investments in real estate debt (1,092,842) (874,326) Proceeds from sale/repayment of investments in real estate debt Proceeds from sale/repayment of investments in real estate debt 321,914 200,533 Purchase of real estate-related equity securities Purchase of real estate-related equity securities (955,601) (463,695) Sale of real estate-related equity securities Sale of real estate-related equity securities 0 102,932 Net cash used in investing activities (4,306,221) (4,933,503) Cash flows from financing activities: Proceeds from issuance of common stock 7,843,419 5,047,278 Offering costs paid (69,527) (48,008) Subscriptions received in advance 2,072,884 175,886 Repurchase of common stock (643,916) (720,157) Repurchase of management fee shares Repurchase of management fee shares (172,230) (76,631) Redemption of redeemable non-controlling interest Redemption of redeemable non-controlling interest (111,949) (83,625) Redemption of affiliate service provider incentive compensation awards Redemption of affiliate service provider incentive compensation awards (1,083) (1,755) Borrowings under mortgage notes, term loans, and secured revolving credit facilities Borrowings under mortgage notes, term loans, and secured revolving credit facilities 737,274 6,108,651 Repayments of mortgage notes, term loans, and secured revolving credit facilities Repayments of mortgage notes, term loans, and secured revolving credit facilities (1,064,309) (5,400,290) Borrowings under secured financings of investments in real estate debt Borrowings under secured financings of investments in real estate debt 0 1,490,542 Repayments of secured financings of investments in real estate debt Repayments of secured financings of investments in real estate debt (1,782,500) (2,216,689) Borrowings under affiliate unsecured revolving credit facility Borrowings under affiliate unsecured revolving credit facility 60,000 175,000 Repayments of affiliate unsecured revolving credit facility Repayments of affiliate unsecured revolving credit facility (60,000) (175,000) Borrowings under unsecured revolving credit facilities Borrowings under unsecured revolving credit facilities 0 130,000 Repayments of unsecured revolving credit facilities Repayments of unsecured revolving credit facilities 0 (130,000) Payment of deferred financing costs (18,119) (31,354) Contributions from non-controlling interests 15,687 22,017 Distributions to and redemptions of non-controlling interests Distributions to and redemptions of non-controlling interests (13,459) (14,251) Distributions (279,488) (189,722) Net cash provided by financing activities 6,512,684 4,061,892 Net change in cash and cash equivalents and restricted cash 2,879,705 (386,816) Cash and cash equivalents and restricted cash, beginning of period 1,044,523 1,109,702 Cash and cash equivalents and restricted cash, end of period $ 3,924,228 $ 722,886 Reconciliation of cash and cash equivalents and restricted cash to the condensed consolidated balance sheets: Reconciliation of cash and cash equivalents and restricted cash to the condensed consolidated balance sheets: Cash and cash equivalents $ 1,680,991 $ 263,067 Restricted cash 2,243,237 459,819 Total cash and cash equivalents and restricted cash $ 3,924,228 $ 722,886 5Non-cash investing and financing activities: Assumption of mortgage notes in conjunction with acquisitions of real estate $ 0 $ 224,123 Assumption of other liabilities in conjunction with acquisitions of real estate $ 12,725 $ 1,482 Assumption of other liabilities in conjunction with acquisitions of investments in unconsolidated entities $ 9,249 $ 0 Accrued pre-acquisition costs $ 5,647 $ 0 Accrued capital expenditures and acquisition related costs $ 12,392 $ 6,920 Accrued distributions $ 35,257 $ 23,814 Accrued stockholder servicing fee due to affiliate $ 223,489 $ 79,593 Redeemable non-controlling interest issued as settlement of performance participation allocation $ 192,648 $ 141,396 Exchange of redeemable non-controlling interest for Class I shares $ 12,246 $ 9,228 Exchange of redeemable non-controlling interest for Class I or Class B units $ 68,453 $ 48,543 Allocation to redeemable non-controlling interest $ 9,650 $ 302 Distribution reinvestment $ 323,396 $ 228,166 Accrued common stock repurchases $ 68,283 $ 52,096 Accrued common stock repurchases due to affiliate $ 0 $ 17,762 Payable for unsettled investments in real estate debt $ 200,263 $ 1,487 Receivable for unsettled investments in real estate debt $ 29,564 $ 0 See accompanying notes to condensed consolidated financial statements. 6See accompanying notes to consolidated financial statements.Notes to Condensed Consolidated Financial Statements(Unaudited)1. Organization and Business PurposeBlackstone Real Estate Income Trust, Inc. (“BREIT” or the “Company”) was formed on November 16, 2015 as a Maryland corporation and intends to qualify as a real estate investment trust (“REIT”) for U.S. federal income tax purposes commencing with the taxable year ending December 31, 2017. The Company was organized to investinvests primarily in stabilized income-oriented commercial real estate in the United States and, to a lesser extent, invest in real estate-related securities.estate debt. The Company is the sole general partner of BREIT Operating Partnership, L.P., a Delaware limited partnership (“BREIT OP”). BREIT Special Limited Partner L.L.C.L.P. (the “Special Limited Partner”), a wholly-owned subsidiary of The Blackstone Group L.P.Inc. (together with its affiliates, “Blackstone”), owns a special limited partner interest in BREIT OP. Substantially all of the Company’s business is conducted through BREIT OP. The Company and BREIT OP are externally managed by BX REIT Advisors L.L.C. (the “Adviser”), an affiliate. The Adviser is part of Blackstone.haswas formed on November 16, 2015 as a Maryland corporation and qualifies as a real estate investment trust (“REIT”) for U.S. federal income tax purposes.As of June 30, 2021, the Company had received aggregate net proceeds of $29.9 billion from selling shares of the Company’s common stock through both the Offering, as defined below, and in unregistered sales. The Company had previously registered with the Securities and Exchange Commission (the “SEC”) 2 offerings for up to an aggregate of $17.0 billion in shares of common stock (the “Previous Offerings”), and accepted gross offering proceeds of $16.3 billion during the period from January 1, 2017 to February 1, 2021. The Company subsequently registered a follow-on offering with the SEC of up to $5.0$24.0 billion in shares of common stock, consisting of up to $4.0$20.0 billion in shares in its primary offering and up to $1.0$4.0 billion in shares pursuant to its distribution reinvestment plan, which the Company began using to offer shares of its common stock in February 2021 (the “Current Offering” and with the Previous Offerings, the “Offering”). The Company intends to sell any combination of four4 classes of shares of its common stock, with a dollar value up to the maximum aggregate amount of the Current Offering. The share classes have different upfront selling commissions, dealer manager fees and ongoing stockholder servicing fees. As of January 1, 2017, the Company had satisfied the minimum offering requirement and the Company’s board of directors authorized the release of proceeds from escrow. As of September 30, 2017, the Company issued and sold 125,491,201 shares of the Company’s common stock (consisting of 98,779,308 Class S shares, 23,277,430 Class I shares, 1,225,700 Class D shares, and 2,208,763 Class T shares). The Company intends to continue selling shares on a monthly basis.As of SeptemberJune 30, 2017,2021, the Company owned 18 investments in real estate and had 24 positions in commercial mortgage-backed securities (“CMBS”).1,463 properties. The Company currently operates in five8 reportable segments: Multifamily,Residential, Industrial, Hotel,Net Lease, Hospitality, Self Storage, Retail, and Retail Properties,Office properties, and Investments in Real Estate-Related Securities.Estate Debt. Residential includes various forms of rental housing including multifamily, student housing and manufactured housing. Net Lease includes the real estate assets of The Bellagio Las Vegas (the “Bellagio”) and the unconsolidated interest in the MGM Grand and Mandalay Bay joint venture. Any additional unconsolidated interests are included in the respective property segment as further described in Note 4 – Investments in Unconsolidated Entities. Financial results by segment are reported in Note 1415 — Segment Reporting.2. Summary of Significant Accounting PoliciesBasis of PresentationThe accompanying unaudited condensed consolidated financial statements have been prepared in accordance with accounting principles generally accepted in the United States of America (“GAAP”) for interim financial information and the instructions to Form 10-Q and Rule 10-01 of Regulation S-X. All intercompany transactions have been eliminated in consolidation. The condensed consolidated financial statements, including the condensed notes thereto, are unaudited and exclude some of the disclosures required in audited financial statements. Management believes it has made all necessary adjustments, consisting of only normal recurring items, so that the condensed consolidated financial statements are presented fairly and that estimates made in preparing itsthe Company's condensed consolidated financial statements are reasonable and prudent. The accompanying unaudited condensed consolidated interim financial statements should be read in conjunction with the audited consolidated financial statements included in the Company’s Annual Report on Form 10-K for the fiscal year ended December 31, 20162020 filed with the SEC.The accompanying condensed consolidated financial statements include the accounts of the Company, ourthe Company’s subsidiaries, and joint ventures in which we havethe Company has a controlling interest. All intercompany balances and transactions have been eliminated in consolidation.Principles of ConsolidationThe Company consolidates all entities in which it has a controlling financial interest through majority ownership or voting rights and variable interest entities whereby the Company is the primary beneficiary. In determining whether the Company has a controlling financial interest in a partially owned entity and the requirement to consolidate the accounts of that entity, the Company considers whether the entity is a variable interest entity (“VIE”) and whether it is the primary beneficiary. The Company is the primary beneficiary of a VIE when it has (i) the power to direct the most significant activities impacting the economic performance of the VIE and (ii) the obligation to absorb losses or receive benefits significant to the VIE. Entities that do not qualify as VIEs are generally7considered voting interest entities (“VOEs”) and are evaluated for consolidation under the voting interest model. VOEs are consolidated when the Company controls the entity through a majority voting interest or other means. When the requirements for consolidation are not met and the Company has significant influence over the operations of the entity, the investment is accounted for under the equity method of accounting. Equity method investments for which the Company has not elected a fair value option are initially recorded at cost and subsequently adjusted for the Company’s pro-rata share of net income, contributions and distributions. When the Company elects the fair value option (“FVO”), the Company records its share of net asset value of the Entity and any related unrealized gains and losses.BREIT OP and each of the Company’s joint ventures are considered to be either a VIE or VOE. The Company consolidates these entities, excluding their equity method investments, because it has the ability to direct the most significant activities of the entities such as purchases, dispositions, financings, budgets, and overall operating plans.For consolidated joint ventures, the non-controlling partner’s share of the assets, liabilities, and operations of theeach joint venturesventure is included in non-controlling interests as equity of the Company. The non-controlling partner’s interest is generally computed as the joint venture partner’s ownership percentage.As of June 30, 2021, the total assets and liabilities of the Company’s consolidated VIEs, excluding BREIT OP, were $12.1 billion and $7.9 billion, respectively, compared to $11.5 billion and $8.0 billion as of December 31, 2020. Such amounts are included on the Company’s Condensed Consolidated Balance Sheets.Certain of the Company’s joint ventures are accounted for under the equity method of accounting as the requirements for consolidation are not met. As of June 30, 2021, the Company did not consolidate 3 of its joint ventures and accounted for these under the equity method of accounting. The Company has elected the FVO for 2 of its equity method investments while the third is presented at historical cost. Refer to Note 4 for additional details on the Company’s investments in unconsolidated entities.Use of EstimatesThe preparation of the condensed consolidated financial statements in conformity with GAAP requires management to make estimates and assumptions that affect the reported amounts of assets and liabilities and disclosure of contingent assets and liabilities as of the date of the condensed consolidated financial statements and the reported amounts of revenue and expenses during the reporting period. As of June 30, 2021, the novel coronavirus (“COVID-19”) pandemic is ongoing. During 2020, the COVID-19 pandemic created disruption in global supply chains, increased rates of unemployment and adversely impacted many industries. In 2021, the global economy has, with certain setbacks, begun reopening and wider distribution of vaccines will likely encourage greater economic activity. Nevertheless, there is continued uncertainty regarding the trajectory of a continuing recovery, particularly given the strength of the Delta variant. Accordingly, this recovery remains uneven with dispersion across sectors and regions. The Company believes the estimates and assumptions underlying its condensed consolidated financial statements are reasonable and supportable based on the information available as of June 30, 2021. However, uncertainty over the ultimate impact COVID-19 will have on the global economy generally, and the Company’s business in particular, makes any estimates and assumptions as of June 30, 2021 inherently less certain than they would be absent the current and potential impacts of COVID-19. Actual results may ultimately differ from those estimates.Fair Value MeasurementsUnder normal market conditions, the fair value of an investment is the amount that would be received to sell an asset or transfer a liability in an orderly transaction between market participants at the measurement date (i.e., the exit price). The Company uses a hierarchical framework that prioritizes and ranks the level of market price observability used in measuring investments at fair value. Market price observability is impacted by a number of factors, including the type of investment and the characteristics specific to the investment, and the state of the marketplace, including the existence and transparency of transactions between market participants. Investments with readily available actively quoted prices or for which fair value can be measured from actively quoted prices generally will have a higher degree of market price observability and a lesser degree of judgment used in measuring fair value.Investments measured and reported at fair value are classified and disclosed in one of the following levels within the fair value hierarchy:Level 1 — quoted prices are available in active markets for identical investments as of the measurement date. The Company does not adjust the quoted price for these investments.Level 2 — quoted prices are available in markets that are not active or model inputs are based on inputs that are either directly or indirectly observable as of the measurement date.8Level 3 — pricing inputs are unobservable and include instances where there is minimal, if any, market activity for the investment. These inputs require significant judgment or estimation by management or third parties when determining fair value and generally represent anything that does not meet the criteria of Levels 1 and 2. Due to the inherent uncertainty of these estimates, these values may differ materially from the values that would have been used had a ready market for these investments existed.Valuation of assets and liabilities measured at fair valueThe Company’s investments in real estate debt are reported at fair value. As of June 30, 2021 and December 31, 2020, the Company’s investments in real estate debt consisted of commercial mortgage-backed securities (“CMBS”) and residential mortgage-backed securities (“RMBS”), which are securities backed by one or more mortgage loans secured by real estate assets, as well as corporate bonds, term loans, mezzanine loans, and other loans to real estate-related companies or secured by real estate assets. The Company generally determines the fair value of its investments in real estate debt by utilizing third-party pricing service providers whenever available. In determining the fair value of a particular investment, pricing service providers may use broker-dealer quotations, reported trades or valuation estimates from their internal pricing models to determine the reported price. The pricing service providers’ internal models for securities such as real estate debt generally consider the attributes applicable to a particular class of the security (e.g., credit rating, seniority), current market data, and estimated cash flows for each security, and incorporate specific collateral performance, as applicable.Certain of the Company’s investments in real estate debt, such as mezzanine loans, are unlikely to have readily available market quotations. In such cases, the Company will generally determine the initial value based on the acquisition price of such investment if acquired by the Company or the par value of such investment if originated by the Company. Following the initial measurement, the Company will determine fair value by utilizing or reviewing certain of the following (i) market yield data, (ii) discounted cash flow modeling, (iii) collateral asset performance, (iv) local or macro real estate performance, (v) capital market conditions, (vi) debt yield or loan-to-value ratios, and (vii) borrower financial condition and performance.The Company’s investments in equity securities of public and private real estate-related companies are reported at fair value. As such, the resulting unrealized gains and losses are recorded as a component of Other Income (Expense) on the Company’s Condensed Consolidated Statements of Operations. During the three and six months ended June 30, 2021, the Company recognized $142.5 million and $224.8 million of unrealized gains, respectively, on its investments in equity securities. During the three and six months ended June 30, 2020, the Company recognized $11.9 million of unrealized gains and $25.2 million of unrealized losses, respectively, on its investments in equity securities.In determining the fair value of public equity securities, the Company utilizes the closing price of such securities in the principal market in which the security trades (Level 1 inputs). The Company’s investment in a preferred equity security is reflected at its fair value as of June 30, 2021 (Level 2 inputs). In determining the fair value, the Company utilizes inputs such as stock volatility, discount rate, and risk-free interest rate. The Company's investment in a private real estate company is reflected at its fair value as of June 30, 2021 (Level 3 inputs). To determine the fair value, the Company utilizes inputs such as the multiples of comparable companies and select financial statement metrics. As of June 30, 2021 and December 31, 2020, the Company’s $1.8 billion and $0.6 billion of equity securities, respectively, were recorded as a component of Other Assets on the Company’s Condensed Consolidated Balance Sheets.The Company has elected the FVO for 2 of its equity method investments and therefore, reports these investments at fair value. As such, the resulting unrealized gains and losses are recorded as a component of Income From Unconsolidated Entities on the Company’s Condensed Consolidated Statements of Operations. The Company separately values the assets and liabilities of the equity method investments. To determine the fair value of the assets of the equity method investments, the Company utilizes a discounted cash flow methodology, taking into consideration various factors including discount rate and exit capitalization rate. The Company determines the fair value of the indebtedness of the equity method investment by modeling the cash flows required by the debt agreements and discounting them back to the present value using an estimated market yield. Additionally, the Company considers current market rates and conditions by evaluating similar borrowing agreements with comparable loan-to-value ratios and credit profiles. After the fair value of the assets and liabilities are determined, the Company applies its ownership interest to the net asset value and reflects this amount as its equity method investment at fair value. The inputs used in determining the Company’s equity method investments carried at fair value are considered Level 3.The Company’s derivative financial instruments are reported at fair value. As of June 30, 2021 and December 31, 2020, the Company’s derivative financial instruments consisted of foreign currency and interest rate contracts. The fair values of the Company’s foreign currency and interest rate contracts were estimated using advice from a third-party derivative specialist, based on contractual cash flows and observable inputs comprising yield curves, foreign currency rates and credit spreads (Level 2 inputs).9The following table details the Company’s assets and liabilities measured at fair value on a recurring basis ($ in thousands):June 30, 2021 December 31, 2020 Level I Level 2 Level 3 Total Level I Level 2 Level 3 Total Assets: Investments in real estate debt $ 0 $ 5,554,513 $ 174,865 $ 5,729,378 $ 0 $ 4,445,414 $ 120,892 $ 4,566,306 Equity securities 1,338,420 338,400 119,341 1,796,161 327,935 271,250 0 599,185 Investments in unconsolidated entities 0 0 422,616 422,616 0 0 0 0 Derivatives 0 24,817 0 24,817 0 0 0 0 Total $ 1,338,420 $ 5,917,730 $ 716,822 $ 7,972,972 $ 327,935 $ 4,716,664 $ 120,892 $ 5,165,491 Liabilities: Derivatives $ 0 $ 27,664 $ 0 $ 27,664 $ 0 $ 55,536 $ 0 $ 55,536 Total $ 0 $ 27,664 $ 0 $ 27,664 $ 0 $ 55,536 $ 0 $ 55,536 The following table details the Company’s assets measured at fair value on a recurring basis using Level 3 inputs ($ in thousands):Investments in
Real Estate DebtInvestments in
Unconsolidated EntitiesEquity Securities(1)Total Balance as of December 31, 2020 $ 120,892 $ 0 $ 0 $ 120,892 Purchases 46,550 374,007 119,341 539,898 Distributions 0 (5,619) 0 (5,619) Included in net income Unrealized gain included in income from unconsolidated entities 0 54,228 0 54,228 Discount accretion included in income (loss) from investments in real estate debt 728 0 0 728 Unrealized gain included in income (loss) from investments in real estate debt 6,695 0 0 6,695 Balance as of June 30, 2021 $ 174,865 $ 422,616 $ 119,341 $ 716,822 (1)Based on the Company's analysis, there was no adjustment to the fair value as of June 30, 2021.The following tables contain the quantitative inputs and assumptions used for items categorized in Level 3 of the fair value hierarchy ($ in thousands):June 30, 2021 Fair Value Valuation Technique Unobservable Inputs Weighted Average Impact to Valuation from an Increase in Input Investments in real estate debt $ 174,865 Discounted cash flow Yield 8.1% Decrease Investments in unconsolidated entities $ 422,616 Discounted cash flow Discount Rate 6.6% Decrease Exit Capitalization Rate 4.6% Decrease Weighted Average Cost of Capital 12.0% Decrease Equity securities $ 119,341 Market comparable Enterprise Value/
Forward EBITDA Multiple19.7x Increase December 31, 2020 Fair Value Valuation Technique Unobservable Input Rate Impact to Valuation from an Increase in Input Investments in real estate debt $ 120,892 Discounted cash flow Yield 10.3% Decrease 10Valuation of liabilities not measured at fair valueAs of June 30, 2021, the fair value of the Company’s mortgage notes, term loans, and secured revolving credit facilities, secured financings on investments in real estate debt, and unsecured revolving credit facilities was $53.1 million above carrying value. As of December 31, 2020, the fair value of the Company’s mortgage notes, term loans, and secured revolving credit facilities, secured financings on investments in real estate debt, and unsecured revolving credit facilities was $48.6 million above carrying value. Fair value of the Company’s indebtedness is estimated by modeling the cash flows required by the Company’s debt agreements and discounting them back to the present value using an estimated market yield. Additionally, the Company considers current market rates and conditions by evaluating similar borrowing agreements with comparable loan-to-value ratios and credit profiles. The inputs used in determining the fair value of the Company’s indebtedness are considered Level 3.Derivative Financial InstrumentsAs of June 30, 2021 and December 31, 2020, all of the Company’s derivative instruments were non-designated hedges. The Company presents changes in the fair value of its non-designated hedges as a component of Income (loss) from Investments in Real Estate Debt or Other Income (Expense) on the Company’s Condensed Consolidated Statements of Operations depending on the nature of the derivative instrument.The Company has elected to not offset derivative assets and liabilities or financial assets in its Condensed Consolidated Balance Sheets, including cash, that may be received or paid as part of collateral arrangements, even when an enforceable master netting agreement is in place that provide the Company, in the event of counterparty default, the right to liquidate collateral and the right to offset a counterparty’s rights and obligations. Derivative financial instruments are recorded as a component of either Other Assets or Other Liabilities on the Company’s Condensed Consolidated Balance Sheets at fair value.Stock-Based CompensationThe Company’s stock-based compensation consists of incentive compensation awards issued to certain employees of affiliate portfolio company service providers and certain employees of Simply Self Storage, a wholly owned subsidiary of BREIT. Such awards vest over the life of the awards and stock-based compensation expense is recognized for these awards on a straight-line basis over the applicable vesting period of each award, based on the value of the awards on their grant date, as adjusted for forfeitures. Refer to Note 9 for additional information on the awards issued to certain employees of the affiliate portfolio companies.On January 1, 2021, the Company issued awards to certain employees of Simply Self Storage which had a grant date fair value of $3.6 million. The Simply Self Storage awards are subject to certain performance conditions and a four-year service period. As such, if the Company determines it is probable that the performance conditions will be met, the value of the award will be amortized over the four-year service period, as adjusted for forfeitures. As of June 30, 2021, the Company determined it was probable that the performance conditions will be met. During the three and six months ended June 30, 2021, the Company recorded $0.2 million and $0.4 million, respectively, of compensation expense related to such awards, which was included as a component of Rental Property Operating Expense in the Company’s Condensed Consolidated Statements of Operations. As of June 30, 2021, the total unrecognized compensation cost relating to the Simply Self Storage awards was $3.2 million and is expected to be recognized over a period of 3.5 years from June 30, 2021.Recent Accounting PronouncementsIn April 2020, the Financial Accounting Standards Board (“FASB”) staff issued a question and answer document (the “Lease Modification Q&A”) focused on the application of lease accounting guidance to lease concessions provided as a result of the COVID-19 pandemic. In accordance with the Lease Modification Q&A, the Company has made a policy election to not account for concessions as a lease modification if the total cash flows after the lease concessions are substantially the same, or less than, the cash flows in the original lease. However, if in the future, a concession is granted that modifies the terms and significantly alters the cash flows of the original lease, the Company will account for the changes as a lease modification. The Company has granted concessions as a result of the COVID-19 pandemic to certain tenants to defer rental payments until a later date. The Company continued to recognize rental revenue for such tenants during the six months ended June 30, 2021, while also considering any necessary bad debt reserves.In March 2020, the FASB issued Accounting Standards Update (“ASU”) 2020-04 “Reference Rate Reform (Topic 848): Facilitation of the Effects of Reference Rate Reform on Financial Reporting.” ASU 2020-04 provides optional expedients and exceptions to GAAP requirements for modifications on debt instruments, leases, derivatives, and other contracts, related to the expected market transition from LIBOR, and certain other floating rate benchmark indices (collectively, “IBORs”) to alternative reference rates. ASU 2020-04 generally considers contract modifications related to reference rate reform to be an event that does not require contract remeasurement at the modification date nor a reassessment of a previous accounting determination. In January 2021, the FASB issued11ASU 2021-01 “Reference Rate Reform (Topic 848): Scope,” or ASU 2021-01. ASU 2021-01 clarifies that the practical expedients in ASU 2020-04 apply to derivatives impacted by changes in the interest rate used for margining, discounting, or contract price alignment. The guidance in ASU 2020-04 is optional and may be elected over time, through December 31, 2022, as reference rate reform activities occur. Once ASU 2020-04 is elected, the guidance must be applied prospectively for all eligible contract modifications. The Company has not adopted any of the optional expedients or exceptions as of June 30, 2021, but will continue to evaluate the possible adoption of any such expedients or exceptions during the effective period as circumstances evolve.3. Investments in Real EstateInvestments in real estate, net consisted of the following ($ in thousands):June 30, 2021 December 31, 2020 Building and building improvements $ 27,744,892 $ 25,991,610 Land and land improvements 7,876,089 7,626,381 Furniture, fixtures and equipment 560,464 495,395 Right of use asset - operating leases(1)114,535 114,535 Right of use asset - financing leases(1)56,008 56,008 Total 36,351,988 34,283,929 Accumulated depreciation and amortization (2,400,600) (1,826,216) Investments in real estate, net $ 33,951,388 $ 32,457,713 (1)Refer to Note 14 for additional details on the Company’s leases.AcquisitionsDuring the six months ended June 30, 2021, the Company acquired interests in 15 real estate investments for $2.1 billion, which comprised 17 residential properties, 28 industrial properties, and 1 office property.The following table details the properties acquired during the six months ended June 30, 2021 ($ in thousands):Segments Number of Transactions Number of Properties Sq. Ft. (in thousands)/Units Purchase Price(1)Residential properties 11 17 6,092 units $ 1,313,475 Industrial properties 3 28 3,556 sq.ft. 529,895 Office properties 1 1 361 sq.ft. 251,171 15 46 $ 2,094,541 (1)Purchase price is inclusive of acquisition-related costs.The following table details the purchase price allocation for the properties acquired during the six months ended June 30, 2021 ($ in thousands):Amount Building and building improvements $ 1,647,231 Land and land improvements 311,249 Furniture, fixtures and equipment 43,150 In-place lease intangibles 97,399 Above-market lease intangibles 310 Below-market lease intangibles (4,798) Total purchase price 2,094,541 Assumed mortgage notes(1)0 Net purchase price $ 2,094,541 (1)Refer to Note 6 for additional details on the Company’s mortgage notes.12The weighted-average amortization periods for the acquired in-place lease intangibles, above-market lease intangibles, and below-market lease intangibles of the properties acquired during the six months ended June 30, 2021 were six, four, and seven years, respectively.DispositionsThe following table details the dispositions during the three and six months ended June 30, 2021 and 2020 ($ in thousands):Three Months Ended
June 30, 2021Six Months Ended
June 30, 2021Segments Number of Properties Net Proceeds Net Gain Number of Properties Net Proceeds Net Gain Residential properties 1 $ 21,054 $ 7,372 5 $ 94,977 $ 22,802 1 $ 21,054 $ 7,372 5 $ 94,977 $ 22,802 Three Months Ended
June 30, 2020Six Months Ended
June 30, 2020Segments Number of Properties Net Proceeds Net Gain Number of Properties Net Proceeds Net Gain Industrial properties 0 $ 0 $ 0 1 $ 4,488 $ 371 0 $ 0 $ 0 1 $ 4,488 $ 371 Properties Held for SaleAs of June 30, 2021, 1 residential property was classified as held for sale. There were 0 properties classified as held for sale as of December 31, 2020. The held for sale assets and liabilities are components of Other Assets and Other Liabilities, respectively, on the Condensed Consolidated Balance Sheets.The following table details the assets and liabilities of the Company’s properties classified as held for sale ($ in thousands):Assets: June 30, 2021 Investments in real estate, net $ 13,654 Other assets 1,356 Total assets $ 15,010 Liabilities: Mortgage notes $ 0 Other liabilities 145 Total liabilities $ 145 ImpairmentThe Company reviews its real estate investments for impairment each quarter or when there is an event or change in circumstances that indicates an impaired value. If the GAAP depreciated cost basis of a real estate investment exceeds the expected undiscounted future cash flows of such real estate investment, the investment is considered impaired and the GAAP depreciated cost basis is reduced to the estimated fair value of the investment. During the three and six months ended June 30, 2021, the Company did 0t recognize any impairments. During the three and six months ended June 30, 2020, the Company recognized a $6.1 million impairment charge on one of its hotel properties. The impairment charge was a result of updates to the undiscounted cash flow assumptions for such asset to reflect a decrease in occupancy and future cash flows as a result of the COVID-19 pandemic.4. Investments in Unconsolidated EntitiesThe Company holds three investments in joint ventures that it accounts for under the equity method of accounting, as the Company’s ownership interest in each joint venture does not meet the requirements for consolidation. The joint ventures are owned by the Company and other institutional investors or public companies and include 52 industrial properties and 2 net lease properties. Refer to Note 2 for additional details.13The following table details the Company’s equity investment in unconsolidated entities as of June 30, 2021 and December 31, 2020 ($ in thousands):Joint Venture Segment Ownership
InterestJune 30, 2021 December 31, 2020 MGM Grand & Mandalay Bay(1)Net Lease 49.9% $ 819,915 $ 816,220 WC Infill Industrial Portfolio(2)Industrial 85.0% 249,648 0 Vault Industrial Portfolio(2)Industrial 41.0% 172,968 0 Total $ 1,242,531 $ 816,220 (1)Includes $9.3 million and $9.4 million of BREIT outside basis attributable to the MGM Grand & Mandalay Bay joint venture as of June 30, 2021 and December 31, 2020, respectively.(2)The Company elected the fair value option for these investments, which are therefore recorded at their estimated fair value. The following table details the Company’s income from unconsolidated entities for the three and six months ended June 30, 2021 ($ in thousands):Three Months Ended June 30, 2021 Joint Venture Ownership
InterestTotal
Revenue of Unconsolidated Joint VenturesNet Income of Unconsolidated Joint Ventures BREIT's
ShareAmortization of Outside Basis BREIT
Income from Unconsolidated EntitiesMGM Grand & Mandalay Bay 49.9% $ 98,681 $ 50,445 $ 25,171 $ (35) $ 25,136 WC Infill Industrial Portfolio(1)85.0% 0 0 0 0 25,977 Vault Industrial Portfolio(1)41.0% 0 0 0 0 18,915 Total $ 70,028 Six Months Ended June 30, 2021 Joint Venture Ownership
InterestTotal
Revenue of Unconsolidated Joint VenturesNet Income of Unconsolidated Joint Ventures BREIT's
ShareAmortization of Outside Basis BREIT
Income from Unconsolidated EntitiesMGM Grand & Mandalay Bay 49.9% $ 197,363 $ 101,313 $ 50,555 $ (73) $ 50,482 WC Infill Industrial Portfolio(1)85.0% 0 0 0 0 31,336 Vault Industrial Portfolio(1)41.0% 0 0 0 0 22,892 Total $ 104,710 (1)The Company elected the fair value option for these investments. Therefore, the income from unconsolidated entities represents the change in estimated fair value of the Company’s investment in such entities.The following table details the Company’s income from unconsolidated entities for the three and six months ended June 30, 2020 ($ in thousands):Three Months Ended June 30, 2020 Joint Venture Ownership
InterestTotal
RevenueNet Income of Unconsolidated Joint Ventures BREIT's
ShareAmortization of Outside Basis BREIT
Income from Unconsolidated EntitiesMGM Grand & Mandalay Bay 49.9% $ 98,681 $ 50,847 $ 25,373 $ (37) $ 25,336 Six Months Ended June 30, 2020 Joint Venture Ownership
InterestTotal
RevenueNet Income of Unconsolidated Joint Ventures BREIT's
ShareAmortization of Outside Basis BREIT
Income from Unconsolidated EntitiesMGM Grand & Mandalay Bay 49.9% $ 149,118 $ 77,479 $ 38,662 $ (57) $ 38,605 145. Investments in Real Estate DebtThe following tables detail the Company’s investments in real estate debt ($ in thousands):June 30, 2021 Type of Security/Loan WeightedAverageCoupon(1)WeightedAverageMaturity Date(2)Face
AmountCost
BasisFair
ValueCMBS(3)L+2.5% 9/25/2025 $ 5,013,759 $ 4,869,931 $ 4,887,941 Corporate bonds L+4.2% 10/21/2027 161,861 161,149 164,149 RMBS 3.9% 8/27/2031 52,291 52,446 52,597 Total real estate securities 3.4% 11/11/2025 5,227,911 5,083,526 5,104,687 Term loans L+3.1% 9/9/2021 451,274 418,725 449,826 Mezzanine loans L+6.3% 1/28/2025 183,750 181,701 174,865 Total real estate loans L+4.0% 8/21/2022 635,024 600,426 624,691 Total investments in real estate debt 3.5% 7/5/2025 $ 5,862,935 $ 5,683,952 $ 5,729,378 December 31, 2020 Type of Security/Loan WeightedAverageCoupon(1)WeightedAverageMaturity Date(2)Face
AmountCost
BasisFair
ValueCMBS(3)L+2.0% 1/17/2026 $ 4,093,201 $ 3,949,824 $ 3,753,428 Corporate bonds 5.0% 5/3/2027 179,398 178,219 183,203 RMBS 4.5% 10/24/2049 22,429 22,602 22,510 Total real estate securities 3.2% 3/29/2026 4,295,028 4,150,645 3,959,141 Term loans L+3.1% 1/7/2022 488,824 438,445 486,273 Mezzanine loans L+6.9% 12/15/2024 134,750 134,424 120,892 Total real estate loans L+3.8% 8/8/2022 623,574 572,869 607,165 Total investments in real estate debt 3.5% 10/3/2025 $ 4,918,602 $ 4,723,514 $ 4,566,306 (1)The term “L” refers to the relevant floating benchmark rates, which include USD LIBOR, GBP LIBOR, EURIBOR and SONIA, as applicable to each security and loan. Fixed rate CMBS are reflected as a spread over the relevant floating benchmark rates, as of June 30, 2021 and December 31, 2020, respectively, for purposes of the weighted-averages. Weighted Average Coupon for CMBS does not include zero coupon securities.(2)Weighted average maturity date is based on the fully extended maturity date of the instrument or, in the case of CMBS and RMBS, the underlying collateral.(3)Face amount excludes interest-only securities with a notional amount of $2.8 billion and $2.3 billion as of June 30, 2021 and December 31, 2020, respectively. In addition, CMBS includes zero coupon securities of $208.8 million and $236.1 million as of June 30, 2021 and December 31, 2020, respectively.The following table details the collateral type of the properties securing the Company’s investments in real estate debt ($ in thousands): June 30, 2021 December 31, 2020 Collateral(1)Cost
BasisFair
ValuePercentage Based on Fair Value Cost
BasisFair
ValuePercentage Based on Fair Value Hospitality $ 2,252,404 $ 2,231,066 39% $ 2,046,529 $ 1,904,256 42% Residential 1,189,590 1,244,355 22% 748,086 797,840 17% Industrial 903,524 916,248 16% 612,884 610,504 13% Office 754,007 738,429 13% 720,665 681,596 15% Other 238,202 236,325 4% 238,202 213,654 5% Diversified 221,907 225,246 4% 234,527 225,077 5% Net Lease 106,943 121,077 2% 105,246 117,219 3% Retail 17,375 16,632 0% 17,375 16,160 0% Total $ 5,683,952 $ 5,729,378 100% $ 4,723,514 $ 4,566,306 100% 15(1)Residential investments in real estate debt are collateralized by various forms of rental housing including apartments and single-family homes.The following table details the credit rating of the Company’s investments in real estate debt ($ in thousands): June 30, 2021 December 31, 2020 Credit Rating Cost
BasisFair
ValuePercentage Based on Fair Value Cost
BasisFair
ValuePercentage Based on Fair Value AAA $ 13,405 $ 13,369 0% $ 10,044 $ 10,047 0% AA 710 710 0% 776 779 0% A 257,359 272,447 5% 262,097 267,023 6% BBB 821,502 819,972 14% 797,918 753,393 17% BB 1,536,903 1,546,976 27% 1,435,891 1,381,221 30% B 1,407,974 1,394,523 24% 1,186,975 1,114,977 24% CCC 35,165 36,059 1% 32,402 34,839 1% Other 1,610,934 1,645,322 29% 997,411 1,004,027 22% Total $ 5,683,952 $ 5,729,378 100% $ 4,723,514 $ 4,566,306 100% During the three and six months ended June 30, 2021, the Company recorded a net unrealized gain of $72.8 million and $202.7 million, respectively, related to investments in real estate debt. During the three and six months ended June 30, 2020, the Company recorded a net unrealized gain of $466.4 million and a net unrealized loss $548.7 million, respectively, related to investments in real estate debt. Such unrealized gains and losses were recorded as a component of Income from Investments in Real Estate Debt on the Company’s Condensed Consolidated Statements of Operations.During the three and six months ended June 30, 2021, the Company recognized a net realized gain of $11.9 million and $14.5 million, respectively, due to the sale, repayment, or partial repayment of certain of the Company’s investments in real estate debt. During the three and six months ended June 30, 2020, the Company recognized a net realized loss of $5.0 million and $4.7 million, respectively, due to the sale, repayment, or partial repayment of certain of the Company’s investments in real estate debt.The Company’s investments in real estate debt included certain CMBS and loans collateralized by properties owned by Blackstone-advised investment vehicles. The following table details the Company’s investments in affiliated real estate debt ($ in thousands): Fair Value Income (Loss) Three Months Ended June 30, Six Months Ended June 30, June 30, 2021 December 31, 2020 2021 2020 2021 2020 CMBS $ 1,759,738 $ 1,749,877 $ 32,969 $ 199,457 $ 102,312 $ (183,971) Loans 566,369 545,539 14,473 16,766 (4,099) 9,992 Total $ 2,326,107 $ 2,295,416 $ 47,442 $ 216,223 $ 98,213 $ (173,979) For additional information regarding the Company’s investments in affiliated real estate debt, see Note 5 to the consolidated financial statements in the Company’s Annual Report on Form 10-K for the year ended December 31, 2020. The terms and conditions of such affiliated real estate debt held as of June 30, 2021 are consistent with the terms described in such Note.As of June 30, 2021 and December 31, 2020, the Company’s investments in real estate debt also included $292.3 million and $179.6 million, respectively, of CMBS collateralized, in part, by certain of the Company’s mortgage notes. The Company recognized $11.4 million and $18.3 million of income related to such CMBS during the three and six months ended June 30, 2021, respectively. The Company recognized $24.5 million of income and $16.6 million of loss related to such CMBS during the three and six months ended June 30, 2020, respectively.166. Mortgage Notes, Term Loans, and Secured Revolving Credit FacilitiesThe following table details the mortgage notes, term loans, and secured revolving credit facilities secured by the Company’s real estate ($ in thousands): June 30, 2021 Principal Balance Outstanding Indebtedness WeightedAverageInterest Rate(1)WeightedAverageMaturity Date (2)(3)Maximum
Facility SizeJune 30, 2021 December 31, 2020 Fixed rate loans: Fixed rate mortgages 3.8% 8/26/2027 N/A $ 13,006,707 $ 13,124,595 Variable rate loans: Floating rate mortgages L+1.8% 5/25/2026 N/A 4,914,122 4,544,044 Variable rate term loans L+1.7% 3/18/2024 N/A 1,795,520 1,761,920 Variable rate secured revolving credit facilities 0 — $ 2,185,344 0 481,725 Variable rate mezzanine loans L+3.5% 3/9/2025 N/A 71,100 202,200 Total variable rate loans L+1.8% 10/21/2025 6,780,742 6,989,889 Total loans secured by real estate 3.1% 1/7/2027 19,787,449 20,114,484 Premium on assumed debt, net 14,214 15,191 Deferred financing costs, net (139,653) (153,514) Mortgage notes, term loans, and secured revolving credit facilities, net $ 19,662,010 $ 19,976,161 (1)The term “L” refers to the one-month LIBOR. (2)For loans where the Company, at its sole discretion, has extension options, the maximum maturity date has been assumed.(3)The majority of the Company’s mortgages contain yield or spread maintenance provisions.The following table details the future principal payments due under the Company’s mortgage notes, term loans, and secured revolving credit facilities as of June 30, 2021 ($ in thousands):Year Amount 2021 (remaining) $ 5,814 2022 523,256 2023 491,796 2024 3,042,855 2025 4,126,110 2026 3,564,585 Thereafter 8,033,033 Total $ 19,787,449 During the three and six months ended June 30, 2021 and 2020, the Company repaid certain of its loans at their carrying value in conjunction with the sale of the underlying property or a refinancing. As such, the Company incurred a realized loss on extinguishment of debt of $2.8 million and $6.2 million, respectively, for the three and six months ended June 30, 2021. The Company did 0t incur any realized loss on extinguishment of debt for the three months ended June 30, 2020, and incurred a realized loss of $1.2 million for the six months ended June 30, 2020. Such losses result from the acceleration of related deferred financing costs, prepayment penalties, and transactions costs and are recorded on the Company’s Condensed Consolidated Statements of Operations.The Company is subject to various financial and operational covenants under certain of its mortgage notes, term loans, and secured revolving credit facility agreements. These covenants require the Company to maintain certain financial ratios, which may include leverage, debt yield, and debt service coverage, among others. As of June 30, 2021, the Company believes it was in compliance with all of its loan covenants that could result in a default under such agreements, and with respect to the other financial ratio-based covenants, the Company has provided limited guarantees to allow the applicable collateral real estate to continue to distribute their cash flow to the Company.7. Secured Financings of Investments in Real Estate DebtThe Company has entered into master repurchase agreements and other financing agreements with lenders to provide additional financing capacity secured by certain of its investments in real estate debt. The terms of the master repurchase agreements and other financing agreements provide the lenders the ability to determine the size and terms of the financing provided based upon the17particular collateral pledged by the Company from time-to-time, and may require the Company to provide additional margin in the form of cash, securities, or other forms of collateral should the market value of the pledged investments decline. The following tables detail the Company’s secured financings of investments in real estate debt ($ in thousands): June 30, 2021 Borrowing's Outstanding Collateral Assets(1)Weighted AverageInterest Rate (2)Weighted Average Maturity Date CMBS $ 96,120 $ 158,543 L+1.2% 2/18/2023 Term Loan 254,478 391,504 L+1.8% 4/2/2022 $ 350,598 $ 550,047 L+1.6% December 31, 2020 Borrowing's Outstanding Collateral Assets(1)Weighted AverageInterest Rate (2)Weighted Average Maturity Date CMBS $ 1,733,623 $ 2,697,714 L+1.6% 6/21/2021 Term Loans 292,406 452,578 L+1.8% 3/17/2022 Corporate Bonds 111,540 138,215 L+0.8% 3/6/2021 RMBS 3,424 4,646 L+1.5% 3/30/2021 $ 2,140,993 $ 3,293,153 L+1.6% (1)Represents the fair value of the Company’s investments in real estate debt that serve as collateral.(2) The term “L” refers to the relevant floating benchmark rates, which include USD LIBOR, GBP LIBOR and EURIBOR, as applicable to each secured financing.8. Unsecured Revolving Credit FacilitiesThe Company is party to an unsecured revolving credit facility with multiple banks. The credit facility expires on February 22, 2024 and may be extended for one year. Interest under the credit facility is determined based on LIBOR plus 2.5%. As of June 30, 2021, the capacity of the credit facility was $1.9 billion. As of December 31, 2020, the Company had a $23.5 million letter of credit outstanding, which reduced the available capacity of the unsecured credit facility. NaN such letter of credit was outstanding as of June 30, 2021. There were 0 other outstanding borrowings on the unsecured credit facility as of June 30, 2021 and December 31, 2020.The Company also maintains a $100.0 million unsecured revolving credit facility with an affiliate of Blackstone of which there was 0 outstanding balance as of June 30, 2021 or December 31, 2020. For additional information regarding the affiliate credit facility, see Note 8 to the consolidated financial statements in the Company’s Annual Report on Form 10-K for the year ended December 31, 2020.9. Related Party TransactionsDue to AffiliatesThe following table details the components of due to affiliates ($ in thousands):June 30, 2021 December 31, 2020 Accrued stockholder servicing fee $ 828,900 $ 605,411 Performance participation allocation 442,588 192,648 Accrued management fee 33,549 22,253 Accrued affiliate service provider expenses 8,261 10,151 Advanced organization and offering costs 3,068 4,090 Other 2,273 53,107 Total $ 1,318,639 $ 887,660 18Accrued Stockholder Servicing FeeThe Company accrues the full amount of the future stockholder servicing fees payable to Blackstone Securities Partners L.P. (the “Dealer Manager”), a registered broker dealer affiliated with the Adviser, for Class S, Class T, and Class D shares up to the 8.75% of gross proceeds limit at the time such shares are sold. The Dealer Manager has entered into agreements with the selected dealers distributing the Company’s shares in the Offering, which provide, among other things, for the re-allowance of the full amount of the selling commissions and dealer manager fee and all or a portion of the stockholder servicing fees received by the Dealer Manager to such selected dealers.Performance Participation AllocationThe Special Limited Partner holds a performance participation interest in BREIT OP that entitles it to receive an allocation of BREIT OP’s total return to its capital account. Total return is defined as distributions paid or accrued plus the change in the Company’s Net Asset Value ("NAV"). Under the BREIT OP agreement, the annual total return will be allocated solely to the Special Limited Partner only after the other unit holders have received a total return of 5% (after recouping any loss carryforward amount) and such allocation will continue until the allocation between the Special Limited Partner and all other BREIT OP unit holders is equal to 12.5% and 87.5%, respectively. Thereafter, the Special Limited Partner will receive an allocation of 12.5% of the annual total return. The allocation of the performance participation interest is ultimately determined at the end of each calendar year and will be paid in Class I or Class B units of BREIT OP or cash, at the election of the Special Limited Partner. During the three and six months ended June 30, 2021, the Company recognized $299.4 million and $442.6 million, respectively, of Performance Participation Allocation expense in the Company’s Condensed Consolidated Statements of Operations as the performance hurdle was achieved as of June 30, 2021. During the three and six months ended June 30, 2020, the Company recognized 0 Performance Participation Allocation expense as the performance hurdle was not achieved as of and June 30, 2020.In January 2021, the Company issued 15.5 million Class I units and 1.1 million Class B units in BREIT OP to the Special Limited Partner as payment of the 2020 performance participation allocation. Such units were issued at the NAV per unit as of December 31, 2020. Subsequent to the issuance of the Class I units and Class B units, 9.7 million of such units were redeemed for $111.9 million, and 1.1 million of such units were exchanged for unregistered Class I shares in the Company. The remaining Class I units held by the Special Limited Partner are included in Redeemable Non-Controlling Interest on the Company’s Condensed Consolidated Balance Sheets. As of June 30, 2021, Blackstone and its employees, including the Company’s executive officers, continue to own shares of the Company and Class I and Class B units of BREIT OP worth an aggregate $385.5 million.Accrued Management FeeThe Adviser is entitled to an annual management fee equal to 1.25% of the Company’s NAV, payable monthly, as compensation for the services it provides to the Company. The management fee can be paid, at the Adviser’s election, in cash, shares of the Company's common stock, or BREIT OP units. To date, the Adviser has elected to receive the management fee in shares of the Company’s common stock. During the three and six months ended June 30, 2021, the Company incurred management fees of $92.2 million and $165.3 million, respectively. During the three and six months ended June 30, 2020, the Company incurred management fees of $53.4 million and $102.9 million, respectively.During the six months ended June 30, 2021 and 2020, the Company issued 11.0 million and 7.8 million unregistered Class I shares, respectively, to the Adviser as payment for management fees. The Company also had a payable of $33.5 million and $22.3 million related to the management fees as of June 30, 2021 and December 31, 2020, respectively, which is included in Due to Affiliates on the Company’s Condensed Consolidated Balance Sheets. During July 2021, the Adviser was issued 2.7 million unregistered Class I shares as payment for the $33.5 million management fees accrued as of June 30, 2021. The shares issued to the Adviser for payment of the management fee were issued at the applicable NAV per share at the end of each month for which the fee was earned. During the six months ended June 30, 2021, the Adviser submitted 10.4 million Class I shares for repurchase, for a total repurchase amount of $121.4 million. During the six months ended June 30, 2020, the Adviser submitted 5.0 million Class I shares for repurchase, for a total repurchase amount of $52.3 million.Accrued affiliate service provider expenses and incentive compensation awardsFor further details on the Company’s relationships with its affiliated service providers, see Note 9 to the consolidated financial statements in the Company’s Annual Report on Form 10-K for the year ended December 31, 2020. The Company issues incentive compensation awards to certain employees of affiliate portfolio company service providers that entitles them to receive an allocation of the Company’s total return over a certain hurdle amount, as determined by the Company, which is considered a performance condition. If it is considered probable that the performance condition will be met, these awards are amortized over the four-year service period, as adjusted for forfeitures. As of June 30, 2021, the Company has determined it is probable that the performance19condition will be met and has amortized the value of such awards over the applicable service period. None of Blackstone, the Adviser, or the affiliate portfolio company service providers receive any incentive compensation from the aforementioned arrangements.The following table details the incentive compensation awards ($ in thousands): June 30, 2021 Plan Year Unrecognized Compensation Cost as of December 31, 2020 Value of New Awards Issued Amortization of Compensation Cost for the Six Months Ended June 30, 2021 Unrecognized Compensation Cost Remaining Amortization Period 2019 $ 3,363 $ 0 $ (1,083) $ 2,280 1.5 years 2020 0 0 0 0 — 2021 0 8,500 (1,062) 7,438 3.5 years $ 3,363 $ 8,500 $ (2,145) $ 9,718 The following table details the amounts incurred for affiliate service providers during the three and six months ended June 30, 2021 and 2020 ($ in thousands):Affiliate ServiceProvider ExpensesThree Months Ended June 30,Amortization ofAffiliate Service ProviderIncentive Compensation Three Months Ended June 30,Capitalized TransactionSupport ServicesThree Months Ended June 30, 2021 2020 2021 2020 2021 2020 Link Industrial Properties L.L.C. $ 15,831 $ 13,691 $ 188 $ 260 $ 575 $ 39 LivCor, L.L.C. 10,193 6,689 315 77 1,196 701 BRE Hotels and Resorts LLC 2,762 4,326 (5) 156 0 0 ShopCore Properties TRS Management LLC 1,471 1,356 9 7 42 0 Revantage Corporate Services, L.L.C. 726 469 0 0 0 0 Equity Office Management, L.L.C. 352 150 8 0 0 0 Total $ 31,335 $ 26,681 $ 515 $ 500 $ 1,813 $ 740 Affiliate ServiceProvider ExpensesSix Months Ended June 30,Amortization of AffiliateService Provider IncentiveCompensation AwardsSix Months Ended June 30,Capitalized TransactionSupport ServicesSix Months Ended June 30,2021 2020 2021 2020 2021 2020 Link Industrial Properties L.L.C. $ 31,959 $ 26,022 $ 605 $ 521 $ 818 $ 553 LivCor, L.L.C. 20,918 12,324 697 154 2,075 1,761 BRE Hotels and Resorts LLC 5,443 7,649 127 312 0 0 ShopCore Properties TRS Management LLC 2,895 2,121 25 13 82 315 Revantage Corporate Services, L.L.C. 1,379 957 0 0 0 0 Equity Office Management, L.L.C. 964 295 16 0 0 0 Total $ 63,558 $ 49,368 $ 1,470 $ 1,000 $ 2,975 $ 2,629 Affiliate service provider expenses and incentive compensation awards are included as a component of Rental Property Operating and Hospitality Operating expense, as applicable, in the Company’s Condensed Consolidated Statements of Operations. Transaction support service fees were capitalized to Investments in Real Estate on the Company’s Condensed Consolidated Balance Sheets. Neither Blackstone nor the Adviser receives any fees from the aforementioned arrangements.OtherAs of June 30, 2021, and December 31, 2020, the Company had 0 and $50.8 million, respectively, of accrued repurchases of Class I shares due to the Adviser. Additionally, as of both June 30, 2021 and December 31, 2020, the Adviser had advanced $2.3 million of expenses on the Company’s behalf for general corporate expenses provided by unaffiliated third parties. 20Affiliate Title Service ProviderDuring the six months ended June 30, 2021, the Company paid Lexington National Land Services $2.4 million for title services related to 16 investments and such costs were capitalized to Investments in Real Estate or recorded as deferred financing costs, which is a reduction to Mortgage Notes, Term Loans, and Secured Revolving Credit Facilities on the Company’s Condensed Consolidated Balance Sheets. For additional information regarding this affiliate relationship, see Note 9 to the consolidated financial statements in the Company’s Annual Report on Form 10-K for the year ended December 31, 2020.Captive Insurance CompanyDuring the three and six months ended June 30, 2021, the Company contributed $43.9 million and $44.2 million, respectively, of capital to the captive insurance company for insurance premiums and its pro rata share of other expenses. Of these amounts, $0.8 million and $0.8 million, respectively, was attributable to the fee paid to a Blackstone affiliate to provide oversight and management services of the captive insurance company. The capital contributed and fees paid are in place of insurance premiums and fees that would otherwise be paid to third party insurance companies. The Company did 0t contribute any capital to the captive insurance company during the three and six months ended June 30, 2020.OtherAs of both June 30, 2021 and December 31, 2020, the Company had a receivable of $3.9 million from LivCor, L.L.C. and such amounts are included in Other Assets on the Company’s Condensed Consolidated Balance Sheets.10. Other Assets and Other LiabilitiesThe following table details the components of other assets ($ in thousands):June 30, 2021 December 31, 2020 Equity securities $ 1,796,161 $ 599,185 Real estate intangibles, net 630,428 738,259 Straight-line rent receivable 215,506 155,108 Receivables, net 160,409 109,159 Prepaid expenses 67,782 50,092 Pre-acquisition costs 61,694 241 Deferred leasing costs, net 62,265 49,533 Derivatives 24,817 0 Deferred financing costs, net 23,881 22,740 Held for sale assets 15,010 0 Other 76,377 74,936 Total $ 3,134,330 $ 1,799,253 21The following table details the components of other liabilities ($ in thousands):June 30, 2021 December 31, 2020 Subscriptions received in advance $ 2,072,884 $ 508,817 Payable for unsettled investments in real estate debt 200,263 0 Accounts payable and accrued expenses 159,502 104,866 Real estate taxes payable 150,326 117,362 Distribution payable 126,149 90,892 Intangible liabilities, net 116,614 128,639 Right of use lease liability - operating leases 85,779 85,065 Prepaid rental income 84,712 95,165 Stock repurchases payable 68,283 83,350 Tenant security deposits 66,017 57,489 Right of use lease liability - financing leases 58,191 57,727 Accrued interest expense 45,841 50,065 Derivatives 27,664 55,536 Held for sale liabilities 145 0 Other 82,107 30,221 Total $ 3,344,477 $ 1,465,194 11. IntangiblesThe gross carrying amount and accumulated amortization of the Company’s intangible assets and liabilities consisted of the following ($ in thousands): June 30, 2021 December 31, 2020 Intangible assets: In-place lease intangibles $ 1,014,562 $ 1,094,561 Above-market lease intangibles 46,056 49,261 Other 33,229 32,549 Total intangible assets 1,093,847 1,176,371 Accumulated amortization: In-place lease amortization (429,998) (407,256) Above-market lease amortization (21,136) (20,291) Other (12,285) (10,565) Total accumulated amortization (463,419) (438,112) Real estate intangibles, net $ 630,428 $ 738,259 Intangible liabilities: Below-market lease intangibles $ 187,950 $ 194,158 Total intangible liabilities 187,950 194,158 Accumulated amortization: Below-market lease amortization (71,336) (65,519) Total accumulated amortization (71,336) (65,519) Intangible liabilities, net $ 116,614 $ 128,639 22The estimated future amortization on the Company’s intangibles for each of the next five years and thereafter as of June 30, 2021 is as follows ($ in thousands): In-place Lease
IntangiblesAbove-market
Lease IntangiblesBelow-market
Lease Intangibles2021 (remaining) $ 140,091 $ 4,094 $ (14,956) 2022 130,777 6,639 (26,328) 2023 86,704 4,166 (21,587) 2024 60,548 2,891 (17,255) 2025 47,205 2,256 (13,041) 2026 36,231 1,652 (9,827) Thereafter 83,008 3,222 (13,620) $ 584,564 $ 24,920 $ (116,614) 12. DerivativesThe Company uses derivative financial instruments to minimize the risks and/or costs associated with the Company’s investments and financing transactions. The Company has not designated any of its derivative financial instruments as hedges as defined within ASC 815 – “Derivatives and Hedging”. Derivatives not designated as hedges are not speculative and are used to manage the Company’s exposure to interest rate movements, fluctuations in foreign exchange rates, and other identified risks.The use of derivative financial instruments involves certain risks, including the risk that the counterparties to these contractual arrangements do not perform as agreed. To mitigate this risk, the Company enters into derivative financial instruments with counterparties it believes to have appropriate credit ratings and that are major financial institutions with which the Company and its affiliates may also have other financial relationships.Interest Rate ContractsCertain of the Company’s transactions expose the Company to interest rate risks, which include exposure to variable interest rates on its secured financings of investments in real estate debt in addition to certain loans secured by the Company’s real estate. The Company uses derivative financial instruments, which includes interest rate swaps, and may also include interest rate caps, options, floors, and other interest rate derivative contracts, to limit the Company’s exposure to the future variability of interest rates.The following tables detail the Company’s outstanding interest rate derivatives that were non-designated hedges of interest rate risk (notional amount in thousands): June 30, 2021 Interest Rate Derivatives Number of Instruments Notional Amount Strike Index Weighted Average Maturity (Years) Interest Rate Swaps - Investments in real estate debt 49 $ 1,062,960 1.1% LIBOR 5.6 Interest Rate Swaps - Property debt 6 $ 1,500,000 1.0% LIBOR 7.0 December 31, 2020 Interest Rate Derivatives Number of Instruments Notional Amount Strike Index Weighted Average Maturity (Years) Interest Rate Swaps - Investments in real estate debt 53 $ 929,560 1.3% LIBOR 6.3 Foreign Currency Forward ContractsCertain of the Company’s international investments expose it to fluctuations in foreign currency exchange rates and interest rates. These fluctuations may impact the value of the Company’s cash receipts and payments in terms of its functional currency, the U.S. dollar. The Company uses foreign currency forward contracts to protect the value or fix the amount of certain investments or cash flows in terms of the U.S. dollar.23The following table details the Company’s outstanding foreign currency forward contracts that were non-designated hedges of foreign currency risk (notional amount in thousands): June 30, 2021 December 31, 2020 Foreign Currency Forward Contracts Number of Instruments Notional Amount Number of Instruments Notional Amount Buy USD / Sell EUR Forward 9 € 283,594 7 € 219,430 Buy USD / Sell GBP Forward 7 £ 53,082 2 £ 25,093 Valuation and Financial Statement ImpactThe following table details the fair value of the Company’s derivative financial instruments ($ in thousands):Fair Value of Derivativesin an Asset(1) PositionFair Value of Derivativesin a Liability(2) PositionJune 30, 2021 December 31, 2020 June 30, 2021 December 31, 2020 Interest rate derivatives $ 14,148 $ 0 $ 27,568 $ 46,144 Foreign currency forward contracts 10,669 0 96 9,392 Total Derivatives $ 24,817 $ 0 $ 27,664 $ 55,536 (1)Included in Other Assets in the Company’s Condensed Consolidated Balance Sheets.(2)Included in Other Liabilities in the Company’s Condensed Consolidated Balance Sheets.The following table details the effect of the Company’s derivative financial instruments on the Condensed Consolidated Statements of Operations ($ in thousands):Type of Derivative Realized/Unrealized Gain (Loss) Location of Gain (Loss) Recognized in Net Income Three Months Ended June 30, 2021 2020 Foreign Currency Forward Contract Realized (loss) gain Income from investments in real estate debt $ (4,102) $ 1,613 Interest Rate Swap - Investments in real estate debt Realized (loss) Income from investments in real estate debt (274) 0 Foreign Currency Forward Contract Unrealized gain Income from investments in real estate debt 4,640 (7,326) Interest Rate Swap – Investments in real estate debt Unrealized gain (loss) Income from investments in real estate debt (11,492) (5,439) Interest Rate Swap – Property debt Unrealized gain Other income (expense) (27,348) 0 $ (38,576) $ (11,152) Type of Derivative Realized/Unrealized Gain (Loss) Location of Gain (Loss) Recognized in Net Income Six Months Ended June 30, 2021 2020 Foreign Currency Forward Contract Realized (loss) gain Income from investments in real estate debt $ (8,580) $ 1,969 Interest Rate Swap - Investments in real estate debt Realized (loss) Income from investments in real estate debt (14,964) (1,711) Foreign Currency Forward Contract Unrealized gain Income from investments in real estate debt 19,965 (5,097) Interest Rate Swap – Investments in real estate debt Unrealized gain (loss) Income from investments in real estate debt 42,930 (63,263) Interest Rate Swap – Property debt Unrealized gain Other income (expense) (10,147) 0 $ 29,204 $ (68,102) Credit-Risk Related Contingent FeaturesThe Company has entered into agreements with certain of its derivative counterparties that contain provisions whereby if the Company were to default on any of its indebtedness, including default where repayment of the indebtedness has not been accelerated by the lender, the Company may also be declared in default under its derivative obligations. In addition, certain of the Company’s agreements with its derivative counterparties require the Company to post collateral based on a percentage of derivative notional amounts and/or to secure net liability positions.As of June 30, 2021, the Company was in a net liability position with one of its derivative counterparties and posted collateral of $9.5 million under these derivative contracts, which amount is included in Restricted Cash on the Company’s Condensed Consolidated Balance Sheet. As of December 31, 2020, the Company was in a net liability position with two of its derivative counterparties and24posted collateral of $55.9 million under these derivative contracts, which amount is included in Restricted Cash on the Company’s Condensed Consolidated Balance Sheet.13. Equity and Redeemable Non-controlling InterestAuthorized CapitalAs of June 30, 2021, the Company had the authority to issue 10,100,000,000 shares, consisting of the following:Classification Number of Shares
(in thousands)Par Value Preferred Stock 100,000 $ 0.01 Class S Shares 3,000,000 $ 0.01 Class I Shares 6,000,000 $ 0.01 Class T Shares 500,000 $ 0.01 Class D Shares 500,000 $ 0.01 Total 10,100,000 Common StockThe following table details the movement in the Company’s outstanding shares of common stock (in thousands): Three Months Ended June 30, 2021 Class S Class I Class T Class D Total March 31, 2021 783,521 1,042,750 47,115 146,954 2,020,340 Common stock issued 136,282 292,072 3,020 33,893 465,267 Distribution reinvestment 6,111 6,687 335 1,140 14,273 Common stock repurchased (4,076) (15,238) (282) (481) (20,077) Independent directors' restricted stock grant(1)0 0 0 0 0 June 30, 2021 921,838 1,326,271 50,188 181,506 2,479,803 Six Months Ended June 30, 2021 Class S Class I Class T Class D Total December 31, 2020 702,853 927,080 45,943 124,141 1,800,017 Common stock issued 218,053 437,290 4,403 56,514 716,260 Distribution reinvestment 11,807 12,522 672 2,141 27,142 Common stock repurchased (10,875) (50,626) (830) (1,290) (63,621) Independent directors' restricted stock grant(1)0 5 0 0 5 June 30, 2021 921,838 1,326,271 50,188 181,506 2,479,803 (1)The independent directors’ restricted stock grant represents $0.1 million of the annual compensation paid to a new independent director, which has been prorated for the period from January 2021 through August 2021. The exposure associated with the grant is amortized over the service period and the shares vest in August 2021.Share and Unit RepurchasesFor the three months ended June 30, 2021, the Company repurchased 20.1 million shares of common stock and 13.4 thousand BREIT OP units for a total of $242.6 million and $0.2 million, respectively. For the six months ended June 30, 2021, the Company repurchased 63.6 million shares of common stock and 9.8 million BREIT OP units for a total of $750.9 million and $113.4 million, respectively. The Company had no unfulfilled repurchase requests during the six months ended June 30, 2021.25DistributionsThe Company generally intends to distribute substantially all of its taxable income, which does not necessarily equal net income as calculated in accordance with GAAP, to its stockholders each year to comply with the REIT provisions of the Internal Revenue Code.Each class of common stock receives the same gross distribution per share. The net distribution varies for each class based on the applicable stockholder servicing fee, which is deducted from the monthly distribution per share and paid directly to the applicable distributor.The following table details the aggregate distributions declared for each applicable class of common stock for the three and six months ended June 30, 2021: Three Months Ended June 30, 2021 Class S Class I Class T Class D Aggregate gross distributions declared per share of common stock $ 0.1615 $ 0.1615 $ 0.1615 $ 0.1615 Stockholder servicing fee per share of common stock (0.0262) 0 (0.0258) (0.0076) Net distributions declared per share of common stock $ 0.1353 $ 0.1615 $ 0.1357 $ 0.1539 Six Months Ended June 30, 2021 Class S Class I Class T Class D Aggregate gross distributions declared per share of common stock $ 0.3215 $ 0.3215 $ 0.3215 $ 0.3215 Stockholder servicing fee per share of common stock (0.0509) 0 (0.0502) (0.0147) Net distributions declared per share of common stock $ 0.2706 $ 0.3215 $ 0.2713 $ 0.3068 Redeemable Non-controlling InterestIn connection with its performance participation interest, the Special Limited Partner holds Class I units in BREIT OP. See Note 9 for further details of the Special Limited Partner’s performance participation interest. Because the Special Limited Partner has the ability to redeem its Class I units for Class I shares in the Company or cash, at the election of the Special Limited Partner, the Company has classified these Class I units as Redeemable Non-controlling Interest in mezzanine equity on the Company’s Condensed Consolidated Balance Sheets.The following table details the redeemable non-controlling interest activity related to the Special Limited Partner for the six months ended June 30, 2021 and 2020 ($ in thousands): June 30, 2021 June 30, 2020 Balance at the beginning of the year $ 274 $ 272 Settlement of prior year performance participation allocation 192,648 141,396 Repurchases (111,949) (83,625) Conversion to Class I and Class B units (68,453) (48,543) Conversion to Class I shares (12,246) (9,228) GAAP income allocation (1) (15) Distributions (8) (6) Fair value allocation 34 4 Ending balance $ 299 $ 255 In addition to the Special Limited Partner’s interest noted above, certain of the Company’s third party joint ventures also have a redeemable non-controlling interest in such joint ventures. As of June 30, 2021 and December 31, 2020, $43.3 million and $29.8 million, respectively, related to such third party joint ventures was included in Redeemable Non-controlling Interests on the Company’s Condensed Consolidated Balance Sheets.The Redeemable Non-controlling Interests are recorded at the greater of (i) their carrying amount, adjusted for their share of the allocation of GAAP net income or loss and distributions, or (ii) their redemption value, which is equivalent to the fair value of such interests at the end of each measurement period. Accordingly, the Company recorded an allocation adjustment of $(6.9) million and $(9.7) million during the three and six months ended June 30, 2021, respectively, between Additional Paid-in Capital and Redeemable26Non-controlling Interest. The Company recorded an allocation adjustment of $0.2 million and $(0.3) million during the three and six months ended June 30, 2020, respectively, between Additional Paid-in Capital and Redeemable Non-controlling Interest.14. LeasesLessorThe Company’s rental revenue primarily consists of rent earned from operating leases at the Company’s residential, industrial, net lease, self storage, retail, and office properties. Leases at the Company’s industrial, retail, and office properties generally include a fixed base rent, and certain leases also contain a variable rent component. The variable component of the Company’s operating leases at its industrial, retail, and office properties primarily consist of the reimbursement of operating expenses such as real estate taxes, insurance, and common area maintenance costs. Rental revenue earned from leases at the Company’s residential properties primarily consist of a fixed base rent, and certain leases contain a variable component that allows for the pass-through of certain operating expenses such as utilities. Rental revenue earned from leases at the Company’s self storage properties primarily consist of a fixed base rent only.Rental revenue from the Company’s lease at the Bellagio consists of a fixed annual rent that escalates annually throughout the term of the lease, and the tenant is generally responsible for all property-related expenses, including taxes, insurance, and maintenance. The Company assessed the classification of the Bellagio lease and determined the lease was an operating lease. The Company’s assessment included the consideration of the present value of the lease payments over the lease term and the residual value of the leased assets.Leases at the Company’s industrial, net lease, retail, and office properties are generally longer term and may contain extension and termination options at the lessee’s election. Leases at the Company’s residential and self storage properties are short term in nature, generally not greater than 12 months in length.The following table details the components of operating lease income from leases in which the Company is the lessor ($ in thousands): Three Months Ended June 30, Six Months Ended June 30, 2021 2020 2021 2020 Fixed lease payments $ 616,068 $ 506,046 $ 1,207,108 $ 983,331 Variable lease payments 64,741 47,671 126,617 102,481 Rental revenue $ 680,809 $ 553,717 $ 1,333,725 $ 1,085,812 The following table presents the undiscounted future minimum rents the Company expects to receive for its industrial, net lease, retail and office properties as of June 30, 2021 ($ in thousands). Leases at the Company’s residential and self storage properties are short term, generally 12 months or less, and are therefore not included.Year Future Minimum Rents 2021 (remaining) $ 514,787 2022 988,808 2023 884,034 2024 778,531 2025 696,405 2026 616,555 Thereafter 9,009,183 Total $ 13,488,303 LesseeCertain of the Company’s investments in real estate are subject to ground leases. The Company’s ground leases are classified as either operating leases or financing leases based on the characteristics of each lease. As of June 30, 2021, the Company had 15 ground leases classified as operating and 2 ground leases classified as financing. Each of the Company’s ground leases were acquired as part of the acquisition of real estate, and no incremental costs were incurred for such ground leases. The Company’s ground leases are non-cancelable, and two of the Company’s operating leases contain renewal options, one for an additional 99 year term and the other for an additional 10 year term.27The following table details the future lease payments due under the Company’s ground leases as of June 30, 2021 ($ in thousands): Operating
LeasesFinancing
Leases2021 (remaining) $ 2,043 $ 1,563 2022 4,093 3,174 2023 4,132 3,269 2024 4,183 3,367 2025 4,423 3,468 2026 4,530 3,572 Thereafter 595,398 323,447 Total undiscounted future lease payments 618,802 341,860 Difference between undiscounted cash flows and discounted cash flows (533,023) (283,669) Total lease liability $ 85,779 $ 58,191 The Company utilized its incremental borrowing rate, which was between 5% and 7%, to determine its lease liabilities. As of June 30, 2021, the weighted average remaining lease term of the Company’s operating leases and financing leases was 55 years and 75 years, respectively.Payments under the Company’s ground leases primarily contain fixed payment components that may include periodic increases fixed to an index or periodic fixed percentage escalations. One of the Company’s ground leases contains a variable component based on a percentage of revenue.The following table details the fixed and variable components of the Company’s operating leases ($ in thousands): Three Months Ended June 30, Six Months Ended June 30, 2021 2020 2021 2020 Fixed ground rent expense $ 1,025 $ 1,014 $ 2,046 $ 2,026 Variable ground rent expense 26 1 26 18 Total cash portion of ground rent expense 1,051 1,015 2,072 2,044 Straight-line ground rent expense 1,643 1,691 3,290 3,434 Total operating lease costs $ 2,694 $ 2,706 $ 5,362 $ 5,478 The following table details the fixed and variable components of the Company’s financing leases ($ in thousands): Three Months Ended June 30, Six Months Ended June 30, 2021 2020 2021 2020 Interest on lease liabilities $ 759 $ 737 $ 1,518 $ 1,474 Amortization of right-of-use assets 252 257 499 509 Total financing lease costs $ 1,011 $ 994 $ 2,017 $ 1,983 15. Segment ReportingThe Company operates in 8 reportable segments: Residential, Industrial, Net Lease, Hospitality, Self Storage, Retail, and Office properties, and Investments in Real Estate Debt. The Company allocates resources and evaluates results based on the performance of each segment individually. The Company believes that Segment Net Operating Income is the key performance metric that captures the unique operating characteristics of each segment.28The following table details the total assets by segment ($ in thousands): June 30, 2021 December 31, 2020 Residential $ 15,350,917 $ 13,701,615 Industrial 12,642,621 11,498,912 Net Lease 5,213,010 5,199,651 Hospitality 2,401,770 2,196,429 Self Storage 1,523,867 1,593,430 Retail 688,744 700,045 Office 700,870 447,630 Investments in Real Estate Debt 6,014,628 4,763,309 Other (Corporate) 3,445,428 582,994 Total assets $ 47,981,855 $ 40,684,015 The following table details the financial results by segment for the three months ended June 30, 2021 ($ in thousands): Residential Industrial Net
LeaseHospitality Self
StorageRetail Office Investments in
Real Estate
DebtTotal Revenues: Rental revenue $ 302,095 $ 236,908 $ 82,794 $ 0 $ 33,673 $ 14,667 $ 10,672 $ 0 $ 680,809 Hospitality revenue 0 0 0 102,660 0 0 0 0 102,660 Other revenue 18,476 2,144 0 3,318 2,161 457 158 0 26,714 Total revenues 320,571 239,052 82,794 105,978 35,834 15,124 10,830 0 810,183 Expenses: Rental property operating 150,642 72,191 249 0 17,253 4,626 3,024 0 247,985 Hospitality operating 0 0 0 75,093 0 0 0 0 75,093 Total expenses 150,642 72,191 249 75,093 17,253 4,626 3,024 0 323,078 Income from unconsolidated entities 0 44,892 25,136 0 0 0 0 0 70,028 Income from investments in real estate debt 0 0 0 0 0 0 0 116,573 116,573 Income from investments in equity securities 95,442 33,769 22,085 0 0 0 2,344 0 153,640 Segment net operating income (loss) $ 265,371 $ 245,522 $ 129,766 $ 30,885 $ 18,581 $ 10,498 $ 10,150 $ 116,573 $ 827,346 Depreciation and amortization $ (167,943) $ (136,649) $ (28,637) $ (22,870) $ (32,063) $ (6,575) $ (4,884) $ 0 $ (399,621) General and administrative $ (7,789) Management fee (92,183) Performance participation allocation (299,373) Impairment of investments in real estate 0 Net gain on dispositions of real estate 7,372 Interest income 9 Interest expense (181,529) Loss on extinguishment of debt (2,757) Other income (expense) (28,057) Net loss $ (176,582) Net income attributable to non-controlling interests in third party joint ventures $ (264) Net loss attributable to non-controlling interests in BREIT OP 2,089 Net loss attributable to BREIT stockholders $ (174,757) 29The following table details the financial results by segment for the three months ended June 30, 2020 ($ in thousands):Residential Industrial Net
LeaseHospitality Self
StorageRetail Office Investments in
Real Estate
DebtTotal Revenues: Rental revenue $ 241,793 $ 209,583 $ 82,794 $ 0 $ 3,897 $ 12,679 $ 2,971 $ 0 $ 553,717 Hospitality revenue 0 0 0 21,781 0 0 0 0 21,781 Other revenue 14,007 1,157 0 1,263 464 228 130 0 17,249 Total revenues 255,800 210,740 82,794 23,044 4,361 12,907 3,101 0 592,747 Expenses: Rental property operating 115,236 64,048 13 0 2,341 4,331 1,066 0 187,035 Hospitality operating 0 0 0 44,523 0 0 0 0 44,523 Total expenses 115,236 64,048 13 44,523 2,341 4,331 1,066 0 231,558 Income from unconsolidated entities 0 0 25,336 0 0 0 0 0 25,336 Income from investments in real estate debt 0 0 0 0 0 0 0 492,889 492,889 Income from investments in equity securities 3,124 3,508 19,700 0 0 0 3,318 0 29,650 Segment net operating income $ 143,688 $ 150,200 $ 127,817 $ (21,479) $ 2,020 $ 8,576 $ 5,353 $ 492,889 $ 909,064 Depreciation and amortization $ (145,595) $ (138,798) $ (29,040) $ (22,753) $ (1,452) $ (8,174) $ (1,540) $ 0 $ (347,352) General and administrative $ (6,913) Management fee (53,423) Performance participation allocation 0 Impairment of investments in real estate (6,126) Net gain on dispositions of real estate 0 Interest income 233 Interest expense (176,579) Loss on extinguishment of debt 0 Other income (expense) (572) Net income $ 318,332 Net loss attributable to non-controlling interests in third party joint ventures $ 966 Net income attributable to non-controlling interests in BREIT OP (4,859) Net income attributable to BREIT stockholders $ 314,439 30The following table details the financial results by segment for the six months ended June 30, 2021 ($ in thousands):Residential Industrial Net
LeaseHospitality Self
StorageRetail Office Investments in
Real Estate
DebtTotal Revenues: Rental revenue $ 590,548 $ 463,668 $ 165,589 $ 0 $ 64,648 $ 29,097 $ 20,175 $ 0 $ 1,333,725 Hospitality revenue 0 0 0 160,803 0 0 0 0 160,803 Other revenue 32,540 5,994 0 4,994 4,157 1,214 211 0 49,110 Total revenues 623,088 469,662 165,589 165,797 68,805 30,311 20,386 0 1,543,638 Expenses: Rental property operating 290,583 146,063 470 0 32,961 9,535 6,078 0 485,690 Hospitality operating 0 0 0 130,773 0 0 0 0 130,773 Total expenses 290,583 146,063 470 130,773 32,961 9,535 6,078 0 616,463 Income from unconsolidated entities 0 54,228 50,482 0 0 0 0 0 104,710 Income from investments in real estate debt 0 0 0 0 0 0 0 355,934 355,934 Income from investments in equity securities 151,495 55,411 30,963 0 0 0 6,882 0 244,751 Segment net operating income (loss) $ 484,000 $ 433,238 $ 246,564 $ 35,024 $ 35,844 $ 20,776 $ 21,190 $ 355,934 $ 1,632,570 Depreciation and amortization $ (335,986) $ (268,544) $ (57,136) $ (45,576) $ (69,814) $ (14,185) $ (8,767) $ 0 $ (800,008) General and administrative $ (14,749) Management fee (165,278) Performance participation allocation (442,588) Impairment of investments in real estate 0 Net gain on dispositions of real estate 22,802 Interest income 95 Interest expense (363,147) Loss on extinguishment of debt (6,173) Other income (expense) (11,222) Net loss $ (147,698) Net income attributable to non-controlling interests in third party joint ventures $ (323) Net loss attributable to non-controlling interests in BREIT OP 1,736 Net loss attributable to BREIT stockholders $ (146,285) 31The following table details the financial results by segment for the six months ended June 30, 2020 ($ in thousands): Residential Industrial Net
LeaseHospitality Self
StorageRetail Office Investments in
Real Estate DebtTotal Revenues: Rental revenue $ 468,912 $ 410,980 $ 165,589 $ 0 $ 7,461 $ 26,922 $ 5,948 $ 0 $ 1,085,812 Hospitality revenue 0 0 0 149,253 0 0 0 0 149,253 Other revenue 26,092 1,998 0 2,837 911 506 220 0 32,564 Total revenues 495,004 412,978 165,589 152,090 8,372 27,428 6,168 0 1,267,629 Expenses: Rental property operating 219,796 121,218 114 0 4,443 7,751 2,101 0 355,423 Hospitality operating 0 0 0 143,829 0 0 0 0 143,829 Total expenses 219,796 121,218 114 143,829 4,443 7,751 2,101 0 499,252 Income from unconsolidated entities 0 0 38,605 0 0 0 0 0 38,605 Loss from investments in real estate debt 0 0 0 0 0 0 0 (523,258) (523,258) Income (loss) from investments in
equity securities(5,766) 13,571 (12,197) 0 0 0 100 0 (4,292) Segment net operating income $ 269,442 $ 305,331 $ 191,883 $ 8,261 $ 3,929 $ 19,677 $ 4,167 $ (523,258) $ 279,432 Depreciation and amortization $ (272,921) $ (276,922) $ (57,195) $ (45,546) $ (3,681) $ (16,809) $ (3,083) $ 0 $ (676,157) General and administrative (13,595) Management fee (102,925) Performance participation allocation 0 Impairment of investments in real estate (6,126) Net gain on dispositions of real estate 371 Interest income 1,980 Interest expense (365,083) Loss on extinguishment of debt (1,237) Other income (expense) (15,478) Net loss $ (898,818) Net loss attributable to non-controlling interests in third party joint ventures $ 1,203 Net loss attributable to non-controlling interests in BREIT OP 11,967 Net loss attributable to BREIT stockholders $ (885,648) 16. Commitments and ContingenciesLitigation From time to time, the Company may be involved in various claims and legal actions arising in the ordinary course of business. As of June 30, 2021 and December 31, 2020, the Company was not involved in any material legal proceedings.Capital CommitmentsIn February 2021, the Company committed $200.0 million to invest in a private real estate-related company to be funded by September 30, 2021. As of June 30, 2021, the Company had a remaining commitment of $80.9 million to the private real estate-related company.3217. Subsequent EventsHome Partners of AmericaSubsequent to June 30, 2021, the Company acquired Home Partners of America (“HPA”), valuing the Company at $6.0 billion. HPA is one of the largest private owners and operators of single‐family rental (“SFR”) homes in the United States with a high-quality portfolio of over 17,000 homes across the country.AcquisitionsSubsequent to June 30, 2021, the Company acquired an aggregate of $2.1 billion of real estate (not including the HPA transaction described above), exclusive of closing costs, across 6 separate transactions.Subsequent to June 30, 2021, the Company acquired an aggregate of $0.3 billion of investments in unconsolidated entities.Subsequent to June 30, 2021, the Company purchased an aggregate of $0.7 billion of investments in real estate debt. Proceeds from the Issuance of Common StockSubsequent to June 30, 2021, the Company received net proceeds of $4.9 billion from the issuance of its common stock.33ITEM 2. MANAGEMENT’S DISCUSSION AND ANALYSIS OF FINANCIAL CONDITION AND RESULTS OF OPERATIONSReferences herein to “Blackstone Real Estate Income Trust,” “BREIT,” the “Company,” “we,” “us,” or “our” refer to Blackstone Real Estate Income Trust, Inc. and its subsidiaries unless the context specifically requires otherwise.The following discussion should be read in conjunction with the unaudited condensed consolidated financial statements and notes thereto appearing elsewhere in this quarterly report on Form 10-Q.Forward-Looking StatementsThis quarterly report on Form 10-Q contains forward-looking statements within the meaning of the federal securities laws and the Private Securities Litigation Reform Act of 1995. These forward-looking statements can be identified by the use of forward-looking terminology such as “may,” “will,” “expect,” “intend,” “anticipate,” “estimate,” “believe,” “continue,” “identified” or other similar words or the negatives thereof. These may include our financial projections and estimates and their underlying assumptions, statements about plans, objectives and expectations with respect to future operations, statements with respect to acquisitions, statements regarding future performance and statements regarding identified but not yet closed acquisitions. Such forward-looking statements are inherently uncertain and there are or may be important factors that could cause actual outcomes or results to differ materially from those indicated in such statements. We believe these factors also include but are not limited to those described under the section entitled “Risk Factors” in our prospectus and our Annual Report on form 10-K for the year ended December 31, 2020, and any such updated factors included in our periodic filings with the SEC, which are accessible on the SEC’s website at www.sec.gov. These factors should not be construed as exhaustive and should be read in conjunction with the other cautionary statements that are included in this document (or our prospectus and other filings). Except as otherwise required by federal securities laws, we undertake no obligation to publicly update or revise any forward-looking statements, whether as a result of new information, future developments or otherwise.OverviewBREIT invests primarily in stabilized income-generating commercial real estate in the United States and, to a lesser extent, in real estate debt. We are the sole general partner and majority limited partner of BREIT Operating Partnership L.P. (“BREIT OP”), a Delaware limited partnership, and we own substantially all of our assets through BREIT OP. We are externally managed by BX REIT Advisors L.L.C. (the “Adviser”). The Adviser is part of the real estate group of Blackstone Inc. (“Blackstone”), a leading investment manager. We currently operate our business in eight reportable segments: Residential, Industrial, Net Lease, Hospitality, Self Storage, Retail, and Office Properties, and Investments in Real Estate Debt. Residential includes various forms of rental housing including multifamily, student housing, and manufactured housing. Net Lease includes the real estate assets of The Bellagio Las Vegas (the “Bellagio”) and the Company's unconsolidated interest in the MGM Grand and Mandalay Bay joint venture. Additional unconsolidated interests are included in the respective property segment.BREIT is a non-listed, perpetual life real estate investment trust (“REIT”) that qualifies as a REIT under the Internal Revenue Code of 1986, as amended (the “Code”) for U.S. federal income tax. We generally will not be subject to U.S. federal income taxes on our taxable income to the extent we annually distribute all of our net taxable income to stockholders and maintain our qualification as a REIT.As of August 12, 2021, we have received net proceeds of $34.8 billion from the sale of shares of our common stock. We have contributed the net proceeds to BREIT OP in exchange for a corresponding number of Class S, Class I, Class T, and Class D units. BREIT OP has primarily used the net proceeds to make investments in real estate and real estate debt as further described below under “ Investment Portfolio.” We intend to continue selling shares on a monthly basis.Recent DevelopmentsAs of June 30, 2021, the novel coronavirus (“COVID-19”) pandemic is ongoing. During 2020, the COVID-19 pandemic created disruption in global supply chains, increased rates of unemployment and adversely impacted many industries, including industries related to the collateral underlying certain of our loans. In 2021, the global economy has, with certain setbacks, begun reopening and wider distribution of vaccines will likely encourage greater economic activity. Nevertheless, both in the U.S. and abroad, there is continued uncertainty regarding the trajectory of a continuing recovery, particularly given the strength of the Delta variant. Accordingly, this recovery remains uneven with dispersion across sectors and regions.The outbreak of COVID-19 and its impact on the current financial, economic and capital markets environment, and future developments in these and other areas present uncertainty and risk with respect to our financial condition, results of operations, liquidity, and ability to pay distributions. Countries around the world continue to grapple with the economic impacts of the COVID-1934pandemic. Although a recovery is partially underway, it continues to be gradual, uneven and characterized by meaningful dispersion across sectors and regions, and could be hindered by persistent or resurgent infection rates. The most recent round of U.S. fiscal stimulus could provide meaningful support, along with continued accommodative monetary policy and wider distribution of vaccines. Issues with respect to the distribution and acceptance of vaccines or the spread of new variants of the virus could adversely impact the recovery. Overall, there remains significant uncertainty regarding the timing and duration of the economic recovery, which precludes any prediction as to the ultimate adverse impact of COVID-19 on economic and market conditions. For additional discussion with respect to the potential impact of the COVID-19 pandemic on our liquidity and capital resources, see “Liquidity and Capital Resources” below.Please refer to Item 1A. Risk Factors in our Annual Report on Form 10-K for the year ended December 31, 2020 and our prospectus dated February 12, 2021 and filed with the SEC, as supplemented, for additional disclosure relating to material trends or uncertainties that may impact our business.35Q2 2021 HighlightsOperating Results:•Declared monthly net distributions totaling $348.5 million for the three months ended June 30, 2021, resulting in average annualized distribution rates of 4.5% for Class S, 5.3% for Class I, 4.5% for Class T, and 5.1% for Class D for the quarter.(1)•Year-to-date total return through June 30, 2021, without upfront selling commissions, was 11.5% for Class S, 12.1% for Class I, 11.7% for Class T, and 11.7% for Class D shares. Year-to-date total return through June 30, 2021, assuming maximum upfront selling commissions, was 7.7% for Class S, 7.9% for Class T, and 10.0% for Class D shares.(2)•Inception-to-date total return through June 30, 2021, without upfront selling commissions, was 10.3% for Class S, 11.2% for Class I, 10.7% for Class T, and 11.3% for Class D shares. Inception-to-date total return through June 30, 2021, assuming maximum upfront selling commissions, was 9.5% for Class S, 9.8% for Class T shares and 10.9% for Class D.(2)Investments:•Acquired 21 industrial, 13 residential, and one office property across 11 transactions with a total purchase price of $1.7 billion during the three months ended June 30, 2021. The acquisitions are consistent with our strategy of acquiring diversified, income-producing, commercial real estate assets concentrated in high growth markets across the U.S.•In July, acquired Home Partners of America (“HPA”), valuing the Company at $6.0 billion. HPA is one of the largest private owners and operators of single‐family rental (“SFR”) homes in the United States with a high-quality portfolio of over 17,000 homes across the country.•Entered into an agreement with Blackstone Infrastructure Partners, and other long-term perpetual capital vehicles managed by Blackstone to acquire all outstanding shares of common stock of QTS Realty Trust (NYSE: QTS) (“QTS”) for $10.0 billion, including the assumption of debt. QTS is a leading provider of data center solutions with a portfolio of high-quality assets in top tier data center markets. The transaction is expected to close in the second half of 2021 and BREIT will indirectly own approximately 40% of QTS.•Subsequent to June 30, 2021, we entered into an agreement to acquire from American International Group, Inc. (“AIG”) its interests in a U.S. affordable housing portfolio for a $5.1 billion equity purchase price, plus the assumption of debt. Our proposed investment reflects a majority economic interest in a series of partnerships that own 678 affordable housing communities totaling approximately 83,000 apartments located throughout the U.S. The transaction is expected to close in the fourth quarter of 2021.•Sold one residential property for net proceeds of $21.1 million, which resulted in a realized gain of $7.4 million during the three months ended June 30, 2021.•Invested $927.1 million in real estate debt, consisting of commercial mortgage-backed securities (“CMBS”), residential mortgage-backed securities (“RMBS”), and corporate bonds of real estate-related companies during the three months ended June 30, 2021.Capital Activity and Financings:•Raised $5.7 billion of proceeds during the three months ended June 30, 2021 from the sale of our common stock. Repurchased $242.6 million of our common stock during the three months ended June 30, 2021.•Increased revolving credit capacity by $50.0 million, increased property-level financings by $123.7 million, and reduced the financings secured by our investments in real estate debt by $1.1 billion during the three months ended June 30, 2021.Overall Portfolio:•Our portfolio as of June 30, 2021 consisted of investments in real estate (89% based on fair value) and investments in real estate debt (11%).•Our 1,463 properties as of June 30, 2021 consisted primarily of Residential (41% based on fair value), Industrial (36%), and Net Lease (12%), and our portfolio of real estate was concentrated in the following regions: West (39%), South (35%), East (15%), and Midwest (11%).•Our investments in real estate debt as of June 30, 2021 consisted of a diversified portfolio. For further details on credit rating and underlying real estate collateral, refer to “Investment Portfolio – Investments in Real Estate Debt”.(1)The annualized distribution rate is calculated as the current month’s distribution annualized and divided by the prior month’s net asset value, which is inclusive of all fees and expenses. The Company believes the annualized distribution rate is a useful measure of the overall investment performance of our shares.(2)Total return is calculated as the change in NAV per share during the respective periods plus any distributions per share declared in the period and assumes any distributions are reinvested in accordance with our distribution reinvestment plan. Total return for periods greater than one year are annualized. The Company believes total return is a useful measure of the overall investment performance of our shares.36Investment PortfolioPortfolio SummaryThe following chart allocates our investments in real estate and real estate debt based on fair value as of June 30, 2021: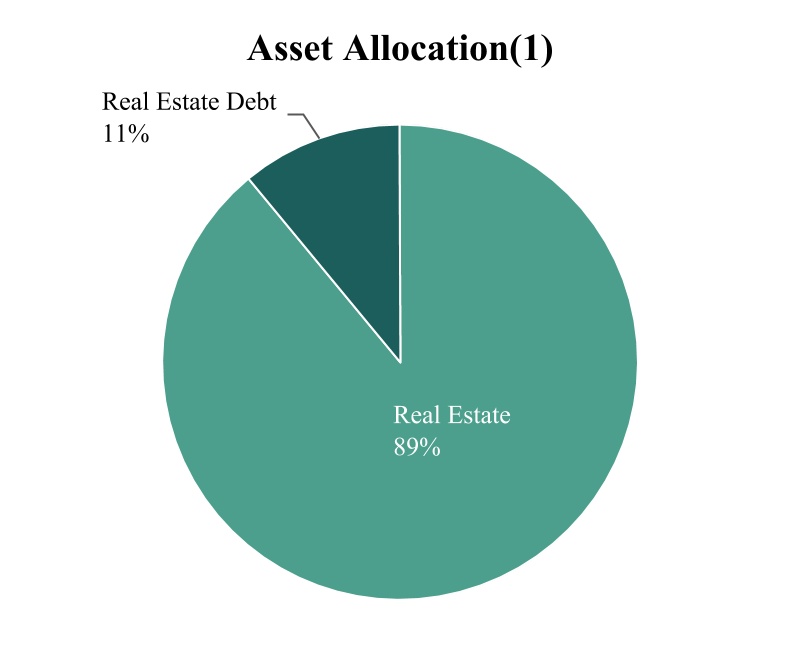 Real Estate InvestmentsThe following charts further describe the diversification of our investments in real estate based on fair value as of June 30, 2021:
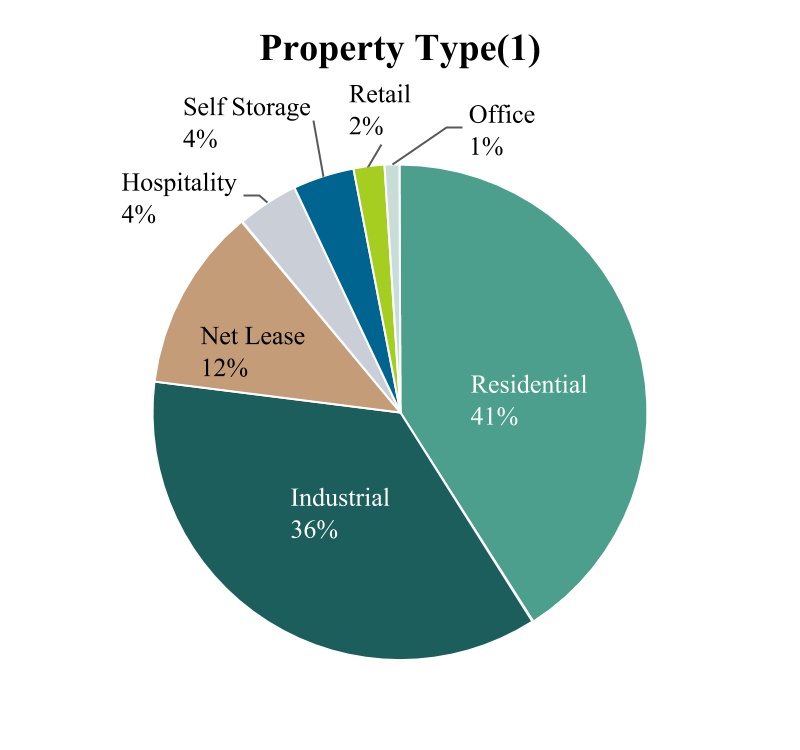
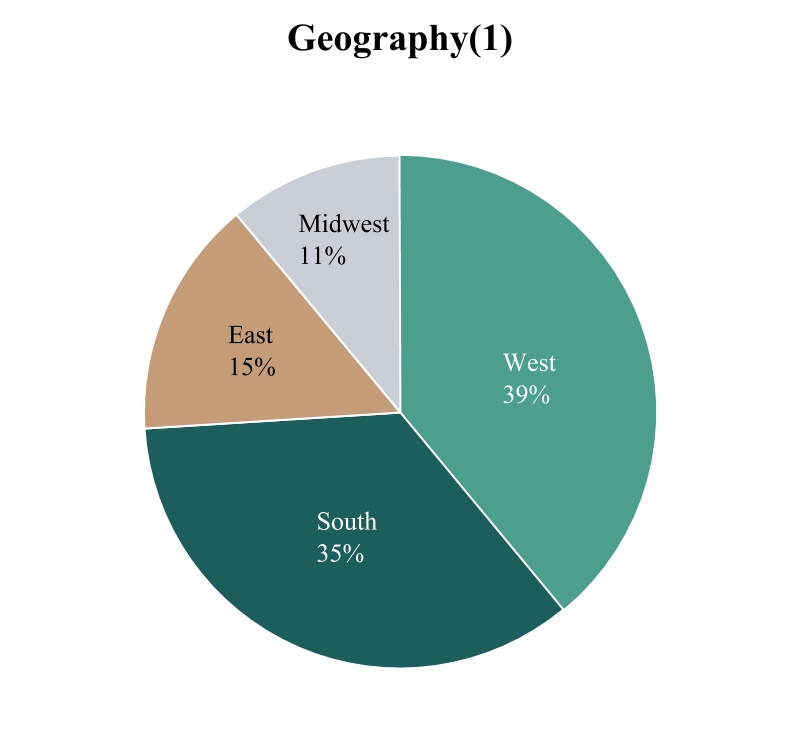 (1) Investments in real estate includes our direct property investments, unconsolidated investments, and equity in public and private real estate-related companies. Geographic weighting is measured as the asset value of real estate properties, excluding the value of any third-party interests in such real estate properties, and unconsolidated investments for each geographical category (West, South, East, Midwest) against the total asset value of (i) all real estate properties, excluding the value of any third-party interests in such real estate properties, and (ii) unconsolidated investments.37The following map identifies the top markets of our real estate portfolio composition based on fair value as of June 30, 2021:
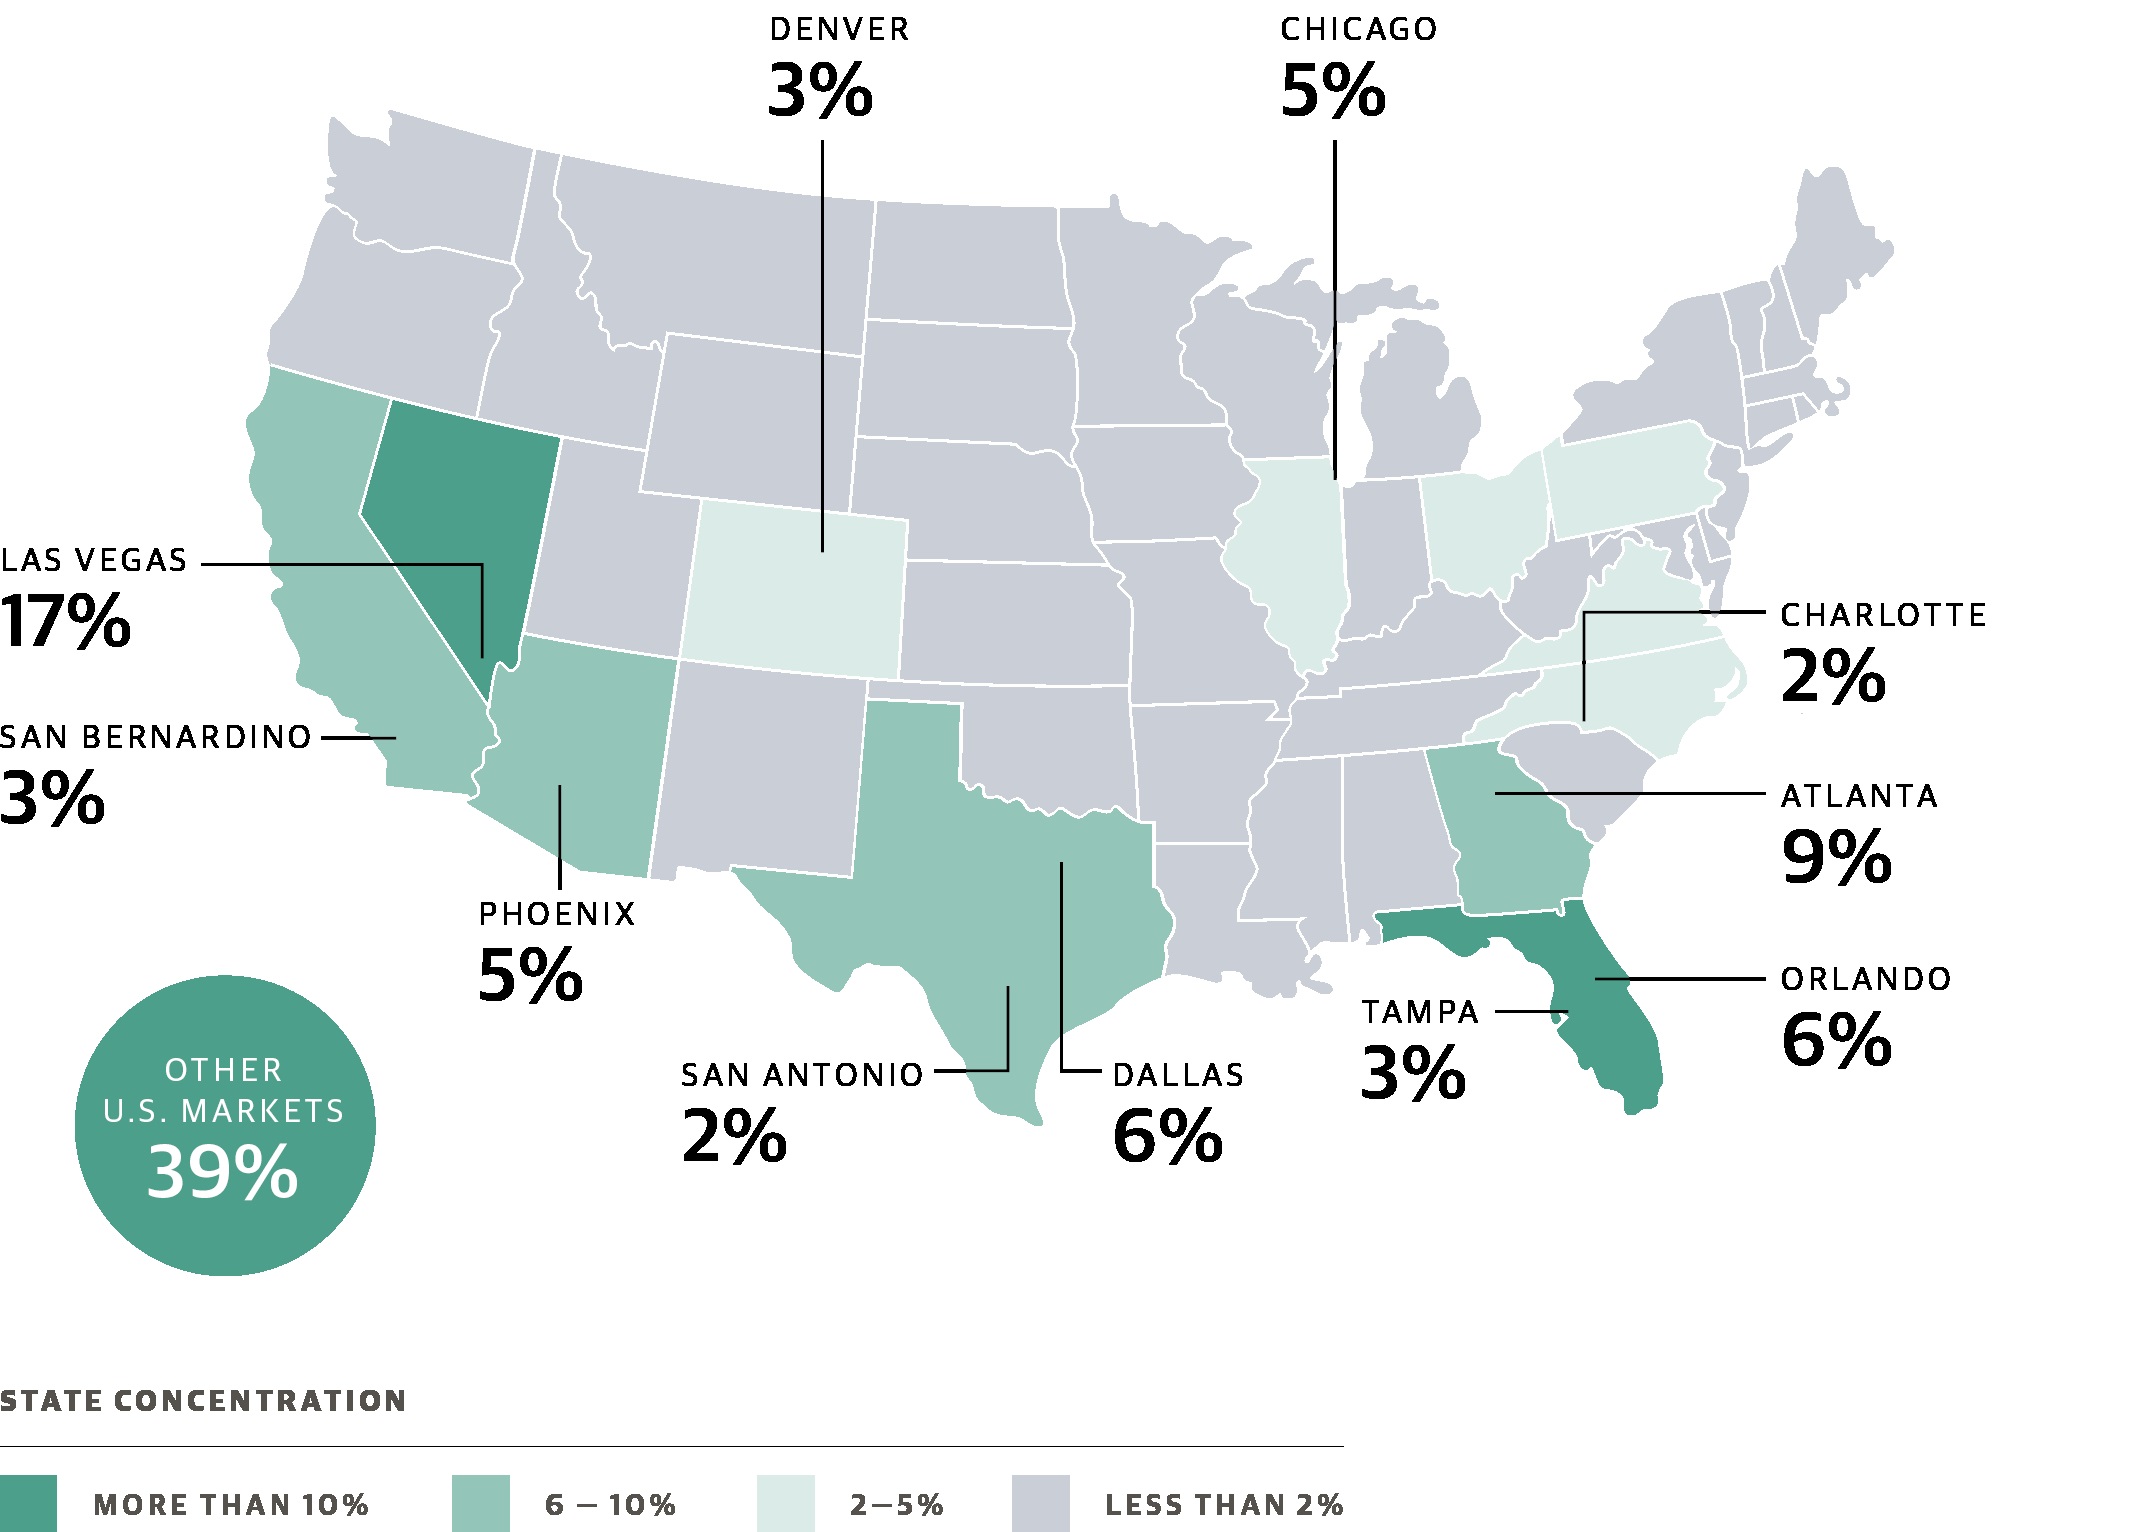 The select markets that are named represent all metropolitan statistical areas (“MSAs”) in which BREIT has at least a 2% portfolio concentration. BREIT is invested in additional MSAs that are not named above. Shading reflects the concentration of all real estate properties and unconsolidated investments in each state. Weighting is measured as the asset value of real estate properties and unconsolidated investments for each market against the total asset value of all (i) real estate properties, excluding the value of any third-party interests in such real estate properties, and (ii) unconsolidated investments.As of June 30, 2021, we owned 1,463 properties consisting of a diversified portfolio of income producing assets primarily focused in Residential, Industrial, and Net Lease properties, and to a lesser extent Hospitality, Self Storage, Retail, and Office properties, concentrated in growth markets across the U.S.The following table provides a summary of our portfolio as of June 30, 2021:
Segment Number ofProperties(1)Sq. Feet (in
thousands)/
Units/KeysOccupancyRate(2)Average EffectiveAnnual Base RentPer Leased SquareFoot/Units/Keys(3)Gross AssetValue(4)($ in thousands)SegmentRevenue(5)Percentage of Total Revenues Residential(6)298 93,174 units 94% $14,506 $ 17,442,161 $ 623,088 38% Industrial 938 154,011 sq. ft. 96% $5.30 15,734,206 523,890 32% Net lease 3 24,748 sq. ft. N/A N/A 5,553,514 216,071 13% Hospitality 58 9,672 keys 49% $120.91/$59.24 2,070,331 165,797 10% Self Storage 150 10,958 sq. ft. 94% $12.32 1,664,941 68,805 4% Retail 13 2,018 sq. ft. 96% $23.94 681,686 30,311 2% Office 3 946 sq. ft. 99% $35.76 654,579 20,386 1% Total 1,463 $ 43,801,418 $ 1,648,348 100% 38(1)Industrial and Net Lease include properties owned by unconsolidated entities.(2)The occupancy rate for our industrial, retail and office investments includes all leased square footage as of June 30, 2021. The occupancy rate for our self storage and manufactured housing investments includes occupied square footage and occupied units, respectively, as of June 30, 2021. The occupancy rate for our student housing and other residential investments is defined as the percentage of actual rent divided by gross potential rent (defined as actual rent for occupied units and market rent for vacant units) for the six months ended June 30, 2021. The occupancy rate for our hospitality investments includes paid occupied rooms for the 12 months ended June 30, 2021. Hospitality investments owned less than 12 months are excluded from the average occupancy rate calculation.(3)For industrial, manufactured housing, self storage, retail, and office properties, average effective annual base rent represents the annualized June 30, 2021 base rent per leased square foot or unit and excludes tenant recoveries, straight-line rent and above-market and below-market lease amortization. For student housing and other residential properties, average effective annual base rent represents the base rent for the three months ended June 30, 2021 per leased unit, and excludes tenant recoveries, straight-line rent and above-market and below-market lease amortization. For hospitality properties, average effective annual base rent represents Average Daily Rate (“ADR”) and Revenue Per Available Room (“RevPAR”), respectively, for the 12 months ended June 30, 2021. Hospitality investments owned less than 12 months are excluded from the ADR and RevPAR calculations. (4)Based on fair value as of June 30, 2021.(5)Segment revenue is presented for the six months ended June 30, 2021. Net lease and industrial segment revenue includes income from unconsolidated entities.(6)Residential includes various forms of rental housing such as multifamily, manufactured and student housing. Residential units include manufactured housing sites and student housing beds.39Real EstateThe following table provides information regarding our real estate portfolio as of June 30, 2021:Segment and Investment Number of
PropertiesLocation Acquisition Date Ownership Interest(1)Sq. Feet (in thousands)/Units/Keys(2)Occupancy Rate(3)Residential: TA Multifamily Portfolio 6 Various April 2017 100% 2,514 units 95% Emory Point 1 Atlanta, GA May 2017 100% 750 units 93% Nevada West Multifamily 3 Las Vegas, NV May 2017 100% 972 units 98% Mountain Gate & Trails Multifamily 2 Las Vegas, NV June 2017 100% 539 units 97% Elysian West Multifamily 1 Las Vegas, NV July 2017 100% 466 units 97% Gilbert Multifamily 2 Gilbert, AZ Sept. 2017 90% 748 units 97% Domain & GreenVue Multifamily 2 Dallas, TX Sept. 2017 100% 803 units 95% ACG II Multifamily 4 Various Sept. 2017 94% 932 units 97% Olympus Multifamily 3 Jacksonville, FL Nov. 2017 95% 1,032 units 94% Amberglen West Multifamily 1 Hillsboro, OR Nov. 2017 100% 396 units 95% Aston Multifamily Portfolio 18 Various Various 100% 3,991 units 95% Talavera and Flamingo Multifamily 2 Las Vegas, NV Dec. 2017 100% 674 units 96% Walden Pond & Montair Multifamily Portfolio 2 Everett, WA & Thornton, CO Dec. 2017 95% 636 units 97% Signature at Kendall Multifamily 1 Miami, FL Dec. 2017 100% 546 units 97% The Boulevard 1 Phoenix, AZ April 2018 100% 294 units 97% Blue Hills Multifamily 1 Boston, MA May 2018 100% 472 units 94% Wave Multifamily Portfolio 6 Various May 2018 100% 2,199 units 97% ACG III Multifamily 2 Gresham, OR & Turlock, CA May 2018 95% 475 units 97% Carroll Florida Multifamily 2 Jacksonville & Orlando, FL May 2018 100% 716 units 94% Solis at Flamingo 1 Las Vegas, NV June 2018 95% 524 units 96% Velaire at Aspera 1 Phoenix, AZ July 2018 100% 286 units 95% Coyote Multifamily Portfolio 6 Phoenix, AZ Aug. 2018 100% 1,752 units 96% Avanti Apartments 1 Las Vegas, NV Dec. 2018 100% 414 units 97% Gilbert Heritage Apartments 1 Phoenix, AZ Feb. 2019 90% 256 units 96% Roman Multifamily Portfolio 14 Various Feb. 2019 100% 3,743 units 97% Elevation Plaza Del Rio 1 Phoenix, AZ April 2019 90% 333 units 97% Courtney at Universal Multifamily 1 Orlando, FL April 2019 100% 355 units 95% Citymark Multifamily 2-Pack 2 Various April 2019 95% 608 units 96% Tri-Cities Multifamily 2-Pack 2 Richland & Kennewick, WA April 2019 95% 428 units 97% Raider Multifamily Portfolio 4 Las Vegas, NV Various 100% 1,514 units 97% Bridge II Multifamily Portfolio 6 Various Various 100% 2,363 units 96% Miami Doral 2-Pack 2 Miami, FL May 2019 100% 720 units 96% Davis Multifamily 2-Pack 2 Various May 2019 100% 454 units 96% Slate Savannah 1 Savannah, GA May 2019 90% 272 units 97% Amara at MetroWest 1 Orlando, FL May 2019 95% 411 units 94% Colorado 3-Pack 3 Denver & Fort Collins, CO May 2019 100% 855 units 95% Edge Las Vegas 1 Las Vegas, NV June 2019 95% 296 units 97% ACG IV Multifamily 2 Various June 2019 95% 606 units 97% Perimeter Multifamily 3-Pack 3 Atlanta, GA June 2019 100% 691 units 96% Anson at the Lakes 1 Charlotte, NC June 2019 100% 694 units 96% San Valiente Multifamily 1 Phoenix, AZ July 2019 95% 604 units 97% Edgewater at the Cove 1 Oregon City, OR Aug. 2019 100% 244 units 93% Haven 124 Multifamily 1 Denver, CO Sept. 2019 100% 562 units 93% Villages at McCullers Walk Multifamily 1 Raleigh, NC Oct. 2019 100% 412 units 94% Canopy at Citrus Park Multifamily 1 Largo, FL Oct. 2019 90% 318 units 96% Ridge Multifamily Portfolio 4 Las Vegas, NV Oct. 2019 90% 1,220 units 95% Charleston on 66th Multifamily 1 Tampa, FL Nov. 2019 95% 258 units 96% Evolve at Timber Creek Multifamily 1 Garner, NC Nov. 2019 100% 304 units 95% Solis at Towne Center Multifamily 1 Glendale, AZ Nov. 2019 100% 240 units 96% Arches at Hidden Creek Multifamily 1 Chandler, AZ Nov. 2019 98% 432 units 92% Terra Multifamily 1 Austin, TX Dec. 2019 100% 372 units 88% Arium Multifamily Portfolio 5 Various Dec. 2019 100% 1,684 units 94% Easton Gardens Multifamily 1 Columbus, OH Feb. 2020 95% 1,064 units 95% Acorn Multifamily Portfolio 21 Various Feb. & May 2020 98% 8,309 units 95% Indigo West Multifamily 1 Orlando, FL March 2020 100% 456 units 94% The Sixes Multifamily 1 Holly Springs, GA Sept. 2020 100% 340 units 94% Park & Market Multifamily 1 Raleigh, NC Oct. 2020 100% 409 units 96% 40Segment and Investment Number of
PropertiesLocation Acquisition Date Ownership Interest(1)Sq. Feet (in thousands)/Units/Keys(2)Occupancy Rate(3)Cortland Lex Multifamily 1 Alpharetta, GA Oct. 2020 100% 360 units 97% The Palmer Multifamily 1 Charlotte, NC Oct. 2020 90% 318 units 95% Grizzly Multifamily Portfolio 2 Atlanta, GA & Nashville, TN Oct. & Nov. 2020 100% 767 units 82% Jaguar Multifamily Portfolio 11 Various Nov. & Dec. 2020 100% 3,788 units 94% Kansas City Multifamily Portfolio 2 Overland Park & Olathe, KS Dec. 2020 100% 620 units 86% The View at Woodstock Multifamily 1 Woodstock, GA Jan. 2021 100% 320 units 97% Southeast Multifamily Portfolio 2 Lebanon, TN & Sanford, FL Feb. 2021 98% 330 units 94% Cortona South Tampa Multifamily 1 Tampa, FL April 2021 100% 300 units 95% Crest at Park Central Multifamily 1 Dallas, TX April 2021 100% 387 units 96% Archer & Rosery Multifamily Portfolio 2 Various April & May 2021 100% 539 units 82% Encore Tessera Multifamily 1 Phoenix, Arizona May 2021 80% 240 units 93% Acorn 2.0 Multifamily Portfolio 4 Various May & June 2021 98% 1,922 units 96% Vue at Centennial Multifamily 1 Las Vegas, NV June 2021 100% 372 units 97% Charlotte Multifamily Portfolio 2 Various June 2021 100% 636 units 71% Haven by Watermark Multifamily 1 Denver, CO June 2021 100% 206 units 95% Highroads MH 3 Phoenix, AZ April 2018 99% 266 units 94% Evergreen Minari MH 2 Phoenix, AZ June 2018 99% 115 units 95% Southwest MH 12 Various June 2018 99% 2,568 units 89% Hidden Springs MH 1 Desert Hot Springs, CA July 2018 99% 317 units 86% SVPAC MH 2 Phoenix, AZ July 2018 99% 234 units 95% Riverest MH 1 Tavares, FL Dec. 2018 99% 130 units 90% Angler MH Portfolio 4 Phoenix, AZ April 2019 99% 770 units 85% Florida MH 4-Pack 4 Various April & July 2019 99% 795 units 93% Impala MH 3 Phoenix & Chandler, AZ July 2019 99% 333 units 99% Clearwater MHC 2-Pack 2 Clearwater, FL March & Aug. 2020 99% 207 units 98% Legacy MH Portfolio 7 Various April 2020 99% 1,896 units 92% May Manor MH 1 Lakeland, FL June 2020 99% 297 units 83% Royal Oaks MH 1 Petaluma, CA Nov. 2020 99% 94 units 99% Southeast MH Portfolio 41 Various Dec. 2020 99% 8,639 units 89% EdR Student Housing Portfolio 20 Various Sept. 2018 95% 10,610 units 92% Mercury 3100 Student Housing 1 Orlando, FL Feb. 2021 100% 840 units 95% Total Residential 298 93,174 units Industrial: Stockton Industrial Park 1 Stockton, CA Feb. 2017 100% 878 sq. ft. 100% HS Industrial Portfolio 36 Various April 2017 100% 5,838 sq. ft. 99% Fairfield Industrial Portfolio 11 Fairfield, NJ Sept. 2017 100% 578 sq. ft. 100% Southeast Industrial Portfolio 5 Various Nov. 2017 100% 1,927 sq. ft. 100% Kraft Chicago Industrial Portfolio 3 Aurora, IL Jan. 2018 100% 1,693 sq. ft. 100% Canyon Industrial Portfolio 145 Various March 2018 100% 20,954 sq. ft. 98% HP Cold Storage Industrial Portfolio 6 Various May 2018 100% 2,259 sq. ft. 100% Meridian Industrial Portfolio 106 Various Nov. 2018 99% 14,014 sq. ft. 98% Stockton Distribution Center 1 Stockton, CA Dec. 2018 100% 987 sq. ft. 100% Summit Industrial Portfolio 8 Atlanta, GA Dec. 2018 100% 631 sq. ft. 92% 4500 Westport Drive 1 Harrisburg, PA Jan. 2019 100% 179 sq. ft. 100% Morgan Savannah 1 Savannah, GA April 2019 100% 357 sq. ft. 100% Minneapolis Industrial Portfolio 34 Minneapolis, MN April 2019 100% 2,459 sq. ft. 97% Atlanta Industrial Portfolio 61 Atlanta, GA May 2019 100% 3,779 sq. ft. 89% D.C. Powered Shell Warehouse Portfolio 9 Ashburn & Manassas, VA June & Dec. 2019 90% 1,471 sq. ft. 100% Patriot Park Industrial Portfolio 2 Durham, NC Sept. 2019 100% 323 sq. ft. 100% Denali Industrial Portfolio 18 Various Sept. 2019 100% 4,098 sq. ft. 95% Jupiter 12 Industrial Portfolio 315 Various Sept. 2019 100% 63,979 sq. ft. 95% 2201 Main Street 1 San Diego, CA Oct. 2019 100% 260 sq. ft. N/A Triangle Industrial Portfolio 37 Greensboro, NC Jan. 2020 100% 2,783 sq. ft. 92% Midwest Industrial Portfolio 27 Various Feb. 2020 100% 5,940 sq. ft. 98% Pancal Industrial Portfolio 12 Various Feb. & April 2020 100% 2,109 sq. ft. 100% Grainger Distribution Center 1 Jacksonville, FL March 2020 100% 297 sq. ft. 100% Diamond Industrial 1 Rico Rivera, CA Aug. 2020 100% 243 sq. ft. 100% Inland Empire Industrial Portfolio 2 Etiwanda & Fontana, CA Sept. 2020 100% 404 sq. ft. 100% Shield Industrial Portfolio 13 Various Dec. 2020 100% 2,079 sq. ft. 100% 7520 Georgetown Industrial 1 Indianapolis, IN Dec. 2020 100% 425 sq. ft. 100% WC Infill Industrial Portfolio 17 Various Jan. 2021 85% 2,926 sq. ft. 99% 41Segment and Investment Number of
PropertiesLocation Acquisition Date Ownership Interest(1)Sq. Feet (in thousands)/Units/Keys(2)Occupancy Rate(3)Vault Industrial Portfolio 35 Various Jan. 2021 41% 6,585 sq. ft. 96% Chicago Infill Industrial Portfolio 7 Various Feb. 2021 100% 1,058 sq. ft. 100% Greensboro Industrial Portfolio 19 Various April 2021 100% 2,068 sq. ft. 93% Highpoint Powered Shell Portfolio 2 Sterling, VA June 2021 100% 430 sq. ft. 100% Total Industrial 938 154,011 sq. ft. Net Lease: Bellagio Net Lease 1 Las Vegas, NV Nov. 2019 95% 8,507 sq. ft. N/A MGM Grand Net Lease 1 Las Vegas, NV Feb. 2020 49.9% 6,917 sq. ft. N/A Mandalay Bay Net Lease 1 Las Vegas, NV Feb. 2020 49.9% 9,324 sq. ft. N/A Total Net Lease 3 24,748 sq. ft. Hospitality: Hyatt Place UC Davis 1 Davis, CA Jan. 2017 100% 127 keys 46% Hyatt Place San Jose Downtown 1 San Jose, CA June 2017 100% 240 keys 27% Florida Select-Service 4-Pack 4 Tampa & Orlando, FL July 2017 100% 476 keys 58% Hyatt House Downtown Atlanta 1 Atlanta, GA Aug. 2017 100% 150 keys 52% Boston/Worcester Select-Service 3-Pack 3 Boston & Worcester, MA Oct. 2017 100% 374 keys 53% Henderson Select-Service 2-Pack 2 Henderson, NV May 2018 100% 228 keys 70% Orlando Select-Service 2-Pack 2 Orlando, FL May 2018 100% 254 keys 61% Corporex Select Service Portfolio 5 Various Aug. 2018 100% 601 keys 59% JW Marriott San Antonio Hill Country Resort 1 San Antonio, TX Aug. 2018 100% 1,002 keys 33% Hampton Inn & Suites Federal Way 1 Seattle, WA Oct. 2018 100% 142 keys 48% Staybridge Suites Reno 1 Reno, NV Nov. 2018 100% 94 keys 81% Salt Lake City Select Service 3 Pack 3 Salt Lake City, UT Nov. 2018 60% 454 keys 60% Courtyard Kona 1 Kailua-Kona, HI March 2019 100% 455 keys 35% Raven Select Service Portfolio 21 Various June 2019 100% 2,555 keys 55% Urban 2-Pack 1 Chicago, IL July 2019 100% 337 keys 18% Hyatt Regency Atlanta 1 Atlanta, GA Sept. 2019 100% 1,260 keys 31% RHW Select Service Portfolio 9 Various Nov. 2019 100% 923 keys 67% Total Hospitality 58 9,672 keys Self Storage: East Coast Storage Portfolio 21 Various Aug. 2019 98% 1,416 sq. ft. 95% Phoenix Storage 2-Pack 2 Phoenix, AZ March 2020 98% 111 sq. ft. 99% Cactus Storage Portfolio 18 Various Sept. & Oct. 2020 98% 1,115 sq. ft. 91% Caltex Storage Portfolio 4 Various Nov. & Dec. 2020 98% 241 sq. ft. 96% Simply Self Storage 102 Various Dec. 2020 100% 7,843 sq. ft. 94% Florida Self Storage Portfolio 2 Cocoa & Rockledge, FL Dec. 2020 98% 158 sq. ft. 81% Pace Storage Portfolio 1 Pace, FL Dec. 2020 98% 74 sq. ft. 96% Total Self Storage 150 10,958 sq. ft. Retail: Bakers Centre 1 Philadelphia, PA March 2017 100% 236 sq. ft. 100% Plaza Del Sol Retail 1 Burbank, CA Oct. 2017 100% 166 sq. ft. 99% Vista Center 1 Miami, FL Aug. 2018 100% 89 sq. ft. 92% El Paseo Simi Valley 1 Simi Valley, CA June 2019 100% 197 sq. ft. 90% Towne Center East 1 Signal Hill, CA Sept. 2019 100% 163 sq. ft. 100% Plaza Pacoima 1 Pacoima, CA Oct. 2019 100% 204 sq. ft. 100% Canarsie Plaza 1 Brooklyn, NY Dec. 2019 100% 274 sq. ft. 99% SoCal Grocery Portfolio 6 Various Jan. 2020 100% 689 sq. ft. 93% Total Retail 13 2,018 sq. ft. Office: EmeryTech Office 1 Emeryville, CA Oct. 2019 100% 228 sq. ft. 95% Coleman Highline Office 1 San Jose, CA Oct. 2020 100% 357 sq. ft. 100% Atlanta Tech Center Office 1 Atlanta, GA May 2021 98% 361 sq. ft. 100% Total Office 3 946 sq. ft. Total Investments in Real Estate 1,463 42Certain of the joint venture agreements entered into by the Company provide the seller or the other partner a profits interest based on achieving certain internal rate of return hurdles. Such investments are consolidated by us and any profits interest due to the other partners is reported within non-controlling interests. The table above also includes properties owned by unconsolidated entities.(1)Residential includes various forms of rental housing such as multifamily, manufactured housing, and student housing. Residential units include manufactured housing sites and student housing beds.(2)The occupancy rate for our industrial, retail and office investments includes all leased square footage as of June 30, 2021. The occupancy rate for our self storage and manufactured housing investments includes occupied square footage and occupied units, respectively, as of June 30, 2021. The occupancy rate for our student housing and other residential investments is defined as the percentage of actual rent divided by gross potential rent (defined as actual rent for occupied units and market rent for vacant units) for the three months ended June 30, 2021. The occupancy rate for our hospitality investments is the average occupancy rate for the 12 months ended June 30, 2021. The occupancy rate for hospitality investments owned less than 12 months is not included.Lease ExpirationsThe following schedule details the expiring leases at our consolidated industrial, net lease, retail, and office properties by annualized base rent and square footage as of June 30, 2021 ($ and square feet data in thousands). The table below excludes our residential and self-storage properties as substantially all leases at such properties expire within 12 months:Year Number of
Expiring LeasesAnnualizedBase Rent(1)% of Total
Annualized Base
Rent ExpiringSquare
Feet% of Total Square
Feet Expiring2021 (remaining) 221 $ 37,894 4% 7,094 5% 2022 559 118,220 11% 22,167 15% 2023 482 122,266 12% 24,018 16% 2024 477 100,107 9% 18,713 13% 2025 325 75,147 7% 13,400 9% 2026 305 108,808 10% 22,359 15% 2027 120 48,860 5% 9,436 7% 2028 100 39,841 4% 6,524 5% 2029 59 38,347 4% 4,652 3% 2030 60 57,204 5% 6,369 4% 2031 34 12,359 1% 1,577 1% Thereafter 51 293,104 28% 9,928 7% Total 2,793 $ 1,052,157 100% 146,237 100% (1)Annualized base rent is determined from the annualized June 30, 2021 base rent per leased square foot of the applicable year and excludes tenant recoveries, straight-line rent, and above-market and below-market lease amortization.43Investments in Real Estate DebtThe following charts further describe the diversification of our investments in real estate debt by credit rating and collateral type based on fair value as of June 30, 2021:
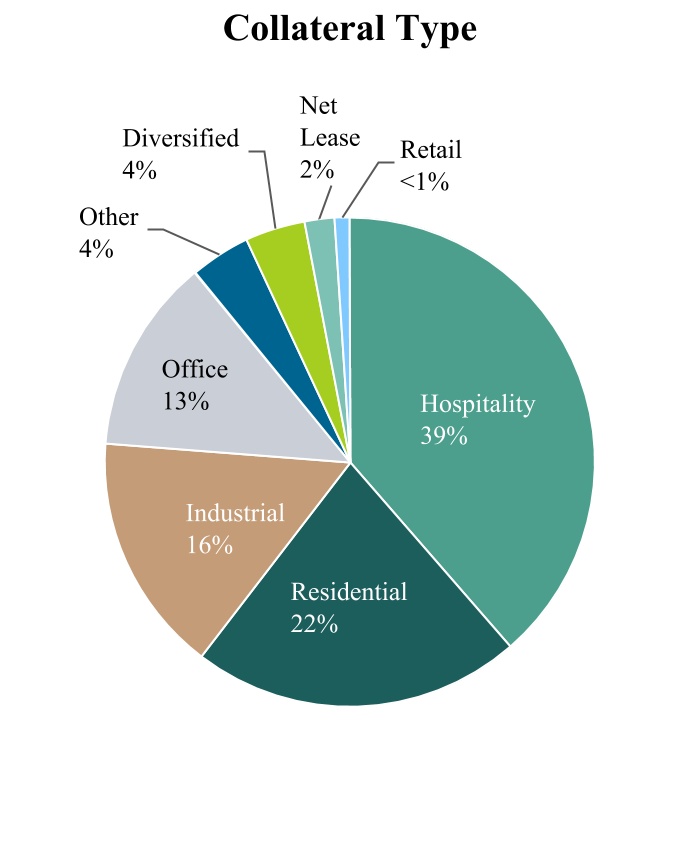 The following table details our investments in real estate debt as of June 30, 2021 ($ in thousands):
 June 30, 2021 Type of Security/Loan WeightedAverageCoupon(1)WeightedAverageMaturity Date(2)Face
AmountCost
BasisFair
ValueCMBS(3)L+2.5% 9/25/2025 $ 5,013,759 $ 4,869,931 $ 4,887,941 Corporate bonds L+4.2% 10/21/2027 161,861 161,149 164,149 RMBS 3.9% 8/27/2031 52,291 52,446 52,597 Total real estate securities 3.4% 11/11/2025 5,227,911 5,083,526 5,104,687 Term loans L+3.1% 9/9/2021 451,274 418,725 449,826 Mezzanine loans L+6.3% 1/28/2025 183,750 181,701 174,865 Total real estate loans L+4.0% 8/21/2022 635,024 600,426 624,691 Total investments in real estate debt 3.5% 7/5/2025 $ 5,862,935 $ 5,683,952 $ 5,729,378 (1)The term “L” refers to the relevant floating benchmark rates, which include USD LIBOR, GBP LIBOR, EURIBOR and SONIA, as applicable to each security and loan. Fixed rate CMBS are reflected as a spread over the relevant floating benchmark rates, as of June 30, 2021 and December 31, 2020, respectively, for purposes of the weighted-averages. Weighted Average Coupon for CMBS does not include zero coupon securities.(2)Weighted average maturity date is based on the fully extended maturity date of the instrument or, in the case of CMBS and RMBS, the underlying collateral.(3)Face amount excludes interest-only securities with a notional amount of $2.8 billion and $2.3 billion as of June 30, 2021 and December 31, 2020, respectively. In addition, CMBS includes zero coupon securities of $208.8 million and $236.1 million as of June 30, 2021 and December 31, 2020, respectively.44Results of OperationsThe following table sets forth information regarding our consolidated results of operations ($ in thousands, except per share data): Three Months Ended Change June 30, 2021 March 31, 2021 $ Revenues Rental revenue $ 680,809 $ 652,916 $ 27,893 Hospitality revenue 102,660 58,143 44,517 Other revenue 26,714 22,396 4,318 Total revenues 810,183 733,455 76,728 Expenses Rental property operating 247,985 237,705 10,280 Hospitality operating 75,093 55,680 19,413 General and administrative 7,789 6,960 829 Management fee 92,183 73,095 19,088 Performance participation allocation 299,373 143,215 156,158 Depreciation and amortization 399,621 400,387 (766) Total expenses 1,122,044 917,042 205,002 Other income (expense) Income from unconsolidated entities 70,028 34,682 35,346 Income (loss) from investments in real estate debt 116,573 239,361 (122,788) Net gain on dispositions of real estate 7,372 15,430 (8,058) Interest income 9 86 (77) Interest expense (181,529) (181,618) 89 Loss on extinguishment of debt (2,757) (3,416) 659 Other income (expense) 125,583 107,946 17,637 Total other income (expense) 135,279 212,471 (77,192) Net (loss) income $ (176,582) $ 28,884 $ (205,466) Net (income) loss attributable to non-controlling interests in third party joint ventures $ (264) $ (59) $ (205) Net (income) loss attributable to non-controlling interests in BREIT OP 2,089 (353) 2,442 Net (loss) income attributable to BREIT stockholders $ (174,757) $ 28,472 $ (203,229) Net (loss) income per share of common stock — basic and diluted $ (0.08) $ 0.01 $ (0.09) Total RevenuesDuring the three months ended June 30, 2021, revenues increased $76.7 million as compared to the three months ended March 31, 2021. The increase can primarily be attributed to a $58.6 million increase in same property revenues and a $18.1 million increase in non-same property revenues. See Same Property Results of Operations section for further details of the increase in same property revenues. The non-same property revenue increase is due to the real estate acquisitions we made during the first and second quarter of 2021.Rental Property Operating ExpensesDuring the three months ended June 30, 2021, rental property operating expenses increased $10.2 million as compared to the three months ended March 31, 2021. The increase can primarily be attributed to a $4.0 million increase in same property operating expenses and a $6.2 million increase in non-same property operating expenses. The non-same property operating expense increase is due to the real estate acquisitions we made during the first and second quarter of 2021.Hospitality Operating ExpensesDuring the three months ended June 30, 2021, hospitality operating expenses increased $19.4 million as compared to the three months ended March 31, 2021. The increase in hospitality operating expenses was primarily the result of increased operating expenses resulting from increased occupancy at our hotels during the three months ended June 30, 2021.45General and Administrative ExpensesDuring the three months ended June 30, 2021, general and administrative expenses increased $0.8 million compared to the three months ended March 31, 2021. The increase was primarily due to various corporate level expenses related to the increased size of our portfolio.Management FeeDuring the three months ended June 30, 2021, the management fee increased $19.1 million compared to the three months ended March 31, 2021. The increase was primarily due to the $7.2 billion increase in our NAV from March 31, 2021 to June 30, 2021.Performance Participation AllocationDuring the three months ended June 30, 2021, the unrealized performance participation allocation accrual increased $156.2 million compared to the three months ended March 31, 2021. The increase was primarily the result of our increased NAV and a higher total return for the three months ended June 30, 2021 compared to the three months ended March 31, 2021.Reimbursement by the AdviserPursuant to the advisory agreement between us, the Adviser and BREIT OP, the Adviser will reimburse us for any expenses that cause our Total Operating Expenses in any four consecutive fiscal quarters to exceed the greater of: (1) 2% of our Average Invested Assets or (2) 25% of our Net Income (each as defined in our charter) (the “2%/25% Limitation”).Notwithstanding the foregoing, to the extent that our Total Operating Expenses exceed these limits and the independent directors determine that the excess expenses were justified based on unusual and nonrecurring factors that they deem sufficient, the Adviser would not be required to reimburse us.For the four fiscal quarters ended June 30, 2021, our Total Operating Expenses exceeded the 2%/25% Limitation. Based upon a review of unusual and non-recurring factors, including but not limited to outsized performance during this period resulting in increased performance participation allocation expense, our independent directors determined that the excess expenses were justified.Depreciation and AmortizationDuring the three months ended June 30, 2021, depreciation and amortization decreased $0.8 million compared to the three months ended March 31, 2021. The decrease is attributable to a decrease in amortization of $11.5 million due to the full amortization of certain intangible assets, which was offset by an increase in depreciation of $10.7 million due to the increase in properties within our portfolio.Income from Unconsolidated EntitiesDuring the three months ended June 30, 2021, income from unconsolidated entities increased $35.3 million compared to the three months ended March 31, 2021. The increase is primarily due to an increase of $35.0 million in the fair value of our investment in the WC Infill Industrial Portfolio and Vault Industrial Portfolio from March 31, 2021 to June 30, 2021.Income (Loss) from Investments in Real Estate DebtDuring the three months ended June 30, 2021, income (loss) from our investments in real estate debt decreased $122.8 million compared to the three months ended March 31, 2021. The decrease was primarily attributable to $61.1 million of unrealized gains during the three months ended June 30, 2021 compared to $217.1 million of unrealized gains during the three months ended March 31, 2021. This decrease was offset by $6.9 million of realized gains during the three months ended June 30, 2021 compared to $20.6 million of realized losses during the three months ended March 31, 2021. Additionally, interest income increased $5.9 million during the three months ended June 30, 2021, compared to the three months ended March 31, 2021.Net Gain on Dispositions of Real EstateDuring the three months ended June 30, 2021, net gains on dispositions of real estate decreased $8.1 million compared to the three months ended March 31, 2021. During the three months ended June 30, 2021, we recorded $7.4 million of net gains from the disposition of one residential property compared to a $15.4 million net gain from the sales of four residential properties during the three months ended March 31, 2021.46Interest ExpenseDuring the three months ended June 30, 2021, interest expense decreased $0.1 million compared to the three months ended March 31, 2021. The decrease was primarily due to the decrease in our secured financings of investments in real estate debt. The decrease was offset by an increase in interest expense related to additional property-level debt.Other Income (Expense)During the three months ended June 30, 2021, other income (expense) increased $17.6 million compared to the three months ended March 31, 2021. The increase was primarily due to $142.5 million of unrealized gains on our investments in equity securities and $27.3 million of unrealized losses on our interest rate swaps during the three months ended June 30, 2021, compared to $82.3 million of unrealized gains on our investments in equity securities and $17.2 million of unrealized gains on our interest rate swaps during the three months ended March 31, 2021. Additionally, dividend income from our investments in equity securities increased $2.4 million during the three months ended June 30, 2021.The following table sets forth information regarding our consolidated results of operations ($ in thousands): Six months ended June 30, 2021 vs. 2020 2021 2020 $ Revenues Rental revenue $ 1,333,725 $ 1,085,812 $ 247,913 Hospitality revenue 160,803 149,253 11,550 Other revenue 49,110 32,564 16,546 Total revenues 1,543,638 1,267,629 276,009 Expenses Rental property operating 485,690 355,423 130,267 Hospitality operating 130,773 143,829 (13,056) General and administrative 14,749 13,595 1,154 Management fee 165,278 102,925 62,353 Performance participation allocation 442,588 — 442,588 Impairment of investments in real estate — 6,126 (6,126) Depreciation and amortization 800,008 676,157 123,851 Total expenses 2,039,086 1,298,055 741,031 Other income (expense) Income from unconsolidated entities 104,710 38,605 66,105 Income (loss) from investments in real estate debt 355,934 (523,258) 879,192 Net gain on dispositions of real estate 22,802 371 22,431 Interest income 95 1,980 (1,885) Interest expense (363,147) (365,083) 1,936 Loss on extinguishment of debt (6,173) (1,237) (4,936) Other income (expense) 233,529 (19,770) 253,299 Total other income (expense) 347,750 (868,392) 1,216,142 Net (loss) income $ (147,698) $ (898,818) $ 751,120 Net (income) loss attributable to non-controlling interests in third party joint ventures $ (323) $ 1,203 $ (1,526) Net (income) loss attributable to non-controlling interests in BREIT OP 1,736 11,967 (10,231) Net (loss) income attributable to BREIT stockholders $ (146,285) $ (885,648) $ 739,363 Net (loss) income per share of common stock — basic and diluted $ (0.07) $ (0.59) $ 0.52 Revenues, Rental Property Operating and Hospitality Operating ExpensesDue to the significant amount of acquisitions of real estate and investments in real estate debt we have made since June 30, 2020, our revenues and operating expenses for the six months ended June 30, 2021 and 2020 are not comparable. See below for a discussion of the properties in our portfolio that were owned for both of the full six months ended June 30, 2021 and 2020.47General and Administrative ExpensesDuring the six months ended June 30, 2021, general and administrative expenses increased $1.2 million compared to the corresponding period in 2020. The increase was primarily due to various corporate level expenses related to the increased size of our portfolio.Management FeeDuring the six months ended June 30, 2021, the management fee increased $62.4 million compared to the corresponding period in 2020. The increase was primarily due to the $14.2 billion increase in our NAV from June 30, 2020 to June 30, 2021.Performance Participation AllocationDuring the six months ended June 30, 2021, the unrealized performance participation allocation accrual increased $442.6 million compared to the corresponding period in 2020. The increase was primarily the result of our increased NAV and a higher total return for the six months ended June 30, 2021 compared to the corresponding period in 2020.Depreciation and AmortizationDuring the six months ended June 30, 2021, depreciation and amortization increased $123.9 million compared to the corresponding period in 2020. The increase was driven by the growth in our portfolio, which increased to 1,463 properties as of June 30, 2021 from 1,171 properties as of June 30, 2020.Income from Unconsolidated EntitiesDuring the six months ended June 30, 2021, income from unconsolidated entities increased $66.1 million compared to the corresponding period in 2020. The increase is primarily due to acquisition of the WC Infill Industrial Portfolio and the Vault Industrial Portfolio in January 2021 and a full six months of income from our investment in MGM Grand & Mandalay Bay.Income (Loss) from Investments in Real Estate DebtDuring the six months ended June 30, 2021, income (loss) from our investments in real estate debt increased $879.2 million compared to the corresponding period in 2020. The increase was primarily attributable to $278.1 million of unrealized gains during the six months ended June 30, 2021 compared to $623.3 million of unrealized losses during the corresponding period in 2020. The COVID-19 pandemic caused significant market pricing and liquidity dislocation in March 2020, causing a broad-based market decline impacting the unrealized value of certain of our investments in real estate debt. However, beginning in the second quarter of 2020 and continuing through the second quarter of 2021, we continued to see a recovery in the fair value of our investments in real estate debt.Net Gain on Dispositions of Real EstateDuring the six months ended June 30, 2021, net gains on dispositions of real estate increased $22.4 million compared to the corresponding period in 2020. During the six months ended June 30, 2021, we recorded $22.8 million of net gains from the sales of five residential properties compared to a $0.4 million net gain from the disposition of one industrial property during the corresponding period in 2020.Interest ExpenseDuring the six months ended June 30, 2021, interest expense decreased $1.9 million compared to the corresponding period in 2020. The decrease was primarily due to a decrease in our indebtedness and a decrease in the applicable floating rate benchmark rates associated with such indebtedness in 2021 as compared to 2020.Other Income (Expense)During the six months ended June 30, 2021, other income (expense) increased $253.3 million compared to the corresponding period in 2020. The increase was primarily due to $224.8 million of unrealized gains on our investments in equity securities and $10.1 million of unrealized losses on our interest rate swaps during the six months ended June 30, 2021, compared to $25.2 million of unrealized losses on our investments in equity securities and a $20.8 million forfeited deposit related to a transaction we decided not to pursue during the corresponding period in 2020.48Same Property Results of OperationsWe evaluate our consolidated results of operations on a same property basis, which allows us to analyze our property operating results excluding acquisitions and dispositions during the periods under comparison. Properties in our portfolio are considered same property if they were owned for the full periods presented, otherwise they are considered non-same property. Recently developed properties that have not achieved stabilized occupancy (defined as 90% or greater for properties other than hotels) and properties held for sale are excluded from same property results and are considered non-same property. We do not consider our investments in real estate debt segment to be same property.For the three months ended June 30, 2021 and March 31, 2021, our same property portfolio consisted of 857 industrial, 242 residential, 106 self storage, 58 hotel, 13 retail, one net lease, and one office property. For the six months ended June 30, 2021 and 2020, our same property portfolio consisted of 760 industrial, 173 residential, 58 hotel, seven retail, one net lease, and one office property.Same property operating results are measured by calculating same property net operating income (“NOI”). Same property NOI is a supplemental non-GAAP disclosure of our operating results that we believe is meaningful as it enables management to evaluate the impact of occupancy, rents, leasing activity, and other controllable property operating results at our real estate. We define same property NOI as operating revenues less operating expenses, which exclude (i) impairment of investments in real estate (ii) depreciation and amortization, (iii) interest expense, and (iv) other non-property related revenue and expense items such as (a) general and administrative expenses, (b) management fee, (c) performance participation allocation, (d) affiliate incentive compensation awards, (e) income from unconsolidated entities, (f) income (loss) from investments in real estate debt, (g) net gain on dispositions of real estate, (h) interest income, (i) loss on extinguishment of debt, and (j) other income (expense).Our same property NOI may not be comparable to that of other REITs and should not be considered to be more relevant or accurate in evaluating our operating performance than the current GAAP methodology used to calculate our net income (loss).The following table reconciles GAAP net income (loss) attributable to BREIT stockholders to same property NOI for the three months ended June 30, 2021 and March 31, 2021 ($ in thousands): Three Months Ended Change June 30, 2021 March 31, 2021 $ Net income (loss) attributable to BREIT stockholders $ (174,757) $ 28,472 $ (203,229) Adjustments to reconcile to same property NOI General and administrative 7,789 6,960 829 Management fee 92,183 73,095 19,088 Performance participation allocation 299,373 143,215 156,158 Incentive compensation awards 692 1,177 (485) Depreciation and amortization 399,621 400,387 (766) Income from unconsolidated entities (70,028) (34,682) (35,346) (Income) loss from investments in real estate debt (116,573) (239,361) 122,788 Net gains on dispositions of real estate (7,372) (15,430) 8,058 Interest income (9) (86) 77 Interest expense 181,529 181,618 (89) Loss on extinguishment of debt 2,757 3,416 (659) Other (income) expense (125,583) (107,946) (17,637) Net income (loss) attributable to non-controlling interests in third party joint ventures 264 59 205 Net income (loss) attributable to non-controlling interests in BREIT OP (2,089) 353 (2,442) NOI 487,797 441,247 46,550 Non-same property NOI 29,548 18,027 11,521 Same property NOI $ 458,249 $ 423,220 $ 35,029 49The following table details the components of same property NOI for the three months ended June 30, 2021 and March 31, 2021 ($ in thousands): Three Months Ended Change June 30, 2021 March 31, 2021 $ % Same property NOI Rental revenue $ 632,758 $ 621,696 $ 11,062 2% Hospitality revenue 102,661 58,143 44,518 77% Other revenue 24,055 21,065 2,990 14% Total revenues 759,474 700,904 58,570 8% Rental property operating 226,127 222,139 3,988 2% Hospitality operating 75,098 55,545 19,553 35% Total expenses 301,225 277,684 23,541 8% Same property NOI $ 458,249 $ 423,220 $ 35,029 8% Same Property – Rental RevenueSame property rental revenue increased $11.1 million for the three months ended June 30, 2021 compared to the three months ended March 31, 2021. The increase was due to a $9.2 million increase in base rental revenue and a $2.0 million decrease in our bad debt reserve. Our bad debt reserve represents the amount of rental revenue we anticipate we will not be able to collect from our tenants. The increase was partially offset by a $0.1 million decrease in tenant reimbursement income.The following table details the changes in base rental revenue period over period ($ in thousands):June 30, 2021 vs. March 31, 2021 Three Months Ended Change in Base
Rental RevenueChange in
Occupancy RateChange in Average
Effective Annual
Base Rent Per Leased
Square Foot/Unit(1)June 30, 2021 March 31, 2021 Residential $ 267,586 $ 263,475 $ 4,111 —% +1% Industrial 178,201 173,934 4,267 +1% +1% Net Lease 82,795 82,795 — —% —% Self Storage 23,179 21,564 1,615 +2% +5% Retail 11,841 12,547 (706) 1% (6)% Office 6,849 6,889 (40) —% (1)% Total base rental revenue $ 570,451 $ 561,204 $ 9,247 (1)The annualized base rent per leased square foot or unit for the three months ended June 30, 2021 and the three months ended March 31, 2021 includes straight-line rent and above-market and below-market lease amortization.Same Property – Hospitality RevenueSame property hospitality revenue increased $44.5 million for the three months ended June 30, 2021 compared to the three months ended March 31, 2021. As the economy continues to reopen and travel restrictions ease from the COVID-19 pandemic, we have begun to see a recovery in our hospitality assets. ADR for the hotels in our same property portfolio increased from $113 to $140 while occupancy increased 16% and RevPAR increased from $56 to $91 during the three months ended June 30, 2021 compared to the three months ended March 31, 2021.Same Property – Other RevenueSame property other revenue increased $3.0 million for the three months ended June 30, 2021 compared to the three months ended March 31, 2021. The increase was primarily due to increased non-recurring lease related fees such as late fees, lease termination fees and other miscellaneous fees at our residential properties and increased golf course revenues at our full service hotel in San Antonio, Texas during the three months ended June 30, 2021.50Same Property – Rental Property Operating ExpensesSame property rental property operating expenses increased $4.0 million during the three months ended June 30, 2021, compared to the three months ended March 31, 2021. The increase in rental property operating expenses for the three months ended June 30, 2021 was primarily the result of increased unit turnover expenses, payroll and administrative expenses, and property management fees at our residential properties.Same Property – Hospitality Operating ExpensesSame property hospitality operating expenses increased $19.6 million during the three months ended June 30, 2021, compared to the three months ended March 31, 2021. The increase in hospitality operating expenses was primarily the result of increased operating expenses resulting from increased occupancy at our hotels during the three months ended June 30, 2021.The following table reconciles GAAP net income (loss) attributable to BREIT stockholders to same property NOI for the six months ended June 30, 2021 and 2020 ($ in thousands): Six Months Ended June 30, Change 2021 2020 $ Net income (loss) attributable to BREIT stockholders $ (146,285) $ (885,648) $ 739,363 Adjustments to reconcile to same property NOI General and administrative 14,749 13,595 1,154 Management fee 165,278 102,925 62,353 Performance participation allocation 442,588 — 442,588 Incentive compensation awards 1,869 1,000 869 Impairment of investments in real estate — 6,126 (6,126) Depreciation and amortization 800,008 676,157 123,851 Income from unconsolidated entities (104,710) (38,605) (66,105) (Income) loss from investments in real estate debt (355,934) 523,258 (879,192) Net gains on dispositions of real estate (22,802) (371) (22,431) Interest income (95) (1,980) 1,885 Interest expense 363,147 365,083 (1,936) Loss on extinguishment of debt 6,173 1,237 4,936 Other (income) expense (233,529) 19,770 (253,299) Net income (loss) attributable to non-controlling interests in third party joint ventures 323 (1,203) 1,526 Net income (loss) attributable to non-controlling interests in BREIT OP (1,736) (11,967) 10,231 NOI 929,044 769,377 159,667 Non-same property NOI 209,511 79,779 129,732 Same property NOI $ 719,533 $ 689,598 $ 29,935 The following table details the components of same property NOI for the six months ended June 30, 2021 and 2020 ($ in thousands): Six Months Ended June 30, Change 2021 2020 $ % Same property NOI Rental revenue $ 991,078 $ 960,267 $ 30,811 3% Hospitality revenue 160,803 141,455 19,348 14% Other revenue 34,470 27,088 7,382 27% Total revenues 1,186,351 1,128,810 57,541 5% Rental property operating 336,175 301,904 34,271 11% Hospitality operating 130,643 137,308 (6,665) (5)% Total expenses 466,818 439,212 27,606 6% Same property NOI $ 719,533 $ 689,598 $ 29,935 4% 51Same Property – Rental RevenueSame property rental revenue increased $30.8 million for the six months ended June 30, 2021 compared to the corresponding period in 2020. The increase was due to a $21.0 million increase in base rental revenue and a $13.0 million increase in tenant reimbursement income. The increase was partially offset by a $3.2 million increase in our bad debt reserve. Our bad debt reserve represents the amount of rental revenue we anticipate we will not be able to collect from our tenants.The following table details the changes in base rental revenue period over period ($ in thousands):2021 vs. 2020 Six Months Ended June 30, Change in Base
Rental RevenueChange in
Occupancy RateChange in Average
Effective Annual
Base Rent Per Leased
Square Foot/Unit(1)2021 2020 Residential $ 393,155 $ 377,952 $ 15,203 +1% +3% Industrial 311,363 305,339 6,024 +1% +2% Net Lease 165,589 165,589 — —% —% Retail 14,907 15,125 (218) (1)% (1)% Office 4,138 4,138 — —% —% Total base rental revenue $ 889,152 $ 868,143 $ 21,009 (1)The annualized base rent per leased square foot or unit for the six months ended June 30, 2021 and 2020 includes straight-line rent and above-market and below-market lease amortization.Same Property – Hospitality RevenueSame property hospitality revenue increased $19.3 million for the six months ended June 30, 2021 compared to corresponding period in 2020. ADR for the hotels in our same property portfolio decreased from $144 to $128 while occupancy increased 15% and RevPAR increased from $61 to $74 during the six months ended June 30, 2021 compared to the six months ended June 30, 2020.Same Property – Other RevenueSame property other revenue increased $7.4 million for the six months ended June 30, 2021 compared to the corresponding period in 2020. The increase was primarily due to increased golf course revenues at our full service hotel in San Antonio, Texas and increased lease termination fees and ancillary income at our industrial properties during the six months ended June 30, 2021.Same Property – Rental Property Operating ExpensesSame property rental property operating expenses increased $34.3 million during the six months ended June 30, 2021, compared to the corresponding period in 2020. The increase in rental property operating expenses for the six months ended June 30, 2021 was primarily the result of increased real estate taxes, snow removal, and insurance expenses at our industrial properties and increased insurance expenses, COVID-19 related expenses and general operating expenses at our residential properties.Same Property – Hospitality Operating ExpensesSame property hospitality operating expenses decreased $6.7 million during the six months ended June 30, 2021, compared to the corresponding period in 2020. The decrease in hospitality operating expenses was primarily the result of decreased payroll expenses at our hotels during the six months ended June 30, 2021.Non-same Property NOIDue to our substantial fundraising and continued deployment of the net proceeds raised into new property acquisitions, non-same property NOI is not comparable period-over-period. We expect the non-same property NOI variance period-over-period to continue as we raise more proceeds from selling shares of our common stock and invest in additional new property acquisitions.52Funds from Operations, Adjusted Funds from Operations and Funds Available for DistributionWe believe funds from operations (“FFO”) is a meaningful non-GAAP supplemental measure of our operating results. Our condensed consolidated financial statements are presented using historical cost accounting which, among other things, requires depreciation of real estate investments to be calculated on a straight-line basis. As a result, our operating results imply that the value of our real estate investments have decreased over time. However, we believe that the value of our real estate investments will fluctuate over time based on market conditions and, as such, depreciation under historical cost accounting may be less informative as a measure of our performance. FFO is an operating metric defined by the National Association of Real Estate Investment Trusts (“NAREIT”) that is broadly used in the REIT industry. FFO, as defined by NAREIT and presented below, is calculated as net income or loss (computed in accordance with GAAP), excluding (i) depreciation and amortization, (ii) impairment of investments in real estate, (iii) net gains or losses from sales of real estate, and (iv) similar adjustments for non-controlling interests and unconsolidated entities.We also believe that adjusted FFO (“AFFO”) is an additional meaningful non-GAAP supplemental measure of our operating results. AFFO further adjusts FFO to better reflect the performance of our portfolio by adjusting for items we believe are not directly attributable to our operations. Our adjustments to FFO to arrive at AFFO include removing the impact of (i) straight-line rental income and expense, (ii) amortization of above- and below-market lease intangibles, (iii) amortization of mortgage premium/discount, (iv) unrealized losses (gains) from changes in fair value of financial instruments, (v) net forfeited investment deposits, (vi) amortization of restricted stock awards, (vii) the performance participation allocation to our Special Limited Partner or other incentive compensation awards that are based on our Net Asset Value, inclusive of unrealized gains and losses not recorded in GAAP net income (loss) , (viii) gain or loss on involuntary conversion, (ix) amortization of deferred financing costs, (x) losses (gains) on extinguishment of debt, and (xi) similar adjustments for non-controlling interests and unconsolidated entities.We also believe funds available for distribution (“FAD”) is an additional meaningful non-GAAP supplemental measure of our operating results. FAD provides useful information for considering our operating results and certain other items relative to the amount of our distributions. Further, FAD is a metric, among others, that is considered by our board of directors and executive officers when determining the amount of our dividend to stockholders, and we believe is therefore meaningful to stockholders. FAD is calculated as AFFO adjusted for (i) management fees paid in shares or BREIT OP units, even if subsequently repurchased by us, (ii) realized losses (gains) on financial instruments, (iii) recurring tenant improvements, leasing commissions, and other capital expenditures, (iv) stockholder servicing fees paid during the period, and (v) similar adjustments for non-controlling interests and unconsolidated entities. FAD is not indicative of cash available to fund our cash needs and does not represent cash flows from operating activities in accordance with GAAP, as it excludes (i) adjustments for working capital items and (ii) amortization of discounts and premiums on investments in real estate debt. Cash flows from operating activities in accordance with GAAP would generally be adjusted for such items. Furthermore, FAD is adjusted for stockholder servicing fees and recurring tenant improvements, leasing commissions, and other capital expenditures, which are not considered when determining cash flows from operating activities in accordance with GAAP.FFO, AFFO, and FAD should not be considered more relevant or accurate than GAAP net income (loss) in evaluating our operating performance. In addition, FFO, AFFO, and FAD should not be considered as alternatives to net income (loss) as indications of our performance or as alternatives to cash flows from operating activities as indications of our liquidity, but rather should be reviewed in conjunction with these and other GAAP measurements. Further, FFO, AFFO, and FAD are not intended to be used as liquidity measures indicative of cash flow available to fund our cash needs, including our ability to make distributions to our stockholders. In addition, our methodology for calculating AFFO and FAD may differ from the methodologies employed by other companies to calculate the same or similar supplemental performance measures, and accordingly, our reported AFFO and FAD may not be comparable to the AFFO and FAD reported by other companies.During the first quarter of 2021, we updated our definitions of AFFO and FAD to exclude the impact of the amortization related to deferred financing costs (“DFCs”) on our debt, which is included in GAAP net income (loss). We do not consider the amortization of DFCs to be directly attributable to our operations and view DFCs similar to acquisition expenses, which are capitalized into our cost basis, and therefore excluded from our non-GAAP metrics. We believe that excluding amortization of DFCs from our calculations of AFFO and FAD results in metrics that better reflect the results of our operations. Prior period disclosures of AFFO and FAD were updated to conform to our updated definitions of AFFO and FAD.53The following table presents a reconciliation of net income (loss) attributable to BREIT stockholders to FFO, AFFO and FAD attributable to BREIT stockholders ($ in thousands): Three Months Ended June 30, Six Months Ended June 30, 2021 2020 2021 2020 Net (loss) income attributable to BREIT stockholders $ (174,757) $ 314,439 $ (146,285) $ (885,648) Adjustments to arrive at FFO: Depreciation and amortization 410,100 357,924 820,959 692,046 Impairment of investments in real estate — 6,126 — 6,126 Net gain on dispositions of real estate (7,372) — (22,802) (371) Amount attributable to non-controlling interests for above adjustments (9,679) (10,746) (19,970) (21,562) FFO attributable to BREIT stockholders 218,292 667,743 631,902 (209,409) Adjustments to arrive at AFFO: Straight-line rental income and expense (41,038) (41,814) (81,382) (76,988) Amortization of above- and below-market lease intangibles (5,419) (4,386) (10,457) (8,104) Amortization of mortgage premium/discount (463) (342) (964) (572) Unrealized (gains) losses from changes in fair value of financial instruments(1)(215,902) (455,939) (537,523) 648,455 Net forfeited investment deposits — — — 12,750 Amortization of restricted stock awards 125 100 246 200 Non-cash performance participation allocation 299,373 — 442,588 — Non-cash incentive compensation awards 692 500 1,869 1,000 Gain on involuntary conversion — (180) — (180) Amortization of deferred financing costs 13,957 10,438 26,698 19,998 Loss on extinguishment of debt 2,757 — 6,173 1,237 Amount attributable to non-controlling interests for above adjustments 365 8,397 4,348 (5,028) AFFO attributable to BREIT stockholders 272,739 184,517 483,498 383,359 Adjustments to arrive at FAD: Management fee paid in shares 92,183 53,423 165,278 102,925 Recurring tenant improvements, leasing commissions and other capital expenditures(2)(51,928) (30,132) (85,041) (53,749) Stockholder servicing fees (25,583) (15,644) (46,354) (31,068) Realized (gains) losses on financial instruments(1)(6,879) (13,342) 13,703 (11,977) Amount attributable to non-controlling interests for above adjustments (549) (85) (1,404) (518) FAD attributable to BREIT stockholders $ 279,983 $ 178,737 $ 529,680 $ 388,972 (1)Unrealized losses (gains) from changes in fair value of financial instruments primarily relates to mark-to-market changes on both our investments in real estate debt and our investments in equity securities. Realized (gains) losses on financial instruments primarily relates to realized (gains) losses from the sale of our investments in real estate debt and our investments in equity securities.(2)Recurring tenant improvements and leasing commissions are generally related to second-generation leases and other capital expenditures required to maintain our investments. Other capital expenditures exclude underwritten tenant improvements, leasing commissions and capital expenditures in conjunction with acquisitions and projects that we believe will enhance the value of our investments.Net Asset ValueThe purchase price per share for each class of our common stock will generally equal our prior month’s NAV per share, plus applicable selling commissions and dealer manager fees. Our NAV for each class of shares is based on the net asset values of our investments (including investments in real estate debt), and any other assets (such as cash on hand), and is reduced by our liabilities, including the allocation/accrual of any performance participation, and any stockholder servicing fees applicable to such class of shares.For more information on our Net Asset Value Calculation and Valuation Guidelines please refer to our prospectus. Please also refer to Item 1A Risk Factors in our Annual Report on Form 10-K for the year ended December 31, 2020 and our prospectus dated February5412, 2021 and filed with the SEC, as supplemented for additional disclosure relating to material trends or uncertainties that may impact our business.For the quarter ended June 30, 2021, BREIT’s Class S NAV per share increased $0.70, from $11.93 as of March 31, 2021 to $12.63 as of June 30, 2021. Similarly, BREIT’s Class I NAV per share increased from $11.90 to $12.61, BREIT’s Class D NAV per share increased from $11.75 to $12.43 and BREIT’s Class T NAV per share increased from $11.72 to $12.43. This price movement was driven by increases in the value of our residential, industrial and net lease properties, as well as increases in the value of our real estate debt portfolio.Our total NAV presented in the following tables includes the NAV of our Class S, Class T, Class D, and Class I common shares, as well as partnership interests of BREIT OP held by parties other than us. The following table provides a breakdown of the major components of our total NAV as of June 30, 2021 ($ and shares/units in thousands):Components of NAV June 30, 2021 Investments in real estate $ 42,447,750 Investments in real estate debt 5,729,378 Investments in unconsolidated entities 1,353,668 Cash and cash equivalents 1,680,991 Restricted cash 2,243,237 Other assets 2,190,725 Mortgage notes, term loans, and revolving credit facilities, net (19,715,052) Secured financings on investments in real estate debt (350,598) Subscriptions received in advance (2,072,884) Other liabilities (1,048,171) Accrued performance participation allocation (442,588) Management fee payable (33,549) Accrued stockholder servicing fees(1)(9,072) Non-controlling interests in joint ventures (377,599) Net Asset Value $ 31,596,236 Number of outstanding shares/units 2,507,783 (1)Stockholder servicing fees only apply to Class S, Class T, and Class D shares. See Reconciliation of Stockholders’ Equity and BREIT OP Partners’ Capital to NAV below for an explanation of the difference between the $9.1 million accrued for purposes of our NAV and the $828.9 million accrued under U.S. GAAP.The following table provides a breakdown of our total NAV and NAV per share/unit by class as of June 30, 2021 ($ and shares/units in thousands, except per share/unit data):NAV Per Share Class S
SharesClass I
SharesClass T
SharesClass D
SharesThird-partyOperatingPartnershipUnits (1)Total Monthly NAV $ 11,642,954 $ 16,720,508 $ 623,842 $ 2,256,180 $ 352,752 $ 31,596,236 Number of outstanding shares/units 921,838 1,326,271 50,188 181,506 27,980 2,507,783 NAV Per Share/Unit as of June 30, 2021 $ 12.6302 $ 12.6072 $ 12.4301 $ 12.4303 $ 12.6072 (1)Includes the partnership interests of BREIT OP held by the Special Limited Partner, Class B unitholders, and other BREIT OP interests held by parties other than us.55The following table details the weighted average discount rate and exit capitalization rate by property type, which are the key assumptions used in the discounted cash flow valuations as of June 30, 2021:Property Type Discount Rate Exit Capitalization Rate Residential 7.2% 4.9% Industrial 6.5% 5.0% Net Lease 7.0% 6.5% Hospitality 9.2% 9.5% Self Storage 7.0% 5.5% Retail 7.6% 6.3% Office 6.7% 5.5% These assumptions are determined by the Adviser and reviewed by our independent valuation advisor. A change in these assumptions would impact the calculation of the value of our property investments. For example, assuming all other factors remain unchanged, the changes listed below would result in the following effects on our investment values: Input Hypothetical
ChangeResidential Investment
ValuesIndustrial
Investment
ValuesNet Lease
Investment
ValuesHospitality
Investment
ValuesSelf Storage
Investment
ValuesRetail
Investment
ValuesOffice
Investment
ValuesDiscount Rate 0.25% decrease +1.9% +1.7% +2.0% +1.8% +2.5% +1.8% +1.9% (weighted average) 0.25% increase (1.9)% (2.2)% (1.5)% (1.7)% (1.2)% (1.8)% (1.9)% Exit Capitalization Rate 0.25% decrease +3.4% +3.2% +2.3% +1.4% +2.8% +2.3% +3.2% (weighted average) 0.25% increase (3.1)% (3.6)% (1.9)% (1.3)% (2.8)% (2.3)% (2.9)% The following table reconciles stockholders’ equity and BREIT OP partners’ capital per our condensed consolidated balance sheet to our NAV ($ in thousands): June 30, 2021 Stockholders’ equity $ 22,858,518 Non-controlling interests attributable to BREIT OP 250,150 Redeemable non-controlling interest 299 Total partners’ capital of BREIT OP under GAAP 23,108,967 Adjustments: Accrued stockholder servicing fee 819,828 Organization and offering costs 3,068 Accrued affiliate incentive compensation awards (23,709) Unrealized net real estate and real estate debt appreciation 4,240,271 Accumulated depreciation and amortization under GAAP 3,447,811 NAV $ 31,596,236 The following details the adjustments to reconcile GAAP stockholders’ equity and total partners’ capital of BREIT OP to our NAV:–Accrued stockholder servicing fee represents the accrual for the full cost of the stockholder servicing fee for Class S, Class T, and Class D shares. Under GAAP, we accrued the full cost of the stockholder servicing fee payable over the life of each share (assuming such share remains outstanding the length of time required to pay the maximum stockholder servicing fee) as an offering cost at the time we sold the Class S, Class T, and Class D shares. Refer to Note 2 to the consolidated financial statements in our Annual Report on Form 10-K for the year ended December 31, 2020 for further details of the GAAP treatment regarding the stockholder servicing fee. For purposes of calculating NAV we recognize the stockholder servicing fee as a reduction of NAV on a monthly basis when such fee is paid.–The Adviser agreed to advance certain organization and offering costs on our behalf through December 31, 2017. Such costs are reimbursed to the Adviser on a pro-rata basis over 60 months beginning January 1, 2018. Under GAAP, organization costs are expensed as incurred and offering costs are charged to equity as such amounts are incurred. For56purposes of calculating NAV, such costs are recognized as a reduction to NAV as they are reimbursed ratably over 60 months.–Under GAAP, the affiliate incentive compensation awards are valued as of grant date and compensation expense is recognized over the service period on a straight-line basis with an offset to equity, resulting in no impact to Stockholders’ Equity. For purposes of calculating NAV, we value the awards based on the performance in the applicable period and deduct such value from NAV.–Our investments in real estate are presented under historical cost in our GAAP consolidated financial statements. Additionally, our mortgage notes, term loans, secured and unsecured revolving credit facilities, and repurchase agreements (“Debt”) are presented at their carrying value in our consolidated GAAP financial statements. As such, any increases or decreases in the fair market value of our investments in real estate or our Debt are not included in our GAAP results. For purposes of calculating our NAV, our investments in real estate and our Debt are recorded at fair value.–In addition, we depreciate our investments in real estate and amortize certain other assets and liabilities in accordance with GAAP. Such depreciation and amortization is not recorded for purposes of calculating our NAV.DistributionsBeginning March 31, 2017, we declared monthly distributions for each class of our common stock, which are generally paid 20 days after month-end. We have paid distributions consecutively each month since that time. Each class of our common stock received the same aggregate gross distribution per share, which was $0.3215 per share for the six months ended June 30, 2021. The net distribution varies for each class based on the applicable stockholder servicing fee, which is deducted from the monthly distribution per share and paid directly to the applicable distributor. The table below details the net distribution for each of our share classes for the six months ended June 30, 2021: Class S
SharesClass I
SharesClass T
SharesClass D
SharesJanuary 31, 2021 $ 0.0451 $ 0.0535 $ 0.0452 $ 0.0511 February 28, 2021 0.0451 0.0528 0.0452 0.0506 March 31, 2021 0.0451 0.0537 0.0452 0.0512 April 30, 2021 0.0451 0.0535 0.0452 0.0511 May 31, 2021 0.0451 0.0541 0.0453 0.0515 June 30, 2021 0.0451 0.0539 0.0452 0.0513 Total $ 0.2706 $ 0.3215 $ 0.2713 $ 0.3068 57The following tables summarize our distributions declared during the three and six months ended June 30, 2021 and 2020 ($ in thousands): Three Months Ended June 30, 2021 Three Months Ended June 30, 2020 Amount Percentage Amount Percentage Distributions Payable in cash $ 164,662 47 % $ 109,258 47 % Reinvested in shares 183,806 53 % 125,124 53 % Total distributions $ 348,468 100 % $ 234,382 100 % Sources of Distributions Cash flows from operating activities $ 348,468 100 % $ 234,382 100 % Offering proceeds — — % — — % Total sources of distributions $ 348,468 100 % $ 234,382 100 % Cash flows from operating activities $ 381,606 $ 275,756 Funds from Operations(1)$ 218,292 $ 667,743 Adjusted Funds from Operations(1)$ 272,739 $ 184,517 Funds Available for Distribution(1)$ 279,983 $ 178,737 Six Months Ended June 30, 2021 Six Months Ended June 30, 2020 Amount Percentage Amount Percentage Distributions Payable in cash $ 297,452 47 % $ 203,198 46 % Reinvested in shares 340,421 53 % 238,258 54 % Total distributions $ 637,873 100 % $ 441,456 100 % Sources of Distributions Cash flows from operating activities $ 637,873 100 % $ 441,456 100 % Offering proceeds — — % — — % Total sources of distributions $ 637,873 100 % $ 441,456 100 % Cash flows from operating activities $ 673,242 $ 484,795 Funds from Operations(1)$ 631,902 $ (209,409) Adjusted Funds from Operations(1)$ 483,498 $ 383,359 Funds Available for Distribution(1)$ 529,680 $ 388,972 (1)See “—Funds from Operations and Adjusted Funds from Operations and Funds Available for Distribution” above for descriptions of Funds from Operations (FFO), Adjusted Funds from Operations (AFFO), and Funds Available for Distribution (FAD), for reconciliations of them to GAAP net loss attributable to BREIT stockholders, and for considerations on how to review these metrics.Through June 30, 2021, our distributions have been funded entirely from cash flows from operations.Liquidity and Capital ResourcesLiquidityWe believe we are well positioned from a liquidity perspective with $4.4 billion of immediate liquidity as of August 2, 2021, made up of $3.6 billion of undrawn line of credit capacity and $0.8 billion of cash on hand. In addition to our immediate liquidity, we obtain incremental liquidity through the sale of our common stock, from which we generated $8.3 billion during the six months ended June 30, 2021. In addition, we may incur indebtedness secured by our real estate and real estate debt investments, borrow money through unsecured financings, or incur other forms of indebtedness. We may also generate incremental liquidity through the sale of our real estate and real estate debt investments.58Our primary liquidity needs are to fund our investments, make distributions to our stockholders, repurchase shares of our common stock pursuant to our share repurchase plan, pay operating expenses, fund capital expenditures, repay indebtedness, and pay debt service on our outstanding indebtedness. Our operating expenses include, among other things, the management fee we pay to the Adviser and the performance participation allocation that BREIT OP pays to the Special Limited Partner, both of which will impact our liquidity to the extent the Adviser or the Special Limited elect to receive such payments in cash.Our cash needs for acquisitions and other capital investments will be funded primarily from the sale of shares of our common stock and through the incurrence or assumption of debt. We continue to believe that our current liquidity position is sufficient to meet the need of our expected investment activity. Other potential future sources of capital include secured or unsecured financings from banks or other lenders and proceeds from the sale of assets. If necessary, we may use financings or other sources of capital in the event of unforeseen significant capital expenditures.We continue to believe that our current liquidity position is sufficient to meet the need of our expected investment activity.Capital ResourcesAs of June 30, 2021, our indebtedness included loans secured by our properties, master repurchase agreements and other financing agreements with lenders secured by our investments in real estate debt, and unsecured revolving credit facilities.The following table is a summary of our indebtedness as of June 30, 2021 ($ in thousands):June 30, 2021 Principal Balance as of Indebtedness WeightedAverageInterest Rate(1)WeightedAverageMaturity Date(2)Maximum
Facility
SizeJune 30, 2021 December 31, 2020 Fixed rate loans: Fixed rate mortgages 3.8% 8/26/2027 N/A $ 13,006,707 $ 13,124,595 Variable rate loans: Floating rate mortgages L+1.8% 5/25/2026 N/A 4,914,122 4,544,044 Variable rate term loans L+1.7% 3/18/2024 N/A 1,795,520 1,761,920 Variable rate secured revolving credit facilities — — $ 2,185,344 — 481,725 Variable rate mezzanine loans L+3.5% 3/9/2025 N/A 71,100 202,200 Total variable rate loans L+1.8% 10/21/2025 6,780,742 6,989,889 Total loans secured by our properties 3.1% 1/7/2027 19,787,449 20,114,484 Secured financings on investments in real estate debt: Secured financings on investments in real estate debt(3)L+1.6% 6/29/2022 N/A 350,598 2,140,993 Unsecured loans: Unsecured variable rate revolving credit facility L+2.5% 2/22/2024 1,900,000 — — Affiliate line of credit L+2.5% 1/22/2022 100,000 — — Total unsecured loans 2,000,000 — — Total indebtedness $ 20,138,047 $ 22,255,477 (1)The term “L” refers to the one-month LIBOR with respect to loans secured by our properties and unsecured loans.(2)For loans where we, at our sole discretion, have extension options, the maximum maturity date has been assumed.(3)Weighted average interest rate based on L+1.6%, whereby “L” refers to the relevant floating benchmark rates, which include USD LIBOR, GBP LIBOR and EURIBOR, as applicable to each secured financing.We had registered with the Securities and Exchange Commission (the “SEC”), two offerings for an aggregate of up to $17.0 billion in shares of common stock (the “Previous Offerings”) and accepted gross offering proceeds of $16.3 billion during the period January 1, 2017 to February 1, 2021. The Company subsequently registered with the SEC a follow-on offering of up to $24.0 billion in shares of common stock, consisting of up to $20.0 billion in shares in its primary offering and up to $4.0 billion in shares pursuant to its distribution reinvestment plan, which we began using to offer shares of our common stock in February 2021 (the “Current Offering”59and with the Previous Offerings, the “Offering”). The share classes have different upfront selling commissions and ongoing stockholder servicing fees.As of August 12, 2021, we had received net proceeds of $8.0 billion from selling an aggregate of 660,937,071 shares of our common stock in the Current Offering (consisting of 286,308,172 Class S shares, 285,777,626 Class I shares, 7,818,636 Class T shares, and 81,032,637 Class D shares).Cash FlowsThe following table provides a breakdown of the net change in our cash and cash equivalents and restricted cash ($ in thousands): Six Months Ended June 30, 2021 2020 Cash flows provided by operating activities $ 673,242 $ 484,795 Cash flows used in investing activities (4,306,221) (4,933,503) Cash flows provided by financing activities 6,512,684 4,061,892 Net increase in cash and cash equivalents and restricted cash $ 2,879,705 $ (386,816) Cash flows provided by operating activities increased $188.4 million during the six months ended June 30, 2021 compared to the corresponding period in 2020 due to increased cash flows from the operations of our investments in real estate and income on our investments in real estate debt.Cash flows used in investing activities decreased $627.3 million during the six months ended June 30, 2021 compared to the corresponding period in 2020 primarily due to a net decrease of $824.6 million in the acquisitions of and capital improvements to real estate investments, a decrease of $443.6 million in investments in unconsolidated entities, and an increase of $90.5 million in proceeds from dispositions of real estate. This was offset by a net increase of $594.8 million related to our investments in real estate-related equity securities, an increase of $39.4 million related to pre-acquisition costs and deposits and a net increase of $97.1 million in our investments in real estate debt.Cash flows provided by financing activities increased $2.5 billion during the six months ended June 30, 2021 compared to the corresponding period in 2020 primarily due to an increase of $2.8 billion from the issuance of our common stock and an increase of $1.9 billion in subscriptions received in advance. This was partially offset by a net decrease in borrowings of $2.1 billion and an increase of $0.1 billion in distributions.Critical Accounting PoliciesThe preparation of the financial statements in accordance with GAAP involves significant judgments and assumptions and requires estimates about matters that are inherently uncertain. These judgments will affect our reported amounts of assets and liabilities and our disclosure of contingent assets and liabilities at the datedates of the balance sheet.financial statements and the reported amounts of revenue and expenses during the reporting periods. With different estimates or assumptions, materially different amounts could be reported in our condensed consolidated financial statements. We consider our accounting policies over investments in real estate and lease intangibles, investments in real estate debt, and revenue recognition to be our critical accounting policies. See Note 2 to the consolidated financial statements in our Annual Report on Form 10-K for the year ended December 31, 2020 for further descriptions of such accounting policies.Critical Accounting EstimatesThe preparation of these financial statements requires us to make estimates and assumptions that affect the reported amounts of assets, liabilities, revenue and expenses, and the related disclosure of contingent assets and liabilities. Actual results could differ from thosethese estimates.Cash and Cash EquivalentsCash and cash equivalents represent cash held in banks, cash on hand, and liquid investments with original maturitiesAllocation of three months or less. The Company may have bank balances in excess of federally insured amounts; however, the Company deposits its cash and cash equivalents with high credit-quality institutions to minimize credit risk.As of September 30, 2017, restricted cash primarily consists of $98.4 million of cash receivedPurchase Price for subscriptions prior to the date in which the subscriptions are effective. The Company’s restricted cash is held primarily in a bank account controlled by the Company’s transfer agent but in the name of the Company.In accordance with the guidance for business combinations, the Company determines whetherUpon the acquisition of a property, qualifies as a business combination, which requires that the assets acquired and liabilities assumed constitute a business. If the property acquired is not a business, the Company accounts for the transaction as an asset acquisition. The Company has early adopted Accounting Standards Update 2017-01 — Clarifying the Definition of a Business (“ASU 2017-01”). ASU 2017-01 states that when substantially all ofwe assess the fair value of the gross assets to be acquired is concentrated in a single identifiable asset or group of similar identifiable assets, the asset or set of assets is not a business. All property acquisitions to date have been accounted for as asset acquisitions.Whether the acquisition of a property acquired is considered a business combination or asset acquisition, the Company recognizes the identifiable assets acquired, the liabilities assumed, and any non-controlling interest in the acquired entity. In addition, for transactions that are business combinations, the Company evaluates the existence of goodwill or a gain from a bargain purchase. The Company expenses acquisition-related costs associated with business combinations as they are incurred. The Company capitalizes acquisition-related costs associated with asset acquisitions.Upon acquisition of a property, the Company assesses the fair value of acquired tangible and intangible assets (including land, buildings, tenant improvements, “above-market” and “below-market” leases, acquired in-place leases, other identified intangible assets and assumed liabilities) and allocateswe allocate the purchase price to the acquired assets and assumed liabilities.liabilities, which are on a relative fair value basis. The Company assessesmost significant portion of the allocation is to building and considersland and requires the use of market-based estimates and60assumptions. We assess and consider fair value based on estimated cash flow projections that utilize appropriate discount and/or capitalization rates, that it deems appropriate, as well as other available market information. Estimates of future cash flows are based on a number of factors including the historical operating results, known and anticipated trends, and market and economic conditions.The fair value of the tangible assets of an acquired property considers the value of the property as if it were vacant. The CompanyWe also considersconsider an allocation of purchase price of other acquired intangibles, including acquired in-place leases that may have a customer relationship intangible value, including (but not limited to) the nature and extent of the existing relationship with the tenants, the tenants’ credit quality and expectations of lease renewals. Based on its acquisitions to date, the Company’s allocation to customer relationship intangible assets has not been material.The Company records acquiredAcquired above-market and below-market leases are recorded at their fair values (using a discount rate which reflects the risks associated with the leases acquired) equal to the difference between (1) the contractual amounts to be paid pursuant to each in-place lease and (2) management’s estimate of fair market lease rates for each corresponding in-place lease, measured over a period equal to the remaining term of the lease for above-market leases and the initial term plus the term of any below-market fixed rate renewal options for below-market leases. Other intangible assets acquired include amounts for in-place lease values that are based on the Company’sour evaluation of the specific characteristics of each tenant’s lease. Factors to be considered include estimates of carrying costs during hypothetical expected lease-up periods considering current market conditions, and costs to execute similar leases. In estimating carrying costs, the Company includeswe include real estate taxes, insurance and other operating expenses and estimates of lost rentals at market rates during the expected lease-up periods, depending on local market conditions. In estimating costs to execute similar leases, the Company considerswe consider leasing commissions, legal and other related expenses.The amortization of acquired above-market and below-market leases is recorded as an adjustment to Rental Revenue on the Company’s Consolidated Statements of Operations. The amortization of in-place leases is recorded as an adjustment to Depreciation and Amortization Expense on the Company’s Consolidated Statements of Operations. The amortization of below-market and pre-paid ground leases are recorded as an adjustment to Rental Property Operating or Hotel Operating Expenses, as applicable, on the Company’s Consolidated Statements of Operations.The cost of buildings and improvements includes the purchase price of the Company’s properties and any acquisition-related costs, along with any subsequent improvements to such properties. The Company’s investments in real estate are stated at cost and are generally depreciated on a straight-line basis over the estimated useful lives of the assets as follows:DescriptionDepreciable LifeBuilding30 - 40 yearsBuilding- and land improvements10 yearsFurniture, fixtures and equipment1 - 7 yearsLease intangiblesOver lease termSignificant improvements to properties are capitalized. When assets are sold or retired, their costs and related accumulated depreciation are removed from the accounts with the resulting gains or losses reflected in net income or loss for the period.Repairs and maintenance are expensed to operations as incurred and are included in Rental Property Operating and Hotel Operating Expenses on the Company’s Consolidated Statements of Operations.The Company’s management reviews its real estate properties for impairment each quarter or when there is an event or change in circumstances that indicates an impaired value. If the carrying amount of the real estate investment is no longer recoverable and exceeds the fair value such investment, an impairment loss is recognized. The impairment loss is recognized based on the excess of the carrying amount of the asset over its fair value. The evaluation of anticipated future cash flows is highly subjective and is based in part on assumptions regarding future occupancy, rental rates and capital requirements that could differ materially from actual results. Since cash flows on real estate properties considered to be “long-lived assets to be held and used” are considered on an undiscounted basis to determine whether an asset has been impaired, the Company’s strategy of holding properties over the long term directly decreases the likelihood of recording an impairment loss. If the Company’s strategy changes or market conditions otherwise dictate an earlier sale date, an impairment loss may be recognized and such loss could be material to the Company’s results. If the Company determines that an impairment has occurred, the affected assets must be reduced to their fair value, less cost to sell. During the periods presented, no such impairment occurred.Deferred ChargesThe Company’s deferred charges include financing and leasing costs. Deferred financing costs include legal, structuring, and other loan costs incurred by the Company for its financing agreements. Deferred financing costs related to the Company’s mortgage notes and term loan are recorded as an offset to the related liability and amortized over the term of the applicable financing instruments. Deferred financing costs related to the Company’s revolving credit facility and affiliate line of credit are recorded as a component of Other Assets on the Company’s Consolidated Balance Sheets and amortized over the term of the applicable financing agreements. Deferred leasing costs incurred in connection with new leases, which consist primarily of brokerage and legal fees, are recorded as a component of Other Assets on the Company’s Consolidated Balance Sheets and amortized over the life of the related lease.Investments in Real Estate-Related SecuritiesThe Company has elected to classify its investment in real estate-related securities as trading securities and carry such investments at estimated fair value. As such, the resulting gains and losses are recorded as a component of Income from Real Estate-Related Securities on the Company’s Consolidated Statements of Operations.Fair Value MeasurementUnder normal market conditions, the fair value of an investment is the amount that would be received to sell an asset or transfer a liability in an orderly transaction between market participants at the measurement date (i.e., the exit price). Additionally, there is a hierarchal framework that prioritizes and ranks the level of market price observability used in measuring investments at fair value. Market price observability is impacted by a number of factors, including the type of investment and the characteristics specific to the investment and the state of the marketplace, including the existence and transparency of transactions between market participants. Investments with readily available active quoted prices or for which fair value can be measured from actively quoted prices generally will have a higher degree of market price observability and a lesser degree of judgment used in measuring fair value.Investments measured and reported at fair value are classified and disclosed in one of the following levels within the fair value hierarchy:Level 1 — quoted prices are available in active markets for identical investments as of the measurement date. The Company does not adjust the quoted price for these investments.Level 2 — quoted prices are available in markets that are not active or model inputs are based on inputs that are either directly or indirectly observable as of the measurement date.Level 3 — pricing inputs are unobservable and include instances where there is minimal, if any, market activity for the investment. These inputs require significant judgment or estimation by management or third parties when determining fair value and generally represent anything that does not meet the criteria of Levels 1 and 2. Due to the inherent uncertainty of these estimates, these values may differ materially from the values that would have been used had a ready market for these investments existed.As of September 30, 2017, the Company’s $644.4 million of investments in real estate-related securities were classified as Level 2.ValuationThe Company’s investments in real estate-related securities are reported at fair value. As of September 30, 2017, the Company’s investments in real estate-related securities consisted of CMBS, which are mortgage-related fixed income securities. Mortgage-related securities are usually issued as separate tranches, or classes, of securities within each deal. The Company generally determines the fair value of its CMBS by utilizing third-party pricing service providers and broker-dealer quotations on the basis of last available bid price. In determining the fair value of a particular investment, pricing service providers may use broker-dealer quotations, reported trades or valuation estimates from their internal pricing models to determine the reported price. The pricing service providers’ internal models for mortgage-related securities such as CMBS usually consider the attributes applicable to a particular class of the security (e.g., credit rating, seniority), current market data, and estimated cash flows for each class and incorporate deal collateral performance such as prepayment speeds and default rates, as available.The fair value of the Company’s mortgage notes, term loan, and revolving credit facility, repurchase agreements, and affiliate line of credit all approximate their carrying value.Revenue RecognitionThe Company’s sources of revenue and the related revenue recognition policies are as follows:Rental revenue — primarily consists of base rent arising from tenant leases at the Company’s industrial, multifamily, and retail properties. Rental revenue is recognized on a straight-line basis over the life of the lease, including any rent steps or abatement provisions. The Company begins to recognize revenue upon the acquisition of the related property or when a tenant takes possession of the leased space.Tenant reimbursement income — consists primarily of amounts due from tenants for costs related to common area maintenance, real estate taxes, and other recoverable costs included in lease agreements. The Company recognizes the reimbursement of such costs incurred as tenant reimbursement income.Hotel revenue — consists of income from the Company’s hotel properties. Hotel revenue consists primarily of room revenue and food and beverage revenue. Room revenue is recognized when the related room is occupied and other hotel revenue is recognized when the service is rendered.Income TaxesThe Company intends to make an election to be taxed as a REIT under Sections 856 through 860 of the Internal Revenue Code of 1986, as amended, or the Internal Revenue Code, commencing with its taxable year ending December 31, 2017. If the Company qualifies for taxation as a REIT, the Company generally will not be subject to federal corporate income tax to the extent it distributes 90% of its taxable income to its stockholders. REITs are subject to a number of other organization and operational requirements. Even if the Company qualifies for taxation as a REIT, it may be subject to certain state and local taxes on its income and property, and federal income and excise taxes on its undistributed income.The Company leases its hotel investments to wholly-owned taxable REIT subsidiaries (“TRSs”). The TRSs are subject to taxation at the federal, state and local levels, as applicable. Revenues related to the hotels’ operations such as room revenue, food and beverage revenue and other revenue are recorded in the TRS along with corresponding expenses. The Company accounts for applicable income taxes by utilizing the asset and liability method. As such, the Company records deferred tax assets and liabilities for the future tax consequences resulting from the difference between the carrying value of existing assets and liabilities and their respective tax basis. A valuation allowance for deferred tax assets is provided if the Company believes all or some portion of the deferred tax asset may not be realized. As of September 30, 2017, the Company recorded a deferred tax asset of $246 thousand due to its hotel investments and recorded such amount as a tax benefit within Income Tax Benefit on the Company’s Consolidated Statements of Operations.Organization and Offering CostsOrganization costs are expensed as incurred and recorded as a component of General and Administrative Expense on the Company’s Consolidated Statements of Operations and offering costs are charged to equity as such amounts are incurred.The Adviser has agreed to advance certain organization and offering costs on behalf of the Company interest free (including legal, accounting, and other expenses attributable to the Company’s organization, but excluding upfront selling commissions, dealer manager fees and stockholder servicing fees) through December 31, 2017, the day before the first anniversary of the date as of which escrow for the Offering was released. The Company will reimburse the Adviser for all such advanced expenses ratably over a 60 month period following December 31, 2017.As of September 30, 2017, the Adviser and its affiliates had incurred organization and offering costs on the Company’s behalf of $9.4 million, consisting of offering costs of $7.6 million and organization costs of $1.8 million. Such costs became the Company’s liability on January 1, 2017, the date as of which the proceeds from the Offering were released from escrow. These organization and offering costs were recorded as a component of Due to Affiliates on the Company’s Consolidated Balance Sheet as of September 30, 2017.Blackstone Advisory Partners L.P. (the “Dealer Manager”), a registered broker-dealer affiliated with the Adviser, serves as the dealer manager for the Offering. The Dealer Manager is entitled to receive selling commissions and dealer manager fees based on the transaction price of each applicable class of shares sold in the Offering. The Dealer Manager is also entitled to receive a stockholder servicing fee of 0.85%, 0.85% and 0.25% per annum of the aggregate net asset value (“NAV”) of the Company’s outstanding Class S shares, Class T shares, and Class D shares, respectively.The following table details the selling commissions, dealer manager fees, and stockholder servicing fees for each applicable share class:There is no stockholder servicing fee with respect to Class I shares. The Dealer Manager has entered into agreements with the selected dealers distributing the Company’s shares in the Offering, which provide, among other things, for the re-allowance of the full amount of the selling commissions and dealer manager fees and all or a portion of the stockholder servicing fees received by the Dealer Manager to such selected dealers. The Company will cease paying the stockholder servicing fee with respect to any Class S share, Class T share or Class D share held in a stockholder’s account at the end of the month in which the total selling commissions, dealer manager fees and stockholder servicing fees paid with respect to the shares held by such stockholder within such account would exceed, in the aggregate, 8.75% (or, in the case of Class T shares sold through certain participating broker-dealers, a lower limit as set forth in any applicable agreement between the Dealer Manager and a participating broker-dealer) of the gross proceeds from the sale of such shares (including the gross proceeds of any shares issued under the Company’s distribution reinvestment plan with respect thereto). The Company will accrue the full cost of the stockholder servicing fee as an offering cost at the time each Class S, Class T, and Class D share is sold during the Offering. As of September 30, 2017, the Company had accrued $76.0 million of stockholder servicing fees related to Class S shares, Class D shares and Class T shares sold and recorded such amount as a component of Due to Affiliates on the Company’s Consolidated Balance Sheets.Earnings Per ShareBasic net loss per share of common stock is determined by dividing net loss attributable to common stockholders by the weighted average number of common shares outstanding during the period. All classes of common stock are allocated net income/(loss) at the same rate per share and receive the same gross distribution per share.The restricted stock grants of Class I shares held by our directors are considered to be participating securities because they contain non-forfeitable rights to distributions. The impact of these restricted stock grants on basic and diluted earnings per common share (“EPS”) has been calculated using the two-class method whereby earnings are allocated to the restricted stock grants based on dividends declared and the restricted stocks’ participation rights in undistributed earnings. As of September 30, 2017, the effects of the two-class method on basic and diluted EPS were not material to the Company’s consolidated financial statements.In May 2014, the Financial Accounting Standards Board (“FASB”) issued ASU 2014-09 “Revenue from Contracts with Customers (Topic 606).” Beginning January 1, 2018, companies will be required to recognize revenue to depict the transfer of promised goods or services to customers in an amount that reflects the consideration to which the entity expects to be entitled in exchange for those goods or services and also includes additional disclosure requirements. The new standard can be adopted either retrospectively to prior reporting periods presented or as a cumulative effect adjustment as of the date of adoption. The Company is taking inventory of its revenue streams and performing a detailed review of the related contracts to determine the impact of this standard on the Company’s consolidated financial statements. The majority of the Company’s revenue is derived from tenant leases at multifamily, industrial andretail properties. As such the adoption of ASU 2014-09 will not have an impact on both the Rental Revenue and Tenant Reimbursement Income revenue streams. However, upon adoption of the new leasing standard, ASU 2014-09 may impact the presentation of certain lease and non-lease components of revenue. See below for a further description of the expected impact the new leasing standard may have on the Company. The Company is finalizing its assessment of the expected impact ASU 2014-09 will have on its performance obligations related to the revenue components at the Company’s hotel properties. Due to the fact that the Company’s hotel properties are select service hotels whereby the customer is generally allowed to cancel their reservation within a certain period of time, the Company does not expect the adoption of ASU 2014-09 to have a material impact on the revenue recognition policy for the Company’s hotel properties.In February 2016, the FASB issued ASU 2016-02, “Leases,” which will require organizations that lease assets to recognize the assets and liabilities for the rights and obligations created by those leases on their balance sheet. Additional disclosure regarding a company’s leasing activities will also be expanded under the new guidance. For public entities, ASU 2016-02 is effective for fiscal years beginning after December 15, 2018, including interim periods within those fiscal years, and requires a modified retrospective transition. The Company is currently evaluating the potential impact of this pronouncement on the Company’s consolidated financial statements from both a lessor and lessee standpoint. Under the new leasing standard lessor accounting remains substantially the same as current GAAP. However, the classification of certain lease and non-lease components, such as tenant reimbursement income for real estate taxes and insurance, may change but will not impact total revenue. The new lease standard will have a significant impact on lessee accounting. As such, the Company will be required to recognize a right of use asset on the Company’s consolidated balance sheet along with a lease liability equal to the present value of the remaining minimum lease payments for the Company’s ground leases.3. Investments in Real EstateInvestments in real estate, net consisted of the following ($ in thousands):During the nine months ended September 30, 2017, the Company acquired interests in 18 real estate investments, which were comprised of 50 industrial, 27 multifamily, 7 hotel, and 1 retail property. As of December 31, 2016, the Company had not commenced its principal operations and had not acquired any real estate investment properties.The following table provides further details of the properties acquired during the nine months ended September 30, 2017 ($ in thousands):(1)Purchase price is inclusive of acquisition related costs.(2)The Hyatt Place UC Davis and Emory Point are subject to a ground lease. The Emory Point ground lease was prepaid by the seller and is recorded as a component of Intangible Assets on the Company’s Consolidated Balance Sheets.(3)The TA Multifamily Portfolio consists of a 32-floor property in downtown Orlando (“55 West”) and five garden style properties located in the suburbs of Palm Beach Gardens, Orlando, Chicago, Dallas and Kansas City.(4)The HS Industrial Portfolio consists of 38 industrial properties located in six submarkets, with the following concentration based on square footage: Atlanta (38%), Chicago (23%), Houston (17%), Harrisburg (10%), Dallas (10%) and Orlando (2%).(5) Emory Point also includes 124,000 square feet of walkable retail space.(6)The ACG II Multifamily Portfolio consists of four garden style properties in Modesto, CA, Olympia, WA, Flagstaff, AZ and Gilbert, AZ.The following table summarizes the purchase price allocation for the properties acquired during the nine months ended September 30, 2017 ($ in thousands):(1)Includes assumed mortgage notes with an outstanding principal balance of $107.4 million and premium on mortgage notes of $1.6 million as of September 30, 2017. Refer to Note 6 for additional details on the Company’s mortgage notes.The weighted-average amortization periods for the acquired in-place lease intangibles, below-market ground lease intangibles, above-market lease intangibles, below-market lease intangibles, prepaid ground lease rent and other intangibles of the properties acquired during the nine months ended September 30, 2017 were 3, 52, 6, 6, 71 and 4 years, respectively.4. IntangiblesThe gross carrying amount and accumulated amortization of the Company’s intangible assets and liabilities consisted of the following ($ in thousands): The estimated future amortization on the Company’s intangibles for each of the next five years and thereafter as of September 30, 2017 is as follows ($ in thousands):5. Investments in Real Estate-Related SecuritiesThe following table details the Company’s investments in CMBS as of September 30, 2017 ($ in thousands):(1)BBB represents credit ratings of BBB+, BBB, and BBB-, BB represents credit ratings of BB+, BB, and BB-, and B represents credit ratings of B+, B, and B-.(2)The term “L” refers to the three-month U.S. dollar-denominated London Interbank Offer Rate (“LIBOR”). As of September 30, 2017, three-month LIBOR was equal to 1.3%.As of September 30, 2017, the Company’s investments in real estate-related securities included 11 CMBS with a total cost basis of $369.3 million collateralized by properties owned by Blackstone-advised investment vehicles and three CMBS with a total cost basis of $63.5 million collateralized by a loan originated by a Blackstone-advised investment vehicle. Such CMBS were purchased in fully or over-subscribed offerings. Each investment in such CMBS by Blackstone and its affiliates (including the Company) represented no more than a 49% participation in any individual tranche. The Company acquired its minority participation interests from third-party investment banks on market terms negotiated by the majority third-party investors. Blackstone and its affiliates (including the Company) will forgo all non-economic rights (including voting rights) in such CMBS as long as the Blackstone-advised investment vehicles either own the properties collateralizing, or have an interest in a different part of the capital structure related to such CMBS. For the three and nine months ended September 30, 2017, the Company recorded interest income of $3.1 million and $4.3 million, respectively, related to its investments in such CMBS. Such amounts were reported as a component of Income From Real Estate-Related Securities on the Company’s Consolidated Statements of Operations.As described in Note 2, the Company classifies its investments in real estate-related securities as trading and records these investments at fair value in Real Estate-Related Securities on the Company’s Consolidated Balance Sheets. During the three and nine months ended September 30, 2017, the Company recorded an unrealized loss of $0.6 million and an unrealized gain of $1.0 million, respectively, as a component of Income From Real Estate-Related Securities on the Company’s Consolidated Statements of Operations. During the nine months ended September 30, 2017, one of the Company’s CMBS investments was repaid and the Company recorded a realized loss of $0.2 million as a component of Income From Real Estate-Related Securities on the Company’s Consolidated Statements of Operations. The Company did not sell any securities during the three and nine months ended September 30, 2017.6. Mortgage Notes, Term Loan, and Revolving Credit FacilityThe following is a summary of the mortgage notes, term loan, and revolving credit facility secured by the Company’s properties as of September 30, 2017 ($ in thousands):(1)The term “L” refers to the one-month LIBOR. As of September 30, 2017, one-month LIBOR was equal to 1.2%.(2)Yield and spread maintenance provisions require the borrower to pay a premium to the lender in an amount that would allow the lender to attain the yield or spread assuming the borrower had made all payments until maturity.(3)The 55 West mortgage has an initial maturity date of May 9, 2019 and the Company, at its sole discretion, has three one-year extension options.(4)Interest only payments required for the first 60 months of the mortgage and principal and interest payments required for the final 24 months.(5)Principal and interest payments are required for Gilbert Redstone, ACG II-Woodlands, and ACG II-Sterling Point beginning September 2021, February 2019, and January 2018, respectively.The following table presents the future principal payments due under the Company’s mortgage notes, term loan, and revolving credit facility as of September 30, 2017 ($ in thousands):7. Repurchase AgreementsThe Company has entered into master repurchase agreements with Citigroup Global Markets Inc. (the “Citi MRA”), Royal Bank of Canada (the “RBC MRA”), and Bank of America Merrill Lynch (the “BAML MRA”) to provide the Company with additional financing capacity secured by the Company’s $644.4 million of investments in real estate-related securities. The terms of the Citi MRA, RBC MRA, and BAML MRA provide the lenders the ability to determine the size and terms of the financing provided based upon the particular collateral pledged by the Company from time-to-time. As of September 30, 2017, the Company did not have any outstanding borrowings under the BAML MRA.The following table is a summary of our repurchase agreements as of September 30, 2017 ($ in thousands):(1)The term “L” refers to the three-month LIBOR. As of September 30, 2017, three-month LIBOR was equal to 1.3%(2)Subsequent to quarter end, the Company rolled its repurchase agreement contracts expiring in October 2017 into new three, nine, or twelve month contracts.(3)Represents the fair value of the Company’s investments in real estate-related securities.8. Affiliate Line of CreditOn January 23, 2017, the Company entered into an unsecured, uncommitted line of credit (the “Line of Credit”) up to a maximum amount of $250 million with Blackstone Holdings Finance Co. L.L.C. (“Lender”), an affiliate of Blackstone. The Line of Credit expires on January 23, 2018, and may be extended for up to 12 months, subject to Lender approval. The interest rate is the then-current rate offered by a third-party lender, or, if no such rate is available, LIBOR plus 2.25%. Interest under the Line of Credit is determined based on a one-month U.S. dollar-denominated LIBOR, which was 1.2% as of September 30, 2017. Each advance under the Line of Credit is repayable on the earliest of (i) the expiration of the Line of Credit, (ii) Lender’s demand and (iii) the date on which the Adviser no longer acts as the Company’s investment adviser, provided that the Company will have 180 days to make such repayment in the cases of clauses (i) and (ii) and 45 days to make such repayment in the case of clause (iii). To the extent the Company has not repaid all loans and other obligations under the Line of Credit when repayment is required, the Company is obligated to apply the net cash proceeds from the Offering and any sale or other disposition of assets to the repayment of such loans and other obligations; provided that the Company will be permitted to (x) make payments to fulfill any repurchase requests pursuant to the Company’s share repurchase plan, (y) use funds to close any acquisition of property that the Company committed to prior to receiving a demand notice and (z) make quarterly distributions to the Company’s stockholders at per share levels consistent with the immediately preceding fiscal quarter and as otherwise required for the Company to maintain its REIT status. As of September 30, 2017, the Company had $122.7 million in borrowings outstanding under the Line of Credit.9. Other Assets and Other LiabilitiesThe following table summarizes the components of other assets ($ in thousands):September 30, 2017December 31, 2016Pre-acquisition costs$10,106—Prepaid expenses3,267—Receivables3,143—Deferred financing costs, net2,426—Straight-line rent receivable1,118—Other3,694—Total$23,754$—The following table summarizes the components of accounts payable, accrued expenses, and other liabilities ($ in thousands):Authorized CapitalThe Company is authorized to issue preferred stock and four classes of common stock consisting of Class S shares, Class T shares, Class D shares, and Class I shares. The Company’s board of directors has the ability to establish the preferences and rights of each class or series of preferred stock, without stockholder approval, and as such, it may afford the holders of any series or class of preferred stock preferences, powers and rights senior to the rights of holders of common stock. The differences among the common share classes relate to upfront selling commissions, dealer manager fees and ongoing stockholder servicing fees. See Note 2 for a further description of such items. Other than the differences in upfront selling commissions, dealer manager fees and ongoing stockholder servicing fees, each class of common stock is subject to the same economic and voting rights.As of September 30, 2017, the Company had authority to issue 2,100,000,000 shares, consisting of the following:Common StockAs of September 30, 2017, the Company had sold 125.5 million shares of its common stock in the Offering for aggregate net proceeds of $1.3 billion. The following table details the movement in the Company’s outstanding shares of common stock (in thousands):(1)The directors’ restricted stock grant represents 25% of the annual compensation paid to the independent directors. The grant is amortized over the service period of such grant.Share Repurchase PlanWe have adopted a share repurchase plan whereby, subject to certain limitations, stockholders may request on a monthly basis that we repurchase all or any portion of their shares. For the nine months ended September 30, 2017, we repurchased 18,921 shares of common stock. We had no unfulfilled repurchase requests during the nine months ended September 30, 2017.DistributionsThe Company generally intends to distribute substantially all of its taxable income, which does not necessarily equal net income as calculated in accordance with GAAP, to its stockholders each year to comply with the REIT provisions of the Internal Revenue Code. Beginning March 2017, the Company declared a monthly distribution to stockholders of record as of the last day of each applicable month.The following table details the aggregate distributions declared for each applicable class of common stock for the nine months ended September 30, 2017 ($ in thousands, except share and per share data):11. Related Party TransactionsManagement Fee and Performance Participation AllocationOn August 7, 2017, the Company renewed the advisory agreement between the Company, BREIT OP and the Adviser for an additional one-year period ending August 31, 2018. The Adviser is entitled to an annual management fee equal to 1.25% of the Company’s NAV, payable monthly as compensation for the services it provides to the Company. The management fee can be paid, at the Adviser’s election, in cash, shares of common stock, or BREIT OP units. The Adviser’s management fee waiver period expired on June 30, 2017. During the three months ended September 30, 2017, the Company accrued $3.7 million of management fees, which is included in Due to Affiliates on the Company’s Consolidated Balance Sheets. The Adviser has currently elected to receive the management fee in shares of the Company’s common stock and during October 2017 the Adviser was issued 355 thousand Class I shares as payment for the $3.7 million management fee accrued as of September 30, 2017.Additionally, the Special Limited Partner holds a performance participation interest in BREIT OP that entitles it to receive an allocation of BREIT OP’s total return to its capital account. Total return is defined as distributions paid or accrued plus the change in NAV. Under the BREIT OP agreement, the annual total return will be allocated solely to the Special Limited Partner after the other unit holders have received a total return of 5% (after recouping any loss carryforward amount) and such allocation will continue until the allocation between the Special Limited Partner and all other unit holders is equal to 12.5% and 87.5%, respectively. Thereafter, the Special Limited Partner will receive an allocation of 12.5% of the annual total return. The allocation of the performance participation interest is ultimately determined at the end of each calendar year and will be paid in cash or Class I units of BREIT OP, at the election of the Special Limited Partner. During the nine months ended September 30, 2017, the Company had recognized $11.0 million of Performance Participation Allocation Expense in the Company’s Consolidated Statement of Operations.Due to AffiliatesThe following table details the components of due to affiliates ($ in thousands):Accrued stockholder servicing feeAs described in Note 2, the Company accrues the full amount of the future stockholder servicing fees payable to the Dealer Manager for Class S, Class T, and Class D shares up to the 8.75% of gross proceeds limit at the time such shares are sold. As of September 30, 2017, the Company accrued $76.0 million of stockholder servicing fees payable to the Dealer Manager related to the Class S, Class T, and Class D shares sold. The Dealer Manager has entered into agreements with the selected dealers distributing the Company’s shares in the Offering, which provide, among other things, for the re-allowance of the full amount of the selling commissions and dealer manager fee and all or a portion of the stockholder servicing fees received by the Dealer Manager to such selected dealers.Advanced organization and offering costsThe Adviser advanced $9.4 million of organization and offering costs (excluding upfront selling commissions, dealer manager fees and stockholder servicing fees) on behalf of the Company through September 30, 2017. Such amounts will be reimbursed to the Adviser on a pro-rata basis over 60 months beginning January 1, 2018.Accrued affiliate service provider expensesThe Company has engaged and expects to continue to engage BRE Hotels and Resorts, a portfolio company controlled (but not owned) by a Blackstone-advised fund, to provide day-to-day operational and management services (including revenue management, accounting, legal and contract management, expense management, and capital expenditure projects and transaction support services) for the Company’s hotel properties. The Company currently estimates the cost for such services to be approximately $200 per key perannum (which will be reviewed periodically and adjusted if appropriate), plus actual costs allocated for transaction support services. During the three and nine months ended September 30, 2017, the Company incurred $38 thousand and $53 thousand, respectively, of expenses due to BRE Hotels and Resorts for services incurred in connection with its investments and such amount is included in Hotel Operating expenses on the Company’s Consolidated Statements of Operations.The Company has engaged and expects to continue to engage LivCor, LLC (“LivCor”), a portfolio company owned by a Blackstone-advised fund, to provide day-to-day operational and management services (including leasing, construction management, revenue management, accounting, legal and contract management, expense management, and capital expenditure projects and transaction support services) for the Company’s multifamily properties. The Company currently estimates the cost for such services to be approximately $300 per unit per annum (which will be reviewed periodically and adjusted if appropriate), plus actual costs allocated for transaction support services. During the three and nine months ended September 30, 2017, the Company incurred $394 thousand and $464 thousand, respectively, of expenses due to LivCor for services incurred in connection with its investments and such amount is included in Rental Property Operating expenses on the Company’s Consolidated Statements of Operations. Additionally, as of September 30, 2017, the Company capitalized $600 thousand to Investments in Real Estate on the Company’s Consolidated Balance Sheets for transaction support services provided by LivCor.The Company has engaged and expects to continue to engage Equity Office Management, L.L.C. (“EOM”), a portfolio company owned by Blackstone-advised funds, to provide day-to-day operational and management services (including property management services, leasing, construction management, accounting, legal and contract management, expense management, and capital expenditure projects and transaction support services) for the Company’s office and industrial properties. The Company currently estimates the cost for such services to be approximately 3% of gross revenue for property management services, 1% of gross rents from new and renewal leases for leasing services and 4% of total project costs for construction management services, plus a per square foot amount for corporate services and actual costs allocated for transaction support services. During the three and nine months ended September 30, 2017, the Company incurred $286 thousand and $757 thousand, respectively, of expenses due to EOM for services incurred in connection with its investments, and such amount is included in Rental Property Operating expenses in the Company’s Consolidated Statements of Operations. Additionally, as of September 30, 2017, the Company capitalized $20 thousand to Investments in Real Estate on the Company’s Consolidated Balance Sheets for transaction support services provided by EOM.The Company has engaged and expects to continue to engage ShopCore Properties TRS Management LLC (“ShopCore”), a portfolio company owned by a Blackstone-advised fund, to provide day-to-day operational and management services (including property management services, leasing, construction management, revenue management, accounting, legal and contract management, expense management, and capital expenditure projects and transaction support services) for the Company’s retail properties. The Company currently estimates the cost of such services to be approximately 3% of gross revenue for property management services, 1% of gross rents from new and renewal leases for leasing services and 4% of total project costs for construction management services, plus a per square foot amount for corporate services and actual costs allocated for transaction support services. During the three and nine months ended September 30, 2017, the Company incurred $72 thousand and $142 thousand, respectively, of expenses due to ShopCore for services incurred in connection with its investments and such amount is included in Rental Property Operating expenses on the Company’s Consolidated Statements of Operations.The Company expects to set up a management incentive plan for each transaction for which the Company engages BRE Hotels and Resorts, LivCor, EOM, or ShopCore for certain senior executives of the applicable portfolio company. Neither Blackstone nor the Adviser receives any fees or incentive payments from agreements between the Company and such portfolio companies or their management teams. During the nine months ended September 30, 2017, the Company has not paid or accrued any incentive fees to its affiliated service providers under such agreements.Advanced expensesThe Adviser had advanced $135 thousand and $86 thousand of expenses on the Company’s behalf for general corporate services provided by unaffiliated third parties as of September 30, 2017 and December 31, 2016, respectively.OtherBlackstone partnered with a leading national title agency to create Lexington National Land Services (“LNLS”), a title agent company. LNLS acts as an agent for one or more underwriters in issuing title policies in connection with investments by the Company, Blackstone, and third parties. LNLS will not perform services in non-regulated states for the Company, unless in the context of a portfolio transaction that includes properties in rate-regulated states, as part of a syndicate of title insurance companies where the rate is negotiated by other insurers or their agents, when a third party is paying all or a material portion of the premium or in other scenarios where LNLS is not negotiating the premium. LNLS earns fees, which would have otherwise been paid to third parties, by providing title agency services and facilitating placement of title insurance with underwriters. Blackstone receives distributions from LNLS in connection with investments by the Company based on its equity interest in LNLS. During the nine months endedSeptember 30, 2017, the Company paid LNLS $160 thousand for title services related to two investments and such costs were capitalized to Investments in Real Estate on the Company’s Consolidated Balance Sheet.12. Commitments and ContingenciesAs of September 30, 2017 and December 31, 2016, the Company was not subject to any material litigation nor is the Company aware of any material litigation threatened against it.The Hyatt Place UC Davis is subject to a ground lease that expires in 2070. Pursuant to the ground lease, the Company will pay the landlord annual rent equal to the greater of (a) minimum base rent of $130 thousand (subject to certain periodic adjustments) or (b) 5% of room revenue reduced by a utility rebate equal to actual utility charges paid, capped at 2% of room revenue.The 55 West parking garage is subject to a ground lease that expires in 2085. Pursuant to the ground lease, the Company will pay the landlord annual rent equal to a fixed payment of $50 thousand and a variable payment which is the product of the prior year variable rate adjusted by the Consumer Price Index during the previous year. At the time the Company acquired the ground lease, the variable rent payment component was equal to $59 thousand.The following table details the Company’s contractual obligations and commitments with payments due subsequent to September 30, 2017 ($ in thousands):13. Five Year Minimum Rental PaymentsThe following table presents the future minimum rents the Company expects to receive for its industrial and retail properties ($ in thousands). Leases at the Company’s multifamily investments are short term, generally 12 months or less, and are therefore not included.The Company operates in five reportable segments: Multifamily properties, Industrial properties, Hotel properties, Retail properties, and Real Estate-Related Securities. The Company allocates resources and evaluates results based on the performance of each segment individually. The Company believes that Segment Net Operating Income is the key performance metric that captures the unique operating characteristics of each segment.The following table sets forth the total assets by segment as of September 30, 2017 ($ in thousands): The following table sets forth the financial results by segment for the three months ended September 30, 2017 ($ in thousands): The following table sets forth the financial results by segment for the nine months ended September 30, 2017 ($ in thousands): 15. Subsequent EventsAcquisitionsSubsequent to September 30, 2017, the Company acquired an aggregate of $383.8 million of real estate across four separate transactions, exclusive of closing costs. The acquisitions were related to multifamily, industrial, hotel, and retail properties. Subsequent to September 30, 2017, the Company purchased an aggregate of $150.8 million of floating-rate CMBS.FinancingOn October 27, 2017, the Company entered into a $300.0 million revolving credit facility with Citi Bank, N.A. (the “Citi Line of Credit”). The Citi Line of Credit is currently secured by certain of the Company’s hotel investments. Borrowings under the Citi Line of Credit will accrue interest at a rate of LIBOR plus 2.25%. The initial maturity date of the Citi Line of Credit is October 26, 2018, and the Company has two one year extension options. As of November 13, 2017, the Company has not drawn any funds under the Citi Line of Credit. Status of the OfferingAs of November 13, 2017, the Company had sold an aggregate of 152,942,761 shares of its common stock (consisting of 117,771,673 Class S shares, 4,315,936 Class T shares, 2,981,473 Class D shares, and 27,873,679 Class I shares) in the Offering resulting in net proceeds of $1.5 billion to the Company as payment for such shares.References herein to “Blackstone Real Estate Income Trust,” “BREIT,” the “Company,” “we,” “us,” or “our” refer to Blackstone Real Estate Income Trust, Inc. and its subsidiaries unless the context specifically requires otherwise.The following discussion should be read in conjunction with the unaudited consolidated financial statements and notes thereto appearing elsewhere in this quarterly report on Form 10-Q.Forward-Looking StatementsThis Form 10-Q contains forward-looking statements about our business, operations and financial performance, including, in particular, statements about our plans, strategies and objectives. You can generally identify forward-looking statements by our use of forward-looking terminology such as “may,” “will,” “expect,” “intend,” “anticipate,” “estimate,” “believe,” “continue” or other similar words. These statements include our plans and objectives for future operations, including plans and objectives relating to future growth and availability of funds, and are based on current expectations that involve numerous risks, uncertainties and assumptions. Assumptions relating to these statements involve judgments with respect to, among other things, future economic, competitive and market conditions and future business decisions, all of which are difficult or impossible to accurately predict and many of which are beyond our control. Although we believe the assumptions underlying the forward-looking statements, and the forward-looking statements themselves, are reasonable, any of the assumptions could be inaccurate and, therefore, there can be no assurance that these forward-looking statements will prove to be accurate and our actual results, performance and achievements may be materially different from that expressed or implied by these forward-looking statements as a result of various factors, including but not limited to those discussed in the Company’s Registration Statement on Form S-11 (File No. 333-213043), as amended, under Item 1A. Risk Factors in our annual report on Form 10-K for the year ended December 31, 2016, and elsewhere in this quarterly report on Form 10-Q. In light of the significant uncertainties inherent in these forward looking statements, the inclusion of this information should not be regarded as a representation by us or any other person that our objectives and plans, which we consider to be reasonable, will be achieved.OverviewBlackstone Real Estate Income Trust, Inc. was formed on November 16, 2015 as a Maryland corporation. We are an externally advised, perpetual-life entity that intends to qualify as a real estate investment trust (“REIT”) for U.S. federal income tax purposes commencing with the taxable year ending December 31, 2017. We were formed to invest primarily in stabilized income-oriented commercial real estate in the United States and, to a lesser extent, invest in real estate-related securities. We are the sole general partner of BREIT Operating Partnership L.P., a Delaware limited partnership (“BREIT OP”). BREIT Special Limited Partner L.L.C. (the “Special Limited Partner”), a wholly owned subsidiary of The Blackstone Group L.P. (together with its affiliates, “Blackstone”), owns a special limited partner interest in BREIT OP. We own all or substantially all of our assets through BREIT OP. The Company and BREIT OP are externally managed by BX REIT Advisors L.L.C. (the “Adviser”), an affiliate of Blackstone.Our board of directors will at all times have oversight and policy-making authority over us, including responsibility for governance, financial controls, compliance and disclosure. However, pursuant to the Advisory Agreement, we have delegated to the Adviser the authority to source, evaluate and monitor our investment opportunities and to make decisions related to the acquisition, management, financing and disposition of our assets, in accordance with our investment objectives, guidelines, policies and limitations, subject to oversight by our board of directors.We have registered with the Securities and Exchange Commission (the “SEC”) an offering of up to $5.0 billion in shares of common stock (in any combination of purchases of Class S, Class T, Class D and Class I shares of our common stock), consisting of up to $4.0 billion in shares in our primary offering and up to $1.0 billion in shares pursuant to its distribution reinvestment plan (the “Offering”). The share classes have different upfront selling commissions and ongoing stockholder servicing fees. As of January 1, 2017, we satisfied the minimum offering requirement and our board of directors authorized the release of proceeds from escrow. We intend to continue selling shares in the Offering on a monthly basis. As of November 13, 2017, we had received net proceeds of $1.5 billion from selling an aggregate of 152,942,761 shares of our common stock (consisting of 117,771,673 Class S shares, 4,315,936 Class T shares, 2,981,473 Class D shares, and 27,873,679 Class I shares). We have contributed the net proceeds from the Offering to BREIT OP in exchange for a corresponding number of Class S, Class I, Class D, and Class T units. BREIT OP has primarily used the net proceeds to make investments in real estate and real estate-related securities as further described below under “— Portfolio”.We own one property in Houston, nine properties in Florida, and one property in Atlanta. Our assets remain operational with no material damage from the hurricanes that hit the U.S. at the end of August and in the beginning of September 2017. We expect to incur some non-budgeted expenses related to minor repairs and cleanup. We expect these costs to have an immaterial impact on our NAV and results from operations.We are not aware of any material trends or uncertainties, favorable or unfavorable, other than national economic conditions affecting real estate generally, that may be reasonably anticipated to have a material impact on either capital resources or the revenues or income to be derived from acquiring properties or real estate-related securities, other than those disclosed in Item 1A. Risk Factors in our annual report on Form 10-K for the year ended December 31, 2016, our prospectus dated April 17, 2017 and filed with the SEC, as supplemented, and elsewhere in this quarterly report on Form 10-Q.Investment ObjectivesOur investment objectives are to invest in assets that will enable us to:provide current income in the form of regular, stable cash distributions to achieve an attractive distribution yield;preserve and protect invested capital;realize appreciation in the net asset value (“NAV”) from proactive investment and asset management; andprovide an investment alternative for stockholders seeking to allocate a portion of their long-term investment portfolios to commercial real estate with lower volatility than public real estate companies.Acquisitions of Real EstateDuring the nine months ended September 30, 2017, we invested $2.4 billion in real estate investments consisting of 79 wholly-owned properties and 6 properties through two joint ventures. The following table provides information regarding our portfolio of real properties as of September 30, 2017:(1)Certain of the joint venture agreements entered into by BREIT provide the other partner a profits interest based on certain internal rate of return hurdles being achieved.(2)Purchase price is inclusive of acquisition-related costs.(3)The occupancy rate is as of September 30, 2017 for non-hotels. The occupancy rate for our hotel investments is the average occupancy rate from the date of acquisition to September 30, 2017.(4)See property description below for geographical breakdown.(5)The ACG II Multifamily Portfolio consists of four garden style properties in Modesto, CA, Olympia, WA, Flagstaff, AZ and Gilbert, AZ.Subsequent to September 30, 2017, the Company acquired an aggregate of $383.8 million of real estate across four separate transactions, exclusive of closing costs. The acquisitions were related to multifamily, industrial, hotel, and retail properties.The following provides descriptions of select properties in our portfolio:TA Multifamily PortfolioOn April 13, 2017, we acquired fee simple interests in six high quality multifamily properties totaling 2,514 units (the “TA Multifamily Portfolio”). The portfolio was acquired from an affiliate of TA Realty, a third party, for $432.6 million. The TA Multifamily Portfolio consists of a 32-floor high quality property in downtown Orlando and five garden style properties located in the suburbs of Palm Beach Gardens, Orlando, Chicago, Dallas and Kansas City.The acquisition of the TA Multifamily Portfolio was funded with cash on hand, which primarily consisted of proceeds from the Offering, and a $95.0 million draw on the Line of Credit. See “— Liquidity and Capital Resources” for further information regarding the Line of Credit.HS Industrial PortfolioOn April 18, 2017, we acquired a fee simple interest in the HS Industrial Portfolio (the “HS Industrial Portfolio”), a six million square foot collection of predominantly infill industrial assets. The portfolio was acquired from an affiliate of High Street Realty Company (“Seller”), a third party, for $405.9 million. The HS Industrial Portfolio consists of 38 industrial properties located in six submarkets, with the following concentration based on square footage: Atlanta (38%), Chicago (23%), Houston (17%), Harrisburg (10%), Dallas (10%) and Orlando (2%).The acquisition of the HS Industrial Portfolio was funded through a combination of cash on hand, which primarily consisted of proceeds from the Offering, a $5.0 million draw on the Line of Credit, and a $292.0 million loan. See “— Liquidity and Capital Resources” for further information regarding the HS Industrial Portfolio financing.Emory PointOn May 2, 2017, we acquired a leasehold interest in Emory Point, a Class A+ multifamily property totaling 750 units and 124,000 square feet of walkable retail space in Atlanta, Georgia (“Emory Point”). The property was acquired from a third party for $201.6 million. Emory Point was recently constructed in 2015 and is located adjacent to Emory University and across the street from the Center for Disease Control and Prevention’s headquarters. The property’s immediate submarket has no new multifamily supply and the property is the only new multifamily project delivered in the property’s immediate submarket since 2010.The acquisition of Emory Point was funded through a combination of cash on hand, which primarily consisted of proceeds from the Offering and a $130.0 million loan. See “— Liquidity and Capital Resources” for further information regarding the Emory Point financing.Nevada WestOn May 19, 2017, we acquired a fee simple interest in three newly constructed Class A multifamily properties totaling 972 units located in Las Vegas, Nevada (“Nevada West”). The properties were acquired from a third party for $171.0 million. Nevada West is highly amenitized with large units and rents 10% - 15% below comparable properties. We believe the Las Vegas residential market also benefits from attractive fundamentals with new housing supply 65% below the long term average while annual unemployment growth has averaged 3.7% since 2012 compared to 1.8% nationally.The acquisition of Nevada West was funded through cash on hand, which primarily consisted of proceeds from the Offering.The following charts further describe the diversification of our investments in real properties based on fair value as of September 30, 2017: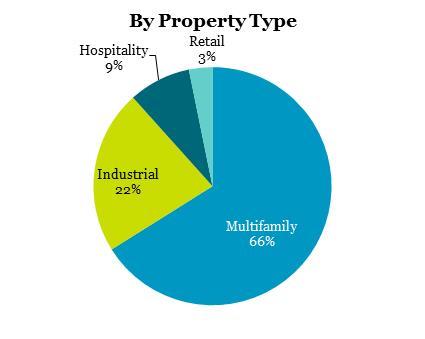
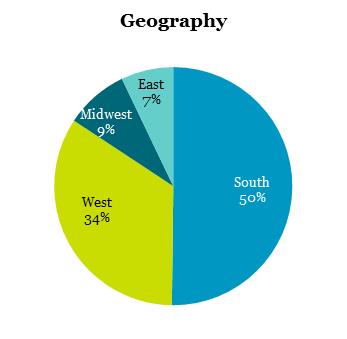
The following chart outlines the allocation of our investments in real properties and real estate-related securities based on fair value as of September 30, 2017: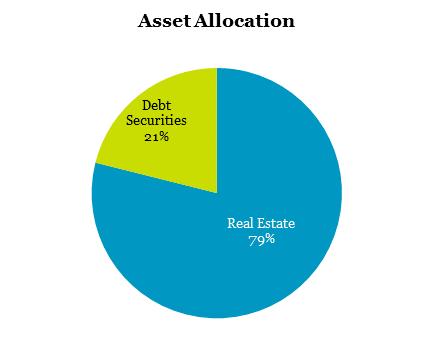
Investments in Real Estate-Related SecuritiesDuring the nine months ended September 30, 2017, we made 24 investments in commercial mortgage backed securities (“CMBS”). The following table details our investments in CMBS as of September 30, 2017 ($ in thousands):(1)BBB represents credit ratings of BBB+, BBB, and BBB-, BB represents credit ratings of BB+, BB, and BB-, and B represents credit ratings of B+, B, and B-.(2)The term “L” refers to the three-month U.S. dollar-denominated London Interbank Offer Rate (“LIBOR”).(3)For details regarding affiliate relationships with respect to certain of our CMBS investments, see Note 5 to our consolidated financial statements.The following charts further describe the diversification of our CMBS investments by credit rating and collateral type based on fair value as of September 30, 2017:Credit Rating(1) Collateral Type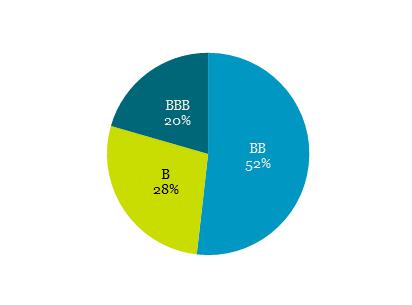
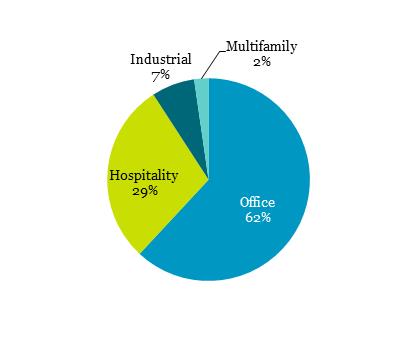
(1)BBB represents credit ratings of BBB+, BBB, and BBB-, BB represents credit ratings of BB+, BB, and BB-, and B represents credit ratings of B+, B, and B-.Subsequent to September 30, 2017, we purchased an aggregate of $150.8 million of floating-rate CMBS.Rental and Hotel RevenueThe following table details our rental revenue and hotel revenue by segment ($ in thousands):Lease ExpirationsThe following schedule details the expiring leases at our industrial and retail properties by annualized base rent and square footage as of September 30, 2017 ($ and square feet data in thousands). The table below excludes our multifamily properties as substantially all leases at such properties expire within twelve months.(1)Annualized base rent is determined from the annualized September 2017 base rent per leased square foot of the applicable year and excludes tenant recoveries, straight-line rent and above-market and below-market lease amortization.Hotel MetricsThe following table details the average daily rate and the revenue per available room (“RevPAR”) for our hotel properties for the period of ownership during the three and nine months ended September 30, 2017:Affiliate Service ProvidersFor details regarding our affiliate service providers, see Note 11 to our consolidated financial statements.The following table sets forth information regarding our consolidated results of operations ($ in thousands):From March 2, 2016 (date of our initial capitalization) through September 30, 2016, we had not commenced our principal operations and were focused on our formation and the registration of the Offering. The registration statement for the Offering was declared effective by the SEC on August 31, 2016. We commenced selling shares in October 2016 and broke escrow on January 1, 2017. As such, comparative results have not been presented.Total RevenuesDuring the three and nine months ended September 30, 2017, total revenues were $48.9 million and $79.7 million, respectively, driven primarily by rental income and hotel revenue from our 18 investments in real property.Rental Property and Hotel Operating ExpensesDuring the three and nine months ended September 30, 2017, Rental Property and Hotel Operating Expenses were $22.6 million and $35.2 million, respectively, driven primarily by our 18 investments in real property.General and Administrative ExpensesDuring the three and nine months ended September 30, 2017, General and Administrative Expenses were $1.7 million and $6.0 million, respectively, and consisted primarily of legal fees, accounting fees, transfer agent fees, other professional services fees, and expenses related to unconsummated acquisitions we are no longer pursuing. Additionally, during the nine months ended September 30, 2017, we incurred $1.8 million of organization costs incurred in conjunction with our formation. Such costs included legal fees, accounting fees, and transfer agent fees, among other costs. We do not expect to incur such costs in the future as our formation is complete and we have commenced principal operations.The Adviser’s management fee waiver expired on June 30, 2017, and during the third quarter we began accruing the management fee on a monthly basis based on our NAV. During both the three and nine months ended September 30, 2017, the management fee was $3.7 million.Performance Participation AllocationDuring the three and nine months ended September 30, 2017, the unrealized performance participation allocation accrued was $5.7 million and $11.0 million, respectively, as a result of the total return being greater than the 5% hurdle amount. Such amount was allocated to the Special Limited Partner.Depreciation and AmortizationDuring the three and nine months ended September 30, 2017, depreciation and amortization expenses were $40.4 million and $65.1 million, respectively, driven by depreciation and amortization on our investments in real property.Income from Real Estate-Related SecuritiesDuring the three and nine months ended September 30, 2017, income from real estate-related securities was $4.0 million and $7.4 million, respectively, which consisted of the interest income and mark-to-market gains, partially offset by a realized loss on our investments in real estate-related securities.Interest IncomeDuring the three and nine months ended September 30, 2017, interest income was $36 thousand and $0.4 million, respectively, which consisted of the interest earned on the cash deposited in a money market account.Interest ExpenseDuring the three and nine months ended September 30, 2017, interest expense was $10.9 million and $16.4 million, respectively, which consisted of the interest expense incurred on our mortgage notes, term loan, revolving credit facility, Line of Credit and borrowings under our repurchase agreements.Income Tax BenefitDuring the three and nine months ended September 30, 2017, the income tax benefit of $0.2 million and $0.1 million, respectively, related to our hotel taxable REIT subsidiaries.Funds from Operations and Adjusted Funds from OperationsWe believe funds from operations (“FFO”) is a meaningful supplemental non-GAAP operating metric. Our consolidated financial statements are presented under historical cost accounting which, among other things, requires depreciation of real estate investments to be calculated on a straight-line basis. As a result, our operating results imply that the value of our real estate investments will decrease evenly over a set time period. However, we believe that the value of real estate investments will fluctuate over time based on market conditions and as such, depreciation under historical cost accounting may be less informative. FFO is a standard REIT industry metric defined by the National Associational of Real Estate Investment Trusts (“NAREIT”).FFO, as defined by NAREIT and presented below, is calculated as net income or loss (computed in accordance with GAAP), excluding gains or losses from sales of depreciable real property and impairment write-downs on depreciable real property, plus real estate-related depreciation and amortization, and similar adjustments for unconsolidated joint ventures.The following table presents a reconciliation of FFO to net loss ($ in thousands):We also believe that adjusted FFO (“AFFO”) is a meaningful supplemental non-GAAP disclosure of our operating results. AFFO further adjusts FFO in order for our operating results to reflect the specific characteristics of our business by adjusting for items we believe are not related to our core operations. Our adjustments to FFO to arrive at AFFO include straight-line rental income, amortization of above- and below-market lease intangibles, organization costs, unrealized gains or losses from changes in the fair value of financial instruments, amortization of stock awards, and performance participation allocation not paid in cash. AFFO is not defined by NAREIT and our calculation of AFFO may not be comparable to disclosures made by other REITs.The following table presents a reconciliation of FFO to AFFO ($ in thousands):FFO and AFFO should not be considered to be more relevant or accurate than the current GAAP methodology in calculating net income or in evaluating our operating performance. In addition, FFO and AFFO should not be considered as alternatives to net income (loss) as indications of our performance or as alternatives to cash flows from operating activities as indications of our liquidity, but rather should be reviewed in conjunction with these and other GAAP measurements. Further, FFO and AFFO are not intended to be used as liquidity measures indicative of cash flow available to fund our cash needs, including our ability to make distributions to our stockholders.Net Asset ValueThe purchase price per share for each class of our common stock will generally equal our prior month’s NAV per share, as determined monthly, plus applicable selling commissions and dealer manager fees. Our NAV for each class of shares is based on the net asset values of our investments (including real estate-related securities), the addition of any other assets (such as cash on hand) and the deduction of any liabilities, including the allocation/accrual of any performance participation, and any stockholder servicing fees applicable to such class of shares.The following table provides a breakdown of the major components of our NAV ($ and shares in thousands, except per share data):(1)Stockholder servicing fees only apply to Class S, Class T, and Class D shares. See Reconciliation of Stockholders’ Equity to NAV for an explanation of the difference between the $744 thousand accrued for purposes of our NAV and the $76.0 million accrued under U.S. GAAP.Set forth below are the weighted averages of the key assumptions in the discounted cash flow methodology used in the September 30, 2017 valuations, based on property types. Once we own more than one retail property, we will include the key assumptions for this property type.These assumptions are determined by the Adviser and reviewed by our independent valuation advisor. A change in these assumptions would impact the calculation of the value of our property investments. For example, assuming all other factors remain unchanged, the changes listed below would result in the following effects on our investment values:The following table reconciles stockholders’ equity per our consolidated balance sheet to our NAV ($ in thousands):The following details the adjustments to reconcile GAAP stockholders’ equity to our NAV:-Accrued stockholder servicing fee represents the accrual for the full cost of the stockholder servicing fee for Class S, Class D and Class T shares. Under GAAP, we accrued the full cost of the stockholder servicing fee as an offering cost at the time we sold the Class S, Class T, and Class D shares. For purposes of NAV we recognize the stockholder servicing fee as a reduction of NAV on a monthly basis as such fee is paid.-The Adviser has agreed to advance organization and offering costs on our behalf through December 31, 2017. Such costs will be reimbursed to the Adviser pro rata over 60 months beginning January 1, 2018. Under GAAP, organization costs are expensed as incurred and offering costs are charged to equity as such amounts are incurred. For NAV, such costs will be recognized as a reduction to NAV as they are reimbursed ratably over 60 months.-Our investments in real estate are presented under historical cost in our GAAP consolidated financial statements. Additionally, our mortgage notes, term loan, and revolving credit facility, and repurchase agreements and Line of Credit (“Debt”) are presented at their carrying value in our consolidated GAAP financial statements. As such, any increases in the fair market value of our investments in real estate or Debt are not included in our GAAP results. For purposes of determining our NAV, our investments in real estate and Debt are recorded at fair value. DistributionsThe following table summarizes our distributions declared during the three and nine months ended September 30, 2017 ($ in thousands). From March 2, 2016 (date of our initial capitalization) through September 30, 2016, we had not commenced our principal operations and as such, no distributions were made during this period.Liquidity and Capital ResourcesOur primary needs for liquidity and capital resources are to fund our investments, to make distributions to our stockholders, to repurchase shares of our common stock pursuant to our share repurchase plan, to pay our organization and offering costs, operating expenses and capital expenditures and to pay debt service on any outstanding indebtedness we may incur. To date, the Adviser has advanced our organization and offering costs, but beginning January 1, 2018 we will be required to reimburse the Adviser for such advanced amounts ratably over a 60 month period.We anticipate our operating expenses will include, among other things, the management fee we will pay to the Adviser (to the extent the Adviser elects to receive the management fee in cash or requests that we repurchase shares previously issued to the Adviser for payment of the management fee), the performance participation allocation that BREIT OP will pay to the Special Limited Partner, general corporate expenses, and fees related to managing our properties and other investments. We do not have any office or personnel expenses as we do not have any employees.Our cash needs for acquisitions and other investments will be funded primarily from the sale of shares of our common stock and through the assumption or incurrence of debt.The following is a summary of our indebtedness as of September 30, 2017 ($ in thousands):(1)The term “L” refers to (i) the one-month LIBOR with respect to the Line of Credit, Revolving Credit Facility, and Term Loan, and (ii) the three-month LIBOR with respect to the Repurchase agreement borrowings.(2)The 55 West mortgage has an initial maturity date of May 9, 2019 and we, at our sole discretion, have three one-year extension options in which we anticipate exercising.(3)Subsequent to quarter end, we rolled our repurchase agreement contracts expiring in October 2017 into new three, nine, or twelve month contracts.(4)Subsequent to quarter end, we entered into a $300.0 million revolving credit facility with Citi Bank, N.A. (the “Citi Line of Credit”). See Note 15 to our consolidated financial statements for further details on the Citi Line of Credit.Other potential future sources of capital include secured or unsecured financings from banks or other lenders and proceeds from the sale of assets. If necessary, we may use financings or other sources of capital in the event of unforeseen significant capital expenditures. We have not yet identified any sources for these types of financings.As of November 13, 2017, we had received net proceeds of $1.5 billion from selling an aggregate of 152,942,761 shares of our common stock (consisting of 117,771,673 Class S shares, 4,315,936 Class T shares, 2,981,473 Class D shares, and 27,873,679 Class I shares). The Company intends to continue selling shares in the Offering on a monthly basis.The following table provides a breakdown of the net change in our cash and cash equivalents and restricted cash ($ in thousands):Cash flows provided by operating activities were $44.3 million during the nine months ended September 30, 2017 primarily as a result of cash flows from the operations of the investments in our properties and interest income on our investments in real estate-related securities.Cash flows used in investing activities were $2.9 billion during the nine months ended September 30, 2017 driven primarily by our acquisitions of real estate investments of $2.3 billion and purchase of real estate-related securities of $660.2 million.Cash flows provided by financing activities were $3.0 billion during the nine months ended September 30, 2017 primarily due to the $1.3 billion of net proceeds we received from the issuance of our common stock and $1.7 billion of net borrowings under our mortgage notes, term loan, affiliate line of credit, and repurchase agreements.From March 2, 2016 (date of our initial capitalization) through September 30, 2016, we had not commenced our principal operations and as such, comparative results have not been analyzed.Critical Accounting PoliciesThe preparation of the financial statements in accordance with accounting principles generally accepted in the United States (“GAAP”) involve significant judgments and assumptions and require estimates about matters that are inherently uncertain. These judgments will affect our reported amounts of assets and liabilities and our disclosure of contingent assets and liabilities at the dates of the financial statements and the reported amounts of revenue and expenses during the reporting periods. With different estimates or assumptions, materially different amounts could be reported in our consolidated financial statements. We consider our accounting policies over investments in real estate and lease intangibles, investments in securities, and revenue recognition to be our critical accounting policies. See Note 2 to our consolidated financial statements for further descriptions of such accounting policies.Recent Accounting PronouncementsOff-Balance Sheet ArrangementsWe currently have no off-balance sheet arrangements that are reasonably likely to have a material current or future effect on our financial condition, changes in financial condition, revenues or expenses, results of operations, liquidity, capital expenditures or capital resources.Contractual ObligationsThe following table aggregates our contractual obligations and commitments with payments due subsequent to SeptemberJune 30, 20172021 ($ in thousands).(1)The allocation of our indebtedness includes both principal and interest payments based on the current maturity date and interest rates in effect at September 30, 2017.Obligations Total Less than
1 year1-3 years 3-5 years More than
5 yearsIndebtedness(1)$ 24,182,762 $ 1,379,682 $ 2,588,327 $ 9,194,926 $ 11,019,827 Ground leases 960,662 7,179 14,801 15,707 922,975 Capital Commitments(2)80,914 80,914 — — — Organizational and offering costs 3,068 2,045 1,023 — — Other 4,196 2,398 1,798 — — Total $ 25,231,602 $ 1,472,218 $ 2,605,949 $ 9,210,633 $ 11,942,802 (1)The allocation of our indebtedness includes both principal and interest payments based on the fully extended maturity date and interest rates in effect at June 30, 2021.(2)Capital committed to invest in a private real estate-related company to be funded by September 30, 2021.61ITEM 3. QUANTITATIVE AND QUALITATIVE DISCLOSURES ABOUT MARKET RISKIndebtednessWe are exposed to interest rate risk with respect to our variable-rate indebtedness, whereas an increase in interest rates would directly result in higher interest expense costs.expense. We seek to manage our exposure to interest rate risk by utilizing a mix of fixed and floating rate financings with staggered maturities and through interest rate protection agreements to fix or cap a portion of our variable rate debt. As of SeptemberJune 30, 2017,2021, the outstanding principal balance of our variable rate indebtedness was $956.6 million$7.1 billion and consisted of mortgage notes, a term loan, aloans, secured and unsecured revolving credit facility, an affiliate linefacilities, and secured financings on investments in real estate debt. Certain of credit,our mortgage notes, term loans, secured and repurchase agreements. Our mortgage loans, term loan,unsecured revolving credit facility,facilities and affiliate line of creditsecured financings are variable rate and indexed to one-month U.S. Dollar denominated LIBOR.LIBOR, three-month U.S. Dollar denominated LIBOR, three-month GBP denominated LIBOR, or three-month Euro denominated LIBOR (collectively, the “Reference Rates”). For the three and ninesix months ended SeptemberJune 30, 2017,2021, a 10% increase in one-month U.S. Dollar denominated LIBORthe Reference Rates would have resulted in increased interest expense of $819 thousand$0.2 million and $1.3$0.4 million, respectively.OurLIBOR and certain other floating rate benchmark indices to which our floating rate loans and other loan agreements are tied, including, without limitation, the Euro Interbank Offered Rate (collectively, "IBORs"), are the subject of recent national, international and regulatory guidance and proposals for reform. On November 30, 2020, the Financial Conduct Authority of the U.K., (the "FCA"), which has statutory powers to require panel banks to contribute to LIBOR where necessary, announced that subject to confirmation following its consultation with the administrator of LIBOR, it would cease publication of the one-week and two-month USD LIBOR immediately after December 31, 2021 and cease publication of the remaining tenors immediately after June 30, 2023. Additionally, the Federal Reserve Board has advised banks to stop entering into new USD LIBOR based contracts. The U.S. Federal Reserve, in conjunction with the Alternative Reference Rates Committee, a steering committee comprised of large U.S. financial institutions, has identified the Secured Overnight Financing Rate, ("SOFR"), a new index calculated by short-term repurchase agreements, are variablebacked by Treasury securities, as its preferred alternative rate and indexedfor LIBOR. At this time, it is not possible to three-month U.S. Dollar denominated LIBOR. Forpredict how markets will respond to SOFR or other alternative reference rates as the three and nine months ended September 30, 2017, a 10% increasetransition away from the IBOR benchmarks is anticipated in coming years. Refer to “Part I. Item 1A. Risk Factors — Risks Related to Debt Financing — Changes to, or the three-month U.S. Dollar denominatedelimination of, LIBOR rate would have resulted in increasedmay adversely affect interest expense related to borrowings under our credit facilities and real estate-related investments” of $217 thousand and $293 thousand, respectively.We may seek to limitour Annual Report on Form 10-K for the impact of rising interest rates on earnings and cash flows through the use of fixed rate financings or the use of derivative financial instruments to hedge exposures to changes in interest rates on loans secured by our assets.Investments in real estate-related securitiesAs of SeptemberJune 30, 2017, our2021, we held $5.7 billion of investments in real estate-related securities consisted of $644.4 million of CMBS.estate debt. Our CMBS investments in real estate debt are primarily floating-rate and indexed to one-month U.S. denominated LIBORthe Reference Rates or the Sterling Overnight Index Average, and as such, exposed to interest rate risk. Our net income will increase or decrease depending on interest rate movements. While we cannot predict factors which may or may not affect interest rates, duringfor the three and ninesix months ended SeptemberJune 30, 2017,2021, a 10% increase or decrease in the one-month U.S. denominated LIBOR rateReference Rates would have resulted in an increase or decrease to income from investments in real estate-related securitiesestate debt of $467 thousand$0.1 million and $663 thousand,$0.2 million, respectively.We may also be exposed to market risk with respect to our investments in real-estate related securitiesreal estate debt due to changes in the fair value of our investments. We seek to manage our exposure to market risk with respect to our investments in real estate debt by making investments in real estate debt backed by different types of collateral and varying credit ratings. The fair value of our investments may fluctuate, thustherefore the amount we will realize upon any sale of our investments in CMBSreal estate debt is unknown. AsHowever, as of SeptemberJune 30, 2017, the fair value at which we may sell our investments in real estate-related securities is not known, but2021, a 10% change in the fair value of our investments in real estate-related securities mayestate debt would result in an unrealized gain or lossa change in the carrying value of $64.4our investments in real estate debt of $572.9 million.62ITEM 4. CONTROLS AND PROCEDURESEvaluation of Disclosure Controls and ProceduresAn evaluation of the effectiveness of the design and operation of our “disclosure controls and procedures” (as defined in Rule 13a-15(e) under the Securities Exchange Act of 1934, as amended (the “Exchange Act”)), as of the end of the period covered by this quarterly report on Form 10-Q was made under the supervision and with the participation of our management, including our Chief Executive Officer (“CEO”) and Chief Financial Officer (“CFO”). Based upon this evaluation, our CEO and CFO have concluded that as of the end of the period covered by this report our disclosure controls and procedures (a) arewere effective to ensure that information required to be disclosed by us in reports filed or submitted under the Exchange Act is recorded, processed, summarized and reported within the time periods specified by SEC rules and forms and (b) include,included, without limitation, controls and procedures designed to ensure that information required to be disclosed by us in reports filed or submitted under the Exchange Act is accumulated and communicated to our management, including our CEO and CFO, as appropriate to allow timely decisions regarding required disclosure.Changes in Internal Controls over Financial ReportingThere have been no changes in our “internal control over financial reporting” (as defined in Rule 13a-15(f) of the Exchange Act) that occurred during the period covered by this quarterly report on Form 10-Q that have materially affected, or are reasonably likely to materially affect, our internal control over financial reporting.63PART II. OTHER INFORMATIONITEM 1. LEGAL PROCEEDINGSFrom time to time, we may be involved in various claims and legal actions arising in the ordinary course of business. As of SeptemberJune 30, 2017,2021, we were not involved in any material legal proceedings.There have been no material changes toITEM 1A. RISK FACTORSFor information regarding factors that could affect our results of operations, financial condition and liquidity, see the risk factors previously disclosed underdiscussed in Part I, Item 1A of1A. “Risk Factors” in our Annual Report on Form 10-K for the year ended December 31, 2016.
2020 and under the heading “Risk Factors” in our prospectus dated February 12, 2021, as supplemented.64ITEM 2. UNREGISTERED SALES OF EQUITY SECURITIES AND USE OF PROCEEDSUnregistered Sales of Equity SecuritiesDuring the three months ended SeptemberJune 30, 2017,2021, we did not sell or issue anysold equity securities that were not registered under the Securities Act. As described in Note 119 to our condensed consolidated financial statements, the Adviser is entitled to an annual management fee payable monthly in cash, shares of common stock, or BREIT OP Units, in each case at the Adviser's election. For each of the three month periodmonths ended SeptemberJune 30, 2017,2021, the Adviser elected to receive its management fee in Class I Shares. During October 2017, the Companyshares, and we issued 355 thousand4.8 million unregistered Class I Sharesshares to the Adviser in satisfaction of the management fee.Use of Offering ProceedsOn August 31, 2016, our Registration Statement on Form S-11 (File No. 333-213043) covering the Offering of up to $5.0 billion in shares of common stock (in any combination of purchases of Class S, Class T, Class Dfee for April and May 2021. Additionally, we issued 2.7 million unregistered Class I shares to the Adviser in July 2021 in satisfaction of our common stock), consistingthe June 2021 management fee.We have also sold Class I shares to feeder vehicles created primarily to hold Class I shares and offer indirect interests in such shares to non-U.S. persons. The offer and sale of upClass I shares to $4.0 billion in shares in our primary offering and up to $1.0 billion in shares pursuant to our distribution reinvestment plan,the feeder vehicles was declared effective underexempt from the Securities Act. Amendment No. 5 to our Registration Statement was declared effective underregistration provisions of the Securities Act, on August 17, 2017. The initial offering priceby virtue of each class ofSection 4(a)(2) and Regulation S thereunder. During the three months ended June 30, 2021, we received $1.8 billion from selling 148.2 million unregistered Class I shares to such vehicles. We intend to use the net proceeds from such sales for the purposes set forth in the prospectus for our common stock was $10.00 per share, plus applicable selling commissions and dealer manager fees. The offering price for each class of our common stock is determined monthly and is made available on our websiteCurrent Offering and in prospectus supplement filings.Asa manner within the investment guidelines approved by our board of September 30, 2017, the following is certain information about the Offering and use of proceeds therefrom ($ in thousands):Under our share repurchase plan, to the extent we choose to repurchase shares in any particular month, we will only repurchase shares as of the opening of the last calendar day of that month (each such date, a “Repurchase Date”). Repurchases will be made at the transaction price in effect on the Repurchase Date (which will generally be equal to our prior month’s NAV per share), except that shares that have not been outstanding for at least one year will be repurchased at 95% of the transaction price (an “Early Repurchase Deduction”) subject to certain limited exceptions. Settlements of share repurchases will generally be made within three business days of the Repurchase Date. The Early Repurchase Deduction will not apply to shares acquired through our distribution reinvestment plan.The total amountaggregate NAV of aggregatetotal repurchases of Class S Class T, Class D andshares, Class I shares, Class T shares and Class D shares (including repurchases at certain non-U.S. investor vehicles primarily created to hold shares of the Company, but excluding any Early Repurchase Deduction applicable to the repurchased shares) is limited to no more than 2% of our aggregate NAV per month based on the aggregate NAV of the prior month and no more than 5% of our aggregate NAV per calendar quarter.Should repurchase requests, in our judgment, place an undue burden on our liquidity, adversely affect our operations or risk having an adverse impact on the companyCompany as a whole, or should we otherwise determine that investing our liquid assets in real properties or other illiquid investments rather than repurchasing our shares is in the best interests of the Company as a whole, then we may choose to repurchase fewer shares than have been requested to be repurchased, or none at all. Further, our board of directors may modify and suspend or terminate our share repurchase plan if it deems such action to be in our best interest and the best interest of our stockholders. In the event that we determine to repurchase some but not all of the shares submitted for repurchase during any month, shares repurchased at the end of the month will be repurchased on a pro rata basis.If the transaction price for the applicable month is not made available by the tenth business day prior to the last business day of the month (or is changed after such date), then no repurchase requests will be accepted for such month and stockholders who wish to have their shares repurchased the following month must resubmit their repurchase requests.65During the three months ended SeptemberJune 30, 2017,2021, we repurchased shares of our common stock in the following amounts, which represented all of the share repurchase requests received for the same period.Month of: Total Numberof SharesRepurchased(1)Repurchases as a Percentage of NAV(2)Average
Price Paid
per ShareTotal Number of
Shares Repurchased
as Part of Publicly
Announced Plans
or ProgramsMaximum Number ofShares PendingRepurchase Pursuantto PubliclyAnnounced Plansor Programs(3)April 2021 9,361,311 0.4% $ 11.88 7,307,122 — May 2021 5,283,805 0.2% 12.10 5,283,805 — June 2021 5,432,744 0.2% 12.40 5,432,744 — Total 20,077,860 N/M $ 12.08 18,023,671 —
(1)Includes 2,054,189 Class I common shares previously issued to the Adviser as payment for the management fee. The shares were repurchased at the then current transaction price resulting in a total repurchase of $24.4 million. As of June 30, 2021, the Adviser owned 6,940,360 of our Class I common shares.(1)Repurchases are limited under the share repurchase plan as described above. Under the share repurchase plan, we would have been able to repurchase up to an aggregate of $57.6 million of Class T, Class S, Class D and Class I shares based on our August 31, 2017 NAV in the third quarter of 2017 (if such repurchase requests were made). Pursuant to the share repurchase plan, this amount resets at the beginning of each quarter.(2)Represents aggregate NAV of the shares repurchased under our share repurchase plan over aggregate NAV of all shares outstanding, in each case, based on the NAV as of the last calendar day of the prior month.(3)All repurchase requests under our share repurchase plan were satisfied.The Special Limited Partner continues to hold 23,788 Class I units in BREIT OP. The redemption of Class I units, Class B units and shares held by the Adviser acquired as payment of the Adviser’s management fee are not considered part of our share repurchase plan.ITEM 3. DEFAULTS UPON SENIOR SECURITIESNone.ITEM 4. MINE SAFETY DISCLOSURESNot applicable.ITEM 5. OTHER INFORMATIONNot applicable.66ITEM 6. EXHIBITSNone.Not applicable.Not applicable. 4.131.1* 31.1 31.2104 Cover Page Interactive Data File (formatted as Inline XBRL and contained in Exhibit 101) +* Filed herewith. + This exhibit shall not be deemed “filed” for purposes of Section 18 of the Securities Exchange Act of 1934, as amended (the “Exchange Act”) or otherwise subject to the liability of that Section. Such exhibit shall not be deemed incorporated into any filing under the Securities Act or the Exchange Act.The agreements and other documents filed as exhibits to this report are not intended to provide factual information or other disclosure other than with respect to the terms of the agreements or other documents themselves, and you should not rely on them for that purpose. In particular, any representations and warranties made by us in these agreements or other documents were made solely within the specific context of the relevant agreement or document and may not describe the actual state of affairs as of the date they were made or at any other time.67SIGNATURESPursuant to the requirements of the Securities Exchange Act of 1934, the registrant has duly caused this report to be signed on its behalf by the undersigned thereunto duly authorized.BLACKSTONE REAL ESTATE INCOME TRUST, INC. November 13, 2017November 13, 2017Paul D. QuinlanPaul D. QuinlanOfficer andAugust 12, 2021 /s/ Paul Kolodziej Date Paul Kolodziej Chief Accounting Officer (Principal Accounting Officer) 4368