REPUBLIC OF PANAMA |
| 72-0593134 | |
(State or Other Jurisdiction of Incorporation or Organization) |
| (I.R.S. Employer Identification No.) | |
|
|
| |
HOUSTON, TEXAS |
|
| 77079 |
(Address of Principal Executive Offices) |
| (Zip Code) |
UNITED STATES
SECURITIES AND EXCHANGE COMMISSION
Washington, D.C. 20549
FORM 10-Q
(Mark One)
☑ | QUARTERLY REPORT PURSUANT TO SECTION 13 OR 15(d) OF THE SECURITIES EXCHANGE ACT OF 1934 |
For the quarterly period ended March 31, 20182019
OR
☐ | TRANSITION REPORT PURSUANT TO SECTION 13 OR 15(d) OF THE SECURITIES EXCHANGE ACT OF 1934 |
For the transition period from to
Commission File No. 001-08430
McDERMOTT INTERNATIONAL, INC.
(Exact name of registrant as specified in its charter)
REPUBLIC OF PANAMA |
| 72-0593134 | |
(State or Other Jurisdiction of Incorporation or Organization) |
| (I.R.S. Employer Identification No.) | |
|
|
| |
HOUSTON, TEXAS |
|
| 77079 |
(Address of Principal Executive Offices) |
| (Zip Code) |
Registrant’s Telephone Number, Including Area Code: (281) 870-5000
Indicate by check mark whether the registrant (1) has filed all reports required to be filed by Section 13 or 15(d) of the Securities Exchange Act of 1934 during the preceding 12 months (or for such shorter period that the registrant was required to file such reports), and (2) has been subject to such filing requirements for the past 90 days. Yes ☑ No ☐
Indicate by check mark whether the registrant has submitted electronically and posted on its corporate Web site, if any, every Interactive Data File required to be submitted and posted pursuant to Rule 405 of Regulation S-T (§ 232.405 of this chapter) during the preceding 12 months (or for such shorter period that the registrant was required to submit and post such files). Yes ☑ No ☐
Indicate by check mark whether the registrant is a large accelerated filer, an accelerated filer, a non-accelerated filer, a smaller reporting company, or an emerging growth company. See the definitions of “large accelerated filer,” “accelerated filer”,filer,” “smaller reporting company” and “emerging growth company” in Rule 12b-2 of the Exchange Act.
Large accelerated filer | ☑ | Accelerated filer | ☐ |
|
|
|
|
Non-accelerated filer | ☐ | Smaller reporting company | ☐ |
|
|
|
|
|
| Emerging growth company | ☐ |
If an emerging growth company, indicate by check mark if the registrant has elected not to use the extended transition period for complying with any new or revised financial accounting standards provided pursuant to Section 13(a) of the Exchange Act. ☐
Indicate by check mark whether the registrant is a shell company (as defined in Rule 12b-2 of the Exchange Act). Yes ☐ No ☑
The number of shares of the registrant’s common stock outstanding at April 20, 201825, 2019 was 285,899,713.
181,658,808.
TABLE OF CONTENTS
McDERMOTT INTERNATIONAL, INC.
INDEX—FORM 10-Q
PAGE | |
1 | |
1 | |
1 | |
2 | |
3 | |
4 | |
5 | |
7 | |
Item 2—Management’s Discussion and Analysis of Financial Condition and Results of Operations | 43 |
Item 3—Quantitative and Qualitative Disclosures about Market Risk | 65 |
66 | |
67 | |
67 | |
67 | |
68 | |
69 | |
70 |
CONDENSED CONSOLIDATED FINANCIAL STATEMENTS
PART I: FINANCIAL INFORMATION
Item 1. Condensed Consolidated Financial Statements
McDERMOTT INTERNATIONAL, INC. |
| |||||||
CONDENSED CONSOLIDATED STATEMENTS OF OPERATIONS |
| |||||||
(Unaudited) |
| |||||||
|
| Three months ended March 31, |
| |||||
|
| 2019 |
|
| 2018 |
| ||
|
| (In millions, except per share amounts) |
| |||||
Revenues |
| $ | 2,211 |
|
| $ | 608 |
|
|
|
|
|
|
|
|
|
|
Costs and Expenses: |
|
|
|
|
|
|
|
|
Cost of operations |
|
| 2,018 |
|
|
| 476 |
|
Project intangibles and inventory-related amortization |
|
| 10 |
|
|
| - |
|
Total cost of operations |
|
| 2,028 |
|
|
| 476 |
|
Research and development expenses |
|
| 8 |
|
|
| - |
|
Selling, general and administrative expenses |
|
| 72 |
|
|
| 48 |
|
Other intangibles amortization |
|
| 22 |
|
|
| - |
|
Transaction costs |
|
| 4 |
|
|
| 3 |
|
Restructuring and integration costs |
|
| 69 |
|
|
| 12 |
|
Other operating expense, net |
|
| 1 |
|
|
| - |
|
Total expenses |
|
| 2,204 |
|
|
| 539 |
|
|
|
|
|
|
|
|
|
|
Income (loss) from investments in unconsolidated affiliates |
|
| 9 |
|
|
| (4 | ) |
Investment in unconsolidated affiliates-related amortization |
|
| (3 | ) |
|
| - |
|
Operating income |
|
| 13 |
|
|
| 65 |
|
|
|
|
|
|
|
|
|
|
Other expense: |
|
|
|
|
|
|
|
|
Interest expense, net |
|
| (92 | ) |
|
| (12 | ) |
Other non-operating income, net |
|
| 1 |
|
|
| 2 |
|
Total other expense, net |
|
| (91 | ) |
|
| (10 | ) |
|
|
|
|
|
|
|
|
|
(Loss) income before provision for income taxes |
|
| (78 | ) |
|
| 55 |
|
|
|
|
|
|
|
|
|
|
Income tax (benefit) expense |
|
| (21 | ) |
|
| 21 |
|
|
|
|
|
|
|
|
|
|
Net (loss) income |
|
| (57 | ) |
|
| 34 |
|
|
|
|
|
|
|
|
|
|
Less: Net loss attributable to noncontrolling interests |
|
| (1 | ) |
|
| (1 | ) |
|
|
|
|
|
|
|
|
|
Net (loss) income attributable to McDermott |
| $ | (56 | ) |
| $ | 35 |
|
|
|
|
|
|
|
|
|
|
Dividends on redeemable preferred stock |
|
| (10 | ) |
|
| - |
|
Accretion of redeemable preferred stock |
|
| (4 | ) |
|
| - |
|
|
|
|
|
|
|
|
|
|
Net (loss) income attributable to common stockholders |
| $ | (70 | ) |
| $ | 35 |
|
|
|
|
|
|
|
|
|
|
Net (loss) income per share attributable to common stockholders |
|
|
|
|
|
|
|
|
Basic |
| $ | (0.39 | ) |
| $ | 0.37 |
|
Diluted |
| $ | (0.39 | ) |
| $ | 0.37 |
|
|
|
|
|
|
|
|
|
|
Shares used in the computation of net (loss) income per share |
|
|
|
|
|
|
|
|
Basic |
|
| 181 |
|
|
| 95 |
|
Diluted |
|
| 181 |
|
|
| 95 |
|
See accompanying Notes to these Condensed Consolidated Financial Statements.
| 1 |
CONDENSED CONSOLIDATED FINANCIAL STATEMENTS
McDERMOTT INTERNATIONAL, INC. |
| |||||||
CONDENSED CONSOLIDATED STATEMENTS OF COMPREHENSIVE INCOME (LOSS) |
| |||||||
(Unaudited) |
| |||||||
|
|
|
|
|
|
|
|
|
|
| Three months ended March 31, |
| |||||
|
| 2019 |
|
| 2018 |
| ||
|
| (In millions) |
| |||||
Net (loss) income |
| $ | (57 | ) |
| $ | 34 |
|
Other comprehensive (loss) income, net of tax: |
|
|
|
|
|
|
|
|
(Loss) gain on derivatives |
|
| (19 | ) |
|
| - |
|
Foreign currency translation |
|
| (39 | ) |
|
| (1 | ) |
Total comprehensive (loss) income |
|
| (115 | ) |
|
| 33 |
|
Less: Comprehensive loss attributable to noncontrolling interests |
|
| (1 | ) |
|
| (1 | ) |
Comprehensive (loss) income attributable to McDermott |
| $ | (114 | ) |
| $ | 34 |
|
See accompanying Notes to these Condensed Consolidated Financial Statements.
| 2 |
CONDENSED CONSOLIDATED FINANCIAL STATEMENTS
McDERMOTT INTERNATIONAL, INC. |
| |||||||
CONSOLIDATED BALANCE SHEETS |
| |||||||
|
|
|
| |||||
|
| March 31, 2019 |
|
| December 31, 2018 |
| ||
|
| (In millions, except per share amounts) |
| |||||
Assets |
| (Unaudited) |
|
|
|
|
| |
Current assets: |
|
|
|
|
|
|
|
|
Cash and cash equivalents ($142 and $146 related to variable interest entities ("VIEs")) |
| $ | 413 |
|
| $ | 520 |
|
Restricted cash and cash equivalents |
|
| 326 |
|
|
| 325 |
|
Accounts receivable—trade, net ($15 and $29 related to VIEs) |
|
| 977 |
|
|
| 932 |
|
Accounts receivable—other ($49 and $57 related to VIEs) |
|
| 149 |
|
|
| 175 |
|
Contracts in progress ($245 and $144 related to VIEs) |
|
| 1,006 |
|
|
| 704 |
|
Project-related intangible assets, net |
|
| 114 |
|
|
| 137 |
|
Inventory |
|
| 106 |
|
|
| 101 |
|
Other current assets ($29 and $24 related to VIEs) |
|
| 148 |
|
|
| 139 |
|
Total current assets |
|
| 3,239 |
|
|
| 3,033 |
|
Property, plant and equipment, net |
|
| 2,051 |
|
|
| 2,067 |
|
Operating lease right-of-use assets |
|
| 401 |
|
|
| - |
|
Accounts receivable—long-term retainages |
|
| 69 |
|
|
| 62 |
|
Investments in unconsolidated affiliates |
|
| 453 |
|
|
| 452 |
|
Goodwill |
|
| 2,681 |
|
|
| 2,654 |
|
Other intangibles, net |
|
| 979 |
|
|
| 1,009 |
|
Other non-current assets |
|
| 156 |
|
|
| 163 |
|
Total assets |
| $ | 10,029 |
|
| $ | 9,440 |
|
|
|
|
|
|
|
|
|
|
Liabilities, Mezzanine Equity and Stockholders' Equity |
|
|
|
|
|
|
|
|
Current liabilities: |
|
|
|
|
|
|
|
|
Revolving credit facility |
| $ | 178 |
|
| $ | - |
|
Current maturities of long-term debt |
|
| 30 |
|
|
| 30 |
|
Current portion of long-term lease obligations |
|
| 97 |
|
|
| 8 |
|
Accounts payable ($326 and $277 related to VIEs) |
|
| 949 |
|
|
| 595 |
|
Advance billings on contracts ($541 and $717 related to VIEs) |
|
| 1,618 |
|
|
| 1,954 |
|
Project-related intangible liabilities, net |
|
| 52 |
|
|
| 66 |
|
Accrued liabilities ($94 and $136 related to VIEs) |
|
| 1,694 |
|
|
| 1,564 |
|
Total current liabilities |
|
| 4,618 |
|
|
| 4,217 |
|
Long-term debt |
|
| 3,393 |
|
|
| 3,393 |
|
Long-term lease obligations |
|
| 394 |
|
|
| 66 |
|
Deferred income taxes |
|
| 47 |
|
|
| 47 |
|
Other non-current liabilities |
|
| 659 |
|
|
| 664 |
|
Total liabilities |
|
| 9,111 |
|
|
| 8,387 |
|
Commitments and contingencies |
|
|
|
|
|
|
|
|
Mezzanine equity: |
|
|
|
|
|
|
|
|
Redeemable preferred stock |
|
| 243 |
|
|
| 230 |
|
Stockholders' equity: |
|
|
|
|
|
|
|
|
Common stock, par value $1.00 per share, authorized 255 shares; |
|
|
|
|
|
|
|
|
issued 184 and 183 shares, respectively |
|
| 184 |
|
|
| 183 |
|
Capital in excess of par value |
| 3,545 |
|
|
| 3,539 |
| |
Accumulated deficit |
|
| (2,789 | ) |
|
| (2,719 | ) |
Accumulated other comprehensive loss |
|
| (165 | ) |
|
| (107 | ) |
Treasury stock, at cost: 3 and 3 shares, respectively |
|
| (96 | ) |
|
| (96 | ) |
Total McDermott Stockholders' Equity |
|
| 679 |
|
|
| 800 |
|
Noncontrolling interest |
|
| (4 | ) |
|
| 23 |
|
Total stockholders' equity |
|
| 675 |
|
|
| 823 |
|
Total liabilities and stockholders' equity |
| $ | 10,029 |
|
| $ | 9,440 |
|
See accompanying Notes to these Condensed Consolidated Financial Statements.
| 3 |
CONDENSED CONSOLIDATED FINANCIAL STATEMENTS
McDERMOTT INTERNATIONAL, INC. |
| |||||||
CONDENSED CONSOLIDATED STATEMENTS OF CASH FLOWS |
| |||||||
(Unaudited) |
| |||||||
|
| Three months ended March 31, |
| |||||
|
| 2019 |
|
| 2018 |
| ||
|
| (In millions) |
| |||||
Cash flows from operating activities: |
|
|
|
|
|
|
|
|
Net (loss) income |
| $ | (57 | ) |
| $ | 34 |
|
Non-cash items included in net (loss) income: |
|
|
|
|
|
|
|
|
Depreciation and amortization |
|
| 76 |
|
|
| 23 |
|
Debt issuance cost amortization |
|
| 11 |
|
|
| 2 |
|
Stock-based compensation charges |
|
| 6 |
|
|
| 3 |
|
Deferred taxes |
|
| - |
|
|
| 1 |
|
Changes in operating assets and liabilities, net of effects of businesses acquired: |
|
|
|
|
|
|
|
|
Accounts receivable |
|
| (87 | ) |
|
| (68 | ) |
Contracts in progress, net of advance billings on contracts |
|
| (638 | ) |
|
| 143 |
|
Accounts payable |
|
| 357 |
|
|
| (90 | ) |
Other current and non-current assets |
|
| 12 |
|
|
| (20 | ) |
Investments in unconsolidated affiliates |
|
| (4 | ) |
|
| 4 |
|
Other current and non-current liabilities |
|
| 80 |
|
|
| 6 |
|
Total cash (used in) provided by operating activities |
|
| (244 | ) |
|
| 38 |
|
|
|
|
|
|
|
|
|
|
Cash flows from investing activities: |
|
|
|
|
|
|
|
|
Purchases of property, plant and equipment |
|
| (18 | ) |
|
| (18 | ) |
Advances related to proportionately consolidated consortiums |
|
| (114 | ) |
|
| - |
|
Investments in unconsolidated affiliates |
|
| (1 | ) |
|
| (2 | ) |
Total cash used in investing activities |
|
| (133 | ) |
|
| (20 | ) |
|
|
|
|
|
|
|
|
|
Cash flows from financing activities: |
|
|
|
|
|
|
|
|
Revolving credit facility borrowings |
|
| 483 |
|
|
| - |
|
Revolving credit facility repayments |
|
| (305 | ) |
|
| - |
|
Repayment of debt and finance lease obligations |
|
| (8 | ) |
|
| - |
|
Advances related to equity method joint ventures and proportionately consolidated consortiums |
|
| 116 |
|
|
| - |
|
Repurchase of common stock |
|
| (4 | ) |
|
| (7 | ) |
Distribution to joint venture member |
|
| (5 | ) |
|
| - |
|
Total cash provided by (used in) financing activities |
|
| 277 |
|
|
| (7 | ) |
|
|
|
|
|
|
|
|
|
Effects of exchange rate changes on cash, cash equivalents and restricted cash |
|
| (6 | ) |
|
| - |
|
Net (decrease) increase in cash, cash equivalents and restricted cash |
|
| (106 | ) |
|
| 11 |
|
Cash, cash equivalents and restricted cash at beginning of period |
|
| 845 |
|
|
| 408 |
|
Cash, cash equivalents and restricted cash at end of period |
| $ | 739 |
|
| $ | 419 |
|
|
|
|
|
|
|
|
|
|
See accompanying Notes to these Condensed Consolidated Financial Statements.
| 4 |
CONDENSED CONSOLIDATED FINANCIAL STATEMENTS
McDERMOTT INTERNATIONAL, INC. |
| |||||||||||||||||||||||||||||||||||||
CONDENSED CONSOLIDATED STATEMENTS OF STOCKHOLDERS' EQUITY |
| |||||||||||||||||||||||||||||||||||||
(Unaudited) |
| |||||||||||||||||||||||||||||||||||||
|
| Common Stock Par Value |
|
| Capital in Excess of Par Value |
|
| Retained Earnings/ (Accumulated Deficit) |
|
| Accumulated Other Comprehensive Loss ("AOCI") |
|
| Treasury Stock |
|
| Stockholders' Equity |
|
| Noncontrolling Interest ("NCI") |
|
| Total Equity |
| ||||||||||||||
| (In millions) |
| ||||||||||||||||||||||||||||||||||||
Balance at December 31, 2017 |
| $$$ | $ 293 |
|
| $ | 1,663 |
|
| $ | (48 | ) |
| $ | (50 | ) |
| $ | (96 | ) |
| $ | 1,762 |
|
| $ | 28 |
|
| $ | 1,790 |
| ||||||
Adoption of ASC 606 |
|
| - |
|
|
| - |
|
|
| 20 |
|
|
| - |
|
|
| - |
|
|
| 20 |
|
|
| - |
|
|
| 20 |
| ||||||
Balance at January 1, 2018 |
|
| 293 |
|
|
| 1,663 |
|
|
| (28 | ) |
|
| (50 | ) |
|
| (96 | ) |
|
| 1,782 |
|
|
| 28 |
|
|
| 1,810 |
| ||||||
Net income (loss) |
|
| - |
|
|
| - |
|
|
| 35 |
|
|
| - |
|
|
| - |
|
|
| 35 |
|
|
| (1 | ) |
|
| 34 |
| ||||||
Other comprehensive loss, net of tax |
|
| - |
|
|
| - |
|
|
| - |
|
|
| (1 | ) |
|
| - |
|
|
| (1 | ) |
|
| - |
|
|
| (1 | ) | ||||||
Common stock issued |
|
| 3 |
|
|
| (3 | ) |
|
| - |
|
|
| - |
|
|
| - |
|
|
| - |
|
|
| - |
|
|
| - |
| ||||||
Stock-based compensation charges |
|
| - |
|
|
| 3 |
|
|
| - |
|
|
| - |
|
|
| - |
|
|
| 3 |
|
|
| - |
|
|
| 3 |
| ||||||
Purchase of treasury shares |
|
| - |
|
|
| - |
|
|
| - |
|
|
| - |
|
|
| (7 | ) |
|
| (7 | ) |
|
| - |
|
|
| (7 | ) | ||||||
Retirement of common stock |
|
| (1 | ) |
|
| (6 | ) |
|
| - |
|
|
| - |
|
|
| 7 |
|
|
| - |
|
|
| - |
|
|
| - |
| ||||||
Balance at March 31, 2018 |
|
| 295 |
|
|
| 1,657 |
|
|
| 7 |
|
|
| (51 | ) |
|
| (96 | ) |
|
| 1,812 |
|
|
| 27 |
|
|
| 1,839 |
| ||||||
|
|
|
|
|
|
|
|
|
|
|
|
|
|
|
|
|
|
|
|
|
|
|
|
|
|
|
|
|
|
|
|
| ||||||
Balance at December 31, 2018 |
|
| 183 |
|
|
| 3,539 |
|
|
| (2,719 | ) |
|
| (107 | ) |
|
| (96 | ) |
|
| 800 |
|
|
| 23 |
|
|
| 823 |
| ||||||
Net loss |
|
| - |
|
|
| - |
|
|
| (56 | ) |
|
| - |
|
|
| - |
|
|
| (56 | ) |
|
| (1 | ) |
|
| (57 | ) | ||||||
Other comprehensive loss, net of tax |
|
| - |
|
|
| - |
|
|
| - |
|
|
| (58 | ) |
|
| - |
|
|
| (58 | ) |
|
| - |
|
|
| (58 | ) | ||||||
Common stock issued |
|
| 2 |
|
|
| (2 | ) |
|
| - |
|
|
| - |
|
|
| - |
|
|
| - |
|
|
| - |
|
|
| - |
| ||||||
Stock-based compensation charges |
|
| - |
|
|
| 6 |
|
|
| - |
|
|
| - |
|
|
| - |
|
|
| 6 |
|
|
| - |
|
|
| 6 |
| ||||||
Accretion and dividends on redeemable preferred stock |
|
| - |
|
|
| - |
|
|
| (14 | ) |
|
| - |
|
|
| - |
|
|
| (14 | ) |
|
| - |
|
|
| (14 | ) | ||||||
Conversion of noncontrolling interest |
|
| - |
|
|
| 2 |
|
|
| - |
|
|
| - |
|
|
| - |
|
|
| 2 |
|
|
| (26 | ) |
|
| (24 | ) | ||||||
Purchase of treasury shares |
|
| - |
|
|
| - |
|
|
| - |
|
|
| - |
|
|
| (4 | ) |
|
| (4 | ) |
|
| - |
|
|
| (4 | ) | ||||||
Retirement of common stock |
|
| (1 | ) |
|
| (3 | ) |
|
|
|
|
|
|
|
|
|
| 4 |
|
|
| - |
|
|
| - |
|
|
| - |
| ||||||
Other |
|
| - |
|
|
| 3 |
|
|
| - |
|
|
| - |
|
|
| - |
|
|
| 3 |
|
|
| - |
|
|
| 3 |
| ||||||
Balance at March 31, 2019 |
| $ | 184 |
|
| $ | 3,545 |
|
| $ | (2,789 | ) |
| $ | (165 | ) |
| $ | (96 | ) |
| $ | 679 |
|
| $ | (4 | ) |
| $ | 675 |
| ||||||
See accompanying Notes to these Condensed Consolidated Financial Statements.
| 5 |
NOTES TO THE CONDENSED CONSOLIDATED FINANCIAL STATEMENTS (UNAUDITED)
TABLE OF CONTENTS
CONSOLIDATED FINANCIAL STATEMENTS
PART I: Item 1—FINANCIAL INFORMATION
See accompanying Notes to the Consolidated Financial Statements.
|
|
CONSOLIDATED FINANCIAL STATEMENTS
See accompanying Notes to the Consolidated Financial Statements.
|
|
CONSOLIDATED FINANCIAL STATEMENTS
McDERMOTT INTERNATIONAL, INC. |
| |||||||
| ||||||||
|
|
|
| |||||
|
| March 31, 2018 |
|
| December 31, 2017 |
| ||
|
| (In thousands, except share and per share amounts) |
| |||||
Assets |
| (Unaudited) |
|
|
|
|
| |
Current assets: |
|
|
|
|
|
|
|
|
Cash and cash equivalents |
| $ | 412,725 |
|
| $ | 390,263 |
|
Restricted cash and cash equivalents |
|
| 6,074 |
|
|
| 17,929 |
|
Accounts receivable—trade, net |
|
| 395,073 |
|
|
| 328,302 |
|
Accounts receivable—other |
|
| 52,818 |
|
|
| 40,730 |
|
Contracts in progress |
|
| 506,420 |
|
|
| 621,411 |
|
Other current assets |
|
| 43,519 |
|
|
| 35,615 |
|
Total current assets |
|
| 1,416,629 |
|
|
| 1,434,250 |
|
Property, plant and equipment |
|
| 2,659,414 |
|
|
| 2,651,087 |
|
Less accumulated depreciation |
|
| (994,237 | ) |
|
| (985,273 | ) |
Property, plant and equipment, net |
|
| 1,665,177 |
|
|
| 1,665,814 |
|
Accounts receivable—long-term retainages |
|
| 40,154 |
|
|
| 39,253 |
|
Investments in Unconsolidated Affiliates |
|
| 5,318 |
|
|
| 7,501 |
|
Deferred income taxes |
|
| 17,400 |
|
|
| 17,616 |
|
Other assets |
|
| 55,970 |
|
|
| 58,386 |
|
Total assets |
| $ | 3,200,648 |
|
| $ | 3,222,820 |
|
|
|
|
|
|
|
|
|
|
Liabilities and Equity |
|
|
|
|
|
|
|
|
Current liabilities: |
|
|
|
|
|
|
|
|
Notes payable and current maturities of long-term debt |
| $ | 24,264 |
|
| $ | 24,264 |
|
Accounts payable |
|
| 191,561 |
|
|
| 279,109 |
|
Accrued liabilities |
|
| 341,637 |
|
|
| 336,747 |
|
Advance billings on contracts |
|
| 40,207 |
|
|
| 32,252 |
|
Income taxes payable |
|
| 40,670 |
|
|
| 34,562 |
|
Total current liabilities |
|
| 638,339 |
|
|
| 706,934 |
|
Long-term debt |
|
| 512,994 |
|
|
| 512,713 |
|
Self-insurance |
|
| 16,550 |
|
|
| 16,097 |
|
Pension liabilities |
|
| 14,535 |
|
|
| 14,400 |
|
Non-current income taxes |
|
| 63,798 |
|
|
| 62,881 |
|
Other liabilities |
|
| 115,479 |
|
|
| 121,018 |
|
Total liabilities |
|
| 1,361,695 |
|
|
| 1,434,043 |
|
Commitments and contingencies |
|
|
|
|
|
|
|
|
Stockholders' equity: |
|
|
|
|
|
|
|
|
Common stock, par value $1.00 per share, authorized 400,000,000 shares; |
|
|
|
|
|
|
|
|
issued 294,407,255 and 292,525,841 shares, respectively |
|
| 294,407 |
|
|
| 292,526 |
|
Capital in excess of par value |
| 1,657,744 |
|
|
| 1,663,091 |
| |
Retained earnings/ (Accumulated deficit) |
|
| 6,912 |
|
|
| (48,221 | ) |
Accumulated other comprehensive loss |
|
| (50,807 | ) |
|
| (50,448 | ) |
Treasury stock, at cost: 8,507,542 and 8,499,021 shares, respectively |
|
| (96,347 | ) |
|
| (96,282 | ) |
Stockholders' Equity—McDermott |
|
| 1,811,909 |
|
|
| 1,760,666 |
|
Noncontrolling interest |
|
| 27,044 |
|
|
| 28,111 |
|
Total equity |
|
| 1,838,953 |
|
|
| 1,788,777 |
|
Total liabilities and equity |
| $ | 3,200,648 |
|
| $ | 3,222,820 |
|
See accompanying Notes to the Consolidated Financial Statements.
|
|
CONSOLIDATED FINANCIAL STATEMENTS
See accompanying Notes to the Consolidated Financial Statements.
|
|
CONSOLIDATED FINANCIAL STATEMENTS
See accompanying Notes to the Consolidated Financial Statements.
|
|
NOTES TO THE CONSOLIDATED FINANCIAL STATEMENTS (UNAUDITED)
| ||
Note |
|
|
|
| |
|
| |
|
| |
| ||
| ||
|
| |
| ||
| ||
| ||
| ||
| ||
| ||
| ||
| ||
|
| 6 |
|
NOTES TO THE CONDENSED CONSOLIDATED FINANCIAL STATEMENTS (UNAUDITED)
NOTE 1—BASISNATURE OF PRESENTATIONOPERATIONS AND SIGNIFICANT ACCOUNTING POLICIESORGANIZATION
Nature of Operations
McDermott International, Inc. (“McDermott,” “we” or “us”), a corporation incorporated under the laws of the Republic of Panama in 1959, is a leadingfully integrated provider of integrated engineering, procurement, construction and installation (“EPCI”), front-end engineering and technology solutions to the energy industry. We design (“FEED”) and module fabrication services for upstream field developments worldwide. We deliver fixedbuild end-to-end infrastructure and floating production facilities, pipeline installationstechnology solutions to transport and subsea systems from concept to commissioning for complex offshore and subseatransform oil and gas projects. Operating in approximately 20 countries acrossinto a variety of products. Our proprietary technologies, integrated expertise and comprehensive solutions are utilized for offshore, subsea, power, liquefied natural gas (“LNG”) and downstream energy projects around the Americas, Europe, Africa, Asia and Australia, our integrated resources include a diversified fleet of marine vessels, fabrication facilities and engineering offices. We support our activities with comprehensive project management and procurement services, while utilizing our fully integrated capabilities in both shallow water and deepwater construction.world. Our customers include national, major integrated and other oil and gas companies as well as producers of petrochemicals and electric power, and we operate in most major offshore oil and gasenergy producing regions throughout the world. We execute our contracts through a variety of methods, principally fixed-price, but also including cost reimbursable, cost-plus, day-rate and unit-rate basis or some combination of those methods. In these Notes to
Organization
Our business is organized into five operating groups, which represent our Consolidated Financial Statements, unlessreportable segments consisting of: North, Central and South America (“NCSA”); Europe, Africa, Russia and Caspian (“EARC”); the context otherwise indicates, “we,” “us”Middle East and “our” mean McDermott International, Inc.North Africa (“MENA”); Asia Pacific (“APAC”); and its consolidated subsidiaries.Technology. See Note 22, Segment Reporting, for further discussion.
NOTE 2—BASIS OF PRESENTATION AND SIGNIFICANT ACCOUNTING POLICIES
Basis of Presentation
The accompanying Condensed Consolidated Financial Statements (the “Financial Statements”) are unaudited and have been prepared from our books and records in accordance with Rule 10-1 of Regulation S-X for interim financial information. Accordingly, they do not include all of the information and notes required by accounting principles generally accepted in the United States (“U.S. GAAP”) for complete financial statements.statements and are not necessarily indicative of results of operations for a full year. Therefore, they should be read in conjunction with the Financial Statements and Notes thereto included in our Annual Report on Form 10-K for the year ended December 31, 2018 (the “2018 Form 10-K”).
The Financial Statements reflect all wholly owned subsidiaries and those entities we are required to consolidate. See the “Joint Venture and Consortium Arrangements” section of “Note 2—Basis of Presentation and Significant Accounting Policies” in the 2018 Form 10-K for further discussion of our consolidation policy for those entities that are not wholly owned. In the opinion of our management, all adjustments, consisting only of normal recurring adjustments, considered necessary for a fair presentation have been included. The resultsIntercompany balances and transactions are eliminated in consolidation. Values presented within tables (excluding per share data) are in millions and may not sum due to rounding.
On May 10, 2018, we completed our combination with Chicago Bridge & Iron Co. N.V. (“CB&I”) through a series of operationstransactions (the “Combination”). See Note 3, Business Combination, for interim periods are not necessarily indicative of results of operations for a full year. These Consolidated Financial Statements should be read in conjunction with our Consolidated Financial Statements and Notes thereto included in our Annual Report on Form 10-K for the year ended December 31, 2017 filed with the U.S. Securities and Exchange Commission (the “SEC”) on February 21, 2018 (the “2017 Form 10-K”).further discussion.
Classification
Certain prior year amounts have been reclassified for consistency with the current year presentation. Previously reported Consolidated Financial Statements have been adjusted to reflect those changes.
Recently Issued and Adopted Accounting Guidance
Revenue from Contracts with Customers (ASC Topic 606)—In May 2014, the Financial Accounting Standards Board (the “FASB”) issued a new standard related to revenue recognition which supersedes most of the existing revenue recognition requirements in U.S. GAAP and requires entities to recognize revenue at an amount that reflects the consideration to which an entity expects to be entitled in exchange for transferring goods or services to a customer. It also requires significantly expanded disclosures regarding the qualitative and quantitative information of an entity’s nature, amount, timing and uncertainty of revenue and cash flows arising from contracts with customers.
The FASB has issued several amendments to the standard, including clarification on accounting for licenses of intellectual property, identifying performance obligations, reporting gross versus net revenue and narrow-scope revisions and practical expedients.
Adoption—We adopted the new standard on January 1, 2018 (the “initial application” date):
using the modified retrospective application, with no restatement of the comparative periods presented and a cumulative effect adjustment to retained earnings as of the date of adoption;
applying the new standard only to those contracts that are not substantially complete at the date of initial application; and
disclosing the impact of the new standard in our 2018 Consolidated Financial Statements.
| 7 |
|
NOTES TO THE CONDENSED CONSOLIDATED FINANCIAL STATEMENTS (UNAUDITED)
Significant changes toReclassifications
Bidding and Proposal Costs—We began classifying bid and proposal costs in Cost of operations in our accounting policiesCondensed Consolidated Statements of Operations (the “Statement of Operations”) in the second quarter of 2018 as a result of adoptingour realignment of commercial personnel within our operating groups in conjunction with the new standard are discussed below:
We measure transferCombination. For the first quarter of control utilizing an input method to measure progress2018, bid and proposal costs were included in Selling, general and administrative expenses (“SG&A”) and totaled $10 million. Our Cost of operations for individual contracts or combinationsthe first quarter of contracts based on the total cost2019 includes $26 million of materials, labor, equipmentbid and vessel operating costs and other costs incurred as applicable to each contract. Previously, under ASC Topic 605-35, Construction-Type and Production-Type Contracts (the “legacy GAAP”), we generally excluded certain costs from the cost-to-cost method of measuring project progress, such as significant costs for procured materials and third-party subcontractors;proposal costs.
Our Consolidated Balance Sheet no longer reflect assets related to cost incurred in excess of cost recognized. Under legacy GAAP, we generally excluded certain costs from our cost-to-cost method of measuring progress towards completion, such as significant costs for procured materials and third-party subcontractors, which resultedBeginning in the recognitionsecond quarter of cost incurred2018, we made certain classification changes, as well as reclassifications to our historical financial statements to align with our current presentation, as follows:
• | Income (Loss) from Investments in Unconsolidated Affiliates—Our Statements of Operations for the three months ended March 31, 2018 reflects the reclassification of a $4 million loss from investments in unconsolidated affiliates associated with our ongoing io Oil and Gas and Qingdao McDermott Wuchuan Offshore Engineering Company Ltd. joint ventures to Operating income to conform to our current presentation. Previously, results from these unconsolidated joint ventures were presented below Operating income, as we did not consider the activities of the unconsolidated joint ventures to be integral to our operations. Based on an expected expansion in activity of these unconsolidated joint ventures in 2018 and in the future, we now believe the activities of these unconsolidated joint ventures are integral to our ongoing operations and are most appropriately reflected in Operating income. Income (loss) from investments in unconsolidated affiliates that are not integral to our operations will continue to be presented below Operating income. See Note 9, Joint Venture and Consortium Arrangements, for further discussion of our unconsolidated joint ventures. |
• | Reverse Common Stock Split—We amended our Amended and Restated Articles of Incorporation during the second quarter of 2018 to effect a three-to-one reverse stock split of McDermott common stock, effective May 9, 2018. Common stock, capital in excess of par, share and per share (except par value per share, which was not affected) information presented for the first quarter of 2018 has been recast in the Financial Statements and accompanying Notes to reflect the reverse stock split. |
• | Restructuring and Integration Costs and Transaction Costs—Approximately $12 million of restructuring and integration costs and $3 million of transaction costs related to the Combination, which were previously recorded within Other operating (income) expenses, net during the three months ended March 31, 2018, were reclassified to (i) Restructuring and integration costs and (ii) Transaction costs, respectively, in our Statements of Operations. See Note 10, Restructuring and Integration Costs and Transaction Costs, for further discussion. |
Use of Estimates and Judgments
The preparation of financial statements in excessconformity with U.S. GAAP requires us to make estimates and judgments that affect the reported amounts of cost recognized as an asset on our Consolidatedassets, liabilities, revenue and expenses and related disclosures of contingent assets and liabilities. We believe the most significant estimates and judgments are associated with:
• | revenue recognition for our contracts, including estimating costs to complete each contract and the recognition of incentive fees and unapproved change orders and claims; |
• | determination of fair value with respect to acquired assets and liabilities; |
• | fair value and recoverability assessments that must be periodically performed with respect to long-lived tangible assets, goodwill and other intangible assets; |
• | valuation of deferred tax assets and financial instruments; |
• | the determination of liabilities related to loss contingencies, self-insurance programs and income taxes; |
• | the determination of pension-related obligations; and |
• | consolidation determinations with respect to our joint venture and consortium arrangements. |
If the underlying estimates and assumptions upon which the Financial Statements.
Variable consideration, includingStatements are based change orders, claims, bonus, incentive fees and liquidated damages or penalties will bein the future, actual amounts may differ from those included in the estimated contract revenue at the most likely amount to which we expect to be entitled. We will include variable consideration in the estimated transaction price to the extent we concluded that it is probable a significant revenue reversal will not occur or when the uncertainty associated with the variable consideration is resolved.
Revenue RecognitionFinancial Statements.
Contracts―Our revenue is typically derived from long-term contracts that can span several years. We determine the appropriate accounting treatment for each of our contracts with customers before work on the project begins. We generally recognize contract revenues and related costs over-time.
Performance Obligation Satisfied Over Time―A performance obligation is a promise in a contract to transfer a distinct good or service to the customer, and is the unit of account in ASC Topic 606. A contract’s transaction price is allocated to each distinct performance obligation and recognized as revenue when, or as, the performance obligation is satisfied. Our performance obligations are generally satisfied over time as work progresses because of continuous transfer of control to the customer. For contracts with multiple performance obligations, we allocate the contract’s transaction price to each performance obligation using our best estimate of the stand-alone selling price of each distinct good or service in the contract.
Method to Measure Progress—We measure transfer of control utilizing an input method to measure progress for individual contracts or combinations of contracts based on the cost incurred to total cost of materials, labor, equipment and vessel operating costs and other costs as applicable to each contract. These costs, once incurred, are considered a measure of progress and are expensed in the period in which they are incurred. Costs incurred prior to a project award, are generally expensed during the period in which they are incurred.
Total estimated project costs and resulting contract income are affected by changes in the expected cost of materials and labor, productivity, vessel costs, scheduling and other factors. Additionally, external factors such as weather, customer requirements and other factors outside of our control may affect the progress and estimated cost of a project’s completion and, therefore, the timing and amount of revenue and income recognition. Changes in total estimated contract cost and losses, if any, are recognized in the period they are determined.
Performance Obligation Satisfied at a Point-in-Time Method—Contracts with performance obligations that do not meet the criteria to be recognized over time are required to be recognized “at a point-in-time”, whereby revenue and gross profit is recognized only when a performance obligation is complete and a customer has obtained control of a promised asset. For contracts with revenues recognized at a point-in-time, we consider physical possession of the asset, legal transfer of title, significant risk rewards of ownership, customer acceptance and our rights to payment in determining when a performance obligation is complete.
Remaining Performance Obligations (“RPOs”)―RPOs represent the dollar amount of revenues we expect to recognize in the future from contracts that are in progress. These amounts are presented in U.S. dollars. Currency risks associated with RPOs that are not mitigated within the contracts are generally mitigated with the use of foreign currency derivative (hedging) instruments, when deemed significant. However, these actions may not eliminate all currency risk exposure included within our long-term contracts. We do not include expected revenues of contracts related to unconsolidated joint ventures in our RPOs, except to the extent of any contract awards we receive from those joint ventures.
| 8 |
|
NOTES TO THE CONDENSED CONSOLIDATED FINANCIAL STATEMENTS (UNAUDITED)
RPOs may not be indicative of future operating results, and projects included in RPOs may be cancelled, modified or otherwise altered by customers.Recently Adopted Accounting Guidance
Variable Consideration―The nature of our contracts gives rise to several types of variable consideration, including unpriced change orders, claims, bonuses, incentive fees and liquidated damages or penalties. We estimate variable consideration based onLeases—In February 2016, the most likely amount to which we expect to be entitled. We include variable consideration in the estimated transaction price to the extent it is probable that a significant reversal of cumulative revenue recognized will not occur or when we conclude that any significant uncertainty associated with the variable consideration is resolved. Our estimates of variable consideration and determination of whether to include estimated amounts in the transaction price are based largely on an assessment of our anticipated performance and all information (historical, current and forecasted) that is reasonably available to us. The effect of changes in our estimates of variable consideration on the transaction price is recognized as an adjustment to revenues (either as an increase in or a reduction of revenues) on a cumulative catch-up basis.
Change Orders―Change orders, which are a normal and recurring part of our business, can increase the future scope and cost of a project. Most of our change orders are not distinct from the existing contract and are accounted for as part of that existing contract. The effect of a change order on the transaction price and our measure of progress for the performance obligation to which it relates, is recognized as an adjustment to revenues (either as an increase in or a reduction of revenues) on a cumulative catch-up basis.
Change orders that may not be approved by the customer until the later stages of a contract or subsequent to the date a project is completed could significantly affect gross profit on a contract. Revenues from unapproved change orders are generally recognized to the extent of the amounts we expect to recover, consistent with our Variable Consideration policy discussed above. If it is probable that a reversal of revenues will occur, the costs attributable to change orders are treated as contract costs without incremental revenues. To the extent change orders included in the price are not resolved in our favor, there could be reductions in, or reversals of previously reported amounts of, revenues and profits, and charges against current earnings, which could be material.
Claims Revenue—Claims revenue may relate to various factors, including the procurement of materials, equipment performance failures, change order disputes or schedule disruptions and other delays, including factors outside of our control, therefore we believe we are entitled to additional compensation. Claims revenue, when recorded, is only recorded to the extent of the amounts we expect to recover. We include certain unapproved claims in the transaction price when the claims are legally enforceable, we consider collection to be probable and believe we can reliably estimate the ultimate value. Amounts attributable to unpriced change orders are not included in claims. We continue to engage in negotiations with our customers on our outstanding claims. However, these claims may be resolved at amounts that differ from our current estimates, which could result in increases or decreases in future estimated contract profits or losses. Claims are generally negotiated over the course of the respective projects, many of which are long-term in nature.
Warranties―Our contracts include assurance-type warranties that our performance is free from material defect and consistent with the specifications of our contracts, which do not give rise to a separate performance obligation.
Adoption of the new revenue standard resulted in changes to the timing of revenue recognition and in the reclassification between financial statement line items. See Note 3, Revenue Recognition, for further discussion.
Pension and Postretirement Benefits—In March 2017, the FASBFinancial Accounting Standards Board (the “FASB”) issued Accounting Standards Update (“ASU”) 2017-07, Compensation—Retirement Benefits2016-02,Leases (Topic 715): Improving the Presentation of Net Periodic Pension Cost and Net Periodic Postretirement Benefit842). This ASU requires bifurcationentities that lease assets—referred to as “lessees”—to recognize on the balance sheet the assets and liabilities for the rights and obligations created by leases with lease terms of certain components of net pension and postretirement benefit cost in the Consolidated Statements of Operations. more than 12 months. We adopted this ASU effective January 1, 2019 using the modified retrospective application, applying the new standard to leases in place as of the adoption date. Prior periods have not been adjusted.
We elected to apply certain practical expedients allowed upon the adoption of this ASU, which, among other things, allowed us to: not reassess whether any expired or existing contracts contain leases; carry forward the historical lease classification; and not have to reassess any initial direct cost of any expired or existing leases. Adoption of the new standard resulted in the recording of Operating lease right-of-use assets, Current portion of long-term lease obligations and Long-term lease obligations of approximately $424 million, $101 million and $342 million, respectively, as of January 1, 2018. As2019. The adoption of this ASU did not have a result, benefit costs, excluding service costs component, previouslymaterial impact on our Statement of Operations, Condensed Consolidated Statement of Cash Flows (“Statement of Cash Flows”) or the determination of compliance with financial covenants under our current debt agreements. See Note 12, Lease Obligations, for further discussion.
Income Taxes—In January 2018, the FASB issued ASU 2018-02, Reporting Comprehensive Income (Topic 220). This ASU gives entities the option to reclassify to retained earnings the tax effects resulting from the U.S. Tax Cuts and Jobs Act related to items in accumulated other comprehensive income (loss) (“AOCI”) that the FASB refers to as having been stranded in AOCI. We adopted this ASU effective January 1, 2019. The adoption of this ASU did not have a material impact on the Financial Statements and related disclosures.
Derivatives—In August 2017, the FASB issued ASU No. 2017-12, Derivatives and Hedging (Topic 815). This ASU includes financial reporting improvements related to hedging relationships to better report the economic results of an entity’s risk management activities in its financial statements. Additionally, this ASU makes certain improvements to simplify the application of the hedge accounting guidance. We adopted this ASU effective January 1, 2019. The adoption of this ASU did not have a material impact on the Financial Statements. See Note 16, Derivative Financial Instruments, for related disclosures.
In October 2018, the FASB issued ASU No. 2018-16, Derivatives and Hedging: Inclusion of the Secured Overnight Financing Rate (SOFR) Overnight Index Swap (OIS) Rate as a Benchmark Interest Rate for Hedge Accounting Purposes, which expands the list of benchmark interest rates permitted in the application of hedge accounting. This ASU permits the use of an OIS rate based on the SOFR as a U.S. benchmark interest rate for hedge accounting purposes. We adopted this ASU effective January 1, 2019. The adoption of this ASU did not have a material impact on the Financial Statements and related disclosures. See Note 16, Derivative Financial Instruments.
Significant Accounting Policies
Our significant accounting policies are detailed in “Note 2—Basis of Presentation and Significant Accounting Policies” in the 2018 Form 10-K. The following is an update to those significant accounting policies due to recently adopted accounting guidance.
Leases—We classify an arrangement as a lease at inception if we have the right to control the use of an identified asset we do not legally own for a period of time in exchange for consideration. In general, leases with an initial term of 12 months or less are not recorded on our Balance Sheet unless it is reasonably certain we will renew the lease. All leases with an initial term of more than 12 months, whether classified as operating or finance, are recorded to our Balance Sheet based on the present value of lease payments over the lease term, determined at lease commencement. Determination of the present value of lease payments requires a discount rate. We use the implicit rate in the lease agreement when available. Most of our leases do not provide an implicit interest rate; therefore, we use an incremental borrowing rate based on information available at the commencement date.
Our lease terms may include options to extend or terminate the lease when it is reasonably certain we will exercise that option. Lease expense for operating leases and the amortization of the right-of-use asset for finance leases are recognized on a straight-line basis over the lease term.
We have lease agreements with lease and non-lease components, which are generally accounted for separately for all leases other than leases at our construction project sites. Non-lease components included in Selling, generalassets and administrate expenses,obligations under operating leases are now included in Other non-operating income (expense), net innot material to our Consolidated Statements of Operations. All comparable periods presented have been retrospectively revised to reflect this change.financial statements.
| 9 |
|
NOTES TO THE CONDENSED CONSOLIDATED FINANCIAL STATEMENTS (UNAUDITED)
For our joint ventures, consortiums and other collaborative arrangements (referred to as “joint ventures” and “consortiums”), the right-of-use asset and lease obligations are generally recognized by the party that enters into the lease agreement, which could be the joint venture directly, one of our joint venture partners or us. We have recognized our proportionate share of leases entered into by our joint ventures, where the joint venture has the right to control the use of an identified asset.
Derivative Financial Instruments—We utilize derivative financial instruments in certain circumstances to mitigate the effects of changes in foreign currency exchange rates and interest rates, as described below.
• | Foreign Currency Rate Derivatives—We do not engage in currency speculation. However, we utilize foreign currency exchange rate derivatives on an ongoing basis to hedge against certain foreign currency related operating exposures. We generally apply hedge accounting treatment for contracts used to hedge operating exposures and designate them as cash flow hedges. Therefore, gains and losses are included in AOCI until the associated underlying operating exposure impacts our earnings, at which time the impact of the hedge is recorded within the income statement line item associated with the underlying exposure. Changes in the fair value of instruments that we do not designate as cash flow hedges are recognized in the income statement line item associated with the underlying exposure. |
• | Interest Rate Derivatives—Our interest rate derivatives are limited to a swap arrangement entered into on May 8, 2018, to hedge against interest rate variability associated with $1.94 billion of the $2.26 billion Term Facility described in Note 11, Debt. The swap arrangement has been designated as a cash flow hedge, as its critical terms matched those of the Term Facility at inception and through March 31, 2019. Accordingly, changes in the fair value of the swap arrangement are included in AOCI until the associated underlying exposure impacts our interest expense. |
See Note 15, Fair Value Measurements, and Note 16, Derivative Financial Instruments, for further discussion.
Accounting Guidance Issued Butbut Not Adopted as of March 31, 20182019
Financial Instruments—In June 2016, the FASB issued ASU 2016-13, Financial Instruments—Credit Losses (Topic 326): Measurement of Credit Losses on Financial Instruments. This ASU will require a financial asset measured at amortized cost basis to be presented at the net amount expected to be collected. A valuation account, allowance for credit losses, will be deducted from the amortized cost basis of the financial asset to present the net carrying value at the amount expected to be collected on the financial asset. This ASU is effective for interim and annual periods beginning after December 15, 2019. We are currently assessing the impact of this ASU on our future consolidated financial statements and related disclosures.
Defined Benefit Pension Plans—In August 2018, the FASB issued ASU No. 2018-14, Compensation—Retirement Benefits—Defined Benefit Plans—General (Subtopic 715-20). This ASU eliminates, modifies and adds disclosure requirements for employers that sponsor defined benefit pension or other postretirement plans. This ASU is effective for fiscal years ending after December 15, 2020, with early adoption permitted. We are evaluating the impact of the new guidance on our future Consolidated Financial Statements and related disclosures.
LeasesConsolidation—In February 2016,October 2018, the FASB issued ASU 2016-02, Leases (Topic 842)No. 2018-17, Consolidation: Targeted Improvements to Related Party Guidance for Variable Interest Entities (“VIE”). This ASU amends the guidance for determining whether a decision-making fee is a variable interest, which requires companies to consider indirect interests held through related parties under common control on a proportional basis rather than as the equivalent of a direct interest in its entirety. The ASU will require entitiesis effective for annual and interim periods beginning after December 15, 2019. We are currently assessing the impact of this ASU on our future consolidated financial statements and related disclosures.
Collaborative Arrangements—In November 2018, the FASB issued ASU No. 2018-18, Collaborative Arrangements: Clarifying the Interaction between Topic 808 and Topic 606. This ASU clarifies that lease assets—referred tocertain transactions between collaborative arrangement participants should be accounted for as “lessees”—to recognize onrevenue under Topic 606 when the balance sheetcollaborative arrangement participant is a customer in the assets and liabilities forcontext of a unit of account. In addition, unit-of-account guidance in Topic 808 was aligned with the rights and obligations created by leases with lease termsguidance in Topic 606 (that is, a distinct good or service) when assessing whether the collaborative arrangement or a part of more than 12 months. Consistent with current U.S. GAAP, the recognition, measurement and presentationarrangement is within the scope of expenses and cash flows arising from a lease by a lessee primarily will depend on its classification as a finance or operating lease. However, unlike current U.S. GAAP—which requires only capital leases to be recognized on the balance sheet—the new ASU will require both types of leases to be recognized on the balance sheet.Topic 606. This ASU is effective for interim and annual periods beginning after December 15, 2018.2019. Early adoption is permitted. We are currently assessing the impact of this ASU on our future Consolidated Financial Statementsconsolidated financial statements and related disclosures.
| 10 |
NOTES TO THE CONDENSED CONSOLIDATED FINANCIAL STATEMENTS (UNAUDITED)
NOTE 2—3—BUSINESS COMBINATION AGREEMENT WITH CHICAGO BRIDGE & IRON COMPANY N.V. (“CB&I”)
General―On December 18, 2017, McDermott International, Inc. (“McDermott”), Chicago Bridge & Iron Company N.V. (“CB&I”) and certain of their respective subsidiarieswe entered into a Business Combination Agreement (as amended, the “Business Combination Agreement”) pursuant to which CB&I and McDermott have agreedan agreement to combine their businesses through a seriesour business with CB&I, an established downstream provider of transactionsindustry-leading petrochemical, refining, power, gasification and gas processing technologies and solutions. On May 10, 2018 (the “Combination”“Combination Date”). The Business Combination Agreement has been approved by we completed the McDermott Board, the Management Board of CB&I and the Supervisory Board of CB&I.Combination.
Upon completion ofTransaction Overview—On the Combination McDermott stockholders will own approximately 53 percentDate, we acquired the equity of certain U.S. and non-U.S. CB&I subsidiaries that owned CB&I’s technology business, as well as certain intellectual property rights, for $2.87 billion in cash consideration that was funded using debt financing, as discussed further in Note 11, Debt, and existing cash. Also, on the combined business on a fully diluted basis andCombination Date, CB&I shareholders will own approximately 47 percent. Under the terms of the Business Combination Agreement, we will exchange all issued and outstanding shares of CB&I common stock forreceived 0.82407 shares of McDermott common stock at the exchange ratio described below. As a result CB&I shareholders will be entitled to receive 2.47221 shares of McDermott Common Stock for each share of CB&I Common Stock owned (orcommon stock tendered in the exchange offer. Each remaining share of CB&I common stock held by CB&I shareholders not acquired by McDermott in the exchange offer was effectively converted into the right to receive the same 0.82407 shares ifof McDermott effects a proposed three-to-one reversecommon stock split prior tothat was paid in the closing of the Combination),exchange offer, together with cash in lieu of any fractional shares.shares of McDermott common stock, less any applicable withholding taxes. Stock-settled equity-based awards relating to shares of CB&I’s common stock were either canceled and converted into the right to receive cash or were converted into comparable McDermott awards on generally the same terms and conditions as prior to the Combination Date. We issued 84.5 million shares of McDermott common stock to the former CB&I shareholders and converted CB&I stock-settled equity awards into McDermott stock-settled equity-based awards to be settled in approximately 2.2 million shares of McDermott common stock.
Transaction Accounting—The Combination would beis accounted for using the acquisition method of accounting in accordance with Accounting Standards Codifications (“ASC”)ASC Topic 805, Business Combinations. McDermott would beis considered the acquirer for accounting acquirerpurposes based on the following facts: (1) upon completion offacts at the Combination Date: (1) McDermott’s stockholders will ownowned approximately 53 percent of the combined business on a fully diluted basis; (2) a group of McDermott’s current directors, including the Chairman of the Board, will constituteconstituted a majority of the Board of Directors; and (3) McDermott’s current President and Chief Executive Officer and current Executive Vice President and Chief Financial Officer will continue in those roles followingroles. The series of transactions resulting in McDermott’s acquisition of CB&I’s entire business is being accounted for as a single accounting transaction, as such transactions were entered into at the closingsame time in contemplation of one another and were collectively designed to achieve an overall commercial effect.
Purchase Consideration―We completed the Combination for a gross purchase price of approximately $4.6 billion ($4.1 billion net of cash acquired), detailed as follows (in millions, except per share amounts):
|
|
| (In millions, except per share amounts) |
CB&I shares for Combination consideration |
|
| 103 |
Conversion Ratio: 1 CB&I share = 0.82407 McDermott shares |
|
| 85 |
McDermott stock price on May 10, 2018 |
|
| 19.92 |
Equity Combination consideration transferred |
| $ | 1,684 |
Fair value of converted awards earned prior to the Combination |
|
| 9 |
Total equity Combination consideration transferred |
|
| 1,693 |
Cash consideration transferred |
|
| 2,872 |
Total Combination consideration transferred |
|
| 4,565 |
Less: Cash acquired |
|
| (498) |
Total Combination consideration transferred, net of cash acquired |
| $ | 4,067 |
Preliminary Purchase Price Allocation—The aggregate purchase price noted above was allocated to the major categories of assets and liabilities acquired based upon their estimated fair values at the Combination Date, which were based, in part, upon external preliminary appraisal and valuation of certain assets, including specifically identified intangible assets and property and equipment. The excess of the Combination. CB&I’s President and Chief Executive Officer will remain withpurchase price over the combined business for a transition period.
In connection with the Business Combination Agreement, we entered into or received commitment letters (including the exhibits and other attachments thereto, and together with any amendments, modifications or supplements thereto, the “Commitment Letters”) from certain financial institutions to provide debt financing for the Combination. Pursuant to the Commitment Letters, as amended and restated through the date of this report, we expect the following financing arrangements to be reflected in a new credit agreement to be entered into by certain of our subsidiaries (the “Borrowers”) on or before the closingpreliminary estimated fair value of the Combination (the “New Credit Agreement”):
a senior secured revolving credit facility providing for revolving credit borrowingsnet tangible and letters of credit in an aggregate principal or face amount of $1.0identifiable intangible assets acquired, totaling $4.9 billion, outstanding at any one time (the “Revolving Facility”);
a senior secured letter of credit facility providing for letters of credit in the aggregate face amount of $1.39 billion outstanding at any one time (the “LC Facility”); and
|
|
NOTES TO THE CONSOLIDATED FINANCIAL STATEMENTS (UNAUDITED)was recorded as goodwill.
In addition, on April 18, 2018, McDermott Escrow 1, Inc. and McDermott Escrow 2, Inc. (together, the “Escrow Issuers”) completed the previously announced offering of $1.3 billion in aggregate principal amount of 10.625% senior unsecured notes due 2024 (the “2024 Notes”). The Escrow Issuers represent variable interest entities which will be consolidated by McDermott International, Inc. beginning in the second quarter of 2018. The 2024 Notes were offered to qualified institutional buyers in reliance on Rule 144A under the Securities Act of 1933, as amended (the “Securities Act”), and to certain non-U.S. persons in transactions outside the United States in reliance on Regulation S under the Securities Act. The 2024 Notes were issued pursuant to an Indenture, dated April 18, 2018 (the “Indenture”), by and among the Escrow Issuers and Wells Fargo Bank, National Association, as trustee. The 2024 Notes are scheduled to mature on May 1, 2024.
Pursuant to an escrow agreement (the “Escrow Agreement”), by and among the Escrow Issuers and Wells Fargo Bank, National Association, as escrow agent (the “Escrow Agent”), the proceeds of the offering of the 2024 Notes, together with approximately $28 million, to provide funds sufficient to pay interest on the 2024 Notes through June 29, 2018, were deposited into a segregated escrow account with the Escrow Agent. The funds will remain in escrow until the date on which certain escrow conditions are satisfied and the escrow proceeds are released (the “Escrow Conditions”). Concurrent with the satisfaction of the Escrow Conditions, the Escrow Issuers will merge with and into McDermott Technology (Americas), Inc. (“McDermott Technology (Americas)”) and McDermott Technology (US), Inc. (together with McDermott Technology (Americas), the “Post-Merger Co-Issuers”), with each Post-Merger Co-Issuer being a surviving entity that will assume, by operation of law, the obligations of the applicable Escrow Issuer under the 2024 Notes. Each of the Post-Merger Co-Issuers is a wholly owned subsidiary of McDermott International, Inc.
The 2024 Notes will be subject to a special mandatory redemption at a redemption price equal to 100% of the initial issue price of the 2024 Notes plus accrued interest to, but not including, the redemption date if the Escrow Conditions are not satisfied or the Escrow Issuers determine in their discretion that the Escrow Conditions are incapable of being satisfied on or prior to June 29, 2018.
The proceeds of the offering of the 2024 Notes and loans under the New Credit Agreement are intended to be used: (a) on the closing date for the Combination (the “Effective Date”) to (1) consummate the Combination, including the repayment of certain existing indebtedness of CBI and its subsidiaries, (2) redeem Outstanding Senior Secured Notes, (3) prepay existing indebtedness under, and to terminate in full, the Current Credit Agreement (as defined in Note 8, Debt), and (4) pay fees and expenses in connection with the Combination, the New Credit Agreement and the issuance of the 2024 Notes; and (b) for working capital and other general corporate purposes. On the Effective Date, certain existing letters of credit outstanding under the Current Credit Agreement and certain existing letters of credit outstanding under CBI’s existing credit facilities will be deemed issued under the New Credit Agreement, and letters of credit will be issued under the New Credit Agreement to backstop certain other existing letters of credit issued for the account of McDermott International, Inc., CBI and their respective subsidiaries and affiliates.
The Revolving Facility and the LC Facility are expected to mature on the fifth annual anniversary of the Effective Date. The Term Facility is expected to mature on the seventh annual anniversary of the Effective Date, unless on the date that is six months prior to the scheduled maturity date of the 2024 Notes, more than $350 million of the 2024 Notes are outstanding and our secured leverage ratio (as defined in the New Credit Agreement) is greater than or equal to 1.00 to 1.00, in which case the Term Facility will mature on such date.
From and after the Effective Date the indebtedness and other obligations under the New Credit Agreement, the 2024 Notes and the Indenture will be unconditionally guaranteed on a senior secured basis by McDermott International, Inc. and substantially all of its wholly owned subsidiaries, including wholly owned subsidiaries resulting from the consummation of the Combination (collectively, the “Guarantors”), other than its captive insurance subsidiary and certain other designated or immaterial subsidiaries. From and after the Effective Date, the obligations under the New Credit Agreement will be secured by first-priority liens on substantially all of the Borrowers’ and the Guarantors’ assets.
The New Credit Agreement is expected to include provisions for mandatory commitment reductions and prepayments in connection with, among other events and circumstances, certain asset sales and casualty events. In addition, we will be required to make an annual prepayment of term loans under the Term Facility and thereafter cash collateralize letters of credit issued under the Revolving Facility and the LC Facility with 75% of excess cash flow (as defined in the New Credit Agreement), reducing to 50% of excess cash flow and 25% of excess cash flow depending on our secured leverage ratio. The New Credit Agreement is expected to require the Borrowers to prepay the term loans made under the Term Facility on the last day of each fiscal quarter in an amount equal to approximately $6 million. The New Credit Agreement is expected to otherwise only require periodic interest payments until maturity.
| 11 |
|
NOTES TO THE CONDENSED CONSOLIDATED FINANCIAL STATEMENTS (UNAUDITED)
Revolving loans under the Revolving Facility are expected to bear interestThe following summarizes our preliminary purchase price allocation at the Borrowers’ option at either the Eurodollar rate (as defined in the New Credit Agreement) plus a margin ranging from 3.75% to 4.25% per year or the base rate (the highest of the Federal Funds rate plus 0.50%, the 30-day Eurodollar rate plus 1.0%, or the administrative agent’s prime rate) plus a margin ranging from 2.75% to 3.25% per year. The applicable margin will vary depending on our leverage ratio (as defined in the New Credit Agreement). Term loans under the Term Facility are expected to bear interest at the Borrowers’ option at either the Eurodollar rate plus a margin of 5.00% per year or the base rate plus a margin of 4.00%, subject to a 1.0% floor with respect to the Eurodollar rate. The Borrowers are expected to be charged a commitment fee of 0.50% per year on the daily amount of the unused portions of the commitments under the Revolving Facility and the LC Facility. Additionally, with respect to all letters of credit outstanding under the New Credit Agreement, the Borrowers are expected to be charged a fronting fee of 0.25% per year and, with respect to all letters of credit outstanding under the New Credit Agreement, a participation fee of (1) between 3.75% to 4.25% per year in respect of financial letters of credit and (2) between 1.875% to 2.125% per year in respect of performance letters of credit, in each case depending on our leverage ratio. The Borrowers are also expected to be required to pay customary issuance fees and other fees and expenses in connection with the issuance of letters of credit under the New Credit Agreement. On the EffectiveCombination Date we will be required to pay upfront fees, ticking fees, commitment fees, arrangement fees and other fees to certain lenders, arrangers and agents of the New Credit Agreement.(in millions):
The New Credit Agreement is expected to include the following financial covenants that will be tested on a quarterly basis, commencing September 30, 2018:
a minimum permitted fixed charge coverage ratio (as defined in the New Credit Agreement) of 1.50 to 1.00;
a maximum permitted leverage ratio of (1) 4.25 to 1.00 for each fiscal quarter ending on or before September 30, 2019, (2) 4.00 to 1.00 for the fiscal quarter ending December 31, 2019, (3) 3.75 to 1.00 for each fiscal quarter ending after December 31, 2019 and on or before December 31, 2020, (4) 3.50 to 1.00 for each fiscal quarter ending after December 31, 2020 and on or before December 31, 2021 and (5) 3.25 to 1.00 for each fiscal quarter ending after December 31, 2021; and
a minimum liquidity (as defined in the New Credit Agreement, but generally meaning the sum of our cash and cash equivalents plus unused commitments under the New Credit Agreement available for revolving borrowings) requirement of $200 million.
In addition, the New Credit Agreement and the Indenture contain various covenants that, among other restrictions, will limit the ability of McDermott International, Inc. and each of its restricted subsidiaries to:
incur or assume indebtedness;
grant or assume liens;
make acquisitions or engage in mergers;
sell, transfer, assign or convey assets;
make investments;
repurchase equity and make dividends and certain other restricted payments;
change the nature of its business;
engage in transactions with affiliates;
enter into burdensome agreements;
modify its organizational documents;
enter into sale and leaseback transactions;
make capital expenditures;
enter into speculative hedging contracts; and
make prepayments on certain junior debt.
|
| May 10, 2018 |
| |
Net tangible assets: |
|
|
|
|
Cash |
| $ | 498 |
|
Accounts receivable |
|
| 844 |
|
Inventory |
|
| 111 |
|
Contracts in progress |
|
| 273 |
|
Assets held for sale (1) |
|
| 70 |
|
Other current assets |
|
| 272 |
|
Investments in unconsolidated affiliates (2) |
|
| 426 |
|
Property, plant and equipment |
|
| 385 |
|
Other non-current assets |
|
| 127 |
|
Accounts payable |
|
| (469 | ) |
Advance billings on contracts (3) |
|
| (2,410 | ) |
Deferred tax liabilities |
|
| (16 | ) |
Other current liabilities |
|
| (1,211 | ) |
Other non-current liabilities |
|
| (453 | ) |
Noncontrolling interest |
|
| 14 |
|
Total net tangible liabilities |
|
| (1,539 | ) |
Project-related intangible assets/liabilities, net (4) |
|
| 150 |
|
Other intangible assets (5) |
|
| 1,071 |
|
Net identifiable liabilities |
|
| (318 | ) |
Goodwill (6) |
|
| 4,883 |
|
Total Combination consideration transferred |
|
| 4,565 |
|
Less: Cash acquired |
|
| (498 | ) |
Total Combination consideration transferred, net of cash acquired |
| $ | 4,067 |
|
| Assets held for sale includes CB&I’s former administrative headquarters within Corporate and various fabrication facilities within NCSA. During the third quarter of 2018, we completed the sale of CB&I’s former administrative headquarters for proceeds of $52 million. |
(2) | Investments in unconsolidated affiliates includes a fair value adjustment of $215 million associated with the Combination. Approximately $146 million of the fair value adjustment is attributable to the basis difference between McDermott’s investment and the underlying equity in identifiable assets of unconsolidated affiliates and will be amortized to Investment in unconsolidated affiliates-related amortization over a range of two to 30 years based on the life of assets to which the basis difference is attributed. |
(3) | Advance billings on contracts includes accrued provisions for estimated losses on projects of $374 million, primarily associated with the Cameron LNG and Freeport LNG Trains 1 and 2, the now-substantially completed gas power project for a unit of Calpine Corporation (“Calpine”) and the now-completed gas power project for Indianapolis Power & Light Company. |
| 12 |
|
NOTES TO THE CONDENSED CONSOLIDATED FINANCIAL STATEMENTS (UNAUDITED)
The Indenture contains, and the New Credit Agreement is expected to contain, provisions relating to events of default that we believe are customary for similar financing arrangements.
During the first quarter of 2018, $11 million of costs associated with the Combination were expensed as incurred and were reported in Other operating (income) (expense) in our Consolidated Statements of Operations. Those costs included advisors’ professional fees and integration costs related to the Combination.
Effect of ASC Topic 606 Adoption―The cumulative effect of adopting ASC 606 due to change in method to measure project progress, as discussed in Note 1, Basis Of Presentation and Significant Accounting Policies, is as follows:
|
| Impact of ASC 606 adoption |
| |||||||||
|
| Legacy GAAP |
|
| Adjustment |
|
| As reported |
| |||
|
| (In thousands) |
| |||||||||
Consolidated Statements of Operations for the quarter ended March 31, 2018 |
|
|
|
|
|
|
|
|
|
|
|
|
Revenues |
| $ | 590,307 |
|
| $ | 17,511 |
|
| $ | 607,818 |
|
Cost of operations |
|
| 459,991 |
|
|
| 15,720 |
|
|
| 475,711 |
|
|
|
|
|
|
|
|
|
|
|
|
|
|
Operating Income |
|
| 66,648 |
|
|
| 1,791 |
|
|
| 68,439 |
|
|
|
|
|
|
|
|
|
|
|
|
|
|
Provision for income taxes |
|
| 19,979 |
|
|
| 736 |
|
|
| 20,715 |
|
|
|
|
|
|
|
|
|
|
|
|
|
|
Net income |
|
| 34,134 |
|
|
| 1,055 |
|
|
| 35,189 |
|
|
|
|
|
|
|
|
|
|
|
|
|
|
Consolidated Balance Sheets as of March 31, 2018 |
|
|
|
|
|
|
|
|
|
|
|
|
Assets |
|
|
|
|
|
|
|
|
|
|
|
|
Current assets: |
|
|
|
|
|
|
|
|
|
|
|
|
Contracts in progress |
|
| 493,750 |
|
|
| 12,670 |
|
|
| 506,420 |
|
|
|
|
|
|
|
|
|
|
|
|
|
|
Liabilities and equity |
|
|
| |||||||||
Current liabilities: |
|
|
|
|
|
|
|
|
|
|
|
|
Advance billings on contracts |
|
| 49,310 |
|
|
| (9,103 | ) |
|
| 40,207 |
|
Income taxes payable |
|
| 39,934 |
|
|
| 736 |
|
|
| 40,670 |
|
|
|
|
|
|
|
|
|
|
|
|
|
|
Stockholders' equity: |
|
|
|
|
|
|
|
|
|
|
|
|
Retained earnings (Accumulated deficit) |
|
| (14,125 | ) |
|
| 21,037 |
|
|
| 6,912 |
|
(1) Includes $20 million of cumulative catch-up adjustment to opening Retained earnings (Accumulated deficit) on January 1, 2018, upon adoption of ASC 606.
Remaining performance obligations (“RPOs”)―Our RPOs are generally satisfied over time as work progresses under our contracts with customers. As of March 31, 2018, we had $3.4 billion of RPOs. The following table summarizes changes to our RPOs (in thousands):
RPOs at December 31, 2017 | $ | 3,901,443 |
|
ASC 606 cumulative effect adjustment at January 1, 2018 |
| (228,126 | ) |
RPOs at January 1, 2018 |
| 3,673,317 |
|
Bookings from new contracts |
| 193,170 |
|
Additions on existing contracts, net |
| 128,004 |
|
Less: Amounts recognized in revenues |
| 607,818 |
|
RPOs at March 31, 2018 (1) | $ | 3,386,673 |
|
|
|
| Otherintangible assets are reflected in the table below and recorded at estimated fair value, as determined by our management, based on available information, which includes preliminary valuations prepared by external experts. The estimated useful lives for intangible assets were determined based upon the remaining useful economic lives of the intangible assets that are expected to contribute directly or indirectly to future cash flows. |
|
| May 10, 2018 |
|
|
|
|
| Weighted |
|
| |
|
| Fair value |
|
| Useful Life Range |
| Average Useful Life |
|
| ||
|
| (In millions) |
|
|
|
|
|
|
|
| |
Process technologies |
| $ | 514 |
|
| 10-30 |
|
| 27 |
|
|
Trade names |
|
| 401 |
|
| 10-20 |
|
| 12 |
|
|
Customer relationships |
|
| 129 |
|
| 4-11 |
|
| 10 |
|
|
Trademarks |
|
| 27 |
|
| 10 |
|
| 10 |
|
|
Total |
| $ | 1,071 |
|
|
|
|
|
|
|
|
(6) | Goodwill resulted from the acquired established workforce, which does not qualify for separate recognition, as well as expected future cost savings and revenue synergies associated with the combined operations. Of the $4.9 billion of estimated goodwill recorded in conjunction with the Combination, $2.6 billion, $461 million, $50 million, $52 million and $1.7 billion, was allocated to our NCSA, EARC, MENA, APAC and Technology reporting segments, respectively. Approximately $1.7 billion of the opening goodwill balance is deductible for tax purposes. |
Changes in our preliminary purchase price allocation of approximately $61 million since our previous estimates as of December 31, 2018 primarily related to fair value adjustments to accounts receivable on acquired contracts, leasehold improvements, property and equipment and estimated liabilities associated with litigation.
The preliminary purchase price allocation described above is subject to further change when additional information is obtained. We have not finalized our assessment of the fair values of purchased receivables, intangible assets and liabilities, inventory, property and equipment, joint venture and consortium arrangements, tax balances, contingent liabilities, long-term leases or acquired contracts. Our final purchase price allocation, to be completed in the second quarter of 2019, may result in additional adjustments to various other assets and liabilities, including the residual amount allocated to goodwill during the measurement period.
Impact onRPOs—CB&I RPOs totaled approximately $8.3 billion at the Combination Date, after considering conforming accounting policies and project adjustments for acquired in-process projects.
| 13 |
|
NOTES TO THE CONDENSED CONSOLIDATED FINANCIAL STATEMENTS (UNAUDITED)
Our RPOs by segment wereSupplemental Pro Forma Information (Unaudited)—The following unaudited pro forma financial information reflects the Combination and the related events as follows:
| March 31, 2018 |
| |||||
| (in approximate millions) |
| |||||
AEA | $ | 969 |
|
|
| 28 | % |
MEA |
| 2,021 |
|
|
| 60 | % |
ASA |
| 397 |
|
|
| 12 | % |
Total | $ | 3,387 |
|
|
| 100 | % |
Of the March 31, 2018 RPOs, we expect to recognize revenues as follows:
| 2018 |
|
| 2019 |
|
| Thereafter |
| |||
| (in approximate millions) |
| |||||||||
Total RPOs | $ | 1,826 |
|
| $ | 1,252 |
|
| $ | 309 |
|
Contract types―We execute our contracts using a variety of pricing models, including fixed-price, unit-basis, cost-plus, or some combination of those methods, with fixed-price being the most prevalent. Additional detail regarding our revenues by contract types is disclosed in Note 16, Segment Reporting.
Change orders—As of March 31,if they occurred on January 1, 2018 and 2017, variable considerationgives effect to pro forma events that are directly attributable to the Combination, factually supportable, and expected to have a continuing impact on our combined results, following the Combination. The pro forma financial information includes adjustments to: (1) include additional intangibles amortization, investment in unconsolidated affiliates-related amortization, depreciation of property, plant and equipment and net interest expense associated with unapproved change ordersthe Combination and (2) exclude restructuring, integration and transaction costs that have been included in transaction prices aggregated to approximately $110 million and $118 million, of which approximately $8 million and $12 million were included in RPOs, respectively.
Claims Revenue―As of March 31, 2018, there were no material claims revenues included in operating results. The amount of revenues included in our transaction prices associated with claims as of March 31, 2018McDermott and 2017 was$10 million, all in our Middle East segment. Claim amountsCB&I’s historical results and are determined based on various factors, including our analysisexpected to be non-recurring. This pro forma financial information is presented for illustrative purposes only and is not necessarily indicative of the underlying contractual language and our experience in making and resolving claims. Our unconsolidated joint ventures didoperating results that would have been achieved had the pro forma events taken place on the date indicated. Further, the pro forma financial information does not include any material claims revenues or associated costs in their financialpurport to project the future operating results for the three months ended March 31, 2018 and 2017.
None of the claims as of March 31, 2018, whether material or immaterial, werecombined business operations following the subject of any litigation proceedings. We continue to actively engage in negotiations with our customers on our outstanding claims. These claims may be resolved at amounts that differ from our current estimates, which could result in increases or decreases in future estimated contract profits or losses. However, we currently do not expect any significant reversals of revenues.Combination.
Loss Recognition―A risk associated with fixed-priced contracts is that revenue from customers may not cover increases in our costs. It is possible that current estimates could materially change for various reasons, including, but not limited to, fluctuations in forecasted labor and vessel productivity, vessel repair requirements, weather downtime, subcontractor or supplier performance, pipeline lay rates or steel and other raw material prices and penalties associated with missed completion deadlines. For all contracts, if a current estimate of total contract cost indicates a loss, the projected loss is recognized in full immediately and reflected in cost of operations in the Consolidated Statements of Operations. It is possible that these estimates could change due to unforeseen events such as changes in productivity, actual downtime and the resolution of change orders and claims with the customers, which could result in adjustments to overall contract costs. Variations from estimated contract performance could result in material adjustments to operating results for any fiscal quarter or year.
|
| Three Months Ended |
| |
|
| March 31, 2018 (1) |
| |
|
|
|
|
|
Pro forma revenue |
| $ | 2,353 |
|
Pro forma net income attributable to common stockholders |
|
| 39 |
|
Pro forma net income per share attributable to common stockholders |
|
|
|
|
Basic |
|
| 0.22 |
|
Diluted |
|
| 0.21 |
|
Shares used in the computation of net income per share (2) |
|
|
|
|
Basic |
| 181 |
| |
Diluted |
| 188 |
| |
In our Consolidated Balance Sheets, the provision for estimated losses on all active uncompleted projects is included in “Advance billings on contracts.”
There were no material active projects as of March 31, 2018 which we determined to be in a substantial loss position.
The provision for estimated losses on all active uncompleted projects in our Consolidated Balance Sheets as of March 31, 2018 and December 31, 2017 were not material.
| Adjustments, net of tax, included in the pro forma net income above that were of a non-recurring nature totaled $15 million. The adjustments reflect the elimination of (1) restructuring and integration costs ($13 million); and (2) transaction costs ($2 million). These pro forma results exclude the effect of adjustments to the opening balance sheet associated with fair value purchase accounting estimates. |
(2) | Pro forma net income per share was calculated using weighted average basic shares outstanding during the three months ended March 31, 2019. Due to the net loss for the three months ended March 31, 2019, the effects of restricted stock, warrants and redeemable preferred stock were not included in the calculation of diluted earnings per share. For the presentation of the pro forma net income for the three months ended March 31, 2018, diluted shares includes the impact of restricted stock and warrants but does not include the impact of the redeemable preferred stock, as those shares were antidilutive. |
| 14 |
|
NOTES TO THE CONDENSED CONSOLIDATED FINANCIAL STATEMENTS (UNAUDITED)
NOTE 4—USE OFREVENUE RECOGNITION
RPOs
Our RPOs by segment were as follows:
| March 31, 2019 |
|
| December 31, 2018 |
| ||||||||||
| (Dollars in millions) |
| |||||||||||||
NCSA | $ | 8,581 |
|
|
| 56 | % |
| $ | 5,649 |
|
|
| 52 | % |
EARC |
| 1,914 |
|
|
| 12 | % |
|
| 1,378 |
|
|
| 12 | % |
MENA |
| 2,879 |
|
|
| 19 | % |
|
| 1,834 |
|
|
| 17 | % |
APAC |
| 1,401 |
|
|
| 9 | % |
|
| 1,420 |
|
|
| 13 | % |
Technology |
| 601 |
|
|
| 4 | % |
|
| 632 |
|
|
| 6 | % |
Total | $ | 15,376 |
|
|
| 100 | % |
| $ | 10,913 |
|
|
| 100 | % |
Of the March 31, 2019 RPOs, we expect to recognize revenues as follows:
| 2019 |
|
| 2020 |
|
| Thereafter |
| |||
| (In millions) |
| |||||||||
Total RPOs | $ | 6,189 |
|
| $ | 5,119 |
|
| $ | 4,068 |
|
Revenue Disaggregation
Our revenue by product offering, contract types and revenue recognition methodology was as follows:
|
| Three Months Ended March 31, |
| |||||
|
| 2019 (2) |
|
| 2018 (2) |
| ||
|
| (In millions) |
| |||||
Revenue by product offering: |
|
|
|
|
|
|
|
|
Offshore and subsea |
| $ | 605 |
|
| $ | 608 |
|
LNG |
|
| 421 |
|
|
| - |
|
Downstream (1) |
|
| 862 |
|
|
| - |
|
Power |
|
| 323 |
|
|
| - |
|
|
| $ | 2,211 |
|
| $ | 608 |
|
|
|
|
|
|
|
|
|
|
Revenue by contract type: |
|
|
|
|
|
|
|
|
Fixed price |
| $ | 1,726 |
|
| $ | 583 |
|
Reimbursable |
|
| 303 |
|
|
| - |
|
Hybrid |
|
| 110 |
|
|
| - |
|
Unit-basis and other |
|
| 72 |
|
|
| 25 |
|
|
| $ | 2,211 |
|
| $ | 608 |
|
|
|
|
|
|
|
|
|
|
Revenue by recognition methodology: |
|
|
|
|
|
|
|
|
Over time |
| $ | 2,160 |
|
| $ | 608 |
|
At a point in time |
|
| 51 |
|
|
| - |
|
|
| $ | 2,211 |
|
| $ | 608 |
|
(1) | Includes the results of our Technology operating group. |
(2) | Intercompany amounts have been eliminated in consolidation. |
| 15 |
NOTES TO THE CONDENSED CONSOLIDATED FINANCIAL STATEMENTS (UNAUDITED)
Other
For the three months ended March 31, 2019, we recognized approximately $22 million of revenues resulting from changes in transaction prices associated with performance obligations satisfied in prior periods, primarily in our NCSA segment. For the three months ended March 31, 2018, we recognized approximately $66 million of revenues due to changes in transaction price associated with performance obligations satisfied in prior periods, primarily in our APAC segment. The changes in transaction prices primarily related to reimbursement of costs incurred in prior periods.
Revenues recognized during the three months ended March 31, 2019, with respect to amounts included in our Advance billings on contracts balance as of December 31, 2018, were approximately $768 million.
Unapproved Change Orders, Claims and Incentives
Unapproved Change Orders and Claims—As of March 31, 2019, we had unapproved change orders and claims included in transaction prices for our projects aggregating to approximately $297 million, of which approximately $93 million was included in our RPO balance. As of December 31, 2018, we had unapproved change orders and claims included in transaction prices for our projects aggregating to approximately $428 million, of which approximately $130 million was included in our RPO balance.
Incentives—As of March 31, 2019, we had incentives included in transaction prices for our projects aggregating to approximately $16 million, of which approximately $1 million was included in our RPO balance. As of December 31, 2018, we did not have any material incentives included in transaction prices for our projects.
The amounts recorded in contract prices and recognized as revenues reflect our best estimates of recovery; however, the ultimate resolution and amounts received could differ from these estimates and could have a material adverse effect on our results of operations, financial position and cash flow.
Loss Projects
Our accrual of provisions forestimated losses on active uncompleted contracts as of March 31, 2019 was $190 million and primarily related to the Cameron LNG project and the Freeport LNG Trains 1 & 2 projects. Our accrual of provisions for estimated losses on active uncompleted contracts as of December 31, 2018 was $266 million and primarily related to the Cameron LNG, Freeport LNG Trains 1 & 2, Calpine and Abkatun-A2 projects. Our Freeport LNG Train 3 project is not anticipated to be in a loss position.
Summary information for our significant ongoing loss projects as of March 31, 2019 is as follows:
Cameron LNG―At March 31, 2019, our U.S. LNG export facility project in Hackberry, Louisiana for Cameron LNG (within our NCSA operating group) was approximately 65% complete on a post-Combination basis (approximately 90% on a pre-Combination basis) and had an accrued provision for estimated losses of approximately $128 million. For these purposes (and for purposes of the discussion below), when we refer to a percentage of completion on a pre-Combination basis, we are referring to the cumulative percentage of completion, which includes progress made prior to the Combination Date. In accordance with U.S. GAAP, as of the Combination Date, we reset the progress to completion for all of CB&I’s projects then in progress to 0% for accounting purposes based on the remaining costs to be incurred as of that date.
Freeport LNG―At March 31, 2019, Trains 1 & 2 of our U.S. LNG export facility project in Freeport, Texas for Freeport LNG (within our NCSA operating group) were approximately 80% complete on a post-Combination basis (approximately 95% on a pre-Combination basis) and had an accrued provision for estimated losses of approximately $19 million. During the three months ended March 31, 2019, the project was negatively impacted by $27 million due to changes in cost estimates resulting from increases in construction and subcontractor costs. These cost estimate increases were partially offset by the recording of approximately $11 million of incentive revenues. Additionally, Freeport LNG Train 3 was positively impacted by $16 million of changes in cost estimates at completion due to increased productivity and savings in indirect costs, resulting in an overall net immaterial impact on operating margin at completion for the Freeport LNG project taken as a whole.
| 16 |
NOTES TO THE CONDENSED CONSOLIDATED FINANCIAL STATEMENTS (UNAUDITED)
Summary information for our significant loss projects previously reported in the 2018 Form 10-K that are substantially complete as of March 31, 2019 is as follows:
Calpine Power Project―At March 31, 2019, our U.S. gas turbine power project for Calpine (within our NCSA operating group) was approximately 95% complete on a post-Combination basis (approximately 99% on a pre-Combination basis), and the remaining accrued provision for estimated losses was not significant.
Abkatun-A2 Project―At March 31, 2019, our Abkatun-A2 platform project in Mexico for Pemex (within our NCSA operating group) was approximately 95% complete, and the remaining accrued provision for estimated losses was not significant.
NOTE 5—PROJECT CHANGES IN ESTIMATES
Our RPOs for each of our operating groups generally consist of several hundred contracts, and our results may be impacted by changes in estimated margins. The following is a discussion of our most significant changes in cost estimates that impacted segment operating income for the three months ended March 31, 20182019 and 2017.2018. For discussion of significant changes in estimates resulting from changes in transaction prices, see Note 4, Revenue Recognition.
Three months ended March 31, 2018
Segment operating income was positively impacted by favorable changes in estimates totaling approximately $37 million in our Middle East (“MEA”) and Asia (“ASA”) segments, which were partially offset by $2 million of net unfavorable changes in estimates in our Americas, Europe and Africa (“AEA”) segment.
MEA—This segment was positively impacted by favorable changes in estimates aggregating approximately $30 million, primarily due to:
cost savings associated with fabrication, procurement and marine campaigns on two Saudi Aramco lump-sum EPCI projects under the second Saudi Aramco Long Term Agreement (“LTA II”);
savings associated with marine campaigns, reimbursement for costs incurred and reduction in estimated costs to complete on multiple projects in the Middle East, none of which were individually material.
Those favorable changes in estimates were partially offset by higher estimated costs associated with:
hook-up and marine campaigns on two Saudi Aramco projects; and
standby equipment and mechanical equipment downtime on Middle East projects.
ASA—This segment was positively impacted by favorable changes in estimates aggregating approximately $9 million, primarily due to reduction in estimates of costs to complete several active projects. Those favorable changes in estimates were partially offset by additional costs associated with weather downtime on two active projects.
Three months ended March 31, 20172019
Segment operating income for the three months ended March 31, 20172019 was impacted by net favorable changes in estimates totaling approximately $19 million, primarily in our NCSA, EARC, MENA and APAC segments.
NCSA—Our segment results for the three months ended March 31, 2019 were negatively impacted by net unfavorable changes in estimates aggregating approximately $24 million. The net unfavorable changes were due to cost increases on the Freeport LNG Trains 1 & 2 project and a subsea pipeline flowline installation project, partially offset by savings on our ethane projects in Texas and Louisiana and our Freeport LNG Train 3 project. See Note 4, Revenue Recognition, for further discussion of our Freeport LNG Trains 1 & 2 and Train 3 projects.
EARC—Our segment results for the three months ended March 31, 2019 were positively impacted by net favorable changes in estimates aggregating approximately $4 million.
MENA—Our segment results for the three months ended March 31, 2019 were positively impacted by net favorable changes in estimates aggregating approximately $33 million. The net favorable changes were primarily due to reductions in costs on various projects in the Middle East.
APAC—Our segment results for the three months ended March 31, 2019 were positively impacted by net favorable changes in estimates aggregating approximately $6 million. The net favorable changes were due to reductions in cost to complete several projects, partially offset by cost increases and weather downtime on various projects.
Three months ended March 31, 2018
Segment operating income for the three months ended March 31, 2018 was positively impacted by net favorable changes in estimates totaling approximately $47 million across all segments.
AEA—This segment was positively impacted by net favorable changes in estimates aggregating approximately $5 million on multiple projects, none of which individually were material.
MEA—This segment was positively impacted by net favorable changes in estimates aggregating approximately $16$37 million, primarily due to productivity improvements and associated cost savings on Saudi Aramco projects.
ASA—This segmentwas positively impacted by net favorable changes in estimates aggregating approximately $26 million, primarily as a result of improved cost estimates associated with efficient project execution, including productivity improvements on our marine vessels and associated cost savings achieved, on our active projects.
At December 31, 2016, on the Ichthys project in Australia, we reported a $34 million increase in our estimated costs at completion due to a failure identified in a supplier-provided subsea-pipe connector component that we had previously installed,MENA (approximately $30 million) and we identified possible additional increases of up to $10 million, due to potential need for alternative installation methods. We investigated the cause of the failure and developed a remediation plan in conjunction with the customer. We commenced offshore replacement in June 2017 through a diving intervention method and completed the replacement in 2017. The costs to replace the supplier-provided subsea-pipe connector component were less than our December 31, 2016 estimate. The project remains in an overall profitable position.APAC (approximately $9 million) segments.
|
|
|
NOTES TO THE CONDENSED CONSOLIDATED FINANCIAL STATEMENTS (UNAUDITED)
NOTE 5—6—CASH, CASH EQUIVALENTSEQUIVALENTS AND RESTRICTED CASH
The following table provides a reconciliation of cash, cash equivalents and restricted cash reported within the Consolidated Balance Sheets that sum to the totals of such amounts shown in the Consolidated Statements of Cash Flows.Flows as of March 31, 2019 and December 31, 2018:
|
|
|
| |||||||||||||
|
| March 31, 2018 |
|
| December 31, 2017 |
|
| March 31, 2019 |
|
| December 31, 2018 |
| ||||
|
| (in thousands) |
|
| (In millions) |
| ||||||||||
Cash and cash equivalents |
| $ | 412,725 |
|
| $ | 390,263 |
| $ |
| 413 |
|
| $ | 520 |
|
Restricted cash and cash equivalents |
|
| 6,074 |
|
|
| 17,929 |
| ||||||||
Restricted cash and cash equivalents (1) |
|
| 326 |
|
|
| 325 |
| ||||||||
Total cash, cash equivalents and restricted cash shown in the Consolidated Statements of Cash Flows |
| $ | 418,799 |
|
| $ | 408,192 |
| $ |
| 739 |
|
| $ | 845 |
|
(1) | Our restricted cash balances primarily serve as cash collateral deposits for our letter of credit facilities. See Note 11, Debt, for further discussion. |
A majority of our restricted cash balances serve as collateral for letters of credit, discussed in Note 8, Debt.
Accounts Receivable—Trade, Net―A summary of contract receivables is as follows:
|
| March 31, 2018 |
|
| December 31, 2017 |
| ||
|
| (In thousands) |
| |||||
Contract receivables |
| $ | 313,758 |
|
| $ | 225,974 |
|
Retainages |
|
| 98,551 |
|
|
| 119,550 |
|
Less allowances |
|
| (17,236 | ) |
|
| (17,222 | ) |
Accounts receivable—trade, net |
| $ | 395,073 |
|
| $ | 328,302 |
|
Retainages—Contract retainages generally represent amounts withheld by our customers until project completion, in accordance with the terms of the applicable contracts. The following is a summary of retainages on our contracts:
|
|
|
| |||||
|
| March 31, 2018 |
|
| December 31, 2017 |
| ||
|
| (In thousands) |
| |||||
Retainages expected to be collected within one year |
| $ | 98,551 |
|
| $ | 119,550 |
|
Retainages expected to be collected after one year |
|
| 40,154 |
|
|
| 39,253 |
|
Total retainages |
| $ | 138,705 |
|
| $ | 158,803 |
|
NOTE 7—CONTRACTS IN PROGRESS AND ADVANCE BILLINGS ON CONTRACTS
Contracts in progress, assets—include unbilled amounts typically resulting from revenue recognized exceeding the amount billed to the customer. We bill our customers as work progresses in accordance with agreed-upon contractual terms, mostly upon achievement of contractual milestones. Billing occurring subsequent to revenue recognition results in contract assets. Contract assets may not exceed their net realizable value and are classified as current. We expect to invoice customers for all unbilled revenues. Our payment terms are generally for less than 12 months and our contracts typically do not include a significant financing component.
Advance billings on contracts—include billings to customers that exceed revenues recognized. Most long-term contracts contain provisions for progress payments. Billing occurring prior to revenue recognition results in contract liabilities.
As oftrade receivable balances at March 31, 2018, Contracts in progress, assets and Advance billings on contracts include balances associated with excess of costs recognized over cost incurred on those contracts that are substantially complete at the date of initial application of ASC Topic 606.
|
|
NOTES TO THE CONSOLIDATED FINANCIAL STATEMENTS (UNAUDITED)
Prior to the adoption of ASC Topic 606, certain costs, such as significant costs for materials and third-party subcontractors, were excluded from our cost-to-cost method of measuring progress for revenue recognition, which resulted in the recognition of an asset related to cost incurred in excess of cost recognized. As a result of our adoption of ASC Topic 606 effective January 1, 2018, we now measure transfer of control utilizing an input method to measure progress for individual contracts or combinations of contracts based on the total cost of materials, labor, equipment and vessel operating costs and other costs incurred as applicable to each contract.
Our contract assets and liabilities as of March 31, 20182019 and December 31, 2017 were as follows and are reflective of2018 included the accounting treatment in effect as of each reporting date:following:
|
| March 31, 2018 |
|
| December 31, 2017 |
| ||
|
| (In thousands) |
| |||||
Costs incurred less costs of revenues recognized |
| $ | (3,228 | ) |
| $ | 98,127 |
|
Revenues recognized less billings to customers |
|
| 509,648 |
|
|
| 523,284 |
|
Contracts in Progress, assets |
|
| 506,420 |
|
|
| 621,411 |
|
|
|
|
|
|
|
|
|
|
Billings to customers less revenues recognized |
|
| 28,279 |
|
|
| 45,661 |
|
Costs incurred less costs of revenues recognized |
|
| 11,928 |
|
|
| (13,409 | ) |
Advance billings on contracts |
|
| 40,207 |
|
|
| 32,252 |
|
|
|
|
|
|
|
|
|
|
For the three-months ended March 31, 2018, we recognized $66 million of revenues due to changes in transaction price associated with performance obligations satisfied in prior periods, primarily in our ASA segment. The change in transaction price primarily relates to reimbursement of costs incurred in prior periods.
Revenues recognized for the three-month period ended March 31, 2018 with respect to amounts included in our Advance billings on contracts balance as of December 31, 2017 was $38 million.
The carrying values of our long-term debt obligations, net of unamortized debt issuance costs of $5 million as of March 31, 2018 and December 31, 2017, are as follows:
|
|
|
| |||||
|
| March 31, 2018 |
|
| December 31, 2017 |
| ||
|
| (In thousands) |
| |||||
Senior Notes |
| $ | 495,383 |
|
| $ | 495,000 |
|
North Ocean 105 construction financing |
|
| 24,511 |
|
|
| 24,511 |
|
Vendor equipment financing |
|
| 15,686 |
|
|
| 15,686 |
|
Other, including capital lease obligations |
|
| 1,678 |
|
|
| 1,780 |
|
|
|
| 537,258 |
|
|
| 536,977 |
|
Less: Amounts due within one year |
|
| 24,264 |
|
|
| 24,264 |
|
Total long-term debt |
| $ | 512,994 |
|
| $ | 512,713 |
|
|
|
|
| |||||
|
| March 31, 2019 |
|
| December 31, 2018 |
| ||
|
| (In millions) |
| |||||
Contract receivables (1) |
| $ | 838 |
|
| $ | 794 |
|
Retainages (2) |
|
| 156 |
|
|
| 155 |
|
Less allowances |
|
| (17 | ) |
|
| (17 | ) |
Accounts receivable—trade, net |
| $ | 977 |
|
| $ | 932 |
|
|
|
(2) | Retainages classified within Accounts receivable-trade, net are amounts anticipated to be collected within one year and as to which we have an unconditional right to collect from the customer, subject only to the passage of time. Retainages anticipated to be collected beyond one year are classified as Accounts receivable long-term retainages on our Balance Sheet. |
NOTES TO THE CONSOLIDATED FINANCIAL STATEMENTS (UNAUDITED)
NOTE 8—GOODWILL AND OTHER INTANGIBLE ASSETS
Goodwill
On June 30, 2017, we amended and restated our credit agreement dated April 16, 2014, by entering into an Amended and Restated Credit Agreement (the “Current Credit Agreement”)Our goodwill balance is attributable to the excess of the purchase price over the fair value of net assets acquired in connection with a syndicatethe Combination. The changes in the carrying amount of lenders and letter of credit issuers, and Crédit Agricole Corporate and Investment Bank,goodwill during the three months ended March 31, 2019 are as administrative agent and collateral agent. Available capacity under the Current Credit Agreement is as follows:
|
| Capacity |
|
| Utilized |
| ||||||
|
|
|
|
|
| March 31, 2018 |
|
| December 31, 2017 |
| ||
|
| (In millions) |
| |||||||||
Letters of Credit(1) |
| $ | 510 |
|
| $ | 390 |
|
| $ | 407 |
|
Revolving Credit Facility/ Letters of Credit |
|
| 300 |
|
|
| - |
|
|
| - |
|
|
|
|
| |
|
| (In millions) |
| |
Balance as of December 31, 2018 |
| $ | 2,654 |
|
Adjustments to preliminary purchase accounting estimates (1) |
|
| 61 |
|
Currency translation adjustments |
|
| (34) |
|
Balance as of March 31, 2019 (2) |
| $ | 2,681 |
|
(1) |
|
(2) | At March 31, 2019, we had approximately $2.2 billion of cumulative impairment charges recorded in conjunction with our impairment analysis performed during the fourth quarter of 2018, |
During the first quarter of 2018, the maximum amount of cash collateral used to support bilateral letters of credit was $122 million.
Senior Secured Notes—On April 9, 2018, in connection with the financings referred to in Note 2, Business Combination Agreement with Chicago Bridge & Iron Company N.V. (“CB&I”), we gave a conditional notice for full optional redemption of all our outstanding senior secured notes due 2021 (the “Outstanding Senior Secured Notes”) on May 10, 2018, which date is subject to extension through June 8, 2018. The redemption price will be equal to 102% of the aggregate principal amount of the Outstanding Senior Secured Notes, plus accrued and unpaid interest. The redemption is subject to our depositing, with the trustee for the Outstanding Senior Secured Notes, funds sufficient to pay the redemption price for all of the Outstanding Senior Secured Notes, plus accrued and unpaid interest.
Uncommitted Bilateral Credit Facilities—We are party to a number of short-term uncommitted bilateral credit facilities (the “Uncommitted Facilities”) across several geographic regions, as follows:
|
| March 31, 2018 |
|
| December 31, 2017 |
| ||||||||||
|
| Uncommitted Line Capacity |
|
| Utilized |
|
| Uncommitted Line Capacity |
|
| Utilized |
| ||||
|
| (In millions) |
| |||||||||||||
Bank Guarantee and Bilateral Letter of Credit |
| $ | 875 |
|
| $ | 545 |
|
| $ | 725 |
|
| $ | 572 |
|
Surety Bonds |
| 300 |
|
| 48 |
|
| 300 |
|
| 49 |
| ||||
Bilateral arrangements to issue cash collateralized letters of credit |
|
| 175 |
|
|
| 6 |
|
|
| 175 |
|
|
| 18 |
|
As of March 31, 2018, we were in compliance with all of the financial covenants set forth in the Current Credit Agreement.
See Note 12, Debt, included in our Annual Report on Form 10-K for the year ended December 31, 2017, for additional information relating to our outstanding debt.
NOTE 9—PENSION AND POSTRETIREMENT BENEFITS
Net periodic benefit cost or gain recognized during each period presented relates to expected return on plan assets, net of interest costs, for our qualified defined benefit pension plan and several of our non-qualified supplemental defined benefit pension plans (the “Domestic Plans”) and our J. Ray McDermott, S.A. Third Country National Employees Pension Plan (the “TCN Plan”).
| Domestic Plans |
|
| TCN Plan |
| ||||||||||
| Three Months Ended March 31, |
| |||||||||||||
| 2018 |
|
| 2017 |
|
| 2018 |
|
| 2017 |
| ||||
| (In thousands) |
| |||||||||||||
Interest cost | $ | 4,433 |
|
| $ | 4,991 |
|
| $ | - |
|
| $ | 290 |
|
Expected return on plan assets |
| (4,672 | ) |
|
| (4,907 | ) |
|
| (11 | ) |
|
| (345 | ) |
Net periodic benefit cost (gain) | $ | (239 | ) |
| $ | 84 |
|
| $ | (11 | ) |
| $ | (55 | ) |
| 18 |
|
NOTES TO THE CONDENSED CONSOLIDATED FINANCIAL STATEMENTS (UNAUDITED)
During the three months ended March 31, 2019, no indicators of goodwill impairment were identified.
In August 2017 the TCN plan was amended to issue lump-sum distributions of certain accrued benefits or allow transfer of such benefits into the defined contribution plan. As ofProject-Related Intangibles
Our project-related intangibles at March 31, 2019 and December 31, 2017 all investments in2018, including the TCN plan trustMarch 31, 2019 weighted-average useful lives, were convertedas follows:
|
|
|
|
|
| March 31, 2019 |
|
| December 31, 2018 |
| ||||||||||||||||||
|
| Weighted Average Useful Life |
|
| Gross Carrying Amount |
|
| Accumulated Amortization |
|
| Net Carrying Amount |
|
| Gross Carrying Amount |
|
| Accumulated Amortization |
|
| Net Carrying Amount |
| |||||||
|
| (In years) |
|
| (In millions) |
| ||||||||||||||||||||||
Project-related intangible assets |
|
| 4 |
|
| $ | 257 |
|
| $ | (143 | ) |
| $ | 114 |
|
| $ | 259 |
|
| $ | (122 | ) |
| $ | 137 |
|
Project-related intangible liabilities |
|
| 2 |
|
|
| (109 | ) |
|
| 57 |
|
|
| (52 | ) |
|
| (109 | ) |
|
| 43 |
|
|
| (66 | ) |
Total (1) |
|
|
|
|
| $ | 148 |
|
| $ | (86 | ) |
| $ | 62 |
|
| $ | 150 |
|
| $ | (79 | ) |
| $ | 71 |
|
(1) | The decrease in project-related intangible assets during the three months ended March 31, 2019 primarily related to amortization expense of $8 million and the impact of foreign currency translation. |
Other Intangible Assets
Our other intangible assets at March 31, 2019 and December 31, 2018, including the March 31, 2019 weighted-average useful lives, were as follows:
|
|
|
|
|
| March 31, 2019 |
|
| December 31, 2018 |
| ||||||||||||||||||
|
| Weighted Average Useful Life |
|
| Gross Carrying Amount |
|
| Accumulated Amortization |
|
| Net Carrying Amount |
|
| Gross Carrying Amount |
|
| Accumulated Amortization |
|
| Net Carrying Amount |
| |||||||
|
| (In years) |
|
| (In millions) |
| ||||||||||||||||||||||
Process technologies |
|
| 27 |
|
| $ | 509 |
|
| $ | (21 | ) |
| $ | 488 |
|
| $ | 514 |
|
| $ | (14 | ) |
| $ | 500 |
|
Trade names |
|
| 12 |
|
|
| 399 |
|
|
| (32 | ) |
|
| 367 |
|
|
| 401 |
|
|
| (23 | ) |
|
| 378 |
|
Customer relationships |
|
| 10 |
|
|
| 128 |
|
|
| (29 | ) |
|
| 99 |
|
|
| 129 |
|
|
| (23 | ) |
|
| 106 |
|
Trademarks |
|
| 10 |
|
|
| 27 |
|
|
| (2 | ) |
|
| 25 |
|
|
| 27 |
|
|
| (2 | ) |
|
| 25 |
|
Total (1) |
|
|
|
|
| $ | 1,063 |
|
| $ | (84 | ) |
| $ | 979 |
|
| $ | 1,071 |
|
| $ | (62 | ) |
| $ | 1,009 |
|
(1) | The decrease inother intangible assets during the three months ended March 31, 2019 primarily related to amortization expense of $22 million and the impact of foreign currency translation. |
NOTE 9—JOINT VENTURE AND CONSORTIUM ARRANGEMENTS
We account for our unconsolidated joint ventures or consortiums using either proportionate consolidation, when we meet the applicable accounting criteria to cash and cash equivalents to facilitate settlements. Settlements are expecteddo so, or the equity method. Further, we consolidate any joint venture or consortium that is determined to be completed bya VIE for which we are the endprimary beneficiary or which we otherwise effectively control.
| 19 |
NOTES TO THE CONDENSED CONSOLIDATED FINANCIAL STATEMENTS (UNAUDITED)
Proportionately Consolidated Consortiums
The following is a summary description of 2018. our significant consortiums that have been deemed to be VIEs where we are not the primary beneficiary and are accounted for using proportionate consolidation:
• | McDermott/Zachry Industrial Inc.(“Zachry”)—We have a 50%/50% consortium with Zachry to perform engineering, procurement and construction (“EPC”) work for two LNG liquefaction trains in Freeport, Texas. In addition, we have subcontract and risk sharing arrangements with a unit of Chiyoda Corporation (“Chiyoda”) to support our responsibilities to the venture. The costs of these arrangements are recorded in Cost of operations. |
• | McDermott/Zachry/Chiyoda—We have a consortium with Zachry and Chiyoda (MDR—33.3% / Zachry—33.3% / Chiyoda—33.3%) to perform EPC work for an additional LNG liquefaction train at the project site in Freeport, Texas, described above. |
• | McDermott/Chiyoda—We have a 50%/50% consortium with Chiyoda to perform EPC work for three LNG liquefaction trains in Hackberry, Louisiana. |
• | McDermott/CTCI—We have a 42.5%/57.5% consortium with a unit of CTCI Corporation (“CTCI”) to perform EPC work for a mono-ethylene glycol facility in Gregory, Texas. |
The following table presents summarized balance sheet information for our share of our proportionately consolidated consortiums:
|
| March 31, 2019 |
|
| December 31, 2018 |
| ||
|
| (In millions) |
| |||||
Current assets (1) |
| $ | 377 |
|
| $ | 299 |
|
Non-current assets |
|
| 11 |
|
|
| 10 |
|
Total assets |
| $ | 388 |
|
| $ | 309 |
|
|
|
|
|
|
|
|
|
|
Current liabilities |
| $ | 816 |
|
| $ | 992 |
|
(1) | Our consortium arrangements allow for excess working capital of the consortium to be advanced to the consortium participants. Such advances are returned to the ventures for working capital needs as necessary. Accordingly, at a reporting period end a consortium may have advances to its participants which are reflected as an advance receivable within current assets of the consortium. As of March 31, 2019 and December 31, 2018, Accounts receivable-other included $33 million and $44 million, respectively, related to our proportionate share of advances from the consortiums to the other consortium participants. |
As of March 31, 2019 and December 31, 2018, total benefits remainingAccrued liabilities reflected on the McDermott International, Inc. Consolidated Balance Sheet included $44 million and $53 million, respectively, related to advances from these consortiums.
The following is a summary description of our significant consortium that has been deemed a collaborative arrangement, in which we are not the primary beneficiary and we record our share of the consortium’s revenues, costs and profits:
• | McDermott/Zachry/Chiyoda—We have a consortium with Zachry and Chiyoda to perform EPC work for a natural gas liquefaction facility in Sabine Pass, Texas. The collaborative arrangement includes an underlying primary consortium with all three parties sharing equal voting interests. This primary consortium has subcontract relationships with a separate consortium between Zachry and McDermott, with equal voting interests and separate scopes of work to be executed by each consortium party. |
| 20 |
NOTES TO THE CONDENSED CONSOLIDATED FINANCIAL STATEMENTS (UNAUDITED)
The following table presents summarized balance sheet information for our share of that proportionately consolidated collaborative arrangement:
|
| March 31, 2019 |
| |
|
| (In millions) |
| |
Current assets |
| $ | 70 |
|
Non-current assets |
|
| - |
|
Total assets |
| $ | 70 |
|
|
|
|
|
|
Current liabilities |
| $ | 69 |
|
Equity Method Joint Ventures—The following is a summary description of our significant joint ventures accounted for using the equity method:
• | Chevron Lummus Global, L.L.C. (“CLG”)—We have a 50%/50% joint venture with a unit of Chevron Corporation which provides proprietary process technology licenses and associated engineering services and catalyst, primarily for the refining industry. As sufficient capital investments in CLG have been made by the joint venture participants, it does not qualify as a VIE. |
• | NET Power, LLC (“NET Power”)—We have a joint venture with a unit of Exelon Corporation (“Exelon”), 8 Rivers Capital and Oxy Low Carbon Ventures LLC, a subsidiary of Occidental Petroleum Corporation (“Oxy”), (MDR—32.2% / Exelon—32.2% / 8 Rivers Capital—32.2% / Oxy— 3.3%) to commercialize a new natural gas power generation system that recovers the carbon dioxide produced during combustion. NET Power is building a first-of-its-kind demonstration plant which is being funded by contributions and services from the joint venture participants and other parties. On November 8, 2018, NET Power signed an investment agreement for Oxy to purchase 10% of the company for $60 million over a three-year period, which will dilute future ownership of each of the existing members by 3.3%. On March 8, 2019, Oxy paid the first tranche of $20 million and received a 3.3% interest in NET Power. We have determined the joint venture to be a VIE; however, we are not the primary beneficiary and therefore do not consolidate it. |
• | McDermott/CTCI—We have a 50%/50% joint venture with CTCI to perform EPC work for a liquids ethylene cracker and associated units at Sohar, Oman. We have determined the joint venture to be a VIE; however, we are not the primary beneficiary and therefore do not consolidate it. Our joint venture arrangement allows for excess working capital of the joint venture to be advanced to the joint venture participants. Such advances are returned to the joint venture for working capital needs as necessary. As of March 31, 2019 and December 31, 2018, Accrued liabilities on our Balance Sheet included $95 million and $95 million, respectively, related to advances from this joint venture. |
• | io Oil and Gas—We co-own several 50%/50% joint venture entities with Baker Hughes, a GE company. These joint venture entities focus on the pre-FEED phases of projects in offshore markets, bring comprehensive field development expertise and provide technically advanced solutions in new full field development concept selection and evaluation. |
• | Qingdao McDermott Wuchuan Offshore Engineering Company Ltd.—We have a 50%/50% joint venture with Wuhan Wuchuan Investment Holding Co., Ltd., a leading shipbuilder in China. This joint venture provides project management, procurement, engineering, fabrication, construction and pre-commissioning of onshore and offshore oil and gas structures, including onshore modules, topsides, floating production storage, off-loading modules, subsea structures and manifolds. |
Aggregate summarized financial information for CLG and McDermott/CTCI is as follows:
|
| Three Months Ended March 31, 2019 |
| |||
|
| (In millions) |
| |||
Revenues |
| $ | 225 |
| ||
Cost of operations |
|
| 195 |
| ||
Gross profit |
|
| 30 |
| ||
Operating income |
|
| 25 |
| ||
Net income (1) |
| $ | 28 |
| ||
(1) | The results of CLG and McDermott/CTCI for the three months ended March 31, 2018 were prior to the Combination Date and are not presented. |
| 21 |
NOTES TO THE CONDENSED CONSOLIDATED FINANCIAL STATEMENTS (UNAUDITED)
Amortization expense associated with fair value adjustments recorded to Investments in unconsolidated affiliates in conjunction with the Combination was $3 million for the three months ended March 31, 2019.
Consolidated Joint Ventures—The following is a summary description of our significant joint venture we consolidate due to its designation as a VIE for which we are the primary beneficiary:
• | McDermott/Orano—We have a joint venture with Orano (McDermott—52% / Orano—48%) relating to a mixed oxide fuel fabrication facility in Aiken, South Carolina. The project is currently winding down, with limited activity anticipated for the remainder of 2019. |
The following table presents summarized balance sheet information for our consolidated joint ventures, including other consolidated joint ventures that are not individually material to our financial results:
|
| March 31, 2019 |
|
| December 31, 2018 |
| ||
|
| (In millions) |
| |||||
Current assets |
| $ | 104 |
|
| $ | 102 |
|
Non-current assets |
|
| 14 |
|
|
| 15 |
|
Total assets |
| $ | 118 |
|
| $ | 117 |
|
|
|
|
|
|
|
|
|
|
Current liabilities |
| $ | 145 |
|
| $ | 138 |
|
Other—The use of joint ventures and consortiums exposes us to a number of risks, including the risk that the third-party joint venture or consortium participants may be unable or unwilling to provide their share of capital investment to fund the operations of the joint venture or consortium or complete their obligations to us, the joint venture or consortium, or ultimately, our customer. Differences in opinions or views among joint venture or consortium participants could also result in delayed decision-making or failure to agree on material issues, which could adversely affect the business and operations of a joint venture or consortium. In addition, agreement terms may subject us to joint and several liability for the third-party participants in our joint ventures or consortiums, and the failure of any of those third parties to perform their obligations could impose additional performance and financial obligations on us. These factors could result in unanticipated costs to complete the projects, liquidated damages or contract disputes.
NOTE 10—RESTRUCTURING AND INTEGRATION COSTS AND TRANSACTION COSTS
Restructuring and Integration Costs
Restructuring and integration costs for the three months ended March 31, 2019 were $69 million, and included change-in-control, severance, professional fees and costs of settlement of litigation (see Note 21, Commitments and Contingencies for further discussion of litigation), as well as costs to achieve our combination profitability initiative (“CPI”) program. We launched the CPI program in the second quarter of 2018, with the goal of realizing transformative cost savings across our business. The program incorporates the activities of our Fit 2 Grow program previously announced in the fourth quarter of 2017 and targets a significant improvement in cost controls across five main opportunity areas: (1) procurement and supply chain; (2) systems, applications and support; (3) assets and facilities; (4) perquisites, travel and other; and (5) workforce efficiency. Restructuring and integration costs for the three months ended March 31, 2018 were $12 million, and primarily related to costs associated with CPI. These costs are recorded within our Corporate operating results.
Transaction Costs
Transaction costs for the three months ended March 31, 2019 primarily relate to professional fees associated with the development of plans to sell our non-core industrial storage tank and U.S. pipe fabrication businesses. Transaction costs for the three months ended March 31, 2018 primarily related to professional service fees (including accounting, legal and advisory services) incurred in connection with the Combination. These costs are recorded within our Corporate operating results and were $4 million and $3 million for the three months ended March 31, 2019 and 2018, respectively.
| 22 |
NOTES TO THE CONDENSED CONSOLIDATED FINANCIAL STATEMENTS (UNAUDITED)
NOTE 11—DEBT
The carrying values of our debt obligations are as follows:
|
|
|
| |||||
|
| March 31, 2019 |
|
| December 31, 2018 |
| ||
|
| (In millions) |
| |||||
Current |
|
|
|
|
|
|
|
|
Revolving credit facility |
| $ | 178 |
|
| $ | - |
|
|
|
|
|
|
|
|
|
|
Current maturities of long-term debt |
|
| 31 |
|
|
| 31 |
|
Less: unamortized debt issuance costs |
|
| (1 | ) |
|
| (1 | ) |
Current maturities of long-term debt, net of unamortized debt issuance costs |
|
| 30 |
|
|
| 30 |
|
Current debt, net of unamortized debt issuance costs |
| $ | 208 |
|
| $ | 30 |
|
Long-term |
|
|
|
|
|
|
|
|
Term Facility |
| $ | 2,237 |
|
| $ | 2,243 |
|
10.625% senior notes |
|
| 1,300 |
|
|
| 1,300 |
|
North Ocean 105 construction financing |
|
| 16 |
|
|
| 16 |
|
Less: current maturities of long-term debt |
|
| (30 | ) |
|
| (30 | ) |
Less: unamortized debt issuance costs |
|
| (130 | ) |
|
| (136 | ) |
Long-term debt, net of unamortized debt issuance costs |
| $ | 3,393 |
|
| $ | 3,393 |
|
Credit Agreement
On May 10, 2018, we entered into a Credit Agreement (the “Credit Agreement”) with a syndicate of lenders and letter of credit issuers, Barclays Bank PLC, as administrative agent for a term facility under the planCredit Agreement, and Crédit Agricole Corporate and Investment Bank, as administrative agent for the other facilities under the Credit Agreement. The Credit Agreement provides for borrowings and letters of credit in the aggregate principal amount of $4.65 billion, consisting of the following:
• | a $2.26 billion senior secured, seven-year term loan facility (the “Term Facility”), the full amount of which was borrowed, and $319.3 million of which has been deposited into a restricted cash collateral account (the “LC Account”) to secure reimbursement obligations in respect of up to $310.0 million of letters of credit (the “Term Facility Letters of Credit”); |
• | a $1.0 billion senior secured revolving credit facility (the “Revolving Credit Facility”); and |
• | a $1.39 billion senior secured letter of credit facility (the “LC Facility”). |
The Credit Agreement provides that:
• | Term Facility Letters of Credit can be issued in an amount up to the amount on deposit in the LC Account ($319.9 million at March 31, 2019), less an amount equal to approximately 3% of such amount on deposit (to be held as a reserve for related letter of credit fees), not to exceed $310.0 million; |
• | subject to compliance with the financial covenants in the Credit Agreement, the full amount of the Revolving Credit Facility is available for revolving loans; |
• | subject to our utilization in full of our capacity to issue Term Facility Letters of Credit, the full amount of the Revolving Credit Facility is available for the issuance of performance letters of credit and up to $200 million of the Revolving Credit Facility is available for the issuance of financial letters of credit; and |
• | the full amount of the LC Facility is available for the issuance of performance letters of credit. |
Borrowings are available under the Revolving Credit Facility for working capital and other general corporate purposes. Certain existing letters of credit outstanding under our previously existing Amended and Restated Credit Agreement, dated as of June 30, 2017 (the “Prior Credit Agreement”), and certain existing letters of credit outstanding under CB&I’s previously existing credit facilities have been deemed issued under the Credit Agreement, and letters of credit were issued under the Credit Agreement to backstop certain other existing letters of credit issued for the account of McDermott, CB&I and their respective subsidiaries and affiliates.
The Credit Agreement includes mandatory commitment reductions and prepayments in connection with, among other things, certain asset sales and casualty events (subject to reinvestment rights with respect to asset sales of less than $500 million). In addition, we are
| 23 |
NOTES TO THE CONDENSED CONSOLIDATED FINANCIAL STATEMENTS (UNAUDITED)
required to make annual prepayments of term loans under the Term Facility and cash collateralize letters of credit issued under the Revolving Credit Facility and the LC Facility with 75% of excess cash flow (as defined in the Credit Agreement), reducing to 50% of excess cash flow and 25% of excess cash flow depending on our secured leverage ratio.
Term Facility—As of March 31, 2019, we had $2.2 billion of borrowings outstanding under the Term Facility. Proceeds from our borrowing under the Term Facility were used, together with proceeds from the issuance of the Senior Notes and cash on hand, (1) to consummate the Combination in 2018, including the repayment of certain existing indebtedness of CB&I and its subsidiaries, (2) to redeem $500 million aggregate principal amount of our 8.000% second-lien notes, (3) to prepay existing indebtedness under, and to terminate in full, the Prior Credit Agreement, and (4) to pay fees and expenses in connection with the Combination, the Credit Agreement and the issuance of the Senior Notes.
Principal under the Term Facility is payable quarterly and interest is assessed at either (1) the Eurodollar rate plus a margin of 5.00% per year or (2) the base rate (the highest of the Federal Funds rate plus 0.50%, the Eurodollar rate plus 1.0%, or the administrative agent’s prime rate) plus a margin of 4.00%, subject to a 1.0% floor with respect to the Eurodollar rate and is payable periodically dependent upon the interest rate in effect during the period. On May 8, 2018, we entered into a U.S. dollar interest rate swap arrangement to mitigate exposure associated with cash flow variability on $1.94 billion of the $2.26 billion Term Facility. This resulted in a weighted average interest rate of 7.70%, inclusive of the applicable margin during the three months ended March 31, 2019. The Credit Agreement requires us to prepay a portion of the term loans made under the Term Facility on the last day of each fiscal quarter in an amount equal to $5.65 million.
The future scheduled maturities of the Term Facility are:
|
| (In millions) |
| |
2019 |
| $ | 17 |
|
2020 |
|
| 23 |
|
2021 |
|
| 23 |
|
2022 |
|
| 23 |
|
2023 |
|
| 23 |
|
Thereafter |
|
| 2,128 |
|
|
| $ | 2,237 |
|
Additionally, as of March 31, 2019, there were approximately $20$297 million of Term Facility letters of credit issued (including $48 million of financial letters of credit) under the Credit Agreement, leaving approximately $13 million of available capacity under the Term Facility.
Revolving Credit Facility and LC Facility—We have a $1.0 billion Revolving Credit Facility which is scheduled to expire in May 2023. As of March 31, 2019, we had approximately $178 million in borrowings and $108 million of letters of credit outstanding (including $49 million of financial letters of credit) under the Revolving Credit Facility, leaving $714 million of available capacity under this facility. During the three months ended March 31, 2019, the maximum borrowing under the Revolving Credit Facility was $317 million. We also have a $1.39 billion LC Facility that is scheduled to expire in May 2023. As of March 31, 2019, we had approximately $1.37 billion of letters of credit outstanding, leaving $19 million of available capacity under the LC Facility. If we borrow funds under the Revolving Credit Facility, interest will be assessed at either the base rate plus a floating margin ranging from 2.75% to 3.25% (3.25% at March 31, 2019) or the Eurodollar rate plus a floating margin ranging from 3.75% to 4.25% (4.25% at March 31, 2019), in each case depending on our leverage ratio (calculated quarterly). We are charged a commitment fee of 0.50% per year on the daily amount of the unused portions of the commitments under the Revolving Credit Facility and the LC Facility. Additionally, with respect to all letters of credit outstanding under the Credit Agreement, we are charged a fronting fee of 0.25% per year and, with respect to all letters of credit outstanding under the Revolving Credit Facility and the LC Facility, we are charged a participation fee of (i) between 3.75% to 4.25% (4.25% at March 31, 2019) per year in respect of financial letters of credit and (ii) between 1.875% to 2.125% (2.125% at March 31, 2019) per year in respect of performance letters of credit, in each case depending on our leverage ratio (calculated quarterly). We are also required to pay customary issuance fees and other fees and expenses in connection with the issuance of letters of credit under the Credit Agreement.
Credit Agreement Covenants—The Credit Agreement includes the following financial covenants that are tested on a quarterly basis:
| 24 |
NOTES TO THE CONDENSED CONSOLIDATED FINANCIAL STATEMENTS (UNAUDITED)
• | the minimum permitted fixed charge coverage ratio (as defined in the Credit Agreement) is 1.50 to 1.00; |
• | the maximum permitted leverage ratio is (i) 4.25 to 1.00 for each fiscal quarter ending on or before September 30, 2019, (ii) 4.00 to 1.00 for the fiscal quarter ending December 31, 2019, (iii) 3.75 to 1.00 for each fiscal quarter ending after December 31, 2019 and on or before December 31, 2020, (iv) 3.50 to 1.00 for each fiscal quarter ending after December 31, 2020 and on or before December 31, 2021 and (v) 3.25 to 1.00 for each fiscal quarter ending after December 31, 2021; and |
• | the minimum liquidity (as defined in the Credit Agreement, but generally meaning the sum of McDermott’s unrestricted cash and cash equivalents plus unused commitments under the Credit Agreement available for revolving borrowings) is $200 million. |
In addition, the Credit Agreement contains various covenants that, among other restrictions, limit our ability to:
• | incur or assume indebtedness; |
• | grant or assume liens; |
• | make acquisitions or engage in mergers; |
• | sell, transfer, assign or convey assets; |
• | make investments; |
• | repurchase equity and make dividends and certain other restricted payments; |
• | change the nature of our business; |
• | engage in transactions with affiliates; |
• | enter into burdensome agreements; |
• | modify our organizational documents; |
• | enter into sale and leaseback transactions; |
• | make capital expenditures; |
• | enter into speculative hedging contracts; and |
• | make prepayments on certain junior debt. |
The Credit Agreement contains events of default that we believe are customary for a secured credit facility. If an event of default relating to bankruptcy or other insolvency event occurs, all obligations under the Credit Agreement will immediately become due and payable. If any other event of default exists under the Credit Agreement, the lenders may accelerate the maturity of the obligations outstanding under the Credit Agreement and exercise other rights and remedies. In addition, if any event of default exists under the Credit Agreement, the lenders may commence foreclosure or other actions against the collateral.
If any default exists under the Credit Agreement, or if we are unable to make any of the representations and warranties in the Credit Agreement at the applicable time, we will be unable to borrow funds or have letters of credit issued under the Credit Agreement.
Credit Agreement Covenants Compliance—As of March 31, 2019, we were in compliance with all our restrictive and financial covenants under the Credit Agreement. The financial covenants as of March 31, 2019 are summarized below:
Ratios | Requirement | Actual | ||
Minimum fixed charge coverage ratio | 1.50x | 2.47x | ||
Maximum total leverage ratio | 4.25x | 2.50x | ||
Minimum liquidity | $ | 200 million | $ | 1,140 million |
Future compliance with our financial and restrictive covenants under the Credit Agreement could be impacted by circumstances or conditions beyond our control, including, but not limited to, the delay or cancellation of projects, decreased letter of credit capacity, decreased profitability on our projects, changes in currency exchange or interest rates, performance of pension plan assets or changes in actuarial assumptions. Further, we could be impacted if our customers experience a material change in their ability to pay us or if
| 25 |
NOTES TO THE CONDENSED CONSOLIDATED FINANCIAL STATEMENTS (UNAUDITED)
the banks associated with the Credit Agreement were to cease operations, or if there is a full or partial break-up of the European Union (“EU”) or its currency, the Euro.
Letter of Credit Agreement
On October 30, 2018, we, as a guarantor, entered into a Letter of Credit Agreement (the “Letter of Credit Agreement”) with McDermott Technology (Americas), Inc., McDermott Technology (US), Inc. and McDermott Technology, B.V., each a wholly owned subsidiary of ours, as co-applicants, and Barclays Bank PLC, as administrative agent. The Letter of Credit Agreement provides for a facility for extensions of credit in the form of performance letters of credit in the aggregate face amount of up to $230 million (the “$230 Million LC Facility”). The $230 Million LC Facility is scheduled to expire in December 2021. The obligations under the Letter of Credit Agreement are unconditionally guaranteed on a senior secured basis by us and substantially all of our wholly owned subsidiaries, other than the co-applicants (which are directly obligated thereunder) and several captive insurance subsidiaries and certain other designated or immaterial subsidiaries. The liens securing the $230 Million LC Facility will rank equal in priority with the liens securing obligations under the Credit Agreement. The Letter of Credit Agreement includes financial and other covenants and provisions relating to events of default that are substantially the same as those in the Credit Agreement. As of March 31, 2019, there were approximately $205 million of letters of credit issued (or deemed issued) under the $230 million LC Facility, leaving approximately $25 million of available capacity.
Letter of Credit Agreement Covenants Compliance—As of March 31, 2019, we were in compliance with all our restrictive and financial covenants under the Letter of Credit Agreement.
Senior Notes
On April 18, 2018, we issued $1.3 billion in aggregate principal of 10.625% senior notes due 2024 (the “Senior Notes”), pursuant to an indenture we entered into with Wells Fargo Bank, National Association, as trustee (the “Senior Notes Indenture”). Interest on the Senior Notes is payable semi-annually in arrears, and the Senior Notes are scheduled to mature in May 2024. However, at any time or from time to time on or after May 1, 2021, we may redeem the Senior Notes, in whole or in part, at the redemption prices (expressed as percentages of principal amount of the Senior Notes to be redeemed) set forth below, together with accrued and unpaid interest to (but excluding) the redemption date (subject to the right of holders of record on the relevant record date to receive interest due on the relevant interest payment date), if redeemed during the 12-month period beginning on May 1 of the years indicated:
Year |
| Optional redemption price |
| |
2021 |
|
| 105.313 | % |
2022 |
|
| 102.656 | % |
2023 and thereafter |
|
| 100.000 | % |
In addition, prior to May 1, 2021, we may redeem up to 35.0% of the aggregate principal amount of the outstanding Senior Notes, in an amount not greater than the net cash proceeds of one or more qualified equity offerings (as defined in the Senior Notes Indenture) at a redemption price equal to 110.625% of the principal amount of the notes to be redeemed, plus accrued and unpaid interest to (but excluding) the date of redemption (subject to the right of holders of record on the relevant record date to receive interest due on the relevant interest payment date), subject to certain limitations and other requirements. The Senior Notes may also be redeemed, in whole or in part, at any time prior to May 1, 2021 at our option, at a redemption price equal to 100% of the principal amount of the Senior Notes redeemed, plus the applicable premium (as defined in the Senior Notes Indenture) as of, and accrued and unpaid interest to (but excluding) the applicable redemption date (subject to the right of the holders of record on the relevant record date to receive interest due on the relevant interest payment date).
| 26 |
NOTES TO THE CONDENSED CONSOLIDATED FINANCIAL STATEMENTS (UNAUDITED)
Senior Notes Covenants—The Senior Notes Indenture contains covenants that, among other things, provide limits around our ability to: (1) incur or guarantee additional indebtedness or issue preferred stock; (2) make investments or certain other restricted payments; (3) pay dividends or distributions on our capital stock or purchase or redeem our subordinated indebtedness; (4) sell assets; (5) create restrictions on the ability of our restricted subsidiaries to pay dividends or make other payments to us; (6) create certain liens; (7) sell all or substantially all of our assets or merge or consolidate with or into other companies; (8) enter into transactions with affiliates; and (9) create unrestricted subsidiaries. Those covenants are subject to various exceptions and limitations.
Senior Notes Covenants Compliance—As of March 31, 2019, we were in compliance with all our restrictive covenants under the Senior Notes Indenture. Future compliance with our restrictive covenants under the Senior Notes Indenture could be impacted by circumstances or conditions beyond our control, including, but not limited to, those discussed above with respect to the Credit Agreement.
Other Financing Arrangements
North Ocean (“NO”) Financing―On September 30, 2010, McDermott International, Inc., as guarantor, and NO 105 AS, one of our subsidiaries, as borrower, entered into a financing agreement to pay a portion of the construction costs of the NO 105. Borrowings under the agreement are secured by, among other things, a pledge of all of the equity of NO 105 AS, a mortgage on the NO 105, and a lien on substantially all of the other assets of NO 105 AS. As of March 31, 2019, the outstanding borrowing under this facility was approximately $16 million. Future maturities are approximately $8 million for the remainder of 2019 and $8 million in 2020.
Receivables Factoring―During the first quarter of 2019, we sold, without recourse, approximately $35 million of receivables under an uncommitted receivables purchase agreement in Mexico at a discount rate of applicable LIBOR plus a margin of 1.40% - 2.00% and Interbank Equilibrium Interest Rate in Mexico plus a margin of 1.40% - 1.70%. We recorded approximately $1 million of factoring costs in Other operating income (expense) during the first quarter of 2019. Ten percent of the receivables sold are withheld and received on the due date of the original invoice. We have received cash, net of fees and amounts withheld, of approximately $31 million under these arrangements during the first quarter of 2019.
Uncommitted Facilities—We are party to a number of short-term uncommitted bilateral credit facilities and surety bond arrangements (the “Uncommitted Facilities”) across several geographic regions, as follows:
|
| March 31, 2019 |
|
| December 31, 2018 |
| ||||||||||
|
| Uncommitted Line Capacity |
|
| Utilized |
|
| Uncommitted Line Capacity |
|
| Utilized |
| ||||
|
| (In millions) |
| |||||||||||||
Bank Guarantee and Bilateral Letter of Credit (1) |
| $ | 1,668 |
|
| $ | 1,095 |
|
| $ | 1,669 |
|
| $ | 1,060 |
|
Surety Bonds (2) |
| 840 |
|
| 532 |
|
|
| 842 |
|
|
| 475 |
| ||
(1) | Approximately $175 million of this capacity is available only upon provision of an equivalent amount of cash collateral. |
(2) | Excludes approximately $360 million of surety bonds maintained on behalf of CB&I’s former Capital Services Operations, which were sold to CSVC Acquisition Corp (“CSVC”) in June 2017. We also continue to maintain guarantees on behalf of CB&I’s former Capital Services Operations business in support of approximately $45 million of RPOs. We are entitled to an indemnity from CSVC for both the surety bonds and guarantees. |
| 27 |
NOTES TO THE CONDENSED CONSOLIDATED FINANCIAL STATEMENTS (UNAUDITED)
NOTE 12—LEASE OBLIGATIONS
The following tables summarize our leased assets and lease liability obligations:
|
|
|
| March 31, 2019 |
|
| December 31, 2018 |
| ||
|
|
|
| (In millions) |
| |||||
Leases |
| Classification |
|
|
|
|
|
|
|
|
Assets |
|
|
|
|
|
|
|
|
|
|
Operating lease assets |
| Operating lease right-of-use assets |
| $ | 401 |
|
| $ | - |
|
Finance lease assets (1) |
| Property, plant and equipment, net |
|
| 69 |
|
|
| 70 |
|
|
| Total leased assets |
|
| 470 |
|
|
| 70 |
|
Liabilities |
|
|
|
|
|
|
|
|
|
|
Current |
|
|
|
|
|
|
|
|
|
|
Operating |
| Current portion of long-term lease obligations |
|
| 89 |
|
|
| - |
|
Finance |
| Current portion of long-term lease obligations |
|
| 8 |
|
|
| 8 |
|
|
|
|
|
| 97 |
|
|
| 8 |
|
Noncurrent |
|
|
|
|
|
|
|
|
|
|
Operating |
| Long-term lease obligations |
|
| 330 |
|
|
| - |
|
Finance |
| Long-term lease obligations |
|
| 64 |
|
|
| 66 |
|
|
|
|
|
| 394 |
|
|
| 66 |
|
|
|
|
|
|
|
|
|
|
|
|
|
| Total lease liabilities |
| $ | 491 |
|
| $ | 74 |
|
(1) | Our finance leases are represented by: |
(a) | A jack-up barge utilized in our MENA region; and |
(b) | The Amazon, a pipelay and construction vessel, was purchased by us in February 2017, sold to an unrelated third party (the “Amazon Owner”) and leased back under a long-term bareboat charter that gave us the right to use the vessel and was recorded as an operating lease. On July 27, 2018, we entered into agreements (the “Amazon Modification Agreements”) providing for certain modifications to the Amazon vessel and related financing and amended bareboat charter arrangements. The total cost of the modifications, including project management and other fees and expenses, is expected to be in the range of approximately $260 million to $290 million. The Amazon Owner is expected to fund the cost of the modifications primarily through an export credit-backed senior loan provided by a group of lenders, supplemented by expected direct capital expenditures by us of approximately $58 million over the course of the modifications. The amended bareboat charter arrangement is accounted for as a finance lease, recognizing Property, plant and equipment and Lease obligation for the present value of future minimum lease payments. The cost of modifications will be recorded in Property, plant and equipment with a corresponding liability for direct capital expenditures not incurred by us. The finance lease obligation will increase upon completion of the modifications and funding by the Amazon Owner. As of March 31, 2019, Property, plant and equipment, net included a $51 million asset (net of accumulated amortization of $4 million) and a finance lease liability of approximately $52 million. As of December 31, 2018, Property, plant and equipment, net included a $52 million asset (net of accumulated amortization of $3 million) and a finance lease liability of approximately $53 million. |
Our lease cost was as follows:
|
|
|
| Three months ended |
| |
|
|
|
| March 31, 2019 |
| |
|
| Classification |
| (In millions) |
| |
Operating lease cost (1) |
| SG&A |
| $ | 21 |
|
Operating lease cost (1) |
| Cost of operations |
|
| 19 |
|
Finance lease cost |
|
|
|
|
|
|
Amortization of leased assets |
| Cost of operations |
|
| 2 |
|
Interest on lease liabilities |
| Interest expense, net |
|
| 1 |
|
Net lease cost |
|
|
| $ | 43 |
|
(1) | Includes short-term leases and immaterial variable lease costs. |
| 28 |
NOTES TO THE CONDENSED CONSOLIDATED FINANCIAL STATEMENTS (UNAUDITED)
Future minimum lease payments for our operating and finance lease obligations as of March 31, 2019 are as follows:
|
| Operating leases |
|
| Finance leases |
|
| Total |
| |||
|
| (In millions) |
| |||||||||
2019 |
| $ | 75 |
|
| $ | 10 |
|
| $ | 85 |
|
2020 |
|
| 85 |
|
|
| 12 |
|
|
| 97 |
|
2021 |
|
| 74 |
|
|
| 11 |
|
|
| 85 |
|
2022 |
|
| 67 |
|
|
| 11 |
|
|
| 78 |
|
2023 |
|
| 56 |
|
|
| 11 |
|
|
| 67 |
|
After 2023 |
|
| 332 |
|
|
| 44 |
|
|
| 376 |
|
Total lease payments |
|
| 689 |
|
|
| 99 |
|
|
| 788 |
|
Less: Interest |
|
| (270) |
|
|
| (27 | ) |
|
| (297 | ) |
Present value of lease liabilities |
| $ | 419 |
|
| $ | 72 |
|
| $ | 491 |
|
Lease term and discount rates for our operating and finance lease obligations are as follows:
Lease Term and Discount Rate | March 31, 2019 | |||
Weighted-average remaining lease term (years) | ||||
Operating leases | 8.8 | |||
Finance leases | 8.9 | |||
Weighted-average discount rate | ||||
Operating leases | 9.6 | % | ||
Finance leases | 8.9 | % | ||
Supplemental information for our operating and finance lease obligations are as follows:
Other information |
| March 31, 2019 |
| |
|
| (In millions) |
| |
Cash paid for amounts included in the measurement of lease liabilities |
|
|
|
|
Operating cash flows from operating leases |
| $ | (31 | ) |
Financing cash flows from finance leases |
|
| (2 | ) |
Leased assets obtained in exchange for new operating lease liabilities |
|
| 401 |
|
Leased assets obtained in exchange for new finance lease liabilities |
|
| - |
|
NOTE 13—PENSION AND POSTRETIREMENT BENEFITS
We sponsor various defined benefit pension plans covering eligible employees and provide specific postretirement benefits for eligible retired U.S. employees and their dependents through health care and life insurance benefit programs.
The following table provides contribution information for our Non-U.S. defined benefit pension plans and other postretirement plans at March 31, 2019:
|
| Non-U.S. Pension Plans |
|
| Other Postretirement Plans |
| ||
|
| (In millions) |
| |||||
Contributions made through March 31, 2019 |
| $ | 7 |
|
| $ | - |
|
Contributions expected for the remainder of 2019 |
|
| 7 |
|
|
| 2 |
|
Total contributions expected for 2019 |
| $ | 14 |
|
| $ | 2 |
|
| 29 |
NOTES TO THE CONDENSED CONSOLIDATED FINANCIAL STATEMENTS (UNAUDITED)
The following table provides a breakdown of the components of the net periodic benefit cost (income) associated with our defined benefit pension plans for the periods indicated:
|
| Three Months Ended March 31, |
| |||||
|
| 2019 (2) |
|
| 2018 (2) |
| ||
|
| (In millions) |
| |||||
U.S. pension plans: |
|
|
|
|
|
|
|
|
Service cost |
| $ | - |
|
| $ | - |
|
Interest cost |
|
| 5 |
|
|
| 4 |
|
Expected return on plan assets |
|
| (4 | ) |
|
| (5 | ) |
Amortization of prior service (credits) costs |
|
| - |
|
|
| - |
|
Net periodic benefit cost (income) (1) |
| $ | 1 |
|
| $ | (1 | ) |
|
|
|
|
|
|
|
|
|
Non-U.S. pension plans: |
|
|
|
|
|
|
|
|
Service cost |
| $ | 3 |
|
| $ | - |
|
Interest cost |
|
| 4 |
|
|
| - |
|
Expected return on plan assets |
|
| (6 | ) |
|
| - |
|
Amortization of prior service (credits) costs |
|
| - |
|
|
| - |
|
Net periodic benefit cost (income) (1) |
| $ | 1 |
|
| $ | - |
|
(1) | The components of net periodic benefit cost (income) other than the service cost component are included in Other non-operating (income) expense, net in our Statements of Operations. The service cost component is included in Cost of operations and SG&A, in our Statements of Operations, along with other compensation costs rendered by the participating employees. |
(2) | Net periodic benefit cost for our other postretirement plans is not material. |
We recognize mark-to-market fair value adjustments on defined benefit pension and other postretirement plans in Other non-operating (income) expense, net in our Consolidated Statements of Operations in the fourth quarter of each year.
NOTE 10—DERIVATIVE FINANCIAL INSTRUMENTS14—ACCRUED LIABILITIES
We enter into derivative
|
| March 31, 2019 |
|
| December 31, 2018 |
| ||
|
| (In millions) |
| |||||
Accrued contract costs |
| $ | 855 |
|
| $ | 796 |
|
Advances from equity method and proportionally consolidated joint ventures and consortiums (1) |
|
| 139 |
|
|
| 148 |
|
Income taxes payable |
|
| 45 |
|
|
| 69 |
|
Other accrued liabilities (2) |
|
| 655 |
|
|
| 551 |
|
Accrued liabilities |
| $ | 1,694 |
|
| $ | 1,564 |
|
(1) | Represents advances from the joint ventures and consortiums in which we participate. See Note 9, Joint Venture and Consortium Arrangements, for further discussion. |
(2) | Represents various accruals that are each individually less than 5% of total current liabilities. |
NOTE 15—FAIR VALUE MEASUREMENTS
Fair value of financial instruments primarily
Financial instruments are required to hedge certain firm purchase commitmentsbe categorized within a valuation hierarchy based upon the lowest level of input that is available and forecasted transactions denominatedsignificant to the fair value measurement. The three levels of the valuation hierarchy are as follows:
• | Level 1—inputs are based on quoted prices for identical instruments traded in active markets. |
• | Level 2—inputs are based on quoted prices for similar instruments in active markets, quoted prices for similar or identical instruments in inactive markets and model-based valuation techniques for which all significant assumptions are observable in the market or can be corroborated by observable market data for substantially the full term of the assets and liabilities. |
| 30 |
NOTES TO THE CONDENSED CONSOLIDATED FINANCIAL STATEMENTS (UNAUDITED)
• | Level 3—inputs are generally unobservable and typically reflect management’s estimates of assumptions that market participants would use in pricing the asset or liability. The fair values are therefore determined using model-based techniques that include option pricing models, discounted cash flow models and similar valuation techniques. |
The following table presents the fair value of our financial instruments as of March 31, 2019 and December 31, 2018 that are (1) measured and reported at fair value in foreign currencies. We record these contractsthe Financial Statements on a recurring basis and (2) not measured at fair value on a recurring basis in the Financial Statements:
|
| March 31, 2019 |
| |||||||||||||||||
|
| Carrying Amount |
|
| Fair Value |
|
| Level 1 |
|
| Level 2 |
|
| Level 3 |
| |||||
|
| (In millions) |
| |||||||||||||||||
Measured at fair value on recurring basis |
|
|
|
|
|
|
|
|
|
|
|
|
|
|
|
|
|
|
|
|
Forward contracts (1) |
| $ | (54 | ) |
|
| (54 | ) |
| $ | - |
|
| $ | (54 | ) |
| $ | - |
|
Not measured at fair value on recurring basis |
|
|
|
|
|
|
|
|
|
|
|
|
|
|
|
|
|
|
|
|
Debt and capital lease obligations (2) |
|
| (3,625 | ) |
|
| (3,321 | ) |
|
| - |
|
|
| (3,233 | ) |
|
| (88 | ) |
|
|
|
|
|
|
|
|
|
|
|
|
|
|
|
|
|
|
|
|
|
|
| December 31, 2018 |
| |||||||||||||||||
|
| Carrying Amount |
|
| Fair Value |
|
| Level 1 |
|
| Level 2 |
|
| Level 3 |
| |||||
|
| (In millions) |
| |||||||||||||||||
Measured at fair value on recurring basis |
|
|
|
|
|
|
|
|
|
|
|
|
|
|
|
|
|
|
|
|
Forward contracts (1) |
| $ | (39 | ) |
| $ | (39 | ) |
| $ | - |
|
| $ | (39 | ) |
| $ | - |
|
Not measured at fair value on recurring basis |
|
|
|
|
|
|
|
|
|
|
|
|
|
|
|
|
|
|
|
|
Debt and capital lease obligations (2) |
|
| (3,633 | ) |
|
| (3,287 | ) |
|
| - |
|
|
| (3,197 | ) |
|
| (90 | ) |
(1) | The fair value of forward contracts is classified as Level 2 within the fair value hierarchy and is valued using observable market parameters for similar instruments traded in active markets. Where quoted prices are not available, the income approach is used to value forward contracts. This approach discounts future cash flows based on current market expectations and credit risk. |
(2) | Our debt instruments are generally valued using a market approach based on quoted prices for similar instruments traded in active markets and are classified as Level 2 within the fair value hierarchy. Quoted prices were not available for the NO 105 construction financing, vendor equipment financing or capital leases. Therefore, these instruments were valued based on the present value of future cash flows discounted at estimated borrowing rates for similar debt instruments or on estimated prices based on current yields for debt issues of similar quality and terms and are classified as Level 3 within the fair value hierarchy. |
The carrying amounts that we have reported for our Consolidated Balance Sheets. Depending on the hedge designation at the inception of the contract, the related gainsother financial instruments, including cash and losses on these contracts are either: (1) deferred as a component of Accumulated Other Comprehensive Income (“AOCI”) until the hedged item is recognized in earnings; (2) offset against the change incash equivalents, restricted cash and cash equivalents, accounts receivable, accounts payable and revolving credit facility debt approximate their fair value of the hedged firm commitment through earnings; or (3) recognized immediately in earnings. At inception and on an ongoing basis, we assess the hedging relationship to determine its effectiveness in offsetting changes in cash flows or fair value attributablevalues due to the hedged risk. We exclude from our assessmentshort maturity of effectiveness the portion of the fair value of the forward contracts attributable to the difference between spot exchange rates and forward exchange rates. The ineffective portion of a derivative’s change in fair value and any portion excluded from the assessment of effectiveness are immediately recognized in earnings. Gains and losses on derivative financial instruments which are immediately recognized in earnings are included as a component of Other non-operating income (expense), net, in our Consolidated Statements of Operations.those instruments.
As of March 31, 2018, the majority of our foreign currency forward contracts were designated as cash flow hedging instruments. In addition, we deferred approximately $2 million of net losses on those derivative financial instruments in AOCI, and we expect to reclassify approximately $0.2 million of deferred losses out of AOCI by March 31, 2019, as hedged items are recognized in earnings.
NOTE 16—DERIVATIVE FINANCIAL INSTRUMENTS
Foreign Currency Exchange Rate Derivatives—The notional value of our outstanding foreign exchange rate derivative contracts totaled $199$887 million atas of March 31, 2018,2019, with maturities extending through June 2020.August 2022. These instruments consist of contracts to purchase or sell foreign-denominated currencies. As of March 31, 2018,2019, the fair value of these contracts was in a net assetliability position totaling approximately $1$10 million. The fair value of outstanding derivative instruments is determined using observable financial market inputs, such as quoted market prices, and is classified as Level 2 in nature.
As of March 31, 2019, we have approximately $14 million of unrealized net losses in AOCI in connection with foreign exchange rate derivatives designated as cash flow hedges, and we expect to reclassify approximately $6 million of deferred losses out of AOCI by March 31, 2020, as hedged items are recognized in earnings.
Interest Rate Derivatives—On May 8, 2018, we entered into a U.S. dollar interest rate swap arrangement to mitigate exposure associated with cash flow variability on the Term Facility in an aggregate notional value of $1.94 billion. The following tables summarize our derivative financial instruments:swap arrangement has been designated as a cash flow hedge as its critical terms matched those of the Term Facility at inception and through March 31, 2019. Accordingly, changes in the fair value of the swap arrangement are included in AOCI until the associated underlying exposure impacts
Asset and Liability Derivatives
|
|
|
|
|
|
|
|
|
|
| March 31, 2018 |
|
| December 31, 2017 |
| ||
|
| (in thousands) |
| |||||
Derivatives Designated as Hedges: |
|
|
|
|
|
|
|
|
Location: |
|
|
|
|
|
|
|
|
Accounts receivable-other |
| $ | 1,788 |
|
| $ | 2,232 |
|
Other assets |
|
| 56 |
|
|
| 66 |
|
Total derivatives asset |
| $ | 1,844 |
|
| $ | 2,298 |
|
|
|
|
|
|
|
|
|
|
Accounts payable |
| $ | 925 |
|
| $ | 618 |
|
Other liabilities |
|
| 8 |
|
|
| - |
|
Total derivatives liability |
| $ | 933 |
|
| $ | 618 |
|
|
|
|
NOTES TO THE CONDENSED CONSOLIDATED FINANCIAL STATEMENTS (UNAUDITED)
our interest expense. As of March 31, 2019, the fair value of the swap arrangement was in a net liability position totaling approximately $45 million. The fair value of outstanding derivative instruments is determined using observable financial market inputs, such as quoted market prices, and is classified as Level 2 in nature.
The EffectsAs of Derivative Instruments on our Financial Statements
|
| March 31, |
| |||||
|
| 2018 |
|
| 2017 |
| ||
|
| (in thousands) |
| |||||
Derivatives Designated as Hedges: |
|
|
|
|
|
|
|
|
Amount of gain (loss) recognized in other comprehensive income (loss) |
| $ | 481 |
|
| $ | 5,602 |
|
Gain reclassified from AOCI to Cost of operations |
|
| (238 | ) |
|
| (3,515 | ) |
Ineffective portion and amount excluded from effectiveness testing: gain (loss) recognized in Other non-operating income (expense) |
|
| 310 |
|
|
| 305 |
|
NOTE 11—FAIR VALUE MEASUREMENTSMarch 31, 2019, in connection with the interest rate swap arrangement, we have approximately $45 million of unrealized net losses in AOCI, and we expect to reclassify approximately $8 million of deferred losses out of AOCI by March 31, 2020, as the hedged items are recognized in earnings.
The following table presents the financial instruments outstanding as of March 31, 2018 and December 31, 2017 that are measured attotal fair value on a recurring basisof the derivatives by underlying risk and financial instruments that are not measured at fair value on a recurring basis.balance sheet classification:
|
| March 31, 2018 |
|
|
|
|
|
|
|
|
|
|
|
|
| |||||
|
| Carrying Amount |
|
| Fair Value |
|
| Level 1 |
|
| Level 2 |
|
| Level 3 |
| |||||
|
| (in thousands) |
| |||||||||||||||||
Recurring |
|
|
|
|
|
|
|
|
|
|
|
|
|
|
|
|
|
|
|
|
Forward contracts |
| $ | 911 |
|
| $ | 911 |
|
| $ | - |
|
| $ | 911 |
|
| $ | - |
|
Financial instruments not measured at fair value |
|
|
|
|
|
|
|
|
|
|
|
|
|
|
|
|
|
|
|
|
Debt |
|
| (537,258 | ) |
|
| (552,651 | ) |
|
| - |
|
|
| (510,460 | ) |
|
| (42,191 | ) |
|
|
|
|
|
|
|
|
|
|
|
|
|
|
|
|
|
|
|
|
|
|
| December 31, 2017 |
|
|
|
|
|
|
|
|
|
|
|
|
| |||||
|
| Carrying Amount |
|
| Fair Value |
|
| Level 1 |
|
| Level 2 |
|
| Level 3 |
| |||||
|
| (in thousands) |
| |||||||||||||||||
Recurring |
|
|
|
|
|
|
|
|
|
|
|
|
|
|
|
|
|
|
|
|
Forward contracts |
| $ | 1,680 |
|
| $ | 1,680 |
|
| $ | - |
|
| $ | 1,680 |
|
| $ | - |
|
Financial instruments not measured at fair value |
|
|
|
|
|
|
|
|
|
|
|
|
|
|
|
|
|
|
|
|
Debt |
|
| (536,977 | ) |
|
| (558,077 | ) |
|
| - |
|
|
| (515,735 | ) |
|
| (42,342 | ) |
|
| March 31, 2019 |
|
| December 31, 2018 |
| ||||||||||
|
| Derivatives designated as cash flow hedges |
|
| Derivatives not designated as cash flow hedges |
|
| Derivatives designated as cash flow hedges |
|
| Derivatives not designated as cash flow hedges |
| ||||
|
| (In millions) |
| |||||||||||||
Other current assets |
| $ | 3 |
|
| $ | 3 |
|
| $ | 3 |
|
| $ | 3 |
|
Other non-current assets |
|
| 1 |
|
|
| - |
|
|
| - |
|
|
| - |
|
Total derivatives asset |
| $ | 4 |
|
| $ | 3 |
|
| $ | 3 |
|
| $ | 3 |
|
|
|
|
|
|
|
|
|
|
|
|
|
|
|
|
|
|
Accrued liabilities |
| $ | 17 |
|
| $ | 2 |
|
| $ | 10 |
|
| $ | 3 |
|
Other non-current liabilities |
|
| 42 |
|
|
| - |
|
|
| 32 |
|
|
| - |
|
Total derivatives liability |
| $ | 59 |
|
| $ | 2 |
|
| $ | 42 |
|
| $ | 3 |
|
The carryingfollowing table presents the total value, of all non-derivative financial instruments includedby underlying risk, recognized in current assets (including cash, cash equivalentsother comprehensive income and restricted cash and accounts receivable) and current liabilities (including accounts payable but excluding short-term debt) approximates the applicable fair value duereclassified from AOCI to the short maturityStatements of those instruments.Operations, in connection with derivatives:
We used
|
| Three months ended March 31, |
| |||||||
|
| 2019 |
|
|
|
| 2018 |
| ||
|
| (In millions) |
| |||||||
Amount of gain (loss) recognized in other comprehensive income (loss) |
|
|
|
|
|
|
|
|
|
|
Foreign exchange hedges |
| $ | (7 | ) |
|
|
| $ | 1 |
|
Interest rate hedges |
|
| (15 | ) |
|
|
|
| - |
|
Loss recognized on derivatives designated as cash flow hedges |
|
|
|
|
|
|
|
|
|
|
Foreign exchange hedges |
|
|
|
|
|
|
|
|
|
|
Revenue |
|
| 1 |
|
|
|
|
| - |
|
Cost of operations |
|
| 1 |
|
|
|
|
| - |
|
Interest rate hedges |
|
|
|
|
|
|
|
|
|
|
Interest expense |
|
| 1 |
|
|
|
|
| - |
|
Gain recognized on derivatives not designated as cash flow hedges |
|
|
|
|
|
|
|
|
|
|
Foreign exchange hedges |
|
|
|
|
|
|
|
|
|
|
Revenue |
|
| 1 |
|
|
|
|
| - |
|
NOTE 17—INCOME TAXES
During the following methods and assumptions in estimating our fair value disclosures for our other financial instruments:
Short-term and long-term debt—The fair valuethree months ended March 31, 2019, we recognized an income tax benefit of debt instruments valued using a market approach based on quoted prices for similar instruments traded in active markets is classified as Level 2 within the fair value hierarchy.
Quoted prices were not available$21 million (effective tax rate of 26.9%), compared to tax expense of $21 million (effective tax rate of 38.2%) for the NO 105 construction financing, vendor equipment financing or capital leases. The income approach was used to value these instruments based on the present value of future cash flows discounted at estimated borrowing rates for similar debt instruments or on estimated prices based on current yields for debt issues of similar quality and terms and are classified as Level 3 within the fair value hierarchy.
|
|
NOTES TO THE CONSOLIDATED FINANCIAL STATEMENTS (UNAUDITED)
Forward contracts—The fair value of forward contracts is classified as Level 2 within the fair value hierarchy and is valued using observable market parameters for similar instruments traded in active markets. Where quoted prices are not available, the income approach is used to value forward contracts, which discounts future cash flows based on current market expectations and credit risk.
NOTE 12—INCOME TAXESthree months ended March 31, 2018.
Our effective income tax rateprovision for the first quarter 2019 benefitted from the settlement of 2018 was 35.4% compared with 27.7% for the first quarter 2017. The increase in the provision for income taxes was primarily driven by increased income in the quarter coupled with losses in certain jurisdictions where we did not recognize a customer claim ($18 million) and a favorable court ruling on tax benefit. The increase was partiallymatters ($16 million) offset by income in favorable tax jurisdictions.nondeductible, state and other expenses ($30 million).
ForPrior to the three-month period ended March 31, 2018, the Company is utilizingCombination, we used the discrete-period method to compute itsour interim tax provision, due to significant variations in the relationship between income tax expense and pre-tax accounting income or loss; consequently,loss. Consequently, the actual effective rate forwas reported during the interim period is being reported.first quarter 2018. The discrete-period method is applied when the application of the estimated annual effective tax rate is
| 32 |
NOTES TO THE CONDENSED CONSOLIDATED FINANCIAL STATEMENTS (UNAUDITED)
impractical, because it is not possible to reliably estimate the annual effective tax rate.
DuePrior to the impact of ongoingCombination, CB&I used the estimated annual effective tax lossesrate approach to calculate its interim tax provision related to ordinary income. Beginning in the U.S. andthird quarter of 2018, we began utilizing an estimated annual effective tax rate approach on a combined company basis.
During the corresponding valuation allowance onfirst quarter of 2019, our U.S. net deferredunrecognized tax asset position,benefits decreased $16 million, due to the new provisions from U.S. tax reform enactedfavorable court ruling referenced above. We do not anticipate significant changes to this balance in December 2017 and taking effect in 2018 are not expected to have a material impact on our 2018 tax position.the next 12 months.
NOTE 13—18—STOCKHOLDERS’ EQUITY AND EQUITY-BASED INCENTIVE PLANS
Shares Outstanding and Treasury Shares―The changes in the number of shares outstanding and treasury shares held by the Companyus are as follows:follows (in millions):
|
| Three Months Ended March 31, |
|
| Three Months Ended March 31, |
| ||||||||||
|
| 2018 |
|
| 2017 |
|
| 2019 |
|
| 2018 |
| ||||
Shares outstanding |
|
|
|
|
|
|
|
|
|
|
|
|
|
|
|
|
Beginning balance |
|
| 284,026,820 |
|
|
| 241,388,277 |
|
|
| 181 |
|
|
| 95 |
|
Common stock issued |
|
| 2,740,096 |
|
|
| 2,586,578 |
|
|
| 2 |
|
|
| 1 |
|
Purchase of common stock |
|
| (867,203 | ) |
|
| (933,060 | ) |
|
| (1 | ) |
|
| - |
|
Ending balance |
|
| 285,899,713 |
|
|
| 243,041,795 |
|
|
| 182 |
|
|
| 95 |
|
|
|
|
|
|
|
|
|
|
|
|
|
|
|
|
|
|
Shares held as Treasury shares |
|
|
|
|
|
|
|
|
|
|
|
|
|
|
|
|
Beginning balance |
|
| 8,499,021 |
|
|
| 8,302,004 |
|
|
| 3 |
|
|
| 3 |
|
Purchase of common stock |
|
| 867,203 |
|
|
| 933,060 |
|
|
| 1 |
|
|
| - |
|
Retirement of common stock |
|
| (858,682 | ) |
|
| (787,267 | ) |
|
| (1 | ) |
|
| - |
|
Ending balance |
|
| 8,507,542 |
|
|
| 8,447,797 |
|
|
| 3 |
|
|
| 3 |
|
|
|
|
|
|
|
|
|
|
|
|
|
|
|
|
|
|
Ordinary shares issued at the end of the period |
|
| 294,407,255 |
|
|
| 251,489,592 |
|
|
| 184 |
|
|
| 98 |
|
(1) | Amounts in this table may not sum due to rounding. |
Combination—As discussed in Note 3, Business Combination, we issued 84.5 million shares of McDermott common stock to the former CB&I shareholders. Additionally, effective as of the Combination Date, unvested and unexercised stock-settled equity-based awards (which included 2.1 million of CB&I restricted stock units and stock options to purchase 0.1 million shares of CB&I’s common stock) were canceled and converted into comparable McDermott stock-settled awards with generally the same terms and conditions as those prior to the Combination Date. The restricted stock units generally vest over a period ranging from three to four years from the original grant date.
Stock-Based Compensation Expense―During the three months ended March 31, 2019 and 2018, we recognized $6 million and $3 million, respectively, of stock-based compensation expense, primarily within SG&A in our Statements of Operations. In addition, during the three month ended March 31, 2019 and 2018, we recognized $2 million and $4 million, respectively, of compensation expense associated with awards classified as liability awards as of the end of those respective periods.
Accumulated Other Comprehensive (Loss) Income (Loss)—the―The components of AOCI included in stockholders’ equity are as follows:
|
|
|
| |||||||||||||
|
| March 31, 2018 |
|
| December 31, 2017 |
|
| March 31, 2019 |
|
| December 31, 2018 |
| ||||
|
| (in thousands) |
|
| (In millions) |
| ||||||||||
Foreign currency translation adjustments ("CTA") |
| $ | (49,621 | ) |
| $ | (49,025 | ) |
| $ | (112 | ) |
| $ | (73 | ) |
Net unrealized gain on investments |
|
| 400 |
|
|
| 393 |
| ||||||||
Net unrealized loss on derivative financial instruments |
|
| (1,586 | ) |
|
| (1,816 | ) |
|
| (59 | ) |
|
| (40 | ) |
Defined benefit pension and other postretirement plans |
|
| 6 |
|
|
| 6 |
| ||||||||
Accumulated other comprehensive loss |
| $ | (50,807 | ) |
| $ | (50,448 | ) |
| $ | (165 | ) |
| $ | (107 | ) |
|
|
|
NOTES TO THE CONDENSED CONSOLIDATED FINANCIAL STATEMENTS (UNAUDITED)
The following table presents the components of AOCI and the amounts that were reclassified during the periods indicated:
|
| Foreign currency translation adjustments |
|
| Unrealized holding gain (loss) on investments |
|
| Gain (loss) on derivative (1) |
|
| TOTAL |
| ||||
|
| (In thousands) |
| |||||||||||||
Balance, January 1, 2017 |
| $ | (42,082 | ) |
| $ | 269 |
|
| $ | (25,082 | ) |
| $ | (66,895 | ) |
Other comprehensive income before reclassification |
|
| 239 |
|
|
| 19 |
|
|
| 5,602 |
|
|
| 5,860 |
|
Amounts reclassified from AOCI |
|
| - |
|
|
| - |
|
|
| (3,449 | ) | (2) |
| (3,449 | ) |
Net current period other comprehensive income |
|
| 239 |
|
|
| 19 |
|
|
| 2,153 |
|
|
| 2,411 |
|
Balance, March 31, 2017 |
| $ | (41,843 | ) |
| $ | 288 |
|
| $ | (22,929 | ) |
| $ | (64,484 | ) |
|
|
|
|
|
|
|
|
|
|
|
|
|
|
|
|
|
Balance, January 1, 2018 |
| $ | (49,025 | ) |
| $ | 393 |
|
| $ | (1,816 | ) |
| $ | (50,448 | ) |
Other comprehensive income before reclassification |
|
| (596 | ) |
|
| 7 |
|
|
| 481 |
|
|
| (108 | ) |
Amounts reclassified from AOCI |
|
| - |
|
|
| - |
|
|
| (251 | ) | (2) |
| (251 | ) |
Net current period other comprehensive income |
|
| (596 | ) |
|
| 7 |
|
|
| 230 |
|
|
| (359 | ) |
Balance, March 31, 2018 |
| $ | (49,621 | ) |
| $ | 400 |
|
| $ | (1,586 | ) |
| $ | (50,807 | ) |
|
| Foreign currency translation adjustments |
|
| Net unrealized loss on derivative financial instruments (1) |
|
| Defined benefit pension and other postretirement plans |
|
| TOTAL |
| ||||
|
| (In millions) |
| |||||||||||||
December 31, 2017 |
| $ | (49 | ) |
| $ | (1 | ) |
| $ | - |
|
| $ | (50 | ) |
Other comprehensive income before reclassification |
|
| (1 | ) |
|
| - |
|
|
| - |
|
|
| (1 | ) |
Amounts reclassified from AOCI (2) |
|
| - |
|
|
| - |
|
|
| - |
|
|
| - |
|
Net current period other comprehensive income |
|
| (1 | ) |
|
| - |
|
|
| - |
|
|
| - |
|
March 31, 2018 |
| $ | (50 | ) |
| $ | (1 | ) |
| $ | - |
|
| $ | (51 | ) |
|
|
|
|
|
|
|
|
|
|
|
|
|
|
|
|
|
December 31, 2018 |
|
| (73 | ) |
|
| (40 | ) |
|
| 6 |
|
|
| (107 | ) |
Other comprehensive income before reclassification |
|
| (39 | ) |
|
| (22 | ) |
|
| - |
|
|
| (61 | ) |
Amounts reclassified from AOCI (2) |
|
| - |
|
|
| 3 |
|
|
| - |
|
|
| 3 |
|
Net current period other comprehensive income |
|
| (39 | ) |
|
| (19 | ) |
|
| - |
|
|
| (58 | ) |
March 31, 2019 |
| $ | (112 | ) |
| $ | (59 | ) |
| $ | 6 |
|
| $ | (165 | ) |
(1) | Refer to Note |
(2) |
|
Noncontrolling Interest―In 2002, P.T. Sarana Interfab Mandiri (“PTSIM”) acquired a 25% participating interest in our subsidiary, PT McDermott Indonesia (“PTMI”). After two years, PTSIM had the option to sell its interest to us for $5 million plus PTSIM’s share of PTMI undistributed earnings to the date of such sale. In January 2019, McDermott and PTSIM entered into framework agreement, restructuring the PTMI shareholders agreement, whereby PTSIM waived its put option right and exchanged its participating interest in PTMI to a non-participating interest in exchange for a payment of approximately $29 million, payable in three installments during 2019. During the three months ended March 31, 2019, we paid approximately $5 million and have a remaining liability of approximately $24 million.
NOTE 19—REDEEMABLE PREFERRED STOCK
On November 29, 2018 (the “Closing Date”), we completed a private placement of (1) 300,000 shares of 12% Redeemable Preferred Stock, par value $1.00 per share (the “Redeemable Preferred Stock”), and (2) Series A warrants (the “Warrants”) to purchase approximately 6.8 million shares of our common stock, with an initial exercise price per share of $0.01, for aggregate proceeds of $289.5 million, before payment of approximately $18 million of directly related issuance costs.
Redeemable Preferred Stock—The Redeemable Preferred Stock will initially have an Accreted Value (as defined in the Certificate of Designation with respect to the Redeemable Preferred Stock (the “Certificate of Designation”)) of $1,000.00 per share. The holders of the Redeemable Preferred Stock will be entitled to receive cumulative compounding preferred cash dividends quarterly in arrears at a fixed rate of 12.0% per annum compounded quarterly (of which 3.0% accrues each quarter) on the Accreted Value per share (the “Dividend Rate”). The cash dividends are payable only when, as and if declared by our Board of Directors out of funds legally available for payment of dividends. If a cash dividend is not declared and paid in respect of any dividend payment period ending on or prior to December 31, 2021, then the Accreted Value of each outstanding share of Redeemable Preferred Stock will automatically be increased by the amount of the dividend otherwise payable for such dividend payment period, except the applicable dividend rate for this purpose is 13.0% per annum. Such automatic increase in the Accreted Value of each outstanding share of Redeemable Preferred Stock would be in full satisfaction of the preferred dividend that would have otherwise accrued for such dividend payment period. Our Board of Directors declared, and we paid cash dividends on the Redeemable Preferred Stock on the first dividend payment date (December 31, 2018), but our Board of Directors did not declare cash dividends on the Redeemable Preferred Stock on the March 31, 2019 dividend payment date and, as a result, the Accreted Value of the Redeemable Preferred Stock was increased by the amount ofthe accrued but unpaid dividend (i.e., a paid-in-kind (“PIK”) dividend).
| 34 |
NOTES TO THE CONDENSED CONSOLIDATED FINANCIAL STATEMENTS (UNAUDITED)
The Redeemable Preferred Stock has no stated maturity and will remain outstanding indefinitely unless repurchased or redeemed by us.
The Redeemable Preferred Stock will have a liquidation preference equal to the then applicable Minimum Return (the “Liquidation Preference”) plus accrued and unpaid dividends. The Liquidation Preference will initially be equal to $1,200.00 per share. The “Minimum Return” is equal to a multiple of invested capital (“MOIC”) (as defined in the Certificate of Designation) as follows, exclusive of cash dividends previously paid:
• | prior to | ||
• | on or after January 1, 2020 but prior to January 1, 2022, a MOIC multiple of 1.25; | ||
• | on or after January 1, 2022 but prior to January 1, 2023, a MOIC multiple of 1.20; | ||
• | on or after January 1, 2023 but prior to January 1, 2025, a MOIC multiple of 1.15; and | ||
• | on or after January 1, 2025, a MOIC multiple of 1.20. |
We may redeem the Redeemable Preferred Stock at any time for an amount per share of Redeemable Preferred Stock equal to the Liquidation Preference of each such share plus all accrued dividends on such share (such amount per share, the “Redemption Consideration”).
At any time after the seventh anniversary of the Closing Date, each holder may elect to have us fully redeem such holder’s then outstanding Redeemable Preferred Stock in cash, to the extent we have funds legally available for payment of dividends, at a redemption price per share equal to the Redemption Consideration for each share.
Upon a change of control (as defined in the Certificate of Designation), if we have not previously redeemed the Redeemable Preferred Stock and the holders of a majority of the then-outstanding Redeemable Preferred Stock do not agree with us to an alternative treatment, then in connection with such change of control, each holder may elect either: (1) to cause us to redeem all, but not less than all, of its outstanding Redeemable Preferred Stock at a redemption price per share equal to the Redemption Consideration, which would be payable in full in cash or, if any of the Senior Notes are then outstanding, payable partially in cash in an amount equal to 101% of the Share Purchase Price (as defined in the Certificate of Designation) (or such lower amount as may be required under the Senior Notes Indenture) and the remainder in shares of our common stock based on a per share price equal to 96% of the volume-weighted average price of our common stock on the New York Stock Exchange during the 10 trading days prior to the announcement of such change of control; (2) to receive a substantially equivalent security to the Redeemable Preferred Stock in the surviving entity of the change of control; or (3) to continue to hold the Redeemable Preferred Stock if we are the surviving entity in the change of control. However, any such redemption in cash will be tolled until a date that will not result in the Redeemable Preferred Stock being characterized as “disqualified stock,” “disqualified equity interest” or a similar concept under our debt instruments.
The fair value upon issuance represented the net impact of $289.5 million of aggregate proceeds, less $18 million of fees and $43 million of fair value assigned to the warrants described below (separately included within Capital in excess of par value in our Balance Sheet). The fair value measurement upon issuance was based on inputs that were not observable in the market and thus represented level 3 inputs. We will record accretion as an adjustment to Retained earnings (deficit) over the seven years from the Closing Date through the expected redemption date of November 29, 2025 using the effective interest method. Through March 31, 2019, we recorded cumulative accretion of approximately $5 million with respect to the Redeemable Preferred Stock, including approximately $4 million during the three months ended March 31, 2019. As of March 31, 2019, the Redeemable Preferred Stock balance was $243 million, adjusted for accretion and the PIK dividend of approximately $10 million. During 2018, approximately $3 million of cash dividends were paid to the holders of the Redeemable Preferred Stock.
Warrants—The Warrants are exercisable at any time after the earlier of (1) any change of control or the commencement of proceedings for the voluntary or involuntary dissolution, liquidation or winding up of us and (2) the first anniversary of the Closing Date, and from time to time, in whole or in part, until the tenth anniversary of the Closing Date. The fair value measurement of the Warrants was based on the market-observable fair value of our common stock upon issuance and thus represented a level 1 input.
| 35 |
NOTES TO THE CONDENSED CONSOLIDATED FINANCIAL STATEMENTS (UNAUDITED)
The exercise price and the number of shares of common stock for which a Warrant is exercisable are subject to adjustment from time to time upon the occurrence of certain events including: (1) payment of a dividend or distribution to holders of shares of our common stock payable in common stock, (2) the distribution of any rights, options or warrants to all holders of our common stock entitling them for a period of not more than 60 days to purchase shares of common stock at a price per share less than the fair market value per share, (3) a subdivision, combination, or reclassification of our common stock, (4) a distribution to all holders of our common stock of cash, any shares of our capital stock (other than our common stock), evidences of indebtedness or other assets of ours, and (5) any dividend of shares of a subsidiary of ours in a spin-off transaction.
NOTE 14—20—EARNINGS PER SHARE
The following table sets forth the computation of basic and diluted earnings per common share: share.
|
| Three Months Ended March 31, |
| |||||
|
| 2018 |
|
| 2017 |
| ||
|
| (in thousands, except share and per share amounts) |
| |||||
Net income attributable to McDermott |
| $ | 35,189 |
|
| $ | 21,916 |
|
|
|
|
|
|
|
|
|
|
Weighted average common stock (basic) |
|
| 284,658,938 |
|
|
| 241,829,988 |
|
Effect of dilutive securities: |
|
|
|
|
|
|
|
|
Tangible equity units |
|
| - |
|
|
| 38,000,936 |
|
Stock options, restricted stock and restricted stock units |
|
| 391,586 |
|
|
| 2,454,671 |
|
Potential dilutive common stock |
|
| 285,050,524 |
|
|
| 282,285,595 |
|
|
|
|
|
|
|
|
|
|
Net income per share attributable to McDermott |
|
|
|
|
|
|
|
|
Basic: |
| $ | 0.12 |
|
| $ | 0.09 |
|
Diluted: |
| $ | 0.12 |
|
| $ | 0.08 |
|
|
| Three Months Ended March 31, |
| |||||
|
| 2019 (1) |
|
| 2018 (2) |
| ||
|
| (In millions, except per share amounts) |
| |||||
Net (loss) income attributable to McDermott |
| $ | (56 | ) |
| $ | 35 |
|
Dividends on redeemable preferred stock |
|
| (10 | ) |
|
| - |
|
Accretion of redeemable preferred stock |
|
| (4 | ) |
|
| - |
|
Net (loss) income attributable to common stockholders |
| $ | (70 | ) |
| $ | 35 |
|
|
|
|
|
|
|
|
|
|
Weighted average common stock (basic) |
|
| 181 |
|
|
| 95 |
|
Effect of dilutive securities: |
|
|
|
|
|
|
|
|
Stock-based awards |
|
| - |
|
|
| - |
|
Warrants and preferred stock |
|
| - |
|
|
| - |
|
Weighted average common stock (diluted) |
|
| 181 |
|
|
| 95 |
|
|
|
|
|
|
|
|
|
|
Net (loss) income per share attributable to common stockholders |
|
|
|
|
|
|
|
|
Basic: |
| $ | (0.39 | ) |
| $ | 0.37 |
|
Diluted: |
| $ | (0.39 | ) |
| $ | 0.37 |
|
Approximately 1 million and 2 million shares underlying outstanding stock-based awards for the three months ended March 31, 2018 and 2017, respectively, were excluded from the computation of diluted earnings per share during those periods because the exercise price of those awards was greater than the average market price of our common stock, and the inclusion of such shares would have been antidilutive.
|
|
(2) | Approximately 0.4 million shares underlying outstanding stock-based awards for the three months ended March 31, 2018 were excluded from the computation of diluted earnings per share during the period because the exercise price of those awards was greater than the average market price of our common stock, and the inclusion of such shares would have been antidilutive in each of those years. |
NOTES TO THE CONSOLIDATED FINANCIAL STATEMENTS (UNAUDITED)
NOTE 15—COMMITMENTS21—COMMITMENTS AND CONTINGENCIES
Investigations and Litigation
Combination Related LawsuitsGeneral—In January, February and March 2018, five shareholders of CB&I filed separate lawsuits under the federal securities laws in the United States District Court for the Southern District of Texas challenging the accuracy of the disclosures made in the registration statement we and a subsidiary of CB&I filed in connection with the Combination (the “Registration Statement”). The cases are captioned (1) McIntyre v. Chicago Bridge & Iron Company N.V., et al., Case No. 4:18-cv-00273 (S.D. Tex.) (the “McIntyre Action”); (2) The George Leon Family Trust v. Chicago Bridge & Iron Company N.V., et al., Case No. 4:18-cv-00314 (S.D. Tex.) (the “Leon Action”); (3) Maresh v. Chicago Bridge & Iron Company N.V., et al., Case No. 4:18-cv-00498 (S.D. Tex.) (the “Maresh Action”); (4) Patel v.Chicago Bridge & Iron Co. N.V., et al., Case No. 4:18-cv-00550 (S.D. Tex.) (the “Patel Action”); and (5) Judd v. Chicago Bridge& Iron Co. N.V., et. al., Case No. 4:18-cv-00799 (S.D. Tex.) (the “Judd Action”). The McIntyre Action, Leon Action, Maresh Action and Judd Action are asserted on behalf of putative classes of CB&I’s public shareholders, while the Patel Action is brought only on behalf of the named plaintiff.
All five actions allege violations of Section 14(a) and 20(a) of the Securities Exchange Act of 1934 and Rule 14a-9 promulgated thereunder based on various alleged omissions of material information from the Registration Statement. The McIntyre Action names as defendants CB&I, each of CB&I’s directors, individually, and certain current and former CB&I officers and employees individually. It seeks to enjoin the Combination, an award of costs and attorneys’ and expert fees, and damages. On February 7, 2018, the plaintiff in the McIntyre Action filed a motion for preliminary injunction seeking to enjoin CB&I from consummating the Combination. The Leon Action names as defendants CB&I, certain subsidiaries of CB&I and McDermott that are parties to the Business Combination Agreement, each of CB&I’s directors, individually, and McDermott as an alleged control person of CB&I. The Leon Action seeks to enjoin the Combination (or, in the alternative, rescission or an award for rescissory damages in the event the Combination is completed), to compel CB&I to issue revised disclosure, and an award of costs and attorneys’ and expert fees. The Maresh Action, which was originally filed in Delaware and voluntarily dismissed without prejudice on February 13, 2018, was re-filed in Texas and names as defendants CB&I and each of CB&I’s directors, individually. Although originally filed as an individual action, the Maresh Action was refiled as a putative class action in an amended complaint filed on February 26, 2018. The Maresh Action seeks to enjoin the Combination (or, in the alternative, an award for rescissory damages in the event the Combination is completed) and an award of costs and attorneys’ and expert fees. The Patel Action names as defendants CB&I and each of CB&I’s directors, individually. The Patel Action seeks to enjoin the Combination (or, in the alternative, an award for rescissory damages in the event the Combination is completed) and an award of costs and attorneys’ and expert fees. The Judd Action names as defendants CB&I and each of CB&I’s directors individually. The Judd Action seeks to enjoin the Combination (or, in the alternative, an award for rescissory damages in the event the Combination is completed) and an award of costs and attorneys’ and expert fees.
On February 23, 2018, CB&I moved for consolidation of the four then-pending shareholder actions, an order requiring plaintiffs and their counsel to coordinate their efforts, and for appointment of a preliminary lead plaintiff and lead counsel in the putative class actions. On February 26, 2018, the plaintiff in the Maresh Action moved for consolidation of the four then-pending shareholder actions and for appointment of Maresh as interim lead plaintiff and the law firm of Levi & Korsinsky LLP as lead counsel. On March 1, 2018, that motion was withdrawn. On February 28, 2018, the plaintiff in the Leon Action also moved for consolidation of the four then-pending shareholder actions and for appointment of Leon as interim lead plaintiff and the law firm of Rigrodsky & Long, P.A. as lead counsel. On March 2, 2018, the Court consolidated the four then-pending actions (all but the Judd Action) and granted the Leon Action plaintiff’s motion as to interim lead plaintiff and lead counsel. On March 9, 2018, the lead plaintiff filed a consolidated amended complaint.
On March 15, 2018, after the Judd Action was filed, the defendants moved for that case to be consolidated with the other cases. On March 16, 2018, that motion was granted.
On March 16, 2018, the defendants moved to dismiss the consolidated amended complaint and the interim lead plaintiff filed a motion for a preliminary injunction. On March 29, 2018, the interim lead plaintiff withdrew its motion for a preliminary injunction. Motions for permanent lead plaintiff status were due on April 2, 2018, and only the interim lead plaintiff filed such a motion. On April 5, 2018, the interim lead plaintiff sought an extension of time to respond to defendants’ motion to dismiss until after such time as a permanent lead plaintiff is appointed. That motion was granted. We believe the substantive allegations contained in the complaints are without merit, and we intend to defend against the claims made against us vigorously.
|
|
NOTES TO THE CONSOLIDATED FINANCIAL STATEMENTS (UNAUDITED)
FloaTEC Investigation—We co-own interests in several entities (collectively “FloaTEC”) with subsidiaries of Keppel Corporation (including its subsidiaries, “Keppel”). We have conducted an internal investigation in connection with allegations by a former Petrobras employee that Keppel’s agent made improper payments to secure project awards from Petrobras on a number of Keppel affiliated projects in Brazil, including a FloaTEC project on which we were also a subcontractor. Keppel’s agent subsequently entered into a plea arrangement with the Brazilian authorities and admitted to having made improper payments on behalf of Keppel to former Petrobras employees on projects unrelated to FloaTEC. In August 2016, we voluntarily contacted the U.S. Department of Justice (“DOJ”) to advise it of the preliminary results of our internal investigation, which identified no evidence to indicate any improper payments were made by us or FloaTEC or that any of our or FloaTEC’s employees authorized, had knowledge of, or direction or control over, any such payments. During the period from August 2016 through January 2017, we responded to requests for additional information from the DOJ. In December 2017, Keppel entered into a deferred prosecution agreement with the DOJ and the U.S. Attorney’s Office for the U.S. District Court for the Eastern District of New York in connection with charges that Keppel had conspired to violate the anti-bribery provisions of the Foreign Corrupt Practices Act. The DOJ has not been in contact with us since January 2017 regarding this matter. If in the future, the DOJ determines that violations of applicable law have occurred involving us, we could be subject to civil or criminal sanctions, including monetary penalties, which could be material. However, based on the results of our investigation, we do not expect this matter to have a material adverse effect on us or our operations.
Additionally, dueDue to the nature of our business, we and our affiliates are, from time to time, involved in litigation or subject to disputes, governmental investigations or claims related to our business activities, including, among other things:
performance or warranty-related matters under our customer and supplier contracts and other business arrangements; and
• | performance or warranty-related matters under our customer and supplier contracts and other business arrangements; and |
workers’ compensation claims, Jones Act claims, occupational hazard claims, including asbestos-exposure claims, premises liability claims and other claims.
• | workers’ compensation claims, Jones Act claims, occupational hazard claims, premises liability claims and other claims. |
Based upon our prior experience, we do not expect that any of these other litigation proceedings, disputes, investigations and claims will have a material adverse effect on our consolidated financial condition, results of operations or cash flows; however, because of the inherent uncertainty of litigation and other dispute resolution proceedings and, in some cases, the availability and amount of potentially applicable insurance, we can provide no assurance the resolution of any particular claim or proceeding to which we are a party will not have a material effect on our consolidated financial condition, results of operations or cash flows for the fiscal period in which that resolution occurs.
| 36 |
NOTES TO THE CONDENSED CONSOLIDATED FINANCIAL STATEMENTS (UNAUDITED)
Project Arbitration Matters—We are in arbitration (governed by the arbitration rules of the International Chamber of Commerce) entitled Refineria de Cartagena S.A. v. Chicago Bridge & Iron Company N.V., et al., which was commenced on March 8, 2016 in connection with a large, cost reimbursable refinery construction project in Colombia completed by CB&I in 2015. Refineria de Cartagena, the customer on the project, is alleging that we are responsible for certain cost overruns, delays and consequential damages on the project. The customer is claiming total damages in excess of $4.5 billion. We have asserted a counterclaim against the customer for approximately $250 million. The parties are currently preparing witness statements, expert reports and other filings that are scheduled to be submitted to the tribunal on a date to be determined, but which is expected to be in early to mid-summer 2019. Hearings are scheduled to take place between April and June 2020. The venue for the arbitration hearings is New York, New York. We do not believe a risk of material loss is probable related to this matter, and accordingly, our reserves for this matter were not significant as of March 31, 2019. While it is possible that a loss may be incurred, we are unable to estimate the range of potential loss, if any.
In addition, we are in arbitration (governed by the arbitration rules of the United Nations Commission on International Trade Law) entitled CBI Constructors Pty & Kentz Pty Ltd and Chevron Australia Pty Ltd., which was commenced on or about May 17, 2017, with the customer for one of CB&I’s previously completed consolidated joint venture projects, regarding differing interpretations of the contract related to reimbursable billings. The matter has been bifurcated, with hearings on entitlement held in November 2018 and hearings on the amount of damages scheduled for September 2019. In December 2018, the tribunal issued an interim award on entitlement, finding that the joint venture was not overpaid for its craft labor but that certain overpayments were made to the joint venture for its staff. As a result, we and our joint venture counterparty are asserting claims against the customer of approximately $103 million for certain unpaid invoices and other set-offs, and the customer is asserting that it has overpaid the joint venture by $189 million, less the amounts owed to the joint venture. Accordingly, as of March 31, 2019, we have established a reserve of approximately $55 million in the acquired balance sheet from the Combination, which equates to $85 million at the joint venture level.
Dispute Related to Sale of Nuclear Operations—On December 31, 2015, we sold our Nuclear Operations to Westinghouse Electric Company LLC (“WEC”). In connection with the transaction, a post-closing purchase price adjustment mechanism was negotiated between CB&I and WEC to account for any difference between target working capital and actual working capital as finally determined pursuant to the terms of the purchase agreement. On April 28, 2016, WEC delivered to us a purported closing statement that estimated closing working capital was negative $976.5 million, which was $2.1 billion less than the target working capital amount. In contrast, we calculated closing working capital to be $1.6 billion, which was $427.8 million greater than the target working capital amount. On July 21, 2016, we filed a complaint against WEC in the Court of Chancery in the State of Delaware seeking a declaration that WEC has no remedy for the vast majority of its claims, and we requested an injunction barring WEC from bringing such claims. On December 2, 2016, the Court of Chancery granted WEC’s motion for judgment on the pleadings and dismissed our complaint, stating that the dispute should follow the dispute resolution process set forth in the purchase agreement, which includes the use of an independent auditor to resolve the working capital dispute. We appealed that ruling to the Delaware Supreme Court. Due to WEC’s bankruptcy filing on March 29, 2017, all claim resolution proceedings were automatically stayed pursuant to the Bankruptcy Code. At the parties’ request, the Bankruptcy Court lifted the automatic stay to permit the appeal and dispute resolution process to continue. Oral argument before the Delaware Supreme Court was held on May 3, 2017, and on June 27, 2017, the Delaware Supreme Court overturned the decision of the Court of Chancery and instructed the Court of Chancery to issue an order enjoining WEC from submitting certain claims to the independent auditor. The parties have discussed those matters still subject to the dispute resolution process and the selection of a new independent auditor to replace the previous auditor, who had resigned. We do not believe a risk of material loss is probable related to this matter, and, accordingly, no amounts have been accrued as of March 31, 2019. While it is possible that a loss may be incurred, we are unable to estimate the range of potential loss, if any. We believe the Delaware Supreme Court ruling significantly improved our position on this matter and intend to continue pursuing our rights under the purchase agreement.
Asbestos Litigation—We are a defendant in numerous lawsuits wherein plaintiffs allege exposure to asbestos at various locations. We review and defend each case on its own merits and make accruals based on the probability of loss and best estimates of potential loss. We do not believe any unresolved asserted claim will have a material adverse effect on our future results of operations, financial position or cash flow. With respect to unasserted asbestos claims, we cannot identify a population of potential claimants with sufficient certainty to determine the probability of loss or estimate future losses. We do not believe a risk of material loss is probable related to these matters, and, accordingly, our reserves were not significant as of March 31, 2019. While we continue to pursue recovery for recognized and unrecognized contingent losses through insurance, indemnification arrangements and other sources, we are unable to quantify the amount that we may recover because of the variability in coverage amounts, limitations and deductibles or the viability of carriers, with respect to our insurance policies for the years in question.
| 37 |
NOTES TO THE CONDENSED CONSOLIDATED FINANCIAL STATEMENTS (UNAUDITED)
Mercury Litigation—Certain of our subsidiaries are co-defendants in a group of consolidated “toxic exposure” claims, involving 54 plaintiffs who allege that they were exposed to mercury while working in a chlorine manufacturing facility located in Muscle Shoals, Alabama. The matter was commenced on December 14, 2011 and is captioned Aretha Abernathy, et al. v. Occidental Chemical Corp., et al., CV 11-900266, Circuit Court of Colbert County, Alabama. The plaintiffs consist of former employees of subsidiaries of CB&I, as well as other defendants. No trial date has been set. We do not believe a risk of material loss is probable related to this matter, and accordingly, our reserves were not significant as of March 31, 2019. While it is possible that a loss may be incurred (absent insurance coverage), we are unable at this time, to estimate the range of potential loss, if any. Further, we believe we are entitled to coverage under various insurance policies, though certain carriers have issued letters reserving their rights to contest their obligations to indemnify us. Discussions between us and the carriers continue over coverage for these matters.
In addition, under the terms of certain insurance policies, additional deductible amounts may be due upon a resolution of these matters, either by settlement or judgment. We do not believe a risk of material loss is probable for additional deductible amounts due upon resolution of these matters, and accordingly, our reserves for this matter were not significant as of March 31, 2019.
Labor Litigation—A former employee of one of our subsidiaries commenced a class action lawsuit under the Fair Labor Standards ACT (“FLSA”) entitled Cantrell v. Lutech Resources, Inc., (S.D. Texas 2017) Case No. 4:17-CV-2679 on or about September 5, 2017, alleging that he and his fellow class members were not paid one and one half times their normal hourly wage rates for hours worked that exceeded 40 hours in a work week. Our subsidiary has yet to answer the allegations in the complaint, as agreed by the parties, in order to allow mediation to take place. The first mediation session commenced in October 2018 and is ongoing. We do not believe a risk of material loss is probable related to this matter, and, accordingly, our reserves for this matter were not significant as of March 31, 2019. While it is possible that a loss may be incurred, we are unable at this time, to estimate the range of potential loss, if any.
Pre-Combination CB&I Securities Litigations—On March 2, 2017, a complaint was filed in the United States District Court for the Southern District of New York seeking class action status on behalf of purchasers of CB&I common stock and alleging damages on their behalf arising from alleged false and misleading statements made during the class period from October 30, 2013 to June 23, 2015. The case is captioned: In re Chicago Bridge & Iron Company N.V. Securities Litigation, No. 1:17-cv-01580-LGS (the “Securities Litigation”). The defendants in the case are: CB&I; a former chief executive officer of CB&I; a former chief financial officer of CB&I; and a former controller and chief accounting officer of CB&I. On June 14, 2017, the court named ALSAR Partnership Ltd. as lead plaintiff. On August 14, 2017, a consolidated amended complaint was filed alleging violations of Sections 10(b) and 20(a) of the Exchange Act and Rule 10b-5 thereunder, arising out of alleged misrepresentations about CB&I’s accounting for the acquisition of The Shaw Group, CB&I’s accounting with respect to the two nuclear projects being constructed by The Shaw Group, and CB&I’s financial reporting and public statements with respect to those two projects. On May 24, 2018, the court denied defendants’ motion to dismiss and the parties are currently engaged in the discovery process. On February 4, 2019, lead plaintiff ALSAR Partnership Ltd. and additional plaintiffs Iron Workers Local 40, 361, & 417 – Union Security Funds and Iron Workers Local 580 – Joint Funds moved for class certification and appointment as class representatives. That motion remains pending. We are not able at this time to determine the likelihood of loss, if any, arising from this matter and, accordingly, no amounts have been accrued as of March 31, 2019. We believe the claims are without merit and intend to defend against them vigorously.
On October 26, 2018, two actions were filed by individual plaintiffs based on allegations similar to those alleged in the Securities Litigation. On February 25, 2019, a third action was filed by an individual plaintiff based on similar allegations. All three actions were filed in the United States District Court for the Southern District of New York and are captioned Gotham Diversified Neutral Master Fund, LP, et al. v. Chicago Bridge & Iron Company N.V. et al., Case No. 1:18-cv-09927 (the “Gotham Action”); Appaloosa Investment L.P., et al., v. Chicago Bridge & Iron Company N.V., et al., Case No. 1:18-cv-09928 (the “Appaloosa Action”) and CB Litigation Recovery I, LLC v. Chicago Bridge & Iron Company N.V., et al., Case No. 1:19-cv-01750 (the “CB Litigation Recovery Action”). Besides CB&I, the other defendants in all three cases are the same individual defendants as in the Securities Litigation described above. Plaintiffs assert causes of action based on alleged violations of Sections 10(b), 18 and 20(a) of the Exchange Act and Rule 10b-5 thereunder, along with common law causes of action. On January 25, 2019, the defendants filed in the Gotham and Appaloosa Actions partial motions to dismiss the causes of actions asserted under Section 18 of the Exchange Act and the common law causes of action, which are currently pending. On March 25, 2019, the court entered a stipulation and order staying the CB Recovery Action pending a ruling on the partial motions to dismiss in the Gotham and Appaloosa Actions and making the decision on the partial motions to dismiss the Gotham and Appaloosa Actions applicable to the CB Recovery Action. We are not able at this time to determine the likelihood of loss, if any, arising from these matters and, accordingly, no amounts have been accrued as of March 31, 2019. We believe the claims are without merit and intend to defend against them vigorously.
| 38 |
NOTES TO THE CONDENSED CONSOLIDATED FINANCIAL STATEMENTS (UNAUDITED)
On or about November 2, 2017, a complaint was filed in the District Court of Montgomery County, Texas by Daniel Cohen and associated individuals and corporations, alleging causes of action under both common and state law for alleged false and misleading statements related to CB&I’s acquisition of The Shaw Group in 2013, particularly with regard to two nuclear projects being constructed by Shaw in South Carolina and Georgia. The case is captioned Daniel Cohen, et al. v. Chicago Bridge & Iron Company, N.V., et al., No. 17-10-12820. The other defendants are the same individual defendants as in the Securities Litigation described above. The plaintiffs alleged that the individual defendants made, or had authority over the content and method of communicating information to the public, including the alleged misstatements and omissions detailed in the complaint, resulting in a financial loss on shares of stock purchased by the plaintiffs. Discovery in this matter is proceeding. We are not able at this time to determine the likelihood of loss, if any, arising from this matter and, accordingly, no amounts have been accrued as of March 31, 2019. We believe the claims are without merit and intend to defend against them vigorously.
Trade Secrets Dispute—We were in litigation in a matter entitled TechnipFMC plc v. Mukherjee, et al., Cause No. 2018-53084, 164th Judicial District, Harris County, Texas, which was commenced on August 9, 2018. The plaintiff alleges that one of our executive officers misappropriated certain confidential information and trade secrets when he left the plaintiff’s employ for employment with McDermott. The plaintiff also asserts claims for lost profits or, in the alternative, the disgorgement of profits that we may earn under certain contracts which the plaintiff claims would not have been awarded to us but for the use of such confidential information and trade secrets, along with other damages. The court issued orders prohibiting the use of any such information in our possession or the possession of the executive officer, requiring the return of all such documents to the plaintiff and requiring compliance with other terms of the order. McDermott and its executive officer fully complied. The parties settled this matter through a Confidential Settlement Agreement and Mutual Release entered into on April 26, 2019.
Post-Combination McDermott Securities Litigation—On November 15, 2018, a complaint was filed in the United States District Court for the Southern District of Texas seeking class action status on behalf of purchasers of McDermott common stock and alleging damages on their behalf arising from allegedly false and misleading statements made during the class period from January 24, 2018 to October 30, 2018. The case is captioned: Edwards v. McDermott International, Inc., et al., No. 4:18-cv-04330. The defendants in the case are: McDermott; David Dickson, our president and chief executive officer; and Stuart Spence, our chief financial officer. The plaintiff has alleged that the defendants made material misrepresentations and omissions about the integration of the CB&I business, certain CB&I projects and their fair values, and our business, prospects and operations. The plaintiff asserts claims under Sections 10(b) and 20(a) of the Exchange Act and Rule 10b-5 thereunder. On January 14, 2019, a related action was filed in the United States District Court for the Southern District of Texas seeking class action status on behalf of all shareholders of McDermott common stock as of April 4, 2018 who had the right to vote on the Combination, captioned: The Public Employees Retirement System of Mississippi v. McDermott International, Inc., et al., No. 4:19-cv-00135. The plaintiff has alleged the defendants (which include our chief executive officer and chief financial officer) made material misrepresentations and omissions in the proxy statement we used in connection with the Combination. The plaintiff asserted claims under Section 14(a) and 20(a) of the Exchange Act. We filed a motion to consolidate the two actions, and the court granted that motion on February 22, 2019. The court has not yet appointed a lead plaintiff for either set of claims. We expect to file motions to dismiss all of the claims. We are not able at this time to determine the likelihood of loss, if any, arising from these matters and, accordingly, no amounts have been accrued as of March 31, 2019. We believe the claims are without merit and we intend to defend against them vigorously.
On March 1, 2019 and March 4, 2019, two essentially identical class action lawsuits were filed in the Harris County (Texas) District Court alleging violations of Sections 11, 12 and 15 of the Securities Act of 1933 on behalf of CB&I shareholders who acquired McDermott common stock pursuant or traceable to the Registration Statement on Form S-4 and the related Prospectus we issued in connection with the Combination. These actions are captioned Curti v. McDermott International, Inc., et al., Case No. 2019-15780 and Stremcha v. McDermott International, Inc., et al., Case No. 2019-15473. The defendants, besides McDermott International, Inc., include present officers of McDermott and current and past members of McDermott’s board of directors. We are not able at this time to determine the likelihood of loss, if any, arising from these matters and, accordingly, no amounts have been accrued as of March 31, 2019. We believe the claims are without merit and we intend to defend against them vigorously.
Environmental Matters
We have been identified as a potentially responsible party at various cleanup sites under the Comprehensive Environmental Response, Compensation, and Liability Act of 1980, as amended (“CERCLA”). CERCLA and other environmental laws can impose liability for the entire cost of cleanup on any of the potentially responsible parties, regardless of fault or the lawfulness of the original conduct.
In connection with the historical operation of our facilities, including those associated with acquired operations, substances which currently are or might be considered hazardous were used or disposed of at some sites that will or may require us to make
| 39 |
NOTES TO THE CONDENSED CONSOLIDATED FINANCIAL STATEMENTS (UNAUDITED)
expenditures for remediation. In addition, we have agreed to indemnify parties from whom we have purchased or to whom we have sold facilities for certain environmental liabilities arising from acts occurring before the dates those facilities were transferred. Generally, however, where there are multiple responsible parties, a final allocation of costs is made based on the amount and type of wastes disposed of by each party and the number of financially viable parties, although this may not be the case with respect to any particular site. We have not been determined to be a major contributor of waste to any of these sites. On the basis of our relative contribution of waste to each site, we expect our share of the ultimate liability for the various sites will not have a material adverse effect on our consolidated financial condition, results of operations or cash flows in any given year.
We believe we are in compliance, in all material respects, with applicable environmental laws and regulations and maintain insurance coverage to mitigate our exposure to environmental liabilities. We do not anticipate we will incur material capital expenditures for environmental matters or for the investigation or remediation of environmental conditions during the remainder of 2019 and 2020. As of March 31, 2018,2019, we had no environmental reserve recorded.
Asset Retirement Obligations (“ARO”)
At some sites,On March 26, 2019, we are contractually obligatedsigned an agreement to decommission ourenter into a long-term land lease agreement with Saudi Aramco to establish a fabrication facilities upon site exit. Currently, we are unable to estimate any asset retirement obligations (“AROs”) due toand maritime facility located in Ras Al-Khair, Saudi Arabia. In connection with the indeterminate lifecontemplated lease, the closure of our current fabrication facilities. We regularly review the optimal future alternatives for our facilities. Any decisionfacility in Dubai, United Arab Emirates, is expected to retire one or more facilities will resultoccur in recording the present value2030. ARO recorded as of such obligations.
AROs would be recorded atMarch 31, 2019 was equal to the present value of the estimated costs to retiredecommission the asset at the time the obligation is incurred. As of March 31, 2018, we had no AROs recorded.
|
|
NOTES TO THE CONSOLIDATED FINANCIAL STATEMENTS (UNAUDITED)current fabrication facility and was not material.
Contracts Containing Liquidated Damages Provisions
Some of our contracts contain provisions that require us to pay liquidated damages if we are responsible for the failure to meet specified contractual milestone dates and the applicable customer asserts a claim under those provisions. Those contracts define the conditions under which our customers may make claims against us for liquidated damages. In many cases in which we have historically had potential exposure for liquidated damages, such damages ultimately were not asserted by our customers. As of March 31, 2018,2019, we determined that we had under $1approximately $241 million of potential liquidated damages exposure, based on performance under contracts to date, and no liability is recordedincluded $166 million as a reduction in our Consolidated Financial Statementstransaction prices related to such exposure. We believe we will be successful in obtaining schedule extensions or other customer-agreed changes that should resolve the potential for thesethe liquidated damages.damages where we have not made a reduction in transaction prices. However, we may not achieve relief on some or all of the issues involved and, as a result, could be subject to liquidated damages being imposed on us in the future.
We disclose the results of each of our reportable segments in accordance with ASC 280, Segment Reporting. Each of the reportable segments is separately managed by a senior executive who is a member of our Executive Committee (“EXCOM”). Our EXCOM is led by our Chief Executive Officer, who is the chief operating decision maker.maker (“CODM”). Discrete financial information is available for each of the segments, and the EXCOM uses the operating results of each of the reportable segments for performance evaluation and resource allocation.
We manage reportable segments along geographic lines consistingUpon completion of (1) AEA, (2) MEAthe Combination, during the second quarter of 2018, we reorganized our operations around five operating segments. This reorganization is intended to better serve our global clients, leverage our workforce, help streamline operations, and (3) ASA.provide enhanced growth opportunities. Our five operating groups are: NCSA; EARC; MENA; APAC; and Technology. The segment information presented for three months ended March 31, 2018 has been recast to conform to the current presentation. We also report certain corporate and other non-operating activities under the heading “Corporate and Other.”
Corporate and Other primarily reflects corporate expenses, certain centrally managed initiatives (such as restructuring charges), impairments, year-end mark-to-market (“MTM”) pension actuarial gains and losses, costs not attributable to a particular reportable segment and unallocated direct operating expenses associated with the underutilization of vessels, fabrication facilities and engineering resources.
|
|
|
NOTES TO THE CONDENSED CONSOLIDATED FINANCIAL STATEMENTS (UNAUDITED)
Summarized financial information is shown inIntersegment sales are recorded at prices we generally establish by reference to similar transactions with unaffiliated customers and were not material during the following tables: three months ended March 31, 2019 or 2018 and are eliminated upon consolidation.
Operating Information by Segment
|
| Three Months Ended March 31, |
| |||||
|
| 2018 |
|
| 2017 |
| ||
|
| (in thousands) |
| |||||
Revenues: |
|
|
|
|
|
|
|
|
AEA |
| $ | 113,304 |
|
| $ | 28,131 |
|
MEA |
|
| 345,123 |
|
|
| 310,052 |
|
ASA |
|
| 149,391 |
|
|
| 181,248 |
|
Total revenues: |
| $ | 607,818 |
|
| $ | 519,431 |
|
|
|
|
|
|
|
|
|
|
Income before provision for income taxes: |
|
|
|
|
|
|
|
|
Operating income: |
|
|
|
|
|
|
|
|
AEA |
| $ | 53 |
|
| $ | 183 |
|
MEA |
|
| 69,183 |
|
|
| 64,377 |
|
ASA |
|
| 75,349 |
|
|
| 29,775 |
|
Segment operating income |
|
| 144,585 |
|
|
| 94,335 |
|
Corporate and Other(1) |
|
| (76,146 | ) |
|
| (38,296 | ) |
Total operating income |
|
| 68,439 |
|
|
| 56,039 |
|
Interest expense, net |
|
| (11,608 | ) |
|
| (17,706 | ) |
Other non-operating income, net |
|
| 1,719 |
|
|
| 560 |
|
Income before provision for income taxes |
| $ | 58,550 |
|
| $ | 38,893 |
|
|
|
|
|
|
|
|
|
|
Capital expenditures:(2) |
|
|
|
|
|
|
|
|
AEA |
| $ | 2,524 |
|
| $ | 5,251 |
|
MEA |
|
| 3,295 |
|
|
| 5,852 |
|
ASA |
|
| 3,039 |
|
|
| 3,512 |
|
Corporate and Other(3) |
|
| 9,528 |
|
|
| 48,234 |
|
Total capital expenditures: |
| $ | 18,386 |
|
| $ | 62,849 |
|
|
|
|
|
|
|
|
|
|
Depreciation and amortization:(4) |
|
|
|
|
|
|
|
|
AEA |
| $ | 7,302 |
|
| $ | 4,013 |
|
MEA |
|
| 6,248 |
|
|
| 7,903 |
|
ASA |
|
| 7,426 |
|
|
| 7,575 |
|
Corporate and Other |
|
| 1,800 |
|
|
| 1,890 |
|
Total depreciation and amortization: |
| $ | 22,776 |
|
| $ | 21,381 |
|
|
| Three Months Ended March 31, |
| |||||
|
| 2019 |
|
| 2018 |
| ||
|
| (In millions) |
| |||||
Revenues: |
|
|
|
|
|
|
|
|
NCSA |
| $ | 1,380 |
|
| $ | 98 |
|
EARC |
|
| 148 |
|
|
| 16 |
|
MENA |
|
| 380 |
|
|
| 345 |
|
APAC |
|
| 155 |
|
|
| 149 |
|
Technology |
|
| 148 |
|
|
| - |
|
Total revenues |
| $ | 2,211 |
|
| $ | 608 |
|
|
|
|
|
|
|
|
|
|
Operating (loss) income: |
|
|
|
|
|
|
|
|
Segment operating income: |
|
|
|
|
|
|
|
|
NCSA |
| $ | 73 |
|
| $ | 2 |
|
EARC |
|
| 7 |
|
|
| (3 | ) |
MENA |
|
| 66 |
|
|
| 70 |
|
APAC |
|
| 13 |
|
|
| 73 |
|
Technology |
|
| 35 |
|
|
| - |
|
Total segment operating income |
|
| 194 |
|
|
| 142 |
|
Corporate (1) |
|
| (181 | ) |
|
| (77 | ) |
Total operating income |
| $ | 13 |
|
| $ | 65 |
|
|
|
|
|
|
|
|
|
|
Depreciation and amortization: |
|
|
|
|
|
|
|
|
NCSA |
| $ | 17 |
|
| $ | 7 |
|
EARC |
|
| 4 |
|
|
| - |
|
MENA |
|
| 12 |
|
|
| 6 |
|
APAC |
|
| 5 |
|
|
| 7 |
|
Technology |
|
| 19 |
|
|
| - |
|
Corporate |
|
| 19 |
|
|
| 3 |
|
Total depreciation and amortization |
| $ | 76 |
|
| $ | 23 |
|
|
|
|
|
|
|
|
|
|
Capital expenditures (2): |
|
|
|
|
|
|
|
|
NCSA |
| $ | 3 |
|
| $ | 2 |
|
EARC |
|
| - |
|
|
| - |
|
MENA |
|
| 4 |
|
|
| 3 |
|
APAC |
|
| 5 |
|
|
| 3 |
|
Technology |
|
| - |
|
|
| - |
|
Corporate |
|
| 6 |
|
|
| 10 |
|
Total Capital expenditures |
| $ | 18 |
|
| $ | 18 |
|
(1) Corporate and Other operating results for the first quarter of 2018 and 2017 include approximately $14 million in restructuring costs and transaction costs related to the Combination and a $3 million gain on sale of assets, respectively.
|
|
|
NOTES TO THE CONDENSED CONSOLIDATED FINANCIAL STATEMENTS (UNAUDITED)
(2) Liabilities associated with assets acquired during the first quarter of 2018 and 2017 were $10 million and $9 million, respectively.
(3) Corporate and other capital expenditures in the first quarter of 2017 include the purchase of the Amazon, a pipelay and construction vessel. Following the purchase, we sold this vessel to an unrelated party and simultaneously entered into an 11-year bareboat charter agreement.
(4) Depreciation and amortization expense associated with our marine vessels is included in the respective segments in which the vessels were located as of the reporting date.Assets by Segment
|
| March 31, 2018 |
|
| December 31, 2017 |
| ||
|
| (in thousands) |
| |||||
Segment assets: |
|
|
|
|
|
|
|
|
AEA |
| $ | 960,102 |
|
| $ | 921,171 |
|
MEA |
|
| 955,054 |
|
|
| 1,020,599 |
|
ASA |
|
| 923,226 |
|
|
| 887,209 |
|
Corporate and Other |
|
| 362,266 |
|
|
| 393,841 |
|
Total assets |
| $ | 3,200,648 |
|
| $ | 3,222,820 |
|
|
| Three Months Ended March 31, |
| |||||
|
| March 31, 2019 |
|
| December 31, 2018 |
| ||
|
| (In millions) |
| |||||
Segment assets: |
|
|
|
|
|
|
|
|
NCSA |
| $ | 3,596 |
|
| $ | 3,257 |
|
EARC |
|
| 1,221 |
|
|
| 1,169 |
|
MENA |
|
| 1,565 |
|
|
| 1,472 |
|
APAC |
|
| 1,198 |
|
|
| 1,147 |
|
Technology |
|
| 2,757 |
|
|
| 2,752 |
|
Corporate (3) |
|
| (308 | ) |
|
| (357 | ) |
Total assets |
| $ | 10,029 |
|
| $ | 9,440 |
|
(1) Our marine vessels are included in the area in which they were located as of the reporting date.
Our revenue by service lines and contract types was as follows:
|
| Three Months Ended March 31, |
| |||||
|
| 2018 |
|
| 2017 |
| ||
|
| (in thousands) |
| |||||
Service line revenues: |
|
|
|
|
|
|
|
|
Offshore |
| $ | 394,724 |
|
| $ | 354,064 |
|
Subsea and other |
|
| 213,094 |
|
|
| 165,367 |
|
|
| $ | 607,818 |
|
| $ | 519,431 |
|
|
|
|
|
|
|
|
|
|
Contract types |
|
|
|
|
|
|
|
|
Fixed-price |
| $ | 582,592 |
|
| $ | 475,921 |
|
Unit-basis and other |
|
| 25,226 |
|
|
| 43,510 |
|
|
| $ | 607,818 |
|
| $ | 519,431 |
|
(1) | Corporate operating results for the three months ended March 31, 2019 include $69 million and $4 million of restructuring and integration costs and transaction costs, respectively. Corporate operating results for the three months ended March 31, 2018 include $12 million and $3 million of restructuring and integration costs and transaction costs, respectively. See Note 10, Restructuring and Integration Costs and Transaction Costs, for further discussion. |
(2) | Capital expenditures reported represent cash purchases. At March 31, 2019 and 2018, we had approximately $19 million and $10 million, respectively, of accrued and unpaid capital expenditures reported in PP&E and accrued liabilities. |
(3) | Corporate assets at March 31, 2019 and December 31, 2018 include negative cash balances associated with our international cash pooling program. |
|
|
|
MANAGEMENT’S DISCUSSION AND ANALYSIS OF FINANCIAL CONDITION AND RESULTS OF OPERATIONS
Item 2. MANAGEMENT’S DISCUSSION AND ANALYSIS OF FINANCIAL CONDITION AND RESULTS OF OPERATIONSManagement’s Discussion and Analysis of Financial Condition and Results of Operations
In this quarterly report on Form 10-Q, unless the context otherwise indicates, “McDermott,” “MDR,” “we,” “our,” “us” and “our”or the “Company” mean McDermott International, Inc. and its consolidated subsidiaries.
CAUTIONARY STATEMENT CONCERNING FORWARD-LOOKING STATEMENTS
We are including the following discussion to inform our existing and potential security holders generally of some of the risks and uncertainties that can affect our company and to take advantage of the “safe harbor” protection for forward-looking statements that applicable federal securities law affords. This information should be read in conjunction with the unaudited Consolidated Financial Statements and the Notes thereto included in Item 1 of this report and the audited Consolidated Financial Statements and the related Notes and Item 7 “Management’s Discussion and Analysis of Financial Condition and Results of Operations” included in our Annual Report on Form 10-K for the year ended December 31, 20172018 filed with the U.S. Securities and Exchange Commission (the “SEC”) on February 21, 201825, 2019 (the “2017“2018 Form 10-K”).
From time to time, our management or persons acting on our behalf make forward-looking“forward-looking statements,” within the meaning of the Private Securities Litigation Reform Act of 1995, to inform existing and potential security holders about our company. These statements may include projections and estimates concerning the scope, execution, timing and success of specific projects and our future backlog,remaining performance obligations (“RPOs”), revenues, income and capital spending. Forward-looking statements are generally accompanied by words such as “achieve,” “anticipate,” “believe,” “continue,” “could,” “estimate,” “expect,” “forecast,” “goal,” “intend,” “may,” “might,” “plan,” “potential,” “predict,” “project,” “predict,” “forecast,” “believe,” “expect,” “anticipate,” “plan,” “seek,” “goal,“should,” “could,” “may,” or “should”“strategy” or other words that convey the uncertainty of future events or outcomes. Sometimes we will specifically describe a statement as being a forward-looking statement and refer to this cautionary statement.
In addition, various statements in this report, including those that express a belief, expectation or intention, as well as those that are not statements of historical fact, are forward-looking statements. Those forward-looking statements appear in the Notes to our Condensed Consolidated Financial Statements (the “Financial Statements”) in Item 1 of this report, in this Management’s Discussion and Analysis of Financial Condition and Results of Operations, Legal Proceedings in Item 1 of Part II of this report and elsewhere in this report.
These forward-looking statements include, but are not limited to, statements that relate to, or statements that are subject to risks, contingencies or uncertainties that relate to:
expectations regarding the pending business combination with Chicago Bridge & Iron Company N.V. (“CB&I”) described in Note 2 to the Consolidated Financial Statements included in this report (the “Combination”) and the anticipated benefits of combining CB&I’s business with our business;
future levels of revenues, operating margins, income from operations, cash flows, net income or earnings per share;
the outcome of project awards and scope, execution and timing of specific projects, including timing to complete and cost to complete these projects;
future project activities, including the commencement and subsequent timing of marine or installation campaigns on specific projects, and the ability of projects to generate sufficient revenues to cover our fixed costs;
estimates of percentage of completion and contract profits or losses;
anticipated levels of demand for our products and services;
global demand for oil and gas and fundamentals of the oil and gas industry;
expectations regarding offshore development of oil and gas;
market outlook for the engineering, procurement, construction and installation (“EPCI”) market;
expectations regarding cash flows from operating activities;
expectations regarding backlog;
future levels of capital, environmental or maintenance expenditures;
• | expectations regarding our business combination with CB&I described in Note 3, Business Combination, to the accompanying Financial Statements, and the anticipated benefits of combining CB&I’s business with McDermott’s business; |
|
| future levels of revenues, operating margins, operating income, cash flows, net income or earnings per share; |
• | the outcome of project awards and scope, execution and timing of specific projects, including timing to complete and cost to complete these projects; |
• | future project activities, including the commencement and subsequent timing of, and the success of, operational activities on specific projects, and the ability of projects to generate sufficient revenues to cover our fixed costs; |
• | estimates of revenue over time and contract profits or losses; |
• | expectations regarding the acquisition or divestiture of assets, including expectations regarding the sales of our industrial storage tanks and U.S. pipe fabrication businesses and the timing of, and use of proceeds from, those transactions; |
• | anticipated levels of demand for our products and services; |
• | global demand for oil and gas and fundamentals of the oil and gas industry; |
• | expectations regarding offshore development of oil and gas; |
• | market outlook for the EPCI market; |
• | expectations regarding cash flows from operating activities; |
| 43 |
|
MANAGEMENT’S DISCUSSION AND ANALYSIS OF FINANCIAL CONDITION AND RESULTS OF OPERATIONS
• | future levels of capital, environmental or maintenance expenditures; |
• | the success or timing of completion of ongoing or anticipated capital or maintenance projects; |
the adequacy of our sources of liquidity and capital resources, including for the financing arrangements contemplated by the Commitment Letters (as defined herein) to enable us to complete the Combination;
• | the adequacy of our sources of liquidity and capital resources; |
interest expense;
• | interest expense; |
the effectiveness of our derivative contracts in mitigating foreign currency risk;
• | the effectiveness of our derivative contracts in mitigating foreign currency and interest rate risks; |
results of our capital investment program;
• | results of our capital investment program; |
expectations regarding the acquisition or divestiture of assets;
• | the impact of U.S. and non-U.S. tax law changes; |
the impact of U.S. tax reform on our tax position;
• | the potential effects of judicial or other proceedings on our business, financial condition, results of operations and cash flows; and |
the possibility of establishing our parent company’s tax residence in the United Kingdom;
the potential effects of judicial or other proceedings on our business, financial condition, results of operations and cash flows; and
the anticipated effects of actions of third parties such as competitors, or regulatory authorities, or plaintiffs in litigation.
• | the anticipated effects of actions of third parties such as competitors, or federal, foreign, state or local regulatory authorities, or plaintiffs in litigation. |
These forward-looking statements speak only as of the date of this report; we disclaim any obligation to update these statements unless required by securities law, and we caution you not to rely on them unduly. We have based these forward-looking statements on our current expectations and assumptions about future events. While our management considers these expectations and assumptions to be reasonable, they are inherently subject to significant business, economic, competitive, regulatory and other risks, contingencies and uncertainties, most of which are difficult to predict and many of which are beyond our control. These risks, contingencies and uncertainties relate to, among other matters, the following:
general economic and business conditions and industry trends;
general developments in the industries in which we are involved;
volatility of oil and gas prices;
decisions about offshore developments to be made by oil and gas companies;
the highly competitive nature of our industry;
our ability to appropriately bid, estimate and effectively perform projects on time, in accordance with the schedules established by the applicable contracts with customers;
changes in project design or schedule;
changes in scope or timing of work to be completed under contracts;
cancellations of contracts, change orders and other modifications and related adjustments to backlog and the resulting impact from using backlog as an indicator of future revenues or earnings;
the collectability of amounts reflected in change orders and claims relating to work previously performed on contracts;
the capital investment required to construct new-build vessels and maintain and/or upgrade our existing fleet of vessels;
the ability of our suppliers and subcontractors to deliver raw materials in sufficient quantities and/or perform in a timely manner;
volatility and uncertainty of the credit markets;
our ability to comply with covenants in our credit agreement, indentures and other debt instruments and availability, terms and deployment of capital;
the unfunded liabilities of our pension plans, which may negatively impact our liquidity and, depending upon future operations, may impact our ability to fund our pension obligations;
• | general economic and business conditions and industry trends; |
|
| general developments in the industries in which we are involved; |
• | the volatility of oil and gas prices; |
• | decisions about capital investment to be made by oil and gas companies and other participants in the energy and natural resource industries, demand from which is the largest component of our revenues; |
• | other factors affecting future levels of demand, including investments across the natural gas value chain, including LNG and petrochemicals, investments in power and petrochemical facilities and investments in various types of facilities that require storage structures and pre-fabricated pipe; |
• | the highly competitive nature of the businesses in which we are engaged; |
• | uncertainties as to timing and funding of new contract awards; |
• | our ability to appropriately bid, estimate and effectively perform projects on time, in accordance with the schedules established by the applicable contracts with customers; |
• | changes in project design or schedule; |
• | changes in scope or timing of work to be completed under contracts; |
• | cost overruns on fixed-price or similar contracts or failure to receive timely or proper payments on cost-reimbursable contracts, whether as a result of improper estimates, performance, disputes or otherwise; |
• | changes in the costs or availability of, or delivery schedule for, equipment, components, materials, labor or subcontractors; |
• | risks associated with labor productivity; |
• | cancellations of contracts, change orders and other modifications and related adjustments to RPOs and the resulting impact from using RPOs as an indicator of future revenues or earnings; |
• | the collectability of amounts reflected in change orders and claims relating to work previously performed on contracts; |
| 44 |
|
MANAGEMENT’S DISCUSSION AND ANALYSIS OF FINANCIAL CONDITION AND RESULTS OF OPERATIONS
| • | our ability to settle or negotiate unapproved change orders and claims and estimates regarding liquidated damages; |
• | the capital investment required to construct new-build vessels and maintain and/or upgrade our existing fleet of vessels; |
• | the ability of our suppliers and subcontractors to deliver raw materials in sufficient quantities and/or perform in a timely manner; |
• | volatility and uncertainty of the credit markets; |
• | our ability to comply with covenants in our credit agreements and other debt instruments and the availability, terms and deployment of capital; |
• | the unfunded liabilities of our pension and other post-retirement plans, which may negatively impact our liquidity and, depending upon future operations, may impact our ability to fund our pension obligations; |
• | the continued availability of qualified personnel; |
the operating risks normally incident to our lines of business, including the potential impact of liquidated damages;
• | the operating risks normally incident to our lines of business, which could lead to increased costs and affect the quality, costs or availability of, or delivery schedule for, equipment, components, materials, labor or subcontractors and give rise to contractually imposed liquidated damages; |
natural or man-caused disruptive events that could damage our facilities, equipment or our work-in-progress and cause us to incur losses and/or liabilities;
• | natural or man-caused disruptive events that could damage our facilities, equipment or our work-in-progress and cause us to incur losses and/or liabilities; |
equipment failure;
• | equipment failure; |
changes in, or our failure or inability to comply with, government regulations;
• | changes in, or our failure or inability to comply with, government regulations; |
adverse outcomes from legal and regulatory proceedings;
• | adverse outcomes from legal and regulatory proceedings; |
impact of potential requirements to significantly limit or reduce greenhouse gas and other emissions in the future;
• | impact of potential regional, national and/or global requirements to significantly limit or reduce greenhouse gas and other emissions in the future; |
changes in, and liabilities relating to, existing or future environmental regulatory matters;
• | changes in, and liabilities relating to, existing or future environmental regulatory matters; |
changes in tax laws;
• | changes in U.S. and non-U.S. tax laws or regulations; |
rapid technological changes;
• | the continued competitiveness and availability of, and continued demand and legal protection for, our intellectual property assets or rights, including the ability of our patents or licensed technologies to perform as expected and to remain competitive, current, in demand, profitable and enforceable; |
the consequences of significant changes in interest rates and currency exchange rates;
• | our ability to keep pace with rapid technological changes or innovations; |
difficulties we may encounter in obtaining regulatory or other necessary approvals of any strategic transactions;
• | the risk that we may not be successful in updating and replacing current information technology and the risks associated with information technology systems interruptions and cybersecurity threats; |
the risks associated with integrating acquired businesses and forming and operating joint ventures;
• | the risks associated with failures to protect data privacy in accordance with applicable legal requirements and contractual provisions binding upon us; |
the risk we may not be successful in updating and replacing current information technology and the risks associated with information technology systems interruptions and cybersecurity threats;
• | the consequences of significant changes in interest rates and currency exchange rates; |
social, political and economic situations in countries where we do business;
• | difficulties we may encounter in obtaining regulatory or other necessary approvals of any strategic transactions; |
the risks associated with our international operations, including local content or similar requirements;
• | the risks associated with integrating acquired businesses; |
interference from adverse weather or sea conditions;
• | the risks associated with forming and operating joint ventures, including exposure to joint and several liability for failures in performance by our co-venturers; |
the possibilities of war, other armed conflicts or terrorist attacks;
• | social, political and economic situations in countries where we do business; |
• | the risks associated with our international operations, including risks relating to local content or similar requirements; |
| 45 |
the effects of asserted and unasserted claims and the extent of available insurance coverages;
MANAGEMENT’S DISCUSSION AND ANALYSIS OF FINANCIAL CONDITION AND RESULTS OF OPERATIONS
• | foreign currency and interest rate risks and our ability to properly manage or hedge those or similar risks; |
our ability to obtain surety bonds, letters of credit and financing;
• | interference from adverse weather or sea conditions; |
our ability to maintain builder’s risk, liability, property and other insurance in amounts and on terms we consider adequate and at rates that we consider economical;
• | the possibilities of war, other armed conflicts or terrorist attacks; |
the aggregated risks retained in our captive insurance subsidiary; and
• | the effects of asserted and unasserted claims and the extent of available insurance coverages; |
• | our ability to obtain surety bonds, letters of credit and new financing arrangements; |
the impact of the loss of insurance rights as part of the Chapter 11 Bankruptcy settlement concluded in 2006 involving several of our former subsidiaries.
• | our ability to maintain builder’s risk, liability, property and other insurance in amounts and on terms we consider adequate and at rates that we consider economical; |
• | the aggregated risks retained in our captive insurance subsidiaries; and |
• | the impact of the loss of insurance rights as part of the Chapter 11 Bankruptcy settlement concluded in 2006 involving several of our former subsidiaries. |
We believe the items we have outlined above are important factors that could cause estimates in our financial statements to differ materially from actual results and those expressed in a forward-looking statement made in this quarterly report or elsewhere by us or on our behalf. We have discussed many of these factors in more detail elsewhere in this report and in the 20172018 Form 10-K. These factors are not necessarily all the factors that could affect us. Unpredictable or unanticipated factors we have not discussed in this report and in the 20172018 Form 10-K could also have material adverse effects on actual results of matters that are the subject of our forward-looking statements. We do not intend to update our description of important factors each time a potential important factor arises, except as required by applicable securities laws and regulations. We advise our security holders that they should (1) be aware that factors not referred to above could affect the accuracy of our forward-looking statements and (2) use caution and common sense when considering our forward-looking statements.
Overview
We are a fully integrated provider of engineering, procurement, construction and installation (“EPCI”) and technology solutions to the energy industry and design and build end-to-end infrastructure and technology solutions to transport and transform oil and gas into a variety of products. Our customers include national, major integrated and other oil and gas companies as well as producers of petrochemicals and electric power. Our proprietary technologies, integrated expertise and comprehensive solutions are utilized for liquefied natural gas (“LNG”), power, offshore and subsea, and downstream (includes downstream oil and gas processing facilities and licensed technologies and catalysts) energy projects around the world. We execute our contracts through a variety of methods, principally fixed-price, but also including cost reimbursable, cost-plus, day-rate and unit-rate basis or some combination of those methods. Contracts are usually awarded through a competitive bid process.
Business Combination in 2018
On May 10, 2018 (the “Combination Date”), we completed our combination with Chicago Bridge & Iron Company N.V. (“CB&I”) (the “Combination”) (see Note 3, Business Combination, to the accompanying Financial Statements for further discussion). Following completion of the Combination, during the second quarter of 2018, we reorganized our operations into five business segments to better serve our global clients, leverage our workforce, help streamline operations and provide enhanced growth opportunities.
Business Segments
Our five business segments, which represent our reportable segments, are: North, Central & South America (“NCSA”); Europe, Africa, Russia & the Caspian (“EARC”); Middle East & North Africa (“MENA”); Asia Pacific (“APAC”); and Technology. We also report certain corporate and other non-operating activities under the heading “Corporate and Other.” Corporate and Other primarily reflects costs that are not allocated to our segments. The segment information presented for the first quarter of 2018 has been recast to conform to the 2019 presentation. For financial information about our segments, see Note 22, Segment Reporting, to the accompanying Financial Statements.
• | NCSA—Our NCSA segment designs, engineers and constructs upstream offshore oil & gas facilities, downstream oil & gas facilities, gas-fired power plants, LNG import and export terminals, atmospheric and refrigerated storage vessels and terminals and water storage and treatment facilities and performs pipe and module fabrication. Our March 31, 2019 RPOs composition by product offering 53% LNG, 34% Downstream, 8% Power and 5% Offshore & Subsea. We anticipate the |
|
|
|
MANAGEMENT’S DISCUSSION AND ANALYSIS OF FINANCIAL CONDITION AND RESULTS OF OPERATIONS
majority of future opportunities over the intermediate term are likely to be in the U.S. LNG and petrochemical markets. Our March 31, 2019 RPOs distribution for this segment by contracting type was approximately 91% fixed-price and hybrid and 9% cost-reimbursable and other. |
• | EARC―Our EARC segment designs, engineers and constructs upstream offshore oil & gas facilities, downstream oil & gas facilities, LNG import and export terminals and atmospheric and refrigerated storage vessels and terminals. Our March 31, 2019 RPOs composition by product offering was 61% Offshore & Subsea and 39% Downstream and was primarily comprised of fixed-price contracts. We anticipate the majority of future opportunities over the intermediate term are likely to be in the downstream oil & gas markets in Russia and upstream and LNG projects in Africa. |
• | MENA―Our MENA segment designs, engineers and constructs upstream offshore oil & gas facilities and pipelines, downstream oil & gas facilities, hydrocarbon processing facilities, atmospheric and refrigerated storage vessels and terminals, and performs pipe fabrication and manufacturing. Our March 31, 2019 RPOs composition by product offering was 78% Offshore & Subsea and 22% Downstream and was primarily comprised of fixed-price contracts. We anticipate the majority of future opportunities over the intermediate term are likely to be in the Middle East offshore market. |
• | APAC—Our APAC segment designs, engineers and constructs upstream offshore oil & gas facilities and pipelines, refining and petrochemical facilities, hydrocarbon processing facilities, LNG import and export terminals and atmospheric and refrigerated storage vessels and terminals. Our March 31, 2019 RPOs composition by product offering was 93% Offshore & Subsea and 7% Downstream, which was primarily comprised of fixed-price contracts. We anticipate the majority of future opportunities over the intermediate term are likely to be in India and Australia. |
• | Technology―Our Technology segment is a leading technology licensor of proprietary gas processing, refining, petrochemical and coal gasification technologies as well as a supplier of proprietary catalysts, equipment and related engineering services. These technologies are critical in the refining of crude oil into gasoline, diesel, jet fuel and lubes, the manufacturing of petrochemicals and polymers, as well as the gasification of coal into syngas. The Technology segment also has a 50% owned unconsolidated joint venture that provides proprietary process technology licenses and associated engineering services and catalysts, primarily for the refining industry. Our March 31, 2019 RPOs composition for this segment was 100% Downstream and primarily comprised of fixed-price contracts. |
Loss Projects
Our accrual of provisions forestimated losses on active uncompleted contracts as of March 31, 2019 was $190 million and Results of Operations
Business Segments
We manage reportable segments along geographic lines consisting of (1) Americas, Europe and Africa (“AEA”), (2) the Middle East (“MEA”) and (3) Asia (“ASA”). We also report certain corporate and other non-operating activities under the heading “Corporate and Other.”
Segment operations
We use Operating income (loss) as our measure of profitability for segment reporting purposes. For additional financial informationprimarily related to the Cameron LNG project and the Freeport LNG Trains 1 & 2 projects. Our accrual of provisions for estimated losses on active uncompleted contracts as of December 31, 2018 was $266 million and primarily related to the Cameron LNG, Freeport LNG Trains 1 & 2, Calpine and Abkatun-A2 projects. Our Freeport LNG Train 3 project is not anticipated to be in a loss position.
Summary information for our reporting segments,significant ongoing loss projects as wellof March 31, 2019 is as follows:
Cameron LNG―At March 31, 2019, our U.S. LNG export facility project in Hackberry, Louisiana for Cameron LNG (within our NCSA operating group) was approximately 65% complete on a reconciliation of segment operating income to income beforepost-Combination basis (approximately 90% on a pre-Combination basis) and had an accrued provision for income taxes, as defined by generally accepted accounting principles inestimated losses of approximately $128 million. For these purposes (and for purposes of the United States (“GAAP”)discussion below), see Note 16, Segment Reporting,when we refer to a percentage of completion on a pre-Combination basis, we are referring to the accompanying Consolidated Financial Statements.cumulative percentage of completion, which includes progress made prior to the Combination Date. In accordance with U.S. GAAP, as of the Combination Date, we reset the progress to completion for all of CB&I’s projects then in progress to 0% for accounting purposes based on the remaining costs to be incurred as of that date.
Our segment operating results are frequently influenced by the resolution of change orders, project close-outs and settlements, which generally can cause operating margins to improve during the period in which these items are approved or finalized. While we expect change orders, close-outs and settlements to continue as partFreeport LNG―At March 31, 2019, Trains 1 & 2 of our normal business activities,U.S. LNG export facility project in Freeport, Texas for Freeport LNG (within our NCSA operating group) were approximately 80% complete on a post-Combination basis (approximately 95% on a pre-Combination basis) and had an accrued provision for estimated losses of approximately $19 million. During the period in which they are recognized is largely driven by the finalization of agreements with customers and suppliers and, as a result, is difficult to predict. Additionally, the future margin increases or decreases associated with these items are difficult to predict, due to, among other items, the difficulty of predicting the timing of recognition of change orders, close-outs and settlements and the timing of new project awards.
Three months ended March 31, 2018 vs three months ended March 31, 20172019, the project was negatively impacted by $27 million due to changes in cost estimates resulting from increases in construction and subcontractor costs. These cost estimate increases were partially offset by the recording of approximately $11 million of incentive revenues. Additionally, Freeport LNG Train 3 was positively impacted by $16 million of changes in cost estimates at completion due to increased productivity and savings in indirect costs, resulting in an overall net immaterial impact on operating margin at completion for the Freeport LNG project taken as a whole.
Revenues
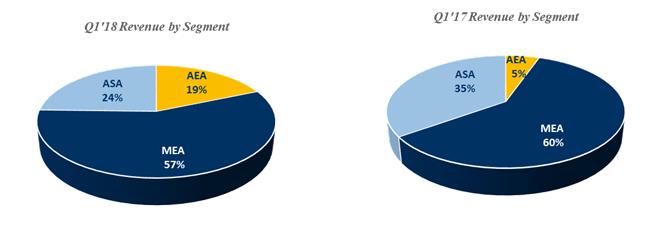
| Three Months Ended March 31, |
|
|
|
|
|
|
|
|
|
| ||||||||||||||
| 2018 |
|
| 2017 |
|
| Change | ||||||||||||||||||
| (In thousands) |
|
| Percentage | |||||||||||||||||||||
Revenues: |
|
|
|
|
|
|
|
|
|
|
|
|
|
|
|
| |||||||||
AEA | $ | 113,304 |
|
| $ | 28,131 |
|
| $ | 85,173 |
|
|
| 303 |
| % | |||||||||
MEA |
| 345,123 |
|
|
| 310,052 |
|
|
| 35,071 |
|
|
| 11 |
|
| |||||||||
ASA |
| 149,391 |
|
|
| 181,248 |
|
|
| (31,857 | ) |
|
| (18 | ) |
| |||||||||
Total revenues | $ | 607,818 |
|
| $ | 519,431 |
|
| $ | 88,387 |
|
|
| 17 |
| % | |||||||||
|
|
|
MANAGEMENT’S DISCUSSION AND ANALYSIS OF FINANCIAL CONDITION AND RESULTS OF OPERATIONS
Summary information for our significant loss projects previously reported in the 2018 Form 10-K that are substantially complete as of March 31, 2019 is as follows:
Calpine Power Project―At March 31, 2019, our U.S. gas turbine power project for Calpine (within our NCSA operating group) was approximately 95% complete on a post-Combination basis (approximately 99% on a pre-Combination basis), and the remaining accrued provision for estimated losses was not significant.
Abkatun-A2 Project―At March 31, 2019, our Abkatun-A2 platform project in Mexico for Pemex (within our NCSA operating group) was approximately 95% complete, and the remaining accrued provision for estimated losses was not significant.
Review of Business Portfolio
We have performed a review of our business portfolio, which included businesses acquired in the Combination. Our review sought to determine if any portions of our business are non-core for purposes of our vertically integrated offering model. As a result of our review, we identified our industrial storage tank and U.S. pipe fabrication businesses as non-core for purposes of our vertically integrated offering model. As a result and in view of the considerations discussed below under “Liquidity and Capital Resources,” we have identified multiple potential buyers, and have initiated marketing efforts, for each of the two businesses. Any potential sale would be subject to approval by 17%, or $88our Board of Directors. Our credit agreement requires us to use proceeds from any sale of a business generating in excess of $500 million in the first quarter of 2018 comparedsales proceeds to the first quarter of 2017, primarily due to increases in our AEA and MEA segments, partially offset by a decrease in our ASA segment.
AEA—Revenues increased by 303%, or $85 million,in the first quarter of 2018 compared to the first quarter of 2017.
In the first quarter of 2018, a variety of projects and activities contributed to revenues, as follows:
fabrication activity progress on the Abkatun-A2 platform, a turnkey EPCI project in the Gulf of Mexico;
substantial completion of onshore activity on the Atlanta SURF project, in Brazil;
commencement in 2018 of the Maersk Olie og Gas A/S (“Maersk Oil”) Tyra Redevelopment EPCI project, awarded in the fourth quarter of 2017; and
fabrication activity progress on BP Angelin EPCI, a gas field project.
In the first quarter of 2017, a variety of projects and activities contributed to revenues, including:
commencement of fabrication activity on the Abkatun-A2 platform; and
a front-end engineering and design project.
MEA—Revenues increased by 11%, or $35 million, in the first quarter of 2018 compared to the first quarter of 2017.
In the first quarter of 2018, a variety of projects and activities contributed to revenues, as follows:
engineering and fabrication progress and pipelay activity by our DB 32 vessel on the Saudi Aramco Safaniya phase 5 project;
marine hook-up activities utilizing a jack-up barge on the lump-sum EPCI project under the Saudi Aramco Long-Term Agreement (“LTA II”);
a marine campaign for hookup activities and fabrication on two Saudi Aramco EPCI projects;
commencement of two Saudi Aramco projects, the Safaniya phase 6 project, awarded in the fourth quarter of 2017, and the 13 Jackets project, awarded in the first quarter of 2018; and
marine offshore campaign progress on the Saudi Aramco four jackets and three observation platform project, which was awarded in the fourth quarter of 2016.
In the first quarter of 2017, a variety of projects and activities contributed to revenues, as follows:
fabrication and marine activities on the lump-sum EPCI project under the LTA II;
|
|
marine hookup activities carried out during the shutdown of the TP-1 platform on our Saudi Aramco Karan-45 project;
increased fabrication activities undertaken on the Marjan power system cable replacement project for Saudi Aramco;
completion of the next phase of a large pipeline repair-related project in the Middle East;
a marine campaign executed by our Emerald Sea vessel and other vessels for tran-spooling, umbilical installation and hook-up activities on a pipeline, spool and risers for a flow assurance project in Qatar; and
engineering and fabrication activities on a Saudi Aramco project to supply nine jackets, which was awarded in the second quarter of 2016.
ASA—Revenues decreased by 18%, or $32 million, primarily due to a reduction in active projects in the first quarter of 2018 compared to the first quarter of 2017.
|
|
MANAGEMENT’S DISCUSSION AND ANALYSIS OF FINANCIAL CONDITION AND RESULTS OF OPERATIONS
In the first quarter of 2018, a variety of projects and activities contributed to revenues, as follows:
the Inpex Ichthys project, which is substantially complete;
commencement of the off-shore campaign on the Greater Western Flank Phase 2 project in Australia, as the project progressed from the fabrication phase to prelay campaign; and
progress on marine installation activities on the Vashishta subsea field infrastructure development EPCI project in India, which is substantially complete.
In the first quarter of 2017, a variety of projects and activities contributed to revenues, as follows:
the Vashishta subsea field infrastructure development EPCI project work in India;
the Ichthys EPCI project in Australia; and
the Yamal project.
Segment Operating Income
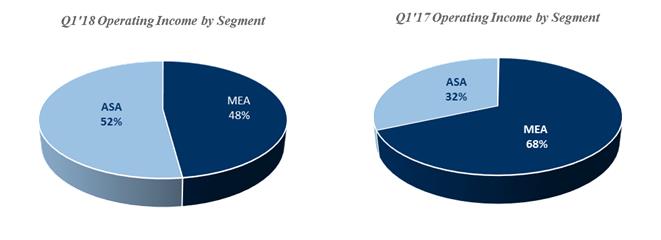
| Three Months Ended March 31, |
|
|
|
|
|
|
|
|
|
| |||||
| 2018 |
|
| 2017 |
|
| Change | |||||||||
| (In thousands) |
|
| Percentage | ||||||||||||
Segment operating income: |
|
|
|
|
|
|
|
|
|
|
|
|
|
|
|
|
AEA | $ | 53 |
|
| $ | 183 |
|
| $ | (130 | ) |
|
| (71 | ) | % |
MEA |
| 69,183 |
|
|
| 64,377 |
|
|
| 4,806 |
|
|
| 7 |
|
|
ASA |
| 75,349 |
|
|
| 29,775 |
|
|
| 45,574 |
|
|
| 153 |
|
|
Total | $ | 144,585 |
|
| $ | 94,335 |
|
| $ | 50,250 |
|
|
| 53 |
| % |
Segment operating income increased by 53%, or $50 million, in the first quarter of 2018 compared to the first quarter of 2017.
AEA—Segment operating income was less than $0.2 million in the first quarters of 2018 and 2017.
In the first quarter of 2018, a variety of projects and activities contributed to operating income, including:
higher activity on the Atlanta SURF project in Brazil, which was substantially complete in the first quarter of 2018; and
commencement of the Maersk Oil Tyra Redevelopment EPCI project in 2018.
|
|
MANAGEMENT’S DISCUSSION AND ANALYSIS OF FINANCIAL CONDITION AND RESULTS OF OPERATIONS
The first quarter of 2018 operating income was unfavorably impacted by fabrication and procurement related cost changes on certain active projects, none of which individually was material.
In the first quarter of 2017, a variety of projects and activities contributed to the operating income:
an increase in fabrication activity on the Abkatun-A2 platform;
a front-end engineering and design project; and
close-out improvements and recognition of approved change orders on certain completed projects.
MEA—Segment operating income in the first quarters of 2018 and 2017 was $69 million and $64 million, respectively.
In the first quarter of 2018, a variety of projects and activities contributed to operating income:
marine hook-up activities utilizing jack-up barge on the lump-sum EPCI project under the LTA II;
engineering and fabrication progress and pipelay activity by our DB 32 vessel on the Saudi Aramco Safaniya phase 5 project;
marine offshore campaign progress on the Saudi Aramco four jackets and three observation platform project, which was awarded in the fourth quarter of 2016;
the marine campaign for hookup activities and fabrication on two Saudi Aramco EPCI projects;
commencement of two Saudi Aramco projects, the Safaniya phase 6 project, awarded in the fourth quarter of 2017, and the 13 Jackets project, awarded in the first quarter of 2018; and
commencement of the third phase of a large Middle East pipeline repair-related project, awarded in the fourth quarter of 2017.
In the first quarter of 2017, a variety of projects and activities contributed to the operating income, including:
fabrication and marine activities progress on the lump-sum EPCI project under the LTA II;
marine hookup activities carried out during the shutdown of the TP-1 platform on the Karan-45 project;
progress on the Marjan power systems cable replacement project; and
completion of the next phase on the large pipeline repair-related project in the Middle East.
ASA—Segment operating income in the first quarters of 2018 and 2017 was $75 million and $30 million, respectively.
In the first quarter of 2018, segment operating income was impacted by:
close-out of outstanding change orders on active and completed projects;
commencement of the off-shore campaign on the Greater Western Flank Phase 2 project, in Australia, as the project progressed from the fabrication phase to prelay campaign; and
reimbursement for vessel standby and downtime costs incurred on active and completed projects.
In the first quarter of 2017, a variety of projects and activities contributed to operating income, including:
the Ichthys project in Australia, as the project progressed through the marine installation phase; and
higher fabrication activity in 2017 on the Yamal project, which was substantially completed in the first quarter of 2017.
Our Vashishta project in India, which is substantially complete, did not contribute positively to our overall operating margin. Our estimated revenues at completion of the project also include unapproved change orders.
Other items in Operating Income
|
|
MANAGEMENT’S DISCUSSION AND ANALYSIS OF FINANCIAL CONDITION AND RESULTS OF OPERATIONS
| Three Months Ended March 31, |
|
|
|
|
|
|
|
|
|
| |||||
| 2018 |
|
| 2017 |
|
| Change | |||||||||
| (In thousands) |
|
| Percentage | ||||||||||||
Corporate and other | $ | (76,146 | ) |
| $ | (38,296 | ) |
| $ | (37,850 | ) |
|
| (99 | ) | % |
Corporate and other expenses increased by $38 million in the first quarter of 2018 compared to the first quarter of 2017.
|
|
MANAGEMENT’S DISCUSSION AND ANALYSIS OF FINANCIAL CONDITION AND RESULTS OF OPERATIONS
The increase was due primarily to the:
$14 million associated with (1) our Fit 2 Grow (“F2G”), a value improvement program to further reduce our costs; and (2) transaction costs related to our business combination with CB&I; and
lower cost recovery associated with certain vessels, engineering and fabrication facilities.
Other Non-operating Itemsoutstanding debt.
Interest expense, net—Interest expense was $12 million and $18 million in the first quarter of 2018 and 2017, respectively. The decrease was primarily due to the repaymentfinancial results of our term loan in the second quarterindustrial storage tank and U.S. pipe fabrication businesses are primarily included within our NCSA, MENA and APAC operating groups. Revenues for our industrial storage tank business as a percentage of 2017.
Provision for income taxes—For the three months ended March 31, 2018, we recognized income before provision for income taxes of $59 million, compared to $39 million in the three months ended March 31, 2017. In the aggregate, the provision for income taxes was $21 millionour consolidated Revenues were approximately 11% and $11 million8%, respectively, for the three months ended March 31, 20182019 and 2017, respectively. The increaseyear ended December 31, 2018. Property, plant and equipment, net for our industrial storage tank business as a percentage of our consolidated Property, plant and equipment, net was approximately 3% as of both March 31, 2019 and December 31, 2018. Revenues for our U.S. pipe fabrication business as a percentage of our consolidated Revenues were approximately 1% for both the three months ended March 31, 2019 and year ended December 31, 2018. Property, plant and equipment, net for our U.S. pipe fabrication business as a percentage of our consolidated Property, plant and equipment, net was approximately 5% and 6%, respectively, as of March 31, 2019 and December 31, 2018. We have not included total assets of the two businesses in the provision for income taxes was primarily driven by increased incomeabove discussion, as the allocation of goodwill and intangible assets resulting from the Combination has not been completed. Additionally, we have not included a profitability measure (such as operating income) in the 2018 period coupled with losses in certain jurisdictions where we did not recognize a tax benefit. The increase was partially offset by income in favorable tax jurisdictions.
Dueabove discussion, as the allocation of the corresponding intangible amortization to the impact of ongoing tax losses intwo businesses is not complete.
RPOs
RPOs represent the U.S. and the corresponding valuation allowance on our U.S. net deferred tax asset position, the new provisions from U.S. tax reform enacted in December 2017 and taking effect in 2018 are not expected to have a material impact on our 2018 tax position.
Backlog
Backlog represents the dollar amount of revenues we expect to recognize in the future from contracts awarded, including those that are in progress. These amounts are presented in U.S. dollars. Our methodologyour contract commitments on projects. RPOs include the entire expected revenue values for determining backlog may not be comparable to methodologies used by other companies in determining their backlog amounts. The backlogjoint ventures we consolidate and our proportionate values for consortiums we disclose include anticipated revenues associated with: (1) the original contract amounts; (2) change orders for which we have received written confirmations from the applicable customers; (3) change orders for which we expect to receive confirmations in the ordinary course of business; and (4) claims that we have made against our customers, when certain conditions are met.proportionately consolidate. We do not include expected revenues of contracts related to unconsolidated joint ventures in our backlog,RPOs, except to the extent of any contractsubcontract awards we may receive from those joint ventures.
BacklogRPOs for each of our segments can consist of up to several hundred contracts. These contracts vary in size from less than one hundred thousand dollars in contract value to several billion dollars, with varying durations that can exceed five years. The timing of awards and differing types, sizes and durations of our contracts, combined with the geographic diversity and stages of completion of the associated projects, often results in fluctuations in our quarterly segment results as a percentage of total revenue. RPOs may not be indicative of future operating results, and projects in our backlogRPOs may be cancelled, modified or otherwise altered by customers. We can provide no assurance as to the profitability of our contracts reflected in backlog.RPOs. It is possible that our estimates of profit could increase or decrease based on, among other things, changes in productivity, actual downtime and the resolution of change orders and claims with the customers. Backlogcustomers, and therefore our future profitability is difficult to predict.
The timing of our revenue recognition may be impacted by the contracting structure of our contracts. Under fixed-price contracts, we perform our services and execute our projects at an established price. Fixed-price contracts, and hybrid contracts with a measure not defined bymore significant fixed-price component, tend to provide us with greater control over project schedule and the timing of when work is performed and costs are incurred, and, accordingly, when revenue is recognized. Under cost-reimbursable contracts, we generally accepted accounting principlesperform our services in exchange for a price that consists of reimbursement of all customer-approved costs and a profit component, which is nottypically a measure of contract profitability.
As of March 31, 2018, our $3.4 billion of backlog equals our remaining performance obligations under the applicable contracts. See Note 3, Revenue Recognition, to the accompanying Consolidated Financial Statements for further discussion.
Liquidity and Capital Resources
General—Our primary ongoing sources of liquidity are cash flows generated from operations and cash and cash equivalents on hand. We regularly review our sources and uses of funds and may access capital markets to increase our liquidity position or to refinance our existing debt. We plan to fund our ongoing working capital, capital expenditures, debt service and other funding requirements with cash on hand, cash from operating activities, proceeds from the issuance of debt,fixed rate per hour, an overall fixed fee or a combination thereof.percentage of total reimbursable costs. Cost-reimbursable contracts, and hybrid contracts with a more significant cost-reimbursable component, generally provide our customers with greater influence
We believe our anticipated future operating cash flow, capacity under our credit facilities and uncommitted bilateral lines of credit, along with access to surety bonds, will be sufficient to finance our capital expenditures, settle our commitments and contingencies and address our normal, anticipated working capital needs for the foreseeable future.
|
|
|
MANAGEMENT’S DISCUSSION AND ANALYSIS OF FINANCIAL CONDITION AND RESULTS OF OPERATIONS
over the timing of when we perform our work, and, accordingly, such contracts often result in less predictability with respect to the timing of revenue recognition. Our shorter-term contracts and services are generally provided on a cost-reimbursable, fixed-price or unit price basis.
Our RPOs by business segment as of March 31, 2019 and December 31, 2018 were as follows:
| March 31, 2019 |
|
| December 31, 2018 |
|
|
|
| Change (1) |
| |||||||||||||||
| (Dollars in millions) |
|
|
|
|
|
|
|
|
|
|
| |||||||||||||
NCSA | $ | 8,581 |
|
|
| 56 | % |
| $ | 5,649 |
|
|
| 52 | % |
|
|
| $ | 2,932 |
|
|
| 52 | % |
EARC |
| 1,914 |
|
|
| 12 | % |
|
| 1,378 |
|
|
| 12 | % |
|
|
|
| 536 |
|
|
| 39 | % |
MENA |
| 2,879 |
|
|
| 19 | % |
|
| 1,834 |
|
|
| 17 | % |
|
|
|
| 1,045 |
|
|
| 57 | % |
APAC |
| 1,401 |
|
|
| 9 | % |
|
| 1,420 |
|
|
| 13 | % |
|
|
|
| (19 | ) |
|
| (1) | % |
Technology |
| 601 |
|
|
| 4 | % |
|
| 632 |
|
|
| 6 | % |
|
|
|
| (31 | ) |
|
| (5) | % |
Total | $ | 15,376 |
|
|
| 100 | % |
| $ | 10,913 |
|
|
| 100 | % |
|
|
| $ | 4,463 |
|
|
| 41 | % |
(1) | Our RPOs increased by $4.5 billion from December 31, 2018, due to new awards of $6.7 billion exceeding the recognition of revenues of $2.2 billion. |
Of the RPOs as of March 31, 2019, we expect to recognize revenues as follows:
| 2019 |
|
| 2020 |
|
| Thereafter |
| |||
| (In millions) |
| |||||||||
Total RPOs | $ | 6,189 |
|
| $ | 5,119 |
|
| $ | 4,068 |
|
| 49 |
MANAGEMENT’S DISCUSSION AND ANALYSIS OF FINANCIAL CONDITION AND RESULTS OF OPERATIONS
Three months ended March 31, 2019 vs three months ended March 31, 2018
Revenue
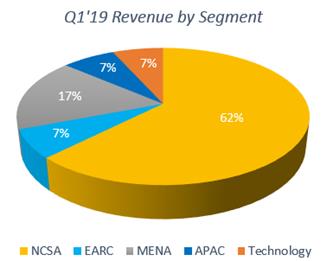

Revenues increased by 264%, or $1.6 billion, in the first quarter of 2019 compared to the first quarter of 2018, reflecting a $1.5 billion increase due to the Combination, partially offset by reduced revenues from legacy McDermott projects.
| Three months ended March 31, |
|
|
|
|
|
|
|
|
|
| |||||
| 2019 |
|
| 2018 |
|
| Change | |||||||||
| (In millions) |
|
| Percentage | ||||||||||||
Revenues: |
|
|
|
|
|
|
|
|
|
|
|
|
|
|
|
|
NCSA | $ | 1,380 |
|
| $ | 98 |
|
| $ | 1,282 |
|
|
| 1,308 |
| % |
EARC |
| 148 |
|
|
| 16 |
|
|
| 132 |
|
|
| 825 |
|
|
MENA |
| 380 |
|
|
| 345 |
|
|
| 35 |
|
|
| 10 |
|
|
APAC |
| 155 |
|
|
| 149 |
|
|
| 6 |
|
|
| 4 |
|
|
Technology |
| 148 |
|
|
| - |
|
|
| 148 |
|
| NA |
|
| |
Total | $ | 2,211 |
|
| $ | 608 |
|
| $ | 1,603 |
|
|
| 264 |
| % |
NCSA—Revenues increased by 1,308%, or $1.3 billion (including an increase of $1.2 billion due to the Combination), compared to the first quarter of 2018.
In the first quarter of 2019, a variety of projects and activities contributed to revenues, including:
• | construction progress on our two U.S. LNG export facility projects (approximately $409 million combined); |
• | construction progress on our ethane projects in Texas and Louisiana (approximately $335 million combined); and |
• | various power projects in the United States. |
| 50 |
MANAGEMENT’S DISCUSSION AND ANALYSIS OF FINANCIAL CONDITION AND RESULTS OF OPERATIONS
In the first quarter of 2018, a variety of projects and activities contributed to revenues, including:
• | fabrication activity progress on the Abkatun-A2 platform, a turnkey EPCI project in the Gulf of Mexico; |
• | substantial completion of onshore activity on the Atlanta SURF project in Brazil; and |
• | fabrication activity progress on BP Angelin EPCI, a gas field project. |
EARC—Revenues increased by 825%, or $132 million (including an increase of $61 million due to the Combination), compared to the first quarter of 2018.
In the first quarter of 2019, a variety of projects and activities contributed to revenues, including:
• | progress on engineering and procurement activities on the TOTAL Tyra Redevelopment EPCI project (“Tyra Redevelopment project”), awarded in the fourth quarter of 2017; |
• | ongoing procurement activities for an oil refinery expansion project in Russia; and |
• | engineering, procurement and supply of process equipment for a deep conversion complex built at a refinery in central Russia. |
In the first quarter of 2018, revenue was primarily associated with the commencement of the Tyra Redevelopment project.
MENA—Revenues increased by 10%, or $35 million (including an increase of $109 million due to the Combination), compared to the first quarter of 2018.
In the first quarter of 2019, a variety of projects and activities contributed to revenues, including:
• | procurement, fabrication and marine activities on the Saudi Aramco Safaniya phase 6 project, awarded in the fourth quarter of 2017; |
• | engineering and procurement activities on the Bul Hanine EPCI project for Qatar Petroleum, awarded in the fourth quarter of 2017; |
• | engineering and procurement progress on Abu Dhabi National Oil Company crude flexibility project in Ruwais, UAE, awarded in the first quarter of 2018; |
• | engineering, procurement and construction progress on the LIWA EPC project for ORPIC; and |
• | close out activities on the substantially complete Saudi Aramco Safaniya phase 5 project. |
In the first quarter of 2018, a variety of projects and activities contributed to revenues, including:
• | engineering and fabrication progress and pipelay activity by our DB 32 vessel on the Saudi Aramco Safaniya phase 5 project; |
• | marine hook-up activities utilizing a jack-up barge on the lump-sum EPCI project under the Saudi Aramco Long-Term Agreement (“LTA II”); |
• | a marine campaign for hookup activities and fabrication on two Saudi Aramco EPCI projects; |
• | commencement of two Saudi Aramco projects, the Safaniya phase 6 project, awarded in the fourth quarter of 2017, and the 13 Jackets project, awarded in the first quarter of 2018; and |
• | marine offshore campaign progress on the Saudi Aramco four jackets and three observation platform project, which was awarded in the fourth quarter of 2016. |
APAC—Revenues increased by 4%, or $6 million (including an increase of $26 million due to the Combination), compared to the first quarter of 2018.
In the first quarter of 2019, a variety of projects and activities contributed to revenues, including:
• | substantial completion of initial offshore campaign by our DLV 2000 vessel on a subsea installation project in India; and |
• | close out activities on a completed project and progress on various other projects. |
| 51 |
MANAGEMENT’S DISCUSSION AND ANALYSIS OF FINANCIAL CONDITION AND RESULTS OF OPERATIONS
In the first quarter of 2018, a variety of projects and activities contributed to revenues, including:
• | the Inpex Ichthys project; |
• | commencement of the offshore campaign on the Greater Western Flank Phase 2 project in Australia, as the project progressed from the fabrication phase to prelay campaign; and |
• | progress on marine installation activities on the Vashishta subsea field infrastructure development EPCI project in India, which is substantially complete. |
Technology—Revenues during the first quarter of 2019 were $148 million (all of which was due to the Combination) and were primarily associated with licensing and proprietary equipment activities in the petrochemical and refining markets and also the sale of catalyst materials.
Segment Operating Income


Segment operating income in the first quarter of 2019 was $194 million compared to segment operating income of $142 million in the first quarter of 2018. Our first quarter 2019 operating results included $160 million of operating income due to the Combination (including $34 million of project-related and other intangible assets, inventory and investment in unconsolidated affiliates-related amortization).
| Three months ended March 31, |
|
|
|
|
|
|
|
|
|
| |||||
| 2019 |
|
| 2018 |
|
| Change | |||||||||
| (In millions) |
|
| Percentage | ||||||||||||
Segment operating income: |
|
|
|
|
|
|
|
|
|
|
|
|
|
|
|
|
NCSA | $ | 73 |
|
| $ | 2 |
|
| $ | 71 |
|
|
| 3,550 |
| % |
EARC |
| 7 |
|
|
| (3 | ) |
|
| 10 |
|
|
| 333 |
|
|
MENA |
| 66 |
|
|
| 70 |
|
|
| (4 | ) |
|
| (6 | ) |
|
APAC |
| 13 |
|
|
| 73 |
|
|
| (60 | ) |
|
| (82 | ) |
|
Technology |
| 35 |
|
|
| - |
|
|
| 35 |
|
| NA |
|
| |
Total | $ | 194 |
|
| $ | 142 |
|
| $ | 52 |
|
|
| 37 |
| % |
| 52 |
MANAGEMENT’S DISCUSSION AND ANALYSIS OF FINANCIAL CONDITION AND RESULTS OF OPERATIONS
NCSA—Segment operating income was $73 million and $2 million during the first quarters of 2019 and 2018, respectively. Our first quarter of 2019 operating results increased by $96 million, compared to the prior-year period, due to the impact of the Combination (including $10 million of amortization for project, other intangible assets and inventory related fair value adjustments).
In the first quarter of 2019, a variety of projects and activities contributed to operating income, including:
• | construction progress and cost savings on our ethane projects in Texas and Louisiana; and |
• | construction progress on various power projects in the United States. |
These benefits were partially offset by charges resulting from changes in estimates for a subsea pipeline flowline installation project due to execution challenges.
During the three months ended March 31, 2019, the Freeport LNG Trains 1 & 2 project was negatively impacted by $27 million due to changes in cost estimates resulting from increases in construction and subcontractor costs. These cost estimate increases were partially offset by the recording of approximately $11 million of incentive revenues. Additionally, Freeport LNG Train 3 was positively impacted by $16 million of changes in cost estimates at completion due to increased productivity and savings in indirect costs, resulting in the Freeport LNG project having a net immaterial impact on our operating margin during the period.
In the first quarter of 2018, higher activity on the Atlanta SURF project in Brazil, which was substantially complete in the first quarter of 2018, contributed to operating income.
The first quarter of 2018 operating income was unfavorably impacted by fabrication and procurement related cost changes on certain active projects, none of which individually was material.
EARC—Segment operating income was $7 million in the first quarter of 2019 compared to a segment operating loss of $3 million in the first quarter of 2018. Our first quarter 2019 operating results increased by $3 million due to the impact of the Combination (including $3 million of project-related and other intangible assets amortization).
In the first quarter of 2019, a variety of projects and activities contributed to operating income, including:
• | progress on engineering and procurement activities on the Tyra Redevelopment project; |
• | ongoing procurement activities for an oil refinery expansion project in Russia; and |
• | set-up activities and preparation of long-lead items on the BP Tortue EPCI project. |
In the first quarter of 2018, our project results were partially offset by selling, general and administrative expenses and losses from our investment in the io Oil and Gas unconsolidated joint venture.
MENA—Segment operating income in the first quarters of 2019 and 2018 was $66 million and $70 million, respectively. Our first quarter 2019 operating results increased by $25 million due to the impact of the Combination (including $4 million of project-related and other intangible assets and investment in unconsolidated affiliate-related amortization).
In the first quarter of 2019, a variety of projects and activities contributed to operating income, including:
• | procurement, fabrication and marine activities on the Saudi Aramco Safaniya phase 6 project, awarded in the fourth quarter of 2017, as well as cost savings on the project; |
• | close-out activities and cost savings on the substantially complete Saudi Aramco Safaniya phase 5 project; |
• | engineering, procurement and construction progress on the LIWA EPC project for ORPIC, as well as cost savings on the project; |
• | engineering and procurement progress on Abu Dhabi National Oil Company crude flexibility projects in Ruwais, UAE, awarded in the first quarter of 2018; and |
• | income from our unconsolidated joint venture with CTCI. |
| 53 |
MANAGEMENT’S DISCUSSION AND ANALYSIS OF FINANCIAL CONDITION AND RESULTS OF OPERATIONS
In the first quarter of 2018, a variety of projects and activities contributed to operating income, including:
• | marine hook-up activities utilizing a jack-up barge on the lump-sum EPCI project under the LTA II; |
• | engineering and fabrication progress and pipelay activity by our DB 32 vessel on the Saudi Aramco Safaniya phase 5 project; |
• | marine offshore campaign progress on the Saudi Aramco four jackets and three observation platform project, which was awarded in the fourth quarter of 2016; |
• | the marine campaign for hookup activities and fabrication on two Saudi Aramco EPCI projects; |
• | commencement of two Saudi Aramco projects, the Safaniya phase 6 project, awarded in the fourth quarter of 2017, and the 13 Jackets project, awarded in the first quarter of 2018; and |
• | commencement of the third phase of a large Middle East pipeline repair-related project, awarded in the fourth quarter of 2017. |
APAC—Segment operating income in the first quarters of 2019 and 2018 was $13 million and $73 million, respectively. During the first quarter of 2019, APAC did not materially benefit from the Combination.
In the first quarter of 2019, cost savings and close-out activities on completed projects contributed to operating income, partially offset by cost increases and weather downtime on various projects.
In the first quarter of 2018, a variety of projects and activities contributed to operating income, including:
• | close out of outstanding change orders on active and completed projects; |
• | commencement of the offshore campaign on the Greater Western Flank Phase 2 project, in Australia, as the project progressed from the fabrication phase to prelay campaign; and |
• | reimbursement for vessel standby and downtime costs incurred on active and completed projects. |
Technology—Segment operating income during the first quarter of 2019 was $35 million (including $17 million of project-related and other intangible assets and investment in unconsolidated affiliate-related amortization). The results were primarily associated with licensing and proprietary equipment activity, as well as the supply of catalyst materials, and included equity income from our unconsolidated joint venture, Chevron Lummus Global, L.L.C.
Other Items in Operating Income
Corporate and Other
| Three months ended March 31, |
|
|
|
|
|
|
|
|
|
| |||||
| 2019 |
|
| 2018 |
|
| Change | |||||||||
| (In thousands) |
|
| Percentage | ||||||||||||
Corporate and Other | $ | (181 | ) |
| $ | (77 | ) |
| $ | (104 | ) |
|
| (135 | ) | % |
The increase in Corporate and Other expenses was primarily due to the following:
• | an increase of $58 million in restructuring and integration costs, primarily related to change-in-control, severance, professional fees and costs of settlement of litigation (see Note 10, Restructuring and Integration Costs and Transaction Costs, to the accompanying Financial Statements); and |
• | increased selling, general and administrative expenses for the combined organization. |
| 54 |
MANAGEMENT’S DISCUSSION AND ANALYSIS OF FINANCIAL CONDITION AND RESULTS OF OPERATIONS
Other Non-operating Items
Interest expense, net—Interest expense, net, was $92 million and $12 million in the first quarter of 2019 and 2018, respectively.
Interest expense in the first quarter of 2019 was primarily comprised of:
• | $35 million of interest expense and $2 million of deferred debt issuance costs (“DIC”) amortization associated with the issuance of $1.3 billion principal amount of our 10.625% senior notes due 2024; |
• | $42 million of interest expense and $3 million of DIC amortization associated with our $2.26 billion senior secured term loan facility; and |
• | $3 million of interest expense and $3 million of DIC amortization associated with the Revolving Credit Facility. |
See Note 11, Debt, to the accompanying Financial Statements for further discussion.
Interest expense, net in the first quarter of 2018 was primarily associated with our 8.000% second-lien notes, which were redeemed in May 2018.
Income tax (benefit) expense—During the three months ended March 31, 2019, we recognized an income tax benefit of $21 million (effective tax rate of 26.1%), compared to tax expense of $21 million (effective tax rate of 38.2%) for the three months ended March 31, 2018. Our income tax provision for the first quarter of 2019 benefited from the settlement of a customer claim ($18 million) and a favorable court ruling on tax matters ($16 million), offset by nondeductible, state and other expenses ($30 million).
Inflation and Changing Prices
Our financial statements are prepared in accordance with accounting principles generally accepted in the United States (“GAAP”), generally using historical U.S. dollar accounting (“historical cost”). Statements based on historical cost, however, do not adequately reflect the cumulative effect of increasing costs and changes in the purchasing power of the dollar, especially during times of significant and continued inflation.
In order to minimize the negative impact of inflation on our operations, we attempt to cover the increased cost of anticipated changes in labor, material and service costs either through an estimate of those changes, which we reflect in the original price, or through price escalation clauses in our contracts.
Liquidity and Capital Resources
Our primary sources of liquidity are cash and cash equivalents on hand, cash flows generated from operations and capacity under our revolving credit and other facilities. Our revolving credit and other facilities are also available to provide letters of credit, which are generally issued to customers in the ordinary course of business to support advance payments and performance guarantees in lieu of retention on our contracts, or in certain cases, are issued in support of our insurance programs. We regularly review our sources and uses of funds and may seek to access capital markets or increase our revolving credit and letter of credit capacity to increase our liquidity position and support our ability to take on larger project awards. We also perform periodic strategic reviews of our business portfolio and may adjust our portfolio to dispose of those portions of our business deemed to be non-core to our vertically integrated offering model.
We believe our cash and cash equivalents on hand, cash flows generated from operations, amounts available under our credit facilities and uncommitted bilateral lines of credit and proceeds from previously announced non-core asset sales will be sufficient to finance our capital expenditures, settle our commitments and contingencies (as more fully described in Note 21, Commitments and Contingencies to the Financial Statements) and address our normal, anticipated working capital needs for the foreseeable future.
| 55 |
MANAGEMENT’S DISCUSSION AND ANALYSIS OF FINANCIAL CONDITION AND RESULTS OF OPERATIONS
As discussed above under “Company Overview – Review of Business Portfolio,” we have identified multiple potential buyers, and have initiated marketing efforts, for the sales of our industrial storage tank and U.S. pipe fabrication businesses. Any potential sale would be subject to approval by our Board of Directors. Our credit agreement requires us to use proceeds from any sale of a business generating in excess of $500 million in sales proceeds to reduce our outstanding debt.
There can be no assurance that funding sources will continue to be available, as our ability to generate cash flows from operations, our ability to access our credit facilities and uncommitted bilateral lines of credit, our ability to access capital markets and our ability to sell non-core assets, at reasonable terms or at all, may be impacted by a variety of business, economic, legislative, financial and other factors, which may be outside of our control. Additionally, while we currently have significant uncommitted bonding facilities, primarily to support various commercial provisions in our contracts, a termination or reduction of these bonding facilities could result in the utilization of letters of credit in lieu of performance bonds, thereby reducing the available capacity under our credit facilities and uncommitted bilateral lines of credit. Although we do not anticipate a reduction or termination of the bonding facilities, there can be no assurance that such facilities will continue to be available at reasonable terms to service our ordinary course obligations.
Cash, Cash Equivalents and Restricted Cash
As of March 31, 2018,2019, we had $419$739 million of cash, cash equivalents and restricted cash, as compared to $408$845 million as of December 31, 2017. At2018. Approximately $142 million of our cash and cash equivalents as of March 31, 2018,2019 was within our variable interest entities (“VIEs”) associated with our joint venture and consortium arrangements, which is generally only available for use in our operating activities when distributed to the joint venture and consortium participants. As of March 31, 2019, we had $117approximately $187 million of cash in jurisdictions outside the U.S., principallyin the United Arab Emirates, UK, Singapore, Brazilthe Netherlands, Ireland, India, the Czech Republic and Malaysia.Bahrain. Approximately 2%4.7% of our outstanding cash balance is held in countries that have established government imposedgovernment-imposed currency restrictions that could impede the ability of our subsidiaries to transfer funds to us.
As of March 31, 2018, we had restricted cash and cash equivalents totaling $6 million, compared to $18 million as of December 31, 2017, collateralized to support letters of credits. During the first quarter of 2018, the maximum amount of cash collateral used to support letters of credit was $122 million.
Cash Flow Activities
Operating activities―activities―Net cash (used in) provided by operating activities in the first quarters of 2019 and 2018 and 2017 was $37($244) million and $48$38 million, respectively.
The cash (used in) provided by operating activities primarily reflected our net (loss) income, adjusted for non-cash items and changes in components of our working capital—capital and changes in our current and non-current liabilities. The changes in our working capital during the three months ended March 31, 2019 were primarily driven by accounts receivable, contracts in progress, net of advance billings on contracts, and accounts payable. Fluctuations in working capital are normal in our business. Working capital is impacted by the size of our projects and the achievement of billing milestones on backlogRPOs as we complete certaindifferent phases of our projects.
As of March 31, 2019 and December 31, 2018, negative working capital associated with the projects.Calpine power project and our aggregate proportionate shares of the Cameron LNG and Freeport LNG consortium projects (collectively, the “Focus Projects”) was approximately $506 million and $815 million, respectively.
In the three months ended March 31, 2019, net cash used by working capital was approximately $368 million.
The components of working capital that used cash are:were:
• | Contracts in progress/Advance billings on contracts—a net increase of $638 million, primarily due to the impact of progress on projects within our NCSA segment (including approximately $296 million used for the Focus Projects) and projects within our EARC and MENA segments; and |
• | Accounts receivable—anet increase of $87 million, primarily due to billings in our NCSA, APAC and Technology segments, partially offset by collections within our EARC and MENA segments. |
Accounts receivables—a $68This increase was partially offset by:
• | Accounts payable—an increase of $357 million, primarily driven by project progress across all segments and Corporate. |
The net increase in current and non-current liabilities of $80 million increasewas primarily due to timing of billings and receipt of payments under project contractual terms; and
Accounts payable—a decrease of $90 million driven by progress across allour EARC and APAC segments and dueCorporate, partially offset by our MENA segment. The net increase was primarily associated with accrued contract costs, integration and restructuring costs and a payable to timingthe joint venture member with non-controlling interest, discussed in Note 18, Stockholders’ Equity and Equity-Based Incentive Plans, to the accompanying Financial Statements.
| 56 |
MANAGEMENT’S DISCUSSION AND ANALYSIS OF FINANCIAL CONDITION AND RESULTS OF OPERATIONS
In the three months ended March 31, 2018, net cash used by working capital was approximately $15 million.
The components of billings and vendor payments.working capital that used cash were:
• | Accounts receivables—a $68 million increase, primarily due to timing of billings and receipt of payments under project contractual terms; and |
• | Accounts payable—a decrease of $90 million, driven by progress across all segments, and due to timing of billings and vendor payments. |
The decrease was partially offset by a decrease in Contracts in progress, net of Advance billings on contracts, primarily due to progress on various Saudi Aramco projects, including the lump-sum EPCI project under the LTA II and the Vashishta project, all of which are substantially complete.
In the first quarter of 2017, net cash provided by working capital was $15 million.
The components of working capital that provided cash are:
Accounts receivables—collections across all segments reduced our accounts receivable by $161 million; and
Accounts payable—increases of $95 million in accounts payable were driven by projects progress across all segments.
Those increases were partially offset by a $241 million increase in Contracts in progress, net of Advance billings on contracts. This increase was primarily due to:
progress on the Abkatun A-2 project in the AEA segment, the Saudi Aramco LTA II project in the MEA segment and the Vashishta project in the ASA segment; and
cash utilized by our Ichthys project as the project progressed through the marine installation phase.
|
|
MANAGEMENT’S DISCUSSION AND ANALYSIS OF FINANCIAL CONDITION AND RESULTS OF OPERATIONS
Investing activities―Net cash used in investing activities in the first quarters of 2018 and 2017 was $20 million and $7 million, respectively. The uses in both periods primarily related to capital expenditures. activities―Net cash used in investing activities in the first quarter of 2017 also included2019 was $133 million and was primarily associated with net outflows from advances of $114 million with our third-party consortium participants of proportionately consolidated consortiums (see Note 9, Joint Venture and Consortium Arrangements, to the sale lease backaccompanying Financial Statements) and capital expenditures of the Amazon vessel discussed below.$18 million.
Financing activities―Net cash used in investing activities in the first quarter of 2018 was $20 million and was primarily associated with capital expenditures of $18 million.
Financing activities―Net cash provided by (used in) financing activities in the first quarters of 2019 and 2018 and 2017 was $7$277 million and $12$(7) million, respectively.
Net cash provided in the first quarter of 2019 was primarily attributable to:
• | $178 million of net borrowings under the Revolving Credit Facility discussed below; and |
• | $116 million of net inflows attributable to advances from our equity method joint ventures and proportionately consolidated consortiums. |
The inflows were partially offset by:
• | $6 million of Term Facility payments and $2 million of capital lease payments; |
• | $5 million of distributions to a former joint venture member (see Note 18, Stockholders’ Equity and Equity-Based Incentive Plans, to the accompanying Financial Statements); and |
• | $4 million of repurchases of common stock tendered by participants in our long-term incentive plans for payment of applicable withholding taxes upon vesting of awards under those plans. |
Net cash used in the first quartersquarter of 2018 and 2017 was primarily attributable to repayment of debt and the repurchase of common stock from participants in our long-term incentive plans for payment of applicable withholding taxes upon vesting of awards under those plans.
Effects of Exchange Rate Changes on Cash, Cash Equivalents and Restricted Cash—During the first quarter of 2019, our cash, cash equivalents and restricted cash balance decreased by $6 million, due to the impact of changes in functional currency exchange rates against the U.S. Dollar for non-U.S. Dollar cash balances, primarily for net changes in the Australian Dollar, British Pound and Euro exchange rates. The net unrealized loss on our cash, cash equivalents and restricted cash resulting from these exchange rate movements is reflected in the cumulative translation adjustment component of Other comprehensive income (loss). Our cash, cash equivalents and restricted cash held in non-U.S. Dollar currencies are used primarily for project-related and other operating expenditures in those currencies, and, therefore, our exposure to realized exchange gains and losses is not anticipated to be material.
During the first quarter of 2018, the effect of exchange rate changes on cash, cash equivalents and restricted cash was not material.
| 57 |
MANAGEMENT’S DISCUSSION AND ANALYSIS OF FINANCIAL CONDITION AND RESULTS OF OPERATIONS
Credit and Other Financing Arrangements
Credit Agreement
On May 10, 2018, we entered into a Credit Agreement (the “Credit Agreement”) with a syndicate of lenders and letter of credit issuers, Barclays Bank PLC, as administrative agent for a term facility under the Credit Agreement, and Crédit Agricole Corporate and Investment Bank, as administrative agent for the other facilities under the Credit Agreement. The Credit Agreement provides for borrowings and letters of credit in the aggregate principal amount of $4.65 billion, consisting of the following:
• | a $2.26 billion senior secured, seven-year term loan facility (the “Term Facility”), the full amount of which was borrowed, and $319.3 million of which has been deposited into a restricted cash collateral account (the “LC Account”) to secure reimbursement obligations in respect of up to $310.0 million of letters of credit (the “Term Facility Letters of Credit”); |
• | a $1.0 billion senior secured revolving credit facility (the “Revolving Credit Facility”); and |
• | a $1.39 billion senior secured letter of credit facility (the “LC Facility”). |
The Credit Agreement provides that:
• | Term Facility Letters of Credit can be issued in an amount up to the amount on deposit in the LC Account ($319.9 million at March 31, 2019), less an amount equal to approximately 3% of such amount on deposit (to be held as a reserve for related letter of credit fees), not to exceed $310.0 million; |
• | subject to compliance with the financial covenants in the Credit Agreement, the full amount of the Revolving Credit Facility is available for revolving loans; |
• | subject to our utilization in full of our capacity to issue Term Facility Letters of Credit, the full amount of the Revolving Credit Facility is available for the issuance of performance letters of credit and up to $200 million of the Revolving Credit Facility is available for the issuance of financial letters of credit; and |
• | the full amount of the LC Facility is available for the issuance of performance letters of credit. |
Borrowings are available under the Revolving Credit Facility for working capital and other general corporate purposes. Certain existing letters of credit outstanding under our previously existing Amended and Restated Credit Agreement, dated as of June 30, 2017 (the “Prior Credit Agreement”), and certain existing letters of credit outstanding under CB&I’s previously existing credit facilities have been deemed issued under the Credit Agreement, and letters of credit were issued under the Credit Agreement to backstop certain other existing letters of credit issued for the account of McDermott, CB&I and their respective subsidiaries and affiliates.
The Credit Agreement includes mandatory commitment reductions and prepayments in connection with, among other things, certain asset sales and casualty events (subject to reinvestment rights with respect to asset sales of less than $500 million). In addition, we are required to make annual prepayments of term loans under the Term Facility and cash collateralize letters of credit issued under the Revolving Credit Facility and the LC Facility with 75% of excess cash flow (as defined in the Credit Agreement), reducing to 50% of excess cash flow and 25% of excess cash flow depending on our secured leverage ratio.
Term Facility—As of March 31, 2019, we had $2.2 billion of borrowings outstanding under the Term Facility. Proceeds from our borrowing under the Term Facility were used, together with proceeds from the issuance of the Senior Notes and cash on hand, (1) to consummate the Combination in 2018, including the repayment of certain existing indebtedness of CB&I and its subsidiaries, (2) to redeem $500 million aggregate principal amount of our 8.000% second-lien notes, (3) to prepay existing indebtedness under, and to terminate in full, the Prior Credit Agreement, and (4) to pay fees and expenses in connection with the Combination, the Credit Agreement and the issuance of the Senior Notes.
Principal under the Term Facility is payable quarterly and interest is assessed at either (1) the Eurodollar rate plus a margin of 5.00% per year or (2) the base rate (the highest of the Federal Funds rate plus 0.50%, the Eurodollar rate plus 1.0%, or the administrative agent’s prime rate) plus a margin of 4.00%, subject to a 1.0% floor with respect to the Eurodollar rate and is payable periodically dependent upon the interest rate in effect during the period. On May 8, 2018, we entered into a U.S. dollar interest rate swap arrangement to mitigate exposure associated with cash flow variability on $1.94 billion of the $2.26 billion Term Facility. This resulted in a weighted average interest rate of 7.70%, inclusive of the applicable margin during the three months ended March 31, 2019. The Credit Agreement requires us to prepay a portion of the term loans made under the Term Facility on the last day of each fiscal quarter in an amount equal to $5.65 million.
| 58 |
MANAGEMENT’S DISCUSSION AND ANALYSIS OF FINANCIAL CONDITION AND RESULTS OF OPERATIONS
The future scheduled maturities of the Term Facility are:
|
| (In millions) |
| |
2019 |
| $ | 17 |
|
2020 |
|
| 23 |
|
2021 |
|
| 23 |
|
2022 |
|
| 23 |
|
2023 |
|
| 23 |
|
Thereafter |
|
| 2,128 |
|
|
| $ | 2,237 |
|
Additionally, as of March 31, 2019, there were approximately $297 million of Term Facility letters of credit issued (including $48 million of financial letters of credit) under the Credit Agreement, leaving approximately $13 million of available capacity under the Term Facility.
Revolving Credit Facility and LC Facility—We have a $1.0 billion Revolving Credit Facility which is scheduled to expire in May 2023. As of March 31, 2019, we had approximately $178 million in borrowings and $108 million of letters of credit outstanding (including $49 million of financial letters of credit) under the Revolving Credit Facility, leaving $714 million of available capacity under this facility. During the three months ended March 31, 2019, the maximum borrowing under the Revolving Credit Facility was $317 million. We also have a $1.39 billion LC Facility that is scheduled to expire in May 2023. As of March 31, 2019, we had approximately $1.37 billion of letters of credit outstanding, leaving $19 million of available capacity under the LC Facility. If we borrow funds under the Revolving Credit Facility, interest will be assessed at either the base rate plus a floating margin ranging from 2.75% to 3.25% (3.25% at March 31, 2019) or the Eurodollar rate plus a floating margin ranging from 3.75% to 4.25% (4.25% at March 31, 2019), in each case depending on our leverage ratio (calculated quarterly). We are charged a commitment fee of 0.50% per year on the daily amount of the unused portions of the commitments under the Revolving Credit Facility and the LC Facility. Additionally, with respect to all letters of credit outstanding under the Credit Agreement, we are charged a fronting fee of 0.25% per year and, with respect to all letters of credit outstanding under the Revolving Credit Facility and the LC Facility, we are charged a participation fee of (i) between 3.75% to 4.25% (4.25% at March 31, 2019) per year in respect of financial letters of credit and (ii) between 1.875% to 2.125% (2.125% at March 31, 2019) per year in respect of performance letters of credit, in each case depending on our leverage ratio (calculated quarterly). We are also required to pay customary issuance fees and other fees and expenses in connection with the issuance of letters of credit under the Credit Agreement.
Credit Agreement Covenants—The Credit Agreement includes the following financial covenants that are tested on a quarterly basis:
• | the minimum permitted fixed charge coverage ratio (as defined in the Credit Agreement) is 1.50 to 1.00; |
• | the maximum permitted leverage ratio is (i) 4.25 to 1.00 for each fiscal quarter ending on or before September 30, 2019, (ii) 4.00 to 1.00 for the fiscal quarter ending December 31, 2019, (iii) 3.75 to 1.00 for each fiscal quarter ending after December 31, 2019 and on or before December 31, 2020, (iv) 3.50 to 1.00 for each fiscal quarter ending after December 31, 2020 and on or before December 31, 2021 and (v) 3.25 to 1.00 for each fiscal quarter ending after December 31, 2021; and |
• | the minimum liquidity (as defined in the Credit Agreement, but generally meaning the sum of McDermott’s unrestricted cash and cash equivalents plus unused commitments under the Credit Agreement available for revolving borrowings) is $200 million. |
In addition, the Credit Agreement contains various covenants that, among other restrictions, limit our ability to:
• | incur or assume indebtedness; |
• | grant or assume liens; |
• | make acquisitions or engage in mergers; |
• | sell, transfer, assign or convey assets; |
• | make investments; |
• | repurchase equity and make dividends and certain other restricted payments; |
• | change the nature of our business; |
| 59 |
MANAGEMENT’S DISCUSSION AND ANALYSIS OF FINANCIAL CONDITION AND RESULTS OF OPERATIONS
• | engage in transactions with affiliates; |
• | enter into burdensome agreements; |
• | modify our organizational documents; |
• | enter into sale and leaseback transactions; |
• | make capital expenditures; |
• | enter into speculative hedging contracts; and |
• | make prepayments on certain junior debt. |
The Credit Agreement contains events of default that we believe are customary for a secured credit facility. If an event of default relating to bankruptcy or other insolvency event occurs, all obligations under the Credit Agreement will immediately become due and payable. If any other event of default exists under the Credit Agreement, the lenders may accelerate the maturity of the obligations outstanding under the Credit Agreement and exercise other rights and remedies. In addition, if any event of default exists under the Credit Agreement, the lenders may commence foreclosure or other actions against the collateral.
If any default exists under the Credit Agreement, or if we are unable to make any of the representations and warranties in the Credit Agreement at the applicable time, we will be unable to borrow funds or have letters of credit issued under the Credit Agreement.
Credit Agreement Covenants Compliance—As of March 31, 2019, we were in compliance with all our restrictive and financial covenants under the Credit Agreement. The financial covenants as of March 31, 2019 are summarized below:
Ratios | Requirement | Actual | ||
Minimum fixed charge coverage ratio | 1.50x | 2.47x | ||
Maximum total leverage ratio | 4.25x | 2.50x | ||
Minimum liquidity | $ | 200 million | $ | 1,140 million |
Future compliance with our financial and restrictive covenants under the Credit Agreement could be impacted by circumstances or conditions beyond our control, including, but not limited to, the delay or cancellation of projects, decreased letter of credit capacity, decreased profitability on our projects, changes in currency exchange or interest rates, performance of pension plan assets or changes in actuarial assumptions. Further, we could be impacted if our customers experience a material change in their ability to pay us or if the banks associated with the Credit Agreement were to cease operations, or if there is a full or partial break-up of the European Union (“EU”) or its currency, the Euro.
Letter of Credit Agreement
On October 30, 2018, we, as a guarantor, entered into a Letter of Credit Agreement (the “Letter of Credit Agreement”) with McDermott Technology (Americas), Inc., McDermott Technology (US), Inc. and McDermott Technology, B.V., each a wholly owned subsidiary of ours, as co-applicants, and Barclays Bank PLC, as administrative agent. The Letter of Credit Agreement provides for a facility for extensions of credit in the form of performance letters of credit in the aggregate face amount of up to $230 million (the “$230 Million LC Facility”). The $230 Million LC Facility is scheduled to expire in December 2021. The obligations under the Letter of Credit Agreement are unconditionally guaranteed on a senior secured basis by us and substantially all of our wholly owned subsidiaries, other than the co-applicants (which are directly obligated thereunder) and several captive insurance subsidiaries and certain other designated or immaterial subsidiaries. The liens securing the $230 Million LC Facility will rank equal in priority with the liens securing obligations under the Credit Agreement. The Letter of Credit Agreement includes financial and other covenants and provisions relating to events of default that are substantially the same as those in the Credit Agreement. As of March 31, 2019, there were approximately $205 million of letters of credit issued (or deemed issued) under the $230 million LC Facility, leaving approximately $25 million of available capacity.
Letter of Credit Agreement Covenants Compliance—As of March 31, 2019, we were in compliance with all our restrictive and financial covenants under the Letter of Credit Agreement.
| 60 |
MANAGEMENT’S DISCUSSION AND ANALYSIS OF FINANCIAL CONDITION AND RESULTS OF OPERATIONS
Senior Notes
On April 18, 2018, we issued $1.3 billion in aggregate principal of 10.625% senior notes due 2024 (the “Senior Notes”), pursuant to an indenture we entered into with Wells Fargo Bank, National Association, as trustee (the “Senior Notes Indenture”). Interest on the Senior Notes is payable semi-annually in arrears, and the Senior Notes are scheduled to mature in May 2024. However, at any time or from time to time on or after May 1, 2021, we may redeem the Senior Notes, in whole or in part, at the redemption prices (expressed as percentages of principal amount of the Senior Notes to be redeemed) set forth below, together with accrued and unpaid interest to (but excluding) the redemption date (subject to the right of holders of record on the relevant record date to receive interest due on the relevant interest payment date), if redeemed during the 12-month period beginning on May 1 of the years indicated:
Year |
| Optional redemption price |
| |||
2021 |
|
| 105.313 | % | ||
2022 |
|
| 102.656 | % | ||
2023 and thereafter |
|
| 100.000 | % | ||
In addition, prior to May 1, 2021, we may redeem up to 35.0% of the aggregate principal amount of the outstanding Senior Notes, in an amount not greater than the net cash proceeds of one or more qualified equity offerings (as defined in the Senior Notes Indenture) at a redemption price equal to 110.625% of the principal amount of the notes to be redeemed, plus accrued and unpaid interest to (but excluding) the date of redemption (subject to the right of holders of record on the relevant record date to receive interest due on the relevant interest payment date), subject to certain limitations and other requirements. The Senior Notes may also be redeemed, in whole or in part, at any time prior to May 1, 2021 at our option, at a redemption price equal to 100% of the principal amount of the Senior Notes redeemed, plus the applicable premium (as defined in the Senior Notes Indenture) as of, and accrued and unpaid interest to (but excluding) the applicable redemption date (subject to the right of the holders of record on the relevant record date to receive interest due on the relevant interest payment date).
Senior Notes Covenants—The Senior Notes Indenture contains covenants that, among other things, provide limits around our ability to: (1) incur or guarantee additional indebtedness or issue preferred stock; (2) make investments or certain other restricted payments; (3) pay dividends or distributions on our capital stock or purchase or redeem our subordinated indebtedness; (4) sell assets; (5) create restrictions on the ability of our restricted subsidiaries to pay dividends or make other payments to us; (6) create certain liens; (7) sell all or substantially all of our assets or merge or consolidate with or into other companies; (8) enter into transactions with affiliates; and (9) create unrestricted subsidiaries. Those covenants are subject to various exceptions and limitations.
Senior Notes Covenants Compliance—As of March 31, 2019, we were in compliance with all our restrictive covenants under the Senior Notes Indenture. Future compliance with our restrictive covenants under the Senior Notes Indenture could be impacted by circumstances or conditions beyond our control, including, but not limited to, those discussed above with respect to the Credit Agreement.
Other Financing Arrangements
North Ocean (“NO”) Financing―On September 30, 2010, McDermott International, Inc., as guarantor, and NO 105 AS, one of our subsidiaries, as borrower, entered into a financing agreement to pay a portion of the construction costs of the NO 105. Borrowings under the agreement are secured by, among other things, a pledge of all of the equity of NO 105 AS, a mortgage on the NO 105, and a lien on substantially all of the other assets of NO 105 AS. As of March 31, 2019, the outstanding borrowing under this facility was approximately $16 million. Future maturities are approximately $8 million for the remainder of 2019 and $8 million in 2020.
Receivables Factoring―During the first quarter of 2019, we sold, without recourse, approximately $35 million of receivables under an uncommitted receivables purchase agreement in Mexico at a discount rate of applicable LIBOR plus a margin of 1.40% - 2.00% and Interbank Equilibrium Interest Rate in Mexico plus a margin of 1.40% - 1.70%. We recorded approximately $1 million of factoring costs in Other operating income (expense) during the first quarter of 2019. Ten percent of the receivables sold are withheld and received on the due date of the original invoice. We have received cash, net of fees and amounts withheld, of approximately $31 million under these arrangements during the first quarter of 2019.
| 61 |
MANAGEMENT’S DISCUSSION AND ANALYSIS OF FINANCIAL CONDITION AND RESULTS OF OPERATIONS
Uncommitted Facilities—We are party to a number of short-term uncommitted bilateral credit facilities and surety bond arrangements (the “Uncommitted Facilities”) across several geographic regions, as follows:
|
| March 31, 2019 |
|
| December 31, 2018 |
| ||||||||||
|
| Uncommitted Line Capacity |
|
| Utilized |
|
| Uncommitted Line Capacity |
|
| Utilized |
| ||||
|
| (In millions) |
| |||||||||||||
Bank Guarantee and Bilateral Letter of Credit (1) |
| $ | 1,668 |
|
| $ | 1,095 |
|
| $ | 1,669 |
|
| $ | 1,060 |
|
Surety Bonds (2) |
| 840 |
|
| 532 |
|
|
| 842 |
|
|
| 475 |
| ||
(1) | Approximately $175 million of this capacity is available only upon provision of an equivalent amount of cash collateral. |
(2) | Excludes approximately $360 million of surety bonds maintained on behalf of CB&I’s former Capital Services Operations, which were sold to CSVC Acquisition Corp (“CSVC”) in June 2017. We also continue to maintain guarantees on behalf of CB&I’s former Capital Services Operations business in support of approximately $45 million of RPOs. We are entitled to an indemnity from CSVC for both the surety bonds and guarantees. |
Finance Lease Obligation
Our significant finance lease obligation is as follows:
The Amazon, a pipelay and construction vessel, was purchased by us in February 2017, sold to an unrelated third party (the “Amazon Owner”) and leased back under a long-term bareboat charter that gave us the right to use the vessel and was recorded as an operating lease. On July 27, 2018, we entered into agreements (the “Amazon Modification Agreements”) providing for certain modifications to the Amazon vessel and related financing and amended bareboat charter arrangements. The total cost of the modifications, including project management and other fees and expenses, is expected to be in the range of approximately $260 million to $290 million. The Amazon Owner is expected to fund the cost of the modifications primarily through an export credit-backed senior loan provided by a group of lenders, supplemented by expected direct capital expenditures by us of approximately $58 million over the course of the modifications. The amended bareboat charter arrangement is accounted for as a finance lease, recognizing Property, plant and equipment and Lease obligation for the present value of future minimum lease payments. The cost of modifications will be recorded in Property, plant and equipment with a corresponding liability for direct capital expenditures not incurred by us. The finance lease obligation will increase upon completion of the modifications and funding by the Amazon Owner. As of March 31, 2019, Property, plant and equipment, net included a $51 million asset (net of accumulated amortization of $4 million) and a finance lease liability of approximately $52 million. As of December 31, 2018, Property, plant and equipment, net included a $52 million asset (net of accumulated amortization of $3 million) and a finance lease liability of approximately $53 million.
Redeemable Preferred Stock
On November 29, 2018 (the “Closing Date”), we completed a private placement of (1) 300,000 shares of 12% Redeemable Preferred Stock, par value $1.00 per share (the “Redeemable Preferred Stock”), and (2) Series A warrants (the “Warrants”) to purchase approximately 6.8 million shares of our common stock, with an initial exercise price per share of $0.01, for aggregate proceeds of $289.5 million, before payment of approximately $18 million of directly related issuance costs.
Redeemable Preferred Stock—The Redeemable Preferred Stock will initially have an Accreted Value (as defined in the Certificate of Designation with respect to the Redeemable Preferred Stock (the “Certificate of Designation”)) of $1,000.00 per share. The holders of the Redeemable Preferred Stock will be entitled to receive cumulative compounding preferred cash dividends quarterly in arrears at a fixed rate of 12.0% per annum compounded quarterly (of which 3.0% accrues each quarter) on the Accreted Value per share (the “Dividend Rate”). The cash dividends are payable only when, as and if declared by our Board of Directors out of funds legally available for payment of dividends. If a cash dividend is not declared and paid in respect of any dividend payment period ending on or prior to December 31, 2021, then the Accreted Value of each outstanding share of Redeemable Preferred Stock will automatically be increased by the amount of the dividend otherwise payable for such dividend payment period, except the applicable dividend rate for this purpose is 13.0% per annum. Such automatic increase in the Accreted Value of each outstanding share of Redeemable Preferred Stock would be in full satisfaction of the preferred dividend that would have otherwise accrued for such dividend payment period. Our Board of Directors declared, and we paid cash dividends on the Redeemable Preferred Stock on the first dividend payment date (December 31, 2018), but our Board of Directors did not declare cash dividends on the Redeemable Preferred Stock on the March 31, 2019 dividend payment date and, as a result, the Accreted Value of the Redeemable Preferred Stock was increased by the amount ofthe accrued but unpaid dividend (i.e., a paid-in-kind (“PIK”) dividend).
| 62 |
MANAGEMENT’S DISCUSSION AND ANALYSIS OF FINANCIAL CONDITION AND RESULTS OF OPERATIONS
The Redeemable Preferred Stock has no stated maturity and will remain outstanding indefinitely unless repurchased or redeemed by us.
The Redeemable Preferred Stock will have a liquidation preference equal to the then applicable Minimum Return (the “Liquidation Preference”) plus accrued and unpaid dividends. The Liquidation Preference will initially be equal to $1,200.00 per share. The “Minimum Return” is equal to a multiple of invested capital (“MOIC”) (as defined in the Certificate of Designation) as follows, exclusive of cash dividends previously paid:
• | prior to January 1, 2020, a MOIC multiple of 1.2; | ||
• | on or after January 1, 2020 but prior to January 1, 2022, a MOIC multiple of 1.25; | ||
• | on or after January 1, 2022 but prior to January 1, 2023, a MOIC multiple of 1.20; | ||
• | on or after January 1, 2023 but prior to January 1, 2025, a MOIC multiple of 1.15; and | ||
• | on or after January 1, 2025, a MOIC multiple of 1.20. |
We may redeem the Redeemable Preferred Stock at any time for an amount per share of Redeemable Preferred Stock equal to the Liquidation Preference of each such share plus all accrued dividends on such share (such amount per share, the “Redemption Consideration”).
At any time after the seventh anniversary of the Closing Date, each holder may elect to have us fully redeem such holder’s then outstanding Redeemable Preferred Stock in cash, to the extent we have funds legally available for payment of dividends, at a redemption price per share equal to the Redemption Consideration for each share.
Upon a change of control (as defined in the Certificate of Designation), if we have not previously redeemed the Redeemable Preferred Stock and the holders of a majority of the then-outstanding Redeemable Preferred Stock do not agree with us to an alternative treatment, then in connection with such change of control, each holder may elect either: (1) to cause us to redeem all, but not less than all, of its outstanding Redeemable Preferred Stock at a redemption price per share equal to the Redemption Consideration, which would be payable in full in cash or, if any of the Senior Notes are then outstanding, payable partially in cash in an amount equal to 101% of the Share Purchase Price (as defined in the Certificate of Designation) (or such lower amount as may be required under the Senior Notes Indenture) and the remainder in shares of our common stock based on a per share price equal to 96% of the volume-weighted average price of our common stock on the New York Stock Exchange during the 10 trading days prior to the announcement of such change of control; (2) to receive a substantially equivalent security to the Redeemable Preferred Stock in the surviving entity of the change of control; or (3) to continue to hold the Redeemable Preferred Stock if we are the surviving entity in the change of control. However, any such redemption in cash will be tolled until a date that will not result in the Redeemable Preferred Stock being characterized as “disqualified stock,” “disqualified equity interest” or a similar concept under our debt instruments.
The fair value upon issuance represented the net impact of $289.5 million of aggregate proceeds, less $18 million of fees and $43 million of fair value assigned to the warrants described below (separately included within Capital in excess of par value in our Balance Sheet). The fair value measurement upon issuance was based on inputs that were not observable in the market and thus represented level 3 inputs. We will record accretion as an adjustment to Retained earnings (deficit) over the seven years from the Closing Date through the expected redemption date of November 29, 2025 using the effective interest method. Through March 31, 2019, we recorded cumulative accretion of approximately $5 million with respect to the Redeemable Preferred Stock, including approximately $4 million during the three months ended March 31, 2019. As of March 31, 2019, the Redeemable Preferred Stock balance was $243 million, adjusted for accretion and the PIK dividend of approximately $10 million. During 2018, approximately $3 million of cash dividends were paid to the holders of the Redeemable Preferred Stock.
Warrants—The Warrants are exercisable at any time after the earlier of (1) any change of control or the commencement of proceedings for the voluntary or involuntary dissolution, liquidation or winding up of us and (2) the first anniversary of the Closing Date, and from time to time, in whole or in part, until the tenth anniversary of the Closing Date. The fair value measurement of the Warrants was based on the market-observable fair value of our common stock upon issuance and thus represented a level 1 input.
| 63 |
MANAGEMENT’S DISCUSSION AND ANALYSIS OF FINANCIAL CONDITION AND RESULTS OF OPERATIONS
The exercise price and the number of shares of common stock for which a Warrant is exercisable are subject to adjustment from time to time upon the occurrence of certain events including: (1) payment of a dividend or distribution to holders of shares of our common stock payable in common stock, (2) the distribution of any rights, options or warrants to all holders of our common stock entitling them for a period of not more than 60 days to purchase shares of common stock at a price per share less than the fair market value per share, (3) a subdivision, combination, or reclassification of our common stock, (4) a distribution to all holders of our common stock of cash, any shares of our capital stock (other than our common stock), evidences of indebtedness or other assets of ours, and (5) any dividend of shares of a subsidiary of ours in a spin-off transaction.
Capital Expenditures
As part of our strategic growth program, our management regularly evaluates our marine vessel fleet and our fabrication yard construction capacity to ensure our fleet and construction capabilities are adequately aligned with our overall growth strategy. These assessments may result in capital expenditures to construct, upgrade, acquire or operate vessels or acquire or upgrade fabrication yards that would enhance or grow our technical capabilities, or may involve engaging in discussions to dispose of certain marine vessels or fabrication yards.
Capital expenditures for the first quarters of 20182019 and 20172018 were $18 million and $63$18 million, respectively, as discussed below:
Capital expenditures for the three months ended March 31, 2018 were primarily attributable to our vessel upgrades and information technology update costs.
• | Capital expenditures for the 2019 period were primarily attributable to our vessel and information technology upgrades. |
Capital expenditures for the three months ended March 31, 2017 were primarily attributable to the purchase of the pipelay and construction vessel, the Amazon. Following the purchase, we sold the Amazon to an unrelated third party and simultaneously entered into an 11-year bareboat charter agreement with the purchaser.
• | Capital expenditures for the 2018 period were primarily attributable to our vessel and information technology upgrades. |
During the remainder of 2018,2019, we expect to spend approximately $100$140 million for capital projects, such as our new administrative headquarters in Houston, Texas and various vessel upgrades and capital maintenance projects.
Credit AgreementsOther
AsShelf Registration Statement―We filed a shelf registration statement with the SEC in September 2018. The registration statement became effective automatically and is scheduled to expire in September 2021. The shelf registration statement enables us to offer and sell shares of March 31, 2018,our common or preferred stock and issue debt or other securities from time to time.
Other―A portion of our pension plans’ assets are invested in EU government securities, which could be impacted by economic turmoil in Europe or a full or partial break-up of the EU or its currency, the Euro. However, given the long-term nature of pension funding requirements, in the event any of our pension plans (including those with investments in EU government securities) become materially underfunded from a decline in value of our plan assets, we had $390 million of outstanding letters of credit issuedbelieve our cash on hand and amounts available under the letterRevolving Credit Facility would be sufficient to fund any increases in future contribution requirements.
We are a defendant in a number of credit facility provided under our principal credit agreement (the “Current Credit Agreement”),lawsuits arising in the normal course of business, and we had $537 million of total debt, including current maturities, net of debt issuance costs of $5 million. In addition, as of March 31, 2018 we had $545 million of outstanding bank guarantees issued under uncommitted lines of credit and $48 million of surety bonds issued under general agreements of indemnity.
As of March 31, 2018, we werehave in compliance with the financial and other covenants under the Current Credit Agreement, including those as shown below:
|
|
| |||||
|
|
| |||||
|
|
| |||||
|
|
|
Senior Secured Notes—On April 9, 2018, we gave a conditional notice for full optional redemption of all our outstanding senior secured notes due 2021 (the “Outstanding Senior Secured Notes”) on May 10, 2018, which date is subject to extension through June 8, 2018. The redemption price will be equal to 102% of the principal amount of the Outstanding Senior Secured Notes, plus accrued and unpaid interest. The redemption is subject to our depositing, with the trustee for the Outstanding Senior Secured Notes, funds sufficient to pay the redemption pricetype of work that we perform. As a matter of standard policy, we review our litigation accrual quarterly and, as further information becomes known on pending cases, we may record increases or decreases, as appropriate, for all of the Outstanding Senior Secured Notes, plus accruedthese reserves. See Note 21, Commitments and unpaid interest.
For additional information, see Note 8, DebtContingencies, to the accompanying Consolidated Financial Statements.Statements for a discussion of pending litigation.
Financing of the Combination
|
|
MANAGEMENT’S DISCUSSION AND ANALYSIS OF FINANCIAL CONDITION AND RESULTS OF OPERATIONS
On December 18, 2017, in connection with the Business Combination Agreement that we entered into with CB&I, we entered into or received commitment letters (including the exhibits and other attachments thereto, and together with any amendments, modifications or supplements thereto, the “Commitment Letters”) from certain financial institutions to provide debt financing for the Combination. Pursuant to the Commitment Letters, as amended and restated through the date of this report, we expect the following financing arrangements to be reflected in a new credit agreement to be entered into by certain of our subsidiaries (the “Borrowers”) on or before the closing of the Combination (the “New Credit Agreement”):
a senior secured revolving credit facility providing for revolving credit borrowings and letters of credit in an aggregate principal or face amount of $1.0 billion outstanding at any one time (the “Revolving Facility”);
a senior secured letter of credit facility providing for letters of credit in the aggregate face amount of $1.39 billion outstanding at any one time (the “LC Facility”); and
a senior secured term loan facility providing for borrowings in the aggregate principal amount of $2.26 billion (the “Term Facility”), $319 million of which will be deposited into a cash collateral account to secure reimbursement obligations in respect of up to $310 million of letters of credit issuable under the Term Facility.
In addition, on April 18, 2018, McDermott Escrow 1, Inc. and McDermott Escrow 2, Inc. (together, the “Escrow Issuers”) completed the previously announced offering of $1.3 billion in aggregate principal amount of 10.625% senior unsecured notes due 2024 (the “2024 Notes”). The Escrow Issuers represent variable interest entities which will consolidated by McDermott International, Inc. beginning in the second quarter of 2018. The 2024 Notes were offered to qualified institutional buyers in reliance on Rule 144A under the Securities Act of 1933, as amended (the “Securities Act”), and to certain non-U.S. persons in transactions outside the United States in reliance on Regulation S under the Securities Act. The 2024 Notes were issued pursuant to an Indenture, dated April 18, 2018 (the “Indenture”), by and among the Escrow Issuers and Wells Fargo Bank, National Association, as trustee. The 2024 Notes are scheduled to mature on May 1, 2024.
Pursuant to an escrow agreement (the “Escrow Agreement”), by and among the Escrow Issuers and Wells Fargo Bank, National Association, as escrow agent (the “Escrow Agent”), the proceeds of the offering of the 2024 Notes, together with approximately $28 million, to provide funds sufficient to pay interest on the 2024 Notes through June 29, 2018, were deposited into a segregated escrow account with the Escrow Agent. The funds will remain in escrow until the date on which certain escrow conditions are satisfied and the escrow proceeds are released (the “Escrow Conditions”). Concurrent with the satisfaction of the Escrow Conditions, the Escrow Issuers will merge with and into McDermott Technology (Americas), Inc. (“McDermott Technology (Americas)”) and McDermott Technology (US), Inc. (together with McDermott Technology (Americas), the “Post-Merger Co-Issuers”), with each Post-Merger Co-Issuer being a surviving entity that will assume, by operation of law, the obligations of the applicable Escrow Issuer under the 2024 Notes. Each of the Post-Merger Co-Issuers is a wholly owned subsidiary of McDermott International, Inc.
The 2024 Notes will be subject to a special mandatory redemption at a redemption price equal to 100% of the initial issue price of the 2024 Notes plus accrued interest to, but not including, the redemption date if the Escrow Conditions are not satisfied or the Escrow Issuers determine in their discretion that the Escrow Conditions are incapable of being satisfied on or prior to June 29, 2018.
The proceeds of the offering of the 2024 Notes and loans under the New Credit Agreement are intended to be used: (a) on the closing date for the Combination (the “Effective Date”) to (1) consummate the Combination, including the repayment of certain existing indebtedness of CBI and its subsidiaries, (2) redeem Outstanding Senior Secured Notes, (3) prepay existing indebtedness under, and to terminate in full, the Current Credit Agreement (as defined in Note 8, Debt, to the accompanying Consolidated Financial Statements), and (4) pay fees and expenses in connection with the Combination, the New Credit Agreement and the issuance of the 2024 Notes; and (b) for working capital and other general corporate purposes. On the Effective Date, certain existing letters of credit outstanding under the Current Credit Agreement and certain existing letters of credit outstanding under CBI’s existing credit facilities will be deemed issued under the New Credit Agreement, and letters of credit will be issued under the New Credit Agreement to backstop certain other existing letters of credit issued for the account of McDermott International, Inc., CBI and their respective subsidiaries and affiliates.
For additional information regarding the Revolving Facility, the LC Facility, the Term Facility and the 2024 Notes, see Note 2, Business Combination Agreement with Chicago Bridge and Iron Company N.V. (“CB&I”), to the accompanying Consolidated Financial Statements.
|
|
MANAGEMENT’S DISCUSSION AND ANALYSIS OF FINANCIAL CONDITION AND RESULTS OF OPERATIONS
Critical Accounting Policies and Estimates
For a discussion of the impact of critical accounting policies and estimates on our Consolidated Financial Statements, refer to Item 7 “Management’s Discussion and Analysis of Financial Condition and Results of Operations” included in the 20172018 Form 10-K.
See For a discussion of the impact of the new accounting standards adopted in 2019 on our significant accounting policies, see Note 1, 2, Basis of Presentation and Significant Accounting Policies, to the accompanying ConsolidatedFinancial Statements.
New Accounting Standards
See Note 2, Basis of Presentation and Significant Accounting Policies, to the accompanying Financial Statements for a discussion of the potential impact of new accounting standards issued but not adopted as of March 31, 2019 on our unaudited Consolidated Financial Statements.
|
|
|
QUANTITATIVE AND QUALITATIVE DISCLOSURES ABOUT MARKET RISK
Item 3. QuantitativeQuantitative and Qualitative Disclosures about Market Risk
Foreign Currency Exchange Risk
In the normal course of business, our results of operations are exposed to certain market risks, primarily associated with fluctuations in currency exchange rates.
We have operations in many locations around the world and as a result,are involved in transactions in currencies other than those of our financialentity’s functional currencies, which could adversely affect our results could be significantly affected by factors such asof operations due to changes in currency exchange rates or weak economic conditions in foreign markets. In order toWe manage thethese risks associated with currency exchange rate fluctuations we attempt to hedgeby hedging those risks with foreign currency derivative instruments. Historically, we have hedged those risks with foreign currency forward contracts. In certain cases, contracts with our customers may contain provisions under which payments from our customers are denominated in U.S. dollars and in a foreign currency. The payments denominated in a foreign currency are designed to compensate us for costs that we expect to incur in such foreign currency. In these cases, we may use derivative instruments to reduce the risks associated with currency exchange rate fluctuations arising from differences in timing of our foreign currency cash inflows and outflows. Our operationalThe related gains and losses on these contracts are either: (1) deferred as a component of Accumulated Other Comprehensive Income (“AOCI”) until the hedged item is recognized in earnings; (2) offset against the change in fair value of the hedged firm commitment through earnings; or (3) recognized immediately in earnings.
At March 31, 2019, the notional value of our outstanding forward contracts to hedge certain foreign currency exchange-related operating exposures was $887 million. The total fair value of these contracts was a net liability of approximately $10 million at March 31, 2019. The potential change in fair value for our outstanding contracts resulting from a hypothetical ten percent change in quoted foreign currency exchange rates would have been approximately $2 million at March 31, 2019. This potential change in fair value of our outstanding contracts would be offset by the change in fair value of the associated underlying operating exposures.
We are exposed to fluctuating exchange rates related to the effects of translating financial statements of entities with functional currencies other than the U.S. Dollar into our reporting currency. Net movements in the Australian Dollar, British Pound, and Euro exchange rates against the U.S. Dollar unfavorably impacted the cumulative translation adjustment component of AOCI by approximately $39 million, net of tax, and our cash flows and cash balances, though predominately held in U.S. dollars, may consistbalance by approximately $6 million as of different currencies at various points in time in orderMarch 31, 2019. We generally do not hedge our exposure to execute our project contracts globally. Non-U.S. denominated asset and liability balances are subject topotential foreign currency fluctuations when measured period to period for financial reporting purposes in U.S. dollars.translation adjustments.
Interest Rate Risk
As of March 31, 2018,2019, we had no material future earnings orcontinued to utilize a U.S. dollar floating-to-fixed interest rate swap arrangement to mitigate exposure associated with cash flow exposures fromvariability on the Term Facility in an aggregate notional value of $1.94 billion. The swap arrangement has been designated as a cash flow hedge as its critical terms matched those of the Term Facility at inception and through March 31, 2019. Accordingly, changes in interest rates on our outstanding debt obligations, as substantially allthe fair value of those obligations had fixed interest rates.
For additional quantitativethe swap arrangement are initially recorded in AOCI and qualitative disclosures about market risk, see Item 7A, Quantitative and Qualitative Disclosures about Market Risk, includedthen reclassified into earnings in the 2017 Form 10-K.period in which corresponding interest payments are made. As of March 31, 2019, the fair value of the swap arrangement was in a net liability position totaling approximately $45 million. The potential change in fair value for our interest rate swap resulting from a hypothetical one percent change in the Eurodollar rate would have been approximately $56 million at March 31, 2019.
Other
As of March 31, 2019 and December 31, 2018, the fair values of the Term Facility and Senior Notes, based on current market rates for debt with similar credit risk and maturities, were approximately $2.1 billion and $1.1 billion, respectively, and were categorized within level 2 on the valuation hierarchy. See Note 15, Fair Value Measurements, to the accompanying Financial Statements for further discussion of our financial instruments.
|
|
|
CONTROLS AND PROCEDURES
Item 4. Controls andand Procedures
Disclosure Controls and Procedures—As of the end of the period covered by this quarterly report, we carried out an evaluation, under the supervision and with the participation of our management, including our Chief Executive Officer and Chief Financial Officer, of the effectiveness of the design and operation of our disclosure controls and procedures (as that term is defined in Rules 13a-15(e) and 15d-15(e) adopted by the SEC under the Securities Exchange Act of 1934, as amended (the “Exchange Act”)). Our disclosure controls and procedures were developed through a process in which our management applied its judgment in assessing the costs and benefits of such controls and procedures, which, by their nature, can provide only reasonable assurance regarding the control objectives. You should note that the design of any system of disclosure controls and procedures is based in part upon various assumptions about the likelihood of future events, and we cannot assure you that any design will succeed in achieving its stated goals under all potential future conditions, regardless of how remote. Based on the evaluation referred to above, our Chief Executive Officer and Chief Financial Officer concluded that the design and operation of our disclosure controls and procedures are effective as of March 31, 20182019 to provide reasonable assurance that information required to be disclosed by us in the reports that we file or submit under the Exchange Act is recorded, processed, summarized and reported within the time periods specified in the rules and forms of the Securities and Exchange Commission, and such information is accumulated and communicated to management, including our principal executive and principal financial officers or persons performing similar functions, as appropriate to allow timely decisions regarding disclosure.
Changes in Internal Control Over Financial Reporting—There has been no change in our internal control over financial reporting during the quarter ended March 31, 20182019 that has materially affected, or is reasonably likely to materially affect, our internal control over financial reporting.
|
|
|
LEGAL PROCEEDINGS
OTHER INFORMATION
For information regarding ongoing investigations and litigation, see Note 1521, Commitments and Contingencies, to our unaudited Consolidated Financial Statements in Part I of this report, which we incorporate by reference into this Item.
Item 1A. Risk Factors
See “Item 1A. Risk Factors” in our Annual Report on Form 10-K for the year ended December 31, 2018 for discussion of various risk factors relating to our business and operations and investments in our securities.
|
|
Item 5. Other Information
Effective April 26, 2019, Mr. Samik Mukherjee, former Executive Vice President, Chief Operating Officer, has assumed the role of Group Senior Vice President, Projects. The assumption of this role is intended to reflect Mr. Mukherjee’s focus on improving project execution.
| 68 |
|
EXHIBITS
Exhibits
EXHIBIT INDEX
Exhibit Number |
| Description |
| ||
|
|
|
3.1* |
| |
|
|
|
3.2* |
| |
|
|
|
3.3* |
| |
| ||
| ||
|
|
|
10.1* |
| |
|
|
|
10.2* |
| |
10.3* |
| |
|
|
|
10.4* |
| |
|
|
|
10.5* |
| |
|
|
EXHIBITS
|
| |
|
|
|
31.1 |
| Rule 13a-14(a)/15d-14(a) certification of Chief Executive Officer. |
|
|
|
31.2 |
| Rule 13a-14(a)/15d-14(a) certification of Chief Financial |
|
|
|
32.1 |
| Section 1350 certification of Chief Executive |
|
|
|
32.2 |
| Section 1350 certification of Chief Financial |
|
| |
101.SCH XBRL |
| Taxonomy Extension Schema | |
|
| ||
101.CAL XBRL |
| Taxonomy Extension Calculation Linkbase | |
|
| ||
101.LAB XBRL |
| Taxonomy Extension Label Linkbase | |
|
| ||
101.PRE XBRL |
| Taxonomy Extension Presentation Linkbase | |
|
| ||
101.DEF XBRL |
| Taxonomy Extension Definition Linkbase | |
* | Incorporated by reference to the filing indicated. |
|
|
|
SIGNATURES
Pursuant to the requirements of the Securities Exchange Act of 1934, the registrant has duly caused this report to be signed on its behalf by the undersigned thereunto duly authorized.
April |
|
| ||
|
|
| ||
|
| McDERMOTT INTERNATIONAL, INC. | ||
|
|
| ||
|
| By: |
| /s/ CHRISTOPHER A. KRUMMEL |
|
|
|
| Christopher A. Krummel Global Vice President, Finance and Chief Accounting Officer |
|
|
|