
| |
| ☒ | QUARTERLY REPORT PURSUANT TO SECTION 13 OR 15(d) OF THE SECURITIES EXCHANGE ACT OF 1934 |
or
| |
| ☐ | TRANSITION REPORT PURSUANT TO SECTION 13 OR 15(d) OF THE SECURITIES EXCHANGE ACT OF 1934 |
|
| |||
| Delaware | 65-0231984 | |||
(State or other jurisdiction of incorporation or organization) | (I.R.S. Employer Identification No.) | |||
(954)
| Title of each class | Trading Symbol(s) | Name of each exchange on which registered |
| Common Stock, $0.01 Par Value | UVE | New York Stock Exchange |
| Large accelerated filer | ☒ |
| Accelerated filer | ☐ | ||
Non-accelerated filer | ☐ |
| Smaller reporting company | ☐ | ||
Emerging growth company | ☐ | |||||
PART I – FINANCIAL INFORMATION
| ||||||
|
| |||||
| Page No. | ||||||
| ||||||
| ||||||
| ||||||
| ||||||
| ||||||
| ||||||
|
| |||||
Item 2. |
| |||||
|
| |||||
| ||||||
July 27, 2018
| As of |
| |||||
| June 30, |
|
| December 31, |
| ||
| 2018 |
|
| 2017 |
| ||
| (unaudited) |
|
|
|
|
| |
ASSETS |
|
|
|
|
|
|
|
Available-for-sale debt securities | $ | 656,762 |
|
| $ | 639,334 |
|
Available-for-sale short-term investments |
| — |
|
|
| 10,000 |
|
Equity securities |
| 70,866 |
|
|
| 62,215 |
|
Investment real estate, net |
| 19,539 |
|
|
| 18,474 |
|
Total invested assets |
| 747,167 |
|
|
| 730,023 |
|
|
|
|
|
|
|
|
|
Cash and cash equivalents |
| 311,088 |
|
|
| 213,486 |
|
Restricted cash and cash equivalents |
| 2,635 |
|
|
| 2,635 |
|
Prepaid reinsurance premiums |
| 310,618 |
|
|
| 132,806 |
|
Reinsurance recoverable |
| 117,851 |
|
|
| 182,405 |
|
Reinsurance receivable, net |
| 1,402 |
|
|
| — |
|
Premium receivable, net |
| 67,186 |
|
|
| 56,500 |
|
Property and equipment, net |
| 34,792 |
|
|
| 32,866 |
|
Deferred policy acquisition costs |
| 88,756 |
|
|
| 73,059 |
|
Income taxes recoverable |
| 11,839 |
|
|
| 9,472 |
|
Deferred income tax asset, net |
| 177 |
|
|
| 9,286 |
|
Other assets |
| 17,766 |
|
|
| 12,461 |
|
Total assets | $ | 1,711,277 |
|
| $ | 1,454,999 |
|
LIABILITIES AND STOCKHOLDERS' EQUITY |
|
|
|
|
|
|
|
LIABILITIES: |
|
|
|
|
|
|
|
Unpaid losses and loss adjustment expenses | $ | 151,916 |
|
| $ | 248,425 |
|
Unearned premiums |
| 608,921 |
|
|
| 532,444 |
|
Advance premium |
| 38,230 |
|
|
| 26,216 |
|
Accounts payable |
| 2,778 |
|
|
| 2,866 |
|
Book overdraft |
| 2,982 |
|
|
| 36,715 |
|
Reinsurance payable, net |
| 341,912 |
|
|
| 110,381 |
|
Dividends payable |
| 5,638 |
|
|
| — |
|
Other liabilities and accrued expenses |
| 54,695 |
|
|
| 45,096 |
|
Long-term debt |
| 12,132 |
|
|
| 12,868 |
|
Total liabilities |
| 1,219,204 |
|
|
| 1,015,011 |
|
|
|
|
|
|
|
|
|
Commitments and Contingencies (Note 12) |
|
|
|
|
|
|
|
|
|
|
|
|
|
|
|
STOCKHOLDERS' EQUITY: |
|
|
|
|
|
|
|
Cumulative convertible preferred stock, $.01 par value |
| — |
|
|
| — |
|
Authorized shares - 1,000 |
|
|
|
|
|
|
|
Issued shares - 10 and 10 |
|
|
|
|
|
|
|
Outstanding shares - 10 and 10 |
|
|
|
|
|
|
|
Minimum liquidation preference, $9.99 and $9.99 per share |
|
|
|
|
|
|
|
Common stock, $.01 par value |
| 463 |
|
|
| 458 |
|
Authorized shares - 55,000 |
|
|
|
|
|
|
|
Issued shares - 46,257 and 45,778 |
|
|
|
|
|
|
|
Outstanding shares - 34,872 and 34,735 |
|
|
|
|
|
|
|
Treasury shares, at cost - 11,385 and 11,043 |
| (116,239 | ) |
|
| (105,123 | ) |
Additional paid-in capital |
| 85,925 |
|
|
| 86,186 |
|
Accumulated other comprehensive income (loss), net of taxes |
| (9,161 | ) |
|
| (6,281 | ) |
Retained earnings |
| 531,085 |
|
|
| 464,748 |
|
Total stockholders' equity |
| 492,073 |
|
|
| 439,988 |
|
Total liabilities and stockholders' equity | $ | 1,711,277 |
|
| $ | 1,454,999 |
|
| As of | |||||||
| June 30, 2019 | December 31, 2018 | ||||||
| ASSETS | |||||||
| Available-for-sale debt securities, at fair value (amortized cost: $863,021 and $831,127) | $ | 884,093 | $ | 820,438 | |||
| Equity securities, at fair value (amortized cost: $43,571 and $86,271) | 42,368 | 63,277 | |||||
| Investment real estate, net | 15,792 | 24,439 | |||||
| Total invested assets | 942,253 | 908,154 | |||||
| Cash and cash equivalents | 181,614 | 166,428 | |||||
| Restricted cash and cash equivalents | 2,635 | 2,635 | |||||
| Prepaid reinsurance premiums | 381,982 | 142,750 | |||||
| Reinsurance recoverable | 331,567 | 418,603 | |||||
| Premium receivable, net | 66,756 | 59,858 | |||||
| Property and equipment, net | 40,498 | 34,991 | |||||
| Deferred policy acquisition costs | 90,530 | 84,686 | |||||
| Income taxes recoverable | 8,897 | 11,159 | |||||
| Deferred income tax asset, net | — | 14,586 | |||||
| Other assets | 17,391 | 14,540 | |||||
| Total assets | $ | 2,064,123 | $ | 1,858,390 | |||
| LIABILITIES AND STOCKHOLDERS’ EQUITY | |||||||
| LIABILITIES: | |||||||
| Unpaid losses and loss adjustment expenses | $ | 288,296 | $ | 472,829 | |||
| Unearned premiums | 650,388 | 601,679 | |||||
| Advance premium | 39,471 | 26,222 | |||||
| Accounts payable | 3,024 | 3,059 | |||||
| Book overdraft | 25,649 | 102,843 | |||||
| Reinsurance payable, net | 424,187 | 93,306 | |||||
| Dividends payable | 5,517 | — | |||||
| Deferred income tax liability, net | 5,079 | — | |||||
| Other liabilities and accrued expenses | 45,784 | 45,422 | |||||
| Long-term debt | 10,662 | 11,397 | |||||
| Total liabilities | 1,498,057 | 1,356,757 | |||||
| Commitments and Contingencies (Note 12) | |||||||
| STOCKHOLDERS’ EQUITY: | |||||||
| Cumulative convertible preferred stock, $.01 par value | — | — | |||||
| Authorized shares - 1,000 | |||||||
| Issued shares - 10 and 10 | |||||||
| Outstanding shares - 10 and 10 | |||||||
| Minimum liquidation preference, $9.99 and $9.99 per share | |||||||
| Common stock, $.01 par value | 467 | 465 | |||||
| Authorized shares - 55,000 | |||||||
| Issued shares - 46,698 and 46,514 | |||||||
| Outstanding shares - 34,160 and 34,783 | |||||||
| Treasury shares, at cost - 12,538 and 11,731 | (154,623 | ) | (130,399 | ) | |||
| Additional paid-in capital | 90,226 | 86,353 | |||||
| Accumulated other comprehensive income (loss), net of taxes | 15,929 | (8,010 | ) | ||||
| Retained earnings | 614,067 | 553,224 | |||||
| Total stockholders’ equity | 566,066 | 501,633 | |||||
| Total liabilities and stockholders’ equity | $ | 2,064,123 | $ | 1,858,390 | |||
Three Months Ended Six Months Ended June 30, June 30, 2018 2017 2018 2017 PREMIUMS EARNED AND OTHER REVENUES Direct premiums written $ 342,781 $ 296,191 $ 612,765 $ 541,606 Change in unearned premium (68,754 ) (51,568 ) (76,477 ) (60,608 ) Direct premium earned 274,027 244,623 536,288 480,998 Ceded premium earned (81,755 ) (75,614 ) (161,439 ) (150,430 ) Premiums earned, net 192,272 169,009 374,849 330,568 Net investment income (expense) 5,786 3,223 10,571 5,927 Net realized gains (losses) on sale of securities 145 1,710 (2,496 ) 1,647 Net change in unrealized gains (losses) of equity securities (1,521 ) — (6,630 ) — Commission revenue 5,709 4,644 10,980 9,242 Policy fees 5,764 5,250 10,539 9,733 Other revenue 1,633 1,651 3,475 3,244 Total premiums earned and other revenues 209,788 185,487 401,288 360,361 OPERATING COSTS AND EXPENSES Losses and loss adjustment expenses 89,842 80,184 165,768 150,754 General and administrative expenses 58,698 57,380 122,573 114,313 Total operating costs and expenses 148,540 137,564 288,341 265,067 INCOME BEFORE INCOME TAXES 61,248 47,923 112,947 95,294 Income tax expense 15,164 18,547 26,808 34,719 NET INCOME $ 46,084 $ 29,376 $ 86,139 $ 60,575 Basic earnings per common share $ 1.32 $ 0.84 $ 2.47 $ 1.73 Weighted average common shares outstanding - Basic 34,909 34,959 34,874 35,049 Diluted earnings per common share $ 1.29 $ 0.82 $ 2.42 $ 1.68 Weighted average common shares outstanding - Diluted 35,589 35,958 35,636 36,061 Cash dividend declared per common share $ 0.14 $ 0.14 $ 0.28 $ 0.28 Three Months Ended Six Months Ended June 30, June 30, 2018 2017 2018 2017 Net income $ 46,084 $ 29,376 $ 86,139 $ 60,575 Other comprehensive income (loss), net of taxes (1,849 ) 1,486 (5,899 ) 3,950 Comprehensive income $ 44,235 $ 30,862 $ 80,240 $ 64,525 Six Months Ended June 30, 2018 2017 Cash flows from operating activities: Net cash provided by (used in) operating activities $ 158,081 $ 140,965 Cash flows from investing activities: Proceeds from sale of property and equipment 17 15 Purchases of property and equipment (4,024 ) (2,757 ) Purchases of equity securities (19,106 ) (13,275 ) Purchases of available-for-sale debt securities (205,738 ) (67,517 ) Purchases of investment real estate, net (1,269 ) (3,759 ) Proceeds from sales of equity securities 4,127 56,971 Proceeds from sales of available-for-sale debt securities 119,222 6,507 Maturities of available-for-sale debt securities 64,480 39,144 Maturities of available-for-sale short-term investments 10,000 5,000 Net cash provided by (used in) investing activities (32,291 ) 20,329 Cash flows from financing activities: Preferred stock dividend (5 ) (5 ) Common stock dividend (9,821 ) (9,803 ) Issuance of common stock for stock option exercises 73 — Purchase of treasury stock (11,116 ) (8,919 ) Payments related to tax withholding for share-based compensation (6,583 ) (1,367 ) Repayment of debt (736 ) (1,435 ) Net cash provided by (used in) financing activities (28,188 ) (21,529 ) Cash and cash equivalents, and restricted cash and cash equivalents: Net increase (decrease) during the period 97,602 139,765 Balance, beginning of period 216,121 108,365 Balance, end of period $ 313,723 $ 248,130 June 30, 2018 December 31, 2017 Cash and cash equivalents $ 311,088 $ 213,486 Restricted cash and cash equivalents (1) 2,635 2,635 Total cash and cash equivalents and restricted cash and cash equivalents $ 313,723 $ 216,121 Our wholly-owned adjusting company receives claims-handling fees from the Insurance Entities. The Insurance Entities are reimbursed for these fees on claims that are subject to recovery under the Insurance Entities’ respective reinsurance programs. These fees, after expenses, are recorded in the Condensed Consolidated Financial Statements as an adjustment to losses and loss adjustment expense. June 30, 2018 Gross Gross Amortized Unrealized Unrealized Cost Gains Losses Fair Value Debt Securities: U.S. government obligations and agencies $ 59,086 $ — $ (1,374 ) $ 57,712 Corporate bonds 339,730 424 (6,190 ) 333,964 Mortgage-backed and asset-backed securities 242,492 31 (5,091 ) 237,432 Municipal bonds 15,798 — (81 ) 15,717 Redeemable preferred stock 11,762 318 (143 ) 11,937 Total $ 668,868 $ 773 $ (12,879 ) $ 656,762 December 31, 2017 Gross Gross Amortized Unrealized Unrealized Cost Gains Losses Fair Value Debt Securities: U.S. government obligations and agencies $ 60,481 $ — $ (877 ) $ 59,604 Corporate bonds 228,336 476 (1,308 ) 227,504 Mortgage-backed and asset-backed securities 221,956 19 (2,523 ) 219,452 Municipal bonds 120,883 599 (1,187 ) 120,295 Redeemable preferred stock 12,059 485 (65 ) 12,479 Short-term investments 10,000 — — 10,000 Total $ 653,715 $ 1,579 $ (5,960 ) $ 649,334 June 30, 2018 December 31, 2017 (1) % of Total % of Total Credit Ratings Fair Value Fair Value Fair Value Fair Value AAA $ 310,359 47.3 % $ 317,313 48.9 % AA 73,207 11.1 % 129,573 20.0 % A 182,479 27.8 % 146,749 22.6 % BBB 87,007 13.3 % 51,020 7.8 % BB+ and Below 114 0.0 % 1,569 0.2 % No Rating Available 3,596 0.5 % 3,110 0.5 % Total $ 656,762 100.0 % $ 649,334 100.0 % The table above includes credit quality ratings by Standard and Poor’s Rating Services, Inc. (“S&P”), Moody’s Investors Service, Inc. and Fitch Ratings, Inc. The Company The following table summarizes the amortized cost and fair value of mortgage-backed and asset-backed securities as of the dates presented (in thousands): June 30, 2018 December 31, 2017 Amortized Amortized Cost Fair Value Cost Fair Value Mortgage-backed Securities: Agency $ 140,252 $ 137,247 $ 118,014 $ 116,014 Non-agency 29,023 28,608 17,676 17,488 Asset-backed Securities: Auto loan receivables 30,187 29,845 35,105 34,962 Credit card receivables 16,258 16,074 38,844 38,719 Other receivables 26,772 25,658 12,317 12,269 Total $ 242,492 $ 237,432 $ 221,956 $ 219,452 June 30, 2018 Less Than 12 Months 12 Months or Longer Number of Unrealized Number of Unrealized Issues Fair Value Losses Issues Fair Value Losses Debt Securities: U.S. government obligations and agencies 9 $ 35,148 $ (608 ) 8 $ 22,564 $ (766 ) Corporate bonds 346 266,868 (5,103 ) 33 31,018 (1,087 ) Mortgage-backed and asset-backed securities 100 135,607 (2,172 ) 61 84,444 (2,919 ) Municipal bonds 7 3,521 (81 ) — — — Redeemable preferred stock 66 3,808 (143 ) — — — Total 528 $ 444,952 $ (8,107 ) 102 $ 138,026 $ (4,772 ) December 31, 2017 Less Than 12 Months 12 Months or Longer Number of Unrealized Number of Unrealized Issues Fair Value Losses Issues Fair Value Losses Debt Securities: U.S. government obligations and agencies 7 $ 35,464 $ (301 ) 9 $ 24,140 $ (576 ) Corporate bonds 159 142,208 (792 ) 39 29,796 (516 ) Mortgage-backed and asset-backed securities 83 137,481 (955 ) 37 70,218 (1,568 ) Municipal bonds 36 28,265 (246 ) 30 48,370 (941 ) Redeemable preferred stock 21 2,464 (65 ) — — — Total 306 $ 345,882 $ (2,359 ) 115 $ 172,524 $ (3,601 ) hold the available-for-sale debt securities until recovery and its credit analysis of the individual issuers of the securities. Based on this process and analysis, management has no reason to believe the unrealized losses of the available-for-sale debt securities as of June 30, June 30, 2018 Amortized Cost Fair Value Due in one year or less $ 49,496 $ 49,286 Due after one year through five years 216,335 211,886 Due after five years through ten years 124,206 121,788 Due after ten years 24,577 24,433 Mortgage-backed and asset-backed securities 242,492 237,432 Perpetual maturity securities 11,762 11,937 Total $ 668,868 $ 656,762 maturity dates. Three Months Ended Six Months Ended June 30, June 30, 2018 2017 2018 2017 Proceeds from sales and maturities (fair value): Available-for-sale debt securities $ 68,875 $ 30,822 $ 193,702 $ 50,651 Equity securities $ 3,082 $ 54,471 $ 4,127 $ 56,971 Gross realized gains on sale of securities: Available-for-sale debt securities $ 10 $ 28 $ 317 $ 28 Equity securities $ 177 $ 1,785 $ 301 $ 1,785 Gross realized losses on sale of securities: Available-for-sale debt securities $ (42 ) $ (4 ) $ (3,114 ) $ (40 ) Equity securities $ — $ (99 ) $ — $ (126 ) Three Months Ended Six Months Ended June 30, June 30, 2018 2017 2018 2017 Available-for-sale debt securities $ 4,095 $ 3,206 $ 7,795 $ 5,916 Equity securities 711 338 1,294 720 Available-for-sale short-term investments 56 7 145 22 Other (1) 1,605 188 2,659 332 Total investment income 6,467 3,739 11,893 6,990 Less: Investment expenses (2) (681 ) (516 ) (1,322 ) (1,063 ) Net investment (expense) income $ 5,786 $ 3,223 $ 10,571 $ 5,927 ) Three Months Ended Six Months Ended June 30, June 30, 2018 2017 2018 2017 Net gains and (losses) recognized during the period on equity securities $ (1,344 ) $ 1,686 $ (6,329 ) $ 1,659 Less: Net (gains) and losses recognized during the period on equity securities sold during the period (177 ) (1,686 ) (301 ) (1,659 ) Unrealized gains and (losses) recognized during the reporting period on equity securities still held at the reporting period $ (1,521 ) $ — $ (6,630 ) $ — June 30, 2018 December 31, 2017 Income Producing: Investment real estate (1) $ 14,619 $ 6,918 Less: Accumulated depreciation (664 ) (460 ) 13,955 6,458 Non-Income Producing: Properties under development (1) 5,584 12,016 Investment real estate, net $ 19,539 $ 18,474 The Company received net cash proceeds of approximately $10.5 million and recognized a pre-tax gain of approximately $1.2 million that is included in net realized gains (losses) on investments on the Condensed Consolidated Statements of Income for the three and six months ended June 30, 2019. Three Months Ended Six Months Ended June 30, June 30, 2018 2017 2018 2017 Depreciation expense on investment real estate $ 101 $ 44 $ 204 $ 89 Ratings as of June 30, 2018 Due from as of Standard and Poor's Moody's AM Best Rating Investors June 30, December 31, Reinsurer Company Services Service, Inc. 2018 2017 Lloyd's of London Syndicate A A+ n/a $ 33,966 $ — Allianz Risk Transfer A+ AA- n/a 18,406 105,573 Florida Hurricane Catastrophe Fund (1) n/a n/a n/a — 52,054 Renaissance Reinsurance Ltd n/a n/a n/a — 22,545 Total (2) $ 52,372 $ 180,172 Three Months Ended June 30, 2018 2017 �� Losses and Loss Losses and Loss Premiums Premiums Adjustment Premiums Premiums Adjustment Written Earned Expenses Written Earned Expenses Direct $ 342,781 $ 274,027 $ 246,622 $ 296,191 $ 244,623 $ 85,656 Ceded (339,251 ) (81,755 ) (156,780 ) (311,338 ) (75,614 ) (5,472 ) Net $ 3,530 $ 192,272 $ 89,842 $ (15,147 ) $ 169,009 $ 80,184 Six Months Ended June 30, 2018 2017 Losses and Loss Losses and Loss Premiums Premiums Adjustment Premiums Premiums Adjustment Written Earned Expenses Written Earned Expenses Direct $ 612,765 $ 536,288 $ 323,261 $ 541,606 $ 480,998 $ 156,439 Ceded (339,251 ) (161,439 ) (157,493 ) (311,524 ) (150,430 ) (5,685 ) Net $ 273,514 $ 374,849 $ 165,768 $ 230,082 $ 330,568 $ 150,754 June 30, December 31, 2018 2017 Prepaid reinsurance premiums $ 310,618 $ 132,806 Reinsurance recoverable on paid losses and LAE $ 21,002 $ — Reinsurance recoverable on unpaid losses and LAE 96,849 182,405 Reinsurance receivable, net 1,402 — Reinsurance recoverable and receivable $ 119,253 $ 182,405 Three Months Ended Six Months Ended June 30, June 30, 2018 2017 2018 2017 DPAC, beginning of period $ 78,007 $ 66,524 $ 73,059 $ 64,912 Capitalized Costs 50,430 39,898 92,369 73,654 Amortization of DPAC (39,681 ) (32,831 ) (76,672 ) (64,975 ) DPAC, end of period $ 88,756 $ 73,591 $ 88,756 $ 73,591 PSI. June 30, December 31, 2018 2017 Ten percent of total liabilities UPCIC $ 86,454 $ 72,633 APPCIC $ 624 $ 572 Statutory capital and surplus UPCIC $ 340,933 $ 307,686 APPCIC $ 16,278 $ 16,633 Three Months Ended Six Months Ended June 30, June 30, 2018 2017 2018 2017 Combined net income $ 29,244 $ 31,433 $ 43,722 $ 43,194 June 30, December 31, 2018 2017 Restricted cash and cash equivalents $ 2,635 $ 2,635 Investments $ 3,908 $ 3,910 Three Months Ended Six Months Ended June 30, June 30, 2018 2017 2018 2017 Balance at beginning of period $ 129,637 $ 31,463 $ 248,425 $ 58,494 Less: Reinsurance (recoverable)/payable (70,351 ) 2,353 (182,405 ) (106 ) Net balance at beginning of period 59,286 33,816 66,020 58,388 Incurred (recovered) related to: Current year 87,532 79,075 163,502 149,549 Prior years 2,310 1,109 2,266 1,205 Total incurred 89,842 80,184 165,768 150,754 Paid related to: Current year 50,572 62,141 67,979 85,031 Prior years 43,373 30,607 108,626 102,859 Total paid 93,945 92,748 176,605 187,890 Net balance at end of period 55,183 21,252 55,183 21,252 Plus: Reinsurance recoverable/(payable) 96,733 1,393 96,733 1,393 Balance at end of period $ 151,916 $ 22,645 $ 151,916 $ 22,645 June 30, December 31, 2018 2017 Surplus note $ 12,132 $ 12,868 Principal and interest are paid periodically pursuant to terms of the surplus note. Issued Treasury Outstanding Shares Shares Shares Balance, as of December 31, 2017 45,778 (11,043 ) 34,735 Shares repurchased — (342 ) (342 ) Vesting of performance share units 127 — 127 Stock option exercises 1,156 — 1,156 Restricted stock grants 50 — 50 Shares acquired through cashless exercise (1) — (854 ) (854 ) Shares cancelled (854 ) 854 — Balance, as of June 30, 2018 46,257 (11,385 ) 34,872 Dividend Shareholders Dividend Cash Dividend 2018 Declared Date Record Date Payable Date Per Share Amount First Quarter January 22, 2018 February 28, 2018 March 12, 2018 $ 0.14 Second Quarter April 12, 2018 April 27, 2018 May 4, 2018 $ 0.14 Third Quarter May 29, 2018 July 2, 2018 July 16, 2018 $ 0.16 2018. 2018. deductions that are ultimately recognized for tax purposes. Three Months Ended Six Months Ended June 30, June 30, 2018 2017 2018 2017 Numerator for EPS: Net income $ 46,084 $ 29,376 $ 86,139 $ 60,575 Less: Preferred stock dividends (2 ) (2 ) (5 ) (5 ) Income available to common stockholders $ 46,082 $ 29,374 $ 86,134 $ 60,570 �� Denominator for EPS: Weighted average common shares outstanding 34,909 34,959 34,874 35,049 Plus: Assumed conversion of share-based compensation (1) 655 974 737 987 Assumed conversion of preferred stock 25 25 25 25 Weighted average diluted common shares outstanding 35,589 35,958 35,636 36,061 Basic earnings per common share $ 1.32 $ 0.84 $ 2.47 $ 1.73 Diluted earnings per common share $ 1.29 $ 0.82 $ 2.42 $ 1.68 Three Months Ended June 30, 2018 2017 Pre-tax Tax After-tax Pre-tax Tax After-tax Net changes related to available-for-sale securities: Unrealized holding gains (losses) arising during the period $ (2,488 ) $ (618 ) $ (1,870 ) $ 4,116 $ 1,574 $ 2,542 Less: Reclassification adjustment for (gains) losses realized in net income 32 11 21 (1,710 ) (654 ) (1,056 ) Other comprehensive income (loss) (2,456 ) (607 ) (1,849 ) 2,406 920 1,486 Reclassification adjustments to retained earnings (1) — — — — — — Change in accumulated other comprehensive income (loss) $ (2,456 ) $ (607 ) $ (1,849 ) $ 2,406 $ 920 $ 1,486 Six Months Ended June 30, 2018 2017 Pre-tax Tax After-tax Pre-tax Tax After-tax Net changes related to available-for-sale securities: Unrealized holding gains (losses) arising during the period $ (10,522 ) $ (2,507 ) $ (8,015 ) $ 8,041 $ 3,074 $ 4,967 Less: Reclassification adjustment for (gains) losses realized in net income 2,797 681 2,116 (1,647 ) (630 ) (1,017 ) Other comprehensive income (loss) (7,725 ) (1,826 ) (5,899 ) 6,394 2,444 3,950 Reclassification adjustments to retained earnings (1) 5,830 2,811 3,019 — — — Change in accumulated other comprehensive income (loss) $ (1,895 ) $ 985 $ (2,880 ) $ 6,394 $ 2,444 $ 3,950 Amount Reclassified from Accumulated Other Comprehensive Income (Loss) Details about Accumulated Other Comprehensive Three Months Ended June 30, Six Months Ended June 30, Affected Line Item in the Statement Income (Loss) Components 2018 2017 2018 2017 Where Net Income is Presented Unrealized gains (losses) on available-for-sale debt securities $ (32 ) $ 1,710 $ (2,797 ) $ 1,647 Net realized gains (losses) sale of securities 11 (654 ) 681 (630 ) Income taxes Total reclassification for the period $ (21 ) $ 1,056 $ (2,116 ) $ 1,017 Net of tax Level 1 — Observable inputs that reflect unadjusted quoted prices for identical assets or liabilities in active markets as of the reporting date. Active markets are those in which transactions for the asset or liability occur in sufficient frequency and volume to provide pricing information on an ongoing basis. Level 2 — Observable market-based inputs or unobservable inputs that are corroborated by market data. Level 3 — Unobservable inputs that are not corroborated by market data. These inputs reflect management’s best estimate of fair value using its own assumptions about the assumptions a market participant would use in pricing the asset or liability. Recurring Basis Fair Value Measurements June 30, 2018 Level 1 Level 2 Level 3 Total Available-For-Sale Debt Securities: Fixed Maturities: U.S. government obligations and agencies $ — $ 57,712 $ — $ 57,712 Corporate bonds — 333,964 — 333,964 Mortgage-backed and asset-backed securities — 237,432 — 237,432 Municipal bonds — 15,717 — 15,717 Redeemable preferred stock — 11,937 — 11,937 Equity Securities: Common stock 22,320 — — 22,320 Mutual funds 48,546 — — 48,546 Total assets accounted for at fair value $ 70,866 $ 656,762 $ — $ 727,628 Fair Value Measurements December 31, 2017 Level 1 Level 2 Level 3 Total Available-For-Sale Debt Securities: Fixed Maturities: U.S. government obligations and agencies $ — $ 59,604 $ — $ 59,604 Corporate bonds — 227,504 — 227,504 Mortgage-backed and asset-backed securities — 219,452 — 219,452 Municipal bonds — 120,295 — 120,295 Redeemable preferred stock — 12,479 — 12,479 Equity Securities: Common stock 18,811 — — 18,811 Mutual funds 43,404 — — 43,404 Available-for-sale short-term investments — 10,000 — 10,000 Total assets accounted for at fair value $ 62,215 $ 649,334 $ — $ 711,549 June 30, 2018 December 31, 2017 (Level 3) (Level 3) Estimated Fair Estimated Fair Carrying Value Value Carrying Value Value Liabilities (debt): Surplus note $ 12,132 $ 10,823 $ 12,868 $ 11,630 2018. We undertake no obligation to update or revise publicly any forward-looking statements, whether as a result of new information, future events, or otherwise. The For the Three Months Ended June 30, 2018 June 30, 2017 Growth year over year State Direct Written Premium % Direct Written Premium % $ % Florida $ 295,337 86.2 % $ 261,430 88.3 % $ 33,907 13.0 % Other states 47,444 13.8 % 34,761 11.7 % 12,683 36.5 % Total $ 342,781 100.0 % $ 296,191 100.0 % $ 46,590 15.7 % For the Six Months Ended June 30, 2018 June 30, 2017 Growth year over year State Direct Written Premium % Direct Written Premium % $ % Florida $ 529,515 86.4 % $ 479,868 88.6 % $ 49,647 10.3 % Other states 83,250 13.6 % 61,738 11.4 % 21,512 34.8 % Total $ 612,765 100.0 % $ 541,606 100.0 % $ 71,159 13.1 % Net earned premiums grew by Total revenues increased by Declared and paid dividends of Repurchased APPCIC also purchases extensive multiple line excess per risk reinsurance with various reinsurers due to the measures are met. 2018 (in thousands) Three Months Ended June 30, Change 2018 2017 $ % PREMIUMS EARNED AND OTHER REVENUES Direct premiums written $ 342,781 $ 296,191 $ 46,590 15.7 % Change in unearned premium (68,754 ) (51,568 ) (17,186 ) 33.3 % Direct premium earned 274,027 244,623 29,404 12.0 % Ceded premium earned (81,755 ) (75,614 ) (6,141 ) 8.1 % Premiums earned, net 192,272 169,009 23,263 13.8 % Net investment income (expense) 5,786 3,223 2,563 79.5 % Net realized gains (losses) on sale of securities 145 1,710 (1,565 ) NM Net change in unrealized gains (losses) of equity securities (1,521 ) — (1,521 ) NM Commission revenue 5,709 4,644 1,065 22.9 % Policy fees 5,764 5,250 514 9.8 % Other revenue 1,633 1,651 (18 ) -1.1 % Total premiums earned and other revenues 209,788 185,487 24,301 13.1 % OPERATING COSTS AND EXPENSES Losses and loss adjustment expenses 89,842 80,184 9,658 12.0 % General and administrative expenses 58,698 57,380 1,318 2.3 % Total operating costs and expenses 148,540 137,564 10,976 8.0 % INCOME BEFORE INCOME TAXES 61,248 47,923 13,325 27.8 % Income tax expense 15,164 18,547 (3,383 ) -18.2 % NET INCOME $ 46,084 $ 29,376 $ 16,708 56.9 % Other comprehensive income (loss), net of taxes (1,849 ) 1,486 (3,335 ) NM COMPREHENSIVE INCOME $ 44,235 $ 30,862 $ 13,373 43.3 % DILUTED EARNINGS PER SHARE DATA: Diluted earnings per common share $ 1.29 $ 0.82 $ 0.47 57.3 % Weighted average diluted common shares outstanding 35,589 35,958 (369 ) -1.0 % thousands): new 2019-2020 Reinsurance Program and “Item 1—Note 4 (Reinsurance).” offset by increased cost for reinsurance. We sell period. See “Item 1—(Note 3 Investments).” Program. Three Months Ended June 30, 2018 Direct Loss Ratio Ceded Loss Ratio Net Loss Ratio Premiums earned $ 274,027 $ 81,755 $ 192,272 Loss and loss adjustment expenses: Weather events* $ 5,000 1.8 % $ — — $ 5,000 2.6 % Prior year adverse/(favorable) reserve development 161,400 58.9 % 159,090 194.6 % 2,310 1.2 % All other losses and loss adjustment expenses 80,222 29.3 % (2,310 ) (2.8 %) 82,532 42.9 % Total losses and loss adjustment expenses $ 246,622 90.0 % $ 156,780 191.8 % $ 89,842 46.7 % Three Months Ended June 30, 2017 Direct Loss Ratio Ceded Loss Ratio Net Loss Ratio Premiums earned $ 244,623 $ 75,614 $ 169,009 Loss and loss adjustment expenses: Weather events* $ 6,000 2.5 % $ — — $ 6,000 3.6 % Prior year adverse/(favorable) reserve development 6,581 2.7 % 5,472 7.2 % 1,109 0.7 % All other losses and loss adjustment expenses 73,075 29.9 % — — 73,075 43.2 % Total losses and loss adjustment expenses $ 85,656 35.1 % $ 5,472 7.2 % $ 80,184 47.4 % reinsurers. Three Months Ended June 30, Change 2018 2017 $ % $ Ratio $ Ratio Premiums earned, net $ 192,272 $ 169,009 $ 23,263 13.8 % General and administrative expenses: Policy acquisition costs 33,545 17.4 % 33,022 19.5 % 523 1.6 % Other operating costs 25,063 13.0 % 24,272 14.4 % 791 3.3 % Interest expense 90 — 86 — 4 4.7 % Total general and administrative expenses (1) $ 58,698 30.4 % $ 57,380 33.9 % $ 1,318 2.3 % net premiums earned. Other comprehensive 2018 (in thousands) Six Months Ended June 30, Change 2018 2017 $ % PREMIUMS EARNED AND OTHER REVENUES Direct premiums written $ 612,765 $ 541,606 $ 71,159 13.1 % Change in unearned premium (76,477 ) (60,608 ) (15,869 ) 26.2 % Direct premium earned 536,288 480,998 55,290 11.5 % Ceded premium earned (161,439 ) (150,430 ) (11,009 ) 7.3 % Premiums earned, net 374,849 330,568 44,281 13.4 % Net investment income (expense) 10,571 5,927 4,644 78.4 % Net realized gains (losses) on sale of securities (2,496 ) 1,647 (4,143 ) NM Net change in unrealized gains (losses) of equity securities (6,630 ) — (6,630 ) NM Commission revenue 10,980 9,242 1,738 18.8 % Policy fees 10,539 9,733 806 8.3 % Other revenue 3,475 3,244 231 7.1 % Total premiums earned and other revenues 401,288 360,361 40,927 11.4 % OPERATING COSTS AND EXPENSES Losses and loss adjustment expenses 165,768 150,754 15,014 10.0 % General and administrative expenses 122,573 114,313 8,260 7.2 % Total operating costs and expenses 288,341 265,067 23,274 8.8 % INCOME BEFORE INCOME TAXES 112,947 95,294 17,653 18.5 % Income tax expense 26,808 34,719 (7,911 ) -22.8 % NET INCOME $ 86,139 $ 60,575 $ 25,564 42.2 % Other comprehensive income (loss), net of taxes (5,899 ) 3,950 (9,849 ) NM COMPREHENSIVE INCOME $ 80,240 $ 64,525 $ 15,715 24.4 % DILUTED EARNINGS PER SHARE DATA: Diluted earnings per common share $ 2.42 $ 1.68 $ 0.74 44.0 % Weighted average diluted common shares outstanding 35,636 36,061 (425 ) -1.2 % thousands): new 2019-2020 Reinsurance Program and “Item 1— (Note 4 Reinsurance).” offset by increased costs for reinsurance. 2018. Cash and cash equivalents are invested short term until needed to settle loss and LAE payments, reinsurance premium payments and operating cash needs. Yields from the fixed income portfolio are dependent on future market forces, monetary policy and interest rate policy from the Federal Reserve. period. See “Item 1—(Note 3 Investments).” Program. Six Months Ended June 30, 2018 Direct Loss Ratio Ceded Loss Ratio Net Loss Ratio Premiums earned $ 536,288 $ 161,439 $ 374,849 Loss and loss adjustment expenses: Weather events* $ 5,000 0.9 % $ — — $ 5,000 1.3 % Prior year adverse/(favorable) reserve development 162,050 30.2 % 159,784 99.0 % 2,266 0.6 % All other losses and loss adjustment expenses 156,211 29.1 % (2,291 ) (1.4 %) 158,502 42.3 % Total losses and loss adjustment expenses $ 323,261 60.2 % $ 157,493 97.6 % $ 165,768 44.2 % Six Months Ended June 30, 2017 Direct Loss Ratio Ceded Loss Ratio Net Loss Ratio Premiums earned $ 480,998 $ 150,430 $ 330,568 Loss and loss adjustment expenses: Weather events* $ 9,000 1.9 % $ — — $ 9,000 2.7 % Prior year adverse/(favorable) reserve development 6,890 1.4 % 5,685 3.8 % 1,205 0.4 % All other losses and loss adjustment expenses 140,549 29.2 % — — 140,549 42.5 % Total losses and loss adjustment expenses $ 156,439 32.5 % $ 5,685 3.8 % $ 150,754 45.6 % Six Months Ended June 30, Change 2018 2017 $ % $ Ratio $ Ratio Premiums earned, net $ 374,849 $ 330,568 $ 44,281 13.4 % General and administrative expenses: Policy acquisition costs 71,588 19.1 % 65,450 19.8 % 6,138 9.4 % Other operating costs 50,816 13.6 % 48,674 14.7 % 2,142 4.4 % Interest expense 169 — 189 — (20 ) (10.6 %) Total general and administrative expenses (1) $ 122,573 32.7 % $ 114,313 34.5 % $ 8,260 7.2 % of 2018 excluding the non-recurring premium tax benefit. rate. 2018 As of June 30, December 31, Type of Investment 2018 2017 Available-for-sale debt securities $ 656,762 $ 639,334 Available-for-sale short-term investments — 10,000 Equity securities 70,866 62,215 Investment real estate, net 19,539 18,474 Total $ 747,167 $ 730,023 investments and “Item 1—Note 3 (Investments).” Investment real estate, net reduced $8.6 million during 2019 as a result of the sale of two investment properties. The gain on the sale of the two investment properties was $1.2 million. 2019. storm events. expand. DPAC. tax reverse. which is the variability of premiums written by month. shareholders on July 17, 2019. Reinsurance premiums are paid in installments during the reinsurance policy period, which runs from June 1 to May 31 of the following year. The Florida Hurricane Catastrophe Fund (“FHCF”) is paid in three installments on August 1, October 1, and December 1, and third-party reinsurance is paid in four installments on July 1, October 1, January 1 and April 1, resulting in significant payments at those times. See “Item 1—Note 12 (Commitments and Contingencies)” and “—Contractual Obligations” for more information. The maximum amount of dividends that can be paid by Florida insurance companies without prior approval of the PSI. Our insurance operations provide liquidity As of June 30, December 31, 2018 2017 Stockholders' equity $ 492,073 $ 439,988 Total long-term debt 12,132 12,868 Total capital $ 504,205 $ 452,856 Debt-to-total capital ratio 2.4 % 2.8 % Debt-to-equity ratio 2.5 % 2.9 % During the six months ended June 30, 2019, there were two authorized repurchase plans in effect: 2019. Dividend Shareholders Dividend Cash Dividend 2018 Declared Date Record Date Payable Date Per Share Amount First Quarter January 22, 2018 February 28, 2018 March 12, 2018 $ 0.14 Second Quarter April 12, 2018 April 27, 2018 May 4, 2018 $ 0.14 Third Quarter May 29, 2018 July 2, 2018 July 16, 2018 $ 0.16 Less than Over Total 1 year 1-3 years 3-5 years 5 years Unpaid losses and LAE, direct (1) $ 151,916 $ 77,477 $ 43,904 $ 23,851 $ 6,684 Long-term debt 13,561 1,347 5,160 3,237 3,817 Total contractual obligations $ 165,477 $ 78,824 $ 49,064 $ 27,088 $ 10,501 2018. price changes. declines over the remaining term of the agreement. June 30, 2018 Amortized Cost Fair Value 2018 2019 2020 2021 2022 Thereafter Other (1) Total Total Fixed income Financial Instruments $ 12,530 $ 77,593 $ 54,579 $ 66,940 $ 23,587 $ 179,385 $ 254,254 $ 668,868 $ 656,762 Weighted average interest rate 1.81 % 1.76 % 2.04 % 2.15 % 2.46 % 3.53 % 3.22 % 2.88 % 2.88 % December 31, 2017 Amortized Cost Fair Value 2018 2019 2020 2021 2022 Thereafter Other (1) Total Total Fixed income Financial Instruments $ 51,846 $ 85,309 $ 61,215 $ 60,968 $ 27,832 $ 132,530 $ 234,015 $ 653,715 $ 649,334 Weighted average interest rate 1.87 % 1.82 % 2.18 % 2.16 % 2.76 % 4.02 % 3.08 % 2.83 % 2.83 % contractual maturity dates. June 30, 2018 December 31, 2017 Fair Value Percent Fair Value Percent Equity Securities: Common stock $ 22,320 31.5 % $ 18,811 30.2 % Mutual funds 48,546 68.5 % 43,404 69.8 % Total equity securities $ 70,866 100.0 % $ 62,215 100.0 % Total Number of Maximum Number Shares Purchased of Shares That As Part of May Yet be Publicly Purchased Under Total Number of Average Price Announced the Plans or Shares Purchased Paid per Share (1) Plans or Programs Programs (2) 4/1/18 - 4/30/18 40,000 $ 32.91 40,000 — 5/1/18 - 5/31/18 200,000 $ 33.46 200,000 — 6/1/18 - 6/30/18 10,000 $ 35.41 10,000 247,436 Total 250,000 $ 33.45 250,000 247,436 31.2 32 UNIVERSAL INSURANCE HOLDINGS, INC. Date: /s/ Date: /s/ Frank C. Wilcox Frank C. Wilcox, Chief Financial Officer and Principal Accounting OfficerCONDENSED CONSOLIDATED STATEMENTS OF INCOME (unaudited)(in thousands, except per share data) Three Months Ended
June 30, Six Months Ended
June 30, 2019 2018 2019 2018 PREMIUMS EARNED AND OTHER REVENUES Direct premiums written $ 357,960 $ 342,781 $ 647,194 $ 612,765 Change in unearned premium (54,852 ) (68,754 ) (48,709 ) (76,477 ) Direct premium earned 303,108 274,027 598,485 536,288 Ceded premium earned (92,751 ) (81,755 ) (178,401 ) (161,439 ) Premiums earned, net 210,357 192,272 420,084 374,849 Net investment income 7,410 5,786 15,552 10,571 Net realized gains (losses) on investments (1,605 ) 145 (13,130 ) (2,496 ) Net change in unrealized gains (losses) of equity securities 3,759 (1,521 ) 21,791 (6,630 ) Commission revenue 6,048 5,709 11,553 10,980 Policy fees 5,997 5,764 11,018 10,539 Other revenue 1,756 1,633 3,440 3,475 Total premiums earned and other revenues 233,722 209,788 470,308 401,288 OPERATING COSTS AND EXPENSES Losses and loss adjustment expenses 113,296 89,842 226,390 165,768 General and administrative expenses 69,496 58,698 139,244 122,573 Total operating costs and expenses 182,792 148,540 365,634 288,341 INCOME BEFORE INCOME TAXES 50,930 61,248 104,674 112,947 Income tax expense 13,637 15,164 27,233 26,808 NET INCOME $ 37,293 $ 46,084 $ 77,441 $ 86,139 Basic earnings per common share $ 1.09 $ 1.32 $ 2.24 $ 2.47 Weighted average common shares outstanding - Basic 34,311 34,909 34,525 34,874 Diluted earnings per common share $ 1.08 $ 1.29 $ 2.22 $ 2.42 Weighted average common shares outstanding - Diluted 34,612 35,589 34,903 35,636 Cash dividend declared per common share $ 0.16 $ 0.14 $ 0.32 $ 0.28 CONDENSED CONSOLIDATED STATEMENTS OF COMPREHENSIVE INCOME (unaudited) Three Months Ended
June 30, Six Months Ended
June 30, 2019 2018 2019 2018 Net income $ 37,293 $ 46,084 $ 77,441 $ 86,139 Other comprehensive income (loss), net of taxes 11,955 (1,849 ) 23,939 (5,899 ) Comprehensive income $ 49,248 $ 44,235 $ 101,380 $ 80,240 The accompanying notes to condensed consolidated financial statements are an integral part of these statements.UNIVERSAL INSURANCE HOLDINGS, INC. AND SUBSIDIARIESCONDENSED CONSOLIDATED STATEMENTS OF STOCKHOLDERS’ EQUITYFOR THE THREE AND SIX MONTHS ENDED JUNE 30, 2019 AND 2018 (unaudited)(in thousands) Treasury Shares CommonSharesIssued PreferredSharesIssued CommonStockAmount PreferredStockAmount AdditionalPaid-InCapital RetainedEarnings AccumulatedOtherComprehensiveIncome (Loss) TreasuryShares,at Cost TotalStockholders’EquityBalance, December 31, 2018 (11,731 ) 46,514 10 $ 465 $ — $ 86,353 $ 553,224 $ (8,010 ) $ (130,399 ) $ 501,633 Vesting of performance share units (56 ) (1) 148 — 2 — (2 ) — — (2,069 ) (2,069 ) Grants and vesting of restricted stock (5 ) (1) 25 — — — — — — (166 ) (166 ) Stock option exercises (36 ) (1) 84 — 1 — 1,438 — — (1,367 ) 72 Retirement of treasury shares 97 (97 ) — (1 ) — (3,601 ) — — 3,602 — Purchases of treasury stock (321 ) — — — — — — — (10,117 ) (10,117 ) Share-based compensation — — — — — 3,140 — — — 3,140 Net income — — — — — — 40,148 — — 40,148 Change in net unrealized gains (losses), net of taxes — — — — — — — 11,984 — 11,984 Declaration of dividends
($0.16 per common share and
$0.25 per preferred share) — — — — — — (5,575 ) — — (5,575 ) Balance, March 31, 2019 (12,052 ) 46,674 10 467 — 87,328 587,797 3,974 (140,516 ) 539,050 Grants and vesting of restricted stock (14 ) (1) 25 — — — — — — (402 ) (402 ) Stock option exercises (14 ) (1) 27 — — — 403 — — (414 ) (11 ) Retirement of treasury shares 28 (28 ) — — — (816 ) — — 816 — Purchases of treasury stock (486 ) — — — — — — — (14,107 ) (14,107 ) Share-based compensation — — — — — 3,311 — — — 3,311 Net income — — — — — — 37,293 — — 37,293 Change in net unrealized gains (losses), net of taxes — — — — — — — 11,955 — 11,955 Declaration of dividends for second quarter
($0.16 per common share and
$0.25 per preferred share) — — — — — — (5,547 ) — — (5,547 ) Declaration of dividends for third quarter
($0.16 per common share) — — — — — — (5,476 ) — — (5,476 ) Balance, June 30, 2019 (12,538 ) 46,698 10 $ 467 $ — $ 90,226 $ 614,067 $ 15,929 $ (154,623 ) $ 566,066 (1) All shares acquired represent shares tendered to cover the strike price for options and tax withholdings on the intrinsic value of options exercised or performance share units or restricted stock vested. These shares have been cancelled by the Company. The accompanying notes to condensed consolidated financial statements are an integral part of these statements.UNIVERSAL INSURANCE HOLDINGS, INC. AND SUBSIDIARIESCONDENSED CONSOLIDATED STATEMENTS OF STOCKHOLDERS’ EQUITY (continued)(in thousands) Treasury Shares CommonSharesIssued PreferredSharesIssued CommonStockAmount PreferredStockAmount AdditionalPaid-InCapital RetainedEarnings AccumulatedOtherComprehensiveIncome (Loss) TreasuryShares, at Cost TotalStockholders’EquityBalance, December 31, 2017 (11,043 ) 45,778 10 $ 458 $ — $ 86,186 $ 464,748 $ (6,281 ) $ (105,123 ) $ 439,988 Cumulative effect of change in accounting principle (ASU 2016-01) — — — — — — (3,601 ) 3,601 — — Balance January 1, 2018 (11,043 ) 45,778 10 458 — 86,186 461,147 (2,680 ) (105,123 ) 439,988 Vesting of performance share units (43 ) (1) 127 — 1 — (1 ) — — (1,273 ) (1,273 ) Grants and vesting of restricted stock — 50 — — — — — — — — Stock option exercises (568 ) (1) 804 — 8 — 15,195 — — (18,723 ) (3,520 ) Retirement of treasury shares 611 (611 ) — (6 ) — (19,990 ) — — 19,996 — Purchases of treasury stock (93 ) — — — — — — — (2,746 ) (2,746 ) Share-based compensation — — — — — 2,904 — — — 2,904 Net income — — — — — — 40,055 — — 40,055 Change in net unrealized gains (losses), net of taxes — — — — — — — (4,050 ) — (4,050 ) Reclassification of income taxes upon adoption ofASU 2018-02 — — — — — — 582 (582 ) — — Declaration of dividends
($0.14 per common share and
$0.25 per preferred share) — — — — — — (4,906 ) — — (4,906 ) Balance, March 31, 2018 (11,136 ) 46,148 10 461 — 84,294 496,878 (7,312 ) (107,869 ) 466,452 Stock option exercises (244 ) (1) 353 — 4 — 6,295 — — (8,015 ) (1,716 ) Retirement of treasury shares 244 (244 ) — (2 ) — (8,013 ) — — 8,015 — Purchases of treasury stock (249 ) — — — — — — — (8,370 ) (8,370 ) Share-based compensation — — — — — 3,349 — — — 3,349 Net income — — — — — — 46,084 — — 46,084 Change in net unrealized gains (losses), net of taxes — — — — — — — (1,849 ) — (1,849 ) Declaration of dividends for second quarter
($0.14 per common share and
$0.25 per preferred share) — — — — — — (4,923 ) — — (4,923 ) Declaration of dividends for third quarter
($0.16 per common share) — — — — — — (5,596 ) — — (5,596 ) Balance, June 30, 2018 (11,385 ) 46,257 10 $ 463 $ — $ 85,925 $ 532,443 $ (9,161 ) $ (116,239 ) $ 493,431 (1) All shares acquired represent shares tendered to cover the strike price for options and tax withholdings on the intrinsic value of options exercised or performance share units or restricted stock vested. These shares have been cancelled by the Company. The accompanying notes to condensed consolidated financial statements are an integral part of these statements.UNIVERSAL INSURANCE HOLDINGS, INC. AND SUBSIDIARIESCONDENSED CONSOLIDATED STATEMENTS OF CASH FLOWS (unaudited)(in thousands) Six Months Ended June 30, 2019 2018 Cash flows from operating activities: Net cash provided by (used in) operating activities $ 55,988 $ 158,081 Cash flows from investing activities: Proceeds from sale of property and equipment 18 17 Purchases of property and equipment (8,030 ) (4,024 ) Purchases of equity securities (890 ) (19,106 ) Purchases of available-for-sale debt securities (143,728 ) (205,738 ) Purchases of investment real estate, net (883 ) (1,269 ) Proceeds from sales of equity securities 29,137 4,127 Proceeds from sales of available-for-sale debt securities 43,205 119,222 Proceeds from sales of investment real estate 10,537 — Maturities of available-for-sale debt securities 68,525 64,480 Maturities of available-for-sale short-term investments — 10,000 Net cash provided by (used in) investing activities (2,109 ) (32,291 ) Cash flows from financing activities: Preferred stock dividend (5 ) (5 ) Common stock dividend (11,153 ) (9,821 ) Issuance of common stock for stock option exercises 239 73 Purchase of treasury stock (24,224 ) (11,116 ) Payments related to tax withholding for share-based compensation (2,815 ) (6,583 ) Repayment of debt (735 ) (736 ) Net cash provided by (used in) financing activities (38,693 ) (28,188 ) Cash and cash equivalents, and restricted cash and cash equivalents: Net increase (decrease) during the period 15,186 97,602 Balance, beginning of period 169,063 216,121 Balance, end of period $ 184,249 $ 313,723 The following table summarizes our cash and cash equivalents and restricted cash and cash equivalents within the Condensed Consolidated Balance Sheets (in thousands): June 30, December 31, 2019 2018 Cash and cash equivalents $ 181,614 $ 166,428 Restricted cash and cash equivalents (1) 2,635 2,635 Total cash and cash equivalents and restricted cash and cash equivalents $ 184,249 $ 169,063 (1)(1) See “—Note 5 (Insurance Operations),” for a discussion of the nature of the restrictions for restricted cash and cash equivalents. The accompanying notes to condensed consolidated financial statements are an integral part of these statements.NOTES TO CONDENSED CONSOLIDATED FINANCIAL STATEMENTS(unaudited)1. Nature of Operations and Basis of PresentationUniversal Insurance Holdings, Inc. (“UVE”(together with its wholly-owned subsidiaries, “the Company”) is a Delaware corporation incorporated in 1990. UVE with its wholly-owned subsidiaries (the “Company”)The Company is a vertically integrated insurance holding company performing all aspects of insurance underwriting, distribution and claims. Through its wholly-owned insurance company subsidiaries, Universal Property & Casualty Insurance Company (“UPCIC”) and American Platinum Property and Casualty Insurance Company (“APPCIC”), and together referred to aswith UPCIC, the “Insurance Entities,”Entities”), the Company is principally engaged in the property and casualty insurance business offered primarily through its network of independent agents. Risk from catastrophic losses is managed through the use of reinsurance agreements. The Company’s primary product is residential homeowners’ insurance currently offered in seventeen18 states as of June 30, 2018,2019, including Florida, which comprises the vast majority of the Company’s in-force policies.policies in force. See “—Note 5 (Insurance Operations)” for more information regarding the Company’s insurance operations.The Company generates revenues primarily from the collection of premiums and invests funds in excess of those retained for claims-paying obligations and insurance operations. Other significant sources of revenue include brokerage commissions collected from reinsurers on certain reinsurance programs placed by the Insurance Entities, policy fees collected from policyholders by our wholly-owned managing general agent subsidiary and payment plan fees charged to policyholders who choose to pay their premiums in installments.Basis of PresentationThe Company has prepared the accompanying unaudited Condensed Consolidated Financial Statements (“Financial Statements”) in accordance with the rules and regulations of the United States Securities and Exchange Commission (“SEC”) for interim financial information. Accordingly, the Financial Statements do not include all of the information and footnotes required by United States Generally Accepted Accounting Principles (“U. S.U.S. GAAP”) for annual financial statements. Therefore, the Financial Statements should be read in conjunction with the audited Consolidated Financial Statements contained in the Company’s Annual Report on Form 10-K for the fiscal year ended December 31, 2017,2018, filed with the SEC on February 23, 2018.March 1, 2019. The condensed consolidated balance sheet at December 31, 2017,2018 was derived from audited financial statements, but does not include all disclosures required by U.S. GAAP. In the opinion of management, all adjustments (consisting of normal recurring adjustments) necessary for a fair presentation have been included in the Financial Statements. The results for interim periods do not necessarily indicate the results that may be expected for any other interim period or for the full year.To conform to the current period presentation, certain amounts in the prior periods’ condensed consolidated financial statements and notes have been reclassified. Such reclassifications were of an immaterial amount and had no effect on net income or stockholders’ equity.The Financial Statements include the accounts of UVEthe Company and its wholly-owned subsidiaries. All material intercompany balances and transactions have been eliminated in consolidation.Management must make estimates and assumptions that affect amounts reported in the Company’s Financial Statements and in disclosures of contingent assets and liabilities. Actual results could differ from those estimates.2. Significant Accounting PoliciesThe Company reported Significant Accounting Policies in its Annual Report on Form 10-K for the year ended December 31, 2017. The following2018. There are no new or revised disclosures or disclosures required on a quarterly basis.Recently Adopted Accounting PronouncementsIn January 2016, the Financial Accounting Standards Board (“FASB”) revised U.S. GAAP with the issuanceTable of Accounting Standards Update (“ASU”) 2016-01, Financial Instruments - Overall (Subtopic 825-10): Recognition and Measurement of Financial Assets and Financial Liabilities to improve the recognition and measurement of financial instruments. The new ASU requires certain investments in equity securities to be measured at fair value with changes in fair value reported in earnings and requires changes in instrument-specific credit risk for financial liabilities recorded at fair value under the fair value option to be reported in Other Comprehensive Income (“OCI”). The Company adopted this ASU effective January 1, 2018 using the modified retrospective transition method and recorded a cumulative effect adjustment of $3.6 million to the Condensed Consolidated Balance Sheets to reclassify unrealized losses on investments in equity securities to retained earnings from other comprehensive income. The adoption of this ASU also resulted in the recognition of the change in unrealized gains and losses for equity security investments as a separate component in the Condensed Consolidated Statements of Income during the three and six months ended June 30, 2018.In August 2016, the FASB revised U.S. GAAP with the issuance of ASU 2016-15, Classification of Certain Cash Receipts and Cash Payments intended to reduce diversity in practice in how certain cash receipts and cash payments are presented and classified in the statement of cash flows. The new ASU applies to: 1) debt prepayment or debt extinguishment costs, 2) settlement of zero-coupon debt instruments, 3) contingent consideration payments made after business combination, 4) proceeds from the settlement of insurance claims, 5) proceeds from the settlement of corporate-owned life insurance policies, 6) distributions received from equity method investments, 7) beneficial interests in securitization transactions, and 8) separately identifiable cash flows and application of the predominance principle. Historically, the items outlined above have not been applicable to the Company. The Company adopted this ASU effective January 1, 2018 and the adoption did not have an impact on our Condensed Consolidated Statements of Cash Flows.In November 2016, the FASB revised U.S. GAAP, Statement of Cash Flows (Topic 230): Restricted Cash with the issuance of the ASU 2016-18, to reduce diversity in the classification and presentation of changes in restricted cash in the statement of cash flows. The new ASU requires that the statement of cash flows explain the change during the period in the total of cash, cash equivalents, and amounts generally described as restricted cash or restricted cash equivalents. The Company is required to reconcile such total to amounts on the Condensed Consolidated Balance Sheets and disclose the nature of the restrictions. The Company adopted this ASU effective January 1, 2018, which only resulted in a change in the presentation of the Condensed Consolidated Statements of Cash Flows.In February 2018, the FASB revised U.S. GAAP, Comprehensive Income (Topic 220), with the issuance of ASU 2018-02, Reclassification of Certain Tax Effects from Accumulated Other Comprehensive Income in response to the enactment of the Tax Cuts and Jobs Act of 2017 (the “Tax Act”) on December 22, 2017. The new ASU permits a company to reclassify the disproportionate income tax effects of the Tax Act on items within accumulated other comprehensive income (“AOCI”) to retained earnings and requires certain new disclosures. The Company adopted this guidance effective January 1, 2018 and made an election to reclassify the income tax effects of the Tax Act from AOCI to retained earnings. Retained earnings were reduced by approximately $0.6 million due to this reclassification. The reclassification represents the effect of the change in the U.S. federal corporate income tax rate on the gross deferred tax amounts and related valuation allowances at the date of enactment of the Tax Act related to items remaining in accumulated other comprehensive income. The Company follows an aggregate portfolio approach and considers that it had two portfolios, an available for sale debt equity portfolio and an available for sale equity portfolio, the disproportionate tax effects relating to the available for sale equity portfolio were included in the transition adjustment when adopting ASU 2016-01.3. InvestmentsSecurities Available for SaleThe following table provides the amortized cost and fair value of debt and short-term investment securities available for sale as of the dates presented (in thousands):June 30, 2019 Amortized
Cost Gross
Unrealized
Gains Gross
Unrealized
Losses Fair Value $ 73,073 $ 817 $ (314 ) $ 73,576 444,052 14,726 (335 ) 458,443 329,492 7,056 (1,125 ) 335,423 3,401 112 (6 ) 3,507 13,003 295 (154 ) 13,144 $ 863,021 $ 23,006 $ (1,934 ) $ 884,093 December 31, 2018 Amortized
Cost Gross
Unrealized
Gains Gross
Unrealized
Losses Fair Value Debt Securities: U.S. government obligations and agencies $ 67,435 $ 241 $ (1,039 ) $ 66,637 Corporate bonds 434,887 714 (6,736 ) 428,865 Mortgage-backed and asset-backed securities 312,840 912 (4,155 ) 309,597 Municipal bonds 3,405 — (43 ) 3,362 Redeemable preferred stock 12,560 55 (638 ) 11,977 Total $ 831,127 $ 1,922 $ (12,611 ) $ 820,438 The following table provides the credit quality of available-for-sale debt securities with contractual maturities as of the dates presented (dollars in thousands): June 30, 2019 December 31, 2018 Equivalent S&P Credit Ratings Fair Value % of Total Fair Value Fair Value % of Total Fair Value $ 419,914 47.5 % $ 388,672 47.4 % 102,686 11.6 % 100,791 12.3 % 232,297 26.3 % 214,503 26.1 % 124,880 14.1 % 112,613 13.7 % BB and Below — — % 494 0.1 % 4,316 0.5 % 3,365 0.4 % $ 884,093 100.0 % $ 820,438 100.0 % (1)The credit ratings in the table above have been reclassified from the prior periods’ consolidated financial statements to conform to the current periods’ presentation.modified the presentation of this table by presentinghas presented the highest rating of the three rating agencies for each investment position. June 30, 2019 December 31, 2018 Amortized
Cost Fair Value Amortized
Cost Fair Value Mortgage-backed Securities: Agency $ 148,574 $ 148,889 $ 139,418 $ 136,291 Non-agency 73,639 78,169 61,689 61,933 Asset-backed Securities: Auto loan receivables 50,798 51,215 53,449 53,341 Credit card receivables 25,670 25,982 29,594 29,366 Other receivables 30,811 31,168 28,690 28,666 Total $ 329,492 $ 335,423 $ 312,840 $ 309,597 The following table summarizes the fair value and gross unrealized losses on available-for-sale debt securities, aggregated by major investment category and length of time that individual securities have been in a continuous unrealized loss position as of the dates presented (dollars in(in thousands):June 30, 2019 Less Than 12 Months 12 Months or Longer Number of
Issues Fair Value Unrealized
Losses Number of
Issues Fair Value Unrealized
Losses — $ — $ — 9 $ 46,478 $ (314 ) 23 12,768 (28 ) 79 68,066 (307 ) 10 13,813 (67 ) 71 102,029 (1,058 ) — — — 1 274 (6 ) 26 3,337 (47 ) 7 1,595 (107 ) 59 $ 29,918 $ (142 ) 167 $ 218,442 $ (1,792 ) December 31, 2018 Less Than 12 Months 12 Months or Longer Number of
Issues Fair Value Unrealized
Losses Number of
Issues Fair Value Unrealized
LossesDebt Securities: U.S. government obligations and agencies — $ — $ — 13 $ 56,531 $ (1,039 ) Corporate bonds 228 210,152 (3,318 ) 160 131,225 (3,418 ) Mortgage-backed and asset-backed securities 36 57,487 (196 ) 103 148,436 (3,959 ) Municipal bonds 6 3,362 (43 ) — — — Redeemable preferred stock 61 8,092 (506 ) 5 1,034 (132 ) Total 331 $ 279,093 $ (4,063 ) 281 $ 337,226 $ (8,548 ) As of June 30, 2018,2019, the Company held available-for-sale debt securities that were in an unrealized loss position as presented in the table above. For available-for-sale debt securities with significant declines in value, the Company performs quarterly fundamental credit analysis on a security-by-security basis, which includes consideration of credit quality and credit ratings, review of relevant industry analyst reports and other available market data. For available-for-sale debt securities, the Company considers whether it has the intent and ability to hold the available-for-sale debt securities for a period of time sufficient to recover its cost basis. Where the Company lacks the intent and ability to hold to recovery, or believes the recovery period is extended, the security’s decline in fair value is considered other than temporary and is recorded in earnings. Based on our analysis, our fixed income portfolio is of high quality and we believe that we will recover the amortized cost basis of our available-for-sale debt securities. We continually monitor the credit quality of our investments in available-for-sale debt securities to assess if it is probable that we will receive our contractual or estimated cash flows in the form of principal and interest. Additionally, the Company considers management’s intent and ability to20182019 are other than temporary.The following table presents the amortized cost and fair value of investments with contractual maturities as of the date presented (in thousands):June 30, 2019 Amortized Cost Fair Value $ 125,392 $ 125,260 430,647 437,007 296,314 310,958 9,515 9,656 1,153 1,212 $ 863,021 $ 884,093 ExpectedAll securities, except those with perpetual maturities, may differ fromwere categorized in the table above utilizing years to effective maturity. Effective maturity takes into consideration all forms of potential prepayment, such as call features or prepayment schedules, that shorten the lifespan of contractual maturities because borrowers may have the right to call or prepay with or without penalty.The following table provides certain information related to available-for-sale debt securities, and equity securities and investment real estate during the periods presented (in thousands):Three Months Ended
June 30, Six Months Ended
June 30,2019 2018 2019 2018 $ 60,545 $ 68,875 $ 111,730 $ 193,702 $ 11,976 $ 3,082 $ 29,137 $ 4,127 $ 112 $ 10 $ 299 $ 317 $ 170 $ 177 $ 335 $ 301 $ (148 ) $ (42 ) $ (190 ) $ (3,114 ) $ (2,952 ) $ — $ (14,787 ) $ — Realized gains on sale of real estate investment $ 1,213 $ — $ 1,213 $ — The following table presents the components of net investment income, comprised primarily of interest and dividends, for the periods presented (in thousands): Three Months Ended
June 30, Six Months Ended
June 30, 2019 2018 2019 2018 Available-for-sale debt securities $ 6,041 $ 4,095 $ 12,192 $ 7,795 Equity securities 562 711 1,604 1,294 Available-for-sale short-term investments — 56 — 145 Cash and cash equivalents (1) 1,392 1,359 2,692 2,246 Other (2) 252 246 511 413 Total investment income 8,247 6,467 16,999 11,893 Less: Investment expenses (3) (837 ) (681 ) (1,447 ) (1,322 ) Net investment income $ 7,410 $ 5,786 $ 15,552 $ 10,571 (1)(1 ) Includes interest earned on cash and cash equivalents and restricted cash and cash equivalents. Also includes(2 ) Includes investment income earned on real estate investments. (2)Includes bankcustodial fees, investment accounting and advisory fees, and expenses associated with real estate investments.Equity SecuritiesThe following table presentsprovides the portion of unrealized gains and losses related to equity securities forrecorded during the periods presented on equity securities still held at the end of the reporting period (in thousands): Three Months Ended
June 30, Six Months Ended
June 30, 2019 2018 2019 2018 Unrealized gains and (losses) recognized during the reporting period on equity securities still held at the reporting period$ 880 $ (1,521 ) $ 2,766 $ (6,630 ) Investment Real EstateInvestment real estate consisted of the following as of the dates presented (in thousands):June 30,
2019 December 31,
2018 Investment real estate $ 14,679 $ 14,619 (1,077 ) (870 ) 13,602 13,749 Investment real estate 2,190 10,690 $ 15,792 $ 24,439 (1) During the six months ended June 30, 2018,2019, the Company transferred $7.4 million from properties under development tocompleted the sale of investment real estate.Depreciation expense related to investment real estate for the periods presented (in thousands): Three Months Ended
June 30, Six Months Ended
June 30, 2019 2018 2019 2018 Depreciation expense on investment real estate $ 104 $ 101 $ 207 $ 204 4. ReinsuranceThe Company seeks to reduce theirits risk of loss by reinsuring certain levels of risk in various areas of exposure with other insurance enterprises or reinsurers, generally as of the beginning of the hurricane season on June 1st of each year. The Company’s current reinsurance programs consist principally of catastrophe excess of loss reinsurance, subject to the terms and conditions of the applicable agreements. The Company is responsible for certain retained loss amounts before reinsurance attaches and insured losses related to catastrophes and other events that exceed coverage provided by theirthe reinsurance programs. The Company remains responsible for the settlement of insured losses irrespective of whether any of theirthe reinsurers fail to make payments otherwise due.Amounts recoverable from reinsurers are estimated in a manner consistent with the termsprovisions of the reinsurance contracts.agreements and consistent with the establishment of the gross liability for losses, loss adjustment expenses (“LAE”) and expenses. Reinsurance premiums, losses and loss adjustment expenses (“LAE”)LAE are accounted for on a basis consistent with those used in accounting for the original policies issued and the terms of the reinsurance contracts.To reduce credit risk for amounts due from reinsurers, the Insurance Entities seek to do business with financially sound reinsurance companies and regularly evaluate the financial strength of all reinsurers used.The following table presents ratings from rating agencies and the unsecured amounts due from the Company’s reinsurers whose aggregate balancebalances exceeded 3% of the Company’s stockholders’ equity as of the dates presented (in thousands): Ratings as of June 30, 2019 Due from as of Reinsurer AM BestCompany Standardand Poor’sRatingServices, Inc. Moody’sInvestors Service, Inc. June 30, 2019 December 31, 2018 Florida Hurricane Catastrophe Fund (1) n/a n/a n/a $ 128,720 $ 165,022 Allianz Risk Transfer A+ AA Aa3 69,891 139,565 Renaissance Reinsurance Ltd A+ A+ A1 19,881 39,459 Chubb Tempest Reinsurance Ltd n/a n/a n/a — 16,208 Total (2) $ 218,492 $ 360,254 (1)(1) No rating is available, because the fund is not rated. (2)(2) Amounts represent prepaid reinsurance premiums, reinsurance receivables and net recoverables for paid and unpaid losses, including incurred but not reported reserves, and loss adjustment expenses, and offsetting reinsurance payables.expenses.The Company’s reinsurance arrangements had the following effect on certain items in the Condensed Consolidated Statements of Income for the periods presented (in thousands): Three Months Ended June 30, 2019 2018 Premiums
Written Premiums
Earned Losses and Loss
Adjustment
Expenses Premiums
Written Premiums
Earned Losses and Loss
Adjustment
ExpensesDirect $ 357,960 $ 303,108 $ 213,586 $ 342,781 $ 274,027 $ 246,622 Ceded (417,633 ) (92,751 ) (100,290 ) (339,251 ) (81,755 ) (156,780 ) Net $ (59,673 ) $ 210,357 $ 113,296 $ 3,530 $ 192,272 $ 89,842 Six Months Ended June 30, 2019 2018 Premiums
Written Premiums
Earned Losses and Loss
Adjustment
Expenses Premiums
Written Premiums
Earned Losses and Loss
Adjustment
ExpensesDirect $ 647,194 $ 598,485 $ 329,328 $ 612,765 $ 536,288 $ 323,261 Ceded (417,633 ) (178,401 ) (102,938 ) (339,251 ) (161,439 ) (157,493 ) Net $ 229,561 $ 420,084 $ 226,390 $ 273,514 $ 374,849 $ 165,768 The following prepaid reinsurance premiums and reinsurance recoverable and receivable are reflected in the Condensed Consolidated Balance Sheets as of the dates presented (in thousands):June 30, December 31, 2019 2018 $ 381,982 $ 142,750 $ 134,450 $ 25,238 197,117 393,365 Reinsurance recoverable $ 331,567 $ 418,603 5. Insurance OperationsDeferred Policy Acquisition CostsThe Company defers certain costs relating to written premium, called Deferred Policy Acquisition Costs (“DPAC”). DPAC is amortized over the effective period of the related insurance policies.The following table presents the beginning and ending balances and the changes in DPAC for the periods presented (in thousands):Three Months Ended
June 30, Six Months Ended
June 30,2019 2018 2019 2018 $ 83,284 $ 78,007 $ 84,686 $ 73,059 50,694 50,430 92,215 92,369 (43,448 ) (39,681 ) (86,371 ) (76,672 ) $ 90,530 $ 88,756 $ 90,530 $ 88,756 Regulatory Requirements and RestrictionsThe Insurance Entities are subject to regulations and standards of the Florida Office of Insurance Regulation (“FLOIR”). UPCIC also is subject to regulations and standards of regulatory authorities in other states where it is licensed, although as a Florida-domiciled insurer, its principal regulatory authority is the FLOIR. These standards require the Insurance Entities to maintain specified levels of statutory capital and restrict the timing and amount of dividends and other distributions that may be paid by the Insurance Entities to the parent company. Except in the case of extraordinary dividends, these standards generally permit dividends to be paid from statutory unassigned surplus of the regulated subsidiary and are limited based on the regulated subsidiary’s level of statutory net income and statutory capital and surplus. The maximum dividend that may be paid by UPCIC and APPCIC to their immediate parent company, Protection Solutions, Inc. (“PSI”, formerly known as Universal Insurance Holding Company of Florida (“UVECF”)Florida), without prior regulatory approval is limited by the provisions of the Florida Insurance Code. These dividends are referred to as “ordinary dividends.” However, if the dividend, together with other dividends paid within the preceding twelve months exceeds this statutory limit or is paid from sources other than earned surplus, the entire dividend is generally considered an “extraordinary dividend” and must receive prior regulatory approval.In accordance with Florida Insurance Code, and based on the calculations performed by the Company as of December 31, 2017,2018, UPCIC has the capacity to pay ordinary dividends of $36.2$14.0 million during 2018. 2019. APPCIC doesdid not currently meet the earnings or surplus regulatory requirements as of December 31, 2018 to pay ordinary dividends during 2018.2019. For the six months ended June 30, 2018,2019, no dividends were paid from UPCIC or APPCIC to UVECF. The Florida Insurance Code requires insurance companies to maintain capitalization equivalent to the greater of ten percent of the insurer’s total liabilities but not less thanor $10.0 million. The following table presents the amount of capital and surplus calculated in accordance with statutory accounting principles, which differ from U.S. GAAP, and an amount representing ten percent of total liabilities for both UPCIC and APPCIC as of the dates presented (in thousands):June 30, 2019 December 31, 2018 $ 98,843 $ 90,610 $ 632 $ 489 $ 344,609 $ 291,438 $ 15,898 $ 15,973 As of the dates in the table above, both UPCIC and APPCIC exceeded the minimum statutory capitalization requirement. UPCIC also met the capitalization requirements of the other states in which it is licensed as of June 30, 2018.2019. UPCIC and APPCIC are also required to adhere to prescribed premium-to-capital surplus ratios and have met those requirements at such dates.The following table summarizes combined net income for UPCIC and APPCIC determined in accordance with statutory accounting practices for the periods presented (in thousands): Three Months Ended
June 30, Six Months Ended
June 30, 2019 2018 2019 2018 Combined net income $ 26,717 $ 29,244 $ 34,340 $ 43,722 The Insurance Entities are required by various state laws and regulations to maintain certain assets in depository accounts. The following table represents assets held by insurance regulators as of the dates presented (in thousands):June 30, 2019 December 31, 2018 $ 2,635 $ 2,635 $ 3,931 $ 3,876 6.Liability for Unpaid Losses and Loss Adjustment ExpensesSet forth in the following table is the change in liability for unpaid losses and LAE for the periods presented (in thousands):Three Months Ended
June 30, Six Months Ended
June 30,2019 2018 2019 2018 $ 366,356 $ 129,637 $ 472,829 $ 248,425 Less: Reinsurance recoverable (269,071 ) (70,351 ) (393,365 ) (182,405 ) 97,285 59,286 79,464 66,020 112,626 87,532 225,905 163,502 670 2,310 485 2,266 113,296 89,842 226,390 165,768 89,093 50,572 123,642 67,979 30,309 43,373 91,033 108,626 119,402 93,945 214,675 176,605 91,179 55,183 91,179 55,183 Plus: Reinsurance recoverable 197,117 96,733 197,117 96,733 $ 288,296 $ 151,916 $ 288,296 $ 151,916 The Company’s losses incurred for the three and six months ended June 20, 2018 include prior year net reserve developmentTable of $2.3 million which was principally caused by Contentsloss reserve development of $5.3 million on a direct basis ($2.6 million on a net basis) for the fourth quarter 2016 storm, Hurricane Matthew. Reserve strengthening on Hurricane Matthew is based on our revised estimate to settle the remaining 78 open claims. The three and six months ended June 30, 2017 included prior year loss reserve development of $6.6 million on a direct basis ($1.1 million on a net basis), also reflecting strengthening of reserves for the fourth quarter 2016 storm, Hurricane Matthew.Also, during the second quarter in 2018, the Company increased its estimate of ultimate losses on the third quarter 2017 storm Hurricane Irma to $603.5 million for both Insurance Entities from $447.4 million recorded in the first quarter in 2018. The prior year development of $156.1 million in gross losses resulted in a net retention benefit of $0.3 million after cessions to the Company’s reinsurers. The increase in the ultimate loss and LAE for Hurricane Irma was the result of continuation of new reported claims and the aggressive nature of plaintiff attorneys on claims in Florida.7. Long-Term DebtLong-term debt consists of the following as of the dates presented (in thousands): June 30, December 31, 2019 2018 Surplus note $ 10,662 $ 11,397 In 2006, UPCIC entered into a $25.0 million surplus note with the State Board of Administration of Florida (the “SBA”) under Florida’s Insurance Capital Build-Up Incentive Program (the “ICBUI”).Program. The surplus note has a twenty-year term and accrues interest, adjusted quarterly based on the 10-year Constant Maturity Treasury Index.UPCIC was in compliance with the terms of the surplus note as of June 30, 2018.2019.8. Stockholders’ EquityCommon StockThe following table summarizesOn May 6, 2019, the activity relating to shares of the Company’s common stock during the six months ended June 30, 2018 (in thousands):(1)All shares acquired represent shares tendered to cover the strike price for options and tax withholdings on the intrinsic value of options exercised or performance share units vested. These shares have been cancelled by the Company.In September 2017, UVE’s Board of Directors authorized a share repurchase program under which UVEthe Company may repurchase in the open market up to $40 million of the Company’s outstanding shares of common stock through December 31, 2020. Following such authorization through June 30, 2019, the Company repurchased 338,274 shares, at an aggregate purchase price of approximately $9.7 million, pursuant to such repurchase program.On December 12, 2018, the Company’s Board of Directors authorized a share repurchase program under which the Company was authorized to repurchase in compliance with Exchange Act Rule 10b-18,the open market up to $20 million of the Company’s outstanding shares of common stock through May 31, 2020. During the six months ended June 30, 2019, the Company repurchased 468,108 shares, at an aggregate purchase price of approximately $14.5 million, pursuant to such repurchase program. The Company completed this share repurchase program in May 2019.On September 5, 2017, the Company’s Board of Directors authorized a share repurchase program under which the Company was authorized to repurchase in the open market up to $20 million of the Company’s outstanding shares of common stock through December 31, 2018. During the six months ended June 30, 2018, UVEthe Company repurchased 342,749 shares, at an aggregate price of approximately $11.1 million, pursuant to such repurchase program.DividendsThe following table summarizes the dividends declared and paid by the Company:9. Income TaxesDuring the three months ended June 30, 20182019 and 2017,2018, the Company recorded approximately $15.2$13.6 million and $18.5$15.2 million of income tax expense, respectively. The effective tax rate (“ETR”)for for the three months ended June 30, 20182019 was 24.8%26.8% compared to a 38.7%24.8% ETR for the same period in 2017.During the six months ended June 30, 20182019 and 2017,2018, the Company recorded approximately $26.8$27.2 million and $34.7$26.8 million of income tax expense, respectively. The ETR for the six months ended June 30, 20182019 was 23.7%26.0% compared to a 36.4%23.7% ETR for the same period in 2017.In arriving at these rates, the Company considersconsidered a variety of factors including the forecasted full year pre-tax results, the U.S. federal tax rate,, expected non-deductible expenses and estimated state income taxes. The Company’s final ETR for the full year will be dependent on the level of pre-tax income, discrete items, the apportionment of taxable income among state tax jurisdictions and the extent of non-deductible expenses in relation to pre-tax income.Income tax expense for the three months ended June 30, 2018 included a net credit for discrete items of $0.6 million primarily driven by the excess tax benefits resulting from stock-based compensation awards that were exercised during the second quarter of 2018, benefitting the current quarter’s ETR. For the second quarter of 2017, there were no discrete items.Income tax expense for the six months ended June 30, 2018 included a net credit of $2.3 million primarily driven by the excess tax benefits resulting from stock-based compensation awards that had vested and/or were exercised during that period. The prior year’s discrete items for the six months ended June 30, 2017 were $0.8 million for excess tax benefits resulting from stock-based compensation awards that had vested and/or were exercised during that period, and a credit toCompany’s income tax expense of $1.2 million resulting from anticipated recoveries of income taxes paid for the 2014-2015 tax years.The Company's income tax provision for the current reporting period reflects an estimated annual ETR of 25.7%,26.6% for 2019, calculated before the impact of discrete items. The statutory tax rate consists of a federal income tax rate of 21% and a state income tax rate, net of federal benefit, of 3.7%. TheDeferred tax assets and liabilities are recorded based on the difference inbetween the statutoryfinancial statement and tax rate, 24.7%,bases of assets and liabilities at the annual ETR, 25.7%, is largely attributable to the newenacted tax law’s impact on Internal Revenue Code Section 162(m). The effectrates. We review our deferred tax assets regularly for recoverability. As of reporting discrete items in the three months and six months ended June 30, 2018 amounts2019, we determined that we did not need a valuation allowance on our gross deferred tax assets. Although realization of the deferred tax assets is not assured, management believes that it is more likely than not the deferred tax assets will be realized based on our expectation that we will be able to an additional decrease tofully utilize the annual ETR rate of 1.0% and 2.0%, respectively, resulting in a total estimated ETR of 24.8% and 23.7%, respectively.The Company files its tax returns as prescribed by the tax laws of the jurisdictions in which it operates. TheAs of June 30, 2019, the Company’s 20142016 through 20162018 tax years are still subject to examination by the Internal Revenue Service and various tax years remain open to examination in certain state jurisdictions. In February 2018, the Company received notification from the Internal Revenue Service with respect to an examination10. Earnings Per ShareBasic earnings per share (“EPS”) is computed based on the weighted average number of common shares outstanding for the period, excluding any dilutive common share equivalents. Diluted EPS reflects the potential dilution resulting from the exercises of stock options, vesting of restricted stock, vesting of performance share units and conversion of preferred stock.The following table reconciles the numerator (i.e., income) and denominator (i.e., shares) of the basic and diluted earnings per shareEPS computations for the periods presented (in thousands, except per share data): Three Months Ended
June 30, Six Months Ended
June 30, 2019 2018 2019 2018 Numerator for EPS: Net income $ 37,293 $ 46,084 $ 77,441 $ 86,139 Less: Preferred stock dividends (2 ) (2 ) (5 ) (5 ) Income available to common stockholders $ 37,291 $ 46,082 $ 77,436 $ 86,134 Denominator for EPS: Weighted average common shares outstanding 34,311 34,909 34,525 34,874 Plus: Assumed conversion of share-based compensation (1) 276 655 353 737 Assumed conversion of preferred stock 25 25 25 25 Weighted average diluted common shares outstanding 34,612 35,589 34,903 35,636 Basic earnings per common share $ 1.09 $ 1.32 $ 2.24 $ 2.47 Diluted earnings per common share $ 1.08 $ 1.29 $ 2.22 $ 2.42 (1)(1) Represents the dilutive effect of unvested restricted stock, unvested performance share units and unexercised stock options. 11. Other Comprehensive Income (Loss)The following table provides the components of other comprehensive income (loss) on a pre-tax and after-tax basis for the periods presented (in thousands):(1)This amount represents reclassifications to retained earnings associated with the disproportional income tax effects of the Tax Act on items within AOCI and Unrealized Losses in AOCI relating to Available for Sale equity security investments. See “—Note 2 — Significant Accounting Policies – Recently Adopted Accounting Pronouncements” for more information. Three Months Ended June 30, 2019 2018 Pre-tax Tax After-tax Pre-tax Tax After-tax Net changes related to available-for-sale securities: Unrealized holding gains (losses) arising during the period $ 15,825 $ 3,896 $ 11,929 $ (2,488 ) $ (618 ) $ (1,870 ) Less: Reclassification adjustments for (gains) losses realized in net income36 10 26 32 11 21 Other comprehensive income (loss) $ 15,861 $ 3,906 $ 11,955 $ (2,456 ) $ (607 ) $ (1,849 ) Six Months Ended June 30, 2019 2018 Pre-tax Tax After-tax Pre-tax Tax After-tax Net changes related to available-for-sale securities: Unrealized holding gains (losses) arising during the period $ 31,870 $ 7,849 $ 24,021 $ (10,522 ) $ (2,507 ) $ (8,015 ) Less: Reclassification adjustments for (gains) losses realized in net income(109 ) (27 ) (82 ) 2,797 681 2,116 Other comprehensive income (loss) $ 31,761 $ 7,822 $ 23,939 $ (7,725 ) $ (1,826 ) $ (5,899 ) The following table provides the reclassifications adjustmentreclassification adjustments for gains (losses) out of accumulated other comprehensive income for the periods presented (in thousands):Details about AccumulatedOther ComprehensiveIncome (Loss) Components Amount Reclassified from AccumulatedOther Comprehensive Income (Loss) Affected Line Item in the StatementWhere Net Income is Presented Three Months Ended
June 30, Six Months Ended
June 30, 2019 2018 2019 2018 Unrealized gains (losses) on available-for-sale debt securities $ (36 ) $ (32 ) $ 109 $ (2,797 ) Net realized gains (losses) on sale of securities 10 11 (27 ) 681 Income taxes Total reclassification for the period $ (26 ) $ (21 ) $ 82 $ (2,116 ) Net of tax 12. Commitments and ContingenciesObligations under Multi-Year Reinsurance ContractsThe Company purchases reinsurance coverage to protect its capital and to limit its losses when major events occur. Reinsurance commitments run from June 1 of the current year to May 31 of the following year. Certain of the Company’s reinsurance agreements are for periods longer than one year. Amounts payable for coverage during the current June 1 to May 31 contract period are recorded as “Reinsurance Payable” in the financial statements. Multi-year contract commitments for future years will be recorded at the commencement of the coverage period. Amounts payable for future reinsurance contract years that the Company is obligated to pay are: (1) $117.6 million in 2020 and (2) $83.6 million in 2021.LitigationLawsuits are filed against the Company from time to time. Many of these lawsuits involve claims under policies that we underwrite and reserve for as an insurer. We are also involved in various other legal proceedings and litigation unrelated to claims under our policies that arise in the ordinary course of business operations. Management believes that any liabilities that may arise as a result of these legal matters will not have a material adverse effect on our financial condition or results of operations. The Company contests liability and/or the amount of damages as appropriate in each pending matter.In accordance with applicable accounting guidance, the Company establishes an accrued liability for legal matters when those matters present loss contingencies that are both probable and estimable. Legal proceedings are subject to many uncertain factors that generally cannot be predicted with assurance, and the Company may be exposed to losses in excess of any amounts accrued. The Company currently estimates that the reasonably possible losses for legal proceedings, whether in excess of a related accrued liability or where there is no accrued liability, and for which the Company is able to estimate a possible loss, are immaterial. This represents management’s estimate of possible loss with respect to these matters and is based on currently available information. These estimates of possible loss do not represent our maximum loss exposure, and actual results may vary significantly from current estimates.13. Fair Value MeasurementsU.S. GAAP defines fair value as the price that would be received to sell an asset or paid to transfer a liability in an orderly transaction between market participants as of the measurement date. U.S. GAAP describes three approaches to measuring the fair value of assets and liabilities: the market approach, the income approach and the cost approach. Each approach includes multiple valuation techniques. U.S. GAAP does not prescribe which valuation technique should be used when measuring fair value, but does establish a fair value hierarchy that prioritizes the inputs used in applying the various techniques. Inputs broadly refer to the assumptions that market participants use to make pricing decisions, including assumptions about risk. Level 1 inputs are given the highest priority in the hierarchy while Level 3 inputs are given the lowest priority. Assets and liabilities carried at fair value are classified in one of the following three categories based on the nature of the inputs to the valuation technique used:Summary of significant valuation techniquesSignificant Valuation Techniques for assets measuredAssets Measured at fair valueFair Value on a recurring basisLevel 1Common stock: Comprise actively traded, exchange-listed U.S. and international equity securities. Valuation is based on unadjusted quoted prices for identical assets in active markets that the Company can access.Mutual funds: Comprise actively traded funds. Valuation is based on daily quoted net asset values for identical assets in active markets that the Company can access.Level 2U.S. government obligations and agencies: Comprise U.S. Treasury Bills or Notes or U.S. Treasury Inflation Protected Securities. The primary inputs to the valuation include quoted prices for identical assets in inactive markets or similar assets in active or inactive markets, contractual cash flows, benchmark yields and credit spreads.Corporate bonds: Comprise investment-grade fixed income securities. The primary inputs to the valuation include quoted prices for identical assets in inactive markets or similar assets in active or inactive markets, contractual cash flows, benchmark yields and credit spreads.Mortgage-backed and asset-backed securities: Comprise securities that are collateralized by mortgage obligations and other assets. The primary inputs to the valuation include quoted prices for identical assets in inactive markets or similar assets in active or inactive markets, contractual cash flows, benchmark yields, collateral performance and credit spreads.Municipal bonds: Comprise fixed income securities issued by a state, municipality or county. The primary inputs to the valuation include quoted prices for identical assets in inactive markets or similar assets in active or inactive markets, contractual cash flows, benchmark yields and credit spreads.Redeemable preferred stock: Comprise preferred stock securities that are redeemable. The primary inputs to the valuation include quoted prices for identical or similar assets in markets that are not active.Short-term investments: Comprise investment securities subject to re-measurement with original maturities within one year but more than three months. The primary inputs to the valuation include quoted prices for identical or similar assets in markets that are not active.As required by U.S. GAAP, assets and liabilities are classified in their entirety based on the lowest level of input that is significant to the fair value measurement. The Company’s assessment of the significance of a particular input to the fair value measurement requires judgment, and may affect the placement of the asset or liability within the fair value hierarchy levels.The following tables set forth by level within the fair value hierarchy the Company’s assets that were measured at fair value on a recurring basis as of the dates presented (in thousands):Fair Value Measurements June 30, 2019 Level 1 Level 2 Level 3 Total $ — $ 73,576 $ — $ 73,576 — 458,443 — 458,443 — 335,423 — 335,423 — 3,507 — 3,507 — 13,144 — 13,144 Equity securities: 2,724 — — 2,724 39,644 — — 39,644 $ 42,368 $ 884,093 $ — $ 926,461 Fair Value Measurements December 31, 2018 Level 1 Level 2 Level 3 Total Available-For-Sale Debt Securities: U.S. government obligations and agencies $ — $ 66,637 $ — $ 66,637 Corporate bonds — 428,865 — 428,865 Mortgage-backed and asset-backed securities — 309,597 — 309,597 Municipal bonds — 3,362 — 3,362 Redeemable preferred stock — 11,977 — 11,977 Equity securities: Common stock 15,564 — — 15,564 Mutual funds 47,713 — — 47,713 Total assets accounted for at fair value $ 63,277 $ 820,438 $ — $ 883,715 The Company utilizes third-party independent pricing services that provide a price quote for each available-for-sale debt security and equity security and available-for-sale short-term investment.security. Management reviews the methodology used by the pricing services. If management believes that the price used by the pricing service does not reflect an orderly transaction between participants, management will use an alternative valuation methodology. There were no adjustments made by the Company to the prices obtained from the independent pricing source for any available-for-sale debt securities,security or equity securities or available-for-sale short-term investments included in the tables above.The following table summarizes the carrying value and estimated fair values of the Company’s financial instruments that are not carried at fair value as of the dates presented (in thousands):June 30, 2019 December 31, 2018 Carrying Value (Level 3) Estimated Fair Value Carrying Value (Level 3) Estimated Fair Value $ 10,662 $ 9,768 $ 11,397 $ 10,125 Level 3Long-term debt: The fair value of the surplus note was determined by management from the expected cash flows discounted using the interest rate quoted by the holder. The SBA is the holder of the surplus note and the quoted interest rate is below prevailing rates quoted by private lending institutions. However, as the Company’s use of funds from the surplus note is limited by the terms of the agreement, the Company has determined the interest rate quoted by the SBA to be appropriate for purposes of establishing the fair value of the note.14. Subsequent EventsThe Company performed an evaluation of subsequent events through the date the Financial Statements were issued and determined there were no recognized or unrecognized subsequent events that would require an adjustment or additional disclosure in the Financial Statements as of June 30, 2018.2019.ItemItem 2. Management’s Discussion and Analysis of Financial Condition and Results of OperationsUnless the context otherwise requires, all references to “we,” “us,” “our,” and “Company” refer to Universal Insurance Holdings, Inc. and its wholly-owned subsidiaries. You should read the following discussion together with our unaudited condensed consolidated financial statements (“Financial Statements”) and the related notes thereto included in Part“Part I, Item 1 “Financial Statements.”1—Financial Statements”, and our audited condensed consolidated financial statements and the related notes thereto included in “Part II, Item 8—Financial Statements and Supplementary Data” in our Annual Report on Form 10-K for the year ended December 31, 2018. Operating results for any one quarter are not necessarily indicative of results to be expected for any other quarter or for the year.Cautionary Note Regarding Forward-Looking StatementsIn addition to historical information, the following discussionthis report may contain “forward-looking statements” within the meaning of Section 27A of the Securities Act of 1933, as amended, and Section 21E of the Securities Exchange Act. Forward-lookingAct of 1934, as amended (the “Exchange Act”). The forward-looking statements anticipate results based on our estimates, assumptions and plans that are subject to uncertainty. These forward-looking statements may be identified by their use of words like “plans,” “seeks,” “expects,” “will,” “should,” “anticipates,” “estimates,” “intends,” “believes,” “likely,” “targets” and other words with similar meanings. These statements may address, among other things, our strategy for growth, catastrophe exposure and other risk management, product development, investment results, regulatory approvals, market position, expenses, financial results, litigation and reserves. We believe that these statements are based on various factorsreasonable estimates, assumptions and plans. However, if the estimates, assumptions that include known and unknownor plans underlying the forward-looking statements prove inaccurate or if other risks andor uncertainties some of which are beyond our control and cannot be predicted or quantified. Certain statements made in this report reflect management’s expectations regarding future events, and the words “expect,” “estimate,” “anticipate,” “believe,” “intend,” “project,” “plan” and similar expressions and variations thereof, speak only as of the date the statement was made and are intended to identify forward-looking statements. Such statements may include, but not be limited to, projections of revenues, income or loss, expenses, plans, as well as assumptions relating to the foregoing. Futurearise, actual results could differ materially from those communicated in the following discussion and those described inthese forward-looking statements as a result of the risks set forth below, which are a summary of those set forth in our Annual Report on Form 10-K for the year ended December 31, 2017.Risks Relatingand uncertainties that may affect our financial condition and operating results include, but are not limited to, our Businessthe following:As a property and casualty insurer, we may face significant losses fromUnanticipated increases in the severity or frequency of claims, including those relating to catastrophes, and severe weather eventsActual claims incurred and changing climate conditions, which may exceed our current reserves established for claims and may adversely affectclaims;Failure of our operating results and financial condition,Our success depends in part on our abilityrisk mitigation strategies, including failure to accurately and adequately price the risks we underwriteUnanticipated increases in the severity or frequency of claims may adversely affect our profitability and financial condition,The failure of the risk mitigation strategies we utilize could have a material adverse effect on our financial condition or results of operations,Because we rely on independent insurance agents, the loss of these independent agent relationships and the business they control or our ability to attract new independent agents could have an adverse impact on our business,The inherent uncertainty of models and our reliance on such models as a tool to evaluate risk may have an adverse effect on our financial results,Reinsurance may be unavailable in the future at current levels and prices, which may limit our ability to write new business or to adequately mitigate our exposure to loss,Reinsurance subjects us to the credit risk of our reinsurers, which could have a material adverse effect on our operating results and financial condition,Our financial condition and operating results and the financial condition and operating results of our Insurance Entities (as defined below) may be adversely affected by the cyclical nature of the property and casualty business,Because we conduct the substantial majority of our business in Florida, our financial results depend on the regulatory, economic and weather conditions in Florida,Changing climate conditions may adversely affect our financial condition, profitability or cash flows,We have entered and in the future, may enter new markets, but there can be no assurance that our diversification and growth strategy will be effectiveLoss of key executives or our inability to otherwise attract and retain talent could affect our operations,We could be adversely affected if our controls designed to ensure compliance with guidelines, policies and legal regulatory standards are not effective,The failure of our claims department to effectively manage claims could adversely affect our insurance business, financial results and capital requirements,Litigation or regulatory actions could have a material adverse impact on us,Our future results are dependent in part on our ability to successfully operate in a highly competitive insurance industry,•A downgrade in our Financial Stability Rating® may have an adverse effect on our competitive position, the marketability of our product offerings, and our liquidity, operating results and financial condition,•Breaches of our information systems or denial of service on our website could have an adverse impact on our business and reputation,We may not be able to effectively implement or adapt to changes in technology, andLack of effectiveness of exclusions and other loss limitation methods in our insurance policies;Loss of independent insurance agents and inability to attract new independent agents;Reliance on models, which are inherently uncertain, as a tool to evaluate risks;The continued availability of reinsurance at current levels and prices, and our ability to collect payments from our reinsurers;Changes in industry trends, including changes due to the insurancecyclical nature of the industry and increased competition;Geographic concentration of our business in Florida and the effectiveness of our growth and diversification strategy in new markets;Loss of key personnel and inability to attract and retain talented employees;Failure to comply with existing and future guidelines, policies we writeand legal and regulatory standards;The ability of our claims professionals to effectively manage claims;Litigation or regulatory actions that could have a material adverse effectresult in significant damages, fines or penalties;A downgrade in our Financial Stability Rating® and its impact on our financial conditioncompetitive position, the marketability of our product offerings, our liquidity and profitability;The impact on our business and reputation of data and security breaches due to cyber-attacks or our resultsinability to effectively adapt to changes in technology;Our dependence on the returns of operations.Risks Relating to Investmentsrisk;Weour investment portfolio, which are subject to market risk, which could adversely affect investment income, andOur overall financial performance is dependent in part on the returns on our investment portfolio, which could have a material adverse effect on our financial conditionLegal, regulatory or results of operations or cause such results to be volatile.Risks Relating to the Insurance IndustryWe are subject to extensive regulation and potential further restrictive regulation maytax changes that increase our operating costs and limitdecrease our growth and profitability,UVE is a holding company and, consequently, its cash flow is dependent such as limitations on dividends and other permissible payments from its subsidiaries,Regulations limiting rate changes and requiring usor requirements to participate in loss sharing or assessments may decreasesharing;Our dependence on dividends and permissible payments from our subsidiaries; andprofitability,amountability of our Insurance Entities to comply with statutory capital and surplus that eachminimums and other regulatory and licensing requirements.OVERVIEWWe are a vertically integrated holding company offering property and the amount of statutory capitalcasualty (“P&C”) insurance and surplus it must hold can varyvalue-added insurance services. We develop, market and are sensitive to a number of factors outside of our control, including market conditions andunderwrite insurance products for consumers predominantly in the regulatory environment and rules, andOur Insurance Entities are subject to examination and actions by state insurance departments.Risks Relating to Debt ObligationsAdverse capital and credit market conditions may significantly affect our ability to meet liquidity needs or our ability to obtain credit on acceptable terms.Risks Relating to Ownership of Our Common StockThe price of our common stock may fluctuate significantly, and you could lose all or part of your investment,Any issuance of preferred stock could make it difficult for another company to acquire us or could otherwise adversely affect holders of our common stock, which could depress the price of our common stock, andFuture sales of our common stock may depress our stock price.The following Management’s Discussion and Analysis of Financial Condition and Results of Operations (“MD&A”) is intended to help the reader understand the results of operations and financial condition of Universal Insurance Holdings, Inc. and its wholly-owned consolidated subsidiaries. MD&A is provided as a supplement to, and should be read in conjunction with, our financial statements and accompanying notes in Item 1 above.OverviewUniversal Insurance Holdings, Inc. (“UVE,” and together with its wholly-owned subsidiaries, “we,” “our,” “us,” or “the Company”) is the largest private personal residential insurance company in Florida by direct written premium in-force, with approximately 10.3% market share ashomeowners line of March 31, 2018, according to the most recent data reported by the Florida Office of Insurance Regulation (“FLOIR”). Webusiness and perform substantially all aspects ofother insurance-related services for our primary insurance underwriting, policy issuance, general administrationentities, including risk management, claims management, and claims processing and settlement internally through our vertically integrated operations.distribution. Our wholly-owned licensedprimary insurance subsidiaries,entities, Universal Property & Casualty Insurance Company (“UPCIC”) and American Platinum Property and Casualty Insurance Company (“APPCIC” and together with UPCIC, the “Insurance Entities”), currentlyoffer insurance products through both our appointed independent agent network and our online distribution channels across 18 states (primarily in Florida), with licenses to write personal residential insurance policies, predominantly in Florida with $529.5 millionan additional twostates. In the second quarter, we surrendered our license in directWest Virginia, a state in which we have not written premium and have no current plans to do business. Also during the second quarter, we received a Certificate of Authority in Wisconsin, approving UPCIC as a licensed insurance entity in Wisconsin. The Insurance Entities seek to produce an underwriting profit over the long term (defined as earned premium less losses, loss adjustment expense (“LAE”), policy acquisition costs and other operating costs); maintain a strong balance sheet to prepare for years in which the Insurance Entities are not able to achieve an underwriting profit; and generate investment income on assets exceeding short-term operating needs.The following Management’s Discussion and Analysis (“MD&A”) is intended to assist in an understanding of our financial condition and results of operations. This MD&A should be read in conjunction with our Financial Statements and accompanying Notes appearing elsewhere in this Report (the “Notes”). In addition, reference should be made to our audited Consolidated Financial Statements and accompanying Notes to Consolidated Financial Statements and “Item 7—Management’s Discussion and Analysis of Financial Condition and Results of Operations” included in our Annual Report on Form 10-K for the six monthsyear ended June 30,December 31, 2018. UPCIC also writes residential homeowners insurance policies in Alabama, Delaware, Georgia, Hawaii, Indiana, Maryland, Massachusetts, Michigan, Minnesota, New Hampshire, New Jersey, New York, North Carolina, Pennsylvania, South Carolina, and Virginia with $83.3 million in direct written premiumExcept for the six months ended June 30, 2018. UPCIC is also licensedhistorical information contained herein, the discussions in this MD&A contain forward-looking statements that involve risks and uncertainties. Our future results could differ materially from those discussed herein. Factors that could cause or contribute to issue policies in Illinois, Iowa, and West Virginia. APPCIC also is currently writing Fire, Commercial Multi-Peril, and Other Liability linessuch differences include, but are not limited to, those discussed above under “Cautionary Note Regarding Forward-Looking Statements.”RESULTS OF OPERATIONS AND ANALYSIS OF FINANCIAL CONDITIONHighlightsResults of business in Florida. We believe that our longevity in the Florida market and our resulting depth of experience will enable us to continue to successfully grow our business in both hard and soft markets.We generate revenues primarily from the collection of premiums. The nature of our business tends to be seasonal, reflecting consumer behaviors in connection with the Florida residential real estate market and the hurricane season. The amount of direct written premium tends to increase just prior tooperations for the second quarter of our fiscal year and tends to decrease approaching2019, in each case compared with the fourth quarter. Other sourcessecond quarter of revenuefiscal 2018 (unless otherwise specified), include: commissions paid by our reinsurers to our reinsurance intermediary subsidiary, Blue Atlantic Reinsurance, on reinsurance it places for the Insurance Entities; policy fees collected from policyholders by our managing general agent subsidiary, Universal Risk Advisors; earnings from claims handling on ceded claims by our subsidiary, Universal Adjusting Corporation (“UAC”); and financing fees charged to policyholders who choose to defer premium payments. We also generate income by investing our assets.Over the past several years, we have grown our business both within Florida and elsewhere in the United States through our distribution network of approximately 9,200 licensed independent agents. Our goals are to profitably grow our business, invest in our vertically integrated structure, expand our independent agent network, and return value to shareholders. Some of our key strategies include increasing our policies in force in Florida through continued profitable and organic growth; expanding into other states to diversify our revenue and risk; optimizing our reinsurance program; and continuing to provide high quality service to our policyholders and reinsurers through our vertically integrated structure. We believe each of these strategies has contributed to an increase in earnings and earnings per share as well as an improvement in our overall financial condition. See “—Results of Operations” below for a discussion of our results for the three and six months ended June 30, 2018 compared to the same periods in 2017.Our overall organic growth strategy emphasizes taking prudent measures to increase our footprint, grow our policy count and improve the quality of our business rather than merely increasing our market share. Our focus on long-term capital strength and organic growth allows us to be selective in the risks we accept. Our goal is to write risks that are priced adequately and meet our underwriting standards. We believe that our strategy of organically expanding our premium growth through our independent agent distribution network and through our unique direct-to-consumer online platform called Universal DirectSM (which enables homeowners to directly purchase, pay for and bind homeowners policies online without the need to directly interface with any intermediaries), streamlining claims management and balancing appropriate pricing with disciplined underwriting standards will maximize our profitable growth. We also intend to continue our expansion outside of Florida in markets that allow us to write profitable business and to diversify our revenue and risk. Upon entering new markets, we leverage our existing independent agent network to generate new local relationships and business, and we take the time to learn about each new market and any of its unique risks in order to carefully develop our own policy forms, rates and informed underwriting standards. Our expansion efforts differ from many of our competitors that have grown in recent years primarily through assumption of policies from Citizens Property Insurance Corporation, Florida’s statutory residual property insurance market and through mergers and acquisitions.As a result of our organic growth strategy and initiatives, we have seen increases in policy count and insured value in all states for over three years. The percentage of our total insured value for states outside of Florida increased from 23.7% as of June 30, 2017 to 28.9% as of June 30, 2018. The following table provides direct premiums written premium for Florida and other states for the three and six months ended June 30, 2018 and 2017 (dollars in thousands):Second-Quarter 2018 HighlightsGross direct written premiums overall grew by $46.6$15.2 million, or 15.7%4.4%, to $342.8$358.0 million.In Florida, direct premiums written grew by $1.6 million, our other states, direct premiums written grew by $13.6 million, or 28.7%.compared to the second quarteror 0.5%, and in 2017.Total direct written premium rate of growth improved from 8.9% in 2017 to 15.7% in 2018, quarter over quarter.$210.4 million.$23.3$18.1 million, or 13.8%9.4%, to $192.3 million compared to the second quarter in 2017.$24.3$23.9 million, or 13.1%11.4%, to $209.8 million$233.7 million.Loss ratio was 53.9% as compared to 46.7%.the second quarter in 2017.Diluted earnings per share (“EPS”) of $1.08.Loss ratio improvedBook value per share increased by $2.15, or 14.9%, to $16.57 at June 30, 2019 from 47.4% as of the end of the second quarter in 2017 to 46.7% as of the end of the second quarter in$14.42 at December 31, 2018.•Expense ratio improved from 33.9% as of the end of the second quarter in 2017 to 30.4% as of the end of the second quarter in 2018.UAC generated $8.4 million of estimated pretax profits principally from the handling of Hurricane Irma claims.Primarily as a result of the Tax Cuts and Jobs Act of 2017 (“Tax Act”), our effective tax rate decreased from 38.7% in 2017 to 24.8% in 2018.Completed negotiation and execution of contracts representing our 2018 – 2019 reinsurance program.of 2019.$0.14$0.16 per share duringin the second quarter in 20182019 and declared dividends of $0.16 per share payable in the third quarter in 2018.250,000485,882 shares during the quarter at an aggregate costpurchase price of $8.4 million pursuant$14.1 million.ReinsuranceReinsurance enables our Insurance Entities to limit potential exposures to catastrophic events. Reinsurance contracts are typically classified as treaty or facultative contracts. Treaty reinsurance provides coverage for all or a portion of a specified group or class of risks ceded by the or excess of loss. Quota-share reinsurance is where the primary insurer and the reinsurer share proportionally or pro-rata in the direct premiums and losses of the insurer. Excess of loss reinsurance indemnifies the direct insurer or reinsurer for all or a portion of the loss in excess of an agreed upon amount or retention.Company’s 2018primary insurer, while facultative reinsurance provides coverage for specific individual risks. Within each classification, reinsurance can be further classified as quota share repurchase program.WroteDeveloping and implementing our first policyreinsurance strategy to adequately protect our balance sheet and Insurance Entities in New Hampshire.UPCIC’s 2018-2019 Reinsurance ProgramThird-Party ReinsuranceOur annualthe event of one or more catastrophes while maintaining efficient reinsurance program, which is segmented into layers of coverage, as is industry practice, protects us against excess property catastrophe losses. Our 2018-2019costs has been a key strategic priority for us. In order to limit the Insurance Entities’ potential exposure to catastrophic events, we purchase significant reinsurance program includes the mandatory coverage required by law to be placed withfrom third-party reinsurers and the Florida Hurricane Catastrophe Fund (“FHCF”),. The Florida Office of Insurance Regulation (“FLOIR”) requires the Insurance Entities, like all insurance companies doing business in Florida, to have a certain amount of capital and reinsurance coverage in order to cover losses upon the occurrence of a single catastrophic event and a series of catastrophic events occurring in the same hurricane season. The Insurance Entities’ 2019-2020 reinsurance programs meet the FLOIR’s requirements, which we have elected to participate at 90%, the highest level,are based on, among other things, successfully demonstrating a cohesive and also includes private reinsurance below, alongside and above the FHCF layer. In placing our 2018-2019comprehensive reinsurance program we obtained multiple yearsthat protects the policyholders of coverage for an additional portionour Insurance Entities as well as satisfying a series of stress test catastrophe loss scenarios based on past historical events.We believe the Insurance Entities’ retentions under their respective reinsurance programs are appropriate and structured to protect policyholders. We test the sufficiency of the program. We believe this multi-year arrangement will allow usreinsurance programs by subjecting the Insurance Entities’ personal residential exposures to capitalizestatistical testing using a third-party hurricane model, RMS RiskLink v17.0 (Build 1825). This model combines simulations of the natural occurrence patterns and characteristics of hurricanes, tornadoes, earthquakes and other catastrophes with information on favorable pricingproperty values, construction types and contract terms and conditions and allow us to mitigate uncertainty with respect tooccupancy classes. The model outputs provide information concerning the price of future reinsurance coverage, onepotential for large losses before they occur, so companies can prepare for their financial impact. Furthermore, as part of our largest costs.The total cost of UPCIC’s privateoperational excellence initiatives, we continually look to enable new technology to refine our data intelligence on catastrophe reinsurance program for all states as described below, effectiverisk modeling.Effective June 1, 2018 through May 31, 2019, is $175.30 million. In addition, UPCIC has purchased reinstatement premium protection as described below, the cost of which is $14.97 million. The largest private participants in Insurance Entities entered into multiple reinsurance agreements comprising our 2019-2020 reinsurance program. See “Item 1—Note 4 (Reinsurance).”UPCIC’s reinsurance program include leading reinsurance companies and providers such as Nephila Capital, Everest Re, RenaissanceRe, Chubb Tempest Re and Lloyd’s of London syndicates.UPCIC’s RetentionUPCIC has a net2019-2020 Reinsurance ProgramFirst event All States retention of $35$43 million; First event Non-Florida retention of $10 million.All States first event tower expanded to $3.28 billion, an increase of $134 million per catastrophe event for losses incurred, in all states, up toover the final 2018-2019 program.Assuming a first event loss of $3.00 billion. UPCIC also purchases a separate underlying catastrophe program to further reduce its retention for all losses occurring in any state other than Florida (the “Other States Reinsurance Program”). UPCIC retains only $5 million under its Other States Reinsurance Program incompletely exhausts the first event, $3 million in$3.28 billion tower, the second event and only $1exhaustion point would be $1.3 billion, an increase of $262 million under its Other States Reinsurance Program forover the third through fifth events. These retention amounts are gross of any potential tax benefit we would receive in paying such losses.First LayerImmediately above UPCIC’s net retention, we have reinsurance coverage from third-party reinsurers for up to four separate catastrophic events,final 2018-2019 program on the same assumptions.Full reinstatement available for all states. Specifically, we haveprivate market first event catastrophe layers for guaranteed second event coverage. For all layers purchased reinsurance coverage forbelow the first and third catastrophic events, and each such coverage allows for one reinstatement upon the payment of reinstatement premiums, which would cover the second and fourth catastrophic events. This coverage has been obtained from four contracts as follows:59% of $76 million in excess of $35 million provides coverage for the 2018-2019 period;20% of $55 million in excess of $35 million provides coverage on a multi-year basis through May 31, 2021;21% of $55 million in excess of $35 million provides coverage for the 2018-2019 period; and100% of $76 million in excess of $35 million and in excess of $152 million otherwise recoverable (from the first and second events) provides the third and fourth event coverage for the 2018-2019 period.For the first three contracts above,FHCF, to the extent that all of our coverage or a portion thereof is exhausted in a catastrophic event and reinstatement premium is due, we haveUPCIC has purchased reinstatement premium protection (“RPP”) to pay the required premium necessary for the reinstatement of these coverages. All of these contracts extend coverage to all states.Second LayerAbove the first layers, for losses exceeding $90 million and $111 million, we have purchased a second layer of coverage for losses up to $445 million – in other words, for the next $355 or $334 million of losses. This coverage has been obtained from three contracts as follows:58% of $355 million in excess of $90 million provides coverage on a multi-year basis through May 31, 2020;19.5% of $334 million in excess of $111 million provides coverage on a multi-year basis through May 31, 2021; and22.5% of $334 million in excess of $111 million provides coverage for the 2018-2019 period.In these layers, to the extent that all of our coverage or a portion thereof is exhausted in a catastrophic event and reinstatement premium is due, we have purchased reinstatement premium protection to pay the required premium necessary for the reinstatement of these coverages. All of these contracts extend coverage to all states.Third LayerAbove the first and second layers, we have purchased a third layer of coverage for losses up to $529 million – in other words, for the next $84 million of losses. This coverage was obtained from two contracts as follows:65% of $84 million in excess of $445 million provides coverage on a multi-year basis through May 31, 2021; and35% of $84 million in excess of $445 million provides coverage for the 2018-2019 period.In these layers, to the extent that all of our coverage or a portion thereof is exhausted in a catastrophic event and reinstatement premium is due, we have purchased reinstatement premium protection to pay the required premium necessary for the reinstatement of these coverages. Both of these contracts extend coverage to all states.Fourth LayerAbove the first, second and third layers, we have purchased a fourth layer of coverage for losses up to $635 million – in other words, for the next $106 million of losses. This coverage was obtained from two contracts as follows:65% of $106 million in excess of $529 million provides coverage for the 2018-2019 period; and35% of $106 million in excess of $529 million provides coverage for the 2018-2019 period.In these layers, to the extent that all of our coverage or a portion thereof is exhausted in a catastrophic event and reinstatement premium is due, we have purchased reinstatement premium protection to pay the required premium necessary for the reinstatement of these coverages. Both of these contracts extend coverage to all states.Fifth LayerAbove the first, second, third and fourth layers, we have purchased a fifth layer of coverage for losses up to $680 million – in other words, for the next $45 million of losses. This coverage was obtained from two contracts as follows:65% of $45 million in excess of $635 million provides coverage on a multi-year basis through May 31, 2021; and35% of $45 million in excess of $635 million provides coverage for the 2018-2019 period.In these layers, to the extent that all of our coverage or a portion thereof is exhausted in a catastrophic event and reinstatement premium is due, we have purchased reinstatement premium protection to pay the required premium necessary for the reinstatement of these coverages. Both of these contracts extend coverage to all states.Sixth and Seventh LayersIn the sixth and seventh layers, we have purchased reinsurance for $218 million of coverage in excess of $680 million in losses incurred by us (net of the FHCF layer), and $140 million of coverage in excess of $898 million (net of the FHCF layer), respectively, for a total of $1.0 billion of coverage (net of the FHCF layer) by third-party reinsurers. In these layers, to the extent that all of our coverage or a portion thereof is exhausted in a catastrophic event and reinstatement premium is due, we have purchased reinstatement premium protection to pay the required premium necessary for the reinstatement of these coverages. Both of these contracts extend coverage to all states.UPCIC structures itsPrivate market reinsurance coverage continues to be structured into layers andlayers. This structure utilizes a cascading feature such that the second, third, fourth, fifth, sixth and seventh reinsurance layers all attach at $111 million. Anyany layers above thea $111 million attachment point are excess of loss over the immediately preceding layer. If the aggregate limit of the preceding layer is exhausted, the next layer cascades down in its place for future events. This means that, unless losses exhaust the top layerSpecific 3rd and 4th event private market catastrophe excess of our coverage, we are exposed to only $35 million in losses, pre-tax, per catastrophe for each of the first four events. In addition to tax benefits that could reduce our ultimate loss we anticipate that certain fees paid to our subsidiary service providers by our Insurance Entities and, indirectly, our reinsurers, would also increase during an active hurricane season.Other States Reinsurance ProgramThe total cost of UPCIC’s private catastrophe reinsurance program for other states as described below, effective June 1, 2018 through May 31, 2019, is $9.74 million. In addition, UPCIC has purchased reinstatement premium protection as described below, the cost of which is $2.25 million.Effective June 1, 2018 through June 1, 2019, under an excess catastrophe contract specifically covering risks located outside the state of Florida and intended to further reduce UPCIC’s $35 million net retention, as noted above, UPCIC has obtained catastrophe coverage of $30$76 million in excess of $5$35 million covering certain loss occurrences, including hurricanes, in states outsideprovides robust frequency protection for a multiple event storm season.For the FHCF Reimbursement Contracts effective June 1, 2019, UPCIC has continued the election of Florida. Thisthe 90% coverage level. The total mandatory FHCF layer is estimated to provide approximately $1.980 billion of coverage for UPCIC, which inures to the benefit of the open market coverage secured from private reinsurers.APPCIC’s 2019-2020 Reinsurance ProgramFirst event All States retention of $2 million.All States first event tower of $27.5 million.Full reinstatement available for all private market first event catastrophe coverage has alayers for guaranteed second full limit available with additional premium calculated pro rata as to amount and 100% as to time, as applicable.event coverage. For this catastrophe coverage, which is placed in three layers,the layer purchased below the FHCF, to the extent that all of our coverage or a portion thereof is exhausted in a catastrophic event and reinstatement premium is due, we haveAPPCIC has purchased reinstatement premium protectionRPP to pay the required premium necessary for the reinstatement of this coverage. All catastrophe layers are placed with a cascading feature so that all capacity could be made available in excess of $5 million under certain loss scenarios. Further, UPCIC purchased subsequent catastrophe event excess of loss reinsurance specifically covering risks outside of Florida to cover certain levels of loss through five catastrophe events including hurricanes. Specifically, UPCIC obtained catastrophe coverage that covers 100% of $4,000,000 excess of $1,000,000 in excess of $6,000,000 otherwise recoverable. This coverage has two and a half free reinstatements and a total of $14,000,000 of coverage available to UPCIC.In certain circumstances involving a first catastrophic event impacting both Florida and other states, UPCIC’s retention could result in pre-tax net liability as low as $5,000,000 – the $35 million net retention under the all states reinsurance program could be offset by as much as $30 million in coverage under the Other States Reinsurance Program – or 1.5% of UPCIC’s statutory policyholders’ surplus as of June 30, 2018.FHCFUPCIC’s third-party reinsurance program supplements the FHCF coverage we are required to purchase every year. The limit and retention of the FHCF coverage we receive each year is subject to upward or downward adjustment based on, among other things, submitted exposures to the FHCF by all participants. As of June 1, 2018, we estimate our FHCF coverage includes a maximum provisional limit of 90% of $2.18 billion, or $1.96 billion, in excess of $680 million. The estimated premium that UPCIC plans to cede to the FHCF for the 2018 hurricane season is $128.3 million.Coverage purchased from third-party reinsurers, as described above, adjusts to provide coverage for certain losses not otherwise covered by the FHCF. The FHCF coverage cannot be reinstated once exhausted, but it does provide coverage for multiple events. The FHCF coverage extends only to losses to our Florida portfolio due to a land falling hurricane.The third-party reinsurance we purchase for UPCIC is therefore net of FHCF recovery. When our FHCF and third-party reinsurance coverages are taken together, UPCIC hasPrivate market reinsurance coverage of upcontinues to $3.00 billion for the first event, as illustrated by the graphic below. Should a catastrophic event occur, we would retain up to $35 million pre-tax for each catastrophic event, and would also be responsible for any additional losses that exceed our top layer of coverage.All States 1st Event
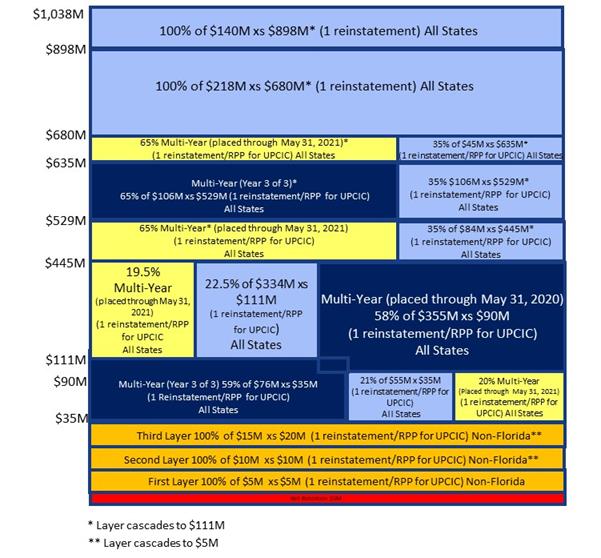
APPCIC’s 2018-2019 Reinsurance ProgramThird-Party ReinsuranceThe total cost of APPCIC’s private catastrophe and multiple line excess reinsurance program, effective June 1, 2018 through May 31, 2019, is $2.27 million. In addition, APPCIC has purchased reinstatement premium protection as described below, the cost of which is $103,950. The largest private participants in APPCIC’s reinsurance program include leading reinsurance companies such as Everest Re, Chubb Tempest Re, Hiscox, Hannover Ruck, and Lloyd’s of London syndicates.APPCIC’s RetentionAPPCIC has a net retention of $2 million for all losses per catastrophe event for losses incurred up to a first event loss of $36.2 million.structured into layers. This retention amount is gross of any potential tax benefit we would receive in paying such losses.First LayerImmediately above APPCIC’s net retention we have $4.2 million of reinsurance coverage from third-party reinsurers. Specifically, we have purchased reinsurance coverage for the first event, and such coverage allows for one reinstatement upon the payment of reinstatement premiums, which would cover the second and potentially more catastrophic events. We have purchased reinstatement premium protection to pay the required premium necessary for the initial reinstatement of this coverage for a second catastrophic event.Second, Third and Fourth LayersIn the second, third and fourth layers, we have purchased reinsurance for $2.0 million of coverage in excess of $6.2 million in losses incurred by us (net of the FHCF layer), $5 million of coverage in excess of $8.2 million in losses incurred by us (net of the FHCF layer), and $5 million of coverage in excess of $13.2 million in losses incurred by us (net of the FHCF layer), respectively.APPCIC structures its reinsurance coverage into layers andstructure utilizes a cascading feature such that the second, third and fourth reinsurance layers all attach at $2 million. Anyany layers above the $2 million attachment point are excess of loss over the immediately preceding layer. If the aggregate limit of the preceding layer is exhausted, the next layer cascades down in its place for future events. This means that, unless losses exhaust the top layer of our coverage, we are only exposed to $2 million in losses, pre-tax, per catastrophe for each of the first two events. In addition to tax benefits that could reduce our ultimate loss, we anticipate that certain fees paid to our subsidiary service providers by our Insurance Entities and, indirectly, our reinsurers would also increase during an active hurricane season.FHCFAPPCIC’s third-party reinsurance program is used to supplement the FHCF reinsurance we are required to purchase every year. The limit and retention of the FHCF coverage we receive each year is subject to upward or downward adjustment based on, among other things, submitted exposures to the FHCF by all participants. As of June 1, 2018, we estimate our FHCF coverage includes a maximum provisional limit of 90% of $20 million, or $18 million, in excess of $6.2 million. The estimated premium that APPCIC plans to cede to the FHCF for the 2018 hurricane season is $1.2 million. Factoring in our estimated coverage under the FHCF, we purchase coverage alongside our FHCF coverage from third-party reinsurers as described above, which adjusts to provide coverage for certain losses not otherwise covered by the FHCF. The FHCF coverage cannot be reinstated once exhausted, but it does provide coverage for multiple events. The FHCF coverage extends only to losses to our portfolio impacted by a land falling hurricane.The third-party reinsurance we purchase for APPCIC is therefore net of FHCF recovery. When our FHCF and third-party reinsurance coverages are taken together, APPCIC has reinsurance coverage of up to $36.2 million, as illustrated by the graphic below. Should a catastrophic event occur, we would retain $2 million pre-tax for each catastrophic event, and would also be responsible for any additional losses that exceed our top layer of coverage.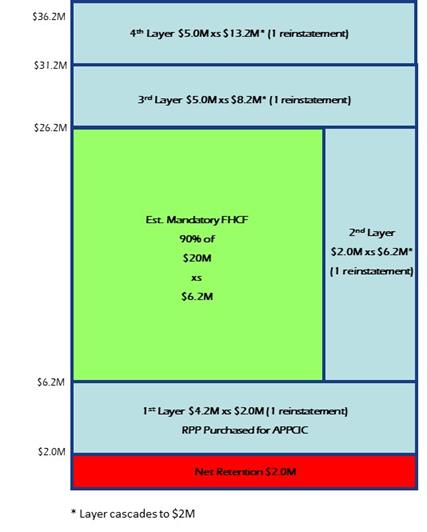
Multiple Line Excess of Losshigh valuedhigh-value risks it insures in both the personal residential and commercial multiple peril lines of business. Under this multiple line excess per risk contract, APPCIC has coverage of $8.5 million in excess of $500 thousand ultimate net loss for each risk and each property loss, and $1 million in excess of $0.3 million for each casualty loss. A $19.5 million aggregate limit applies to the term of the contract for property relatedproperty-related losses and a $2.0 million aggregate limit applies to the term of the contract for casualty-related losses. This contract also contains a profit sharingprofit-sharing feature available to APPCIC if the contract meets specific performance measures.For the FHCF Reimbursement Contracts effective June 1, 2019, APPCIC has continued the election of the 90% coverage level. The total mandatory FHCF layer is estimated to provide approximately $11.7 million of coverage for APPCIC, which inures to the benefit of the open market coverage secured from private reinsurers.The total cost of the 2019-2020 reinsurance programs for UPCIC and APPCIC is projected to be $417 million, representing approximately 33.3% of estimated direct premium earned for the 12-month treaty period.Results of Operations —- Three Months Ended June 30, 20182019 Compared to Three Months Ended June 30, 2017Net income was $37.3 million for the three months ended June 30, 2019 compared to $46.1 million an increase of $16.7 million, or 56.9%, for the three months ended June 30, 2018, a decrease of $8.8 million or 19.1%. Diluted EPS for the current quarter was $1.08 compared to $29.4 million for the three months ended June 30, 2017. The increase is the result$1.29 in 2018, a decrease of double digit revenue growth, continued underwriting profitability, and a reduced effective tax rate. Diluted earnings per common share increased by $0.47 to $1.29 for the three months ended June 30, 2018, compared to $0.82 per share for the three months ended June 30, 2017, reflecting the increase in net income and a slight reduction in our weighted$0.21 or 16.3%. Weighted average diluted common shares outstanding. outstanding were lower by 2.7% to 34.6 million shares from 35.6 million shares at June 30, 2018. Benefiting the quarter were increases in net earned premium, net investment income and increases in the net change in unrealized gains of equity securities, offset by realized losses from sales on investments and increased operating costs for losses and LAE and general and administrative costs. Direct and net earned premium were up 10.6% and 9.4%, respectively, due to growth in all states in which we are licensed and writing during the past 12 months. Increases in losses and LAE were the result of premium growth, increased estimated core losses and LAE for the current year compared to prior year, offset by a lower level of unexpected weather events over expectations this year and a lower level of prior year adverse development compared to the prior year. In the second quarter there was a lower level of benefits recognized from claim adjustment fees, including claims fees ceded to reinsurers, as there is a lower level of hurricane claims compared to the prior year. As discussed further below, certain non-recurring items from 2018 impacted the quarter over quarter comparison such as a $6.5 million benefit associated with a premium tax refund in 2018 and a greater amount of discrete items in 2018 giving rise to a lower effective rate in 2018.A detailed discussion of our results of operations follows the table below.below (in thousands, except per share data).Three Months Ended
June 30, Change 2019 2018 $ % $ 357,960 $ 342,781 $ 15,179 4.4 % (54,852 ) (68,754 ) 13,902 (20.2 )% 303,108 274,027 29,081 10.6 % (92,751 ) (81,755 ) (10,996 ) 13.4 % 210,357 192,272 18,085 9.4 % Net investment income 7,410 5,786 1,624 28.1 % Net realized gains (losses) on investments (1,605 ) 145 (1,750 ) NM 3,759 (1,521 ) 5,280 NM 6,048 5,709 339 5.9 % 5,997 5,764 233 4.0 % 1,756 1,633 123 7.5 % 233,722 209,788 23,934 11.4 % 113,296 89,842 23,454 26.1 % 69,496 58,698 10,798 18.4 % 182,792 148,540 34,252 23.1 % 50,930 61,248 (10,318 ) (16.8 )% 13,637 15,164 (1,527 ) (10.1 )% $ 37,293 $ 46,084 $ (8,791 ) (19.1 )% 11,955 (1,849 ) 13,804 NM $ 49,248 $ 44,235 $ 5,013 11.3 % $ 1.08 $ 1.29 $ (0.21 ) (16.3 )% 34,612 35,589 (977 ) (2.7 )% NM – Not Meaningful NM – Not MeaningfulPolicy count, premium in force and total insured value increased at June 30, 2019 when compared to June 30, 2018. Direct premiums written increased by $46.6$15.2 million, or 15.7%4.4%, for the quarter ended June 30, 2018,2019, driven by growth within our Florida business of $33.9$1.6 million, or 13.0%0.5%, and growth in our other states business of $13.6 million, or 28.7%, as compared to the same period of the prior period,year. Rate increases in Florida and in other states was also a source of premium growth. As discussed below in losses and LAE, we implemented new binding guidelines during the first quarter of 2019 on new business to address emerging loss trends that have impacted the rate of growth in our Other States business of $12.7 million, or 36.5%, asFlorida. Premiums in force increased in every state in which we are writing compared to the prior period. Florida growth was driven by growthyear. In early March 2019, we commenced writing in policy count as well as the impact of an average statewide rate increase of 3.4%, which was approved in early December and effective for new business beginning on December 7, 2017 and for renewal business beginning on January 26, 2018. Geographic expansion efforts in our Other States business continued to add to overall premium levels,Illinois, and we are now actively writing policies in 1617 states other thanoutside our home state of Florida. We commenced operationsThe following table provides direct premiums written for Florida and wrote our first policyOther States for the three months ended June 30, 2019 and 2018 (dollars in New Hampshire in early April 2018. For the Three Months Ended June 30, 2019 June 30, 2018 Growthyear over yearState Direct PremiumsWritten % Direct PremiumsWritten % $ % Florida $ 296,896 82.9 % $ 295,337 86.2 % $ 1,559 0.5 % Other states 61,064 17.1 % 47,444 13.8 % 13,620 28.7 % Total $ 357,960 100.0 % $ 342,781 100.0 % $ 15,179 4.4 % Direct premium earned increased by $29.4$29.1 million, or 12.0%10.6%, for the quarter ended June 30, 2018,2019, reflecting the earning of premiums written over the past 12 months and any changes in rates orand policy count during that time.Reinsurance enables our Insurance Entities to limit potential exposures to catastrophic events. Ceded premium represents amounts paid to reinsurers for this protection. Ceded premium earned increased by $6.1$11.0 million, or 8.1%13.4%, for the quarter ended June 30, 2018,2019. Reinsurance costs, as a percentage of direct premium earned, increased from 29.8% to 30.6%, reflecting an increase in total insured value covered bynew pricing for the cost of reinsurance as our annual reinsurance program and the coverage terms of the reinsurance agreements in effect during the treaty periods which beginrenews each year on June 1. The increase was the result of reinsurance costs to support the growth in our policies in force and increased costs for reinsurance in our 2019-2020 new reinsurance program effective June 1. The increased costs associated with the 2019-2020 Reinsurance Program will be earned over the June 1, of each year and extend through2019 to May 31, of2020 coverage period. See the following year. Ceded premium earned as a percent of direct premiums earned was 29.8%discussion above for the three months ended June 30, 2018 compared to 30.9% for the three months ended June 30, 2017.Premiums earned, net of ceded premium earned, grew by 13.8%9.4%, or $23.3$18.1 million, to $192.3$210.4 million for the three months ended June 30, 2018,2019, reflecting thean increase in direct premiumpremiums earned discussed above.Net investment income was $5.8$7.4 million for the three months ended June 30, 2018,2019, compared to $3.2$5.8 million for the same period in 2017.2018, an increase of $1.6 million, or 28.1%. The increase in net investment income of $2.6 million is primarily the result of several factors including the growth in cash and invested assets compared to the prior year and an increase in investment incomeyields from our available-for-sale debt securities, which grew as a result of growthshift in total invested assets, favorable market trendsasset mix and actions taken to increase yield while maintaining high credit quality. Also contributing to the increase in investment income is a higher level of return from our cash and cash equivalents due to actions taken to optimize treasury management coupled with an increase inrising interest rates on short-term investments.rates. Total invested assets were $747.2$942.3 million with an average Standard & Poor’s equivalent fixed income credit rating of AA-A+ during the three months ended June 30, 20182019 compared to $634.9$747.2 million with an average Standard & Poor’s equivalent fixed income credit rating of AA- for the same period in 2017.2018. Cash and cash equivalents are invested short term until needed to settle loss and LAE payments, reinsurance premium payments and operating cash needs. Yields from the fixed income portfolio are dependent on future market forces, monetary policy and interest rate policy from the Federal Reserve. investment securities from our investment portfolio of securities, including equity securities and available for sale debt securities, from time to time when opportunities arise or circumstances could result in greater losses or lower yields if held.to meet our investment objectives. We sold securities and investment securities availablereal estate during the three months ended June 30, 2019, generating net realized loss of $1.6 million compared to net realized gain of $0.1 million for the three months ended June 30, 2018. The realized losses this quarter resulted primarily from the sale andof equity securities.There was a $3.8 million favorable net unrealized gain in equity securities during the three months ended June 30, 2018, generating net realized gain of $0.1 million2019 compared to a $1.5 million unfavorable net realized gain of $1.7 million forunrealized loss during the three months ended June 30, 2017.In2018. Unrealized gains or losses are the second quarterresult of 2018,changes in the net change in unrealized gains (losses) of equity securities was a loss of $1.5 million, driven by a decline infair market value of our equity securities portfolio. We highlight that this line item was added during the quarter ended March 31, 2018 becauseperiod for securities still held and the reversal of the adoption of new accounting guidance for equity securities. See “Note 2 - Significant Accounting Policies – Recently Adopted Accounting Pronouncements” for more information. The comparable change in unrealized gains (losses) within our equity portfolioor losses for securities sold during the prior period in 2017 was $0.6 million of pretax losses, which was not included in net income in the prior period, but was included in other comprehensive income (loss), which is presented net of taxes.Commission revenue is comprised principally of brokerage commissions we earn from reinsurers on reinsurance placed for the Insurance Entities. Commission revenue is earned pro-rata over the reinsurance policy period which runs from June 1 to May 31 of the following year. For the three months ended June 30, 2018,2019, commission revenue was $5.7$6.0 million, compared to $4.6$5.7 million for the three months ended June 30, 2017.2018. The increase in commission revenue of $1.1$0.3 million, or 22.9%5.9%, for the three months ended June 30, 2018 compared to the three months ended June 30, 20172019 was primarily from increased commissions earned on reinsurance premiums associated with the result of $873 thousand of reinstatement commissions received by Blue Atlantic Reinsurance Corporation during the second quarter of 2018.Policy fees for the three months ended June 30, 2018,2019 were $5.8$6.0 million compared to $5.3$5.8 million for the same period in 2017.2018. The increase of $514 thousand,$0.2 million, or 9.8%4.0%, was the result of an increase in the total number of new and renewal policies written during the three months ended June 30, 20182019 compared to the same period in 2017.Other revenue, which represents revenue from premium financing2018.Losses and other miscellaneous income, was $1.6LAE, net of reinsurance, were $113.3 million for the three months ended June 30, 20182019, compared to $1.7 million for the same period in 2017.Losses and LAE, net of reinsurance, were $89.8 million for the three months ended June 30, 2018, compared to $80.2 million during the same period in 20172018 as follows (dollars in thousands):Three Months Ended June 30, 2019 Direct Loss Ratio Ceded Loss Ratio Net Loss Ratio $ 303,108 $ 92,751 $ 210,357 $ 4,917 1.6 % $ 2,917 3.1 % $ 2,000 1.0 % 98,043 32.4 % 97,373 105.0 % 670 0.3 % 110,626 36.5 % — — 110,626 52.6 % $ 213,586 70.5 % $ 100,290 108.1 % $ 113,296 53.9 % *Includes only current year weather events beyond those expected. *Includes only current year weather events beyond those expected. *Includes only weather events beyond those expected. Three Months Ended June 30, 2018 Direct Loss Ratio Ceded Loss Ratio Net Loss Ratio Premiums earned $ 274,027 $ 81,755 $ 192,272 Loss and loss adjustment expenses: Weather events* $ 5,000 1.8 % $ — — $ 5,000 2.6 % Prior year adverse/(favorable) reserve development161,400 58.9 % 159,090 194.6 % 2,310 1.2 % All other losses and loss adjustment expenses80,222 29.3 % (2,310 ) (2.8 )% 82,532 42.9 % Total losses and loss adjustment expenses $ 246,622 90.0 % $ 156,780 191.8 % $ 89,842 46.7 % *Includes only current year weather events beyond those expected. See “Item 1 — 1—Note 6 (Liability for Unpaid Losses and Loss Adjustment Expenses)” for change in liability for unpaid losses and LAE.For the quarter ended June 30, 2018, we experienced $5.0 million of weather events beyond expectations (on both a direct and net basis), related to the eruption of the Kilauea volcano in Hawaii and several other meaningful weather-related events that occurred in2018. This compares to lossesLosses and LAE, (on both a direct and net basis) of $6.0 million from weather events beyond those expected for the second quarter ended June 30, 2017, which wasof 2019 were $113.3 million compared to $89.8 million in the resultsecond quarter of an increase to our underlying core loss ratio in 2017 to reflect2018, an increase of unexpected weather-related losses.During the second quarter in 2018, the Company increased its estimate of ultimate losses on Hurricane Irma to $603.5$23.5 million, for both the Insurance Entities from $447.4 million recorded in the first quarter in 2018. The prior year development of $156.1 million in gross losses resulted in a net retention benefit of $0.3 million after cessions to the Company’s reinsurers. The increase in the ultimate lossor 26.1%. Losses and LAE for Hurricane Irma was the result of a continuation of new reported claims and the aggressive nature of plaintiff attorneys on claims in Florida.Also, the Company recorded prior year loss reserve development of $5.3 million on a direct basis ($2.6 million on a net basis) for the quarter ended June 30, 2018, reflecting strengthening of reserves for the fourth quarter 2016 storm, Hurricane Matthew. Reserve strengthening on Hurricane Matthew is based on our revised estimate to settle the remaining 78 open claims. The three months ending June 30, 2017 included prior period loss reserve development of $6.6 million on a direct basis ($1.1 million on a net basis), also reflecting strengthening of reserves for the fourth quarter 2016 storm, Hurricane Matthew.All other net losses and LAE were $82.5 million for the three months ended June 30, 2018, compared to $73.1 million during the same period in 2017. Our service company subsidiaries, particularly UAC, generated additional revenues servicing Hurricane Irma claims andincreased during the second quarter ended June 30, 2019 principally due to three key factors: (1) increased losses in connection with the growth in our underlying business; (2) increased core loss ratio (as defined below) from 33% in 2018 generated $8.4to 37% in 2019; and (3) reduced level of benefits from claim settlement fees ceded to reinsurers as hurricanes claims conclude. To a lesser extent, the quarter included net $2.0 million for weather events beyond those expected. In the second quarter of earnings which reduced amounts recorded as2019, there was adverse prior year reserve development of $98.0 million gross, less $97.4 million ceded resulting in $0.7 million net. The reserve development for the quarter ended June 30, 2019 was to increase ultimate direct losses and LAE this quarter. This hadfor Hurricanes Matthew, Florence and Irma, with minimal impact on net losses and LAE. In the quarter ended June 30, 2018 the increase in prior year reserves was principally to increase expected Hurricane Irma claims.We increased our core loss ratio to be in line with recent claim experience, specifically in the Florida market, as we continue to address: (1) the assignment of benefit issue (“AOB”) and increases in the systemic solicitation and representation of claims; and (2) emerging trends impacting the severity and frequency of claims. Claims paid under an AOB often involve unnecessary litigation and as a favorable effect on ourresult cost significantly more than claims settled when an AOB is not involved, with most of the increase going to the attorneys or representatives of policyholders. The increase in the underlying core loss and LAE ratio of approximately 3.4 percentage points on a direct basis (or 5.0 percentage points on a net basis). The Company’s underlying loss and LAE ratioalso reflects continued geographic expansion into states outside of Florida where non-catastrophe loss ratios are generally higher than in Florida. “Core loss ratio” is a common operational metric used in the insurance industry to describe the ratio of current accident year expected losses to premiums earned.On May 23, 2019, Florida Governor Ron DeSantis signed HB 7065: Insurance Assignment Agreements, which aims to curtail the abuse of AOB. We are evaluating this bill to determine its impact on our business.These market trends in losses and LAE led us to file for an overall 2.6% rate increase in Florida (effective April 2019 for new business and May 2019 for renewals), make changes to certain new business binding requirements and develop specialized claims and litigation management efforts to address market trends driving up claim costs.The financial benefit from the management of claims, including claims fees ceded to reinsurers, was $1.3 million for the second quarter of 2019 compared to $8.4 million during the second quarter of 2018. The benefit is reflected in our financial statements as well as claims trends insidea reduction of Florida includingdirect claim costs. This reduction in the growth insecond quarter of 2019 reflects a lower volume of hurricane claim costs and challenges faced when policyholders assign their policy benefitsceded to third parties and including the increased litigation arising from these claims.General and administrative expenses were $58.7$69.5 million for the three months ended June 30, 2018,2019, compared to $57.4$58.7 million during the same period in 20172018, as follows (dollars in thousands):(1)Total general and administrative expense ratio does not include interest expense. Three Months Ended June 30, Change 2019 2018 $ % $ Ratio $ Ratio Premiums earned, net $ 210,357 $ 192,272 $ 18,085 9.4 % General and administrative expenses: Policy acquisition costs 44,221 21.0 % 33,545 17.4 % 10,676 31.8 % Other operating costs 25,275 12.0 % 25,153 13.1 % 122 0.5 % Total general and administrative expenses $ 69,496 33.0 % $ 58,698 30.5 % $ 10,798 18.4 % The increase in generalGeneral and administrative expenses of $1.3costs increased by $10.8 million, which was primarily the result of modest increases in bothpolicy acquisition costs of $10.7 million and to a lesser extent due to an increase in other operating costs of $0.1 million. As a percentage of earned premiums, general and administrative costs increased from 30.5% of earned premiums for the three months ended June 30, 2018 to 33.0% of earned premiums for the same period in 2019. The increase in policy acquisition costs and other operating costs, which increased by $0.5 million and $0.8 million, respectively, as compared to the prior year’s quarter. General and administrative expensesratio for the quarter ended June 30, 2018 included2019 was due to a non-recurring benefit of $6.5 million benefit (included within policy acquisition costs)recorded in 2018 related to a settlementrefund of prior year premium tax auditstaxes as a result of an audit settlement with the Florida Department of Revenue, which reduced the expensepolicy acquisition costs ratio by 3.4 percentage points. Our underlying policy acquisition costs continued to be drivenpoints in 2018. Excluding this benefit in the prior year, the overall total general and administrative expense ratio in 2019 would have improved by increased premium volume and continued geographic expansion into states that typically have higher commission rates as0.9 percentage points compared to Florida.the same period in 2018 before the impact of the premium tax refund. Other operating costs for the three months ended June 30, 2019 increased $0.1 million, reflecting lower amounts recorded for executive compensation and temporary employee expenses offset by added costs to support the growth in business. Other operating costs ratio for the three months ended June 30, 2019 was 12.0% in 2019 compared to 13.1% in 2018, reflecting lower amounts recorded for executive compensation. Overall, the expense ratio (general and administrative expenses as a percentage of net earned premiums) benefited from the items mentioned above and economies of scale as general and administrative expenses did not increase at the same rate as revenues. As a result of the above items, the expense ratio decreased to 30.4% for the three months ended June 30, 2018 compared to 33.9% for the same period in 2017.Income tax expense decreased by $3.4$1.5 million, or 18.2%10.1%, for the three months ended June 30, 2018,2019, when compared with the three months ended June 30, 2017.2018. Our effective tax rate decreased(“ETR”) increased to 26.8% for the three months ended June 30, 2019, as compared to 24.8% for the three months ended June 30, 2018,2018. Income tax expense decreased as compared to 38.7% for the three months ended June 30, 2017. Thea result of a decrease in taxable income partially offset by an increase in the ETR. The ETR increased by 2.0 percentage points from both income tax expense and our effective tax rate is primarily the result of the enactment of the Tax Act. The second quarter of 2018 included a net credit to income tax expense of $0.6 million primarily driven by the excess tax benefits resulting from stock-based awards that vested and/or were exercised during the second quarter, thereby benefitting the quarter’s effective tax rate by 1.0 percentage points. See “Item 1 – Note 9 (Income Taxes)” for an explanation of the change in our effectivepermanent differences between book and taxable income and a lower amount of net discrete items both of which increase the tax rates.rate.loss,income, net of taxes for the three months ended June 30, 20182019, was $1.8$12.0 million compared to other comprehensive incomeloss of $1.5$1.8 million for the same period in 2017.2018. See “Item 1 — 1—Note 11 (Other Comprehensive Income (Loss))” for additional information about the amounts comprising other comprehensive income and loss for these periods.Results of Operations —- Six Months Ended June 30, 20182019 Compared to Six Months Ended June 30, 2017Net income was $77.4 million for the six months ended June 30, 2019 compared to $86.1 million an increase of $25.6 million, or 42.2%, for the six months ended June 30, 2018, compared to $60.6 milliona decrease of $8.7 million. Diluted EPS for the six months ended June 30, 2017. The increase is the result of double digit revenue growth, continued underwriting profitability, and a reduced effective tax rate. Diluted earnings per common share increased by $0.742019 was $2.22 compared to $2.42 forin 2018, a decrease of $0.20 or 8.3%. Weighted average diluted common shares outstanding were lower by 2.1% to 34.9 million shares from 35.6 million shares at June 30, 2018. Benefiting the six months ended June 30, 2018,2019 were increases in net earned premium, net investment income and increases in the net change in unrealized gains of equity securities, offset by realized losses on investments and increased operating costs for losses and LAE and general and administrative costs. Direct and net earned premium were up 11.6% and 12.1%, respectively, due to growth in all states in which we are licensed and writing during the past 12 months. Increases in losses and LAE were the result of premium growth, increased estimated core losses and LAE for the current year compared to $1.68 per share forprior year and unexpected weather events this year. During 2019, there was a lower level of benefits recognized from claim adjustment fees, including claim fees ceded to reinsurers, as there is a lower level of hurricane claims compared to prior year. As discussed further below, certain non-recurring items from 2018 impacted the six months ended June 30, 2017, reflecting the increaseperiod over period comparison such as a $6.5 million benefit associated with a premium tax refund in net income2018 and a slight reductiongreater amount of discrete items in our weighted average diluted common shares outstanding. 2018 giving rise to a lower effective rate in 2018.A detailed discussion of our results of operations follows the table below.below (in thousands, except per share data).NM – Not Meaningful Six Months Ended June 30, Change 2019 2018 $ % PREMIUMS EARNED AND OTHER REVENUES Direct premiums written $ 647,194 $ 612,765 $ 34,429 5.6 % Change in unearned premium (48,709 ) (76,477 ) 27,768 (36.3 )% Direct premium earned 598,485 536,288 62,197 11.6 % Ceded premium earned (178,401 ) (161,439 ) (16,962 ) 10.5 % Premiums earned, net 420,084 374,849 45,235 12.1 % Net investment income (expense) 15,552 10,571 4,981 47.1 % Net realized gains (losses) on investments (13,130 ) (2,496 ) (10,634 ) 426.0 % Net change in unrealized gains (losses) of equity securities 21,791 (6,630 ) 28,421 NM Commission revenue 11,553 10,980 573 5.2 % Policy fees 11,018 10,539 479 4.5 % Other revenue 3,440 3,475 (35 ) (1.0 )% Total premiums earned and other revenues 470,308 401,288 69,020 17.2 % OPERATING COSTS AND EXPENSES Losses and loss adjustment expenses 226,390 165,768 60,622 36.6 % General and administrative expenses 139,244 122,573 16,671 13.6 % Total operating costs and expenses 365,634 288,341 77,293 26.8 % INCOME BEFORE INCOME TAXES 104,674 112,947 (8,273 ) (7.3 )% Income tax expense 27,233 26,808 425 1.6 % NET INCOME $ 77,441 $ 86,139 $ (8,698 ) (10.1 )% Other comprehensive income (loss), net of taxes 23,939 (5,899 ) 29,838 NM COMPREHENSIVE INCOME $ 101,380 $ 80,240 $ 21,140 26.3 % DILUTED EARNINGS PER SHARE DATA: Diluted earnings per common share $ 2.22 $ 2.42 $ (0.20 ) (8.3 )% Weighted average diluted common shares outstanding 34,903 35,636 (733 ) (2.1 )% NM – Not Meaningful Policy count, premium in force and total insured value increased at June 30, 2019 when compared to June 30, 2018. Direct premiums written increased by $71.2$34.4 million, or 13.1%5.6%, for the six months ended June 30, 2018,2019, driven by growth within our Florida business of $49.6$9.5 million, or 10.3%1.8%, and growth in our other states business of $24.9 million, or 29.9%, as compared to the same period of the prior period,year. Rate increases in Florida and in other states were also a source of premium growth. We implemented new binding guidelines during the six months ended June 30, 2019 on new business to address emerging loss trends that have impacted the rate of growth in our Other States business of $21.5 million, or 34.8%, asFlorida. Premiums in force increased in every state in which we are writing compared to the prior period. Florida growth was driven by growthJune 30, 2018. In early March 2019, we commenced writing in policy count as well as the impact of an average statewide rate increase of 3.4%, which was approved in early December and effective for new business beginning on December 7, 2017 and for renewal business beginning on January 26, 2018. Geographic expansion efforts in our Other States business continued to add to overall premium levels,Illinois, and we are now actively writing policies in 1617 states other thanoutside our home state of Florida. We commenced operationsThe following table provides direct premiums written for Florida and wrote our first policyOther States for the six months ended June 30, 2019 and 2018 (dollars in New Hampshire in early April 2018. For the Six Months Ended June 30, 2019 June 30, 2018 Growth year over year State Direct Premiums Written % Direct Premiums Written % $ % Florida $ 539,044 83.3 % $ 529,515 86.4 % $ 9,529 1.8 % Other states 108,150 16.7 % 83,250 13.6 % 24,900 29.9 % Total $ 647,194 100.0 % $ 612,765 100.0 % $ 34,429 5.6 % Direct premium earned increased by $55.3$62.2 million, or 11.5%11.6%, for the six months ended June 30, 2018,2019, reflecting the earning of premiums written over the past 12 months and any changes in rates orand policy count during that time.Reinsurance enables our Insurance Entities to limit potential exposures to catastrophic events. Ceded premium represents amounts paid to reinsurers for this protection. Ceded premium earned increased by $11.0$17.0 million, or 7.3%10.5%, for the six months ended June 30, 2019. Reinsurance costs, as a percentage of direct premium earned, decreased from 30.1% in 2018 reflecting anto 29.8% in 2019. The lower ratio was a result of the higher base of direct premium earned in 2019 compared to 2018. The increase in total insured value covered byreinsurance costs was to support the growth in our policies in force and increased costs for reinsurance in our 2019-2020 new reinsurance program effective June 1. Costs associated with the renewal of our reinsurance program andwill be earned over the coverage terms of the reinsurance agreements in effect during the treatyperiods which begin on June 1, of each year and extend through2019 to May 31, of2020 coverage period. See the following year. Ceded premium earned as a percent of direct premiums earned was 30.1%discussion above for the six months ended June 30, 2018 compared to 31.3% for the six months ended June 30, 2017.Premiums earned, net of ceded premium earned, grew by 13.4%12.1%, or $44.3$45.2 million, to $374.8$420.1 million for the six months ended June 30, 2018,2019, reflecting the increase in direct premiums earned premiums discussed above.Net investment income was $10.6$15.6 million for the six months ended June 30, 2018,2019, compared to $5.9$10.6 million for the same six-month period in 2017.2018, an increase of $5.0 million, or 47.1%. The increase in net investment income of $4.6 million is primarily the result of several factors including the growth in cash and invested assets compared to the prior year and an increase in investment incomeyields from our available-for-sale debt securities, which grew as a result of growthshift in total invested assets, favorable market trendsasset mix and actions taken to increase yield while maintaining high credit quality. Also contributing to the increase in investment income is a higher level of return from our cash and cash equivalents due to actions taken to optimize treasury management coupled with an increase inrising interest rates on short-term investments.rates. Total invested assets were $747.2$942.3 million with an average Standard & Poor’s equivalent fixed income credit rating of AA-A+ during the six months ended June 30, 20182019 compared to $634.9$747.2 million with an average Standard & Poor’s equivalent fixed income credit rating of AA- for the same period in 2017.We sell investment securitiesinvestments from our investment portfolio including, equity securities and available for sale debt securities, from time to time when opportunities arise or circumstances could result in greater losses or lower yields if held.to meet our investment objectives. We sold securities and investment securities available for sale and equity securitiesreal estate during the six months ended June 30, 2018,2019, generating net realized lossesloss of $2.5$13.1 million compared to net realized gainsloss of $1.6$2.5 million for the six months ended June 30, 2017.2018. The investment securities soldrealized losses during the six months ended June 30, 2019 resulted primarily from the sale of equity securities, whereas the realized loss for the six months ended June 30, 2018 were comprisedresulted primarily from the sale of municipal securities, which were liquidated in light of their diminished after-tax returns following the enactment of the Tax Act.During the first six months in 2018, the net change in unrealized gains (losses) of equity securities, See “Item 1—(Note 3 Investments).”There was a loss of $6.6$21.8 million driven by a declinefavorable net unrealized gain in value of our equity securities portfolio. We highlight that this line item was added during the six months ended June 30, 2018, because2019 compared to a $6.6 million unfavorable net unrealized loss during the six months ended June 30, 2018. Unrealized gains or losses are the result of changes in the adoptionfair market value of new accounting guidanceour equity securities during the period for equity securities. See “Note 2 - Significant Accounting Policies – Recently Adopted Accounting Pronouncements” for more information. The comparable change insecurities still held and the reversal of unrealized gains (losses) within our equity portfolioor losses for securities sold during the prior period in 2017 was $1.1 million of pretax gains, which was not included in net income in the prior period, but was included in other comprehensive income (loss), which is presented net of taxes.Commission revenue is comprised principally of brokerage commissions we earn from reinsurers on reinsurance placed for the Insurance Entities. Commission revenue is earned pro-rata over the reinsurance policy period which runs from June 1 to May 31 of the following year. For the six months ended June 30, 2018,2019, commission revenue was $11.0$11.6 million, compared to $9.2$11.0 million for the six months ended June 30, 2017.2018. The increase in commission revenue of $1.7$0.6 million, or 18.8%5.2%, for the six months ended June 30, 2018 compared to the six months ended June 30, 20172019 was primarily the result of $1.4 million of reinstatementfrom increased commissions received by Blue Atlanticearned on reinsurance premiums associated with our Reinsurance Corporation during the first six months ended of 2018.Policy fees for the six months ended June 30, 2018,2019 were $10.5$11.0 million compared to $9.7$10.5 million for the same period in 2017.2018. The increase of $0.8$0.5 million, or 8.3%4.5%, was the result of an increase in the total number of new and renewalrenewed policies written during the six months ended June 30, 20182019 compared to the same period in 2017.Other revenue, which represents revenue from premium financing2018.Losses and other miscellaneous income, was $3.5LAE, net of reinsurance, were $226.4 million for the six months ended June 30, 20182019, compared to $3.2 million for the same period in 2017.Losses and LAE, net of reinsurance were $165.8 million for the six months ended June 30, 2018, compared to $150.8 million during the same period in 20172018 as follows (dollars in thousands):* Includes only weather events beyond those expected. Six Months Ended June 30, 2019 Direct Loss Ratio Ceded Loss Ratio Net Loss Ratio Premiums earned $ 598,485 $ 178,401 $ 420,084 Loss and loss adjustment expenses: Weather events* $ 9,917 1.7 % $ 2,917 1.6 % $ 7,000 1.7 % Prior year adverse/(favorable) reserve development100,208 16.7 % 99,723 55.9 % 485 0.1 % All other losses and loss adjustment expenses219,203 36.6 % 298 0.2 % 218,905 52.1 % Total losses and loss adjustment expenses $ 329,328 55.0 % $ 102,938 57.7 % $ 226,390 53.9 % *Includes only current year weather events beyond those expected. Six Months Ended June 30, 2018 Direct Loss Ratio Ceded Loss Ratio Net Loss Ratio Premiums earned $ 536,288 $ 161,439 $ 374,849 Loss and loss adjustment expenses: Weather events* $ 5,000 0.9 % $ — — $ 5,000 1.3 % Prior year adverse/(favorable) reserve development162,050 30.2 % 159,784 99.0 % 2,266 0.6 % All other losses and loss adjustment expenses156,211 29.1 % (2,291 ) (1.4 )% 158,502 42.3 % Total losses and loss adjustment expenses $ 323,261 60.2 % $ 157,493 97.6 % $ 165,768 44.2 % *Includes only current year weather events beyond those expected. See “Item 1 — 1—Note 6 (Liability for Unpaid Losses and Loss Adjustment Expenses)” for change in liability for unpaid losses and LAE.Losses and LAE, net for the six months ended June 30, 2019 were $226.4 million compared to $165.8 million in the same period in 2018, an increase of $60.6 million, or 36.6%. Losses and LAE increased during the six months ended June 30, 2019 principally due to three key factors: (1) increased losses in connection with the growth in our underlying business; (2) increased core loss ratio (as defined below) from 33% in 2018 to 37% in 2019; and (3) reduced level of benefits from claim settlement fees ceded to reinsurers as hurricanes claims conclude. As of June 30, 2019, there was adverse prior year reserve development of $100.2 million gross, less $99.7 million ceded resulting in $0.5 million net. For the six months ended June 30, 2018, we experienced $5.0there was $162.1 million of weather events beyond expectations (on bothgross less $159.8 million ceded resulting in $2.3 million net. To a direct and net basis), related to the eruption of the Kilauea volcano in Hawaii and several other meaningful weather-related events that occurred in 2018. This compares to losses and LAE (on both a direct and net basis) of $9.0 million from weather events beyond those expected forlesser extent, the six months ended June 30, 2017, including an2019 included net $7.0 million for weather events beyond those expected compared to net $5.0 million in the prior year. The reserve development for 2019 was to increase ultimate direct losses and LAE for Hurricanes Matthew, Florence and Irma, with minimal impact on net losses and LAE. For 2018 the increase in prior year reserves was principally to increase expected Hurricane Irma claims.We increased our underlying core loss ratio to be in 2017line with recent claim experience, specifically in the Florida market, as we continue to reflectaddress: (1) the AOB issue and increases in the systemic solicitation and representation of claims; and (2) emerging trends impacting the severity and frequency of claims. Claims paid under an AOB often involve unnecessary litigation and as a result cost significantly more than claims settled when an AOB is not involved, with most of the increase of unexpected weather-related losses.During the second quarter in 2018, the Company increased its estimate of ultimate losses on Hurricane Irma to $603.5 million for both Insurance Entities from $446.7 million recorded in 2017. The prior year development of $156.8 million in gross losses resulted in a net retention benefit of $0.3 million after cessionsgoing to the Company’s reinsurers.attorneys or representatives of policyholders. The increase in the ultimate loss and LAE for Hurricane Irma was the result of a continuation of new reported claims and the aggressive nature of plaintiff attorneys on claims in Florida.Also, the Company recorded prior year loss reserve development of $5.3 million on a direct basis, $2.6 million on a net basis, for the six months ended June 30, 2018, reflecting strengthening of reserves for the fourth quarter 2016 storm, Hurricane Matthew. Reserve strengthening on Hurricane Matthew is based on our revised estimate to settle the remaining 78 open claims. The six months ended June 30, 2017 included prior period loss reserve development of $6.9 million on a direct basis ($1.2 million on a net basis), also primarily reflecting strengthening of reserves for the fourth quarter 2016 storm, Hurricane Matthew.All other net losses and LAE were $158.5 million for the six months ended June 30, 2018, compared to $140.5 million during the same period in 2017. Our service company subsidiaries, particularly UAC, generated additional revenues servicing Hurricane Irma claims and during the six months ended June 30, 2018 generated $18.9 million of earnings which reduced amounts recorded as losses and LAE in 2018. This had a favorable effect on our underlying core loss and LAE ratio of approximately 3.5 percentage points on a direct basis (or 5.0 percentage points on a net basis). The Company’s underlying loss and LAE ratioalso reflects continued geographic expansion into states outside of Florida where non-catastrophe loss ratios are generally higher than in Florida. “Core loss ratio” is a common operational metric used in the insurance industry to describe the ratio of current accident year expected losses to premiums earned.On May 23, 2019, Florida as well asGovernor Ron DeSantis signed HB 7065: Insurance Assignment Agreements which aims to curtail the marketplace dynamics insideabuse of AOB. We are evaluating this bill to determine its impact on our business.These market trends in losses and LAE have led us to file for an overall 2.6% rate increase in Florida (effective April 2019 for new business and May 2019 for renewals), make changes to certain new business binding requirements and develop specialized claims and litigation management efforts to address market trends driving up claim costs.The financial benefit from the management of claims ceded, including challenges faced when policyholders assign their policy benefitsclaim fees ceded to third parties including the increased litigation from these claims.General and administrative expenses were $122.6reinsurers, was $2.1 million for the six months ended June 30, 2018,2019 compared to $114.3$18.9 million during the six months ended June 30, 2018. The benefit is reflected in our financial statements as a reduction of direct claim costs. This reduction in the six months ended June 30, 2019 reflects a lower volume of hurricane claim costs ceded to reinsurers.General and administrative expenses were $139.2 million for the six months ended June 30, 2019, compared to $122.6 million during the same period in 20172018, as follows (dollars in thousands):(1)Total general and administrative expense ratio does not include interest expense. Six Months Ended June 30, Change 2019 2018 $ % $ Ratio $ Ratio Premiums earned, net $ 420,084 $ 374,849 $ 45,235 12.1% General and administrative expenses: Policy acquisition costs 87,732 20.9 % 71,588 19.1 % 16,144 22.6 % Other operating costs 51,512 12.3 % 50,985 13.6 % 527 1.0 % Total general and administrative expenses $ 139,244 33.2 % $ 122,573 32.7 % $ 16,671 13.6 % The increase in generalGeneral and administrative expenses of $8.3costs increased by $16.7 million, which was primarily the result of increases in policy acquisition costs of $6.1$16.1 million which were driven bydue to commissions associated with increased premium volume and continued geographic expansion into states that have higher typical commission rates comparedas well as a non-recurring audit settlement related to our home state of Florida,premium taxes, and to a lesser extent due to an increase in other operating costs of $2.1$0.5 million. GeneralAs a percentage of earned premiums, general and administrative expensescosts increased from 32.7% of earned premiums for the six months ended June 30, 2018 includedto 33.2% of earned premiums for the same period in 2019. The increase in policy acquisition costs and ratio for the six months ended June 30, 2019 was due to a non-recurring benefit of $6.5 million benefit (included within policy acquisition costs)recorded in 2018 related to a settlementrefund of prior year premium tax auditstaxes as a result of an audit settlement with the Florida Department of Revenue, which reduced the expensepolicy acquisition costs ratio by 1.7 percentage points. Our underlying policy acquisitionpoints in 2018. Excluding this benefit in the prior year, the overall total general and administrative expense ratio in 2019 would have improved 1.2 percentage points compared to the same period in 2018 before the impact of the premium tax refund. Other operating costs continuedfor the six months ended June 30, 2019 increased $0.5 million, reflecting lower amounts recorded for executive compensation and temporary employee expenses offset by added costs to be driven by increasedsupport the growth in business. Other operating costs as a percentage of earned premium volume and continued geographic expansion into states wherereduced from 13.6% of net earned premium for the comparable commission rates are higher than Florida.six months ended June 30, 2018 compared to 12.3% of net earned premium for the same period in 2019. Overall, the expense ratio for 2019 (general and administrative expenses as a percentage of net earned premiums)premiums earned) benefited from reduced executive compensation and economies of scale as general and administrative expenses did not increase at the same rate as revenues. As a result of the above items, the expense ratio decreased to 32.7% for the six months ended June 30, 2018revenues when compared to 34.5% for the same period in 2017.Income tax expense decreasedincreased by $7.9$0.4 million, or 22.8%1.6%, for the six months ended June 30, 2018,2019, when compared with the six months ended June 30, 2017.2018. Our effective tax rate decreasedETR increased to 26.0% for the six months ended June 30, 2019, as compared to 23.7% for the six months ended June 30, 2018, as compared to 36.4% for the six months ended June 30, 2017.2018. The decreaseincrease in both income tax expense and our effective tax rate is primarily the result of the enactment of the Tax Act. The six months ended June 30, 2018 included a net credit to income tax expense of $2.3$0.4 million primarily drivenwas the result of an increase in the ETR mostly offset by excessa decrease in taxable income. The ETR increased by 2.3 percentage points from both a change in permanent differences between book and tax benefits resulting from stock-based awards that vested and/or were exercised during the six months ended June 30, 2018, thereby benefitting the six month ended June 30, 2018 effective tax rate by 2.0 percentage points. Discrete items for the six months ended June 30, 2017 included $0.8 million of excess tax benefit benefits resulting from stock-based awards that had vested and/or were exercised during that periodincome and a credit to incomelower amount of net discrete items both of which increased the tax expense of $1.2 million resulting from anticipated recoveries of income taxes paid from 2014 and 2015, thereby benefitting the six months ended June 30, 2017 effective tax rate by 1.9 percentage points. See “Item 1 – Note 9 (Income Taxes)” for an explanation of the change in our effective tax rates.Other comprehensive loss,income, net of taxes for the six months ended June 30, 20182019, was $5.9$23.9 million compared to other comprehensive incomeloss of $4.0$5.9 million for the same period in 2017.2018. See “Item 1 — 1—Note 11 (Other Comprehensive Income (Loss))” for additional information about the amounts comprising other comprehensive income and loss for these periods.Analysis of Financial Condition—As of June 30, 20182019 Compared to December 31, 2017We believe that cash flows generated from operations will be sufficient to meet our working capital requirements for at least the next twelve months. Our policy is toWe invest amounts considered to be in excess of current working capital requirements.The following table summarizes, by type, the carrying values of investments as of the dates presented (in thousands): As of June 30, December 31, Type of Investment 2019 2018 Available-for-sale debt securities $ 884,093 $ 820,438 Equity securities 42,368 63,277 Investment real estate, net 15,792 24,439 Total $ 942,253 $ 908,154 See “Item 1 —1—Condensed Consolidated Statements of Cash Flows” for explanations of changes in investments.Prepaid reinsurance premiums represent the portion of unearned ceded written premiumspremium that will be earned pro-rata over the coverage period of our reinsurance program, which runs from June 1 to May 31 of the following year. The increase of $177.8$239.2 million to $310.6$382.0 million as of June 30, 20182019 was due to additional ceded written premium of $338.9$417.6 million recorded this quarter for the reinsurance costs relating to our new 2018-20192019-2020 catastrophe reinsurance program beginning June 1, 20182019, less amortization of prepaid reinsurance premiums recorded during the period.Reinsurance recoverable represents the estimated amount of paid and unpaid losses, LAE and loss adjustment expenses that are expected to be recoverable from reinsurers. The decrease of $64.6$87.0 million during the quarter to $117.9$331.6 million as of June 30, 20182019 was primarily due to the settlementcollection of amounts due from reinsurers for claims ceded to reinsurers relating to Hurricane Irmaprevious hurricanes and to a lesser extent Hurricane Matthew.Premiums receivable, net represents amounts receivable from policyholders. The increase in premiums receivable, net of $10.7$6.9 million to $67.2$66.8 million as of June 30, 20182019 relates to both the growth, seasonality and consumer payment behavior of our business. The nature of our business tends to be seasonal during the year, reflecting consumer behaviors in connection with the Florida residential real estate market and seasonalitythe hurricane season. The amount of direct premiums written tends to increase just prior to the second quarter and tends to decrease approaching the fourth quarter.Property and equipment, net increased $5.5 million during 2019 primarily as the result of the Company’s business.Deferred income tax assets and liabilities represent temporary differences between U.S. GAAP andpurchase of a new office building in Fort Lauderdale, Florida, which will be used to meet the tax basisstaffing needs of the Company's assets and liabilities. Duringcompany as the six months ended June 30, 2018, deferred tax assets decreased by $9.1 millionbusiness continues to $0.2 million, primarily due to an increase in deferred policy acquisition costs and an increase in ceded unearned premiums.Deferred policy acquisition costs (“DPAC”) increased by $15.7$5.8 million to $88.8$90.5 million as of June 30, 2018,2019, which is in lineconsistent with the underlying premium growth.growth and the seasonality of our business. See “Item 1 — 1—Note 5 (Insurance Operations)” for a roll-forward in the balance of our deferred policy acquisition costs.Income taxes recoverable increased by $2.4 millionrepresents the difference between estimated tax obligations and tax payments made to $11.8 million as oftaxing authorities. At June 30, 2018,2019, the balance recoverable was $8.9 million, representing amounts due from $9.5taxing authorities at that date, compared to a balance recoverable of $11.2 million as of December 31, 2017. The increase represents2018.Deferred income taxes represent the estimated tax asset or tax liability caused by temporary differences between the tax return basis of certain assets and liabilities and amounts due from taxing jurisdictions within one year and when income tax payments exceed income tax liabilities. Income taxes recoverable as ofrecorded in the financial statements. During the six months ended June 30, 2018 were $11.82019, deferred tax assets decreased by $19.7 million which represents amounts recoverable or to be applieda deferred tax liability of $5.1 million. The change was primarily due to increase in unrealized gains on investment, prepaid reinsurance premiums and unearned premiums. Deferred income taxes reverse in future periods for federalyears as the temporary differences between book and state income taxes.See “Item 1 — 1—Note 6 (Liability for Unpaid Losses and Loss Adjustment Expenses)” for a roll-forward in the balance of our unpaid losses and loss adjustment expenses. LAE. Unpaid losses and loss adjustment expensesLAE decreased by $96.5$184.5 million to $151.9$288.3 million as of June 30, 2018.2019. The reduction in unpaid losses and loss adjustment expensesLAE was principally due to the settlement of Hurricane Irma claims that werefrom previous hurricane and storm events, as more claims from those events concluded during the six months ended June 30, 2019. Overall unpaid losses and LAE decreased, as of December 31, 2017, offset from losses incurred from weather related activity and other claims in 2018.claim settlements exceeded new emerging claims. Unpaid losses and loss adjustment expensesLAE are net of estimated subrogation recoveries. The Company is continuing its initiatives to expedite claims payments including the ability of our mobile claims teams to rapidly settle certain claims, which we refer to as “Fast Track,”and pursuing the anticipated benefits from subrogation collections.Unearned premiums represent the portion of direct premiums written premium that will be earned pro ratapro-rata in the future. The increase of $76.5$48.7 million from December 31, 2018 to $608.9$650.4 million as of June 30, 20182019 reflects both organic growth and the seasonality of our business, as described under “– Overview”.Advance premium represents premium payments made by policyholders ahead of the effective date of the policies. The increase of $12.0$13.2 million to $38.2$39.5 million as of June 30, 20182019 reflects bothcustomer payment behavior and the organic growth and the seasonality of our business as described under “– Overview”.business.Book overdrafts represent outstanding checks or drafts in excess of cash on deposit with banking institutions and are examined to determine if a legal right of offset exists for accounts within the same banking institution at each balance sheet date. The Company maintainsWe maintain a short-term cash investment sweep to maximize investment returns on cash balances. Due to sweep activities, certain outstanding items are recorded as book overdrafts, which totaled $3.0$25.6 million as of June 30, 20182019, compared to $36.7$102.8 million as of December 31, 2017.2018. The decrease of $33.7$77.2 million is the result of higher cash balances available for offset as of June 30, 2018 and to a lesser amount lessfewer outstanding items as of June 30, 20182019 compared to December 31, 2017 due to lower Hurricane Irma drafts2018, as outstanding claims payments for hurricane and storm events are settled and are no longer outstanding.Reinsurance payable, net, represents the unpaid ceded written premiumsinstallments owed to reinsurers, in connection with the renewal of the Company’s 2018-2019 catastrophe reinsurance program on June 1, 2018, unpaid reinstatement premiums due to reinsurers and cash advances received from reinsurers in connection with Hurricane Irma’s anticipated recoveries.reinsurers. On June 1st of each year, we renew our catastrophe reinsurance program and record the estimated annual cost of our reinsurance program. The annual cost initially increases reinsurance payable which is then reduced as installment payments are made over the policy period of the reinsurance, which runs from June 1st to May 31st. The balance increased by $231.5$330.9 million to $341.9$424.2 million as of June 30, 20182019 as a result of the timing of the above items. Ceded premiums for the 2018-2019 catastrophe reinsurance program are paid in installments over theDividend payable increased $5.5 million and primarily represents a 16 cents per share dividend declared on June 15, 2019 and payable to May 31 policy term.Capital resources, net increased by $51.3$63.7 million and includesduring the six months ended June 30, 2019, reflecting increases in stockholders’ equity of $52.0 million, offset by a reduction in long-term debt of $0.7 million.debt. The increases in stockholders’ equity was principally the result of $86.1 million of 2018our 2019 net income and $4.7 millionafter-tax changes in fair value of stock-based compensation,our investment portfolio unrealized gains in 2019 offset by $11.1 million in treasury stock purchases,repurchases and $15.4 million in dividends to shareholders. See “Item 1—Condensed Consolidated Statements of Stockholders’ Equity” and “Item 1—Note 8 (Stockholders’ Equity).”The reduction in long-term debt of $0.7 million was the result of principal payments on debt during 2018.2019. See “– “—Liquidity and Capital Resources” and “Item 1 – Note 8 (Stockholders’ Equity)Resources.” for explanation of changes in treasury stock.LIQUIDITY AND CAPITAL RESOURCESLiquidity and Capital ResourcesLiquidityLiquidity is a measure of a company’s ability to generate sufficient cash flows to meet its short and long-term obligations. Funds generated from operations have been sufficient to meet our liquidity requirements and we expect that, in the future, funds from operations will continue to meet such requirements.The balance of cash and cash equivalents as of June 30, 20182019 was $311.1$181.6 million compared to $213.5$166.4 million at December 31, 2017.2018. See “Item 1 — 1—Condensed Consolidated Statements of Cash Flows” for a reconciliation of the balance of cash and cash equivalents between June 30, 20182019 and December 31, 2017.2018. The increase in cash and cash equivalents was driven by cash flows generated from operating activities in excess of those used for investing and financing activities. The Company maintainsWe maintain a short-term investment cash sweep to maximize investment returns on cash balances. Due to thethese sweep activities, certain outstanding items wereare routinely recorded as “Book Overdraft”overdraft” in the Condensed Consolidated Financial Statements. Cash and cash equivalents balances are available to settle book overdrafts, and to pay reinsurance premiums, expenses and pay claims.The balance of restricted cash and cash equivalents as of June 30, 20182019 and December 31, 2017 includes2018 represents cash equivalents on deposit with regulatory agencies in the various states in which our Insurance Entities do business.Liquidity for UVE and its non-insurance subsidiaries is required for us to cover the payment of general operating expenses, dividends to shareholders (if and when authorized and declared by our Board of Directors), payment for the possible repurchase of our common stock (if and when authorized by our Board of Directors), payment of income taxes, and interest and principal payments on outstanding debt obligations, if any. The declaration and payment of future dividends by UVE to itsour shareholders, and any future repurchases of UVEour common stock, will be at the discretion of our Board of Directors and will depend upon many factors, including our operating results, financial condition, debt covenants and any regulatory constraints. Principal sources of liquidity for UVE and its non-insurance subsidiariesus include revenues generated from fees paid by the Insurance Entities to affiliated companies for policy administration,general agency, inspections and claims adjusting services. Additional sources of liquidity include brokerage commissions earned on reinsurance contracts, policy fees and policy fees. UVEremittances from the Insurance Entities for their respective share of income taxes. We also maintains certain othermaintain investments, which are a source of ongoing interest and dividend income and would generate funds upon sale. As discussed in “Item 1 – Note 5 (Insurance Operations),” thereThere are limitations on the dividends the Insurance Entities may pay to their immediate parent company, Protection Solutions, Inc. (“PSI”, formerly known as Universal Insurance Holding Company of Florida (“UVECF”)Florida).Commissioner of the FLOIR is subject to restrictions as referenced below and in “Item I – 1—Note 5 –(Insurance Operations).” The maximum dividend that may be paid by the Insurance Operations.”Entities to PSI without prior approval is limited to the lesser of statutory net income from operations of the preceding calendar year or statutory unassigned surplus as of the preceding year end. During the six months ended June 30, 2019 and the year ended December 31, 2018, the Insurance Entities did not pay dividends to UVECF. During 2017 UPCIC paid a $30 million dividend to UVECF.Liquidity for the Insurance Entities is primarily required to cover payments for reinsurance premiums, claims payments including potential payments of catastrophe losses (offset by recovery of any reimbursement amounts under our reinsurance agreements), fees paid to affiliates for managing general agency services, inspections and claims adjusting services, agent commissions, premiumspremium and income taxes, regulatory assessments, general operating expenses, and interest and principal payments on debt obligations. The principal source of liquidity for the Insurance Entities consists of the revenue generated from the collection of net premiums, interest and dividend income from the investment portfolio, the collection of reinsurance recoverable and financing fees.in thatas premiums are generally received months or even years before losses are paid under the policies written. In the event of catastrophic events, many of the Company’sour reinsurance agreements provide for “cash advance” whereby reinsurers advance or prepay amounts to the Company,us, thereby providing liquidity, which the Company utilizeswe utilize in the claim settlement process. In addition, the Insurance Entities maintain substantial investments in highly liquid, marketable securities, which would generate funds upon sale.The Insurance Entities are responsible for losses related to catastrophic events in excess of coverage provided by the Insurance Entities’ reinsurance programs or retentions before the Company’sour reinsurance protection commences. Also, the Insurance Entities are responsible for all other losses that otherwise may not be covered by the reinsurance programs and any amounts arising in the event of a reinsurer default. Losses or a reinsurer default by reinsurers may have a material adverse effect on either of the Insurance Entities or our business, financial condition, results of operations and liquidity.Capital ResourcesCapital resources provide protection for policyholders, furnish the financial strength to support the business of underwriting insurance risks and facilitate continued business growth. The following table provides our stockholderstockholders’ equity, total long-term debt, total capital debt-to-equityresources, debt-to-total capital ratio and debt-to-equity ratio for the periods presented (dollars in thousands): As of June 30, December 31, 2019 2018 Stockholders’ equity $ 566,066 $ 501,633 Total long-term debt 10,662 11,397 Total capital resources $ 576,728 $ 513,030 Debt-to-total capital ratio 1.8 % 2.2 % Debt-to-equity ratio 1.9 % 2.3 % As described in our Annual Report on Form 10-K for the year ended December 31, 2017,2018, UPCIC entered into a surplus note with the State Board of Administration of Florida under Florida’s Insurance Capital Build-Up Incentive Program on November 9, 2006. The surplus note has a twenty-year term, with quarterly payments of principal and interest that accrue per the terms of the note agreement. At June 30, 2018,2019, UPCIC was in compliance with the terms of the surplus note. Total adjusted capital surplus, which includes the surplus note, was in excess of regulatory requirements for both UPCIC and APPCIC.On September 5, 2017, our Board of Directors authorized the repurchase of up to $20 million of the Company’s outstanding common stock through December 31, 2018. The CompanyCommon Stock RepurchasesWe may repurchase shares from time to time at itsour discretion, based on ongoing assessments of theour capital needs, of the Company, the market price of itsour common stock and general market conditions. The CompanyWe will fund the share repurchase program with cash from operations.On December 12, 2018, we announced that our Board of Directors authorized a share repurchase program under which we were authorized to repurchase shares in the open market up to $20 million of outstanding shares of our common stock through May 31, 2020 (the “May 2020 Share Repurchase Program”), pursuant to which we repurchased 606,342 shares of our common stock at an average price of $32.98 per share on the open market. We completed the May 2020 Share Repurchase Program in May 2019.On May 6, 2019, we announced that our Board of Directors authorized a share repurchase program under which we may repurchase in the open market up to $40 million of outstanding shares of our common stock through December 31, 2020 (the “December 2020 Share Repurchase Program”). Under the December 2020 Share Repurchase Program, we repurchased 338,274 shares of our common stock at an average price of $28.71 during the six months ended June 30, 2019 at an aggregate cost of approximately $9.7 million.During the six months ended June 30, 2019, we repurchased an aggregate of 342,749806,382 shares of UVE’sour common stock in the open market at an aggregate costpurchase price of $11.1$24.2 million. Also, see “Part“Part II, Item 2 — 2—Unregistered Sales of Equity Securities and Use of Proceeds” for share repurchase activity during the three months ended June 30, 2018.Cash DividendsThe following table summarizes the dividends declared by the Company:2019 DividendDeclared Date ShareholdersRecord Date DividendPayable Date Cash DividendPer Share AmountFirst Quarter January 31, 2019 March 11, 2019 March 25, 2019 $ 0.16 Second Quarter April 10, 2019 May 3, 2019 May 10, 2019 $ 0.16 Third Quarter June 5, 2019 July 3, 2019 July 17, 2019 $ 0.16 CONTRACTUAL OBLIGATIONSThe following table represents our contractual obligations for which cash flows are fixed or determinable as of June 30, 20182019 (in thousands): Total Less than1 year 1-3 years 3-5 years Over5 yearsReinsurance payable and multi-year commitments (1) $ 625,346 $ 424,187 $ 201,159 $ — $ — Unpaid losses and LAE, direct (2) 288,296 178,455 80,435 22,199 7,207 Long-term debt 11,617 1,287 4,952 3,126 2,252 Total contractual obligations $ 925,259 $ 603,929 $ 286,546 $ 25,325 $ 9,459 (1)(1) The 1-3 years amount represents the payment of reinsurance premiums payable under multi-year commitments. See “Item 1—–Note 12 (Commitments and Contingencies).” (2) There are generally no notional or stated amounts related to unpaid losses and LAE. Both the amounts and timing of future loss and LAE payments are estimates and subject to the inherent variability of legal and market conditions affecting the obligations and make the timing of cash outflows uncertain. The ultimate amount and timing of unpaid losses and LAE could differ materially from the amounts in the table above. Further, the unpaid losses and LAE do not represent all the obligations that will arise under the contracts, but rather only the estimated liability incurred through June 30, 2018.2019. Unpaid losses and LAE are net of estimated subrogation recoveries. In addition, these balances exclude amounts recoverable from the Company’s reinsurance program. See “Item 1—Note 4 (Reinsurance).”Critical Accounting Policies and EstimatesOther than as disclosed in “Item 1 — Note 2 (Significant Accounting Policies),” thereCRITICAL ACCOUNTING POLICIES AND ESTIMATESThere have been no material changes during the period covered by this Quarterly Report on Form 10-Q to Critical Accounting Policies and Estimates previously disclosed in Part“Part II, Item 7, “Management’s7—Management’s Discussion and Analysis of Financial Condition and Results of Operations” included in our Annual Report on Form 10-K for the year ended December 31, 2017.Recent Accounting Pronouncements Not Yet AdoptedIn June 2016, the Financial Accounting Standards Board (“FASB”) revised U.S. GAAP with the issuance of Accounting Standards Update (“ASU”) 2016-13, Financial Instruments -CreditInstruments-Credit Losses (Topic 326), that introduces a new process for recognizing credit losses on financial instruments based on an estimate of current expected credit losses. The new ASU will apply to: 1)(1) loans, accounts receivable, trade receivables, and other financial assets measured at amortized cost, 2)(2) loan commitments and certain other off-balance sheet credit exposures, 3)(3) debt securities and other financial assets measured at fair value through other comprehensive income and 4)(4) beneficial interests in securitized financial assets. The ASU changes the current practice of recording a permanent write down (other than temporary impairment), for probable credit losses, which is more restrictive than the new ASU requirement that would estimate credit losses, then recorded through a temporary allowance account that can be re-measured as estimated credit losses change. The ASU further limited estimated credit losses relating to available for saleavailable-for-sale securities to the amount which fair value is below amortized cost. The ASU is effective for fiscal years beginning after December 15, 2019, including interim periods within those fiscal years. We are currently evaluating the impact that this standard will have on our consolidated financial statements.In March 2017,August 2018, the FASB revised U.S. GAAP with the issuance of ASU 2017-08, Receivables – Nonrefundable Fees and Other Costs to amend the amortization period for certain purchased callable debt securities held at a premium. Current U.S. GAAP excludes certain callable debt securities from consideration of early repayment of principal even if the holder is certain that the call will be exercised. The new ASU shortens the amortization period of certain purchased callable debt securities2018-13, Fair Value Measurement (Topic 820) - Disclosure Framework - Changes to the earliest call date.Disclosure Requirements for Fair Value Measurement. The ASU removes, modifies and adds certain disclosure requirements associated with fair value measurements. The ASU is effective for fiscal years, beginning after December 15, 2018, includingand interim periods within those fiscal years.years, beginning after December 15, 2019. Early adoption is permitted. UnderThe removed and modified disclosures will be adopted on a retrospective basis and the current U.S. GAAP, you could consider the call dates and estimate if you hadnew disclosures will be adopted on a large number of similar securities and you were basing your judgment on actual experience. Our service provider (who processes the accounting forprospective basis. We are currently evaluating our investment transactions) has many similar securities on their system and can make that type of determination. As a result, we currently accounttimeline for the amortization underadoption of this ASU, which only affects the proposed ASUpresentation of certain disclosures and there will be nois not expected to impact to our results of operations, financial position or liquidity.Item 3. Quantitative and Qualitative Disclosures about Market RiskMarket risk is the potential for economic losses due to adverse changes in fair market value of available-for-sale debt securities, available-for-sale short-term investments and equity securities (“Financial Instruments”) and investment real estate. We carry all of our Financial Instruments at fair market value and investment real estate at net book value in our statement of financial condition. Our investment portfolio as of June 30, 20182019 iscomprised of available-for-sale debt securities and equitiesequity securities, carried at fair market value, which expose us to changes inchanging market conditions, specifically interest rates and equity prices.The primary objectives of the investment portfolio are the preservation of capital and providing adequate liquidity for potential claims payments and other cash needs. The portfolio’s secondary investment objective is to provide a total rate of return with an emphasis on investment income. None of our investments in risk-sensitive Financial Instruments were entered into for trading purposes.See “Item 1 – 1—Note 3 (Investments)” for more information about our Financial Instruments.Interest rate risk is the sensitivity of the fair market value of a fixed-rate Financial Instrument to changes in interest rates. Generally, when interest rates rise, the fair value of our fixed-rate Financial Instruments declines.The following table providestables provide information about our fixed income Financial Instruments as of June 30, 2019 compared to December 31, 2018, which are sensitive to changes in interest rates. The table presentstables present the expected cash flows of principal amounts and related weighted average interest rates by expected maturity dates for Financial Instruments available for sale as ofbased on years to effective maturity using amortized cost compared to fair market value and the dates presented (inrelated book yield compared to coupon yield (dollars in thousands):(1)Comprised of mortgage-backed and asset-backed securities which have multiple maturity dates, and perpetual maturity securities, and are presented separately for June 30, 2019 2019 2020 2021 2022 2023 Thereafter Other Total Amortized cost $ 125,392 $ 143,713 $ 59,128 $ 108,872 $ 118,934 $ 305,829 $ 1,153 $ 863,021 Fair market value $ 125,260 $ 144,053 $ 59,747 $ 110,603 $ 122,604 $ 320,614 $ 1,212 $ 884,093 Coupon rate 2.32 % 2.44 % 3.12 % 3.32 % 3.47 % 3.82 % 5.79 % 3.23 % Book yield 2.10 % 2.36 % 2.80 % 3.04 % 3.16 % 3.64 % 5.81 % 3.01 % * Years to effective maturity - 3.3 years December 31, 2018 2019 2020 2021 2022 2023 Thereafter Other Total Amortized cost $ 123,110 $ 109,690 $ 114,580 $ 55,542 $ 121,363 $ 301,454 $ 5,388 $ 831,127 Fair market value $ 122,333 $ 108,564 $ 112,917 $ 54,309 $ 119,945 $ 297,214 $ 5,156 $ 820,438 Coupon rate 2.04 % 2.35 % 2.63 % 2.99 % 3.32 % 3.90 % 6.15 % 3.11 % Book yield 1.88 % 2.24 % 2.43 % 2.83 % 3.18 % 3.68 % 5.96 % 2.94 % * Years to effective maturity - 3.5 years All securities, except those with perpetual maturities, were categorized in the purposes of this table.The tables above represent average contract ratesutilizing years to effective maturity. Effective maturity takes into consideration all forms of potential prepayment, such as call features or prepayment schedules, that differ fromshorten the book yieldlifespan of the available-for-sale debt securities. The fixed income Financial Instruments in our available for sale portfolio are comprised of United States government and agency securities, corporate bonds, municipal bonds, redeemable preferred stock, mortgage-backed and asset-backed securities and certificates of deposit. Duration is a measure of interest rate sensitivity expressed as a number of years. The weighted average duration of the fixed income Financial Instruments in our available for sale portfolio at June 30, 2018 was 2.8 years.To a lesser extent, we also have exposure to interest on our debt obligation which is in the form of a surplus note. The surplus note accrues interest at an adjustable rate based on the 10-year Constant Maturity Treasury rate.Equity Price RiskEquity price risk is the potential for loss in fair value of Financial Instruments in common stock and mutual funds from adverse changes in the prices of those Financial Instruments.The following table provides information about the Financial Instruments in our investment portfolio subject to price risk as of the dates presented (in thousands): June 30, 2019 December 31, 2018 Fair Value Percent Fair Value Percent Equity Securities: Common stock $ 2,724 6.4 % $ 15,564 24.6 % Mutual funds 39,644 93.6 % 47,713 75.4 % Total equity securities $ 42,368 100.0 % $ 63,277 100.0 % A hypothetical decrease of 20% in the market prices of each of the equity securities held at June 30, 20182019 and December 31, 20172018 would have resulted in a decrease of $14.2$8.5 million and $12.4$12.7 million, respectively, in the fair value of those securities.ItemItem 4. Controls and ProceduresEvaluation of Disclosure Controls and ProceduresThe Company carried out an evaluation under the supervision and with the participation of the Company’s management, including the Company’s Chief Executive Officer and Chief Financial Officer, of the effectiveness of the design and operation of the Company’s disclosure controls and procedures pursuant to Rule 13a-15 under the Securities Exchange Act of 1934 as of the end of the period covered by this report. Based on that evaluation, the Company’s Chief Executive Officer and Chief Financial Officer have concluded that disclosure controls and procedures were effective as of June 30, 2018,2019, to ensure that information required to be disclosed by the Company in its reports that it files or submits under the Securities Exchange Act of 1934 is recorded, processed, summarized and reported within the time periods specified in the SEC’s rules and forms and that information required to be disclosed by the Company in the reports that it files or submits under the Securities Exchange Act of 1934 is accumulated and communicated to the Company’s management, including its principal executive and principal financial officers as appropriate, to allow timely decisions regarding required disclosure.Changes in Internal Control Over Financial ReportingThere was no change in the Company’s internal controls over financial reporting that occurred during the period covered by this report that has materially affected, or is reasonably likely to materially affect, the Company’s internal control over financial reporting.PART II — OTHER INFORMATIONItem 1. Legal ProceedingsLawsuits are filed against the Company from time to time. Many of these lawsuits involve claims under policies that we underwrite and reserve for as an insurer. We are also involved in various other legal proceedings and litigation unrelated to claims under our policies that arise in the ordinary course of business operations. Management believes that any liabilities that may arise as a result of these legal matters will not have a material adverse effect on our financial condition or results of operations. The Company contests liability and/or the amount of damages as appropriate in each pending matter.In accordance with applicable accounting guidance, the Company establishes an accrued liability for legal matters when those matters present loss contingencies that are both probable and estimable.Legal proceedings are subject to many uncertain factors that generally cannot be predicted with assurance, and the Company may be exposed to losses in excess of any amounts accrued. The Company currently estimates that the reasonably possible losses for legal proceedings, whether in excess of a related accrued liability or where there is no accrued liability, and for which the Company is able to estimate a possible loss, are immaterial. This represents management’s estimate of possible loss with respect to these matters and is based on currently available information. These estimates of possible loss do not represent our maximum loss exposure, and actual results may vary significantly from current estimates.ItemItem 1A. Risk FactorsThere have been no material changes during the period covered by this Quarterly Report on Form 10-Q to the risk factors previously disclosed in Part“Part I, Item 1A, “Risk1A—Risk Factors,” included in the Company’s Annual Report on Form 10-K for the year ended December 31, 2017.2018.Item 2. Unregistered Sales of Equity Securities and Use of ProceedsThe table below presents our purchases of UVEour common stock during the three months ended June 30, 2018.(1)Average price paid per share does not reflect brokerage commissions paid to acquire shares in open market transactions.(2)Number of shares was calculated using a closing price at June 29, 2018 of $35.10 per share. Total Number of Maximum Number Shares Purchased of Shares That As Part of May Yet be Publicly Purchased Under Total Number of Average Price Announced the Plans or Shares Purchased Paid per Share (1) Plans or Programs Programs (2) 4/1/2019 - 4/30/2019 50,000 $ 29.81 50,000 — 5/1/2019 - 5/31/2019 392,500 $ 28.90 392,500 — 6/1/2019 - 6/30/2019 43,382 $ 28.99 43,382 1,085,990 Total 485,882 $ 29.00 485,882 1,085,990 (1)Average price paid per share does not reflect brokerage commissions paid to acquire shares in open market transactions.(2)Number of shares was calculated based on a closing price at June 28, 2019 of $27.90 per share.We may repurchase shares from time to time at our discretion, based on ongoing assessments of our capital needs, the market price of our common stock and general market conditions. The CompanyWe will fund the share repurchase program with cash from operations.In September 2017, our During the six months ended June 30, 2019, there were two authorized repurchase plans in effect:On December 12, 2018, we announced that the Board of Directors approved a share authorized the repurchase program authorizing us to purchaseof up to $20 million of our outstanding shares of common stock through May 31, 2020, pursuant to which we repurchased 606,342 shares of our common stock at an aggregate price of $20.0 million. We completed the May 2020 Share Repurchase Program in May 2019.On May 6, 2019, we announced that the open market in compliance with Rule 10b-18 underBoard of Directors authorized the Securities Exchange Actrepurchase of 1934, as amended,up to $40 million of our outstanding shares of common stock through December 31, 2018.Since September 2017,2020. Under the December 2020 Share Repurchase Program, we repurchased 350,941338,274 shares of our common stock from May 2019 through June 30, 2019 at an aggregate cost of approximately $9.7 million.During the six months ended June 30, 2019, we repurchased 806,382 shares of our common stock pursuant to this program through June 30, 2018 the May 2020 Share Repurchase Program and the December 2020 Share Repurchase Program at an aggregate costpurchase price of approximately $11.3$24.2 million.ItemItem 6. ExhibitsExhibit No.Exhibit 15.1Exhibit 31.131.1 101.INS-XBRLInstance Document101.SCH-XBRLTaxonomy Extension Schema Document101.CAL-XBRLTaxonomy Extension Calculation Linkbase Document101.DEF-XBRLTaxonomy Extension Definition Linkbase Document101.LAB-XBRLTaxonomy Extension Label Linkbase Document101.PRE-XBRLTaxonomy Extension Presentation Linkbase DocumentSIGNATURESPursuant to the requirements of the Securities Exchange Act of 1934, the registrant has duly caused this report to be signed on its behalf by the undersigned thereunto duly authorized.July 27, 2018Sean P. DownesSean P. Downes,Stephen J. Donaghy, Chief Executive Officer and Principal Executive OfficerJuly 27, 20185248