
UNITED STATES
SECURITIES AND EXCHANGE COMMISSION
Washington, D.C. 20549
FORM 10-Q
☑ | QUARTERLY REPORT PURSUANT TO SECTION 13 OR 15(d) OF THE SECURITIES EXCHANGE ACT OF 1934 |
For the quarterly period ended September 30, 20182019
or
☐ | TRANSITION REPORT PURSUANT TO SECTION 13 OR 15(d) OF THE SECURITIES EXCHANGE ACT OF 1934 |
For the transition period from to
Commission File Number: 001-33303
TARGA RESOURCES PARTNERS LP
(Exact name of registrant as specified in its charter)
Delaware |
| 65-1295427 | ||
(State or other jurisdiction of incorporation or organization) |
| (I.R.S. Employer Identification No.) | ||
|
|
| ||
811 Louisiana St, Suite 2100, Houston, Texas |
| 77002 | ||
(Address of principal executive offices) |
| (Zip Code) |
(713) 584-1000
(Registrant’s telephone number, including area code)
Securities registered pursuant to Section 12(b) of the Act:
Title of each class | Trading Symbol(s) | Name of exchange on which registered | ||
9.0% Series A Fixed-to-Floating Rate Cumulative Redeemable Perpetual Preferred Units | NGLS/PA | New York Stock Exchange |
Indicate by check mark whether the registrant (1) has filed all reports required to be filed by Section 13 or 15(d) of the Securities Exchange Act of 1934 during the preceding 12 months (or for such shorter period that the registrant was required to file such reports), and (2) has been subject to such filing requirements for the past 90 days. Yes☑ No ☐
Indicate by check mark whether the registrant has submitted electronically every Interactive Data File required to be submitted pursuant to Rule 405 of Regulation S-T (§232.405 of this chapter) during the preceding 12 months (or for such shorter period that the registrant was required to submit such files). Yes☑ No ☐
Indicate by check mark whether the registrant is a large accelerated filer, an accelerated filer, a non-accelerated filer, a smaller reporting company, or an emerging growth company. See the definitions of “large accelerated filer,” “accelerated filer,” “smaller reporting company,” and “emerging growth company” in Rule 12b-2 of the Exchange Act.
Large accelerated filer | ☐ |
| Accelerated filer | ☐ | |
Non-accelerated filer | ☑ |
| Smaller reporting company | ☐ | |
|
|
| Emerging growth company | ☐ |
If an emerging growth company, indicate by check mark if the registrant has elected not to use the extended transition period for complying with any new or revised financial accounting standards provided pursuant to Section 13(a) of the Exchange Act. ☐
Indicate by check mark whether the registrant is a shell company (as defined in Rule 12b-2 of the Exchange Act). Yes☐ No☑.
As of November 5, 2018,1, 2019, there were 5,000,000 9.0% Series A Fixed-to-Floating Rate Cumulative Redeemable Perpetual Preferred Units outstanding.
1
CAUTIONARY STATEMENT ABOUT FORWARD-LOOKING STATEMENTS
Targa Resources Partners LP’s (together with its subsidiaries, “we,” “us,” “our,” “TRP” or “the Partnership”the “Partnership”) reports, filings and other public announcements may from time to time contain statements that do not directly or exclusively relate to historical facts. Such statements are “forward-looking statements.” You can typically identify forward-looking statements within the meaning of Section 27A of the Securities Act of 1933, as amended, and Section 21E of the Securities Exchange Act of 1934, as amended, by the use of forward-looking statements, such as “may,” “could,” “project,” “believe,” “anticipate,” “expect,” “estimate,” “potential,” “plan,” “forecast” and other similar words.
All statements that are not statements of historical facts, including statements regarding our future financial position, business strategy, budgets, projected costs and plans and objectives of management for future operations, are forward-looking statements.
These forward-looking statements reflect our intentions, plans, expectations, assumptions and beliefs about future events and are subject to risks, uncertainties and other factors, many of which are outside our control. Important factors that could cause actual results to differ materially from the expectations expressed or implied in the forward-looking statements include known and unknown risks. Known risks and uncertainties include, but are not limited to, the following risks and uncertainties:
the timing and extent of changes in natural gas, natural gas liquids, crude oil and other commodity prices, interest rates and demand for our services;
• | the timing and extent of changes in natural gas, natural gas liquids, crude oil and other commodity prices, interest rates and demand for our services; |
the level and success of crude oil and natural gas drilling around our assets, our success in connecting natural gas supplies to our gathering and processing systems, oil supplies to our gathering systems and natural gas liquid supplies to our logistics and marketing facilities and our success in connecting our facilities to transportation services and markets;
• | the level and success of crude oil and natural gas drilling around our assets, our success in connecting natural gas supplies to our gathering and processing systems, oil supplies to our gathering systems and natural gas liquid supplies to our transportation and logistics and marketing facilities and our success in connecting our facilities to transportation services and markets; |
our ability to access the capital markets, which will depend on general market conditions and the credit ratings for our debt obligations;
• | our ability to access the capital markets, which will depend on general market conditions and the credit ratings for our debt obligations; |
the amount of collateral required to be posted from time to time in our transactions;
• | the amount of collateral required to be posted from time to time in our transactions; |
our success in risk management activities, including the use of derivative instruments to hedge commodity price risks;
• | our success in risk management activities, including the use of derivative instruments to hedge commodity price risks; |
the level of creditworthiness of counterparties to various transactions with us;
• | the level of creditworthiness of counterparties to various transactions with us; |
changes in laws and regulations, particularly with regard to taxes, safety and protection of the environment;
• | changes in laws and regulations, particularly with regard to taxes, safety and protection of the environment; |
weather and other natural phenomena;
• | weather and other natural phenomena; |
industry changes, including the impact of consolidations and changes in competition;
• | industry changes, including the impact of consolidations and changes in competition; |
our ability to obtain necessary licenses, permits and other approvals;
• | our ability to obtain necessary licenses, permits and other approvals; |
our ability to grow through acquisitions or internal growth projects and the successful integration and future performance of such assets;
• | our ability to grow through acquisitions or internal growth projects and the successful integration and future performance of such assets; |
general economic, market and business conditions; and
• | general economic, market and business conditions; and |
the risks described in our Annual Report on Form 10-K for the year ended December 31, 2017 (“Annual Report”) and our reports and registration statements filed from time to time with the United States Securities and Exchange Commission (“SEC”).
• | the risks described in our Annual Report on Form 10-K for the year ended December 31, 2018 (“Annual Report”) and our reports and registration statements filed from time to time with the United States Securities and Exchange Commission (“SEC”). |
Although we believe that the assumptions underlying our forward-looking statements are reasonable, any of the assumptions could be inaccurate, and, therefore, we cannot assure you that the forward-looking statements included in this Quarterly Report on Form 10-Q for the quarter ended September 30, 20182019 (“Quarterly Report”) will prove to be accurate. Some of these and other risks and uncertainties that could cause actual results to differ materially from such forward-looking statements are more fully described in our Annual Report. Except as may be required by applicable law, we undertake no obligation to publicly update or advise of any change in any forward-looking statement, whether as a result of new information, future events or otherwise.
2
As generally used in the energy industry and in this Quarterly Report, the identified terms have the following meanings:
Bbl | Barrels (equal to 42 U.S. gallons) | |
BBtu | Billion British thermal units | |
Bcf | Billion cubic feet | |
Btu | British thermal units, a measure of heating value | |
/d | Per day | |
GAAP | Accounting principles generally accepted in the United States of America | |
gal | U.S. gallons | |
|
| |
|
| |
LIBOR | London Interbank Offered Rate | |
LPG | Liquefied petroleum gas | |
MBbl | Thousand barrels | |
MMBbl | Million barrels | |
MMBtu | Million British thermal units | |
MMcf | Million cubic feet | |
MMgal | Million U.S. gallons | |
NGL(s) | Natural gas liquid(s) | |
NYMEX | New York Mercantile Exchange | |
NYSE | New York Stock Exchange | |
SCOOP | South Central Oklahoma Oil Province | |
STACK | Sooner Trend, Anadarko, Canadian and Kingfisher | |
|
|
PART I – FINANCIALFINANCIAL INFORMATION
TARGA RESOURCES PARTNERS LP
|
|
| September 30, 2018 |
|
| December 31, 2017 |
|
|
| September 30, 2019 |
|
| December 31, 2018 |
| ||||||||||||||||||||
|
|
|
|
|
|
|
|
|
|
|
| (Unaudited) |
|
|
| (Unaudited) |
| |||||||||||||||||
|
|
| (In millions) |
|
|
| (In millions) |
| ||||||||||||||||||||||||||
ASSETS | ASSETS |
|
|
|
|
|
|
|
| ASSETS |
| |||||||||||||||||||||||
Current assets: | Current assets: |
|
|
|
|
|
|
|
| Current assets: |
|
|
|
|
|
|
|
| ||||||||||||||||
Cash and cash equivalents | Cash and cash equivalents |
| $ | 187.5 |
|
| $ | 124.7 |
| Cash and cash equivalents |
| $ | 294.9 |
|
| $ | 203.3 |
| ||||||||||||||||
Trade receivables, net of allowances of $0.1 and $0.1 million at September 30, 2018 and December 31, 2017 |
|
| 1,036.0 |
|
|
| 825.7 |
| ||||||||||||||||||||||||||
Trade receivables, net of allowances of $0.0 and $0.1 million at September 30, 2019 and December 31, 2018 | Trade receivables, net of allowances of $0.0 and $0.1 million at September 30, 2019 and December 31, 2018 |
|
| 742.9 |
|
|
| 864.4 |
| |||||||||||||||||||||||||
Inventories | Inventories |
|
| 177.9 |
|
|
| 204.5 |
| Inventories |
|
| 210.9 |
|
|
| 164.7 |
| ||||||||||||||||
Assets from risk management activities | Assets from risk management activities |
|
| 59.6 |
|
|
| 37.9 |
| Assets from risk management activities |
|
| 140.1 |
|
|
| 115.3 |
| ||||||||||||||||
Other current assets | Other current assets |
|
| 66.4 |
|
|
| 55.8 |
| Other current assets |
|
| 43.4 |
|
|
| 32.2 |
| ||||||||||||||||
Held for sale assets (see Note 4) |
|
| 165.7 |
|
|
| — |
| ||||||||||||||||||||||||||
Total current assets | Total current assets |
|
| 1,693.1 |
|
|
| 1,248.6 |
| Total current assets |
|
| 1,432.2 |
|
|
| 1,379.9 |
| ||||||||||||||||
Property, plant and equipment | Property, plant and equipment |
|
| 16,214.6 |
|
|
| 14,198.6 |
| Property, plant and equipment |
|
| 19,589.1 |
|
|
| 17,213.8 |
| ||||||||||||||||
Accumulated depreciation |
|
| (4,133.8 | ) |
|
| (3,768.7 | ) | ||||||||||||||||||||||||||
Accumulated depreciation and amortization | Accumulated depreciation and amortization |
|
| (4,892.4 | ) |
|
| (4,285.5 | ) | |||||||||||||||||||||||||
Property, plant and equipment, net | Property, plant and equipment, net |
|
| 12,080.8 |
|
|
| 10,429.9 |
| Property, plant and equipment, net |
|
| 14,696.7 |
|
|
| 12,928.3 |
| ||||||||||||||||
Intangible assets, net | Intangible assets, net |
|
| 2,029.6 |
|
|
| 2,165.8 |
| Intangible assets, net |
|
| 1,854.4 |
|
|
| 1,983.2 |
| ||||||||||||||||
Goodwill, net | Goodwill, net |
|
| 256.6 |
|
|
| 256.6 |
| Goodwill, net |
|
| 46.6 |
|
|
| 46.6 |
| ||||||||||||||||
Long-term assets from risk management activities | Long-term assets from risk management activities |
|
| 8.4 |
|
|
| 23.2 |
| Long-term assets from risk management activities |
|
| 60.0 |
|
|
| 34.1 |
| ||||||||||||||||
Investments in unconsolidated affiliates | Investments in unconsolidated affiliates |
|
| 441.5 |
|
|
| 221.6 |
| Investments in unconsolidated affiliates |
|
| 718.5 |
|
|
| 490.5 |
| ||||||||||||||||
Other long-term assets | Other long-term assets |
|
| 16.5 |
|
|
| 13.3 |
| Other long-term assets |
|
| 49.9 |
|
|
| 27.5 |
| ||||||||||||||||
Total assets | Total assets |
| $ | 16,526.5 |
|
| $ | 14,359.0 |
| Total assets |
| $ | 18,858.3 |
|
| $ | 16,890.1 |
| ||||||||||||||||
|
|
|
|
|
|
|
|
|
|
|
|
|
|
|
|
|
|
| ||||||||||||||||
LIABILITIES AND OWNERS' EQUITY | LIABILITIES AND OWNERS' EQUITY |
|
|
|
|
|
|
|
| LIABILITIES AND OWNERS' EQUITY |
| |||||||||||||||||||||||
Current liabilities: | Current liabilities: |
|
|
|
|
|
|
|
| Current liabilities: |
|
|
|
|
|
|
|
| ||||||||||||||||
Accounts payable and accrued liabilities | Accounts payable and accrued liabilities |
| $ | 1,984.1 |
|
| $ | 1,106.6 |
| Accounts payable and accrued liabilities |
| $ | 1,234.8 |
|
| $ | 1,636.9 |
| ||||||||||||||||
Accounts payable to Targa Resources Corp. | Accounts payable to Targa Resources Corp. |
|
| 136.5 |
|
|
| 76.9 |
| Accounts payable to Targa Resources Corp. |
|
| 194.0 |
|
|
| 187.4 |
| ||||||||||||||||
Liabilities from risk management activities | Liabilities from risk management activities |
|
| 176.3 |
|
|
| 79.7 |
| Liabilities from risk management activities |
|
| 83.5 |
|
|
| 33.6 |
| ||||||||||||||||
Current debt obligations | Current debt obligations |
|
| 290.0 |
|
|
| 350.0 |
| Current debt obligations |
|
| 258.0 |
|
|
| 1,027.9 |
| ||||||||||||||||
Held for sale liabilities (see Note 4) |
|
| 1.7 |
|
|
| — |
| ||||||||||||||||||||||||||
Total current liabilities | Total current liabilities |
|
| 2,588.6 |
|
|
| 1,613.2 |
| Total current liabilities |
|
| 1,770.3 |
|
|
| 2,885.8 |
| ||||||||||||||||
Long-term debt | Long-term debt |
|
| 5,243.9 |
|
|
| 4,268.0 |
| Long-term debt |
|
| 6,844.7 |
|
|
| 5,197.4 |
| ||||||||||||||||
Long-term liabilities from risk management activities | Long-term liabilities from risk management activities |
|
| 67.5 |
|
|
| 19.6 |
| Long-term liabilities from risk management activities |
|
| 46.1 |
|
|
| 3.1 |
| ||||||||||||||||
Deferred income taxes, net | Deferred income taxes, net |
|
| 24.0 |
|
|
| 24.0 |
| Deferred income taxes, net |
|
| 23.9 |
|
|
| 23.9 |
| ||||||||||||||||
Other long-term liabilities | Other long-term liabilities |
|
| 245.2 |
|
|
| 576.0 |
| Other long-term liabilities |
|
| 261.7 |
|
|
| 233.8 |
| ||||||||||||||||
Contingencies (see Note 15) |
|
|
|
|
|
|
|
| ||||||||||||||||||||||||||
Contingencies (see Note 16) | Contingencies (see Note 16) |
|
|
|
|
|
|
|
| |||||||||||||||||||||||||
Owners' equity: | Owners' equity: |
|
|
|
|
|
|
|
| Owners' equity: |
|
|
|
|
|
|
|
| ||||||||||||||||
Series A preferred limited partners | Series A preferred limited partners | Issued |
|
| Outstanding |
|
|
|
| 120.6 |
|
|
| 120.6 |
| Issued |
|
| Outstanding |
|
|
|
| 120.6 |
|
|
| 120.6 |
| |||||
September 30, 2018 |
| 5,000,000 |
|
|
| 5,000,000 |
|
|
|
|
|
|
|
|
|
| ||||||||||||||||||
December 31, 2017 |
| 5,000,000 |
|
|
| 5,000,000 |
|
|
|
|
|
|
|
|
|
| ||||||||||||||||||
September 30, 2019 |
| 5,000,000 |
|
|
| 5,000,000 |
|
|
|
|
|
|
|
|
|
| ||||||||||||||||||
December 31, 2018 |
| 5,000,000 |
|
|
| 5,000,000 |
|
|
|
|
|
|
|
|
|
| ||||||||||||||||||
Common limited partners | Common limited partners | Issued |
|
| Outstanding |
|
|
|
| 6,525.5 |
|
|
| 6,500.3 |
| Issued |
|
| Outstanding |
|
|
|
| 5,437.1 |
|
|
| 6,227.2 |
| |||||
September 30, 2018 |
| 275,168,410 |
|
|
| 275,168,410 |
|
|
|
|
|
|
|
|
|
| ||||||||||||||||||
December 31, 2017 |
| 275,168,410 |
|
|
| 275,168,410 |
|
|
|
|
|
|
|
|
|
| ||||||||||||||||||
September 30, 2019 |
| 275,168,410 |
|
|
| 275,168,410 |
|
|
|
|
|
|
|
|
|
| ||||||||||||||||||
December 31, 2018 |
| 275,168,410 |
|
|
| 275,168,410 |
|
|
|
|
|
|
|
|
|
| ||||||||||||||||||
General partner | General partner | Issued |
|
| Outstanding |
|
|
|
| 808.7 |
|
|
| 808.2 |
| Issued |
|
| Outstanding |
|
|
|
| 786.4 |
|
|
| 802.6 |
| |||||
September 30, 2018 |
| 5,629,136 |
|
|
| 5,629,136 |
|
|
|
|
|
|
|
|
|
| ||||||||||||||||||
December 31, 2017 |
| 5,629,136 |
|
|
| 5,629,136 |
|
|
|
|
|
|
|
|
|
| ||||||||||||||||||
September 30, 2019 |
| 5,629,136 |
|
|
| 5,629,136 |
|
|
|
|
|
|
|
|
|
| ||||||||||||||||||
December 31, 2018 |
| 5,629,136 |
|
|
| 5,629,136 |
|
|
|
|
|
|
|
|
|
| ||||||||||||||||||
Accumulated other comprehensive income (loss) | Accumulated other comprehensive income (loss) |
|
|
|
|
| (165.7 | ) |
|
| (46.0 | ) |
|
|
|
|
| 186.6 |
|
|
| 124.9 |
| |||||||||||
|
|
|
| 7,289.1 |
|
|
| 7,383.1 |
|
|
|
| 6,530.7 |
|
|
| 7,275.3 |
| ||||||||||||||||
Noncontrolling interests in subsidiaries |
|
|
|
|
| 1,068.2 |
|
|
| 475.1 |
| |||||||||||||||||||||||
Noncontrolling interests |
|
|
|
|
| 3,380.9 |
|
|
| 1,270.8 |
| |||||||||||||||||||||||
Total owners' equity | Total owners' equity |
|
| 8,357.3 |
|
|
| 7,858.2 |
| Total owners' equity |
|
| 9,911.6 |
|
|
| 8,546.1 |
| ||||||||||||||||
Total liabilities and owners' equity | Total liabilities and owners' equity |
| $ | 16,526.5 |
|
| $ | 14,359.0 |
| Total liabilities and owners' equity |
| $ | 18,858.3 |
|
| $ | 16,890.1 |
| ||||||||||||||||
|
|
|
|
|
|
|
|
|
|
|
|
|
|
|
|
|
|
| ||||||||||||||||
See notes to consolidated financial statements. | See notes to consolidated financial statements. |
| See notes to consolidated financial statements. |
| ||||||||||||||||||||||||||||||
CONSOLIDATED STATEMENTS OF OPERATIONS
| Three Months Ended September 30, |
|
| Nine Months Ended September 30, |
| Three Months Ended September 30, |
|
| Nine Months Ended September 30, |
| ||||||||||||||||||||
| 2018 |
|
| 2017 |
|
| 2018 |
|
| 2017 |
| 2019 |
|
| 2018 |
|
| 2019 |
|
| 2018 |
| ||||||||
| (Unaudited) |
| (Unaudited) |
| ||||||||||||||||||||||||||
| (In millions) |
| (In millions) |
| ||||||||||||||||||||||||||
Revenues: |
|
|
|
|
|
|
|
|
|
|
|
|
|
|
|
|
|
|
|
|
|
|
|
|
|
|
|
|
|
|
Sales of commodities (see Note 3) | $ | 2,654.1 |
|
| $ | 1,871.5 |
|
| $ | 6,981.4 |
|
| $ | 5,353.1 |
| |||||||||||||||
Fees from midstream services (see Note 3) |
| 332.3 |
|
|
| 260.3 |
|
|
| 904.9 |
|
|
| 759.0 |
| |||||||||||||||
Sales of commodities | $ | 1,594.2 |
|
| $ | 2,654.1 |
|
| $ | 5,254.8 |
|
| $ | 6,981.4 |
| |||||||||||||||
Fees from midstream services |
| 308.3 |
|
|
| 332.3 |
|
|
| 942.4 |
|
|
| 904.9 |
| |||||||||||||||
Total revenues |
| 2,986.4 |
|
|
| 2,131.8 |
|
|
| 7,886.3 |
|
|
| 6,112.1 |
|
| 1,902.5 |
|
|
| 2,986.4 |
|
|
| 6,197.2 |
|
|
| 7,886.3 |
|
Costs and expenses: |
|
|
|
|
|
|
|
|
|
|
|
|
|
|
|
|
|
|
|
|
|
|
|
|
|
|
|
|
|
|
Product purchases (see Note 3) |
| 2,383.5 |
|
|
| 1,663.1 |
|
|
| 6,229.7 |
|
|
| 4,737.8 |
| |||||||||||||||
Product purchases |
| 1,328.1 |
|
|
| 2,383.5 |
|
|
| 4,415.7 |
|
|
| 6,229.7 |
| |||||||||||||||
Operating expenses |
| 194.9 |
|
|
| 155.5 |
|
|
| 538.7 |
|
|
| 462.6 |
|
| 200.2 |
|
|
| 194.9 |
|
|
| 600.7 |
|
|
| 538.7 |
|
Depreciation and amortization expense |
| 206.3 |
|
|
| 208.3 |
|
|
| 607.1 |
|
|
| 602.8 |
|
| 244.3 |
|
|
| 206.3 |
|
|
| 718.9 |
|
|
| 607.1 |
|
General and administrative expense |
| 59.3 |
|
|
| 46.6 |
|
|
| 165.0 |
|
|
| 139.4 |
|
| 65.6 |
|
|
| 59.3 |
|
|
| 212.3 |
|
|
| 165.0 |
|
Impairment of property, plant and equipment |
| — |
|
|
| 378.0 |
|
|
| — |
|
|
| 378.0 |
| |||||||||||||||
Other operating (income) expense |
| 61.8 |
|
|
| 0.6 |
|
|
| 15.7 |
|
|
| 17.2 |
|
| 18.4 |
|
|
| 61.8 |
|
|
| 21.7 |
|
|
| 15.7 |
|
Income (loss) from operations |
| 80.6 |
|
|
| (320.3 | ) |
|
| 330.1 |
|
|
| (225.7 | ) |
| 45.9 |
|
|
| 80.6 |
|
|
| 227.9 |
|
|
| 330.1 |
|
Other income (expense): |
|
|
|
|
|
|
|
|
|
|
|
|
|
|
|
|
|
|
|
|
|
|
|
|
|
|
|
|
|
|
Interest expense, net |
| (75.7 | ) |
|
| (51.9 | ) |
|
| (113.3 | ) |
|
| (169.5 | ) |
| (84.2 | ) |
|
| (75.7 | ) |
|
| (229.2 | ) |
|
| (113.3 | ) |
Equity earnings (loss) |
| 3.0 |
|
|
| 0.2 |
|
|
| 6.4 |
|
|
| (16.6 | ) |
| 10.0 |
|
|
| 3.0 |
|
|
| 15.9 |
|
|
| 6.4 |
|
Gain (loss) from financing activities |
| — |
|
|
| — |
|
|
| (1.3 | ) |
|
| (10.7 | ) |
| — |
|
|
| — |
|
|
| (1.4 | ) |
|
| (1.3 | ) |
Gain (loss) from sale of equity-method investment |
| 65.8 |
|
|
| — |
|
|
| 65.8 |
|
|
| — |
| |||||||||||||||
Change in contingent considerations |
| (16.6 | ) |
|
| 126.8 |
|
|
| (12.1 | ) |
|
| 125.6 |
|
| — |
|
|
| (16.6 | ) |
|
| (8.8 | ) |
|
| (12.1 | ) |
Other, net |
| — |
|
|
| 0.2 |
|
|
| — |
|
|
| (2.7 | ) | |||||||||||||||
Income (loss) before income taxes |
| (8.7 | ) |
|
| (245.0 | ) |
|
| 209.8 |
|
|
| (299.6 | ) |
| 37.5 |
|
|
| (8.7 | ) |
|
| 70.2 |
|
|
| 209.8 |
|
Income tax (expense) benefit |
| — |
|
|
| — |
|
|
| — |
|
|
| 4.2 |
|
| — |
|
|
| — |
|
|
| — |
|
|
| — |
|
Net income (loss) |
| (8.7 | ) |
|
| (245.0 | ) |
|
| 209.8 |
|
|
| (295.4 | ) |
| 37.5 |
|
|
| (8.7 | ) |
|
| 70.2 |
|
|
| 209.8 |
|
Less: Net income (loss) attributable to noncontrolling interests |
| 9.7 |
|
|
| 9.7 |
|
|
| 32.0 |
|
|
| 25.9 |
|
| 76.6 |
|
|
| 9.7 |
|
|
| 144.3 |
|
|
| 32.0 |
|
Net income (loss) attributable to Targa Resources Partners LP | $ | (18.4 | ) |
| $ | (254.7 | ) |
| $ | 177.8 |
|
| $ | (321.3 | ) | $ | (39.1 | ) |
| $ | (18.4 | ) |
| $ | (74.1 | ) |
| $ | 177.8 |
|
|
|
|
|
|
|
|
|
|
|
|
|
|
|
|
|
|
|
|
|
|
|
|
|
|
|
|
|
|
|
|
Net income attributable to preferred limited partners | $ | 2.8 |
|
| $ | 2.8 |
|
| $ | 8.4 |
|
| $ | 8.4 |
| $ | 2.8 |
|
| $ | 2.8 |
|
| $ | 8.4 |
|
| $ | 8.4 |
|
Net income (loss) attributable to general partner |
| (0.4 | ) |
|
| (5.2 | ) |
|
| 3.4 |
|
|
| (6.6 | ) |
| (0.9 | ) |
|
| (0.4 | ) |
|
| (1.7 | ) |
|
| 3.4 |
|
Net income (loss) attributable to common limited partners |
| (20.8 | ) |
|
| (252.3 | ) |
|
| 166.0 |
|
|
| (323.1 | ) |
| (41.0 | ) |
|
| (20.8 | ) |
|
| (80.8 | ) |
|
| 166.0 |
|
Net income (loss) attributable to Targa Resources Partners LP | $ | (18.4 | ) |
| $ | (254.7 | ) |
| $ | 177.8 |
|
| $ | (321.3 | ) | $ | (39.1 | ) |
| $ | (18.4 | ) |
| $ | (74.1 | ) |
| $ | 177.8 |
|
See notes to consolidated financial statements.
TARGA RESOURCESRESOURCES PARTNERS LP
CONSOLIDATED STATEMENTS OF COMPREHENSIVE INCOME (LOSS)
|
| Three Months Ended September 30, |
|
| Nine Months Ended September 30, |
|
| Three Months Ended September 30, |
|
| Nine Months Ended September 30, |
| ||||||||||||||||||||
|
| 2018 |
|
| 2017 |
|
| 2018 |
|
| 2017 |
|
| 2019 |
|
| 2018 |
|
| 2019 |
|
| 2018 |
| ||||||||
|
| (Unaudited) |
|
| (Unaudited) |
| ||||||||||||||||||||||||||
|
| (In millions) |
|
| (In millions) |
| ||||||||||||||||||||||||||
Net income (loss) |
| $ | (8.7 | ) |
| $ | (245.0 | ) |
| $ | 209.8 |
|
| $ | (295.4 | ) |
| $ | 37.5 |
|
| $ | (8.7 | ) |
| $ | 70.2 |
|
| $ | 209.8 |
|
Other comprehensive income (loss): |
|
|
|
|
|
|
|
|
|
|
|
|
|
|
|
|
|
|
|
|
|
|
|
|
|
|
|
|
|
|
|
|
Commodity hedging contracts: |
|
|
|
|
|
|
|
|
|
|
|
|
|
|
|
|
|
|
|
|
|
|
|
|
|
|
|
|
|
|
|
|
Change in fair value |
|
| (139.6 | ) |
|
| (106.8 | ) |
|
| (178.0 | ) |
|
| (10.5 | ) |
|
| 118.2 |
|
|
| (139.6 | ) |
|
| 167.8 |
|
|
| (178.0 | ) |
Settlements reclassified to revenues |
|
| 23.9 |
|
|
| 2.1 |
|
|
| 58.3 |
|
|
| 2.2 |
|
|
| (41.5 | ) |
|
| 23.9 |
|
|
| (106.1 | ) |
|
| 58.3 |
|
Other comprehensive income (loss) |
|
| (115.7 | ) |
|
| (104.7 | ) |
|
| (119.7 | ) |
|
| (8.3 | ) |
|
| 76.7 |
|
|
| (115.7 | ) |
|
| 61.7 |
|
|
| (119.7 | ) |
Comprehensive income (loss) |
|
| (124.4 | ) |
|
| (349.7 | ) |
|
| 90.1 |
|
|
| (303.7 | ) |
|
| 114.2 |
|
|
| (124.4 | ) |
|
| 131.9 |
|
|
| 90.1 |
|
Less: Comprehensive income (loss) attributable to noncontrolling interests |
|
| 9.7 |
|
|
| 9.7 |
|
|
| 32.0 |
|
|
| 25.9 |
|
|
| 76.6 |
|
|
| 9.7 |
|
|
| 144.3 |
|
|
| 32.0 |
|
Comprehensive income (loss) attributable to Targa Resources Partners LP |
| $ | (134.1 | ) |
| $ | (359.4 | ) |
| $ | 58.1 |
|
| $ | (329.6 | ) |
| $ | 37.6 |
|
| $ | (134.1 | ) |
| $ | (12.4 | ) |
| $ | 58.1 |
|
See notes to consolidated financial statements.
CONSOLIDATED STATEMENTS OF CHANGES IN OWNERS' EQUITY
|
|
|
|
|
|
|
|
|
|
|
|
|
|
|
|
|
|
|
|
|
|
|
|
|
|
| Accumulated |
|
|
|
|
|
|
|
|
| |
|
| Limited |
|
| Limited |
|
| General |
|
|
| Other |
|
| Non- |
|
|
|
|
| |||||||||||||||||
|
| Partner |
|
| Partner |
|
| Partner |
|
|
| Comprehensive |
|
| controlling |
|
|
|
|
| |||||||||||||||||
|
| Preferred |
|
| Amount |
|
| Common |
|
| Amount |
|
| Units |
|
| Amount |
|
|
| Income (Loss) |
|
| Interests |
|
| Total |
| |||||||||
|
| (Unaudited) |
| ||||||||||||||||||||||||||||||||||
|
| (In millions, except units in thousands) |
| ||||||||||||||||||||||||||||||||||
|
|
|
|
|
|
|
|
|
|
|
|
|
|
|
|
|
|
|
|
|
|
|
|
|
|
|
|
|
|
|
|
|
|
|
|
|
|
Balance, December 31, 2017 |
|
| 5,000 |
|
| $ | 120.6 |
|
|
| 275,168 |
|
| $ | 6,500.3 |
|
|
| 5,629 |
|
| $ | 808.2 |
|
|
| $ | (46.0 | ) |
| $ | 475.1 |
|
| $ | 7,858.2 |
|
Contributions from Targa Resources Corp. |
|
| — |
|
|
| — |
|
|
| — |
|
|
| 529.2 |
|
|
| — |
|
|
| 10.8 |
|
|
|
| — |
|
|
| — |
|
|
| 540.0 |
|
Acquisition of related party (see Note 14) |
|
| — |
|
|
| — |
|
|
| — |
|
|
| — |
|
|
| — |
|
|
| — |
|
|
|
| — |
|
|
| 1.1 |
|
|
| 1.1 |
|
Distributions to noncontrolling interests |
|
| — |
|
|
| — |
|
|
| — |
|
|
| — |
|
|
| — |
|
|
| — |
|
|
|
| — |
|
|
| (51.5 | ) |
|
| (51.5 | ) |
Contributions from noncontrolling interests |
|
| — |
|
|
| — |
|
|
| — |
|
|
| — |
|
|
| — |
|
|
| — |
|
|
|
| — |
|
|
| 611.6 |
|
|
| 611.6 |
|
Purchase of noncontrolling interests in subsidiary |
|
| — |
|
|
| — |
|
|
| — |
|
|
| — |
|
|
| — |
|
|
| — |
|
|
|
| — |
|
|
| (0.1 | ) |
|
| (0.1 | ) |
Other comprehensive income (loss) |
|
| — |
|
|
| — |
|
|
| — |
|
|
| — |
|
|
| — |
|
|
| — |
|
|
|
| (119.7 | ) |
|
| — |
|
|
| (119.7 | ) |
Net income (loss) |
|
| — |
|
| 8.4 |
|
|
| — |
|
|
| 166.0 |
|
|
| — |
|
|
| 3.4 |
|
|
|
| — |
|
|
| 32.0 |
|
|
| 209.8 |
| |
Distributions |
|
| — |
|
|
| (8.4 | ) |
|
| — |
|
|
| (670.0 | ) |
|
| — |
|
|
| (13.7 | ) |
|
|
| — |
|
|
| — |
|
|
| (692.1 | ) |
Balance, September 30, 2018 |
|
| 5,000 |
|
| $ | 120.6 |
|
|
| 275,168 |
|
| $ | 6,525.5 |
|
|
| 5,629 |
|
| $ | 808.7 |
|
|
| $ | (165.7 | ) |
| $ | 1,068.2 |
|
| $ | 8,357.3 |
|
|
|
|
|
|
|
|
|
|
|
|
|
|
|
|
|
|
|
|
|
|
|
|
|
|
| Accumulated |
|
|
|
|
|
|
|
|
| |
|
| Limited |
|
| Limited |
|
| General |
|
| Other |
|
| Non- |
|
|
|
|
| |||||||||||||||||
|
| Partner |
|
| Partner |
|
| Partner |
|
| Comprehensive |
|
| controlling |
|
|
|
|
| |||||||||||||||||
|
| Preferred |
|
| Amount |
|
| Common |
|
| Amount |
|
| Units |
|
| Amount |
|
| Income (Loss) |
|
| Interests |
|
| Total |
| |||||||||
|
| (Unaudited) |
| |||||||||||||||||||||||||||||||||
|
| (In millions, except units in thousands) |
| |||||||||||||||||||||||||||||||||
|
|
|
|
|
|
|
|
|
|
|
|
|
|
|
|
|
|
|
|
|
|
|
|
|
|
|
|
|
|
|
|
|
|
|
|
|
Balance, June 30, 2019 |
|
| 5,000 |
|
| $ | 120.6 |
|
|
| 275,168 |
|
| $ | 5,703.1 |
|
|
| 5,629 |
|
| $ | 791.9 |
|
| $ | 109.9 |
|
| $ | 3,276.2 |
|
| $ | 10,001.7 |
|
Contributions from Targa Resources Corp. |
|
| — |
|
|
| — |
|
|
| — |
|
|
| 9.8 |
|
|
| — |
|
|
| 0.2 |
|
|
| — |
|
|
| — |
|
|
| 10.0 |
|
Sale of ownership interests in subsidiaries |
|
| — |
|
|
| — |
|
|
| — |
|
|
| — |
|
|
| — |
|
|
| — |
|
|
| — |
|
|
| — |
|
|
| — |
|
Distributions to noncontrolling interests |
|
| — |
|
|
| — |
|
|
| — |
|
|
| — |
|
|
| — |
|
|
| — |
|
|
| — |
|
|
| (87.2 | ) |
|
| (87.2 | ) |
Contributions from noncontrolling interests |
|
| — |
|
|
| — |
|
|
| — |
|
|
| — |
|
|
| — |
|
|
| — |
|
|
| — |
|
|
| 115.3 |
|
|
| 115.3 |
|
Other comprehensive income (loss) |
|
| — |
|
|
| — |
|
|
| — |
|
|
| — |
|
|
| — |
|
|
| — |
|
|
| 76.7 |
|
|
| — |
|
|
| 76.7 |
|
Net income (loss) |
|
| — |
|
|
| 2.8 |
|
|
| — |
|
|
| (41.0 | ) |
|
| — |
|
|
| (0.9 | ) |
|
| — |
|
|
| 76.6 |
|
|
| 37.5 |
|
Distributions |
|
| — |
|
|
| (2.8 | ) |
|
| — |
|
|
| (234.8 | ) |
|
| — |
|
|
| (4.8 | ) |
|
| — |
|
|
| — |
|
|
| (242.4 | ) |
Balance, September 30, 2019 |
|
| 5,000 |
|
| $ | 120.6 |
|
|
| 275,168 |
|
| $ | 5,437.1 |
|
|
| 5,629 |
|
| $ | 786.4 |
|
| $ | 186.6 |
|
| $ | 3,380.9 |
|
| $ | 9,911.6 |
|
|
|
|
|
|
|
|
|
|
|
|
|
|
|
|
|
|
|
|
|
|
|
|
|
|
| Accumulated |
|
|
|
|
|
|
|
|
| |
|
| Limited |
|
| Limited |
|
| General |
|
| Other |
|
| Non- |
|
|
|
|
| |||||||||||||||||
|
| Partner |
|
| Partner |
|
| Partner |
|
| Comprehensive |
|
| controlling |
|
|
|
|
| |||||||||||||||||
|
| Preferred |
|
| Amount |
|
| Common |
|
| Amount |
|
| Units |
|
| Amount |
|
| Income (Loss) |
|
| Interests |
|
| Total |
| |||||||||
|
| (Unaudited) |
| |||||||||||||||||||||||||||||||||
|
| (In millions, except units in thousands) |
| |||||||||||||||||||||||||||||||||
|
|
|
|
|
|
|
|
|
|
|
|
|
|
|
|
|
|
|
|
|
|
|
|
|
|
|
|
|
|
|
|
|
|
|
|
|
Balance, June 30, 2018 |
|
| 5,000 |
|
| $ | 120.6 |
|
|
| 275,168 |
|
| $ | 6,322.2 |
|
|
| 5,629 |
|
| $ | 804.5 |
|
| $ | (49.9 | ) |
| $ | 911.8 |
|
| $ | 8,109.2 |
|
Contributions from Targa Resources Corp. |
|
| — |
|
|
| — |
|
|
| — |
|
|
| 450.6 |
|
|
| — |
|
|
| 9.2 |
|
|
| — |
|
|
| — |
|
|
| 459.8 |
|
Acquisition of related party |
|
| — |
|
|
| — |
|
|
| — |
|
|
| — |
|
|
| — |
|
|
| — |
|
|
| — |
|
|
| — |
|
|
| — |
|
Purchase of noncontrolling interests in subsidiaries, net |
|
| — |
|
|
| — |
|
|
| — |
|
|
| — |
|
|
| — |
|
|
| — |
|
|
| — |
|
|
| — |
|
|
| — |
|
Distributions to noncontrolling interests |
|
| — |
|
|
| — |
|
|
| — |
|
|
| — |
|
|
| — |
|
|
| — |
|
|
| — |
|
|
| (17.7 | ) |
|
| (17.7 | ) |
Contributions from noncontrolling interests |
|
| — |
|
|
| — |
|
|
| — |
|
|
| — |
|
|
| — |
|
|
| — |
|
|
| — |
|
|
| 164.4 |
|
|
| 164.4 |
|
Other comprehensive income (loss) |
|
| — |
|
|
| — |
|
|
| — |
|
|
| — |
|
|
| — |
|
|
| — |
|
|
| (115.8 | ) |
|
| — |
|
|
| (115.8 | ) |
Net income (loss) |
|
| — |
|
|
| 2.8 |
|
|
| — |
|
|
| (20.8 | ) |
|
| — |
|
|
| (0.4 | ) |
|
| — |
|
|
| 9.7 |
|
|
| (8.7 | ) |
Distributions |
|
| — |
|
|
| (2.8 | ) |
|
| — |
|
|
| (226.5 | ) |
|
| — |
|
|
| (4.6 | ) |
|
| — |
|
|
| — |
|
|
| (233.9 | ) |
Balance, September 30, 2018 |
|
| 5,000 |
|
| $ | 120.6 |
|
|
| 275,168 |
|
| $ | 6,525.5 |
|
|
| 5,629 |
|
| $ | 808.7 |
|
| $ | (165.7 | ) |
| $ | 1,068.2 |
|
| $ | 8,357.3 |
|
See notes to consolidated financial statements.
TARGA RESOURCES PARTNERS LP
CONSOLIDATED STATEMENTS OF CHANGES IN OWNERS' EQUITY
|
|
|
|
|
|
|
|
|
|
|
|
|
|
|
|
|
|
|
|
|
|
|
|
|
| Accumulated |
|
|
|
|
|
|
|
|
| |
|
| Limited |
|
| Limited |
|
| General |
|
| Other |
|
| Non- |
|
|
|
|
| |||||||||||||||||
|
| Partner |
|
| Partner |
|
| Partner |
|
| Comprehensive |
|
| controlling |
|
|
|
|
| |||||||||||||||||
|
| Preferred |
|
| Amount |
|
| Common |
|
| Amount |
|
| Units |
|
| Amount |
|
| Income (Loss) |
|
| Interests |
|
| Total |
| |||||||||
|
| (Unaudited) |
| |||||||||||||||||||||||||||||||||
|
| (In millions, except units in thousands) |
| |||||||||||||||||||||||||||||||||
|
|
|
|
|
|
|
|
|
|
|
|
|
|
|
|
|
|
|
|
|
|
|
|
|
|
|
|
|
|
|
|
|
|
|
|
|
Balance, December 31, 2018 |
|
| 5,000 |
|
| $ | 120.6 |
|
|
| 275,168 |
|
| $ | 6,227.2 |
|
|
| 5,629 |
|
| $ | 802.6 |
|
| $ | 124.9 |
|
| $ | 1,270.8 |
|
| $ | 8,546.1 |
|
Contributions from Targa Resources Corp. |
|
| — |
|
|
| — |
|
|
| — |
|
|
| 196.0 |
|
|
| — |
|
|
| 4.0 |
|
|
| — |
|
|
| — |
|
|
| 200.0 |
|
Sale of ownership interests in subsidiaries |
|
| — |
|
|
| — |
|
|
| — |
|
|
| (10.5 | ) |
|
| — |
|
|
| (0.2 | ) |
|
| — |
|
|
| 1,619.7 |
|
|
| 1,609.0 |
|
Distributions to noncontrolling interests |
|
| — |
|
|
| — |
|
|
| — |
|
|
| — |
|
|
| — |
|
|
| — |
|
|
| — |
|
|
| (172.6 | ) |
|
| (172.6 | ) |
Contributions from noncontrolling interests |
|
| — |
|
|
| — |
|
|
| — |
|
|
| — |
|
|
| — |
|
|
| — |
|
|
| — |
|
|
| 518.7 |
|
|
| 518.7 |
|
Other comprehensive income (loss) |
|
| — |
|
|
| — |
|
|
| — |
|
|
| — |
|
|
| — |
|
|
| — |
|
|
| 61.7 |
|
|
| — |
|
|
| 61.7 |
|
Net income (loss) |
|
| — |
|
| 8.4 |
|
|
| — |
|
|
| (80.8 | ) |
|
| — |
|
|
| (1.7 | ) |
|
| — |
|
|
| 144.3 |
|
|
| 70.2 |
| |
Distributions |
|
| — |
|
|
| (8.4 | ) |
|
| — |
|
|
| (894.8 | ) |
|
| — |
|
|
| (18.3 | ) |
|
| — |
|
|
| — |
|
|
| (921.5 | ) |
Balance, September 30, 2019 |
|
| 5,000 |
|
| $ | 120.6 |
|
|
| 275,168 |
|
| $ | 5,437.1 |
|
|
| 5,629 |
|
| $ | 786.4 |
|
| $ | 186.6 |
|
| $ | 3,380.9 |
|
| $ | 9,911.6 |
|
|
|
|
|
|
|
|
|
|
|
|
|
|
|
|
|
|
|
|
|
|
|
|
|
|
|
|
|
|
|
|
|
|
|
|
|
|
|
|
|
|
|
|
|
|
|
|
|
|
|
|
|
|
|
|
|
|
|
|
|
|
|
| Accumulated |
|
|
|
|
|
|
|
|
| |
|
| Limited |
|
| Limited |
|
| General |
|
| Other |
|
| Non- |
|
|
|
|
| |||||||||||||||||
|
| Partner |
|
| Partner |
|
| Partner |
|
| Comprehensive |
|
| controlling |
|
|
|
|
| |||||||||||||||||
|
| Preferred |
|
| Amount |
|
| Common |
|
| Amount |
|
| Units |
|
| Amount |
|
| Income (Loss) |
|
| Interests |
|
| Total |
| |||||||||
|
| (Unaudited) |
| |||||||||||||||||||||||||||||||||
|
| (In millions, except units in thousands) |
| |||||||||||||||||||||||||||||||||
Balance, December 31, 2016 |
|
| 5,000 |
|
| $ | 120.6 |
|
|
| 275,168 |
|
| $ | 5,939.9 |
|
|
| 5,629 |
|
| $ | 796.7 |
|
| $ | (61.8 | ) |
| $ | 355.2 |
|
| $ | 7,150.6 |
|
Contributions from Targa Resources Corp. |
|
| — |
|
|
| — |
|
|
| — |
|
|
| 1,587.5 |
|
|
| — |
|
|
| 32.5 |
|
|
| — |
|
|
| — |
|
|
| 1,620.0 |
|
Purchase of noncontrolling interests in subsidiary |
|
| — |
|
|
| — |
|
|
| — |
|
|
| — |
|
|
| — |
|
|
| — |
|
|
| — |
|
|
| (12.5 | ) |
|
| (12.5 | ) |
Distributions to noncontrolling interests |
|
| — |
|
|
| — |
|
|
| — |
|
|
| — |
|
|
| — |
|
|
| — |
|
|
| — |
|
|
| (33.4 | ) |
|
| (33.4 | ) |
Contributions from noncontrolling interests |
|
| — |
|
|
| — |
|
|
| — |
|
|
| — |
|
|
| — |
|
|
| — |
|
|
| — |
|
|
| 93.8 |
|
|
| 93.8 |
|
Other comprehensive income (loss) |
|
| — |
|
|
| — |
|
|
| — |
|
|
| — |
|
|
| — |
|
|
| — |
|
|
| (8.3 | ) |
|
| — |
|
|
| (8.3 | ) |
Net income (loss) |
|
| — |
|
|
| 8.4 |
|
|
| — |
|
|
| (323.1 | ) |
|
| — |
|
|
| (6.6 | ) |
|
| — |
|
|
| 25.9 |
|
|
| (295.4 | ) |
Distributions |
|
| — |
|
|
| (8.4 | ) |
|
| — |
|
|
| (612.2 | ) |
|
| — |
|
|
| (12.5 | ) |
|
| — |
|
|
| — |
|
|
| (633.1 | ) |
Balance, September 30, 2017 |
|
| 5,000 |
|
| $ | 120.6 |
|
|
| 275,168 |
|
| $ | 6,592.1 |
|
|
| 5,629 |
|
| $ | 810.1 |
|
| $ | (70.1 | ) |
| $ | 429.0 |
|
| $ | 7,881.7 |
|
|
|
|
|
|
|
|
|
|
|
|
|
|
|
|
|
|
|
|
|
|
|
|
|
|
|
|
|
|
|
|
|
|
|
|
|
|
|
|
|
|
|
|
|
|
|
|
|
|
|
|
|
|
|
|
|
|
|
|
|
|
|
| Accumulated |
|
|
|
|
|
|
|
|
| |
|
| Limited |
|
| Limited |
|
| General |
|
| Other |
|
| Non- |
|
|
|
|
| |||||||||||||||||
|
| Partner |
|
| Partner |
|
| Partner |
|
| Comprehensive |
|
| controlling |
|
|
|
|
| |||||||||||||||||
|
| Preferred |
|
| Amount |
|
| Common |
|
| Amount |
|
| Units |
|
| Amount |
|
| Income (Loss) |
|
| Interests |
|
| Total |
| |||||||||
|
| (Unaudited) |
| |||||||||||||||||||||||||||||||||
|
| (In millions, except units in thousands) |
| |||||||||||||||||||||||||||||||||
|
|
|
|
|
|
|
|
|
|
|
|
|
|
|
|
|
|
|
|
|
|
|
|
|
|
|
|
|
|
|
|
|
|
|
|
|
Balance, December 31, 2017 |
|
| 5,000 |
|
| $ | 120.6 |
|
|
| 275,168 |
|
| $ | 6,500.3 |
|
|
| 5,629 |
|
| $ | 808.2 |
|
| $ | (46.0 | ) |
| $ | 475.1 |
|
| $ | 7,858.2 |
|
Contributions from Targa Resources Corp. |
|
| — |
|
|
| — |
|
|
| — |
|
|
| 529.2 |
|
|
| — |
|
|
| 10.8 |
|
|
| — |
|
|
| — |
|
|
| 540.0 |
|
Acquisition of related party |
|
| — |
|
|
| — |
|
|
| — |
|
|
| — |
|
|
| — |
|
|
| — |
|
|
| — |
|
|
| 1.1 |
|
|
| 1.1 |
|
Purchase of noncontrolling interests in subsidiaries, net |
|
| — |
|
|
| — |
|
|
| — |
|
|
| — |
|
|
| — |
|
|
| — |
|
|
| — |
|
|
| (0.1 | ) |
|
| (0.1 | ) |
Distributions to noncontrolling interests |
|
| — |
|
|
| — |
|
|
| — |
|
|
| — |
|
|
| — |
|
|
| — |
|
|
| — |
|
|
| (51.5 | ) |
|
| (51.5 | ) |
Contributions from noncontrolling interests |
|
| — |
|
|
| — |
|
|
| — |
|
|
| — |
|
|
| — |
|
|
| — |
|
|
| — |
|
|
| 611.6 |
|
|
| 611.6 |
|
Other comprehensive income (loss) |
|
| — |
|
|
| — |
|
|
| — |
|
|
| — |
|
|
| — |
|
|
| — |
|
|
| (119.7 | ) |
|
| — |
|
|
| (119.7 | ) |
Net income (loss) |
|
| — |
|
|
| 8.4 |
|
|
| — |
|
|
| 166.0 |
|
|
| — |
|
|
| 3.4 |
|
|
| — |
|
|
| 32.0 |
|
|
| 209.8 |
|
Distributions |
|
| — |
|
|
| (8.4 | ) |
|
| — |
|
|
| (670.0 | ) |
|
| — |
|
|
| (13.7 | ) |
|
| — |
|
|
| — |
|
|
| (692.1 | ) |
Balance, September 30, 2018 |
|
| 5,000 |
|
| $ | 120.6 |
|
|
| 275,168 |
|
| $ | 6,525.5 |
|
|
| 5,629 |
|
| $ | 808.7 |
|
| $ | (165.7 | ) |
| $ | 1,068.2 |
|
| $ | 8,357.3 |
|
See notes to consolidated financial statements.
CONSOLIDATED STATEMENTS OF CASH FLOWS
|
| Nine Months Ended September 30, |
| |||||||||||||||||
|
|
| 2018 |
|
| 2017 |
|
| Nine Months Ended September 30, |
| ||||||||||
|
|
|
|
|
|
|
|
|
|
|
| 2019 |
|
|
| 2018 |
| |||
|
| (Unaudited) |
| (Unaudited) |
| |||||||||||||||
|
| (In millions) |
| (In millions) |
| |||||||||||||||
Cash flows from operating activities | Cash flows from operating activities |
|
|
|
|
|
|
|
|
|
|
|
|
|
|
|
|
| ||
Net income (loss) | Net income (loss) |
| $ | 209.8 |
|
| $ | (295.4 | ) |
| $ | 70.2 |
|
|
| $ | 209.8 |
| ||
Adjustments to reconcile net income (loss) to net cash provided by operating activities: | Adjustments to reconcile net income (loss) to net cash provided by operating activities: |
|
|
|
|
|
|
|
|
|
|
|
|
|
|
|
|
| ||
Amortization in interest expense | Amortization in interest expense |
|
| 6.8 |
|
|
| 7.1 |
|
|
| 6.8 |
|
|
|
| 6.8 |
| ||
Depreciation and amortization expense | Depreciation and amortization expense |
|
| 607.1 |
|
|
| 602.8 |
|
|
| 718.9 |
|
|
|
| 607.1 |
| ||
Impairment of property, plant and equipment |
|
| — |
|
|
| 378.0 |
| ||||||||||||
Accretion of asset retirement obligations | Accretion of asset retirement obligations |
|
| 2.8 |
|
|
| 3.0 |
|
|
| 3.7 |
|
|
|
| 2.8 |
| ||
Increase (decrease) in redemption value of mandatorily redeemable preferred interests | Increase (decrease) in redemption value of mandatorily redeemable preferred interests |
|
| (66.3 | ) |
|
| 8.5 |
|
|
| — |
|
|
|
| (66.3 | ) | ||
Equity (earnings) loss of unconsolidated affiliates | Equity (earnings) loss of unconsolidated affiliates |
|
| (6.4 | ) |
|
| 16.6 |
|
|
| (15.9 | ) |
|
|
| (6.4 | ) | ||
Distributions of earnings received from unconsolidated affiliates | Distributions of earnings received from unconsolidated affiliates |
|
| 16.0 |
|
|
| 8.4 |
|
|
| 26.0 |
|
|
|
| 16.0 |
| ||
Risk management activities | Risk management activities |
|
| 9.6 |
|
|
| 7.3 |
|
|
| 100.8 |
|
|
|
| 9.6 |
| ||
(Gain) loss on sale or disposition of assets | (Gain) loss on sale or disposition of assets |
|
| 14.3 |
|
|
| 16.6 |
|
|
| 3.6 |
|
|
|
| 14.3 |
| ||
Write-down of assets |
|
| 17.9 |
|
|
|
| — |
| |||||||||||
(Gain) loss from financing activities | (Gain) loss from financing activities |
|
| 1.3 |
|
|
| 10.7 |
|
|
| 1.4 |
|
|
|
| 1.3 |
| ||
Change in contingent considerations included in Other expense (income) |
|
| 12.1 |
|
|
| (125.6 | ) | ||||||||||||
(Gain) loss from sale of equity-method investment |
|
| (65.8 | ) |
|
|
| — |
| |||||||||||
Change in contingent considerations |
|
| 8.8 |
|
|
|
| 12.1 |
| |||||||||||
Changes in operating assets and liabilities, net of business acquisitions: | Changes in operating assets and liabilities, net of business acquisitions: |
|
|
|
|
|
|
|
|
|
|
|
|
|
|
|
|
| ||
Receivables and other assets | Receivables and other assets |
|
| (221.7 | ) |
|
| (91.5 | ) |
|
| 108.0 |
|
|
|
| (221.7 | ) | ||
Inventories | Inventories |
|
| (16.6 | ) |
|
| (136.4 | ) |
|
| (89.7 | ) |
|
|
| (16.6 | ) | ||
Accounts payable and other liabilities | Accounts payable and other liabilities |
|
| 374.7 |
|
|
| 53.1 |
|
|
| 2.7 |
|
|
|
| 374.7 |
| ||
Net cash provided by operating activities | Net cash provided by operating activities |
|
| 943.5 |
|
|
| 463.2 |
|
|
| 897.4 |
|
|
|
| 943.5 |
| ||
Cash flows from investing activities | Cash flows from investing activities |
|
|
|
|
|
|
|
|
|
|
|
|
|
|
|
|
| ||
Outlays for property, plant and equipment | Outlays for property, plant and equipment |
|
| (2,033.6 | ) |
|
| (866.6 | ) |
|
| (2,433.8 | ) |
|
|
| (2,033.6 | ) | ||
Outlays for business acquisition, net of cash acquired |
|
| — |
|
|
| (570.8 | ) | ||||||||||||
Proceeds from sale of assets | Proceeds from sale of assets |
|
| 71.5 |
|
|
| — |
|
|
| 2.7 |
|
|
|
| 71.5 |
| ||
Investments in unconsolidated affiliates | Investments in unconsolidated affiliates |
|
| (223.7 | ) |
|
| (7.5 | ) |
|
| (243.7 | ) |
|
|
| (223.7 | ) | ||
Proceeds from sale of equity-method investment |
|
| 70.3 |
|
|
|
| — |
| |||||||||||
Return of capital from unconsolidated affiliates | Return of capital from unconsolidated affiliates |
|
| 2.2 |
|
|
| 2.2 |
|
|
| 1.1 |
|
|
|
| 2.2 |
| ||
Other, net | Other, net |
|
| (9.2 | ) |
|
| (14.8 | ) |
|
| (16.3 | ) |
|
|
| (9.2 | ) | ||
Net cash used in investing activities | Net cash used in investing activities |
|
| (2,192.8 | ) |
|
| (1,457.5 | ) |
|
| (2,619.7 | ) |
|
|
| (2,192.8 | ) | ||
Cash flows from financing activities | Cash flows from financing activities |
|
|
|
|
|
|
|
|
|
|
|
|
|
|
|
|
| ||
Debt obligations: | Debt obligations: |
|
|
|
|
|
|
|
|
|
|
|
|
|
|
|
|
| ||
Proceeds from borrowings under credit facility | Proceeds from borrowings under credit facility |
|
| 950.0 |
|
|
| 1,496.0 |
|
|
| 2,180.0 |
|
|
|
| 950.0 |
| ||
Repayments of credit facility | Repayments of credit facility |
|
| (970.0 | ) |
|
| (1,216.0 | ) |
|
| (2,050.0 | ) |
|
|
| (970.0 | ) | ||
Proceeds from borrowings under accounts receivable securitization facility | Proceeds from borrowings under accounts receivable securitization facility |
|
| 440.0 |
|
|
| 281.6 |
|
|
| 770.0 |
|
|
|
| 440.0 |
| ||
Repayments of accounts receivable securitization facility | Repayments of accounts receivable securitization facility |
|
| (500.0 | ) |
|
| (278.5 | ) |
|
| (804.0 | ) |
|
|
| (500.0 | ) | ||
Proceeds from issuance of senior notes | Proceeds from issuance of senior notes |
|
| 1,000.0 |
|
|
| — |
|
|
| 1,500.0 |
|
|
|
| 1,000.0 |
| ||
Redemption of senior notes | Redemption of senior notes |
|
| — |
|
|
| (287.6 | ) |
|
| (749.4 | ) |
|
|
| — |
| ||
Principal payments of finance leases |
|
| (8.5 | ) |
|
|
| — |
| |||||||||||
Costs incurred in connection with financing arrangements | Costs incurred in connection with financing arrangements |
|
| (15.8 | ) |
|
| (0.1 | ) |
|
| (25.1 | ) |
|
|
| (15.8 | ) | ||
Purchase of noncontrolling interests in subsidiary |
|
| (0.1 | ) |
|
| (12.5 | ) | ||||||||||||
Payment of contingent consideration |
|
| (317.1 | ) |
|
|
| — |
| |||||||||||
Sale of ownership interests in subsidiaries |
|
| 1,619.7 |
|
|
|
| (0.1 | ) | |||||||||||
Contributions from general partner | Contributions from general partner |
|
| 10.8 |
|
|
| 32.5 |
|
|
| 4.0 |
|
|
|
| 10.8 |
| ||
Contributions from TRC | Contributions from TRC |
|
| 529.2 |
|
|
| 1,587.5 |
|
|
| 196.0 |
|
|
|
| 529.2 |
| ||
Contributions from noncontrolling interests | Contributions from noncontrolling interests |
|
| 611.6 |
|
|
| 93.8 |
|
|
| 518.7 |
|
|
|
| 611.6 |
| ||
Distributions to noncontrolling interests | Distributions to noncontrolling interests |
|
| (51.5 | ) |
|
| (33.4 | ) |
|
| (98.9 | ) |
|
|
| (51.5 | ) | ||
Distributions to unitholders | Distributions to unitholders |
|
| (692.1 | ) |
|
| (633.1 | ) |
|
| (921.5 | ) |
|
|
| (692.1 | ) | ||
Net cash provided by (used in) financing activities |
|
| 1,312.1 |
|
|
| 1,030.2 |
| ||||||||||||
Net cash provided by financing activities |
|
| 1,813.9 |
|
|
|
| 1,312.1 |
| |||||||||||
Net change in cash and cash equivalents | Net change in cash and cash equivalents |
|
| 62.8 |
|
|
| 35.9 |
|
|
| 91.6 |
|
|
|
| 62.8 |
| ||
Cash and cash equivalents, beginning of period | Cash and cash equivalents, beginning of period |
|
| 124.7 |
|
|
| 68.0 |
|
|
| 203.3 |
|
|
|
| 124.7 |
| ||
Cash and cash equivalents, end of period | Cash and cash equivalents, end of period |
| $ | 187.5 |
|
| $ | 103.9 |
|
| $ | 294.9 |
|
|
| $ | 187.5 |
| ||
See notes to consolidated financial statements.
NOTES TO CONSOLIDATED FINANCIAL STATEMENTS
(Unaudited)
Except as noted within the context of each footnote disclosure, the dollar amounts presented in the tabular data within these footnote disclosures are stated in millions of dollars.
Note 1 — Organization and Operations
Our Organization
Targa Resources Partners LP is a Delaware limited partnership formed in October 2006 by our parent, Targa Resources Corp. (“Targa” or “TRC” or the “Company” or “Parent”). In this Quarterly Report, unless the context requires otherwise, references to “we,” “us,” “our,” “TRP,” or the “Partnership” are intended to mean the business and operations of Targa Resources Partners LP and its consolidated subsidiaries.
Our common units are wholly owned by TRC and no longer publicly traded as a result of TRC’s acquisition of our outstanding common units that it and its subsidiaries did not already own in 2016.
The 5,000,000 9.00% Series A Fixed-to-Floating Rate Cumulative Redeemable Perpetual Preferred Units (the “Preferred Units”) that were issued in October 2015 remain outstanding as limited partner interests in us and continue to trade on the NYSE under the symbol “NGLS PRA.“NGLS/PA.”
Our Operations
We are primarily engaged in the business of:
gathering, compressing, treating, processing and selling natural gas;
• | gathering, compressing, treating, processing, transporting and selling natural gas; |
storing, fractionating, treating, transporting and selling NGLs and NGL products, including services to LPG exporters;
• | transporting, storing, fractionating, treating and selling NGLs and NGL products, including services to LPG exporters; and |
gathering, storing, terminaling and selling crude oil; and
storing, terminaling and selling refined petroleum products.
• | gathering, storing, terminaling and selling crude oil. |
See Note 1920 – Segment Information for certain financial information regarding our business segments.
The employees supporting our operations are employed by Targa. Our consolidated financial statements include the direct costs of Targa employees deployed to our operating segments, as well as an allocation of costs associated with our usage of Targa’s centralized general and administrative services.
Note 2 — Basis of Presentation
We have prepared theseThe accompanying unaudited consolidated financial statements have been prepared in accordance with GAAP for interim financial information and with the instructions to Form 10-Q and Article 10 of Regulation S-X. Accordingly, they do not include all of the information and footnotes required by GAAP for complete financial statements. While we derived the year-end balance sheet data from audited financial statements, this interim report does not include all disclosures required by GAAP for annual periods. These unaudited consolidated financial statements and otherGAAP. Therefore, this information included in this Quarterly Report should be read in conjunction with our consolidated financial statements and notes thereto includedcontained in our Annual Report.
The unaudited consolidated financial statements for the three and nine months ended September 30, 2018 includeinformation furnished herein reflects all adjustments that we believe are, in the opinion of management, necessary for a fair statement of the results forof the interim periods.periods reported. All significant intercompany balances and transactions have been eliminated in consolidation. Certain amounts in prior periods may have been reclassified to conform to the current year presentation.
Our financial Operating results for the three and nine months ended September 30, 20182019, are not necessarily indicative of the results that may be expected for the full year.
Note 3 — Significant Accounting Policies
The accounting policies that we follow are set forth in Note 3 – Significant Accounting Policies of the Notes to Consolidated Financial Statements in our Annual Report. Other than the updates noted below, there were no significant updates or revisions to our accounting policies during the nine months ended September 30, 2019.
Recent Accounting Pronouncements
Recently issuedadopted accounting pronouncements not yet adopted
Leases
In February 2016, the Financial Accounting Standards Board (“FASB”) issued Accounting Standards Update (“ASU”) 2016-02, Leases (Topic 842). The amendments in this update require, among other items, that lessees recognizesupersede the following for all leases (withguidance in Topic 840. We adopted Topic 842 on January 1, 2019 by applying the exception of short-term leases) at the commencement date: (1) a lease liability, which is a lessee’s obligation to make lease payments arising from a lease, measured on a discounted basis; and (2) a right-of-use asset, which is an asset that represents the lessee’s right to use, or control the use of, a specified asset for the lease term. Lessees and lessors must apply a modified retrospective transition approach for leases existing at, or entered into after, the beginning of the earliest comparative period presented in the financial statements. These amendments are effective for fiscal years, and interim periods within those years, beginning after December 15, 2018, with early adoption permitted. We are currently monitoring recent exposure drafts and clarifications issued by the FASB.
In January 2018, the FASB issued ASU 2018-01, Leases (Topic 842): Land Easement Practical Expedient for Transition to Topic 842. The amendments in this update permit an entity to elect an optional transition practical expedient to not evaluate land easements that existed or expired before the entity’s adoption of Topic 842 and that were not previously accounted for as leases under Topic 840.
In July 2018, the FASB issued ASU 2018-10, Codification Improvements to Topic 842, Leases. The amendments in this update affect narrow aspects of the guidance issuedmethod in ASU 2016-02 and is intended to alleviate unintended consequences from applying the new standard. The amendments do not make substantive changes to the core provisions or principles of the new standard and will be considered during our implementation process.
In July 2018, the FASB also issued ASU 2018-11,Leases (Topic 842): Targeted Improvements. The amendments in this update provide entities with an optional transition method, which permits an entity to initially apply the new leases standard at the adoption date and recognize a cumulative-effect adjustment to the opening balance of retained earnings in the period of adoption. In addition, the amendments in this update also provide lessors with a practical expedient (provided certain conditions are met), by class of underlying asset, to not separate the nonlease component(s) from the associated lease component for purposes of income statement presentation.
We expect to adopt Topic 842 on January 1, 2019, and intend to elect the land easement practical expedient as well as the optional additional transition method. We are currently in the process of gathering a complete population of our lease arrangements, implementing a software solution with respect to our leases, evaluating the impact of the new standard on our consolidated financial statements, and developing and implementing appropriate changes to our internal processes and controls to support the accounting and disclosure requirements of the new standard. Based on our evaluation to-date and from the perspective as the lessee, our leasing activity primarily consists of railcars, office space, tractors, vehicles, land, and terminals. Though the evaluation process is still in progress, we currently anticipate that the new lease guidance will result in changes to the way we recognize, present and disclose our operating leases in our consolidated financial statements, including the recognition of a lease liability and an offsetting right-of-use asset in our consolidated balance sheet for our operating leases (with the exception of short-term leases).
Measurement of Credit Losses on Financial Instruments
In June 2016, the FASB issued ASU 2016-13, Financial Instruments-Credit Losses (Topic 326): Measurement of Credit Losses on Financial Instruments. The amendments in this update change the measurement of credit losses for most financial assets and certain other instruments that are not measured at fair value through net income. The amendments affect investments in loans, investments in debt securities, trade receivables, net investments in leases, off-balance sheet credit exposures, reinsurance receivables, and any other financial assets not excluded from the scope that have the contractual right to receive cash. The amendments also replace the incurred loss impairment methodology in current GAAP with a methodology that reflects expected credit losses and requires consideration of a broader range of reasonable and supportable information to inform credit loss estimates. These amendments are effective for fiscal years, and interim periods within those years, beginning after December 15, 2019, with early adoption permitted. We expect to early adopt the amendments on January 1, 2019 and do not expect a material impact on our consolidated financial statements.
Customer’s Accounting for Implementation Costs Incurred in a Cloud Computing Arrangement That is a Service Contract
In August 2018, the FASB issued ASU 2018-15, Intangibles – Goodwill and Other – Internal-Use Software (Subtopic 350-40): Customer’s Accounting for Implementation Costs Incurred in a Cloud Computing Arrangement That is a Service Contract. The amendments in this update require customers in a cloud computing arrangement that is a service contract to assess related implementation costs for capitalization using the same approach as implementation costs associated with internal-use software. These amendments are effective for fiscal years, and interim periods within those years, beginning after December 15, 2019, with early adoption permitted. We are currently evaluating the effect of the amendments on our consolidated financial statements and related disclosures.
Recently adopted accounting pronouncements
Revenue from Contracts with Customers
In May 2014, the FASB issued ASU 2014-09, Revenue from Contracts with Customers (Topic 606). The amendments in this update supersede the revenue recognition requirements in Topic 605, Revenue Recognition, and most industry-specific guidance. The amendments also create a new Subtopic 340-40, Other Assets and Deferred Costs – Contracts with Customers, which provides guidance for the incremental costs of obtaining a contract with a customer and those costs incurred in fulfilling a contract with a customer that are not in the scope of another topic. The core principal of Topic 606 is that an entity should recognize revenue to depict the transfer of promised goods or services to customers in an amount that reflects the consideration to which the entity expects to be entitled to, in exchange for those goods or services. We adopted Topic 606 on January 1, 2018 by applying the modified retrospective transition approach to contracts which were not completed as of the date of adoption. The adoption of Topic 606842 did not result in a material cumulative effect adjustment to retained earnings on January 1, 2018. However, the adoption did have an impact on the classification between “Fees from midstream services” and “Product purchases,” as well as the reporting of gross vs. net revenues, as discussed below:
Embedded fees within commodity supply contracts where the counterparty is not deemed to be a customer are now reported as a reduction of “Product purchases.” Historically, such fees were reported as “Fees from midstream services.”
Noncash consideration in the form of commodities received in-kind from a customer is now recognized as service revenue within “Fees from midstream services” when the service is performed. Historically, the noncash consideration was only recognized as revenue upon sale to a third party without corresponding “Product purchases.”
For certain contracts structured as a purchase where we do not control the commodities, but rather are acting as an agent for the supplier, revenue is now recognized for the net amount of consideration we expect to retain in exchange for our service. Historically, the purchase from the supplier and subsequent sale were reported gross.
The following tables summarize the effects of adoption on our consolidated financial statements:
|
| Three Months Ended September 30, 2018 |
| |||||||||
|
| Pre-Adoption |
|
| Effect of Adoption |
|
| Post-Adoption |
| |||
Revenues: |
|
|
|
|
|
|
|
|
|
|
|
|
Sales of commodities |
| $ | 2,738.7 |
|
| $ | (84.6 | ) |
| $ | 2,654.1 |
|
Fees from midstream services |
|
| 338.1 |
|
|
| (5.8 | ) |
|
| 332.3 |
|
Total revenues |
|
| 3,076.8 |
|
|
| (90.4 | ) |
|
| 2,986.4 |
|
Costs and expenses: |
|
|
|
|
|
|
|
|
|
|
|
|
Product purchases |
|
| 2,473.9 |
|
|
| (90.4 | ) |
|
| 2,383.5 |
|
Income from operations |
|
| 80.6 |
|
|
| — |
|
|
| 80.6 |
|
Income (loss) before income taxes |
|
| (8.7 | ) |
|
| — |
|
|
| (8.7 | ) |
Net income (loss) |
| $ | (8.7 | ) |
| $ | — |
|
| $ | (8.7 | ) |
|
| Nine Months Ended September 30, 2018 |
| |||||||||
|
| Pre-Adoption |
|
| Effect of Adoption |
|
| Post-Adoption |
| |||
Revenues: |
|
|
|
|
|
|
|
|
|
|
|
|
Sales of commodities |
| $ | 7,232.0 |
|
| $ | (250.6 | ) |
| $ | 6,981.4 |
|
Fees from midstream services |
|
| 923.5 |
|
|
| (18.6 | ) |
|
| 904.9 |
|
Total revenues |
|
| 8,155.5 |
|
|
| (269.2 | ) |
|
| 7,886.3 |
|
Costs and expenses: |
|
|
|
|
|
|
|
|
|
|
|
|
Product purchases |
|
| 6,498.9 |
|
|
| (269.2 | ) |
|
| 6,229.7 |
|
Income from operations |
|
| 330.1 |
|
|
| — |
|
|
| 330.1 |
|
Income (loss) before income taxes |
|
| 209.8 |
|
|
| — |
|
|
| 209.8 |
|
Net income (loss) |
| $ | 209.8 |
|
| $ | — |
|
| $ | 209.8 |
|
See Note 16 – Revenue for information regarding our performance obligations and Note 19 – Segment Information for further disaggregation of our revenues.
Targeted Improvements to Accounting for Hedge Activities
In August 2017, FASB issued ASU 2017-12, Derivatives and Hedging (Topic 815): Targeted Improvements to Accounting for Hedge Activities. The amendments in this update are intended to better align risk management activities and financial reporting for hedging relationships. The amendments cover multiple aspects of hedge accounting including: (1) change the way in which ineffectiveness is accounted; (2) allow for new hedge strategies; and (3) change hedge disclosures. Under the new guidance, companies will have the option to perform a qualitative quarterly effectiveness assessment once the initial quantitative test has been performed. In addition, any ineffectiveness that exists is required to be recorded in other comprehensive income instead of in earnings as was required under prior guidance. Several new hedging strategies qualify for hedge accounting treatment, most of these strategies involving the hedging of contractually specified components. Lastly, disclosure requirements have been updated to: (1) require that hedge income be presented on the same line item as the related hedged item; (2) require hedge program objectives to be disclosed; and (3) eliminate the requirement to separately disclose ineffectiveness. These amendments are effective for fiscal years beginning after December 15, 2018, and interim periods within those years, with early adoption permitted. We early adopted the amendments on January 1, 2018, with the changes to ineffectiveness resulting in no effect on retained earnings, as we had no accumulated ineffectiveness at December 31, 2017. See updated disclosures as a result of these amendments in Note 12 – Derivative Instruments and Hedging Activities and Note 19 – Segment Information.
Cash Flow Classification
In August 2016, the FASB issued ASU 2016-15, Statement of Cash Flows (Topic 230): Classification of Certain Cash Receipts and Cash Payments (a consensus of the Emerging Issues Task Force). The amendments in this update clarify how entities should classify certain cash receipts and cash payments in the statement of cash flows related to the following transactions: (1) debt prepayment or extinguishment costs; (2) settlement of zero-coupon debt instruments or other debt instruments with coupon rates that are insignificant in relation to the effective interest rate of the borrowing; (3) contingent consideration payments made after a business combination; (4) proceeds from the settlement of insurance claims; (5) proceeds from the settlement of corporate-owned life insurance; (6) distributions received from equity method investees; and (7) beneficial interests in securitization transactions. Additionally, the update clarifies how the predominance principle should be applied when cash receipts and cash payments have aspects of more than one class of cash flows. The amendments were effective for us on January 1, 2018 and were adopted on a retrospective basis, with no material effect on our consolidated financial statements. In addition, we elected to continue to apply our historical cumulative earnings approach to classify distributions received from equity method investees.
Other Income
In February 2017, FASB issued ASU 2017-05, Other Income—Gains and Losses from the Derecognition of Nonfinancial Assets (Subtopic 610-20). The amendments in this update clarify the scope of Subtopic 610-20 and add guidance for partial sales of nonfinancial assets. Subtopic 610-20 was issued in May 2014 as part of ASU 2014-09, Revenue from Contracts with Customers (Topic 606), and provides guidance for recognizing gains and losses from the transfer of nonfinancial assets in contracts with noncustomers. Specifically, the amendments clarify that the guidance applies to all nonfinancial assets and in substance nonfinancial assets unless other specific guidance applies and defines "in substance nonfinancial asset" as an asset or group of assets for which substantially all of the fair value consists of nonfinancial assets and the group or subsidiary is not a business. These amendments also impact the accounting for partial sales of nonfinancial assets, whereby an entity that transfers its controlling interest in a nonfinancial asset but retains a noncontrolling ownership interest, will measure the retained interest at fair value resulting in the full gain/loss recognition upon sale. These amendments were effective for us on January 1, 2018 and were adopted by applying the modified retrospective transition approach to contracts which were not completed as of the date of adoption. The adoption did not0t result in a cumulative effect adjustment to retained earnings on January 1, 2018.
Accounting Policy Updates
The accounting policies that we follow are set forth in Note 3 – Significant Accounting Policies2019. As part of the Notes to Consolidated Financial Statements in our Annual Report. Besides those noted below, there were no other significant updates or revisions to our policies during the nine months ended September 30, 2018.adoption of Topic 842, we recognized a net right-of-use asset of $64.2 million (net of $0.4 million of lease incentives/deferred rent) and lease liability of $64.6 million. Other practical expedients we elected include:
Revenue Recognition
• | The package for transition relief, which among other things, allows us to carry forward our historical lease classification; |
• | The land easements transition, which allows us to carry forward our historical accounting treatment for land easements prior to the effective date of the new leases standard, and evaluate only new or modified land easements on or after January 1, 2019 under Topic 842; |
• | The short-term lease election, which allows us to elect not to record leases with an initial term of twelve months or less, for all asset classes; |
• | The election to not separate non-lease components from lease components for all the asset classes in our current lease portfolio, where Targa is the lessee; and |
• | The election to not separate non-lease components from lease components for gathering, processing and storage assets, where Targa is the lessor. Based on our election, we determined the non-lease component in certain of these arrangements is the predominant component and therefore account for the arrangements under ASC 606. |
Our operating revenues are primarily derived fromWe recognize the following activities:
salesfor all leases (with the exception of natural gas, NGLs, condensate, crude oil and petroleum products;short-term leases) at the commencement date:
services related to compressing, gathering, treating and processing of natural gas; and
services related to NGL fractionation, terminaling and storage, transportation and treating.
• | A lease liability, which is a lessee’s obligation to make lease payments arising from a lease. |
• | A right-of-use asset, which is an asset that represents the lessee’s right to use, or control the use of, a specified asset for the lease term. |
We have multiple typesdetermine if an arrangement is or contains a lease at inception. Leases with an initial term of contracts with commercial counterparties and many of these may result in cash inflows to Targa due to the structure of settlement provisions with embedded fees. The commercial relationship of the counterparty in such contracts is inherently one of a supplier, rather than a customer, and therefore, such contractstwelve months or less are considered short-term leases, which are excluded from the provisionsbalance sheet. Right-of-use assets and lease liabilities are recognized at the commencement date based on the present value of future lease payments over the lease term. The right-of-use asset also includes any lease prepayments and excludes lease incentives. As most of the revenue recognition guidance in Topic 606. Any cash inflows or feesCompany’s leases do not provide an implicit interest rate, we use our incremental borrowing rate as the discount rate to compute the present value of our lease liability. The discount rate applied is determined based on information available on the date of adoption for all leases existing as of that are realizeddate, and on these supply type contracts are reported as a reductionthe date of Product purchases.lease commencement for all subsequent leases.
Our revenues, therefore, are measuredlease arrangements may include variable lease payments based on consideration specified inan index or market rate, or may be based on performance. For variable lease payments based on an index or market rate, we estimate and apply a contract with parties designated as customers. We recognize revenue when we satisfy arate based on information available at the commencement date. Variable lease payments based on performance obligation by transferring control over a commodity or service to a customer. Sales and other taxes we collect, that are both imposed on and concurrent with revenue-producing activities, are excluded from revenues.
We generally report sales revenues on a gross basisthe calculation of the right-of-use asset and lease liability, and are recognized in our Consolidated Statements of Operations as we typically act aswhen the principalcontingency underlying such variable lease payments is resolved. Our lease terms may include options to extend or terminate the lease. Such options are included in the transactions wheremeasurement of our right-of-use asset and liability, provided we receive and control commodities. However, buy-sell transactionsdetermine that involve purchases and sales of inventory withwe are reasonably certain to exercise the same counterparty, which are legally contingent or in contemplation of one another, as well as other instances where we do not control the commodities, but rather are acting as an agent to the supplier, are reported as a single revenue transaction on a combined net basis.option.
See Note 11 – Leases for additional details.
Our commodity sales contracts typically contain multiple performance obligations, whereby each distinct unit of commodity to be transferred to the customer is a separate performance obligation. Under such contracts, revenue is recognized at the point in time each unit is transferred to the customer because the customer is able to direct the use of, and obtain substantially all of the remaining benefits from, the commodity at that time. In certain instances, it may be determinable that the customer receives and consumes the benefits of each unit as it is transferred. Under such contracts, we have a single performance obligation comprised of a series of distinct units of commodity; and in such instance, revenue is recognized over time using the units delivered output method, as each distinct unit is transferred to the customer. Our commodity sales contracts are typically priced at a market index, but may also be set at a fixed price. When our sales are priced at a market index, we apply the allocation exception for variable consideration and allocate the market price to each distinct unit when it is transferred to the customer. The fixed price in our commodity sales contracts generally represents the standalone selling price, and therefore, when each distinct unit is transferred to the customer, we recognize revenue at the fixed price.
Our service contracts typically contain a single performance obligation. The underlying activities performed by us are considered inputs to an integrated service and not separable because such activities in combination are required to successfully transfer the single overall service that the customer has contracted for and expects to receive. Therefore, the underlying activities in such contracts are not considered to be distinct services. However, in certain instances, the customer may contract for additional distinct services and therefore additional performance obligations may exist. In such instances, the transaction price is allocated to the multiple performance obligations based on their relative standalone selling prices. The performance obligation(s) in our service contracts is a series of distinct days of the applicable service over the life of the contract (fundamentally a stand-ready service), whereby we recognize revenue over time using an output method of progress based on the passage of time (i.e., each day of service). This output method is appropriate because it directly relates to the value of service transferred to the customer to date, relative to the remaining days of service promised under the contract.
The transaction price for our service contracts is typically comprised of variable consideration, which is primarily dependent on the volume and composition of the commodities delivered and serviced. The variable consideration is generally commensurate with our efforts to perform the service and the terms of the variable payments relate specifically to our efforts to satisfy each day of distinct service. Therefore, the variable consideration is typically not estimated at contract inception, but rather the allocation exception for variable consideration is applied, whereby the variable consideration is allocated to each day of service and recognized as revenue when each day of service is provided. When we are entitled to noncash consideration in the form of commodities, the variability related to the form of consideration (market price) and reasons other than form (volume and composition) are interrelated to the service, and therefore, we measure the noncash consideration at the point in time when the volume, mix and market price related to the commodities retained in-kind are known. This results in the recognition of revenue based on the market price of the commodity when the service is performed. In addition, if the transaction price includes a fixed component (i.e., a fixed capacity reservation fee), the fixed component is recognized ratably on a straight line basis over the contract term, as each day of service has elapsed, which is consistent with the output method of progress selected for the performance obligation.
Our customers are typically billed on a monthly basis, or earlier, if final delivery and sale of commodities is made prior to month-end, and payment is typically due within 10 to 30 days. As a practical matter, we define the unit of account for revenue recognition purposes based on the passage of time ranging from one month to one quarter, rather than each day. This is because the financial reporting outcome is the same regardless of whether each day or month/quarter is treated as the distinct service in the series. That is, at the end of each month or quarter, the variability associated with the amount of consideration for which we are entitled to, is resolved, and can be included in that month or quarter’s revenue.
Certain provisions of our service contracts (i.e., tiered price structures) require further assessment to determine if the allocation exception for variable consideration is met. If the allocation exception is not met, we estimate the total consideration that we expect to be entitled to for the applicable term of the contract, based on projections of future activity. In such instance, revenue is recognized using an output method of progress based on the volume of commodities serviced during the reporting period. Our estimate of total consideration is reassessed each reporting period until contract completion.
For contracts with minimum volume commitments, we generally expect the customer to meet the commitment. However, such contracts are reassessed throughout the term of the commitment, and if we no longer expect the customer to meet the commitment, the allocation exception for variable consideration would not be met. That is, from that point onwards, an allocation based on the applicable fee applied to the volumes serviced does not depict the amount of consideration which we expect to be entitled to, in exchange for the service. In such instance, revenue will be recognized up to the minimum volume commitment in proportion to the days of service elapsed and the remaining duration of the commitment.
Contract Assets
Contract assets are presented separately from amounts presented as a receivable when or as a performance obligation(s) is satisfied and prior to having a right to payment that is unconditional at the end of the reporting period. We classify our contract assets as receivables because we generally have an unconditional right to payment for the commodities sold or services performed at the end of reporting period.
Note 4 –Newly-Formed Joint Ventures, Acquisitions and — Divestitures
Joint Ventures
Grand PrixTrain 7 Joint Venture
In May 2017,February 2019, we announced plans to constructan extension of the Grand Prix a new common carrier NGL pipeline.Pipeline (“Grand Prix”) from Southern Oklahoma to the STACK region of Central Oklahoma where it will connect with the Williams Companies, Inc. (“Williams”) Bluestem Pipeline and link the Conway, Kansas, and Mont Belvieu, Texas, NGL markets. In connection with this project, Williams has committed significant volumes to us that we will transport on Grand Prix will transport volumes from the Permian Basin and fractionate at our North Texas system to our fractionation and storage complex in the NGL market hub at Mont Belvieu Texas. Grand Prix will be supported byfacilities. Williams also had an initial option to purchase a 20% equity interest in one of our volumesrecently announced 110 MBbl/d fractionation trains (Train 7 or Train 8) in Mont Belvieu. Williams exercised its option to acquire a 20% equity interest in Train 7 and other third-party customer volume commitments, and is expected to be fully in servicesubsequently executed a joint venture agreement with us in the second quarter of 2019.
In September 2017, we sold a 25% interest in our consolidated subsidiary, Grand Prix Pipeline LLC (the “Grand Prix Joint Venture”), which owns the portion of Grand Prix extending from the Permian Basin to Mont Belvieu, Texas, to funds managed Certain fractionation-related infrastructure for Train 7, including storage caverns and brine handling, will be funded and owned 100% by Blackstone Energy Partners ("Blackstone"). Targa. We are the operator and construction manager of Grand Prix. We account for Grand Prixpresent Train 7 on a consolidated basis in our consolidated financial statements.
Concurrent withSale of Interest in Targa Badlands LLC
On April 3, 2019, we closed on the sale of the 25%a 45% interest in the Grand Prix Joint Venture to Blackstone, we and EagleClaw Midstream Ventures,Targa Badlands LLC (“EagleClaw”Targa Badlands”), a Blackstone portfolio company, executed a long-term Raw Product Purchase Agreement whereby EagleClaw has dedicated and committed significant NGLs associated with EagleClaw’s natural gas volumes produced or processed in the Delaware Basin.
In March 2018, we announced an extensionentity that holds substantially all of Grand Prix from North Texas into southern Oklahoma. The pipeline expansion is supported by long-term commitments for both transportation and fractionation services from our existing and future processing plants in the Arkoma area in our SouthOK system and from third-party commitments, including a long-term commitment for transportation and fractionation with Valiant Midstream, LLC. The extension of Grand Prix into southern Oklahoma is not part of the Grand Prix Joint Venture and its expected cost of approximately $350 million will be funded exclusively by Targa.
The capacity of the 24-inch pipeline segment from the Permian Basin will be approximately 300 MBbl/d, expandable to 550 MBbl/d. The pipeline segment from the Permian Basin will be connected to a 30-inch diameter pipeline segmentassets in North Texas, where Permian, North TexasDakota, to funds managed by GSO Capital Partners and Oklahoma volumes will be connectedBlackstone Tactical Opportunities (collectively, “Blackstone”) for $1.6 billion in cash. We used the net cash proceeds to Mont Belvieu,repay debt and will have capacityfor general corporate purposes, including funding our growth capital program. Future growth capital of approximately 450 MBbl/d, expandable to 950 MBbl/d. The capacity from southern Oklahoma to North Texas will vary based on telescoping pipe size.
Grand Prix economics related to volumes flowing on the pipeline from the Permian Basin to Mont Belvieu are included in the Blackstone and Grand Prix Development LLC (“Grand Prix DevCo JV”) joint venture arrangements, while the economics related to volumes flowing from North Texas and southern Oklahoma to Mont Belvieu accrue solely to Targa’s benefit.
The total cost for Grand Prix, including the extension into southern Oklahoma,Targa Badlands is expected to be approximately $1.7 billion.
Cayenne Joint Venture
In July 2017, we entered into the Cayenne Pipeline, LLC joint venturefunded on a pro rata ownership basis. Targa Badlands pays a minimum quarterly distribution (“Cayenne Joint Venture”MQD”) to Blackstone and Targa, with American Midstream LLCBlackstone having a priority right on such MQDs. Once Blackstone receives funds sufficient to meet a predetermined fixed return on their invested capital, their interest will convert an existing 62-mile gas pipeline to an NGL pipeline connecting the VESCO plant in Venice, Louisiana to the Enterprise Products Operating LLC (“Enterprise”) pipeline at Toca, Louisiana, for delivery to Enterprise’s Norco Fractionator. We acquired a 50%7.5% equity interest in the Cayenne Joint Venture for $5.0 million. The project commenced operations in December 2017. See Note 7 – Investments in Unconsolidated Affiliates for activity related to the Cayenne Joint Venture.
Gulf Coast Express Joint Venture
In December 2017, we entered into definitive joint venture agreements with Kinder Morgan Texas Pipeline LLC (“KMTP”)Targa Badlands, and DCP Midstream Partners, LP (“DCP”) with respect to the joint developmentit will no longer have a priority right on MQDs. Additionally, upon a sale of Gulf Coast Express Pipeline (“GCX”),Targa Badlands, Blackstone’s capital contributions would have a natural gas pipeline from the Waha hub to Agua Dulce in South Texas. The pipeline will provide an outlet for increased natural gas production from the Permian Basin to growing markets along the Texas Gulf Coast. We and DCP each own a 25% interest, and KMTP owns a 50% interest in GCX. In addition, Apache Corporation (which will also be a shipper on GCX) has an option to purchase upliquidation preference equal to a 15% equity stake from KMTP. KMTP will serve aspredetermined fixed return on their invested capital.
After the operator and constructor of GCX, and we will commit significant volumes to the pipeline. In addition, Pioneer Natural Resources Company, a joint owner in our WestTX Permian Basin system has committed volumes to the project. GCX is designed to transport up to 1.98 Bcf/d of natural gas and the total costseventh anniversary of the project is expected to be approximately $1.75 billion. GCX is expected to be in service inclosing date or upon the fourth quarteroccurrence of 2019, pending regulatory approvals. See Note 7 – Investments in Unconsolidated Affiliates for activity related to the GCX Joint Venture.
Little Missouri 4 Joint Venture
In January 2018, we formed a 50/50 joint venture with Hess Midstream Partners LP to construct a new 200 MMcf/d natural gas processing plant (“LM4 Plant”) at the Partnership’s existing Little Missouri facility (“Little Missouri 4”). The LM4 Plant is anticipated to be completed in the second quarter of 2019. The Partnership is managing the construction of, and will operate, the LM4 Plant. See Note 7 – Investments in Unconsolidated Affiliates for activity related to the Little Missouri 4 Joint Venture.
DevCo Joint Ventures
In February 2018, we formed three development joint ventures (“DevCo JVs”) with investment vehicles affiliated with Stonepeak Infrastructure Partners (“Stonepeak”) to fund portions of Grand Prix, GCX and an approximately 100 MBbl/d fractionator in Mont Belvieu, Texas (“Train 6”). Stonepeak owns a 95% interest in the Grand Prix DevCo JV, which owns a 20% interest in the Grand Prix Joint Venture (which does not include the extension into southern Oklahoma). Stonepeak owns an 80% interest in both Targa GCX Pipeline LLC (“GCX DevCo JV”), which owns our 25% interest in GCX, and Targa Train 6 LLC (“Train 6 DevCo JV”), which owns a 100% interest in certain assets associated with Train 6. The Train 6 DevCo JV does not include certain fractionation-related infrastructure such as brine and storage, which will be funded and owned 100% by us. We hold the remaining interests in the DevCo JVs as well as control the management, construction and operation of Grand Prix and Train 6.
The following diagram displays the ownership structure of the DevCo JVs:
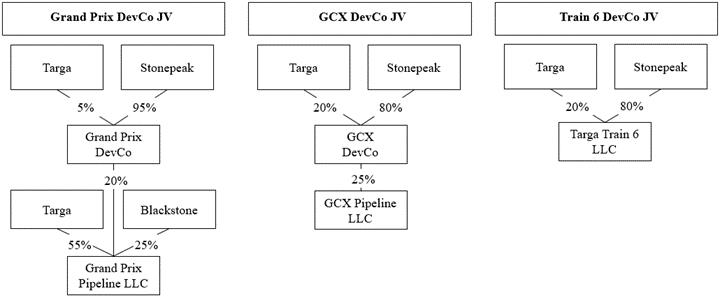
For a four-year period beginning on the earlier of the date that all three projects have commenced commercial operations or January 1, 2020,triggering events, we have the option to acquire all or part of Stonepeak’s interests in the DevCo JVs. Targa may acquire up to 50% of Stonepeak’s invested capital in multiple increments with a minimum of $100 million, and Stonepeak’s remaining 50%Blackstone’s interest in Targa Badlands for a single final purchase. The purchase price payable for such partial or full interests isto Blackstone based on their liquidation preference after taking into account all prior distributions to Blackstone, plus a predetermined fixed return orset percentage on a multiple on invested capital, including distributions received by Stonepeak fromof the DevCo JVs. trailing twelve-month EBITDA of Targa Badlands. Targa will continue to control the management of Targa Badlands pending the DevCo JVs unlessoccurrence of certain triggering events, including if Blackstone has not received funds sufficient to meet its liquidation preference and until Targa declines to exercisehas not exercised its optionpurchase right to acquire Stonepeak's interests. Train 6 is expected to begin operations in the first quarter of 2019. Grand Prix is expected to be fully in service in the second quarter of 2019. GCX is expected to be in service in the fourth quarter of 2019, pending regulatory approvals.Blackstone’s interest by April 3, 2029.
We continue to be the operator of Targa Badlands and hold a controlling interest in each of the DevCo JVs, as we have the majority voting interest and the supermajority voting provisions of the joint venture agreements do not represent substantive participating rights and are protective in nature to Stonepeak.governance rights. As a result, we have consolidated each of the DevCo JVs in our financial statements. We continue to account for Grand Prix and Train 6present Targa Badlands on a consolidated basis in ourour consolidated financial statements and continue to account for GCXBlackstone’s contributions are reflected as an equity method investment as disclosed in Note 7 – Investments in Unconsolidated Affiliates.
Agua Blanca Joint Venture
In April 2018, we joined WhiteWater Midstream, LLC (“WhiteWater Midstream”), WPX Energy, Inc., and Markwest Energy Partners, L.P., as joint venture partners in WhiteWater Midstream’s Delaware Basin Agua Blanca pipeline (“Agua Blanca Joint Venture”). The Agua Blanca pipeline is an approximately 160 mile natural gas residue pipeline with an initial capacity of 1.4 Bcf/d. The pipeline, which commenced operations in April 2018, runs from Orla, Texas to the Waha hub, servicing portions of Culberson, Loving, Pecos, Reeves and Ward counties with multiple direct downstream connections including to the Trans-Pecos Header. We acquired a 10% interest in the Agua Blanca Joint Venture for $3.5 million. See Note 7 – Investments in Unconsolidated Affiliates for activity related to the Agua Blanca Joint Venture.
Carnero Joint Venture
In May 2018, Sanchez Midstream Partners LP and we merged our respective 50%noncontrolling interests in the Carnero Gathering and Carnero Processing Joint Ventures, which own the high-pressure Carnero gathering line and Raptor natural gas processing plant, to form an expanded 50/50 joint venture in South Texas (the “Carnero Joint Venture”). In connection with the joint venture merger transactions, the Carnero Joint Venture acquired our 200 MMcf/d Silver Oak II natural gas processing plant located in Bee County Texas, which increased the processing capacity of the joint venture from 260 MMcf/d to 460 MMcf/d. Additional enhancements to the prior joint ventures include dedication of over 315,000 additional gross acres in the Western Eagle Ford, operated by Sanchez Energy Corporation, under a new long-term firm gas gathering and processing agreement. Including the approximately 105,000 Catarina acreage, the joint venture now has over 420,000 gross acres dedicated long term. We operate the gas gathering and processing facilities in the joint venture. The Carnero Joint Venture is a consolidated subsidiary and its financial results are presented on a gross basis in our reported financials.
Whistler Pipeline
In August 2018, we announced that we were involved in the development of the Whistler Pipeline (“Whistler”), consisting of a pipeline designed to transport natural gas from the Waha area of the Permian Basin to Agua Dulce in South Texas, with an additional segment continuing from Agua Dulce to Wharton County, TX. We are continuing to work on securing commitments on Whistler and the project remains subject to final investment decisions and regulatory approvals.
Acquisitions
Permian Acquisition
On March 1, 2017, we completed the purchase of 100% of the membership interests of Outrigger Delaware Operating, LLC, Outrigger Southern Delaware Operating, LLC (together “New Delaware”) and Outrigger Midland Operating, LLC (“New Midland” and together with New Delaware, the “Permian Acquisition”).
We paid $484.1 million in cash at closing on March 1, 2017, and paid an additional $90.0 million in cash on May 30, 2017 (collectively, the “initial purchase price”). Subject to certain performance-linked measures and other conditions, additional cash of up to $935.0 million may be payable to the sellers of New Delaware and New Midland in potential earn-out payments. The first earn-out payment due in May 2018 expired with no required payment. The second potential earn-out payment would occur in MaySubsequent Event
In November 2019, and will be based upon a multiple of realized gross margin from contracts that existed on March 1, 2017.
Pro Forma Impact of Permian Acquisition on Consolidated Statements of Operations
The following summarized unaudited pro forma Consolidated Statements of Operations information for the three and nine months ended September 30, 2017 assumes that the Permian Acquisition occurred as of January 1, 2016. We prepared the following summarized unaudited pro forma financial results for comparative purposes only. The summarized unaudited pro forma information may not be indicative of the results that would have occurred had we completed this acquisition as of January 1, 2016, or that would be attained in the future.
|
| Three Months Ended September 30, 2017 |
|
| Nine Months Ended September 30, 2017 |
| ||
|
| Pro Forma |
|
| Pro Forma |
| ||
Revenues |
| $ | 2,131.8 |
|
| $ | 6,126.2 |
|
Net income (loss) |
|
| (244.7 | ) |
|
| (297.0 | ) |
The pro forma consolidated results of operations amounts have been calculated after applying our accounting policies, and making the following adjustments to the unaudited results of the acquired businesses for the periods indicated:
Reflect the amortization expense resulting from the fair value of intangible assets recognized as part of the Permian Acquisition.
Reflect the change in depreciation expense resulting from the difference between the historical balances of the Permian Acquisition’s property, plant and equipment, net, and the fair value of property, plant and equipment acquired.
Exclude $5.6 million of acquisition-related costs incurred as of September 30, 2017 from pro forma net income for the three and nine months ended September 30, 2017.
A contingent consideration liability arising from potential earn-out payments in connection with the Permian Acquisition has been recognized at its fair value. We agreed to pay up to an additional $935.0 million in aggregate potential earn-out payments in May 2018 and May 2019. The acquisition date fair value of the potential earn-out payments of $416.3 million was originally recorded within Other long-term liabilities on our Consolidated Balance Sheets. Changes in the fair value of the liability (that were not accounted for as revisions of the acquisition date fair value) have been included in Other income (expense).
During the three months ended September 30, 2018 and 2017, we recognized $16.6 million expense and $126.6 million income, respectively, in Other income (expense) related to the change in fair value of the contingent consideration. The increase in fair value of the contingent consideration during the three months ended September 30, 2018 was primarily attributable to a shorter discount period. The underlying forecasted volumes reflect the most recently observed production trends. During the nine months ended September 30, 2018 and 2017, we recognized $12.0 million expense and $125.5 million income in Other income (expense) related to the change in fair value of the contingent consideration.
The portion of the earn-out due in 2018 expired with no required payment. As of September 30, 2018, the fair value of the second potential earn-out payment of $329.0 million has been recorded as a component of Accounts payable and accrued liabilities, which are current liabilities on our Consolidated Balance Sheets. See Note 13 – Fair Value Measurements for additional discussion of the fair value methodology.
Divestitures
Assets and liabilities held for sale
During the third quarter of 2018, we executed agreements to sell our Downstream refined productscrude gathering and crude oil storage and terminaling facilitiesbusiness in Tacoma, WA, and Baltimore, MD, to a third partythe Permian Delaware for approximately $160$135 million. TheSubject to customary regulatory approvals and closing conditions, the sale closedis expected to close in the fourth quarter of 2018 and we intend2019.
We have also engaged Jefferies LLC to useevaluate the proceeds to repay debt and to fund a portionpotential divestiture of our crude gathering business in the Permian Midland, which includes crude gathering and storage assets. The potential divestiture is predicated on third party valuations adequately capturing our forward growth capital program. In relation to the sale, we classified our Tacoma and Baltimore refined products and crude oil storage and terminaling facilities assets as heldexpectations for sale and measured them at the lower of their carrying value or fair value less costs to sell, which resulted in a loss of $57.5 million included within Other operating income (expense) in our Consolidated Statements of Operations for the three and nine months ended September 30, 2018. The sale of these businesses does not qualify for reporting as discontinued operations as it did not represent a strategic shift that would have a major effect on our operations and financial results.
The adjusted carrying amounts of the assets, and liabilities held forno assurance can be made that a sale as of September 30, 2018 are as follows:will be consummated.
|
| September 30, 2018 |
| |
Current assets: |
|
|
|
|
Trade receivables |
| $ | 8.8 |
|
Inventories |
|
| 5.5 |
|
Property, plant and equipment, net of accumulated depreciation and estimated loss on sale |
|
| 151.4 |
|
Total assets held for sale |
| $ | 165.7 |
|
|
|
|
|
|
Current liabilities: |
|
|
|
|
Accounts payable and accrued liabilities |
| $ | (1.7 | ) |
Total liabilities held for sale |
| $ | (1.7 | ) |
|
| September 30, 2018 |
|
| December 31, 2017 |
|
| September 30, 2019 |
|
| December 31, 2018 |
| ||||
Commodities |
| $ | 163.3 |
|
| $ | 191.6 |
|
| $ | 202.6 |
|
| $ | 151.1 |
|
Materials and supplies |
|
| 14.6 |
|
|
| 12.9 |
|
|
| 8.3 |
|
|
| 13.6 |
|
|
| $ | 177.9 |
|
| $ | 204.5 |
|
| $ | 210.9 |
|
| $ | 164.7 |
|
Note 6 — Property, Plant and Equipment and Intangible Assets
|
| September 30, 2018 |
|
| December 31, 2017 |
|
| Estimated Useful Lives (In Years) |
| September 30, 2019 |
|
| December 31, 2018 |
|
| Estimated Useful Lives (In Years) | ||||
Gathering systems |
| $ | 7,395.2 |
|
| $ | 7,037.2 |
|
| 5 to 20 |
| $ | 8,767.6 |
|
| $ | 7,547.9 |
|
| 5 to 20 |
Processing and fractionation facilities |
|
| 3,842.4 |
|
|
| 3,563.0 |
|
| 5 to 25 |
|
| 4,961.3 |
|
|
| 4,001.0 |
|
| 5 to 25 |
Terminaling and storage facilities |
|
| 1,068.1 |
|
|
| 1,244.1 |
|
| 5 to 25 |
|
| 1,459.1 |
|
|
| 1,138.7 |
|
| 5 to 25 |
Transportation assets |
|
| 456.1 |
|
|
| 343.6 |
|
| 10 to 25 |
|
| 2,221.9 |
|
|
| 445.1 |
|
| 10 to 50 |
Other property, plant and equipment |
|
| 313.6 |
|
|
| 303.5 |
|
| 3 to 25 |
|
| 302.0 |
|
|
| 334.3 |
|
| 3 to 25 |
Land |
|
| 146.8 |
|
|
| 125.7 |
|
| — |
|
| 154.4 |
|
|
| 144.3 |
|
| — |
Construction in progress |
|
| 2,992.4 |
|
|
| 1,581.5 |
|
| — |
|
| 1,675.9 |
|
|
| 3,602.5 |
|
| — |
Finance lease right-of-use assets |
|
| 46.9 |
|
|
| — |
|
|
| ||||||||||
Property, plant and equipment |
|
| 16,214.6 |
|
|
| 14,198.6 |
|
|
|
|
| 19,589.1 |
|
|
| 17,213.8 |
|
|
|
Accumulated depreciation |
|
| (4,133.8 | ) |
|
| (3,768.7 | ) |
|
| ||||||||||
Accumulated depreciation and amortization |
|
| (4,892.4 | ) |
|
| (4,285.5 | ) |
|
| ||||||||||
Property, plant and equipment, net |
| $ | 12,080.8 |
|
| $ | 10,429.9 |
|
|
|
| $ | 14,696.7 |
|
| $ | 12,928.3 |
|
|
|
|
|
|
|
|
|
|
|
|
|
|
|
|
|
|
|
|
|
|
|
|
Intangible assets |
| $ | 2,736.6 |
|
| $ | 2,736.6 |
|
| 10 to 20 |
| $ | 2,736.6 |
|
| $ | 2,736.6 |
|
| 10 to 20 |
Accumulated amortization |
|
| (707.0 | ) |
|
| (570.8 | ) |
|
|
|
| (882.2 | ) |
|
| (753.4 | ) |
|
|
Intangible assets, net |
| $ | 2,029.6 |
|
| $ | 2,165.8 |
|
|
|
| $ | 1,854.4 |
|
| $ | 1,983.2 |
|
|
|
ImpairmentDuring the preparation of North Texas Gatheringthe Company's first quarter 2019 consolidated financial statements, the Company identified an error related to depreciation expense on certain assets that should have been placed in-service during 2018. The Company does not believe this error is material to its previously issued historical consolidated financial statements for any of the periods impacted and Processing Assetsaccordingly, has not adjusted the historical financial statements. The Company recorded the cumulative impact of the adjustment in the period of identification, resulting in a one-time $12.5 million overstatement of depreciation expense.
We recorded a non-cash pre-tax impairment charge of $378.0During the three and nine months ended September 30, 2019, depreciation expense was $201.4 million inand $590.1 million. During the third quarter of 2017 for the partial impairment of gas processing facilitiesthree and gathering systems associated with our North Texas operations in our Gatheringnine months ended September 30, 2018, depreciation expense was $161.7 million and Processing segment. The impairment was a result of our assessment that forecasted undiscounted future net cash flows from operations, while positive, would not be sufficient to recover the existing total net book value of the underlying assets. Given the price environment at the time, we projected a continuing decline in natural gas production across the Barnett Shale in North Texas due in part to producers pursuing more attractive opportunities in other basins. We measured the impairment of property, plant and equipment using discounted estimated future cash flow analysis (“DCF”) including a terminal value (a Level 3 fair value measurement). The future cash flows were based on our estimates of future revenues, income from operations and other factors, such as timing of capital expenditures. We took into account current and expected industry and market conditions, including commodity prices and volumetric forecasts. The discount rate used in our DCF analysis was based on a weighted average cost of capital determined from relevant market comparisons. These carrying value adjustments are included in Impairment of property, plant and equipment in our Consolidated Statements of Operations.$470.9 million.
Intangible Assets
Intangible assets consist of customer contracts and customer relationships acquired in the Permian Acquisition and the acquisition of the Flag City Plant assets in SouthTX in 2017, the mergers with Atlas Energy L.P. and Atlas Pipeline Partners L.P. in 2015 (collectively, the “Atlas mergers”) and our Badlands acquisition in 2012.prior business combinations. The fair valuesvalue of these acquired intangible assets were determined at the date of acquisition based on the present values of estimated future cash flows. Key valuation assumptions include probability of contracts under negotiation, renewals of existing contracts, economic incentives to retain customers, past and future volumes, current and future capacity of the gathering system, pricing volatility and the discount rate.
Amortization expense attributable to these assets is recorded over the periods in which we benefit from services provided to customers. We are amortizing these assets over lives ranging from 10 to 20 years using a method that closely reflects the cash flow pattern underlying their intangible asset valuation, or the straight-line method, if a reliably determinable pattern of amortization could not be identified.
The estimated annual amortization expense for intangible assets is approximately $182.6 million, $171.6 million, $159.4 million, $149.5 million, $141.2 million and $141.2$136.0 million for each of the years 20182019 through 2022.2023.
The changes in our intangible assets are as follows:
Balance at December 31, 2017 |
| $ | 2,165.8 |
|
Amortization |
|
| (136.2 | ) |
Balance at September 30, 2018 |
| $ | 2,029.6 |
|
Balance at December 31, 2018 | $ | 1,983.2 |
|
Amortization |
| (128.8 | ) |
Balance at September 30, 2019 | $ | 1,854.4 |
|
During the second quarter of 2018, we sold our inland marine barge business to a third party for $69.3 million. As a result of the sale, we recognized a gain of $48.1 million in our Consolidated Statements of Operations for the nine months ended September 30, 2018 as part of Other operating (income) expense. We continue to own and operate two ocean-going barges.
Note 7 – Investments in Unconsolidated Affiliates
Our investments in unconsolidated affiliates consist of the following:
Gathering and Processing Segment
a 38.8% non-operated ownership interest in Gulf Coast Fractionators LP (“GCF”);
• | 2 operated joint ventures in South Texas: a 75% interest in T2 LaSalle Gathering Company L.L.C. (“T2 LaSalle”) and a 50% interest in T2 Eagle Ford Gathering Company L.L.C. (“T2 Eagle Ford”), (together the “T2 Joint Ventures”); and |
• | a 50% operated ownership interest in Little Missouri 4 LLC (“Little Missouri 4”). |
three non-operated joint ventures in South Texas acquired in the Atlas mergers in 2015: a 75% interest in T2 LaSalle Gathering Company L.L.C. (“T2 LaSalle”), a gas gathering company; a 50% interest in T2 Eagle Ford Gathering Company L.L.C. (“T2 Eagle Ford”), a gas gathering company;Logistics and a 50% interest in T2 EF Cogeneration Holdings L.L.C. (“T2 EF Cogen”), which owns a cogeneration facility, (together the “T2 Joint Ventures”);Marketing Segment
• | a 25% non-operated ownership interest in Gulf Coast Express Pipeline LLC (“GCX”); |
a 50% operated ownership interest in the Cayenne Joint Venture;
• | a 38.8% non-operated ownership interest in Gulf Coast Fractionators LP (“GCF”); and |
a 25% non-operated ownership interest in GCX;
a 50% operated ownership interest in Little Missouri 4; and
a 10% non-operated ownership interest in the Agua Blanca Joint Venture.
• | a 50% operated ownership interest in Cayenne Pipeline, LLC(“Cayenne”). |
The terms of these joint venture agreements do not afford us the degree of control required for consolidating them in our consolidated financial statements, but do afford us the significant influence required to employ the equity method of accounting.
See Note 4 – Newly-Formed
The T2 Joint Ventures Acquisitionswere formed to provide services for the benefit of their joint venture owners and Divestitures for discussionhave capacity lease agreements with their joint venture owners, which cover costs of operations (excluding depreciation and amortization). On April 1, 2019, we assumed the operatorship of the formationT2 Joint Ventures.
During the third quarter of our GCX Joint Venture and Little Missouri 4 Joint Venture, and our acquisition2019, we closed on the sale of interestsan equity-method investment for $70.3 million that resulted in the Cayenne Joint Venture andrecognition of a gain of $65.8 million during the Agua Blanca Joint Venture.three months ended September 30, 2019, which is reported as part of Other (income) expense.
The following table shows the activity related to our investments in unconsolidated affiliates:
|
| Balance at December 31, 2017 |
|
| Equity Earnings (Loss) |
|
| Cash Distributions (1) |
|
| Acquisition |
|
| Contributions (2) |
|
| Balance at September 30, 2018 |
|
| Balance at December 31, 2018 |
|
| Equity Earnings (Loss) |
|
| Cash Distributions |
|
| Disposition |
|
| Contributions |
|
| Balance at September 30, 2019 |
| ||||||||||||
GCX (1) |
| $ | 211.6 |
|
| $ | 8.9 |
|
| $ | (5.3 | ) |
| $ | — |
|
| $ | 210.4 |
|
| $ | 425.6 |
| ||||||||||||||||||||||||
T2 Eagle Ford (2) |
|
| 99.0 |
|
|
| (7.5 | ) |
|
| — |
|
|
| — |
|
|
| — |
|
|
| 91.5 |
| ||||||||||||||||||||||||
Little Missouri 4 |
|
| 67.3 |
|
|
| 0.1 |
|
|
| — |
|
|
| — |
|
|
| 33.0 |
|
|
| 100.4 |
| ||||||||||||||||||||||||
T2 LaSalle (2) |
|
| 49.3 |
|
|
| (3.5 | ) |
|
| — |
|
|
| — |
|
|
| — |
|
|
| 45.8 |
| ||||||||||||||||||||||||
GCF |
| $ | 45.8 |
|
| $ | 14.2 |
|
| $ | (16.3 | ) |
| $ | — |
|
| $ | — |
|
| $ | 43.7 |
|
|
| 40.3 |
|
|
| 14.0 |
|
|
| (14.7 | ) |
|
| — |
|
|
| — |
|
|
| 39.6 |
|
T2 LaSalle (3) |
|
| 54.1 |
|
|
| (3.8 | ) |
|
| — |
|
|
| — |
|
|
| 0.1 |
|
|
| 50.4 |
| ||||||||||||||||||||||||
T2 Eagle Ford (3) |
|
| 109.2 |
|
|
| (7.6 | ) |
|
| — |
|
|
| — |
|
|
| — |
|
|
| 101.6 |
| ||||||||||||||||||||||||
T2 EF Cogen |
|
| 3.9 |
|
|
| (1.3 | ) |
|
| — |
|
|
| — |
|
|
| — |
|
|
| 2.6 |
| ||||||||||||||||||||||||
Cayenne |
|
| 8.6 |
|
|
| 4.6 |
|
|
| (1.9 | ) |
|
| — |
|
|
| 5.5 |
|
|
| 16.8 |
|
|
| 16.6 |
|
|
| 5.4 |
|
|
| (6.7 | ) |
|
| — |
|
|
| 0.3 |
|
|
| 15.6 |
|
GCX |
|
| — |
|
|
| 0.1 |
|
|
| — |
|
|
| — |
|
|
| 154.8 |
|
|
| 154.9 |
| ||||||||||||||||||||||||
Little Missouri 4 |
|
| — |
|
|
| — |
|
|
| (8.0 | ) |
|
| — |
|
|
| 75.3 |
|
|
| 67.3 |
| ||||||||||||||||||||||||
Agua Blanca |
|
| — |
|
|
| 0.2 |
|
|
| — |
|
|
| 3.5 |
|
|
| 0.5 |
|
|
| 4.2 |
|
|
| 6.4 |
|
|
| (1.5 | ) |
|
| (0.4 | ) |
|
| (4.5 | ) |
|
| — |
|
|
| — |
|
Total |
| $ | 221.6 |
|
| $ | 6.4 |
|
| $ | (26.2 | ) |
| $ | 3.5 |
|
| $ | 236.2 |
|
| $ | 441.5 |
|
| $ | 490.5 |
|
| $ | 15.9 |
|
| $ | (27.1 | ) |
| $ | (4.5 | ) |
| $ | 243.7 |
|
| $ | 718.5 |
|
_________________
(1) |
|
(2) |
|
|
|
Note 8 — Accounts Payable and Accrued Liabilities
|
| September 30, 2018 |
|
| December 31, 2017 |
|
| September 30, 2019 |
|
| December 31, 2018 |
| ||||
Commodities |
| $ | 975.5 |
|
| $ | 711.9 |
|
| $ | 612.0 |
|
| $ | 721.9 |
|
Other goods and services |
|
| 499.8 |
|
|
| 286.9 |
|
|
| 359.6 |
|
|
| 474.5 |
|
Interest |
|
| 83.3 |
|
|
| 54.1 |
|
|
| 91.6 |
|
|
| 79.4 |
|
Permian Acquisition contingent consideration, estimated current portion |
|
| 329.0 |
|
|
| 6.8 |
| ||||||||
Permian Acquisition contingent consideration |
|
| — |
|
|
| 308.2 |
| ||||||||
Income and other taxes |
|
| 88.6 |
|
|
| 26.3 |
|
|
| 79.5 |
|
|
| 45.4 |
|
Accrued distributions to noncontrolling interests |
|
| 73.8 |
|
|
| — |
| ||||||||
Other |
|
| 7.9 |
|
|
| 20.6 |
|
|
| 18.3 |
|
|
| 7.5 |
|
|
| $ | 1,984.1 |
|
| $ | 1,106.6 |
|
| $ | 1,234.8 |
|
| $ | 1,636.9 |
|
Accounts payable and accrued liabilities includes $53.8$15.3 million and $49.7$52.2 million of liabilities to creditors to whom we have issued checks that remained outstanding as of September 30, 20182019 and December 31, 2017. The current portion2018.
Permian Acquisition Contingent Consideration
As a result of a 2017 acquisition of certain gas gathering and processing and crude gathering assets in the Permian Acquisition contingent consideration representsBasin (the “Permian Acquisition”), we included the estimated fair value of the contingent consideration in accounts payable and accrued liabilities as of December 31, 2018. The contingent consideration earn-out payments due within twelve months of the respective balance sheet dates.period ended on February 28, 2019 and resulted in a $317.1 million payment in May 2019.
Note 9 — Debt Obligations
|
| September 30, 2018 |
|
| December 31, 2017 |
|
| September 30, 2019 |
|
| December 31, 2018 |
| ||||
Current: |
|
|
|
|
|
|
|
|
|
|
|
|
|
|
|
|
Accounts receivable securitization facility, due December 2018 (1) |
| $ | 290.0 |
|
| $ | 350.0 |
| ||||||||
Accounts receivable securitization facility, due December 2019 (1) |
| $ | 246.0 |
|
| $ | 280.0 |
| ||||||||
Senior unsecured notes, 4⅛% fixed rate, due November 2019 |
|
| — |
|
|
| 749.4 |
| ||||||||
|
|
| 246.0 |
|
|
| 1,029.4 |
| ||||||||
Debt issuance costs, net of amortization |
|
| — |
|
|
| (1.5 | ) | ||||||||
Finance lease liabilities |
|
| 12.0 |
|
|
| — |
| ||||||||
Current debt obligations |
|
| 258.0 |
|
|
| 1,027.9 |
| ||||||||
|
|
|
|
|
|
|
|
|
|
|
|
|
|
|
|
|
Long-term: |
|
|
|
|
|
|
|
|
|
|
|
|
|
|
|
|
Senior secured revolving credit facility, variable rate, due June 2023 (2) |
|
| — |
|
|
| 20.0 |
|
|
| 830.0 |
|
|
| 700.0 |
|
Senior unsecured notes: |
|
|
|
|
|
|
|
|
|
|
|
|
|
|
|
|
4⅛% fixed rate, due November 2019 |
|
| 749.4 |
|
|
| 749.4 |
| ||||||||
5¼% fixed rate, due May 2023 |
|
| 559.6 |
|
|
| 559.6 |
|
|
| 559.6 |
|
|
| 559.6 |
|
4¼% fixed rate, due November 2023 |
|
| 583.9 |
|
|
| 583.9 |
|
|
| 583.9 |
|
|
| 583.9 |
|
6¾% fixed rate, due March 2024 |
|
| 580.1 |
|
|
| 580.1 |
|
|
| 580.1 |
|
|
| 580.1 |
|
5⅛% fixed rate, due February 2025 |
|
| 500.0 |
|
|
| 500.0 |
|
|
| 500.0 |
|
|
| 500.0 |
|
5⅞% fixed rate, due April 2026 |
|
| 1,000.0 |
|
|
| — |
|
|
| 1,000.0 |
|
|
| 1,000.0 |
|
5⅜% fixed rate, due February 2027 |
|
| 500.0 |
|
|
| 500.0 |
|
|
| 500.0 |
|
|
| 500.0 |
|
6½% fixed rate, due July 2027 |
|
| 750.0 |
|
|
| — |
| ||||||||
5% fixed rate, due January 2028 |
|
| 750.0 |
|
|
| 750.0 |
|
|
| 750.0 |
|
|
| 750.0 |
|
TPL notes, 4¾% fixed rate, due November 2021 |
|
| 6.5 |
|
|
| 6.5 |
| ||||||||
TPL notes, 5⅞% fixed rate, due August 2023 |
|
| 48.1 |
|
|
| 48.1 |
| ||||||||
6⅞% fixed rate, due January 2029 |
|
| 750.0 |
|
|
| — |
| ||||||||
TPL notes, 4¾% fixed rate, due November 2021 (3) |
|
| 6.5 |
|
|
| 6.5 |
| ||||||||
TPL notes, 5⅞% fixed rate, due August 2023 (3) |
|
| 48.1 |
|
|
| 48.1 |
| ||||||||
Unamortized premium |
|
| 0.3 |
|
|
| 0.4 |
|
|
| 0.3 |
|
|
| 0.3 |
|
|
|
| 5,277.9 |
|
|
| 4,298.0 |
|
|
| 6,858.5 |
|
|
| 5,228.5 |
|
Debt issuance costs, net of amortization |
|
| (34.0 | ) |
|
| (30.0 | ) |
|
| (40.7 | ) |
|
| (31.1 | ) |
Finance lease liabilities |
|
| 26.9 |
|
|
| — |
| ||||||||
Long-term debt |
|
| 5,243.9 |
|
|
| 4,268.0 |
|
|
| 6,844.7 |
|
|
| 5,197.4 |
|
Total debt obligations |
| $ | 5,533.9 |
|
| $ | 4,618.0 |
|
| $ | 7,102.7 |
|
| $ | 6,225.3 |
|
Irrevocable standby letters of credit outstanding |
| $ | 76.6 |
|
| $ | 27.2 |
| ||||||||
Irrevocable standby letters of credit outstanding (2) |
| $ | 73.8 |
|
| $ | 79.5 |
| ||||||||
| (1) | As of September 30, |
|
| (2) | As of September 30, |
(3) | “TPL” refers to Targa Pipeline Partners LP. |
|
The following table shows the range of interest rates and weighted average interest rate incurred on our variable-rate debt obligations during the nine months ended September 30, 2018:
2019:
|
| Range of Interest Rates Incurred |
| Weighted Average Interest Rate Incurred |
|
TRP Revolver |
|
|
|
|
|
Accounts receivable securitization facility |
|
|
|
|
|
Compliance with Debt Covenants
As of September 30, 2018,2019, we were in compliance with the covenants contained in our various debt agreements.
Senior Unsecured Notes Issuance
In April 2018,January 2019, we issued $1.0 billion aggregate principal amount$750.0 million of 5⅞% senior notes due April 2026 (the “5⅞6½% Senior Notes due 2026”). We used theJuly 2027 and $750.0 million of 6⅞% Senior Notes due January 2029, resulting in total net proceeds of $991.9 million after costs$1,486.6 million. The net proceeds from this offeringthe issuance were used to repayredeem in full our 4⅛% Senior Notes due 2019, at par value plus accrued interest through the redemption date, with the remainder used for general partnership purposes, which included repayment of borrowings under our credit facilities and for general partnership purposes. The 5⅞facilities.
Debt Extinguishment
In February 2019, we redeemed in full our outstanding 4⅛% Senior Notes due 2026 are unsecured senior obligations that have substantially2019 at par value plus accrued interest through the same terms and covenants as our other senior notes.redemption date. The redemption resulted in a non-cash loss to write-off $1.4 million of unamortized debt issuance costs, which is included in Gain (loss) from financing activities in the Consolidated Statements of Operations.
In June 2018, we entered into an agreement to amend and restate the TRP Revolver, which extended the maturity date from October 2020 to June 2023, increased available commitments from $1.6 billion to $2.2 billion and lowered the applicable margin range and commitment fee range used in the calculation of interest. Our ability to request additional commitments of $500.0 million remained unchanged.
The TRP Revolver bears interest, at our option, either at the base rate or the Eurodollar rate. The base rate is equal to the highest of: (i) Bank of America’s prime rate; (ii) the federal funds rate plus 0.5%; or (iii) the one-month LIBOR rate plus 1.0%, plus an applicable margin (a) before the collateral release date, ranging from 0.25% to 1.25% dependent on our ratio of consolidated funded indebtedness to consolidated adjusted EBITDA and (b) upon and after the collateral release date, ranging from 0.125% to 0.75% dependent on our non-credit-enhanced senior unsecured long-term debt ratings. The Eurodollar rate is equal to LIBOR rate plus an applicable margin (i) before the collateral release date, ranging from 1.25% to 2.25% dependent on our ratio of consolidated funded indebtedness to consolidated adjusted EBITDA and (ii) upon and after the collateral release date, ranging from 1.125% to 1.75% dependent on our non-credit-enhanced senior unsecured long-term debt ratings.
We are required to pay a commitment fee equal to an applicable rate ranging from (a) before the collateral release date, 0.25% to 0.375% (dependent on our ratio of consolidated funded indebtedness to consolidated adjusted EBITDA) and (b) upon and after the collateral release date, 0.125% to 0.35% (dependent on our non-credit-enhanced senior unsecured long-term debt ratings) times the actual daily average unused portion of the TRP Revolver. Additionally, issued and undrawn letters of credit bear interest at an applicable margin (i) before the collateral release date, ranging from 1.25% to 2.25% dependent on our ratio of consolidated funded indebtedness to consolidated adjusted EBITDA and (ii) upon and after the collateral release date, ranging from 1.125% to 1.75% dependent on our non-credit-enhanced senior unsecured long-term debt ratings. The TRP Revolver’s covenants remained substantially the same.
During the nine months ended September 30, 2018, we incurred a loss of $1.3 million to partially write-off debt issuance costs associated with the TRP Revolver amendment as a result of a change in syndicate members. The remaining debt issuance costs, along with debt issuance costs incurred with this amendment, will be amortized on a straight-line basis over the TRP Revolver’s new term.
Note 10 — Other Long-term Liabilities
Other long-term liabilities areis comprised of the following obligations:
|
| September 30, 2018 |
|
| December 31, 2017 |
| ||
Asset retirement obligations |
| $ | 53.4 |
|
| $ | 50.3 |
|
Mandatorily redeemable preferred interests |
|
| 10.3 |
|
|
| 76.2 |
|
Deferred revenue |
|
| 176.4 |
|
|
| 136.2 |
|
Permian Acquisition contingent consideration, noncurrent portion |
|
| — |
|
|
| 310.2 |
|
Other liabilities |
|
| 5.1 |
|
|
| 3.1 |
|
Total long-term liabilities |
| $ | 245.2 |
|
| $ | 576.0 |
|
Asset Retirement Obligations
Ourdeferred revenue, asset retirement obligations (“ARO”) primarily relate to certain gas gathering pipelines and processing facilities.
Mandatorily Redeemable Preferred Interests
Our consolidated financial statements include our interest in two joint ventures that, separately, own a 100% interest in the WestOK natural gas gathering and processing system and a 72.8% undivided interest in the WestTX natural gas gathering and processing system. Our partner in the joint ventures holds preferred interests in each joint venture that are redeemable: (i) at our or our partner’s election, on or after July 27, 2022; and (ii) mandatorily, in July 2037.
For reporting purposes under GAAP, an estimate of our partner’s interest in each joint venture is required to be recorded as if the redemption had occurred on the reporting date. As redemption cannot occur before 2022, the actual value of our partner’s allocable share of each joint venture’s assets at the time of redemption may differ from our estimate of redemption value as of September 30, 2018.operating lease liabilities.
In February 2018, the parties amended the agreements governing each joint venture to: (i) increase the priority return for capital contributions made on or after January 1, 2017; and (ii) add a non-consent feature effective with respect to certain capital projects undertaken on or after January 1, 2017. During the nine months ended September 30, 2018, the change in the estimated redemption value of the mandatorily redeemable preferred interests is primarily attributable to the amendments.
Deferred Revenue
We have certain long-term contractual arrangements underfor which we have received consideration but which require future performance by Targa. These arrangements result inthat we are not yet able to recognize as revenue. The resulting deferred revenue which will be recognized over the periods that performance will be provided.once all conditions for revenue recognition have been met.
Deferred revenue as of September 30, 2019 and December 31, 2018, was $173.0 million and $175.5 million, respectively, which includes consideration$129.0 million of payments received from Vitol Americas Corp. (“Vitol”) (formerly known as Noble Americas Corp.), a subsidiary of Vitol US Holding Co., in 2016, 2017, and 2018 as part of an agreement (the “Splitter Agreement”) related to the construction and operation of a crude oil and condensate splitter. On December 27, 2015, Targa Terminals LLC and Noble Americas Corp., then a subsidiary of Noble Group Ltd., entered into a long-term, fee-based agreement (the “Splitter Agreement”) under which we will build and operate a crude oil and condensate splitter at our Channelview Terminal on the Houston Ship Channel (the “Channelview Splitter”) and provide approximately 730,000 Bbl of storage capacity. The Channelview Splitter will have the capability to split approximately 35,000 Bbl/d of crude oil and condensate into its various components, including naphtha, kerosene, gas oil, jet fuel and liquefied petroleum gas and will provide segregated storage for the crude, condensate and components. The Channelview Splitter project is expected to be substantially completed inIn December 2018, and has an estimated total cost of approximately $150 million. In January 2018, Vitol US Holding Co. acquired Noble Americas Corp.As of September 30, 2018,elected to terminate the Splitter Agreement. The Splitter Agreement provides that the first three annual payments due underare ours if Vitol elects to terminate, which Vitol disputes. The timing of revenue recognition related to the Splitter Agreement totaling $129.0 million, have been received.
deferred revenue is dependent upon resolution of the dispute with Vitol. Deferred revenue also includes nonmonetary consideration received in a 2015 amendment to a gas gathering and processing agreement and consideration received for other construction activities of facilities connected to our systems.
The following table shows the changes in deferred revenue:
Balance at December 31, 2017 |
| $ | 136.2 |
|
Additions |
|
| 43.1 |
|
Revenue recognized |
|
| (2.9 | ) |
Balance at September 30, 2018 |
| $ | 176.4 |
|
Permian Acquisition Contingent ConsiderationNote 11 – Leases
Upon closingWe have non-cancellable operating leases primarily associated with our office facilities, rail assets, land, and storage and terminal assets. We have finance leases primarily associated with our tractors and vehicles. Our leases have remaining lease terms of 1 to 6 years, some of which include options to extend the Permian Acquisition, a contingent consideration liability arising from potential earn-out provisions was recognized at its preliminary fair value. See Note 4 – Newly-Formed Joint Ventures, Acquisitionslease term for up to 10 years.
The balances of right-of-use assets and Divestitures. The first potential earn-out payment would have occurred in May 2018 while the second potential earn-out payment would occur in May 2019. The acquisition date fair valueliabilities of the contingent consideration of $416.3 million was recorded within Other long-term liabilitiesfinance leases and operating leases, and their locations on our Consolidated Balance Sheets. ForSheets are as follows:
|
| Balance Sheet Location |
| September 30, 2019 |
| |
Right-of-use assets |
|
|
|
|
|
|
Operating leases, gross |
| Other long-term assets |
| $ | 31.5 |
|
Finance leases, gross |
| Property, plant and equipment |
|
| 46.9 |
|
|
|
|
|
|
|
|
Lease liabilities |
|
|
|
|
|
|
Current: |
|
|
|
|
|
|
Operating leases |
| Accounts payable and accrued liabilities |
| $ | 6.9 |
|
Finance leases |
| Current debt obligations |
|
| 12.0 |
|
Non-current: |
|
|
|
|
|
|
Operating leases |
| Other long-term liabilities |
| $ | 19.6 |
|
Finance leases |
| Long-term debt |
|
| 26.9 |
|
Operating lease costs and short-term lease costs are included in Operating expenses or General and administrative expense in our Consolidated Statements of Operations, depending on the period from the acquisition date to December 31, 2017, the fair valuenature of the contingent consideration decreased by $99.3 million, bringing the total Permian Acquisition contingent considerationleases. Finance lease costs are included in Depreciation and amortization expense and Interest expense, net in our Consolidated Statements of Operations. The components of lease expense were as follows:
|
| Three Months Ended September 30, 2019 |
|
| Nine Months Ended September 30, 2019 |
| ||
Lease cost |
|
|
|
|
|
|
|
|
Operating lease cost |
| $ | 2.2 |
|
| $ | 6.0 |
|
Short-term lease cost |
|
| 6.7 |
|
|
| 22.4 |
|
Variable lease cost |
|
| 0.8 |
|
|
| 3.6 |
|
Finance lease cost |
|
|
|
|
|
|
|
|
Amortization of right-of-use assets |
|
| 3.4 |
|
|
| 9.7 |
|
Interest expense |
|
| 0.4 |
|
|
| 1.2 |
|
Total lease cost |
| $ | 13.5 |
|
| $ | 42.9 |
|
Other supplemental information related to $317.0 million at December 31, 2017, of which $6.8 million was a current liability.our leases are as follows:
|
|
|
| Nine Months Ended September 30, 2019 |
| |
Cash paid for amounts included in the measurement of lease liabilities: |
|
|
|
|
|
|
Operating cash flows for operating leases |
|
|
| $ | 6.1 |
|
Operating cash flows for finance leases |
|
|
|
| 1.2 |
|
Financing cash flows for finance leases |
|
|
|
| 8.5 |
|
The weighted-average remaining lease terms for operating leases and finance leases are 4 years and 3 years, respectively. The weighted-average discount rates for operating leases and finance leases are 3.9% and 3.9%, respectively.
The portionfollowing table presents the maturities of the earn-out due in 2018 expired with no required payment. For the period from December 31, 2017 to September 30, 2018, the fair value of the contingent consideration increased by $12.0 million. Asour lease liabilities under non-cancellable leases as of September 30, 2018, the fair value of the second potential earn-out payment of $329.0 million has been recorded as a component of accounts payable and accrued liabilities, which are current liabilities on our Consolidated Balance Sheets. See Note 13 – Fair Value Measurements for additional discussion of the fair value methodology.2019:
|
| Operating Leases |
|
| Finance Leases |
| ||
Future Minimum Lease Payments Beginning After September 30, |
|
|
|
|
|
|
|
|
2019 |
| $ | 7.8 |
|
| $ | 13.3 |
|
2020 |
|
| 6.9 |
|
|
| 11.4 |
|
2021 |
|
| 6.1 |
|
|
| 10.3 |
|
2022 |
|
| 4.6 |
|
|
| 6.1 |
|
2023 |
|
| 2.6 |
|
|
| 0.6 |
|
Thereafter |
|
| 0.7 |
|
|
| — |
|
Total undiscounted cash flows |
|
| 28.7 |
|
|
| 41.7 |
|
Less imputed interest |
|
| (2.2 | ) |
|
| (2.8 | ) |
Total lease liabilities |
| $ | 26.5 |
|
| $ | 38.9 |
|
The following table presents future minimum payments under non-cancellable leases as of December 31, 2018:
|
| Leases |
| |
2019 |
| $ | 20.5 |
|
2020 |
|
| 17.7 |
|
2021 |
|
| 14.9 |
|
2022 |
|
| 12.6 |
|
2023 |
|
| 6.0 |
|
Thereafter |
|
| 1.7 |
|
Total payments |
| $ | 73.4 |
|
|
|
|
|
|
Note 1112 — Partnership UnitsUnits and Related Matters
Distributions
TRC is entitled to receive all Partnership distributions after payment of preferred unit distributions each quarter.
The following table details the distributions declared and/orand paid by us for the nine months ended September 30, 2018:2019:
Three Months Ended |
| Date Paid Or to Be Paid |
| Total Distributions |
|
| Distributions to Targa Resources Corp. |
| ||
September 30, 2018 |
| November 13, 2018 | $ |
| 237.6 |
| $ |
| 234.8 |
|
June 30, 2018 |
| August 13, 2018 |
|
| 234.0 |
|
|
| 231.2 |
|
March 31, 2018 |
| May 11, 2018 |
|
| 229.7 |
|
|
| 226.9 |
|
December 31, 2017 |
| February 12, 2018 |
|
| 228.5 |
|
|
| 225.7 |
|
Three Months Ended |
| Date Paid or To Be Paid |
| Total Distributions |
|
| Distributions to Targa Resources Corp. |
| ||
September 30, 2019 |
| November 13, 2019 | $ |
| 242.1 |
| $ |
| 239.3 |
|
June 30, 2019 |
| August 13, 2019 |
|
| 242.4 |
|
|
| 239.6 |
|
March 31, 2019 |
| April 5, 2019 |
|
| 437.8 |
|
|
| 435.0 |
|
December 31, 2018 |
| February 13, 2019 |
|
| 241.3 |
|
|
| 238.5 |
|
Contributions
All capital contributions to us continue to be allocated 98% to the limited partner and 2% to our general partner; however, no0 units will be issued for those contributions. During the three and nine months ended September 30, 2018,2019, TRC made total capital contributions of $10.0 million and $200.0 million to us of $540.0 million.us.
Preferred Units
Our Preferred Units rank senior to our common units with respect to the distribution rights. Distributions on our 5,000,000 Preferred Units are cumulative from the date of original issue in October 2015 and are payable monthly in arrears on the 15th day of each month of each year, when, as and if declared by the board of directors of our general partner. Distributions on our Preferred Units are payable out of amounts legally available at a rate equal to 9.0% per annum. On and after November 1, 2020, distributions on our Preferred Units will accumulate at an annual floating rate equal to the one-month LIBOR plus a spread of 7.71%.
We paid $2.8 million and $8.4 million of distributions to the holders of preferred unitsPreferred Units (“Preferred Unitholders”) for the three and nine months ended September 30, 2018.2019.
Subsequent Event
In October 2018,2019, the board of directors of our general partner declared a cash distribution of $0.1875 per Preferred Unit, resulting in approximately $0.9 million in distributions that will be paid on November 15, 2018.2019.
Note 1213 — Derivative Instruments and Hedging Activities
The primary purpose of our commodity risk management activities is to manage our exposure to commodity price risk and reduce volatility in our operating cash flow due to fluctuations in commodity prices. We have entered into derivative instruments to hedge the commodity price risks associated with a portion of our expected (i) natural gas, NGL, and condensate equity volumes in our Gathering and Processing operations that result from percent-of-proceeds processing arrangements, and (ii) future commodity purchases and sales in our Logistics and Marketing segment and (iii) natural gas transportation basis risk in our Logistics and Marketing segment. TheseThe hedge positions associated with (i) and (ii) above will move favorably in periods of falling commodity prices and unfavorably in periods of rising commodity prices. We haveprices and are designated these derivative contracts as cash flow hedges for accounting purposes.
The hedges generally match the NGL product composition and the NGL delivery points of our physical equity volumes. Our natural gas hedges are a mixture of specific gas delivery points and Henry Hub. The NGL hedges may be transacted as specific NGL hedges or as baskets of ethane, propane, normal butane, isobutane and natural gasoline based upon our expected equity NGL composition. We believe this approach avoids uncorrelated risks resulting from employing hedges on crude oil or other petroleum products as “proxy” hedges of NGL prices. Our natural gas and NGL hedges are settled using published index prices for delivery at various locations.
We hedge a portion of our condensate equity volumes using crude oil hedges that are based on the NYMEX futures contracts for West Texas Intermediate light, sweet crude, which approximates the prices received for condensate. This exposes us to a market differential risk if the NYMEX futures do not move in exact parity with the sales price of our underlying condensate equity volumes.
We also enter into derivative instruments to help manage other short-term commodity-related business risks. We have not designated these derivatives as hedges and record changes in fair value and cash settlements to revenues.
At September 30, 2018,2019, the notional volumes of our commodity derivative contracts were:
Commodity | Instrument | Unit | 2018 |
| 2019 |
| 2020 |
| 2021 |
| 2022 |
| 2023 |
| Instrument | Unit | 2019 |
| 2020 |
| 2021 |
| 2022 |
| 2023 |
| 2024 |
| ||||||||||||
Natural Gas | Swaps | MMBtu/d |
| 210,109 |
| 158,246 |
| 31,630 |
| 11,821 |
| - |
| - |
| Swaps | MMBtu/d |
| 172,254 |
| 96,130 |
| 85,151 |
| 7,500 |
| - |
| - |
| ||||||||||
Natural Gas | Basis Swaps | MMBtu/d |
| 158,478 |
| 109,281 |
| 70,417 |
| 56,658 |
| 40,000 |
| 20,000 |
| Basis Swaps | MMBtu/d |
| 398,098 |
| 352,260 |
| 339,360 |
| 200,000 |
| 200,000 |
| 40,000 |
| ||||||||||
NGL | Swaps | Bbl/d |
| 19,820 |
| 16,269 |
| 11,607 |
| 2,434 |
| - |
| - |
| Swaps | Bbl/d |
| 30,468 |
| 20,305 |
| 8,396 |
| 3,236 |
| - |
| - |
| ||||||||||
NGL | Futures | Bbl/d |
| 33,620 |
| 2,890 |
| 3,115 |
| - |
| - |
| - |
| Futures | Bbl/d |
| 29,620 |
| 15,495 |
| - |
| - |
| - |
| - |
| ||||||||||
NGL | Options | Bbl/d |
| 1,310 |
| 410 |
| - |
| - |
| - |
| - |
| Options | Bbl/d |
| 410 |
| - |
| - |
| - |
| - |
| - |
| ||||||||||
Condensate | Swaps | Bbl/d |
| 4,990 |
| 3,413 |
| 1,170 |
| 388 |
| - |
| - |
| Swaps | Bbl/d |
| 4,170 |
| 4,140 |
| 3,154 |
| 1,110 |
| - |
| - |
| ||||||||||
Condensate | Options | Bbl/d |
| 590 |
| 590 |
| - |
| - |
| - |
| - |
| Options | Bbl/d |
| 590 |
| - |
| - |
| - |
| - |
| - |
| ||||||||||
Our derivative contracts are subject to netting arrangements that permit our contracting subsidiaries to net cash settle offsetting asset and liability positions with the same counterparty within the same Targa entity. We record derivative assets and liabilities on our Consolidated Balance Sheets on a gross basis, without considering the effect of master netting arrangements. The following schedules reflect the fair valuesvalue of our derivative instruments and their location on our Consolidated Balance Sheets as well as pro forma reporting assuming that we reported derivatives subject to master netting agreements on a net basis:
|
|
|
| Fair Value as of September 30, 2018 |
|
| Fair Value as of December 31, 2017 |
|
|
|
| Fair Value as of September 30, 2019 |
|
| Fair Value as of December 31, 2018 |
| ||||||||||||||||||||
|
| Balance Sheet |
| Derivative |
|
| Derivative |
|
| Derivative |
|
| Derivative |
|
| Balance Sheet |
| Derivative |
|
| Derivative |
|
| Derivative |
|
| Derivative |
| ||||||||
|
| Location |
| Assets |
|
| Liabilities |
|
| Assets |
|
| Liabilities |
|
| Location |
| Assets |
|
| Liabilities |
|
| Assets |
|
| Liabilities |
| ||||||||
Derivatives designated as hedging instruments |
|
|
|
|
|
|
|
|
|
|
|
|
|
|
|
|
|
|
|
|
|
|
|
|
|
|
|
|
|
|
|
|
|
|
|
|
Commodity contracts |
| Current |
| $ | 57.5 |
|
| $ | 164.1 |
|
| $ | 37.9 |
|
| $ | 78.6 |
|
| Current |
| $ | 138.2 |
|
| $ | (11.4 | ) |
| $ | 112.5 |
|
| $ | (18.9 | ) |
|
| Long-term |
|
| 6.9 |
|
|
| 65.2 |
|
|
| 23.2 |
|
|
| 18.7 |
|
| Long-term |
|
| 56.6 |
|
|
| (1.1 | ) |
|
| 31.6 |
|
|
| (1.5 | ) |
Total derivatives designated as hedging instruments |
|
|
| $ | 64.4 |
|
| $ | 229.3 |
|
| $ | 61.1 |
|
| $ | 97.3 |
|
|
|
| $ | 194.8 |
|
| $ | (12.5 | ) |
| $ | 144.1 |
|
| $ | (20.4 | ) |
Derivatives not designated as hedging instruments |
|
|
|
|
|
|
|
|
|
|
|
|
|
|
|
|
|
|
|
|
|
|
|
|
|
|
|
|
|
|
|
|
|
|
|
|
Commodity contracts |
| Current |
| $ | 2.1 |
|
| $ | 12.2 |
|
| $ | — |
|
| $ | 1.1 |
|
| Current |
| $ | 1.9 |
|
| $ | (72.1 | ) |
| $ | 2.8 |
|
| $ | (14.7 | ) |
|
| Long-term |
|
| 1.5 |
|
|
| 2.3 |
|
|
| — |
|
|
| 0.9 |
|
| Long-term |
|
| 3.4 |
|
|
| (45.0 | ) |
|
| 2.5 |
|
|
| (1.6 | ) |
Total derivatives not designated as hedging instruments |
|
|
| $ | 3.6 |
|
| $ | 14.5 |
|
| $ | — |
|
| $ | 2.0 |
|
|
|
| $ | 5.3 |
|
| $ | (117.1 | ) |
| $ | 5.3 |
|
| $ | (16.3 | ) |
Total current position |
|
|
| $ | 59.6 |
|
| $ | 176.3 |
|
| $ | 37.9 |
|
| $ | 79.7 |
|
|
|
| $ | 140.1 |
|
| $ | (83.5 | ) |
| $ | 115.3 |
|
| $ | (33.6 | ) |
Total long-term position |
|
|
|
| 8.4 |
|
|
| 67.5 |
|
|
| 23.2 |
|
|
| 19.6 |
|
|
|
|
| 60.0 |
|
|
| (46.1 | ) |
|
| 34.1 |
|
|
| (3.1 | ) |
Total derivatives |
|
|
| $ | 68.0 |
|
| $ | 243.8 |
|
| $ | 61.1 |
|
| $ | 99.3 |
|
|
|
| $ | 200.1 |
|
| $ | (129.6 | ) |
| $ | 149.4 |
|
| $ | (36.7 | ) |
The pro forma impact of reporting derivatives on our Consolidated Balance Sheets on a net basis is as follows:
|
| Gross Presentation |
|
| Pro Forma Net Presentation |
|
| Gross Presentation |
|
| Pro Forma Net Presentation |
| ||||||||||||||||||||||||||||
September 30, 2018 | Asset |
|
| Liability |
|
| Collateral |
|
| Asset |
|
| Liability |
| ||||||||||||||||||||||||||
September 30, 2019 | September 30, 2019 | Asset |
|
| Liability |
|
| Collateral |
|
| Asset |
|
| Liability |
| |||||||||||||||||||||||||
Current Position | Current Position |
|
|
|
|
|
|
|
|
|
|
|
|
|
|
|
|
|
|
| Current Position |
|
|
|
|
|
|
|
|
|
|
|
|
|
|
|
|
|
|
|
| Counterparties with offsetting positions or collateral | $ | 59.6 |
|
| $ | (163.6 | ) |
| $ | 39.0 |
|
| $ | 11.3 |
|
| $ | (76.3 | ) | Counterparties with offsetting positions or collateral | $ | 103.9 |
|
| $ | (69.5 | ) |
| $ | (25.2 | ) |
| $ | 62.5 |
|
| $ | (53.3 | ) |
| Counterparties without offsetting positions - assets |
| - |
|
|
| - |
|
|
| - |
|
|
| - |
|
|
| - |
| Counterparties without offsetting positions - assets |
| 36.2 |
|
|
| - |
|
|
| - |
|
|
| 36.2 |
|
|
| - |
|
| Counterparties without offsetting positions - liabilities |
| - |
|
|
| (12.7 | ) |
|
| - |
|
|
| - |
|
|
| (12.7 | ) | Counterparties without offsetting positions - liabilities |
| - |
|
|
| (14.0 | ) |
|
| - |
|
|
| - |
|
|
| (14.0 | ) |
|
|
| 59.6 |
|
|
| (176.3 | ) |
|
| 39.0 |
|
|
| 11.3 |
|
|
| (89.0 | ) |
|
| 140.1 |
|
|
| (83.5 | ) |
|
| (25.2 | ) |
|
| 98.7 |
|
|
| (67.3 | ) |
Long Term Position | Long Term Position |
|
|
|
|
|
|
|
|
|
|
|
|
|
|
|
|
|
|
| Long Term Position |
|
|
|
|
|
|
|
|
|
|
|
|
|
|
|
|
|
|
|
| Counterparties with offsetting positions or collateral |
| 8.4 |
|
|
| (42.2 | ) |
|
| - |
|
|
| - |
|
|
| (33.8 | ) | Counterparties with offsetting positions or collateral |
| 47.1 |
|
|
| (46.1 | ) |
|
| - |
|
|
| 32.1 |
|
|
| (31.1 | ) |
| Counterparties without offsetting positions - assets |
| - |
|
|
| - |
|
|
| - |
|
|
| - |
|
|
| - |
| Counterparties without offsetting positions - assets |
| 12.9 |
|
|
| - |
|
|
| - |
|
|
| 12.9 |
|
|
| - |
|
| Counterparties without offsetting positions - liabilities |
| - |
|
|
| (25.3 | ) |
|
| - |
|
|
| - |
|
|
| (25.3 | ) | Counterparties without offsetting positions - liabilities |
| - |
|
|
| - |
|
|
| - |
|
|
| - |
|
|
| - |
|
|
|
| 8.4 |
|
|
| (67.5 | ) |
|
| - |
|
|
| - |
|
|
| (59.1 | ) |
|
| 60.0 |
|
|
| (46.1 | ) |
|
| - |
|
|
| 45.0 |
|
|
| (31.1 | ) |
Total Derivatives | Total Derivatives |
|
|
|
|
|
|
|
|
|
|
|
|
|
|
|
|
|
|
| Total Derivatives |
|
|
|
|
|
|
|
|
|
|
|
|
|
|
|
|
|
|
|
| Counterparties with offsetting positions or collateral |
| 68.0 |
|
|
| (205.8 | ) |
|
| 39.0 |
|
|
| 11.3 |
|
|
| (110.1 | ) | Counterparties with offsetting positions or collateral |
| 151.0 |
|
|
| (115.6 | ) |
|
| (25.2 | ) |
|
| 94.6 |
|
|
| (84.4 | ) |
| Counterparties without offsetting positions - assets |
| - |
|
|
| - |
|
|
| - |
|
|
| - |
|
|
| - |
| Counterparties without offsetting positions - assets |
| 49.1 |
|
|
| - |
|
|
| - |
|
|
| 49.1 |
|
|
| - |
|
| Counterparties without offsetting positions - liabilities |
| - |
|
|
| (38.0 | ) |
|
| - |
|
|
| - |
|
|
| (38.0 | ) | Counterparties without offsetting positions - liabilities |
| - |
|
|
| (14.0 | ) |
|
| - |
|
|
| - |
|
|
| (14.0 | ) |
|
| $ | 68.0 |
|
| $ | (243.8 | ) |
| $ | 39.0 |
|
| $ | 11.3 |
|
| $ | (148.1 | ) |
| $ | 200.1 |
|
| $ | (129.6 | ) |
| $ | (25.2 | ) |
| $ | 143.7 |
|
| $ | (98.4 | ) |
|
|
|
|
|
|
|
|
|
|
|
|
|
|
|
|
|
|
|
|
|
|
|
|
|
|
|
|
|
|
|
|
|
|
|
|
|
|
|
|
|
|
| Gross Presentation |
|
| Pro Forma Net Presentation |
|
| Gross Presentation |
|
| Pro Forma Net Presentation |
| ||||||||||||||||||||||||||||
December 31, 2017 | Asset |
|
| Liability |
|
| Collateral |
|
| Asset |
|
| Liability |
| ||||||||||||||||||||||||||
December 31, 2018 | December 31, 2018 | Asset |
|
| Liability |
|
| Collateral |
|
| Asset |
|
| Liability |
| |||||||||||||||||||||||||
Current Position | Current Position |
|
|
|
|
|
|
|
|
|
|
|
|
|
|
|
|
|
|
| Current Position |
|
|
|
|
|
|
|
|
|
|
|
|
|
|
|
|
|
|
|
| Counterparties with offsetting positions or collateral | $ | 37.9 |
|
| $ | (74.7 | ) |
| $ | 22.9 |
|
| $ | 13.8 |
|
| $ | (27.7 | ) | Counterparties with offsetting positions or collateral | $ | 100.0 |
|
| $ | (33.6 | ) |
| $ | (14.2 | ) |
| $ | 70.0 |
|
| $ | (17.8 | ) |
| Counterparties without offsetting positions - assets |
| - |
|
|
| - |
|
|
| - |
|
|
| - |
|
|
| - |
| Counterparties without offsetting positions - assets |
| 15.3 |
|
|
| - |
|
|
| - |
|
|
| 15.3 |
|
|
| - |
|
| Counterparties without offsetting positions - liabilities |
| - |
|
|
| (5.0 | ) |
|
| - |
|
|
| - |
|
|
| (5.0 | ) | Counterparties without offsetting positions - liabilities |
| - |
|
|
| - |
|
|
| - |
|
|
| - |
|
|
| - |
|
|
|
| 37.9 |
|
|
| (79.7 | ) |
|
| 22.9 |
|
|
| 13.8 |
|
|
| (32.7 | ) |
|
| 115.3 |
|
|
| (33.6 | ) |
|
| (14.2 | ) |
|
| 85.3 |
|
|
| (17.8 | ) |
Long Term Position | Long Term Position |
|
|
|
|
|
|
|
|
|
|
|
|
|
|
|
|
|
|
| Long Term Position |
|
|
|
|
|
|
|
|
|
|
|
|
|
|
|
|
|
|
|
| Counterparties with offsetting positions or collateral |
| 23.2 |
|
|
| (17.3 | ) |
|
| - |
|
|
| 14.8 |
|
|
| (8.9 | ) | Counterparties with offsetting positions or collateral |
| 8.9 |
|
|
| (3.1 | ) |
|
| - |
|
|
| 5.9 |
|
|
| (0.1 | ) |
| Counterparties without offsetting positions - assets |
| - |
|
|
| - |
|
|
| - |
|
|
| - |
|
|
| - |
| Counterparties without offsetting positions - assets |
| 25.2 |
|
|
| - |
|
|
| - |
|
|
| 25.2 |
|
|
| - |
|
| Counterparties without offsetting positions - liabilities |
| - |
|
|
| (2.3 | ) |
|
| - |
|
|
| - |
|
|
| (2.3 | ) | Counterparties without offsetting positions - liabilities |
| - |
|
|
| - |
|
|
| - |
|
|
| - |
|
|
| - |
|
|
|
| 23.2 |
|
|
| (19.6 | ) |
|
| - |
|
|
| 14.8 |
|
|
| (11.2 | ) |
|
| 34.1 |
|
|
| (3.1 | ) |
|
| - |
|
|
| 31.1 |
|
|
| (0.1 | ) |
Total Derivatives | Total Derivatives |
|
|
|
|
|
|
|
|
|
|
|
|
|
|
|
|
|
|
| Total Derivatives |
|
|
|
|
|
|
|
|
|
|
|
|
|
|
|
|
|
|
|
| Counterparties with offsetting positions or collateral |
| 61.1 |
|
|
| (92.0 | ) |
|
| 22.9 |
|
|
| 28.6 |
|
|
| (36.6 | ) | Counterparties with offsetting positions or collateral |
| 108.9 |
|
|
| (36.7 | ) |
|
| (14.2 | ) |
|
| 75.9 |
|
|
| (17.9 | ) |
| Counterparties without offsetting positions - assets |
| - |
|
|
| - |
|
|
| - |
|
|
| - |
|
|
| - |
| Counterparties without offsetting positions - assets |
| 40.5 |
|
|
| - |
|
|
| - |
|
|
| 40.5 |
|
|
| - |
|
| Counterparties without offsetting positions - liabilities |
| - |
|
|
| (7.3 | ) |
|
| - |
|
|
| - |
|
|
| (7.3 | ) | Counterparties without offsetting positions - liabilities |
| - |
|
|
| - |
|
|
| - |
|
|
| - |
|
|
| - |
|
|
| $ | 61.1 |
|
| $ | (99.3 | ) |
| $ | 22.9 |
|
| $ | 28.6 |
|
| $ | (43.9 | ) |
| $ | 149.4 |
|
| $ | (36.7 | ) |
| $ | (14.2 | ) |
| $ | 116.4 |
|
| $ | (17.9 | ) |
Our payment obligations in connection with a majority of these hedging transactions are secured by a first priority lien in the collateral securing the TRP Revolver that ranks equal in right of payment with liens granted in favor of our senior secured lenders. Some of our hedges are futures contracts executed through a brokerbrokers that clearsclear the hedges through an exchange. We maintain a margin deposit with the brokerbrokers in an amount sufficient enough to cover the fair value of our open futures positions. The margin deposit is considered collateral, which is located within other current assets on our Consolidated Balance Sheets and is not offset against the fair valuesvalue of our derivative instruments.
The fair value of our derivative instruments, depending on the type of instrument, was determined by the use of present value methods or standard option valuation models with assumptions about commodity prices based on those observed in underlying markets. The estimated fair value of our derivative instruments was a net liabilityasset of $175.8$70.5 million as of September 30, 2018.2019. The estimated fair value is net of an adjustment for credit risk based on the default probabilities as indicated by market quotes for the counterparties’ credit default swap rates. The credit risk adjustment was immaterial for all periods presented. Our futures contracts that are cleared through an exchange are margined daily and do not require any credit adjustment.
The following tables reflect amounts recorded in Other Comprehensive Incomecomprehensive income (“OCI”) and amounts reclassified from OCI to revenue and expense for the periods indicated:
|
| Gain (Loss) Recognized in OCI on Derivatives (Effective Portion) |
|
| Gain (Loss) Recognized in OCI on Derivatives (Effective Portion) |
| ||||||||||||||||||||||||||
Derivatives in Cash Flow |
| Three Months Ended September 30, |
|
| Nine Months Ended September 30, |
|
| Three Months Ended September 30, |
|
| Nine Months Ended September 30, |
| ||||||||||||||||||||
Hedging Relationships |
| 2018 |
|
| 2017 |
|
| 2018 |
|
| 2017 |
|
| 2019 |
|
| 2018 |
|
| 2019 |
|
| 2018 |
| ||||||||
Commodity contracts |
| $ | (139.6 | ) |
| $ | (106.8 | ) |
| $ | (178.0 | ) |
| $ | (10.5 | ) |
| $ | 118.2 |
|
| $ | (139.6 | ) |
| $ | 167.8 |
|
| $ | (178.0 | ) |
|
| Gain (Loss) Reclassified from OCI into Income (Effective Portion) |
|
| Gain (Loss) Reclassified from OCI into Income (Effective Portion) |
| ||||||||||||||||||||||||||
|
| Three Months Ended September 30, |
|
| Nine Months Ended September 30, |
|
| Three Months Ended September 30, |
|
| Nine Months Ended September 30, |
| ||||||||||||||||||||
Location of Gain (Loss) |
| 2018 |
|
| 2017 |
|
| 2018 |
|
| 2017 |
|
| 2019 |
|
| 2018 |
|
| 2019 |
|
| 2018 |
| ||||||||
Revenues |
| $ | (23.9 | ) |
| $ | (2.1 | ) |
| $ | (58.3 | ) |
| $ | (2.2 | ) |
| $ | 41.5 |
|
| $ | (23.9 | ) |
| $ | 106.1 |
|
| $ | (58.3 | ) |
Based on valuations as of September 30, 2019, we expect to reclassify commodity hedge-related deferred gains of $182.2 million included in accumulated other comprehensive income into earnings before income taxes through the end of 2022, with $126.7 million of gains to be reclassified over the next twelve months.
Our consolidated earnings are also affected by the use of the mark-to-market method of accounting for derivative instruments that do not qualify for hedge accounting or that have not been designated as hedges. The changes in fair value of these instruments are recorded on the balance sheet and through earnings rather than being deferred until the anticipated transaction settles. The use of mark-to-market accounting for financial instruments can cause non-cash earnings volatility due to changes in the underlying commodity price indices. For the three and nine months ended September 30, 2019, the unrealized mark-to-market losses are primarily attributable to unfavorable movements in natural gas forward basis prices.
|
| Location of Gain |
| Gain (Loss) Recognized in Income on Derivatives |
|
| Location of Gain |
| Gain (Loss) Recognized in Income on Derivatives |
| ||||||||||||||||||||||||||
Derivatives Not Designated |
| Recognized in Income on |
| Three Months Ended September 30, |
|
| Nine Months Ended September 30, |
|
| Recognized in Income on |
| Three Months Ended September 30, |
|
| Nine Months Ended September 30, |
| ||||||||||||||||||||
as Hedging Instruments |
| Derivatives |
| 2018 |
|
| 2017 |
|
| 2018 |
|
| 2017 |
|
| Derivatives |
| 2019 |
|
| 2018 |
|
| 2019 |
|
| 2018 |
| ||||||||
Commodity contracts |
| Revenue |
| $ | (1.1 | ) |
| $ | (1.5 | ) |
| $ | (14.1 | ) |
| $ | (2.9 | ) |
| Revenue |
| $ | (103.3 | ) |
| $ | (1.1 | ) |
| $ | (113.8 | ) |
| $ | (14.1 | ) |
Based on valuations as of September 30, 2018, we expect to reclassify commodity hedge-related deferred losses of $164.9 million included in accumulated other comprehensive income into earnings before income taxes through the end of 2021, with $106.6 million of losses to be reclassified over the next twelve months.
See Note 1314 – Fair Value Measurements and Note 1920 – Segment Information for additional disclosures related to derivative instruments and hedging activities.
Note 1314 — Fair Value Measurements
Under GAAP, our Consolidated Balance Sheets reflect a mixture of measurement methods for financial assets and liabilities (“financial instruments”). Derivative financial instruments and contingent consideration related to business acquisitions are reported at fair value on our Consolidated Balance Sheets. Other financial instruments are reported at historical cost or amortized cost on our Consolidated Balance Sheets. The following are additional qualitative and quantitative disclosures regarding fair value measurements of financial instruments.
Fair Value of Derivative Financial Instruments
Our derivative instruments consist of financially settled commodity swaps, futures, option contracts and fixed-price forward commodity contracts with certain counterparties. We determine the fair value of our derivative contracts using present value methods or standard option valuation models with assumptions about commodity prices based on those observed in underlying markets. We have consistently applied these valuation techniques in all periods presented and we believe we have obtained the most accurate information available for the types of derivative contracts we hold.
The fair values of our derivative instruments are sensitive to changes in forward pricing on natural gas, NGLs and crude oil. The financial position of these derivatives at September 30, 2018,2019, a net liabilityasset position of $175.8$70.5 million, reflects the present value, adjusted for counterparty credit risk, of the amount we expect to receive or pay in the future on our derivative contracts. If forward pricing on natural gas, NGLs and crude oil were to increase by 10%, the result would be a fair value reflecting a net liability of $281.7$34.0 million, ignoring an adjustment for counterparty credit risk. If forward pricing on natural gas, NGLs and crude oil were to decrease by 10%, the result would be a fair value reflecting a net liabilityasset of $69.9$175.4 million, ignoring an adjustment for counterparty credit risk.
Fair Value of Other Financial Instruments
Due to their cash or near-cash nature, the carrying value of other financial instruments included in working capital (i.e., cash and cash equivalents, accounts receivable, accounts payable) approximates their fair value. Long-term debt is primarily the other financial instrument for which carrying value could vary significantly from fair value. We determined the supplemental fair value disclosures for our long-term debt as follows:
The TRP Revolver and the accounts receivable securitization facility are based on carrying value, which approximates fair value as their interest rates are based on prevailing market rates; and
• | The TRP Revolver and the accounts receivable securitization facility are based on carrying value, which approximates fair value as their interest rates are based on prevailing market rates; and |
Senior unsecured notes are based on quoted market prices derived from trades of the debt.
• | Senior unsecured notes are based on quoted market prices derived from trades of the debt. |
Contingent consideration liabilities related to business acquisitions are carried at fair value.value until the end of the related earn-out period.
Fair Value Hierarchy
We categorize the inputs to the fair value measurements of financial assets and liabilities at each balance sheet reporting date using a three-tier fair value hierarchy that prioritizes the significant inputs used in measuring fair value:
Level 1 – observable inputs such as quoted prices in active markets;
• | Level 1 – observable inputs such as quoted prices in active markets; |
Level 2 – inputs other than quoted prices in active markets that we can directly or indirectly observe to the extent that the markets are liquid for the relevant settlement periods; and
• | Level 2 – inputs other than quoted prices in active markets that we can directly or indirectly observe to the extent that the markets are liquid for the relevant settlement periods; and |
Level 3 – unobservable inputs in which little or no market data exists, therefore we must develop our own assumptions.
• | Level 3 – unobservable inputs in which little or no market data exists, therefore we must develop our own assumptions. |
The following table shows a breakdown by fair value hierarchy category for (1) financial instruments measurements included on our Consolidated Balance Sheets at fair value and (2) supplemental fair value disclosures for other financial instruments:
|
|
| September 30, 2018 |
|
|
| September 30, 2019 |
| ||||||||||||||||||||||||||||||||||
|
|
|
|
|
|
| Fair Value |
|
|
|
|
|
|
| Fair Value |
| ||||||||||||||||||||||||||
|
|
| Carrying Value |
|
| Total |
|
| Level 1 |
|
| Level 2 |
|
| Level 3 |
|
|
| Carrying Value |
|
| Total |
|
| Level 1 |
|
| Level 2 |
|
| Level 3 |
| ||||||||||
Financial Instruments Recorded on Our Consolidated Balance Sheets at Fair Value: | Financial Instruments Recorded on Our Consolidated Balance Sheets at Fair Value: |
|
|
|
|
|
|
|
|
|
|
|
|
|
|
|
|
|
|
|
| Financial Instruments Recorded on Our Consolidated Balance Sheets at Fair Value: |
|
|
|
|
|
|
|
|
|
|
|
|
|
|
|
|
|
|
|
|
Assets from commodity derivative contracts (1) | Assets from commodity derivative contracts (1) |
| $ | 67.7 |
|
| $ | 67.7 |
|
| $ | — |
|
| $ | 67.7 |
|
| $ | — |
| Assets from commodity derivative contracts (1) |
| $ | 197.5 |
|
| $ | 197.5 |
|
| $ | — |
|
| $ | 196.4 |
|
| $ | 1.1 |
|
Liabilities from commodity derivative contracts (1) | Liabilities from commodity derivative contracts (1) |
|
| 243.5 |
|
|
| 243.5 |
|
|
| — |
|
|
| 231.0 |
|
|
| 12.5 |
| Liabilities from commodity derivative contracts (1) |
|
| 127.0 |
|
|
| 127.0 |
|
|
| — |
|
|
| 127.0 |
|
|
| — |
|
Permian Acquisition contingent consideration (2) |
|
|
| 329.0 |
|
|
| 329.0 |
|
|
| — |
|
|
| — |
|
|
| 329.0 |
| |||||||||||||||||||||
TPL contingent consideration (3) |
|
| 2.5 |
|
|
| 2.5 |
|
|
| — |
|
|
| — |
|
|
| 2.5 |
| ||||||||||||||||||||||
TPL contingent consideration (2) |
|
|
| 2.4 |
|
|
| 2.4 |
|
|
| — |
|
|
| — |
|
|
| 2.4 |
| |||||||||||||||||||||
Financial Instruments Recorded on Our Consolidated Balance Sheets at Carrying Value: | Financial Instruments Recorded on Our Consolidated Balance Sheets at Carrying Value: |
|
|
|
|
|
|
|
|
|
|
|
|
|
|
|
|
|
|
|
| Financial Instruments Recorded on Our Consolidated Balance Sheets at Carrying Value: |
|
|
|
|
|
|
|
|
|
|
|
|
|
|
|
|
|
|
|
|
Cash and cash equivalents | Cash and cash equivalents |
|
| 187.5 |
|
|
| 187.5 |
|
|
| — |
|
|
| — |
|
|
| — |
| Cash and cash equivalents |
|
| 294.9 |
|
|
| 294.9 |
|
|
| — |
|
|
| — |
|
|
| — |
|
TRP Revolver | TRP Revolver |
|
| — |
|
|
| — |
|
|
| — |
|
|
| — |
|
|
| — |
| TRP Revolver |
|
| 830.0 |
|
|
| 830.0 |
|
|
| — |
|
|
| 830.0 |
|
|
| — |
|
Senior unsecured notes | Senior unsecured notes |
|
| 5,277.9 |
|
|
| 5,322.8 |
|
|
| — |
|
|
| 5,322.8 |
|
|
| — |
| Senior unsecured notes |
|
| 6,028.5 |
|
|
| 6,310.6 |
|
|
| — |
|
|
| 6,310.6 |
|
|
| — |
|
Accounts receivable securitization facility | Accounts receivable securitization facility |
|
| 290.0 |
|
|
| 290.0 |
|
|
| — |
|
|
| 290.0 |
|
|
| — |
| Accounts receivable securitization facility |
|
| 246.0 |
|
|
| 246.0 |
|
|
| — |
|
|
| 246.0 |
|
|
| — |
|
|
|
|
|
|
|
|
|
|
|
|
|
|
|
|
|
|
|
|
|
|
|
|
|
|
|
|
|
|
|
|
|
|
|
|
|
|
|
|
|
|
|
|
|
| December 31, 2017 |
|
| December 31, 2018 |
| ||||||||||||||||||||||||||||||||||||
|
|
|
|
|
| Fair Value |
|
|
|
|
|
| Fair Value |
| ||||||||||||||||||||||||||||
|
|
| Carrying Value |
| Total |
| Level 1 |
| Level 2 |
| Level 3 |
|
|
| Carrying Value |
| Total |
| Level 1 |
| Level 2 |
| Level 3 |
| ||||||||||||||||||
Financial Instruments Recorded on Our Consolidated Balance Sheets at Fair Value: | Financial Instruments Recorded on Our Consolidated Balance Sheets at Fair Value: |
|
|
|
|
|
|
|
|
|
|
|
|
|
|
|
|
|
|
|
| Financial Instruments Recorded on Our Consolidated Balance Sheets at Fair Value: |
|
|
|
|
|
|
|
|
|
|
|
|
|
|
|
|
|
|
|
|
Assets from commodity derivative contracts (1) | Assets from commodity derivative contracts (1) |
| $ | 60.3 |
|
| $ | 60.3 |
|
| $ | — |
|
| $ | 58.8 |
|
| $ | 1.5 |
| Assets from commodity derivative contracts (1) |
| $ | 144.4 |
|
| $ | 144.4 |
|
| $ | — |
|
| $ | 137.5 |
|
| $ | 6.9 |
|
Liabilities from commodity derivative contracts (1) | Liabilities from commodity derivative contracts (1) |
|
| 98.5 |
|
|
| 98.5 |
|
|
| — |
|
|
| 93.3 |
|
|
| 5.2 |
| Liabilities from commodity derivative contracts (1) |
|
| 31.7 |
|
|
| 31.7 |
|
|
| — |
|
|
| 31.3 |
|
|
| 0.4 |
|
Permian Acquisition contingent consideration (2) |
|
|
| 317.0 |
|
|
| 317.0 |
|
|
| — |
|
|
| — |
|
|
| 317.0 |
| |||||||||||||||||||||
TPL contingent consideration (3) |
|
| 2.4 |
|
|
| 2.4 |
|
|
| — |
|
|
| — |
|
|
| 2.4 |
| ||||||||||||||||||||||
Permian Acquisition contingent consideration |
|
|
| 308.2 |
|
|
| 308.2 |
|
|
| — |
|
|
| — |
|
|
| 308.2 |
| |||||||||||||||||||||
TPL contingent consideration (2) | TPL contingent consideration (2) |
|
| 2.4 |
|
|
| 2.4 |
|
|
| — |
|
|
| — |
|
|
| 2.4 |
| |||||||||||||||||||||
Financial Instruments Recorded on Our Consolidated Balance Sheets at Carrying Value: | Financial Instruments Recorded on Our Consolidated Balance Sheets at Carrying Value: |
|
|
|
|
|
|
|
|
|
|
|
|
|
|
|
|
|
|
|
| Financial Instruments Recorded on Our Consolidated Balance Sheets at Carrying Value: |
|
|
|
|
|
|
|
|
|
|
|
|
|
|
|
|
|
|
|
|
Cash and cash equivalents | Cash and cash equivalents |
|
| 124.7 |
|
|
| 124.7 |
|
|
| — |
|
|
| — |
|
|
| — |
| Cash and cash equivalents |
|
| 203.3 |
|
|
| 203.3 |
|
|
| — |
|
|
| — |
|
|
| — |
|
TRP Revolver | TRP Revolver |
|
| 20.0 |
|
|
| 20.0 |
|
|
| — |
|
|
| 20.0 |
|
|
| — |
| TRP Revolver |
|
| 700.0 |
|
|
| 700.0 |
|
|
| — |
|
|
| 700.0 |
|
|
| — |
|
Senior unsecured notes | Senior unsecured notes |
|
| 4,278.0 |
|
|
| 4,362.4 |
|
|
| — |
|
|
| 4,362.4 |
|
|
| — |
| Senior unsecured notes |
|
| 5,277.9 |
|
|
| 5,088.9 |
|
|
| — |
|
|
| 5,088.9 |
|
|
| — |
|
Accounts receivable securitization facility | Accounts receivable securitization facility |
|
| 350.0 |
|
|
| 350.0 |
|
|
| — |
|
|
| 350.0 |
|
|
| — |
| Accounts receivable securitization facility |
|
| 280.0 |
|
|
| 280.0 |
|
|
| — |
|
|
| 280.0 |
|
|
| — |
|
(1) | The fair value of derivative contracts in this table is presented on a different basis than the Consolidated Balance Sheets presentation as disclosed in Note |
(2) |
|
| We have a contingent consideration liability for TPL’s previous acquisition of a gas gathering system and related assets, which is carried at fair value. |
Additional Information Regarding Level 3 Fair Value Measurements Included on Our Consolidated Balance Sheets
We reported certain of our swaps and option contracts at fair value using Level 3 inputs due to such derivatives not having observable market prices or implied volatilities or market prices for substantially the full term of the derivative asset or liability. For valuations that include both observable and unobservable inputs, if the unobservable input is determined to be significant to the overall inputs, the entire valuation is categorized in Level 3. This includes derivatives valued using indicative price quotations whose contract length extends into unobservable periods.
The fair value of these swaps is determined using a discounted cash flow valuation technique based on a forward commodity basis curve. For these derivatives, the primary input to the valuation model is the forward commodity basis curve, which is based on observable or public data sources and extrapolated when observable prices are not available.
As of September 30, 2018,2019, we had 1610 commodity swap and option contracts categorized as Level 3. The significant unobservable inputs used in the fair value measurements of our Level 3 derivatives are (i) the forward natural gas liquids pricing curves, for which a significant portion of the derivative’s term is beyond available forward pricing and (ii) implied volatilities, which are unobservable as a result of inactive natural gas liquids options trading. The change in the fair value of Level 3 derivatives associated with a 10% change in the forward basis curve where prices are not observable is immaterial.
The fair value of the Permian Acquisition contingent consideration was determined using a Monte Carlo simulation model. Significant inputs used in the fair value measurement include expected gross margin (calculated in accordance with the terms of the purchase and sale agreements), term of the earn-out period, risk adjusted discount rate and volatility associated with the underlying assets. A significant decrease in expected gross margin during the earn-out period, or significant increase in the discount rate or volatility would result in a lower fair value estimate.
The fair value of the TPL contingent consideration was determined using a probability-based model measuring the likelihood of meeting certain volumetric measures. The inputs for both models are not observable; therefore, the entire valuationsvaluation of the contingent considerations areconsideration is categorized in Level 3. The Permian Acquisition contingent consideration earn-out period ended on February 28, 2019 and resulted in a $317.1 million payment in May 2019. See Note 8 – Accounts Payable and Accrued Liabilities for additional discussion of the Permian Acquisition contingent consideration. Changes in the fair value of these liabilities are included in Other income (expense) in our Consolidated Statements of Operations.
The following table summarizes the changes in fair value of our financial instruments classified as Level 3 in the fair value hierarchy:
|
|
| Commodity |
|
|
|
|
| |
|
|
| Derivative Contracts |
|
| Contingent |
| ||
|
|
| Asset/(Liability) |
|
| Liability |
| ||
Balance, December 31, 2017 |
| $ | (3.8 | ) |
| $ | (319.4 | ) | |
| Change in fair value of TPL contingent consideration |
|
| - |
|
|
| (0.1 | ) |
| Change in fair value of Permian Acquisition contingent consideration (1) |
|
| - |
|
|
| (12.0 | ) |
| New Level 3 derivative instruments |
|
| (1.0 | ) |
|
| - |
|
| Settlements included in Revenue |
|
| 2.6 |
|
|
| - |
|
| Unrealized gain/(loss) included in OCI |
|
| (10.3 | ) |
|
| - |
|
Balance, September 30, 2018 |
| $ | (12.5 | ) |
| $ | (331.5 | ) | |
|
|
| Commodity |
|
|
|
|
| |
|
|
| Derivative Contracts |
|
| Contingent |
| ||
|
|
| Asset/(Liability) |
|
| Consideration |
| ||
Balance, December 31, 2018 |
| $ | 6.5 |
|
| $ | (310.6 | ) | |
| Completion of Permian Acquisition contingent consideration earn-out period |
|
| — |
|
|
| 308.2 |
|
| New Level 3 derivative instruments |
|
| (0.4 | ) |
|
| — |
|
| Transfers out of Level 3 (1) |
|
| (6.5 | ) |
|
| — |
|
| Unrealized gain/(loss) included in OCI |
|
| 1.5 |
|
|
| — |
|
Balance, September 30, 2019 |
| $ | 1.1 |
|
| $ | (2.4 | ) | |
(1) |
|
Note 1415 — Related Party Transactions – Targa
Relationship with Targa
We do not have any employees. Targa provides operational, general and administrative and other services to us associated with our existing assets and assets acquired from third parties. Targa performs centralized corporate functions for us, such as legal, accounting, treasury, insurance, risk management, health, safety and environmental, information technology, human resources, credit, payroll, internal audit, taxes, engineering and marketing.
Our Partnership Agreement governs the reimbursement of costs incurred by Targa on behalf of us. Targa charges us for all the direct costs of the employees assigned to our operations, as well as all general and administrative support costs other than (1) costs attributable to Targa’s status as a separate reporting company and (2) until March 2018, costs of Targa providing management and support services to certain unaffiliated spun-off entities. We generally reimburse Targa monthly for cost allocations to the extent that Targa has made a cash outlay.
The following table summarizes transactions with Targa. Management believes these transactions are executed on terms that are fair and reasonable.Targa:
|
| Three Months Ended September 30, |
|
| Nine Months Ended September 30, |
| Three Months Ended September 30, |
|
| Nine Months Ended September 30, |
| ||||||||||||||||||||
|
| 2018 |
|
| 2017 |
|
| 2018 |
|
| 2017 |
| 2019 |
|
| 2018 |
|
| 2019 |
|
| 2018 |
| ||||||||
Targa billings of payroll and related costs included in operating expenses |
| $ | 61.3 |
|
| $ | 54.0 |
|
| $ | 177.7 |
|
| $ | 148.6 |
| $ | 61.6 |
|
| $ | 61.3 |
|
| $ | 177.3 |
|
| $ | 177.7 |
|
Targa allocation of general and administrative expense |
|
| 54.6 |
|
|
| 43.2 |
|
|
| 149.3 |
|
|
| 126.6 |
|
| 59.5 |
|
|
| 54.6 |
|
|
| 188.4 |
|
|
| 149.3 |
|
Cash distributions to Targa based on general partner and limited partner ownership |
|
| 231.2 |
|
|
| 222.6 |
|
|
| 683.7 |
|
|
| 624.7 |
|
| 239.6 |
|
|
| 231.2 |
|
|
| 913.1 |
|
|
| 683.7 |
|
Cash contributions from Targa related to limited partner ownership (1) |
|
| 450.7 |
|
|
| 14.7 |
|
|
| 529.2 |
|
|
| 1,587.5 |
|
| 9.8 |
|
|
| 450.7 |
|
|
| 196.0 |
|
|
| 529.2 |
|
Cash contributions from Targa to maintain its 2% general partner ownership |
|
| 9.2 |
|
|
| 0.3 |
|
|
| 10.8 |
|
|
| 32.5 |
|
| 0.2 |
|
|
| 9.2 |
|
|
| 4.0 |
|
|
| 10.8 |
|
(1) | The cash contributions from Targa related to limited partner ownership were allocated 98% to the limited partner and 2% to general partner. See Note |
Relationship with Sajet Resources LLC
In December 2010, immediately prior to Targa’s initial public offering, Sajet Resources LLC (“Sajet”) was spun-off from Targa. Certain directors and executive officers of Targa are also directors and executive officers of Sajet. The primary assets of Sajet are real property. Sajet also holds (i) an ownership interest in Floridian Natural Gas Storage Company, LLC through a December 2016 merger with Tesla Resources LLC, (ii) an ownership interest in Allied CNG Ventures LLC and (iii) certain technology rights. Former holders of Targa’s pre-IPO common equity, including certain of Targa’s current and former executives, managers and directors collectively own an 18% interest in Sajet. We provide general and administrative services to Sajet and are reimbursed for these amounts. Services provided to Sajet totaled less than $0.1 million in January and February of 2018.
In March 2018, we acquired the 82% interest in Sajet that was held by Warburg Pincus sponsored funds for $5.0 million in cash (the “Warburg Funds Transaction”) and extinguished Sajet’s third-party debt in exchange for a promissory note from Sajet of $9.9 million. Minority shareholders had the right to join the transaction and sell up to 100% of their membership interests in Sajet to us at substantially the same terms and price as the Warburg Funds Transaction (the “Tag-Along Rights”). Minority shareholders who currently hold, or formerly held, executive positions at Targa, and minority shareholders who are board members of Targa, agreed not to exercise their Tag-Along Rights resulting from the Warburg Funds Transaction. Certain minority shareholders chose to sell interests totaling 1.6% for approximately $0.1 million in April 2018.
Since March 2018, Sajet has been accounted for on a consolidated basis in our consolidated financial statements.
Legal Proceedings
We are a party to various legal, administrative and regulatory proceedings that have arisen in the ordinary course of our business. We are also a party to various proceedings with governmental environmental agencies, in 2018, including but not limited to the Environmental Protection Agency, Texas Commission on Environmental Quality, Oklahoma Department of Environmental Quality, New Mexico Environment Department, Louisiana Department of Environmental Quality and North Dakota Department of Health, Environmental Health Section,Quality, which assert penalties for alleged violations of environmental regulations, including air emissions, discharges into the environment and reporting deficiencies, related to events that have arisen at certain of our facilities in the ordinary course of our business.
Note 1617 – Revenue
Fixed consideration allocated to remaining performance obligations
The following table includes the estimated minimum revenue expected to be recognized in the future related to performance obligations that are unsatisfied (or partially unsatisfied) at the end of the reporting period and is comprised of fixed consideration primarily attributable to contracts with minimum volume commitments and for which a guaranteed amount of revenue can be calculated. These contracts are comprised primarily of gathering and processing, fractionation, export, terminaling and storage agreements.
|
| 2018 |
|
| 2019 |
|
| 2020 and after |
| |||
Fixed consideration to be recognized as of September 30, 2018 |
| $ | 116.5 |
|
| $ | 500.1 |
|
| $ | 2,790.7 |
|
|
| 2019 |
|
| 2020 |
|
| 2021 and after |
| |||
Fixed consideration to be recognized as of September 30, 2019 |
| $ | 130.8 |
|
| $ | 486.3 |
|
| $ | 3,474.4 |
|
In accordance with the optional exemptions that we elected to apply, the amounts presented in the table above exclude variable consideration for which the allocation exception is met and consideration associated with performance obligations of short-term contracts. In addition, consideration from contracts for which we recognize revenue at the amount to whichthat we have the right to invoice for services performed is also excluded from the table above, with the exception of any fixed consideration attributable to such contracts. The nature of the performance obligations for which the consideration has been excluded is consistent with the performance obligations described within our revenue recognition accounting policy andpolicy; the estimated remaining duration of such contracts primarily ranges from 1 to 1619 years. In addition, variability exists in the consideration excluded due to the unknown quantity and composition of volumes to be serviced or sold as well as fluctuations in the market price of commodities to be received as consideration or sold over the applicable remaining contract terms. Such variability is resolved at the end of each future month or quarter.
For additional information on our revenue recognition policy and the adoption of ASU No. 2014-09, see Note 3 – Significant Accounting Policies. For disclosures related to disaggregated revenue, see Note 19 20– Segment Information.
Note 1718 – Other Operating (Income) Expense
Other operating (income) expense is comprised of the following:
| Three Months Ended September 30, |
|
| Nine Months Ended September 30, |
| Three Months Ended September 30, |
| Nine Months Ended September 30, |
| ||||||||||||||||||||
| 2018 |
|
| 2017 |
|
| 2018 |
|
| 2017 |
| 2019 |
| 2018 |
|
| 2019 |
|
| 2018 |
| ||||||||
(Gain) loss on sale or disposal of assets (1) | $ | 61.1 |
|
| $ | 0.3 |
|
| $ | 14.3 |
|
| $ | 16.6 |
| ||||||||||||||
(Gain) loss on sale or disposition of assets (1) | $ | 0.5 |
| $ | 61.1 |
|
| $ | 3.6 |
|
| $ | 14.3 |
| |||||||||||||||
Write-down of assets |
| 17.9 |
| — |
|
|
| 17.9 |
|
|
| — |
| ||||||||||||||||
Miscellaneous business tax |
| 0.4 |
|
|
| 0.3 |
|
|
| 1.0 |
|
|
| 0.6 |
|
| — |
| 0.4 |
|
|
| 0.2 |
|
|
| 1.0 |
| |
Other |
| 0.3 |
|
|
| - |
|
|
| 0.4 |
|
|
| - |
|
| — |
|
| 0.3 |
|
|
| — |
|
|
| 0.4 |
|
| $ | 61.8 |
|
| $ | 0.6 |
|
| $ | 15.7 |
|
| $ | 17.2 |
| $ | 18.4 |
| $ | 61.8 |
|
| $ | 21.7 |
|
| $ | 15.7 |
|
Note 1819 — Supplemental Cash Flow Information
|
| Nine Months Ended September 30, |
| ||||||
|
| 2018 |
|
|
| 2017 |
| ||
Cash: |
|
|
|
|
|
|
|
|
|
Interest paid, net of capitalized interest (1) | $ |
| 140.5 |
|
| $ |
| 154.5 |
|
Income taxes paid, net of refunds |
|
| 0.2 |
|
|
|
| (4.9 | ) |
Non-cash investing activities: |
|
|
|
|
|
|
|
|
|
Deadstock commodity inventory transferred to property, plant and equipment | $ |
| 39.4 |
|
| $ |
| 8.3 |
|
Impact of capital expenditure accruals on property, plant and equipment |
|
| 283.9 |
|
|
|
| 118.3 |
|
Transfers from materials and supplies inventory to property, plant and equipment |
|
| 8.9 |
|
|
|
| 2.8 |
|
Contribution of property, plant and equipment to investments in unconsolidated affiliates |
|
| 16.0 |
|
|
|
| 1.0 |
|
Change in ARO liability and property, plant and equipment due to revised cash flow estimate |
|
| 1.2 |
|
|
|
| 3.1 |
|
Non-cash balance sheet movements related to assets held for sale (See Note 4 - Newly-Formed Joint Ventures, Acquisitions and Divestitures): |
|
|
|
|
|
|
|
|
|
Trade receivables | $ |
| 8.8 |
|
| $ |
| — |
|
Inventories |
|
| 5.5 |
|
|
|
| — |
|
Property, plant and equipment, net |
|
| 151.4 |
|
|
|
| — |
|
Accounts payable and accrued liabilities |
|
| (1.7 | ) |
|
|
| — |
|
Non-cash balance sheet movements related to the Permian Acquisition (See Note 4 - Newly-Formed Joint Ventures, Acquisitions and Divestitures): |
|
|
|
|
|
|
|
|
|
Contingent consideration recorded at the acquisition date | $ |
| — |
|
| $ |
| 416.3 |
|
Non-cash balance sheet movements related to acquisition of related party: |
|
|
|
|
|
|
|
|
|
Noncontrolling interest |
|
| 1.1 |
|
|
|
| — |
|
| Nine Months Ended September 30, |
| ||||
| 2019 |
| 2018 |
| ||
Cash: |
|
|
|
|
|
|
Interest paid, net of capitalized interest (1) | $ | 216.6 |
| $ | 140.5 |
|
Income taxes paid, net of refunds |
| (1.7 | ) |
| 0.2 |
|
Non-cash investing activities: |
|
|
|
|
|
|
Impact of capital expenditure accruals on property, plant and equipment | $ | (150.6 | ) | $ | 283.9 |
|
Transfers from materials and supplies inventory to property, plant and equipment |
| 21.7 |
|
| 8.9 |
|
Non-cash financing activities: |
|
|
|
|
|
|
Accrued distributions to noncontrolling interests | $ | 73.8 |
| $ | — |
|
Non-cash balance sheet movements related to assets held for sale: |
|
|
|
|
|
|
Working capital | $ | — |
| $ | 12.6 |
|
Property, plant and equipment, net |
| — |
|
| 151.4 |
|
Lease liabilities arising from recognition of right-of-use assets: |
|
|
|
|
|
|
Operating lease | $ | 6.7 |
| $ | — |
|
Finance lease |
| 8.0 |
|
| — |
|
__________________
(1) | Interest capitalized on major projects was |
Note 1920 — SegmentSegment Information
We operate in two2 primary segments: (i) Gathering and Processing, and (ii) Logistics and Marketing (also referred to as the Downstream Business). Our reportable segments include operating segments that have been aggregated based on the nature of the products and services provided.
Our Gathering and Processing segment includes assets used in the gathering of natural gas produced from oil and gas wells and processing this raw natural gas into merchantable natural gas by extracting NGLs and removing impurities; and assets used for crude oil gathering and terminaling. The Gathering and Processing segment's assets are located in the Permian Basin of West Texas and Southeast New Mexico (including the Midland and Delaware Basins); the Eagle Ford Shale in South Texas; the Barnett Shale in North Texas; the Anadarko, Ardmore, and Arkoma Basins in Oklahoma (including exposure to the SCOOP and STACK plays)STACK) and South Central Kansas; the Williston Basin in North DakotaDakota; and in the onshore and near offshore regions of the Louisiana Gulf Coast and the Gulf of Mexico.
Our Logistics and Marketing segment includes the activities and assets necessary to convert mixed NGLs into NGL products and also includes other assets and value-added services such as transporting, storing, fractionating, terminaling transporting and marketing of NGLs and NGL products, including services to LPG exporters; storing and terminaling of refined petroleum products and crude oil and certain natural gas supply and marketing activities in support of our other businesses. The Logistics and Marketing segment includes Grand Prix, which is currently under construction. The associated assets are generally connected to and supplied in part by our Gathering and Processing segment and, except for the pipeline projectspipelines and smaller terminals, are located predominantly in Mont Belvieu and Galena Park, Texas, and in Lake Charles, Louisiana.
Other contains the results of commodity derivative activities related to Gathering and Processing hedges of equity volumes that are included in operating margin and mark-to-market gains/losses related to derivative contracts that were not designated as cash flow hedges. Elimination of inter-segment transactions are reflected in the corporate and eliminations column.
Reportable segment information is shown in the following tables:
|
| Three Months Ended September 30, 2018 |
|
| Three Months Ended September 30, 2019 |
| ||||||||||||||||||||||||||||||||||
|
| Gathering and Processing |
|
| Logistics and Marketing |
|
| Other |
|
| Corporate and Eliminations |
|
| Total |
|
| Gathering and Processing |
|
| Logistics and Marketing |
|
| Other |
|
| Corporate and Eliminations |
|
| Total |
| ||||||||||
Revenues |
|
|
|
|
|
|
|
|
|
|
|
|
|
|
|
|
|
|
|
|
|
|
|
|
|
|
|
|
|
|
|
|
|
|
|
|
|
|
|
|
Sales of commodities |
| $ | 296.7 |
|
| $ | 2,378.2 |
|
| $ | (20.8 | ) |
| $ | — |
|
| $ | 2,654.1 |
|
| $ | 254.4 |
|
| $ | 1,403.1 |
|
| $ | (63.3 | ) |
| $ | — |
|
| $ | 1,594.2 |
|
Fees from midstream services |
|
| 199.3 |
|
|
| 133.0 |
|
|
| — |
|
|
| — |
|
|
| 332.3 |
|
|
| 173.0 |
|
|
| 135.3 |
|
|
| — |
|
|
| — |
|
|
| 308.3 |
|
|
|
| 496.0 |
|
|
| 2,511.2 |
|
|
| (20.8 | ) |
|
| — |
|
|
| 2,986.4 |
|
|
| 427.4 |
|
|
| 1,538.4 |
|
|
| (63.3 | ) |
|
| — |
|
|
| 1,902.5 |
|
Intersegment revenues |
|
|
|
|
|
|
|
|
|
|
|
|
|
|
|
|
|
|
|
|
|
|
|
|
|
|
|
|
|
|
|
|
|
|
|
|
|
|
|
|
Sales of commodities |
|
| 1,069.7 |
|
|
| 15.5 |
|
|
| — |
|
|
| (1,085.2 | ) |
|
| — |
|
|
| 534.0 |
|
|
| 34.9 |
|
|
| — |
|
|
| (568.9 | ) |
|
| — |
|
Fees from midstream services |
|
| 1.5 |
|
|
| 8.5 |
|
|
| — |
|
|
| (10.0 | ) |
|
| — |
|
|
| 1.9 |
|
|
| 7.4 |
|
|
| — |
|
|
| (9.3 | ) |
|
| — |
|
|
|
| 1,071.2 |
|
|
| 24.0 |
|
|
| — |
|
|
| (1,095.2 | ) |
|
| — |
|
|
| 535.9 |
|
|
| 42.3 |
|
|
| — |
|
|
| (578.2 | ) |
|
| — |
|
Revenues |
| $ | 1,567.2 |
|
| $ | 2,535.2 |
|
| $ | (20.8 | ) |
| $ | (1,095.2 | ) |
| $ | 2,986.4 |
|
| $ | 963.3 |
|
| $ | 1,580.7 |
|
| $ | (63.3 | ) |
| $ | (578.2 | ) |
| $ | 1,902.5 |
|
Operating margin |
| $ | 255.3 |
|
| $ | 173.5 |
|
| $ | (20.8 | ) |
| $ | — |
|
| $ | 408.0 |
|
| $ | 208.6 |
|
| $ | 228.9 |
|
| $ | (63.3 | ) |
| $ | — |
|
| $ | 374.2 |
|
Other financial information: |
|
|
|
|
|
|
|
|
|
|
|
|
|
|
|
|
|
|
|
|
|
|
|
|
|
|
|
|
|
|
|
|
|
|
|
|
|
|
|
|
Total assets (1) |
| $ | 11,331.5 |
|
| $ | 5,019.0 |
|
| $ | 64.2 |
|
| $ | 111.8 |
|
| $ | 16,526.5 |
|
| $ | 12,172.4 |
|
| $ | 6,475.0 |
|
| $ | 157.0 |
|
| $ | 53.9 |
|
| $ | 18,858.3 |
|
Goodwill |
| $ | 256.6 |
|
| $ | — |
|
| $ | — |
|
| $ | — |
|
| $ | 256.6 |
|
| $ | 46.6 |
|
| $ | — |
|
| $ | — |
|
| $ | — |
|
| $ | 46.6 |
|
Capital expenditures |
| $ | 453.0 |
|
| $ | 560.7 |
|
| $ | — |
|
| $ | 4.0 |
|
| $ | 1,017.7 |
|
| $ | 230.3 |
|
| $ | 301.2 |
|
| $ | — |
|
| $ | 10.8 |
|
| $ | 542.3 |
|
(1) | Assets in the Corporate and Eliminations column primarily include cash, prepaids and debt issuance costs for our TRP Revolver. |
|
Three Months Ended September 30, 2017 |
|
| Three Months Ended September 30, 2018 |
| |||||||||||||||||||||||||||||||||||
|
| Gathering and Processing |
|
| Logistics and Marketing |
|
| Other |
|
| Corporate and Eliminations |
|
| Total |
|
| Gathering and Processing |
|
| Logistics and Marketing |
|
| Other |
|
| Corporate and Eliminations |
|
| Total |
| ||||||||||
Revenues |
|
|
|
|
|
|
|
|
|
|
|
|
|
|
|
|
|
|
|
|
|
|
|
|
|
|
|
|
|
|
|
|
|
|
|
|
|
|
|
|
Sales of commodities |
| $ | 200.3 |
|
| $ | 1,672.2 |
|
| $ | (1.0 | ) |
| $ | — |
|
| $ | 1,871.5 |
|
| $ | 296.7 |
|
| $ | 2,378.2 |
|
| $ | (20.8 | ) |
| $ | — |
|
| $ | 2,654.1 |
|
Fees from midstream services |
|
| 148.5 |
|
|
| 111.8 |
|
|
| — |
|
|
| — |
|
|
| 260.3 |
|
|
| 199.3 |
|
|
| 133.0 |
|
|
| — |
|
|
| — |
|
|
| 332.3 |
|
|
|
| 348.8 |
|
|
| 1,784.0 |
|
|
| (1.0 | ) |
|
| — |
|
|
| 2,131.8 |
|
|
| 496.0 |
|
|
| 2,511.2 |
|
|
| (20.8 | ) |
|
| — |
|
|
| 2,986.4 |
|
Intersegment revenues |
|
|
|
|
|
|
|
|
|
|
|
|
|
|
|
|
|
|
|
|
|
|
|
|
|
|
|
|
|
|
|
|
|
|
|
|
|
|
|
|
Sales of commodities |
|
| 783.7 |
|
|
| 80.6 |
|
|
| — |
|
|
| (864.3 | ) |
|
| — |
|
|
| 1,069.7 |
|
|
| 15.5 |
|
|
| — |
|
|
| (1,085.2 | ) |
|
| — |
|
Fees from midstream services |
|
| 1.7 |
|
|
| 7.0 |
|
|
| — |
|
|
| (8.7 | ) |
|
| — |
|
|
| 1.5 |
|
|
| 8.5 |
|
|
| — |
|
|
| (10.0 | ) |
|
| — |
|
|
|
| 785.4 |
|
|
| 87.6 |
|
|
| — |
|
|
| (873.0 | ) |
|
| — |
|
|
| 1,071.2 |
|
|
| 24.0 |
|
|
| — |
|
|
| (1,095.2 | ) |
|
| — |
|
Revenues |
| $ | 1,134.2 |
|
| $ | 1,871.6 |
|
| $ | (1.0 | ) |
| $ | (873.0 | ) |
| $ | 2,131.8 |
|
| $ | 1,567.2 |
|
| $ | 2,535.2 |
|
| $ | (20.8 | ) |
| $ | (1,095.2 | ) |
| $ | 2,986.4 |
|
Operating margin |
| $ | 198.3 |
|
| $ | 115.9 |
|
| $ | (1.0 | ) |
| $ | — |
|
| $ | 313.2 |
|
| $ | 255.3 |
|
| $ | 173.5 |
|
| $ | (20.8 | ) |
| $ | — |
|
| $ | 408.0 |
|
Other financial information: |
|
|
|
|
|
|
|
|
|
|
|
|
|
|
|
|
|
|
|
|
|
|
|
|
|
|
|
|
|
|
|
|
|
|
|
|
|
|
|
|
Total assets (1) |
| $ | 10,644.3 |
|
| $ | 3,240.9 |
|
| $ | 30.8 |
|
| $ | 56.2 |
|
| $ | 13,972.2 |
|
| $ | 11,331.5 |
|
| $ | 5,019.0 |
|
| $ | 64.2 |
|
| $ | 111.8 |
|
| $ | 16,526.5 |
|
Goodwill |
| $ | 256.6 |
|
| $ | — |
|
| $ | — |
|
| $ | — |
|
| $ | 256.6 |
|
| $ | 256.6 |
|
| $ | — |
|
| $ | — |
|
| $ | — |
|
| $ | 256.6 |
|
Capital expenditures |
| $ | 295.9 |
|
| $ | 71.0 |
|
| $ | — |
|
| $ | 11.8 |
|
| $ | 378.7 |
|
| $ | 453.0 |
|
| $ | 560.7 |
|
| $ | — |
|
| $ | 4.0 |
|
| $ | 1,017.7 |
|
(1) | Assets |
|
| Nine Months Ended September 30, 2019 |
| |||||||||||||||||
|
| Gathering and Processing |
|
| Logistics and Marketing |
|
| Other |
|
| Corporate and Eliminations |
|
| Total |
| |||||
Revenues |
|
|
|
|
|
|
|
|
|
|
|
|
|
|
|
|
|
|
|
|
Sales of commodities |
| $ | 761.5 |
|
| $ | 4,508.5 |
|
| $ | (15.2 | ) |
| $ | — |
|
| $ | 5,254.8 |
|
Fees from midstream services |
|
| 549.1 |
|
|
| 393.3 |
|
|
| — |
|
|
| — |
|
|
| 942.4 |
|
|
|
| 1,310.6 |
|
|
| 4,901.8 |
|
|
| (15.2 | ) |
|
| — |
|
|
| 6,197.2 |
|
Intersegment revenues |
|
|
|
|
|
|
|
|
|
|
|
|
|
|
|
|
|
|
|
|
Sales of commodities |
|
| 1,896.5 |
|
|
| 117.0 |
|
|
| — |
|
|
| (2,013.5 | ) |
|
| — |
|
Fees from midstream services |
|
| 5.3 |
|
|
| 20.1 |
|
|
| — |
|
|
| (25.4 | ) |
|
| — |
|
|
|
| 1,901.8 |
|
|
| 137.1 |
|
|
| — |
|
|
| (2,038.9 | ) |
|
| — |
|
Revenues |
| $ | 3,212.4 |
|
| $ | 5,038.9 |
|
| $ | (15.2 | ) |
| $ | (2,038.9 | ) |
| $ | 6,197.2 |
|
Operating margin |
| $ | 630.9 |
|
| $ | 565.0 |
|
| $ | (15.2 | ) |
| $ | — |
|
| $ | 1,180.7 |
|
Other financial information: |
|
|
|
|
|
|
|
|
|
|
|
|
|
|
|
|
|
|
|
|
Total assets (1) |
| $ | 12,172.4 |
|
| $ | 6,475.0 |
|
| $ | 157.0 |
|
| $ | 53.9 |
|
| $ | 18,858.3 |
|
Goodwill |
| $ | 46.6 |
|
| $ | — |
|
| $ | — |
|
| $ | — |
|
| $ | 46.6 |
|
Capital expenditures |
| $ | 1,068.7 |
|
| $ | 1,197.5 |
|
| $ | — |
|
| $ | 38.7 |
|
| $ | 2,304.9 |
|
(1) | Assets in the Corporate and Eliminations column primarily include cash, prepaids and debt issuance costs for our TRP Revolver. |
|
| Nine Months Ended September 30, 2018 |
| |||||||||||||||||
|
| Gathering and Processing |
|
| Logistics and Marketing |
|
| Other |
|
| Corporate and Eliminations |
|
| Total |
| |||||
Revenues |
|
|
|
|
|
|
|
|
|
|
|
|
|
|
|
|
|
|
|
|
Sales of commodities |
| $ | 835.3 |
|
| $ | 6,188.3 |
|
| $ | (42.2 | ) |
| $ | — |
|
| $ | 6,981.4 |
|
Fees from midstream services |
|
| 536.8 |
|
|
| 368.1 |
|
|
| — |
|
|
| — |
|
|
| 904.9 |
|
|
|
| 1,372.1 |
|
|
| 6,556.4 |
|
|
| (42.2 | ) |
|
| — |
|
|
| 7,886.3 |
|
Intersegment revenues |
|
|
|
|
|
|
|
|
|
|
|
|
|
|
|
|
|
|
|
|
Sales of commodities |
|
| 2,848.9 |
|
|
| 147.0 |
|
|
| — |
|
|
| (2,995.9 | ) |
|
| — |
|
Fees from midstream services |
|
| 5.4 |
|
|
| 24.3 |
|
|
| — |
|
|
| (29.7 | ) |
|
| — |
|
|
|
| 2,854.3 |
|
|
| 171.3 |
|
|
| — |
|
|
| (3,025.6 | ) |
|
| — |
|
Revenues |
| $ | 4,226.4 |
|
| $ | 6,727.7 |
|
| $ | (42.2 | ) |
| $ | (3,025.6 | ) |
| $ | 7,886.3 |
|
Operating margin |
| $ | 718.4 |
|
| $ | 441.7 |
|
| $ | (42.2 | ) |
| $ | — |
|
| $ | 1,117.9 |
|
Other financial information: |
|
|
|
|
|
|
|
|
|
|
|
|
|
|
|
|
|
|
|
|
Total assets (1) |
| $ | 11,331.5 |
|
| $ | 5,019.0 |
|
| $ | 64.2 |
|
| $ | 111.8 |
|
| $ | 16,526.5 |
|
Goodwill |
| $ | 256.6 |
|
| $ | — |
|
| $ | — |
|
| $ | — |
|
| $ | 256.6 |
|
Capital expenditures |
| $ | 1,008.2 |
|
| $ | 1,229.9 |
|
| $ | — |
|
| $ | 72.3 |
|
| $ | 2,310.4 |
|
(1) | Assets |
| Nine Months Ended September 30, 2017 |
| ||||||||||||||||||
|
| Gathering and Processing |
|
| Logistics and Marketing |
|
| Other |
|
| Corporate and Eliminations |
|
| Total |
| |||||
Revenues |
|
|
|
|
|
|
|
|
|
|
|
|
|
|
|
|
|
|
|
|
Sales of commodities |
| $ | 544.4 |
|
| $ | 4,804.8 |
|
| $ | 3.9 |
|
| $ | — |
|
| $ | 5,353.1 |
|
Fees from midstream services |
|
| 399.3 |
|
|
| 359.7 |
|
|
| — |
|
|
| — |
|
|
| 759.0 |
|
|
|
| 943.7 |
|
|
| 5,164.5 |
|
|
| 3.9 |
|
|
| — |
|
|
| 6,112.1 |
|
Intersegment revenues |
|
|
|
|
|
|
|
|
|
|
|
|
|
|
|
|
|
|
|
|
Sales of commodities |
|
| 2,209.2 |
|
|
| 237.8 |
|
|
| — |
|
|
| (2,447.0 | ) |
|
| — |
|
Fees from midstream services |
|
| 5.1 |
|
|
| 21.1 |
|
|
| — |
|
|
| (26.2 | ) |
|
| — |
|
|
|
| 2,214.3 |
|
|
| 258.9 |
|
|
| — |
|
|
| (2,473.2 | ) |
|
| — |
|
Revenues |
| $ | 3,158.0 |
|
| $ | 5,423.4 |
|
| $ | 3.9 |
|
| $ | (2,473.2 | ) |
| $ | 6,112.1 |
|
Operating margin |
| $ | 549.3 |
|
| $ | 358.5 |
|
| $ | 3.9 |
|
| $ | — |
|
| $ | 911.7 |
|
Other financial information: |
|
|
|
|
|
|
|
|
|
|
|
|
|
|
|
|
|
|
|
|
Total assets (1) |
| $ | 10,644.3 |
|
| $ | 3,240.9 |
|
| $ | 30.8 |
|
| $ | 56.2 |
|
| $ | 13,972.2 |
|
Goodwill |
| $ | 256.6 |
|
| $ | — |
|
| $ | — |
|
| $ | — |
|
| $ | 256.6 |
|
Capital expenditures |
| $ | 730.7 |
|
| $ | 241.8 |
|
| $ | — |
|
| $ | 15.2 |
|
| $ | 987.7 |
|
Business acquisition |
| $ | 987.1 |
|
| $ | — |
|
| $ | — |
|
| $ | — |
|
| $ | 987.1 |
|
|
|
The following table shows our consolidated revenues disaggregated by product and service for the periods presented:
|
| Three Months Ended September 30, |
|
| Nine Months Ended September 30, |
|
| Three Months Ended September 30, |
|
| Nine Months Ended September 30, |
| ||||||||||||||||||||
|
| 2018 |
|
| 2017 |
|
| 2018 |
|
| 2017 |
|
| 2019 |
|
| 2018 |
|
| 2019 |
|
| 2018 |
| ||||||||
Sales of commodities: |
|
|
|
|
|
|
|
|
|
|
|
|
|
|
|
|
|
|
|
|
|
|
|
|
|
|
|
|
|
|
|
|
Revenue recognized from contracts with customers: |
|
|
|
|
|
|
|
|
|
|
|
|
|
|
|
|
|
|
|
|
|
|
|
|
|
|
|
|
|
|
|
|
Natural gas |
| $ | 451.9 |
|
| $ | 505.4 |
|
| $ | 1,338.5 |
|
| $ | 1,485.2 |
|
| $ | 305.3 |
|
| $ | 451.9 |
|
| $ | 934.2 |
|
| $ | 1,338.5 |
|
NGL |
|
| 2,063.2 |
|
|
| 1,276.2 |
|
|
| 5,254.4 |
|
|
| 3,628.5 |
|
|
| 1,160.5 |
|
|
| 2,063.2 |
|
|
| 3,752.4 |
|
|
| 5,254.4 |
|
Condensate |
|
| 95.7 |
|
|
| 44.9 |
|
|
| 286.1 |
|
|
| 135.8 |
| ||||||||||||||||
Condensate and crude oil |
|
| 178.7 |
|
|
| 95.7 |
|
|
| 488.4 |
|
|
| 286.1 |
| ||||||||||||||||
Petroleum products |
|
| 68.2 |
|
|
| 48.6 |
|
|
| 176.0 |
|
|
| 108.5 |
|
|
| 11.5 |
|
|
| 68.2 |
|
|
| 87.5 |
|
|
| 176.0 |
|
|
|
| 2,679.0 |
|
|
| 1,875.1 |
|
|
| 7,055.0 |
|
|
| 5,358.0 |
|
|
| 1,656.0 |
|
|
| 2,679.0 |
|
|
| 5,262.5 |
|
|
| 7,055.0 |
|
Non-customer revenue: |
|
|
|
|
|
|
|
|
|
|
|
|
|
|
|
|
|
|
|
|
|
|
|
|
|
|
|
|
|
|
|
|
Derivative activities - Hedge |
|
| (23.8 | ) |
|
| (2.1 | ) |
|
| (59.6 | ) |
|
| (2.0 | ) |
|
| 41.5 |
|
|
| (23.8 | ) |
|
| 106.1 |
|
|
| (59.6 | ) |
Derivative activities - Non-hedge (1) |
|
| (1.1 | ) |
|
| (1.5 | ) |
|
| (14.0 | ) |
|
| (2.9 | ) |
|
| (103.3 | ) |
|
| (1.1 | ) |
|
| (113.8 | ) |
|
| (14.0 | ) |
|
|
| (24.9 | ) |
|
| (3.6 | ) |
|
| (73.6 | ) |
|
| (4.9 | ) |
|
| (61.8 | ) |
|
| (24.9 | ) |
|
| (7.7 | ) |
|
| (73.6 | ) |
Total sales of commodities |
|
| 2,654.1 |
|
|
| 1,871.5 |
|
|
| 6,981.4 |
|
|
| 5,353.1 |
|
|
| 1,594.2 |
|
|
| 2,654.1 |
|
|
| 5,254.8 |
|
|
| 6,981.4 |
|
|
|
|
|
|
|
|
|
|
|
|
|
|
|
|
|
|
|
|
|
|
|
|
|
|
|
|
|
|
|
|
|
|
Fees from midstream services: |
|
|
|
|
|
|
|
|
|
|
|
|
|
|
|
|
|
|
|
|
|
|
|
|
|
|
|
|
|
|
|
|
Revenue recognized from contracts with customers: |
|
|
|
|
|
|
|
|
|
|
|
|
|
|
|
|
|
|
|
|
|
|
|
|
|
|
|
|
|
|
|
|
Fractionating and treating |
|
| 31.1 |
|
|
| 29.8 |
|
|
| 90.3 |
|
|
| 92.8 |
| ||||||||||||||||
Storage, terminaling, transportation and export |
|
| 86.9 |
|
|
| 75.0 |
|
|
| 260.8 |
|
|
| 247.8 |
| ||||||||||||||||
NGL transportation and services |
|
| 45.8 |
|
|
| 37.5 |
|
|
| 122.0 |
|
|
| 115.8 |
| ||||||||||||||||
Storage, terminaling and export |
|
| 84.6 |
|
|
| 79.6 |
|
|
| 254.7 |
|
|
| 233.1 |
| ||||||||||||||||
Gathering and processing |
|
| 196.5 |
|
|
| 138.0 |
|
|
| 522.3 |
|
|
| 368.5 |
|
|
| 171.6 |
|
|
| 196.5 |
|
|
| 543.7 |
|
|
| 522.3 |
|
Other |
|
| 17.8 |
|
|
| 17.5 |
|
|
| 31.5 |
|
|
| 49.9 |
|
|
| 6.3 |
|
|
| 18.7 |
|
|
| 22.0 |
|
|
| 33.7 |
|
|
|
|
|
|
|
|
|
|
|
|
|
|
|
|
|
| ||||||||||||||||
Total fees from midstream services |
|
| 332.3 |
|
|
| 260.3 |
|
|
| 904.9 |
|
|
| 759.0 |
|
|
| 308.3 |
|
|
| 332.3 |
|
|
| 942.4 |
|
|
| 904.9 |
|
|
|
|
|
|
|
|
|
|
|
|
|
|
|
|
|
|
|
|
|
|
|
|
|
|
|
|
|
|
|
|
|
|
Total revenues |
| $ | 2,986.4 |
|
| $ | 2,131.8 |
|
| $ | 7,886.3 |
|
| $ | 6,112.1 |
|
| $ | 1,902.5 |
|
| $ | 2,986.4 |
|
| $ | 6,197.2 |
|
| $ | 7,886.3 |
|
(1) | Represents derivative activities that are not designated as hedging instruments under ASC 815. |
The following table shows a reconciliation of reportable segment operating margin to income (loss) before income taxes for the periods presented:
|
| Three Months Ended September 30, |
|
| Nine Months Ended September 30, |
| Three Months Ended September 30, |
|
| Nine Months Ended September 30, |
| ||||||||||||||||||||
|
| 2018 |
|
| 2017 |
|
| 2018 |
|
| 2017 |
| 2019 |
|
| 2018 |
|
| 2019 |
|
| 2018 |
| ||||||||
Reconciliation of reportable segment operating margin to income (loss) before income taxes: |
|
|
|
|
|
|
|
|
|
|
|
|
|
|
|
|
|
|
|
|
|
|
|
|
|
|
|
|
|
|
|
Gathering and Processing operating margin |
| $ | 255.3 |
|
| $ | 198.3 |
|
| $ | 718.4 |
|
| $ | 549.3 |
| $ | 208.6 |
|
| $ | 255.3 |
|
| $ | 630.9 |
|
| $ | 718.4 |
|
Logistics and Marketing operating margin |
|
| 173.5 |
|
|
| 115.9 |
|
|
| 441.7 |
|
|
| 358.5 |
|
| 228.9 |
|
|
| 173.5 |
|
|
| 565.0 |
|
|
| 441.7 |
|
Other operating margin |
|
| (20.8 | ) |
|
| (1.0 | ) |
|
| (42.2 | ) |
|
| 3.9 |
|
| (63.3 | ) |
|
| (20.8 | ) |
|
| (15.2 | ) |
|
| (42.2 | ) |
Depreciation and amortization expenses |
|
| (206.3 | ) |
|
| (208.3 | ) |
|
| (607.1 | ) |
|
| (602.8 | ) | |||||||||||||||
General and administrative expenses |
|
| (59.3 | ) |
|
| (46.6 | ) |
|
| (165.0 | ) |
|
| (139.4 | ) | |||||||||||||||
Impairment of property, plant and equipment |
|
| — |
|
|
| (378.0 | ) |
|
| — |
|
|
| (378.0 | ) | |||||||||||||||
Depreciation and amortization expense |
| (244.3 | ) |
|
| (206.3 | ) |
|
| (718.9 | ) |
|
| (607.1 | ) | ||||||||||||||||
General and administrative expense |
| (65.6 | ) |
|
| (59.3 | ) |
|
| (212.3 | ) |
|
| (165.0 | ) | ||||||||||||||||
Interest expense, net |
|
| (75.7 | ) |
|
| (51.9 | ) |
|
| (113.3 | ) |
|
| (169.5 | ) |
| (84.2 | ) |
|
| (75.7 | ) |
|
| (229.2 | ) |
|
| (113.3 | ) |
Gain (loss) from sale of equity-method investment |
| 65.8 |
|
|
| — |
|
|
| 65.8 |
|
|
| — |
| ||||||||||||||||
Change in contingent considerations |
|
| (16.6 | ) |
|
| 126.8 |
|
|
| (12.1 | ) |
|
| 125.6 |
|
| — |
|
|
| (16.6 | ) |
|
| (8.8 | ) |
|
| (12.1 | ) |
Other, net |
|
| (58.8 | ) |
|
| (0.2 | ) |
|
| (10.6 | ) |
|
| (47.2 | ) |
| (8.4 | ) |
|
| (58.8 | ) |
|
| (7.1 | ) |
|
| (10.6 | ) |
Income (loss) before income taxes |
| $ | (8.7 | ) |
| $ | (245.0 | ) |
| $ | 209.8 |
|
| $ | (299.6 | ) | $ | 37.5 |
|
| $ | (8.7 | ) |
| $ | 70.2 |
|
| $ | 209.8 |
|
Item 2. Management’s Discussion and Analysis ofof Financial Condition and Results of Operations.
The following discussion and analysis of our financial condition and results of operations should be read in conjunction with Management’s Discussion and Analysis of Financial Condition and Results of Operations contained in our Annual Report on Form 10-K for the year ended December 31, 20172018 (“Annual Report”), as well as the unaudited consolidated financial statements and notes hereto included in this Quarterly Report on Form 10-Q.
In May 2014, the FASB issued ASU 2014-09, Revenue from Contracts with Customers (Topic 606). The amendments in this update supersede the revenue recognition requirements in Topic 605, Revenue Recognition, and most industry-specific guidance. We adopted Topic 606 on January 1, 2018 by applying the modified retrospective transition approach to contracts which were not completed as of the date of adoption. The adoption of Topic 606 did not result in an impact to our operating or gross margin. However, the adoption did have an impact on the classification between “Fees from midstream services” and “Product purchases,” as well as the reporting of gross vs. net revenues. For more information, see “Recent Accounting Pronouncements” included within Note 3 – Significant Accounting Policies in our Consolidated Financial Statements.
Overview
Targa Resources Partners LP (“we,” “our,” the “Partnership” or “TRP”) is a Delaware limited partnership formed in October 2006 by Targa Resources Corp. (“TRC” or “Targa”). Our common units were listed on the NYSE under the symbol “NGLS” prior to TRC’s acquisition on February 17, 2016 of all our outstanding common units that it and its subsidiaries did not already own. Our 9.00% Series A Fixed-to-Floating Rate Cumulative Redeemable Perpetual Preferred Units (the “Preferred Units”) remain outstanding as preferred limited partner interests in us and continue to trade on the NYSE under the symbol “NGLS PRA.“NGLS/PA.”
Targa Resources GP LLC, our general partner, is a Delaware limited liability company formed by Targa in October 2006 to own a 2% general partner interest in us. Its primary business purpose is to manage our affairs and operations. Targa Resources GP LLC is an indirect wholly owned subsidiary of Targa.
Our Operations
We are engaged primarily in the business of:
gathering, compressing, treating, processing and selling natural gas;
• | gathering, compressing, treating, processing, transporting and selling natural gas; |
storing, fractionating, treating, transporting and selling NGLs and NGL products, including services to LPG exporters;
• | transporting, storing, fractionating, treating and selling NGLs and NGL products, including services to LPG exporters; and |
gathering, storing, terminaling and selling crude oil; and
storing, terminaling and selling refined petroleum products.
• | gathering, storing, terminaling and selling crude oil. |
To provide these services, we operate in two primary segments: (i) Gathering and Processing, and (ii) Logistics and Marketing (also referred to as the Downstream Business).
Our Gathering and Processing segment includes assets used in the gathering of natural gas produced from oil and gas wells and processing this raw natural gas into merchantable natural gas by extracting NGLs and removing impurities; and assets used for crude oil gathering and terminaling. The Gathering and Processing segment's assets are located in the Permian Basin of West Texas and Southeast New Mexico (including the Midland and Delaware Basins); the Eagle Ford Shale in South Texas; the Barnett Shale in North Texas; the Anadarko, Ardmore, and Arkoma Basins in Oklahoma (including exposure to the SCOOP and STACK plays)STACK) and South Central Kansas; the Williston Basin in North Dakota and in the onshore and near offshore regions of the Louisiana Gulf Coast and the Gulf of Mexico.
Our Logistics and Marketing segment includes the activities and assets necessary to convert mixed NGLs into NGL products and also includes other assets and value-added services such as transporting, storing, fractionating, terminaling transporting and marketing of NGLs and NGL products, including services to LPG exporters; storing and terminaling of refined petroleum products and crude oil and certain natural gas supply and marketing activities in support of our other businesses. The Logistics and Marketing segment also includes the Grand Prix NGL Pipeline (“Grand Prix”), which is currently under construction.integrates our gathering and processing positions in the Permian Basin, Southern Oklahoma and North Texas with our downstream facilities in Mont Belvieu, Texas. The associated assets including these pipeline projects, are generally connected to and supplied in part by our Gathering and Processing segment and, except for the pipeline projectspipelines and smaller terminals, are located predominantly in Mont Belvieu and Galena Park, Texas, and in Lake Charles, Louisiana.
Other contains the results of commodity derivative activities related to Gathering and Processing hedges of equity volumes that are included in operating margin and mark-to-market gains/losses related to derivative contracts that were not designated as cash flow hedges.
Recent Developments
Gathering and Processing Segment Expansion
Permian Midland Processing Expansions
In response to increasing production and to meet the infrastructure needs of producers, we have announced thecompleted construction of additional processing plants that further expand the gathering and processing footprint of our Permian Midland systems:
In February 2018, we announced plans to construct twoor have begun constructing three new 250 MMcf/d cryogenic natural gas processing plants each with a processing capacity of 250 MMcf/d.in the Midland Basin. The first plant, known as the Hopson Plant, began operations in the second quarter of 2019. The second plant, the Pembrook Plant, began operations in the third quarter of 2019. In August 2019, we announced commencement of a third plant, the Gateway Plant, which is expected to begin operations in the firstfourth quarter of 2019. The second plant, known as the Pembrook Plant, is expected to begin operations in the second quarter of 2019.
In May 2017, we announced plans to build a 200 MMcf/d cryogenic natural gas processing plant, known as the Johnson Plant, which began operations in the third quarter of 2018.
In November 2016, we announced plans to build the 200 MMcf/d Joyce Plant, which began operations in the first quarter of 2018.
2020.
Permian Delaware Processing Expansions
In March 2018, we announced that we entered into long-term fee-based agreements with an investment grade energy company for natural gas gathering and processing services in the Delaware Basin and for downstream transportation, fractionation and other related services. WeThe agreements are constructingunderpinned by the customer's dedication of significant acreage within a large, well-defined area in the Delaware Basin. The approximately 220 miles of 12- to 24-inch high pressurehigh-pressure rich gas gathering pipelines that we constructed across the Delaware Basin aare operational. We have recently completed construction of or are currently constructing two new 250 MMcf/d cryogenic natural gas processing plant (the “Falcon Plant”)plants in the Delaware Basin that is expected to begin Basin. The first plant, the Falcon Plant, began operations late in the fourththird quarter of 2019, and a2019. The second 250 MMcf/d cryogenic natural gas processing plant, in Culberson County (the “Peregrine Plant”) in the Delaware Basin thatPeregrine Plant, is expected to begin operations in the second quarter of 2020. Total growth capital expenditures related to the plants and high-pressure gas pipeline system are expected to be approximately $600 million.
We will provide NGL transportation services on Grand Prix and fractionation services at our Mont Belvieu complex for a majority of the NGLs from the Falcon and Peregrine Plants. Total growth capital expenditures related to the plants and high pressure pipeline system are approximately $500 million.
In May 2017, we announced plans to build a new plant and further expand the gathering footprint of our Permian Delaware systems. This project includes a new 250 MMcf/d cryogenic processing plant, known as the Wildcat Plant, which began operations in the second quarter of 2018.
Permian Acquisition
On March 1, 2017, we completed the purchase of 100% of the membership interests of Outrigger Delaware Operating, LLC, Outrigger Southern Delaware Operating, LLC (together “New Delaware”) and Outrigger Midland Operating, LLC (“New Midland” and together with New Delaware, the “Permian Acquisition”).
We paid $484.1 million in cash at closing on March 1, 2017, and paid an additional $90.0 million in cash on May 30, 2017 (collectively, the "initial purchase price"). Subject to certain performance-based measures and other conditions, additional cash of up to $935.0 million may be payable to the sellers of New Delaware and New Midland in potential earn-out payments in May 2018 and May 2019. The potential earn-out payments are based upon a multiple of realized gross margin from contracts that existed on March 1, 2017. The 2018 portion of the earn-out expired with no payment required.
New Delaware's gas gathering and processing and crude gathering assets are located in Loving, Winkler, Pecos and Ward counties. The operations are backed by producer dedications of more than 145,000 acres under long-term, largely fee-based contracts, with an average weighted contract life of 14 years. The initial New Delaware assets included 70 MMcf/d of processing capacity. In addition, the Oahu Plant, a 60 MMcf/d plant in the Delaware Basin, which was completed in March 2018 and placed into service in April 2018, was added to the New Delaware system. Currently, there is 40 MBbl/d of crude gathering capacity on the New Delaware system.
New Midland's gas gathering and processing and crude gathering assets are located in Howard, Martin and Borden counties. The operations are backed by producer dedications of more than 105,000 acres under long-term, largely fee-based contracts, with an average weighted contract life of 13 years. The New Midland assets include 10 MMcf/d of processing capacity. Currently, there is 40 MBbl/d of crude gathering capacity on the New Midland system.
New Delaware's gas gathering and processing assets were connected to our Sand Hills system in the first quarter of 2017, and New Midland's gas gathering and processing assets were connected to our WestTX system in the fourth quarter of 2017. We believe connecting the acquired assets to our legacy Permian footprint creates operational and capital synergies, and is expected to afford enhanced flexibility in serving producers.
Badlands
In January 2018, we announced the formation of a 50/50 joint venture with Hess Midstream Partners LP tounder which Targa would construct and operate a new 200 MMcf/d natural gas processing plant (“LM4 Plant”Little Missouri 4”) at Targa’s existing Little Missouri facility. The LM4 Plant is anticipated to be completed in the second quarter of 2019. Targa is managing the construction of, and will operate, the LM4 Plant.
SouthOK Expansion
In December 2017, ownership of the Flag City Plant assets located in Jackson County, Texas, was transferred to Centrahoma Processing, LLC, a joint venture that we operate (“Centrahoma” or the “Centrahoma Joint Venture”), and in which we have a 60% ownership interest; the remaining 40% ownership interest is held by MPLX, LP (“MPLX”). The former Flag City Plant assets have been relocated to, and installed in, Hughes County, Oklahoma, as a new 150 MMcf/d cryogenic natural gas processing plant (the “Hickory Hills Plant”). The Hickory Hills Plant will process natural gas production from the Arkoma Woodford Basin and is expected to beginLittle Missouri 4 began operations in the fourththird quarter of 2018. In October 2018, Targa contributed the 120 MMcf/d cryogenic Tupelo Plant in Coal County, Oklahoma to Centrahoma. In conjunction with Targa’s contribution of both the Hickory Hills and Tupelo plant assets, MPLX made cash contributions to Centrahoma in order to maintain its 40% ownership interest.
Eagle Ford Shale Natural Gas Gathering and Processing Joint Venture
In May 2018, Sanchez Midstream Partners LP and we merged our respective 50% interests in the Carnero Gathering and Carnero Processing Joint Ventures, which own the high-pressure Carnero gathering line and Raptor natural gas processing plant, to form an expanded 50/50 joint venture in South Texas (the “Carnero Joint Venture”). In connection with the joint venture merger transactions, the Carnero Joint Venture acquired our 200 MMcf/d Silver Oak II natural gas processing plant located in Bee County Texas, which increased the processing capacity of the joint venture from 260 MMcf/d to 460 MMcf/d. Additional enhancements to the prior joint ventures include dedication of over 315,000 additional gross acres in the Western Eagle Ford, operated by Sanchez Energy Corporation, under a new long-term firm gas gathering and processing agreement. Including the approximately 105,000 Catarina acreage, the joint venture now has over 420,000 gross acres dedicated long term. We operate the gas gathering and processing facilities in the joint venture.2019.
Downstream Segment Expansion
Whistler Pipeline
In August 2018, we announced that we were involved in the development of the Whistler Pipeline (“Whistler”), consisting of a pipeline designed to transport natural gas from the Waha area of the Permian Basin to Agua Dulce in South Texas, with an additional segment continuing from Agua Dulce to Wharton County, TX. We are continuing to work on securing commitments on Whistler and the project remains subject to final investment decisions and regulatory approvals.
Grand Prix NGL Pipeline
In May 2017,the third quarter of 2019, we announced plans to construct abegan full service into Mont Belvieu on Grand Prix, our new common carrier NGL pipeline. The NGL pipeline (“Grand Prix”) will transport volumesPrix transports NGLs from the Permian Basin, and North Texas, and Southern Oklahoma to our fractionation and storage complex in the NGL market hub at Mont Belvieu, Texas. Grand Prix will be supported by our volumes and other third-party customer volume commitments, andThe pipeline is expected to be fully in service in the second quartercomprised of 2019.three primary segments:
• | Permian Basin Segment – Connects our Gathering and Processing positions throughout the Delaware and Midland Basins to North Texas. The capacity of the 24-inch diameter pipeline segment from the Permian Basin is approximately 300 MBbl/d, expandable to 550 MBbl/d. |
• | Southern Oklahoma Extension – Connects our SouthOK and North Texas Gathering and Processing positions with the North Texas to Mont Belvieu Segment. The extension varies in capacity based on telescoping pipe size. |
• | North Texas to Mont Belvieu Segment – The Permian Basin Segment and Southern Oklahoma Extension connect to a 30-inch diameter pipeline segment in North Texas, which connects Permian, North Texas and Oklahoma volumes to Mont Belvieu. The North Texas to Mont Belvieu Segment has a capacity of approximately 450 MBbl/d, expandable to 950 MBbl/d. |
In September 2017,February 2019, we sold a 25% interest in our consolidated subsidiary, Grand Prix Pipeline LLC (the "Grand Prix Joint Venture"), which owns the portion of Grand Prix extending from the Permian Basin to Mont Belvieu, Texas, to funds managed by Blackstone Energy Partners (“Blackstone”). We are the operator and construction manager of Grand Prix.announced an additional extension:
Concurrent with the sale of the minority interest in the Grand Prix Joint Venture to Blackstone, we and EagleClaw Midstream Ventures, LLC ("EagleClaw"), a Blackstone portfolio company, executed a long-term Raw Product Purchase Agreement whereby EagleClaw has dedicated and committed significant NGLs associated with EagleClaw's natural gas volumes produced or processed in the Delaware Basin.
• | Central Oklahoma Extension – Extends from Southern Oklahoma to the STACK region of Central Oklahoma where it will connect with The Williams Companies, Inc. (“Williams”) Bluestem Pipeline, linking the Conway, Kansas, and Mont Belvieu, Texas, NGL markets. In connection with this project, Williams has committed significant volumes to us that we will transport on Grand Prix and fractionate at our Mont Belvieu facilities. The Central Oklahoma Extension is expected to be completed in the first quarter of 2021. |
Grand Prix NGL Pipeline Extension into Oklahoma
In March 2018, we announced an extension of Grand Prix into southern Oklahoma. The pipeline expansion is supported by long-term commitments for both transportation and fractionation services from our existing and future processing plants in the Arkoma area in our SouthOK system and from third-party commitments, including a long-term commitment for transportation and fractionation with Valiant Midstream, LLC. The extension of Grand Prix into southern Oklahoma is not part of the Grand Prix Joint Venture.
The capacity of the 24-inch diameter pipeline segment from the Permian Basin will be approximately 300 MBbl/d, expandable to 550 MBbl/d. The pipeline segment from the Permian Basin will be connected to a 30-inch diameter pipeline segment in North Texas, where Permian, North Texas and Oklahoma volumes will be connected to Mont Belvieu, and will have capacity of approximately 450 MBbl/d, expandable to 950 MBbl/d. The capacity from southern Oklahoma to North Texas will vary based on telescoping pipe size.
Grand Prix economics related to volumes flowing on the pipeline from the Permian Basin to Mont Belvieu are included in the Blackstone and Grand Prix DevCo joint venture arrangements,Pipeline LLC (“Grand Prix Joint Venture”), a consolidated subsidiary of which Targa owns a 56% interest, while the economics related to volumes flowing from North Texas and southern Oklahoma to Mont Belvieu accrue solely to Targa’s benefit.
Total growth capital spending on Grand Prix, including the extensionextensions into southern Oklahoma, is now estimated to be approximately $1.7$2.0 billion, with our portion of growth capital spending estimated to be approximately $1.1$1.4 billion. We expect that our portion of growth capital spending in 2018 will be approximately $900 million.
Fractionation Expansion
In February 2018, we announced plans to construct a new 100 MBbl/d fractionation train in Mont Belvieu, Texas (“Train 6”), which began operations in the second quarter of 2019. The total cost of the fractionation train and related infrastructure was approximately $350 million. Targa Train 6 LLC, a joint venture between Targa and Stonepeak Infrastructure Partners (“Stonepeak”), owns 100% interest in certain assets associated with Train 6. Certain fractionation-related infrastructure for Train 6, such as storage caverns and brine handling, were funded and are owned 100% by Targa.
In November 2018, we announced plans to construct two new 110 MBbl/d fractionation trains in Mont Belvieu, Texas (“Train 7 and Train 8”), which are expected to begin operations inby the end of the first quarter of 2020 and secondthe end of the third quarter of 2020, respectively. The total cost of these fractionation trains and related infrastructure is expected to be approximately $825 million.
In February 2018, we announced plansconnection with the Central Oklahoma Extension, Williams exercised its initial option to constructacquire a new 100 MBbl/d fractionation train20% equity interest in Mont Belvieu, Texas (“Train 6”), which is expected to begin operations early7 and executed a joint venture agreement with us in the second quarter of 2019. Certain fractionation-related infrastructure for Train 7, including storage caverns and brine handling, will be funded and owned 100% by Targa.
LPG Export Expansion
In February 2019, we announced plans to further expand our LPG export capabilities of propane and butanes at our Galena Park Marine Terminal by increasing refrigeration capacity and associated load rates. Our current effective export capacity will increase to approximately 11 to 15 MMBbl per month, depending upon the mix of propane and butane demand, vessel size and availability of supply, among other factors. The total cost of the fractionation trainexpansion and related infrastructure is expected to be approximately $350 million.
$120 million and is expected to be completed in the third quarter of 2020.
Gulf Coast Express Pipeline
In December 2017, we entered into definitive joint venture agreements to form Gulf Coast Express Pipeline LLC (“GCX”) with Kinder Morgan Texas Pipeline LLC (“KMTP”) and DCP Midstream Partners, LP (“DCP”) with respect tofor the joint developmentpurpose of developing the Gulf Coast Express Pipeline (“GCX”GCX Pipeline”), a natural gas pipeline from the Waha hub, including direct connections to the tailgate of many of our Midland Basin processing facilities, to Agua Dulce in South Texas. The pipeline will provideprovides an outlet for increased natural gas production from the Permian Basin to growing markets along the Texas Gulf Coast. WeTarga GCX Pipeline LLC, a joint venture between us and Stonepeak, and DCP each own a 25% interest, and KMTP owns a 50%34% interest, and Altus Midstream Company owns the remaining 16% interest in GCX. Shipper Apache Corporation has an option to purchase up to a 15% equity stake from KMTP.GCX. KMTP will serveserves as the construction manager and operator of GCX.GCX Pipeline. We have committed significant volumes to GCX.GCX Pipeline. In addition, Pioneer Natural Resources Company, a joint owner in our WestTX Permian Basin system,assets, has committed volumes to the project. GCX Pipeline. GCX Pipeline is designed to transport up to 1.98 Bcf/d of natural gas and the total cost of the project is estimated to be approximately $1.75 billion. GCX Pipeline was placed in service late in the third quarter of 2019.
Badlands Interest Sale
In April 2019, we closed on the sale of a 45% interest in Targa Badlands LLC (“Targa Badlands”), the entity that holds substantially all of our assets in North Dakota, to funds managed by GSO Capital Partners and Blackstone Tactical Opportunities (collectively, “Blackstone”) for $1.6 billion in cash. We used the net cash proceeds to repay debt and for general corporate purposes, including funding our growth capital program. We continue to be the operator of Targa Badlands and hold majority governance rights. Future growth capital of Targa Badlandsis expected to be in service in the fourth quarterfunded on a pro rata ownership basis. Targa Badlands pays a minimum quarterly distribution (“MQD”) to Blackstone and Targa, with Blackstone having a priority right on such MQDs. Additionally, Blackstone’s capital contributions would have a liquidation preference upon a sale of 2019, pending regulatory approvals.Targa Badlands.
Development Joint Ventures
In February 2018, we also announced the formation of three development joint ventures (the “DevCo JVs”) with investment vehicles affiliated with Stonepeak Infrastructure Partners (“Stonepeak”). Stonepeak owns an 80% interest in both the GCX DevCo JV, which owns our 25% interest in GCX, and the Train 6 DevCo JV, which owns a 100% interest in certain assets associated with Train 6. Stonepeak owns a 95% interest in the Grand Prix DevCo JV, which owns a 20% interest in the Grand Prix Joint Venture. We hold the remaining interest of each DevCo JV, as well as control the management, construction and operation of Grand Prix and the fractionation train. The Train 6 DevCo JV will fund the fractionation train while we will fund 100% of the required brine, storage and other infrastructure that will support the fractionation train’s operations.
Stonepeak committed a maximum of approximately $960 million of capital to the DevCo JVs, including an initial contribution of approximately $190 million that was distributed to the Partnership to reimburse it for a portion of capital spent to date.
For a four-year period beginning on the earlier of the date that all three projects have commenced commercial operations or January 1, 2020, Targa has the option to acquire all or part of Stonepeak’s interests in the DevCo JVs. Targa may acquire up to 50% of Stonepeak’s invested capital in multiple increments with a minimum of $100 million, and Stonepeak’s remaining 50% interest in a single final purchase. The purchase price payable for such partial or full interests would be based on a predetermined fixed return or multiple on invested capital, including distributions received by Stonepeak from the DevCo JVs.
Channelview Splitter
On December 27, 2015, we and Noble Americas Corp., then an affiliate of Noble Group Ltd., entered into a long-term, fee-based agreement (the “Splitter Agreement”) under which we will build and operate a 35,000 Bbl/d crude oil and condensate splitter at our Channelview Terminal on the Houston Ship Channel (the “Channelview Splitter”). The Channelview Splitter will have the capability to split approximately 35,000 Bbl/d of crude oil and condensate into its various components, including naphtha, kerosene, gas oil, jet fuel and liquefied petroleum gas and will provide segregated storage for the crude, condensate and components. In January 2018, Vitol US Holding Co. acquired Noble Americas Corp.
The Channelview Splitter is expected to be substantially completed in December 2018, and has an estimated total cost of approximately $150 million. The first three annual payments due under the Splitter Agreement, totaling $129.0 million, have been received and are reflected in deferred revenue as a component of other long-term liabilities on our Consolidated Balance Sheet.
Asset Sales and Divestitures
During the second quarter of 2018, we sold our inland marine barge business to a third party for $69.3 million. We continue to ownevaluate and operate two ocean-going barges.
execute asset sales to reduce leverage and focus on our core operations. During the third quarter of 2018,2019, we closed on the sale of an equity-method investment for $70.3 million. In November 2019, we executed agreements to sell our refined productscrude gathering and crude oil storage and terminaling facilitiesbusiness in Tacoma, WA, and Baltimore, MD, to a third partythe Permian Delaware for approximately $160$135 million. TheSubject to customary regulatory approvals and closing conditions, the sale closedis expected to close in the fourth quarter of 2018 and we intend2019.
We have also engaged Jefferies LLC to useevaluate the proceeds to repay debt and to fund a portionpotential divestiture of our crude gathering business in the Permian Midland, which includes crude gathering and storage assets. The potential divestiture is predicated on third party valuations adequately capturing our forward growth capital program.
Duringexpectations for the fourth quarter of 2018, we announcedassets, and no assurance can be made that we are evaluating the potentiala sale of a minority interest in our Badlands assets in North Dakota to a select small group of counterparties.will be consummated.
2018 Financing Activities
In April 2018,January 2019, we issued $1.0 billion aggregate principal amount$750.0 million of 5⅞% senior notes due 2026 (the “5⅞6½% Senior Notes due 2026”). We used theJuly 2027 and $750.0 million of 6⅞% Senior Notes due January 2029, resulting in total net proceeds of $991.9 million after costs$1,486.6 million. The net proceeds from this offeringthe issuance were used to repay redeem in full our 4⅛% Senior Notes due 2019, at par value plus accrued interest through the redemption date, with the remainder used for general partnership purposes, which included repayment of borrowings under our credit facilities and for general partnership purposes.
On October 29, 2018, Standard & Poor’s Corporation (“S&P”) raised our corporate credit rating and our issue-level rating on senior unsecured notes to 'BB' from 'BB-', and raised the outlook to positive from stable.
TRP Revolver Amendment
In June 2018, we entered into an agreement to amend and restate the TRP Revolver, which extended the maturity date from October 2020 to June 2023, increased available commitments from $1.6 billion to $2.2 billion and lowered the applicable margin range and commitment fee range used in the calculation of interest. Our ability to request additional commitments of $500.0 million remained unchanged.
The TRP Revolver bears interest, at our option, either at the base rate or the Eurodollar rate. The base rate is equal to the highest of: (i) Bank of America’s prime rate; (ii) the federal funds rate plus 0.5%; or (iii) the one-month LIBOR rate plus 1.0%, plus an applicable margin (a) before the collateral release date, ranging from 0.25% to 1.25% dependent on our ratio of consolidated funded indebtedness to consolidated adjusted EBITDA and (b) upon and after the collateral release date, ranging from 0.125% to 0.75% dependent on our non-credit-enhanced senior unsecured long-term debt ratings. The Eurodollar rate is equal to LIBOR rate plus an applicable margin (i) before the collateral release date, ranging from 1.25% to 2.25% dependent on our ratio of consolidated funded indebtedness to consolidated adjusted EBITDA and (ii) upon and after the collateral release date, ranging from 1.125% to 1.75% dependent on our non-credit-enhanced senior unsecured long-term debt ratings.
We are required to pay a commitment fee equal to an applicable rate ranging from (a) before the collateral release date, 0.25% to 0.375% (dependent on our ratio of consolidated funded indebtedness to consolidated adjusted EBITDA) and (b) upon and after the collateral release date, 0.125% to 0.35% (dependent on our non-credit-enhanced senior unsecured long-term debt ratings) times the
actual daily average unused portion of the TRP Revolver. Additionally, issued and undrawn letters of credit bear interest at an applicable margin (i) before the collateral release date, ranging from 1.25% to 2.25% dependent on our ratio of consolidated funded indebtedness to consolidated adjusted EBITDA and (ii) upon and after the collateral release date, ranging from 1.125% to 1.75% dependent on our non-credit-enhanced senior unsecured long-term debt ratings. The TRP Revolver’s covenants remained substantially the same.facilities.
Recent Accounting Pronouncements
For a discussion of recent accounting pronouncements that will affect us, see “Recent Accounting Pronouncements” included within Note 3 – Significant Accounting Policies in our Consolidated Financial Statements.
How We Evaluate Our Operations
The profitability of our business segments is a function of the difference between: (i) the revenues we receive from our operations, including fee-based revenues from services and revenues from the natural gas, NGLs, crude oil and condensate we sell, and (ii) the costs associated with conducting our operations, including the costs of wellhead natural gas, crude oil and mixed NGLs that we purchase as well as operating, general and administrative costs and the impact of our commodity hedging activities. Because commodity price movements tend to impact both revenues and costs, increases or decreases in our revenues alone are not necessarily indicative of increases or decreases in our profitability. Our contract portfolio, the prevailing pricing environment for crude oil, natural gas and NGLs, and the volumes of crude oil, natural gas and NGL throughput on our systems are important factors in determining our profitability. Our profitability is also affected by the NGL content in gathered wellhead natural gas, supply and demand for our products and services, utilization of our assets and changes in our customer mix.
Our profitability is also impacted by fee-based contracts. contracts. Our growing fee-related capital expenditures for pipelines and gathering and processing assets underpinned by fee-based margin, expansion of our downstream facilities, continued focus on adding fee-based margin to our existing and future gathering and processing contracts, as well as third-party acquisitions of businesses and assets, will continue to increase the number of our contracts that are fee-based. Fixed fees for services such as fractionation, storage, terminaling and crude oil gathering are not directly tied to changes in market prices for commodities. Nevertheless, a change in unit fees due to market dynamics such as available commodity throughput does affect profitability.
Management uses a variety of financial measures and operational measurements to analyze our performance. These include: (1) throughput volumes, facility efficiencies and fuel consumption, (2) operating expenses, (3) capital expenditures and (4) the following non-GAAP measures: gross margin, operating margin, and Adjusted EBITDA.
Throughput Volumes, Facility Efficiencies and Fuel Consumption
Our profitability is impacted by our ability to add new sources of natural gas supply and crude oil supply to offset the natural decline of existing volumes from oil and natural gas wells that are connected to our gathering and processing systems. This is achieved by connecting new wells and adding new volumes in existing areas of production, as well as by capturing crude oil and natural gas supplies currently gathered by third parties. Similarly, our profitability is impacted by our ability to add new sources of mixed NGL supply, connected by third-party transportation and in the future through our Grand Prix, pipeline, to our Downstream Business fractionation facilities and at times to our export facilities. We fractionate NGLs generated by our gathering and processing plants, as well as by contracting for mixed NGL supply from third-party facilities.
In addition, we seek to increase operating margin by limiting volume losses, reducing fuel consumption and by increasing efficiency. With our gathering systems’ extensive use of remote monitoring capabilities, we monitor the volumes received at the wellhead or central delivery points along our gathering systems, the volume of natural gas received at our processing plant inlets and the volumes of NGLs and residue natural gas recovered by our processing plants. We also monitor the volumes of NGLs received, stored, fractionated and delivered across our logistics assets. This information is tracked through our processing plants and Downstream Business facilities to determine customer settlements for sales and volume related fees for service and helps us increase efficiency and reduce fuel consumption.
As part of monitoring the efficiency of our operations, we measure the difference between the volume of natural gas received at the wellhead or central delivery points on our gathering systems and the volume received at the inlet of our processing plants as an indicator of fuel consumption and line loss. We also track the difference between the volume of natural gas received at the inlet of the processing plant and the NGLs and residue gas produced at the outlet of such plant to monitor the fuel consumption and recoveries of our facilities. Similar tracking is performed for our crude oil gathering and logistics assets. These volume, recovery and fuel consumption measurements are an important part of our operational efficiency analysis and safety programs.
Operating expenses are costs associated with the operation of specific assets. Labor, contract services, repair and maintenance, utilities and ad valorem taxes comprise the most significant portion of our operating expenses. These expenses, other than fuel and power, remain relatively stable and independent of the volumes through our systems, but may increase with system expansions and will fluctuate depending on the scope of the activities performed during a specific period.
Capital Expenditures
Capital projects associated with growth and maintenance projects are closely monitored. Return on investment is analyzed before a capital project is approved, spending is closely monitored throughout the development of the project, and the subsequent operational performance is compared to the assumptions used in the economic analysis performed for the capital investment approval.
Gross Margin
We define gross margin as revenues less product purchases. It is impacted by volumes and commodity prices as well as by our contract mix and commodity hedging program.
Gathering and Processing segment gross margin consists primarily of revenues from the sale of natural gas, condensate, crude oil and NGLs and fees related to natural gas and crude oil gathering and services, less producer payments and other natural gas and crude oil purchases.of:
• | revenues from the sale of natural gas, condensate, crude oil and NGLs less producer payments and other natural gas and crude oil purchases; and |
• | service fees related to natural gas and crude oil gathering, treating and processing. |
Logistics and Marketing segment gross margin consists primarily of:
service fees (including the pass-through of energy costs included in fee rates);
• | service fees (including the pass-through of energy costs included in fee rates); |
system product gains and losses; and
• | system product gains and losses; and |
NGL and natural gas sales, less NGL and natural gas purchases, transportation costs and the net inventory change.
• | NGL and natural gas sales, less NGL and natural gas purchases, transportation costs and the net inventory change. |
The gross margin impacts of our equity volumes hedge settlements are reported in Other.
Operating Margin
We define operating margin as gross margin less operating expenses. Operating margin is an important performance measure of the core profitability of our operations.
Management reviews business segment gross margin and operating margin monthly as a core internal management process. We believe that investors benefit from having access to the same financial measures that management uses in evaluating our operating results. Gross margin and operating margin provide useful information to investors because they are used as supplemental financial measures by management and by external users of our financial statements, including investors and commercial banks, to assess:
the financial performance of our assets without regard to financing methods, capital structure or historical cost basis;
• | the financial performance of our assets without regard to financing methods, capital structure or historical cost basis; |
our operating performance and return on capital as compared to other companies in the midstream energy sector, without regard to financing or capital structure; and
• | our operating performance and return on capital as compared to other companies in the midstream energy sector, without regard to financing or capital structure; and |
the viability of acquisitions and capital expenditure projects and the overall rates of return on alternative investment opportunities.
• | the viability of acquisitions and capital expenditure projects and the overall rates of return on alternative investment opportunities. |
Gross margin and operating margin are non-GAAP measures. The GAAP measure most directly comparable to gross margin and operating margin is net income.income (loss). Gross margin and operating margin are not alternatives to GAAP net income and have important limitations as analytical tools. Investors should not consider gross margin and operating margin in isolation or as a substitute for analysis of our results as reported under GAAP. Because gross margin and operating margin exclude some, but not all, items that affect net income and are defined differently by different companies in our industry, our definitions of gross margin and operating margin may not be comparable with similarly titled measures of other companies, thereby diminishing their utility. Management compensates for the limitations of gross margin and operating margin as analytical tools by reviewing the comparable GAAP measures, understanding the differences between the measures and incorporating these insights into its decision-making processes.
We define Adjusted EBITDA as net income (loss) attributable to TRP before interest, income taxes, depreciation and amortization, and other items that we believe should be adjusted consistent with our core operating performance. The adjusting items are detailed in the Adjusted EBITDA reconciliation table and its footnotes. Adjusted EBITDA is used as a supplemental financial measure by us and by external users of our financial statements such as investors, commercial banks and others. The economic substance behind our use of Adjusted EBITDA is to measure the ability of our assets to generate cash sufficient to pay interest costs, support our indebtedness and pay dividendsmake distributions to holders of our investors.equity interests.
Adjusted EBITDA is a non-GAAP financial measure. The GAAP measure most directly comparable to Adjusted EBITDA is net income (loss) attributable to TRP. Adjusted EBITDA should not be considered as an alternative to GAAP net income. Adjusted EBITDA has important limitations as an analytical tool. Investors should not consider Adjusted EBITDA in isolation or as a substitute for analysis of our results as reported under GAAP. Because Adjusted EBITDA excludes some, but not all, items that affect net income and is defined differently by different companies in our industry, our definition of Adjusted EBITDA may not be comparable to similarly titled measures of other companies, thereby diminishing its utility.
Management compensates for the limitations of Adjusted EBITDA as an analytical tool by reviewing the comparable GAAP measures, understanding the differences between the measures and incorporating these insights into its decision-making processes.
Our Non-GAAP Financial Measures
The following tables reconcile the non-GAAP financial measures used by management to the most directly comparable GAAP measures for the periods indicated.
| Three Months Ended September 30, |
| Nine Months Ended September 30, |
|
| Three Months Ended September 30, |
|
| Nine Months Ended September 30, |
| ||||||||||||||||||||||
| 2018 |
|
| 2017 |
|
| 2018 |
|
| 2017 |
|
| 2019 |
|
| 2018 |
|
| 2019 |
|
| 2018 |
| |||||||||
| (In millions) |
|
| (In millions) |
| |||||||||||||||||||||||||||
Reconciliation of Net Income (loss) to TRP Operating Margin and Gross Margin: |
|
|
|
|
|
|
|
|
|
|
|
|
|
|
|
| ||||||||||||||||
Reconciliation of Net Income (Loss) to Operating Margin and Gross Margin |
|
|
|
|
|
|
|
|
|
|
|
|
|
|
|
| ||||||||||||||||
Net income (loss) |
| $ | (8.7 | ) |
| $ | (245.0 | ) |
| $ | 209.8 |
|
| $ | (295.4 | ) |
| $ | 37.5 |
|
| $ | (8.7 | ) |
| $ | 70.2 |
|
| $ | 209.8 |
|
Depreciation and amortization expense |
|
| 206.3 |
|
|
| 208.3 |
|
|
| 607.1 |
|
|
| 602.8 |
|
|
| 244.3 |
|
|
| 206.3 |
|
|
| 718.9 |
|
|
| 607.1 |
|
General and administrative expense |
|
| 59.3 |
|
|
| 46.6 |
|
|
| 165.0 |
|
|
| 139.4 |
|
|
| 65.6 |
|
|
| 59.3 |
|
|
| 212.3 |
|
|
| 165.0 |
|
Impairment of property, plant and equipment |
|
| — |
|
|
| 378.0 |
|
|
| — |
|
|
| 378.0 |
| ||||||||||||||||
Interest expense, net |
|
| 75.7 |
|
|
| 51.9 |
|
|
| 113.3 |
|
|
| 169.5 |
| ||||||||||||||||
Income tax expense (benefit) |
|
| — |
|
|
| — |
|
|
| — |
|
|
| (4.2 | ) | ||||||||||||||||
Interest (income) expense, net |
|
| 84.2 |
|
|
| 75.7 |
|
|
| 229.2 |
|
|
| 113.3 |
| ||||||||||||||||
(Gain) loss on sale or disposition of assets |
|
| 61.1 |
|
|
| 0.3 |
|
|
| 14.3 |
|
|
| 16.6 |
|
|
| 0.5 |
|
|
| 61.1 |
|
|
| 3.6 |
|
|
| 14.3 |
|
Write-down of assets |
|
| 17.9 |
|
|
| — |
|
|
| 17.9 |
|
|
| — |
| ||||||||||||||||
(Gain) loss from sale of equity-method investment |
|
| (65.8 | ) |
|
| — |
|
|
| (65.8 | ) |
|
| — |
| ||||||||||||||||
(Gain) loss from financing activities |
|
| — |
|
|
| — |
|
|
| 1.3 |
|
|
| 10.7 |
|
|
| — |
|
|
| — |
|
|
| 1.4 |
|
|
| 1.3 |
|
Change in contingent considerations |
|
| — |
|
|
| 16.6 |
|
|
| 8.8 |
|
|
| 12.1 |
| ||||||||||||||||
Other, net |
|
| 14.3 |
|
|
| (126.9 | ) |
|
| 7.1 |
|
|
| (105.7 | ) |
|
| (10.0 | ) |
|
| (2.3 | ) |
|
| (15.7 | ) |
|
| (5.0 | ) |
Operating margin |
|
| 408.0 |
|
|
| 313.2 |
|
|
| 1,117.9 |
|
|
| 911.7 |
|
|
| 374.2 |
|
|
| 408.0 |
|
|
| 1,180.8 |
|
|
| 1,117.9 |
|
Operating expenses |
|
| 194.9 |
|
|
| 155.5 |
|
|
| 538.7 |
|
|
| 462.6 |
|
|
| 200.2 |
|
|
| 194.9 |
|
|
| 600.7 |
|
|
| 538.7 |
|
Gross margin |
| $ | 602.9 |
|
| $ | 468.7 |
|
| $ | 1,656.6 |
|
| $ | 1,374.3 |
|
| $ | 574.4 |
|
| $ | 602.9 |
|
| $ | 1,781.5 |
|
| $ | 1,656.6 |
|
| Three Months Ended September 30, |
| Nine Months Ended September 30, |
| |||||||||||||||
|
| 2018 |
|
| 2017 |
| 2018 |
|
| 2017 |
| ||||||||
|
| (In millions) | |||||||||||||||||
Reconciliation of Net Income (Loss) attributable to TRP to Adjusted EBITDA |
|
|
|
|
|
|
|
|
|
|
|
|
|
|
|
|
|
|
|
Net income (loss) attributable to TRP |
|
| $ | (18.4 | ) |
|
| $ | (254.7 | ) |
| $ | 177.8 |
|
|
| $ | (321.3 | ) |
Interest expense, net (1) |
|
|
| 75.7 |
|
|
|
| 51.9 |
|
|
| 113.3 |
|
|
|
| 169.5 |
|
Income tax expense (benefit) |
|
|
| — |
|
|
|
| — |
|
|
| — |
|
|
|
| (4.2 | ) |
Depreciation and amortization expense |
|
|
| 206.3 |
|
|
|
| 208.3 |
|
|
| 607.1 |
|
|
|
| 602.8 |
|
Impairment of property, plant and equipment |
|
|
| — |
|
|
|
| 378.0 |
|
|
| — |
|
|
|
| 378.0 |
|
(Gain) loss on sale or disposition of assets |
|
|
| 61.1 |
|
|
|
| 0.3 |
|
|
| 14.3 |
|
|
|
| 16.6 |
|
(Gain) loss from financing activities |
|
|
| — |
|
|
|
| — |
|
|
| 1.3 |
|
|
|
| 10.7 |
|
(Earnings) loss from unconsolidated affiliates |
|
|
| (3.0 | ) |
|
|
| (0.2 | ) |
|
| (6.4 | ) |
|
|
| 16.6 |
|
Distributions from unconsolidated affiliates and preferred partner interests, net |
|
|
| 7.5 |
|
|
|
| 4.6 |
|
|
| 21.4 |
|
|
|
| 15.0 |
|
Change in contingent considerations |
|
|
| 16.6 |
|
|
|
| (126.8 | ) |
|
| 12.1 |
|
|
|
| (125.6 | ) |
Transaction costs related to business acquisitions |
|
|
| — |
|
|
|
| 0.4 |
|
|
| — |
|
|
|
| 5.6 |
|
Splitter Agreement (2) |
|
|
| 10.8 |
|
|
|
| 10.8 |
|
|
| 32.3 |
|
|
|
| 32.3 |
|
Risk management activities (3) |
|
|
| (0.8 | ) |
|
|
| 2.0 |
|
|
| 8.3 |
|
|
|
| 7.2 |
|
Noncontrolling interests adjustments (4) |
|
|
| (7.7 | ) |
|
|
| (5.0 | ) |
|
| (19.7 | ) |
|
|
| (13.6 | ) |
TRP Adjusted EBITDA |
|
| $ | 348.1 |
|
|
| $ | 269.6 |
|
| $ | 961.8 |
|
|
| $ | 789.6 |
|
|
| Three Months Ended September 30, |
|
| Nine Months Ended September 30, |
| ||||||||||
|
| 2019 |
|
| 2018 |
|
| 2019 |
|
| 2018 |
| ||||
|
| (In millions) |
| |||||||||||||
Reconciliation of Net Income (Loss) attributable to TRP to Adjusted EBITDA |
|
|
|
|
|
|
|
|
|
|
|
|
|
|
|
|
Net income (loss) attributable to TRP |
| $ | (39.1 | ) |
| $ | (18.4 | ) |
| $ | (74.1 | ) |
| $ | 177.8 |
|
Interest (income) expense, net (1) |
|
| 84.2 |
|
|
| 75.7 |
|
|
| 229.2 |
|
|
| 113.3 |
|
Depreciation and amortization expense |
|
| 244.3 |
|
|
| 206.3 |
|
|
| 718.9 |
|
|
| 607.1 |
|
(Gain) loss on sale or disposition of assets |
|
| 0.5 |
|
|
| 61.1 |
|
|
| 3.6 |
|
|
| 14.3 |
|
Write-down of assets |
|
| 17.9 |
|
|
| — |
|
|
| 17.9 |
|
|
| — |
|
(Gain) loss from sale of equity-method investment |
|
| (65.8 | ) |
|
| — |
|
|
| (65.8 | ) |
|
| — |
|
(Gain) loss from financing activities (2) |
|
| — |
|
|
| — |
|
|
| 1.4 |
|
|
| 1.3 |
|
Equity (earnings) loss |
|
| (10.0 | ) |
|
| (3.0 | ) |
|
| (15.9 | ) |
|
| (6.4 | ) |
Distributions from unconsolidated affiliates and preferred partner interests, net |
|
| 14.0 |
|
|
| 7.5 |
|
|
| 33.4 |
|
|
| 21.4 |
|
Change in contingent considerations |
|
| — |
|
|
| 16.6 |
|
|
| 8.8 |
|
|
| 12.1 |
|
Risk management activities |
|
| 100.7 |
|
|
| (0.8 | ) |
|
| 100.8 |
|
|
| 8.3 |
|
Noncontrolling interests adjustments (3) |
|
| (8.9 | ) |
|
| (7.7 | ) |
|
| (25.6 | ) |
|
| (19.7 | ) |
TRP Adjusted EBITDA (4) |
| $ | 337.8 |
|
| $ | 337.3 |
|
| $ | 932.6 |
|
| $ | 929.5 |
|
(1) | Includes the change in estimated redemption value of the mandatorily redeemable preferred interests. |
(2) |
|
(3) | Noncontrolling interest portion of depreciation and amortization expense. |
(4) | Beginning in the second quarter of 2019, we revised our reconciliation of Net Income (Loss) attributable to TRP to Adjusted EBITDA to exclude the Splitter Agreement adjustment |
|
|
|
|
Consolidated Results of Operations
The following table and discussion is a summary of our consolidated results of operations:
|
| Three Months Ended September 30, |
|
|
|
|
|
|
|
|
|
|
| Nine Months Ended September 30, |
|
|
|
|
|
|
|
|
| Three Months Ended September 30, |
|
|
|
|
|
|
|
|
|
| Nine Months Ended September 30, |
|
|
|
|
|
|
|
|
| ||||||||||||||||||||
|
| 2018 |
|
| 2017 |
|
| 2018 vs. 2017 |
|
|
| 2018 |
|
| 2017 |
|
| 2018 vs. 2017 |
| 2019 |
|
| 2018 |
|
| 2019 vs. 2018 |
|
| 2019 |
|
| 2018 |
|
| 2019 vs. 2018 |
| ||||||||||||||||||||||||||||
| (In millions, except operating statistics and price amounts) |
| (In millions) |
| ||||||||||||||||||||||||||||||||||||||||||||||||||||||||||||
Revenues: |
|
|
|
|
|
|
|
|
|
|
|
|
|
|
|
|
|
|
|
|
|
|
|
|
|
|
|
|
|
|
|
|
|
|
|
|
|
|
|
|
|
|
|
|
|
|
|
|
|
|
|
|
|
|
|
|
|
|
|
|
|
|
|
|
Sales of commodities |
| $ | 2,654.1 |
|
| $ | 1,871.5 |
|
| $ | 782.6 |
|
|
| 42 | % |
|
| $ | 6,981.4 |
|
| $ | 5,353.1 |
|
| $ | 1,628.3 |
|
|
| 30 | % | $ | 1,594.2 |
|
| $ | 2,654.1 |
|
| $ | (1,059.9 | ) |
|
| (40 | %) |
| $ | 5,254.8 |
|
| $ | 6,981.4 |
|
| $ | (1,726.6 | ) |
|
| (25 | %) |
Fees from midstream services |
|
| 332.3 |
|
|
| 260.3 |
|
|
| 72.0 |
|
|
| 28 | % |
|
|
| 904.9 |
|
|
| 759.0 |
|
|
| 145.9 |
|
|
| 19 | % |
| 308.3 |
|
|
| 332.3 |
|
|
| (24.0 | ) |
|
| (7 | %) |
|
| 942.4 |
|
|
| 904.9 |
|
|
| 37.5 |
|
|
| 4 | % |
Total revenues |
|
| 2,986.4 |
|
|
| 2,131.8 |
|
|
| 854.6 |
|
|
| 40 | % |
|
|
| 7,886.3 |
|
|
| 6,112.1 |
|
|
| 1,774.2 |
|
|
| 29 | % |
| 1,902.5 |
|
|
| 2,986.4 |
|
|
| (1,083.9 | ) |
|
| (36 | %) |
|
| 6,197.2 |
|
|
| 7,886.3 |
|
|
| (1,689.1 | ) |
|
| (21 | %) |
Product purchases |
|
| 2,383.5 |
|
|
| 1,663.1 |
|
|
| 720.4 |
|
|
| 43 | % |
|
|
| 6,229.7 |
|
|
| 4,737.8 |
|
|
| 1,491.9 |
|
|
| 31 | % |
| 1,328.1 |
|
|
| 2,383.5 |
|
|
| (1,055.4 | ) |
|
| (44 | %) |
|
| 4,415.7 |
|
|
| 6,229.7 |
|
|
| (1,814.0 | ) |
|
| (29 | %) |
Gross margin (1) |
|
| 602.9 |
|
|
| 468.7 |
|
|
| 134.2 |
|
|
| 29 | % |
|
|
| 1,656.6 |
|
|
| 1,374.3 |
|
|
| 282.3 |
|
|
| 21 | % |
| 574.4 |
|
|
| 602.9 |
|
|
| (28.5 | ) |
|
| (5 | %) |
|
| 1,781.5 |
|
|
| 1,656.6 |
|
|
| 124.9 |
|
|
| 8 | % |
Operating expenses |
|
| 194.9 |
|
|
| 155.5 |
|
|
| 39.4 |
|
|
| 25 | % |
|
|
| 538.7 |
|
|
| 462.6 |
|
|
| 76.1 |
|
|
| 16 | % |
| 200.2 |
|
|
| 194.9 |
|
|
| 5.3 |
|
|
| 3 | % |
|
| 600.7 |
|
|
| 538.7 |
|
|
| 62.0 |
|
|
| 12 | % |
Operating margin (1) |
|
| 408.0 |
|
|
| 313.2 |
|
|
| 94.8 |
|
|
| 30 | % |
|
|
| 1,117.9 |
|
|
| 911.7 |
|
|
| 206.2 |
|
|
| 23 | % |
| 374.2 |
|
|
| 408.0 |
|
|
| (33.8 | ) |
|
| (8 | %) |
|
| 1,180.8 |
|
|
| 1,117.9 |
|
|
| 62.9 |
|
|
| 6 | % |
Depreciation and amortization expense |
|
| 206.3 |
|
|
| 208.3 |
|
|
| (2.0 | ) |
|
| (1 | %) |
|
|
| 607.1 |
|
|
| 602.8 |
|
|
| 4.3 |
|
|
| 1 | % |
| 244.3 |
|
|
| 206.3 |
|
|
| 38.0 |
|
|
| 18 | % |
|
| 718.9 |
|
|
| 607.1 |
|
|
| 111.8 |
|
|
| 18 | % |
General and administrative expense |
|
| 59.3 |
|
|
| 46.6 |
|
|
| 12.7 |
|
|
| 27 | % |
|
|
| 165.0 |
|
|
| 139.4 |
|
|
| 25.6 |
|
|
| 18 | % |
| 65.6 |
|
|
| 59.3 |
|
|
| 6.3 |
|
|
| 11 | % |
|
| 212.3 |
|
|
| 165.0 |
|
|
| 47.3 |
|
|
| 29 | % |
Impairment of property, plant and equipment |
|
| — |
|
|
| 378.0 |
|
|
| (378.0 | ) |
|
| (100 | %) |
|
|
| — |
|
|
| 378.0 |
|
|
| (378.0 | ) |
|
| (100 | %) | |||||||||||||||||||||||||||||||
Other operating (income) expense |
|
| 61.8 |
|
|
| 0.6 |
|
|
| 61.2 |
|
| NM |
|
|
|
| 15.7 |
|
|
| 17.2 |
|
|
| (1.5 | ) |
|
| (9 | %) |
| 18.4 |
|
|
| 61.8 |
|
|
| (43.4 | ) |
|
| (70 | %) |
|
| 21.7 |
|
|
| 15.7 |
|
|
| 6.0 |
|
|
| 38 | % | |
Income (loss) from operations |
|
| 80.6 |
|
|
| (320.3 | ) |
|
| 400.9 |
|
|
| 125 | % |
|
|
| 330.1 |
|
|
| (225.7 | ) |
|
| 555.8 |
|
|
| 246 | % |
| 45.9 |
|
|
| 80.6 |
|
|
| (34.7 | ) |
|
| (43 | %) |
|
| 227.9 |
|
|
| 330.1 |
|
|
| (102.2 | ) |
|
| (31 | %) |
Interest expense, net |
|
| (75.7 | ) |
|
| (51.9 | ) |
|
| (23.8 | ) |
|
| (46 | %) |
|
|
| (113.3 | ) |
|
| (169.5 | ) |
|
| 56.2 |
|
|
| 33 | % |
| (84.2 | ) |
|
| (75.7 | ) |
|
| (8.5 | ) |
|
| (11 | %) |
|
| (229.2 | ) |
|
| (113.3 | ) |
|
| (115.9 | ) |
|
| (102 | %) |
Equity earnings (loss) |
|
| 3.0 |
|
|
| 0.2 |
|
|
| 2.8 |
|
| NM |
|
|
|
| 6.4 |
|
|
| (16.6 | ) |
|
| 23.0 |
|
|
| 139 | % |
| 10.0 |
|
|
| 3.0 |
|
|
| 7.0 |
|
|
| 233 | % |
|
| 15.9 |
|
|
| 6.4 |
|
|
| 9.5 |
|
|
| 148 | % | |
Gain (loss) from financing activities |
|
| — |
|
|
| — |
|
|
| — |
|
|
| — |
|
|
|
| (1.3 | ) |
|
| (10.7 | ) |
|
| 9.4 |
|
|
| 88 | % |
| — |
|
|
| — |
|
|
| — |
|
|
| — |
|
|
| (1.4 | ) |
|
| (1.3 | ) |
|
| (0.1 | ) |
|
| (8 | %) |
Gain (loss) from sale of equity-method investment |
| 65.8 |
|
|
| — |
|
|
| 65.8 |
|
|
| — |
|
|
| 65.8 |
|
|
| — |
|
|
| 65.8 |
|
|
| — |
| |||||||||||||||||||||||||||||||||
Change in contingent considerations |
|
| (16.6 | ) |
|
| 126.8 |
|
|
| (143.4 | ) |
|
| (113 | %) |
|
|
| (12.1 | ) |
|
| 125.6 |
|
|
| (137.7 | ) |
|
| (110 | %) |
| — |
|
|
| (16.6 | ) |
|
| 16.6 |
|
|
| 100 | % |
|
| (8.8 | ) |
|
| (12.1 | ) |
|
| 3.3 |
|
|
| 27 | % |
Other income (expense), net |
|
| — |
|
|
| 0.2 |
|
|
| (0.2 | ) |
|
| (100 | %) |
|
|
| — |
|
|
| (2.7 | ) |
|
| 2.7 |
|
|
| 100 | % | |||||||||||||||||||||||||||||||
Income tax (expense) benefit |
|
| — |
|
|
| — |
|
|
| — |
|
|
| — |
|
|
|
| — |
|
|
| 4.2 |
|
|
| (4.2 | ) |
|
| (100 | %) | |||||||||||||||||||||||||||||||
Net income (loss) |
|
| (8.7 | ) |
|
| (245.0 | ) |
|
| 236.3 |
|
|
| 96 | % |
|
|
| 209.8 |
|
|
| (295.4 | ) |
|
| 505.2 |
|
|
| 171 | % |
| 37.5 |
|
|
| (8.7 | ) |
|
| 46.2 |
|
| NM |
|
|
| 70.2 |
|
|
| 209.8 |
|
|
| (139.6 | ) |
|
| (67 | %) | |
Less: Net income (loss) attributable to noncontrolling interests |
|
| 9.7 |
|
|
| 9.7 |
|
|
| — |
|
|
| — |
|
|
|
| 32.0 |
|
|
| 25.9 |
|
|
| 6.1 |
|
|
| 24 | % |
| 76.6 |
|
|
| 9.7 |
|
|
| 66.9 |
|
| NM |
|
|
| 144.3 |
|
|
| 32.0 |
|
|
| 112.3 |
|
| NM |
| ||
Net income (loss) attributable to Targa Resources Partners LP |
| $ | (18.4 | ) |
| $ | (254.7 | ) |
| $ | 236.3 |
|
|
| 93 | % |
|
| $ | 177.8 |
|
| $ | (321.3 | ) |
| $ | 499.1 |
|
|
| 155 | % | $ | (39.1 | ) |
| $ | (18.4 | ) |
| $ | (20.7 | ) |
|
| 113 | % |
| $ | (74.1 | ) |
| $ | 177.8 |
|
| $ | (251.9 | ) |
|
| (142 | %) |
Financial data: |
|
|
|
|
|
|
|
|
|
|
|
|
|
|
|
|
|
|
|
|
|
|
|
|
|
|
|
|
|
|
|
|
|
|
|
|
|
|
|
|
|
|
|
|
|
|
|
|
|
|
|
|
|
|
|
|
|
|
|
|
|
|
|
|
Adjusted EBITDA (1) |
| $ | 348.1 |
|
| $ | 269.6 |
|
| $ | 78.5 |
|
|
| 29 | % |
|
| $ | 961.8 |
|
| $ | 789.6 |
|
| $ | 172.2 |
|
|
| 22 | % | $ | 337.8 |
|
| $ | 337.3 |
|
| $ | 0.5 |
|
|
| — |
|
| $ | 932.6 |
|
| $ | 929.5 |
|
| $ | 3.1 |
|
|
| — |
|
Capital expenditures (2) |
|
| 1,017.7 |
|
|
| 378.7 |
|
|
| 639.0 |
|
|
| 169 | % |
|
|
| 2,310.4 |
|
|
| 987.7 |
|
|
| 1,322.7 |
|
|
| 134 | % | |||||||||||||||||||||||||||||||
Business acquisition (3) |
|
| — |
|
|
| — |
|
|
| — |
|
|
| — |
|
|
|
| — |
|
|
| 987.1 |
|
|
| (987.1 | ) |
|
| (100 | %) | |||||||||||||||||||||||||||||||
Growth capital expenditures (2) |
| 511.3 |
|
|
| 984.4 |
|
|
| (473.1 | ) |
|
| (48 | %) |
|
| 2,203.4 |
|
|
| 2,230.0 |
|
|
| (26.6 | ) |
|
| (1 | %) | |||||||||||||||||||||||||||||||||
Maintenance capital expenditures (3) |
| 31.0 |
|
|
| 33.3 |
|
|
| (2.3 | ) |
|
| (7 | %) |
|
| 101.5 |
|
|
| 80.4 |
|
|
| 21.1 |
|
|
| 26 | % | |||||||||||||||||||||||||||||||||
(1) | Gross margin, operating margin, and Adjusted EBITDA are non-GAAP financial measures and are discussed under “Management’s Discussion and Analysis of Financial Condition and Results of Operations – How We Evaluate Our Operations.” |
(2) |
|
(3) |
|
NM | Due to a low denominator, the noted percentage change is disproportionately high and as a result, considered not meaningful. |
Three Months Ended September 30, 20182019 Compared to Three Months Ended September 30, 20172018
The increasedecrease in commodity sales reflects increasedlower NGL, natural gas, condensate and petroleum volumes ($538.4 million) and higher NGL and condensate prices ($475.51,352.5 million), the unfavorable impact of mark-to-market hedges ($102.0 million) and lower petroleum products and condensate volumes ($62.2 million), partially offset by lowerhigher NGL, crude marketing and natural gas pricesvolumes ($127.5373.3 million), the favorable impact of equity volume hedges ($59.5 million) and the impact of hedgeshigher crude marketing prices ($21.420.1 million). Fee-based and other revenues increased primarily due to higher gas processing and crude gathering fees.
The decrease in fees from midstream services is largely due to lower gas gathering fees attributable to our non-cash take in-kind equity volumes, partially offset by an overall increase in product purchases reflects increased volumes and higher NGL and condensate prices.
The prospectivegas gathered volumes. Subsequent to our January 2018 adoption of the revenue recognition accounting standardASC 606, Revenue from Contracts with Customers, non-cash take in-kind volumes, which have exposure to commodity prices, received from a customer are presented as set forth in Topic 606 in 2018 resulted in lower commodity sales ($84.6 million) and lower fee revenue ($5.8 million)a component of fees from midstream services with a corresponding net reduction inoffset to product purchases resulting inand have no impact onto our operating margin or gross margin.
The higherdecrease in product purchases reflects decreased NGL, natural gas and condensate prices, partially offset by increases in volumes.
Lower 2019 operating margin and gross margin in 2018 reflect increaseddecreased segment margin results for Gathering and Processing, andoffset by increased segment results for Logistics and Marketing. Additionally, our operating margin for the three months ended September 30, 2017 was reduced by approximately $10 million due to temporary operational issues related to the impact of Hurricane Harvey. Operating expenses increased compared to 2017 primarily due to system expansions and higher activity levels. See “—Results of Operations—By Reportable Segment” for additional information regarding changes in operating margin and gross margin on a segment basis. Operating margin and gross margin also include the effect of hedges as discussed in “—Other.”
Depreciation and amortization expense was flat asincreased primarily due to higher depreciation related to ourmajor growth investments was offset by lower depreciation for our North Texas systemprojects placed in service, including additional processing plants and lower scheduled amortization of Badlands intangibles. Lower North Texas system depreciation reflects the impact of a partial impairment of property, plant and equipment recordedassociated infrastructure in the third quarter of 2017.Permian Basin and Grand Prix.
General and administrative expense increased primarily due to higher compensation and benefits costs as a result of increased staffing levels, partially offset by lower professional services and higher outside professional services.lower contract labor.
Other operating (income) expense in 2018 was comprised primarilyDuring the third quarter of 2019, we wrote down certain assets to their recoverable amounts. In the estimatedprior year, a loss on sale was recognized associated with our refined products and crude oil storage and terminaling facilities in Tacoma, Washington,WA, and Baltimore, Maryland that were held for sale as of September 30, 2018.MD.
Interest expense, net, increased due to the impact of higher average borrowings, and lower interest income on the mandatorily redeemable preferred interest valuations, partially offset by higher capitalized interest related to our major growth investments.
EquityThe increase in equity earnings increased in 2018,is primarily reflecting increaseddue to higher earnings at Gulf Coast Fractionators LP (“GCF”) and the commencement of operations of Cayenne.from GCX.
During the third quarter of 2019, we closed on the sale of an equity-method investment for $70.3 million that resulted in the recognition of a gain of $65.8 million.
During 2019, the Permian Acquisition contingent consideration earn-out period ended and resulted in a final payment in May. During 2018, we recorded an expense of $16.6 million resulting primarily from an increase in fair value as of September 30, 2018 of the Permian Acquisition contingent consideration liability. The fair value increase in 2018 change was primarily attributable to a shorter discount period.During 2017, we recorded income of $126.8 million resulting from a decrease in the fair value of the contingent consideration liability from June 30, 2017 to September 30, 2017. The fair value decrease in 2017 reflected reductions in actual and forecasted volumes and gross margin resulting from changes in producers’ drilling activity in the region.
Net income attributable to noncontrolling interests was higher in 2019 due to earnings allocated to noncontrolling interest holders in Targa Badlands, Grand Prix and Train 6.
Nine Months Ended September 30, 20182019 Compared to Nine Months Ended September 30, 20172018
The increasedecrease in commodity sales reflects increased NGL, natural gas, petroleum and condensate volumeslower commodity prices ($1,241.72,640.8 million) and higher NGLlower petroleum products volumes due to the sale of certain petroleum logistics storage and condensate pricesterminaling facilities in the fourth quarter of 2018 ($1,097.585.3 million), partially offset by lowerhigher NGL, crude marketing and natural gas pricesvolumes ($389.2936.4 million) and the favorable impact of hedges ($68.765.8 million). Fee-based and other revenues increased primarily due to higher gas processingHigher exports and crude gathering fees.fees resulted in increased fees from midstream services.
The increasedecrease in product purchases reflects increased volumes and higherdecreased NGL, natural gas and condensate prices.prices, partially offset by increases in volumes.
The prospective adoption of the revenue recognition accounting standard as set forth in Topic 606 in 2018 resulted in lower commodity sales ($250.6 million) and lower fee revenue ($18.6 million) with a corresponding net reduction in product purchases, resulting in no impact on operating margin or gross margin.
The higherHigher 2019 operating margin and gross margin in 2018 reflect increased segment marginresults for Logistics and Marketing, offset by decreased segment results for Gathering and Processing and Logistics and Marketing. Additionally, our operating margin for the nine months ended September 30, 2017 was reduced by approximately $10 million due to temporary operational issues related to the impact of Hurricane Harvey. Operating expenses increased compared to 2017 primarily due to system expansions, higher activity levels and the inclusion of the Permian Acquisition for nine months in 2018 as compared with seven months in 2017.Processing. See “—Results of Operations—By Reportable Segment” for additional information regarding changes in operating margin and gross margin on a segment basis. Operating margin and gross margin also include the effect of hedges as discussed in “—Other.”
Depreciation and amortization expense was flat asincreased primarily due to higher depreciation related to ourmajor growth investments was offset by lower depreciation for our North Texas system, lower scheduled amortization of Badlands intangiblesprojects placed in service, including additional processing plants and lower depreciation on our inland marine barge business soldassociated infrastructure in the second quarter of 2018. In 2017, we recorded a partial impairment of property, plantPermian Basin and equipment in our North Texas system.Grand Prix.
General and administrative expense increased primarily due to higher compensation and benefits costs as a result of increased staffing levels and higher outside professional services.system costs.
Other operating (income) expense in 2018 was comprised primarily of the estimated loss on our refined products and crude oil storage and terminaling facilities in Tacoma, Washington, and Baltimore, Maryland, that were held for sale as of September 30, 2018, partially offset by the gain on sale of our inland marine barge business. In 2017, other operating (income) expense included the loss on sale of our 100% ownership interest in the Venice Gathering System.
Lower interestInterest expense, net, in 2018 was primarilyincreased due to higher non-cash interest income related to a decrease in the mandatorily redeemable preferred interests liability andaverage borrowings, partially offset by higher capitalized interest related to our major growth investments. These factors more than offset the impact of higher average outstanding borrowings during 2018. The mandatorily redeemable preferred interests liability is revalued quarterly at the estimated redemption value as of the reporting date, and the decrease in 2018 of its estimated redemption value is primarily attributable to the February 2018 amendments to the agreements governing the WestTX and WestOK joint ventures.
Equity earnings increased in 2018, which reflects decreased losses of the T2 Joint Ventures, which in 2017 included a $12.0 million loss provision due to the impairment of our investment in the T2 EF Cogen joint venture, increased earnings at GCF and the commencement of operations at Cayenne.
In 2018, we recorded a loss from financing activities of $1.3 million associated with amendments to our revolving credit facilities, which resulted in a write-off of debt issuance costs. In 2017, we recorded a loss from financing activities of $10.7 million on the redemption of the outstanding 6⅜% Senior Notes.
During 2018, we recorded expense of $12.1 million resulting from the change in the fair value of contingent considerations, substantially all of which was due to the increase in fair value as of September 30, 2018 of the Permian Acquisition contingent consideration liability described above. During 2017, we recordedrecognized non-cash interest income of $125.6 million resulting from a decrease in the fairestimated redemption value of the Permian Acquisition contingent consideration liability from mandatorily redeemable interests, primarily attributable to the acquisition dateFebruary 2018 amendments to September 30, 2017.such arrangements.
We recorded an income tax benefitThe increase in 2017equity earnings is primarily due to higher earnings from GCX.
During 2019, we closed on the sale of an equity-method investment for $70.3 million that resulted in the recognition of a Texas Margin Tax refund.gain of $65.8 million.
Net income attributable to noncontrolling interests was higher in 20182019 due to increased earnings at our Carnero joint ventureallocated to noncontrolling interest holders in Targa Badlands, Grand Prix and Cedar Bayou Fractionators.Train 6.
Results of Operations—By Reportable Segment
Our operating margins by reportable segment are:
|
| Gathering and Processing |
|
| Logistics and Marketing |
|
| Other |
|
| Corporate and Eliminations |
|
| Consolidated Operating Margin |
| Gathering and Processing |
|
| Logistics and Marketing |
|
| Other |
|
| Consolidated Operating Margin |
| |||||||||
| (In millions) |
| (In millions) |
| |||||||||||||||||||||||||||||||
Three Months Ended: | Three Months Ended: |
|
|
|
|
|
|
|
|
|
|
|
|
|
|
|
|
| Three Months Ended: |
|
|
|
|
|
|
|
|
|
|
|
|
| |||
September 30, 2019 | $ | 208.6 |
|
| $ | 228.9 |
|
| $ | (63.3 | ) |
| $ | 374.2 |
| ||||||||||||||||||||
September 30, 2018 |
| $ | 255.3 |
|
| $ | 173.5 |
|
| $ | (20.8 | ) |
| $ | — |
|
| $ | 408.0 |
|
| 255.3 |
|
|
| 173.5 |
|
|
| (20.8 | ) |
|
| 408.0 |
|
September 30, 2017 |
|
| 198.3 |
|
|
| 115.9 |
|
|
| (1.0 | ) |
|
| — |
|
|
| 313.2 |
| |||||||||||||||
|
|
|
|
|
|
|
|
|
|
|
|
|
|
|
|
|
|
|
|
|
|
|
|
|
|
|
|
|
|
|
|
|
|
|
|
Nine Months Ended: |
|
|
|
|
|
|
|
|
|
|
|
|
|
|
|
|
|
|
|
|
|
|
|
|
|
|
|
|
|
|
|
|
|
|
|
September 30, 2019 | $ | 630.9 |
|
| $ | 565.0 |
|
| $ | (15.2 | ) |
| $ | 1,180.7 |
| ||||||||||||||||||||
September 30, 2018 |
| $ | 718.4 |
|
| $ | 441.7 |
|
| $ | (42.2 | ) |
| $ | — |
|
| $ | 1,117.9 |
|
| 718.4 |
|
|
| 441.7 |
|
|
| (42.2 | ) |
|
| 1,117.9 |
|
September 30, 2017 |
|
| 549.3 |
|
|
| 358.5 |
|
|
| 3.9 |
|
|
| — |
|
|
| 911.7 |
| |||||||||||||||
Gathering and Processing Segment
| Three Months Ended September 30, |
|
|
|
|
|
|
|
|
|
|
| Nine Months Ended September 30, |
|
|
|
|
|
|
|
|
|
| Three Months Ended September 30, |
|
|
|
|
|
|
|
|
|
|
| Nine Months Ended September 30, |
|
|
|
|
|
|
|
|
|
| ||||||||||||||||||||||||||||
| 2018 |
|
| 2017 |
|
| 2018 vs. 2017 |
|
| 2018 |
|
| 2017 |
|
|
| 2018 vs. 2017 |
| 2019 |
|
| 2018 |
|
| 2019 vs. 2018 |
|
| 2019 |
|
| 2018 |
|
|
| 2019 vs. 2018 |
| ||||||||||||||||||||||||||||||||||||||
Gross margin | $ |
| 373.7 |
|
| $ |
| 289.7 |
|
| $ |
| 84.0 |
|
|
| 29 | % |
| $ |
| 1,046.3 |
|
| $ |
| 817.1 |
|
| $ |
| 229.2 |
|
|
| 28 | % | $ |
| 328.8 |
|
| $ |
| 373.7 |
|
| $ |
| (44.9 | ) |
|
| (12 | %) |
| $ |
| 1,006.1 |
|
| $ |
| 1,046.3 |
|
| $ |
| (40.2 | ) |
|
| (4 | %) |
Operating expenses |
|
| 118.4 |
|
|
|
| 91.4 |
|
|
|
| 27.0 |
|
|
| 30 | % |
|
|
| 327.9 |
|
|
|
| 267.8 |
|
|
|
| 60.1 |
|
|
| 22 | % |
|
| 120.2 |
|
|
|
| 118.4 |
|
|
|
| 1.8 |
|
|
| 2 | % |
|
|
| 375.2 |
|
|
|
| 327.9 |
|
|
|
| 47.3 |
|
|
| 14 | % |
Operating margin | $ |
| 255.3 |
|
| $ |
| 198.3 |
|
| $ |
| 57.0 |
|
|
| 29 | % |
| $ |
| 718.4 |
|
| $ |
| 549.3 |
|
| $ |
| 169.1 |
|
|
| 31 | % | $ |
| 208.6 |
|
| $ |
| 255.3 |
|
| $ |
| (46.7 | ) |
|
| (18 | %) |
| $ |
| 630.9 |
|
| $ |
| 718.4 |
|
| $ |
| (87.5 | ) |
|
| (12 | %) |
Operating statistics (1): |
|
|
|
|
|
|
|
|
|
|
|
|
|
|
|
|
|
|
|
|
|
|
|
|
|
|
|
|
|
|
|
|
|
|
|
|
|
|
|
|
|
|
|
|
|
|
|
|
|
|
|
|
|
|
|
|
|
|
|
|
|
|
|
|
|
|
|
|
|
|
|
|
|
|
Plant natural gas inlet, MMcf/d (2),(3) |
|
|
|
|
|
|
|
|
|
|
|
|
|
|
|
|
|
|
|
|
|
|
|
|
|
|
|
|
|
|
|
|
|
|
|
|
|
|
|
|
|
|
|
|
|
|
|
|
|
|
|
|
|
|
|
|
|
|
|
|
|
|
|
|
|
|
|
|
|
| ||||
Permian Midland (4) |
|
| 1,161.7 |
|
|
|
| 932.1 |
|
|
|
| 229.6 |
|
|
| 25 | % |
|
|
| 1,100.8 |
|
|
|
| 864.9 |
|
|
|
| 235.9 |
|
|
| 27 | % |
|
| 1,546.7 |
|
|
|
| 1,161.7 |
|
|
|
| 385.0 |
|
|
| 33 | % |
|
|
| 1,438.7 |
|
|
|
| 1,100.8 |
|
|
|
| 337.9 |
|
|
| 31 | % |
Permian Delaware |
|
| 470.5 |
|
|
|
| 403.9 |
|
|
|
| 66.6 |
|
|
| 16 | % |
|
|
| 432.5 |
|
|
|
| 373.6 |
|
|
|
| 58.9 |
|
|
| 16 | % |
|
| 629.4 |
|
|
|
| 470.5 |
|
|
|
| 158.9 |
|
|
| 34 | % |
|
|
| 552.2 |
|
|
|
| 432.5 |
|
|
|
| 119.7 |
|
|
| 28 | % |
Total Permian |
|
| 1,632.2 |
|
|
|
| 1,336.0 |
|
|
|
| 296.2 |
|
|
|
|
|
|
|
| 1,533.3 |
|
|
|
| 1,238.5 |
|
|
|
| 294.8 |
|
|
|
|
|
|
| 2,176.1 |
|
|
|
| 1,632.2 |
|
|
|
| 543.9 |
|
|
|
|
|
|
|
| 1,990.9 |
|
|
|
| 1,533.3 |
|
|
|
| 457.6 |
|
|
|
|
|
|
|
|
|
|
|
|
|
|
|
|
|
|
|
|
|
|
|
|
|
|
|
|
|
|
|
|
|
|
|
|
|
|
|
|
|
|
|
|
|
|
|
|
|
|
|
|
|
|
|
|
|
|
|
|
|
|
|
|
|
|
|
|
|
|
|
|
|
|
|
|
|
|
|
|
SouthTX |
|
| 364.1 |
|
|
|
| 330.1 |
|
|
|
| 34.0 |
|
|
| 10 | % |
|
|
| 397.8 |
|
|
|
| 242.1 |
|
|
|
| 155.7 |
|
|
| 64 | % |
|
| 328.6 |
|
|
|
| 364.1 |
|
|
|
| (35.5 | ) |
|
| (10 | %) |
|
|
| 335.3 |
|
|
|
| 397.8 |
|
|
|
| (62.5 | ) |
|
| (16 | %) |
North Texas |
|
| 247.6 |
|
|
|
| 261.8 |
|
|
|
| (14.2 | ) |
|
| (5 | %) |
|
|
| 243.0 |
|
|
|
| 273.7 |
|
|
|
| (30.7 | ) |
|
| (11 | %) |
|
| 228.2 |
|
|
|
| 247.6 |
|
|
|
| (19.4 | ) |
|
| (8 | %) |
|
|
| 227.6 |
|
|
|
| 243.0 |
|
|
|
| (15.4 | ) |
|
| (6 | %) |
SouthOK |
|
| 568.2 |
|
|
|
| 515.2 |
|
|
|
| 53.0 |
|
|
| 10 | % |
|
|
| 549.4 |
|
|
|
| 478.5 |
|
|
|
| 70.9 |
|
|
| 15 | % |
|
| 590.8 |
|
|
|
| 568.2 |
|
|
|
| 22.6 |
|
|
| 4 | % |
|
|
| 606.1 |
|
|
|
| 549.4 |
|
|
|
| 56.7 |
|
|
| 10 | % |
WestOK |
|
| 353.9 |
|
|
|
| 367.1 |
|
|
|
| (13.2 | ) |
|
| (4 | %) |
|
|
| 350.8 |
|
|
|
| 382.5 |
|
|
|
| (31.7 | ) |
|
| (8 | %) |
|
| 329.2 |
|
|
|
| 353.9 |
|
|
|
| (24.7 | ) |
|
| (7 | %) |
|
|
| 335.2 |
|
|
|
| 350.8 |
|
|
|
| (15.6 | ) |
|
| (4 | %) |
Total Central |
|
| 1,533.8 |
|
|
|
| 1,474.2 |
|
|
|
| 59.6 |
|
|
|
|
|
|
|
| 1,541.0 |
|
|
|
| 1,376.8 |
|
| �� |
| 164.2 |
|
|
|
|
|
|
| 1,476.8 |
|
|
|
| 1,533.8 |
|
|
|
| (57.0 | ) |
|
|
|
|
|
|
| 1,504.2 |
|
|
|
| 1,541.0 |
|
|
|
| (36.8 | ) |
|
|
|
|
|
|
|
|
|
|
|
|
|
|
|
|
|
|
|
|
|
|
|
|
|
|
|
|
|
|
|
|
|
|
|
|
|
|
|
|
|
|
|
|
|
|
|
|
|
|
|
|
|
|
|
|
|
|
|
|
|
|
|
|
|
|
|
|
|
|
|
|
|
|
|
|
|
|
|
Badlands (5) |
|
| 90.5 |
|
|
|
| 60.9 |
|
|
|
| 29.6 |
|
|
| 49 | % |
|
|
| 83.3 |
|
|
|
| 53.1 |
|
|
|
| 30.2 |
|
|
| 57 | % | |||||||||||||||||||||||||||||||||||||
Badlands (7), (8) |
|
| 120.8 |
|
|
|
| 90.5 |
|
|
|
| 30.3 |
|
|
| 33 | % |
|
|
| 103.4 |
|
|
|
| 83.3 |
|
|
|
| 20.1 |
|
|
| 24 | % | |||||||||||||||||||||||||||||||||||||
Total Field |
|
| 3,256.5 |
|
|
|
| 2,871.1 |
|
|
|
| 385.4 |
|
|
|
|
|
|
|
| 3,157.6 |
|
|
|
| 2,668.4 |
|
|
|
| 489.2 |
|
|
|
|
|
|
| 3,773.7 |
|
|
|
| 3,256.5 |
|
|
|
| 517.2 |
|
|
|
|
|
|
|
| 3,598.5 |
|
|
|
| 3,157.6 |
|
|
|
| 440.9 |
|
|
|
|
|
|
|
|
|
|
|
|
|
|
|
|
|
|
|
|
|
|
|
|
|
|
|
|
|
|
|
|
|
|
|
|
|
|
|
|
|
|
|
|
|
|
|
|
|
|
|
|
|
|
|
|
|
|
|
|
|
|
|
|
|
|
|
|
|
|
|
|
|
|
|
|
|
|
|
|
Coastal |
|
| 783.3 |
|
|
|
| 750.5 |
|
|
|
| 32.8 |
|
|
| 4 | % |
|
|
| 724.5 |
|
|
|
| 750.1 |
|
|
|
| (25.6 | ) |
|
| (3 | %) |
|
| 721.0 |
|
|
|
| 783.3 |
|
|
|
| (62.3 | ) |
|
| (8 | %) |
|
|
| 765.1 |
|
|
|
| 724.5 |
|
|
|
| 40.6 |
|
|
| 6 | % |
|
|
|
|
|
|
|
|
|
|
|
|
|
|
|
|
|
|
|
|
|
|
|
|
|
|
|
|
|
|
|
|
|
|
|
|
|
|
|
|
|
|
|
|
|
|
|
|
|
|
|
|
|
|
|
|
|
|
|
|
|
|
|
|
|
|
|
|
|
|
|
|
|
|
|
Total |
|
| 4,039.8 |
|
|
|
| 3,621.6 |
|
|
|
| 418.2 |
|
|
| 12 | % |
|
|
| 3,882.1 |
|
|
|
| 3,418.5 |
|
|
|
| 463.6 |
|
|
| 14 | % |
|
| 4,494.7 |
|
|
|
| 4,039.8 |
|
|
|
| 454.9 |
|
|
| 11 | % |
|
|
| 4,363.6 |
|
|
|
| 3,882.1 |
|
|
|
| 481.5 |
|
|
| 12 | % |
NGL production, MBbl/d (3) |
|
|
|
|
|
|
|
|
|
|
|
|
|
|
|
|
|
|
|
|
|
|
|
|
|
|
|
|
|
|
|
|
|
|
|
|
|
|
|
|
|
|
|
|
|
|
|
|
|
|
|
|
|
|
|
|
|
|
|
|
|
|
|
|
|
|
|
|
|
|
|
|
|
|
Permian Midland (4) |
|
| 152.2 |
|
|
|
| 122.8 |
|
|
|
| 29.4 |
|
|
| 24 | % |
|
|
| 148.0 |
|
|
|
| 111.8 |
|
|
|
| 36.2 |
|
|
| 32 | % |
|
| 216.5 |
|
|
|
| 152.2 |
|
|
|
| 64.3 |
|
|
| 42 | % |
|
|
| 199.8 |
|
|
|
| 148.0 |
|
|
|
| 51.8 |
|
|
| 35 | % |
Permian Delaware |
|
| 58.9 |
|
|
|
| 46.3 |
|
|
|
| 12.6 |
|
|
| 27 | % |
|
|
| 51.6 |
|
|
|
| 42.4 |
|
|
|
| 9.2 |
|
|
| 22 | % |
|
| 82.3 |
|
|
|
| 58.9 |
|
|
|
| 23.4 |
|
|
| 40 | % |
|
|
| 71.4 |
|
|
|
| 51.6 |
|
|
|
| 19.8 |
|
|
| 38 | % |
Total Permian |
|
| 211.1 |
|
|
|
| 169.1 |
|
|
|
| 42.0 |
|
|
|
|
|
|
|
| 199.6 |
|
|
|
| 154.2 |
|
|
|
| 45.4 |
|
|
|
|
|
|
| 298.8 |
|
|
|
| 211.1 |
|
|
|
| 87.7 |
|
|
|
|
|
|
|
| 271.2 |
|
|
|
| 199.6 |
|
|
|
| 71.6 |
|
|
|
|
|
|
|
|
|
|
|
|
|
|
|
|
|
|
|
|
|
|
|
|
|
|
|
|
|
|
|
|
|
|
|
|
|
|
|
|
|
|
|
|
|
|
|
|
|
|
|
|
|
|
|
|
|
|
|
|
|
|
|
|
|
|
|
|
|
|
|
|
|
|
|
|
|
|
|
|
SouthTX |
|
| 49.0 |
|
|
|
| 35.4 |
|
|
|
| 13.6 |
|
|
| 38 | % |
|
|
| 52.5 |
|
|
|
| 25.2 |
|
|
|
| 27.3 |
|
|
| 108 | % |
|
| 41.5 |
|
|
|
| 49.0 |
|
|
|
| (7.5 | ) |
|
| (15 | %) |
|
|
| 44.0 |
|
|
|
| 52.5 |
|
|
|
| (8.5 | ) |
|
| (16 | %) |
North Texas |
|
| 29.6 |
|
|
|
| 29.3 |
|
|
|
| 0.3 |
|
|
| 1 | % |
|
|
| 28.1 |
|
|
|
| 30.8 |
|
|
|
| (2.7 | ) |
|
| (9 | %) |
|
| 27.3 |
|
|
|
| 29.6 |
|
|
|
| (2.3 | ) |
|
| (8 | %) |
|
|
| 26.9 |
|
|
|
| 28.1 |
|
|
|
| (1.2 | ) |
|
| (4 | %) |
SouthOK |
|
| 61.2 |
|
|
|
| 42.7 |
|
|
|
| 18.5 |
|
|
| 43 | % |
|
|
| 53.8 |
|
|
|
| 40.7 |
|
|
|
| 13.1 |
|
|
| 32 | % |
|
| 69.5 |
|
|
|
| 61.2 |
|
|
|
| 8.3 |
|
|
| 14 | % |
|
|
| 65.4 |
|
|
|
| 53.8 |
|
|
|
| 11.6 |
|
|
| 22 | % |
WestOK |
|
| 20.7 |
|
|
|
| 20.7 |
|
|
|
| - |
|
|
| - |
|
|
|
| 19.9 |
|
|
|
| 22.3 |
|
|
|
| (2.4 | ) |
|
| (11 | %) |
|
| 19.2 |
|
|
|
| 20.7 |
|
|
|
| (1.5 | ) |
|
| (7 | %) |
|
|
| 22.4 |
|
|
|
| 19.9 |
|
|
|
| 2.5 |
|
|
| 13 | % |
Total Central |
|
| 160.5 |
|
|
|
| 128.1 |
|
|
|
| 32.4 |
|
|
|
|
|
|
|
| 154.3 |
|
|
|
| 119.0 |
|
|
|
| 35.3 |
|
|
|
|
|
|
| 157.5 |
|
|
|
| 160.5 |
|
|
|
| (3.0 | ) |
|
|
|
|
|
|
| 158.7 |
|
|
|
| 154.3 |
|
|
|
| 4.4 |
|
|
|
|
|
|
|
|
|
|
|
|
|
|
|
|
|
|
|
|
|
|
|
|
|
|
|
|
|
|
|
|
|
|
|
|
|
|
|
|
|
|
|
|
|
|
|
|
|
|
|
|
|
|
|
|
|
|
|
|
|
|
|
|
|
|
|
|
|
|
|
|
|
|
|
|
|
|
|
|
Badlands |
|
| 10.5 |
|
|
|
| 9.0 |
|
|
|
| 1.5 |
|
|
| 17 | % |
|
|
| 10.5 |
|
|
|
| 7.4 |
|
|
|
| 3.1 |
|
|
| 42 | % |
|
| 14.0 |
|
|
|
| 10.5 |
|
|
|
| 3.5 |
|
|
| 33 | % |
|
|
| 12.2 |
|
|
|
| 10.5 |
|
|
|
| 1.7 |
|
|
| 16 | % |
Total Field |
|
| 382.1 |
|
|
|
| 306.2 |
|
|
|
| 75.9 |
|
|
|
|
|
|
|
| 364.4 |
|
|
|
| 280.6 |
|
|
|
| 83.8 |
|
|
|
|
|
|
| 470.3 |
|
|
|
| 382.1 |
|
|
|
| 88.2 |
|
|
|
|
|
|
|
| 442.1 |
|
|
|
| 364.4 |
|
|
|
| 77.7 |
|
|
|
|
|
|
|
|
|
|
|
|
|
|
|
|
|
|
|
|
|
|
|
|
|
|
|
|
|
|
|
|
|
|
|
|
|
|
|
|
|
|
|
|
|
|
|
|
|
|
|
|
|
|
|
|
|
|
|
|
|
|
|
|
|
|
|
|
|
|
|
|
|
|
|
|
|
|
|
|
Coastal |
|
| 47.3 |
|
|
|
| 40.0 |
|
|
|
| 7.3 |
|
|
| 18 | % |
|
|
| 42.8 |
|
|
|
| 38.2 |
|
|
|
| 4.6 |
|
|
| 12 | % |
|
| 45.4 |
|
|
|
| 47.3 |
|
|
|
| (1.9 | ) |
|
| (4 | %) |
|
|
| 47.0 |
|
|
|
| 42.8 |
|
|
|
| 4.2 |
|
|
| 10 | % |
|
|
|
|
|
|
|
|
|
|
|
|
|
|
|
|
|
|
|
|
|
|
|
|
|
|
|
|
|
|
|
|
|
|
|
|
|
|
|
|
|
|
|
|
|
|
|
|
|
|
|
|
|
|
|
|
|
|
|
|
|
|
|
|
|
|
|
|
|
|
|
|
|
|
|
Total |
|
| 429.4 |
|
|
|
| 346.2 |
|
|
|
| 83.2 |
|
|
| 24 | % |
|
|
| 407.2 |
|
|
|
| 318.8 |
|
|
|
| 88.4 |
|
|
| 28 | % |
|
| 515.7 |
|
|
|
| 429.4 |
|
|
|
| 86.3 |
|
|
| 20 | % |
|
|
| 489.1 |
|
|
|
| 407.2 |
|
|
|
| 81.9 |
|
|
| 20 | % |
Crude oil gathered, Badlands, MBbl/d |
|
| 161.7 |
|
|
|
| 108.7 |
|
|
|
| 53.0 |
|
|
| 49 | % |
|
|
| 139.9 |
|
|
|
| 111.6 |
|
|
|
| 28.3 |
|
|
| 25 | % |
|
| 164.3 |
|
|
|
| 161.7 |
|
|
|
| 2.6 |
|
|
| 2 | % |
|
|
| 167.0 |
|
|
|
| 139.9 |
|
|
|
| 27.1 |
|
|
| 19 | % |
Crude oil gathered, Permian, MBbl/d |
|
| 75.1 |
|
|
|
| 35.7 |
|
|
|
| 39.4 |
|
|
| 110 | % |
|
|
| 63.8 |
|
|
|
| 24.6 |
|
|
|
| 39.2 |
|
|
| 159 | % |
|
| 95.2 |
|
|
|
| 75.1 |
|
|
|
| 20.1 |
|
|
| 27 | % |
|
|
| 86.1 |
|
|
|
| 63.8 |
|
|
|
| 22.3 |
|
|
| 35 | % |
Natural gas sales, BBtu/d (3) |
|
| 1,817.6 |
|
|
|
| 1,738.5 |
|
|
|
| 79.1 |
|
|
| 5 | % |
|
|
| 1,821.1 |
|
|
|
| 1,647.8 |
|
|
|
| 173.3 |
|
|
| 11 | % |
|
| 2,056.6 |
|
|
|
| 1,817.6 |
|
|
|
| 239.0 |
|
|
| 13 | % |
|
|
| 2,011.2 |
|
|
|
| 1,821.1 |
|
|
|
| 190.1 |
|
|
| 10 | % |
NGL sales, MBbl/d |
|
| 329.6 |
|
|
|
| 244.4 |
|
|
|
| 85.2 |
|
|
| 35 | % |
|
|
| 311.3 |
|
|
|
| 240.4 |
|
|
|
| 70.9 |
|
|
| 29 | % |
|
| 398.0 |
|
|
|
| 329.6 |
|
|
|
| 68.4 |
|
|
| 21 | % |
|
|
| 382.4 |
|
|
|
| 311.3 |
|
|
|
| 71.1 |
|
|
| 23 | % |
Condensate sales, MBbl/d |
|
| 12.6 |
|
|
|
| 11.4 |
|
|
|
| 1.2 |
|
|
| 11 | % |
|
|
| 12.8 |
|
|
|
| 11.4 |
|
|
|
| 1.4 |
|
|
| 12 | % |
|
| 11.0 |
|
|
|
| 12.6 |
|
|
|
| (1.6 | ) |
|
| (13 | %) |
|
|
| 12.2 |
|
|
|
| 12.8 |
|
|
|
| (0.6 | ) |
|
| (5 | %) |
Average realized prices (6): |
|
|
|
|
|
|
|
|
|
|
|
|
|
|
|
|
|
|
|
|
|
|
|
|
|
|
|
|
|
|
|
|
| |||||||||||||||||||||||||||||||||||||||||
Average realized prices (9): |
|
|
|
|
|
|
|
|
|
|
|
|
|
|
|
|
|
|
|
|
|
|
|
|
|
|
|
|
|
|
|
|
|
|
|
|
| |||||||||||||||||||||||||||||||||||||
Natural gas, $/MMBtu |
|
| 1.93 |
|
|
| 2.58 |
|
|
| (0.66 | ) |
|
| (26 | %) |
|
|
| 2.03 |
|
|
| 2.71 |
|
|
|
| (0.68 | ) |
|
| (25 | %) |
|
| 1.02 |
|
|
|
| 1.93 |
|
|
|
| (0.91 | ) |
|
| (47 | %) |
|
|
| 1.19 |
|
|
|
| 2.03 |
|
|
|
| (0.84 | ) |
|
| (41 | %) | |||
NGL, $/gal |
|
| 0.75 |
|
|
| 0.56 |
|
|
| 0.19 |
|
|
| 34 | % |
|
|
| 0.67 |
|
|
| 0.51 |
|
|
|
| 0.16 |
|
|
| 31 | % |
|
| 0.27 |
|
|
|
| 0.75 |
|
|
|
| (0.48 | ) |
|
| (64 | %) |
|
|
| 0.35 |
|
|
|
| 0.67 |
|
|
|
| (0.32 | ) |
|
| (48 | %) | |||
Condensate, $/Bbl |
|
| 58.31 |
|
|
| 42.69 |
|
|
| 15.62 |
|
|
| 37 | % |
|
|
| 58.49 |
|
|
| 43.42 |
|
|
|
| 15.07 |
|
|
| 35 | % |
|
| 50.94 |
|
|
|
| 58.31 |
|
|
|
| (7.37 | ) |
|
| (13 | %) |
|
|
| 49.79 |
|
|
|
| 58.49 |
|
|
|
| (8.70 | ) |
|
| (15 | %) | |||
(1) | Segment operating statistics include the effect of intersegment amounts, which have been eliminated from the consolidated presentation. For all volume statistics presented, the numerator is the total volume sold during the quarter and the denominator is the number of calendar days during the quarter. |
(2) | Plant natural gas inlet represents our undivided interest in the volume of natural gas passing through the meter located at the inlet of a natural gas processing plant, other than Badlands. |
(3) | Plant natural gas inlet volumes and gross NGL production volumes include producer take-in-kind volumes, while natural gas sales and NGL sales exclude producer take-in-kind volumes. |
(4) |
|
|
|
|
|
Three Months Ended September 30, 2018 Compared to Three Months Ended September 30, 2017
The increase in gross margin was primarily due to higher Permian, Central and Badlands volumes and higher NGL and condensate prices, partially offset by lower natural gas prices. The increase in Field Gathering and Processing inlet volumes included both areas in the Permian region, SouthTX, SouthOK and Badlands, partially offset by decreases at WestOK and North Texas. NGL sales and natural gas sales increased primarily due to higher Field Gathering and Processing inlet volumes and increased NGL production, including additional ethane recoveries. Prior year NGL sales were unfavorably impacted by temporary operational issues related to Hurricane Harvey in the third quarter of 2017. Coastal Gathering and Processing gross margin increased due to higher inlet volumes, richer gas, increased recoveries and higher NGL prices. In the Badlands, total crude oil gathered volumes and natural gas gathered volumes increased primarily due to production from new wells and system expansions. Total crude oil gathered volumes increased in the Permian region due to production from new wells.
Operating expenses in the Permian region increased primarily as a result of higher compensation, contract labor, and other costs associated with plant expansions.
Nine Months Ended September 30, 2018 Compared to Nine Months Ended September 30, 2017
The increase in gross margin was primarily due to higher Permian volumes including those associated with the Permian Acquisition in March 2017, higher Central and Badlands volumes and higher NGL and condensate prices, partially offset by lower natural gas prices. The overall increase in Field Gathering and Processing inlet volumes included both areas of the Permian region, SouthTX, SouthOK and Badlands, partially offset by decreases at WestOK and North Texas. NGL sales and natural gas sales increased primarily due to higher Field Gathering and Processing inlet volumes and increased NGL production, including additional ethane recoveries. Prior year NGL sales were unfavorably impacted by temporary operational issues related to Hurricane Harvey in the third quarter of 2017. Coastal Gathering and Processing gross margin increased due to richer gas, increased recoveries and higher NGL prices. In the Badlands, total crude oil gathered volumes and natural gas gathered volumes increased primarily due to production from new wells and system expansions. Total crude oil gathered volumes increased in the Permian region due to the Permian Acquisition and production from new wells and system expansions.
Operating expenses in the Permian region increased primarily as a result of higher compensation, contract labor, and other costs associated with plant expansions as well as the inclusion of the March 2017 Permian Acquisition for the full period of 2018.
Gross Operating Statistics Compared to Actual Reported
The table below provides a reconciliation between gross operating statistics and the actual reported operating statistics for the Field portion of the Gathering and Processing segment:
|
| Three Months Ended September 30, 2018 |
| |||||||||||||
Operating statistics: |
|
|
|
|
|
|
|
|
|
|
|
|
|
|
|
|
Plant natural gas inlet, MMcf/d (1),(2) |
| Gross Volume (3) |
|
| Ownership % |
|
| Net Volume (3) |
|
| Actual Reported |
| ||||
Permian Midland |
|
| 1,466.9 |
|
| Varies (4) |
|
|
| 1,161.7 |
|
|
| 1,161.7 |
| |
Permian Delaware |
|
| 470.5 |
|
|
| 100 | % |
|
| 470.5 |
|
|
| 470.5 |
|
Total Permian |
|
| 1,937.4 |
|
|
|
|
|
|
| 1,632.2 |
|
|
| 1,632.2 |
|
|
|
|
|
|
|
|
|
|
|
|
|
|
|
|
|
|
SouthTX |
|
| 364.1 |
|
| Varies (5) |
|
|
| 272.1 |
|
|
| 364.1 |
| |
North Texas |
|
| 247.6 |
|
|
| 100 | % |
|
| 247.6 |
|
|
| 247.6 |
|
SouthOK |
|
| 568.2 |
|
| Varies (6) |
|
|
| 454.6 |
|
|
| 568.2 |
| |
WestOK |
|
| 353.9 |
|
|
| 100 | % |
|
| 353.9 |
|
|
| 353.9 |
|
Total Central |
|
| 1,533.8 |
|
|
|
|
|
|
| 1,328.2 |
|
|
| 1,533.8 |
|
|
|
|
|
|
|
|
|
|
|
|
|
|
|
|
|
|
Badlands (7) |
|
| 90.5 |
|
|
| 100 | % |
|
| 90.5 |
|
|
| 90.5 |
|
Total Field |
|
| 3,561.7 |
|
|
|
|
|
|
| 3,050.9 |
|
|
| 3,256.5 |
|
|
|
|
|
|
|
|
|
|
|
|
|
|
|
|
|
|
NGL production, MBbl/d (2) |
|
|
|
|
|
|
|
|
|
|
|
|
|
|
|
|
Permian Midland |
|
| 193.3 |
|
| Varies (4) |
|
|
| 152.2 |
|
|
| 152.2 |
| |
Permian Delaware |
|
| 58.9 |
|
|
| 100 | % |
|
| 58.9 |
|
|
| 58.9 |
|
Total Permian |
|
| 252.2 |
|
|
|
|
|
|
| 211.1 |
|
|
| 211.1 |
|
|
|
|
|
|
|
|
|
|
|
|
|
|
|
|
|
|
SouthTX |
|
| 49.0 |
|
| Varies (5) |
|
|
| 35.5 |
|
|
| 49.0 |
| |
North Texas |
|
| 29.6 |
|
|
| 100 | % |
|
| 29.6 |
|
|
| 29.6 |
|
SouthOK |
|
| 61.2 |
|
| Varies (6) |
|
|
| 48.3 |
|
|
| 61.2 |
| |
WestOK |
|
| 20.7 |
|
|
| 100 | % |
|
| 20.7 |
|
|
| 20.7 |
|
Total Central |
|
| 160.5 |
|
|
|
|
|
|
| 134.1 |
|
|
| 160.5 |
|
|
|
|
|
|
|
|
|
|
|
|
|
|
|
|
|
|
Badlands |
|
| 10.5 |
|
|
| 100 | % |
|
| 10.5 |
|
|
| 10.5 |
|
Total Field |
|
| 423.2 |
|
|
|
|
|
|
| 355.7 |
|
|
| 382.1 |
|
|
|
|
|
|
|
| Permian Midland includes operations in WestTX, of which we own |
(5) | SouthTX includes the Raptor Plant, |
(6) | SouthOK includes the Centrahoma Joint Venture, of which we own 60%, and other plants that are owned 100% by us. Centrahoma is a consolidated subsidiary and its financial results are presented on a gross basis in our reported financials. |
(7) | Badlands natural gas inlet represents the total wellhead gathered volume. |
|
| Three Months Ended September 30, 2017 |
| |||||||||||||
Operating statistics: |
|
|
|
|
|
|
|
|
|
|
|
|
|
|
|
|
Plant natural gas inlet, MMcf/d (1),(2) |
| Gross Volume (3) |
|
| Ownership % |
|
| Net Volume (3) |
|
| Actual Reported |
| ||||
Permian Midland (4) |
|
| 1,159.1 |
|
| Varies (5) |
|
|
| 932.1 |
|
|
| 932.1 |
| |
Permian Delaware (4) |
|
| 403.9 |
|
|
| 100 | % |
|
| 403.9 |
|
|
| 403.9 |
|
Total Permian |
|
| 1,563.0 |
|
|
|
|
|
|
| 1,336.0 |
|
|
| 1,336.0 |
|
|
|
|
|
|
|
|
|
|
|
|
|
|
|
|
|
|
SouthTX |
|
| 330.1 |
|
| Varies (6) |
|
|
| 260.0 |
|
|
| 330.1 |
| |
North Texas |
|
| 261.8 |
|
|
| 100 | % |
|
| 261.8 |
|
|
| 261.8 |
|
SouthOK |
|
| 515.2 |
|
| Varies (7) |
|
|
| 412.1 |
|
|
| 515.2 |
| |
WestOK |
|
| 367.1 |
|
|
| 100 | % |
|
| 367.1 |
|
|
| 367.1 |
|
Total Central |
|
| 1,474.2 |
|
|
|
|
|
|
| 1,301.0 |
|
|
| 1,474.2 |
|
|
|
|
|
|
|
|
|
|
|
|
|
|
|
|
|
|
Badlands (8) |
|
| 60.9 |
|
|
| 100 | % |
|
| 60.9 |
|
|
| 60.9 |
|
Total Field |
|
| 3,098.1 |
|
|
|
|
|
|
| 2,697.9 |
|
|
| 2,871.1 |
|
|
|
|
|
|
|
|
|
|
|
|
|
|
|
|
|
|
Gross NGL production, MBbl/d (2) |
|
|
|
|
|
|
|
|
|
|
|
|
|
|
|
|
Permian Midland (4) |
|
| 154.2 |
|
| Varies (5) |
|
|
| 122.8 |
|
|
| 122.8 |
| |
Permian Delaware (4) |
|
| 46.3 |
|
|
| 100 | % |
|
| 46.3 |
|
|
| 46.3 |
|
Total Permian |
|
| 200.5 |
|
|
|
|
|
|
| 169.1 |
|
|
| 169.1 |
|
|
|
|
|
|
|
|
|
|
|
|
|
|
|
|
|
|
SouthTX |
|
| 35.4 |
|
| Varies (6) |
|
|
| 28.6 |
|
|
| 35.4 |
| |
North Texas |
|
| 29.3 |
|
|
| 100 | % |
|
| 29.3 |
|
|
| 29.3 |
|
SouthOK |
|
| 42.7 |
|
| Varies (7) |
|
|
| 34.6 |
|
|
| 42.7 |
| |
WestOK |
|
| 20.7 |
|
|
| 100 | % |
|
| 20.7 |
|
|
| 20.7 |
|
Total Central |
|
| 128.1 |
|
|
|
|
|
|
| 113.2 |
|
|
| 128.1 |
|
|
|
|
|
|
|
|
|
|
|
|
|
|
|
|
|
|
Badlands |
|
| 9.0 |
|
|
| 100 | % |
|
| 9.0 |
|
|
| 9.0 |
|
Total Field |
|
| 337.6 |
|
|
|
|
|
|
| 291.3 |
|
|
| 306.2 |
|
|
|
|
|
|
|
|
|
|
|
|
|
|
|
Three Months Ended September 30, 2019 Compared to Three Months Ended September 30, 2018 The decrease in gross margin was primarily due to lower commodity prices, partially offset by higher Permian and Badlands volumes. The impact of lower commodity prices in 2019 excludes the third quarter realized gain from our hedging activities presented in Other. NGL production, NGL sales and natural gas sales increased primarily due to higher inlet volumes and increased NGL recoveries. In the Permian, natural gas gathered volumes and NGL production increased due to incremental processing capacity available with the commencement of operations at the Johnson Plant in the fourth quarter of 2018, the Hopson Plant in the second quarter of 2019 and the Pembrook Plant in the third quarter of 2019, while total crude oil gathered volumes increased due to production from new wells. In the Badlands, natural gas gathered volumes and NGL production increased due to incremental processing capacity available with the commencement of operations at the Little Missouri 4 Plant in the third quarter of 2019, while total crude oil gathered volumes increased due to production from new wells. Operating expenses were relatively flat with increased operating expenses in the Permian, due to gas plant and system expansions, partially offset by reductions in other regions. Nine Months Ended September 30, 2019 Compared to Nine Months Ended September 30, 2018 The decrease in gross margin was primarily due to lower commodity prices, partially offset by higher Permian and Badlands volumes. The impact of lower commodity prices in 2019 excludes the realized gain from our hedging activities presented in Other. NGL production, NGL sales and natural gas sales increased primarily due to higher inlet volumes and increased NGL recoveries. In the Permian, natural gas gathered volumes and NGL production increased due to incremental processing capacity available with the commencement of operations at the Johnson Plant in the fourth quarter of 2018, the Hopson Plant in the second quarter of 2019 and the Pembrook Plant in the third quarter of 2019. In the Badlands, natural gas gathered volumes and NGL production increased due to production from new wells and the incremental processing capacity available with the commencement of operations at the Little Missouri 4 Plant in the third quarter of 2019. Total crude oil gathered volumes increased in both the Permian region and the Badlands due to production from new wells. The increase in operating expenses was primarily driven by gas plant and system expansions in the Permian region and the Badlands. Operating expenses in other areas were relatively flat. |
|
Logistics and Marketing Segment
|
| Three Months Ended September 30, |
|
|
|
|
|
| Nine Months Ended September 30, |
|
|
|
|
|
|
|
|
|
|
| Three Months Ended September 30, |
|
|
|
|
|
| Nine Months Ended September 30, |
|
|
|
|
|
|
|
|
|
| ||||||||||||||||||||||||||||||||||||||
|
| 2018 |
|
| 2017 |
|
| 2018 vs. 2017 |
|
| 2018 |
|
| 2017 |
|
| 2018 vs. 2017 |
|
| 2019 |
|
| 2018 |
|
| 2019 vs. 2018 |
|
| 2019 |
|
| 2018 |
|
| 2019 vs. 2018 |
| ||||||||||||||||||||||||||||||||||||||||
| (In millions) |
| (In millions) |
| ||||||||||||||||||||||||||||||||||||||||||||||||||||||||||||||||||||||||
Gross margin |
| $ |
| 249.4 |
|
| $ |
| 180.0 |
|
| $ |
| 69.4 |
|
|
| 39 | % |
| $ |
| 653.1 |
|
| $ |
| 553.3 |
|
| $ |
| 99.8 |
|
|
| 18 | % |
| $ |
| 310.4 |
|
| $ |
| 249.4 |
|
| $ |
| 61.0 |
|
|
| 24 | % |
| $ |
| 792.4 |
|
| $ |
| 653.1 |
|
| $ |
| 139.3 |
|
|
| 21 | % |
Operating expenses |
|
|
| 75.9 |
|
|
|
| 64.1 |
|
|
|
| 11.8 |
|
|
| 18 | % |
|
|
| 211.4 |
|
|
|
| 194.8 |
|
|
|
| 16.6 |
|
|
| 9 | % |
|
|
| 81.5 |
|
|
|
| 75.9 |
|
|
|
| 5.6 |
|
|
| 7 | % |
|
|
| 227.4 |
|
|
|
| 211.4 |
|
|
|
| 16.0 |
|
|
| 8 | % |
Operating margin |
| $ |
| 173.5 |
|
| $ |
| 115.9 |
|
| $ |
| 57.6 |
|
|
| 50 | % |
| $ |
| 441.7 |
|
| $ |
| 358.5 |
|
| $ |
| 83.2 |
|
|
| 23 | % |
| $ |
| 228.9 |
|
| $ |
| 173.5 |
|
| $ |
| 55.4 |
|
|
| 32 | % |
| $ |
| 565.0 |
|
| $ |
| 441.7 |
|
| $ |
| 123.3 |
|
|
| 28 | % |
Operating statistics MBbl/d (1): |
|
|
|
|
|
|
|
|
|
|
|
|
|
|
|
|
|
|
|
|
|
|
|
|
|
|
|
|
|
|
|
|
|
|
|
|
|
|
|
|
|
|
|
|
|
|
|
|
|
|
|
|
|
|
|
|
|
|
|
|
|
|
|
|
|
|
|
|
|
|
|
|
|
|
|
|
Fractionation volumes |
|
| 454.5 |
|
|
| 329.3 |
|
|
| 125.2 |
|
|
| 38 | % |
|
|
| 419.0 |
|
|
| 324.3 |
|
|
| 94.7 |
|
|
| 29 | % |
|
| 508.8 |
|
|
|
| 454.5 |
|
|
|
| 54.3 |
|
|
| 12 | % |
|
|
| 492.8 |
|
|
|
| 419.0 |
|
|
| 73.8 |
|
|
| 18 | % | |||||||
LSNG treating volumes (2) |
|
| 36.3 |
|
|
| 27.2 |
|
|
| 9.1 |
|
|
| 33 | % |
|
|
| 33.4 |
|
|
| 31.6 |
|
|
| 1.9 |
|
|
| 6 | % | |||||||||||||||||||||||||||||||||||||||||||
Benzene treating volumes (2) |
|
| — |
|
|
| 16.1 |
|
|
| (16.1 | ) |
|
| (100 | %) |
|
|
| 4.4 |
|
|
| 20.5 |
|
|
| (16.2 | ) |
|
| (79 | %) | |||||||||||||||||||||||||||||||||||||||||||
Export volumes (4) |
|
| 208.2 |
|
|
| 154.5 |
|
|
| 53.6 |
|
|
| 35 | % |
|
|
| 200.2 |
|
|
| 175.5 |
|
|
| 24.6 |
|
|
| 14 | % | |||||||||||||||||||||||||||||||||||||||||||
Export volumes (3) |
|
| 239.2 |
|
|
|
| 208.2 |
|
|
|
| 31.0 |
|
|
| 15 | % |
|
|
| 228.1 |
|
|
|
| 200.2 |
|
|
| 27.9 |
|
|
| 14 | % | ||||||||||||||||||||||||||||||||||||||||
Pipeline throughput (4) |
|
|
| 131.8 |
|
|
|
| - |
|
|
|
| 131.8 |
|
|
| - |
|
|
|
| 44.4 |
|
|
|
| - |
|
|
| 44.4 |
|
|
| - |
| |||||||||||||||||||||||||||||||||||||||
NGL sales |
|
|
| 555.7 |
|
|
|
| 463.4 |
|
|
|
| 92.3 |
|
|
| 20 | % |
|
|
| 526.7 |
|
|
|
| 468.1 |
|
|
| 58.6 |
|
|
| 13 | % |
|
|
| 672.1 |
|
|
|
| 555.7 |
|
|
|
| 116.4 |
|
|
| 21 | % |
|
|
| 620.9 |
|
|
|
| 526.7 |
|
|
| 94.2 |
|
|
| 18 | % | ||
Average realized prices: |
|
|
|
|
|
|
|
|
|
|
|
|
|
|
|
|
|
|
|
|
|
|
|
|
|
|
|
|
|
|
|
|
|
|
|
|
|
|
|
|
|
|
|
|
|
|
|
|
|
|
|
|
|
|
|
|
|
|
|
|
|
|
|
|
|
|
|
|
|
|
|
|
|
| ||
NGL realized price, $/gal |
| $ |
| 0.88 |
|
| $ |
| 0.67 |
|
| $ |
| 0.21 |
|
|
| 31 | % |
| $ |
| 0.80 |
|
| $ |
| 0.64 |
|
| $ |
| 0.16 |
|
|
| 25 | % |
| $ |
| 0.43 |
|
| $ |
| 0.88 |
|
| $ |
| (0.45 | ) |
|
| (51 | %) |
| $ |
| 0.50 |
|
| $ |
| 0.80 |
|
| $ |
| (0.30 | ) |
|
| (38 | %) |
(1) | Segment operating statistics include intersegment amounts, which have been eliminated from the consolidated presentation. For all volume statistics presented, the numerator is the total volume sold during the |
(2) | Fractionation |
| Fractionation volumes for 2019 reflect |
| Export volumes represent the quantity of NGL products delivered to third-party customers at our Galena Park Marine Terminal that are destined for international markets. |
(4) | Pipeline throughput represents the total quantity of mixed NGLs delivered by Grand Prix to Mont Belvieu. |
Three Months Ended September 30, 20182019 Compared to Three Months Ended September 30, 20172018
Logistics and Marketing gross margin increased primarily due to higher NGL transportation, fractionation and services margin, higher marketing margin, and higher LPG export margin.margin, partially offset by lower terminaling and storage throughput. NGL transportation, fractionation and services margin increased due to volumes delivered on Grand Prix, which began full service into Mont Belvieu during the third quarter of 2019, and higher fractionation volumes as a result of the commencement of operations of Train 6 in the second quarter of 2019. Fractionation and services margin was unfavorably impacted by fewer short-term high fee fractionation contracts in the third quarter of 2019 compared to the same period last year, and by a planned maintenance turnaround of our Cedar Bayou fractionator. Marketing margin increased due to optimization of gas and liquids arrangements. LPG export margin increased due to higher supply volumevolumes. Terminaling and storage throughput decreased due to the sale of certain petroleum logistics terminals in the fourth quarter of 2018.
Operating expenses increased due to higher maintenance, higher fuel and power costs that are largely passed through to customers, and higher fees,compensation and benefits primarily attributable to Grand Prix and Train 6 operations, partially offset by the sale of certain petroleum logistics terminals in the fourth quarter of 2018.
Nine Months Ended September 30, 2019 Compared to Nine Months Ended September 30, 2018
Logistics and Marketing gross margin increased due to higher NGL transportation, fractionation and services margin, higher LPG export margin, and higher marketing margin, partially offset by lower system product gains.terminaling and storage throughput. NGL transportation, fractionation and services margin increased due to volumes delivered on Grand Prix, which began full service into Mont Belvieu during the third quarter of 2019, and higher fractionation volumes as a result of the commencement of operations of Train 6 in the second quarter of 2019. Fractionation and services margin was partiallyunfavorably impacted by fewer short-term high fee fractionation contracts in the variable effectsthird quarter of fuel2019 compared to the same period last year, and power that are largely reflected in operating expenses (see footnote (2) above).by a planned maintenance turnaround of our Cedar Bayou fractionator. LPG export margin increased primarily due to higher volumes. Prior year fractionation supply volumeMarketing margin increased due to optimization of gas and LPG export volumes were unfavorably impacted by temporary operational issues related to Hurricane Harvey. Other contributors to gross margin included higher treating margin, higher marketing gains and higher terminalliquids arrangements. Terminaling and storage throughput. throughput decreased due to the sale of certain petroleum logistics terminals in the fourth quarter of 2018.
Operating expenses increased due to higher fuel and power costs that are largely passed through to customers, higher maintenance, and higher compensation and benefits and higher ad valorem taxes.
Nine Months Ended September 30, 2018 Comparedtaxes primarily attributable to Nine Months Ended September 30, 2017
LogisticsGrand Prix and Marketing gross margin increased primarily due to higher fractionation margin. Fractionation margin increased due to higher supply volume. Fractionation margin was partially impacted by the variable effects of fuel and power that are largely reflected in operating expenses (see footnote (2) above). Prior year fractionation supply volume was unfavorably impacted by temporary operational issues related to Hurricane Harvey. Other contributors to gross margin included higher marketing gains, higher terminal and storage throughput and higher domestic marketing margin.
Operating expenses increased due to higher compensation and benefits, higher fuel and power costs that are largely passed through and higher ad valorem taxes,Train 6 operations, partially offset by lower maintenance.the sale of certain petroleum logistics terminals in the fourth quarter of 2018.
Other
|
| Three Months Ended September 30, |
|
|
|
|
|
| Nine Months Ended September 30, |
|
|
|
|
|
| Three Months Ended September 30, |
|
|
|
|
|
| Nine Months Ended September 30, |
|
|
|
|
| ||||||||||||||||||||
|
| 2018 |
|
| 2017 |
|
| 2018 vs. 2017 |
|
| 2018 |
|
| 2017 |
|
| 2018 vs. 2017 |
|
| 2019 |
|
| 2018 |
|
| 2019 vs. 2018 |
|
| 2019 |
|
| 2018 |
|
| 2019 vs. 2018 |
| ||||||||||||
|
| (In millions) |
|
| (In millions) |
| ||||||||||||||||||||||||||||||||||||||||||
Gross margin |
| $ | (20.8 | ) |
| $ | (1.0 | ) |
| $ | (19.8 | ) |
| $ | (42.2 | ) |
| $ | 3.9 |
|
| $ | (46.1 | ) |
| $ | (63.3 | ) |
| $ | (20.8 | ) |
| $ | (42.5 | ) |
| $ | (15.2 | ) |
| $ | (42.2 | ) |
| $ | 27.0 |
|
Operating margin |
| $ | (20.8 | ) |
| $ | (1.0 | ) |
| $ | (19.8 | ) |
| $ | (42.2 | ) |
| $ | 3.9 |
|
| $ | (46.1 | ) |
| $ | (63.3 | ) |
| $ | (20.8 | ) |
| $ | (42.5 | ) |
| $ | (15.2 | ) |
| $ | (42.2 | ) |
| $ | 27.0 |
|
Other contains the results of commodity derivative activities related to Gathering and Processing hedges of equity volumes that are included in operating margin and mark-to-market gain/losses related to derivative contracts that were not designated as cash flow hedges.margin. The primary purpose of our commodity risk management activities is to mitigate a portion of the impact of commodity prices on our operating cash flow. We have entered into derivative instruments to hedge the commodity price associated with a portion of our expected natural gas, NGL and condensate equity volumes in our Gathering and Processing operations that result from percent of proceeds/liquids processing arrangements. Because we are essentially forward-selling a portion of our future plant equity volumes, these hedge positions will move favorably in periods of falling commodity prices and unfavorably in periods of rising commodity prices.
We have also entered into swaps and basis swaps that are not designated or do not qualify for hedge accounting treatment. The mark-to-market gains/losses related to these derivative instruments represent unrealized, non-cash changes in the fair value of the instruments. For the three and nine months ended September 30, 2019, the unrealized mark-to-market losses are primarily attributable to unfavorable movements in natural gas forward basis prices and will be more than offset by locked-in gains to be realized in future periods from the underlying transportation arrangements.
The following table provides a breakdown of the change in Other operating margin:
|
| Three Months Ended September 30, 2018 |
|
| Three Months Ended September 30, 2017 |
|
| Three Months Ended September 30, 2019 |
|
| Three Months Ended September 30, 2018 |
| ||||||||||||||||||||||||||||||||||||
|
| (In millions, except volumetric data and price amounts) |
|
| (In millions, except volumetric data and price amounts) |
| ||||||||||||||||||||||||||||||||||||||||||
|
| Volume Settled |
|
| Price Spread (1) |
|
| Gain (Loss) |
|
| Volume Settled |
|
| Price Spread (1) |
|
| Gain (Loss) |
|
| Volume Settled |
|
| Price Spread (1) |
|
| Gain (Loss) |
|
| Volume Settled |
|
| Price Spread (1) |
|
| Gain (Loss) |
| ||||||||||||
Natural gas (BBtu) |
|
| 15.7 |
|
| $ | 0.82 |
|
| $ | 12.9 |
|
|
| 17.3 |
|
| $ | 0.23 |
|
| $ | 4.0 |
|
|
| 18.8 |
|
| $ | 1.07 |
|
| $ | 20.1 |
|
|
| 15.7 |
|
| $ | 0.82 |
|
| $ | 12.9 |
|
NGL (MMgal) |
|
| 99.0 |
|
|
| (0.27 | ) |
|
| (26.4 | ) |
|
| 74.8 |
|
|
| (0.09 | ) |
|
| (6.7 | ) |
|
| 110.0 |
|
|
| 0.17 |
|
|
| 18.5 |
|
|
| 99.0 |
|
|
| (0.27 | ) |
|
| (26.4 | ) |
Crude oil (MBbl) |
|
| 0.5 |
|
|
| (15.81 | ) |
|
| (8.1 | ) |
|
| 0.4 |
|
|
| 6.29 |
|
|
| 2.3 |
|
|
| 0.4 |
|
|
| (1.76 | ) |
|
| (0.7 | ) |
|
| 0.5 |
|
|
| (15.81 | ) |
|
| (8.1 | ) |
Non-hedge accounting (2) |
|
|
|
|
|
|
|
|
|
| 0.8 |
|
|
|
|
|
|
|
|
|
|
| (0.6 | ) |
|
|
|
|
|
|
|
|
|
| (101.2 | ) |
|
|
|
|
|
|
|
|
|
| 0.8 |
|
Ineffectiveness (3) |
|
|
|
|
|
|
|
|
|
| — |
|
|
|
|
|
|
|
|
|
|
| — |
| ||||||||||||||||||||||||
|
|
|
|
|
|
|
|
|
| $ | (20.8 | ) |
|
|
|
|
|
|
|
|
| $ | (1.0 | ) |
|
|
|
|
|
|
|
|
| $ | (63.3 | ) |
|
|
|
|
|
|
|
|
| $ | (20.8 | ) |
|
|
|
|
|
|
|
|
|
|
|
|
|
|
|
|
|
|
|
|
|
|
|
|
|
|
|
|
|
|
|
|
|
|
|
|
|
|
|
|
|
|
|
|
|
|
|
|
|
|
| Nine Months Ended September 30, 2018 |
|
| Nine Months Ended September 30, 2017 |
|
| Nine Months Ended September 30, 2019 |
|
| Nine Months Ended September 30, 2018 |
| ||||||||||||||||||||||||||||||||||||
|
| (In millions, except volumetric data and price amounts) |
|
| (In millions, except volumetric data and price amounts) |
| ||||||||||||||||||||||||||||||||||||||||||
|
| Volume Settled |
|
| Price Spread (1) |
|
| Gain (Loss) |
|
| Volume Settled |
|
| Price Spread (1) |
|
| Gain (Loss) |
|
| Volume Settled |
|
| Price Spread (1) |
|
| Gain (Loss) |
|
| Volume Settled |
|
| Price Spread (1) |
|
| Gain (Loss) |
| ||||||||||||
Natural gas (BBtu) |
|
| 48.6 |
|
| $ | 0.74 |
|
| $ | 35.8 |
|
|
| 43.3 |
|
| $ | 0.15 |
|
| $ | 6.6 |
|
|
| 47.0 |
|
| $ | 1.29 |
|
| $ | 60.6 |
|
|
| 48.6 |
|
| $ | 0.74 |
|
| $ | 35.8 |
|
NGL (MMgal) |
|
| 286.3 |
|
|
| (0.17 | ) |
|
| (49.7 | ) |
|
| 177.5 |
|
|
| (0.04 | ) |
|
| (7.7 | ) |
|
| 252.1 |
|
|
| 0.11 |
|
|
| 27.9 |
|
|
| 286.3 |
|
|
| (0.17 | ) |
|
| (49.7 | ) |
Crude oil (MBbl) |
|
| 1.5 |
|
|
| (13.10 | ) |
|
| (20.0 | ) |
|
| 0.9 |
|
|
| 6.29 |
|
|
| 5.8 |
|
|
| 1.1 |
|
|
| (2.28 | ) |
|
| (2.6 | ) |
|
| 1.5 |
|
|
| (13.10 | ) |
|
| (20.0 | ) |
Non-hedge accounting (2) |
|
|
|
|
|
|
|
|
|
| (8.3 | ) |
|
|
|
|
|
|
|
|
|
| (0.9 | ) |
|
|
|
|
|
|
|
|
|
| (101.1 | ) |
|
|
|
|
|
|
|
|
|
| (8.3 | ) |
Ineffectiveness (3) |
|
|
|
|
|
|
|
|
|
| — |
|
|
|
|
|
|
|
|
|
|
| 0.1 |
| ||||||||||||||||||||||||
|
|
|
|
|
|
|
|
|
| $ | (42.2 | ) |
|
|
|
|
|
|
|
|
| $ | 3.9 |
|
|
|
|
|
|
|
|
|
| $ | (15.2 | ) |
|
|
|
|
|
|
|
|
| $ | (42.2 | ) |
(1) | The price spread is the differential between the contracted derivative instrument pricing and the price of the corresponding settled commodity transaction. |
(2) | Mark-to-market income (loss) associated with derivative contracts that are not designated as hedges for accounting purposes. |
|
|
As part of the Atlas mergers, outstanding TPL derivative contracts with a fair value of $102.1 million as of February 27, 2015 (the “acquisition date”), were novated to us and included in the acquisition date fair value of assets acquired. We received derivative settlements of $1.4 million and $6.3 million for the three and nine months ended September 30, 2017. The final settlement was received in December 2017. These settlements were reflected as a reduction of the acquisition date fair value of the TPL derivative assets acquired and had no effect on results of operations.
Liquidity and Capital Resources
As of September 30, 2018,2019, we had $187.5$294.9 million of “Cash and cash equivalents,” on our Consolidated Balance Sheets. We believe our cash position, remaining borrowing capacity on our credit facilities (discussed below in “Short-term Liquidity”), and our cash flows from operating activities are adequate to allow us to manage our day-to-day cash requirements and anticipated obligations as discussed further below.
Our ability to finance our operations, including funding capital expenditures and acquisitions, meeting our indebtedness obligations, refinancing our indebtedness and meeting our collateral requirements, will depend on our ability to generate cash in the future. Our ability to generate cash is subject to a number of factors, some of which are beyond our control. These include commodity prices, weather and ongoing efforts to manage operating costs and maintenance capital expenditures, as well as general economic, financial, competitive, legislative, regulatory and other factors.
Our main sources of liquidity and capital resources are internally generated cash flows from operations, contributions from TRC that are funded through TRC’s access to debt and equity markets, borrowings under the TRP Revolver and the Securitization Facility, and access to debt markets. We may supplement these sources of liquidity with joint venture arrangements and proceeds from potential asset sales. For companies involved in hydrocarbon production, transportation and other oil and gas related services, the capital markets have experienced and may continue to experience volatility. Our exposure to adverse credit conditions includes our credit facility, cash investments, hedging abilities, customer performance risks and counterparty performance risks.
Our short-term liquidity as of November 5, 20181, 2019 was:
|
|
| November 5, 2018 |
|
|
| November 1, 2019 |
| ||
|
|
| (In millions) |
|
|
| (In millions) |
| ||
Cash on hand | Cash on hand |
| $ | 319.0 |
| Cash on hand |
| $ | 287.0 |
|
Total availability under the TRP Revolver | Total availability under the TRP Revolver |
|
| 2,200.0 |
| Total availability under the TRP Revolver |
|
| 2,200.0 |
|
Total availability under the Securitization Facility | Total availability under the Securitization Facility |
|
| 350.0 |
| Total availability under the Securitization Facility |
|
| 349.0 |
|
|
|
|
| 2,869.0 |
|
|
|
| 2,836.0 |
|
|
|
|
|
|
|
|
|
|
|
|
Less: | Outstanding borrowings under the TRP Revolver |
|
| (180.0 | ) | Outstanding borrowings under the TRP Revolver |
|
| (880.0 | ) |
| Outstanding borrowings under the Securitization Facility |
|
| (350.0 | ) | Outstanding borrowings under the Securitization Facility |
|
| (349.0 | ) |
| Outstanding letters of credit under the TRP Revolver |
|
| (78.4 | ) | Outstanding letters of credit under the TRP Revolver |
|
| (73.8 | ) |
| Total liquidity |
| $ | 2,260.6 |
| Total liquidity |
| $ | 1,533.2 |
|
Other potential capital resources associated with our existing arrangements include:
Our right to request an additional $500 million in commitment increases under the TRP Revolver, subject to the terms therein. The TRP Revolver matures on June 29, 2023.
• | Our right to request an additional $500 million in commitment increases under the TRP Revolver, subject to the terms therein. The TRP Revolver matures on June 29, 2023. |
A portion of our capital resources are allocated to letters of credit to satisfy certain counterparty credit requirements. These letters of credit reflect our non-investment grade status, as assigned to us by Moody’s and S&P. They also reflect certain counterparties’ views of our financial condition and ability to satisfy our performance obligations, as well as commodity prices and other factors.
Working Capital
Working capital is the amount by which current assets exceed current liabilities. On a consolidated basis, at the end of any given month, accounts receivable and payable tied to commodity sales and purchases are relatively balanced, with receivables from NGL customers being offset by plant settlements payable to producers. The factors that typically cause overall variability in our reported total working capital are: (i) our cash position; (ii) liquids inventory levels and valuation, which we closely manage; (iii) changes in payables and accruals related to major growth projects; (iv) changes in the fair value of the current portion of derivative contracts; (iv)(v) monthly swings in borrowings under the Securitization Facility; and (v)(vi) major structural changes in our asset base or business operations, such as acquisitions or divestitures and certain organic growth projects.
Working capital as of September 30, 2018 decreased $530.92019 increased $1,167.8 million compared to December 31, 2017. Our working capital, exclusive of current debt obligations, and reclassifications from other long term liabilities and held for sale assets, decreased $413.3 million from December 31, 2017 to September 30, 2018. The major items contributing to this decrease in working capital were increases in accounts payable and accruals especially those related to our Grand Prix and Train 6 projects, a reduction in inventoriesincrease was primarily attributable to a decrease in volumes in storage, partially offset by an increase in prices,the February redemption of our 4⅛% Senior Notes due 2019 and a decrease in our net risk management position due to changes in forward prices of commodities, partially offset by higher cash balances. Working capital as of September 30, 2018 was also impacted by a $329.0 million decrease primarily due to the reclassification of the May 2019 estimated contingent consideration payment from noncurrent liabilities, a $151.4 million increase due toassociated with the reclassificationPermian Acquisition, with funding provided by the issuance of held for sale assets relating to the Targa Sound and Baltimore terminals from long-term assets, and a $60.0 million increase due to lower borrowings under our Securitization Facility.senior notes.
Based on our anticipated levels of operations and absent any disruptive events, we believe that internally generated cash flow, contributions from TRC, borrowings available under the TRP Revolver and the Securitization Facility and proceeds from debt offerings, as well as joint ventures and/or potential asset sales, should provide sufficient resources to finance our operations, capital expenditures, long-term debt obligations, collateral requirements and cash distributions to Targa for at least the next twelve months.
Long-term Financing
In February 2018, we formed three development joint ventures (“DevCo JVsJVs”) with investment vehicles affiliated with Stonepeak, which committed a maximum of approximately $960 million of capital to the DevCo JVs. For the nine months ended
As of September 30, 2018,2019, total contributions from Stonepeak to the DevCo JVs were $448.8 million, which$880.1 million. As of September 30, 2019, total contributions from Blackstone to the Grand Prix Joint Venture were $329.6 million. These contributions from Stonepeak and Blackstone are included in noncontrolling interests.
From time to time, we issue long-term debt securities, which we refer to as senior notes. Our senior notes issued to date, generally have similar terms other than interest rates, maturity dates and redemption premiums. AllAs of September 30, 2019, and December 31, 2018, the aggregate principal amount outstanding of our fixed rate senior notes provide that the notes may be redeemed at any time at a price equal to 100% plus accrued interest to the redemption date, and in some cases, a make-whole premium.other various long-term debt obligations, including unamortized premiums, debt issuance costs and non-current liabilities of finance leases, was $6,844.7 million and $5,197.4 million, respectively.
The majority of our long-term debt is fixed rate borrowings; however, we have some exposure to the risk of changes in interest rates, primarily as a result of the variable rate borrowings under the TRP Revolver and the Securitization Facility. We may enter into interest rate hedges with the intent to mitigate the impact of changes in interest rates on cash flows. As of September 30, 2018,2019, we did not have any interest rate hedges.
In April 2018,January 2019, we issued $1.0 billion aggregate principal amount$750.0 million of the 5⅞6½% Senior Notes due 2026.July 2027 and $750.0 million of 6⅞% Senior Notes due January 2029, resulting in total net proceeds of $1,486.6 million. The net proceeds from the issuance were used to redeem in full our 4⅛% Senior Notes due 2019, at par value plus accrued interest through the redemption date, with the remainder used for general partnership purposes, which included repayment of borrowings under our credit facilities.
In April 2019, we closed on the sale of a 45% interest in Targa Badlands, the entity that holds substantially all of our assets in North Dakota, to funds managed by Blackstone for $1.6 billion in cash. We used the net cash proceeds of $991.9 million after costs from this offering to repay borrowings under its credit facilitiesdebt and for general partnership purposes.
In June 2018, we entered intocorporate purposes, including funding our growth capital program. We continue to be the operator of Targa Badlands and hold majority governance rights. Future growth capital of Targa Badlands is expected to be funded on a pro rata ownership basis. Targa Badlands pays an agreementMQD to amendBlackstone and restateTarga, with Blackstone having a priority right on such MQDs. Additionally, Blackstone’s capital contributions would have a liquidation preference upon a sale of Targa Badlands.As of September 30, 2019, the TRP Revolver which extended the maturity datecontributions from October 2020 to June 2023 and increased available commitments from $1.6 billion to $2.2 billion. Our ability to request additional commitments of $500.0 million remained unchanged. The TRP Revolver continues to bear interest costs that are dependent on our ratio of consolidated funded indebtedness to consolidated adjusted EBITDA and the covenants remained substantially the same.Blackstone were $63.0 million.
To date, our debt balances have not adversely affected our operations, ability to grow or ability to repay or refinance indebtedness. For additional information about our debt-related transactions, see Note 9 - Debt Obligations to our consolidated financial statements. For information about our interest rate risk, see “Item 3. Quantitative and Qualitative Disclosures About Market Risk—Interest Rate Risk.”
Distributions on our 5,000,000 Preferred Units are cumulative from the date of original issue in October 2015 and are payable monthly in arrears on the 15th day of each month of each year, when, as and if declared by the board of directors of our general partner. Distributions on our Preferred Units are payable out of amounts legally available at a rate equal to 9.0% per annum.
On and after November 1, 2020, distributions on our Preferred Units will accumulate at an annual floating rate equal to the one-month LIBOR plus a spread of 7.71%. At any time on or after November 1, 2020, we may redeem the Preferred Units, in whole or in part, from any source of funds legally available for such purpose, by paying $25.00 per unit plus an amount equal to all accumulated and unpaid distributions thereon to the date of redemption, whether or not declared. In addition, we (or a third party with our prior written consent) may redeem the Preferred Units following certain changes of control, as described in our Partnership Agreement. If we do not (or a third party with our prior written consent does not) exercise this option, then the Preferred Unitholders have the option to convert the Preferred Units into a number of common units per Preferred Unit as set forth in our Partnership Agreement.
Compliance with Debt Covenants
As of September 30, 2018,2019, we were in compliance with the covenants contained in our various debt agreements.
Cash Flow
Cash Flows from Operating Activities
Nine Months Ended September 30, | Nine Months Ended September 30, |
|
|
|
|
| Nine Months Ended September 30, |
|
|
|
|
| ||||||||
2018 |
|
| 2017 |
|
| 2018 vs. 2017 |
| |||||||||||||
2019 | 2019 |
|
| 2018 |
|
| 2019 vs. 2018 |
| ||||||||||||
(In millions) | (In millions) |
| (In millions) |
| ||||||||||||||||
$ | 943.5 |
|
| $ | 463.2 |
|
| $ | 480.3 |
| 897.4 |
|
| $ | 943.5 |
|
| $ | (46.1 | ) |
The primary drivers of cash flows from operating activities are (i) the collection of cash from customers from the sale of NGLs, natural gas and other petroleum commodities, as well as fees for gas processing, crude gathering, export, fractionation, terminaling, storage and transportation, (ii) the payment of amounts related to the purchasespurchase of NGLs and natural gas, (iii) changes in payables and accruals related to major growth projects; and (iv) the payment of other expenses, primarily field operating costs, general and administrative expense and interest expense. In addition, we use derivative instruments to manage our exposure to commodity price risk. Changes in the prices of the commodities we hedge impact our derivative settlements as well as our margin deposit requirements on unsettled futures contracts.
Net cash provided by operations increased from 2017operating activities decreased in 2019 compared to 2018 primarily due to the impact of higher commodity prices and volumes, higher capitalized interest, increases in distributions from unconsolidated affiliates and lower acquisition costs, offset by increases in payments for operating expenses. The increase in commodity prices and volumes resulted in higher cash collections from customers, partially offset by higher product purchases and an increase in cash payments related to our derivative contracts. Higher capitalized interest resulted in lower interest payments included in operating cash flow. Increases in earnings from unconsolidated affiliates contributed toas a result of higher distributions. Increases in payments for operating expenses were mainly due to system expansions and higher activity levels.
average borrowings.
Cash Flows fromUsed in Investing Activities
Nine Months Ended September 30, | Nine Months Ended September 30, |
|
|
|
|
| Nine Months Ended September 30, |
|
|
|
|
| ||||||||
2018 |
|
| 2017 |
|
| 2018 vs. 2017 |
| |||||||||||||
2019 | 2019 |
|
| 2018 |
|
| 2019 vs. 2018 |
| ||||||||||||
(In millions) | (In millions) |
| (In millions) |
| ||||||||||||||||
$ | (2,192.8 | ) |
| $ | (1,457.5 | ) |
| $ | (735.3 | ) | (2,619.7 | ) |
| $ | (2,192.8 | ) |
| $ | (426.9 | ) |
Cash used in investing activities increased in 20182019 compared to 2017,2018, primarily due to increasedhigher outlays for property, plant and equipment and contributions to unconsolidated affiliates, partially offset by lower outlays for business acquisitions and higher proceeds from the sale of assets.
Our capital expenditures for property, plant and equipment increased $1,167.0$400.5 million, in 2018 primarily related to the construction of Train 7 and Train 8, and additional processing plants and associated infrastructure in the Permian Basin. The change is also attributable to a large number of capital projects, and$20.0 million increase in our contributions to unconsolidated affiliates increased $216.2 million primarilyessentially due to thehigher construction activities of GCX and LM4.
We have made no cash payment for business acquisitions in 2018, whereas in 2017 we paid $570.8 million for the initial cash portionPipeline, partially offset by lower construction activities of the Permian Acquisition. In 2018, we received proceeds of $69.3 million from the sale of our inland marine barge business.Little Missouri 4.
Cash Flows from Financing Activities
| Nine Months Ended September 30, |
| Nine Months Ended September 30, |
| ||||||||||
| 2018 |
|
| 2017 |
| 2019 |
|
| 2018 |
| ||||
Source of Financing Activities, net | (In millions) |
| (In millions) |
| ||||||||||
Sale of ownership interests in subsidiaries | $ | 1,619.7 |
|
| $ | — |
| |||||||
Debt, including financing costs | $ | 904.2 |
|
| $ | (4.6 | ) |
| 823.7 |
|
|
| 904.2 |
|
Contributions from noncontrolling interests |
| 611.6 |
|
|
| 93.8 |
|
| 518.7 |
|
|
| 611.6 |
|
Contributions from TRC and General Partner |
| 540.0 |
|
|
| 1,620.0 |
|
| 200.0 |
|
|
| 540.0 |
|
Distributions |
| (692.1 | ) |
|
| (633.1 | ) |
| (921.5 | ) |
|
| (692.1 | ) |
Payment of contingent consideration |
| (317.1 | ) |
|
| — |
| |||||||
Other |
| (51.6 | ) |
|
| (45.9 | ) |
| (109.6 | ) |
|
| (51.6 | ) |
Net cash provided by (used in) financing activities | $ | 1,312.1 |
|
| $ | 1,030.2 |
| $ | 1,813.9 |
|
| $ | 1,312.1 |
|
In 2019, we realized a net source of cash from financing activities primarily due to the sale of ownership interests in Targa Badlands and Train 7, net increase of debt outstanding and contributions from noncontrolling interests. The result was partially offset by payments of distributions, as well as the final contingent consideration payment associated with the Permian Acquisition. The issuance of 6½% Senior Notes due 2027 and 6⅞% Senior Notes due January 2029, partially offset by the redemption of 4⅛% Senior Notes due November 2019 contributed to the net increase of debt outstanding. The contributions from noncontrolling interests were primarily from Stonepeak and Blackstone to fund growth projects.
In 2018, we realized a net source of cash from financing activities primarily due to a net increase of debt outstanding and contributions from noncontrolling interests and TRC, partially offset by payments of distributions to TRC. The issuance of 5⅞5⅞% Senior Notes due 2026, partially offset by repayments of outstanding borrowings under TRP Revolver contributed to the net increase of debt outstanding. The contributions from noncontrolling interests were primarily from Stonepeak and Blackstone to fund growth projects.
In 2017, we realized a net source of cash from financing activities, primarily due to contributions from TRC, partially offset by payments of distributions to TRC, repayments of the TRP Revolver and redemption of our 6⅜% Senior Notes. In September 2017, we sold a 25% interest in the Grand Prix Joint Venture and receive a total of $75.0 million in contributions from Blackstone.
Distributions
TRC is entitled to receive all available Partnership distributions after payments of preferred distributions each quarter.
The following table details the distributions declared and/orand paid by us during the nine months ended September 30, 2018.2019:
Three Months Ended |
| Date Paid Or to Be Paid |
| Total Distributions |
|
| Distributions to Targa Resources Corp. |
| ||
September 30, 2018 |
| November 13, 2018 | $ |
| 237.6 |
| $ |
| 234.8 |
|
June 30, 2018 |
| August 13, 2018 |
|
| 234.0 |
|
|
| 231.2 |
|
March 31, 2018 |
| May 11, 2018 |
|
| 229.7 |
|
|
| 226.9 |
|
December 31, 2017 |
| February 12, 2018 |
|
| 228.5 |
|
|
| 225.7 |
|
Three Months Ended |
| Date Paid or To Be Paid |
| Total Distributions |
|
| Distributions to Targa Resources Corp. |
| ||
September 30, 2019 |
| November 13, 2019 | $ |
| 242.1 |
| $ |
| 239.3 |
|
June 30, 2019 |
| August 13, 2019 |
|
| 242.4 |
|
|
| 239.6 |
|
March 31, 2019 |
| April 5, 2019 |
|
| 437.8 |
|
|
| 435.0 |
|
December 31, 2018 |
| February 13, 2019 |
|
| 241.3 |
|
|
| 238.5 |
|
Preferred Units
Distributions on our Preferred Units are declared and paid monthly. As of September 30, 2018,2019, we have 5,000,000 Preferred Units outstanding. For the three and nine months ended September 30, 2018,2019, $2.8 million and $8.4 million of distributions were paid. We have accrued distributions to Series A Preferred Unitholders of $0.9 million for September, which were paid subsequently on October 15, 2018.2019.
In October 2018,2019, the board of directors of our general partner declared a cash distribution of $0.1875 per Preferred Unit. This distribution will be paid on November 15, 2018.2019.
Capital RequirementsExpenditures
Our capital requirements relate to capital expenditures which are classified as growth capital expenditures, business acquisitions, and maintenance capital expenditures. Growth capital expenditures improve the service capability of the existing assets, extend asset useful lives, increase capacities from existing levels, add capabilities, and reduce costs or enhance revenues, and fund acquisitions of businesses or assets.revenues. Maintenance capital expenditures are those expenditures that are necessary to maintain the service capability of our existing assets, including the replacement of system components and equipment, which are worn, obsolete or completing their useful life and expenditures to remain in compliance with environmental laws and regulations.
The following table details cash outlays for capital projects for the nine months ended September 30, 2019 and 2018:
|
| Nine Months Ended September 30, |
|
| Nine Months Ended September 30, |
| ||||||||||
|
| 2018 |
|
| 2017 |
|
| 2019 |
|
| 2018 |
| ||||
|
| (In millions) |
| |||||||||||||
Capital requirements: |
|
|
|
|
|
|
|
| ||||||||
Consideration for business acquisition |
| $ | — |
|
| $ | 987.1 |
| ||||||||
Contingent consideration (1) |
|
| — |
|
|
| (416.3 | ) | ||||||||
Cash outlay for business acquisition, net of cash acquired |
|
| — |
|
|
| 570.8 |
| ||||||||
|
|
|
|
|
|
|
|
| ||||||||
Growth (2) |
|
| 2,230.0 |
|
|
| 914.6 |
| ||||||||
Capital expenditures: |
| (In millions) |
| |||||||||||||
Growth (1) |
|
| 2,203.4 |
|
|
| 2,230.0 |
| ||||||||
Maintenance (2) |
|
| 80.4 |
|
|
| 73.1 |
|
|
| 101.5 |
|
|
| 80.4 |
|
Gross capital expenditures |
|
| 2,310.4 |
|
|
| 987.7 |
|
|
| 2,304.9 |
|
|
| 2,310.4 |
|
Transfers of capital expenditures to investment in unconsolidated affiliates |
|
| 16.0 |
|
|
| — |
|
|
| — |
|
|
| 16.0 |
|
Transfers from materials and supplies inventory to property, plant and equipment |
|
| (8.9 | ) |
|
| (2.8 | ) |
|
| (21.7 | ) |
|
| (8.9 | ) |
Change in capital project payables and accruals |
|
| (283.9 | ) |
|
| (118.3 | ) |
|
| 150.6 |
|
|
| (283.9 | ) |
Cash outlays for capital projects |
|
| 2,033.6 |
|
|
| 866.6 |
|
|
| 2,433.8 |
|
|
| 2,033.6 |
|
|
|
|
|
|
|
|
|
| ||||||||
Total capital outlays |
| $ | 2,033.6 |
|
| $ | 1,437.4 |
| ||||||||
(1) |
|
| Growth capital expenditures, net of contributions from noncontrolling interests, were |
(2) | Maintenance capital expenditures, net of contributions from noncontrolling interests, were |
We currently estimate that in 20182019 we will invest at leastapproximately $2,400 million in net growth capital expenditures, net of noncontrolling interests (exclusive of outlays for business acquisitions), and net contributions to investments in unconsolidated affiliates for announced projects. Given our objective of growth through expansions of existing assets, other internal growth projects, and acquisitions, we anticipate that over time that we will invest significant amounts of capital to grow and acquire assets. Future growth capital expenditures may vary significantly based on investment opportunities. We expect that 2018 net2019 maintenance capital expenditures, net of noncontrolling interests, will be approximately $110$130 million.
Total growth capital expenditures were flat for the nine months ended September 30, 2019 as compared to the nine months ended September 30, 2018, primarily due to lower spending on Grand Prix as it began full service in the third quarter, partially offset by spending related to construction of Train 7 and Train 8, and additional processing plants and associated infrastructure in the Permian Basin. Total maintenance capital expenditures increased for the nine months ended September 30, 20182019 as compared to the nine months ended September 30, 2017, primarily due to spending related to Grand Prix, additional processing plants and associated infrastructure in the Permian Basin, SouthOK and Badlands, and construction of Train 6 and other growth projects. Total maintenance capital expenditures increased for 2018, as compared to 2017, primarily due to our increased asset base and additional infrastructure.
Off-Balance Sheet Arrangements
As of September 30, 2018,2019, there were $54.7$55.2 million in surety bonds outstanding related to various performance obligations. These are in place to support various performance obligations as required by (i) statutes within the regulatory jurisdictions where we operate and (ii) counterparty support. Obligations under these surety bonds are not normally called, as we typically comply with the underlying performance requirement.
Item 3. Quantitative and Qualitative Disclosures About Market Risk.
Our principal market risks are our exposure to changes in commodity prices, particularly to the prices of natural gas, NGLs and crude oil, changes in interest rates, as well as nonperformance by our customers.
Risk Management
We evaluate counterparty risks related to our commodity derivative contracts and trade credit. We have all our commodity derivatives with major financial institutions or major oilenergy companies. Should any of these financial counterparties not perform, we may not realize the benefit of some of our hedges under lower commodity prices, which could have a material adverse effect on our results of operations. We sell our natural gas, NGLs and condensate to a variety of purchasers. Non-performance by a trade creditor could result in losses.
Crude oil, NGL and natural gas prices are also volatile. In an effort to reduce the variability of our cash flows, we have entered into derivative instruments to hedge the commodity price associated with a portion of our expected natural gas, equity volumes, NGL equity volumes and condensate equity volumes and, future commodity purchases and sales, and transportation basis risk through 2021.2024. Market conditions may also impact our ability to enter into future commodity derivative contracts.
Commodity Price Risk
A significant portion of our revenues are derived from percent-of-proceeds contracts under which we receive a portion of the proceeds from the sale of natural gas and/or NGLscommodities as payment for services. The prices of natural gas, NGLs and crude oil are subject to fluctuations in response to changes in supply, demand, market uncertainty and a variety of additional factors beyond our control. We monitor these risks and enter into hedging transactions designed to mitigate the impact of commodity price fluctuations on our business. Cash flows from a derivative instrument designated as a hedge are classified in the same category as the cash flows from the item being hedged.
The primary purpose of our commodity risk management activities is to hedge some of the exposure to commodity price risk and reduce fluctuations in our operating cash flow due to fluctuations in commodity prices. In an effort to reduce the variability of our cash flows, as of September 30, 2018,2019, we have hedged the commodity price associated with a portion of our expected (i) natural gas, NGL, and condensate equity volumes in our Gathering and Processing operations that result from our percent-of-proceeds processing arrangements, and (ii) future commodity purchases and sales in our Logistics and Marketing segment and (iii) natural gas transportation basis risk in our Logistics and Marketing segment by entering into derivative instruments. We hedge a higher percentage of our expected equity volumes in the current year compared to future years, for which we hedge incrementally lower percentages of expected equity volumes. With swaps, we typically receive an agreed fixed price for a specified notional quantity of natural gas or NGLs and we pay the hedge counterparty a floating price for that same quantity based upon published index prices. Since we receive from our customers substantially the same floating index price from the sale of the underlying physical commodity, these transactions are designed to effectively lock-in the agreed fixed price in advance for the volumes hedged. In order to avoid having a greater volume hedged than our actual equity volumes, we typically limit our use of swaps to hedge the prices of less than our expected natural gas and NGL equity volumes. We utilize purchased puts (or floors) and calls (or caps) to hedge additional expected equity commodity volumes without creating volumetric risk. We may buy calls in connection with swap positions to create a price floor with upside. We intend to continue to manage our exposure to commodity prices in the future by entering into derivative transactions using swaps, collars, purchased puts (or floors), futures or other derivative instruments as market conditions permit.
When entering into new hedges, we intend to generally match the NGL product composition and the NGL and natural gas delivery points to those of our physical equity volumes. The NGL hedges cover specific NGL products based upon the expected equity NGL composition. We believe this strategy avoids uncorrelated risks resulting from employing hedges on crude oil or other petroleum products as “proxy” hedges of NGL prices. The fair value of our natural gas and NGL hedges’ fair valueshedges are based on published index prices for delivery at various locations, which closely approximate the actual natural gas and NGL delivery points. A portion of our condensate sales are hedged using crude oil hedges that are based on the NYMEX futures contracts for West Texas Intermediate light, sweet crude.
A majority of these commodity price hedges are documented pursuant to a standard International Swap Dealers Association form with customized credit and legal terms. The principal counterparties (or, if applicable, their guarantors) have investment grade credit ratings. Our payment obligations in connection with substantially all of these hedging transactions and any additional credit exposure due to a rise in commodity prices relative to the fixed prices set forth in the hedges are secured by a first priority lien in the collateral securing our senior secured indebtedness that ranks equal in right of payment with liens granted in favor of our senior secured lenders. Absent federal regulations resulting from the Dodd-Frank Act, and as long as this first priority lien is in effect, we expect to have no obligation to post cash, letters of credit or other additional collateral to secure these hedges at any time, even if a counterparty’s exposure to our credit increases over the term of the hedge as a result of higher commodity prices or because there has been a change in our creditworthiness. A purchased put (or floor) transaction does not expose our counterparties to credit risk, as we have no obligation to make future payments beyond the premium paid to enter into the transaction; however, we are exposed to the risk of default by the counterparty, which is the risk that the counterparty will not honor its obligation under the put transaction.
We also enter into commodity price hedging transactions using futures contracts on futures exchanges. Exchange traded futures are subject to exchange margin requirements, so we may have to increase our cash deposit due to a rise in natural gas and NGL prices. Unlike bilateral hedges, we are not subject to counterparty credit risks when using futures on futures exchanges.
These contracts may expose us to the risk of financial loss in certain circumstances. Generally, our hedging arrangements provide us protection on the hedged volumes if prices decline below the prices at which these hedges are set. If prices rise above the prices at which they have been hedged, we will receive less revenue on the hedged volumes than we would receive in the absence of hedges (other than with respect to purchased calls).
To analyze the risk associated with our derivative instruments, we utilize a sensitivity analysis. The sensitivity analysis measures the change in fair value of our derivative instruments based on a hypothetical 10% change in the underlying commodity prices, but does not reflect the impact that the same hypothetical price movement would have on the related hedged items. The financial statement impact on the fair value of a derivative instrument resulting from a change in commodity price would normally be offset by a corresponding gain or loss on the hedged item under hedge accounting. The fair valuevalues of our derivative instruments are also influenced by changes in market volatility for option contracts and the discount rates used to determine the present values.
The following table shows the effect of hypothetical price movements on the estimated fair value of our derivative instruments as of September 30, 20182019:
|
| Fair Value |
|
| Result of 10% Price Decrease |
|
| Result of 10% Price Increase |
|
| Fair Value |
|
| Result of 10% Price Decrease |
|
| Result of 10% Price Increase |
| ||||||
Natural gas |
| $ | 47.5 |
|
| $ | 65.5 |
|
| $ | 29.4 |
|
| $ | (72.9 | ) |
| $ | (27.1 | ) |
| $ | (118.5 | ) |
NGLs |
|
| (185.5 | ) |
|
| (115.0 | ) |
|
| (256.0 | ) |
|
| 124.5 |
|
|
| 166.2 |
|
|
| 83.1 |
|
Crude oil |
|
| (37.8 | ) |
|
| (20.4 | ) |
|
| (55.1 | ) |
|
| 18.9 |
|
|
| 36.3 |
|
|
| 1.4 |
|
Total |
| $ | (175.8 | ) |
| $ | (69.9 | ) |
| $ | (281.7 | ) |
| $ | 70.5 |
|
| $ | 175.4 |
|
| $ | (34.0 | ) |
The table above contains all derivative instruments currently outstanding as of the stated date for the purpose of hedging commodity price risk, which we are exposed to due to our equity volumes and future commodity purchases and sales, as well as basis differentials related to our gas transportation arrangements.
Our operating revenues increased (decreased)decreased by $(24.9)$61.8 million and $(3.6)24.9 million during the three months ended September 30, 2019 and 2018, and 2017, and $(73.6)$7.7 million and $(4.9)$73.6 million during the nine months ended September 30, 20182019 and 2017,2018, as a result of transactions accounted for as derivatives. We account for derivatives designated as hedges that mitigate commodity price risk as cash flow hedges. Changes in fair value are deferred in other comprehensive income until the underlying hedged transactions settle. We also enter into derivative instruments to help manage other short-term commodity-related business risks. We have not designated these derivatives as hedges and record changes in fair value and cash settlements to revenues.
Our risk management position has moved from a net liabilityasset position of $38.2$112.7 million at December 31, 20172018 to a net liabilityasset position of $175.8$70.5 million at September 30, 2018.2019. The fixed prices we currently expect to receive on derivative contracts are belowabove the aggregate forward prices for commodities related to those contracts, creating this net liabilityasset position.
Interest Rate Risk
We are exposed to the risk of changes in interest rates, primarily as a result of variable rate borrowings under the TRP Revolver and the Securitization Facility. As of September 30, 2018,2019, we do not have any interest rate hedges. However, we may enter into interest rate hedges in the future with the intent to mitigate the impact of changes in interest rates on cash flows. To the extent that interest rates increase, interest expense for the TRP Revolver and the Securitization Facility will also increase. As of September 30, 2018,2019, we had $290.0$1,076.0 million in outstanding variable rate borrowings under the TRP Revolver and the Securitization Facility. A hypothetical change of 100 basis points in the interest rate of our variable rate debt would impact our annual interest expense by $2.9 million.$10.8 million based on our September 30, 2019 debt balances.
We are subject to risk of losses resulting from nonpayment or nonperformance by our counterparties. The credit exposure related to commodity derivative instruments is represented by the fair value of the asset position (i.e. the fair value of expected future receipts) at the reporting date. Our futures contracts have limited credit risk since they are cleared through an exchange and are margined daily. Should the creditworthiness of one or more of the counterparties decline, our ability to mitigate nonperformance risk is limited to a counterparty agreeing to either a voluntary termination and subsequent cash settlement or a novation of the derivative contract to a third party. In the event of a counterparty default, we may sustain a loss and our cash receipts could be negatively impacted. We have master netting provisions in the International Swap Dealers Association agreements with our derivative counterparties. These netting provisions allow us to net settle asset and liability positions with the same counterparties within the same Targa entity, and would reduce our maximum loss due to counterparty credit risk by $68.0$129.6 million as of September 30, 2018. Our potential loss2019. The range of losses attributable to anour individual counterparty is $4.9 millioncounterparties as of September 30, 2018.2019 would be between $0.1 million and $36.7 million, depending on the counterparty in default.
Customer Credit Risk
We extend credit to customers and other parties in the normal course of business. We have an established policy and various procedures to manage our credit exposure risk, including performing initial and subsequent credit risk analyses, setting maximum credit limits and terms and requiring credit enhancements when necessary. We use credit enhancements including (but not limited to) letters of credit, prepayments, parental guarantees and rights of offset to limit credit risk to ensure that our established credit criteria are followed and financial loss is mitigated or minimized.
We have an active credit management process, which is focused on controlling loss exposure to bankruptcies or other liquidity issues of counterparties. If an assessment of uncollectible accounts resulted in a 1% reduction of our third-party accounts receivable as of September 30, 2018,2019, our operating income would decrease by $10.4$7.4 million in the year of the assessment.
During the three and nine months ended September 30, 2019, sales of commodities and fees from midstream services provided to Petredec (Europe) Limited comprised approximately 11% and 12% of our consolidated revenues. During the three and nine months ended September 30, 2018, sales of commodities and fees from midstream services provided to Petredec (Europe) Limited comprised approximately 17% and 16% of our consolidated revenues. No customer comprised greater than 10% of our consolidated revenues in the three and nine months ended September 30, 2017.
Item 4. Controls and Procedures.
Evaluation of Disclosure Controls and Procedures
Management, with the participation of our Chief Executive Officer and Chief Financial Officer, has evaluated the design and effectiveness of our disclosure controls and procedures, as such term is defined in Rules 13a-15(e) and 15d-15(e) under the Securities Exchange Act of 1934, as amended (the “Exchange Act”) as of the end of the period covered in this Quarterly Report. Based on such evaluation, our Chief Executive Officer and Chief Financial Officer have concluded that, as of September 30, 2018,2019, the design and operation of our disclosure controls and procedures were effective to provide reasonable assurance that information required to be disclosed in our reports filed or submitted under the Exchange Act is (i) recorded, processed, summarized and reported within the time periods specified in the rules and forms of the SEC and (ii) accumulated and communicated to management, including our Chief Executive Officer and Chief Financial Officer, as appropriate, to allow for timely decisions regarding required disclosure.
Changes in Internal Control Over Financial Reporting
There have been no changes in our internal control over financial reporting that occurred during the quarter that materially affected, or are reasonably likely to materially affect, our internal control over financial reporting, during our most recent fiscal quarter.
PART II – OTHEROTHER INFORMATION
The information required for this item is provided in Note 1516 – Contingencies, under the heading “Legal Proceedings” included in the Notes to Consolidated Financial Statements included under Part I, Item 1 of this Quarterly Report, which is incorporated by reference into this item.
For an in-depth discussion of our risk factors, see “Part I—Item 1A. Risk Factors” of our Annual Report.Report in addition to the updates below. All of these risks and uncertainties, including the updates below, could adversely affect our business, financial condition and/or results of operations.
The tax treatment of publicly traded partnerships or an investment in our Preferred Units could be subject to potential legislative, judicial or administrative changes and differing interpretations, possibly applied on a retroactive basis.
The present U.S. federal income tax treatment of publicly traded partnerships, including us, or an investment in us, may be modified by administrative, legislative or judicial changes or differing interpretations at any time. From time to time, members of Congress propose and consider such substantive changes to the existing U.S. federal income tax laws that would affect publicly traded partnerships, including elimination of partnership tax treatment for publicly traded partnerships. For example, the “Clean Energy for America Act”, which is similar to legislation that was commonly proposed during the Obama Administration, was introduced in the U.S. Senate on May 2, 2019. If enacted, this proposal would, among other things, repeal Section 7704(d)(1)(E) of the Internal Revenue Code upon which we rely for our treatment as a partnership for U.S. federal income tax purposes. In addition, the Treasury Department has issued, and in the future may issue, regulations interpreting those laws that affect publicly traded partnerships. There can be no assurance that there will not be further changes to U.S. federal income tax laws or the Treasury Department’s interpretation of the qualifying income rules in a manner that could impact our ability to qualify as a partnership for U.S. federal income tax purposes in the future.
Any modification to the U.S. federal income tax laws may be applied retroactively and could make it more difficult or impossible for us to meet the exception for certain publicly traded partnerships to be treated as partnerships for U.S. federal income tax purposes. We are unable to predict whether any of these changes or other proposals will ultimately be enacted. Any such changes could negatively impact the value of an investment in us. You are urged to consult with your own tax advisor with respect to the status of legislative or administrative developments and proposals and their potential effect on your investment in our Preferred Units.
Item 2. Unregistered Sales of Equity Securities and Use of Proceeds.
Recent Sales of Unregistered Securities.
Not applicable.
Repurchase of Equity by Targa Resources Partners LP or Affiliated Purchasers.
Not applicable.
Item 3. Defaults Upon Senior Securities.
Not applicable.
Item 4. Mine Safety Disclosures.
Not applicable.
Not applicable.
Number |
| Description | ||
|
|
| ||
3.1 |
| |||
|
|
| ||
3.2 |
| |||
|
|
| ||
3.3 |
| |||
|
|
| ||
3.4 |
| |||
|
|
| ||
3.5 |
| |||
|
|
| ||
4.1 |
| |||
|
|
| ||
|
| |||
|
|
| ||
|
| |||
|
|
| ||
|
| |||
| ||||
|
|
| ||
|
| |||
|
| |||
|
|
| ||
| ||||
|
|
| ||
|
| |||
|
|
| ||
10.7 | ||||
31.1* |
| Certification Pursuant to Section 302 of the Sarbanes-Oxley Act of 2002. | ||
|
|
| ||
Number | Description | |||
31.2* |
| Certification Pursuant to Section 302 of the Sarbanes-Oxley Act of 2002. | ||
|
|
| ||
32.1** |
| |||
|
|
| ||
32.2** |
| |||
|
|
| ||
101.INS* |
| Inline XBRL Instance Document – The instance document does not appear in the interactive data file because its XBRL tags are embedded within the Inline XBRL document | ||
|
|
| ||
101.SCH* |
| Inline XBRL Taxonomy Extension Schema Document | ||
|
|
| ||
101.CAL* |
| Inline XBRL Taxonomy Extension Calculation Linkbase Document | ||
|
|
| ||
|
| Inline XBRL Taxonomy Extension | ||
|
|
| ||
|
| Inline XBRL Taxonomy Extension | ||
|
|
| ||
|
| Inline XBRL Taxonomy Extension | ||
104* | The cover page from this Quarterly Report on Form 10-Q for the quarter ended September 30, 2019, formatted in Inline XBRL (included with Exhibit 101 attachments). | |||
* | Filed herewith |
** | Furnished herewith |
Pursuant to the requirements of the Securities Exchange Act of 1934, the registrant has duly caused this report to be signed on its behalf by the undersigned thereunto duly authorized.
| Targa Resources Partners LP | |
|
|
|
| By: | Targa Resources GP LLC, |
|
| its general partner |
|
|
|
Date: November | By: | /s/ Jennifer R. Kneale |
|
| Jennifer R. Kneale |
|
| Chief Financial Officer |
|
| (Principal Financial Officer) |
6454