
UNITED STATES
SECURITIES AND EXCHANGE COMMISSION
Washington, D.C. 20549
FORM 10-Q
(Mark One)
☒ | QUARTERLY REPORT PURSUANT TO SECTION 13 OR 15(d) OF THE SECURITIES EXCHANGE ACT OF 1934 |
FOR THE QUARTERLY PERIOD ENDED February 28,November 30, 2019
OR
☐ | TRANSITION REPORT PURSUANT TO SECTION 13 OR 15(d) OF THE SECURITIES EXCHANGE ACT OF 1934 |
FOR THE TRANSITION PERIOD FROM TO
Commission File Number: 1-15829
FEDEX CORPORATION
(Exact name of registrant as specified in its charter)
Delaware | 62-1721435 |
(State or other jurisdiction of incorporation or organization) | (I.R.S. Employer Identification No.) |
|
|
942 South Shady Grove Road, Memphis, Tennessee | 38120 |
(Address of principal executive offices) | (ZIP Code) |
(901) 818-7500
(Registrant’s telephone number, including area code)code: (901) 818-7500
Securities registered pursuant to Section 12(b) of the Act:
Title of each class | Trading Symbol | Name of each exchange on which registered | ||
Common Stock, par value $0.10 per share | FDX | New York Stock Exchange | ||
0.700% Notes due 2022 | FDX 22B | New York Stock Exchange | ||
1.000% Notes due 2023 | FDX 23A | New York Stock Exchange | ||
0.450% Notes due 2025 | FDX 25A | New York Stock Exchange | ||
1.625% Notes due 2027 | FDX 27 | New York Stock Exchange | ||
1.300% Notes due 2031 | FDX 31 | New York Stock Exchange |
Indicate by check mark whether the registrant (1) has filed all reports required to be filed by Section 13 or 15(d) of the Securities Exchange Act of 1934 during the preceding 12 months (or for such shorter period that the registrant was required to file such reports), and (2) has been subject to such filing requirements for the past 90 days. Yes ☒ No ☐
Indicate by check mark whether the registrant has submitted electronically every Interactive Data File required to be submitted pursuant to Rule 405 of Regulation S-T (§ 232.405 of this chapter) during the preceding 12 months (or for such shorter period that the registrant was required to submit such files). Yes ☒ No ☐
Indicate by check mark whether the registrant is a large accelerated filer, an accelerated filer, a non-accelerated filer, a smaller reporting company, or an emerging growth company. See the definitions of “large accelerated filer,” “accelerated filer,” “smaller reporting company,” and “emerging growth company” in Rule 12b-2 of the Exchange Act.
Large accelerated filer ☑ | Accelerated filer ☐ | Non-accelerated filer ☐ | Smaller reporting company ☐ | Emerging growth company ☐ |
|
|
|
|
|
If an emerging growth company, indicate by check mark if the registrant has elected not to use the extended transition period for complying with any new or revised financial accounting standards provided pursuant to Section 13(a) of the Exchange Act. ☐
Indicate by check mark whether the registrant is a shell company (as defined in Rule 12b-2 of the Exchange Act). Yes ☐ No ☒
Indicate the number of shares outstanding of each of the issuer’s classes of common stock, as of the latest practicable date.
Common Stock |
| Outstanding Shares at |
Common Stock, par value $0.10 per share |
|
|
INDEX
|
| PAGE |
|
|
|
PART I. FINANCIAL INFORMATION |
|
|
|
|
|
ITEM 1. Financial Statements |
|
|
| 3 | |
| 5 | |
| 6 | |
| 7 | |
Condensed Consolidated Statements of Changes In Common Three and |
| 8 |
| 9 | |
|
| |
ITEM 2. Management’s Discussion and Analysis of Results of Operations and Financial Condition |
|
|
ITEM 3. Quantitative and Qualitative Disclosures About Market Risk |
| 56 |
| 56 | |
|
|
|
|
| |
|
|
|
| 57 | |
| 57 | |
ITEM 2. Unregistered Sales of Equity Securities and Use of Proceeds |
|
|
| ||
|
| |
|
| |
|
|
|
|
| |
|
| |
|
| |
|
| |
|
| |
|
| |
|
| |
|
| |
|
| |
|
| |
|
| |
|
| |
|
| |
|
| |
Exhibit 101.1 Interactive Data Files Exhibit 104.1 Cover Page Interactive Data File |
|
|
- 2 -
CONDENSED CONSOLIDATED BALANCE SHEETS
(IN MILLIONS)
|
| February 28, 2019 (Unaudited) |
|
| May 31, 2018 |
|
| November 30, 2019 (Unaudited) |
|
| May 31, 2019 |
| |||||
ASSETS |
|
|
|
|
|
|
|
|
|
|
|
|
|
|
|
| |
CURRENT ASSETS |
|
|
|
|
|
|
|
|
|
|
|
|
|
|
|
| |
Cash and cash equivalents |
| $ | 2,872 |
|
| $ | 3,265 |
|
| $ | 2,031 |
|
| $ | 2,319 |
| |
Receivables, less allowances of $318 and $401 |
|
| 9,037 |
|
|
| 8,481 |
| |||||||||
Spare parts, supplies and fuel, less allowances of $339 and $268 |
|
| 546 |
|
|
| 525 |
| |||||||||
Receivables, less allowances of $315 and $300 |
|
| 9,709 |
|
|
| 9,116 |
| |||||||||
Spare parts, supplies and fuel, less allowances of $330 and $335 |
|
| 576 |
|
|
| 553 |
| |||||||||
Prepaid expenses and other |
|
| 1,045 |
|
|
| 1,070 |
|
|
| 882 |
|
|
| 1,098 |
| |
Total current assets |
|
| 13,500 |
|
|
| 13,341 |
|
|
| 13,198 |
|
|
| 13,086 |
| |
PROPERTY AND EQUIPMENT, AT COST |
|
| 58,164 |
|
|
| 55,121 |
|
|
| 62,715 |
|
|
| 59,511 |
| |
Less accumulated depreciation and amortization |
|
| 28,396 |
|
|
| 26,967 |
|
|
| 30,307 |
|
|
| 29,082 |
| |
Net property and equipment |
|
| 29,768 |
|
|
| 28,154 |
|
|
| 32,408 |
|
|
| 30,429 |
| |
OTHER LONG-TERM ASSETS |
|
|
|
|
|
|
|
|
|
|
|
|
|
|
|
| |
Operating lease right-of-use assets, net |
|
| 14,097 |
|
|
| — |
| |||||||||
Goodwill |
|
| 6,916 |
|
|
| 6,973 |
|
|
| 6,861 |
|
|
| 6,884 |
| |
Other assets |
|
| 4,280 |
|
|
| 3,862 |
|
|
| 3,390 |
|
|
| 4,004 |
| |
Total other long-term assets |
|
| 11,196 |
|
|
| 10,835 |
|
|
| 24,348 |
|
|
| 10,888 |
| |
|
| $ | 54,464 |
|
| $ | 52,330 |
|
| $ | 69,954 |
|
| $ | 54,403 |
| |
The accompanying notes are an integral part of these condensed consolidated financial statements.
- 3 -
CONDENSED CONSOLIDATED BALANCE SHEETS
(IN MILLIONS, EXCEPT SHARE DATA)
|
| February 28, 2019 (Unaudited) |
|
| May 31, 2018 |
|
| November 30, 2019 (Unaudited) |
|
| May 31, 2019 |
| ||||
LIABILITIES AND COMMON STOCKHOLDERS’ INVESTMENT |
|
|
|
|
|
|
|
|
|
|
|
|
|
|
|
|
CURRENT LIABILITIES |
|
|
|
|
|
|
|
|
|
|
|
|
|
|
|
|
Short-term borrowings |
| $ | 225 |
|
| $ | — |
|
| $ | 150 |
|
| $ | — |
|
Current portion of long-term debt |
|
| 973 |
|
|
| 1,342 |
|
|
| 16 |
|
|
| 964 |
|
Accrued salaries and employee benefits |
|
| 1,659 |
|
|
| 2,177 |
|
|
| 1,632 |
|
|
| 1,741 |
|
Accounts payable |
|
| 3,156 |
|
|
| 2,977 |
|
|
| 3,283 |
|
|
| 3,030 |
|
Operating lease liabilities |
|
| 1,928 |
|
|
| — |
| ||||||||
Accrued expenses |
|
| 3,243 |
|
|
| 3,131 |
|
|
| 3,538 |
|
|
| 3,278 |
|
Total current liabilities |
|
| 9,256 |
|
|
| 9,627 |
|
|
| 10,547 |
|
|
| 9,013 |
|
LONG-TERM DEBT, LESS CURRENT PORTION |
|
| 17,218 |
|
|
| 15,243 |
|
|
| 18,691 |
|
|
| 16,617 |
|
OTHER LONG-TERM LIABILITIES |
|
|
|
|
|
|
|
|
|
|
|
|
|
|
|
|
Deferred income taxes |
|
| 3,211 |
|
|
| 2,867 |
|
|
| 3,072 |
|
|
| 2,821 |
|
Pension, postretirement healthcare and other benefit obligations |
|
| 1,847 |
|
|
| 2,187 |
|
|
| 4,156 |
|
|
| 5,095 |
|
Self-insurance accruals |
|
| 1,861 |
|
|
| 1,784 |
|
|
| 1,921 |
|
|
| 1,899 |
|
Operating lease liabilities |
|
| 12,432 |
|
|
| — |
| ||||||||
Deferred lease obligations |
|
| 512 |
|
|
| 551 |
|
|
| — |
|
|
| 531 |
|
Deferred gains, principally related to aircraft transactions |
|
| 118 |
|
|
| 121 |
| ||||||||
Other liabilities |
|
| 547 |
|
|
| 534 |
|
|
| 476 |
|
|
| 670 |
|
Total other long-term liabilities |
|
| 8,096 |
|
|
| 8,044 |
|
|
| 22,057 |
|
|
| 11,016 |
|
COMMITMENTS AND CONTINGENCIES |
|
|
|
|
|
|
|
|
|
|
|
|
|
|
|
|
COMMON STOCKHOLDERS’ INVESTMENT |
|
|
|
|
|
|
|
|
|
|
|
|
|
|
|
|
Common stock, $0.10 par value; 800 million shares authorized; 318 million shares issued as of February 28, 2019 and May 31, 2018 |
|
| 32 |
|
|
| 32 |
| ||||||||
Common stock, $0.10 par value; 800 million shares authorized; 318 million shares issued as of November 30, 2019 and May 31, 2019 |
|
| 32 |
|
|
| 32 |
| ||||||||
Additional paid-in capital |
|
| 3,209 |
|
|
| 3,117 |
|
|
| 3,287 |
|
|
| 3,231 |
|
Retained earnings |
|
| 26,650 |
|
|
| 24,823 |
|
|
| 25,431 |
|
|
| 24,648 |
|
Accumulated other comprehensive loss |
|
| (737 | ) |
|
| (578 | ) |
|
| (866 | ) |
|
| (865 | ) |
Treasury stock, at cost |
|
| (9,260 | ) |
|
| (7,978 | ) |
|
| (9,225 | ) |
|
| (9,289 | ) |
Total common stockholders’ investment |
|
| 19,894 |
|
|
| 19,416 |
|
|
| 18,659 |
|
|
| 17,757 |
|
|
| $ | 54,464 |
|
| $ | 52,330 |
|
| $ | 69,954 |
|
| $ | 54,403 |
|
The accompanying notes are an integral part of these condensed consolidated financial statements.
- 4 -
CONDENSED CONSOLIDATED STATEMENTS OF INCOME
(UNAUDITED)
(IN MILLIONS, EXCEPT PER SHARE AMOUNTS)
|
| Three Months Ended |
|
| Nine Months Ended |
| ||||||||||||||||||||||||||
|
| February 28, |
|
| February 28, |
|
| Three Months Ended |
|
| Six Months Ended |
| ||||||||||||||||||||
|
| 2019 |
|
| 2018 |
|
| 2019 |
|
| 2018 |
|
| November 30, |
|
| November 30, |
| ||||||||||||||
|
|
|
|
|
| As Adjusted |
|
|
|
|
|
| As Adjusted |
|
| 2019 |
|
| 2018 |
|
| 2019 |
|
| 2018 |
| ||||||
REVENUES |
| $ | 17,010 |
|
| $ | 16,526 |
|
| $ | 51,886 |
|
| $ | 48,136 |
|
| $ | 17,324 |
|
| $ | 17,824 |
|
| $ | 34,372 |
|
| $ | 34,876 |
|
OPERATING EXPENSES: |
|
|
|
|
|
|
|
|
|
|
|
|
|
|
|
|
|
|
|
|
|
|
|
|
|
|
|
|
|
|
|
|
Salaries and employee benefits |
|
| 6,069 |
|
|
| 6,124 |
|
|
| 18,589 |
|
|
| 17,677 |
|
|
| 6,235 |
|
|
| 6,260 |
|
|
| 12,322 |
|
|
| 12,520 |
|
Purchased transportation |
|
| 4,253 |
|
|
| 3,935 |
|
|
| 12,566 |
|
|
| 11,220 |
|
|
| 4,328 |
|
|
| 4,346 |
|
|
| 8,356 |
|
|
| 8,313 |
|
Rentals and landing fees |
|
| 874 |
|
|
| 873 |
|
|
| 2,533 |
|
|
| 2,526 |
|
|
| 924 |
|
|
| 836 |
|
|
| 1,844 |
|
|
| 1,659 |
|
Depreciation and amortization |
|
| 851 |
|
|
| 786 |
|
|
| 2,487 |
|
|
| 2,293 |
|
|
| 901 |
|
|
| 828 |
|
|
| 1,780 |
|
|
| 1,636 |
|
Fuel |
|
| 907 |
|
|
| 914 |
|
|
| 2,945 |
|
|
| 2,435 |
|
|
| 890 |
|
|
| 1,052 |
|
|
| 1,760 |
|
|
| 2,038 |
|
Maintenance and repairs |
|
| 658 |
|
|
| 628 |
|
|
| 2,144 |
|
|
| 1,968 |
|
|
| 774 |
|
|
| 751 |
|
|
| 1,542 |
|
|
| 1,486 |
|
Business realignment costs |
|
| 4 |
|
|
| — |
|
|
| 4 |
|
|
| — |
| ||||||||||||||||
Asset impairment charges |
|
| 66 |
|
|
| — |
|
|
| 66 |
|
|
| — |
| ||||||||||||||||
Other |
|
| 2,483 |
|
|
| 2,408 |
|
|
| 7,468 |
|
|
| 7,073 |
|
|
| 2,652 |
|
|
| 2,583 |
|
|
| 5,171 |
|
|
| 4,985 |
|
|
|
| 16,099 |
|
|
| 15,668 |
|
|
| 48,736 |
|
|
| 45,192 |
|
|
| 16,770 |
|
|
| 16,656 |
|
|
| 32,841 |
|
|
| 32,637 |
|
OPERATING INCOME |
|
| 911 |
|
|
| 858 |
|
|
| 3,150 |
|
|
| 2,944 |
|
|
| 554 |
|
|
| 1,168 |
|
|
| 1,531 |
|
|
| 2,239 |
|
OTHER INCOME (EXPENSE): |
|
|
|
|
|
|
|
|
|
|
|
|
|
|
|
|
|
|
|
|
|
|
|
|
|
|
|
|
|
|
|
|
Interest, net |
|
| (135 | ) |
|
| (125 | ) |
|
| (393 | ) |
|
| (363 | ) |
|
| (151 | ) |
|
| (131 | ) |
|
| (288 | ) |
|
| (258 | ) |
Other retirement plans income |
|
| 158 |
|
|
| 143 |
|
|
| 474 |
|
|
| 436 |
|
|
| 168 |
|
|
| 158 |
|
|
| 336 |
|
|
| 316 |
|
Other, net |
|
| (3 | ) |
|
| (2 | ) |
|
| (22 | ) |
|
| (22 | ) |
|
| 1 |
|
|
| (18 | ) |
|
| (11 | ) |
|
| (19 | ) |
|
|
| 20 |
|
|
| 16 |
|
|
| 59 |
|
|
| 51 |
|
|
| 18 |
|
|
| 9 |
|
|
| 37 |
|
|
| 39 |
|
INCOME BEFORE INCOME TAXES |
|
| 931 |
|
|
| 874 |
|
|
| 3,209 |
|
|
| 2,995 |
|
|
| 572 |
|
|
| 1,177 |
|
|
| 1,568 |
|
|
| 2,278 |
|
PROVISION FOR INCOME TAXES |
|
| 192 |
|
|
| (1,200 | ) |
|
| 700 |
|
|
| (450 | ) |
|
| 12 |
|
|
| 242 |
|
|
| 263 |
|
|
| 508 |
|
NET INCOME |
| $ | 739 |
|
| $ | 2,074 |
|
| $ | 2,509 |
|
| $ | 3,445 |
|
| $ | 560 |
|
| $ | 935 |
|
| $ | 1,305 |
|
| $ | 1,770 |
|
EARNINGS PER COMMON SHARE: |
|
|
|
|
|
|
|
|
|
|
|
|
|
|
|
|
|
|
|
|
|
|
|
|
|
|
|
|
|
|
|
|
Basic |
| $ | 2.83 |
|
| $ | 7.74 |
|
| $ | 9.55 |
|
| $ | 12.85 |
|
| $ | 2.15 |
|
| $ | 3.56 |
|
| $ | 5.00 |
|
| $ | 6.71 |
|
Diluted |
| $ | 2.80 |
|
| $ | 7.59 |
|
| $ | 9.41 |
|
| $ | 12.63 |
|
| $ | 2.13 |
|
| $ | 3.51 |
|
| $ | 4.97 |
|
| $ | 6.60 |
|
DIVIDENDS DECLARED PER COMMON SHARE |
| $ | 0.65 |
|
| $ | 0.50 |
|
| $ | 2.60 |
|
| $ | 2.00 |
|
| $ | 0.65 |
|
| $ | 0.65 |
|
| $ | 1.95 |
|
| $ | 1.95 |
|
The accompanying notes are an integral part of these condensed consolidated financial statements.
- 5 -
CONDENSED CONSOLIDATED STATEMENTS OF COMPREHENSIVE INCOME
(UNAUDITED)
(IN MILLIONS)
|
| Three Months Ended |
|
| Nine Months Ended |
|
| Three Months Ended |
|
| Six Months Ended |
| ||||||||||||||||||||
|
| February 28, |
|
| February 28, |
|
| November 30, |
|
| November 30, |
| ||||||||||||||||||||
|
| 2019 |
|
| 2018 |
|
| 2019 |
|
| 2018 |
|
| 2019 |
|
| 2018 |
|
| 2019 |
|
| 2018 |
| ||||||||
NET INCOME |
| $ | 739 |
|
| $ | 2,074 |
|
| $ | 2,509 |
|
| $ | 3,445 |
|
| $ | 560 |
|
| $ | 935 |
|
| $ | 1,305 |
|
| $ | 1,770 |
|
OTHER COMPREHENSIVE INCOME (LOSS): |
|
|
|
|
|
|
|
|
|
|
|
|
|
|
|
|
|
|
|
|
|
|
|
|
|
|
|
|
|
|
|
|
Foreign currency translation adjustments, net of tax expense of $9 and tax benefit of $22 in 2019 and tax expense of $9 and $26 in 2018 |
|
| 103 |
|
|
| 100 |
|
|
| (90 | ) |
|
| 119 |
| ||||||||||||||||
Amortization of prior service credit, net of tax benefit of $7 and $21 in 2019 and tax benefit of $7 and $29 in 2018 |
|
| (23 | ) |
|
| (23 | ) |
|
| (69 | ) |
|
| (61 | ) | ||||||||||||||||
Foreign currency translation adjustments, net of tax expense of $7 and $4 in 2019 and tax benefit of $7 and $31 in 2018 |
|
| 72 |
|
|
| (31 | ) |
|
| (11 | ) |
|
| (193 | ) | ||||||||||||||||
Amortization of prior service credit, net of tax benefit of $6 and $12 in 2019 and tax benefit of $7 and $14 in 2018 |
|
| (20 | ) |
|
| (23 | ) |
|
| (41 | ) |
|
| (46 | ) | ||||||||||||||||
|
|
| 80 |
|
|
| 77 |
|
|
| (159 | ) |
|
| 58 |
|
|
| 52 |
|
|
| (54 | ) |
|
| (52 | ) |
|
| (239 | ) |
COMPREHENSIVE INCOME |
| $ | 819 |
|
| $ | 2,151 |
|
| $ | 2,350 |
|
| $ | 3,503 |
|
| $ | 612 |
|
| $ | 881 |
|
| $ | 1,253 |
|
| $ | 1,531 |
|
The accompanying notes are an integral part of these condensed consolidated financial statements.
- 6 -
CONDENSED CONSOLIDATED STATEMENTS OF CASH FLOWS
(UNAUDITED)
(IN MILLIONS)
|
| Nine Months Ended |
|
| Six Months Ended |
| ||||||||||
|
| February 28, |
|
| November 30, |
| ||||||||||
|
| 2019 |
|
| 2018 |
|
| 2019 |
|
| 2018 |
| ||||
Operating Activities: |
|
|
|
|
|
|
|
|
|
|
|
|
|
|
|
|
Net income |
| $ | 2,509 |
|
| $ | 3,445 |
|
| $ | 1,305 |
|
| $ | 1,770 |
|
Adjustments to reconcile net income to cash provided by operating activities: |
|
|
|
|
|
|
|
|
|
|
|
|
|
|
|
|
Depreciation and amortization |
|
| 2,487 |
|
|
| 2,293 |
|
|
| 1,780 |
|
|
| 1,636 |
|
Asset impairment charges |
|
| 66 |
|
|
| — |
| ||||||||
Provision for uncollectible accounts |
|
| 221 |
|
|
| 177 |
|
|
| 208 |
|
|
| 160 |
|
Stock-based compensation |
|
| 141 |
|
|
| 135 |
|
|
| 104 |
|
|
| 108 |
|
Deferred income taxes and other noncash items |
|
| 250 |
|
|
| (914 | ) |
|
| 1,164 |
|
|
| 236 |
|
Changes in assets and liabilities: |
|
|
|
|
|
|
|
|
|
|
|
|
|
|
|
|
Receivables |
|
| (780 | ) |
|
| (986 | ) |
|
| (684 | ) |
|
| (1,343 | ) |
Other assets |
|
| (96 | ) |
|
| (151 | ) |
|
| (162 | ) |
|
| (111 | ) |
Accounts payable and other liabilities |
|
| (1,307 | ) |
|
| (2,781 | ) |
|
| (1,691 | ) |
|
| (227 | ) |
Other, net |
|
| (102 | ) |
|
| (56 | ) |
|
| (16 | ) |
|
| (50 | ) |
Cash provided by operating activities |
|
| 3,323 |
|
|
| 1,162 |
|
|
| 2,074 |
|
|
| 2,179 |
|
Investing Activities: |
|
|
|
|
|
|
|
|
|
|
|
|
|
|
|
|
Capital expenditures |
|
| (3,757 | ) |
|
| (3,994 | ) |
|
| (3,266 | ) |
|
| (2,634 | ) |
Business acquisitions, net of cash acquired |
|
| — |
|
|
| (44 | ) | ||||||||
Proceeds from asset dispositions and other |
|
| 62 |
|
|
| 21 |
|
|
| 4 |
|
|
| 53 |
|
Cash used in investing activities |
|
| (3,695 | ) |
|
| (4,017 | ) |
|
| (3,262 | ) |
|
| (2,581 | ) |
Financing Activities: |
|
|
|
|
|
|
|
|
|
|
|
|
|
|
|
|
Proceeds from short-term borrowings, net |
|
| 220 |
|
|
| 797 |
|
|
| 150 |
|
|
| 248 |
|
Principal payments on debt |
|
| (874 | ) |
|
| (31 | ) |
|
| (1,021 | ) |
|
| (785 | ) |
Proceeds from debt issuances |
|
| 2,463 |
|
|
| 1,481 |
|
|
| 2,093 |
|
|
| 1,233 |
|
Proceeds from stock issuances |
|
| 58 |
|
|
| 284 |
|
|
| 26 |
|
|
| 45 |
|
Dividends paid |
|
| (514 | ) |
|
| (402 | ) |
|
| (339 | ) |
|
| (173 | ) |
Purchase of treasury stock |
|
| (1,365 | ) |
|
| (558 | ) |
|
| (3 | ) |
|
| (1,271 | ) |
Other, net |
|
| 5 |
|
|
| 6 |
|
|
| (5 | ) |
|
| 1 |
|
Cash (used in) provided by financing activities |
|
| (7 | ) |
|
| 1,577 |
| ||||||||
Cash provided by (used in) financing activities |
|
| 901 |
|
|
| (702 | ) | ||||||||
Effect of exchange rate changes on cash |
|
| (14 | ) |
|
| 98 |
|
|
| (1 | ) |
|
| (38 | ) |
Net decrease in cash and cash equivalents |
|
| (393 | ) |
|
| (1,180 | ) |
|
| (288 | ) |
|
| (1,142 | ) |
Cash and cash equivalents at beginning of period |
|
| 3,265 |
|
|
| 3,969 |
|
|
| 2,319 |
|
|
| 3,265 |
|
Cash and cash equivalents at end of period |
| $ | 2,872 |
|
| $ | 2,789 |
|
| $ | 2,031 |
|
| $ | 2,123 |
|
The accompanying notes are an integral part of these condensed consolidated financial statements.
- 7 -
CONDENSED CONSOLIDATED STATEMENTS OF CHANGES IN COMMON STOCKHOLDERS'STOCKHOLDERS’ INVESTMENT
(UNAUDITED)
(IN MILLIONS, EXCEPT SHARE DATA)
|
| Three Months Ended |
|
| Nine Months Ended |
|
| Three Months Ended |
|
| Six Months Ended |
| ||||||||||||||||||||
|
| February 28, |
|
| February 28, |
|
| November 30, |
|
| November 30, |
| ||||||||||||||||||||
|
| 2019 |
|
| 2018 |
|
| 2019 |
|
| 2018 |
|
| 2019 |
|
| 2018 |
|
| 2019 |
|
| 2018 |
| ||||||||
Common Stock |
|
|
|
|
|
|
|
|
|
|
|
|
|
|
|
|
|
|
|
|
|
|
|
|
|
|
|
|
|
|
|
|
Beginning Balance |
| $ | 32 |
|
| $ | 32 |
|
| $ | 32 |
|
| $ | 32 |
|
| $ | 32 |
|
| $ | 32 |
|
| $ | 32 |
|
| $ | 32 |
|
Ending Balance |
|
| 32 |
|
|
| 32 |
|
|
| 32 |
|
|
| 32 |
|
|
| 32 |
|
|
| 32 |
|
|
| 32 |
|
|
| 32 |
|
Additional Paid-in-Capital |
|
|
|
|
|
|
|
|
|
|
|
|
|
|
|
|
|
|
|
|
|
|
|
|
|
|
|
|
|
|
|
|
Beginning Balance |
|
| 3,185 |
|
|
| 3,055 |
|
|
| 3,117 |
|
|
| 3,005 |
|
|
| 3,257 |
|
|
| 3,154 |
|
|
| 3,231 |
|
|
| 3,117 |
|
Employee incentive plans and other |
|
| 24 |
|
|
| 30 |
|
|
| 92 |
|
|
| 80 |
|
|
| 30 |
|
|
| 31 |
|
|
| 56 |
|
|
| 68 |
|
Ending Balance |
|
| 3,209 |
|
|
| 3,085 |
|
|
| 3,209 |
|
|
| 3,085 |
|
|
| 3,287 |
|
|
| 3,185 |
|
|
| 3,287 |
|
|
| 3,185 |
|
Retained Earnings |
|
|
|
|
|
|
|
|
|
|
|
|
|
|
|
|
|
|
|
|
|
|
|
|
|
|
|
|
|
|
|
|
Beginning Balance |
|
| 26,080 |
|
|
| 21,785 |
|
|
| 24,823 |
|
|
| 20,833 |
|
|
| 25,048 |
|
|
| 25,315 |
|
|
| 24,648 |
|
|
| 24,823 |
|
Net Income |
|
| 739 |
|
|
| 2,074 |
|
|
| 2,509 |
|
|
| 3,445 |
|
|
| 560 |
|
|
| 935 |
|
|
| 1,305 |
|
|
| 1,770 |
|
Cash dividends declared ($0.65, $0.50, $2.60, and $2.00 per share) |
|
| (169 | ) |
|
| (133 | ) |
|
| (683 | ) |
|
| (535 | ) | ||||||||||||||||
Cash dividends declared ($0.65, $0.65, $1.95, and $1.95 per share) |
|
| (170 | ) |
|
| (170 | ) |
|
| (509 | ) |
|
| (514 | ) | ||||||||||||||||
Employee incentive plans and other |
|
| — |
|
|
| (16 | ) |
|
| 1 |
|
|
| (33 | ) |
|
| (7 | ) |
|
| — |
|
|
| (9 | ) |
|
| 1 |
|
Adoption of new accounting standards on June 1, 2019(1) |
|
| — |
|
|
| — |
|
|
| (4 | ) |
|
| — |
| ||||||||||||||||
Ending Balance |
|
| 26,650 |
|
|
| 23,710 |
|
|
| 26,650 |
|
|
| 23,710 |
|
|
| 25,431 |
|
|
| 26,080 |
|
|
| 25,431 |
|
|
| 26,080 |
|
Accumulated Other Comprehensive Income |
|
|
|
|
|
|
|
|
|
|
|
|
|
|
|
|
|
|
|
|
|
|
|
|
|
|
|
|
|
|
|
|
Beginning Balance |
|
| (817 | ) |
|
| (434 | ) |
|
| (578 | ) |
|
| (415 | ) |
|
| (918 | ) |
|
| (763 | ) |
|
| (865 | ) |
|
| (578 | ) |
Other comprehensive income, net of tax (expense)/benefit of ($2), ($2), $43, and $3 |
|
| 80 |
|
|
| 77 |
|
|
| (159 | ) |
|
| 58 |
| ||||||||||||||||
Other comprehensive income, net of tax (expense)/benefit of ($1), $14, $8, and $45 |
|
| 52 |
|
|
| (54 | ) |
|
| (52 | ) |
|
| (239 | ) | ||||||||||||||||
Reclassification to retained earnings due to the adoption of a new accounting standard on June 1, 2019(2) |
|
| — |
|
|
| — |
|
|
| 51 |
|
|
| — |
| ||||||||||||||||
Ending Balance |
|
| (737 | ) |
|
| (357 | ) |
|
| (737 | ) |
|
| (357 | ) |
|
| (866 | ) |
|
| (817 | ) |
|
| (866 | ) |
|
| (817 | ) |
Treasury Stock |
|
|
|
|
|
|
|
|
|
|
|
|
|
|
|
|
|
|
|
|
|
|
|
|
|
|
|
|
|
|
|
|
Beginning Balance |
|
| (9,186 | ) |
|
| (7,383 | ) |
|
| (7,978 | ) |
|
| (7,382 | ) |
|
| (9,253 | ) |
|
| (8,565 | ) |
|
| (9,289 | ) |
|
| (7,978 | ) |
Purchase of treasury stock (0.6, 1.2, 6.0, and 2.4 million shares) |
|
| (93 | ) |
|
| (288 | ) |
|
| (1,365 | ) |
|
| (558 | ) | ||||||||||||||||
Employee incentive plans and other (0.1, 0.7, 0.6, and 2.7 million shares) |
|
| 19 |
|
|
| 95 |
|
|
| 83 |
|
|
| 364 |
| ||||||||||||||||
Purchase of treasury stock (0.0, 2.8, 0.02, and 5.4 million shares) |
|
| — |
|
|
| (646 | ) |
|
| (3 | ) |
|
| (1,271 | ) | ||||||||||||||||
Employee incentive plans and other (0.2, 0.2, 0.5, and 0.5 million shares) |
|
| 28 |
|
|
| 25 |
|
|
| 67 |
|
|
| 63 |
| ||||||||||||||||
Ending Balance |
|
| (9,260 | ) |
|
| (7,576 | ) |
|
| (9,260 | ) |
|
| (7,576 | ) |
|
| (9,225 | ) |
|
| (9,186 | ) |
|
| (9,225 | ) |
|
| (9,186 | ) |
Total Common Stockholders' Investment Balance |
| $ | 19,894 |
|
| $ | 18,894 |
|
| $ | 19,894 |
|
| $ | 18,894 |
|
| $ | 18,659 |
|
| $ | 19,294 |
|
| $ | 18,659 |
|
| $ | 19,294 |
|
(1) | Relates to the adoption of Accounting Standards Update (“ASU”) 2016-02 and ASU 2018-02. |
(2) | Relates to the adoption of ASU 2018-02. |
The accompanying notes are an integral part of these condensed consolidated financial statements.
- 8 -
NOTES TO CONDENSED CONSOLIDATED FINANCIAL STATEMENTS
(UNAUDITED)
(1) General
SUMMARY OF SIGNIFICANT ACCOUNTING POLICIES. These interim financial statements of FedEx Corporation (“FedEx”) have been prepared in accordance with accounting principles generally accepted in the United States and Securities and Exchange Commission (“SEC”) instructions for interim financial information, and should be read in conjunction with our Annual Report on Form 10-K for the year ended May 31, 20182019 (“Annual Report”). Significant accounting policies and other disclosures normally provided have been omitted since such items are disclosed in our Annual Report.
In the opinion of management, the accompanying unaudited condensed consolidated financial statements reflect all adjustments (including normal recurring adjustments) necessary to present fairly our financial position as of February 28,November 30, 2019, and the results of our operations for the three- and nine-monthsix-month periods ended February 28,November 30, 2019 and 2018, cash flows for the nine-monthsix-month periods ended February 28,November 30, 2019 and 2018, and changes in common stockholders’ investment for the three- and nine-monthsix-month periods ended February 28,November 30, 2019 and 2018. Operating results for the three- and nine-monthsix-month periods ended February 28,November 30, 2019 are not necessarily indicative of the results that may be expected for the year ending May 31, 2019.2020.
Except as otherwise specified, references to years indicate our fiscal year ending May 31, 20192020 or ended May 31 of the year referenced and comparisons are to the corresponding period of the prior year.
RECLASSIFICATIONS. Certain reclassifications have been made to the prior years’ condensed consolidated financial statements to conform to the current year presentation.
REVENUE RECOGNITION.
Satisfaction of Performance Obligation
We recognize revenue upon delivery of shipments for our transportation businesses and upon completion of services for our business services, logistics and trade services businesses. Transportation services are provided with the use of employees and independent businesses that contract with FedEx. FedEx is the principal to the transaction for most of these services and revenue is recognized on a gross basis based on the transfer of control to the customer. Costs associated with independent businesses providing transportation services are recognized as incurred and included in the caption “Purchased transportation” in the accompanying unaudited condensed consolidated statements of income.
For shipments in transit, revenue is recorded based on the percentage of service completed at the balance sheet date which results in our recognizing revenue over time as we perform the services in the contract because of the continuous transfer of control to the customer. Our customers receive the benefit of our services as the goods are transported from one location to another. If we were unable to complete delivery to the final location, another entity would not need to reperform the transportation service already performed. As control transfers over time, revenue is recognized based on the extent of progress towards completion of the performance obligation.
The vast majority of our contracts include only one performance obligation, which is short in duration and spans only a few days. However, if a contract is separated into more than one performance obligation, we allocate the total transaction price to each performance obligation in an amount based on the estimated relative stand-alone selling prices of the promised goods or services underlying each performance obligation. We frequently sell standard transportation services with observable stand-alone sales prices. In these instances, the observable stand-alone sales are used to determine the stand-alone selling price.
We sell customized customer-specific solutions, such as logistics, through which we provide the service of integrating a complex set of tasks and components into a single capability (even if that single capability results in the delivery of multiple units). Therefore, the entire contract is accounted for as one performance obligation. In these cases, we typically use the expected cost plus a margin approach to estimate the stand-alone selling price of each performance obligation.
Variable Consideration
It is common for our contracts to contain customer incentives, guaranteed service refunds or other provisions that can either increase or decrease the transaction price. These variable amounts are generally awarded based upon certain incentive achievements or performance metrics. We estimate variable consideration as the most likely amount to which we expect to be entitled. Estimates for adjustments to revenue and accounts receivable are recognized at the time of shipment for certain customer initiatives, money-back service guarantees and billing corrections based on our assessment of historical, current and forecasted information available. Delivery costs are accrued as incurred.
- 9 -
FEDEX CORPORATION
NOTES TO CONDENSED CONSOLIDATED FINANCIAL STATEMENTS
(UNAUDITED)
Contracts are often modified to account for changes in the rates we charge our customers or to add additional distinct services. We consider contract modifications to exist when the modification either creates new enforceable rights and obligations or alters the existing arrangement. Contract modifications that add distinct goods or services are treated as separate contracts. Contract modifications that do not add distinct goods or services typically change the price of existing services. These contract modifications are accounted for prospectively as the remaining performance obligations are executed.
Contract Assets and Liabilities
Contract assets include billed and unbilled amounts resulting from in-transit packages, as we have an unconditional right to payment only once all performance obligations have been completed (e.g., packages have been delivered). Contract assets are generally classified as current and the full balance is converted each quarter based on the short-term nature of the transactions. Our contract liabilities consist of advance payments and billings in excess of revenue. The full balance of deferred revenue is converted each quarter based on the short-term nature of the transactions.
Gross contract assets related to in-transit packages totaled $526$513 million and $542$533 million at February 28,November 30, 2019 and May 31, 2018,2019, respectively. Contract assets net of deferred unearned revenue were $353$385 million and $363$364 million at February 28,November 30, 2019 and May 31, 2018,2019, respectively. Contract assets are included within current assets in the accompanying unaudited condensed consolidated balance sheets. Contract liabilities related to advance payments from customers were $9$10 million and $13$11 million at February 28,November 30, 2019 and May 31, 2018,2019, respectively. Contract liabilities are included within current liabilities in the accompanying unaudited condensed consolidated balance sheets.
Our contract logistics, global trade services and certain transportation businesses engage in some transactions wherein they act as agents. Revenue from these transactions is recorded on a net basis. Net revenue includes billings to customers less third-party charges, including transportation or handling costs, fees, commissions and taxes and duties.
Certain of our revenue-producing transactions are subject to taxes, such as sales tax, assessed by governmental authorities. We present these revenues net of tax. Under the typical payment terms of our customer contracts, the customer pays at periodic intervals (e.g., every 15 days, 30 days, 45 days, etc.) for shipments included on invoices received. It is not customary business practice to extend payment terms past 90 days, and as such, we do not have a practice of including a significant financing component within our revenue contracts with customers.
- 109 -
FEDEX CORPORATION
NOTES TO CONDENSED CONSOLIDATED FINANCIAL STATEMENTS
(UNAUDITED)
The following table provides revenue by service type (dollars in millions) for the periods ended February 28.November 30. This presentation is consistent with how we organize our segments internally for making operating decisions and measuring performance.
|
| Three Months Ended |
|
| Nine Months Ended |
|
| Three Months Ended |
|
| Six Months Ended |
| ||||||||||||||||||||
|
| 2019 |
|
| 2018 |
|
| 2019 |
|
| 2018 |
|
| 2019 |
|
| 2018 |
|
| 2019 |
|
| 2018 |
| ||||||||
REVENUE BY SERVICE TYPE |
|
|
|
|
|
|
|
|
|
|
|
|
|
|
|
|
|
|
|
|
|
|
|
|
|
|
|
|
|
|
|
|
FedEx Express segment: |
|
|
|
|
|
|
|
|
|
|
|
|
|
|
|
|
|
|
|
|
|
|
|
|
|
|
|
|
|
|
|
|
Package: |
|
|
|
|
|
|
|
|
|
|
|
|
|
|
|
|
|
|
|
|
|
|
|
|
|
|
|
|
|
|
|
|
U.S. overnight box |
| $ | 1,844 |
|
| $ | 1,836 |
|
| $ | 5,678 |
|
| $ | 5,373 |
|
| $ | 1,864 |
|
| $ | 1,948 |
|
| $ | 3,730 |
|
| $ | 3,834 |
|
U.S. overnight envelope |
|
| 433 |
|
|
| 435 |
|
|
| 1,345 |
|
|
| 1,317 |
|
|
| 457 |
|
|
| 444 |
|
|
| 936 |
|
|
| 912 |
|
U.S. deferred |
|
| 1,119 |
|
|
| 996 |
|
|
| 3,131 |
|
|
| 2,796 |
|
|
| 980 |
|
|
| 1,060 |
|
|
| 1,936 |
|
|
| 2,012 |
|
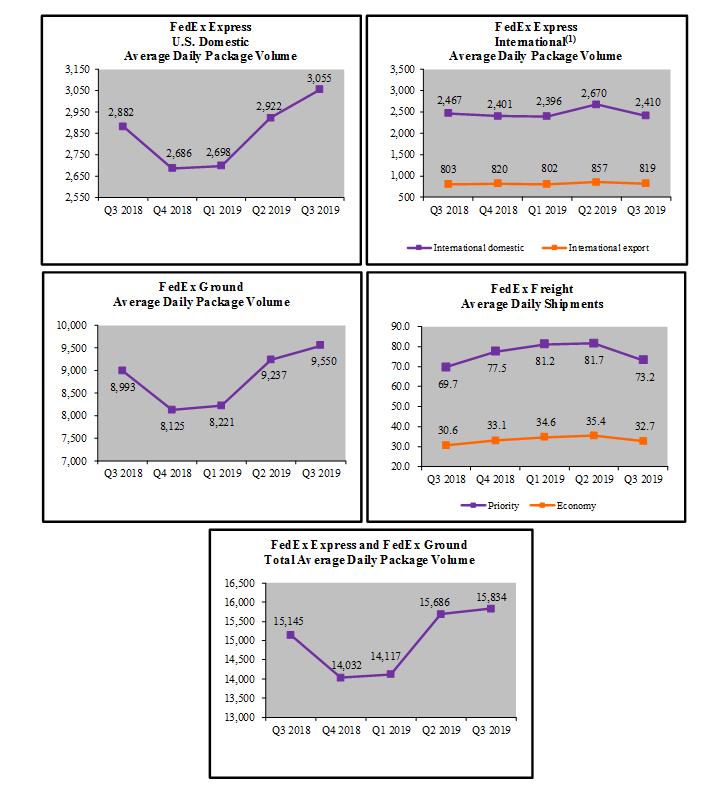
Total U.S. domestic package revenue |
|
| 3,396 |
|
|
| 3,267 |
|
|
| 10,154 |
|
|
| 9,486 |
|
|
| 3,301 |
|
|
| 3,452 |
|
|
| 6,602 |
|
|
| 6,758 |
|
International priority |
|
| 1,738 |
|
|
| 1,841 |
|
|
| 5,508 |
|
|
| 5,469 |
|
|
| 1,817 |
|
|
| 1,896 |
|
|
| 3,634 |
|
|
| 3,770 |
|
International economy |
|
| 806 |
|
|
| 793 |
|
|
| 2,541 |
|
|
| 2,378 |
|
|
| 873 |
|
|
| 885 |
|
|
| 1,728 |
|
|
| 1,735 |
|
Total international export package revenue |
|
| 2,544 |
|
|
| 2,634 |
|
|
| 8,049 |
|
|
| 7,847 |
|
|
| 2,690 |
|
|
| 2,781 |
|
|
| 5,362 |
|
|
| 5,505 |
|
International domestic(1) |
|
| 1,078 |
|
|
| 1,140 |
|
|
| 3,412 |
|
|
| 3,424 |
|
|
| 1,165 |
|
|
| 1,203 |
|
|
| 2,241 |
|
|
| 2,334 |
|
Total package revenue |
|
| 7,018 |
|
|
| 7,041 |
|
|
| 21,615 |
|
|
| 20,757 |
|
|
| 7,156 |
|
|
| 7,436 |
|
|
| 14,205 |
|
|
| 14,597 |
|
Freight: |
|
|
|
|
|
|
|
|
|
|
|
|
|
|
|
|
|
|
|
|
|
|
|
|
|
|
|
|
|
|
|
|
U.S. |
|
| 772 |
|
|
| 739 |
|
|
| 2,294 |
|
|
| 2,040 |
|
|
| 698 |
|
|
| 792 |
|
|
| 1,393 |
|
|
| 1,522 |
|
International priority |
|
| 477 |
|
|
| 532 |
|
|
| 1,574 |
|
|
| 1,527 |
|
|
| 473 |
|
|
| 564 |
|
|
| 937 |
|
|
| 1,097 |
|
International economy |
|
| 495 |
|
|
| 492 |
|
|
| 1,568 |
|
|
| 1,354 |
|
|
| 541 |
|
|
| 554 |
|
|
| 1,057 |
|
|
| 1,073 |
|
International airfreight |
|
| 76 |
|
|
| 93 |
|
|
| 244 |
|
|
| 276 |
|
|
| 70 |
|
|
| 83 |
|
|
| 136 |
|
|
| 168 |
|
Total freight revenue |
|
| 1,820 |
|
|
| 1,856 |
|
|
| 5,680 |
|
|
| 5,197 |
|
|
| 1,782 |
|
|
| 1,993 |
|
|
| 3,523 |
|
|
| 3,860 |
|
Other |
|
| 167 |
|
|
| 201 |
|
|
| 536 |
|
|
| 620 |
|
|
| 146 |
|
|
| 175 |
|
|
| 301 |
|
|
| 369 |
|
Total FedEx Express segment |
|
| 9,005 |
|
|
| 9,098 |
|
|
| 27,831 |
|
|
| 26,574 |
|
|
| 9,084 |
|
|
| 9,604 |
|
|
| 18,029 |
|
|
| 18,826 |
|
FedEx Ground segment |
|
| 5,261 |
|
|
| 4,828 |
|
|
| 15,202 |
|
|
| 13,598 |
|
|
| 5,315 |
|
|
| 5,142 |
|
|
| 10,494 |
|
|
| 9,941 |
|
FedEx Freight segment |
|
| 1,750 |
|
|
| 1,613 |
|
|
| 5,627 |
|
|
| 4,950 |
|
|
| 1,844 |
|
|
| 1,918 |
|
|
| 3,749 |
|
|
| 3,877 |
|
FedEx Services segment |
|
| 402 |
|
|
| 397 |
|
|
| 1,248 |
|
|
| 1,213 |
|
|
| 5 |
|
|
| 4 |
|
|
| 9 |
|
|
| 13 |
|
Other and eliminations(2) |
|
| 592 |
|
|
| 590 |
|
|
| 1,978 |
|
|
| 1,801 |
|
|
| 1,076 |
|
|
| 1,156 |
|
|
| 2,091 |
|
|
| 2,219 |
|
|
| $ | 17,010 |
|
| $ | 16,526 |
|
| $ | 51,886 |
|
| $ | 48,136 |
|
| $ | 17,324 |
|
| $ | 17,824 |
|
| $ | 34,372 |
|
| $ | 34,876 |
|
| (1) | International domestic revenues relate to our international intra-country operations. |
|
| Includes the FedEx Logistics, Inc. (“FedEx Logistics” |
LEASES. We lease certain facilities, aircraft, equipment and vehicles under operating and finance leases. A determination of whether a contract contains a lease is made at the inception of the arrangement. Our leased facilities include national, regional and metropolitan sorting facilities, retail facilities and administrative buildings. We leased 5% of our total aircraft fleet as of November 30, 2019 and 6% as of May 31, 2019.
Our leases generally contain options to extend or terminate the lease. We reevaluate our leases on a regular basis to consider the economic and strategic incentives of exercising the renewal options, and how they align with our operating strategy. Therefore, substantially all the renewal option periods are not included within the lease term and the associated payments are not included in the measurement of the right-of-use asset and lease liability as the options to extend are not reasonably certain at lease commencement.
The lease liabilities are measured at the lease commencement date and determined using the present value of the minimum lease payments not yet paid and our incremental borrowing rate, which approximates the rate at which we would borrow, on a collateralized basis, over the term of a lease in the applicable currency environment. The interest rate implicit in the lease is generally not determinable in transactions where we are the lessee.
- 10 -
FEDEX CORPORATION
NOTES TO CONDENSED CONSOLIDATED FINANCIAL STATEMENTS
(UNAUDITED)
For real estate leases, we account for lease components and non-lease components (such as common area maintenance) as a single lease component. Certain real estate leases require additional payments based on sales volume and index based rate increases, as well as reimbursement for real estate taxes, common area maintenance and insurance, which are expensed as incurred as variable lease costs. Certain leases contain fixed lease payments for items such as real estate taxes, common area maintenance and insurance. These fixed payments are considered part of the lease payment and included in the right-of-use assets and lease liabilities.
See Note 8 for additional information.
IMPAIRMENT OF LONG-LIVED ASSETS. Long-lived assets are reviewed for impairment when circumstances indicate the carrying value of an asset may not be recoverable. For assets that are to be held and used, an impairment is recognized when the estimated undiscounted cash flows associated with the asset or group of assets is less than their carrying value. If impairment exists, an adjustment is made to write the asset down to its fair value, and a loss is recorded as the difference between the carrying value and fair value. Fair values are determined based on quoted market values, discounted cash flows or internal and external appraisals, as applicable. Assets to be disposed of are carried at the lower of carrying value or estimated net realizable value.
We operate integrated transportation networks, and accordingly, cash flows for most of our operating assets to be held and used are assessed at a network level, not at an individual asset level, for our analysis of impairment.
During the second quarter of 2020, we made the decision to permanently retire from service 10 Airbus A310-300 aircraft and 12 related engines at Federal Express Corporation (“FedEx Express”) to align with the needs of the U.S. domestic network and modernize its aircraft fleet. As a consequence of this decision, noncash impairment charges of $66 million ($50 million, net of tax, or $0.19 per diluted share) were recorded in the FedEx Express segment in the second quarter. NaN of these aircraft were temporarily idled.
EMPLOYEES UNDER COLLECTIVE BARGAINING ARRANGEMENTS. The pilots of FederalFedEx Express, Corporation (“FedEx Express”), who are a small number of its total employees, are employed under a collective bargaining agreement that took effect on November 2, 2015. The collective bargaining agreement is scheduled to become amendable in November 2021. Other than the pilots at FedEx Express and drivers at one FedEx Freight, Inc. facility, our U.S. employees have thus far chosen not to unionize (we acquired FedEx Supply Chain Distribution System, Inc. (“FedEx Supply Chain” (formerly GENCO Distribution System, Inc.)) in 2015, which already had a small number of employees who are members of unions). Additionally, certain of FedEx Express’sExpress non-U.S. employees are unionized, and a union has been certified to represent owner-drivers at a FedEx Freight Inc. facility in Canada.Canada, Corp. facility.
STOCK-BASED COMPENSATION. We have two types of equity-based compensation: stock options and restricted stock. The key terms of the stock option and restricted stock awards granted under our incentive stock plans and all financial disclosures about these programs are set forth in our Annual Report.
Our stock-based compensation expense was $33$37 million for the three-month period ended February 28,November 30, 2019 and $141$104 million for the nine-monthsix-month period ended February 28,November 30, 2019. Our stock-based compensation expense was $32$40 million for the three-month period ended February 28,November 30, 2018 and $135$108 million for the nine-monthsix-month period ended February 28,November 30, 2018. Due to its immateriality, additional disclosures related to stock-based compensation have been excluded from this quarterly report.
BUSINESS REALIGNMENT COSTS. DERIVATIVE FINANCIAL INSTRUMENTS. Our risk management strategy includes the select use of derivative instruments to reduce the effects of volatility in foreign currency exchange exposure on operating results and cash flows. In December 2018,accordance with our risk management policies, we announced cost-reduction programs primarily through initiativesdo not hold or issue derivative instruments for trading or speculative purposes. All derivative instruments are recognized in the financial statements at FedEx Expressfair value, regardless of the purpose or intent for holding them.
When we become a party to a derivative instrument and FedEx Corporate Services, Inc. (“FedEx Services”), includingintend to apply hedge accounting, we formally document the hedge relationship and the risk management objective for undertaking the hedge, which includes designating the instrument for financial reporting purposes as a U.S.-based voluntary employee buyout program.fair value hedge, a cash flow hedge or a net investment hedge.
- 11 -
FEDEX CORPORATION
NOTES TO CONDENSED CONSOLIDATED FINANCIAL STATEMENTS
(UNAUDITED)
DuringIf a derivative is designated as a cash flow hedge, the third quarter of 2019, we began offering voluntary cash buyouts to eligible U.S.-based employees in certain staff functions. The U.S.-based voluntary employee buyout program includes voluntary severance payments and funding to healthcare reimbursement accounts, with the voluntary severance payment calculated based on four weeks of gross base salary for every year of continuous FedEx service up to a maximum payment of two years of pay. Eligible employees will be scheduled to vacate positions in phases to ensure a smooth transitionentire change in the impacted functions so that we maintain service levels to our customers. Costsfair value of the benefits provided under the program will be recognized as special termination benefits in the period employees accept their offers.
We incurred costs of approximately $4 million ($3 million, net of tax, or $0.01 per diluted share) during the third quarter of 2019 associated with our business realignment activities. These costs related to certain employee severance arrangements and other external costs directly attributable to our business realignment activities, such as professional fees. Total costs of the U.S.-based voluntary employee buyout program will depend on acceptance rates and severance payments will be made at the time of departure. The cost of our business realignment activities ishedging instrument included in the caption “Business realignment costs”assessment of hedge effectiveness is recorded in other comprehensive income. For net investment hedges, the entire change in the fair value is recorded in the currency translation adjustment section of other comprehensive income. Any portion of a change in the fair value of a derivative that is considered to be ineffective, along with the change in fair value of any derivatives not designated in a hedging relationship, is immediately recognized in the income statement. We do not have any derivatives designated as a cash flow hedge for any period presented. Accordingly, additional disclosures about cash flow hedges are excluded from this quarterly report. On August 13, 2019, we designated €294 million of debt and on November 8, 2019, we designated an additional €98 million of debt, for a total of €392 million, as a net investment hedge to reduce the volatility of the U.S. dollar value of a portion of our unaudited condensednet investment in a euro-denominated consolidated statementssubsidiary. As of income.November 30, 2019, the requirements for the application of hedge accounting continue to be met and the hedge remains effective.
RECENT ACCOUNTING GUIDANCE. New accounting rules and disclosure requirements can significantly impact our reported results and the comparability of our financial statements. We believe the following new accounting guidance is relevant to the readers of our financial statements.
Recently Adopted Accounting Standards
In December 2017, the SEC staff issued Staff Accounting Bulletin (“SAB”) 118 to provide guidance to registrants in accounting for income taxes under the Tax Cuts and Jobs Act (“TCJA”). SAB 118 was issued to address the application of U.S. generally accepted accounting principles (“GAAP”) in situations when a registrant does not have the necessary information available, prepared, or analyzed in reasonable detail to finalize the calculations for certain income tax effects of the TCJA. In accordance with SAB 118, we made reasonable estimates and recorded provisional amounts for the TCJA during 2018. Under the transitional provisions of SAB 118, we had a one-year measurement period to complete the accounting for the initial tax effects of the TCJA. As of December 22, 2018, our accounting is complete for the tax effects of the TCJA, including the following elements initially recorded on a provisional basis:
In 2018, we recognized a provisional benefit related to the revaluation of U.S. deferred tax assets and liabilities. During the second quarter of 2019, we revised the provisional benefit associated with the remeasurement of our net U.S. deferred tax liability. As a result, we recognized a $4 million tax expense, which decreased the $1.15 billion provisional benefit recorded in 2018.
We previously recognized an immaterial provisional benefit from foreign tax credits exceeding the one-time transition tax on previously deferred foreign earnings. No adjustments were made to the provisional estimate recorded in 2018.
We have determined to record the taxes for the global intangible low-taxed income (GILTI) as a period cost.
In 2014,2016, the Financial Accounting Standards Board (“FASB”) and International Accounting Standards Board issued a new accounting standard that supersedes virtually all existing revenue recognition guidance under generally accepted accounting principles in the United States. The fundamental principles of the new guidance are that companies should recognize revenue in a manner that reflects the timing of the transfer of services to customers and the amount of revenue recognized reflects the consideration that a company expects to receive for the goods and services provided. The new guidance establishes a five-step approach for the recognition of revenue. We adopted this standard as of June 1, 2018 (fiscal 2019) using the modified retrospective method of adoption as permitted by the standard. The new guidance did not have an impact on our revenue recognition policies, practices or systems; therefore, there was no cumulative-effect adjustment to retained earnings as of June 1, 2018.
In March 2017, the FASB issued an Accounting Standards Update (ASU 2017-07) that changes how employers that sponsor defined benefit pension or other postretirement benefit plans present the net periodic benefit cost in the income statement. This new guidance requires entities to report the service cost component in the same line item or items as other compensation costs. The other components of net benefit cost are required to be presented in the income statement separately from the service cost component outside of income from operations. This standard impacts our operating income but has no impact on our net income or earnings per share. We adopted this standard effective June 1, 2018 (fiscal 2019) and applied these changes retrospectively. As such, prior year financial results are recast to conform to these new rules upon adoption.
- 12 -
FEDEX CORPORATION
NOTES TO CONDENSED CONSOLIDATED FINANCIAL STATEMENTS
(UNAUDITED)
The following table presents our results under our historical method of accounting and as adjusted to reflect our adoption of ASU 2017-07 (in millions):
|
| Three Months Ended February 28, 2018 |
|
| Nine Months Ended February 28, 2018 |
| ||||||||||||||||||
|
| Reported |
|
| Effect of Adoption of ASU 2017-07 |
|
| As Adjusted |
|
| Reported |
|
| Effect of Adoption of ASU 2017-07 |
|
| As Adjusted |
| ||||||
Revenue |
| $ | 16,526 |
|
| $ | — |
|
| $ | 16,526 |
|
| $ | 48,136 |
|
| $ | — |
|
| $ | 48,136 |
|
Operating Income |
|
| 1,001 |
|
|
| (143 | ) |
|
| 858 |
|
|
| 3,380 |
|
|
| (436 | ) |
|
| 2,944 |
|
Other Income (Expense), net |
|
| (127 | ) |
|
| 143 |
|
|
| 16 |
|
|
| (385 | ) |
|
| 436 |
|
|
| 51 |
|
Net Income |
|
| 2,074 |
|
|
| — |
|
|
| 2,074 |
|
|
| 3,445 |
|
|
| — |
|
|
| 3,445 |
|
|
|
|
|
|
|
|
|
|
|
|
|
|
|
|
|
|
|
|
|
|
|
|
|
|
In August 2018, the SEC published Release No. 33-10532, Disclosure Update and Simplification (“DUSTR”), which adopted amendments to certain disclosure requirements that have become redundant, duplicative, overlapping, outdated or superseded, in light of other SEC disclosure requirements, GAAP, or changes in the information environment. While most of the DUSTR amendments eliminate outdated or duplicative disclosure requirements, the final rule amends the interim financial statement requirements to include a reconciliation of changes in common stockholders’ investment in the notes or as a separate statement for each period for which a statement of comprehensive income is required to be filed. The new interim reconciliation of changes in common stockholders’ investment is included herein as a separate statement.
New Accounting Standards and Accounting Standards Not Yet Adopted
In 2016, the FASB issued a new lease accounting standard, which requires lessees to put most leases on their balance sheets but recognize the expenses in their income statements in a manner similar to current practice. The new standard states that a lessee willLessees are required to recognize a lease liability for the obligation to make lease payments and a right-of-use asset for the right to use the underlying asset for the lease term. Expenses related to leases determined to be operating leases will beare recognized on a straight-line basis, while those determined to be financingfinance leases will beare recognized following a front-loaded expense profile in which interest and amortization are presented separately in the income statement. Based
We adopted this new standard on June 1, 2019 using a modified retrospective transition method. Using the modified retrospective transition method of adoption, we did not adjust the balance sheet for comparative periods but recorded a cumulative effect adjustment to retained earnings on June 1, 2019. We have elected the package of practical expedients permitted under the transition guidance within the new standard, which among other things, allows us to carry forward the historical accounting relating to lease identification and classification for existing leases upon adoption. We also elected the practical expedient to not separate lease and non-lease components for the majority of our classes of assets. For leases in which the lease portfolio, we currently anticipate recognizing aand non-lease components have been combined, the lease expense includes expenses such as common area maintenance. We have made an accounting policy election not to recognize leases with an initial term of 12 months or less on the consolidated balance sheet.
The adoption of the new lease accounting standard resulted in the recognition of an operating lease liability of $14.2 billion and relatedan operating right-of-use asset on our balance sheet of approximately $13$14.1 billion, with an immaterial impact on our income statement compared to the currentprevious lease accounting model. However,Existing prepaid asset and net deferred rent liability balances of $154 million and $309 million, respectively, were recorded to the ultimate impact of the standard will depend on our lease portfolio asright-of-use asset. The cumulative effect of the adoption date. We are currently accumulatingto retained earnings was an increase of $57 million ($47 million, net of tax), primarily related to the reclassification of deferred gains related to sale-leasebacks of aircraft. Substantially all of the necessary information required to properly account for theour lease arrangements are operating leases under the new standard. Additionally, we are implementing an enterprise-wide lease management system to assist in the accountingThe new standard had a material impact on our balance sheet, but did not materially impact consolidated operating results and are evaluating had no impact on operating cash flows.
See “Leases” and Note 8 for additional changes to our processes and internal controls to ensure we meet the standard’s reporting and disclosure requirements. These changes will be effective June 1, 2019 (fiscal 2020)information.
In February 2018, the FASB issued an Accounting Standards Update (ASU 2018-02)ASU 2018-02 that will permitpermits companies to reclassify the income tax effect of the TCJATax Cuts and Jobs Act (“TCJA”) on items within accumulated other comprehensive income (loss)Accumulated Other Comprehensive Income (“AOCI”) to retained earnings. We adopted this new standard on June 1, 2019.
New Accounting Standards and Accounting Standards Not Yet Adopted
In June 2016, the FASB issued ASU 2016-13 that changes how entities will measure credit losses for most financial assets and certain other instruments that are not measured at fair value through net income. These changes will be effective June 1, 20192020 (fiscal 2020)2021). We are continuing to assessassessing the impact of this new standard on our consolidated financial statements and related disclosures.
In August 2018, the FASB issued an Accounting Standards Update (ASU 2018-14) that modifies the disclosure requirements for employers that sponsor defined benefit pension or other postretirement benefit plans. The guidance removes disclosures that are no longer considered cost beneficial, clarifies the specific requirements of disclosures and adds disclosure requirements identified as relevant. We expect this new guidance will have minimal impact on our financial reporting. These changes will be effective June 1, 2020 (fiscal 2021) and will be applied retrospectively. We plan to early adopt these new rules in the fourth quarter of 2019.
In August 2018, the FASB issued an Accounting Standards Update (ASU 2018-15)ASU 2018-15 that reduces the complexity forof accounting for costs of implementing a cloud computing service arrangement and aligns the accounting for capitalizing implementation costs of hosting arrangements, regardless of whether they convey a license to the hosted software. These changes will be effective June 1, 2020 (fiscal 2021).2020. We are assessing the impact of this new standard on our consolidated financial statements and related disclosures.
- 12 -
FEDEX CORPORATION
NOTES TO CONDENSED CONSOLIDATED FINANCIAL STATEMENTS
(UNAUDITED)
TREASURY SHARES. In January 2016, our Board of Directors authorized a sharestock repurchase program of up to 25 million shares. Shares under the current repurchase program may be repurchased from time to time in the open market or in privately negotiated transactions. The timing and volume of repurchases are at the discretion of management, based on the capital needs of the business, the market price of FedEx common stock and general market conditions. No time limit was set for the completion of the program, and the program may be suspended or discontinued at any time.
- 13 -
FEDEX CORPORATION
NOTES TO CONDENSED CONSOLIDATED FINANCIAL STATEMENTS
(UNAUDITED)
We did 0t repurchase any shares of FedEx common stock during the second quarter of 2020. During the third quarterfirst half of 2019,2020, we repurchased 0.60.02 million shares of FedEx common stock at an average price of $168.43$156.90 per share for a total of $93$3 million. During the nine months of 2019, we repurchased 6.0 million shares of FedEx common stock at an average price of $227.42 per share for a total of $1.4 billion. As of February 28,November 30, 2019, 5.75.1 million shares remained under the current sharestock repurchase authorization.
DIVIDENDS DECLARED PER COMMON SHARE. On FebruaryNovember 15, 2019, our Board of Directors declared a quarterly dividend of $0.65 per share of common stock. The dividend will be paid on April 1, 2019January 2, 2020 to stockholders of record as of the close of business on March 11,December 9, 2019. Each quarterly dividend payment is subject to review and approval by our Board of Directors, and we evaluate our dividend payment amount on an annual basis.
(2) Accumulated Other Comprehensive Loss
The following table provides changes in AOCI, net of tax, reported in our unaudited condensed consolidated financial statements for the periods ended February 28November 30 (in millions; amounts in parentheses indicate debits to AOCI):
|
| Three Months Ended |
|
| Nine Months Ended |
|
| Three Months Ended |
|
| Six Months Ended |
| ||||||||||||||||||||
|
| 2019 |
|
| 2018 |
|
| 2019 |
|
| 2018 |
|
| 2019 |
|
| 2018 |
|
| 2019 |
|
| 2018 |
| ||||||||
Foreign currency translation loss: |
|
|
|
|
|
|
|
|
|
|
|
|
|
|
|
|
|
|
|
|
|
|
|
|
|
|
|
|
|
|
|
|
Balance at beginning of period |
| $ | (952 | ) |
| $ | (666 | ) |
| $ | (759 | ) |
| $ | (685 | ) |
| $ | (1,036 | ) |
| $ | (921 | ) |
| $ | (954 | ) |
| $ | (759 | ) |
Translation adjustments |
|
| 103 |
|
|
| 100 |
|
|
| (90 | ) |
|
| 119 |
|
|
| 72 |
|
|
| (31 | ) |
|
| (11 | ) |
|
| (193 | ) |
Reclassification to retained earnings due to the adoption of ASU 2018-02 |
|
| — |
|
|
| — |
|
|
| 1 |
|
|
| — |
| ||||||||||||||||
Balance at end of period |
|
| (849 | ) |
|
| (566 | ) |
|
| (849 | ) |
|
| (566 | ) |
|
| (964 | ) |
|
| (952 | ) |
|
| (964 | ) |
|
| (952 | ) |
Retirement plans adjustments: |
|
|
|
|
|
|
|
|
|
|
|
|
|
|
|
|
|
|
|
|
|
|
|
|
|
|
|
|
|
|
|
|
Balance at beginning of period |
|
| 135 |
|
|
| 232 |
|
|
| 181 |
|
|
| 270 |
|
|
| 118 |
|
|
| 158 |
|
|
| 89 |
|
|
| 181 |
|
Reclassifications from AOCI |
|
| (23 | ) |
|
| (23 | ) |
|
| (69 | ) |
|
| (61 | ) |
|
| (20 | ) |
|
| (23 | ) |
|
| (41 | ) |
|
| (46 | ) |
Reclassification to retained earnings due to the adoption of ASU 2018-02 |
|
| — |
|
|
| — |
|
|
| 50 |
|
|
| — |
| ||||||||||||||||
Balance at end of period |
|
| 112 |
|
|
| 209 |
|
|
| 112 |
|
|
| 209 |
|
|
| 98 |
|
|
| 135 |
|
|
| 98 |
|
|
| 135 |
|
Accumulated other comprehensive (loss) at end of period |
| $ | (737 | ) |
| $ | (357 | ) |
| $ | (737 | ) |
| $ | (357 | ) |
| $ | (866 | ) |
| $ | (817 | ) |
| $ | (866 | ) |
| $ | (817 | ) |
The following table presents details of the reclassifications from AOCI for the periods ended February 28November 30 (in millions; amounts in parentheses indicate debits to earnings):
|
| Amount Reclassified from AOCI |
|
| Affected Line Item in the Income Statement |
| Amount Reclassified from AOCI |
|
| Affected Line Item in the Income Statement | ||||||||||||||||||||||||||
|
| Three Months Ended |
|
| Nine Months Ended |
|
|
|
| Three Months Ended |
|
| Six Months Ended |
|
|
| ||||||||||||||||||||
|
| 2019 |
|
| 2018 |
|
| 2019 |
|
| 2018 |
|
|
|
| 2019 |
|
| 2018 |
|
| 2019 |
|
| 2018 |
|
|
| ||||||||
Amortization of retirement plans prior service credits, before tax |
| $ | 30 |
|
| $ | 30 |
|
| $ | 90 |
|
| $ | 90 |
|
| Salaries and employee benefits |
| $ | 26 |
|
| $ | 30 |
|
| $ | 53 |
|
| $ | 60 |
|
| Salaries and employee benefits |
Income tax benefit |
|
| (7 | ) |
|
| (7 | ) |
|
| (21 | ) |
|
| (29 | ) |
| Provision for income taxes |
|
| (6 | ) |
|
| (7 | ) |
|
| (12 | ) |
|
| (14 | ) |
| Provision for income taxes |
AOCI reclassifications, net of tax |
| $ | 23 |
|
| $ | 23 |
|
| $ | 69 |
|
| $ | 61 |
|
| Net income |
| $ | 20 |
|
| $ | 23 |
|
| $ | 41 |
|
| $ | 46 |
|
| Net income |
(3) Financing Arrangements
We have a shelf registration statement filed with the SEC that allows us to sell, in one or more future offerings, any combination of our unsecured debt securities and common stock.
- 13 -
FEDEX CORPORATION
NOTES TO CONDENSED CONSOLIDATED FINANCIAL STATEMENTS
(UNAUDITED)
During the thirdfirst quarter of 2019,2020, we issued $1.2$2.1 billion of senior unsecured debt under our current shelf registration statement, comprised of €640 million$1.0 billion of 0.7%3.10% fixed-rate notes due in May 2022 and $500August 2029, €500 million of 3.4%0.45% fixed-rate notes due in January 2022.August 2025 and €500 million of 1.30% fixed-rate notes due in August 2031. We will useused the net proceeds to paymake voluntary contributions to our tax-qualified U.S. domestic pension plans (“U.S. Pension Plans”) during the first quarter of 2020 and to redeem the $400 million aggregate principal amount of 2.30% notes due February 1, 2020 and the €500 million aggregate principal amount of floating rate0.50% notes due at maturity on April 11, 2019, and9, 2020. The remaining net proceeds are being used for general corporate purposes.
During the second quarter of 2019, we issued $1.25 billion of senior unsecured debt under our current shelf registration statement, comprised of $400 million of 4.20% fixed-rate notes due in October 2028 and $850 million of 4.95% fixed-rate notes due in October 2048. Interest on these notes is paid semi-annually. We used the net proceeds to redeem the $750 million aggregate principal amount of 8.00% notes due January 15, 2019, and for general corporate purposes.
- 14 -
FEDEX CORPORATION
NOTES TO CONDENSED CONSOLIDATED FINANCIAL STATEMENTS
(UNAUDITED)
We have a five-year $2.0 billion revolvingfive-year credit facility thatagreement (the “Five-Year Credit Agreement”) and a $1.5 billion 364-day credit agreement (the “364-Day Credit Agreement” and, together with the Five-Year Credit Agreement, the “Credit Agreements”). The Five-Year Credit Agreement expires in November 2020. The facility, whichMarch 2024 and includes a $500$250 million letter of credit sublimit, issublimit. The 364-Day Credit Agreement expires in March 2020. The Credit Agreements are available to finance our operations and other cash flow needs. The agreement containsCredit Agreements contain a financial covenant which requiresrequiring us to maintain a ratio of debt to consolidated earnings (excluding non-cashnoncash retirement plans mark-to-market adjustments and non-cashnoncash asset impairment charges) before interest, taxes, depreciation and amortization (“adjusted EBITDA”) of not more than 3.5 to 1.0, calculated as of the end of the applicable quarter on a rolling four-quarters basis. The ratio of our debt to adjusted EBITDA was 2.22.6 to 1.0 at February 28,November 30, 2019. We believe this covenant is the only significant restrictive covenant in our revolving credit agreement. Our revolving credit agreement containsthe Credit Agreements. The Credit Agreements contain other customary covenants that do not, individually or in the aggregate, materially restrict the conduct of our business. We are in compliance with thisthe financial covenant and all other covenants of our revolving credit agreementin the Credit Agreements and do not expect the covenants to affect our operations, including our liquidity or expected funding needs. If we failed to comply with the financial covenant or any other covenants in the Credit Agreements, our access to financing could become limited.
During the thirdsecond quarter of 2019,2020, we issued commercial paper to provide us with additional short-term liquidity. The maximum amount outstanding during the quarter was $750$150 million. Our commercial paper program is backed by unused commitments under the revolving credit facility, and borrowings under the program reduce the amount available under the credit facility. As of February 28,November 30, 2019, $225$150 million of commercial paper and $53 million in letters of credit were outstanding, leaving $1.722$3.297 billion available under the revolving credit facilityCredit Agreements for future borrowings.
Long-term debt, including current maturities and exclusive of capitalfinance leases, had carrying values of $18.1$18.6 billion at February 28,November 30, 2019 and $16.5$17.5 billion at May 31, 2018,2019, compared with estimated fair values of $17.8$19.6 billion at February 28,November 30, 2019 and $16.6$17.8 billion at May 31, 2018.2019. The annualized weighted-average interest rate on long-term debt was 3.4%3.5% at February 28,November 30, 2019. The estimated fair values were determined based on quoted market prices and the current rates offered for debt with similar terms and maturities. The fair value of our long-term debt is classified as Level 2 within the fair value hierarchy. This classification is defined as a fair value determined using market-based inputs other than quoted prices that are observable for the liability, either directly or indirectly.
(4) Computation of Earnings Per Share
The calculation of basic and diluted earnings per common share for the periods ended February 28November 30 was as follows (in millions, except per share amounts):
|
| Three Months Ended |
|
| Nine Months Ended |
|
| Three Months Ended |
|
| Six Months Ended |
| ||||||||||||||||||||
|
| 2019 |
|
| 2018 |
|
| 2019 |
|
| 2018 |
|
| 2019 |
|
| 2018 |
|
| 2019 |
|
| 2018 |
| ||||||||
Basic earnings per common share: |
|
|
|
|
|
|
|
|
|
|
|
|
|
|
|
|
|
|
|
|
|
|
|
|
|
|
|
|
|
|
|
|
Net earnings allocable to common shares(1) |
| $ | 738 |
|
| $ | 2,071 |
|
| $ | 2,506 |
|
| $ | 3,441 |
|
| $ | 559 |
|
| $ | 933 |
|
| $ | 1,303 |
|
| $ | 1,768 |
|
Weighted-average common shares |
|
| 261 |
|
|
| 268 |
|
|
| 262 |
|
|
| 268 |
|
|
| 261 |
|
|
| 262 |
|
|
| 261 |
|
|
| 263 |
|
Basic earnings per common share |
| $ | 2.83 |
|
| $ | 7.74 |
|
| $ | 9.55 |
|
| $ | 12.85 |
|
| $ | 2.15 |
|
| $ | 3.56 |
|
| $ | 5.00 |
|
| $ | 6.71 |
|
Diluted earnings per common share: |
|
|
|
|
|
|
|
|
|
|
|
|
|
|
|
|
|
|
|
|
|
|
|
|
|
|
|
|
|
|
|
|
Net earnings allocable to common shares(1) |
| $ | 738 |
|
| $ | 2,071 |
|
| $ | 2,506 |
|
| $ | 3,441 |
|
| $ | 559 |
|
| $ | 933 |
|
| $ | 1,303 |
|
| $ | 1,768 |
|
Weighted-average common shares |
|
| 261 |
|
|
| 268 |
|
|
| 262 |
|
|
| 268 |
|
|
| 261 |
|
|
| 262 |
|
|
| 261 |
|
|
| 263 |
|
Dilutive effect of share-based awards |
|
| 2 |
|
|
| 5 |
|
|
| 4 |
|
|
| 4 |
|
|
| 1 |
|
|
| 4 |
|
|
| 1 |
|
|
| 5 |
|
Weighted-average diluted shares |
|
| 263 |
|
|
| 273 |
|
|
| 266 |
|
|
| 272 |
|
|
| 262 |
|
|
| 266 |
|
|
| 262 |
|
|
| 268 |
|
Diluted earnings per common share |
| $ | 2.80 |
|
| $ | 7.59 |
|
| $ | 9.41 |
|
| $ | 12.63 |
|
| $ | 2.13 |
|
| $ | 3.51 |
|
| $ | 4.97 |
|
| $ | 6.60 |
|
Anti-dilutive options excluded from diluted earnings per common share |
|
| 7.2 |
|
|
| 1.9 |
|
|
| 5.0 |
|
|
| 2.6 |
|
|
| 11.2 |
|
|
| 4.0 |
|
|
| 11.0 |
|
|
| 3.8 |
|
(1)Net earnings available to participating securities were immaterial in all periods presented.
(1) | Net earnings available to participating securities were immaterial in all periods presented. |
- 1514 -
FEDEX CORPORATION
NOTES TO CONDENSED CONSOLIDATED FINANCIAL STATEMENTS
(UNAUDITED)
Our effective tax rate was 2.1% for the second quarter and 16.8% for the first half of 2020, compared with 20.6% for the thirdsecond quarter and 21.8%22.3% for the nine monthsfirst half of 2019, compared with (137.3)% for the third quarter and (15.0)% for the nine months of 2018.2019. The 20192020 tax rates include a benefit of $90were favorably impacted by $133 million from the reduction of a valuation allowance on certain foreign tax loss carryforwards and an expensedue to operational changes which impacted the determination of $50 million from the impact on ourrealizability of the deferred taxes attributable to a recently enacted lower tax rateasset in the Netherlands.that jurisdiction. The 2020 tax rates were negatively impacted by decreased earnings in certain non-U.S. jurisdictions. The 2019 tax rates were also favorably impacted by the TCJA, which resulted in benefits of approximatelyan approximate $60 million during the third quarter and $230 million for the nine months of 2019, primarily from the lower statutory tax rate on fiscal 2019 earnings. The tax rate for the nine months of 2019 also benefited by approximately $60 millionbenefit from accelerated deductions claimed on our 2018 U.S. income tax return. The 2018 tax rates were favorably impacted by a provisional benefit of $1.15 billion from the remeasurement of our net U.S. deferred tax liability and a provisional benefit of $36 million from foreign tax credits exceeding the one-time transition tax on previously deferred foreign earnings. In addition to these provisional amounts, we recognized a $204 million benefit from a $1.5 billion contribution to our tax-qualified U.S. domestic pension plans (“U.S. Pension Plans”)return filed in February 2018 and $165 million related to the phase-in of a reduced statutory tax rate on 2018 year-to-date earnings, of which approximately $120 million was recorded in the third quarter and attributable to the first half of 2018 earnings.2019.
On January 15, 2019, the U.S. Treasury Department issued final regulations covering the one-time transition tax on unrepatriated foreign earnings, which was enacted as part of the TCJA. Certain guidance included in these final regulations is inconsistent with our interpretation that led to the recognition of a $225 million ($0.94 per diluted share) benefit in 2018 (the “2018 Benefit”). Notwithstanding this inconsistency, we remain confident in our interpretation of the TCJA and intend to defend this position through litigation, if necessary. However, if we are ultimately unsuccessful in defending our position, we may be required to reverse the 2018 Benefit.
During the third quarter of 2019, we completed our accounting for the tax effects of the TCJA. No additional adjustments were made during the quarter. As a result, the only adjustment to the amounts initially recorded on a provisional basis in 2018 was a tax expense of $4 million recognized in the second quarter of 2019 as a revision of the provisional benefit associated with the remeasurement of our net U.S. deferred tax liability.
The TCJA, enacted during the third quarter of fiscal 2018, significantly changed the U.S. corporate income tax system including, among other things, lowering the statutory federal income tax rate from 35% to 21%. Due to our May 31 fiscal year-end, the lower rate was phased in, resulting in a U.S. statutory federal rate of 29.2% for 2018 and a statutory federal rate of 21% for subsequent years.
The following table provides a reconciliation of the 2018 effective tax rates to the 2019 effective tax rates, including the impacts of the TCJA, for the periods ended February 28:
|
| Three Months Ended |
|
| Nine Months Ended |
| ||
2018 Effective Tax Rate(a) |
|
| (137.3 | )% |
|
| (15.0 | )% |
Remeasurement of net U.S. deferred tax liability in 2018 |
|
| 131.5 |
|
|
| 38.5 |
|
Effect of February 2018 pension contribution(b) |
|
| 23.3 |
|
|
| 6.8 |
|
Lower statutory tax rate on first-half 2018 earnings (35% to 29.2%)(c) |
|
| 12.5 |
|
|
| — |
|
Reduction of valuation allowance on tax loss carryforwards in 2019 |
|
| (10.3 | ) |
|
| (3.0 | ) |
Lower statutory tax rate on 2019 earnings (29.2% to 21%)(c) |
|
| (7.6 | ) |
|
| (7.6 | ) |
Remeasurement of net Dutch deferred tax asset in 2019 |
|
| 5.3 |
|
|
| 1.5 |
|
Transition tax provisional benefit in 2018 |
|
| 4.1 |
|
|
| 1.2 |
|
Foreign tax credits on foreign dividends in 2018 |
|
| 1.2 |
|
|
| 2.9 |
|
Accelerated deductions claimed in 2019 on the 2018 U.S. income tax return |
|
| — |
|
|
| (1.8 | ) |
Other, net(d) |
|
| (2.1 | ) |
|
| (1.7 | ) |
2019 Effective Tax Rate(a) |
|
| 20.6 | % |
|
| 21.8 | % |
|
|
|
|
|
|
|
|
- 16 -
FEDEX CORPORATION
NOTES TO CONDENSED CONSOLIDATED FINANCIAL STATEMENTS
(UNAUDITED)
We sponsor programs that provide retirement benefits to most of our employees. These programs include defined benefit pension plans, defined contribution plans and postretirement healthcare plans. Key terms of our retirement plans are provided in our Annual Report.
Our retirement plans costs for the periods ended February 28November 30 were as follows (in millions):
|
| Three Months Ended |
|
| Nine Months Ended |
|
| Three Months Ended |
|
| Six Months Ended |
| ||||||||||||||||||||
|
| 2019 |
|
| 2018 |
|
| 2019 |
|
| 2018 |
|
| 2019 |
|
| 2018 |
|
| 2019 |
|
| 2018 |
| ||||||||
Defined benefit pension plans, net |
| $ | 28 |
|
| $ | 39 |
|
| $ | 85 |
|
| $ | 113 |
|
| $ | 37 |
|
| $ | 29 |
|
| $ | 74 |
|
| $ | 57 |
|
Defined contribution plans |
|
| 138 |
|
|
| 135 |
|
|
| 415 |
|
|
| 386 |
|
|
| 136 |
|
|
| 133 |
|
|
| 278 |
|
|
| 277 |
|
Postretirement healthcare plans |
|
| 19 |
|
|
| 19 |
|
|
| 56 |
|
|
| 56 |
|
|
| 21 |
|
|
| 18 |
|
|
| 43 |
|
|
| 37 |
|
|
| $ | 185 |
|
| $ | 193 |
|
| $ | 556 |
|
| $ | 555 |
|
| $ | 194 |
|
| $ | 180 |
|
| $ | 395 |
|
| $ | 371 |
|
Net periodic benefit cost of the pension and postretirement healthcare plans for the periods ended February 28November 30 included the following components (in millions):
|
| Three Months Ended |
|
| Three Months Ended |
| ||||||||||||||||||||||||||||||||||||||||||
|
| U.S. Pension Plans |
|
| International Pension Plans |
|
| Postretirement Healthcare Plans |
|
| U.S. Pension Plans |
|
| International Pension Plans |
|
| Postretirement Healthcare Plans |
| ||||||||||||||||||||||||||||||
|
| 2019 |
|
| 2018 |
|
| 2019 |
|
| 2018 |
|
| 2019 |
|
| 2018 |
|
| 2019 |
|
| 2018 |
|
| 2019 |
|
| 2018 |
|
| 2019 |
|
| 2018 |
| ||||||||||||
Service cost |
| $ | 173 |
|
| $ | 169 |
|
| $ | 23 |
|
| $ | 23 |
|
| $ | 9 |
|
| $ | 9 |
|
| $ | 192 |
|
| $ | 172 |
|
| $ | 24 |
|
| $ | 25 |
|
| $ | 10 |
|
| $ | 8 |
|
Other retirement plans (income) expense: |
|
|
|
|
|
|
|
|
|
|
|
|
|
|
|
|
|
|
|
|
|
|
|
|
|
|
|
|
|
|
|
|
|
|
|
|
|
|
|
|
|
|
|
|
|
|
|
|
Interest cost |
|
| 237 |
|
|
| 279 |
|
|
| 13 |
|
|
| 12 |
|
|
| 10 |
|
|
| 10 |
|
|
| 250 |
|
|
| 238 |
|
|
| 11 |
|
|
| 12 |
|
|
| 11 |
|
|
| 10 |
|
Expected return on plan assets |
|
| (376 | ) |
|
| (406 | ) |
|
| (12 | ) |
|
| (10 | ) |
|
| — |
|
|
| — |
|
|
| (401 | ) |
|
| (376 | ) |
|
| (13 | ) |
|
| (12 | ) |
|
| — |
|
|
| — |
|
Amortization of prior service credit and other |
|
| (30 | ) |
|
| (29 | ) |
|
| — |
|
|
| 1 |
|
|
| — |
|
|
| — |
|
|
| (25 | ) |
|
| (30 | ) |
|
| (1 | ) |
|
| — |
|
|
| — |
|
|
| — |
|
|
|
| (169 | ) |
|
| (156 | ) |
|
| 1 |
|
|
| 3 |
|
|
| 10 |
|
|
| 10 |
|
|
| (176 | ) |
|
| (168 | ) |
|
| (3 | ) |
|
| — |
|
|
| 11 |
|
|
| 10 |
|
|
| $ | 4 |
|
| $ | 13 |
|
| $ | 24 |
|
| $ | 26 |
|
| $ | 19 |
|
| $ | 19 |
|
| $ | 16 |
|
| $ | 4 |
|
| $ | 21 |
|
| $ | 25 |
|
| $ | 21 |
|
| $ | 18 |
|
|
|
|
|
|
|
|
|
|
|
|
|
|
|
|
|
|
|
|
|
|
|
|
|
|
|
|
|
|
|
|
|
|
|
|
|
|
|
|
|
|
|
|
|
|
|
|
|
|
|
| Nine Months Ended |
|
| Six Months Ended |
| ||||||||||||||||||||||||||||||||||||||||||
|
| U.S. Pension Plans |
|
| International Pension Plans |
|
| Postretirement Healthcare Plans |
|
| U.S. Pension Plans |
|
| International Pension Plans |
|
| Postretirement Healthcare Plans |
| ||||||||||||||||||||||||||||||
|
| 2019 |
|
| 2018 |
|
| 2019 |
|
| 2018 |
|
| 2019 |
|
| 2018 |
|
| 2019 |
|
| 2018 |
|
| 2019 |
|
| 2018 |
|
| 2019 |
|
| 2018 |
| ||||||||||||
Service cost |
| $ | 517 |
|
| $ | 509 |
|
| $ | 72 |
|
| $ | 69 |
|
| $ | 26 |
|
| $ | 27 |
|
| $ | 384 |
|
| $ | 344 |
|
| $ | 48 |
|
| $ | 49 |
|
| $ | 21 |
|
| $ | 17 |
|
Other retirement plans (income) expense: |
|
|
|
|
|
|
|
|
|
|
|
|
|
|
|
|
|
|
|
|
|
|
|
|
|
|
|
|
|
|
|
|
|
|
|
|
|
|
|
|
|
|
|
|
|
|
|
|
Interest cost |
|
| 713 |
|
|
| 836 |
|
|
| 38 |
|
|
| 37 |
|
|
| 30 |
|
|
| 29 |
|
|
| 500 |
|
|
| 476 |
|
|
| 22 |
|
|
| 25 |
|
|
| 22 |
|
|
| 20 |
|
Expected return on plan assets |
|
| (1,129 | ) |
|
| (1,218 | ) |
|
| (36 | ) |
|
| (32 | ) |
|
| — |
|
|
| — |
|
|
| (801 | ) |
|
| (753 | ) |
|
| (26 | ) |
|
| (24 | ) |
|
| — |
|
|
| — |
|
Amortization of prior service credit and other |
|
| (89 | ) |
|
| (88 | ) |
|
| (1 | ) |
|
| — |
|
|
| — |
|
|
| — |
|
|
| (52 | ) |
|
| (59 | ) |
|
| (1 | ) |
|
| (1 | ) |
|
| — |
|
|
| — |
|
|
|
| (505 | ) |
|
| (470 | ) |
|
| 1 |
|
|
| 5 |
|
|
| 30 |
|
|
| 29 |
|
|
| (353 | ) |
|
| (336 | ) |
|
| (5 | ) |
|
| — |
|
|
| 22 |
|
|
| 20 |
|
|
| $ | 12 |
|
| $ | 39 |
|
| $ | 73 |
|
| $ | 74 |
|
| $ | 56 |
|
| $ | 56 |
|
| $ | 31 |
|
| $ | 8 |
|
| $ | 43 |
|
| $ | 49 |
|
| $ | 43 |
|
| $ | 37 |
|
ContributionsWe made voluntary contributions to our U.S. Pension Plans forof $1.0 billion during the nine-month periods ended February 28 were as follows (in millions):
|
| 2019 |
|
| 2018 |
| ||
Required |
| $ | — |
|
| $ | 22 |
|
Voluntary |
|
| 1,000 |
|
|
| 2,478 |
|
|
| $ | 1,000 |
|
| $ | 2,500 |
|
first half of 2020 and $500 million during the first half of 2019.
- 1715 -
FEDEX CORPORATION
NOTES TO CONDENSED CONSOLIDATED FINANCIAL STATEMENTS
(UNAUDITED)
During the second quarter of 2020, we announced the closing of our U.S.-based defined benefit pension plans to new non-union employees hired on or after January 1, 2020. We will introduce an all 401(k) plan retirement benefit structure for eligible employees with a higher company match of up to 8% across all U.S.-based operating companies. During 2020, current eligible employees under the Portable Pension Account (PPA) pension formula will be given a one-time option to continue to be eligible for pension compensation credits under the existing PPA formula and remain in the existing 401(k) plan with its match of up to 3.5%, or to cease receiving compensation credits under the pension plan and move to the new 401(k) plan with the higher match of up to 8%. Changes to the new 401(k) plan structure become effective beginning January 1, 2021. While this new program will provide employees greater flexibility and reduce our long-term pension costs, it will not have a material impact on current or near-term financial results.
(7) Business Segment Information
We provide a broad portfolio of transportation, e-commerce and business services through companies competing collectively, operating independently and managed collaboratively, under the respected FedEx brand. Our primary operating companies are FedEx Express, including TNT Express B.V. (“TNT Express”), the world’s largest express transportation company; FedEx Ground Package System, Inc. (“FedEx Ground”), a leading North American provider of small-package ground delivery services; and FedEx Freight Corporation (“FedEx Freight”), a leading U.S.North American provider of less-than-truckload (“LTL”) freight transportation services. These companies represent our major service lines and, along with FedEx Corporate Services, Inc. (“FedEx Services”), constitute our reportable segments.
Our reportable segments include the following businesses:
FedEx Express Segment | FedEx Express (express transportation) |
| TNT Express (international express transportation, small-package ground delivery and freight transportation) |
|
|
FedEx Ground Segment | FedEx Ground (small-package ground delivery) |
|
|
FedEx Freight Segment | FedEx Freight (LTL freight transportation) |
|
|
FedEx Services Segment | FedEx Services (sales, marketing, information technology, communications, customer service, technical support, billing and collection services and back-office functions) |
|
|
References to our transportation segments include, collectively, the FedEx Express segment, the FedEx Ground segment and the FedEx Freight segment.
Effective June 1, 2019, the results of the FedEx Office operating segment are included in “Corporate, other and eliminations.” This change was made to reflect our internal management reporting structure. Prior year amounts have been revised to reflect current year presentation.
FedEx Services Segment
The FedEx Services segment operates combined sales, marketing, administrative and information-technology functions in shared services operations thatfor U.S. customers of our major business units and certain back-office support to our transportation businesses and allowoperating segments which allows us to obtain synergies from the combination of these functions. For the international regions of FedEx Express, some of these functions are performed on a regional basis and reported by FedEx Express in their natural expense line items. The FedEx Services segment includes: FedEx Services, which provides sales, marketing, information technology, communications, customer service, technical support, billing and collection services for U.S. customers of our major business units and certain back-office support to our other companies; and FedEx Office and Print Services, Inc. (“FedEx Office”), which provides an array of document and business services and retail access to our customers for our package transportation businesses.
The FedEx Services segment provides direct and indirect support to our transportation businesses,operating segments, and we allocate all of the net operating costs of the FedEx Services segment (including the net operating results of FedEx Office) to reflect the full cost of operating our transportation businesses in the results of those segments. Within the FedEx Services segment allocation, the net operating results of FedEx Office, which are an immaterial component of our allocations, are allocated to FedEx Express and FedEx Ground. We review and evaluate the performance of our transportation segments based on operating income (inclusive of FedEx Services segment allocations). For the FedEx Services segment, performance is evaluated based on the impact of its total allocated net operating costs on our transportationoperating segments.
Operating expenses for each of our transportation segments include the allocations from the FedEx Services segment to the respective transportation segments. These allocations also include charges and credits for administrative services provided between operating companies. The allocations of net operating costs are based on metrics such as relative revenues or estimated services provided. We believe these allocations approximate the net cost of providing these functions. Our allocation methodologies are refined periodically, as necessary, to reflect changes in our businesses.
- 16 -
FEDEX CORPORATION
NOTES TO CONDENSED CONSOLIDATED FINANCIAL STATEMENTS
(UNAUDITED)
Corporate, Other and Eliminations
Corporate and other includes corporate headquarters costs for executive officers and certain legal and finance functions, as well as certain other costs and credits not attributed to our core business. These costs are not allocated to the other business segments.
- 18 -
FEDEX CORPORATION
NOTES TO CONDENSED CONSOLIDATED FINANCIAL STATEMENTS
(UNAUDITED)
Also included in corporate and other is the FedEx Office operating segment, which provides an array of document and business services and retail access to our customers for our package transportation businesses, and the FedEx Logistics operating segment, which provides integrated supply chain management solutions, specialty transportation, cross-border e-commerce technology and e-commerce transportation solutions, customs brokerage and global ocean and air freight forwarding through FedEx Trade Networks Transport & Brokerage, Inc.; cross-border enablement and technology solutions and e-commerce transportation solutions through FedEx Cross Border Technologies, Inc.; integrated supply chain management solutions through FedEx Supply Chain; time-critical shipment services through FedEx Custom Critical, Inc.; and, effective September 1, 2018, critical inventory and service parts logistics, 3-D printing and technology repair through FedEx Forward Depots, Inc.forwarding.
Certain FedEx operating companies provide transportation and related services for other FedEx companies outside their reportable segment. Billings for such services are based on negotiated rates, which we believe approximate fair value, and are reflected as revenues of the billing segment. These rates are adjusted from time to time based on market conditions. Such intersegment revenues and expenses are eliminated in our consolidated results and are not separately identified in the following segment information because the amounts are not material.
The following table provides a reconciliation of reportable segment revenues and operating income (loss) to our unaudited condensed consolidated financial statement totals for the periods ended February 28November 30 (in millions):
|
| Three Months Ended |
|
| Six Months Ended |
| ||||||||||
|
| 2019 |
|
| 2018 |
|
| 2019 |
|
| 2018 |
| ||||
Revenues: |
|
|
|
|
|
|
|
|
|
|
|
|
|
|
|
|
FedEx Express segment |
| $ | 9,084 |
|
| $ | 9,604 |
|
| $ | 18,029 |
|
| $ | 18,826 |
|
FedEx Ground segment |
|
| 5,315 |
|
|
| 5,142 |
|
|
| 10,494 |
|
|
| 9,941 |
|
FedEx Freight segment |
|
| 1,844 |
|
|
| 1,918 |
|
|
| 3,749 |
|
|
| 3,877 |
|
FedEx Services segment |
|
| 5 |
|
|
| 4 |
|
|
| 9 |
|
|
| 13 |
|
Other and eliminations |
|
| 1,076 |
|
|
| 1,156 |
|
|
| 2,091 |
|
|
| 2,219 |
|
|
| $ | 17,324 |
|
| $ | 17,824 |
|
| $ | 34,372 |
|
| $ | 34,876 |
|
Operating income (loss): |
|
|
|
|
|
|
|
|
|
|
|
|
|
|
|
|
FedEx Express segment |
| $ | 236 |
|
| $ | 630 |
|
| $ | 521 |
|
| $ | 1,018 |
|
FedEx Ground segment |
|
| 342 |
|
|
| 590 |
|
|
| 986 |
|
|
| 1,266 |
|
FedEx Freight segment |
|
| 141 |
|
|
| 148 |
|
|
| 335 |
|
|
| 324 |
|
Corporate, other and eliminations |
|
| (165 | ) |
|
| (200 | ) |
|
| (311 | ) |
|
| (369 | ) |
|
| $ | 554 |
|
| $ | 1,168 |
|
| $ | 1,531 |
|
| $ | 2,239 |
|
(8) Leases
The following table is a summary of the components of net lease cost for the periods ended November 30 (in millions):
|
| Three Months Ended |
|
| Nine Months Ended |
| ||||||||||
|
| 2019 |
|
| 2018 |
|
| 2019 |
|
| 2018 |
| ||||
Revenues: |
|
|
|
|
|
|
|
|
|
|
|
|
|
|
|
|
FedEx Express segment |
| $ | 9,005 |
|
| $ | 9,098 |
|
| $ | 27,831 |
|
| $ | 26,574 |
|
FedEx Ground segment |
|
| 5,261 |
|
|
| 4,828 |
|
|
| 15,202 |
|
|
| 13,598 |
|
FedEx Freight segment |
|
| 1,750 |
|
|
| 1,613 |
|
|
| 5,627 |
|
|
| 4,950 |
|
FedEx Services segment |
|
| 402 |
|
|
| 397 |
|
|
| 1,248 |
|
|
| 1,213 |
|
Other and eliminations |
|
| 592 |
|
|
| 590 |
|
|
| 1,978 |
|
|
| 1,801 |
|
|
| $ | 17,010 |
|
| $ | 16,526 |
|
| $ | 51,886 |
|
| $ | 48,136 |
|
Operating income (loss): |
|
|
|
|
|
|
|
|
|
|
|
|
|
|
|
|
FedEx Express segment |
| $ | 370 |
|
| $ | 317 |
|
| $ | 1,357 |
|
| $ | 1,238 |
|
FedEx Ground segment |
|
| 577 |
|
|
| 614 |
|
|
| 1,830 |
|
|
| 1,716 |
|
FedEx Freight segment |
|
| 97 |
|
|
| 49 |
|
|
| 421 |
|
|
| 322 |
|
Corporate, other and eliminations |
|
| (133 | ) |
|
| (122 | ) |
|
| (458 | ) |
|
| (332 | ) |
|
| $ | 911 |
|
| $ | 858 |
|
| $ | 3,150 |
|
| $ | 2,944 |
|
|
| Three Months Ended |
|
| Six Months Ended |
|
| ||
|
| 2019 |
|
| 2019 |
|
| ||
Operating lease cost (1) |
| $ | 676 |
|
| $ | 1,350 |
|
|
Finance lease cost: |
|
|
|
|
|
|
|
|
|
Amortization of right-of-use assets |
|
| 3 |
|
|
| 6 |
|
|
Interest on lease liabilities |
|
| 1 |
|
|
| 2 |
|
|
Total finance lease cost |
|
| 4 |
|
|
| 8 |
|
|
Short-term lease cost |
|
| 46 |
|
|
| 81 |
|
|
Variable lease cost(1) |
|
| 282 |
|
|
| 549 |
|
|
Net lease cost |
| $ | 1,008 |
|
| $ | 1,988 |
|
|
(1) Expenses are primarily accounted for in the “Rentals and landing fees” line item. Additional amounts related to embedded leases are accounted for in the “Purchased transportation,” “Fuel” and “Other” line items in the unaudited condensed consolidated statements of income.
- 17 -
FEDEX CORPORATION
NOTES TO CONDENSED CONSOLIDATED FINANCIAL STATEMENTS
(UNAUDITED)
Supplemental cash flow information related to leases for the six months ended November 30 is as follows (in millions):
|
| 2019 |
| |
Cash paid for amounts included in the measurement of lease liabilities: |
|
|
|
|
Operating cash flows paid for operating leases |
| $ | 1,247 |
|
Operating cash flows paid for interest portion of finance leases |
|
| 2 |
|
Financing cash flows paid for principal portion of finance leases |
|
| 64 |
|
Right-of-use assets obtained in exchange for new operating lease liabilities |
| $ | 1,049 |
|
Right-of-use assets obtained in exchange for new finance lease liabilities |
| $ | 93 |
|
Supplemental balance sheet information related to leases as of November 30 is as follows (in millions, except lease term and discount rate):
|
| 2019 |
| |
Operating leases: |
|
|
|
|
Operating lease right-of-use assets, net |
| $ | 14,097 |
|
|
|
|
|
|
Current portion of operating lease liabilities |
|
| 1,928 |
|
Operating lease liabilities |
|
| 12,432 |
|
Total operating lease liabilities |
| $ | 14,360 |
|
|
|
|
|
|
Finance leases: |
|
|
|
|
Net property and equipment |
| $ | 99 |
|
|
|
|
|
|
Current portion of long-term debt |
|
| 16 |
|
Long-term debt, less current portion |
|
| 92 |
|
Total finance lease liabilities |
| $ | 108 |
|
|
|
|
|
|
Weighted-average remaining lease term |
|
|
|
|
Operating leases |
|
| 10.0 |
|
Finance leases |
|
| 11.6 |
|
|
|
|
|
|
Weighted-average discount rate |
|
|
|
|
Operating leases |
|
| 3.24 | % |
Finance leases |
|
| 3.99 | % |
(8) CommitmentsA summary of future minimum lease payments under noncancelable operating and finance leases with an initial or remaining term in excess of one year at November 30, 2019 is as follows (in millions):
|
| Aircraft and Related Equipment |
|
| Facilities and Other |
|
| Total Operating Leases |
|
| Finance Leases |
|
| Total Leases |
| |||||
2020 (remainder) |
| $ | 236 |
|
| $ | 1,013 |
|
| $ | 1,249 |
|
| $ | 13 |
|
| $ | 1,262 |
|
2021 |
|
| 253 |
|
|
| 2,102 |
|
|
| 2,355 |
|
|
| 14 |
|
|
| 2,369 |
|
2022 |
|
| 234 |
|
|
| 1,871 |
|
|
| 2,105 |
|
|
| 14 |
|
|
| 2,119 |
|
2023 |
|
| 198 |
|
|
| 1,668 |
|
|
| 1,866 |
|
|
| 13 |
|
|
| 1,879 |
|
2024 |
|
| 102 |
|
|
| 1,457 |
|
|
| 1,559 |
|
|
| 11 |
|
|
| 1,570 |
|
Thereafter |
|
| 314 |
|
|
| 7,527 |
|
|
| 7,841 |
|
|
| 78 |
|
|
| 7,919 |
|
Total lease payments |
|
| 1,337 |
|
|
| 15,638 |
|
|
| 16,975 |
|
|
| 143 |
|
|
| 17,118 |
|
Less imputed interest |
|
| (107 | ) |
|
| (2,508 | ) |
|
| (2,615 | ) |
|
| (35 | ) |
|
| (2,650 | ) |
Present value of lease liability |
| $ | 1,230 |
|
| $ | 13,130 |
|
| $ | 14,360 |
|
| $ | 108 |
|
| $ | 14,468 |
|
While certain of our lease agreements contain covenants governing the use of the leased assets or require us to maintain certain levels of insurance, none of our lease agreements include material financial covenants or limitations.
- 18 -
FEDEX CORPORATION
NOTES TO CONDENSED CONSOLIDATED FINANCIAL STATEMENTS
(UNAUDITED)
As of February 28,November 30, 2019, FedEx has entered into additional leases which have not yet commenced and are therefore not part of the right-of-use asset and liability. These leases are generally for build-to-suit facilities and have undiscounted future payments of approximately $1.6 billion, and will commence when FedEx gains beneficial access to the leased asset. Commencement dates are expected to be from fiscal 2020 to fiscal 2022.
As previously disclosed in our Annual Report and under the previous lease accounting standard, future minimum lease payments under noncancelable operating leases with an initial or remaining term in excess of one year at May 31, 2019 would have been as follows (in millions):
|
| Operating Leases |
| |||||||||
|
| Aircraft and Related Equipment |
|
| Facilities and Other |
|
| Total Operating Leases |
| |||
2020 |
| $ | 288 |
|
| $ | 2,209 |
|
| $ | 2,497 |
|
2021 |
|
| 230 |
|
|
| 2,033 |
|
|
| 2,263 |
|
2022 |
|
| 212 |
|
|
| 1,816 |
|
|
| 2,028 |
|
2023 |
|
| 154 |
|
|
| 1,625 |
|
|
| 1,779 |
|
2024 |
|
| 58 |
|
|
| 1,428 |
|
|
| 1,486 |
|
Thereafter |
|
| 85 |
|
|
| 7,977 |
|
|
| 8,062 |
|
Total |
| $ | 1,027 |
|
| $ | 17,088 |
|
| $ | 18,115 |
|
(9) Commitments
As of November 30, 2019, our purchase commitments under various contracts for the remainder of 20192020 and annually thereafter were as follows (in millions):
|
| Aircraft and Related |
|
| Other(1) |
|
| Total |
|
| Aircraft and Related |
|
| Other(1) |
|
| Total |
| ||||||
2019 (remainder) |
| $ | 421 |
|
| $ | 296 |
|
| $ | 717 |
| ||||||||||||
2020 |
|
| 1,998 |
|
|
| 833 |
|
|
| 2,831 |
| ||||||||||||
2020 (remainder) |
| $ | 556 |
|
| $ | 511 |
|
| $ | 1,067 |
| ||||||||||||
2021 |
|
| 2,276 |
|
|
| 597 |
|
|
| 2,873 |
|
|
| 2,592 |
|
|
| 749 |
|
|
| 3,341 |
|
2022 |
|
| 1,874 |
|
|
| 433 |
|
|
| 2,307 |
|
|
| 2,596 |
|
|
| 529 |
|
|
| 3,125 |
|
2023 |
|
| 1,586 |
|
|
| 275 |
|
|
| 1,861 |
|
|
| 1,789 |
|
|
| 377 |
|
|
| 2,166 |
|
2024 |
|
| 701 |
|
|
| 228 |
|
|
| 929 |
| ||||||||||||
Thereafter |
|
| 3,079 |
|
|
| 535 |
|
|
| 3,614 |
|
|
| 3,408 | �� |
|
| 586 |
|
|
| 3,994 |
|
Total |
| $ | 11,234 |
|
| $ | 2,969 |
|
| $ | 14,203 |
|
| $ | 11,642 |
|
| $ | 2,980 |
|
| $ | 14,622 |
|
| (1) | Primarily equipment and advertising contracts. |
The amounts reflected in the table above for purchase commitments represent noncancelable agreements to purchase goods or services. As of February 28,November 30, 2019, our obligation to purchase six6 Boeing 777 Freighter (“B777F”) aircraft and five4 Boeing 767-300 Freighter (“B767F”) aircraft is conditioned upon there being no event that causes FedEx Express or its employees not to be covered by the Railway Labor Act of 1926, as amended. Open purchase orders that are cancelable are not considered unconditional purchase obligations for financial reporting purposes and are not included in the table above.
During the first quarter of 2020, FedEx Express exercised options to purchase an additional 6 B767F aircraft for delivery in 2022.
- 19 -
FEDEX CORPORATION
NOTES TO CONDENSED CONSOLIDATED FINANCIAL STATEMENTS
(UNAUDITED)
As of February 28,November 30, 2019, we had $965$735 million in deposits and progress payments on aircraft purchases and other planned aircraft-related transactions. These deposits are classified in the “Other assets” caption of our accompanying unaudited condensed consolidated balance sheets. Aircraft and related contracts are subject to price escalations. The following table is a summary of the key aircraft we are committed to purchase as of February 28,November 30, 2019 with the year of expected delivery:
|
| Cessna SkyCourier 408 |
|
| ATR 72-600F |
|
| B767F |
|
| B777F |
|
| Total |
|
| Cessna SkyCourier 408 |
|
| ATR 72-600F |
|
| B767F |
|
| B777F |
|
| Total |
| ||||||||||
2019 (remainder) |
|
| - |
|
|
| - |
|
|
| 4 |
|
|
| 1 |
|
|
| 5 |
| ||||||||||||||||||||
2020 |
|
| - |
|
|
| - |
|
|
| 17 |
|
|
| 5 |
|
|
| 22 |
| ||||||||||||||||||||
2020 (remainder) |
|
| - |
|
|
| - |
|
|
| 10 |
|
|
| - |
|
|
| 10 |
| ||||||||||||||||||||
2021 |
|
| 12 |
|
|
| 5 |
|
|
| 18 |
|
|
| 2 |
|
|
| 37 |
|
|
| 12 |
|
|
| 5 |
|
|
| 18 |
|
|
| 2 |
|
|
| 37 |
|
2022 |
|
| 12 |
|
|
| 6 |
|
|
| 12 |
|
|
| 3 |
|
|
| 33 |
|
|
| 12 |
|
|
| 6 |
|
|
| 18 |
|
|
| 3 |
|
|
| 39 |
|
2023 |
|
| 12 |
|
|
| 6 |
|
|
| 6 |
|
|
| 4 |
|
|
| 28 |
|
|
| 12 |
|
|
| 6 |
|
|
| 6 |
|
|
| 4 |
|
|
| 28 |
|
2024 |
|
| 14 |
|
|
| 6 |
|
|
| - |
|
|
| 4 |
|
|
| 24 |
| ||||||||||||||||||||
Thereafter |
|
| 14 |
|
|
| 13 |
|
|
| - |
|
|
| 6 |
|
|
| 33 |
|
|
| - |
|
|
| 7 |
|
|
| - |
|
|
| 2 |
|
|
| 9 |
|
Total |
|
| 50 |
|
|
| 30 |
|
|
| 57 |
|
|
| 21 |
|
|
| 158 |
|
|
| 50 |
|
|
| 30 |
|
|
| 52 |
|
|
| 15 |
|
|
| 147 |
|
A summary of future minimum lease payments under noncancelable operating leases with an initial or remaining term in excess of one year at February 28, 2019 is as follows (in millions):(10) Contingencies
|
| Aircraft and Related Equipment |
|
| Facilities and Other |
|
| Total Operating Leases |
| |||
2019 (remainder) |
| $ | 26 |
|
| $ | 571 |
|
| $ | 597 |
|
2020 |
|
| 261 |
|
|
| 2,083 |
|
|
| 2,344 |
|
2021 |
|
| 203 |
|
|
| 1,923 |
|
|
| 2,126 |
|
2022 |
|
| 185 |
|
|
| 1,728 |
|
|
| 1,913 |
|
2023 |
|
| 127 |
|
|
| 1,555 |
|
|
| 1,682 |
|
Thereafter |
|
| 48 |
|
|
| 8,926 |
|
|
| 8,974 |
|
Total |
| $ | 850 |
|
| $ | 16,786 |
|
| $ | 17,636 |
|
Future minimum lease payments under capital leases were immaterial at February 28, 2019. While certain of our lease agreements contain covenants governing the use of the leased assets or require us to maintain certain levels of insurance, none of our lease agreements include material financial covenants or limitations.
(9) Contingencies
Independent Contractor — Lawsuits and Administrative Proceedings.Service Provider Lawsuits. FedEx Ground is involveddefending lawsuits in lawsuits and administrative proceedings claiming that owner-operators engaged under operating agreements no longer in place should have been treated as employees of FedEx Ground, rather than independent contractors. In addition, we are defending joint-employer cases wherewhich it is alleged that FedEx Ground should be treated as an employer of the drivers employed by owner-operatorsservice providers engaged by FedEx Ground. These cases are in varying stages of litigation, and we are not currently able to estimate an amount or range of potential loss in all of these matters. However, we do not expect to incur, individually or in the aggregate, a material loss in these matters. Nevertheless, adverse determinations in these matters related to owner-operators engaged by FedEx Ground could, among other things, entitle certain owner-operators to the reimbursement of certain expenses, and theirservice providers’ drivers to certain wage payments from the owner-operatorsservice providers and FedEx Ground, and result in employment and withholding tax and benefit liability for FedEx Ground. We continue to believe that owner-operators engaged by FedEx Ground are properly classified as independent contractors and that FedEx Ground is not an employer or joint employer of the drivers of these independent contractors.businesses.
CityFederal Securities Litigation and StateDerivative Lawsuits. On June 26, 2019 and July 2, 2019, FedEx and certain present and former officers were named as defendants in two putative class action securities lawsuits filed in the U.S. District Court for the Southern District of New York Cigarette Suit.York. The Citycomplaints, which have been consolidated, allege violations of New YorkSections 10(b) and 20(a) of the Securities Exchange Act of 1934, as amended, and Rule 10b-5 promulgated thereunder relating to alleged misstatements or omissions in FedEx’s public filings with the SEC and other public statements during the period from September 19, 2017 to December 18, 2018. We are not currently able to estimate the probability of loss or the amount or range of potential loss, if any, at this stage of the litigation.
On September 17, 2019 and November 6, 2019, FedEx, its Board of Directors and certain present and former directors and officers were named as defendants in two stockholder derivative lawsuits filed in the U.S. District Court for the District of Delaware. The complaints repeat the allegations in the federal securities litigation complaints discussed above, and assert new claims against the FedEx Board of Directors and certain present and former directors and officers for breach of fiduciary duty, waste of corporate assets, unjust enrichment, insider selling and violations of the federal proxy rules. We are not currently able to estimate the probability of loss or the amount or range of potential loss, if any, at this stage of the litigation.
Environmental Matters. SEC regulations require disclosure of certain environmental matters when a governmental authority is a party to the proceedings and the State of New York filed two related lawsuitsproceedings involve potential monetary sanctions that management reasonably believes could exceed $100,000.
On July 26, 2019, FedEx Freight received a pre-litigation offer from the San Bernardino District Attorney’s Office in California to settle a civil action that the District Attorney intended to file against FedEx Ground in December 2013 and November 2014 arising from FedEx Ground’s alleged shipments of cigarettes to New York residents in contravention of several statutes, including the Racketeer Influenced and Corrupt Organizations Act (“RICO”) and New York’s Public Health Law, as well as common law nuisance claims. The first-filed lawsuit alleged that FedEx Ground provided delivery services on behalf of four shippers, and the second-filed lawsuit alleged that FedEx Ground provided delivery services on behalf of six additional shippers; none of these shippers continue to ship in our network. On July 10, 2017, the City of New York and the State of New York filed a third lawsuit against FedEx Ground and included FedEx Freight as a co-defendant. This additional case identified no shippers or shipments, but generallyfor alleged violations of the same lawsstate’s environmental and hazardous waste regulations. Specifically, the District Attorney alleged that were the subject of the other two lawsuits.
- 20 -
FEDEX CORPORATION
NOTES TO CONDENSED CONSOLIDATED FINANCIAL STATEMENTS
(UNAUDITED)
On October 10,between 2015 and 2018, FedEx GroundFreight illegally transported and the Citystored hazardous waste, failed to report releases of hazardous materials or substances, and State of New Yorkunlawfully released oil into a storm drain. In September 2019, we reached an agreement in principle to settle the lawsuits arising from FedEx Ground’s and FedEx Freight’s alleged shipments of cigarettes to New York residentsthis matter for $35.4 million. The settlement does not include any admission of liability by FedEx Ground or FedEx Freight.an immaterial amount. In addition toOctober 2019, the settlement amount, we recognized approximately $10 million for certain attorney’s fees in connection with this matter. In December 2018, the parties entered into a final settlement agreement and, subsequently, the settlement amount was paid and the lawsuits were dismissedapproved by the court.
Other Matters. FedEx and its subsidiaries are subject to other legal proceedings that arise in the ordinary course of business, including certain lawsuits containing various class-action allegations of wage-and-hour violations in which plaintiffs claim, among other things, that they were forced to work “off the clock,” were not paid overtime or were not provided work breaks or other benefits. In the opinion of management, the aggregate liability, if any, with respect to these other actions will not have a material adverse effect on our financial position, results of operations or cash flows.
(10) - 20 -
FEDEX CORPORATION
NOTES TO CONDENSED CONSOLIDATED FINANCIAL STATEMENTS
(UNAUDITED)
(11) Supplemental Cash Flow Information
Cash paid for interest expense and income taxes for the nine-monthsix-month periods ended February 28November 30 was as follows (in millions):
|
| 2019 |
|
| 2018 |
|
| 2019 |
|
| 2018 |
| ||||
Cash payments for: |
|
|
|
|
|
|
|
|
|
|
|
|
|
|
|
|
Interest (net of capitalized interest) |
| $ | 498 |
|
| $ | 430 |
|
| $ | 279 |
|
| $ | 308 |
|
Income taxes |
| $ | 346 |
|
| $ | 707 |
|
| $ | 162 |
|
| $ | 220 |
|
Income tax refunds received |
|
| (34 | ) |
|
| (59 | ) |
|
| (23 | ) |
|
| (6 | ) |
Cash tax payments, net |
| $ | 312 |
|
| $ | 648 |
|
| $ | 139 |
|
| $ | 214 |
|
(11) - 21 -
FEDEX CORPORATION
NOTES TO CONDENSED CONSOLIDATED FINANCIAL STATEMENTS
(UNAUDITED)
(12) Condensed Consolidating Financial Statements
We are required to present condensed consolidating financial information in order for the subsidiary guarantors of our public debt to continue to be exempt from reporting under the Securities Exchange Act of 1934, as amended.
The guarantor subsidiaries, which are 100% owned by FedEx, guarantee $18.1$18.6 billion of our public debt. The guarantees are full and unconditional and joint and several. Our guarantor subsidiaries were not determined using geographic, service line or other similar criteria, and as a result, the “Guarantor Subsidiaries” and “Non-guarantor Subsidiaries” columns each include portions of our domestic and international operations. Accordingly, this basis of presentation is not intended to present our financial condition, results of operations or cash flows for any purpose other than to comply with the specific requirements for subsidiary guarantor reporting.
- 2122 -
Condensed consolidating financial statements for our guarantor subsidiaries and non-guarantor subsidiaries are presented in the following tables (in millions):
CONDENSED CONSOLIDATING BALANCE SHEETS
(UNAUDITED)
February 28,November 30, 2019
|
|
|
|
|
| Guarantor |
|
| Non-guarantor |
|
|
|
|
|
|
|
|
| ||
|
| Parent |
|
| Subsidiaries |
|
| Subsidiaries |
|
| Eliminations |
|
| Consolidated |
| |||||
ASSETS |
|
|
|
|
|
|
|
|
|
|
|
|
|
|
|
|
|
|
|
|
CURRENT ASSETS |
|
|
|
|
|
|
|
|
|
|
|
|
|
|
|
|
|
|
|
|
Cash and cash equivalents |
| $ | 1,413 |
|
| $ | 204 |
|
| $ | 1,296 |
|
| $ | (41 | ) |
| $ | 2,872 |
|
Receivables, less allowances |
|
| 45 |
|
|
| 5,474 |
|
|
| 3,600 |
|
|
| (82 | ) |
|
| 9,037 |
|
Spare parts, supplies, fuel, prepaid expenses and other, less allowances |
|
| 313 |
|
|
| 979 |
|
|
| 299 |
|
|
| — |
|
|
| 1,591 |
|
Total current assets |
|
| 1,771 |
|
|
| 6,657 |
|
|
| 5,195 |
|
|
| (123 | ) |
|
| 13,500 |
|
PROPERTY AND EQUIPMENT, AT COST |
|
| 23 |
|
|
| 53,997 |
|
|
| 4,144 |
|
|
| — |
|
|
| 58,164 |
|
Less accumulated depreciation and amortization |
|
| 17 |
|
|
| 26,384 |
|
|
| 1,995 |
|
|
| — |
|
|
| 28,396 |
|
Net property and equipment |
|
| 6 |
|
|
| 27,613 |
|
|
| 2,149 |
|
|
| — |
|
|
| 29,768 |
|
INTERCOMPANY RECEIVABLE |
|
| 661 |
|
|
| 2,157 |
|
|
| — |
|
|
| (2,818 | ) |
|
| — |
|
GOODWILL |
|
| — |
|
|
| 1,598 |
|
|
| 5,318 |
|
|
| — |
|
|
| 6,916 |
|
INVESTMENT IN SUBSIDIARIES |
|
| 35,803 |
|
|
| 4,904 |
|
|
| — |
|
|
| (40,707 | ) |
|
| — |
|
OTHER ASSETS |
|
| 891 |
|
|
| 1,670 |
|
|
| 1,857 |
|
|
| (138 | ) |
|
| 4,280 |
|
|
| $ | 39,132 |
|
| $ | 44,599 |
|
| $ | 14,519 |
|
| $ | (43,786 | ) |
| $ | 54,464 |
|
LIABILITIES AND COMMON STOCKHOLDERS’ INVESTMENT |
|
|
|
|
|
|
|
|
|
|
|
|
|
|
|
|
|
|
|
|
CURRENT LIABILITIES |
|
|
|
|
|
|
|
|
|
|
|
|
|
|
|
|
|
|
|
|
Short-term borrowings |
| $ | 225 |
|
| $ | — |
|
| $ | — |
|
| $ | — |
|
| $ | 225 |
|
Current portion of long-term debt |
|
| 966 |
|
|
| 2 |
|
|
| 5 |
|
|
| — |
|
|
| 973 |
|
Accrued salaries and employee benefits |
|
| 52 |
|
|
| 1,149 |
|
|
| 458 |
|
|
| — |
|
|
| 1,659 |
|
Accounts payable |
|
| 188 |
|
|
| 1,430 |
|
|
| 1,656 |
|
|
| (118 | ) |
|
| 3,156 |
|
Accrued expenses |
|
| 510 |
|
|
| 1,848 |
|
|
| 890 |
|
|
| (5 | ) |
|
| 3,243 |
|
Total current liabilities |
|
| 1,941 |
|
|
| 4,429 |
|
|
| 3,009 |
|
|
| (123 | ) |
|
| 9,256 |
|
LONG-TERM DEBT, LESS CURRENT PORTION |
|
| 16,921 |
|
|
| 287 |
|
|
| 10 |
|
|
| — |
|
|
| 17,218 |
|
INTERCOMPANY PAYABLE |
|
| — |
|
|
| — |
|
|
| 2,818 |
|
|
| (2,818 | ) |
|
| — |
|
OTHER LONG-TERM LIABILITIES |
|
|
|
|
|
|
|
|
|
|
|
|
|
|
|
|
|
|
|
|
Deferred income taxes |
|
| — |
|
|
| 3,252 |
|
|
| 97 |
|
|
| (138 | ) |
|
| 3,211 |
|
Other liabilities |
|
| 376 |
|
|
| 3,502 |
|
|
| 1,007 |
|
|
| — |
|
|
| 4,885 |
|
Total other long-term liabilities |
|
| 376 |
|
|
| 6,754 |
|
|
| 1,104 |
|
|
| (138 | ) |
|
| 8,096 |
|
COMMON STOCKHOLDERS’ INVESTMENT |
|
| 19,894 |
|
|
| 33,129 |
|
|
| 7,578 |
|
|
| (40,707 | ) |
|
| 19,894 |
|
|
| $ | 39,132 |
|
| $ | 44,599 |
|
| $ | 14,519 |
|
| $ | (43,786 | ) |
| $ | 54,464 |
|
|
|
|
|
|
|
|
|
|
|
|
|
|
|
|
|
|
|
|
|
|
- 22 -
CONDENSED CONSOLIDATING BALANCE SHEETS
May 31, 2018
|
|
|
|
|
| Guarantor |
|
| Non-guarantor |
|
|
|
|
|
|
|
|
|
|
|
|
|
| Guarantor |
|
| Non-guarantor |
|
|
|
|
|
|
|
|
| ||||
|
| Parent |
|
| Subsidiaries |
|
| Subsidiaries |
|
| Eliminations |
|
| Consolidated |
|
| Parent |
|
| Subsidiaries |
|
| Subsidiaries |
|
| Eliminations |
|
| Consolidated |
| ||||||||||
ASSETS |
|
|
|
|
|
|
|
|
|
|
|
|
|
|
|
|
|
|
|
|
|
|
|
|
|
|
|
|
|
|
|
|
|
|
|
|
|
|
|
|
CURRENT ASSETS |
|
|
|
|
|
|
|
|
|
|
|
|
|
|
|
|
|
|
|
|
|
|
|
|
|
|
|
|
|
|
|
|
|
|
|
|
|
|
|
|
Cash and cash equivalents |
| $ | 1,485 |
|
| $ | 257 |
|
| $ | 1,538 |
|
| $ | (15 | ) |
| $ | 3,265 |
|
| $ | 394 |
|
| $ | 236 |
|
| $ | 1,410 |
|
| $ | (9 | ) |
| $ | 2,031 |
|
Receivables, less allowances |
|
| 3 |
|
|
| 4,970 |
|
|
| 3,586 |
|
|
| (78 | ) |
|
| 8,481 |
|
|
| 348 |
|
|
| 5,698 |
|
|
| 3,762 |
|
|
| (99 | ) |
|
| 9,709 |
|
Spare parts, supplies, fuel, prepaid expenses and other, less allowances |
|
| 425 |
|
|
| 878 |
|
|
| 292 |
|
|
| — |
|
|
| 1,595 |
|
|
| 128 |
|
|
| 932 |
|
|
| 398 |
|
|
| — |
|
|
| 1,458 |
|
Total current assets |
|
| 1,913 |
|
|
| 6,105 |
|
|
| 5,416 |
|
|
| (93 | ) |
|
| 13,341 |
|
|
| 870 |
|
|
| 6,866 |
|
|
| 5,570 |
|
|
| (108 | ) |
|
| 13,198 |
|
PROPERTY AND EQUIPMENT, AT COST |
|
| 21 |
|
|
| 51,232 |
|
|
| 3,868 |
|
|
| — |
|
|
| 55,121 |
|
|
| 27 |
|
|
| 58,286 |
|
|
| 4,402 |
|
|
| — |
|
|
| 62,715 |
|
Less accumulated depreciation and amortization |
|
| 17 |
|
|
| 25,111 |
|
|
| 1,839 |
|
|
| — |
|
|
| 26,967 |
|
|
| 17 |
|
|
| 28,139 |
|
|
| 2,151 |
|
|
| — |
|
|
| 30,307 |
|
Net property and equipment |
|
| 4 |
|
|
| 26,121 |
|
|
| 2,029 |
|
|
| — |
|
|
| 28,154 |
|
|
| 10 |
|
|
| 30,147 |
|
|
| 2,251 |
|
|
| — |
|
|
| 32,408 |
|
INTERCOMPANY RECEIVABLE |
|
| 1,487 |
|
|
| 924 |
|
|
| — |
|
|
| (2,411 | ) |
|
| — |
|
|
| 3,181 |
|
|
| — |
|
|
| — |
|
|
| (3,181 | ) |
|
| — |
|
OPERATING LEASE RIGHT-OF-USE ASSETS, NET |
|
| 39 |
|
|
| 11,844 |
|
|
| 2,214 |
|
|
| — |
|
|
| 14,097 |
| ||||||||||||||||||||
GOODWILL |
|
| — |
|
|
| 1,709 |
|
|
| 5,264 |
|
|
| — |
|
|
| 6,973 |
|
|
| — |
|
|
| 1,587 |
|
|
| 5,274 |
|
|
| — |
|
|
| 6,861 |
|
INVESTMENT IN SUBSIDIARIES |
|
| 33,370 |
|
|
| 4,082 |
|
|
| — |
|
|
| (37,452 | ) |
|
| — |
|
|
| 35,086 |
|
|
| 4,982 |
|
|
| — |
|
|
| (40,068 | ) |
|
| — |
|
OTHER ASSETS |
|
| 75 |
|
|
| 1,854 |
|
|
| 1,829 |
|
|
| 104 |
|
|
| 3,862 |
|
|
| 953 |
|
|
| 1,141 |
|
|
| 1,820 |
|
|
| (524 | ) |
|
| 3,390 |
|
|
| $ | 36,849 |
|
| $ | 40,795 |
|
| $ | 14,538 |
|
| $ | (39,852 | ) |
| $ | 52,330 |
|
| $ | 40,139 |
|
| $ | 56,567 |
|
| $ | 17,129 |
|
| $ | (43,881 | ) |
| $ | 69,954 |
|
LIABILITIES AND COMMON STOCKHOLDERS’ INVESTMENT |
|
|
|
|
|
|
|
|
|
|
|
|
|
|
|
|
|
|
|
|
|
|
|
|
|
|
|
|
|
|
|
|
|
|
|
|
|
|
|
|
CURRENT LIABILITIES |
|
|
|
|
|
|
|
|
|
|
|
|
|
|
|
|
|
|
|
|
|
|
|
|
|
|
|
|
|
|
|
|
|
|
|
|
|
|
|
|
Short-term borrowings |
| $ | 150 |
|
| $ | — |
|
| $ | — |
|
| $ | — |
|
| $ | 150 |
| ||||||||||||||||||||
Current portion of long-term debt |
| $ | 1,332 |
|
| $ | 1 |
|
| $ | 9 |
|
| $ | — |
|
| $ | 1,342 |
|
|
| — |
|
|
| 5 |
|
|
| 11 |
|
|
| — |
|
|
| 16 |
|
Accrued salaries and employee benefits |
|
| 65 |
|
|
| 1,506 |
|
|
| 606 |
|
|
| — |
|
|
| 2,177 |
|
|
| 87 |
|
|
| 1,058 |
|
|
| 487 |
|
|
| — |
|
|
| 1,632 |
|
Accounts payable |
|
| 16 |
|
|
| 1,332 |
|
|
| 1,719 |
|
|
| (90 | ) |
|
| 2,977 |
|
|
| 192 |
|
|
| 1,505 |
|
|
| 1,692 |
|
|
| (106 | ) |
|
| 3,283 |
|
Operating lease liabilities |
|
| 4 |
|
|
| 1,476 |
|
|
| 448 |
|
|
| — |
|
|
| 1,928 |
| ||||||||||||||||||||
Accrued expenses |
|
| 460 |
|
|
| 1,778 |
|
|
| 896 |
|
|
| (3 | ) |
|
| 3,131 |
|
|
| 509 |
|
|
| 2,023 |
|
|
| 1,008 |
|
|
| (2 | ) |
|
| 3,538 |
|
Total current liabilities |
|
| 1,873 |
|
|
| 4,617 |
|
|
| 3,230 |
|
|
| (93 | ) |
|
| 9,627 |
|
|
| 942 |
|
|
| 6,067 |
|
|
| 3,646 |
|
|
| (108 | ) |
|
| 10,547 |
|
LONG-TERM DEBT, LESS CURRENT PORTION |
|
| 14,942 |
|
|
| 288 |
|
|
| 13 |
|
|
| — |
|
|
| 15,243 |
|
|
| 18,362 |
|
|
| 286 |
|
|
| 43 |
|
|
| — |
|
|
| 18,691 |
|
INTERCOMPANY PAYABLE |
|
| — |
|
|
| — |
|
|
| 2,411 |
|
|
| (2,411 | ) |
|
| — |
|
|
| — |
|
|
| 58 |
|
|
| 3,123 |
|
|
| (3,181 | ) |
|
| — |
|
OTHER LONG-TERM LIABILITIES |
|
|
|
|
|
|
|
|
|
|
|
|
|
|
|
|
|
|
|
|
|
|
|
|
|
|
|
|
|
|
|
|
|
|
|
|
|
|
|
|
Deferred income taxes |
|
| — |
|
|
| 2,626 |
|
|
| 137 |
|
|
| 104 |
|
|
| 2,867 |
|
|
| — |
|
|
| 3,013 |
|
|
| 583 |
|
|
| (524 | ) |
|
| 3,072 |
|
Operating lease liabilities |
|
| 37 |
|
|
| 10,577 |
|
|
| 1,818 |
|
|
| — |
|
|
| 12,432 |
| ||||||||||||||||||||
Other liabilities |
|
| 619 |
|
|
| 3,432 |
|
|
| 1,126 |
|
|
| — |
|
|
| 5,177 |
|
|
| 2,139 |
|
|
| 3,439 |
|
|
| 975 |
|
|
| — |
|
|
| 6,553 |
|
Total other long-term liabilities |
|
| 619 |
|
|
| 6,058 |
|
|
| 1,263 |
|
|
| 104 |
|
|
| 8,044 |
|
|
| 2,176 |
|
|
| 17,029 |
|
|
| 3,376 |
|
|
| (524 | ) |
|
| 22,057 |
|
COMMON STOCKHOLDERS’ INVESTMENT |
|
| 19,415 |
|
|
| 29,832 |
|
|
| 7,621 |
|
|
| (37,452 | ) |
|
| 19,416 |
|
|
| 18,659 |
|
|
| 33,127 |
|
|
| 6,941 |
|
|
| (40,068 | ) |
|
| 18,659 |
|
|
| $ | 36,849 |
|
| $ | 40,795 |
|
| $ | 14,538 |
|
| $ | (39,852 | ) |
| $ | 52,330 |
|
| $ | 40,139 |
|
| $ | 56,567 |
|
| $ | 17,129 |
|
| $ | (43,881 | ) |
| $ | 69,954 |
|
|
|
|
|
|
|
|
|
|
|
|
|
|
|
|
|
|
|
|
|
| ||||||||||||||||||||
- 23 -
CONDENSED CONSOLIDATING STATEMENTS OF COMPREHENSIVE INCOMEBALANCE SHEETS
(UNAUDITED)
Three Months Ended February 28,May 31, 2019
|
| Parent |
|
| Guarantor Subsidiaries |
|
| Non-guarantor Subsidiaries |
|
| Eliminations |
|
| Consolidated |
| |||||
REVENUES |
| $ | — |
|
| $ | 12,443 |
|
| $ | 4,667 |
|
| $ | (100 | ) |
| $ | 17,010 |
|
OPERATING EXPENSES: |
|
|
|
|
|
|
|
|
|
|
|
|
|
|
|
|
|
|
|
|
Salaries and employee benefits |
|
| 28 |
|
|
| 4,720 |
|
|
| 1,321 |
|
|
| — |
|
|
| 6,069 |
|
Purchased transportation |
|
| — |
|
|
| 2,749 |
|
|
| 1,547 |
|
|
| (43 | ) |
|
| 4,253 |
|
Rentals and landing fees |
|
| 1 |
|
|
| 677 |
|
|
| 197 |
|
|
| (1 | ) |
|
| 874 |
|
Depreciation and amortization |
|
| — |
|
|
| 731 |
|
|
| 120 |
|
|
| — |
|
|
| 851 |
|
Fuel |
|
| — |
|
|
| 838 |
|
|
| 69 |
|
|
| — |
|
|
| 907 |
|
Maintenance and repairs |
|
| — |
|
|
| 573 |
|
|
| 87 |
|
|
| (2 | ) |
|
| 658 |
|
Business realignment costs |
|
| 4 |
|
|
| — |
|
|
| — |
|
|
| — |
|
|
| 4 |
|
Intercompany charges, net |
|
| (93 | ) |
|
| (397 | ) |
|
| 490 |
|
|
| — |
|
|
| — |
|
Other |
|
| 60 |
|
|
| 1,771 |
|
|
| 698 |
|
|
| (46 | ) |
|
| 2,483 |
|
|
|
| — |
|
|
| 11,662 |
|
|
| 4,529 |
|
|
| (92 | ) |
|
| 16,099 |
|
OPERATING INCOME |
|
| — |
|
|
| 781 |
|
|
| 138 |
|
|
| (8 | ) |
|
| 911 |
|
OTHER INCOME (EXPENSE): |
|
|
|
|
|
|
|
|
|
|
|
|
|
|
|
|
|
|
|
|
Equity in earnings of subsidiaries |
|
| 739 |
|
|
| 16 |
|
|
| — |
|
|
| (755 | ) |
|
| — |
|
Interest, net |
|
| (109 | ) |
|
| (54 | ) |
|
| 28 |
|
|
| — |
|
|
| (135 | ) |
Other retirement plans income |
|
| — |
|
|
| 155 |
|
|
| 3 |
|
|
| — |
|
|
| 158 |
|
Intercompany charges, net |
|
| 149 |
|
|
| (89 | ) |
|
| (60 | ) |
|
| — |
|
|
| — |
|
Other, net |
|
| (40 | ) |
|
| 71 |
|
|
| (42 | ) |
|
| 8 |
|
|
| (3 | ) |
INCOME BEFORE INCOME TAXES |
|
| 739 |
|
|
| 880 |
|
|
| 67 |
|
|
| (755 | ) |
|
| 931 |
|
Provision for income taxes |
|
| — |
|
|
| 147 |
|
|
| 45 |
|
|
| — |
|
|
| 192 |
|
NET INCOME |
| $ | 739 |
|
| $ | 733 |
|
| $ | 22 |
|
| $ | (755 | ) |
| $ | 739 |
|
COMPREHENSIVE INCOME |
| $ | 713 |
|
| $ | 732 |
|
| $ | 129 |
|
| $ | (755 | ) |
| $ | 819 |
|
|
|
|
|
|
| Guarantor |
|
| Non-guarantor |
|
|
|
|
|
|
|
|
| ||
|
| Parent |
|
| Subsidiaries |
|
| Subsidiaries |
|
| Eliminations |
|
| Consolidated |
| |||||
ASSETS |
|
|
|
|
|
|
|
|
|
|
|
|
|
|
|
|
|
|
|
|
CURRENT ASSETS |
|
|
|
|
|
|
|
|
|
|
|
|
|
|
|
|
|
|
|
|
Cash and cash equivalents |
| $ | 826 |
|
| $ | 158 |
|
| $ | 1,381 |
|
| $ | (46 | ) |
| $ | 2,319 |
|
Receivables, less allowances |
|
| 56 |
|
|
| 5,603 |
|
|
| 3,684 |
|
|
| (227 | ) |
|
| 9,116 |
|
Spare parts, supplies, fuel, prepaid expenses and other, less allowances |
|
| 366 |
|
|
| 953 |
|
|
| 332 |
|
|
| — |
|
|
| 1,651 |
|
Total current assets |
|
| 1,248 |
|
|
| 6,714 |
|
|
| 5,397 |
|
|
| (273 | ) |
|
| 13,086 |
|
PROPERTY AND EQUIPMENT, AT COST |
|
| 25 |
|
|
| 55,341 |
|
|
| 4,145 |
|
|
| — |
|
|
| 59,511 |
|
Less accumulated depreciation and amortization |
|
| 17 |
|
|
| 27,066 |
|
|
| 1,999 |
|
|
| — |
|
|
| 29,082 |
|
Net property and equipment |
|
| 8 |
|
|
| 28,275 |
|
|
| 2,146 |
|
|
| — |
|
|
| 30,429 |
|
INTERCOMPANY RECEIVABLE |
|
| 2,877 |
|
|
| (405 | ) |
|
| — |
|
|
| (2,472 | ) |
|
| — |
|
GOODWILL |
|
| — |
|
|
| 1,589 |
|
|
| 5,295 |
|
|
| — |
|
|
| 6,884 |
|
INVESTMENT IN SUBSIDIARIES |
|
| 33,725 |
|
|
| 5,449 |
|
|
| — |
|
|
| (39,174 | ) |
|
| — |
|
OTHER ASSETS |
|
| 995 |
|
|
| 1,811 |
|
|
| 1,789 |
|
|
| (591 | ) |
|
| 4,004 |
|
|
| $ | 38,853 |
|
| $ | 43,433 |
|
| $ | 14,627 |
|
| $ | (42,510 | ) |
| $ | 54,403 |
|
LIABILITIES AND COMMON STOCKHOLDERS’ INVESTMENT |
|
|
|
|
|
|
|
|
|
|
|
|
|
|
|
|
|
|
|
|
CURRENT LIABILITIES |
|
|
|
|
|
|
|
|
|
|
|
|
|
|
|
|
|
|
|
|
Current portion of long-term debt |
| $ | 959 |
|
| $ | 2 |
|
| $ | 3 |
|
| $ | — |
|
| $ | 964 |
|
Accrued salaries and employee benefits |
|
| 143 |
|
|
| 1,100 |
|
|
| 498 |
|
|
| — |
|
|
| 1,741 |
|
Accounts payable |
|
| 16 |
|
|
| 1,469 |
|
|
| 1,808 |
|
|
| (263 | ) |
|
| 3,030 |
|
Accrued expenses |
|
| 521 |
|
|
| 1,853 |
|
|
| 914 |
|
|
| (10 | ) |
|
| 3,278 |
|
Total current liabilities |
|
| 1,639 |
|
|
| 4,424 |
|
|
| 3,223 |
|
|
| (273 | ) |
|
| 9,013 |
|
LONG-TERM DEBT, LESS CURRENT PORTION |
|
| 16,322 |
|
|
| 287 |
|
|
| 8 |
|
|
| — |
|
|
| 16,617 |
|
INTERCOMPANY PAYABLE |
|
| — |
|
|
| — |
|
|
| 2,472 |
|
|
| (2,472 | ) |
|
| — |
|
OTHER LONG-TERM LIABILITIES |
|
|
|
|
|
|
|
|
|
|
|
|
|
|
|
|
|
|
|
|
Deferred income taxes |
|
| — |
|
|
| 2,832 |
|
|
| 580 |
|
|
| (591 | ) |
|
| 2,821 |
|
Other liabilities |
|
| 3,135 |
|
|
| 3,965 |
|
|
| 1,095 |
|
|
| — |
|
|
| 8,195 |
|
Total other long-term liabilities |
|
| 3,135 |
|
|
| 6,797 |
|
|
| 1,675 |
|
|
| (591 | ) |
|
| 11,016 |
|
COMMON STOCKHOLDERS’ INVESTMENT |
|
| 17,757 |
|
|
| 31,925 |
|
|
| 7,249 |
|
|
| (39,174 | ) |
|
| 17,757 |
|
|
| $ | 38,853 |
|
| $ | 43,433 |
|
| $ | 14,627 |
|
| $ | (42,510 | ) |
| $ | 54,403 |
|
- 24 -
CONDENSED CONSOLIDATING STATEMENTS OF COMPREHENSIVE INCOME
(UNAUDITED)
Three Months Ended February 28, 2018
|
| Parent |
|
| Guarantor Subsidiaries |
|
| Non-guarantor Subsidiaries |
|
| Eliminations |
|
| Consolidated |
| |||||
REVENUES |
| $ | — |
|
| $ | 12,433 |
|
| $ | 4,229 |
|
| $ | (136 | ) |
| $ | 16,526 |
|
OPERATING EXPENSES: |
|
|
|
|
|
|
|
|
|
|
|
|
|
|
|
|
|
|
|
|
Salaries and employee benefits |
|
| 39 |
|
|
| 4,764 |
|
|
| 1,321 |
|
|
| — |
|
|
| 6,124 |
|
Purchased transportation |
|
| — |
|
|
| 2,459 |
|
|
| 1,560 |
|
|
| (84 | ) |
|
| 3,935 |
|
Rentals and landing fees |
|
| 2 |
|
|
| 684 |
|
|
| 189 |
|
|
| (2 | ) |
|
| 873 |
|
Depreciation and amortization |
|
| 1 |
|
|
| 670 |
|
|
| 115 |
|
|
| — |
|
|
| 786 |
|
Fuel |
|
| — |
|
|
| 837 |
|
|
| 77 |
|
|
| — |
|
|
| 914 |
|
Maintenance and repairs |
|
| 1 |
|
|
| 543 |
|
|
| 84 |
|
|
| — |
|
|
| 628 |
|
Intercompany charges, net |
|
| (114 | ) |
|
| 185 |
|
|
| (71 | ) |
|
| — |
|
|
| — |
|
Other |
|
| 71 |
|
|
| 1,596 |
|
|
| 791 |
|
|
| (50 | ) |
|
| 2,408 |
|
|
|
| — |
|
|
| 11,738 |
|
|
| 4,066 |
|
|
| (136 | ) |
|
| 15,668 |
|
OPERATING INCOME |
|
| — |
|
|
| 695 |
|
|
| 163 |
|
|
| — |
|
|
| 858 |
|
OTHER INCOME (EXPENSE): |
|
|
|
|
|
|
|
|
|
|
|
|
|
|
|
|
|
|
|
|
Equity in earnings of subsidiaries |
|
| 2,074 |
|
|
| 2 |
|
|
| — |
|
|
| (2,076 | ) |
|
| — |
|
Interest, net |
|
| (137 | ) |
|
| 11 |
|
|
| 1 |
|
|
| — |
|
|
| (125 | ) |
Other retirement plans income |
|
| — |
|
|
| 141 |
|
|
| 2 |
|
|
| — |
|
|
| 143 |
|
Intercompany charges, net |
|
| 140 |
|
|
| (78 | ) |
|
| (62 | ) |
|
| — |
|
|
| — |
|
Other, net |
|
| (3 | ) |
|
| 104 |
|
|
| (103 | ) |
|
| — |
|
|
| (2 | ) |
INCOME BEFORE INCOME TAXES |
|
| 2,074 |
|
|
| 875 |
|
|
| 1 |
|
|
| (2,076 | ) |
|
| 874 |
|
Provision for income taxes |
|
| — |
|
|
| (1,197 | ) |
|
| (3 | ) |
|
| — |
|
|
| (1,200 | ) |
NET INCOME |
| $ | 2,074 |
|
| $ | 2,072 |
|
| $ | 4 |
|
| $ | (2,076 | ) |
| $ | 2,074 |
|
COMPREHENSIVE INCOME |
| $ | 2,051 |
|
| $ | 2,069 |
|
| $ | 107 |
|
| $ | (2,076 | ) |
| $ | 2,151 |
|
- 25 -
CONDENSED CONSOLIDATING STATEMENTS OF COMPREHENSIVE INCOME
(UNAUDITED)
Nine Months Ended February 28, 2019
|
| Parent |
|
| Guarantor Subsidiaries |
|
| Non-guarantor Subsidiaries |
|
| Eliminations |
|
| Consolidated |
| |||||
REVENUES |
| $ | — |
|
| $ | 37,685 |
|
| $ | 14,503 |
|
| $ | (302 | ) |
| $ | 51,886 |
|
OPERATING EXPENSES: |
|
|
|
|
|
|
|
|
|
|
|
|
|
|
|
|
|
|
|
|
Salaries and employee benefits |
|
| 110 |
|
|
| 14,300 |
|
|
| 4,179 |
|
|
| — |
|
|
| 18,589 |
|
Purchased transportation |
|
| — |
|
|
| 7,780 |
|
|
| 4,912 |
|
|
| (126 | ) |
|
| 12,566 |
|
Rentals and landing fees |
|
| 4 |
|
|
| 1,948 |
|
|
| 585 |
|
|
| (4 | ) |
|
| 2,533 |
|
Depreciation and amortization |
|
| 1 |
|
|
| 2,133 |
|
|
| 353 |
|
|
| — |
|
|
| 2,487 |
|
Fuel |
|
| — |
|
|
| 2,708 |
|
|
| 237 |
|
|
| — |
|
|
| 2,945 |
|
Maintenance and repairs |
|
| 1 |
|
|
| 1,874 |
|
|
| 271 |
|
|
| (2 | ) |
|
| 2,144 |
|
Business realignment costs |
|
| 4 |
|
|
| — |
|
|
| — |
|
|
| — |
|
|
| 4 |
|
Intercompany charges, net |
|
| (357 | ) |
|
| (772 | ) |
|
| 1,129 |
|
|
| — |
|
|
| — |
|
Other |
|
| 238 |
|
|
| 4,991 |
|
|
| 2,410 |
|
|
| (171 | ) |
|
| 7,468 |
|
|
|
| 1 |
|
|
| 34,962 |
|
|
| 14,076 |
|
|
| (303 | ) |
|
| 48,736 |
|
OPERATING INCOME |
|
| (1 | ) |
|
| 2,723 |
|
|
| 427 |
|
|
| 1 |
|
|
| 3,150 |
|
OTHER INCOME (EXPENSE): |
|
|
|
|
|
|
|
|
|
|
|
|
|
|
|
|
|
|
|
|
Equity in earnings of subsidiaries |
|
| 2,509 |
|
|
| 145 |
|
|
| — |
|
|
| (2,654 | ) |
|
| — |
|
Interest, net |
|
| (439 | ) |
|
| 44 |
|
|
| 2 |
|
|
| — |
|
|
| (393 | ) |
Other retirement plans income |
|
| — |
|
|
| 466 |
|
|
| 8 |
|
|
| — |
|
|
| 474 |
|
Intercompany charges, net |
|
| 454 |
|
|
| (335 | ) |
|
| (119 | ) |
|
| — |
|
|
| — |
|
Other, net |
|
| (14 | ) |
|
| 18 |
|
|
| (26 | ) |
|
| — |
|
|
| (22 | ) |
INCOME BEFORE INCOME TAXES |
|
| 2,509 |
|
|
| 3,061 |
|
|
| 292 |
|
|
| (2,653 | ) |
|
| 3,209 |
|
Provision for income taxes |
|
| — |
|
|
| 579 |
|
|
| 121 |
|
|
| — |
|
|
| 700 |
|
NET INCOME |
| $ | 2,509 |
|
| $ | 2,482 |
|
| $ | 171 |
|
| $ | (2,653 | ) |
| $ | 2,509 |
|
COMPREHENSIVE INCOME |
| $ | 2,443 |
|
| $ | 2,514 |
|
| $ | 46 |
|
| $ | (2,653 | ) |
| $ | 2,350 |
|
- 26 -
CONDENSED CONSOLIDATING STATEMENTS OF COMPREHENSIVE INCOME
(UNAUDITED)
NineThree Months Ended February 28,November 30, 2019
|
| Parent |
|
| Guarantor Subsidiaries |
|
| Non-guarantor Subsidiaries |
|
| Eliminations |
|
| Consolidated |
| |||||
REVENUES |
| $ | — |
|
| $ | 12,307 |
|
| $ | 5,110 |
|
| $ | (93 | ) |
| $ | 17,324 |
|
OPERATING EXPENSES: |
|
|
|
|
|
|
|
|
|
|
|
|
|
|
|
|
|
|
|
|
Salaries and employee benefits |
|
| 22 |
|
|
| 4,823 |
|
|
| 1,390 |
|
|
| — |
|
|
| 6,235 |
|
Purchased transportation |
|
| — |
|
|
| 2,865 |
|
|
| 1,505 |
|
|
| (42 | ) |
|
| 4,328 |
|
Rentals and landing fees |
|
| 2 |
|
|
| 715 |
|
|
| 209 |
|
|
| (2 | ) |
|
| 924 |
|
Depreciation and amortization |
|
| — |
|
|
| 785 |
|
|
| 116 |
|
|
| — |
|
|
| 901 |
|
Fuel |
|
| — |
|
|
| 846 |
|
|
| 44 |
|
|
| — |
|
|
| 890 |
|
Maintenance and repairs |
|
| — |
|
|
| 685 |
|
|
| 89 |
|
|
| — |
|
|
| 774 |
|
Asset impairment charges |
|
| — |
|
|
| 66 |
|
|
| — |
|
|
| — |
|
|
| 66 |
|
Intercompany charges, net |
|
| (77 | ) |
|
| (622 | ) |
|
| 699 |
|
|
| — |
|
|
| — |
|
Other |
|
| 53 |
|
|
| 1,752 |
|
|
| 896 |
|
|
| (49 | ) |
|
| 2,652 |
|
|
|
| — |
|
|
| 11,915 |
|
|
| 4,948 |
|
|
| (93 | ) |
|
| 16,770 |
|
OPERATING INCOME |
|
| — |
|
|
| 392 |
|
|
| 162 |
|
|
| — |
|
|
| 554 |
|
OTHER (EXPENSE) INCOME: |
|
|
|
|
|
|
|
|
|
|
|
|
|
|
|
|
|
|
|
|
Equity in earnings of subsidiaries |
|
| 560 |
|
|
| 26 |
|
|
| — |
|
|
| (586 | ) |
|
| — |
|
Interest, net |
|
| (164 | ) |
|
| 8 |
|
|
| 5 |
|
|
| — |
|
|
| (151 | ) |
Other retirement plans income |
|
| — |
|
|
| 163 |
|
|
| 5 |
|
|
| — |
|
|
| 168 |
|
Intercompany charges, net |
|
| 161 |
|
|
| (117 | ) |
|
| (44 | ) |
|
| — |
|
|
| — |
|
Other, net |
|
| 3 |
|
|
| 12 |
|
|
| (14 | ) |
|
| — |
|
|
| 1 |
|
INCOME (LOSS) BEFORE INCOME TAXES |
|
| 560 |
|
|
| 484 |
|
|
| 114 |
|
|
| (586 | ) |
|
| 572 |
|
Provision for income taxes (benefit) |
|
| — |
|
|
| 81 |
|
|
| (69 | ) |
|
| — |
|
|
| 12 |
|
NET INCOME (LOSS) |
| $ | 560 |
|
| $ | 403 |
|
| $ | 183 |
|
| $ | (586 | ) |
| $ | 560 |
|
COMPREHENSIVE INCOME (LOSS) |
| $ | 540 |
|
| $ | 380 |
|
| $ | 278 |
|
| $ | (586 | ) |
| $ | 612 |
|
- 25 -
CONDENSED CONSOLIDATING STATEMENTS OF COMPREHENSIVE INCOME
(UNAUDITED)
Three Months Ended November 30, 2018
|
| Parent |
|
| Guarantor Subsidiaries |
|
| Non-guarantor Subsidiaries |
|
| Eliminations |
|
| Consolidated |
|
| Parent |
|
| Guarantor Subsidiaries |
|
| Non-guarantor Subsidiaries |
|
| Eliminations |
|
| Consolidated |
| ||||||||||
REVENUES |
| $ | — |
|
| $ | 36,044 |
|
| $ | 12,445 |
|
| $ | (353 | ) |
| $ | 48,136 |
|
| $ | — |
|
| $ | 12,874 |
|
| $ | 5,050 |
|
| $ | (100 | ) |
| $ | 17,824 |
|
OPERATING EXPENSES: |
|
|
|
|
|
|
|
|
|
|
|
|
|
|
|
|
|
|
|
|
|
|
|
|
|
|
|
|
|
|
|
|
|
|
|
|
|
|
|
|
Salaries and employee benefits |
|
| 112 |
|
|
| 13,713 |
|
|
| 3,852 |
|
|
| — |
|
|
| 17,677 |
|
|
| 34 |
|
|
| 4,797 |
|
|
| 1,429 |
|
|
| — |
|
|
| 6,260 |
|
Purchased transportation |
|
| — |
|
|
| 6,836 |
|
|
| 4,600 |
|
|
| (216 | ) |
|
| 11,220 |
|
|
| — |
|
|
| 2,650 |
|
|
| 1,731 |
|
|
| (35 | ) |
|
| 4,346 |
|
Rentals and landing fees |
|
| 4 |
|
|
| 1,951 |
|
|
| 577 |
|
|
| (6 | ) |
|
| 2,526 |
|
|
| 1 |
|
|
| 640 |
|
|
| 196 |
|
|
| (1 | ) |
|
| 836 |
|
Depreciation and amortization |
|
| 1 |
|
|
| 1,958 |
|
|
| 334 |
|
|
| — |
|
|
| 2,293 |
|
|
| — |
|
|
| 709 |
|
|
| 119 |
|
|
| — |
|
|
| 828 |
|
Fuel |
|
| — |
|
|
| 2,220 |
|
|
| 215 |
|
|
| — |
|
|
| 2,435 |
|
|
| — |
|
|
| 968 |
|
|
| 84 |
|
| �� | — |
|
|
| 1,052 |
|
Maintenance and repairs |
|
| 1 |
|
|
| 1,729 |
|
|
| 238 |
|
|
| — |
|
|
| 1,968 |
|
|
| — |
|
|
| 655 |
|
|
| 96 |
|
|
| — |
|
|
| 751 |
|
Intercompany charges, net |
|
| (325 | ) |
|
| 298 |
|
|
| 27 |
|
|
| — |
|
|
| — |
|
|
| (152 | ) |
|
| (149 | ) |
|
| 301 |
|
|
| — |
|
|
| — |
|
Other |
|
| 207 |
|
|
| 4,664 |
|
|
| 2,333 |
|
|
| (131 | ) |
|
| 7,073 |
|
|
| 117 |
|
|
| 1,675 |
|
|
| 863 |
|
|
| (72 | ) |
|
| 2,583 |
|
|
|
| — |
|
|
| 33,369 |
|
|
| 12,176 |
|
|
| (353 | ) |
|
| 45,192 |
|
|
| — |
|
|
| 11,945 |
|
|
| 4,819 |
|
|
| (108 | ) |
|
| 16,656 |
|
OPERATING INCOME |
|
| — |
|
|
| 2,675 |
|
|
| 269 |
|
|
| — |
|
|
| 2,944 |
|
|
| — |
|
|
| 929 |
|
|
| 231 |
|
|
| 8 |
|
|
| 1,168 |
|
OTHER INCOME (EXPENSE): |
|
|
|
|
|
|
|
|
|
|
|
|
|
|
|
|
|
|
|
| ||||||||||||||||||||
OTHER (EXPENSE) INCOME: |
|
|
|
|
|
|
|
|
|
|
|
|
|
|
|
|
|
|
|
| ||||||||||||||||||||
Equity in earnings of subsidiaries |
|
| 3,445 |
|
|
| 39 |
|
|
| — |
|
|
| (3,484 | ) |
|
| — |
|
|
| 935 |
|
|
| 48 |
|
|
| — |
|
|
| (983 | ) |
|
| — |
|
Interest, net |
|
| (396 | ) |
|
| 35 |
|
|
| (2 | ) |
|
| — |
|
|
| (363 | ) |
|
| (169 | ) |
|
| 50 |
|
|
| (12 | ) |
|
| — |
|
|
| (131 | ) |
Other retirement plans income |
|
| — |
|
|
| 424 |
|
|
| 12 |
|
|
| — |
|
|
| 436 |
|
|
| — |
|
|
| 155 |
|
|
| 3 |
|
|
| — |
|
|
| 158 |
|
Intercompany charges, net |
|
| 403 |
|
|
| (220 | ) |
|
| (183 | ) |
|
| — |
|
|
| — |
|
|
| 162 |
|
|
| (124 | ) |
|
| (38 | ) |
|
| — |
|
|
| — |
|
Other, net |
|
| (7 | ) |
|
| 88 |
|
|
| (103 | ) |
|
| — |
|
|
| (22 | ) |
|
| 7 |
|
|
| (9 | ) |
|
| (7 | ) |
|
| (9 | ) |
|
| (18 | ) |
INCOME BEFORE INCOME TAXES |
|
| 3,445 |
|
|
| 3,041 |
|
|
| (7 | ) |
|
| (3,484 | ) |
|
| 2,995 |
| ||||||||||||||||||||
INCOME (LOSS) BEFORE INCOME TAXES |
|
| 935 |
|
|
| 1,049 |
|
|
| 177 |
|
|
| (984 | ) |
|
| 1,177 |
| ||||||||||||||||||||
Provision for income taxes |
|
| — |
|
|
| (573 | ) |
|
| 123 |
|
|
| — |
|
|
| (450 | ) |
|
| — |
|
|
| 217 |
|
|
| 25 |
|
|
| — |
|
|
| 242 |
|
NET INCOME |
| $ | 3,445 |
|
| $ | 3,614 |
|
| $ | (130 | ) |
| $ | (3,484 | ) |
| $ | 3,445 |
| ||||||||||||||||||||
COMPREHENSIVE INCOME |
| $ | 3,385 |
|
| $ | 3,605 |
|
| $ | (3 | ) |
| $ | (3,484 | ) |
| $ | 3,503 |
| ||||||||||||||||||||
NET INCOME (LOSS) |
| $ | 935 |
|
| $ | 832 |
|
| $ | 152 |
|
| $ | (984 | ) |
| $ | 935 |
| ||||||||||||||||||||
COMPREHENSIVE INCOME (LOSS) |
| $ | 912 |
|
| $ | 819 |
|
| $ | 133 |
|
| $ | (983 | ) |
| $ | 881 |
| ||||||||||||||||||||
- 26 -
CONDENSED CONSOLIDATING STATEMENTS OF COMPREHENSIVE INCOME
(UNAUDITED)
Six Months Ended November 30, 2019
|
| Parent |
|
| Guarantor Subsidiaries |
|
| Non-guarantor Subsidiaries |
|
| Eliminations |
|
| Consolidated |
| |||||
REVENUES |
| $ | — |
|
| $ | 24,549 |
|
| $ | 10,002 |
|
| $ | (179 | ) |
| $ | 34,372 |
|
OPERATING EXPENSES: |
|
|
|
|
|
|
|
|
|
|
|
|
|
|
|
|
|
|
|
|
Salaries and employee benefits |
|
| 42 |
|
|
| 9,507 |
|
|
| 2,773 |
|
|
| — |
|
|
| 12,322 |
|
Purchased transportation |
|
| — |
|
|
| 5,408 |
|
|
| 3,025 |
|
|
| (77 | ) |
|
| 8,356 |
|
Rentals and landing fees |
|
| 4 |
|
|
| 1,426 |
|
|
| 417 |
|
|
| (3 | ) |
|
| 1,844 |
|
Depreciation and amortization |
|
| — |
|
|
| 1,547 |
|
|
| 233 |
|
|
| — |
|
|
| 1,780 |
|
Fuel |
|
| — |
|
|
| 1,658 |
|
|
| 102 |
|
|
| — |
|
|
| 1,760 |
|
Maintenance and repairs |
|
| 1 |
|
|
| 1,368 |
|
|
| 173 |
|
|
| — |
|
|
| 1,542 |
|
Asset impairment charges |
|
| — |
|
|
| 66 |
|
|
| — |
|
|
| — |
|
|
| 66 |
|
Intercompany charges, net |
|
| (156 | ) |
|
| (1,103 | ) |
|
| 1,259 |
|
|
| — |
|
|
| — |
|
Other |
|
| 109 |
|
|
| 3,419 |
|
|
| 1,742 |
|
|
| (99 | ) |
|
| 5,171 |
|
|
|
| — |
|
|
| 23,296 |
|
|
| 9,724 |
|
|
| (179 | ) |
|
| 32,841 |
|
OPERATING INCOME |
|
| — |
|
|
| 1,253 |
|
|
| 278 |
|
|
| — |
|
|
| 1,531 |
|
OTHER INCOME (EXPENSE): |
|
|
|
|
|
|
|
|
|
|
|
|
|
|
|
|
|
|
|
|
Equity in earnings of subsidiaries |
|
| 1,305 |
|
|
| 43 |
|
|
| — |
|
|
| (1,348 | ) |
|
| — |
|
Interest, net |
|
| (315 | ) |
|
| 20 |
|
|
| 7 |
|
|
| — |
|
|
| (288 | ) |
Other retirement plans income |
|
| — |
|
|
| 325 |
|
|
| 11 |
|
|
| — |
|
|
| 336 |
|
Intercompany charges, net |
|
| 325 |
|
|
| (237 | ) |
|
| (88 | ) |
|
| — |
|
|
| — |
|
Other, net |
|
| (10 | ) |
|
| 28 |
|
|
| (29 | ) |
|
| — |
|
|
| (11 | ) |
INCOME (LOSS) BEFORE INCOME TAXES |
|
| 1,305 |
|
|
| 1,432 |
|
|
| 179 |
|
|
| (1,348 | ) |
|
| 1,568 |
|
Provision for income taxes (benefit) |
|
| — |
|
|
| 306 |
|
|
| (43 | ) |
|
| — |
|
|
| 263 |
|
NET INCOME (LOSS) |
| $ | 1,305 |
|
| $ | 1,126 |
|
| $ | 222 |
|
| $ | (1,348 | ) |
| $ | 1,305 |
|
COMPREHENSIVE INCOME (LOSS) |
| $ | 1,270 |
|
| $ | 1,085 |
|
| $ | 246 |
|
| $ | (1,348 | ) |
| $ | 1,253 |
|
- 27 -
CONDENSED CONSOLIDATING STATEMENTS OF CASH FLOWSCOMPREHENSIVE INCOME
(UNAUDITED)
NineSix Months Ended February 28, 2019November 30, 2018
|
| Parent |
|
| Guarantor Subsidiaries |
|
| Non-guarantor Subsidiaries |
|
| Eliminations |
|
| Consolidated |
| |||||
CASH PROVIDED BY (USED IN) OPERATING ACTIVITIES |
| $ | (109 | ) |
| $ | 3,136 |
|
| $ | 322 |
|
| $ | (26 | ) |
| $ | 3,323 |
|
INVESTING ACTIVITIES |
|
|
|
|
|
|
|
|
|
|
|
|
|
|
|
|
|
|
|
|
Capital expenditures |
|
| (3 | ) |
|
| (3,359 | ) |
|
| (395 | ) |
|
| — |
|
|
| (3,757 | ) |
Proceeds from asset dispositions and other |
|
| (45 | ) |
|
| 86 |
|
|
| 21 |
|
|
| — |
|
|
| 62 |
|
CASH USED IN INVESTING ACTIVITIES |
|
| (48 | ) |
|
| (3,273 | ) |
|
| (374 | ) |
|
| — |
|
|
| (3,695 | ) |
FINANCING ACTIVITIES |
|
|
|
|
|
|
|
|
|
|
|
|
|
|
|
|
|
|
|
|
Proceeds from short-term borrowings, net |
|
| 220 |
|
|
| — |
|
|
| — |
|
|
| — |
|
|
| 220 |
|
Net transfers from (to) Parent |
|
| 2 |
|
|
| (31 | ) |
|
| 29 |
|
|
| — |
|
|
| — |
|
Payment on loan between subsidiaries |
|
| (29 | ) |
|
| — |
|
|
| 29 |
|
|
| — |
|
|
| — |
|
Intercompany dividends |
|
| — |
|
|
| 114 |
|
|
| (114 | ) |
|
| — |
|
|
| — |
|
Proceeds from debt issuances |
|
| 2,463 |
|
|
| — |
|
|
| — |
|
|
| — |
|
|
| 2,463 |
|
Principal payments on debt |
|
| (750 | ) |
|
| (117 | ) |
|
| (7 | ) |
|
| — |
|
|
| (874 | ) |
Proceeds from stock issuances |
|
| 58 |
|
|
| — |
|
|
| — |
|
|
| — |
|
|
| 58 |
|
Dividends paid |
|
| (514 | ) |
|
| — |
|
|
| — |
|
|
| — |
|
|
| (514 | ) |
Purchase of treasury stock |
|
| (1,365 | ) |
|
| — |
|
|
| — |
|
|
| — |
|
|
| (1,365 | ) |
Other, net |
|
| — |
|
|
| 127 |
|
|
| (122 | ) |
|
| — |
|
|
| 5 |
|
CASH (USED IN) PROVIDED BY FINANCING ACTIVITIES |
|
| 85 |
|
|
| 93 |
|
|
| (185 | ) |
|
| — |
|
|
| (7 | ) |
Effect of exchange rate changes on cash |
|
| — |
|
|
| (9 | ) |
|
| (5 | ) |
|
| — |
|
|
| (14 | ) |
Net (decrease) increase in cash and cash equivalents |
|
| (72 | ) |
|
| (53 | ) |
|
| (242 | ) |
|
| (26 | ) |
|
| (393 | ) |
Cash and cash equivalents at beginning of period |
|
| 1,485 |
|
|
| 257 |
|
|
| 1,538 |
|
|
| (15 | ) |
|
| 3,265 |
|
Cash and cash equivalents at end of period |
| $ | 1,413 |
|
| $ | 204 |
|
| $ | 1,296 |
|
| $ | (41 | ) |
| $ | 2,872 |
|
|
| Parent |
|
| Guarantor Subsidiaries |
|
| Non-guarantor Subsidiaries |
|
| Eliminations |
|
| Consolidated |
| |||||
REVENUES |
| $ | — |
|
| $ | 25,241 |
|
| $ | 9,837 |
|
| $ | (202 | ) |
| $ | 34,876 |
|
OPERATING EXPENSES: |
|
|
|
|
|
|
|
|
|
|
|
|
|
|
|
|
|
|
|
|
Salaries and employee benefits |
|
| 82 |
|
|
| 9,580 |
|
|
| 2,858 |
|
|
| — |
|
|
| 12,520 |
|
Purchased transportation |
|
| — |
|
|
| 5,032 |
|
|
| 3,364 |
|
|
| (83 | ) |
|
| 8,313 |
|
Rentals and landing fees |
|
| 3 |
|
|
| 1,271 |
|
|
| 388 |
|
|
| (3 | ) |
|
| 1,659 |
|
Depreciation and amortization |
|
| — |
|
|
| 1,402 |
|
|
| 234 |
|
|
| — |
|
|
| 1,636 |
|
Fuel |
|
| — |
|
|
| 1,871 |
|
|
| 167 |
|
|
| — |
|
|
| 2,038 |
|
Maintenance and repairs |
|
| 1 |
|
|
| 1,301 |
|
|
| 184 |
|
|
| — |
|
|
| 1,486 |
|
Intercompany charges, net |
|
| (264 | ) |
|
| (375 | ) |
|
| 639 |
|
|
| — |
|
|
| — |
|
Other |
|
| 178 |
|
|
| 3,221 |
|
|
| 1,711 |
|
|
| (125 | ) |
|
| 4,985 |
|
|
|
| — |
|
|
| 23,303 |
|
|
| 9,545 |
|
|
| (211 | ) |
|
| 32,637 |
|
OPERATING INCOME |
|
| — |
|
|
| 1,938 |
|
|
| 292 |
|
|
| 9 |
|
|
| 2,239 |
|
OTHER INCOME (EXPENSE): |
|
|
|
|
|
|
|
|
|
|
|
|
|
|
|
|
|
|
|
|
Equity in earnings of subsidiaries |
|
| 1,770 |
|
|
| 128 |
|
|
| — |
|
|
| (1,898 | ) |
|
| — |
|
Interest, net |
|
| (330 | ) |
|
| 97 |
|
|
| (25 | ) |
|
| — |
|
|
| (258 | ) |
Other retirement plans income |
|
| — |
|
|
| 311 |
|
|
| 5 |
|
|
| — |
|
|
| 316 |
|
Intercompany charges, net |
|
| 304 |
|
|
| (246 | ) |
|
| (58 | ) |
|
| — |
|
|
| — |
|
Other, net |
|
| 26 |
|
|
| (51 | ) |
|
| 16 |
|
|
| (10 | ) |
|
| (19 | ) |
INCOME (LOSS) BEFORE INCOME TAXES |
|
| 1,770 |
|
|
| 2,177 |
|
|
| 230 |
|
|
| (1,899 | ) |
|
| 2,278 |
|
Provision for income taxes |
|
| — |
|
|
| 432 |
|
|
| 76 |
|
|
| — |
|
|
| 508 |
|
NET INCOME (LOSS) |
| $ | 1,770 |
|
| $ | 1,745 |
|
| $ | 154 |
|
| $ | (1,899 | ) |
| $ | 1,770 |
|
COMPREHENSIVE INCOME (LOSS) |
| $ | 1,730 |
|
| $ | 1,833 |
|
| $ | (133 | ) |
| $ | (1,899 | ) |
| $ | 1,531 |
|
- 28 -
CONDENSED CONSOLIDATING STATEMENTS OF CASH FLOWS
(UNAUDITED)
NineSix Months Ended February 28, 2018November 30, 2019
|
| Parent |
|
| Guarantor Subsidiaries |
|
| Non-guarantor Subsidiaries |
|
| Eliminations |
|
| Consolidated |
|
| Parent |
|
| Guarantor Subsidiaries |
|
| Non-guarantor Subsidiaries |
|
| Eliminations |
|
| Consolidated |
| ||||||||||
CASH PROVIDED BY (USED IN) OPERATING ACTIVITIES |
| $ | (3,537 | ) |
| $ | 4,664 |
|
| $ | 25 |
|
| $ | 10 |
|
| $ | 1,162 |
|
| $ | (1,759 | ) |
| $ | 3,595 |
|
| $ | 201 |
|
| $ | 37 |
|
| $ | 2,074 |
|
INVESTING ACTIVITIES |
|
|
|
|
|
|
|
|
|
|
|
|
|
|
|
|
|
|
|
|
|
|
|
|
|
|
|
|
|
|
|
|
|
|
|
|
|
|
|
|
Capital expenditures |
|
| — |
|
|
| (3,746 | ) |
|
| (248 | ) |
|
| — |
|
|
| (3,994 | ) |
|
| (2 | ) |
|
| (3,007 | ) |
|
| (257 | ) |
|
| — |
|
|
| (3,266 | ) |
Business acquisitions, net of cash acquired |
|
| — |
|
|
| (44 | ) |
|
| — |
|
|
| — |
|
|
| (44 | ) | ||||||||||||||||||||
Proceeds from asset dispositions and other |
|
| (5 | ) |
|
| 23 |
|
|
| 3 |
|
|
| — |
|
|
| 21 |
|
|
| (12 | ) |
|
| 9 |
|
|
| 7 |
|
|
|
|
|
|
| 4 |
|
CASH (USED IN) PROVIDED BY INVESTING ACTIVITIES |
|
| (5 | ) |
|
| (3,767 | ) |
|
| (245 | ) |
|
| — |
|
|
| (4,017 | ) | ||||||||||||||||||||
CASH USED IN INVESTING ACTIVITIES |
|
| (14 | ) |
|
| (2,998 | ) |
|
| (250 | ) |
|
| — |
|
|
| (3,262 | ) | ||||||||||||||||||||
FINANCING ACTIVITIES |
|
|
|
|
|
|
|
|
|
|
|
|
|
|
|
|
|
|
|
|
|
|
|
|
|
|
|
|
|
|
|
|
|
|
|
|
|
|
|
|
Proceeds from short-term borrowings, net |
|
| 797 |
|
|
| — |
|
|
| — |
|
|
| — |
|
|
| 797 |
|
|
| 150 |
|
|
| — |
|
|
| — |
|
|
| — |
|
|
| 150 |
|
Net transfers from (to) Parent |
|
| 807 |
|
|
| (895 | ) |
|
| 88 |
|
|
| — |
|
|
| — |
|
|
| 700 |
|
|
| (853 | ) |
|
| 153 |
|
|
| — |
|
|
| — |
|
Payment on loan between subsidiaries |
|
| 210 |
|
|
| — |
|
|
| (210 | ) |
|
| — |
|
|
| — |
|
|
| (326 | ) |
|
| — |
|
|
| 326 |
|
|
| — |
|
|
| — |
|
Intercompany dividends |
|
| — |
|
|
| 398 |
|
|
| (398 | ) |
|
| — |
|
|
| — |
| ||||||||||||||||||||
Proceeds from debt issuances |
|
| 1,481 |
|
|
| — |
|
|
| — |
|
|
| — |
|
|
| 1,481 |
|
|
| 2,093 |
|
|
| — |
|
|
| — |
|
|
| — |
|
|
| 2,093 |
|
Principal payments on debt |
|
| — |
|
|
| (17 | ) |
|
| (14 | ) |
|
| — |
|
|
| (31 | ) |
|
| (956 | ) |
|
| (62 | ) |
|
| (3 | ) |
|
| — |
|
|
| (1,021 | ) |
Proceeds from stock issuances |
|
| 284 |
|
|
| — |
|
|
| — |
|
|
| — |
|
|
| 284 |
|
|
| 26 |
|
|
| — |
|
|
| — |
|
|
| — |
|
|
| 26 |
|
Dividends paid |
|
| (402 | ) |
|
| — |
|
|
| — |
|
|
| — |
|
|
| (402 | ) |
|
| (339 | ) |
|
| — |
|
|
| — |
|
|
| — |
|
|
| (339 | ) |
Purchase of treasury stock |
|
| (558 | ) |
|
| — |
|
|
| — |
|
|
| — |
|
|
| (558 | ) |
|
| (3 | ) |
|
| — |
|
|
| — |
|
|
| — |
|
|
| (3 | ) |
Other, net |
|
| 2 |
|
|
| 4 |
|
|
| — |
|
|
| — |
|
|
| 6 |
|
|
| (4 | ) |
|
| — |
|
|
| (1 | ) |
|
| — |
|
|
| (5 | ) |
CASH (USED IN) PROVIDED BY FINANCING ACTIVITIES |
|
| 2,621 |
|
|
| (908 | ) |
|
| (136 | ) |
|
| — |
|
|
| 1,577 |
|
|
| 1,341 |
|
|
| (517 | ) |
|
| 77 |
|
|
| — |
|
|
| 901 |
|
Effect of exchange rate changes on cash |
|
| (6 | ) |
|
| 61 |
|
|
| 43 |
|
|
| — |
|
|
| 98 |
|
|
| — |
|
|
| (2 | ) |
|
| 1 |
|
|
| — |
|
|
| (1 | ) |
Net (decrease) increase in cash and cash equivalents |
|
| (927 | ) |
|
| 50 |
|
|
| (313 | ) |
|
| 10 |
|
|
| (1,180 | ) |
|
| (432 | ) |
|
| 78 |
|
|
| 29 |
|
|
| 37 |
|
|
| (288 | ) |
Cash and cash equivalents at beginning of period |
|
| 1,884 |
|
|
| 325 |
|
|
| 1,807 |
|
|
| (47 | ) |
|
| 3,969 |
|
|
| 826 |
|
|
| 158 |
|
|
| 1,381 |
|
|
| (46 | ) |
|
| 2,319 |
|
Cash and cash equivalents at end of period |
| $ | 957 |
|
| $ | 375 |
|
| $ | 1,494 |
|
| $ | (37 | ) |
| $ | 2,789 |
|
| $ | 394 |
|
| $ | 236 |
|
| $ | 1,410 |
|
| $ | (9 | ) |
| $ | 2,031 |
|
- 29 -
REPORTCONDENSED CONSOLIDATING STATEMENTS OF INDEPENDENT REGISTEREDCASH FLOWS
PUBLIC ACCOUNTING FIRM(UNAUDITED)
TheSix Months Ended November 30, 2018
|
| Parent |
|
| Guarantor Subsidiaries |
|
| Non-guarantor Subsidiaries |
|
| Eliminations |
|
| Consolidated |
| |||||
CASH PROVIDED BY (USED IN) OPERATING ACTIVITIES |
| $ | 262 |
|
| $ | 1,631 |
|
| $ | 333 |
|
| $ | (47 | ) |
| $ | 2,179 |
|
INVESTING ACTIVITIES |
|
|
|
|
|
|
|
|
|
|
|
|
|
|
|
|
|
|
|
|
Capital expenditures |
|
| (2 | ) |
|
| (2,337 | ) |
|
| (295 | ) |
|
| — |
|
|
| (2,634 | ) |
Proceeds from asset dispositions and other |
|
| (45 | ) |
|
| 83 |
|
|
| 15 |
|
|
| — |
|
|
| 53 |
|
CASH USED IN INVESTING ACTIVITIES |
|
| (47 | ) |
|
| (2,254 | ) |
|
| (280 | ) |
|
| — |
|
|
| (2,581 | ) |
FINANCING ACTIVITIES |
|
|
|
|
|
|
|
|
|
|
|
|
|
|
|
|
|
|
|
|
Proceeds from short-term borrowings, net |
|
| 248 |
|
|
| — |
|
|
| — |
|
|
| — |
|
|
| 248 |
|
Net transfers from (to) Parent |
|
| (344 | ) |
|
| 350 |
|
|
| (6 | ) |
|
| — |
|
|
| — |
|
Intercompany dividends |
|
| — |
|
|
| 113 |
|
|
| (113 | ) |
|
| — |
|
|
| — |
|
Proceeds from debt issuances |
|
| 1,233 |
|
|
| — |
|
|
| — |
|
|
| — |
|
|
| 1,233 |
|
Principal payments on debt |
|
| (750 | ) |
|
| (29 | ) |
|
| (6 | ) |
|
| — |
|
|
| (785 | ) |
Proceeds from stock issuances |
|
| 45 |
|
|
| — |
|
|
| — |
|
|
| — |
|
|
| 45 |
|
Dividends paid |
|
| (173 | ) |
|
| — |
|
|
| — |
|
|
| — |
|
|
| (173 | ) |
Purchase of treasury stock |
|
| (1,271 | ) |
|
| — |
|
|
| — |
|
|
| — |
|
|
| (1,271 | ) |
Other, net |
|
| — |
|
|
| 128 |
|
|
| (127 | ) |
|
| — |
|
|
| 1 |
|
CASH (USED IN) PROVIDED BY FINANCING ACTIVITIES |
|
| (1,012 | ) |
|
| 562 |
|
|
| (252 | ) |
|
| — |
|
|
| (702 | ) |
Effect of exchange rate changes on cash |
|
| — |
|
|
| (9 | ) |
|
| (29 | ) |
|
| — |
|
|
| (38 | ) |
Net decrease in cash and cash equivalents |
|
| (797 | ) |
|
| (70 | ) |
|
| (228 | ) |
|
| (47 | ) |
|
| (1,142 | ) |
Cash and cash equivalents at beginning of period |
|
| 1,485 |
|
|
| 257 |
|
|
| 1,538 |
|
|
| (15 | ) |
|
| 3,265 |
|
Cash and cash equivalents at end of period |
| $ | 688 |
|
| $ | 187 |
|
| $ | 1,310 |
|
| $ | (62 | ) |
| $ | 2,123 |
|
- 30 -
Report of Independent Registered Public Accounting Firm
To the Stockholders and Board of Directors and Stockholders
FedEx Corporation
Results of Review of Interim Financial Statements
We have reviewed the accompanying condensed consolidated balance sheet of FedEx Corporation (the Company) as of February 28,November 30, 2019, and the related condensed consolidated statements of income, and comprehensive income for the three-month and nine-month periods ended February 28, 2019 and February 28, 2018, the condensed consolidated statements of cash flows for the nine-month periods ended February 28, 2019 and February 28, 2018, and the consolidated statements of changes in common stockholders’ investment for the three-month and nine-monthsix-month periods ended February 28,November 30, 2019 and February 28,2018, the related condensed consolidated statements of cash flows for the six-month periods ended November 30, 2019 and 2018, and the related notes (collectively referred to as the “condensed consolidated interim financial statements”). Based on our reviews, we are not aware of any material modifications that should be made to the condensed consolidated interim financial statements for them to be in conformity with U.S. generally accepted accounting principles.
We have previously audited, in accordance with the standards of the Public Company Accounting Oversight Board (United States) (PCAOB), the consolidated balance sheet of FedEx Corporationthe Company as of May 31, 2018, and2019, the related consolidated statements of income, comprehensive income, cash flows and changes in common stockholders’ investment and cash flows for the year then ended, and the related notes and schedules (not presented herein); and in our report dated July 16, 2018,2019, we expressed an unqualified audit opinion on those consolidated financial statements. In our opinion, the information set forth in the accompanying condensed consolidated balance sheet as of May 31, 2018,2019, is fairly stated, in all material respects, in relation to the consolidated balance sheet from which it has been derived.
Basis for Review Results
These financial statements are the responsibility of the Company’s management. We are a public accounting firm registered with the PCAOB and are required to be independent with respect to the company in accordance with the U.S. federal securities laws and the applicable rules and regulations of the SEC and the PCAOB. We conducted our review in accordance with the standards of the PCAOB. A review of interim financial statements consists principally of applying analytical procedures and making inquiries of persons responsible for financial and accounting matters. It is substantially less in scope than an audit conducted in accordance with the standards of the PCAOB, the objective of which is the expression of an opinion regarding the financial statements taken as a whole. Accordingly, we do not express such an opinion.
/s/ Ernst & Young LLP |
Memphis, Tennessee
March 19,December 17, 2019
- 3031 -
Item 2. Management’s Discussion and Analysis of Results of Operations and Financial Condition
GENERAL
The following Management’s Discussion and Analysis of Results of Operations and Financial Condition (“MD&A”) describes the principal factors affecting the results of operations, liquidity, capital resources, contractual cash obligations and critical accounting estimates of FedEx Corporation (“FedEx”). This discussion should be read in conjunction with the accompanying quarterly unaudited condensed consolidated financial statements and our Annual Report on Form 10-K for the year ended May 31, 20182019 (“Annual Report”). Our Annual Report includes additional information about our significant accounting policies, practices and the transactions that underlie our financial results, as well as a detailed discussion of the most significant risks and uncertainties associated with our financial condition and operating results.
We provide a broad portfolio of transportation, e-commerce and business services through companies competing collectively, operating independently and managed collaboratively, under the respected FedEx brand. Our primary operating companies are Federal Express Corporation (“FedEx Express”), including TNT Express B.V. (“TNT Express”), the world’s largest express transportation company; FedEx Ground Package System, Inc. (“FedEx Ground”), a leading North American provider of small-package ground delivery services; and FedEx Freight Corporation (“FedEx Freight”), a leading U.S.North American provider of less-than-truckload (“LTL”) freight transportation services. These companies represent our major service lines and, along with FedEx Corporate Services, Inc. (“FedEx Services”), constitute our reportable segments.
Our FedEx Services segment provides sales, marketing, information technology, communications, customer service, technical support, billing and collection services, and certain back-office functions that support our transportationoperating segments. The FedEx Services segment also provides customers with retail access to FedEx Express and FedEx Ground shipping services through FedEx Office and Print Services, Inc. (“FedEx Office”). See “Reportable Segments” for further discussion. Additional information on our businesses can be found in our Annual Report.
As discussed in our Annual Report, as of June 1, 2019 the results of the FedEx Logistics,Office and Print Services, Inc. (“FedEx Logistics” (formerly FedEx Trade Networks, Inc.)Office”) operating segment results are included in “Corporate, other and eliminations” ineliminations.” This change was made to reflect our segment reporting.internal management reporting structure. Prior year amounts have been revised to conform to the current year presentation.
The key indicators necessary to understand our operating results include:
the overall customer demand for our various services based on macroeconomic factors and the global economy;
• | the overall customer demand for our various services based on macroeconomic factors and the global economy; |
the volumes of transportation services provided through our networks, primarily measured by our average daily volume and shipment weight and size;
• | the volumes of transportation services provided through our networks, primarily measured by our average daily volume and shipment weight and size; |
the mix of services purchased by our customers;
• | the mix of services purchased by our customers; |
the prices we obtain for our services, primarily measured by yield (revenue per package or pound or revenue per shipment or hundredweight for LTL freight shipments);
• | the prices we obtain for our services, primarily measured by yield (revenue per package or pound or revenue per shipment or hundredweight for LTL freight shipments); |
our ability to manage our cost structure (capital expenditures and operating expenses) to match shifting volume levels; and
• | our ability to manage our cost structure (capital expenditures and operating expenses) to match shifting volume levels; and |
the timing and amount of fluctuations in fuel prices and our ability to recover incremental fuel costs through our fuel surcharges.
• | the timing and amount of fluctuations in fuel prices and our ability to recover incremental fuel costs through our fuel surcharges. |
Many of our operating expenses are directly impacted by revenue and volume levels, and we expect these operating expenses to fluctuate on a year-over-year basis consistent with changes in revenues and volumes. Therefore, the discussion of operating expense captions focuses on the key drivers and trends impacting expenses other than those factors strictly related to changes in revenues and volumes. The line item “Other operating expenses”expense” includes costs associated with outside service contracts (such as facility services and cargo handling, temporary labor and security), insurance, professional fees insurance, uniforms and taxes and licenses.uniforms.
Except as otherwise specified, references to years indicate our fiscal year ending May 31, 20192020 or ended May 31 of the year referenced and comparisons are to the corresponding period of the prior year. References to our transportation segments include, collectively, the FedEx Express segment, the FedEx Ground segment and the FedEx Freight segment.
- 3132 -
CONSOLIDATED RESULTS
The following tables compare summary operating results and changes in revenue and operating income (dollars in millions, except per share amounts) for the periods ended February 28:November 30:
|
| Three Months Ended |
|
| Percent |
|
|
| Nine Months Ended |
|
| Percent |
|
|
| Three Months Ended |
|
| Percent |
|
|
| Six Months Ended |
|
| Percent |
|
| ||||||||||||||||||||||||
|
| 2019 |
|
| 2018 |
|
| Change |
|
|
| 2019 |
|
| 2018 |
|
| Change |
|
|
| 2019 |
|
| 2018 |
|
| Change |
|
|
| 2019 |
|
| 2018 |
|
| Change |
|
| ||||||||||||
Revenues |
| $ | 17,010 |
|
| $ | 16,526 |
|
|
| 3 |
|
|
| $ | 51,886 |
|
| $ | 48,136 |
|
|
| 8 |
|
|
| $ | 17,324 |
|
| $ | 17,824 |
|
|
| (3 | ) |
|
| $ | 34,372 |
|
| $ | 34,876 |
|
|
| (1 | ) |
|
Operating income (loss): |
|
|
|
|
|
|
|
|
|
|
|
|
|
|
|
|
|
|
|
|
|
|
|
|
|
|
|
|
|
|
|
|
|
|
|
|
|
|
|
|
|
|
|
|
|
|
|
|
|
|
|
|
FedEx Express segment |
|
| 370 |
|
|
| 317 |
|
|
| 17 |
|
|
|
| 1,357 |
|
|
| 1,238 |
|
|
| 10 |
|
|
|
| 236 |
|
|
| 630 |
|
|
| (63 | ) |
|
|
| 521 |
|
|
| 1,018 |
|
|
| (49 | ) |
|
FedEx Ground segment |
|
| 577 |
|
|
| 614 |
|
|
| (6 | ) |
|
|
| 1,830 |
|
|
| 1,716 |
|
|
| 7 |
|
|
|
| 342 |
|
|
| 590 |
|
|
| (42 | ) |
|
|
| 986 |
|
|
| 1,266 |
|
|
| (22 | ) |
|
FedEx Freight segment |
|
| 97 |
|
|
| 49 |
|
|
| 98 |
|
|
|
| 421 |
|
|
| 322 |
|
|
| 31 |
|
|
|
| 141 |
|
|
| 148 |
|
|
| (5 | ) |
|
|
| 335 |
|
|
| 324 |
|
|
| 3 |
|
|
Corporate, other and eliminations |
|
| (133 | ) |
|
| (122 | ) |
|
| (9 | ) |
|
|
| (458 | ) |
|
| (332 | ) |
|
| (38 | ) |
|
|
| (165 | ) |
|
| (200 | ) |
|
| 18 |
|
|
|
| (311 | ) |
|
| (369 | ) |
|
| 16 |
|
|
Consolidated operating income |
|
| 911 |
|
|
| 858 |
|
|
| 6 |
|
|
|
| 3,150 |
|
|
| 2,944 |
|
|
| 7 |
|
|
|
| 554 |
|
|
| 1,168 |
|
|
| (53 | ) |
|
|
| 1,531 |
|
|
| 2,239 |
|
|
| (32 | ) |
|
Operating margin: |
|
|
|
|
|
|
|
|
|
|
|
|
|
|
|
|
|
|
|
|
|
|
|
|
|
|
|
|
|
|
|
|
|
|
|
|
|
|
|
|
|
|
|
|
|
|
|
|
|
|
|
|
FedEx Express segment |
|
| 4.1 | % |
|
| 3.5 | % |
|
| 60 |
| bp |
|
| 4.9 | % |
|
| 4.7 | % |
|
| 20 |
| bp |
|
| 2.6 | % |
|
| 6.6 | % |
|
| (400 | ) | bp |
|
| 2.9 | % |
|
| 5.4 | % |
|
| (250 | ) | bp |
FedEx Ground segment |
|
| 11.0 | % |
|
| 12.7 | % |
|
| (170 | ) | bp |
|
| 12.0 | % |
|
| 12.6 | % |
|
| (60 | ) | bp |
|
| 6.4 | % |
|
| 11.5 | % |
|
| (510 | ) | bp |
|
| 9.4 | % |
|
| 12.7 | % |
|
| (330 | ) | bp |
FedEx Freight segment |
|
| 5.5 | % |
|
| 3.0 | % |
|
| 250 |
| bp |
|
| 7.5 | % |
|
| 6.5 | % |
|
| 100 |
| bp |
|
| 7.6 | % |
|
| 7.7 | % |
|
| (10 | ) | bp |
|
| 8.9 | % |
|
| 8.4 | % |
|
| 50 |
| bp |
Consolidated operating margin |
|
| 5.4 | % |
|
| 5.2 | % |
|
| 20 |
| bp |
|
| 6.1 | % |
|
| 6.1 | % |
|
| — |
| bp |
|
| 3.2 | % |
|
| 6.6 | % |
|
| (340 | ) | bp |
|
| 4.5 | % |
|
| 6.4 | % |
|
| (190 | ) | bp |
Consolidated net income |
| $ | 739 |
|
| $ | 2,074 |
|
|
| (64 | ) |
|
| $ | 2,509 |
|
| $ | 3,445 |
|
|
| (27 | ) |
|
| $ | 560 |
|
| $ | 935 |
|
|
| (40 | ) |
|
| $ | 1,305 |
|
| $ | 1,770 |
|
|
| (26 | ) |
|
Diluted earnings per share |
| $ | 2.80 |
|
| $ | 7.59 |
|
|
| (63 | ) |
|
| $ | 9.41 |
|
| $ | 12.63 |
|
|
| (25 | ) |
|
| $ | 2.13 |
|
| $ | 3.51 |
|
|
| (39 | ) |
|
| $ | 4.97 |
|
| $ | 6.60 |
|
|
| (25 | ) |
|
|
| Change in Revenue |
|
| Change in Operating Income |
|
| Change in Revenue |
|
| Change in Operating Income (Loss) |
| ||||||||||||||||||||
|
| Three Months Ended |
|
| Nine Months Ended |
|
| Three Months Ended |
|
| Nine Months Ended |
|
| Three Months Ended |
|
| Six Months Ended |
|
| Three Months Ended |
|
| Six Months Ended |
| ||||||||
FedEx Express segment |
| $ | (93 | ) |
| $ | 1,257 |
|
| $ | 53 |
|
| $ | 119 |
|
| $ | (520 | ) |
| $ | (797 | ) |
| $ | (394 | ) |
| $ | (497 | ) |
FedEx Ground segment |
|
| 433 |
|
|
| 1,604 |
|
|
| (37 | ) |
|
| 114 |
|
|
| 173 |
|
|
| 553 |
|
|
| (248 | ) |
|
| (280 | ) |
FedEx Freight segment |
|
| 137 |
|
|
| 677 |
|
|
| 48 |
|
|
| 99 |
|
|
| (74 | ) |
|
| (128 | ) |
|
| (7 | ) |
|
| 11 |
|
FedEx Services segment |
|
| 5 |
|
|
| 35 |
|
|
| — |
|
|
| — |
|
|
| 1 |
|
|
| (4 | ) |
|
| — |
|
|
| — |
|
Corporate, other and eliminations |
|
| 2 |
|
|
| 177 |
|
|
| (11 | ) |
|
| (126 | ) |
|
| (80 | ) |
|
| (128 | ) |
|
| 35 |
|
|
| 58 |
|
|
| $ | 484 |
|
| $ | 3,750 |
|
| $ | 53 |
|
| $ | 206 |
|
| $ | (500 | ) |
| $ | (504 | ) |
| $ | (614 | ) |
| $ | (708 | ) |
Pension Accounting Change
As of June 1, 2018, we adopted new accounting guidance that changes how employers that sponsor defined benefit pension or other postretirement benefit plans present net periodic benefit cost in their income statement. This new guidance requires us to report only the service cost component in the salaries and employee benefits line item. The other components of net benefit cost are required to be presented in the income statement in other income, outside of income from operations. This new guidance impacts operating income and margin but has no impact on net income or earnings per share. We have applied these changes retrospectively.
Overview
Consolidated operating income improveddeclined during both the second quarter and first half of 2020 primarily due to weaker global economic conditions, increased costs to expand services, the loss of business from a large customer and the later timing of the Thanksgiving holiday, which shifted Cyber Week into December. Continued mix shift to lower-yielding services and an increased competitive pricing environment negatively impacted our results during the thirdsecond quarter and nine monthsfirst half of 2019 primarily due2020. During the second quarter of 2020, we recorded asset impairment charges of $66 million ($50 million, net of tax, or $0.19 per diluted share) associated with the decision to permanently retire certain aircraft and related engines at FedEx Express (see “Asset Impairment Charges” below for more information).These factors were partially offset by lower variable incentive compensation expenses volume growth, the favorable net impact of fuel at all of our transportation segments and increased yields at FedEx Freight and FedEx Ground.Freight. Lower variable incentive compensation expenses benefited the comparison of our results by approximately $350$65 million in the thirdsecond quarter and the nine months of 2019. During the third quarter and nine months of 2019, softening global economic conditions negatively impacted international package volumes at FedEx Express. Lower weights in U.S. domestic package shipments at FedEx Express also negatively impacted our results. Compounding these factors, we also experienced a product mix shift to lower yielding services due in part to an increase in e-commerce traffic at FedEx Express. In addition, higher purchased transportation costs, resulting from increased contractor settlement rates at FedEx Ground and expanding the FedEx Ground network operations to six days year-round, starting in January 2019, negatively affected our results. Comparables for the nine months of 2019 are affected by the impact of the NotPetya cyberattack, which reduced earnings$365 million in the first half of 20182020. Our first half 2020 results were negatively impacted by approximately $400$100 million ($1.14 per diluted share). Winter weather conditions in 2019 did not have a material effect on comparisonsdue to 2018 for either the third-quarter or nine-month periods.one fewer operating day.
- 32 -
The comparison ofConsolidated net income between 2019 and 2018 is significantly affected by a provisional benefit of $1.15 billion ($4.21 per diluted share) attributable to the enactment of the Tax Cuts and Jobs Act (“TCJA”) recognized during the third quarter of 2018, specifically related to the remeasurement of our net U.S. deferred tax liability. Net income for the thirdsecond quarter and first half of 20192020 includes a tax benefitsbenefit of $90$133 million ($0.340.51 per diluted share) from the reduction of a valuation allowance on certain foreign tax loss carryforwards and $60 million ($0.23 per diluted share) primarily related to a lower statutory income tax rate under the TCJA. These items were partially offset by tax expense of $50 million ($0.19 per diluted share) related to a recently enacted lower tax rate in the Netherlands applied to our deferred tax balances. Additionally, we recognized an income tax benefit of approximately $230 million ($0.86 per diluted share) in the nine months of 2019, primarily related to a lower statutory income tax rate under the TCJA. Our results for the third quarter of 2018 included tax benefits of $204 million ($0.75 per diluted share) from a $1.5 billion contribution to our tax-qualified U.S. domestic pension plans (“U.S. Pension Plans”) in February 2018 and $165 million ($0.60 per diluted share) related to the phase-in of a reduced statutory tax rate on 2018 year-to-date earnings, of which approximately $120 million ($0.44 per diluted share) was recorded in the third quarter and attributable to the first half of 2018 earnings.carryforwards. See the “Income Taxes” section below for furthermore information.
- 33 -
We incurred TNT Express integration expenses totaling $69$64 million ($5550 million, net of tax, or $0.21$0.19 per diluted share) in the thirdsecond quarter of 2019, a $37and $135 million decrease from the third quarter of 2018. TNT Express integration expenses were $304 million ($243105 million, net of tax, or $0.92$0.40 per diluted share) in the nine monthsfirst half of 2019,2020, a $37$50 million decrease from the nine monthssecond quarter and a $100 million decrease from the first half of 2018.2019. The integration expenses are predominantly incremental costs directly associated with the integration of TNT Express, including professional and legal fees, salaries and employee benefits, travel and advertising expenses, and include any restructuring charges at TNT Express. Internal salaries and employee benefits are included only to the extent the individuals are assigned full-time to integration activities. These costs were incurred at FedEx Express and FedEx Corporate. The identification of these costs as integration-related expenditures is subject to our disclosure controls and procedures.
- 3334 -
The following graphs for FedEx Express, FedEx Ground and FedEx Freight show selected volume trends (in thousands) over the five most recent quarters:
| (1) | International domestic average daily package volume relates to our international intra-country operations. International export average daily package volume relates to our international priority and economy services. |
(2) | International average daily freight pounds relates to our international priority, economy and airfreight services. |
- 3435 -
The following graphs for FedEx Express, FedEx Ground and FedEx Freight show selected yield trends over the five most recent quarters:
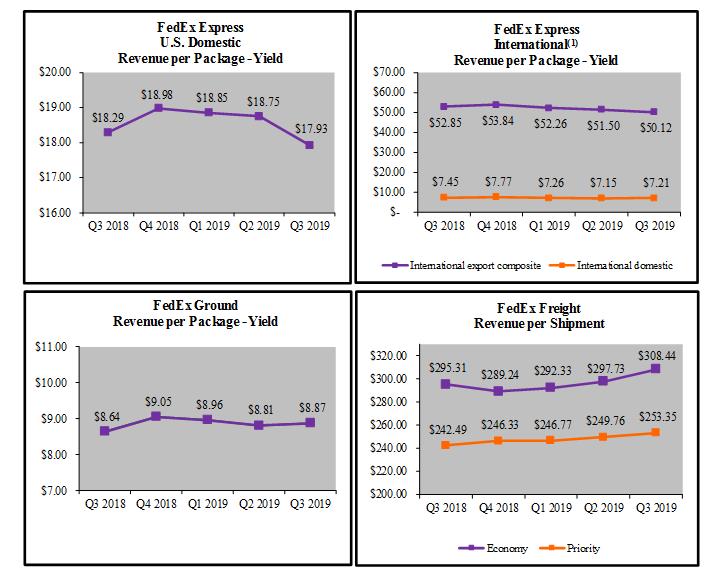
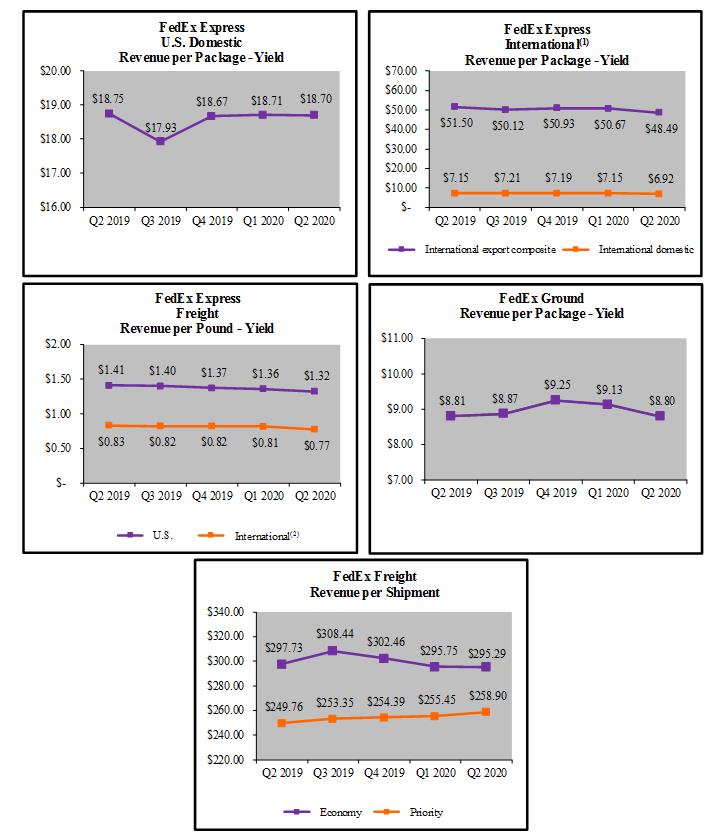
| (1) | International export revenue per package relates to our international priority and economy services. International domestic revenue per package relates to our international intra-country operations. |
(2) | International revenue per pound relates to our international priority, economy and airfreight services. |
- 36 -
Revenue
Revenues increaseddecreased 3% in the thirdsecond quarter and 8%1% in the nine monthsfirst half of 20192020 primarily due to higher volumesthe loss of business from a large customer, macroeconomic weakness and lower fuel surcharges at all of our transportation segments, and increased yields at FedEx Ground and FedEx Freight. At FedEx Ground, revenues increased 9% in the third quarter and 12% in the nine months of 2019 due to volume growth and increased yields. FedEx Freight revenues increased 8% in the third quarter and 14% in the nine months of 2019 due to higher revenue per shipment and average daily shipments. Revenues at FedEx Express decreased 1% in the third quarter of 2019 primarily due to lower international priority and international domestic package revenue. At FedEx Express, unfavorable exchange rates, lower base rates and decreased weights contributed to the decline in international revenue in the third quarter of 2019. Currency exchange rates had a negative impact on revenues at FedEx Express but did not have an impact on operating income in the third quarter of 2019. Revenues at FedEx Express increased 5% in the nine months of 2019 primarily due to U.S. domestic package volume growth and international package and freight volume recovery from the NotPetya cyberattack, partially offset by package yield declines. FedEx Express revenue during the third quarter and nine months of 2019 was negatively impacted by continued softness in international packageresidential delivery volume growth resulting from weakening global economic conditions. Higher fuel surcharges had a positive impact on revenuesat FedEx Ground. In addition, one fewer operating day at all of our transportation segments negatively impacted revenue in the first half of 2020. Revenues at FedEx Express decreased 5% in the second quarter and 4% in the first half of 2020 primarily due to the loss of business from a large customer, macroeconomic weakness and trade uncertainty driving lower freight revenue and unfavorable exchange rates. At FedEx Ground, revenues increased 3% in the second quarter of 2020 due to residential delivery volume growth. Revenues at FedEx Ground increased 6% in the first half of 2020 due to residential delivery volume growth and increased yields. Additionally, the timing of peak-related revenue shifting to the third quarter this year, as well as the loss of business from a large customer, negatively impacted revenue comparisons during the second quarter and nine monthsfirst half of 2019.2020. FedEx Freight revenues decreased 4% in the second quarter and 3% in the first half of 2020 due to decreased average daily shipments, partially offset by higher revenue per shipment.
- 35 -
The following tables compare operating expenses expressed as dollar amounts (in millions) and as a percent of revenue for the periods ended February 28:November 30:
|
| Three Months Ended |
|
| Percent |
|
|
| Nine Months Ended |
|
| Percent |
|
| ||||||||||||
|
| 2019 |
|
| 2018 |
|
| Change |
|
|
| 2019 |
|
| 2018 |
|
| Change |
|
| ||||||
Operating expenses: |
|
|
|
|
|
|
|
|
|
|
|
|
|
|
|
|
|
|
|
|
|
|
|
|
|
|
Salaries and employee benefits |
| $ | 6,069 |
|
| $ | 6,124 |
|
|
| (1 | ) |
|
| $ | 18,589 |
|
| $ | 17,677 |
|
|
| 5 |
|
|
Purchased transportation |
|
| 4,253 |
|
|
| 3,935 |
|
|
| 8 |
|
|
|
| 12,566 |
|
|
| 11,220 |
|
|
| 12 |
|
|
Rentals and landing fees |
|
| 874 |
|
|
| 873 |
|
|
| — |
|
|
|
| 2,533 |
|
|
| 2,526 |
|
|
| — |
|
|
Depreciation and amortization |
|
| 851 |
|
|
| 786 |
|
|
| 8 |
|
|
|
| 2,487 |
|
|
| 2,293 |
|
|
| 8 |
|
|
Fuel |
|
| 907 |
|
|
| 914 |
|
|
| (1 | ) |
|
|
| 2,945 |
|
|
| 2,435 |
|
|
| 21 |
|
|
Maintenance and repairs |
|
| 658 |
|
|
| 628 |
|
|
| 5 |
|
|
|
| 2,144 |
|
|
| 1,968 |
|
|
| 9 |
|
|
Business realignment costs(1) |
|
| 4 |
|
|
| — |
|
| NM |
|
|
|
| 4 |
|
|
| — |
|
| NM |
|
| ||
Other |
|
| 2,483 |
|
|
| 2,408 |
|
|
| 3 |
|
|
|
| 7,468 |
|
|
| 7,073 |
|
|
| 6 |
|
|
Total operating expenses |
| $ | 16,099 |
|
| $ | 15,668 |
|
|
| 3 |
|
|
| $ | 48,736 |
|
| $ | 45,192 |
|
|
| 8 |
|
|
Operating income |
| $ | 911 |
|
| $ | 858 |
|
|
| 6 |
|
|
| $ | 3,150 |
|
| $ | 2,944 |
|
|
| 7 |
|
|
|
|
|
| Three Months Ended |
|
| Percent |
|
|
| Six Months Ended |
|
| Percent |
| ||||||||||||
|
| 2019 |
|
| 2018 |
|
| Change |
|
|
| 2019 |
|
| 2018 |
|
| Change |
| ||||||
Operating expenses: |
|
|
|
|
|
|
|
|
|
|
|
|
|
|
|
|
|
|
|
|
|
|
|
|
|
Salaries and employee benefits |
| $ | 6,235 |
|
| $ | 6,260 |
|
|
| — |
|
|
| $ | 12,322 |
|
| $ | 12,520 |
|
|
| (2 | ) |
Purchased transportation |
|
| 4,328 |
|
|
| 4,346 |
|
|
| — |
|
|
|
| 8,356 |
|
|
| 8,313 |
|
|
| 1 |
|
Rentals and landing fees |
|
| 924 |
|
|
| 836 |
|
|
| 11 |
|
|
|
| 1,844 |
|
|
| 1,659 |
|
|
| 11 |
|
Depreciation and amortization |
|
| 901 |
|
|
| 828 |
|
|
| 9 |
|
|
|
| 1,780 |
|
|
| 1,636 |
|
|
| 9 |
|
Fuel |
|
| 890 |
|
|
| 1,052 |
|
|
| (15 | ) |
|
|
| 1,760 |
|
|
| 2,038 |
|
|
| (14 | ) |
Maintenance and repairs |
|
| 774 |
|
|
| 751 |
|
|
| 3 |
|
|
|
| 1,542 |
|
|
| 1,486 |
|
|
| 4 |
|
Asset impairment charges |
|
| 66 |
|
|
| — |
|
| NM |
|
|
|
| 66 |
|
|
| — |
|
| NM |
| ||
Other |
|
| 2,652 |
|
|
| 2,583 |
|
|
| 3 |
|
|
|
| 5,171 |
|
|
| 4,985 |
|
|
| 4 |
|
Total operating expenses |
|
| 16,770 |
|
|
| 16,656 |
|
|
| 1 |
|
|
|
| 32,841 |
|
|
| 32,637 |
|
|
| 1 |
|
Operating income |
| $ | 554 |
|
| $ | 1,168 |
|
|
| (53 | ) |
|
| $ | 1,531 |
|
| $ | 2,239 |
|
|
| (32 | ) |
|
| Percent of Revenue |
|
| ||||||||||||||||
|
| Three Months Ended |
|
|
| Nine Months Ended |
|
| ||||||||||||
|
| 2019 |
|
|
| 2018 |
|
|
| 2019 |
|
|
| 2018 |
|
| ||||
Operating expenses: |
|
|
|
|
|
|
|
|
|
|
|
|
|
|
|
|
|
|
|
|
Salaries and employee benefits |
|
| 35.7 |
| % |
|
| 37.1 |
| % |
|
| 35.8 |
| % |
|
| 36.7 |
| % |
Purchased transportation |
|
| 25.0 |
|
|
|
| 23.8 |
|
|
|
| 24.2 |
|
|
|
| 23.3 |
|
|
Rentals and landing fees |
|
| 5.1 |
|
|
|
| 5.3 |
|
|
|
| 4.9 |
|
|
|
| 5.2 |
|
|
Depreciation and amortization |
|
| 5.0 |
|
|
|
| 4.7 |
|
|
|
| 4.8 |
|
|
|
| 4.8 |
|
|
Fuel |
|
| 5.3 |
|
|
|
| 5.5 |
|
|
|
| 5.7 |
|
|
|
| 5.1 |
|
|
Maintenance and repairs |
|
| 3.9 |
|
|
|
| 3.8 |
|
|
|
| 4.1 |
|
|
|
| 4.1 |
|
|
Business realignment costs(1) |
|
| 0.0 |
|
|
|
| — |
|
|
|
| 0.0 |
|
|
|
| — |
|
|
Other |
|
| 14.6 |
|
|
|
| 14.6 |
|
|
|
| 14.4 |
|
|
|
| 14.7 |
|
|
Total operating expenses |
|
| 94.6 |
|
|
|
| 94.8 |
|
|
|
| 93.9 |
|
|
|
| 93.9 |
|
|
Operating margin |
|
| 5.4 |
| % |
|
| 5.2 |
| % |
|
| 6.1 |
| % |
|
| 6.1 |
| % |
|
|
|
| Percent of Revenue |
|
| ||||||||||||||||
|
| Three Months Ended |
|
|
| Six Months Ended |
|
| ||||||||||||
|
| 2019 |
|
|
| 2018 |
|
|
| 2019 |
|
|
| 2018 |
|
| ||||
Operating expenses: |
|
|
|
|
|
|
|
|
|
|
|
|
|
|
|
|
|
|
|
|
Salaries and employee benefits |
|
| 36.0 |
| % |
|
| 35.1 |
| % |
|
| 35.8 |
| % |
|
| 35.9 |
| % |
Purchased transportation |
|
| 25.0 |
|
|
|
| 24.4 |
|
|
|
| 24.3 |
|
|
|
| 23.8 |
|
|
Rentals and landing fees |
|
| 5.3 |
|
|
|
| 4.7 |
|
|
|
| 5.4 |
|
|
|
| 4.8 |
|
|
Depreciation and amortization |
|
| 5.2 |
|
|
|
| 4.6 |
|
|
|
| 5.2 |
|
|
|
| 4.7 |
|
|
Fuel |
|
| 5.1 |
|
|
|
| 5.9 |
|
|
|
| 5.1 |
|
|
|
| 5.8 |
|
|
Maintenance and repairs |
|
| 4.5 |
|
|
|
| 4.2 |
|
|
|
| 4.5 |
|
|
|
| 4.3 |
|
|
Asset impairment charges |
|
| 0.4 |
|
|
|
| — |
|
|
|
| 0.2 |
|
|
|
| — |
|
|
Other |
|
| 15.3 |
|
|
|
| 14.5 |
|
|
|
| 15.0 |
|
|
|
| 14.3 |
|
|
Total operating expenses |
|
| 96.8 |
|
|
|
| 93.4 |
|
|
|
| 95.5 |
|
|
|
| 93.6 |
|
|
Operating margin |
|
| 3.2 |
| % |
|
| 6.6 |
| % |
|
| 4.5 |
| % |
|
| 6.4 |
| % |
Operating margin improvedOur results declined in the thirdsecond quarter and first half of 2020 primarily due to weaker global economic conditions, increased costs to expand services, the loss of business from a large customer and the later timing of the Thanksgiving holiday, which shifted Cyber Week into December. In addition, continued mix shift to lower-yielding services and an increased competitive pricing environment negatively impacted our results during the second quarter and first half of 2020. Our results were also negatively impacted by one fewer operating day at all of our transportation segments in the first half of 2020. These items were partially offset by lower variable incentive compensation expenses and increased yields at FedEx Freight. During the second quarter of 20192020, we recorded asset impairment charges of $66 million ($50 million, net of tax, or $0.19 per diluted share) associated with the decision to permanently retire certain aircraft and related engines at FedEx Express (see “Asset Impairment Charges” below for more information).
- 37 -
The adoption of the new lease accounting standard during the second quarter and first half of 2020 resulted in a reclassification from other operating expense to rentals and landing fees expense of $44 million in the second quarter and $91 million in the first half of 2020 and maintenance and repairs expense to rentals and landing fees expense of $10 million in the second quarter and $22 million in the first half of 2020. These amounts were reclassified in order to properly align the lease and rental expenses to the appropriate line items in accordance with the new standard and are excluded from the following year-over-year expense change discussion.
Other operating expense increased 3% in the second quarter and 4% in the first half of 2020 primarily due to higher self-insurance accruals at FedEx Ground and higher outside service contract expense, including technology upgrades and regulatory and clearance cost increases at FedEx Express. Salaries and employee benefits expense decreased 2% in the first half of 2020 primarily due to lower variable incentive compensation expenses, partially offset by higher operating costsmerit increases. Depreciation and amortization expense increased 9% in purchased transportation, driven by higher rates at FedEx Groundboth the second quarter and FedEx Freight as well as expanding the FedEx Ground network operations to six days year-round, starting in January 2019. In addition, lower yields at FedEx Express negatively affected operating margin in the third quarterfirst half of 2019. Operating margin remained flat in the nine months of 20192020 primarily due to increased revenue and lower variable incentive compensation expenses, offset by higher operating costs. An overall product mix shift at FedEx Express from international priority volume to international deferred volume, as well as continued softness in international volumes at FedEx Express resulting from weakening global economic conditions, negatively impacted operating margin during the third quarter and nine months of 2019.
Purchased transportation costs increased 8% in the third quarter and 12% in the nine months of 2019 primarily due to higher volumesstrategic investment programs at all of our transportation segmentssegments. Maintenance and repairs expense increased 4% in the first half of 2020 primarily due to higher aircraft maintenance expense at FedEx Express. Rentals and landing fees increased 11% in the first half of 2020 primarily due to facility expansion at all of our transportation segments. Purchased transportation costs increased 1% in the first half of 2020 primarily due to increased contractor settlement rates and higher volumes at FedEx Ground, including expanding to six-day-per-week operations year-round in January 2019. These items were partially offset by favorable exchange rates at FedEx Express, lower utilization of third-party transportation providers at FedEx Freight and FedEx Express and decreased fuel costs at FedEx Ground and FedEx Freight, reflecting the inflationary impact of the tight labor market on our rates. Salaries and employee benefits expense decreased 1% in the third quarter of 2019 primarily due to lower variable incentive compensation expenses, partially offset by higher staffing to support volume growth and annual merit increases. Salaries and employee benefits expense increased 5% in the nine months of 2019 primarily due to higher staffing and merit increases, partially offset by lower variable incentive compensation expenses. Depreciation and amortization expense increased 8% in the third quarter and nine months of 2019 primarily due to continued investment in aircraft and related equipment at FedEx Express. Maintenance and repairs expense increased 5% in the third quarter and 9% in the nine months of 2019 primarily due to increased aircraft engine maintenance expense at FedEx Express.Freight.
- 36 -
The following graph for our transportation segments shows our average cost of jet and vehicle fuel per gallon for the five most recent quarters:
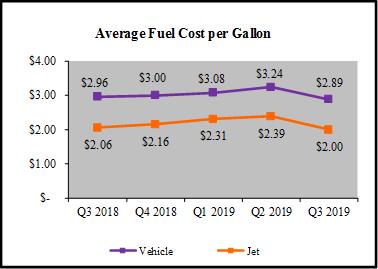
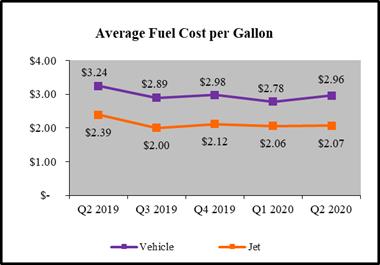
Fuel expense decreased 1%15% in the thirdsecond quarter and 14% in the first half of 20192020 primarily due to decreased fuel prices at FedEx Express, offset by higher mileage at FedEx Freight. Fuel expense increased 21% in the nine months of 2019 primarily due to increased fuel prices. However, fuel prices represent only one component of the factors we consider meaningful in understanding the impact of fuel on our business. Consideration must also be given to the fuel surcharge revenue we collect. Accordingly, we believe discussion of the net impact of fuel on our results, which is a comparison of the year-over-year change in these two factors, is important to understand the impact of fuel on our business. In order to provide information about the impact of fuel surcharges on the trend in revenue and yield growth, we have included the comparative weighted-average fuel surcharge percentages in effect for the thirdsecond quarters of 20192020 and 20182019 in the accompanying discussion of each of our transportation segments.
Most of our fuel surcharges are adjusted on a weekly basis. The fuel surcharge is based on a weekly fuel price from two weeks prior to the week in which it is assessed. Some FedEx Express international fuel surcharges incorporate a timing lag of approximately six to eight weeks.
The manner in which we purchase fuel also influences the net impact of fuel on our results. For example, our contracts for jet fuel purchases at FedEx Express are tied to various indices, including the U.S. Gulf Coast index. While many of these indices are aligned, each index may fluctuate at a different pace, driving variability in the prices paid for jet fuel. Furthermore, under these contractual arrangements, approximately 70% of our jet fuel is purchased based on the index price for the preceding week, with the remainder of our purchases tied to the index price for the preceding month and preceding day, rather than based on daily spot rates. These contractual provisions mitigate the impact of rapidly changing daily spot rates on our jet fuel purchases.
- 38 -
Because of the factors described above, our operating results may be affected should the market price of fuel suddenly change by a significant amount or change by amounts that do not result in an adjustment in our fuel surcharges, which can significantly affect our earnings either positively or negatively in the short-term.
The net impact of fuel had a slightly negative impact to operating income in the second quarter and first half of 2020 as lower fuel surcharges more than offset decreased fuel prices.
We routinely review our fuel surcharges. On March 18, 2019, we updated the tables used to determine our fuel surcharges for FedEx Express U.S. domestic services and at FedEx Ground. On September 10, 2018, we updated the tables used to determine our fuel surcharges at FedEx Express and FedEx Ground.
The net impact of fuel had a significant benefit toon operating income indescribed above and for each segment below excludes the third quarter and nine months of 2019 as higher fuel surcharges more than offset increased fuel prices.impact from these table changes.
The net impact of fuel on our operating results does not consider the effects that fuel surcharge levels may have on our business, including changes in demand and shifts in the mix of services purchased by our customers. In addition, our purchased transportation expense may be impacted by fuel costs. While fluctuations in fuel surcharge percentages can be significant from period to period, fuel surcharges represent one of the many individual components of our pricing structure that impact our overall revenue and yield. Additional components include the mix of services sold, the base price and extra service charges we obtain for these services and the level of pricing discounts offered.
- 37 -
Asset Impairment Charges
During the second quarter of 2020, we made the decision to permanently retire from service 10 Airbus A310-300 aircraft and 12 related engines at FedEx Express to align with the needs of the U.S. domestic network and modernize its aircraft fleet. As a consequence of this decision, noncash impairment charges of $66 million ($50 million, net of tax, or $0.19 per diluted share) were recorded in the FedEx Express segment in the second quarter. Seven of these aircraft were temporarily idled.
Income Taxes
Our effective tax rate was 2.1% for the second quarter and 16.8% for the first half of 2020, compared with 20.6% for the thirdsecond quarter and 21.8%22.3% for the nine monthsfirst half of 2019, compared with (137.3)% for the third quarter and (15.0)% for the nine months of 2018.2019. The 20192020 tax rates include a benefit of $90were favorably impacted by $133 million from the reduction of a valuation allowance on certain foreign tax loss carryforwards and an expensedue to operational changes which impacted the determination of $50 million from the impact on ourrealizability of the deferred taxes attributable to a recently enacted lower tax rateasset in the Netherlands.that jurisdiction. The 2020 tax rates were negatively impacted by decreased earnings in certain non-U.S. jurisdictions. The 2019 tax rates were also favorably impacted by the TCJA,Tax Cuts and Jobs Act (“TCJA”), which resulted in benefits of approximatelyan approximate $60 million during the third quarter and $230 million for the nine months of 2019, primarily from the lower statutory tax rate on fiscal 2019 earnings. The tax rate for the nine months of 2019 also benefited by approximately $60 millionbenefit from accelerated deductions claimed on our 2018 U.S. income tax return. The 2018 tax rates were favorably impacted by a provisional benefit of $1.15 billion from the remeasurement of our net U.S. deferred tax liability and a provisional benefit of $36 million from foreign tax credits exceeding the one-time transition tax on previously deferred foreign earnings. In addition to these provisional amounts, we recognized a $204 million benefit from a $1.5 billion contribution to our U.S. Pension Plansreturn filed in February 2018 and $165 million related to the phase-in of a reduced statutory tax rate on 2018 year-to-date earnings, of which approximately $120 million was recorded in the third quarter and attributable to the first half of 2018 earnings.2019.
On January 15, 2019, the U.S. Treasury Department issued final regulations covering the one-time transition tax on unrepatriated foreign earnings, which was enacted as part of the TCJA. Certain guidance included in these final regulations is inconsistent with our interpretation that led to the recognition of a $225 million ($0.94 per diluted share) benefit in 2018 (the “2018 Benefit”). Notwithstanding this inconsistency, we remain confident in our interpretation of the TCJA and intend to defend this position through litigation, if necessary. However, if we are ultimately unsuccessful in defending our position, we may be required to reverse the 2018 Benefit.
During the third quarter of 2019, we completed our accounting for the tax effects of the TCJA. No additional adjustments were made during the quarter. As a result, the only adjustment to the amounts initially recorded on a provisional basis in 2018 was a tax expense of $4 million recognized in the second quarter of 2019 as a revision of the provisional benefit associated with the remeasurement of our net U.S. deferred tax liability. See Note 1 of the accompanying unaudited condensed consolidated financial statements for further discussion.
The TCJA, enacted during the third quarter of fiscal 2018, significantly changed the U.S. corporate income tax system including, among other things, lowering the statutory federal income tax rate from 35% to 21%. Due to our May 31 fiscal year-end, the lower rate was phased in, resulting in a U.S. statutory federal rate of 29.2% for 2018 and a statutory federal rate of 21% for subsequent years.
The following table provides a reconciliation of the 2018 effective tax rates to the 2019 effective tax rates, including the impacts of the TCJA, for the periods ended February 28:
|
| Three Months Ended |
|
| Nine Months Ended |
| ||
2018 Effective Tax Rate(a) |
|
| (137.3 | )% |
|
| (15.0 | )% |
Remeasurement of net U.S. deferred tax liability in 2018 |
|
| 131.5 |
|
|
| 38.5 |
|
Effect of February 2018 pension contribution(b) |
|
| 23.3 |
|
|
| 6.8 |
|
Lower statutory tax rate on first-half 2018 earnings (35% to 29.2%)(c) |
|
| 12.5 |
|
|
| — |
|
Reduction of valuation allowance on tax loss carryforwards in 2019 |
|
| (10.3 | ) |
|
| (3.0 | ) |
Lower statutory tax rate on 2019 earnings (29.2% to 21%)(c) |
|
| (7.6 | ) |
|
| (7.6 | ) |
Remeasurement of net Dutch deferred tax asset in 2019 |
|
| 5.3 |
|
|
| 1.5 |
|
Transition tax provisional benefit in 2018 |
|
| 4.1 |
|
|
| 1.2 |
|
Foreign tax credits on foreign dividends in 2018 |
|
| 1.2 |
|
|
| 2.9 |
|
Accelerated deductions claimed in 2019 on the 2018 U.S. income tax return |
|
| — |
|
|
| (1.8 | ) |
Other, net(d) |
|
| (2.1 | ) |
|
| (1.7 | ) |
2019 Effective Tax Rate(a) |
|
| 20.6 | % |
|
| 21.8 | % |
|
|
|
|
|
|
|
|
- 38 -
We are subject to taxation in the United States and various U.S. state, local and foreign jurisdictions. We are currently under examination by the Internal Revenue Service (“IRS”) for the 2016 and 2017 tax years. In addition, during the second quarter of 2020, we have initiated appeals proceedingsreached an agreement in principle with respect to the IRS’s proposed audit adjustmentIRS Office of Appeals for the 2014 and 2015 tax years. As a result, we recorded an immaterial reduction to our liabilities for uncertain tax positions during the quarter. It is reasonably possible that certain income tax return proceedings will be completed during the next twelve months and could result in a change in our balance of unrecognized tax benefits. The impact of any changes is not expected to be material to our consolidated financial statements. As of February 28, 2019, there were no material changes to our liabilities for unrecognized tax benefits subsequent to May 31, 2018.
Business Realignment Costs
In December 2018, we announced cost-reduction programs primarily through initiatives at FedEx Express and FedEx Services in response to current business and economic conditions that include the following:
A U.S.-based voluntary employee buyout program for eligible employees;
Limited hiring in staff functions; and
Reductions in discretionary spending.
During the third quarter of 2019, we began offering voluntary cash buyouts to eligible U.S.-based employees in certain staff functions. The U.S.-based voluntary employee buyout program includes voluntary severance payments and funding to healthcare reimbursement accounts, with the voluntary severance payment calculated based on four weeks of gross base salary for every year of continuous FedEx service up to a maximum payment of two years of pay. Eligible employees will be scheduled to vacate positions in phases to ensure a smooth transition in the impacted functions so that we maintain service levels to our customers. Employees in the first phase will vacate their positions on May 31, 2019, and we expect all employees who accept the buyout to vacate their positions by the end of 2020. Costs of the benefits provided under the program will be recognized as special termination benefits in the period employees accept their offers, which is expected to be predominantly in the fourth quarter of 2019.
We incurred costs of approximately $4 million ($3 million, net of tax, or $0.01 per diluted share) during the third quarter of 2019 associated with our business realignment activities. These costs related to certain employee severance arrangements and other external costs directly attributable to our business realignment activities, such as professional fees. We expect the 2019 pre-tax cost of our business realignment activities, including the U.S.-based voluntary employee buyout program, to range from $450 million to $575 million in pre-tax cash expenditures, but actual costs will depend on acceptance rates. Severance payments will be made at the time of departure. Additional costs are expected to be incurred beyond 2019, primarily related to professional fees. We expect savings from our business realignment activities to be between $225 million to $275 million in 2020.
Outlook
We expect continued revenue and earnings growth at FedEx Freightweak macroeconomic conditions to result in the fourth quarter of 2019 to be driven by volume and yield growth. While FedEx Groundlower revenue growth is expected to remain strong infor the fourth quarterremainder of 2019,2020 at our transportation segments. In addition, a more competitive pricing environment and higher operating costs at FedEx Ground are expectedanticipated to contribute to operating income declines for the remainder of 2020.
We anticipate that continued trade tensions, softness in European and Asia Pacific markets and declines in industrial production will continue to negatively impact results, as we continue to focus on growing volumes to fill the capacity of our new six-day network. While the launch of six-day operations will continue to be a modest headwind, we believe it will allow for the more efficient use of our existing assets, which ultimately will drive improved performance and enhance our competitive position. At FedEx Ground and FedEx Freight, we will continue to concentrate on operational improvement programsresults for the remainder of 20192020. Our international operations are much more sensitive to changes in global trade than our U.S. domestic operations because of the higher concentration of business-to-business shipments internationally. The softer economic outlook is expected to create an ongoing revenue shortfall from planned levels, particularly in Europe and Asia Pacific. Furthermore, the cost of maintaining two separate networks in Europe while we execute the TNT Express integration is expected to compound the impact of the revenue shortfall on our near-term results.
In the U.S. domestic package market, incremental costs associated with modernizing our FedEx Express network and permanently expanding our FedEx Ground network operations to seven days per week year-round, combined with volume declines from the loss of a large customer, has created a near-term cost-to-volume disparity. In addition, an increasingly competitive pricing environment is expected to continue pressuring our margins. However, we are confident that are designedour investments in our U.S. domestic package operations will ultimately result in higher revenue that more than offsets the implementation costs associated with these programs.
- 39 -
In response to increase operational efficiency and safety, enhance service offeringsthe current economic conditions, we have made adjustments to our customers and manage our cost structure. We expect earningsFedEx Express U.S. domestic air network to decreasebetter match capacity with demand, as discussed in the “Asset Impairment Charges” section above. Throughout the remainder of 2020, we will make further network capacity changes at FedEx Express in the fourth quarter of 2019 due to lower yields and continued softness inby reducing international package volumes resulting from slowingflight hours. If global economic conditions particularly in Asia and Europe. As a responsedeteriorate further, we may take additional actions to these negative business trends,reduce the size of our FedEx Express network.
At FedEx Ground, we are implementing revenue-quality enhancementfocused on improving revenue quality through rate increases that will go into effect in January and cost-reduction actions; however, the full benefits of these actions will not be realized immediately.through surcharges on oversized and additional handling shipments. We are also making investments in technology aimed at improving productivity and lowering costs.
Our expectations forFor the remainder of 2019 are dependent on key external factors, including fuel prices, moderate U.S. domestic economic growth and no further weakening in international economic conditions from our current forecast.
We2020, we will continue to execute our TNT Express integration plans. The integration process is complex as it spans over 200 countriesplans and territories and involves combining our pickup-and-delivery operations at a local level, our global and regional air and ground networks, and our extensive operations, customs clearance, sales and back-office information technology systems. We have completed the operational integration in the U.S., Canada and Middle East, and expect to have the sales forces substantially integrated by the end of 2019. The sales force integration will allow both the FedEx Express and TNT Express sales teams to sell our full suite of services to customers.
- 39 -
A significant milestone in the integration includes key projects that enable the injection of FedEx Express shipments into the TNT Express European road network. This integration milestone will allow FedEx Express customers to benefit from transit time improvements for their intra-European shipments. We began rolling out this service in Europe in February 2019 and expect to have this service improvement completed in June 2019. In addition, by the end of 2020, we expect to completeare focused on completing projects across our European hub and station locations that will allow interoperability between the ground networks for both FedEx Express and TNT Express packages, which will further lower costs aspackages. In addition, we continue to focus on integrating the related FedEx Express and TNT Express linehaul and pickup-and-delivery operations are optimized.
In 2019, we have begun the operational network integration process for the key countries in Europe, which represent a significant percentage of international revenue, workforces and facilities. Integration activities in Europe are complex and require consultations with works councils and employee representatives in a number of countries. WhileBy the end of 2020, we expect European ground network interoperability to make significant progress onbe substantially completed. The next key integration activities in 2020, particularly in Europe,milestones include completing the integration work will continue intoof the FedEx Express and TNT Express linehaul and pickup-and-delivery operations and completing a single portfolio of services during 2021. We expect to complete international air network interoperability during the first half of 2022. We expect to begin realizing synergies from the combined FedEx Express/TNT Express network during 2021 once the linehaul and pickup-and-delivery networks are optimized, and expect synergy realization to increase significantly after international air network interoperability is completed.
We currently estimateexpect to incur approximately $200 million of integration expenses in the remainder of 2020 in the form of professional fees, outside service contracts, salaries and wages and other operating expense. We expect the aggregate integration program expenses, including restructuring charges at TNT Express, to exceed $1.5be approximately $1.7 billion through 2021, and we may incur additional costs, related toincluding investments that will further transform and optimize the combined business.businesses. The timing and amount of integration expenses and othercapital investments in any future period may change as we revise and implement our plans. We expect to incur approximately $435 million
Our expectations for the remainder of integration expenses2020 are dependent on key external factors, including moderate U.S. economic growth, current fuel price expectations, no further weakening in 2019, downinternational economic conditions from our previous estimate of $450 million.current forecast and no additional adverse developments in international trade policies and relations.
Other Outlook Matters. For details on key 20192020 capital projects, refer to the “Liquidity Outlook” section of this MD&A.
FedEx Ground previously announced plans to implement the Independent Service Provider (“ISP”) model throughout its entire U.S. pickup-and-delivery network. The transition to the ISP model is being accomplished on a district-by-district basis and we are now targeting the transition to be completed during the second quarter of 2020. As of February 28, 2019, over two-thirds of FedEx Ground volume was being delivered by small businesses operating under the ISP model. The costs associated with these transitions will be recognized in the periods incurred and are not expected to be material to any future quarter.
See “Forward-Looking Statements” and Part II, Item 1A “Risk Factors” for a discussion of these and other potential risks and uncertainties that could materially affect our future performance.
RECENT ACCOUNTING GUIDANCE
See Note 1 of the accompanying unaudited condensed consolidated financial statements for a discussion of recent accounting guidance.
- 40 -
REPORTABLE SEGMENTS
FedEx Express, FedEx Ground and FedEx Freight represent our major service lines and, along with FedEx Services, constitute our reportable segments. Our reportable segments include the following businesses:
FedEx Express Segment | FedEx Express (express transportation) |
| TNT Express (international express transportation, small-package ground delivery and freight transportation) |
|
|
FedEx Ground Segment | FedEx Ground (small-package ground delivery) |
|
|
FedEx Freight Segment | FedEx Freight (LTL freight transportation) |
|
|
FedEx Services Segment | FedEx Services (sales, marketing, information technology, communications, customer service, technical support, billing and collection services and back-office functions) |
|
FEDEX SERVICES SEGMENT
The operating expense line item “Intercompany charges” on the accompanying unaudited condensed consolidated financial statements of our transportation segments reflects the allocations from the FedEx Services segment to the respective transportationoperating segments. The allocations of net operating costs are based on metrics such as relative revenues or estimated services provided.
- 40 -
The FedEx Services segment provides direct and indirect support to our transportation businesses,operating segments, and we allocate all of the net operating costs of the FedEx Services segment (including the net operating results of FedEx Office) to reflect the full cost of operating our transportation businesses in the results of those segments. Within the FedEx Services segment allocation, the net operating results of FedEx Office, which are an immaterial component of our allocations, are allocated to FedEx Express and FedEx Ground. We review and evaluate the performance of our transportation segments based on operating income (inclusive of FedEx Services segment allocations). For the FedEx Services segment, performance is evaluated based on the impact of its total allocated net operating costs on our transportationoperating segments. We believe these allocations approximate the net cost of providing these functions. Our allocation methodologies are refined periodically, as necessary, to reflect changes in our businesses.
CORPORATE, OTHER AND ELIMINATIONS
Corporate and other includes corporate headquarters costs for executive officers and certain legal and finance functions, as well as certain other costs and credits not attributed to our core business. These costs are not allocated to the other business segments.
Also included in corporate and other is the FedEx LogisticsOffice operating segment, which provides an array of document and business services and retail access to our customers for our package transportation businesses, and the FedEx Logistics, Inc. operating segment, which provides integrated supply chain management solutions, specialty transportation, cross-border e-commerce technology and e-commerce transportation solutions, customs brokerage and global ocean and air freight forwarding through FedEx Trade Networks Transport & Brokerage, Inc.; cross-border enablement and technology solutions and e-commerce transportation solutions through FedEx Cross Border Technologies, Inc.; integrated supply chain management solutions through FedEx Supply Chain Distribution System, Inc. (“FedEx Supply Chain”); time-critical shipment services through FedEx Custom Critical, Inc.; and, effective September 1, 2018, critical inventory and service parts logistics, 3-D printing and technology repair through FedEx Forward Depots, Inc. (“FedEx Forward Depots”). In the third quarter and nine months of 2019, the operating loss increase in “Corporate, other and eliminations” was driven primarily by FedEx Logistics resulting from operating losses, the inclusion of FedEx Forward Depots following the realignment of FedEx Logistics and lower transportation volumes due to weakness in the global economy. In addition, costs incurred in connection with the settlement of a legal matter involving FedEx Ground, including certain professional fees, negatively impacted our results during the nine months of 2019.forwarding.
Certain FedEx operating companies provide transportation and related services for other FedEx companies outside their reportable segment. Billings for such services are based on negotiated rates, which we believe approximate fair value, and are reflected as revenues of the billing segment. These rates are adjusted from time to time based on market conditions. Such intersegment revenues and expenses are eliminated in our consolidated results and are not separately identified in the following segment information because the amounts are not material.
- 41 -
FedEx Express offers a wide range of U.S. domestic and international shipping services for delivery of packages and freight including priority, deferred and economy services, which provide delivery on a time-definite or day-definite basis. Prior year amounts have been revised to conform to the current year presentation, including revised statistical information. The following tables compare revenues, operating expenses, operating income (dollars in millions), operating margin and operating expenses as a percent of revenue for the periods ended February 28:November 30:
|
| Three Months Ended |
|
| Percent |
|
|
| Nine Months Ended |
|
| Percent |
|
|
| Three Months Ended |
|
| Percent |
|
|
| Six Months Ended |
|
| Percent |
|
| ||||||||||||||||||||||||
|
| 2019 |
|
| 2018 |
|
| Change |
|
|
| 2019 |
|
| 2018 |
|
| Change |
|
|
| 2019 |
|
| 2018 |
|
| Change |
|
|
| 2019 |
|
| 2018 |
|
| Change |
|
| ||||||||||||
Revenues: |
|
|
|
|
|
|
|
|
|
|
|
|
|
|
|
|
|
|
|
|
|
|
|
|
|
|
|
|
|
|
|
|
|
|
|
|
|
|
|
|
|
|
|
|
|
|
|
|
|
|
|
|
Package: |
|
|
|
|
|
|
|
|
|
|
|
|
|
|
|
|
|
|
|
|
|
|
|
|
|
|
|
|
|
|
|
|
|
|
|
|
|
|
|
|
|
|
|
|
|
|
|
|
|
|
|
|
U.S. overnight box |
| $ | 1,844 |
|
| $ | 1,836 |
|
|
| — |
|
|
| $ | 5,678 |
|
| $ | 5,373 |
|
|
| 6 |
|
|
| $ | 1,864 |
|
| $ | 1,948 |
|
|
| (4 | ) |
|
| $ | 3,730 |
|
| $ | 3,834 |
|
|
| (3 | ) |
|
U.S. overnight envelope |
|
| 433 |
|
|
| 435 |
|
|
| — |
|
|
|
| 1,345 |
|
|
| 1,317 |
|
|
| 2 |
|
|
|
| 457 |
|
|
| 444 |
|
|
| 3 |
|
|
|
| 936 |
|
|
| 912 |
|
|
| 3 |
|
|
U.S. deferred |
|
| 1,119 |
|
|
| 996 |
|
|
| 12 |
|
|
|
| 3,131 |
|
|
| 2,796 |
|
|
| 12 |
|
|
|
| 980 |
|
|
| 1,060 |
|
|
| (8 | ) |
|
|
| 1,936 |
|
|
| 2,012 |
|
|
| (4 | ) |
|
Total U.S. domestic package revenue |
|
| 3,396 |
|
|
| 3,267 |
|
|
| 4 |
|
|
|
| 10,154 |
|
|
| 9,486 |
|
|
| 7 |
|
|
|
| 3,301 |
|
|
| 3,452 |
|
|
| (4 | ) |
|
|
| 6,602 |
|
|
| 6,758 |
|
|
| (2 | ) |
|
International priority |
|
| 1,738 |
|
|
| 1,841 |
|
|
| (6 | ) |
|
|
| 5,508 |
|
|
| 5,469 |
|
|
| 1 |
|
|
|
| 1,817 |
|
|
| 1,896 |
|
|
| (4 | ) |
|
|
| 3,634 |
|
|
| 3,770 |
|
|
| (4 | ) |
|
International economy |
|
| 806 |
|
|
| 793 |
|
|
| 2 |
|
|
|
| 2,541 |
|
|
| 2,378 |
|
|
| 7 |
|
|
|
| 873 |
|
|
| 885 |
|
|
| (1 | ) |
|
|
| 1,728 |
|
|
| 1,735 |
|
|
| — |
|
|
Total international export package revenue |
|
| 2,544 |
|
|
| 2,634 |
|
|
| (3 | ) |
|
|
| 8,049 |
|
|
| 7,847 |
|
|
| 3 |
|
|
|
| 2,690 |
|
|
| 2,781 |
|
|
| (3 | ) |
|
|
| 5,362 |
|
|
| 5,505 |
|
|
| (3 | ) |
|
International domestic(1) |
|
| 1,078 |
|
|
| 1,140 |
|
|
| (5 | ) |
|
|
| 3,412 |
|
|
| 3,424 |
|
|
| — |
|
|
|
| 1,165 |
|
|
| 1,203 |
|
|
| (3 | ) |
|
|
| 2,241 |
|
|
| 2,334 |
|
|
| (4 | ) |
|
Total package revenue |
|
| 7,018 |
|
|
| 7,041 |
|
|
| — |
|
|
|
| 21,615 |
|
|
| 20,757 |
|
|
| 4 |
|
|
|
| 7,156 |
|
|
| 7,436 |
|
|
| (4 | ) |
|
|
| 14,205 |
|
|
| 14,597 |
|
|
| (3 | ) |
|
Freight: |
|
|
|
|
|
|
|
|
|
|
|
|
|
|
|
|
|
|
|
|
|
|
|
|
|
|
|
|
|
|
|
|
|
|
|
|
|
|
|
|
|
|
|
|
|
|
|
|
|
|
|
|
U.S. |
|
| 772 |
|
|
| 739 |
|
|
| 4 |
|
|
|
| 2,294 |
|
|
| 2,040 |
|
|
| 12 |
|
|
|
| 698 |
|
|
| 792 |
|
|
| (12 | ) |
|
|
| 1,393 |
|
|
| 1,522 |
|
|
| (8 | ) |
|
International priority |
|
| 477 |
|
|
| 532 |
|
|
| (10 | ) |
|
|
| 1,574 |
|
|
| 1,527 |
|
|
| 3 |
|
|
|
| 473 |
|
|
| 564 |
|
|
| (16 | ) |
|
|
| 937 |
|
|
| 1,097 |
|
|
| (15 | ) |
|
International economy |
|
| 495 |
|
|
| 492 |
|
|
| 1 |
|
|
|
| 1,568 |
|
|
| 1,354 |
|
|
| 16 |
|
|
|
| 541 |
|
|
| 554 |
|
|
| (2 | ) |
|
|
| 1,057 |
|
|
| 1,073 |
|
|
| (1 | ) |
|
International airfreight |
|
| 76 |
|
|
| 93 |
|
|
| (18 | ) |
|
|
| 244 |
|
|
| 276 |
|
|
| (12 | ) |
|
|
| 70 |
|
|
| 83 |
|
|
| (16 | ) |
|
|
| 136 |
|
|
| 168 |
|
|
| (19 | ) |
|
Total freight revenue |
|
| 1,820 |
|
|
| 1,856 |
|
|
| (2 | ) |
|
|
| 5,680 |
|
|
| 5,197 |
|
|
| 9 |
|
|
|
| 1,782 |
|
|
| 1,993 |
|
|
| (11 | ) |
|
|
| 3,523 |
|
|
| 3,860 |
|
|
| (9 | ) |
|
Other |
|
| 167 |
|
|
| 201 |
|
|
| (17 | ) |
|
|
| 536 |
|
|
| 620 |
|
|
| (14 | ) |
|
|
| 146 |
|
|
| 175 |
|
|
| (17 | ) |
|
|
| 301 |
|
|
| 369 |
|
|
| (18 | ) |
|
Total revenues |
|
| 9,005 |
|
|
| 9,098 |
|
|
| (1 | ) |
|
|
| 27,831 |
|
|
| 26,574 |
|
|
| 5 |
|
|
|
| 9,084 |
|
|
| 9,604 |
|
|
| (5 | ) |
|
|
| 18,029 |
|
|
| 18,826 |
|
|
| (4 | ) |
|
Operating expenses: |
|
|
|
|
|
|
|
|
|
|
|
|
|
|
|
|
|
|
|
|
|
|
|
|
|
|
|
|
|
|
|
|
|
|
|
|
|
|
|
|
|
|
|
|
|
|
|
|
|
|
|
|
Salaries and employee benefits |
|
| 3,389 |
|
|
| 3,493 |
|
|
| (3 | ) |
|
|
| 10,303 |
|
|
| 10,046 |
|
|
| 3 |
|
|
|
| 3,405 |
|
|
| 3,441 |
|
|
| (1 | ) |
|
|
| 6,777 |
|
|
| 6,914 |
|
|
| (2 | ) |
|
Purchased transportation |
|
| 1,267 |
|
|
| 1,285 |
|
|
| (1 | ) |
|
|
| 3,928 |
|
|
| 3,773 |
|
|
| 4 |
|
|
|
| 1,267 |
|
|
| 1,354 |
|
|
| (6 | ) |
|
|
| 2,499 |
|
|
| 2,661 |
|
|
| (6 | ) |
|
Rentals and landing fees |
|
| 504 |
|
|
| 526 |
|
|
| (4 | ) |
|
|
| 1,448 |
|
|
| 1,502 |
|
|
| (4 | ) |
|
|
| 505 |
|
|
| 474 |
|
|
| 7 |
|
|
|
| 1,018 |
|
|
| 944 |
|
|
| 8 |
|
|
Depreciation and amortization |
|
| 456 |
|
|
| 423 |
|
|
| 8 |
|
|
|
| 1,341 |
|
|
| 1,248 |
|
|
| 7 |
|
|
|
| 469 |
|
|
| 449 |
|
|
| 4 |
|
|
|
| 931 |
|
|
| 885 |
|
|
| 5 |
|
|
Fuel |
|
| 771 |
|
|
| 782 |
|
|
| (1 | ) |
|
|
| 2,515 |
|
|
| 2,088 |
|
|
| 20 |
|
|
|
| 754 |
|
|
| 899 |
|
|
| (16 | ) |
|
|
| 1,497 |
|
|
| 1,744 |
|
|
| (14 | ) |
|
Maintenance and repairs |
|
| 433 |
|
|
| 419 |
|
|
| 3 |
|
|
|
| 1,449 |
|
|
| 1,323 |
|
|
| 10 |
|
|
|
| 514 |
|
|
| 514 |
|
|
| — |
|
|
|
| 1,031 |
|
|
| 1,016 |
|
|
| 1 |
|
|
Asset impairment charges |
|
| 66 |
|
|
| — |
|
| NM |
|
|
|
| 66 |
|
|
| — |
|
| NM |
|
| ||||||||||||||||||||||||||||
Intercompany charges |
|
| 505 |
|
|
| 536 |
|
|
| (6 | ) |
|
|
| 1,571 |
|
|
| 1,547 |
|
|
| 2 |
|
|
|
| 500 |
|
|
| 517 |
|
|
| (3 | ) |
|
|
| 969 |
|
|
| 1,035 |
|
|
| (6 | ) |
|
Other |
|
| 1,310 |
|
|
| 1,317 |
|
|
| (1 | ) |
|
|
| 3,919 |
|
|
| 3,809 |
|
|
| 3 |
|
|
|
| 1,368 |
|
|
| 1,326 |
|
|
| 3 |
|
|
|
| 2,720 |
|
|
| 2,609 |
|
|
| 4 |
|
|
Total operating expenses |
|
| 8,635 |
|
|
| 8,781 |
|
|
| (2 | ) |
|
|
| 26,474 |
|
|
| 25,336 |
|
|
| 4 |
|
|
|
| 8,848 |
|
|
| 8,974 |
|
|
| (1 | ) |
|
|
| 17,508 |
|
|
| 17,808 |
|
|
| (2 | ) |
|
Operating income |
| $ | 370 |
|
| $ | 317 |
|
|
| 17 |
|
|
| $ | 1,357 |
|
| $ | 1,238 |
|
|
| 10 |
|
|
| $ | 236 |
|
| $ | 630 |
|
|
| (63 | ) |
|
| $ | 521 |
|
| $ | 1,018 |
|
|
| (49 | ) |
|
Operating margin |
|
| 4.1 | % |
|
| 3.5 | % |
|
| 60 |
| bp |
|
| 4.9 | % |
|
| 4.7 | % |
|
| 20 |
| bp |
|
| 2.6 | % |
|
| 6.6 | % |
|
| (400 | ) | bp |
|
| 2.9 | % |
|
| 5.4 | % |
|
| (250 | ) | bp |
| (1) | International domestic revenues relate to our international intra-country operations. |
- 42 -
| Percent of Revenue |
|
|
| Percent of Revenue |
|
| |||||||||||||||||||||||||||||||||
|
| Three Months Ended |
|
| Nine Months Ended |
|
|
| Three Months Ended |
|
| Six Months Ended |
|
| ||||||||||||||||||||||||||
|
| 2019 |
|
| 2018 |
|
|
| 2019 |
|
| 2018 |
|
|
| 2019 |
|
| 2018 |
|
|
| 2019 |
|
| 2018 |
|
| ||||||||||||
Operating expenses: |
|
|
|
|
|
|
|
|
|
|
|
|
|
|
|
|
|
|
|
|
|
|
|
|
|
|
|
|
|
|
|
|
|
| ||||||
Salaries and employee benefits |
|
| 37.6 |
| % |
|
| 38.4 |
| % |
|
| 37.0 |
| % |
|
| 37.8 |
| % |
|
| 37.5 |
| % |
|
| 35.8 |
| % |
|
| 37.6 |
| % |
|
| 36.7 |
| % |
Purchased transportation |
|
| 14.1 |
|
|
| 14.1 |
|
|
| 14.1 |
|
|
| 14.2 |
|
|
|
| 13.9 |
|
|
| 14.1 |
|
|
| 13.9 |
|
|
| 14.1 |
|
| ||||||
Rentals and landing fees |
|
| 5.6 |
|
|
| 5.8 |
|
|
| 5.2 |
|
|
| 5.6 |
|
|
|
| 5.6 |
|
|
| 4.9 |
|
|
| 5.6 |
|
|
| 5.0 |
|
| ||||||
Depreciation and amortization |
|
| 5.1 |
|
|
| 4.6 |
|
|
| 4.8 |
|
|
| 4.7 |
|
|
|
| 5.2 |
|
|
| 4.7 |
|
|
| 5.1 |
|
|
| 4.7 |
|
| ||||||
Fuel |
|
| 8.6 |
|
|
| 8.6 |
|
|
| 9.1 |
|
|
| 7.9 |
|
|
|
| 8.3 |
|
|
| 9.4 |
|
|
| 8.3 |
|
|
| 9.3 |
|
| ||||||
Maintenance and repairs |
|
| 4.8 |
|
|
| 4.6 |
|
|
| 5.2 |
|
|
| 5.0 |
|
|
|
| 5.6 |
|
|
| 5.3 |
|
|
| 5.7 |
|
|
| 5.4 |
|
| ||||||
Asset impairment charges |
|
| 0.7 |
|
|
| — |
|
|
| 0.4 |
|
|
| — |
|
| |||||||||||||||||||||||
Intercompany charges |
|
| 5.6 |
|
|
| 5.9 |
|
|
| 5.6 |
|
|
| 5.8 |
|
|
|
| 5.5 |
|
|
| 5.4 |
|
|
| 5.4 |
|
|
| 5.5 |
|
| ||||||
Other |
|
| 14.5 |
|
|
| 14.5 |
|
|
| 14.1 |
|
|
| 14.3 |
|
|
|
| 15.1 |
|
|
| 13.8 |
|
|
| 15.1 |
|
|
| 13.9 |
|
| ||||||
Total operating expenses |
|
| 95.9 |
|
|
| 96.5 |
|
|
| 95.1 |
|
|
| 95.3 |
|
|
|
| 97.4 |
|
|
| 93.4 |
|
|
| 97.1 |
|
|
| 94.6 |
|
| ||||||
Operating margin |
|
| 4.1 |
| % |
|
| 3.5 |
| % |
|
| 4.9 |
| % |
|
| 4.7 |
| % |
|
| 2.6 |
| % |
|
| 6.6 |
| % |
|
| 2.9 |
| % |
|
| 5.4 |
| % |
The following table compares selected statistics (in thousands, except yield amounts) for the periods ended February 28:
November 30:
|
| Three Months Ended |
|
| Percent |
|
| Nine Months Ended |
|
| Percent |
|
| Three Months Ended |
|
| Percent |
|
| Six Months Ended |
|
| Percent |
| ||||||||||||||||||||||||
|
| 2019 |
|
| 2018 |
|
| Change |
|
| 2019 |
|
| 2018 |
|
| Change |
|
| 2019 |
|
| 2018 |
|
| Change |
|
| 2019 |
|
| 2018 |
|
| Change |
| ||||||||||||
Package Statistics |
|
|
|
|
|
|
|
|
|
|
|
|
|
|
|
|
|
|
|
|
|
|
|
|
|
|
|
|
|
|
|
|
|
|
|
|
|
|
|
|
|
|
|
|
|
|
|
|
Average daily package volume (ADV): |
|
|
|
|
|
|
|
|
|
|
|
|
|
|
|
|
|
|
|
|
|
|
|
|
|
|
|
|
|
|
|
|
|
|
|
|
|
|
|
|
|
|
|
|
|
|
|
|
U.S. overnight box |
|
| 1,307 |
|
|
| 1,315 |
|
|
| (1 | ) |
|
| 1,282 |
|
|
| 1,249 |
|
|
| 3 |
|
|
| 1,244 |
|
|
| 1,308 |
|
|
| (5 | ) |
|
| 1,231 |
|
|
| 1,269 |
|
|
| (3 | ) |
U.S. overnight envelope |
|
| 524 |
|
|
| 541 |
|
|
| (3 | ) |
|
| 536 |
|
|
| 548 |
|
|
| (2 | ) |
|
| 547 |
|
|
| 532 |
|
|
| 3 |
|
|
| 554 |
|
|
| 541 |
|
|
| 2 |
|
U.S. deferred |
|
| 1,224 |
|
|
| 1,026 |
|
|
| 19 |
|
|
| 1,071 |
|
|
| 946 |
|
|
| 13 |
|
|
| 1,012 |
|
|
| 1,082 |
|
|
| (6 | ) |
|
| 994 |
|
|
| 998 |
|
|
| — |
|
Total U.S. domestic ADV |
|
| 3,055 |
|
|
| 2,882 |
|
|
| 6 |
|
|
| 2,889 |
|
|
| 2,743 |
|
|
| 5 |
|
|
| 2,803 |
|
|
| 2,922 |
|
|
| (4 | ) |
|
| 2,779 |
|
|
| 2,808 |
|
|
| (1 | ) |
International priority |
|
| 530 |
|
|
| 537 |
|
|
| (1 | ) |
|
| 537 |
|
|
| 532 |
|
|
| 1 |
|
|
| 565 |
|
|
| 555 |
|
|
| 2 |
|
|
| 548 |
|
|
| 540 |
|
|
| 1 |
|
International economy |
|
| 289 |
|
|
| 266 |
|
|
| 9 |
|
|
| 289 |
|
|
| 265 |
|
|
| 9 |
|
|
| 315 |
|
|
| 302 |
|
|
| 4 |
|
|
| 304 |
|
|
| 289 |
|
|
| 5 |
|
Total international export ADV |
|
| 819 |
|
|
| 803 |
|
|
| 2 |
|
|
| 826 |
|
|
| 797 |
|
|
| 4 |
|
|
| 880 |
|
|
| 857 |
|
|
| 3 |
|
|
| 852 |
|
|
| 829 |
|
|
| 3 |
|
International domestic(1) |
|
| 2,410 |
|
|
| 2,467 |
|
|
| (2 | ) |
|
| 2,491 |
|
|
| 2,473 |
|
|
| 1 |
|
|
| 2,669 |
|
|
| 2,670 |
|
|
| — |
|
|
| 2,509 |
|
|
| 2,530 |
|
|
| (1 | ) |
Total ADV |
|
| 6,284 |
|
|
| 6,152 |
|
|
| 2 |
|
|
| 6,206 |
|
|
| 6,013 |
|
|
| 3 |
|
|
| 6,352 |
|
|
| 6,449 |
|
|
| (2 | ) |
|
| 6,140 |
|
|
| 6,167 |
|
|
| — |
|
Revenue per package (yield): |
|
|
|
|
|
|
|
|
|
|
|
|
|
|
|
|
|
|
|
|
|
|
|
|
|
|
|
|
|
|
|
|
|
|
|
|
|
|
|
|
|
|
|
|
|
|
|
|
U.S. overnight box |
| $ | 22.75 |
|
| $ | 22.53 |
|
|
| 1 |
|
| $ | 23.32 |
|
| $ | 22.64 |
|
|
| 3 |
|
| $ | 23.78 |
|
| $ | 23.63 |
|
|
| 1 |
|
| $ | 23.86 |
|
| $ | 23.60 |
|
|
| 1 |
|
U.S. overnight envelope |
|
| 13.31 |
|
|
| 12.97 |
|
|
| 3 |
|
|
| 13.21 |
|
|
| 12.64 |
|
|
| 5 |
|
|
| 13.26 |
|
|
| 13.24 |
|
|
| — |
|
|
| 13.29 |
|
|
| 13.16 |
|
|
| 1 |
|
U.S. deferred |
|
| 14.76 |
|
|
| 15.66 |
|
|
| (6 | ) |
|
| 15.38 |
|
|
| 15.56 |
|
|
| (1 | ) |
|
| 15.39 |
|
|
| 15.54 |
|
|
| (1 | ) |
|
| 15.34 |
|
|
| 15.75 |
|
|
| (3 | ) |
U.S. domestic composite |
|
| 17.93 |
|
|
| 18.29 |
|
|
| (2 | ) |
|
| 18.50 |
|
|
| 18.20 |
|
|
| 2 |
|
|
| 18.70 |
|
|
| 18.75 |
|
|
| — |
|
|
| 18.71 |
|
|
| 18.80 |
|
|
| — |
|
International priority |
|
| 52.95 |
|
|
| 55.25 |
|
|
| (4 | ) |
|
| 54.01 |
|
|
| 54.10 |
|
|
| — |
|
|
| 51.03 |
|
|
| 54.25 |
|
|
| (6 | ) |
|
| 52.25 |
|
|
| 54.52 |
|
|
| (4 | ) |
International economy |
|
| 44.94 |
|
|
| 48.01 |
|
|
| (6 | ) |
|
| 46.28 |
|
|
| 47.24 |
|
|
| (2 | ) |
|
| 43.94 |
|
|
| 46.45 |
|
|
| (5 | ) |
|
| 44.71 |
|
|
| 46.92 |
|
|
| (5 | ) |
International export composite |
|
| 50.12 |
|
|
| 52.85 |
|
|
| (5 | ) |
|
| 51.31 |
|
|
| 51.82 |
|
|
| (1 | ) |
|
| 48.49 |
|
|
| 51.50 |
|
|
| (6 | ) |
|
| 49.55 |
|
|
| 51.87 |
|
|
| (4 | ) |
International domestic(1) |
|
| 7.21 |
|
|
| 7.45 |
|
|
| (3 | ) |
|
| 7.21 |
|
|
| 7.29 |
|
|
| (1 | ) |
|
| 6.92 |
|
|
| 7.15 |
|
|
| (3 | ) |
|
| 7.03 |
|
|
| 7.21 |
|
|
| (2 | ) |
Composite package yield |
|
| 18.01 |
|
|
| 18.46 |
|
|
| (2 | ) |
|
| 18.33 |
|
|
| 18.17 |
|
|
| 1 |
|
| $ | 17.88 |
|
| $ | 18.30 |
|
|
| (2 | ) |
| $ | 18.21 |
|
| $ | 18.49 |
|
|
| (2 | ) |
Freight Statistics |
|
|
|
|
|
|
|
|
|
|
|
|
|
|
|
|
|
|
|
|
|
|
|
|
|
|
|
|
|
|
|
|
|
|
|
|
|
|
|
|
|
|
|
|
|
|
|
|
Average daily freight pounds: |
|
|
|
|
|
|
|
|
|
|
|
|
|
|
|
|
|
|
|
|
|
|
|
|
|
|
|
|
|
|
|
|
|
|
|
|
|
|
|
|
|
|
|
|
|
|
|
|
U.S. |
|
| 8,905 |
|
|
| 8,757 |
|
|
| 2 |
|
|
| 8,705 |
|
|
| 8,311 |
|
|
| 5 |
|
|
| 8,364 |
|
|
| 8,917 |
|
|
| (6 | ) |
|
| 8,188 |
|
|
| 8,608 |
|
|
| (5 | ) |
International priority |
|
| 5,030 |
|
|
| 5,389 |
|
|
| (7 | ) |
|
| 5,326 |
|
|
| 5,302 |
|
|
| — |
|
|
| 5,230 |
|
|
| 5,684 |
|
|
| (8 | ) |
|
| 5,010 |
|
|
| 5,469 |
|
|
| (8 | ) |
International economy |
|
| 14,067 |
|
|
| 13,209 |
|
|
| 6 |
|
|
| 14,292 |
|
|
| 12,215 |
|
|
| 17 |
|
|
| 15,241 |
|
|
| 15,373 |
|
|
| (1 | ) |
|
| 14,473 |
|
|
| 14,401 |
|
|
| — |
|
International airfreight |
|
| 1,615 |
|
|
| 1,951 |
|
|
| (17 | ) |
|
| 1,697 |
|
|
| 1,982 |
|
|
| (14 | ) |
|
| 1,726 |
|
|
| 1,759 |
|
|
| (2 | ) |
|
| 1,640 |
|
|
| 1,738 |
|
|
| (6 | ) |
Total average daily freight pounds |
|
| 29,617 |
|
|
| 29,306 |
|
|
| 1 |
|
|
| 30,020 |
|
|
| 27,810 |
|
|
| 8 |
|
|
| 30,561 |
|
|
| 31,733 |
|
|
| (4 | ) | �� |
| 29,311 |
|
|
| 30,216 |
|
|
| (3 | ) |
Revenue per pound (yield): |
|
|
|
|
|
|
|
|
|
|
|
|
|
|
|
|
|
|
|
|
|
|
|
|
|
|
|
|
|
|
|
|
|
|
|
|
|
|
|
|
|
|
|
|
|
|
|
|
U.S. |
| $ | 1.40 |
|
| $ | 1.36 |
|
|
| 3 |
|
| $ | 1.39 |
|
| $ | 1.29 |
|
|
| 8 |
|
| $ | 1.32 |
|
| $ | 1.41 |
|
|
| (6 | ) |
| $ | 1.34 |
|
| $ | 1.38 |
|
|
| (3 | ) |
International priority |
|
| 1.53 |
|
|
| 1.60 |
|
|
| (4 | ) |
|
| 1.56 |
|
|
| 1.52 |
|
|
| 3 |
|
|
| 1.43 |
|
|
| 1.57 |
|
|
| (9 | ) |
|
| 1.47 |
|
|
| 1.57 |
|
|
| (6 | ) |
International economy |
|
| 0.57 |
|
|
| 0.60 |
|
|
| (5 | ) |
|
| 0.58 |
|
|
| 0.58 |
|
|
| — |
|
|
| 0.56 |
|
|
| 0.57 |
|
|
| (2 | ) |
|
| 0.57 |
|
|
| 0.58 |
|
|
| (2 | ) |
International airfreight |
|
| 0.76 |
|
|
| 0.77 |
|
|
| (1 | ) |
|
| 0.76 |
|
|
| 0.73 |
|
|
| 4 |
|
|
| 0.65 |
|
|
| 0.75 |
|
|
| (13 | ) |
|
| 0.65 |
|
|
| 0.75 |
|
|
| (13 | ) |
Composite freight yield |
|
| 0.99 |
|
|
| 1.02 |
|
|
| (3 | ) |
|
| 1.00 |
|
|
| 0.98 |
|
|
| 2 |
|
| $ | 0.93 |
|
| $ | 1.00 |
|
|
| (7 | ) |
| $ | 0.95 |
|
| $ | 1.00 |
|
|
| (5 | ) |
| (1) | International domestic statistics relate to our international intra-country operations. |
- 43 -
FedEx Express Segment Revenues
FedEx Express segment revenues decreased 1%5% in the thirdsecond quarter and 4% in the first half of 20192020 primarily due to the loss of business from a large customer, macroeconomic weakness and trade uncertainty resulting in lower international package yields driven byfreight revenue, lower fuel surcharges and unfavorable exchange rates, lower base rates and decreased weights. Currency exchange rates had a negative impact on revenues but did not have an impact on operating income in the third quarter of 2019.rates. In addition, lower U.S. domestic package yields due to decreased weight and increased deferred volumeone fewer operating day contributed to the decline in the thirdfirst half of 2020.
Freight yields decreased 7% in the second quarter and 5% in the first half of 2019.2020 primarily due to base yield declines, lower fuel surcharges and unfavorable exchange rates. Average daily freight pounds decreased 4% in the second quarter and 3% in the first half of 2020 primarily due to lower volume in freight services as a result of macroeconomic weakness and trade uncertainty. U.S. domestic package volume growth partially offset these negative impacts. FedEx Express segment revenues increased 5% in the nine months of 2019 primarily due to U.S. domestic package volume growth and international package and freight volume recovery from the NotPetya cyberattack. Continued softness in international package volumes resulting from weakening global economic conditions negatively impacted revenues for the third quarter and nine months of 2019. Higher fuel surcharges positively impacted revenueyields remained flat in both the thirdsecond quarter and the nine monthsfirst half of 2019.
2020 as base rate improvement was offset by lower package weights and lower fuel surcharges. U.S. domestic package average daily volumes increaseddecreased 4% in the second quarter and 1% in the first half of 2020 driven by the loss of business from a large customer, partially offset by growth in overnight and deferred volume from other customers. International export package yields decreased 6% in the third quarter and 5% in the nine months of 2019 driven by deferred services, as e-commerce continues to drive growth. U.S. domestic package yields decreased 2% in the third quarter of 2019 primarily due to base yield declines driven by lower package weights and increased deferred volume. U.S. domestic package yields increased 2% in the nine months of 2019 driven primarily by higher fuel surcharges. Average daily freight pounds increased 1% in the third quarter and 8% in the nine months of 2019 primarily due to higher volume in international freight services, reflecting recovery from the NotPetya cyberattack and an overall product mix shift from package to freight. Freight yields decreased 3% in the third quarter of 2019 primarily due to unfavorable exchange rates, partially offset by higher fuel surcharges. Freight yields increased 2% in the nine months of 2019 primarily due to higher fuel surcharges on U.S. domestic freight services. International export average daily volumes increased 2% in the thirdsecond quarter and 4% in the nine monthsfirst half of 2019 primarily due to2020 driven by base yield declines, lower fuel surcharges and unfavorable exchange rates. International export package average daily volumes increased 3% in both the recovery from the NotPetya cyberattack.second quarter and first half of 2020 led by volume growth in Europe. However, international package volume growth has slowed across most regions as discussed above.a result of macroeconomic weakness and trade uncertainty. International exportdomestic package yields decreased 5%3% in the thirdsecond quarter and 2% in the first half of 2020 as base yield improvement was more than offset by unfavorable exchange rates. International domestic package average daily volumes remained flat in the second quarter and decreased 1% in the nine monthsfirst half of 2019 driven by base2020 primarily due to targeted yield declines and unfavorable exchange rates, partially offset by higher fuel surcharges.management actions.
FedEx Express’s U.S. domestic and outbound fuel surcharge and international fuel surchargessurcharge ranged as follows for the periods ended February 28:
November 30:
|
| Three Months Ended |
|
| Nine Months Ended |
|
| Three Months Ended |
|
| Six Months Ended |
| ||||||||||||||||||||
|
| 2019 |
|
| 2018 |
|
| 2019 |
|
| 2018 |
|
| 2019 |
|
| 2018 |
|
| 2019 |
|
| 2018 |
| ||||||||
U.S. Domestic and Outbound Fuel Surcharge: |
|
|
|
|
|
|
|
|
|
|
|
|
|
|
|
|
|
|
|
|
|
|
|
|
|
|
|
|
|
|
|
|
Low |
|
| 5.47 | % |
|
| 5.05 | % |
|
| 5.47 | % |
|
| 2.21 | % |
|
| 7.21 | % |
|
| 7.90 | % |
|
| 7.21 | % |
|
| 7.02 | % |
High |
|
| 8.23 |
|
|
| 5.91 |
|
|
| 10.80 |
|
|
| 5.91 |
|
|
| 8.45 |
|
|
| 10.80 |
|
|
| 8.45 |
|
|
| 10.80 |
|
Weighted-average |
|
| 6.21 |
|
|
| 5.56 |
|
|
| 7.32 |
|
|
| 4.31 |
|
|
| 7.53 |
|
|
| 8.60 |
|
|
| 7.54 |
|
|
| 7.87 |
|
International Fuel Surcharges: |
|
|
|
|
|
|
|
|
|
|
|
|
|
|
|
| ||||||||||||||||
International Export and Freight Fuel Surcharge: |
|
|
|
|
|
|
|
|
|
|
|
|
|
|
|
| ||||||||||||||||
Low |
|
| 6.22 |
|
|
| 6.25 |
|
|
| 6.22 |
|
|
| 3.38 |
|
|
| 6.74 |
|
|
| 8.32 |
|
|
| 6.74 |
|
|
| 8.12 |
|
High |
|
| 17.88 |
|
|
| 15.87 |
|
|
| 18.82 |
|
|
| 15.87 |
|
|
| 18.56 |
|
|
| 17.81 |
|
|
| 18.56 |
|
|
| 18.09 |
|
Weighted-average |
|
| 14.89 |
|
|
| 12.24 |
|
|
| 16.05 |
|
|
| 10.53 |
|
|
| 15.64 |
|
|
| 14.87 |
|
|
| 15.59 |
|
|
| 14.74 |
|
International Domestic Fuel Surcharge: |
|
|
|
|
|
|
|
|
|
|
|
|
|
|
|
| ||||||||||||||||
Low |
|
| 3.20 |
|
|
| 2.57 |
|
|
| 3.20 |
|
|
| 2.25 |
| ||||||||||||||||
High |
|
| 19.40 |
|
|
| 19.40 |
|
|
| 19.47 |
|
|
| 19.40 |
| ||||||||||||||||
Weighted-average |
|
| 7.29 |
|
|
| 6.07 |
|
|
| 7.39 |
|
|
| 5.88 |
| ||||||||||||||||
EffectiveOn September 16, 2019, FedEx Express announced a 4.9% average list price increase for U.S. domestic, U.S. export and U.S. import services effective January 6, 2020. On March 18, 2019, we updated the tables used to determine our fuel surcharges for FedEx Express U.S. domestic services. On January 7, 2019, FedEx Express implemented a 4.9% average list price increase for U.S. domestic, U.S. export and U.S. import services. On January 1,September 10, 2018, we updated the tables used to determine our fuel surcharges at FedEx Express implemented a 4.9% average list price increase for U.S. domestic, U.S. export and U.S. import services.Express.
FedEx Express Segment Operating Income
FedEx Express segment operating income increased 17%decreased 63% in the thirdsecond quarter and 49% in the first half of 2020 primarily due to weaker global economic conditions and the loss of business from a large customer. In addition, continued mix shift to lower-yielding services and an increased competitive pricing environment negatively impacted our results during the second quarter and first half of 2020. Operating income and operating margin were negatively impacted by one fewer operating day in the first half of 2020. During the second quarter of 2019 due2020, we recorded asset impairment charges of $66 million associated with the decision to lower variable incentive compensation expenses, the favorable net impact of fuelpermanently retire certain aircraft and volume growth, partially offset by lower package yields. FedEx Express segment operating income increased 10% in the nine months of 2019 due to the favorable net impact of fuel, higher revenues and lower variable incentive compensation expenses, partially offset by higher operating costs in salaries and employee benefits, purchased transportation, maintenance and repairs and depreciation and amortization. related engines (see “Asset Impairment Charges” above for more information).Lower variable incentive compensation expenses benefited operating margin and operating income comparisons by approximately $35 million in the second quarter and $200 million in the third quarter and the nine monthsfirst half of 2019. An overall product mix shift from international package volume to international freight volume, growth in deferred services driven by e-commerce and continued softness in international volumes partially offset the operating income and operating margin increases in the third quarter and nine months of 2019. The NotPetya cyberattack discussed above drove lower results in the nine months of 2018.2020.
FedEx Express segment results included approximately $56$49 million of TNT Express integration expenses in the thirdsecond quarter and $257$106 million of such expenses in the nine monthsfirst half of 2019,2020, a $30$50 million decrease from the thirdsecond quarter and a $13$95 million decrease from the nine monthsfirst half of 2018.2019.
- 44 -
The lease standard reclassification discussed in the “Overview” section above is excluded from the following year-over-year expense change discussion. Purchased transportation expense decreased 6% in both the second quarter and first half of 2020 primarily due to favorable exchange rates and lower international freight volumes, resulting in lower utilization of third-party transportation providers. Other operating expense increased 3% in the second quarter and 4% in the first half of 2020 primarily due to higher outside service contract expense, including technology upgrades and regulatory and clearance cost increases. Salaries and employee benefits expense decreased 3%2% in the third quarterfirst half of 20192020 primarily due to lower variable incentive compensation expenses. Salariesexpenses, favorable exchange rates and employee benefits increased 3%the inclusion of certain TNT Express restructuring expenses in the nine monthsfirst quarter of 2019, primarily due to merit increases and higher staffing to support volume growth, partially offset by lower variable incentive compensation expenses and favorable exchange rates. Purchased transportation expense decreased 1% in the third quarter of 2019 primarily due to favorable exchange rates, partially offset by higher volume. Purchased transportation expense increased 4% in the nine months of 2019 primarily due to higher volume, partially offset by favorable exchange rates. Maintenance and repairs expense increased 3% in the third quarter and 10% in the nine months of 2019 primarily due to increased aircraft engine maintenance expense. Depreciation and amortization expense increased 8% in the third quarter and 7% in the nine months of 2019 primarily due to continued investment in aircraft and related equipment. Intercompany charges expense declined 6% in the third quarter of 2019 due to lower variable incentive compensation expenses and spending controls at FedEx Services.merit increases.
Fuel expense decreased 1%16% in the thirdsecond quarter and 14% in the first half of 20192020 due to decreased fuel prices. Fuel expense increased 20% in the nine months of 2019 due to higher fuel prices. The net impact of fuel had a significant benefitslightly negative impact to operating income in the thirdsecond quarter and nine monthsfirst half of 2019,2020 as higherlower fuel surcharges more than offset increaseddecreased fuel prices. See the “Fuel” section of this MD&A for a description and additional discussion of the net impact of fuel on our operating results.
- 45 -
FedEx Ground service offerings include day-certain delivery to businesses in the U.S. and Canada and to 100% of U.S. residences. The following tables compare revenues, operating expenses, operating income (dollars in millions), operating margin, selected package statistics (in thousands, except yield amounts) and operating expenses as a percent of revenue for the periods ended February 28:November 30:
|
| Three Months Ended |
|
| Percent |
|
|
| Nine Months Ended |
|
| Percent |
|
|
| Three Months Ended |
|
| Percent |
|
|
| Six Months Ended |
|
| Percent |
|
| ||||||||||||||||||||||||
|
| 2019 |
|
| 2018 |
|
| Change |
|
|
| 2019 |
|
| 2018 |
|
| Change |
|
|
| 2019 |
|
| 2018 |
|
| Change |
|
|
| 2019 |
|
| 2018 |
|
| Change |
|
| ||||||||||||
Revenues |
| $ | 5,261 |
|
| $ | 4,828 |
|
|
| 9 |
|
|
| $ | 15,202 |
|
| $ | 13,598 |
|
|
| 12 |
|
|
| $ | 5,315 |
|
| $ | 5,142 |
|
|
| 3 |
|
|
| $ | 10,494 |
|
| $ | 9,941 |
|
|
| 6 |
|
|
Operating expenses: |
|
|
|
|
|
|
|
|
|
|
|
|
|
|
|
|
|
|
|
|
|
|
|
|
|
|
|
|
|
|
|
|
|
|
|
|
|
|
|
|
|
|
|
|
|
|
|
|
|
|
|
|
Salaries and employee benefits |
|
| 874 |
|
|
| 799 |
|
|
| 9 |
|
|
|
| 2,570 |
|
|
| 2,246 |
|
|
| 14 |
|
|
|
| 971 |
|
|
| 891 |
|
|
| 9 |
|
|
|
| 1,842 |
|
|
| 1,696 |
|
|
| 9 |
|
|
Purchased transportation |
|
| 2,466 |
|
|
| 2,154 |
|
|
| 14 |
|
|
|
| 6,870 |
|
|
| 5,944 |
|
|
| 16 |
|
|
|
| 2,561 |
|
|
| 2,342 |
|
|
| 9 |
|
|
|
| 4,864 |
|
|
| 4,404 |
|
|
| 10 |
|
|
Rentals |
|
| 204 |
|
|
| 192 |
|
|
| 6 |
|
|
|
| 595 |
|
|
| 566 |
|
|
| 5 |
|
|
|
| 249 |
|
|
| 200 |
|
|
| 25 |
|
|
|
| 488 |
|
|
| 391 |
|
|
| 25 |
|
|
Depreciation and amortization |
|
| 185 |
|
|
| 177 |
|
|
| 5 |
|
|
|
| 538 |
|
|
| 504 |
|
|
| 7 |
|
|
|
| 195 |
|
|
| 180 |
|
|
| 8 |
|
|
|
| 388 |
|
|
| 353 |
|
|
| 10 |
|
|
Fuel |
|
| 4 |
|
|
| 4 |
|
|
| — |
|
|
|
| 11 |
|
|
| 10 |
|
|
| 10 |
|
|
|
| 4 |
|
|
| 4 |
|
|
| — |
|
|
|
| 7 |
|
|
| 7 |
|
|
| — |
|
|
Maintenance and repairs |
|
| 86 |
|
|
| 75 |
|
|
| 15 |
|
|
|
| 247 |
|
|
| 227 |
|
|
| 9 |
|
|
|
| 98 |
|
|
| 84 |
|
|
| 17 |
|
|
|
| 185 |
|
|
| 161 |
|
|
| 15 |
|
|
Intercompany charges |
|
| 371 |
|
|
| 374 |
|
|
| (1 | ) |
|
|
| 1,162 |
|
|
| 1,099 |
|
|
| 6 |
|
|
|
| 394 |
|
|
| 390 |
|
|
| 1 |
|
|
|
| 769 |
|
|
| 778 |
|
|
| (1 | ) |
|
Other |
|
| 494 |
|
|
| 439 |
|
|
| 13 |
|
|
|
| 1,379 |
|
|
| 1,286 |
|
|
| 7 |
|
|
|
| 501 |
|
|
| 461 |
|
|
| 9 |
|
|
|
| 965 |
|
|
| 885 |
|
|
| 9 |
|
|
Total operating expenses |
|
| 4,684 |
|
|
| 4,214 |
|
|
| 11 |
|
|
|
| 13,372 |
|
|
| 11,882 |
|
|
| 13 |
|
|
|
| 4,973 |
|
|
| 4,552 |
|
|
| 9 |
|
|
|
| 9,508 |
|
|
| 8,675 |
|
|
| 10 |
|
|
Operating income |
| $ | 577 |
|
| $ | 614 |
|
|
| (6 | ) |
|
| $ | 1,830 |
|
| $ | 1,716 |
|
|
| 7 |
|
|
| $ | 342 |
|
| $ | 590 |
|
|
| (42 | ) |
|
| $ | 986 |
|
| $ | 1,266 |
|
|
| (22 | ) |
|
Operating margin |
|
| 11.0 | % |
|
| 12.7 | % |
|
| (170 | ) | bp |
|
| 12.0 | % |
|
| 12.6 | % |
|
| (60 | ) | bp |
|
| 6.4 | % |
|
| 11.5 | % |
|
| (510 | ) | bp |
|
| 9.4 | % |
|
| 12.7 | % |
|
| (330 | ) | bp |
Average daily package volume |
|
| 9,550 |
|
|
| 8,993 |
|
|
| 6 |
|
|
|
| 8,992 |
|
|
| 8,408 |
|
|
| 7 |
|
|
|
| 9,556 |
|
|
| 9,237 |
|
|
| 3 |
|
|
|
| 9,192 |
|
|
| 8,721 |
|
|
| 5 |
|
|
Revenue per package (yield) |
| $ | 8.87 |
|
| $ | 8.64 |
|
|
| 3 |
|
|
| $ | 8.88 |
|
| $ | 8.49 |
|
|
| 5 |
|
|
| $ | 8.80 |
|
| $ | 8.81 |
|
|
| — |
|
|
| $ | 8.96 |
|
| $ | 8.88 |
|
|
| 1 |
|
|
|
| Percent of Revenue |
|
|
| Percent of Revenue |
|
| ||||||||||||||||||||||||||||||||
|
| Three Months Ended |
|
| Nine Months Ended |
|
|
| Three Months Ended |
|
| Six Months Ended |
|
| ||||||||||||||||||||||||||
|
| 2019 |
|
| 2018 |
|
|
| 2019 |
|
| 2018 |
|
|
| 2019 |
|
| 2018 |
|
|
| 2019 |
|
| 2018 |
|
| ||||||||||||
Operating expenses: |
|
|
|
|
|
|
|
|
|
|
|
|
|
|
|
|
|
|
|
|
|
|
|
|
|
|
|
|
|
|
|
|
|
| ||||||
Salaries and employee benefits |
|
| 16.6 |
| % |
|
| 16.5 |
| % |
|
| 16.9 |
| % |
|
| 16.5 |
| % |
|
| 18.3 |
| % |
|
| 17.3 |
| % |
|
| 17.6 |
| % |
|
| 17.1 |
| % |
Purchased transportation |
|
| 46.9 |
|
|
| 44.6 |
|
|
| 45.2 |
|
|
| 43.7 |
|
|
|
| 48.2 |
|
|
| 45.5 |
|
|
| 46.3 |
|
|
| 44.3 |
|
| ||||||
Rentals |
|
| 3.9 |
|
|
| 4.0 |
|
|
| 3.9 |
|
|
| 4.2 |
|
|
|
| 4.7 |
|
|
| 3.9 |
|
|
| 4.6 |
|
|
| 3.9 |
|
| ||||||
Depreciation and amortization |
|
| 3.5 |
|
|
| 3.7 |
|
|
| 3.5 |
|
|
| 3.7 |
|
|
|
| 3.7 |
|
|
| 3.5 |
|
|
| 3.7 |
|
|
| 3.6 |
|
| ||||||
Fuel |
|
| 0.1 |
|
|
| 0.1 |
|
|
| 0.1 |
|
|
| 0.1 |
|
|
|
| 0.1 |
|
|
| 0.1 |
|
|
| 0.1 |
|
|
| 0.1 |
|
| ||||||
Maintenance and repairs |
|
| 1.6 |
|
|
| 1.6 |
|
|
| 1.6 |
|
|
| 1.7 |
|
|
|
| 1.8 |
|
|
| 1.6 |
|
|
| 1.8 |
|
|
| 1.6 |
|
| ||||||
Intercompany charges |
|
| 7.0 |
|
|
| 7.7 |
|
|
| 7.7 |
|
|
| 8.1 |
|
|
|
| 7.4 |
|
|
| 7.6 |
|
|
| 7.3 |
|
|
| 7.8 |
|
| ||||||
Other |
|
| 9.4 |
|
|
| 9.1 |
|
|
| 9.1 |
|
|
| 9.4 |
|
|
|
| 9.4 |
|
|
| 9.0 |
|
|
| 9.2 |
|
|
| 8.9 |
|
| ||||||
Total operating expenses |
|
| 89.0 |
|
|
| 87.3 |
|
|
| 88.0 |
|
|
| 87.4 |
|
|
|
| 93.6 |
|
|
| 88.5 |
|
|
| 90.6 |
|
|
| 87.3 |
|
| ||||||
Operating margin |
|
| 11.0 |
| % |
|
| 12.7 |
| % |
|
| 12.0 |
| % |
|
| 12.6 |
| % |
|
| 6.4 |
| % |
|
| 11.5 |
| % |
|
| 9.4 |
| % |
|
| 12.7 |
| % |
FedEx Ground Segment Revenues
FedEx Ground segment revenues increased 9%3% in the thirdsecond quarter and 12%of 2020 due to residential delivery volume growth. Revenues increased 6% in the nine monthsfirst half of 20192020 due to residential delivery volume growth and increased yields. yields, partially offset by one fewer operating day. In addition, the later timing of the Thanksgiving holiday, which shifted Cyber Week into December, as well as the loss of business from a large customer, negatively impacted revenue comparisons during the second quarter and first half of 2020.
Average daily volume increased 6%3% in the thirdsecond quarter and 7%5% in the nine monthsfirst half of 20192020 primarily due to continued growth in residential services driven by e-commerce. FedEx Ground yields increased 3%remained flat in the thirdsecond quarter and 5%of 2020 as higher base yields were offset by lower fuel surcharges. FedEx Ground yields increased 1% in the nine monthsfirst half of 20192020 primarily due to by higher fuel surcharges, product mix and base yields.
The FedEx Ground fuel surcharge is based on a rounded average of the national U.S. on-highway average price for a gallon of diesel fuel, as published by the Department of Energy. The fuel surcharge ranged as follows for the periods ended February 28:November 30:
|
| Three Months Ended |
|
| Nine Months Ended |
|
| Three Months Ended |
|
| Six Months Ended |
| ||||||||||||||||||||
|
| 2019 |
|
| 2018 |
|
| 2019 |
|
| 2018 |
|
| 2019 |
|
| 2018 |
|
| 2019 |
|
| 2018 |
| ||||||||
Low |
|
| 6.50 | % |
|
| 5.30 | % |
|
| 6.25 | % |
|
| 4.00 | % |
|
| 6.75 | % |
|
| 6.25 | % |
|
| 6.75 | % |
|
| 6.25 | % |
High |
|
| 7.50 |
|
|
| 5.80 |
|
|
| 7.75 |
|
|
| 5.80 |
|
|
| 7.00 |
|
|
| 7.75 |
|
|
| 7.25 |
|
|
| 7.75 |
|
Weighted-average |
|
| 6.84 |
|
|
| 5.50 |
|
|
| 6.86 |
|
|
| 5.00 |
|
|
| 6.92 |
|
|
| 7.40 |
|
|
| 6.98 |
|
|
| 6.87 |
|
- 46 -
Effective January 7,On September 16, 2019, FedEx Ground announced a 4.9% average list price increase.increase effective January 6, 2020. On March 18, 2019, we updated the tables used to determine our fuel surcharges at FedEx Ground. On January 1, 2018,7, 2019, FedEx Ground implemented a 4.9% average list price increase. In addition, as announced onOn September 18, 2017, dimensional weight pricing applies10, 2018, we updated the tables used to the majority ofdetermine our fuel surcharges at FedEx SmartPost shipments effective January 22, 2018.Ground.
FedEx Ground Segment Operating Income
FedEx Ground segment operating income decreased 6%42% in the thirdsecond quarter and 22% in the first half of 20192020 due to increased costs to expand services, higher operating costs driven by higher purchased transportation, resulting from increased contractor settlement ratesself-insurance accruals and expanding the operationslater timing of the FedEx Ground networkThanksgiving holiday, which shifted Cyber Week into December. In addition, the loss of business from a large customer, as well as continued mix shift to six days per week year-round starting in January 2019, staffinglower-yielding services and network expansion costs. Higher revenuesan increased competitive pricing environment, negatively impacted our results during the second quarter and the favorable net impactfirst half of fuel2020. These items were partially offset these factors. Higher operating costs also contributed toby residential delivery volume growth in both the operating margin declinesecond quarter and first half of 2020, as well as increased base yields in the third quarter and nine monthsfirst half of 2019. FedEx Ground segment operating income increased 7% in the nine months of 2019 due to volume growth, increased yields and the favorable net impact of fuel. In addition,2020. Additionally, lower variable incentive compensation expenses benefited operating income comparisons by approximately $75$10 million in the thirdsecond quarter and nine months$60 million in the first half of 2019.2020.
The lease standard reclassification discussed in the “Overview” section above is excluded from the following year-over-year expense change discussion. Purchased transportation expense increased 14%9% in the thirdsecond quarter and 16%10% in the nine monthsfirst half of 2019 primarily2020 due to higher volumes, increased contractor settlement rates and higher volumes, including expanding to six-day per week operations year-round. Higheryear-round, partially offset by decreased fuel costs also contributedcosts. Other operating expense increased 9% in both the second quarter and first half of 2020 primarily due to an increase in purchased transportation expense in the nine months of 2019.higher self-insurance accruals and increased bad debt expense. Salaries and employee benefits expense increased 9% in both the thirdsecond quarter and 14% in the nine monthsfirst half of 2019 primarily2020 due to additional staffing to support volume growth, including current and anticipated expansion of year-round operations, network expansion and merit increases, and network expansion, partially offset by lower variable incentive compensation expenses.
The net impact of fuel had a moderateslightly negative impact to operating income in the second quarter of 2020 as lower fuel surcharges more than offset decreased fuel prices. The net impact of fuel had a slight benefit to operating income in the third quarter and nine monthsfirst half of 2019,2020 as higherdecreased fuel surchargesprices more than offset increasedlower fuel prices.surcharges. See the “Fuel” section of this MD&A for a description and additional discussion of the net impact of fuel on our operating results.
Independent Contractor ModelService Provider Transition
During the second quarter of 2020, FedEx Ground is involved in lawsuits and administrative proceedings claiming that owner-operators engaged under operating agreements no longer in place should have been treated as employees of FedEx Ground, rather than independent contractors. In addition, we are defending joint-employer cases where it is alleged that FedEx Ground should be treated as an employer ofcompleted the drivers employed by owner-operators engaged by FedEx Ground. These cases are in varying stages of litigation. We will continuepreviously announced transition to vigorously defend ourselves in these proceedings and continue to believe that owner-operators engaged by FedEx Ground are properly classified as independent contractors and that FedEx Ground is not an employer or joint employer of the drivers of these independent contractors.
For additional information on the FedEx Ground ISP model, see “Other Outlook Matters” under Consolidated Results of this MD&A.Independent Service Provider agreement throughout its entire U.S. pickup-and-delivery network.
- 47 -
FedEx Freight LTL service offerings include priority services when speed is critical and economy services when time can be traded for savings. The following tables compare revenues, operating expenses, operating income (dollars in millions), operating margin, selected statistics and operating expenses as a percent of revenue for the periods ended February 28:November 30:
|
| Three Months Ended |
|
| Percent |
|
|
| Nine Months Ended |
|
| Percent |
|
|
| Three Months Ended |
|
| Percent |
|
|
| Six Months Ended |
|
| Percent |
|
| ||||||||||||||||||||||||
|
| 2019 |
|
| 2018 |
|
| Change |
|
|
| 2019 |
|
| 2018 |
|
| Change |
|
|
| 2019 |
|
| 2018 |
|
| Change |
|
|
| 2019 |
|
| 2018 |
|
| Change |
|
| ||||||||||||
Revenues |
| $ | 1,750 |
|
| $ | 1,613 |
|
|
| 8 |
|
|
| $ | 5,627 |
|
| $ | 4,950 |
|
|
| 14 |
|
|
| $ | 1,844 |
|
| $ | 1,918 |
|
|
| (4 | ) |
|
| $ | 3,749 |
|
| $ | 3,877 |
|
|
| (3 | ) |
|
Operating expenses: |
|
|
|
|
|
|
|
|
|
|
|
|
|
|
|
|
|
|
|
|
|
|
|
|
|
|
|
|
|
|
|
|
|
|
|
|
|
|
|
|
|
|
|
|
|
|
|
|
|
|
|
|
Salaries and employee benefits |
|
| 865 |
|
|
| 816 |
|
|
| 6 |
|
|
|
| 2,712 |
|
|
| 2,429 |
|
|
| 12 |
|
|
|
| 900 |
|
|
| 919 |
|
|
| (2 | ) |
|
|
| 1,819 |
|
|
| 1,847 |
|
|
| (2 | ) |
|
Purchased transportation |
|
| 213 |
|
|
| 204 |
|
|
| 4 |
|
|
|
| 722 |
|
|
| 610 |
|
|
| 18 |
|
|
|
| 187 |
|
|
| 250 |
|
|
| (25 | ) |
|
|
| 374 |
|
|
| 509 |
|
|
| (27 | ) |
|
Rentals |
|
| 45 |
|
|
| 41 |
|
|
| 10 |
|
|
|
| 129 |
|
|
| 114 |
|
|
| 13 |
|
|
|
| 52 |
|
|
| 42 |
|
|
| 24 |
|
|
|
| 104 |
|
|
| 84 |
|
|
| 24 |
|
|
Depreciation and amortization |
|
| 88 |
|
|
| 76 |
|
|
| 16 |
|
|
|
| 242 |
|
|
| 216 |
|
|
| 12 |
|
|
|
| 97 |
|
|
| 76 |
|
|
| 28 |
|
|
|
| 191 |
|
|
| 154 |
|
|
| 24 |
|
|
Fuel |
|
| 131 |
|
|
| 127 |
|
|
| 3 |
|
|
|
| 418 |
|
|
| 336 |
|
|
| 24 |
|
|
|
| 132 |
|
|
| 150 |
|
|
| (12 | ) |
|
|
| 255 |
|
|
| 287 |
|
|
| (11 | ) |
|
Maintenance and repairs |
|
| 53 |
|
|
| 52 |
|
|
| 2 |
|
|
|
| 178 |
|
|
| 167 |
|
|
| 7 |
|
|
|
| 68 |
|
|
| 63 |
|
|
| 8 |
|
|
|
| 133 |
|
|
| 125 |
|
|
| 6 |
|
|
Intercompany charges |
|
| 128 |
|
|
| 129 |
|
|
| (1 | ) |
|
|
| 403 |
|
|
| 381 |
|
|
| 6 |
|
|
|
| 130 |
|
|
| 137 |
|
|
| (5 | ) |
|
|
| 256 |
|
|
| 275 |
|
|
| (7 | ) |
|
Other |
|
| 130 |
|
|
| 119 |
|
|
| 9 |
|
|
|
| 402 |
|
|
| 375 |
|
|
| 7 |
|
|
|
| 137 |
|
|
| 133 |
|
|
| 3 |
|
|
|
| 282 |
|
|
| 272 |
|
|
| 4 |
|
|
Total operating expenses |
|
| 1,653 |
|
|
| 1,564 |
|
|
| 6 |
|
|
|
| 5,206 |
|
|
| 4,628 |
|
|
| 12 |
|
|
|
| 1,703 |
|
|
| 1,770 |
|
|
| (4 | ) |
|
|
| 3,414 |
|
|
| 3,553 |
|
|
| (4 | ) |
|
Operating income |
| $ | 97 |
|
| $ | 49 |
|
|
| 98 |
|
|
| $ | 421 |
|
| $ | 322 |
|
|
| 31 |
|
|
| $ | 141 |
|
| $ | 148 |
|
|
| (5 | ) |
|
| $ | 335 |
|
| $ | 324 |
|
|
| 3 |
|
|
Operating margin |
|
| 5.5 | % |
|
| 3.0 | % |
|
| 250 |
| bp |
|
| 7.5 | % |
|
| 6.5 | % |
|
| 100 |
| bp |
|
| 7.6 | % |
|
| 7.7 | % |
|
| (10 | ) | bp |
|
| 8.9 | % |
|
| 8.4 | % |
|
| 50 |
| bp |
Average daily shipments (in thousands): |
|
|
|
|
|
|
|
|
|
|
|
|
|
|
|
|
|
|
|
|
|
|
|
|
|
|
|
|
|
|
|
|
|
|
|
|
|
|
|
|
|
|
|
|
|
|
|
|
|
|
|
|
Priority |
|
| 73.2 |
|
|
| 69.7 |
|
|
| 5 |
|
|
|
| 78.7 |
|
|
| 73.5 |
|
|
| 7 |
|
|
|
| 77.4 |
|
|
| 81.7 |
|
|
| (5 | ) |
|
|
| 78.0 |
|
|
| 81.4 |
|
|
| (4 | ) |
|
Economy |
|
| 32.7 |
|
|
| 30.6 |
|
|
| 7 |
|
|
|
| 34.3 |
|
|
| 31.5 |
|
|
| 9 |
|
|
|
| 32.6 |
|
|
| 35.4 |
|
|
| (8 | ) |
|
|
| 32.7 |
|
|
| 35.0 |
|
|
| (7 | ) |
|
Total average daily shipments |
|
| 105.9 |
|
|
| 100.3 |
|
|
| 6 |
|
|
|
| 113.0 |
|
|
| 105.0 |
|
|
| 8 |
|
|
|
| 110.0 |
|
|
| 117.1 |
|
|
| (6 | ) |
|
|
| 110.7 |
|
|
| 116.4 |
|
|
| (5 | ) |
|
Weight per shipment (lbs): |
|
|
|
|
|
|
|
|
|
|
|
|
|
|
|
|
|
|
|
|
|
|
|
|
|
|
|
|
|
|
|
|
|
|
|
|
|
|
|
|
|
|
|
|
|
|
|
|
|
|
|
|
Priority |
|
| 1,210 |
|
|
| 1,232 |
|
|
| (2 | ) |
|
|
| 1,211 |
|
|
| 1,205 |
|
|
| — |
|
|
|
| 1,139 |
|
|
| 1,203 |
|
|
| (5 | ) |
|
|
| 1,147 |
|
|
| 1,211 |
|
|
| (5 | ) |
|
Economy |
|
| 1,106 |
|
|
| 1,133 |
|
|
| (2 | ) |
|
|
| 1,050 |
|
|
| 1,144 |
|
|
| (8 | ) |
|
|
| 983 |
|
|
| 1,043 |
|
|
| (6 | ) |
|
|
| 971 |
|
|
| 1,026 |
|
|
| (5 | ) |
|
Composite weight per shipment |
|
| 1,178 |
|
|
| 1,202 |
|
|
| (2 | ) |
|
|
| 1,162 |
|
|
| 1,187 |
|
|
| (2 | ) |
|
|
| 1,092 |
|
|
| 1,155 |
|
|
| (5 | ) |
|
|
| 1,095 |
|
|
| 1,155 |
|
|
| (5 | ) |
|
Revenue per shipment: |
|
|
|
|
|
|
|
|
|
|
|
|
|
|
|
|
|
|
|
|
|
|
|
|
|
|
|
|
|
|
|
|
|
|
|
|
|
|
|
|
|
|
|
|
|
|
|
|
|
|
|
|
Priority |
| $ | 253.35 |
|
| $ | 242.49 |
|
|
| 4 |
|
|
| $ | 249.78 |
|
| $ | 233.31 |
|
|
| 7 |
|
|
| $ | 258.90 |
|
| $ | 249.76 |
|
|
| 4 |
|
|
| $ | 257.14 |
|
| $ | 248.24 |
|
|
| 4 |
|
|
Economy |
|
| 308.44 |
|
|
| 295.31 |
|
|
| 4 |
|
|
|
| 299.17 |
|
|
| 285.99 |
|
|
| 5 |
|
|
|
| 295.29 |
|
|
| 297.73 |
|
|
| (1 | ) |
|
|
| 295.53 |
|
|
| 295.00 |
|
|
| — |
|
|
Composite revenue per shipment |
| $ | 270.82 |
|
| $ | 259.20 |
|
|
| 4 |
|
|
| $ | 264.89 |
|
| $ | 249.32 |
|
|
| 6 |
|
|
| $ | 270.38 |
|
| $ | 264.27 |
|
|
| 2 |
|
|
| $ | 268.83 |
|
| $ | 262.29 |
|
|
| 2 |
|
|
Revenue per hundredweight: |
|
|
|
|
|
|
|
|
|
|
|
|
|
|
|
|
|
|
|
|
|
|
|
|
|
|
|
|
|
|
|
|
|
|
|
|
|
|
|
|
|
|
|
|
|
|
|
|
|
|
|
|
Priority |
| $ | 20.94 |
|
| $ | 19.67 |
|
|
| 6 |
|
|
| $ | 20.63 |
|
| $ | 19.37 |
|
|
| 7 |
|
|
| $ | 22.74 |
|
| $ | 20.76 |
|
|
| 10 |
|
|
| $ | 22.41 |
|
| $ | 20.50 |
|
|
| 9 |
|
|
Economy |
|
| 27.89 |
|
|
| 26.07 |
|
|
| 7 |
|
|
|
| 28.48 |
|
|
| 24.99 |
|
|
| 14 |
|
|
|
| 30.05 |
|
|
| 28.55 |
|
|
| 5 |
|
|
|
| 30.43 |
|
|
| 28.76 |
|
|
| 6 |
|
|
Composite revenue per hundredweight |
| $ | 22.99 |
|
| $ | 21.56 |
|
|
| 7 |
|
|
| $ | 22.79 |
|
| $ | 21.01 |
|
|
| 8 |
|
|
| $ | 24.75 |
|
| $ | 22.89 |
|
|
| 8 |
|
|
| $ | 24.54 |
|
| $ | 22.71 |
|
|
| 8 |
|
|
|
| Percent of Revenue |
|
|
| Percent of Revenue |
|
| ||||||||||||||||||||||||||||||||
|
| Three Months Ended |
|
| Nine Months Ended |
|
|
| Three Months Ended |
|
| Six Months Ended |
|
| ||||||||||||||||||||||||||
|
| 2019 |
|
| 2018 |
|
|
| 2019 |
|
| 2018 |
|
|
| 2019 |
|
| 2018 |
|
|
| 2019 |
|
| 2018 |
|
| ||||||||||||
Operating expenses: |
|
|
|
|
|
|
|
|
|
|
|
|
|
|
|
|
|
|
|
|
|
|
|
|
|
|
|
|
|
|
|
|
|
| ||||||
Salaries and employee benefits |
|
| 49.4 |
| % |
|
| 50.6 |
| % |
|
| 48.2 |
| % |
|
| 49.1 |
| % |
|
| 48.8 |
| % |
|
| 47.9 |
| % |
|
| 48.5 |
| % |
|
| 47.6 |
| % |
Purchased transportation |
|
| 12.2 |
|
|
| 12.7 |
|
|
| 12.8 |
|
|
| 12.3 |
|
|
|
| 10.1 |
|
|
| 13.0 |
|
|
| 10.0 |
|
|
| 13.1 |
|
| ||||||
Rentals |
|
| 2.6 |
|
|
| 2.5 |
|
|
| 2.3 |
|
|
| 2.3 |
|
|
|
| 2.8 |
|
|
| 2.2 |
|
|
| 2.8 |
|
|
| 2.2 |
|
| ||||||
Depreciation and amortization |
|
| 5.0 |
|
|
| 4.7 |
|
|
| 4.3 |
|
|
| 4.3 |
|
|
|
| 5.3 |
|
|
| 4.0 |
|
|
| 5.1 |
|
|
| 4.0 |
|
| ||||||
Fuel |
|
| 7.5 |
|
|
| 7.9 |
|
|
| 7.4 |
|
|
| 6.8 |
|
|
|
| 7.2 |
|
|
| 7.8 |
|
|
| 6.8 |
|
|
| 7.4 |
|
| ||||||
Maintenance and repairs |
|
| 3.0 |
|
|
| 3.2 |
|
|
| 3.2 |
|
|
| 3.4 |
|
|
|
| 3.7 |
|
|
| 3.3 |
|
|
| 3.6 |
|
|
| 3.2 |
|
| ||||||
Intercompany charges |
|
| 7.3 |
|
|
| 8.0 |
|
|
| 7.2 |
|
|
| 7.7 |
|
|
|
| 7.1 |
|
|
| 7.2 |
|
|
| 6.8 |
|
|
| 7.1 |
|
| ||||||
Other |
|
| 7.5 |
|
|
| 7.4 |
|
|
| 7.1 |
|
|
| 7.6 |
|
|
|
| 7.4 |
|
|
| 6.9 |
|
|
| 7.5 |
|
|
| 7.0 |
|
| ||||||
Total operating expenses |
|
| 94.5 |
|
|
| 97.0 |
|
|
| 92.5 |
|
|
| 93.5 |
|
|
|
| 92.4 |
|
|
| 92.3 |
|
|
| 91.1 |
|
|
| 91.6 |
|
| ||||||
Operating margin |
|
| 5.5 |
| % |
|
| 3.0 |
| % |
|
| 7.5 |
| % |
|
| 6.5 |
| % |
|
| 7.6 |
| % |
|
| 7.7 |
| % |
|
| 8.9 |
| % |
|
| 8.4 |
| % |
- 48 -
FedEx Freight Segment Revenues
FedEx Freight segment revenues increased 8%decreased 4% in the thirdsecond quarter and 14%3% in the nine monthsfirst half of 20192020 due to decreased average daily shipments, partially offset by higher revenue per shipmentshipment. In addition, one fewer operating day contributed to the decline in the first half of 2020.
Average daily shipments decreased 6% in the second quarter and average daily shipments.5% in the first half of 2020 due to lower demand for our service offerings as a result of softening economic conditions. Revenue per shipment increased 4%2% in both the thirdsecond quarter and 6% in the nine monthsfirst half of 20192020 primarily due to higher base rates driven byreflecting our ongoing yield management initiatives, partially offset by lower weight per shipment and higherlower fuel surcharges. Average daily shipments increased 6% in the third quarter and 8% in the nine months of 2019 due to higher demand for our service offerings.
The weekly indexed fuel surcharge is based on the average of the U.S. on-highway prices for a gallon of diesel fuel, as published by the Department of Energy. The indexed FedEx Freight fuel surcharge ranged as follows for the periods ended February 28:November 30:
|
| Three Months Ended |
|
| Nine Months Ended |
|
| Three Months Ended |
|
| Six Months Ended |
| ||||||||||||||||||||
|
| 2019 |
|
| 2018 |
|
| 2019 |
|
| 2018 |
|
| 2019 |
|
| 2018 |
|
| 2019 |
|
| 2018 |
| ||||||||
Low |
|
| 23.40 | % |
|
| 23.10 | % |
|
| 23.40 | % |
|
| 20.90 | % |
|
| 23.50 | % |
|
| 24.90 | % |
|
| 23.50 | % |
|
| 24.60 | % |
High |
|
| 24.60 |
|
|
| 24.00 |
|
|
| 25.60 |
|
|
| 24.00 |
|
|
| 24.00 |
|
|
| 25.60 |
|
|
| 24.40 |
|
|
| 25.60 |
|
Weighted-average |
|
| 23.77 |
|
|
| 23.59 |
|
|
| 24.62 |
|
|
| 22.46 |
|
|
| 23.80 |
|
|
| 25.19 |
|
|
| 23.80 |
|
|
| 24.97 |
|
Effective January 7,On September 16, 2019, FedEx Freight announced a 5.9% average list price increase in certain U.S. and other shipping rates.rates effective January 6, 2020. On January 1, 2018,7, 2019, FedEx Freight implemented a 4.9%5.9% average list price increase in certain U.S. and other shipping rates.
FedEx Freight Segment Operating Income
FedEx Freight segment operating income increased 98% and operating margin improved 250 basis pointsdecreased 5% in the thirdsecond quarter of 2019. Additionally,2020, driven by decreased volumes resulting from softening economic conditions. FedEx Freight continues to focus on yield management, improving profit and aligning its cost structure with current and anticipated business levels, enabling FedEx Freight to significantly offset the impact of lower volumes from softening economic conditions. FedEx Freight segment operating income increased 31% and operating margin improved 100 basis points3% in the nine monthsfirst half of 2019. These positive results were achieved2020 primarily bydue to higher revenue per shipment.shipment, despite moderating volumes. In addition, lower variable incentive compensation expenses benefited operating income comparisons by approximately $40$5 million in the thirdsecond quarter and nine months$35 million in the first half of 2019.2020.
SalariesThe lease standard reclassification discussed in the “Overview” section above is excluded from the following year-over-year expense change discussion. Purchased transportation expense decreased 25% in the second quarter and employee benefits27% in the first half of 2020 primarily due to lower utilization of third-party transportation providers. Depreciation and amortization expense increased 6%28% in the thirdsecond quarter and 24% in the first half of 2020 due to investments in vehicles and trailers, as well as facility expansion.
Fuel expense decreased 12% in the nine months of 2019 reflecting higher staffing levels to support volume growthsecond quarter and merit increases, partially offset by lower variable incentive compensation expenses. Purchased transportation expense increased 4%11% in the third quarter and 18% in the nine monthsfirst half of 2019 due to increased rates and higher volumes. Higher fuel costs also contributed to an increase in purchased transportation expense in the nine months of 2019.
Fuel expense increased 3% in the third quarter of 20192020 primarily due to higher mileage. Fuel expense increased 24% in the nine months of 2019 primarily due to higherdecreased fuel prices. The net impact of fuel had a moderate benefitmoderately negative impact to operating income in the thirdsecond quarter and first half of 2019 and a significant benefit to operating income in the nine months of 20192020 as higherlower fuel surcharges more than offset increaseddecreased fuel prices. See the “Fuel” section of this MD&A for a description and additional discussion of the net impact of fuel on our operating results.
- 49 -
LIQUIDITY
Cash and cash equivalents totaled $2.9$2.0 billion at February 28,November 30, 2019, compared to $3.3$2.3 billion at May 31, 2018.2019. The following table provides a summary of our cash flows for the nine-monthsix-month periods ended February 28November 30 (in millions):
|
| 2019 |
|
| 2018 |
|
| 2019 |
|
| 2018 |
| ||||
Operating activities: |
|
|
|
|
|
|
|
|
|
|
|
|
|
|
|
|
Net income |
| $ | 2,509 |
|
| $ | 3,445 |
|
| $ | 1,305 |
|
| $ | 1,770 |
|
Noncash charges and credits |
|
| 3,099 |
|
|
| 1,691 |
|
|
| 3,322 |
|
|
| 2,140 |
|
Changes in assets and liabilities |
|
| (2,285 | ) |
|
| (3,974 | ) |
|
| (2,553 | ) |
|
| (1,731 | ) |
Cash provided by operating activities |
|
| 3,323 |
|
|
| 1,162 |
|
|
| 2,074 |
|
|
| 2,179 |
|
Investing activities: |
|
|
|
|
|
|
|
|
|
|
|
|
|
|
|
|
Capital expenditures |
|
| (3,757 | ) |
|
| (3,994 | ) |
|
| (3,266 | ) |
|
| (2,634 | ) |
Business acquisitions, net of cash acquired |
|
| — |
|
|
| (44 | ) | ||||||||
Proceeds from asset dispositions and other |
|
| 62 |
|
|
| 21 |
|
|
| 4 |
|
|
| 53 |
|
Cash used in investing activities |
|
| (3,695 | ) |
|
| (4,017 | ) |
|
| (3,262 | ) |
|
| (2,581 | ) |
Financing activities: |
|
|
|
|
|
|
|
|
|
|
|
|
|
|
|
|
Proceeds from short-term borrowings, net |
|
| 220 |
|
|
| 797 |
|
|
| 150 |
|
|
| 248 |
|
Proceeds from debt issuances |
|
| 2,463 |
|
|
| 1,481 |
|
|
| 2,093 |
|
|
| 1,233 |
|
Principal payments on debt |
|
| (874 | ) |
|
| (31 | ) |
|
| (1,021 | ) |
|
| (785 | ) |
Proceeds from stock issuances |
|
| 58 |
|
|
| 284 |
|
|
| 26 |
|
|
| 45 |
|
Dividends paid |
|
| (514 | ) |
|
| (402 | ) |
|
| (339 | ) |
|
| (173 | ) |
Purchase of treasury stock |
|
| (1,365 | ) |
|
| (558 | ) |
|
| (3 | ) |
|
| (1,271 | ) |
Other |
|
| 5 |
|
|
| 6 |
| ||||||||
Cash (used in) provided by financing activities |
|
| (7 | ) |
|
| 1,577 |
| ||||||||
Other, net |
|
| (5 | ) |
|
| 1 |
| ||||||||
Cash provided by (used in) financing activities |
|
| 901 |
|
|
| (702 | ) | ||||||||
Effect of exchange rate changes on cash |
|
| (14 | ) |
|
| 98 |
|
|
| (1 | ) |
|
| (38 | ) |
Net decrease in cash and cash equivalents |
| $ | (393 | ) |
| $ | (1,180 | ) |
| $ | (288 | ) |
| $ | (1,142 | ) |
Cash and cash equivalents at the end of period |
| $ | 2,872 |
|
| $ | 2,789 |
|
| $ | 2,031 |
|
| $ | 2,123 |
|
Cash flows from operating activities increased $2.2 billiondecreased $105 million in the nine monthsfirst half of 20192020 primarily due to lowerhigher pension contributions higherand lower net income, and decreased tax payments, partially offset by higherlower variable incentive compensation payments. Capital expenditures decreased slightlyincreased during the nine monthsfirst half of 20192020 primarily due to lower spending related to facilities, equipment and vehicles at FedEx Ground, as well as lower spending on aircraft and related equipment at FedEx Express, partially offset by increasedhigher spending related to facilities and equipmentaircraft at FedEx Express.Express, increased spending on vehicles and trailers at our transportation segments and increased spending on information technology at FedEx Services, FedEx Express and FedEx Freight. See “Capital Resources” for a discussion of capital expenditures during 20192020 and 2018.2019.
During the thirdfirst quarter of 2019,2020, we issued $1.2$2.1 billion of senior unsecured debt under our current shelf registration statement, comprised of €640 million$1.0 billion of 0.7%3.10% fixed-rate notes due in May 2022 and $500August 2029, €500 million of 3.4%0.45% fixed-rate notes due in January 2022.August 2025 and €500 million of 1.30% fixed-rate notes due in August 2031. We will useused the net proceeds to paymake voluntary contributions to our tax-qualified U.S. domestic pension plans (“U.S. Pension Plans”) during the first quarter of 2020 and to redeem the $400 million aggregate principal amount of 2.30% notes due February 1, 2020 and the €500 million aggregate principal amount of floating rate0.50% notes due at maturity on April 11, 2019, and9, 2020. The remaining net proceeds are being used for general corporate purposes.
During the second quarter of 2019, we issued $1.25 billion of senior unsecured debt under our current shelf registration statement, comprised of $400 million of 4.20% fixed-rate notes due in October 2028 and $850 million of 4.95% fixed-rate notes due in October 2048. Interest on these notes is paid semi-annually. We used the net proceeds to redeem the $750 million aggregate principal amount of 8.00% notes due January 15, 2019, and for general corporate purposes.
During the third quarter of 2019,2020, we issued commercial paper to provide us with additional short-term liquidity. As of February 28,November 30, 2019, we had $225$150 million of commercial paper outstanding. See Note 3 of the accompanying unaudited condensed consolidated financial statements for further discussion.
- 50 -
In January 2016, our Board of Directors approved a sharestock repurchase program of up to 25 million shares. During the third quarter of 2019, we repurchased 0.6 million shares of FedEx common stock at an average price of $168.43 per share for a total of $93 million. During the nine months of 2019, we repurchased 6.0 million shares of FedEx common stock at an average price of $227.42 per share for a total of $1.4 billion. As of February 28, 2019, 5.7 million shares remained under the current share repurchase authorization. Shares under this repurchase program may be repurchased from time to time in the open market or in privately negotiated transactions. The timing and volume of repurchases are at the discretion of management, based on the capital needs of the business, the market price of FedEx common stock and general market conditions. No time limit was set for the completion of the program, and the program may be suspended or discontinued at any time. We did not repurchase any shares of FedEx common stock during the second quarter of 2020. During the first half of 2020, we repurchased 0.02 million shares of FedEx common stock at an average price of $156.90 per share for a total of $3 million. As of November 30, 2019, 5.1 million shares remained under the stock repurchase authorization.
- 50 -
CAPITAL RESOURCES
Our operations are capital intensive, characterized by significant investments in aircraft, vehicles and trailers, technology, facilities, and package-package handling and sort equipment. The amount and timing of capital additions depend on various factors, including pre-existing contractual commitments, anticipated volume growth, domestic and international economic conditions, new or enhanced services, geographical expansion of services, availability of satisfactory financing and actions of regulatory authorities.
The following table compares capital expenditures by asset category and reportable segment for the periods ended February 28November 30 (in millions):
|
|
|
|
|
|
|
|
|
|
|
|
|
|
|
|
|
| Percent Change |
|
|
|
|
|
|
|
|
|
|
|
|
|
|
|
|
|
| Percent Change |
| ||||||||||
|
|
|
|
|
|
|
|
|
|
|
|
|
|
|
|
|
| 2019/2018 |
|
|
|
|
|
|
|
|
|
|
|
|
|
|
|
|
|
| 2019/2018 |
| ||||||||||
|
| Three Months Ended |
|
| Nine Months Ended |
|
| Three Months |
|
| Nine Months |
|
| Three Months Ended |
|
| Six Months Ended |
|
| Three Months |
|
| Six Months |
| ||||||||||||||||||||||||
|
| 2019 |
|
| 2018 |
|
| 2019 |
|
| 2018 |
|
| Ended |
|
| Ended |
|
| 2019 |
|
| 2018 |
|
| 2019 |
|
| 2018 |
|
| Ended |
|
| Ended |
| ||||||||||||
Aircraft and related equipment |
| $ | 397 |
|
| $ | 591 |
|
| $ | 1,472 |
|
| $ | 1,631 |
|
|
| (33 | ) |
|
| (10 | ) |
| $ | 587 |
|
| $ | 604 |
|
| $ | 1,128 |
|
| $ | 1,075 |
|
|
| (3 | ) |
|
| 5 |
|
Package handling and ground support equipment |
|
| 167 |
|
|
| 207 |
|
|
| 584 |
|
|
| 621 |
|
|
| (19 | ) |
|
| (6 | ) |
|
| 267 |
|
|
| 223 |
|
|
| 408 |
|
|
| 417 |
|
|
| 20 |
|
|
| (2 | ) |
Vehicles |
|
| 206 |
|
|
| 237 |
|
|
| 640 |
|
|
| 748 |
|
|
| (13 | ) |
|
| (14 | ) | ||||||||||||||||||||||||
Vehicles and trailers |
|
| 399 |
|
|
| 275 |
|
|
| 660 |
|
|
| 435 |
|
|
| 45 |
|
|
| 52 |
| ||||||||||||||||||||||||
Information technology |
|
| 182 |
|
|
| 116 |
|
|
| 515 |
|
|
| 378 |
|
|
| 57 |
|
|
| 36 |
|
|
| 243 |
|
|
| 157 |
|
|
| 465 |
|
|
| 332 |
|
|
| 55 |
|
|
| 40 |
|
Facilities and other |
|
| 171 |
|
|
| 221 |
|
|
| 546 |
|
|
| 616 |
|
|
| (23 | ) |
|
| (11 | ) |
|
| 352 |
|
|
| 196 |
|
|
| 605 |
|
|
| 375 |
|
|
| 80 |
|
|
| 61 |
|
Total capital expenditures |
| $ | 1,123 |
|
| $ | 1,372 |
|
| $ | 3,757 |
|
| $ | 3,994 |
|
|
| (18 | ) |
|
| (6 | ) |
| $ | 1,848 |
|
| $ | 1,455 |
|
| $ | 3,266 |
|
| $ | 2,634 |
|
|
| 27 |
|
|
| 24 |
|
|
|
|
|
|
|
|
|
|
|
|
|
|
|
|
|
|
|
|
|
|
|
|
|
|
|
|
|
|
|
|
|
|
|
|
|
|
|
|
|
|
|
|
|
|
|
|
|
|
FedEx Express segment |
| $ | 673 |
|
| $ | 858 |
|
| $ | 2,364 |
|
| $ | 2,312 |
|
|
| (22 | ) |
|
| 2 |
|
| $ | 1,061 |
|
| $ | 932 |
|
| $ | 2,012 |
|
| $ | 1,692 |
|
|
| 14 |
|
|
| 19 |
|
FedEx Ground segment |
|
| 137 |
|
|
| 221 |
|
|
| 566 |
|
|
| 936 |
|
|
| (38 | ) |
|
| (40 | ) |
|
| 447 |
|
|
| 253 |
|
|
| 543 |
|
|
| 429 |
|
|
| 77 |
|
|
| 27 |
|
FedEx Freight segment |
|
| 177 |
|
|
| 198 |
|
|
| 403 |
|
|
| 397 |
|
|
| (11 | ) |
|
| 2 |
|
|
| 131 |
|
|
| 137 |
|
|
| 317 |
|
|
| 227 |
|
|
| (4 | ) |
|
| 40 |
|
FedEx Services segment |
|
| 127 |
|
|
| 87 |
|
|
| 387 |
|
|
| 306 |
|
|
| 46 |
|
|
| 26 |
|
|
| 154 |
|
|
| 99 |
|
|
| 305 |
|
|
| 224 |
|
|
| 56 |
|
|
| 36 |
|
Other |
|
| 9 |
|
|
| 8 |
|
|
| 37 |
|
|
| 43 |
|
|
| 13 |
|
|
| (14 | ) |
|
| 55 |
|
|
| 34 |
|
|
| 89 |
|
|
| 62 |
|
|
| 62 |
|
|
| 44 |
|
Total capital expenditures |
| $ | 1,123 |
|
| $ | 1,372 |
|
| $ | 3,757 |
|
| $ | 3,994 |
|
|
| (18 | ) |
|
| (6 | ) |
| $ | 1,848 |
|
| $ | 1,455 |
|
| $ | 3,266 |
|
| $ | 2,634 |
|
|
| 27 |
|
|
| 24 |
|
Capital expenditures decreased slightlyincreased during the nine monthsfirst half of 20192020 primarily due to lower spending related to facilities, equipment and vehicles at FedEx Ground, as well as lower spending on aircraft and related equipment at FedEx Express, partially offset by increasedhigher spending related to facilities and equipmentaircraft at FedEx Express.Express, which included the delivery of seven Boeing 767-300 Freighter (“B767F”) aircraft and five Boeing 777 Freighter aircraft, increased spending on vehicles and trailers at our transportation segments and increased spending on information technology at FedEx Services, FedEx Express and FedEx Freight.
LIQUIDITY OUTLOOK
We believe that our cash and cash equivalents, cash flow from operations and available financing sources will be adequate to meet our liquidity needs, including working capital, capital expenditure requirements, debt payment obligations, pension contributions and TNT Express integration expenses and business realignment activities (including the U.S.-based voluntary employee buyout program).expenses. Our cash and cash equivalents balance at February 28,November 30, 2019 includes $1.0$1.1 billion of cash in foreign jurisdictions associated with our permanent reinvestment strategy. We are able to access the majority of this cash without a material tax cost, as the enactment of the TCJA significantly reduced the cost of repatriating foreign earnings from a U.S. tax perspective. We do not believe that the indefinite reinvestment of these funds impairs our ability to meet our U.S. domestic debt or working capital obligations.
Our capital expenditures are expected to be approximately $5.6$5.9 billion in 2019,2020, and include spending for aircraft and hub modernization at FedEx Express, and spending on facilities and sort equipment, primarilyinvestments that increase our efficiency in handling large packages at FedEx ExpressGround and FedEx Ground.investments in technology across all transportation segments that will further optimize our networks and enhance our capabilities. We invested $1.5$1.1 billion in aircraft and related equipment in the nine monthsfirst half of 20192020 and expect to invest an additional $0.6$0.4 billion for aircraft and related equipment during the remainder of 2019.2020. In addition, we are making investments over the next severalmultiple years we will be investing a totalin our facilities of approximately $1.5 billion to significantly expand the FedEx Express Indianapolis hub and a total of approximately $1.0$1.5 billion to modernize the FedEx Express Memphis World Hub. Despite our declining capacity needs, these investments in hubs will provide productivity gains in a competitive labor environment. We anticipate that our cash flow from operations will be sufficient to fund our capital expenditures in 2019.2020. Historically, we have been successful in obtaining unsecured financing, from both domestic and international sources, although the marketplace for such investment capital can become restricted depending on a variety of economic factors.
- 51 -
During the first quarter of 2020, FedEx Express exercised options to purchase an additional six B767F aircraft for delivery in 2022.
We have a shelf registration statement filed with the Securities and Exchange Commission (“SEC”) that allows us to sell, in one or more future offerings, any combination of our unsecured debt securities and common stock.
- 51 -
We have a five-year $2.0 billion revolvingfive-year credit facility thatagreement (the “Five-Year Credit Agreement”) and a $1.5 billion 364-day credit agreement (the “364-Day Credit Agreement” and, together with the Five-Year Credit Agreement, the “Credit Agreements”). The Five-Year Credit Agreement expires in NovemberMarch 2024 and includes a $250 million letter of credit sublimit. The 364-Day Credit Agreement expires in March 2020. The Credit Agreements are available to finance our operations and other cash flow needs. See Note 3 of the accompanying unaudited condensed consolidated financial statements for a description of the terms and significant covenants of our revolving credit facility.the Credit Agreements.
During the nine monthsfirst half of 2019,2020, we made voluntary contributions totaling $1.0 billion to our U.S. Pension Plans. We do not expect to make any additional contributions to our U.S. Pension Plans duringfor the fourth quarterremainder of 2019.2020. Our U.S. Pension Plans have ample funds to meet expected benefit payments.
Standard & Poor’s has assigned us a senior unsecured debt credit rating of BBB, a commercial paper rating of A-2 and a ratings outlook of “stable.” Moody’s Investors Service has assigned us an unsecured debt credit rating of Baa2, a commercial paper rating of P-2 and a ratings outlook of “stable.“negative.” If our credit ratings drop, our interest expense may increase. If our commercial paper ratings drop below current levels, we may have difficulty utilizing the commercial paper market. If our senior unsecured debt credit ratings drop below investment grade, our access to financing may become limited.
CONTRACTUAL CASH OBLIGATIONS AND OFF-BALANCE SHEET ARRANGEMENTS
The following table sets forth a summary of our contractual cash obligations as of February 28,November 30, 2019. Certain of these contractual obligations are reflected in our balance sheet, while others are disclosed as future obligations under accounting principles generally accepted in the United States. Except for the current portion of interest on long-term debt, this table does not include amounts already recorded in our balance sheet as current liabilities at February 28, 2019. We have certain contingent liabilities that are not accrued in our balance sheet in accordance with accounting principles generally accepted in the United States. These contingent liabilities are not included in the table below. We have other long-term liabilities reflected in our balance sheet, including deferred income taxes, qualified and nonqualified pension and postretirement healthcare plan liabilities and other self-insurance accruals. Unless statutorily required, the payment obligations associated with these liabilities are not reflected in the table below due to the absence of scheduled maturities. Accordingly, this table is not meant to represent a forecast of our total cash expenditures for any of the periods presented.
|
| Payments Due by Fiscal Year (Undiscounted) (in millions) |
|
| Payments Due by Fiscal Year (Undiscounted) (in millions) |
| ||||||||||||||||||||||||||||||||||||||||||||||||||
|
| 2019 (1) |
|
| 2020 |
|
| 2021 |
|
| 2022 |
|
| 2023 |
|
| Thereafter |
|
| Total |
|
| 2020 (1) |
|
| 2021 |
|
| 2022 |
|
| 2023 |
|
| 2024 |
|
| Thereafter |
|
| Total |
| ||||||||||||||
Operating activities: |
|
|
|
|
|
|
|
|
|
|
|
|
|
|
|
|
|
|
|
|
|
|
|
|
|
|
|
|
|
|
|
|
|
|
|
|
|
|
|
|
|
|
|
|
|
|
|
|
|
|
|
|
|
|
|
|
Operating leases |
| $ | 597 |
|
| $ | 2,344 |
|
| $ | 2,126 |
|
| $ | 1,913 |
|
| $ | 1,682 |
|
| $ | 8,974 |
|
| $ | 17,636 |
|
| $ | 1,249 |
|
| $ | 2,355 |
|
| $ | 2,105 |
|
| $ | 1,866 |
|
| $ | 1,559 |
|
| $ | 7,841 |
|
| $ | 16,975 |
|
Non-capital purchase obligations and other |
|
| 397 |
|
|
| 873 |
|
|
| 662 |
|
|
| 476 |
|
|
| 309 |
|
|
| 2,952 |
|
|
| 5,669 |
|
|
| 697 |
|
|
| 979 |
|
|
| 777 |
|
|
| 593 |
|
|
| 460 |
|
|
| 3,761 |
|
|
| 7,267 |
|
Interest on long-term debt |
|
| 126 |
|
|
| 621 |
|
|
| 609 |
|
|
| 609 |
|
|
| 580 |
|
|
| 10,510 |
|
|
| 13,055 |
|
|
| 338 |
|
|
| 649 |
|
|
| 649 |
|
|
| 620 |
|
|
| 598 |
|
|
| 10,183 |
|
|
| 13,037 |
|
Investing activities: |
|
|
|
|
|
|
|
|
|
|
|
|
|
|
|
|
|
|
|
|
|
|
|
|
|
|
|
|
|
|
|
|
|
|
|
|
|
|
|
|
|
|
|
|
|
|
|
|
|
|
|
|
|
|
|
|
Aircraft and related capital commitments |
|
| 396 |
|
|
| 1,930 |
|
|
| 2,186 |
|
|
| 1,808 |
|
|
| 1,529 |
|
|
| 656 |
|
|
| 8,505 |
|
|
| 449 |
|
|
| 2,337 |
|
|
| 2,324 |
|
|
| 1,550 |
|
|
| 468 |
|
|
| 228 |
|
|
| 7,356 |
|
Other capital purchase obligations |
|
| 48 |
|
|
| 28 |
|
|
| 25 |
|
|
| 23 |
|
|
| 23 |
|
|
| 6 |
|
|
| 153 |
|
|
| 20 |
|
|
| 25 |
|
|
| 24 |
|
|
| 23 |
|
|
| 1 |
|
|
| 5 |
|
|
| 98 |
|
Financing activities: |
|
|
|
|
|
|
|
|
|
|
|
|
|
|
|
|
|
|
|
|
|
|
|
|
|
|
|
|
|
|
|
|
|
|
|
|
|
|
|
|
|
|
|
|
|
|
|
|
|
|
|
|
|
|
|
|
Debt |
|
| 569 |
|
|
| 967 |
|
|
| — |
|
|
| 1,226 |
|
|
| 1,600 |
|
|
| 13,957 |
|
|
| 18,319 |
|
|
| — |
|
|
| — |
|
|
| 1,205 |
|
|
| 1,577 |
|
|
| 750 |
|
|
| 15,271 |
|
|
| 18,803 |
|
Finance leases |
|
| 13 |
|
|
| 14 |
|
|
| 14 |
|
|
| 13 |
|
|
| 11 |
|
|
| 78 |
|
|
| 143 |
| ||||||||||||||||||||||||||||
Total |
| $ | 2,133 |
|
| $ | 6,763 |
|
| $ | 5,608 |
|
| $ | 6,055 |
|
| $ | 5,723 |
|
| $ | 37,055 |
|
| $ | 63,337 |
|
| $ | 2,766 |
|
| $ | 6,359 |
|
| $ | 7,098 |
|
| $ | 6,242 |
|
| $ | 3,847 |
|
| $ | 37,367 |
|
| $ | 63,679 |
|
(1) | Cash obligations for the remainder of |
Open purchase orders that are cancelable are not considered unconditional purchase obligations for financial reporting purposes and are not included in the table above. Such purchase orders often represent authorizations to purchase rather than binding agreements. See Note 8 of the accompanying unaudited condensed consolidated financial statements for more information on such purchase orders.
Operating Activities
The amounts reflected in the table above for operating leases represent undiscounted future minimum lease payments under noncancelable operating leases (principally facilities and aircraft) with an initial or remaining term in excess of one year at February 28, 2019.
Included in the table above within the caption entitled “Non-capital purchase obligations and other” is our estimate of the current portion of the liability ($12499 million) for uncertain tax positions. We cannot reasonably estimate the timing of the long-term payments or the amount by which the liability will increase or decrease over time; therefore, the long-term portion of the liability ($3836 million) is excluded from the table.
- 52 -
The amounts reflected in the table above for interest on long-term debt represent future interest payments due on our long-term debt.
Investing Activities
The amounts reflected in the table above for capital purchase obligations represent noncancelable agreements to purchase capital-related equipment. Such contracts include those for certain purchases of aircraft, spare engines, vehicles, facilities, computers and other equipment.
We had $965$735 million in deposits and progress payments as of February 28,November 30, 2019 on aircraft purchases and other planned aircraft-related transactions.
Financing Activities
The amounts reflected in the table above for long-term debtfinance leases represent undiscounted future scheduled principalminimum lease payments on our long-term debt.under noncancelable finance leases with an initial or remaining term in excess of one year at November 30, 2019.
Additional information on amounts included within the operating, investing and financing activities captions in the table above can be found in our Annual Report.
We do not have any guarantees or other off-balance sheet financing arrangements, including variable interest entities, which we believe could have a material impact on our financial condition or liquidity.
- 52 -
OTHER BUSINESS MATTERS
During the first quarter of 2020, FedEx filed suit in U.S. District Court in the District of Columbia seeking to enjoin the U.S. Department of Commerce from enforcing prohibitions contained in the Export Administration Regulations (the “EARs”) against FedEx. FedEx believes that the EARs violate common carriers’ rights to due process under the Fifth Amendment of the U.S. Constitution as they unreasonably hold common carriers strictly liable for shipments that may violate the EARs without requiring evidence that the carriers had knowledge of any violations.
The China State Post Bureau is currently conducting an investigation into the operations of FedEx Express regarding its handling of certain packages while attempting to comply with the EARs. FedEx Express has and will continue to fully cooperate with the Chinese authorities on the investigation.
CRITICAL ACCOUNTING ESTIMATES
The preparation of financial statements in accordance with accounting principles generally accepted in the United States requires management to make significant judgments and estimates to develop amounts reflected and disclosed in the financial statements. In many cases, there are alternative policies or estimation techniques that could be used. We maintain a thorough process to review the application of our accounting policies and to evaluate the appropriateness of the many estimates that are required to prepare the financial statements of a complex, global corporation. However, even under optimal circumstances, estimates routinely require adjustment based on changing circumstances and new or better information.
GOODWILL. Goodwill is tested for impairment between annual tests whenever events or circumstances make it more likely than not that the fair value of a reporting unit has fallen below its carrying value. We do not believe there has been any other change of events or circumstances that would indicate that a reevaluation of the goodwill of our reporting units is required as of February 28,November 30, 2019, nor do we believe the goodwill of our reporting units is at risk of failing impairment testing. For additional details on goodwill impairment testing, refer to Note 1 to the financial statements included in our Annual Report.
Information regarding our critical accounting estimates can be found in our Annual Report, including Note 1 to the financial statements therein. Management has discussed the development and selection of these critical accounting estimates with the Audit Committee of our Board of Directors and with our independent registered public accounting firm.
FORWARD-LOOKING STATEMENTS
Certain statements in this report, including (but not limited to) those contained in “General,” “Fuel,” “Income Taxes,” “Outlook,” “Independent Contractor Model,” “Liquidity,” “Liquidity Outlook,” “Contractual Cash Obligations and Off-Balance Sheet Arrangements” and “Critical Accounting Estimates,” and the “General,” “Financing Arrangements,” “Income Taxes,“Retirement Plans,” “Leases,” “Commitments” and “Contingencies” notes to the consolidated financial statements, are “forward-looking” statements within the meaning of the Private Securities Litigation Reform Act of 1995 with respect to our financial condition, results of operations, cash flows, plans, objectives, future performance and business. Forward-looking statements include those preceded by, followed by or that include the words “will,” “may,” “could,” “would,” “should,” “believes,” “expects,” “anticipates,” “plans,” “estimates,” “targets,” “projects,” “intends” or similar expressions. These forward-looking statements involve risks and uncertainties. Actual results may differ materially from those contemplated (expressed or implied) by such forward-looking statements because of, among other things, potential risks and uncertainties, such as:
economic conditions in the global markets in which we operate;
• | economic conditions in the global markets in which we operate; |
significant changes in the volumes of shipments transported through our networks, customer demand for our various services or the prices we obtain for our services;
a significant data breach or other disruption to our technology infrastructure, which could adversely affect our reputation, business or results of operations;
anti-trade measures and changes in international trade policies;
- 53 -
• | significant changes in the volumes of shipments transported through our networks, customer demand for our various services or the prices we obtain for our services; |
• | anti-trade measures and additional changes in international trade policies and relations; |
• | a significant data breach or other disruption to our technology infrastructure; |
• | our ability to successfully integrate the businesses and operations of FedEx Express and TNT Express in the expected time frame and at the expected cost and to achieve the expected benefits from the combined businesses; |
the impact of the United Kingdom’s vote to leave the European Union and the terms of the United Kingdom’s withdrawal, if it ultimately occurs;
• | our ability to successfully implement our business strategy and effectively respond to changes in market dynamics; |
• | the impact of the United Kingdom’s expected withdrawal from the European Union; |
- 53 -
damage to our reputation or loss of brand equity;
• | our ability to manage our network capacity and cost structure for capital expenditures and operating expenses, and match it to shifting and future customer volume levels; |
the price and availability of jet and vehicle fuel;
• | damage to our reputation or loss of brand equity; |
our ability to manage our network capacity and cost structure for capital expenditures and operating expenses, and match it to shifting and future customer volume levels;
• | the price and availability of jet and vehicle fuel; |
the impact of intense competition on our ability to maintain or increase our prices (including our fuel surcharges in response to rising fuel costs) or to maintain or grow our revenues and market share;
• | the impact of intense competition on our ability to maintain or increase our prices (including our fuel surcharges in response to rising fuel costs) or to maintain or grow our revenues and market share; |
any impacts on our businesses resulting from evolving or new U.S. domestic or international government regulations, laws, and policies, which could be unfavorable to our business, including regulatory actions affecting data privacy and sovereignty, global aviation or other transportation rights, increased air cargo and other security or safety requirements, the use of new technology and tax, accounting, trade (such as protectionist measures or restrictions on free trade), foreign exchange intervention, labor (such as card-check legislation, joint employment standards or changes to the Railway Labor Act of 1926, as amended, affecting FedEx Express employees), environmental (such as global climate change legislation) or postal rules;
• | any impacts on our businesses resulting from evolving or new U.S. domestic or international government regulations, laws, policies and actions, which could be unfavorable to our business, including regulatory or other actions affecting data privacy and sovereignty, global aviation or other transportation rights, increased air cargo, pilot flight and duty time and other security or safety requirements, export controls, the use of new technology and tax, accounting, trade (such as protectionist measures or restrictions on free trade), foreign exchange intervention, labor (such as card-check legislation, joint employment standards or changes to the Railway Labor Act of 1926, as amended, affecting FedEx Express employees), environmental (such as global climate change legislation) or postal rules; |
future guidance, regulations, interpretations, or challenges to our tax positions relating to the TCJA and our ability to defend our interpretations and realize the benefits of certain provisions of the TCJA;
• | future guidance, regulations, interpretations, or challenges to our tax positions relating to the TCJA and our ability to defend our interpretations and realize the benefits of certain provisions of the TCJA; |
our ability to effectively operate, integrate, leverage and grow acquired businesses, and to continue to support the value we allocate to these acquired businesses, including their goodwill and other intangible assets;
• | our ability to execute and effectively operate, integrate, leverage and grow acquired businesses, and to continue to support the value we allocate to these acquired businesses, including their goodwill and other intangible assets; |
our ability to successfully implement our cost-reduction initiatives and productivity enhancements;
• | our ability to maintain good relationships with our employees and avoid attempts by labor organizations to organize groups of our employees, which could significantly increase our operating costs and reduce our operational flexibility; |
the acceptance rate of the U.S.-based voluntary cash buyout offers and the timing of such acceptances, and our ability to realize the expected savings from the U.S.-based voluntary employee buyout program;
• | the impact of costs related to lawsuits in which it is alleged that FedEx Ground should be treated as an employer of drivers employed by service providers engaged by FedEx Ground; |
our ability to maintain good relationships with our employees and avoid attempts by labor organizations to organize groups of our employees, which could significantly increase our operating costs and reduce our operational flexibility;
• | any impact on our business from disruptions or modifications in service by, or changes in the business or financial soundness of, the U.S. Postal Service, which is a significant customer and vendor of FedEx; |
the impact of costs related to (i) challenges to the status of owner-operators engaged by FedEx Ground as independent contractors and direct employers of drivers providing services on their behalf, and (ii) any related changes to our relationship with these owner-operators and their drivers;
• | the impact of any international conflicts or terrorist activities on the United States and global economies in general, the transportation industry or us in particular, and what effects these events will have on our costs or the demand for our services; |
any impact on our business from disruptions or modifications in service by, or changes in the business or financial soundness of, the U.S. Postal Service, which is a significant customer and vendor of FedEx;
• | our ability to attract and retain employee talent and maintain our company culture; |
the impact of any international conflicts or terrorist activities on the United States and global economies in general, the transportation industry or us in particular, and what effects these events will have on our costs or the demand for our services;
• | increasing costs, the volatility of costs and funding requirements and other legal mandates for employee benefits, especially pension and healthcare benefits; |
adverse weather or localized disasters in key geographic areas, such as earthquakes, volcanoes, wildfires, hurricanes, conflicts or unrest, or terrorist attacks, which can disrupt our electrical service, damage our property, disrupt our operations, increase our fuel costs and adversely impact demand for our services;
• | a shortage of pilots caused by a higher than normal number of pilot retirements across the industry, increased flight hour requirements to achieve a commercial pilot’s license, reductions in the number of military pilots entering the commercial workforce and other factors; |
increasing costs, the volatility of costs and funding requirements and other legal mandates for employee benefits, especially pension and healthcare benefits;
• | our ability to quickly and effectively restore operations following adverse weather or a localized disaster or disturbance in a key geography; |
• | our ability to successfully mitigate unique technological, operational and regulatory risks related to our autonomous delivery strategy; |
• | volatility or disruption in the debt capital markets and our ability to maintain our current credit ratings and commercial paper ratings; |
changes in our ability to attract and retain pilots, drivers and package and freight handlers;
• | changes in our ability to attract and retain drivers and package and freight handlers; |
- 54 -
changes in foreign currency exchange rates, especially in the euro, Chinese yuan, British pound, Canadian dollar, Brazilian real and Mexican peso, which can affect our sales levels and foreign currency sales prices;
• | changes in foreign currency exchange rates, especially in the euro, Chinese yuan, British pound, Canadian dollar, Australian dollar and Mexican peso, which can affect our sales levels and foreign currency sales prices; |
market acceptance of our new service and growth initiatives;
• | market acceptance of our new service and growth initiatives; |
any liability resulting from and the costs of defending against class-action litigation, such as wage-and-hour, joint employment, and discrimination and retaliation claims, and any other legal or governmental proceedings;
• | any liability resulting from and the costs of defending against class-action and other litigation, such as wage-and-hour, joint employment, securities and discrimination and retaliation claims, and any other legal or governmental proceedings, including the matters discussed in Note 10 of the accompanying consolidated financial statements; |
the outcome of future negotiations to reach new collective bargaining agreements — including with the union that represents the pilots of FedEx Express (the current pilot agreement is scheduled to become amendable in November 2021), with the union elected in 2015 to represent drivers at a FedEx Freight, Inc. facility in the U.S., and with the union certified in 2019 to represent owner-drivers at a FedEx Freight, Inc. facility in Canada;
• | the outcome of future negotiations to reach new collective bargaining agreements — including with the union that represents the pilots of FedEx Express (the current pilot agreement is scheduled to become amendable in November 2021), with the union elected in 2015 to represent drivers at a FedEx Freight, Inc. facility in the U.S., and with the union certified in 2019 to represent owner-drivers at a FedEx Freight Canada, Corp. facility; |
the impact of technology developments on our operations and on demand for our services, and our ability to successfully mitigate unique operational and regulatory risks relating to such developments and continue to identify and eliminate unnecessary information-technology redundancy and complexity throughout the organization;
• | the impact of technology developments on our operations and on demand for our services, and our ability to continue to identify and eliminate unnecessary information-technology redundancy and complexity throughout the organization; |
governmental underinvestment in transportation infrastructure, which could increase our costs and adversely impact our service levels due to traffic congestion or sub-optimal routing of our vehicles and aircraft;
• | widespread outbreak of an illness or any other communicable disease, or any other public health crisis; |
widespread outbreak of an illness or any other communicable disease, or any other public health crisis;
• | the alternative interest rates we are able to negotiate with counterparties pursuant to the relevant provisions of our credit agreements in the event the London Interbank Offered Rate or the euro interbank offered rate cease to exist and we make borrowings under the agreements; and |
availability of financing on terms acceptable to us and our ability to maintain our current credit ratings, especially given the capital intensity of our operations; and
other risks and uncertainties you can find in our press releases and SEC filings, including the risk factors identified under the heading “Risk Factors” in “Management’s Discussion and Analysis of Results of Operations and Financial Condition” in our Annual Report, as updated by our quarterly reports on Form 10-Q.
• | other risks and uncertainties you can find in our press releases and SEC filings, including the risk factors identified under the heading “Risk Factors” in “Management’s Discussion and Analysis of Results of Operations and Financial Condition” in our Annual Report, as updated by our quarterly reports on Form 10-Q. |
As a result of these and other factors, no assurance can be given as to our future results and achievements. Accordingly, a forward-looking statement is neither a prediction nor a guarantee of future events or circumstances and those future events or circumstances may not occur. You should not place undue reliance on the forward-looking statements, which speak only as of the date of this report. We are under no obligation, and we expressly disclaim any obligation, to update or alter any forward-looking statements, whether as a result of new information, future events or otherwise.
- 55 -
Item 3. Quantitative and QualitativeQualitative Disclosures About Market Risk
As of February 28,November 30, 2019, there were no material changes in our market risk sensitive instruments and positions since our disclosures in our Annual Report.
The principal foreign currency exchange rate risks to which we are exposed relate to the euro, Chinese yuan, British pound, Canadian dollar, Brazilian realAustralian dollar and Mexican peso. Historically, our exposure to foreign currency fluctuations is more significant with respect to our revenues than our expenses, as a significant portion of our expenses are denominated in U.S. dollars, such as aircraft and fuel expenses. During the nine monthsfirst half of 2019,2020, the U.S. dollar strengthened relative to the currencies of the foreign countries in which we operate, as compared to May 31, 2018,2019, and this strengthening had a slightly positive impact on our results.
While we have market risk for changes in the price of jet and vehicle fuel, this risk is largely mitigated by our indexed fuel surcharges. For additional discussion of our indexed fuel surcharges, see the “Fuel” section of “Management’s Discussion and Analysis of Results of Operations and Financial Condition.”
Item 4. Controls and Procedures
The management of FedEx, with the participation of our principal executive and financial officers, has evaluated the effectiveness of our disclosure controls and procedures in ensuring that the information required to be disclosed in our filings under the Securities Exchange Act of 1934, as amended (the “Exchange Act”), is recorded, processed, summarized and reported within the time periods specified in the SEC’s rules and forms, including ensuring that such information is accumulated and communicated to FedEx management as appropriate to allow timely decisions regarding required disclosure. Based on such evaluation, our principal executive and financial officers have concluded that such disclosure controls and procedures were effective as of February 28,November 30, 2019 (the end of the period covered by this Quarterly Report on Form 10-Q).
In the first quarter of 2020, we adopted Accounting Standards Update 2016-02, Leases (Topic 842), and began implementing new systems and internal controls in conjunction with the new lease standard. The implementation of such systems and internal controls continued in the second quarter of 2020. In addition, we have begun the process of migrating to an enterprise resource planning cloud-based financial system, and during the second quarter of 2020 began the implementation of new internal controls in conjunction with this migration. During our fiscal quarter ended February 28,November 30, 2019, no change occurred in our internal control over financial reporting, including the new controls described above, that has materially affected, or is reasonably likely to materially affect, our internal control over financial reporting.
- 56 -
For a description of all material pending legal proceedings, see Note 910 of the accompanying unaudited condensed consolidated financial statements.
Other than the risk factors set forth below, there have been no material changes from the risk factors disclosed in our Annual Report (under the heading “Risk Factors” in “Management’s Discussion and Analysis of Results of Operations and Financial Condition”) in response to Part I, Item 1A of Form 10-K,10-K.
Additional changes in international trade policies and relations could significantly reduce the volume of goods transported globally and adversely affect our business and results of operations. The U.S. government has made significant changes in U.S. trade policy and has taken certain actions that have negatively impacted U.S. trade, including imposing tariffs on certain goods imported into the United States. To date, several governments, including the European Union (“EU”), China and India, have imposed tariffs on certain goods imported from the United States. These actions contributed to weakness in the global economy that adversely affected our results of operations during fiscal 2019 and the first half of fiscal 2020, and we expect such weakness to continue to be present during the remainder of fiscal 2020. Any further changes in U.S. or international trade policy could trigger additional retaliatory actions by affected countries, resulting in “trade wars” and further increased costs for goods transported globally, which may reduce customer demand for these products if the parties having to pay those tariffs increase their prices, or in trading partners limiting their trade with countries that impose anti-trade measures. Political uncertainty surrounding international trade and other disputes could also have a negative effect on consumer confidence and spending. Such conditions could have an adverse effect on our business, results of operations and financial condition, as updatedwell as on the price of our common stock.
Additionally, the U.S. government has recently taken action to limit the ability of domestic companies to engage in commerce with certain foreign entities under certain circumstances. Given the nature of our business and our global recognizability, foreign governments may target FedEx by limiting the ability of foreign entities to do business with us in certain instances, imposing monetary or other penalties or taking other retaliatory action, which could have an adverse effect on our quarterly reportsbusiness, results of operations and financial condition, as well as on Form 10-Q.
the price of our common stock. For example, the China State Post Bureau is currently conducting an investigation into the operations of FedEx Express regarding its handling of certain packages while attempting to comply with the Export Administration Regulations.
The United Kingdom’s vote to leaveexpected withdrawal from the European UnionEU could adversely impact our business, results of operations and financial condition. There is substantial uncertainty surroundingFollowing recent European Parliament elections and the general election in the United Kingdom’s 2016 voteKingdom, it is expected that the United Kingdom and EU will enter into a withdrawal agreement pursuant to which the United Kingdom will leave the European UnionEU (“Brexit”), which is scheduled on January 31, 2020, but maintain access to the EU single market and to the global trade deals negotiated by the EU on behalf of its members, and remain subject to EU law, for March 29, 2019. Any impacta transition period ending on December 31, 2020. The suspension or further delay of Brexit depends onbeyond January 31, 2020 requires the termsunanimous agreement of the United Kingdom’s withdrawal from the European Union. all remaining EU member states.
The ongoing uncertainty within the United Kingdom’s government and Parliament on the status of Brexit has negatively impacted the United Kingdom’s economy, and will likely continue to have a withdrawal agreement with the European Union sustains the possibility ofnegative impact until the United Kingdom leavingand EU reach a definitive resolution on the European Union without a withdrawal agreementoutstanding trade and associatedlegal matters. Any additional impact of Brexit will depend on the terms of such resolution. Even if the United Kingdom maintains access to the EU single market and trade deals following the transition period, Brexit could result in place, which would likely causefurther economic downturn globally. If the United Kingdom ultimately loses access to the EU single market and trade deals, significant market and economic disruption and negatively impactwould likely occur, our customer experience, and service quality and could depressinternational operations would likely be negatively impacted, and the demand for our services.services could be depressed.
Even if an agreement setting forth the terms of the United Kingdom’s withdrawal from the European Union is approved, the withdrawal could result in a global economic downturn. The United Kingdom also could lose access to the single European Union market and to the global trade deals negotiated by the European Union on behalf of its members, depressing trade between the United Kingdom and other countries, which would negatively impact our international operations. Additionally, we may face new regulations regarding trade, aviation, tax, security and employees, among others, in the United Kingdom. Compliance with such regulations could be costly, negatively impacting our business, results of operations and financial condition. Brexit could also adversely affect European and worldwide economic and market conditions and could contribute to instability in global financial and foreign exchange markets, including volatility in the value of the euro and the British pound.
Our autonomous delivery strategy is dependent upon our ability to successfully mitigate unique technological, operational and regulatory risks. We recently announced the development through a partnership of an autonomous delivery device designed to help retailers make same-day and last-mile deliveries to their customers. Autonomous delivery is a new and evolving market, which makes it difficult to predict its acceptance, growth, the magnitude and timing of necessary investments and other trends. This aspect of our business strategy is subject to a variety of risks inherent with the development of new technologies, including: the ability to continue to develop autonomous delivery software and hardware; access to sufficient capital; our ability to develop and maintain necessary partnerships; risks related to the manufacture of autonomous devices; and significant competition from other companies, some of which may have more resources and capital to devote to autonomous technologies than we do.
In addition, we face risks related to the commercial deployment of autonomous delivery devices on our targeted timeline or at all, including consumer acceptance, achievement of adequate safety and other performance standards and compliance with uncertain, evolving and potentially conflicting federal and state regulations. To the extent accidents, cybersecurity breaches or other adverse events associated with our autonomous delivery devices occur, we could be subject to liability, government scrutiny, further regulation and reputational damage. Any of the foregoing could adversely impact our results of operations, financial condition and growth prospects.
- 57 -
Proposed pilot flight and duty time regulations could impair our operations and impose substantial costs on us. In September 2010, the Federal Aviation Administration (“FAA”) proposed regulations that would change the flight and duty time rules applicable to all-cargo air carriers. When the FAA issued final regulations in December 2011 (the “2011 regulations”), all-cargo carriers, including FedEx Express, were exempt from these new requirements. Instead, all-cargo carriers were required to continue complying with previously enacted flight and duty time rules and allowed to pursue the development of fatigue risk management systems to develop fatigue mitigations unique to each operation. In December 2012, the FAA reaffirmed the exclusion of all-cargo carriers from the 2011 regulations, and litigation in the U.S. Court of Appeals for the District of Columbia affirmed the FAA’s decision. However, legislation has recently been introduced in the U.S. Senate and U.S. House of Representatives that, if adopted, would require all-cargo carriers to comply with the 2011 regulations. Required compliance with the 2011 regulations would make it more difficult to avoid pilot fatigue and could impose substantial costs on us in order to maintain operational reliability.
- 58 -
Item 2. Unregistered Sales of EquityEquity Securities and Use of Proceeds
The following table provides information on FedEx’s repurchasesWe did not repurchase any shares of ourFedEx common stock during the thirdsecond quarter of 2019:2020.
ISSUER PURCHASES OF EQUITY SECURITIES
Period |
| Total Number of Shares Purchased |
|
| Average Price Paid per Share |
|
| Total Number of Shares Purchased as Part of Publicly Announced Program |
|
| Maximum Number of Shares That May Yet Be Purchased Under the Program |
| ||||
Dec. 1-31, 2018 |
|
| 100,000 |
|
| $ | 156.50 |
|
|
| 100,000 |
|
|
| 6,192,200 |
|
Jan. 1-31, 2019 |
|
| 305,000 |
|
|
| 166.48 |
|
|
| 305,000 |
|
|
| 5,887,200 |
|
Feb. 1-28, 2019 |
|
| 150,000 |
|
|
| 180.37 |
|
|
| 150,000 |
|
|
| 5,737,200 |
|
Total |
|
| 555,000 |
|
| $ | 168.43 |
|
|
| 555,000 |
|
|
|
|
|
The repurchases were made under theOn January 26, 2016, we announced a stock repurchase program approved by our Board of Directors, and announced on January 26, 2016 and through which we are authorized to purchase, in the open market or in privately negotiated transactions, up to an aggregate of 25 million shares of our common stock. As of March 18,December 13, 2019, 5.65.1 million shares remained authorized for purchase under the January 2016 stock repurchase program, which is the only such program that currently exists. The program does not have an expiration date.
Disclosure Pursuant to Section 219 See Note 1 of the Iran Threat Reduction and Syria Human Rights Act of 2012 and Section 13(r) of the Exchange Act. We have comprehensive export controls and economic sanctions programs designed to ensure compliance with United States and other applicable export controls and sanctions laws, rules and regulations. We recently identified the shipments described below involving P2P Mailing Limited (“P2P”), an e-commerce transportation solutions company that FedEx acquired in March 2018. P2P is based in the United Kingdom and organized under the laws of England and Wales. These shipments were not made in accordance with our internal policies and procedures and require disclosure pursuant to Section 219 of the Iran Threat Reduction and Syria Human Rights Act of 2012 and Section 13(r) of the Exchange Act.
P2P provides customers with unique low-cost international transportation solutions, leveraging its relationships with private, postal, retail and clearance providers in over 200 countries and territories. Its technology and processes provide plug-and-play options with carrier networks and customer systems. It recently came to our attention that from the date FedEx acquired P2P in March 2018 through early February 2019, P2P facilitated the shipment into Iran of approximately 120 packages through its TrakPak service offering and approximately 960 packages through its Untrak service offering. All of P2P’s customers that shipped packages to Iran sell consumer goods. The aggregate gross revenueaccompanying unaudited condensed consolidated financial statements for these shipments was £16,067 (approximately $21,300) and the aggregate profit was £5,083 (approximately $6,700). In the case of the TrakPak shipments, one of P2P’s vendors used Iran Air, an entity identified by the United States Treasury Department’s Office of Foreign Assets Control (“OFAC”) as owned or controlled by the Government of Iran (“GoI”), to move the shipments from the United Kingdom into Iran. Because all of the shipments in question were postal shipments, Iran Post, an entity FedEx understands to be owned or controlled by the GoI, provided the last-mile delivery for both the TrakPak and Untrak shipments after they arrived in Iran. P2P did not directly contract with, provide payment to or otherwise transact with Iran Air or Iran Post.
P2P does not intend to continue this activity. Promptly upon learning of these shipments, we put in place a mechanism designed to prevent shipments into Iran through P2P’s service offerings, and P2P has not facilitated any such shipments since that time. Additionally, we have implemented enhanced controls, procedures and other measures to ensure P2P’s compliance with our export controls and economic sanctions programs.
We have made an initial notification of voluntary self-disclosure to OFAC and will perfect the disclosure at the appropriate time. We intend to fully cooperate with OFAC regarding these matters.
further discussion.
- 5859 -
Exhibit Number |
| Description of Exhibit |
|
|
|
| ||
| ||
| ||
| ||
| ||
*10.1 |
| |
|
|
|
*10.2 |
| |
|
|
|
*10.3 |
| |
|
|
|
*10.4 |
| |
|
|
|
*10.5 |
| |
|
|
|
*10.6 |
| |
10.7 |
| |
|
|
|
10.8 |
| |
|
|
|
10.9 |
| |
|
|
|
10.10 |
| |
|
|
|
- 59 -
|
| |
| ||
10.12 | ||
|
|
|
15.1 |
| |
|
|
|
- 60 -
Exhibit Number | Description of Exhibit | |
31.1 |
| |
|
|
|
31.2 |
| |
|
|
|
32.1 |
| |
|
|
|
32.2 |
| |
|
|
|
101.1 |
| Interactive Data |
104.1 | Cover Page Interactive Data File (formatted in Inline XBRL and contained in Exhibit 101.1). |
* | Information in this exhibit identified by brackets is confidential and has been excluded pursuant to Item 601(b)(10)(iv) of Regulation S-K because it (i) is not material and (ii) would likely cause competitive harm to FedEx if publicly disclosed. |
- 6061 -
Pursuant to the requirements of the Securities Exchange Act of 1934, as amended, the Registrant has duly caused this report to be signed on its behalf by the undersigned thereunto duly authorized.
|
|
| FEDEX CORPORATION |
|
|
|
|
Date: |
|
| /s/ JOHN L. MERINO |
|
|
| JOHN L. MERINO |
|
|
| CORPORATE VICE PRESIDENT AND |
|
|
| PRINCIPAL ACCOUNTING OFFICER |
- 6162 -