
UNITED STATES
SECURITIES AND EXCHANGE COMMISSION
WASHINGTON, D.C. 20549
FORM 10-Q
☒ | QUARTERLY REPORT PURSUANT TO SECTION 13 OR 15(d) OF THE SECURITIES EXCHANGE ACT OF 1934 |
For the quarterly period ended March 31,September 30, 2019
OR
☐ | TRANSITION REPORT PURSUANT TO SECTION 13 OR 15(d) OF THE SECURITIES EXCHANGE ACT OF 1934 |
Commission File Number 001-36794
The Chemours Company
(Exact Name of Registrant as Specified in Its Charter)
Delaware | 46-4845564 |
(State or other Jurisdiction of Incorporation or Organization) | (I.R.S. Employer Identification No.) |
1007 Market Street, Wilmington, Delaware 1989919801
(Address of Principal Executive Offices)
(302) 773-1000
(Registrant’s Telephone Number)
Securities registered pursuant to Section 12(b) of the Act:
Title of Each Class | Trading Symbol(s) | Name of Exchange on Which Registered | ||
Common Stock ($.01 par value) | CC | New York Stock Exchange |
Indicate by check mark whether the registrant (1) has filed all reports required to be filed by Section 13 or 15(d) of the Securities Exchange Act of 1934 during the preceding 12 months (or for such shorter period that the registrant was required to file such reports), and (2) has been subject to such filing requirements for the past 90 days. Yes ☒ No ☐
Indicate by check mark whether the registrant has submitted electronically every Interactive Data File required to be submitted pursuant to Rule 405 of Regulation S-T (§232.405 of this chapter) during the preceding 12 months (or for such shorter period that the registrant was required to submit such files). Yes ☒ No ☐
Indicate by check mark whether the registrant is a large accelerated filer, an accelerated filer, a non-accelerated filer, a smaller reporting company, or an emerging growth company. See the definitions of “large accelerated filer,” “accelerated filer,” “smaller reporting company,” and “emerging growth company” in Rule 12b-2 of the Exchange Act.
Large Accelerated Filer ☒ | Accelerated Filer ☐ |
Non-Accelerated Filer ☐ | Smaller reporting company ☐ |
| Emerging growth company ☐ |
If an emerging growth company, indicate by check mark if the registrant has elected not to use the extended transition period for complying with any new or revised financial accounting standards provided pursuant to Section 13(a) of the Exchange Act. ☐
Indicate by check mark whether the registrant is a shell company (as defined in Rule 12b-2 of the Exchange Act). Yes ☐No ☒
Securities registered pursuant to Section 12(b) of the Act:
|
|
| ||
|
|
|
The registrant had 163,963,626163,501,112 shares of common stock, $0.01 par value, outstanding at April 29,October 31, 2019.
The Chemours Company
TABLE OF CONTENTS
|
| Page |
Part I |
| |
Item 1. |
| |
| 2 | |
| Interim Consolidated Statements of Comprehensive Income (Unaudited) | 3 |
| 4 | |
| Interim Consolidated Statements of Stockholders’ Equity (Unaudited) | 5 |
| 6 | |
| Notes to the Interim Consolidated Financial Statements (Unaudited) | 7 |
Item 2. | Management’s Discussion and Analysis of Financial Condition and Results of Operations |
|
Item 3. |
| |
Item 4. |
| |
|
|
|
Part II |
| |
Item 1. |
| |
Item 1A. |
| |
Item 2. |
| |
Item 3. |
| |
Item 4. |
| |
Item 5. |
| |
Item 6. |
| |
|
|
|
PART I. FINANCIAL INFORMATION
Item 1. | INTERIM CONSOLIDATED FINANCIAL STATEMENTS |
The Chemours Company
Interim Consolidated Statements of Operations (Unaudited)
(Dollars in millions, except per share amounts)
|
| Three Months Ended March 31, |
|
| Three Months Ended September 30, |
|
| Nine Months Ended September 30, |
| |||||||||||||||
|
| 2019 |
|
| 2018 |
|
| 2019 |
|
| 2018 |
|
| 2019 |
|
| 2018 |
| ||||||
Net sales |
| $ | 1,376 |
|
| $ | 1,730 |
|
| $ | 1,390 |
|
| $ | 1,628 |
|
| $ | 4,173 |
|
| $ | 5,174 |
|
Cost of goods sold |
|
| 1,080 |
|
|
| 1,193 |
|
|
| 1,096 |
|
|
| 1,151 |
|
|
| 3,260 |
|
|
| 3,603 |
|
Gross profit |
|
| 296 |
|
|
| 537 |
|
|
| 294 |
|
|
| 477 |
|
|
| 913 |
|
|
| 1,571 |
|
Selling, general, and administrative expense |
|
| 156 |
|
|
| 143 |
|
|
| 130 |
|
|
| 163 |
|
|
| 423 |
|
|
| 466 |
|
Research and development expense |
|
| 22 |
|
|
| 20 |
|
|
| 20 |
|
|
| 20 |
|
|
| 61 |
|
|
| 61 |
|
Restructuring, asset-related, and other charges |
|
| 8 |
|
|
| 10 |
|
|
| 34 |
|
|
| 12 |
|
|
| 49 |
|
|
| 32 |
|
Total other operating expenses |
|
| 186 |
|
|
| 173 |
|
|
| 184 |
|
|
| 195 |
|
|
| 533 |
|
|
| 559 |
|
Equity in earnings of affiliates |
|
| 8 |
|
|
| 12 |
|
|
| 9 |
|
|
| 10 |
|
|
| 25 |
|
|
| 32 |
|
Interest expense, net |
|
| (51 | ) |
|
| (52 | ) |
|
| (53 | ) |
|
| (47 | ) |
|
| (156 | ) |
|
| (148 | ) |
Loss on extinguishment of debt |
|
| — |
|
|
| — |
|
|
| — |
|
|
| (38 | ) | ||||||||
Other income, net |
|
| 40 |
|
|
| 57 |
|
|
| 25 |
|
|
| 24 |
|
|
| 81 |
|
|
| 115 |
|
Income before income taxes |
|
| 107 |
|
|
| 381 |
|
|
| 91 |
|
|
| 269 |
|
|
| 330 |
|
|
| 973 |
|
Provision for income taxes |
|
| 13 |
|
|
| 84 |
| ||||||||||||||||
Provision for (benefit from) income taxes |
|
| 15 |
|
|
| (6 | ) |
|
| 65 |
|
|
| 119 |
| ||||||||
Net income |
|
| 94 |
|
|
| 297 |
|
|
| 76 |
|
|
| 275 |
|
|
| 265 |
|
|
| 854 |
|
Less: Net income attributable to non-controlling interests |
|
| — |
|
|
| — |
|
|
| — |
|
|
| 1 |
| ||||||||
Net income attributable to Chemours |
| $ | 94 |
|
| $ | 297 |
|
| $ | 76 |
|
| $ | 275 |
|
| $ | 265 |
|
| $ | 853 |
|
Per share data |
|
|
|
|
|
|
|
|
|
|
|
|
|
|
|
|
|
|
|
|
|
|
|
|
Basic earnings per share of common stock |
| $ | 0.56 |
|
| $ | 1.63 |
|
| $ | 0.46 |
|
| $ | 1.56 |
|
| $ | 1.60 |
|
| $ | 4.77 |
|
Diluted earnings per share of common stock |
|
| 0.55 |
|
|
| 1.58 |
|
|
| 0.46 |
|
|
| 1.51 |
|
|
| 1.58 |
|
|
| 4.62 |
|
|
|
|
|
|
|
|
|
| ||||||||||||||||
See accompanying notes to the interim consolidated financial statements.
The Chemours Company
Interim Consolidated Statements of Comprehensive Income (Unaudited)
(Dollars in millions)
|
| Three Months Ended March 31, |
|
| Three Months Ended September 30, |
| ||||||||||||||||||||||||||||||||||||||||||
|
| 2019 |
|
| 2018 |
|
| 2019 |
|
| 2018 |
| ||||||||||||||||||||||||||||||||||||
|
| Pre-tax |
|
| Tax |
|
| After-tax |
|
| Pre-tax |
|
| Tax |
|
| After-tax |
|
| Pre-tax |
|
| Tax |
|
| After-tax |
|
| Pre-tax |
|
| Tax |
|
| After-tax |
| ||||||||||||
Net income |
| $ | 107 |
|
| $ | (13 | ) |
| $ | 94 |
|
| $ | 381 |
|
| $ | (84 | ) |
| $ | 297 |
|
| $ | 91 |
|
| $ | (15 | ) |
| $ | 76 |
|
| $ | 269 |
|
| $ | 6 |
|
| $ | 275 |
|
Other comprehensive income (loss): |
|
|
|
|
|
|
|
|
|
|
|
|
|
|
|
|
|
|
|
|
|
|
|
|
|
|
|
|
|
|
|
|
|
|
|
|
|
|
|
|
|
|
|
|
|
|
|
|
Hedging activities: |
|
|
|
|
|
|
|
|
|
|
|
|
|
|
|
|
|
|
|
|
|
|
|
|
|
|
|
|
|
|
|
|
|
|
|
|
|
|
|
|
|
|
|
|
|
|
|
|
Unrealized gain (loss) on net investment hedge |
|
| 10 |
|
|
| (3 | ) |
|
| 7 |
|
|
| (34 | ) |
|
| 8 |
|
|
| (26 | ) |
|
| 33 |
|
|
| (8 | ) |
|
| 25 |
|
|
| (11 | ) |
|
| 3 |
|
|
| (8 | ) |
Unrealized gain on cash flow hedge |
|
| 2 |
|
|
| — |
|
|
| 2 |
|
|
| — |
|
|
| — |
|
|
| — |
| ||||||||||||||||||||||||
Unrealized gain (loss) on cash flow hedge |
|
| 5 |
|
|
| (1 | ) |
|
| 4 |
|
|
| (1 | ) |
|
| — |
|
|
| (1 | ) | ||||||||||||||||||||||||
Reclassifications to net income - cash flow hedge |
|
| (3 | ) |
|
| — |
|
|
| (3 | ) |
|
| — |
|
|
| — |
|
|
| — |
|
|
| (2 | ) |
|
| — |
|
|
| (2 | ) |
|
| (1 | ) |
|
| — |
|
|
| (1 | ) |
Hedging activities, net |
|
| 9 |
|
|
| (3 | ) |
|
| 6 |
|
|
| (34 | ) |
|
| 8 |
|
|
| (26 | ) |
|
| 36 |
|
|
| (9 | ) |
|
| 27 |
|
|
| (13 | ) |
|
| 3 |
|
|
| (10 | ) |
Cumulative translation adjustment |
|
| 7 |
|
|
| — |
|
|
| 7 |
|
|
| 108 |
|
|
| — |
|
|
| 108 |
|
|
| (68 | ) |
|
| — |
|
|
| (68 | ) |
|
| 36 |
|
|
| — |
|
|
| 36 |
|
Defined benefit plans: |
|
|
|
|
|
|
|
|
|
|
|
|
|
|
|
|
|
|
|
|
|
|
|
|
|
|
|
|
|
|
|
|
|
|
|
|
|
|
|
|
|
|
|
|
|
|
|
|
Additions to accumulated other comprehensive loss: |
|
|
|
|
|
|
|
|
|
|
|
|
|
|
|
|
|
|
|
|
|
|
|
|
|
|
|
|
|
|
|
|
|
|
|
|
|
|
|
|
|
|
|
|
|
|
|
|
Effect of foreign exchange rates |
|
| 3 |
|
|
| — |
|
|
| 3 |
|
|
| (9 | ) |
|
| — |
|
|
| (9 | ) |
|
| 9 |
|
|
| — |
|
|
| 9 |
|
|
| (2 | ) |
|
| — |
|
|
| (2 | ) |
Reclassifications to net income: |
|
|
|
|
|
|
|
|
|
|
|
|
|
|
|
|
|
|
|
|
|
|
|
|
|
|
|
|
|
|
|
|
|
|
|
|
|
|
|
|
|
|
|
|
|
|
|
|
Amortization of prior service gain |
|
| (1 | ) |
|
| — |
|
|
| (1 | ) |
|
| — |
|
|
| — |
|
|
| — |
| ||||||||||||||||||||||||
Amortization of actuarial loss |
|
| 6 |
|
|
| (1 | ) |
|
| 5 |
|
|
| 4 |
|
|
| (1 | ) |
|
| 3 |
| ||||||||||||||||||||||||
Settlement loss |
|
| 3 |
|
|
| — |
|
|
| 3 |
|
|
| 2 |
|
|
| — |
|
|
| 2 |
| ||||||||||||||||||||||||
Defined benefit plans, net |
|
| 17 |
|
|
| (1 | ) |
|
| 16 |
|
|
| 4 |
|
|
| (1 | ) |
|
| 3 |
| ||||||||||||||||||||||||
Other comprehensive (loss) income |
|
| (15 | ) |
|
| (10 | ) |
|
| (25 | ) |
|
| 27 |
|
|
| 2 |
|
|
| 29 |
| ||||||||||||||||||||||||
Comprehensive income |
|
| 76 |
|
|
| (25 | ) |
|
| 51 |
|
|
| 296 |
|
|
| 8 |
|
|
| 304 |
| ||||||||||||||||||||||||
Less: Comprehensive income attributable to non-controlling interests |
|
| — |
|
|
| — |
|
|
| — |
|
|
| — |
|
|
| — |
|
|
| — |
| ||||||||||||||||||||||||
Comprehensive income attributable to Chemours |
| $ | 76 |
|
| $ | (25 | ) |
| $ | 51 |
|
| $ | 296 |
|
| $ | 8 |
|
| $ | 304 |
| ||||||||||||||||||||||||
|
|
|
|
|
|
|
|
|
|
|
|
|
|
|
|
|
|
|
|
|
|
|
|
| ||||||||||||||||||||||||
|
|
|
|
|
|
|
|
|
|
|
|
|
|
|
|
|
|
|
|
|
|
|
|
| ||||||||||||||||||||||||
|
| Nine Months Ended September 30, |
| |||||||||||||||||||||||||||||||||||||||||||||
|
| 2019 |
|
| 2018 |
| ||||||||||||||||||||||||||||||||||||||||||
|
| Pre-tax |
|
| Tax |
|
| After-tax |
|
| Pre-tax |
|
| Tax |
|
| After-tax |
| ||||||||||||||||||||||||||||||
Net income |
| $ | 330 |
|
| $ | (65 | ) |
| $ | 265 |
|
| $ | 973 |
|
| $ | (119 | ) |
| $ | 854 |
| ||||||||||||||||||||||||
Other comprehensive income (loss): |
|
|
|
|
|
|
|
|
|
|
|
|
|
|
|
|
|
|
|
|
|
|
|
| ||||||||||||||||||||||||
Hedging activities: |
|
|
|
|
|
|
|
|
|
|
|
|
|
|
|
|
|
|
|
|
|
|
|
| ||||||||||||||||||||||||
Unrealized gain on net investment hedge |
|
| 36 |
|
|
| (9 | ) |
|
| 27 |
|
|
| 2 |
|
|
| (1 | ) |
|
| 1 |
| ||||||||||||||||||||||||
Unrealized gain on cash flow hedge |
|
| 7 |
|
|
| (1 | ) |
|
| 6 |
|
|
| 6 |
|
|
| — |
|
|
| 6 |
| ||||||||||||||||||||||||
Reclassifications to net income - cash flow hedge |
|
| (8 | ) |
|
| 1 |
|
|
| (7 | ) |
|
| (1 | ) |
|
| — |
|
|
| (1 | ) | ||||||||||||||||||||||||
Hedging activities, net |
|
| 35 |
|
|
| (9 | ) |
|
| 26 |
|
|
| 7 |
|
|
| (1 | ) |
|
| 6 |
| ||||||||||||||||||||||||
Cumulative translation adjustment |
|
| (45 | ) |
|
| — |
|
|
| (45 | ) |
|
| (17 | ) |
|
| — |
|
|
| (17 | ) | ||||||||||||||||||||||||
Defined benefit plans: |
|
|
|
|
|
|
|
|
|
|
|
|
|
|
|
|
|
|
|
|
|
|
|
| ||||||||||||||||||||||||
Additions to accumulated other comprehensive loss: |
|
|
|
|
|
|
|
|
|
|
|
|
|
|
|
|
|
|
|
|
|
|
|
| ||||||||||||||||||||||||
Net loss |
|
| (3 | ) |
|
| — |
|
|
| (3 | ) |
|
| — |
|
|
| — |
|
|
| — |
| ||||||||||||||||||||||||
Prior service benefit |
|
| 5 |
|
|
| — |
|
|
| 5 |
|
|
| — |
|
|
| — |
|
|
| — |
| ||||||||||||||||||||||||
Effect of foreign exchange rates |
|
| 10 |
|
|
| — |
|
|
| 10 |
|
|
| 3 |
|
|
| — |
|
|
| 3 |
| ||||||||||||||||||||||||
Reclassifications to net income: |
|
|
|
|
|
|
|
|
|
|
|
|
|
|
|
|
|
|
|
|
|
|
|
| ||||||||||||||||||||||||
Amortization of prior service gain |
|
| (2 | ) |
|
| — |
|
|
| (2 | ) |
|
| (1 | ) |
|
| — |
|
|
| (1 | ) | ||||||||||||||||||||||||
Amortization of actuarial loss |
|
| 5 |
|
|
| (1 | ) |
|
| 4 |
|
|
| 4 |
|
|
| (1 | ) |
|
| 3 |
|
|
| 18 |
|
|
| (4 | ) |
|
| 14 |
|
|
| 11 |
|
|
| (2 | ) |
|
| 9 |
|
Settlement loss |
|
| 1 |
|
|
| — |
|
|
| 1 |
|
|
| — |
|
|
| — |
|
|
| — |
|
|
| 4 |
|
|
| (1 | ) |
|
| 3 |
|
|
| 2 |
|
|
| — |
|
|
| 2 |
|
Defined benefit plans, net |
|
| 9 |
|
|
| (1 | ) |
|
| 8 |
|
|
| (5 | ) |
|
| (1 | ) |
|
| (6 | ) |
|
| 32 |
|
|
| (5 | ) |
|
| 27 |
|
|
| 15 |
|
|
| (2 | ) |
|
| 13 |
|
Other comprehensive income |
|
| 25 |
|
|
| (4 | ) |
|
| 21 |
|
|
| 69 |
|
|
| 7 |
|
|
| 76 |
|
|
| 22 |
|
|
| (14 | ) |
|
| 8 |
|
|
| 5 |
|
|
| (3 | ) |
|
| 2 |
|
Comprehensive income |
|
| 132 |
|
|
| (17 | ) |
|
| 115 |
|
|
| 450 |
|
|
| (77 | ) |
|
| 373 |
|
|
| 352 |
|
|
| (79 | ) |
|
| 273 |
|
|
| 978 |
|
|
| (122 | ) |
|
| 856 |
|
Less: Comprehensive income attributable to non-controlling interests |
|
| — |
|
|
| — |
|
|
| — |
|
|
| 1 |
|
|
| — |
|
|
| 1 |
| ||||||||||||||||||||||||
Comprehensive income attributable to Chemours |
| $ | 132 |
|
| $ | (17 | ) |
| $ | 115 |
|
| $ | 450 |
|
| $ | (77 | ) |
| $ | 373 |
|
| $ | 352 |
|
| $ | (79 | ) |
| $ | 273 |
|
| $ | 977 |
|
| $ | (122 | ) |
| $ | 855 |
|
See accompanying notes to the interim consolidated financial statements.
The Chemours Company
Interim Consolidated Balance Sheets
(Dollars in millions, except per share amounts)
|
| (Unaudited) |
|
|
|
|
|
| (Unaudited) |
|
|
|
|
| ||
|
| March 31, 2019 |
|
| December 31, 2018 |
|
| September 30, 2019 |
|
| December 31, 2018 |
| ||||
Assets |
|
|
|
|
|
|
|
|
|
|
|
|
|
|
|
|
Current assets: |
|
|
|
|
|
|
|
|
|
|
|
|
|
|
|
|
Cash and cash equivalents |
| $ | 697 |
|
| $ | 1,201 |
|
| $ | 694 |
|
| $ | 1,201 |
|
Accounts and notes receivable, net |
|
| 847 |
|
|
| 861 |
|
|
| 832 |
|
|
| 861 |
|
Inventories |
|
| 1,218 |
|
|
| 1,147 |
|
|
| 1,223 |
|
|
| 1,147 |
|
Prepaid expenses and other |
|
| 85 |
|
|
| 84 |
|
|
| 78 |
|
|
| 84 |
|
Total current assets |
|
| 2,847 |
|
|
| 3,293 |
|
|
| 2,827 |
|
|
| 3,293 |
|
Property, plant, and equipment |
|
| 9,089 |
|
|
| 8,992 |
|
|
| 9,274 |
|
|
| 8,992 |
|
Less: Accumulated depreciation |
|
| (5,710 | ) |
|
| (5,701 | ) |
|
| (5,754 | ) |
|
| (5,701 | ) |
Property, plant, and equipment, net |
|
| 3,379 |
|
|
| 3,291 |
|
|
| 3,520 |
|
|
| 3,291 |
|
Operating lease right-of-use assets |
|
| 323 |
|
|
| — |
|
|
| 307 |
|
|
| — |
|
Goodwill and other intangible assets, net |
|
| 180 |
|
|
| 181 |
|
|
| 176 |
|
|
| 181 |
|
Investments in affiliates |
|
| 166 |
|
|
| 160 |
|
|
| 184 |
|
|
| 160 |
|
Other assets |
|
| 430 |
|
|
| 437 |
|
|
| 442 |
|
|
| 437 |
|
Total assets |
| $ | 7,325 |
|
| $ | 7,362 |
|
| $ | 7,456 |
|
| $ | 7,362 |
|
Liabilities |
|
|
|
|
|
|
|
|
|
|
|
|
|
|
|
|
Current liabilities: |
|
|
|
|
|
|
|
|
|
|
|
|
|
|
|
|
Accounts payable |
| $ | 1,042 |
|
| $ | 1,137 |
|
| $ | 948 |
|
| $ | 1,137 |
|
Current maturities of long-term debt |
|
| 13 |
|
|
| 13 |
| ||||||||
Short-term and current maturities of long-term debt |
|
| 149 |
|
|
| 13 |
| ||||||||
Other accrued liabilities |
|
| 517 |
|
|
| 559 |
|
|
| 546 |
|
|
| 559 |
|
Total current liabilities |
|
| 1,572 |
|
|
| 1,709 |
|
|
| 1,643 |
|
|
| 1,709 |
|
Long-term debt, net |
|
| 3,965 |
|
|
| 3,959 |
|
|
| 4,007 |
|
|
| 3,959 |
|
Operating lease liabilities |
|
| 265 |
|
|
| — |
|
|
| 254 |
|
|
| — |
|
Deferred income taxes |
|
| 212 |
|
|
| 217 |
|
|
| 208 |
|
|
| 217 |
|
Other liabilities |
|
| 495 |
|
|
| 457 |
|
|
| 501 |
|
|
| 457 |
|
Total liabilities |
|
| 6,509 |
|
|
| 6,342 |
|
|
| 6,613 |
|
|
| 6,342 |
|
Commitments and contingent liabilities |
|
|
|
|
|
|
|
|
|
|
|
|
|
|
|
|
Equity |
|
|
|
|
|
|
|
|
|
|
|
|
|
|
|
|
Common stock (par value $0.01 per share; 810,000,000 shares authorized; 188,693,084 shares issued and 164,990,989 shares outstanding at March 31, 2019; 187,204,567 shares issued and 170,780,474 shares outstanding at December 31, 2018) |
|
| 2 |
|
|
| 2 |
| ||||||||
Treasury stock, at cost (23,702,095 shares at March 31, 2019; 16,424,093 shares at December 31, 2018) |
|
| (1,011 | ) |
|
| (750 | ) | ||||||||
Common stock (par value $0.01 per share; 810,000,000 shares authorized; 188,811,686 shares issued and 163,492,451 shares outstanding at September 30, 2019; 187,204,567 shares issued and 170,780,474 shares outstanding at December 31, 2018) |
|
| 2 |
|
|
| 2 |
| ||||||||
Treasury stock, at cost (25,319,235 shares at September 30, 2019; 16,424,093 shares at December 31, 2018) |
|
| (1,072 | ) |
|
| (750 | ) | ||||||||
Additional paid-in capital |
|
| 845 |
|
|
| 860 |
|
|
| 857 |
|
|
| 860 |
|
Retained earnings |
|
| 1,517 |
|
|
| 1,466 |
|
|
| 1,606 |
|
|
| 1,466 |
|
Accumulated other comprehensive loss |
|
| (543 | ) |
|
| (564 | ) |
|
| (556 | ) |
|
| (564 | ) |
Total Chemours stockholders’ equity |
|
| 810 |
|
|
| 1,014 |
|
|
| 837 |
|
|
| 1,014 |
|
Non-controlling interests |
|
| 6 |
|
|
| 6 |
|
|
| 6 |
|
|
| 6 |
|
Total equity |
|
| 816 |
|
|
| 1,020 |
|
|
| 843 |
|
|
| 1,020 |
|
Total liabilities and equity |
| $ | 7,325 |
|
| $ | 7,362 |
|
| $ | 7,456 |
|
| $ | 7,362 |
|
See accompanying notes to the interim consolidated financial statements.
The Chemours Company
Interim Consolidated Statements of Stockholders’ Equity (Unaudited)
(Dollars in millions)millions, except per share amounts)
|
| Three Months Ended September 30, |
| |||||||||||||||||||||||||||||||||||||||||||||||||||||||||||||||||||||||||
|
| Common Stock |
|
| Treasury Stock |
|
|
|
|
|
|
|
|
|
|
|
|
|
|
|
|
|
|
|
|
| ||||||||||||||||||||||||||||||||||||||||||||||||||
|
| Shares |
|
| Amount |
|
| Shares |
|
| Amount |
|
| Additional Paid-in Capital |
|
| Retained Earnings |
|
| Accumulated Other Comprehensive (Loss) Income |
|
| Non-controlling Interests |
|
| Total Equity |
| |||||||||||||||||||||||||||||||||||||||||||||||||
Balance at July 1, 2018 |
|
| 186,594,368 |
|
| $ | 2 |
|
|
| 10,073,236 |
|
| $ | (500 | ) |
| $ | 859 |
|
| $ | 1,127 |
|
| $ | (469 | ) |
| $ | 6 |
|
| $ | 1,025 |
| ||||||||||||||||||||||||||||||||||||||||
Common stock issued - compensation plans |
|
| 431,744 |
|
|
| — |
|
|
| — |
|
|
| — |
|
|
| — |
|
|
| — |
|
|
| — |
|
|
| — |
|
|
| — |
| ||||||||||||||||||||||||||||||||||||||||
Exercise of stock options, net |
|
| 123,335 |
|
|
| — |
|
|
| — |
|
|
| — |
|
|
| 2 |
|
|
| — |
|
|
| — |
|
|
| — |
|
|
| 2 |
| ||||||||||||||||||||||||||||||||||||||||
Purchases of treasury stock, at cost |
|
| — |
|
|
| — |
|
|
| 3,226,824 |
|
|
| (136 | ) |
|
| — |
|
|
| — |
|
|
| — |
|
|
| — |
|
|
| (136 | ) | ||||||||||||||||||||||||||||||||||||||||
Stock-based compensation expense |
|
| — |
|
|
| — |
|
|
| — |
|
|
| — |
|
|
| 5 |
|
|
| — |
|
|
| — |
|
|
| — |
|
|
| 5 |
| ||||||||||||||||||||||||||||||||||||||||
Cancellation of unissued stock awards withheld to cover taxes |
|
| — |
|
|
| — |
|
|
| — |
|
|
| — |
|
|
| (10 | ) |
|
| — |
|
|
| — |
|
|
| — |
|
|
| (10 | ) | ||||||||||||||||||||||||||||||||||||||||
Net income |
|
| — |
|
|
| — |
|
|
| — |
|
|
| — |
|
|
| — |
|
|
| 275 |
|
|
| — |
|
|
| — |
|
|
| 275 |
| ||||||||||||||||||||||||||||||||||||||||
Dividends ($0.25 per share) |
|
| — |
|
|
| — |
|
|
| — |
|
|
| — |
|
|
| — |
|
|
| (44 | ) |
|
| — |
|
|
| — |
|
|
| (44 | ) | ||||||||||||||||||||||||||||||||||||||||
Other comprehensive income |
|
| — |
|
|
| — |
|
|
| — |
|
|
| — |
|
|
| — |
|
|
| — |
|
|
| 29 |
|
|
| — |
|
|
| 29 |
| ||||||||||||||||||||||||||||||||||||||||
Balance at September 30, 2018 |
|
| 187,149,447 |
|
| $ | 2 |
|
|
| 13,300,060 |
|
| $ | (636 | ) |
| $ | 856 |
|
| $ | 1,358 |
|
| $ | (440 | ) |
| $ | 6 |
|
| $ | 1,146 |
| ||||||||||||||||||||||||||||||||||||||||
|
|
|
|
|
|
|
|
|
|
|
|
|
|
|
|
|
|
|
|
|
|
|
|
|
|
|
|
|
|
|
|
|
|
|
|
| ||||||||||||||||||||||||||||||||||||||||
Balance at July 1, 2019 |
|
| 188,801,201 |
|
| $ | 2 |
|
|
| 25,319,235 |
|
| $ | (1,072 | ) |
| $ | 853 |
|
| $ | 1,571 |
|
| $ | (531 | ) |
| $ | 6 |
|
| $ | 829 |
| ||||||||||||||||||||||||||||||||||||||||
Common stock issued - compensation plans |
|
| 6,807 |
|
|
| — |
|
|
| — |
|
|
| — |
|
|
| — |
|
|
| — |
|
|
| — |
|
|
| — |
|
|
| — |
| ||||||||||||||||||||||||||||||||||||||||
Exercise of stock options, net |
|
| 3,678 |
|
|
| — |
|
|
| — |
|
|
| — |
|
|
| — |
|
|
| — |
|
|
| — |
|
|
| — |
|
|
| — |
| ||||||||||||||||||||||||||||||||||||||||
Stock-based compensation expense |
|
| — |
|
|
| — |
|
|
| — |
|
|
| — |
|
|
| 4 |
|
|
| — |
|
|
| — |
|
|
| — |
|
|
| 4 |
| ||||||||||||||||||||||||||||||||||||||||
Net income |
|
| — |
|
|
| — |
|
|
| — |
|
|
| — |
|
|
| — |
|
|
| 76 |
|
|
| — |
|
|
| — |
|
|
| 76 |
| ||||||||||||||||||||||||||||||||||||||||
Dividends ($0.25 per share) |
|
| — |
|
|
| — |
|
|
| — |
|
|
| — |
|
|
| — |
|
|
| (41 | ) |
|
| — |
|
|
| — |
|
|
| (41 | ) | ||||||||||||||||||||||||||||||||||||||||
Other comprehensive loss |
|
| — |
|
|
| — |
|
|
| — |
|
|
| — |
|
|
| — |
|
|
| — |
|
|
| (25 | ) |
|
| — |
|
|
| (25 | ) | ||||||||||||||||||||||||||||||||||||||||
Balance at September 30, 2019 |
|
| 188,811,686 |
|
| $ | 2 |
|
|
| 25,319,235 |
|
| $ | (1,072 | ) |
| $ | 857 |
|
| $ | 1,606 |
|
| $ | (556 | ) |
| $ | 6 |
|
| $ | 843 |
| ||||||||||||||||||||||||||||||||||||||||
|
|
|
|
|
|
|
|
|
|
|
|
|
|
|
|
|
|
|
|
|
|
|
|
|
|
|
|
|
|
|
|
|
|
|
|
| ||||||||||||||||||||||||||||||||||||||||
|
|
|
|
|
|
|
|
|
|
|
|
|
|
|
|
|
|
|
|
|
|
|
|
|
|
|
|
|
|
|
|
|
|
|
|
| ||||||||||||||||||||||||||||||||||||||||
|
| Nine Months Ended September 30, |
| |||||||||||||||||||||||||||||||||||||||||||||||||||||||||||||||||||||||||
|
| Common Stock |
|
| Treasury Stock |
|
|
|
|
|
|
|
|
|
|
|
|
|
|
|
|
|
|
|
|
|
| Common Stock |
|
| Treasury Stock |
|
|
|
|
|
|
|
|
|
|
|
|
|
|
|
|
|
|
|
|
| ||||||||||||||||||||||||
|
| Shares |
|
| Amount |
|
| Dividends per Share |
|
| Shares |
|
| Amount |
|
| Additional Paid-in Capital |
|
| Retained Earnings |
|
| Accumulated Other Comprehensive (Loss) Income |
|
| Non-controlling Interests |
|
| Total Equity |
|
| Shares |
|
| Amount |
|
| Shares |
|
| Amount |
|
| Additional Paid-in Capital |
|
| Retained Earnings |
|
| Accumulated Other Comprehensive (Loss) Income |
|
| Non-controlling Interests |
|
| Total Equity |
| |||||||||||||||||||
Balance at January 1, 2018 |
|
| 185,343,034 |
|
| $ | 2 |
|
| $ | — |
|
|
| 2,386,406 |
|
| $ | (116 | ) |
| $ | 837 |
|
| $ | 579 |
|
| $ | (442 | ) |
| $ | 5 |
|
| $ | 865 |
|
|
| 185,343,034 |
|
| $ | 2 |
|
|
| 2,386,406 |
|
| $ | (116 | ) |
| $ | 837 |
|
| $ | 579 |
|
| $ | (442 | ) |
| $ | 5 |
|
| $ | 865 |
|
Common stock issued - compensation plans |
|
| 286,618 |
|
|
| — |
|
|
| — |
|
|
| — |
|
|
| — |
|
|
| — |
|
|
| — |
|
|
| — |
|
|
| — |
|
|
| — |
|
|
| 787,451 |
|
|
| — |
|
|
| — |
|
|
| — |
|
|
| — |
|
|
| — |
|
|
| — |
|
|
| — |
|
|
| — |
|
Exercise of stock options, net |
|
| 273,460 |
|
|
| — |
|
|
| — |
|
|
| — |
|
|
| — |
|
|
| 5 |
|
|
| — |
|
|
| — |
|
|
| — |
|
|
| 5 |
|
|
| 1,018,962 |
|
|
| — |
|
|
| — |
|
|
| — |
|
|
| 15 |
|
|
| — |
|
|
| — |
|
|
| — |
|
|
| 15 |
|
Purchases of treasury stock, at cost |
|
| — |
|
|
| — |
|
|
| — |
|
|
| 4,979,152 |
|
|
| (245 | ) |
|
| — |
|
|
| — |
|
|
| — |
|
|
| — |
|
|
| (245 | ) |
|
| — |
|
|
| — |
|
|
| 10,926,065 |
|
|
| (520 | ) |
|
| — |
|
|
| — |
|
|
| — |
|
|
| — |
|
|
| (520 | ) |
Shares issued under employee stock purchase plan |
|
| — |
|
|
| — |
|
|
| (12,411 | ) |
|
| — |
|
|
| — |
|
|
| — |
|
|
| — |
|
|
| — |
|
|
| — |
| ||||||||||||||||||||||||||||||||||||||||
Stock-based compensation expense |
|
| — |
|
|
| — |
|
|
| — |
|
|
| — |
|
|
| — |
|
|
| 9 |
|
|
| — |
|
|
| — |
|
|
| — |
|
|
| 9 |
|
|
| — |
|
|
| — |
|
|
| — |
|
|
| — |
|
|
| 20 |
|
|
| — |
|
|
| — |
|
|
| — |
|
|
| 20 |
|
Cancellation of unissued stock awards withheld to cover taxes |
|
| — |
|
|
| — |
|
|
| — |
|
|
| — |
|
|
| — |
|
|
| (5 | ) |
|
| — |
|
|
| — |
|
|
| — |
|
|
| (5 | ) |
|
| — |
|
|
| — |
|
|
| — |
|
|
| — |
|
|
| (16 | ) |
|
| — |
|
|
| — |
|
|
| — |
|
|
| (16 | ) |
Net income |
|
| — |
|
|
| — |
|
|
| — |
|
|
| — |
|
|
| — |
|
|
| — |
|
|
| 297 |
|
|
| — |
|
|
| — |
|
|
| 297 |
|
|
| — |
|
|
| — |
|
|
| — |
|
|
| — |
|
|
| — |
|
|
| 853 |
|
|
| — |
|
|
| 1 |
|
|
| 854 |
|
Dividends ($0.42 per share) |
|
| — |
|
|
| — |
|
|
| — |
|
|
| — |
|
|
| — |
|
|
| (74 | ) |
|
| — |
|
|
| — |
|
|
| (74 | ) | ||||||||||||||||||||||||||||||||||||||||
Other comprehensive income |
|
| — |
|
|
| — |
|
|
| — |
|
|
| — |
|
|
| — |
|
|
| — |
|
|
| — |
|
|
| 76 |
|
|
| — |
|
|
| 76 |
|
|
| — |
|
|
| — |
|
|
| — |
|
|
| — |
|
|
| — |
|
|
| — |
|
|
| 2 |
|
|
| — |
|
|
| 2 |
|
Balance at March 31, 2018 |
|
| 185,903,112 |
|
| $ | 2 |
|
| $ | — |
|
|
| 7,365,558 |
|
| $ | (361 | ) |
| $ | 846 |
|
| $ | 876 |
|
| $ | (366 | ) |
| $ | 5 |
|
| $ | 1,002 |
| ||||||||||||||||||||||||||||||||||||
Balance at September 30, 2018 |
|
| 187,149,447 |
|
| $ | 2 |
|
|
| 13,300,060 |
|
| $ | (636 | ) |
| $ | 856 |
|
| $ | 1,358 |
|
| $ | (440 | ) |
| $ | 6 |
|
| $ | 1,146 |
| ||||||||||||||||||||||||||||||||||||||||
|
|
|
|
|
|
|
|
|
|
|
|
|
|
|
|
|
|
|
|
|
|
|
|
|
|
|
|
|
|
|
|
|
|
|
|
|
|
|
|
|
|
|
|
|
|
|
|
|
|
|
|
|
|
|
|
|
|
|
|
|
|
|
|
|
|
|
|
|
|
|
|
|
|
|
|
|
Balance at January 1, 2019 |
|
| 187,204,567 |
|
| $ | 2 |
|
| $ | — |
|
|
| 16,424,093 |
|
| $ | (750 | ) |
| $ | 860 |
|
| $ | 1,466 |
|
| $ | (564 | ) |
| $ | 6 |
|
| $ | 1,020 |
|
|
| 187,204,567 |
|
| $ | 2 |
|
|
| 16,424,093 |
|
| $ | (750 | ) |
| $ | 860 |
|
| $ | 1,466 |
|
| $ | (564 | ) |
| $ | 6 |
|
| $ | 1,020 |
|
Common stock issued - compensation plans |
|
| 1,078,034 |
|
|
| — |
|
|
| — |
|
|
| — |
|
|
| — |
|
|
| 1 |
|
|
| (1 | ) |
|
| — |
|
|
| — |
|
|
| — |
|
|
| 1,098,346 |
|
|
| — |
|
|
| — |
|
|
| — |
|
|
| 1 |
|
|
| (1 | ) |
|
| — |
|
|
| — |
|
|
| — |
|
Exercise of stock options, net |
|
| 410,483 |
|
|
| — |
|
|
| — |
|
|
| — |
|
|
| — |
|
|
| 6 |
|
|
| — |
|
|
| — |
|
|
| — |
|
|
| 6 |
|
|
| 508,773 |
|
|
| — |
|
|
| — |
|
|
| — |
|
|
| 8 |
|
|
| — |
|
|
| — |
|
|
| — |
|
|
| 8 |
|
Purchases of treasury stock, at cost |
|
| — |
|
|
| — |
|
|
| — |
|
|
| 7,278,002 |
|
|
| (261 | ) |
|
| — |
|
|
| — |
|
|
| — |
|
|
| — |
|
|
| (261 | ) |
|
| — |
|
|
| — |
|
|
| 8,895,142 |
|
|
| (322 | ) |
|
| — |
|
|
| — |
|
|
| — |
|
|
| — |
|
|
| (322 | ) |
Stock-based compensation expense |
|
| — |
|
|
| — |
|
|
| — |
|
|
| — |
|
|
| — |
|
|
| 8 |
|
|
| — |
|
|
| — |
|
|
| — |
|
|
| 8 |
|
|
| — |
|
|
| — |
|
|
| — |
|
|
| — |
|
|
| 18 |
|
|
| — |
|
|
| — |
|
|
| — |
|
|
| 18 |
|
Cancellation of unissued stock awards withheld to cover taxes |
|
| — |
|
|
| — |
|
|
| — |
|
|
| — |
|
|
| — |
|
|
| (30 | ) |
|
| — |
|
|
| — |
|
|
| — |
|
|
| (30 | ) |
|
| — |
|
|
| — |
|
|
| — |
|
|
| — |
|
|
| (30 | ) |
|
| — |
|
|
| — |
|
|
| — |
|
|
| (30 | ) |
Net income |
|
| — |
|
|
| — |
|
|
| — |
|
|
| — |
|
|
| — |
|
|
| — |
|
|
| 94 |
|
|
| — |
|
|
| — |
|
|
| 94 |
|
|
| — |
|
|
| — |
|
|
| — |
|
|
| — |
|
|
| — |
|
|
| 265 |
|
|
| — |
|
|
| — |
|
|
| 265 |
|
Dividends |
|
| — |
|
|
| — |
|
|
| 0.25 |
|
|
| — |
|
|
| — |
|
|
| — |
|
|
| (42 | ) |
|
| — |
|
|
| — |
|
|
| (42 | ) | ||||||||||||||||||||||||||||||||||||
Dividends ($0.75 per share) |
|
| — |
|
|
| — |
|
|
| — |
|
|
| — |
|
|
| — |
|
|
| (124 | ) |
|
| — |
|
|
| — |
|
|
| (124 | ) | ||||||||||||||||||||||||||||||||||||||||
Other comprehensive income |
|
| — |
|
|
| — |
|
|
| — |
|
|
| — |
|
|
| — |
|
|
| — |
|
|
| — |
|
|
| 21 |
|
|
| — |
|
|
| 21 |
|
|
| — |
|
|
| — |
|
|
| — |
|
|
| — |
|
|
| — |
|
|
| — |
|
|
| 8 |
|
|
| — |
|
|
| 8 |
|
Balance at March 31, 2019 |
|
| 188,693,084 |
|
| $ | 2 |
|
| $ | 0.25 |
|
|
| 23,702,095 |
|
| $ | (1,011 | ) |
| $ | 845 |
|
| $ | 1,517 |
|
| $ | (543 | ) |
| $ | 6 |
|
| $ | 816 |
| ||||||||||||||||||||||||||||||||||||
Balance at September 30, 2019 |
|
| 188,811,686 |
|
| $ | 2 |
|
|
| 25,319,235 |
|
| $ | (1,072 | ) |
| $ | 857 |
|
| $ | 1,606 |
|
| $ | (556 | ) |
| $ | 6 |
|
| $ | 843 |
| ||||||||||||||||||||||||||||||||||||||||
See accompanying notes to the interim consolidated financial statements.
The Chemours Company
Interim Consolidated Statements of Cash Flows (Unaudited)
(Dollars in millions)
|
| Three Months Ended March 31, |
|
| Nine Months Ended September 30, |
| ||||||||||
|
| 2019 |
|
| 2018 |
|
| 2019 |
|
| 2018 |
| ||||
Cash flows from operating activities |
|
|
|
|
|
|
|
|
|
|
|
|
|
|
|
|
Net income |
| $ | 94 |
|
| $ | 297 |
|
| $ | 265 |
|
| $ | 854 |
|
Adjustments to reconcile net income to cash (used for) provided by operating activities: |
|
|
|
|
|
|
|
| ||||||||
Adjustments to reconcile net income to cash provided by (used for) operating activities: |
|
|
|
|
|
|
|
| ||||||||
Depreciation and amortization |
|
| 76 |
|
|
| 70 |
|
|
| 232 |
|
|
| 213 |
|
Gain on sales of assets and businesses |
|
| — |
|
|
| (42 | ) |
|
| (11 | ) |
|
| (45 | ) |
Equity in earnings of affiliates, net |
|
| (7 | ) |
|
| 17 |
|
|
| (24 | ) |
|
| (4 | ) |
Loss on extinguishment of debt |
|
| — |
|
|
| 38 |
| ||||||||
Amortization of debt issuance costs and issue discounts |
|
| 3 |
|
|
| 3 |
|
|
| 7 |
|
|
| 9 |
|
Deferred tax (benefit) provision |
|
| (7 | ) |
|
| 35 |
|
|
| (17 | ) |
|
| 3 |
|
Asset-related charges |
|
| 12 |
|
|
| — |
| ||||||||
Stock-based compensation expense |
|
| 8 |
|
|
| 9 |
|
|
| 18 |
|
|
| 20 |
|
Net periodic pension cost (income) |
|
| 1 |
|
|
| (3 | ) |
|
| 4 |
|
|
| (7 | ) |
Defined benefit plan contributions |
|
| (6 | ) |
|
| (4 | ) |
|
| (15 | ) |
|
| (12 | ) |
Other operating charges and credits, net |
|
| 4 |
|
|
| (1 | ) |
|
| (2 | ) |
|
| (11 | ) |
Decrease (increase) in operating assets: |
|
|
|
|
|
|
|
|
|
|
|
|
|
|
|
|
Accounts and notes receivable, net |
|
| 16 |
|
|
| (150 | ) |
|
| 32 |
|
|
| (87 | ) |
Inventories and other operating assets |
|
| (49 | ) |
|
| (18 | ) |
|
| (46 | ) |
|
| (154 | ) |
(Decrease) increase in operating liabilities: |
|
|
|
|
|
|
|
|
|
|
|
|
|
|
|
|
Accounts payable and other operating liabilities |
|
| (177 | ) |
|
| (17 | ) |
|
| (205 | ) |
|
| 64 |
|
Cash (used for) provided by operating activities |
|
| (44 | ) |
|
| 196 |
| ||||||||
Cash provided by operating activities |
|
| 250 |
|
|
| 881 |
| ||||||||
Cash flows from investing activities |
|
|
|
|
|
|
|
|
|
|
|
|
|
|
|
|
Purchases of property, plant, and equipment |
|
| (133 | ) |
|
| (102 | ) |
|
| (385 | ) |
|
| (344 | ) |
Acquisition of business, net |
|
| (10 | ) |
|
| (37 | ) | ||||||||
Proceeds from sales of assets and businesses, net |
|
| — |
|
|
| 39 |
|
|
| 7 |
|
|
| 46 |
|
Proceeds from life insurance policies |
|
| 1 |
|
|
| — |
| ||||||||
Foreign exchange contract settlements, net |
|
| (1 | ) |
|
| 5 |
|
|
| — |
|
|
| 8 |
|
Cash used for investing activities |
|
| (134 | ) |
|
| (58 | ) |
|
| (387 | ) |
|
| (327 | ) |
Cash flows from financing activities |
|
|
|
|
|
|
|
|
|
|
|
|
|
|
|
|
Proceeds from issuance of debt, net |
|
| — |
|
|
| 520 |
| ||||||||
Proceeds from revolving loan |
|
| 150 |
|
|
| — |
| ||||||||
Repayments on revolving loan |
|
| (150 | ) |
|
| — |
| ||||||||
Proceeds from accounts receivable securitization facility |
|
| 125 |
|
|
| — |
| ||||||||
Debt repayments |
|
| (3 | ) |
|
| (4 | ) |
|
| (15 | ) |
|
| (675 | ) |
Payments related to extinguishment of debt |
|
| — |
|
|
| (29 | ) | ||||||||
Payments of debt issuance costs |
|
| — |
|
|
| (12 | ) | ||||||||
Payments on finance leases |
|
| (2 | ) |
|
| — |
| ||||||||
Purchases of treasury stock, at cost |
|
| (255 | ) |
|
| (240 | ) |
|
| (322 | ) |
|
| (520 | ) |
Proceeds from exercised stock options, net |
|
| 6 |
|
|
| 5 |
|
|
| 8 |
|
|
| 15 |
|
Payments related to tax withholdings on vested stock awards |
|
| (30 | ) |
|
| (1 | ) |
|
| (30 | ) |
|
| (16 | ) |
Payments of dividends |
|
| (42 | ) |
|
| (31 | ) |
|
| (124 | ) |
|
| (106 | ) |
Cash used for financing activities |
|
| (324 | ) |
|
| (271 | ) |
|
| (360 | ) |
|
| (823 | ) |
Effect of exchange rate changes on cash and cash equivalents |
|
| (2 | ) |
|
| 11 |
|
|
| (10 | ) |
|
| (12 | ) |
Decrease in cash and cash equivalents |
|
| (504 | ) |
|
| (122 | ) |
|
| (507 | ) |
|
| (281 | ) |
Cash and cash equivalents at January 1, |
|
| 1,201 |
|
|
| 1,556 |
|
|
| 1,201 |
|
|
| 1,556 |
|
Cash and cash equivalents at March 31, |
| $ | 697 |
|
| $ | 1,434 |
| ||||||||
Cash and cash equivalents at September 30, |
| $ | 694 |
|
| $ | 1,275 |
| ||||||||
|
|
|
|
|
|
|
|
|
|
|
|
|
|
|
|
|
Supplemental cash flows information |
|
|
|
|
|
|
|
|
|
|
|
|
|
|
|
|
Non-cash investing and financing activities: |
|
|
|
|
|
|
|
|
|
|
|
|
|
|
|
|
Changes in property, plant, and equipment included in accounts payable |
| $ | (11 | ) |
| $ | (1 | ) |
| $ | 68 |
|
| $ | 12 |
|
Obligations incurred under build-to-suit lease arrangement |
|
| 17 |
|
|
| 11 |
|
|
| 35 |
|
|
| 41 |
|
Purchases of treasury stock not settled by quarter-end |
|
| 6 |
|
|
| 15 |
| ||||||||
Tax payments accrued for withholdings on vested restricted stock units |
|
| — |
|
|
| 4 |
| ||||||||
Purchases of treasury stock not settled by period-end |
|
| — |
|
|
| 10 |
| ||||||||
Non-cash financing arrangements |
|
| 11 |
|
|
| — |
| ||||||||
Deferred payments related to acquisition of business |
|
| 15 |
|
|
| — |
| ||||||||
See accompanying notes to the interim consolidated financial statements.
6
The Chemours Company
Notes to the Interim Consolidated Financial Statements (Unaudited)
(Dollars in millions, except per share amounts)
Note 1. Background, Description of the Business, and Basis of Presentation
The Chemours Company (“Chemours,” or “the Company”) is a leading, global provider of performance chemicals that are key inputs in end-products and processes in a variety of industries. The Company delivers customized solutions with a wide range of industrial and specialty chemical products for markets, including plastics and coatings, refrigeration and air conditioning, general industrial, electronics, mining, and oil refining. The Company’s principal products include refrigerants, industrial fluoropolymer resins, sodium cyanide, performance chemicals and intermediates, and titanium dioxide (“TiO2”) pigment. Chemours’ business consists of three3 reportable segments: Fluoroproducts, Chemical Solutions, and Titanium Technologies. The Fluoroproducts segment is a leading, global provider of fluoroproducts, including refrigerants and industrial fluoropolymer resins. The Chemical Solutions segment is a leading, North American provider of industrial chemicals used in gold production, industrial, and consumer applications. The Titanium Technologies segment is a leading, global provider of TiO2 pigment, a premium white pigment used to deliver whiteness, brightness, opacity, and protectionsprotection in a variety of applications.
Chemours separated from E. I. du Pont de Nemours and Company (“DuPont”) on July 1, 2015. On August 31, 2017, DuPont completed a merger with The Dow Chemical Company (“Dow”). Following their merger, DuPont and Dow engaged in a series of reorganization steps and in 2019 have now separated into three publicly-traded companies named Dow Inc., pursuant to which, DowDuPont de Nemours, Inc., and DuPont became subsidiaries of DowDuPont,Corteva, Inc. (“DowDuPont”Corteva”) with.
Unless the intentcontext otherwise requires, references herein to form three independent, publicly-traded companies. On April 1, 2019, Dow separated from DuPont as part“The Chemours Company,” “Chemours,” “the Company,” “our Company,” “we,” “us,” and “our” refer to The Chemours Company and its consolidated subsidiaries. References to “DuPont” refer to E. I. du Pont de Nemours and Company, which is now a subsidiary of their planned reorganization. At this time, the agreements related to Chemours’ separation remain between Chemours and DuPont.Corteva.
The accompanying interim consolidated financial statements have been prepared in accordance with U.S. generally accepted accounting principles (“GAAP”). In the opinion of management, all adjustments (consisting of normal, recurring adjustments) considered necessary for a fair statement of the Company’s results for interim periods have been included. The notes that follow are an integral part of the Company’s interim consolidated financial statements. The Company’s results for interim periods should not be considered indicative of its results for a full year, and the year-end consolidated balance sheet does not include all of the disclosures required by GAAP. As such, these interim consolidated financial statements should be read in conjunction with the Consolidated Financial Statements and notes thereto included in the Company's Annual Report on Form 10-K for the year ended December 31, 2018.
Unless the context otherwise requires, references herein to “The Chemours Company,” “Chemours,” “the Company,” “our Company,” “we,” “us,” and “our” refer to The Chemours Company and its consolidated subsidiaries. References herein to “DuPont” refer to E. I. du Pont de Nemours and Company, a Delaware corporation, and its consolidated subsidiaries (other than Chemours and its consolidated subsidiaries), unless the context otherwise requires.
Certain prior period amounts have been reclassified to conform to the current period presentation, the effect of which, was not material to the Company’s interim consolidated financial statements.
Note 2. Recent Accounting Pronouncements
Accounting Guidance Issued and Not Yet Adopted
Measurement of Credit Losses on Financial Instruments
In June 2016, the Financial Accounting Standards Board (“FASB”) issued ASU No. 2016-13, Financial Instruments – Credit Losses (Topic 326), Measurement of Credit Losses on Financial Instruments. The amendments in this update affect loans, debt securities, trade receivables, and any other financial assets that have the contractual right to receive cash. The ASU requires an entity to recognize expected credit losses rather than incurred losses for financial assets. For public entities, the amendments are effective for fiscal years beginning after December 15, 2019, including interim periods within those fiscal years, and early adoption is permitted. The Company is currently evaluating the impacts of adopting this guidance on its financial position, results of operations, and cash flows.
Changes to Disclosure Requirements for Defined Benefit Plans
In August 2018, the Financial Accounting Standards Board (“FASB”)FASB issued Accounting Standards Update (“ASU”)ASU No. 2018-14, Compensation –Retirement Benefits – Defined Benefit Plans – General (Subtopic 715-20): Disclosure Framework – Changes to the Disclosure Requirements for Defined Benefit Plans (“ASU No. 2018-14”). This update removes disclosures that are no longer considered cost beneficial, clarifies the specific requirements of certain disclosures, and adds new disclosure requirements that are considered relevant for employers that sponsor defined benefit pension or other postretirement plans. ASU No. 2018-14 is effective for fiscal years ending after December 15, 2020 with retrospective application to all periods presented, and early adoption is permitted. The Company is currently evaluating the impacts of adopting this guidance, which it does not expect to be material.
7
The Chemours Company
Notes to the Interim Consolidated Financial Statements (Unaudited)
(Dollars in millions, except per share amounts)
Recently Adopted Accounting Guidance
Leases
In February 2016, the FASB issued ASU No. 2016-02, Leases (Topic 842) (“ASU No. 2016-02”), which supersedes the leases requirements in Topic 840. The core principle of ASU No. 2016-02 is that a lessee should recognize on the balance sheet the lease assets and lease liabilities that arise from all lease arrangements with terms greater than 12 months. Recognition of these lease assets and lease liabilities represents a change from previous GAAP, which did not require lease assets and lease liabilities to be recognized for operating leases.
7
The Chemours Company
Notes to the Interim Consolidated Financial Statements (Unaudited)
(Dollars in millions, except per share amounts)
The Company adopted ASU No. 2016-02 on January 1, 2019 using the modified retrospective transition method, which did not require the Company to adjust comparative periods. Operating leases are included in operating lease right-of-use assets, other accrued liabilities, and operating lease liabilities on the consolidated balance sheets. Finance leases are included in property, plant, and equipment, net, short-term and current maturities of long-term debt, and long-term debt, net, on the consolidated balance sheets. The Company’s lease assets and lease liabilities are recognized on the lease commencement date in an amount that represents the present value of future lease payments. The Company’s incremental borrowing rate, which is based on information available at the adoption date for existing leases and the commencement date for leases commencing after the adoption date, is used to determine the present value of lease payments.
The most significant impact of the Company’s adoption of ASU No. 2016-02 was the recognition of $333 of operating lease right-of-use assets and $349 of operating lease liabilities on its consolidated balance sheets at January 1, 2019. Operating lease right-of-use assets were reduced by $16 due to a tenant improvement allowance on a lease of office space. The Company’s adoption of ASU No. 2016-02 did not have any impact to the Company’s consolidated statements of operations, or its consolidated statements of cash flows. Further, there was no impact on the Company’s covenant compliance under its current debt agreements as a result of the adoption of ASU No. 2016-02.
The Company elected the package of practical expedients included in this guidance, which allowed it to not reassess: (i) whether any expired or existing contracts contain leases; (ii) the lease classification for any expired or existing leases; and, (iii) the initial direct costs for existing leases. The Company combines lease components with non-lease components for all classes of assets, except for certain manufacturing facilities. The Company also elected the practical expedient to not assess whether existing or expired land easements contain a lease.
The Company does not recognize short-term leases on its consolidated balance sheets, and will recognize those lease payments in the consolidated statements of operations on a straight-line basis over the lease term. Leases with the options to extend their term or terminate early are reflected in the lease term when it is reasonably certain that the Company will exercise such options.
Customer’s Accounting for Implementation Costs Incurred in a Cloud Computing Arrangement That Is a Service Contract
In August 2018, the FASB issued ASU No. 2018-15, Intangibles – Goodwill and Other – Internal-Use Software (Subtopic 350-40): Customer’s Accounting for Implementation Costs Incurred in a Cloud Computing Arrangement That Is a Service Contract (“ASU No. 2018-15”), which aligns the requirements for capitalizing implementation costs incurred in a cloud computing arrangement that is a service contract with the requirements for capitalizing implementation costs incurred to develop or obtain internal-use software. Pursuant to the amendments, the Company, when acting as a customer to a cloud computing arrangement that is a service contract, is required to follow the guidance in Subtopic 350-40 to determine whichthe implementation costs to capitalize as an asset related to the service contract and whichthe costs to expense. ASU No. 2018-15 is effective for fiscal years beginning after December 15, 2019, including interim periods within those fiscal years, with early adoption permitted in any interim period. Upon adoption, the Company had the option to elect whether it applies the amendments under ASU No. 2018-15 retrospectively, or prospectively to all implementation costs incurred after the date of adoption. The Company adopted ASU No. 2018-15 on January 1, 2019 using the prospective adoption method, the effect of which, was not material to its financial position, results of operations, or cash flows for the threenine months ended March 31,September 30, 2019.
8
The Chemours Company
Notes to the Interim Consolidated Financial Statements (Unaudited)
(Dollars in millions, except per share amounts)
Note 3. Significant TransactionAcquisitions and Divestitures
Acquisition of Southern Ionics Minerals, LLC.
On August 1, 2019, the Company, through its wholly-owned subsidiary, The Chemours Company FC, LLC, entered into a Membership Interest Purchase Agreement to acquire all of the outstanding stock of Southern Ionics Minerals, LLC (“SIM”), for an estimated total consideration of approximately $25, which included customary working capital and other adjustments made within a specified time period. SIM is a privately-held minerals exploration, mining, and manufacturing company headquartered in Jacksonville, Florida. SIM mines and processes titanium and zirconium mineral sands, and this acquisition expands Chemours’ flexibility and scalability to internally source ore in the Company’s Titanium Technologies segment. The aggregate purchase price of $25 included an upfront payment of $10, an additional installment payment of $10, and contingent considerations with an estimated fair value of $5. The Company accounted for the acquisition of SIM as a business combination, and as such, all assets acquired and liabilities assumed were recorded at their estimated fair values.
The purchase consideration has been primarily assigned to the property, plant, and equipment of the acquired business, and there is 0 goodwill associated with the transaction. These amounts are subject to further adjustment as additional information is obtained during the applicable measurement period, which includes the finalization of a third-party appraisal. The Company expects to complete its assessment by the end of 2019.
The Company’s consolidated financial statements include SIM’s results of operations from August 1, 2019, the date of acquisition, through September 30, 2019. Net sales and net income attributable to Chemours contributed by SIM during this period were not material to the Company’s or its Titanium Technologies segment’s results of operations. Acquisition-related expenses amounted to less than $1 during the three and nine months ended September 30, 2019 and are included as a component of selling, general, and administrative expense in the consolidated statements of operations.
Sale of Land in Linden, New Jersey
In March 2016, the Company entered into an agreement to sell a 210-acre plot of land that formerly housed a DuPont manufacturing site in Linden, New Jersey. The land was assigned to Chemours in connection with its separation from DuPont, and the Company completed the sale in March 2018 for a gain of $42 and net cash proceeds of $39. As part of the sales agreement, the buyer agreed to assume certain costs associated with ongoing environmental remediation activities at the site amounting to $3, which have been reflected as a component of prepaid expenses and other on the consolidated balance sheets. Chemours remains responsible for certain other ongoing environmental remediation activities at the site, which were previously accrued as a component of other liabilities on the consolidated balance sheets.
89
The Chemours Company
Notes to the Interim Consolidated Financial Statements (Unaudited)
(Dollars in millions, except per share amounts)
Note 4. Net Sales
Disaggregation of Net Sales
The following table sets forth a disaggregation of the Company’s net sales by geographic region and product group and segment for the three and nine months ended March 31, 2019.
|
| Three Months Ended March 31, 2019 |
| |||||||||||||
|
|
|
|
|
| Chemical |
|
| Titanium |
|
|
|
|
| ||
|
| Fluoroproducts |
|
| Solutions |
|
| Technologies |
|
| Total |
| ||||
Net sales by geographic region (1) |
|
|
|
|
|
|
|
|
|
|
|
|
|
|
|
|
North America |
| $ | 288 |
|
| $ | 74 |
|
| $ | 197 |
|
| $ | 559 |
|
Asia Pacific |
|
| 163 |
|
|
| 16 |
|
|
| 166 |
|
|
| 345 |
|
Europe, the Middle East, and Africa |
|
| 186 |
|
|
| 5 |
|
|
| 113 |
|
|
| 304 |
|
Latin America (2) |
|
| 50 |
|
|
| 39 |
|
|
| 79 |
|
|
| 168 |
|
Total net sales |
| $ | 687 |
|
| $ | 134 |
|
| $ | 555 |
|
| $ | 1,376 |
|
|
|
|
|
|
|
|
|
|
|
|
|
|
|
|
|
|
Net sales by product group |
|
|
|
|
|
|
|
|
|
|
|
|
|
|
|
|
Fluorochemicals |
| $ | 349 |
|
| $ | — |
|
| $ | — |
|
| $ | 349 |
|
Fluoropolymers |
|
| 338 |
|
|
| — |
|
|
| — |
|
|
| 338 |
|
Mining solutions |
|
| — |
|
|
| 68 |
|
|
| — |
|
|
| 68 |
|
Performance chemicals and intermediates |
|
| — |
|
|
| 66 |
|
|
| — |
|
|
| 66 |
|
Titanium dioxide and other minerals |
|
| — |
|
|
| — |
|
|
| 555 |
|
|
| 555 |
|
Total net sales |
| $ | 687 |
|
| $ | 134 |
|
| $ | 555 |
|
| $ | 1,376 |
|
|
|
|
|
The following table sets forth a disaggregation of the Company’s net sales by geographic region, product group,September 30, 2019 and segment for the three months ended March 31, 2018.
|
| Three Months Ended March 31, 2018 |
| |||||||||||||||||||||||||||||
|
|
|
|
|
| Chemical |
|
| Titanium |
|
|
|
|
|
| Three Months Ended September 30, |
|
| Nine Months Ended September 30, |
| ||||||||||||
|
| Fluoroproducts |
|
| Solutions |
|
| Technologies |
|
| Total |
|
| 2019 |
|
| 2018 |
|
| 2019 |
|
| 2018 |
| ||||||||
Net sales by geographic region (1) |
|
|
|
|
|
|
|
|
|
|
|
|
|
|
|
|
|
|
|
|
|
|
|
|
|
|
|
|
|
|
|
|
North America |
| $ | 303 |
|
| $ | 81 |
|
| $ | 233 |
|
| $ | 617 |
| ||||||||||||||||
Asia Pacific |
|
| 153 |
|
|
| 19 |
|
|
| 242 |
|
|
| 414 |
| ||||||||||||||||
Europe, the Middle East, and Africa |
|
| 222 |
|
|
| 5 |
|
|
| 247 |
|
|
| 474 |
| ||||||||||||||||
Latin America (2) |
|
| 54 |
|
|
| 39 |
|
|
| 132 |
|
|
| 225 |
| ||||||||||||||||
North America: |
|
|
|
|
|
|
|
|
|
|
|
|
|
|
|
| ||||||||||||||||
Fluoroproducts |
| $ | 260 |
|
| $ | 273 |
|
| $ | 851 |
|
| $ | 888 |
| ||||||||||||||||
Chemical Solutions |
|
| 87 |
|
|
| 87 |
|
|
| 246 |
|
|
| 259 |
| ||||||||||||||||
Titanium Technologies |
|
| 178 |
|
|
| 228 |
|
|
| 550 |
|
|
| 700 |
| ||||||||||||||||
Total North America |
|
| 525 |
|
|
| 588 |
|
|
| 1,647 |
|
|
| 1,847 |
| ||||||||||||||||
Asia Pacific: |
|
|
|
|
|
|
|
|
|
|
|
|
|
|
|
| ||||||||||||||||
Fluoroproducts |
|
| 173 |
|
|
| 168 |
|
|
| 511 |
|
|
| 505 |
| ||||||||||||||||
Chemical Solutions |
|
| 16 |
|
|
| 21 |
|
|
| 47 |
|
|
| 63 |
| ||||||||||||||||
Titanium Technologies |
|
| 225 |
|
|
| 251 |
|
|
| 587 |
|
|
| 754 |
| ||||||||||||||||
Total Asia Pacific |
|
| 414 |
|
|
| 440 |
|
|
| 1,145 |
|
|
| 1,322 |
| ||||||||||||||||
Europe, the Middle East, and Africa: |
|
|
|
|
|
|
|
|
|
|
|
|
|
|
|
| ||||||||||||||||
Fluoroproducts |
|
| 151 |
|
|
| 188 |
|
|
| 515 |
|
|
| 657 |
| ||||||||||||||||
Chemical Solutions |
|
| 6 |
|
|
| 5 |
|
|
| 15 |
|
|
| 14 |
| ||||||||||||||||
Titanium Technologies |
|
| 122 |
|
|
| 189 |
|
|
| 358 |
|
|
| 682 |
| ||||||||||||||||
Total Europe, the Middle East, and Africa |
|
| 279 |
|
|
| 382 |
|
|
| 888 |
|
|
| 1,353 |
| ||||||||||||||||
Latin America (2): |
|
|
|
|
|
|
|
|
|
|
|
|
|
|
|
| ||||||||||||||||
Fluoroproducts |
|
| 52 |
|
|
| 53 |
|
|
| 157 |
|
|
| 163 |
| ||||||||||||||||
Chemical Solutions |
|
| 31 |
|
|
| 42 |
|
|
| 96 |
|
|
| 117 |
| ||||||||||||||||
Titanium Technologies |
|
| 89 |
|
|
| 123 |
|
|
| 240 |
|
|
| 372 |
| ||||||||||||||||
Total Latin America |
|
| 172 |
|
|
| 218 |
|
|
| 493 |
|
|
| 652 |
| ||||||||||||||||
Total net sales |
| $ | 732 |
|
| $ | 144 |
|
| $ | 854 |
|
| $ | 1,730 |
|
| $ | 1,390 |
|
| $ | 1,628 |
|
| $ | 4,173 |
|
| $ | 5,174 |
|
|
|
|
|
|
|
|
|
|
|
|
|
|
|
|
|
|
|
|
|
|
|
|
|
|
|
|
|
|
|
|
|
|
Net sales by product group |
|
|
|
|
|
|
|
|
|
|
|
|
|
|
|
|
|
|
|
|
|
|
|
|
|
|
|
|
|
|
|
|
Fluorochemicals |
| $ | 395 |
|
| $ | — |
|
| $ | — |
|
| $ | 395 |
|
| $ | 304 |
|
| $ | 345 |
|
| $ | 1,028 |
|
| $ | 1,183 |
|
Fluoropolymers |
|
| 337 |
|
|
| — |
|
|
| — |
|
|
| 337 |
|
|
| 332 |
|
|
| 337 |
|
|
| 1,006 |
|
|
| 1,030 |
|
Mining solutions |
|
| — |
|
|
| 66 |
|
|
| — |
|
|
| 66 |
|
|
| 70 |
|
|
| 74 |
|
|
| 200 |
|
|
| 212 |
|
Performance chemicals and intermediates |
|
| — |
|
|
| 78 |
|
|
| — |
|
|
| 78 |
|
|
| 70 |
|
|
| 81 |
|
|
| 204 |
|
|
| 241 |
|
Titanium dioxide and other minerals |
|
| — |
|
|
| — |
|
|
| 854 |
|
|
| 854 |
|
|
| 614 |
|
|
| 791 |
|
|
| 1,735 |
|
|
| 2,508 |
|
Total net sales |
| $ | 732 |
|
| $ | 144 |
|
| $ | 854 |
|
| $ | 1,730 |
|
| $ | 1,390 |
|
| $ | 1,628 |
|
| $ | 4,173 |
|
| $ | 5,174 |
|
| (1) | Net sales are attributed to countries based on customer location. |
| (2) | Latin America includes Mexico. |
Substantially all of the Company’s net sales are derived from goods and services transferred at a point in time.
9
10
The Chemours Company
Notes to the Interim Consolidated Financial Statements (Unaudited)
(Dollars in millions, except per share amounts)
Contract Balances
The Company’s assets and liabilities from contracts with customers constitute accounts receivable - trade, deferred revenue, and customer rebates. An amount for accounts receivable - trade is recorded when the right to consideration under a contract becomes unconditional. An amount for deferred revenue is recorded when consideration is received prior to the conclusion that a contract exists, or when a customer transfers consideration prior to the Company satisfying its performance obligations under a contract. Customer rebates represent an expected refund liability to a customer based on a contract. In contracts with customers where a rebate is offered, it is generally applied retroactively based on the achievement of a certain sales threshold. As revenue is recognized, the Company estimates whether or not the sales threshold will be achieved to determine the amount of variable consideration to include in the transaction price.
The following table sets forth the Company’s contract balances from contracts with customers at March 31,September 30, 2019 and December 31, 2018.
|
| March 31, 2019 |
|
| December 31, 2018 |
|
| September 30, 2019 |
|
| December 31, 2018 |
| ||||
Accounts receivable - trade, net (1) |
| $ | 776 |
|
| $ | 790 |
|
| $ | 758 |
|
| $ | 790 |
|
Customer rebates |
|
| 42 |
|
|
| 79 |
|
|
| 66 |
|
|
| 79 |
|
| (1) | Accounts receivable - trade, net includes trade notes receivable of |
The Company’s deferred revenue balances at March 31,September 30, 2019 and December 31, 2018 were not significant. Additionally, changes in the Company’s deferred revenue balances resulting from additions for advance payments and deductions for amounts recognized in net sales during the three and nine months ended March 31,September 30, 2019 were not significant. For the three and nine months ended March 31,September 30, 2019, the amount of net sales recognized from performance obligations satisfied in prior periods (e.g., due to changes in transaction price) was not significant.
There were no0 other contract asset balances or capitalized costs associated with obtaining or fulfilling customer contracts as of March 31,September 30, 2019 or December 31, 2018.
Remaining Performance Obligations
Certain of the Company’s master services agreements or other arrangements contain take-or-pay clauses, whereby customers are required to purchase a fixed minimum quantity of product during a specified period, or pay the Company for such orders, even if not requested by the customer. The Company considers these take-or-pay clauses to be an enforceable contract, and as such, the legally-enforceable minimum amounts under such an arrangement are considered to be outstanding performance obligations on contracts with an original expected duration greater than one year. At March 31,September 30, 2019, Chemours had $132$100 of remaining performance obligations. The Company expects to recognize approximately 40%20% of its remaining performance obligations as revenue in 2019, an approximate additional 40%60% in 2020, and the balance thereafter. The Company applies the allowable practical expedient and does not include remaining performance obligations that have original expected durations ofone year or less, or amounts for variable consideration allocated to wholly-unsatisfied performance obligations or wholly-unsatisfied distinct goods that form part of a single performance obligation, if any. Amounts for contract renewals that are not yet exercised by March 31,September 30, 2019 are also excluded.
Note 5. Restructuring, Asset-related, and Other Charges
The following table sets forth the components of the Company’s restructuring, asset-related, and other charges for the three and nine months ended March 31,September 30, 2019 and 2018.
|
| Three Months Ended March 31, |
|
| Three Months Ended September 30, |
|
| Nine Months Ended September 30, |
| |||||||||||||||
|
| 2019 |
|
| 2018 |
|
| 2019 |
|
| 2018 |
|
| 2019 |
|
| 2018 |
| ||||||
Restructuring and other charges: |
|
|
|
|
|
|
|
|
|
|
|
|
|
|
|
|
|
|
|
|
|
|
|
|
Employee separation charges |
| $ | — |
|
| $ | 3 |
|
| $ | 17 |
|
| $ | 2 |
|
| $ | 15 |
|
| $ | 8 |
|
Decommissioning and other charges |
|
| 8 |
|
|
| 7 |
|
|
| 5 |
|
|
| 10 |
|
|
| 22 |
|
|
| 24 |
|
Total restructuring and other charges |
|
| 22 |
|
|
| 12 |
|
|
| 37 |
|
|
| 32 |
| ||||||||
Asset-related and other charges |
|
| 12 |
|
|
| — |
|
|
| 12 |
|
|
| — |
| ||||||||
Total restructuring, asset-related, and other charges |
| $ | 8 |
|
| $ | 10 |
|
| $ | 34 |
|
| $ | 12 |
|
| $ | 49 |
|
| $ | 32 |
|
1011
The Chemours Company
Notes to the Interim Consolidated Financial Statements (Unaudited)
(Dollars in millions, except per share amounts)
The following table sets forth the impacts of the Company’s restructuring programs to segment earnings for the three and nine months ended March 31,September 30, 2019 and 2018.
|
| Three Months Ended March 31, |
|
| Three Months Ended September 30, |
|
| Nine Months Ended September 30, |
| |||||||||||||||
|
| 2019 |
|
| 2018 |
|
| 2019 |
|
| 2018 |
|
| 2019 |
|
| 2018 |
| ||||||
Restructuring and other charges: |
|
|
|
|
|
|
|
|
|
|
|
|
|
|
|
|
|
|
|
|
|
|
|
|
Plant and product line closures: |
|
|
|
|
|
|
|
|
|
|
|
|
|
|
|
|
|
|
|
|
|
|
|
|
Chemical Solutions |
| $ | — |
|
| $ | 1 |
|
| $ | 12 |
|
| $ | 1 |
|
| $ | 12 |
|
| $ | 4 |
|
Corporate and Other |
|
| 6 |
|
|
| — |
|
|
| 5 |
|
|
| 4 |
|
|
| 18 |
|
|
| 6 |
|
Total plant and product line closures |
|
| 6 |
|
|
| 1 |
|
|
| 17 |
|
|
| 5 |
|
|
| 30 |
|
|
| 10 |
|
2017 Restructuring Program: |
|
|
|
|
|
|
|
|
|
|
|
|
|
|
|
|
|
|
|
|
|
|
|
|
Fluoroproducts |
|
| 1 |
|
|
| 3 |
|
|
| 1 |
|
|
| 2 |
|
|
| 2 |
|
|
| 7 |
|
Chemical Solutions |
|
| — |
|
|
| 1 |
|
|
| — |
|
|
| — |
|
|
| — |
|
|
| 1 |
|
Titanium Technologies |
|
| — |
|
|
| — |
|
|
| 1 |
|
|
| — |
| ||||||||
Corporate and Other |
|
| 1 |
|
|
| 5 |
|
|
| — |
|
|
| 5 |
|
|
| — |
|
|
| 14 |
|
Total 2017 Restructuring Program |
|
| 2 |
|
|
| 9 |
|
|
| 1 |
|
|
| 7 |
|
|
| 3 |
|
|
| 22 |
|
2018 Restructuring Program: |
|
|
|
|
|
|
|
|
|
|
|
|
|
|
|
| ||||||||
Corporate and Other |
|
| (1 | ) |
|
| — |
|
|
| (1 | ) |
|
| — |
| ||||||||
Total 2018 Restructuring Program |
|
| (1 | ) |
|
| — |
|
|
| (1 | ) |
|
| — |
| ||||||||
2019 Restructuring Program: |
|
|
|
|
|
|
|
|
|
|
|
|
|
|
|
| ||||||||
Fluoroproducts |
|
| 7 |
|
|
| — |
|
|
| 7 |
|
|
| — |
| ||||||||
Chemical Solutions |
|
| 2 |
|
|
| — |
|
|
| 2 |
|
|
| — |
| ||||||||
Titanium Technologies |
|
| 5 |
|
|
| — |
|
|
| 5 |
|
|
| — |
| ||||||||
Corporate and Other |
|
| 3 |
|
|
| — |
|
|
| 3 |
|
|
| — |
| ||||||||
Total 2019 Restructuring Program |
|
| 17 |
|
|
| — |
|
|
| 17 |
|
|
| — |
| ||||||||
Total restructuring, asset-related, and other charges |
| $ | 8 |
|
| $ | 10 |
|
| $ | 34 |
|
| $ | 12 |
|
| $ | 49 |
|
| $ | 32 |
|
Plant and Product Line Closures
In the fourth quarter of 2015, the Company announced its completion of the strategic review of its Reactive Metals Solutions business and the decision to stop production at its Niagara Falls, New York manufacturing plant. For the three months ended March 31, 2018, theThe Company recorded additional decommissioning and dismantling-related charges of $1.less than $1 and $1 for the three and nine months ended September 30, 2019, respectively, and $1 and $4 for the three and nine months ended September 30, 2018, respectively. The Company expects to incur approximately $10 in additional restructuring charges for similar activities through 2021, all of which will be reflected inrelates to Chemical Solutions, and will be expensed as incurred.Solutions. As of March 31,September 30, 2019, the Company incurred, in the aggregate, $36 in restructuring charges related to these activities, excluding asset-related charges.
In the first quarter of 2018, the Company began a project to demolish and remove several dormant, unused buildings at its Chambers Works site in Deepwater, New Jersey, which were assigned to Chemours in connection with its separation from DuPont. For the three months ended March 31, 2019, theDuPont and never used in Chemours’ operations. The Company incurred $6 inrecorded additional decommissioning and dismantling-related charges associated with these efforts.of $4 and $18 for the three and nine months ended September 30, 2019, respectively, and $4 and $6 for the three and nine months ended September 30, 2018, respectively. The Company expects to incur approximately $15 to $20$6 in additional restructuring charges related to its Chambers Works site through the end of 2020,2021, all of which will be reflected inrelates to Corporate and Other, and will be expensed as incurred.Other. As of March 31,September 30, 2019, the Company incurred, in the aggregate, $15$27 in restructuring charges related to these activities.
In the third quarter of 2019, the Company announced plans to exit its Methylamines and Methylamides business at its Belle, West Virginia manufacturing plant. As a result, the Company recorded charges of approximately $10 for property, plant, and equipment and $2 for other asset impairment charges for the three and nine months ended September 30, 2019. The Company expects to incur additional charges of $22 for property, plant, and equipment and other assets through the remainder of 2019, and additional restructuring charges, including decommissioning and dismantling, of approximately $11 through 2020, all of which relates to Chemical Solutions.
12
The Chemours Company
Notes to the Interim Consolidated Financial Statements (Unaudited)
(Dollars in millions, except per share amounts)
2017 Restructuring Program
In 2017, the Company announced certain restructuring activities designed to further the cost savings and productivity improvements outlined under management’s transformation plan. These activities include, among other efforts: (i) outsourcing and further centralizing certain business process activities; (ii) consolidating existing, outsourced third-party information technology (“IT”) providers; and, (iii) implementing various upgrades to the Company’s current IT infrastructure. In connection with these corporate function efforts, the Company recorded $2$1 and $6$3 in restructuring-related charges for the three and nine months as of March 31,ended September 30, 2019, respectively, and $5 and $13 for the three and nine months ended September 30, 2018, respectively.
In 2017, the Company also announced a voluntary separation program (“VSP”) for certain eligible U.S. employees in an effort to better manage the anticipated future changes to its workforce. Employees who volunteered for and were accepted under the VSP received certain financial incentives above the Company’s customary involuntary termination benefits to end their employment with Chemours after providing a mutually agreed-upon service period. Approximately 300 employees separated from the Company through the end of 2018. An accrual representing the majority of these termination benefits, amounting to $18, was recognized in the fourth quarter of 2017. The remaining incremental, one-time financial incentives under the VSP were recognized over the period that each participating employee continued to provide service to Chemours, and amounted to $3$2 and $9 for the three and nine months ended March 31, 2018.September 30, 2018, respectively.
The Company recorded charges of $2 and $9 for its 2017 program of $1 and $3 during the three and nine months ended March 31,September 30, 2019, respectively, and $7 and $22 during the three and nine months ended September 30, 2018, respectively. The cumulative amount incurred, in the aggregate, for the Company’s 2017 program amounted to $61$62 at March 31,September 30, 2019. The Company has substantially completed all actions related to this program, and the remaining amounts accrued at March 31, 2019 are expected to be paid during the first half of 2019.program.
11
The Chemours Company
Notes to the Interim Consolidated Financial Statements (Unaudited)
(Dollars in millions, except per share amounts)
2018 Restructuring Program
In the fourth quarter of 2018, management initiated a restructuring program of the Company’s corporate functions and recorded the related estimated severance costs of $5. The Company has substantially completed all actions related to this program.
2019 Restructuring Program
In the third quarter of 2019, management initiated a severance program is expectedof the Company’s corporate functions and businesses and recorded the related estimated severance costs of $17. This charge includes $2 for severance related to be completed in the first halfexit of 2019.the Methylamines and Methylamides business, as described above.
The following table sets forth the change in the Company’s employee separation-related liabilities associated with its restructuring programs for the threenine months ended March 31,September 30, 2019.
|
| 2015 Global Restructuring Program |
|
| 2017 Restructuring Program |
|
| 2018 Restructuring Program |
|
| Total |
|
| 2015 Global Restructuring Program |
|
| 2017 Restructuring Program |
|
| 2018 Restructuring Program |
|
| 2019 Restructuring Program |
|
| Total |
| |||||||||
Balance at December 31, 2018 |
| $ | 1 |
|
| $ | 10 |
|
| $ | 5 |
|
| $ | 16 |
|
| $ | 1 |
|
| $ | 10 |
|
| $ | 5 |
|
| $ | — |
|
| $ | 16 |
|
Credits to income |
|
| — |
|
|
| — |
|
|
| (1 | ) |
|
| (1 | ) | ||||||||||||||||||||
Charges (credits) to income |
|
| (1 | ) |
|
| — |
|
|
| (1 | ) |
|
| 17 |
|
|
| 15 |
| ||||||||||||||||
Payments |
|
| — |
|
|
| (9 | ) |
|
| — |
|
|
| (9 | ) |
|
| — |
|
|
| (9 | ) |
|
| (4 | ) |
|
| — |
|
|
| (13 | ) |
Balance at March 31, 2019 |
| $ | 1 |
|
| $ | 1 |
|
| $ | 4 |
|
| $ | 6 |
| ||||||||||||||||||||
Balance at September 30, 2019 |
| $ | — |
|
| $ | 1 |
|
| $ | — |
|
| $ | 17 |
|
| $ | 18 |
| ||||||||||||||||
At March 31,September 30, 2019, there were no significant outstanding liabilities related to the Company’s decommissioning and other restructuring-related charges.
13
The Chemours Company
Notes to the Interim Consolidated Financial Statements (Unaudited)
(Dollars in millions, except per share amounts)
Note 6. Other Income, Net
The following table sets forth the components of the Company’s other income, net for the three and nine months ended March 31,September 30, 2019 and 2018.
|
| Three Months Ended March 31, |
|
| Three Months Ended September 30, |
|
| Nine Months Ended September 30, |
| |||||||||||||||
|
| 2019 |
|
| 2018 |
|
| 2019 |
|
| 2018 |
|
| 2019 |
|
| 2018 |
| ||||||
Leasing, contract services, and miscellaneous income (1) |
| $ | 26 |
|
| $ | 3 |
|
| $ | 6 |
|
| $ | 24 |
|
| $ | 47 |
|
| $ | 47 |
|
Royalty income (2) |
|
| 5 |
|
|
| 5 |
|
|
| 6 |
|
|
| 2 |
|
|
| 16 |
|
|
| 9 |
|
Gain on sales of assets and businesses (3) |
|
| — |
|
|
| 42 |
|
|
| 9 |
|
|
| — |
|
|
| 11 |
|
|
| 45 |
|
Exchange gains, net (4) |
|
| 6 |
|
|
| — |
| ||||||||||||||||
Non-operating pension and other post-retirement employee benefit income |
|
| 3 |
|
|
| 7 |
| ||||||||||||||||
Exchange gains (losses), net (4) |
|
| 5 |
|
|
| (6 | ) |
|
| 2 |
|
|
| (4 | ) | ||||||||
Non-operating pension and other post-retirement employee benefit (cost) income |
|
| (1 | ) |
|
| 4 |
|
|
| 5 |
|
|
| 18 |
| ||||||||
Total other income, net |
| $ | 40 |
|
| $ | 57 |
|
| $ | 25 |
|
| $ | 24 |
|
| $ | 81 |
|
| $ | 115 |
|
| (1) | Leasing, contract services, and miscellaneous income includes European Union fluorinated greenhouse gas quota authorization sales of |
| (2) | Royalty income |
| (3) | For the three and nine months ended September 30, 2019, the Company recognized a non-cash gain of $9 related to the sale of the Company’s Repauno, New Jersey site. For the |
| (4) | Exchange gains (losses), net includes gains and losses on foreign currency forward contracts. |
Note 7. Income Taxes
For the three months ended March 31,September 30, 2019, Chemours recorded a provision for income taxes of $15, resulting in an effective income tax rate of approximately 16%. For the three months ended September 30, 2018, Chemours recorded a benefit from income taxes of $6, resulting in an effective income tax rate of approximately negative 2%. The change in the Company’s effective tax rate for the three months ended September 30, 2019 was primarily attributable to $5 of additional income tax expense on the revaluation of certain deferred tax assets and liabilities as a result of the increased corporate tax rate for a certain foreign subsidiary, $3 of lower income tax benefits related to windfalls on its share-based payments, reduced profitability, and the geographic mix of earnings.
For the nine months ended September 30, 2019 and 2018, Chemours recorded provisions for income taxes of $13$65 and $84,$119, respectively, resulting in effective income tax rates of approximately 12%20% and 22%12%, respectively. The change in the Company’s provision for income taxeseffective tax rate for the threenine months ended March 31,September 30, 2019 included $9was primarily attributable to $5 of additional income tax benefits related to legal settlementsexpense on the revaluation of certain deferred tax assets and restructuring costs, and $6liabilities as a result of the increased corporate tax rate for a certain foreign subsidiary, $8 of additional income tax expense associated with the recognition of a valuation allowance on the deferred tax assets of a certain foreign subsidiary, $8 of lower income tax benefits related to windfalls on its share-based payments. The Company’s provision for income taxes forpayments, reduced profitability, and the three months ended March 31, 2018 included $10 of income tax expenses related to certain asset sales and $8 of income tax expenses related to the impact of certain U.S. tax reform provisions, which were somewhat offset by $5 of income tax benefits related to windfalls on share-based payments. The remaining change in the Company’s effective tax rate from the prior year is primarily attributable to changes in its geographic mix of its earnings.
With respect to U.S. tax reform, while management has completed its analysis within the applicable measurement period, pursuant to the U.S. Securities and Exchange Commission’s Staff Accounting Bulletin No. 118, the Company is accounting for the tax impact of new provisions based on an interpretation of existing statutory law, including proposed regulations issued by the U.S. Treasury and the Internal Revenue Service. While there can be no assurances as to the effect of any final regulations on the Company’s provision for income taxes, management will continue to evaluate the impact as any regulations issued become final during 2019.
1214
The Chemours Company
Notes to the Interim Consolidated Financial Statements (Unaudited)
(Dollars in millions, except per share amounts)
Note 8. Earnings Per Share of Common Stock
The following table sets forth the reconciliations of the numerators and denominators for the Company’s basic and diluted earnings per share (“EPS”) calculations for the three and nine months ended March 31,September 30, 2019 and 2018.
|
| Three Months Ended March 31, |
|
| Three Months Ended September 30, |
|
| Nine Months Ended September 30, |
| |||||||||||||||
|
| 2019 |
|
| 2018 |
|
| 2019 |
|
| 2018 |
|
| 2019 |
|
| 2018 |
| ||||||
Numerator: |
|
|
|
|
|
|
|
|
|
|
|
|
|
|
|
|
|
|
|
|
|
|
|
|
Net income attributable to Chemours |
| $ | 94 |
|
| $ | 297 |
|
| $ | 76 |
|
| $ | 275 |
|
| $ | 265 |
|
| $ | 853 |
|
Denominator: |
|
|
|
|
|
|
|
|
|
|
|
|
|
|
|
|
|
|
|
|
|
|
|
|
Weighted-average number of common shares outstanding - basic |
|
| 167,866,468 |
|
|
| 182,069,982 |
|
|
| 163,815,483 |
|
|
| 176,489,881 |
|
|
| 165,254,084 |
|
|
| 178,765,676 |
|
Dilutive effect of the Company’s employee compensation plans |
|
| 4,194,432 |
|
|
| 6,263,215 |
|
|
| 1,325,380 |
|
|
| 5,387,244 |
|
|
| 2,780,874 |
|
|
| 5,891,072 |
|
Weighted-average number of common shares outstanding - diluted |
|
| 172,060,900 |
|
|
| 188,333,197 |
|
|
| 165,140,863 |
|
|
| 181,877,125 |
|
|
| 168,034,958 |
|
|
| 184,656,748 |
|
|
|
|
|
|
|
|
|
|
|
|
|
|
|
|
|
|
|
|
|
|
|
|
|
|
Basic earnings per share of common stock |
| $ | 0.56 |
|
| $ | 1.63 |
|
| $ | 0.46 |
|
| $ | 1.56 |
|
| $ | 1.60 |
|
| $ | 4.77 |
|
Diluted earnings per share of common stock |
|
| 0.55 |
|
|
| 1.58 |
|
|
| 0.46 |
|
|
| 1.51 |
|
|
| 1.58 |
|
|
| 4.62 |
|
The following table sets forth the average number of stock options that were anti-dilutive and, therefore, were not included in the Company’s diluted EPS calculations for the three and nine months ended March 31,September 30, 2019 and 2018.
|
| Three Months Ended March 31, |
| |||||
|
| 2019 |
|
| 2018 |
| ||
Average number of stock options |
|
| 683,135 |
|
|
| — |
|
|
| Three Months Ended September 30, |
|
| Nine Months Ended September 30, |
| ||||||||||
|
| 2019 |
|
| 2018 |
|
| 2019 |
|
| 2018 |
| ||||
Average number of stock options |
|
| 3,195,601 |
|
|
| 480,123 |
|
|
| 1,893,011 |
|
|
| 160,041 |
|
Note 9. Accounts and Notes Receivable, Net
The following table sets forth the components of the Company’s accounts and notes receivable, net at March 31,September 30, 2019 and December 31, 2018.
|
| March 31, 2019 |
|
| December 31, 2018 |
|
| September 30, 2019 |
|
| December 31, 2018 |
| ||||
Accounts receivable - trade, net (1) |
| $ | 776 |
|
| $ | 790 |
|
| $ | 758 |
|
| $ | 790 |
|
VAT, GST, and other taxes (2) |
|
| 59 |
|
|
| 56 |
|
|
| 57 |
|
|
| 56 |
|
Other receivables (3) |
|
| 12 |
|
|
| 15 |
|
|
| 17 |
|
|
| 15 |
|
Total accounts and notes receivable, net |
| $ | 847 |
|
| $ | 861 |
|
| $ | 832 |
|
| $ | 861 |
|
| (1) | Accounts receivable - trade, net includes trade notes receivable of |
| (2) | Value added tax (“VAT”) and goods and services tax (“GST”) for various jurisdictions. |
| (3) | Other receivables consist of derivative instruments, advances, and other deposits. |
Accounts and notes receivable are carried at amounts that approximate fair value. Bad debt expense wasamounted to less than $1 and $1 for the three and nine months ended March 31,September 30, 2019, respectively, and less than $1 for the three and nine months ended September 30, 2018, respectively.respectively.
13
15
The Chemours Company
Notes to the Interim Consolidated Financial Statements (Unaudited)
(Dollars in millions, except per share amounts)
Note 10. Inventories
The following table sets forth the components of the Company’s inventories at March 31,September 30, 2019 and December 31, 2018.
|
| March 31, 2019 |
|
| December 31, 2018 |
|
| September 30, 2019 |
|
| December 31, 2018 |
| ||||
Finished products |
| $ | 724 |
|
| $ | 701 |
|
| $ | 664 |
|
| $ | 701 |
|
Semi-finished products |
|
| 206 |
|
|
| 195 |
|
|
| 201 |
|
|
| 195 |
|
Raw materials, stores, and supplies |
|
| 514 |
|
|
| 476 |
|
|
| 596 |
|
|
| 476 |
|
Inventories before LIFO adjustment |
|
| 1,444 |
|
|
| 1,372 |
|
|
| 1,461 |
|
|
| 1,372 |
|
Less: Adjustment of inventories to LIFO basis |
|
| (226 | ) |
|
| (225 | ) |
|
| (238 | ) |
|
| (225 | ) |
Total inventories |
| $ | 1,218 |
|
| $ | 1,147 |
|
| $ | 1,223 |
|
| $ | 1,147 |
|
Inventory values, before last-in, first-out (“LIFO”) adjustment are generally determined by the average cost method, which approximates current cost. Inventories are valued under the LIFO method at substantially all of the Company’s U.S. locations, which comprised $694$770 and $622 (or 48%53% and 45%) of inventories before the LIFO adjustments at March 31,September 30, 2019 and December 31, 2018, respectively. The remainder of the Company’s inventory held in international locations and certain U.S. locations is valued under the average cost method.
Note 11. Property, Plant, and Equipment, Net
The following table sets forth the components of the Company’s property, plant, and equipment, net at March 31,September 30, 2019 and December 31, 2018.
|
| March 31, 2019 |
|
| December 31, 2018 |
|
| September 30, 2019 |
|
| December 31, 2018 |
| ||||
Equipment |
| $ | 7,382 |
|
| $ | 7,344 |
|
| $ | 7,474 |
|
| $ | 7,344 |
|
Buildings |
|
| 918 |
|
|
| 914 |
|
|
| 915 |
|
|
| 914 |
|
Construction-in-progress |
|
| 634 |
|
|
| 579 |
|
|
| 735 |
|
|
| 579 |
|
Land |
|
| 119 |
|
|
| 119 |
|
|
| 115 |
|
|
| 119 |
|
Mineral rights |
|
| 36 |
|
|
| 36 |
|
|
| 35 |
|
|
| 36 |
|
Property, plant, and equipment |
|
| 9,089 |
|
|
| 8,992 |
|
|
| 9,274 |
|
|
| 8,992 |
|
Less: Accumulated depreciation |
|
| (5,710 | ) |
|
| (5,701 | ) |
|
| (5,754 | ) |
|
| (5,701 | ) |
Total property, plant, and equipment, net |
| $ | 3,379 |
|
| $ | 3,291 |
|
| $ | 3,520 |
|
| $ | 3,291 |
|
Depreciation expense amounted to $74$76 and $69$226 for the three and nine months ended March 31,September 30, 2019 and $68 and $207 for the three and nine months ended September 30, 2018, respectively. Property, plant, and equipment, net includes a build-to-suit lease asset of $72$90 and $55 at March 31,September 30, 2019 and December 31, 2018, respectively.
The Company’s gross finance lease assets amounted to $66 and $7 at September 30, 2019 and December 31, 2018, respectively. In the second quarter of 2019, a subsidiary of the Company renegotiated the terms of an existing Fluoroproducts supply contract with Changshu 3F Zhonghao New Chemical Materials Co., Ltd., a related party and equity method investee, to improve the long-term supply security and competitiveness relative to not-in-kind competition of its low global warming potential foam offering. The renegotiated supply contract resulted in the recognition of a finance lease asset and a corresponding finance lease liability, which amounted to $62.
Note 12. Leases
The Company leases certain office space, equipment, railcars, tanks, barges, tow boats, and warehouses. Leases with an initial term of 12 months or less are not recorded on the consolidated balance sheets and lease expense is recognized over the term of these leases on a straight-line basis. The Company’s leases have remaining terms of up to 18 years. Some leases of equipment contain immaterial amounts of residual value guarantees.
1416
The Chemours Company
Notes to the Interim Consolidated Financial Statements (Unaudited)
(Dollars in millions, except per share amounts)
The following table sets forth the Company’s lease assets and lease liabilities and their balance sheet location at March 31,September 30, 2019.
|
| Balance Sheet Location |
| March 31, 2019 |
|
| Balance Sheet Location |
| September 30, 2019 |
| ||
Lease assets: |
|
|
|
|
|
|
|
|
|
|
|
|
Operating lease right-of-use assets |
| Operating lease right-of-use assets |
| $ | 323 |
|
| Operating lease right-of-use assets |
| $ | 307 |
|
Finance lease assets |
| Property, plant, and equipment, net |
|
| 2 |
|
| Property, plant, and equipment, net (Note 11) |
|
| 59 |
|
Total lease assets |
|
|
| $ | 325 |
|
|
|
| $ | 366 |
|
|
|
|
|
|
|
|
|
|
|
|
|
|
Lease liabilities: |
|
|
|
|
|
|
|
|
|
|
|
|
Current: |
|
|
|
|
|
|
|
|
|
|
|
|
Operating lease liabilities |
| Other accrued liabilities |
| $ | 76 |
|
| Other accrued liabilities (Note 16) |
| $ | 73 |
|
Finance lease liabilities |
| Short-term and current maturities of long-term debt (Note 17) |
|
| 5 |
| ||||||
Total current lease liabilities |
|
|
|
| 78 |
| ||||||
Non-current: |
|
|
|
|
|
|
|
|
|
|
|
|
Operating lease liabilities |
| Operating lease liabilities |
|
| 265 |
|
| Operating lease liabilities |
|
| 254 |
|
Finance lease liabilities |
| Long-term debt, net |
|
| 2 |
|
| Long-term debt, net (Note 17) |
|
| 54 |
|
Total non-current lease liabilities |
|
|
|
| 267 |
|
|
|
|
| 308 |
|
Total lease liabilities |
|
|
| $ | 343 |
|
|
|
| $ | 386 |
|
The following table sets forth the components of the Company’s lease cost for the three and nine months ended March 31,September 30, 2019.
|
| Three Months Ended |
|
| Three Months Ended |
|
| Nine Months Ended |
| |||
|
| March 31, 2019 |
|
| September 30, 2019 |
|
| September 30, 2019 |
| |||
Operating lease cost |
| $ | 25 |
|
| $ | 25 |
|
| $ | 74 |
|
Short-term lease cost |
|
| 1 |
|
|
| 1 |
|
|
| 3 |
|
Variable lease cost |
|
| 4 |
|
|
| 4 |
|
|
| 12 |
|
|
|
|
|
|
|
|
|
| ||||
Finance lease cost: |
|
|
|
|
|
|
|
| ||||
Amortization of lease assets |
|
| 2 |
|
|
| 3 |
| ||||
Interest on lease liabilities |
|
| 1 |
|
|
| 1 |
| ||||
Total lease cost |
| $ | 30 |
|
| $ | 33 |
|
| $ | 93 |
|
The total cost associated with the Company’s finance leases amounted to less than $1 for the three months ended March 31, 2019.
The following table sets forth the cash flows related to the Company’s leases for the threenine months ended March 31,September 30, 2019.
|
| Three Months Ended |
|
| Nine Months Ended |
| ||
|
| March 31, 2019 |
|
| September 30, 2019 |
| ||
Cash paid for amounts included in the measurement of lease liabilities: |
|
|
|
|
|
|
|
|
Operating cash flows from operating leases |
| $ | 25 |
|
| $ | 74 |
|
Operating cash flows from finance leases |
|
| 1 |
| ||||
Financing cash flows from finance leases |
|
| 2 |
| ||||
|
|
|
|
|
|
|
|
|
Non-cash operating lease liabilities activity: |
|
|
|
| ||||
Non-cash lease liabilities activity: |
|
|
|
| ||||
Leased assets obtained in exchange for new operating lease liabilities |
| $ | 19 |
|
| $ | 42 |
|
Leased assets obtained in exchange for new finance lease liabilities |
|
| 62 |
| ||||
17
The total cash flows associated withChemours Company
Notes to the Company’s finance leases amounted to less than $1 for the three months ended March 31, 2019.Interim Consolidated Financial Statements (Unaudited)
(Dollars in millions, except per share amounts)
The following table sets forth the weighted-average term and weighted-average discount rate for the Company’s leases at March 31,September 30, 2019.
|
|
|
|
|
|
|
|
| |
Weighted-average remaining lease term (years): |
|
|
|
|
Operating leases |
|
|
|
|
Finance leases |
|
|
|
|
|
|
|
|
|
Weighted-average discount rate: |
|
|
|
|
Operating leases |
|
| 5.10 | % |
Finance leases |
|
|
| % |
15
The Chemours Company
Notes to the Interim Consolidated Financial Statements (Unaudited)
(Dollars in millions, except per share amounts)
The following table sets forth the Company’s lease liabilities’ maturities for the next five years and thereafter.
|
| As of March 31, 2019 |
|
| As of September 30, 2019 |
| ||||||||||||||||||
|
| Operating Leases |
|
| Finance Leases |
|
| Total |
|
| Operating Leases |
|
| Finance Leases |
|
| Total |
| ||||||
Remainder of 2019 |
| $ | 72 |
|
| $ | — |
|
| $ | 72 |
|
| $ | 26 |
|
| $ | 2 |
|
| $ | 28 |
|
2020 |
|
| 73 |
|
|
| 2 |
|
|
| 75 |
|
|
| 80 |
|
|
| 9 |
|
|
| 89 |
|
2021 |
|
| 62 |
|
|
| — |
|
|
| 62 |
|
|
| 67 |
|
|
| 8 |
|
|
| 75 |
|
2022 |
|
| 44 |
|
|
| — |
|
|
| 44 |
|
|
| 49 |
|
|
| 8 |
|
|
| 57 |
|
2023 |
|
| 29 |
|
|
| — |
|
|
| 29 |
|
|
| 32 |
|
|
| 8 |
|
|
| 40 |
|
Thereafter |
|
| 135 |
|
|
| — |
|
|
| 135 |
|
|
| 144 |
|
|
| 42 |
|
|
| 186 |
|
Total lease payments |
|
| 415 |
|
|
| 2 |
|
|
| 417 |
|
|
| 398 |
|
|
| 77 |
|
|
| 475 |
|
Less: Imputed interest |
|
| 74 |
|
|
| — |
|
|
| 74 |
|
|
| 71 |
|
|
| 18 |
|
|
| 89 |
|
Present value of lease liabilities |
| $ | 341 |
|
| $ | 2 |
|
| $ | 343 |
|
| $ | 327 |
|
| $ | 59 |
|
| $ | 386 |
|
The following table sets forth the Company’s lease liabilities’ maturities for the next five years and thereafter under the previous lease accounting standard.
|
| As of December 31, 2018 |
| |||||||||
|
| Operating Leases |
|
| Finance Leases |
|
| Total |
| |||
2019 |
| $ | 92 |
|
| $ | — |
|
| $ | 92 |
|
2020 |
|
| 70 |
|
|
| 2 |
|
|
| 72 |
|
2021 |
|
| 59 |
|
|
| — |
|
|
| 59 |
|
2022 |
|
| 42 |
|
|
| — |
|
|
| 42 |
|
2023 |
|
| 27 |
|
|
| — |
|
|
| 27 |
|
Thereafter |
|
| 134 |
|
|
| — |
|
|
| 134 |
|
Total lease payments |
| $ | 424 |
|
| $ | 2 |
|
| $ | 426 |
|
Build-to-suit Lease Obligation
In October 2017, Chemours executed a build-to-suit lease agreement to construct a new 312,000-square-foot research and development facility on the Science, Technology, and Advanced Research campus of the University of Delaware (“UD”) in Newark, Delaware (“The Chemours Discovery Hub”). The land on which The Chemours Discovery Hub will be located is leased to a third-party owner-lessor by UD, and Chemours will act as the construction agent and ultimate lessee of the facility based on the Company’s agreement with the owner-lessor. Project costs paid by the owner-lessor are reflected on the Company’s consolidated balance sheets as construction-in-progress within property, plant, and equipment, net, and a corresponding build-to-suit lease liability within long-term debt, net. Through March 31,September 30, 2019 and December 31, 2018, project costs paid by the owner-lessor amounted to $72$90 and $55, respectively. Construction of The Chemours Discovery Hub is expected to be completed by the end of 2019.
18
The Chemours Company
Notes to the Interim Consolidated Financial Statements (Unaudited)
(Dollars in millions, except per share amounts)
Note 13. Investments in Affiliates
The Company engages in transactions with its equity method investees in the ordinary course of business. For the three months ended March 31, 2019 and 2018, netNet sales to the Company’s equity method investees amounted to $32$40 and $27,$104 for the three and nine months ended September 30, 2019, respectively, and purchases$38 and $101 for the three and nine months ended September 30, 2018, respectively. Purchases from the Company’s equity method investees amounted to $44$48 and $37,$215 for the three and nine months ended September 30, 2019, respectively, and $30 and $98 for the three and nine months ended September 30, 2018, respectively. The Company also received $1 and $30$4 in dividends from its equity method investees for the three and nine months ended March 31,September 30, 2019, respectively, and less than $1 and $30 for the three and nine months ended September 30, 2018, respectively.
16
The Chemours Company
Notes to the Interim Consolidated Financial Statements (Unaudited)
(Dollars in millions, except per share amounts)
Note 14. Other Assets
The following table sets forth the components of the Company’s other assets at March 31,September 30, 2019 and December 31, 2018.
|
| March 31, 2019 |
|
| December 31, 2018 |
|
| September 30, 2019 |
|
| December 31, 2018 |
| ||||
Capitalized repair and maintenance costs |
| $ | 160 |
|
| $ | 178 |
|
| $ | 156 |
|
| $ | 178 |
|
Pension assets (1) |
|
| 183 |
|
|
| 174 |
|
|
| 193 |
|
|
| 174 |
|
Deferred income taxes |
|
| 46 |
|
|
| 46 |
|
|
| 43 |
|
|
| 46 |
|
Miscellaneous |
|
| 41 |
|
|
| 39 |
|
|
| 50 |
|
|
| 39 |
|
Total other assets |
| $ | 430 |
|
| $ | 437 |
|
| $ | 442 |
|
| $ | 437 |
|
| (1) | Pension assets represent the funded status of certain of the Company's long-term employee benefit plans. |
Note 15. Accounts Payable
The following table sets forth the components of the Company’s accounts payable at March 31,September 30, 2019 and December 31, 2018.
|
| March 31, 2019 |
|
| December 31, 2018 |
|
| September 30, 2019 |
|
| December 31, 2018 |
| ||||
Trade payables |
| $ | 1,010 |
|
| $ | 1,111 |
|
| $ | 929 |
|
| $ | 1,111 |
|
VAT and other payables |
|
| 32 |
|
|
| 26 |
|
|
| 19 |
|
|
| 26 |
|
Total accounts payable |
| $ | 1,042 |
|
| $ | 1,137 |
|
| $ | 948 |
|
| $ | 1,137 |
|
19
The Chemours Company
Notes to the Interim Consolidated Financial Statements (Unaudited)
(Dollars in millions, except per share amounts)
Note 16. Other Accrued Liabilities
The following table sets forth the components of the Company’s other accrued liabilities at March 31,September 30, 2019 and December 31, 2018.
|
| March 31, 2019 |
|
| December 31, 2018 |
|
| September 30, 2019 |
|
| December 31, 2018 |
| ||||
Compensation and other employee-related costs |
| $ | 70 |
|
| $ | 108 |
|
| $ | 61 |
|
| $ | 108 |
|
Employee separation costs (1) |
|
| 6 |
|
|
| 16 |
|
|
| 18 |
|
|
| 16 |
|
Accrued litigation (2) |
|
| 31 |
|
|
| 76 |
|
|
| 27 |
|
|
| 76 |
|
Environmental remediation (2) |
|
| 69 |
|
|
| 74 |
|
|
| 74 |
|
|
| 74 |
|
Income taxes |
|
| 63 |
|
|
| 87 |
|
|
| 62 |
|
|
| 87 |
|
Customer rebates |
|
| 42 |
|
|
| 79 |
|
|
| 66 |
|
|
| 79 |
|
Deferred income |
|
| 7 |
|
|
| 6 |
|
|
| 8 |
|
|
| 6 |
|
Accrued interest |
|
| 62 |
|
|
| 21 |
|
|
| 61 |
|
|
| 21 |
|
Operating lease liabilities (3) |
|
| 76 |
|
|
| — |
|
|
| 73 |
|
|
| — |
|
Miscellaneous (4) |
|
| 91 |
|
|
| 92 |
|
|
| 96 |
|
|
| 92 |
|
Total other accrued liabilities |
| $ | 517 |
|
| $ | 559 |
|
| $ | 546 |
|
| $ | 559 |
|
| (1) | Represents the current portion of accrued employee separation costs related to the Company’s restructuring activities. |
| (2) | Represents the current portions of accrued litigation and environmental remediation, which are discussed further in “Note 19 – Commitments and Contingent Liabilities.” |
| (3) | Represents the current portion of the Company’s operating lease liabilities, which is discussed further in “Note 2 – Recent Accounting Pronouncements” and “Note 12 – Leases.” |
| (4) | Miscellaneous primarily includes accrued utility expenses, property taxes, an accrued indemnification liability, the current portion of the Company’s asset retirement obligations, and other miscellaneous expenses. |
Note 17. Debt
The following table sets forth the components of the Company’s debt at September 30, 2019 and December 31, 2018.
|
| September 30, 2019 |
|
| December 31, 2018 |
| ||
Senior secured term loans: |
|
|
|
|
|
|
|
|
Tranche B-2 U.S. dollar term loan due May 2025 |
| $ | 887 |
|
| $ | 893 |
|
Tranche B-2 euro term loan due May 2025 (€345 at September 30, 2019 and €347 at December 31, 2018) |
|
| 377 |
|
|
| 396 |
|
Senior unsecured notes: |
|
|
|
|
|
|
|
|
6.625% due May 2023 |
|
| 908 |
|
|
| 908 |
|
7.000% due May 2025 |
|
| 750 |
|
|
| 750 |
|
4.000% due May 2026 (€450 at September 30, 2019 and December 31, 2018) |
|
| 493 |
|
|
| 513 |
|
5.375% due May 2027 |
|
| 500 |
|
|
| 500 |
|
Securitization Facility |
|
| 122 |
|
|
| — |
|
Finance lease liabilities |
|
| 59 |
|
|
| 2 |
|
Build-to-suit lease obligation |
|
| 90 |
|
|
| 55 |
|
Other |
|
| 9 |
|
|
| — |
|
Total debt |
|
| 4,195 |
|
|
| 4,017 |
|
Less: Unamortized issue discounts |
|
| (9 | ) |
|
| (10 | ) |
Less: Unamortized debt issuance costs |
|
| (30 | ) |
|
| (35 | ) |
Less: Short-term and current maturities of long-term debt |
|
| (149 | ) |
|
| (13 | ) |
Total long-term debt, net |
| $ | 4,007 |
|
| $ | 3,959 |
|
1720
The Chemours Company
Notes to the Interim Consolidated Financial Statements (Unaudited)
(Dollars in millions, except per share amounts)
Note 17. Debt
The following table sets forth the components of the Company’s debt at March 31, 2019 and December 31, 2018.
|
| March 31, 2019 |
|
| December 31, 2018 |
| ||
Senior secured term loans: |
|
|
|
|
|
|
|
|
Tranche B-2 U.S. dollar term loan due May 2025 |
| $ | 891 |
|
| $ | 893 |
|
Tranche B-2 euro term loan due May 2025 (€347 at March 31, 2019 and December 31, 2018) |
|
| 391 |
|
|
| 396 |
|
Senior unsecured notes: |
|
|
|
|
|
|
|
|
6.625% due May 2023 |
|
| 908 |
|
|
| 908 |
|
7.000% due May 2025 |
|
| 750 |
|
|
| 750 |
|
4.000% due May 2026 (€450 at March 31, 2019 and December 31, 2018) |
|
| 507 |
|
|
| 513 |
|
5.375% due May 2027 |
|
| 500 |
|
|
| 500 |
|
Finance lease liabilities |
|
| 2 |
|
|
| 2 |
|
Build-to-suit lease obligation |
|
| 72 |
|
|
| 55 |
|
Total debt |
|
| 4,021 |
|
|
| 4,017 |
|
Less: Unamortized issue discounts |
|
| (10 | ) |
|
| (10 | ) |
Less: Unamortized debt issuance costs |
|
| (33 | ) |
|
| (35 | ) |
Less: Current maturities of long-term debt |
|
| (13 | ) |
|
| (13 | ) |
Total long-term debt, net |
| $ | 3,965 |
|
| $ | 3,959 |
|
Senior Secured Credit Facilities
The Company’s credit agreement, as amended, provides for seven-year, senior secured term loans and a five-year, $800 senior secured revolving credit facility (“Revolving Credit Facility”). For the three months ended September 30, 2019, the Company repaid $150 of revolving loan borrowings. NoNaN borrowings were outstanding under the Revolving Credit Facility at March 31,September 30, 2019 orand December 31, 2018; however,2018. For the three and nine months ended September 30, 2019, the Company made term loan payments of $3 and $10, respectively. Chemours also had $103 and $104 in letters of credit issued and outstanding under this facilitythe Revolving Credit Facility at March 31,September 30, 2019 and December 31, 2018, respectively. At March 31,September 30, 2019, the effective interest rates on the class of term loans denominated in U.S. dollars, (“Dollar Term Loan”) and the class of term loans denominated in euros (“Euro Term Loan”) were 4.25%3.8% and 2.50%2.5%, respectively. Also, at March 31,September 30, 2019, commitment fees on the Revolving Credit Facility were assessed at a rate of 0.10%0.15% per annum.
Accounts Receivable Securitization Facility
On July 12, 2019, the Company, through a wholly-owned special purpose entity (“SPE”), executed an agreement with a bank for an accounts receivable securitization facility (“Securitization Facility”) for the purpose of enhancing the Company’s liquidity. Under the Securitization Facility, certain of the Company’s subsidiaries will sell their accounts receivable to the SPE, which is a non-guarantor subsidiary. In turn, the SPE may transfer undivided ownership interests in such receivables to the bank in exchange for cash. The Securitization Facility permits the SPE to borrow up to a total of $125, with an option to increase to $200. The bank has a first priority security interest in all receivables held by the SPE, and the SPE has not granted a security interest to anyone else. At September 30, 2019, receivables held by the SPE totaled $225.
Because the SPE maintains effective control over the accounts receivable, transfers of the ownership interests to the bank do not meet the criteria to account for the transfers as true sales. As a result, the Company accounted for the transfers under the Securitization Facility as collateralized borrowings. Cash received from the bank will become a short-term obligation of the Company, which will be fully-collateralized by all receivables held by the SPE. The Securitization Facility is subject to interest charges against both the amount of outstanding borrowings and the amount of available but undrawn commitments. The Securitization Facility bears a variable interest rate on outstanding borrowings and a fixed commitment fee on the average daily undrawn amount. Borrowings under the Securitization Facility are classified in its consolidated balance sheets as a component of its current liabilities due to the short-term nature of the obligation. The net borrowings under the Securitization Facility since July 2019 amounted to $122, which remained outstanding as of September 30, 2019.
Other
During the quarter, the Company entered into a financing arrangement, by which an external financing company funded certain of the Company’s annual insurance premiums for $11. During the three months ended September 30, 2019, the Company made payments of $2 to the financing company, and the remaining $9 is to be repaid within the next twelve months.
Maturities
The Company has required quarterly principal payments related to its senior secured term loans equivalent to 1.00% per annum through December 2024, with the balance due at maturity. Also, following the end of each fiscal year commencing on the year ended December 31, 2019, on an annual basis, the Company is required to make additional principal payments depending on leverage levels, as defined in the amended and restated credit agreement, equivalent to up to 50% of excess cash flows based on certain leverage targets with step-downs to 25% and 0% as actual leverage decreases to below a 3.50 to 1.00 leverage target.
The following table sets forth the Company’s contractual debt principal maturities for the next five years and thereafter.
|
| Year Ended |
| |||||
|
| December 31, |
|
| Year Ended December 31, |
| ||
Remainder of 2019 |
| $ | 10 |
|
| $ | 3 |
|
2020 |
|
| 13 |
|
|
| 135 |
|
2021 |
|
| 13 |
|
|
| 13 |
|
2022 |
|
| 13 |
|
|
| 13 |
|
2023 |
|
| 921 |
|
|
| 921 |
|
Thereafter |
|
| 2,977 |
|
|
| 2,952 |
|
Total principal maturities on senior debt |
| $ | 3,947 |
| ||||
Total principal maturities on debt |
| $ | 4,037 |
| ||||
21
The Chemours Company
Notes to the Interim Consolidated Financial Statements (Unaudited)
(Dollars in millions, except per share amounts)
The Company’s senior secured credit facilities are also subject to a springing maturity in the event that its 6.625% senior unsecured notes due May 2023 are not redeemed, repaid, modified, and/or refinanced within the 91-day period prior to their maturity date.
18
The Chemours Company
Notes to the Interim Consolidated Financial Statements (Unaudited)
(Dollars in millions, except per share amounts)
Debt Fair Value
The following table sets forth the estimated fair values of the Company’s senior debt issues, which are based on quotes received from third-party brokers, and are classified as Level 2 financial instruments in the fair value hierarchy. The carrying value of the Securitization Facility and financed insurance premiums approximate their fair value based on their short-term nature and maturity.
|
| March 31, 2019 |
|
| December 31, 2018 |
|
| September 30, 2019 |
|
| December 31, 2018 |
| ||||||||||||||||||||
|
| Carrying Value |
|
| Fair Value |
|
| Carrying Value |
|
| Fair Value |
|
| Carrying Value |
|
| Fair Value |
|
| Carrying Value |
|
| Fair Value |
| ||||||||
Senior secured term loans: |
|
|
|
|
|
|
|
|
|
|
|
|
|
|
|
|
|
|
|
|
|
|
|
|
|
|
|
|
|
|
|
|
Tranche B-2 U.S. dollar term loan due May 2025 |
| $ | 891 |
|
| $ | 892 |
|
| $ | 893 |
|
| $ | 862 |
|
| $ | 887 |
|
| $ | 855 |
|
| $ | 893 |
|
| $ | 862 |
|
Tranche B-2 euro term loan due May 2025 (€347 at March 31, 2019 and December 31, 2018) |
|
| 391 |
|
|
| 392 |
|
|
| 396 |
|
|
| 394 |
| ||||||||||||||||
Tranche B-2 euro term loan due May 2025 (€345 at September 30, 2019 and €347 December 31, 2018) |
|
| 377 |
|
|
| 371 |
|
|
| 396 |
|
|
| 394 |
| ||||||||||||||||
Senior unsecured notes: |
|
|
|
|
|
|
|
|
|
|
|
|
|
|
|
|
|
|
|
|
|
|
|
|
|
|
|
|
|
|
|
|
6.625% due May 2023 |
|
| 908 |
|
|
| 942 |
|
|
| 908 |
|
|
| 918 |
|
|
| 908 |
|
|
| 900 |
|
|
| 908 |
|
|
| 918 |
|
7.000% due May 2025 |
|
| 750 |
|
|
| 793 |
|
|
| 750 |
|
|
| 761 |
|
|
| 750 |
|
|
| 714 |
|
|
| 750 |
|
|
| 761 |
|
4.000% due May 2026 (€450 at March 31, 2019 and December 31, 2018) |
|
| 507 |
|
|
| 515 |
|
|
| 513 |
|
|
| 487 |
| ||||||||||||||||
4.000% due May 2026 (€450 at September 30, 2019 and December 31, 2018) |
|
| 493 |
|
|
| 452 |
|
|
| 513 |
|
|
| 487 |
| ||||||||||||||||
5.375% due May 2027 |
|
| 500 |
|
|
| 497 |
|
|
| 500 |
|
|
| 454 |
|
|
| 500 |
|
|
| 433 |
|
|
| 500 |
|
|
| 454 |
|
Securitization Facility |
|
| 122 |
|
|
| 122 |
|
|
| — |
|
|
| — |
| ||||||||||||||||
Other |
|
| 9 |
|
|
| 9 |
|
|
| — |
|
|
| — |
| ||||||||||||||||
Total senior debt |
|
| 3,947 |
|
| $ | 4,031 |
|
|
| 3,960 |
|
| $ | 3,876 |
|
|
| 4,046 |
|
| $ | 3,856 |
|
|
| 3,960 |
|
| $ | 3,876 |
|
Less: Unamortized issue discounts |
|
| (10 | ) |
|
|
|
|
|
| (10 | ) |
|
|
|
|
|
| (9 | ) |
|
|
|
|
|
| (10 | ) |
|
|
|
|
Less: Unamortized debt issuance costs |
|
| (33 | ) |
|
|
|
|
|
| (35 | ) |
|
|
|
|
|
| (30 | ) |
|
|
|
|
|
| (35 | ) |
|
|
|
|
Total senior debt, net |
| $ | 3,904 |
|
|
|
|
|
| $ | 3,915 |
|
|
|
|
|
| $ | 4,007 |
|
|
|
|
|
| $ | 3,915 |
|
|
|
|
|
Note 18. Other Liabilities
The following table sets forth the components of the Company’s other liabilities at March 31,September 30, 2019 and December 31, 2018.
|
| March 31, 2019 |
|
| December 31, 2018 |
|
| September 30, 2019 |
|
| December 31, 2018 |
| ||||
Environmental remediation (1) |
| $ | 164 |
|
| $ | 152 |
|
| $ | 165 |
|
| $ | 152 |
|
Employee-related costs (2) |
|
| 118 |
|
|
| 130 |
|
|
| 111 |
|
|
| 130 |
|
Accrued litigation (1) |
|
| 91 |
|
|
| 53 |
|
|
| 90 |
|
|
| 53 |
|
Asset retirement obligations |
|
| 50 |
|
|
| 51 |
|
|
| 55 |
|
|
| 51 |
|
Deferred revenue |
|
| 6 |
|
|
| 7 |
|
|
| 5 |
|
|
| 7 |
|
Miscellaneous (3) |
|
| 66 |
|
|
| 64 |
|
|
| 75 |
|
|
| 64 |
|
Total other liabilities |
| $ | 495 |
|
| $ | 457 |
|
| $ | 501 |
|
| $ | 457 |
|
| (1) | The Company’s accrued environmental remediation and accrued litigation liabilities are discussed further in “Note 19 – Commitments and Contingent Liabilities.” |
| (2) | Employee-related costs primarily represent liabilities associated with the Company’s long-term employee benefits plans. |
| (3) | Miscellaneous primarily includes an accrued indemnification liability of $ |
1922
The Chemours Company
Notes to the Interim Consolidated Financial Statements (Unaudited)
(Dollars in millions, except per share amounts)
Note 19. Commitments and Contingent Liabilities
Litigation
In addition to the matters discussed below, the Company and certain of its subsidiaries, from time to time, are subject to various lawsuits, claims, assessments, and proceedings with respect to product liability, intellectual property, personal injury, commercial, contractual, employment, governmental, environmental, anti-trust, and other such matters that arise in the ordinary course of business. In addition, Chemours, by virtue of its status as a subsidiary of DuPont prior to the separation, is subject to or required under the separation-related agreements executed prior to the separation to indemnify DuPont against various pending legal proceedings. It is not possible to predict the outcomes of these various lawsuits, claims, assessments, or proceedings. WhileExcept as noted below, while management believes it is reasonably possible that Chemours could incur losses in excess of the amounts accrued, if any, for the aforementioned proceedings, it does not believe any such loss would have a material impact on the Company’s consolidated financial position, results of operations, or cash flows. DisputesAdditional disputes between Chemours and DuPont may also arise with respect to indemnification matters, including disputes based on matters of law or contract interpretation. If and to the extent these disputes arise, they could materially adversely affect Chemours.
The Company accrues for litigation matters when it is probable that a liability has been incurred, and the amount of the liability can be reasonably estimated. Legal costs such as outside counsel fees and expenses are recognized in the period in which the expense was incurred. Management believes the Company’s litigation accruals are appropriate based on the facts and circumstances for each matter, which are discussed in further detail below.
The following table sets forth the components of the Company’s accrued litigation at September 30, 2019 and December 31, 2018.
|
| September 30, 2019 |
|
| December 31, 2018 |
| ||
Asbestos |
| $ | 37 |
|
| $ | 37 |
|
Perfluorooctanoic acids and its salts, including the ammonium salt |
| 21 |
|
| 22 |
| ||
GenX and other perfluorinated and polyfluorinated compounds (1) |
| 54 |
|
| 65 |
| ||
All other matters (2) |
| 5 |
|
| 5 |
| ||
Total accrued litigation |
| $ | 117 |
|
| $ | 129 |
|
(1) | Total accruals related to this matter amounted to $83 and $75 at September 30, 2019 and December 31, 2018, respectively. These amounts included $29 and $10, which are reflected as a component of the Company’s environmental remediation liabilities at September 30, 2019 and December 31, 2018, respectively. |
(2) | Includes liabilities related to miscellaneous litigation matters, including Benzene. The Company had accruals related to Benzene of less than $1 at September 30, 2019. The Company had 0 accruals related to Benzene at December 31, 2018. |
The following table sets forth the current and long-term components of the Company’s accrued litigation and their balance sheet locations at September 30, 2019 and December 31, 2018.
|
| Balance Sheet Location |
| September 30, 2019 |
|
| December 31, 2018 |
| ||
Accrued Litigation: |
|
|
|
|
|
|
|
|
|
|
Current accrued litigation |
| Other accrued liabilities (Note 16) |
| $ | 27 |
|
| $ | 76 |
|
Long-term accrued litigation |
| Other liabilities (Note 18) |
|
| 90 |
|
|
| 53 |
|
Total accrued litigation |
|
|
| $ | 117 |
|
| $ | 129 |
|
Asbestos
In the separation, DuPont assigned its asbestos docket to Chemours. At March 31,September 30, 2019 and December 31, 2018, there were approximately 1,300 lawsuits pending against DuPont alleging personal injury from exposure to asbestos. These cases are pending in state and federal court in numerous jurisdictions in the U.S. and are individually set for trial. A small number of cases are pending outside of the U.S. Most of the actions were brought by contractors who worked at sites between the 1950s and the 1990s. A small number of cases involve similar allegations by DuPont employees or household members of contractors or DuPont employees. Finally, certain lawsuits allege personal injury as a result of exposure to DuPont products.
At March 31,September 30, 2019 and December 31, 2018, Chemours had an accrual of $37 related to these matters.
23
The Chemours Company
Notes to the Interim Consolidated Financial Statements (Unaudited)
(Dollars in millions, except per share amounts)
Benzene
In the separation, DuPont assigned its benzene docket to Chemours. At March 31,September 30, 2019 and December 31, 2018, there were 2116 and 19 cases pending against DuPont alleging benzene-related illnesses, respectively. These cases consist of premises matters involving contractors and deceased former employees who claim exposure to benzene while working at DuPont sites primarily in the 1960s through the 1980s, and product liability claims based on alleged exposure to benzene found in trace amounts in aromatic hydrocarbon solvents used to manufacture DuPont products such as paints, thinners, and reducers.
Management believes that a loss is reasonably possible as to the docket as a whole; however, given that the evaluation of each benzene matter is highly fact-driven and impacted by disease, exposure, and other factors, a range of such losses cannot be reasonably estimated at this time.
PFOA
Prior to the fourth quarter of 2014, the performance chemicals segment of DuPont made “PFOA” (collectively, perfluorooctanoic acids and its salts, including the ammonium salt) at its Fayetteville, North Carolina plant and used PFOA as a processing aid in the manufacture of fluoropolymers and fluoroelastomers at certain sites, including: Washington Works, Parkersburg, West Virginia; Chambers Works, Deepwater, New Jersey; Dordrecht Works, Netherlands; Changshu Works, China; and, Shimizu, Japan. These sites are now owned and/or operated by Chemours.
Chemours maintained accruals of $21 and $22 related to the PFOA matters discussed below at March 31,September 30, 2019 and December 31, 2018.2018, respectively. These accruals relate to DuPont’s obligations under agreements with the U.S. Environmental Protection Agency (“EPA”) and voluntary commitments to the New Jersey Department of Environmental Protection (“NJ DEP”). These obligations and voluntary commitments include surveying, sampling, and testing drinking water in and around certain Company sites offering treatment or an alternative supply of drinking water if tests indicate the presence of PFOA in drinking water at or greater than the state or the national health advisory. The Company will continue to work with the EPA regarding the extent of work that may be required with respect to these matters.
20
The Chemours Company
Notes to the Interim Consolidated Financial Statements (Unaudited)
(Dollars in millions, except per share amounts)
Leach Settlement
In 2004, DuPont settled a class action captioned Leach v. DuPont, filed in West Virginia state court, alleging that approximately 80,000 residents living near the Washington Works facility had suffered, or may suffer, deleterious health effects from exposure to PFOA in drinking water. Among the settlement terms, DuPont funded a series of health studies by an independent science panel of experts (“C8 Science Panel”) to evaluate available scientific evidence on whether any probable link exists, as defined in the settlement agreement, between exposure to PFOA and disease.
The C8 Science Panel found probable links, as defined in the settlement agreement, between exposure to PFOA and pregnancy-induced hypertension, including preeclampsia, kidney cancer, testicular cancer, thyroid disease, ulcerative colitis, and diagnosed high cholesterol. Under the terms of the settlement, DuPont is obligated to fund up to $235 for a medical monitoring program for eligible class members and pay the administrative costcosts associated with the program, including class counsel fees. The court-appointed Director of Medical Monitoring implemented the program and testing is ongoing with associated payments to service providers disbursed from an escrow account which the Company replenishes pursuant to the settlement agreement. As of March 31,September 30, 2019, approximately $1.6$1.7 has been disbursed from escrow related to medical monitoring. While it is reasonably possible that the Company will incur additional costs related to the medical monitoring program, such costs cannot be reasonably estimated due to uncertainties surrounding the level of participation by eligible class members and the scope of testing.
In addition, under the Leach settlement agreement, DuPont must continue to provide water treatment designed to reduce the level of PFOA in water to six6 area water districts and private well users. At separation, this obligation was assigned to Chemours and is included in the $21 and $22 accrued for these matters at March 31,September 30, 2019 and December 31, 2018.2018, respectively.
PFOA Leach Class Personal Injury
Further, under the Leach settlement, class members may pursue personal injury claims against DuPont only for those diseases for which the C8 Science Panel determined a probable link exists. Approximately 3,500 lawsuits were subsequently filed in various federal and state courts in Ohio and West Virginia and consolidated in multi-district litigation (“MDL”) in Ohio federal court. These were resolved in March 2017 when DuPont entered into an agreement settling all MDL cases and claims, including all filed and unfiled personal injury cases and claims that were part of the plaintiffs’ counsel’s claims inventory, as well as cases tried to a jury verdict (“MDL Settlement”) for $670.7 in cash, with half paid by Chemours, and half paid by DuPont.
24
The Chemours Company
Notes to the Interim Consolidated Financial Statements (Unaudited)
(Dollars in millions, except per share amounts)
Concurrently with the MDL Settlement, DuPont and Chemours agreed to a limited sharing of potential future PFOA costs (indemnifiable losses, as defined in the separation agreement between DuPont and Chemours) for a period of five years. During that five-year period, Chemours will annually pay future PFOA costs up to $25 and, if such amount is exceeded, DuPont will pay any excess amount up to the next $25 (which payment will not be subject to indemnification by Chemours), with Chemours annually bearing any further excess costs under the terms of the separation agreement. After the five-year period, this limited sharing agreement will expire, and Chemours’ indemnification obligations under the separation agreement will continue unchanged. Chemours has also agreed that it will not contest its indemnification obligations to DuPont under the separation agreement for PFOA costs on the basis of ostensible defenses generally applicable to the indemnification provisions under the separation agreement, including defenses relating to punitive damages, fines or penalties, or attorneys’ fees, and waives any such defenses with respect to PFOA costs. Chemours has, however, retained other defenses, including as to whether any particular PFOA claim is within the scope of the indemnification provisions of the separation agreement.
While all MDL lawsuits were dismissed or resolved through the MDL Settlement, the MDL Settlement did not resolve PFOA personal injury claims of plaintiffs who did not have cases or claims in the MDL or personal injury claims based on diseases first diagnosed after February 11, 2017. Since the resolution of the MDL, approximately 5461 personal injury cases have been filed and are pending in West Virginia or Ohio courts alleging status as a Leach class member. These cases are consolidated before the MDL court.court with trials for 2 plaintiffs scheduled in January 2020, and for 6 plaintiffs in June 2020.
State of Ohio
In February 2018, the State of Ohio initiated litigation against DuPont regarding historical PFOA emissions from the Washington Works site. Chemours is an additional named defendant. Ohio alleges damage to natural resources and fraudulent transfer in the spin-off that created Chemours and seeks damages including remediation and other costs and punitive damages.
21
The Chemours Company
Notes to the Interim Consolidated Financial Statements (Unaudited)
(Dollars in millions, except per share amounts)
PFAS
DuPont and Chemours have been named in other litigations, including class actions, brought by individuals, water districts,municipalities, businesses and a putative national medical monitoring putative class actionwater districts alleging exposure to and/or contamination from perfluorinated and polyfluorinated compounds (“PFAS”), including PFOA. Many matters include an allegation of fraudulent transfer in the spin-off that created Chemours.
Aqueous Film Forming Foam Matters
DuPont and Chemours have been named in four30 matters, involving aqueous film forming foam (“AFFF”), which is used to extinguish hydrocarbon-based (i.e., Class B) fires and subject to U.S. military specifications. SomeOf these matters, 21 have been transferred to or filed directly into a multidistrict litigation (“AFFF MDL”) in South Carolina federal court.
In February 2019, two commercial dairy farms near Cannon Air Force Base The matters pending in New Mexico filed lawsuitsthe AFFF MDL include three purported class actions and allege damages as a result of contamination or exposure to AFFF, in federal court in New Mexico against DuPont and Chemours, as well as against several manufacturers of AFFF. Thesemost cases allege that decades of use of AFFF for firefighting practice at the nearby Air Force base contaminated the groundwater, the aquifer, and the property with PFAS, including PFOA and “PFOS” (perfluorooctane sulfonic acid) and threatens their milk and crop production. These cases allege that DuPont and Chemours manufactured AFFF and its non-defined “constituents.”due to migration from military installations or airports. Plaintiffs seek to recover damages for investigating, monitoring, remediating, treating, and otherwise responding to the contamination,contamination. Others have claims for personal injury, property diminution and punitive damages. A number of matters allege fraudulent transfer.
AlsoThere are 9 AFFF lawsuits pending outside the AFFF MDL in February 2019,state courts across the City of Dayton, Ohiocountry. These matters are:
Valero Refining (“City”Valero”) filed an amended complaintseven state court lawsuits commencing in June 2019 regarding its Tennessee, Texas, Oklahoma, California, Ohio and Louisiana facilities. These lawsuits allege that several defendants that designed, manufactured, marketed, and/or sold AFFF or PFAS incorporated into AFFF have caused Valero to add DuPontincur damages and Chemours as defendants tocosts including remediation, AFFF disposal and replacement. Valero also alleges fraudulent transfer.
In August 2019, a lawsuitputative class action was filed in Ohio federalAlaska state court against numerous AFFF manufacturers. The City alleges that decades ofseeking class status for property owners whose groundwater has been contaminated by AFFF use in firefighting practice at Wright-Patterson Air Force Base in OhioFairbanks International Airport, a nearby fire training facility and at the City’s own firefighting practice center contaminated the drinkingother state operations.Plaintiffs also allege fraudulent transfer. Damages sought include cost of remediation, monitoring, medical monitoring, diminution of property value, cost of replacement water supply. The City alleges that DuPont and Chemours manufactured AFFF and its non-defined “constituents.” The City seeks to recover damages for investigating, monitoring, remediating, treating, and otherwise responding to the PFAS contamination and punitive damages. The case was transferred to the AFFF MDL.
In AprilSeptember 2019, the Atlantic City Municipal Utilities Authoritya lawsuit alleging personal injury resulting from exposure to AFFF in Long Island drinking water was filed a complaintby 4 individuals in New York state court.Plaintiffs also allege violation of New York Uniform Fraudulent Conveyance Act and seek compensatory and punitive damages, and medical monitoring.
25
The Chemours Company
Notes to the Interim Consolidated Financial Statements (Unaudited)
(Dollars in millions, except per share amounts)
State Natural Resource Damages Matters
In addition to the State of New Jersey federal courtactions (as detailed below) and the State of Ohio action (as detailed above), the states of Vermont and New Hampshire have each filed 2 lawsuits against AFFF manufacturers,defendants, including DuPont and Chemours, relating to the Federal Aviation Administrationalleged contamination of state natural resources with PFAS compounds. These lawsuits seek damages including costs to investigate, clean up, restore, treat, monitor, or otherwise respond to contamination to natural resources.
Each state has filed 1 lawsuit against 3M Company (“FAA”3M”), DuPont, and Chemours regardinggenerally alleging widespread contamination of the state’s natural resources with PFAS and damaging the value and use of AFFF at William J. Hughes Technical Center innatural resources as well as injuring citizens of the states. The second lawsuit filed by each state, as well as the state of New Jersey, an FAA-owned site. Plaintiffs allege that DuPont manufactured, marketed, sold, or otherwise promoted the useYork, is against alleged manufacturers of AFFF, including DuPont and Chemours. This second action generally demands that Chemours is responsiblethe defendants pay for sharing DuPont liabilities. The plaintiff seeksall costs to recover damages including clean-up costs, compensatory, and punitive damages regardingrespond to contamination of its drinking water wells.the state’s property and resources and other damages. All these lawsuits include counts for fraudulent transfer, either under state law or uniform acts.
Other PFAS Matters
DuPont has also been named in approximately 51 lawsuits pending in New York courts, which are not part of the Leach class, brought by individual plaintiffs alleging negligence and other claims in the release of PFAS, including PFOA, into drinking water, and seeking medical monitoring, compensatory, and punitive damages against current and former owners and suppliers of a manufacturing facility in Hoosick Falls, New York. TwoThe Company has been included as a named defendant in 7 of these lawsuits. NaN other lawsuits in New York have been filed by a business seeking to recover its losses and by nearby property owners and residents in a putative class action seeking medical monitoring, compensatory and punitive damages, and injunctive relief.
In May 2017, the Water Works and Sewer Board of the Town of Centre, Alabama filed suit against numerous carpet manufacturers located in Dalton, Georgia and suppliers and former suppliers, including DuPont, in Alabama state court. The complaint alleges negligence, nuisance, and trespass in the release of PFAS, including PFOA, into a river leading to the town’s water source, and seeks compensatory and punitive damages.
In February 2018, the New Jersey-American Water Company, Inc. (“NJAW”) filed suit against DuPont and Chemours in New Jersey federal court alleging that discharges in violation of the New Jersey Spill Compensation and Control Act (“Spill Act”), were made into groundwater utilized in the NJAW Penns Grove water system. NJAW alleges that damages include costs associated with remediating, operating, and maintaining its system, and attorney fees.
In October 2018, a putative class action was filed in Ohio federal court against 3M, Company (“3M”), DuPont, Chemours, and other defendants seeking class action status for U.S. residents having a detectable level of PFAS in their blood serum. The complaint seeks declaratory and injunctive relief, including the establishment of a “PFAS Science Panel.”
In December 2018, the owners of a dairy farm filed a lawsuit in Maine state court against numerous defendants including DuPont and Chemours alleging that their dairy farm was contaminated by PFAS, including PFOS and PFOA present in treated municipal sewer sludge used in agricultural spreading applications on their farm. The complaint asserts negligence, trespass, and other tort and state statutory claims and seeks damages.
22
The Chemours Company
Notes to the Interim Consolidated Financial Statements (Unaudited)
(Dollars in millions, except per share amounts)
In January 2019, the Town of East Hampton, New York (“Town”) filed a lawsuit against DuPont, Chemours, and numerous other defendants in New York state court alleging that it has and will incur costs for assessment, remediation, and response to address PFAsPFAS contamination, including PFOA and PFOS in drinking water and the environment. As to DuPont and Chemours, the Town alleges that PFOA and/or PFOS washed from clothing or cleaning supplies to cesspools and then subsurface water. In addition to cost recovery, the Town seeks natural resource damages, compensatory and punitive damages, and injunctive relief. Other defendants, identified as manufacturers of AFFF, transferred the case to the AFFF MDL.
In February 2019, the Ridgewood City Water Department (“Ridgewood Water”), a public water supplier in Bergen County, New Jersey filed a lawsuit in New Jersey state court against DuPont, Chemours, and numerous other defendants. As to DuPont and Chemours, Ridgewood Water alleges that “PTFE” (polytetrafluoroethylene fluoropolymers) is one of the sources of alleged PFAS contamination, including PFOA and PFOS. Ridgewood Water seeks declaratory relief requiring defendants to pay for assessment, remediation, and response costs, as well as compensatory and punitive damages.
In MarchMay 2019, a putative class action was filed in Delaware state court against two electroplating companies alleging that they are responsible for PFAS contamination, including PFOA and PFOS, in drinking water and the NJ DEP issued two Directivesenvironment in the nearby community. The suit also names 3M, DuPont and Chemours, asserting they sold PFAS containing materials to the electroplating companies. The putative class of residents alleges negligence, nuisance, trespass and other claims and seeks medical monitoring, personal injury and property damages, and punitive damages.
26
The Chemours Company
Notes to the Interim Consolidated Financial Statements (Unaudited)
(Dollars in millions, except per share amounts)
In August 2019, 6 Long Island water suppliers filed four lawsuits in New York federal court against defendants including Chemours. Of these actions, the State-wideDuPont and Chemours regarding alleged PFAS, Directive and the lawsuits concerning the Company’s Chambers Works, New Jersey and Parlin, New Jersey sites involve PFAS. All the NJ DEP matters are described further below.
PFOA and PFAS Summary
There may be additional lawsuits filed related to PFOA and/or PFAS, including DuPont’s use of PFOA, its manufacture of PFOA, or its customers’ use of DuPont products. Any such litigation could result in Chemours incurring additional costsPFOS contamination through releases from industrial and liabilities. Management believes that it is reasonably possible that the Company could incur losses related to PFOA and/or PFAS matters in excess of amounts accrued, but any such losses are not estimable at this time due to various reasons, including, among others, that such matters are in their early stagesmanufacturing facilities and have significant factual issues to be resolved.business locations where PFAS-contaminated water was used for irrigation andsites where consumer products were disposed. The complaints allege products liability, negligence, nuisance, trespass and fraudulent transfer. Plaintiffs seek declaratory and injunctive relief as well as compensatory andpunitive damages.
New Jersey Department of Environmental Protection Directives and Litigation
In March 2019, the NJ DEP issued two Directives and filed four4 lawsuits against Chemours and other defendants. The Directives are: (i) a state-wide PFAS Directive issued to DuPont, DowDuPont, DuPont Specialty Products USA LLC (“DuPont SP USA”), Solvay S.A., 3M and Chemours seeking a meeting to discuss future costs for PFAS-relatedPFAS related costs incurred by the NJ DEP and establishing a funding source for such costs by the Directive recipients, and information relating to historic and current use of certain PFAS compounds; and, (ii) a Pompton Lakes natural resource damageNatural Resources Damages (“NRD”) Directive to DuPont and Chemours demanding $0.1 to cover the cost of preparation of a natural resource damage assessment plan and access to related documents.
The lawsuits filed in New Jersey state courts by the NJ DEP are: (i) in Salem County, against DuPont, 3M, and Chemours primarily alleging clean-up and removal costs and damages and natural resource damages under the Spill Act, the Water Pollution Control Act (“WPCA”), the Industrial Site Recovery Act (“ISRA”), and common law regarding past and present operations at Chambers Works, a site assigned to Chemours at separation; separation; (ii) in Middlesex County, against DuPont, DuPont SP USA, 3M, and Chemours primarily alleging clean-up and removal costs and damages and natural resource damages under the Spill Act, ISRA, WPCA, ISRA, and common law regarding past and present operations at Parlin, a DuPont-ownedDuPont owned site; (iii) in Gloucester County, against DuPont and Chemours primarily alleging clean-up and removal costs and damages and natural resource damages under the Spill Act, WPCA, and common law regarding past operations at Repauno, a non-operating remediation site assigned to Chemours at separation which has been sold; and (iv) in Passaic County, against DuPont and Chemours primarily alleging clean-up and removal costs and damages and natural resource damages under the Spill Act, WPCA, and common law regarding past operations at Pompton Lakes, a non-operating remediation site assigned to Chemours at separation. The alleged pollutants listed in the Salem County and Middlesex County matters above include PFAS. Each lawsuit also alleges fraudulent transfer.
DuPont requested that Chemours defend and indemnify it in these matters. Chemours has accepted the defense while reserving rights and declining DuPont’s demand as to matters under ISRA, fraudulent transfer or involving other DuPont entities.
PFOA and PFAS Summary
Management believes that a lossit is reasonably possible asthat the Company could incur losses related to thesePFOA and/or PFAS matters in excess of amounts accrued, but any such losses are not estimable forat this time due to various reasons, including, among others, that thesesuch matters are in their early stages and have significant factual issues to be resolved.
23
The Chemours Company
Notes to the Interim Consolidated Financial Statements (Unaudited)
(Dollars in millions, except per share amounts)
U.S. Smelter and Lead Refinery, Inc.
There are six lawsuits, including one putative class action, pending against DuPont by area residents concerning the U.S. Smelter and Lead Refinery multi-party Superfund site in East Chicago, Indiana. Several of the lawsuits allege that Chemours is now responsible for DuPont environmental liabilities. The lawsuits include allegations for personal injury damages, property diminution, and damages under the Comprehensive Environmental Response Compensation and Liability Act (“CERCLA,” often referred to as “Superfund”). At separation, DuPont assigned Chemours its former plant site, which is located south of the residential portion of the Superfund area, and its responsibility for the environmental remediation at the Superfund site. Management believes a loss is reasonably possible, but not estimable at this time due to various reasons including, among others, that such matters are in their early stages and have significant factual issues to be resolved.
27
The Chemours Company
Notes to the Interim Consolidated Financial Statements (Unaudited)
(Dollars in millions, except per share amounts)
GenX and Other Perfluorinated and Polyfluorinated Compounds
At its Fayetteville, North Carolina facility, the Company continues to capture and separately dispose of process waste water containing the polymerization processing aid hexafluoropropylene oxide dimer acid (“HFPO Dimer Acid,” sometimes referred to as “GenX” or “C3 Dimer Acid”) and other perfluorinated and polyfluorinated compounds. The Company believes that discharges to the Cape Fear River, site surface water, groundwater, and air emissions have not impacted the safety of drinking water in North Carolina and is cooperating with a variety of ongoing inquiries and investigations from federal, state, and local authorities, regulators, and other governmental entities, includingentities. Government inquiries include an investigation regarding PFAS chemicals (including GenX) initiated in July 2019 by the U.S. House of Representatives Committee on Oversight and Reform, Subcommittee on the Environment which held a hearing at which Chemours offered testimony. There is an ongoing investigation into releases from the Fayetteville site being conducted by the U.S. Attorney’s Office for the Eastern District of North Carolina and the Environment and Natural Resources Division of the U.S. Department of Justice.
In September 2017, the North Carolina Department of Environmental Quality (“NC DEQ”) issued a 60-day notice of intent to suspend the permit for the Fayetteville facility and the State of North Carolina filed an action in North Carolina state court regarding the discharges seeking a temporary restraining order and preliminary injunction, as well as other relief, including abatement and site correction. A partial Consent Order was entered partially resolving the State’s action in return for the Company’s agreement to continue and supplement the voluntary waste water disposal measures it had previously commenced and to provide certain information. In November 2017, the NC DEQ informed the Company that it was suspending the process waste water discharge permit for the Fayetteville facility. The Company thereafter commenced the capture and separate disposal of all process waste water from the Fayetteville facility related to the Company’s own operations. In addition, in June 2018, the North Carolina Legislature enacted legislation (i) granting the governor the authority, in certain circumstances, to require a facility with unauthorized PFAS discharges to cease operations, and (ii) granting the governor the authority, in certain circumstances, to direct the NC DEQ secretary to order a PFAS discharger to establish permanent replacement water supplies for parties whose water was contaminated by the discharge.
On July 13, 2018, Cape Fear River Watch (“CFRW”), a non-profit organization, sued the NC DEQ in North Carolina state court, seeking to require the NC DEQ to take additional actions as to the Fayetteville facility. On August 29, 2018, CFRW sued the Company in North Carolina federal court for alleged violations of the Clean Water Act (“CWA”) and the Toxic Substances Control Act (“TSCA”), seeking declaratory and injunctive relief and penalties.
On February 25, 2019, the North Carolina Superior Court for Bladen County approved a Consent Order between NC DEQ and the Company resolving the State’s and CFRW’s lawsuits and other matters (including issues regarding the legislation referenced above and Notices of Violation (“NOVs”) issued by the State) and litigation brought by CFRW. Under its terms, Chemours paid $13 in March 2019 to cover a civil penalty and investigative costs and continues to take additional actions to address site surface water, groundwater, and air emissions, including installing technology to abate future emissions by specified dates and meeting specified emissions reductions (with stipulated penalties for failures to do so). In connectionThe Company continues to have active dialogue with NC DEQ and CFRW regarding the approvedadditional actions to be taken under the Consent Order theand will submit a Corrective Action Plan for onsite groundwater remediation to NC DEQ and CFRW in December 2019. The Company accrued an additional $27$2 during the firstthird quarter of 2019 and had total accrued liabilities of $83 for this matter at March 31,September 30, 2019, of which, $58$54 is treated as accrued litigation costs. The Company’s estimated liability is based on management’s assessment of the current facts and circumstances for this matter, which are subject to various assumptions that include, but are not limited to, the number of affected properties, the type of water treatment systemsystems required, the cost of proposed water treatment systems, the number of affected properties, and any related operation, maintenance, and monitoring (“OM&M”) requirements, assessed fines and penalties, and other charges contemplated by the Consent Order. As implementation of the Company’s obligations under the Consent Order proceed, an additional loss is considered probable but not estimable at this time.
In February 2019, the Company received an NOV from the EPA alleging certain TSCA violations at its Fayetteville site. Matters raised in the NOV could have the potential to affect operations at the Fayetteville site. The Company responded to the EPA in March 2019 asserting that the Company has not violated environmental laws. At this time, management does not believe that a loss is probable related to the matters in this NOV.
It is also possible that issues relating to site discharges could result in further litigation or regulatory demands with regard to the Fayetteville facility, including potential permit modifications. If such issues arise, or if the Consent Order is modified, or as implementation of the obligations under the Consent Order proceed, an additional loss is reasonably possible but not estimable at this time.
24
The Chemours Company
Notes to the Interim Consolidated Financial Statements (Unaudited)
(Dollars in millions, except per share amounts)
The Company has responded to grand jury subpoenas, produced witnesses before a grand jury and for interviews with government investigators and attorneys, and met with the U.S. Attorney’s Office for the Eastern District of North Carolina and the EnvironmentalEnvironment and Natural Resources Division of the U.S. Department of Justice regarding their investigation into a potential violation of the CWA. Although the Company is not able at this point to predict the outcome of that investigation, it is reasonably possible that it could result in a criminal or civil proceeding, the imposition of fines and penalties, and/or other remedies.
28
The Chemours Company
Notes to the Interim Consolidated Financial Statements (Unaudited)
(Dollars in millions, except per share amounts)
Civil actions have been filed against DuPont and Chemours in North Carolina federal court relating to discharges from the Fayetteville site. These actions include a consolidated action brought by public water suppliers seeking damages and injunctive relief, a consolidated purported class action seeking medical monitoring, and property damage and/or other monetary and injunctive relief on behalf of the putative classes of property owners and residents in areas near or that draw drinking water from the Cape Fear River, and an action by private well owners seeking compensatory and punitive damages. It is possible that additional litigation may be filed against the Company and/or DuPont concerning the discharges. Ruling on the Company’s motions in April 2019, the court dismissed the medical monitoring, injunctive demand, and many other alleged causes of actions in these lawsuits.
It is not possible at this point to predict the timing, course, or outcome of all governmental and regulatory inquiries and notices and litigation, and it is possible that these matters could materially affect the Company’s financial results and operations. In addition, local communities, organizations, and federal and state regulatory agencies have raised questions concerning HFPO Dimer Acid and other perfluorinated and polyfluorinated compounds at certain other manufacturing sites operated by the Company, and it is possible that similar developments to those described above and centering on the Fayetteville site could arise in other locations.
Securities Litigation
In October 2019 the Electrical Workers Pension Fund, Local 103 (“IBEW”) filed a putative class action in Delaware federal court alleging that Chemours and certain of its officers violated the Securities Exchange Act of 1934 by making materially false and misleading statements and omissions in public disclosures regarding environmental liabilities assigned to Chemours in connection with its spin-off from DuPont. The IBEW seeks a class of purchasers of the Chemours stock between February 16, 2017 and August 1, 2019 and alleges compensatory damages and fees. The Company believes the suit is without merit and intends to vigorously defend against it. It is possible that additional actions may be filed concerning the same subject matter.
Management believes that it is not possible at this time to reasonably assess the outcome of this litigation or to estimate the loss or range of loss as the matter is in the early stages with significant issues to be resolved. If the Company were not to prevail in the litigation, the impact could be material to the Company’s results of operations, financial position, and cash flows.
Mining Solutions Facility Construction Stoppage
In March 2018, a civil association in Mexico filed a complaint against the government authorities involved in the permitting process of the Company’s new Mining Solutions facility under construction in Gomez Palacio, Durango, Mexico. The claimant sought and obtained a suspension from the district judge to stop the Company’s construction work while the claim is studied and reviewed. Chemours, as the third-party affected, has filed an appeal.work. The Company has declared force majeure with its vendors while plant construction is idled. Chemours’ project permits fully comply with the laws and regulations at the federal, state, and municipal levels,suspension was subsequently lifted on appeal and the Companymatter is working with localbefore the Supreme Court of Mexico. A second similar complaint was filed in September 2019 and, federal authorities, along with community leaders, to address the complaint.again, a suspension of construction was granted. Chemours will file an appeal.
Management determined that these delays represented a trigger event, which requiredAt September 30, 2019 the Company had $144 long-lived assets under construction at the facility, $6 of other related prepaid costs, and approximately $50 of the Company’s goodwill assigned to the Mining Solutions reporting unit’s goodwill to be tested for impairment at March 31,unit. Management believes these amounts are recoverable as of September 30, 2019. No impairments were noted as a result of these tests. If the Company is unable to resume construction on the facility, a significant portion of the associated long-lived assets could be impaired.
Environmental
Chemours, due to the terms of its separation-related agreements with DuPont, is subject to contingencies pursuant to environmental laws and regulations that in the future may require further action to correct the effects on the environment of prior disposal practices or releases of chemical substances by Chemours or other parties. Much of this liability results from CERCLA, the Resource Conservation and Recovery Act, and similar state and global laws. These laws require Chemours to undertake certain investigative, remediation, and restoration activities at sites where Chemours conducts or once conducted operations or at sites where Chemours-generated waste was disposed. The accrual also includes estimated costs related to a number of sites identified for which it is probable that environmental remediation will be required, but which are not currently the subject of enforcement activities.
29
The Chemours Company
Notes to the Interim Consolidated Financial Statements (Unaudited)
(Dollars in millions, except per share amounts)
Chemours accrues for remediation activities when it is probable that a liability has been incurred and a reasonable estimate of the liability can be made. Where the available information is sufficient to estimate the amount of liability, that estimate has been used. Where the available information is only sufficient to establish a range of probable liability, and no point within the range is more likely than any other, the lower end of the range has been used. Estimated liabilities are determined based on existing remediation laws and technologies. Inherent uncertainties exist in such evaluations, primarily due to unknown environmental conditions, changing governmental regulations regarding liability, and emerging remediation technologies. These accruals are adjusted periodically as remediation efforts progress and as additional technological, regulatory, and legal information becomes available. Environmental liabilities and expenditures include claims for matters that are liabilities of DuPont and its subsidiaries, which Chemours may be required to indemnify pursuant to the separation-related agreements executed prior to the Company’s separation from DuPont. These accrued liabilities are undiscounted and do not include claims against third-parties. Costs related to environmental remediation are charged to expense in the period incurred.
The following table sets forth the components of the Company’s environmental remediation liabilities at September 30, 2019 and December 31, 2018, and illustrates the five sites that are deemed the most significant by management.
|
| September 30, 2019 |
|
| December 31, 2018 |
| ||
Chambers Works, Deepwater, New Jersey |
| $ | 20 |
|
| $ | 18 |
|
East Chicago, Indiana |
|
| 18 |
|
|
| 21 |
|
Fayetteville Works, Fayetteville, North Carolina (1) |
|
| 29 |
|
|
| 10 |
|
Pompton Lakes, New Jersey |
|
| 43 |
|
|
| 45 |
|
USS Lead, East Chicago, Indiana |
|
| 14 |
|
|
| 15 |
|
All other sites |
|
| 115 |
|
|
| 117 |
|
Total accrued environmental remediation |
| $ | 239 |
|
| $ | 226 |
|
(1) | Total accruals related to this matter amounted to $83 and $75 at September 30, 2019 and December 31, 2018, respectively. These amounts included $54 and $65, which are reflected as a component of the Company’s accrued litigation at September 30, 2019 and December 31, 2018, respectively. |
The following table sets forth the current and long-term components of the Company’s environmental remediation liabilities and their balance sheet locations at September 30, 2019 and December 31, 2018.
|
|
|
|
|
|
|
|
|
|
|
|
| Balance Sheet Location |
| September 30, 2019 |
|
| December 31, 2018 |
| ||
Environmental Remediation: |
|
|
|
|
|
|
|
|
|
|
Current environmental remediation |
| Other accrued liabilities (Note 16) |
| $ | 74 |
|
| $ | 74 |
|
Long-term environmental remediation |
| Other liabilities (Note 18) |
|
| 165 |
|
|
| 152 |
|
Total environmental remediation |
|
|
| $ | 239 |
|
| $ | 226 |
|
At March 31,September 30, 2019 and December 31, 2018, the consolidated balance sheets included liabilities relating to these matters of $233$239 and $226, respectively, which, in management’s opinion, are appropriate based on existing facts and circumstances. The time-frame for a site to go through all phases of remediation (investigation and active clean-up) may take about 15 to 20 years, followed by several years of OM&M activities. Remediation activities, including OM&M activities, vary substantially in duration and cost from site to site. These activities, and their associated costs, depend on the mix of unique site characteristics, evolving remediation technologies, diverse regulatory requirements, as well as the presence or absence of other potentially responsible parties. In addition, for claims that Chemours may be required to indemnify DuPont pursuant to the separation-related agreements, Chemours, through DuPont, has limited available information for certain sites or is in the early stages of discussions with regulators. For these sites in particular, there may be considerable variability between the clean-up activities that are currently being undertaken or planned and the ultimate actions that could be required. Therefore, considerable uncertainty exists with respect to environmental remediation costs and, under adverse changescosts. While the Company currently estimates that, in circumstances, although deemed remote,view of that uncertainty, the potential liability may range up to approximately $450$570 above the amount accrued at March 31, 2019.September 30, 2019, the amounts could be substantially higher than this range under adverse changes in circumstances.
For the three months ended March 31, 2019 and 2018, Chemours incurred environmental remediation expenses of $15$10 and $11,$42 for the three and nine months ended September 30, 2019, respectively, and $8 and $32 for the three and nine months ended September 30, 2018, respectively.
25
30
The Chemours Company
Notes to the Interim Consolidated Financial Statements (Unaudited)
(Dollars in millions, except per share amounts)
Note 20. Equity
2017 Share Repurchase Program
On November 30, 2017, the Company’s board of directors approved a share repurchase program authorizing the purchase of shares of Chemours’ issued and outstanding common stock in an aggregate amount not to exceed $500, plus any associated fees or costs in connection with the Company’s share repurchase activity (“2017 Share Repurchase Program”). Under the 2017 Share Repurchase Program, shares of Chemours’ common stock were purchased on the open market from time to time, subject to management’s discretion, as well as general business and market conditions. The Company’s 2017 Share Repurchase Program became effective on November 30, 2017. On May 31, 2018, the Company completed the aggregate $500 in authorized purchases of Chemours’ issued and outstanding common stock under the 2017 Share Repurchase Program, which amounted to a cumulative 10,085,647 shares purchased at an average share price of $49.58 per share. All common shares purchased under the 2017 Share Repurchase Program are held as treasury stock and were accounted for using the cost method.
2018 Share Repurchase Program
On August 1, 2018, the Company’s board of directors approved a share repurchase program authorizing the purchase of shares of Chemours’ issued and outstanding common stock in an aggregate amount not to exceed $750, plus any associated fees or costs in connection with the Company’s share repurchase activity (“2018 Share Repurchase Program”). On February 13, 2019, the Company’s board of directors increased the authorization amount of the 2018 Share Repurchase Program from $750 to $1,000. Under the 2018 Share Repurchase Program, shares of Chemours’ common stock can be purchased on the open market from time to time, subject to management’s discretion, as well as general business and market conditions. The Company’s 2018 Share Repurchase Program became effective on August 1, 2018 and will continue through the earlier of its expiration on December 31, 2020, or the completion of repurchases up to the approved amount. The program may be suspended or discontinued at any time. All common shares purchased under the 2018 Share Repurchase Program are expected to be held as treasury stock and accounted for using the cost method.
Under the 2018 Share Repurchase Program, the Company purchased an additional 7,278,002 shares of Chemours’ issued and outstanding common stock during the first quarter of 2019, which amounted to $261 at an average share price of $35.87 per share. As of March 31,September 30, 2019, the Company has purchased a cumulative 13,628,85915,245,999 shares of Chemours’ issued and outstanding common stock under the 2018 Share Repurchase Program, which amounted to $511$572 at an average share price of $37.47$37.52 per share. The aggregate amount of Chemours’ common stock that remained available for purchase under the 2018 Share Repurchase Program at March 31,September 30, 2019 was $489.$428.
Note 21. Stock-based Compensation
The Company’s total stock-based compensation expense was $4 and $18 for the three and nine months ended March 31,September 30, 2019, respectively, and 2018 amounted to $8$5 and $9,$20 for the three and nine months ended September 30, 2018, respectively.
Stock Options
During the threenine months ended March 31,September 30, 2019, Chemours granted approximately 760,000840,000 non-qualified stock options to certain of its employees, of which 760,000 non-qualified stock options were granted in the first quarter of 2019. These awards will vest over a three-year period and expire 10 years from the date of grant. The fair value of the Company’s stock options are based on the Black-Scholes valuation model.
The following table sets forth the assumptions used at grant date to determine the fair value of the Company’s stock option awards that were granted during the threenine months ended March 31,September 30, 2019.
|
| Three Months Ended March 31, 2019 |
|
| Nine Months Ended September 30, 2019 |
| ||
Risk-free interest rate |
|
| 2.60 | % |
|
| 2.53 | % |
Expected term (years) |
|
| 6.00 |
|
|
| 6.05 |
|
Volatility |
|
| 48.07 | % |
|
| 48.05 | % |
Dividend yield |
|
| 2.63 | % |
|
| 2.81 | % |
Fair value per stock option |
| $ | 14.40 |
|
| $ | 13.66 |
|
The Company recorded $4$2 and $5$8 in stock-based compensation expense specific to its stock options for the three and nine months ended March 31,September 30, 2019, respectively, and $1 and $7 in stock-based compensation expense specific to its stock options for the three and nine months ended September 30, 2018, respectively. At March 31,September 30, 2019, approximately 6,980,0006,190,000 stock options remained outstanding.
26
The Chemours Company
Notes to the Interim Consolidated Financial Statements (Unaudited)
(Dollars in millions, except per share amounts)
Restricted Stock Units
During the threenine months ended March 31,September 30, 2019, Chemours granted approximately 150,000190,000 restricted stock units (“RSUs”) to certain of its employees, of which 150,000 RSUs were granted in the first quarter of 2019. These awards will vest over a three-year period and, upon vesting, convert one-for-one1-for-one to Chemours’ common stock. The fair value of the RSUs is based on the market price of the underlying common stock at the grant date.
The Company recorded $2$1 and $5 in stock-based compensation expense specific to its RSUs for the three and nine months ended March 31,September 30, 2019, respectively, and 2018.$1 and $6 in stock-based compensation expense specific to its RSUs for the three and nine months ended September 30, 2018, respectively. At March 31,September 30, 2019, approximately 270,000220,000 RSUs remained non-vested.
31
The Chemours Company
Notes to the Interim Consolidated Financial Statements (Unaudited)
(Dollars in millions, except per share amounts)
Performance Share Units
During the threenine months ended March 31,September 30, 2019, Chemours granted approximately 200,000240,000 performance share units (“PSUs”) to key senior management employees, of which upon200,000 PSUs were granted in the first quarter of 2019. Upon vesting, these awards convert one-for-one1-for-one to Chemours’ common stock if specified performance goals, including certain market-based conditions, are met over the three-year performance period specified in the grant, subject to exceptions through the respective vesting period of three years. Each grantee is granted a target award of PSUs, and may earn between 0% and 250% of the target amount depending on the Company’s performance against stated performance goals.
During the threenine months ended March 31,September 30, 2019, approximately 1,520,000 PSUs granted in 2016 to the Company’s key senior management employees vested, based on the attainment of certain performance and market-based conditions. Of the 1,520,000 PSUs that vested during the threenine months ended March 31,September 30, 2019, approximately 680,000 non-issued shares were cancelled to cover the employee portion of income taxes related to this award.
A portion of the fair value of PSUs was estimated at the grant date based on the probability of satisfying the market-based conditions associated with the PSUs using the Monte Carlo valuation method, which assesses probabilities of various outcomes of market conditions. The other portion of the fair value of the PSUs is based on the fair market value of the Company’s stock at the grant date, regardless of whether the market-based conditions are satisfied.
The Company recorded $2less than $1 and $5 in stock-based compensation expense specific to its PSUs for the three and nine months ended March 31,September 30, 2019, respectively, and 2018.$3 and $7 in stock-based compensation expense specific to its PSUs for the three and nine months ended September 30, 2018, respectively. At March 31,September 30, 2019, approximately 540,000570,000 PSUs at 100% of the target amount remained non-vested.
Employee Stock Purchase Plan
On January 26, 2017, the Company’s board of directors approved The Chemours Company Employee Stock Purchase Plan (“ESPP”), which was approved by Chemours’ stockholders on April 26, 2017. Under the ESPP, a total of 7,000,000 shares of Chemours’ common stock are reserved and authorized for issuance to participating employees, as defined by the ESPP, which excludes executive officers of the Company. The ESPP provides for consecutive 12-month offering periods, each with two2 purchase periods in March and September within those offering periods. The initial offering period under the ESPP began on October 2, 2017. Participating employees are eligible to purchase the Company’s common stock at a discounted rate equal to 95% of its fair value on the last trading day of each purchase period. InDuring the first quarterand third quarters of 2019, the Company executed an open market transactiontransactions to purchase the Company’s common stock on behalf of its ESPP participants, which amounted toparticipants. The company purchased approximately 25,00058,000 shares at $1.
27
The Chemours Company
Notes tofor $1 and approximately 83,000 shares for $2 for the Interim Consolidated Financial Statements (Unaudited)three and nine months ended September 30, 2019, respectively.
(Dollars in millions, except per share amounts)
Note 22. Financial Instruments
Derivative Instruments
Objectives and Strategies for Holding Derivative Instruments
In the ordinary course of business, Chemours enters into contractual arrangements (i.e., derivatives) to reduce its exposure to foreign currency risks. The Company has established a derivative program to be utilized for financial risk management, which currently includes three distinct risk management strategies: (i) foreign currency forward contracts, which are used to minimize the volatility in the Company’s earnings related to foreign exchange gains and losses resulting from remeasuring its monetary assets and liabilities that are denominated in non-functional currencies; (ii) foreign currency forward contracts, which are also used to mitigate the risks associated with fluctuations in the euro against the U.S. dollar for forecasted U.S. dollar-denominated inventory purchases in certain of the Company’s international subsidiaries that use the euro as their functional currency; and, (iii) euro-denominated debt, which is used to reduce the volatility in stockholders’ equity caused by changes in foreign currency exchange rates of the euro with respect to the U.S. dollar for certain of its international subsidiaries that use the euro as their functional currency. The Company’s derivative program reflects varying levels of exposure coverage and time horizons based on an assessment of risk. The derivative program operates within Chemours’ financial risk management policies and guidelines, and the Company does not enter into derivative financial instruments for trading or speculative purposes.
32
The Chemours Company
Notes to the Interim Consolidated Financial Statements (Unaudited)
(Dollars in millions, except per share amounts)
Net Monetary Assets and Liabilities Hedge – Foreign Currency Forward Contracts
At March 31,September 30, 2019, the Company had 1513 foreign currency forward contracts outstanding with an aggregate gross notional U.S. dollar equivalent of $424,$399, and an average maturity of one month. At December 31, 2018, the Company had 20 foreign currency forward contracts outstanding with an aggregate gross notional U.S. dollar equivalent of $503, and an average maturity of one month. Chemours recognized a net lossgains of $2$1 and aless than $1 for the three and nine months ended September 30, 2019, respectively, and net gaingains of $4$14 and $8 for the three and nine months ended September 30, 2018, respectively, on its foreign currency forward contracts in other income, net for the three months ended March 31, 2019 and 2018, respectively.net.
Cash Flow Hedge – Foreign Currency Forward Contracts
At March 31,September 30, 2019, the Company had 95142 foreign currency contracts outstanding under Chemours’ cash flow hedge program with an aggregate notional U.S. dollar equivalent of $158,$128, and an average maturity of four months. At December 31, 2018, the Company had 75 foreign currency contracts outstanding under Chemours’ cash flow hedge program with an aggregate notional U.S. dollar equivalent of $143, and an average maturity of four months. The Company recognized pre-tax gains of $5 and $7 for the three and nine months ended September 30, 2019, and a pre-tax loss of $1 and a pre-tax gain of $2$6 for the three and nine months ended March 31, 2019September 30, 2018 on its cash flow hedge within accumulated other comprehensive loss. For the three and nine months ended March 31,September 30, 2019, $3$2 and $8 of gain was reclassified to the cost of goods sold from accumulated other comprehensive loss. For the three and nine months ended September 30, 2018, $1 of gain was reclassified to the cost of goods sold from accumulated other comprehensive loss.
The Company expects to reclassify an approximate $5$6 of net gain from accumulated other comprehensive loss to the cost of goods sold over the next 12 months, based on current foreign currency exchange rates.
Net Investment Hedge – Foreign Currency Borrowings
The Company recognized a pre-tax gaingains of $10$33 and $36 for the three and nine months ended September 30, 2019, respectively, and a pre-tax loss of $34$11 and a pre-tax gain of $2 for the three and nine months ended March 31, 2019 andSeptember 30, 2018, respectively, on its net investment hedges within accumulated other comprehensive loss. NoNaN amounts were reclassified from accumulated other comprehensive loss for the Company’s net investment hedges during the three and nine months ended March 31,September 30, 2019 and 2018.
28
The Chemours Company
Notes to the Interim Consolidated Financial Statements (Unaudited)
(Dollars in millions, except per share amounts)
Fair Value of Derivative Instruments
The following table sets forth the fair value of the Company’s derivative assets and liabilities at March 31,September 30, 2019 and December 31, 2018.
|
|
|
| Fair Value Using Level 2 Inputs |
|
|
|
| Fair Value Using Level 2 Inputs |
| ||||||||||
|
| Balance Sheet Location |
| March 31, 2019 |
|
| December 31, 2018 |
|
| Balance Sheet Location |
| September 30, 2019 |
|
| December 31, 2018 |
| ||||
Asset derivatives: |
|
|
|
|
|
|
|
|
|
|
|
|
|
|
|
|
|
|
|
|
Foreign currency forward contracts not designated as a hedging instrument |
| Accounts and notes receivable, net |
| $ | 1 |
|
| $ | 1 |
|
| Accounts and notes receivable, net (Note 9) |
| $ | 1 |
|
| $ | 1 |
|
Foreign currency forward contracts designated as a cash flow hedge |
| Accounts and notes receivable, net |
|
| 3 |
|
|
| 3 |
|
| Accounts and notes receivable, net (Note 9) |
|
| 4 |
|
|
| 3 |
|
Total asset derivatives |
|
|
| $ | 4 |
|
| $ | 4 |
|
|
|
| $ | 5 |
|
| $ | 4 |
|
|
|
|
|
|
|
|
|
|
|
|
|
|
|
|
|
|
|
|
|
|
Liability derivatives: |
|
|
|
|
|
|
|
|
|
|
|
|
|
|
|
|
|
|
|
|
Foreign currency forward contracts not designated as a hedging instrument |
| Other accrued liabilities |
| $ | 1 |
|
| $ | 1 |
|
| Other accrued liabilities (Note 16) |
| $ | 1 |
|
| $ | 1 |
|
Total liability derivatives |
|
|
| $ | 1 |
|
| $ | 1 |
|
|
|
| $ | 1 |
|
| $ | 1 |
|
The Company’s foreign currency forward contracts are classified as Level 2 financial instruments within the fair value hierarchy as the valuation inputs are based on the quoted prices and market observable data of similar instruments. For derivative assets and liabilities, standard industry models are used to calculate the fair value of the various financial instruments based on significant observable market inputs, such as foreign exchange rates and implied volatilities obtained from various market sources. Market inputs are obtained from well-established and recognized vendors of market data, and are subjected to tolerance and/or quality checks.
33
The Chemours Company
Notes to the Interim Consolidated Financial Statements (Unaudited)
(Dollars in millions, except per share amounts)
Summary of Derivative Instruments
The following table sets forth the pre-tax changes in fair value of the Company’s derivative assets and liabilities for the three and nine months ended March 31,September 30, 2019 and 2018.
|
| Gain (Loss) Recognized In |
|
| Gain (Loss) Recognized In |
| ||||||||||||||||||
|
|
|
|
|
|
|
|
|
| Other Comprehensive |
|
|
|
|
|
|
|
|
|
| Other Comprehensive |
| ||
Three months ended March 31, |
| Cost of Goods Sold |
|
| Other Income, Net |
|
| Income |
| |||||||||||||||
Three months ended September 30, |
| Cost of Goods Sold |
|
| Other Income, Net |
|
| Income |
| |||||||||||||||
2019 |
|
|
|
|
|
|
|
|
|
|
|
|
|
|
|
|
|
|
|
|
|
|
|
|
Foreign currency forward contracts not designated as a hedging instrument |
| $ | — |
|
| $ | (2 | ) |
| $ | — |
|
| $ | — |
|
| $ | 1 |
|
| $ | — |
|
Foreign currency forward contracts designated as a cash flow hedge |
|
| 3 |
|
|
| — |
|
|
| 2 |
|
|
| 2 |
|
|
| — |
|
|
| 5 |
|
Euro-denominated debt designated as a net investment hedge |
|
| — |
|
|
| — |
|
|
| 10 |
|
|
| — |
|
|
| — |
|
|
| 33 |
|
|
|
|
|
|
|
|
|
|
|
|
|
|
|
|
|
|
|
|
|
|
|
|
|
|
2018 |
|
|
|
|
|
|
|
|
|
|
|
|
|
|
|
|
|
|
|
|
|
|
|
|
Foreign currency forward contracts not designated as a hedging instrument |
| $ | — |
|
| $ | 4 |
|
| $ | — |
|
| $ | — |
|
| $ | 14 |
|
| $ | — |
|
Foreign currency forward contracts designated as a cash flow hedge |
|
| 1 |
|
|
| — |
|
|
| (2 | ) | ||||||||||||
Euro-denominated debt designated as a net investment hedge |
|
| — |
|
|
| — |
|
|
| (34 | ) |
|
| — |
|
|
| — |
|
|
| (11 | ) |
|
|
|
|
|
|
|
|
|
|
|
|
| ||||||||||||
|
| Gain (Loss) Recognized In |
| |||||||||||||||||||||
|
|
|
|
|
|
|
|
|
| Other Comprehensive |
| |||||||||||||
Nine months ended September 30, |
| Cost of Goods Sold |
|
| Other Income, Net |
|
| Income |
| |||||||||||||||
2019 |
|
|
|
|
|
|
|
|
|
|
|
| ||||||||||||
Foreign currency forward contracts not designated as a hedging instrument |
| $ | — |
|
| $ | — |
|
| $ | — |
| ||||||||||||
Foreign currency forward contracts designated as a cash flow hedge |
|
| 8 |
|
|
| — |
|
|
| 7 |
| ||||||||||||
Euro-denominated debt designated as a net investment hedge |
|
| — |
|
|
| — |
|
|
| 36 |
| ||||||||||||
|
|
|
|
|
|
|
|
|
|
|
|
| ||||||||||||
2018 |
|
|
|
|
|
|
|
|
|
|
|
| ||||||||||||
Foreign currency forward contracts not designated as a hedging instrument |
| $ | — |
|
| $ | 8 |
|
| $ | — |
| ||||||||||||
Foreign currency forward contracts designated as a cash flow hedge |
|
| 1 |
|
|
| — |
|
|
| 5 |
| ||||||||||||
Euro-denominated debt designated as a net investment hedge |
|
| — |
|
|
| — |
|
|
| 2 |
| ||||||||||||
Note 23. Long-term Employee Benefits
Chemours sponsors defined benefit pension plans for certain of its employees in various jurisdictions outside of the U.S. The Company’s net periodic pension (cost) income (cost) is based on estimated values and the use of assumptions about the discount rate, expected return on plan assets, and the rate of future compensation increases received by its employees.
2934
The Chemours Company
Notes to the Interim Consolidated Financial Statements (Unaudited)
(Dollars in millions, except per share amounts)
The following table sets forth the Company’s net periodic pension (cost) income and amounts recognized in other comprehensive income for the three and nine months ended March 31,September 30, 2019 and 2018.
|
| Three Months Ended March 31, |
|
| Three Months Ended September 30, |
|
| Nine Months Ended September 30, |
| |||||||||||||||
|
| 2019 |
|
| 2018 |
|
| 2019 |
|
| 2018 |
|
| 2019 |
|
| 2018 |
| ||||||
Service cost |
| $ | (3 | ) |
| $ | (4 | ) |
| $ | (3 | ) |
| $ | (4 | ) |
| $ | (9 | ) |
| $ | (11 | ) |
Interest cost |
|
| (5 | ) |
|
| (4 | ) |
|
| (4 | ) |
|
| (4 | ) |
|
| (13 | ) |
|
| (13 | ) |
Expected return on plan assets |
|
| 13 |
|
|
| 15 |
|
|
| 12 |
|
|
| 14 |
|
|
| 38 |
|
|
| 43 |
|
Amortization of actuarial loss |
|
| (5 | ) |
|
| (4 | ) |
|
| (6 | ) |
|
| (4 | ) |
|
| (18 | ) |
|
| (12 | ) |
Amortization of prior service gain |
|
| 1 |
|
|
| — |
|
|
| 2 |
|
|
| 2 |
| ||||||||
Settlement loss |
|
| (1 | ) |
|
| — |
|
|
| (3 | ) |
|
| (2 | ) |
|
| (4 | ) |
|
| (2 | ) |
Total net periodic pension (cost) income |
| $ | (1 | ) |
| $ | 3 |
|
| $ | (3 | ) |
| $ | — |
|
| $ | (4 | ) |
| $ | 7 |
|
|
|
|
|
|
|
|
|
|
|
|
|
|
|
|
|
|
|
|
|
|
|
|
|
|
Net loss |
| $ | — |
|
| $ | — |
|
| $ | (3 | ) |
| $ | — |
| ||||||||
Prior service benefit |
|
| — |
|
|
| — |
|
|
| 5 |
|
|
| — |
| ||||||||
Amortization of prior service gain |
|
| (1 | ) |
|
| — |
|
|
| (2 | ) |
|
| (1 | ) | ||||||||
Amortization of actuarial loss |
| $ | 5 |
|
| $ | 4 |
|
|
| 6 |
|
|
| 4 |
|
|
| 18 |
|
|
| 11 |
|
Settlement loss |
|
| 1 |
|
|
| — |
|
|
| 3 |
|
|
| 2 |
|
|
| 4 |
|
|
| 2 |
|
Effect of foreign exchange rates |
|
| 3 |
|
|
| (9 | ) |
|
| 9 |
|
|
| (2 | ) |
|
| 10 |
|
|
| 3 |
|
Benefit recognized in other comprehensive income |
|
| 17 |
|
|
| 4 |
|
|
| 32 |
|
|
| 15 |
| ||||||||
Total changes in plan assets and benefit obligations recognized in other comprehensive income |
| $ | 9 |
|
| $ | (5 | ) |
| $ | 14 |
|
| $ | 4 |
|
| $ | 28 |
|
| $ | 22 |
|
The Company made cash contributions of $6$2 and $4$15 to its defined benefit pension plans during the three and nine months ended March 31,September 30, 2019, respectively, and $4 and $12 for the three and nine months ended September 30, 2018, respectively, and expects to make additional cash contributions of $11$6 to its defined benefit pension plans during the remainder of 2019.
Note 24. Segment Information
Chemours’ reportable segments are Fluoroproducts, Chemical Solutions, and Titanium Technologies. Corporate costs and certain legal and environmental expenses, stock-based compensation expenses, and foreign exchange gains and losses arising from the remeasurement of balances in currencies other than the functional currency of the Company’s legal entities are reflected in Corporate and Other.
Segment net sales include transfers to another reportable segment. Certain products are transferred between segments on a basis intended to reflect, as nearly as practicable, the market value of the products. These product transfers were limited and were not significant for each of the periods presented. Depreciation and amortization includes depreciation on research and development facilities and the amortization of other intangible assets, excluding any write-downs of assets.
Adjusted earnings before interest, taxes, depreciation, and amortization (“Adjusted EBITDA”) is the primary measure of segment profitability used by the Company’s Chief Operating Decision Maker and is defined as income (loss) before income taxes, excluding the following:
| • | interest expense, depreciation, and amortization; |
| • | non-operating pension and other post-retirement employee benefit costs, which represents the components of net periodic pension (income) costs excluding the service cost component; |
| • | exchange (gains) losses included in other income (expense), net; |
| • | restructuring, asset-related, and other charges; |
| • | asset impairments; |
| • | (gains) losses on sales of assets and businesses; and, |
| • | other items not considered indicative of the Company’s ongoing operational performance and expected to occur infrequently. |
3035
The Chemours Company
Notes to the Interim Consolidated Financial Statements (Unaudited)
(Dollars in millions, except per share amounts)
The following table sets forth certain summary financial information for the Company’s reportable segments and Corporate and Other for the three and nine months ended March 31,September 30, 2019 and 2018.
Three Months Ended March 31, |
| Fluoroproducts |
|
| Chemical Solutions |
|
| Titanium Technologies |
|
| Corporate and Other |
|
| Total |
| |||||||||||||||||||||
Three Months Ended September 30, |
| Fluoroproducts |
|
| Chemical Solutions |
|
| Titanium Technologies |
|
| Segment Total |
| ||||||||||||||||||||||||
2019 |
|
|
|
|
|
|
|
|
|
|
|
|
|
|
|
|
|
|
|
|
|
|
|
|
|
|
|
|
|
|
|
|
|
|
|
|
Net sales to external customers |
| $ | 687 |
|
| $ | 134 |
|
| $ | 555 |
|
| $ | — |
|
| $ | 1,376 |
|
| $ | 636 |
|
| $ | 140 |
|
| $ | 614 |
|
| $ | 1,390 |
|
Adjusted EBITDA |
|
| 159 |
|
|
| 15 |
|
|
| 126 |
|
|
| (38 | ) |
|
| 262 |
|
|
| 122 |
|
|
| 23 |
|
|
| 137 |
|
|
| 282 |
|
Depreciation and amortization |
|
| 32 |
|
|
| 6 |
|
|
| 30 |
|
|
| 8 |
|
|
| 76 |
|
|
| 34 |
|
|
| 5 |
|
|
| 30 |
|
|
| 69 |
|
|
|
|
|
|
|
|
|
|
|
|
|
|
|
|
|
|
|
|
|
|
|
|
|
|
|
|
|
|
|
|
|
|
|
|
|
|
2018 |
|
|
|
|
|
|
|
|
|
|
|
|
|
|
|
|
|
|
|
|
|
|
|
|
|
|
|
|
|
|
|
|
|
|
|
|
Net sales to external customers |
| $ | 732 |
|
| $ | 144 |
|
| $ | 854 |
|
| $ | — |
|
| $ | 1,730 |
|
| $ | 682 |
|
| $ | 155 |
|
| $ | 791 |
|
| $ | 1,628 |
|
Adjusted EBITDA |
|
| 206 |
|
|
| 11 |
|
|
| 294 |
|
|
| (43 | ) |
|
| 468 |
|
|
| 182 |
|
|
| 24 |
|
|
| 268 |
|
|
| 474 |
|
Depreciation and amortization |
|
| 28 |
|
|
| 5 |
|
|
| 30 |
|
|
| 7 |
|
|
| 70 |
|
|
| 28 |
|
|
| 5 |
|
|
| 30 |
|
|
| 63 |
|
|
|
|
|
|
|
|
|
|
|
|
|
|
|
|
|
| ||||||||||||||||||||
Nine Months Ended September 30, |
| Fluoroproducts |
|
| Chemical Solutions |
|
| Titanium Technologies |
|
| Segment Total |
| ||||||||||||||||||||||||
2019 |
|
|
|
|
|
|
|
|
|
|
|
|
|
|
|
| ||||||||||||||||||||
Net sales to external customers |
| $ | 2,034 |
|
| $ | 404 |
|
| $ | 1,735 |
|
| $ | 4,173 |
| ||||||||||||||||||||
Adjusted EBITDA |
|
| 461 |
|
|
| 55 |
|
|
| 390 |
|
|
| 906 |
| ||||||||||||||||||||
Depreciation and amortization |
|
| 100 |
|
|
| 18 |
|
|
| 90 |
|
|
| 208 |
| ||||||||||||||||||||
|
|
|
|
|
|
|
|
|
|
|
|
|
|
|
|
| ||||||||||||||||||||
2018 |
|
|
|
|
|
|
|
|
|
|
|
|
|
|
|
| ||||||||||||||||||||
Net sales to external customers |
| $ | 2,213 |
|
| $ | 453 |
|
| $ | 2,508 |
|
| $ | 5,174 |
| ||||||||||||||||||||
Adjusted EBITDA |
|
| 619 |
|
|
| 50 |
|
|
| 856 |
|
|
| 1,525 |
| ||||||||||||||||||||
Depreciation and amortization |
|
| 87 |
|
|
| 15 |
|
|
| 90 |
|
|
| 192 |
| ||||||||||||||||||||
Corporate and Other depreciation and amortization expense amounted to $8 and $24 for the three and nine months ended September 30, 2019, respectively, and $8 and $21 for the three and nine months ended September 30, 2018, respectively.
The following table sets forth a reconciliation of segment Adjusted EBITDA to the Company’s consolidated net income before income taxes for the three and nine months ended March 31,September 30, 2019 and 2018.
|
| Three Months Ended March 31, |
|
| Three Months Ended September 30, |
|
| Nine Months Ended September 30, |
| |||||||||||||||
|
| 2019 |
|
| 2018 |
|
| 2019 |
|
| 2018 |
|
| 2019 |
|
| 2018 |
| ||||||
Income before income taxes |
| $ | 107 |
|
| $ | 381 |
| ||||||||||||||||
Segment Adjusted EBITDA |
| $ | 282 |
|
| $ | 474 |
|
| $ | 906 |
|
| $ | 1,525 |
| ||||||||
Corporate and Other Adjusted EBITDA |
|
| (34 | ) |
|
| (39 | ) |
|
| (113 | ) |
|
| (126 | ) | ||||||||
Interest expense, net |
|
| 51 |
|
|
| 52 |
|
|
| (53 | ) |
|
| (47 | ) |
|
| (156 | ) |
|
| (148 | ) |
Depreciation and amortization |
|
| 76 |
|
|
| 70 |
|
|
| (78 | ) |
|
| (71 | ) |
|
| (232 | ) |
|
| (213 | ) |
Non-operating pension and other post-retirement employee benefit income |
|
| (3 | ) |
|
| (7 | ) | ||||||||||||||||
Exchange gains, net |
|
| (6 | ) |
|
| — |
| ||||||||||||||||
Non-operating pension and other post-retirement employee benefit (cost) income |
|
| (1 | ) |
|
| 4 |
|
|
| 5 |
|
|
| 18 |
| ||||||||
Exchange gains (losses), net |
|
| 5 |
|
|
| (6 | ) |
|
| 2 |
|
|
| (4 | ) | ||||||||
Restructuring, asset-related, and other charges (1) |
|
| 8 |
|
|
| 10 |
|
|
| (34 | ) |
|
| (12 | ) |
|
| (49 | ) |
|
| (32 | ) |
Loss on extinguishment of debt |
|
| — |
|
|
| — |
|
|
| — |
|
|
| (38 | ) | ||||||||
Gain on sales of assets and businesses (2) |
|
| — |
|
|
| (42 | ) |
|
| 9 |
|
|
| — |
|
|
| 11 |
|
|
| 45 |
|
Transaction costs |
|
| — |
|
|
| — |
|
|
| (1 | ) |
|
| (9 | ) | ||||||||
Legal charges (3) |
|
| 29 |
|
|
| 4 |
|
|
| (5 | ) |
|
| (34 | ) |
|
| (43 | ) |
|
| (45 | ) |
Adjusted EBITDA |
| $ | 262 |
|
| $ | 468 |
| ||||||||||||||||
Income before income taxes |
| $ | 91 |
|
| $ | 269 |
|
| $ | 330 |
|
| $ | 973 |
| ||||||||
| (1) | Includes restructuring, asset-related, and other charges, which are discussed in further detail in “Note 5 – Restructuring, Asset-related, and Other Charges.” |
| (2) | For the three and nine months ended |
| (3) | Includes litigation settlements, PFOA drinking water treatment accruals, and other legal charges. For the three and nine months ended |
Note 25. Subsequent Event
The Company repurchased an additional 1,387,241 shares of its issued and outstanding common stock under the 2018 Share Repurchase Program subsequent to March 31, 2019, which amounted to $53 at an average share price of $38.51 per share.
3136
The Chemours Company
Notes to the Interim Consolidated Financial Statements (Unaudited)
(Dollars in millions, except per share amounts)
Note 26.25. Guarantor Condensed Consolidating Financial Information
The following guarantor condensed consolidating financial information is included in accordance with Rule 3-10 of Regulation S-X (“Rule 3-10”) in connection with the subsidiary guarantees of the “Notes” (collectively, the 6.625% senior unsecured notes due May 2023, the 7.000% senior unsecured notes due May 2025, the 4.000% senior unsecured notes due May 2026, which are denominated in euros, and the 5.375% senior unsecured notes due May 2027), in each case, issued by The Chemours Company (“Parent Issuer”). As of the dates indicated, each series of the Notes was fully and unconditionally guaranteed, jointly and severally, on a senior unsecured basis, subject to certain exceptions, by the same group of subsidiaries of the Parent Issuer (together, “Guarantor Subsidiaries”). Each of the Guarantor Subsidiaries is 100% owned by the Company. None of the other subsidiaries of the Company, either direct or indirect, guarantee the Notes (together, “Non-Guarantor Subsidiaries”). Pursuant to the indentures governing the Notes, the Guarantor Subsidiaries will be automatically released from those guarantees upon the occurrence of certain customary release provisions.
The following condensed consolidating financial information is presented to comply with the Company’s requirements under Rule 3-10:
| • | the condensed consolidating statements of comprehensive income for the three and nine months ended |
| • | the condensed consolidating balance sheets at |
| • | the condensed consolidating statements of cash flows for the |
The following guarantor condensed consolidating financial information is presented using the equity method of accounting for the Company’s investments in its wholly-owned subsidiaries. Under the equity method, the investments in subsidiaries are recorded at cost and adjusted for the Company’s share of its subsidiaries’ cumulative results of operations, capital contributions, distributions, and other equity changes. The elimination entries principally eliminate investments in subsidiaries and intercompany balances and transactions. The financial information included herein may not necessarily be indicative of the financial positions, results of operations, or cash flows of the Company’s subsidiaries had they operated as independent entities, and should be read in conjunction with the interim consolidated financial statements and the related notes thereto.
3237
The Chemours Company
Notes to the Interim Consolidated Financial Statements (Unaudited)
(Dollars in millions, except per share amounts)
Condensed Consolidating Statements of Comprehensive Income
| Three Months Ended September 30, 2019 |
| ||||||||||||||||||||||||||||||||||||
| Parent Issuer |
|
| Guarantor Subsidiaries |
|
| Non-Guarantor Subsidiaries |
|
| Eliminations and Adjustments |
|
| Consolidated |
| ||||||||||||||||||||||||
Net sales | $ | — |
|
| $ | 810 |
|
| $ | 910 |
|
| $ | (330 | ) |
| $ | 1,390 |
| |||||||||||||||||||
Cost of goods sold |
| — |
|
|
| 739 |
|
|
| 693 |
|
|
| (336 | ) |
|
| 1,096 |
| |||||||||||||||||||
Gross profit |
| — |
|
|
| 71 |
|
|
| 217 |
|
|
| 6 |
|
|
| 294 |
| |||||||||||||||||||
Selling, general, and administrative expense |
| 4 |
|
|
| 96 |
|
|
| 34 |
|
|
| (4 | ) |
|
| 130 |
| |||||||||||||||||||
Research and development expense |
| — |
|
|
| 18 |
|
|
| 2 |
|
|
| — |
|
|
| 20 |
| |||||||||||||||||||
Restructuring, asset-related, and other charges |
| — |
|
|
| 22 |
|
|
| 12 |
|
|
| — |
|
|
| 34 |
| |||||||||||||||||||
Total other operating expenses |
| 4 |
|
|
| 136 |
|
|
| 48 |
|
|
| (4 | ) |
|
| 184 |
| |||||||||||||||||||
Equity in earnings of affiliates |
| — |
|
|
| — |
|
|
| 9 |
|
|
| — |
|
|
| 9 |
| |||||||||||||||||||
Equity in earnings (loss) of subsidiaries |
| 106 |
|
|
| (1 | ) |
|
| — |
|
|
| (105 | ) |
|
| — |
| |||||||||||||||||||
Interest expense, net |
| (52 | ) |
|
| — |
|
|
| (1 | ) |
|
| — |
|
|
| (53 | ) | |||||||||||||||||||
Intercompany interest income (expense), net |
| 11 |
|
|
| 4 |
|
|
| (15 | ) |
|
| — |
|
|
| — |
| |||||||||||||||||||
Other income (expense), net |
| 6 |
|
|
| 40 |
|
|
| (17 | ) |
|
| (4 | ) |
|
| 25 |
| |||||||||||||||||||
Income before income taxes |
| 67 |
|
|
| (22 | ) |
|
| 145 |
|
|
| (99 | ) |
|
| 91 |
| |||||||||||||||||||
(Benefit from) provision for income taxes |
| (9 | ) |
|
| (6 | ) |
|
| 30 |
|
|
| — |
|
|
| 15 |
| |||||||||||||||||||
Net income (loss) |
| 76 |
|
|
| (16 | ) |
|
| 115 |
|
|
| (99 | ) |
|
| 76 |
| |||||||||||||||||||
Net income (loss) attributable to Chemours | $ | 76 |
|
| $ | (16 | ) |
| $ | 115 |
|
| $ | (99 | ) |
| $ | 76 |
| |||||||||||||||||||
Comprehensive income attributable to Chemours | $ | 51 |
|
| $ | (16 | ) |
| $ | 65 |
|
| $ | (49 | ) |
| $ | 51 |
| |||||||||||||||||||
|
|
|
|
|
|
|
|
|
|
|
|
|
|
|
|
|
|
|
| |||||||||||||||||||
| Three Months Ended March 31, 2019 |
| Nine Months Ended September 30, 2019 |
| ||||||||||||||||||||||||||||||||||
| Parent Issuer |
|
| Guarantor Subsidiaries |
|
| Non-Guarantor Subsidiaries |
|
| Eliminations and Adjustments |
|
| Consolidated |
| Parent Issuer |
|
| Guarantor Subsidiaries |
|
| Non-Guarantor Subsidiaries |
|
| Eliminations and Adjustments |
|
| Consolidated |
| ||||||||||
Net sales | $ | — |
|
| $ | 877 |
|
| $ | 898 |
|
| $ | (399 | ) |
| $ | 1,376 |
| $ | — |
|
| $ | 2,544 |
|
| $ | 2,718 |
|
| $ | (1,089 | ) |
| $ | 4,173 |
|
Cost of goods sold |
| — |
|
|
| 741 |
|
|
| 737 |
|
|
| (398 | ) |
|
| 1,080 |
|
| — |
|
|
| 2,215 |
|
|
| 2,138 |
|
|
| (1,093 | ) |
|
| 3,260 |
|
Gross profit |
| — |
|
|
| 136 |
|
|
| 161 |
|
|
| (1 | ) |
|
| 296 |
|
| — |
|
|
| 329 |
|
|
| 580 |
|
|
| 4 |
|
|
| 913 |
|
Selling, general, and administrative expense |
| 8 |
|
|
| 117 |
|
|
| 38 |
|
|
| (7 | ) |
|
| 156 |
|
| 19 |
|
|
| 314 |
|
|
| 108 |
|
|
| (18 | ) |
|
| 423 |
|
Research and development expense |
| — |
|
|
| 20 |
|
|
| 2 |
|
|
| — |
|
|
| 22 |
|
| — |
|
|
| 56 |
|
|
| 5 |
|
|
| — |
|
|
| 61 |
|
Restructuring, asset-related, and other charges |
| — |
|
|
| 8 |
|
|
| — |
|
|
| — |
|
|
| 8 |
|
| — |
|
|
| 37 |
|
|
| 12 |
|
|
| — |
|
|
| 49 |
|
Total other operating expenses |
| 8 |
|
|
| 145 |
|
|
| 40 |
|
|
| (7 | ) |
|
| 186 |
|
| 19 |
|
|
| 407 |
|
|
| 125 |
|
|
| (18 | ) |
|
| 533 |
|
Equity in earnings of affiliates |
| — |
|
|
| — |
|
|
| 8 |
|
|
| — |
|
|
| 8 |
|
| — |
|
|
| — |
|
|
| 25 |
|
|
| — |
|
|
| 25 |
|
Equity in earnings (loss) of subsidiaries |
| 127 |
|
|
| (2 | ) |
|
| — |
|
|
| (125 | ) |
|
| — |
|
| 364 |
|
|
| (3 | ) |
|
| — |
|
|
| (361 | ) |
|
| — |
|
Interest (expense) income, net |
| (53 | ) |
|
| — |
|
|
| 2 |
|
|
| — |
|
|
| (51 | ) |
| (159 | ) |
|
| 1 |
|
|
| 2 |
|
|
| — |
|
|
| (156 | ) |
Intercompany interest income (expense), net |
| 9 |
|
|
| 5 |
|
|
| (14 | ) |
|
| — |
|
|
| — |
|
| 28 |
|
|
| 13 |
|
|
| (41 | ) |
|
| — |
|
|
| — |
|
Other income, net |
| 9 |
|
|
| 34 |
|
|
| 4 |
|
|
| (7 | ) |
|
| 40 |
| |||||||||||||||||||
Other income (expense), net |
| 20 |
|
|
| 108 |
|
|
| (29 | ) |
|
| (18 | ) |
|
| 81 |
| |||||||||||||||||||
Income before income taxes |
| 84 |
|
|
| 28 |
|
|
| 121 |
|
|
| (126 | ) |
|
| 107 |
|
| 234 |
|
|
| 41 |
|
|
| 412 |
|
|
| (357 | ) |
|
| 330 |
|
(Benefit from) provision for income taxes |
| (10 | ) |
|
| (1 | ) |
|
| 25 |
|
|
| (1 | ) |
|
| 13 |
|
| (31 | ) |
|
| 7 |
|
|
| 89 |
|
|
| — |
|
|
| 65 |
|
Net income |
| 94 |
|
|
| 29 |
|
|
| 96 |
|
|
| (125 | ) |
|
| 94 |
|
| 265 |
|
|
| 34 |
|
|
| 323 |
|
|
| (357 | ) |
|
| 265 |
|
Net income attributable to Chemours | $ | 94 |
|
| $ | 29 |
|
| $ | 96 |
|
| $ | (125 | ) |
| $ | 94 |
| $ | 265 |
|
| $ | 34 |
|
| $ | 323 |
|
| $ | (357 | ) |
| $ | 265 |
|
Comprehensive income attributable to Chemours | $ | 115 |
|
| $ | 29 |
|
| $ | 110 |
|
| $ | (139 | ) |
| $ | 115 |
| $ | 273 |
|
| $ | 34 |
|
| $ | 304 |
|
| $ | (338 | ) |
| $ | 273 |
|
3338
The Chemours Company
Notes to the Interim Consolidated Financial Statements (Unaudited)
(Dollars in millions, except per share amounts)
Condensed Consolidating Statements of Comprehensive Income
| Three Months Ended September 30, 2018 |
| ||||||||||||||||||||||||||||||||||||
| Parent Issuer |
|
| Guarantor Subsidiaries |
|
| Non-Guarantor Subsidiaries |
|
| Eliminations and Adjustments |
|
| Consolidated |
| ||||||||||||||||||||||||
Net sales | $ | — |
|
| $ | 987 |
|
| $ | 1,103 |
|
| $ | (462 | ) |
| $ | 1,628 |
| |||||||||||||||||||
Cost of goods sold |
| — |
|
|
| 769 |
|
|
| 834 |
|
|
| (452 | ) |
|
| 1,151 |
| |||||||||||||||||||
Gross profit |
| — |
|
|
| 218 |
|
|
| 269 |
|
|
| (10 | ) |
|
| 477 |
| |||||||||||||||||||
Selling, general, and administrative expense |
| 5 |
|
|
| 122 |
|
|
| 40 |
|
|
| (4 | ) |
|
| 163 |
| |||||||||||||||||||
Research and development expense |
| — |
|
|
| 18 |
|
|
| 2 |
|
|
| — |
|
|
| 20 |
| |||||||||||||||||||
Restructuring, asset-related, and other charges |
| — |
|
|
| 12 |
|
|
| — |
|
|
| — |
|
|
| 12 |
| |||||||||||||||||||
Total other operating expenses |
| 5 |
|
|
| 152 |
|
|
| 42 |
|
|
| (4 | ) |
|
| 195 |
| |||||||||||||||||||
Equity in earnings of affiliates |
| — |
|
|
| — |
|
|
| 10 |
|
|
| — |
|
|
| 10 |
| |||||||||||||||||||
Equity in earnings (loss) of subsidiaries |
| 308 |
|
|
| (1 | ) |
|
| — |
|
|
| (307 | ) |
|
| — |
| |||||||||||||||||||
Interest (expense) income, net |
| (51 | ) |
|
| 1 |
|
|
| 3 |
|
|
| — |
|
|
| (47 | ) | |||||||||||||||||||
Intercompany interest income (expense), net |
| 13 |
|
|
| 3 |
|
|
| (16 | ) |
|
| — |
|
|
| — |
| |||||||||||||||||||
Loss on extinguishment of debt |
| — |
|
|
| — |
|
|
| — |
|
|
| — |
|
|
| — |
| |||||||||||||||||||
Other income (expense), net |
| 2 |
|
|
| 52 |
|
|
| (26 | ) |
|
| (4 | ) |
|
| 24 |
| |||||||||||||||||||
Income before income taxes |
| 267 |
|
|
| 121 |
|
|
| 198 |
|
|
| (317 | ) |
|
| 269 |
| |||||||||||||||||||
(Benefit from) provision for income taxes |
| (8 | ) |
|
| (31 | ) |
|
| 33 |
|
|
| — |
|
|
| (6 | ) | |||||||||||||||||||
Net income |
| 275 |
|
|
| 152 |
|
|
| 165 |
|
|
| (317 | ) |
|
| 275 |
| |||||||||||||||||||
Less: Net income attributable to non-controlling interests |
| — |
|
|
| — |
|
|
| — |
|
|
| — |
|
|
| — |
| |||||||||||||||||||
Net income attributable to Chemours | $ | 275 |
|
| $ | 152 |
|
| $ | 165 |
|
| $ | (317 | ) |
| $ | 275 |
| |||||||||||||||||||
Comprehensive income attributable to Chemours | $ | 304 |
|
| $ | 152 |
|
| $ | 202 |
|
| $ | (354 | ) |
| $ | 304 |
| |||||||||||||||||||
|
|
|
|
|
|
|
|
|
|
|
|
|
|
|
|
|
|
|
| |||||||||||||||||||
| Three Months Ended March 31, 2018 |
| Nine Months Ended September 30, 2018 |
| ||||||||||||||||||||||||||||||||||
| Parent Issuer |
|
| Guarantor Subsidiaries |
|
| Non-Guarantor Subsidiaries |
|
| Eliminations and Adjustments |
|
| Consolidated |
| Parent Issuer |
|
| Guarantor Subsidiaries |
|
| Non-Guarantor Subsidiaries |
|
| Eliminations and Adjustments |
|
| Consolidated |
| ||||||||||
Net sales | $ | — |
|
| $ | 1,017 |
|
| $ | 1,174 |
|
| $ | (461 | ) |
| $ | 1,730 |
| $ | — |
|
| $ | 3,071 |
|
| $ | 3,493 |
|
| $ | (1,390 | ) |
| $ | 5,174 |
|
Cost of goods sold |
| — |
|
|
| 798 |
|
|
| 871 |
|
|
| (476 | ) |
|
| 1,193 |
|
| — |
|
|
| 2,403 |
|
|
| 2,590 |
|
|
| (1,390 | ) |
|
| 3,603 |
|
Gross profit |
| — |
|
|
| 219 |
|
|
| 303 |
|
|
| 15 |
|
|
| 537 |
|
| — |
|
|
| 668 |
|
|
| 903 |
|
|
| — |
|
|
| 1,571 |
|
Selling, general, and administrative expense |
| 10 |
|
|
| 102 |
|
|
| 40 |
|
|
| (9 | ) |
|
| 143 |
|
| 28 |
|
|
| 339 |
|
|
| 119 |
|
|
| (20 | ) |
|
| 466 |
|
Research and development expense |
| — |
|
|
| 19 |
|
|
| 1 |
|
|
| — |
|
|
| 20 |
|
| — |
|
|
| 56 |
|
|
| 5 |
|
|
| — |
|
|
| 61 |
|
Restructuring, asset-related, and other charges |
| — |
|
|
| 9 |
|
|
| 1 |
|
|
| — |
|
|
| 10 |
|
| — |
|
|
| 31 |
|
|
| 1 |
|
|
| — |
|
|
| 32 |
|
Total other operating expenses |
| 10 |
|
|
| 130 |
|
|
| 42 |
|
|
| (9 | ) |
|
| 173 |
|
| 28 |
|
|
| 426 |
|
|
| 125 |
|
|
| (20 | ) |
|
| 559 |
|
Equity in earnings of affiliates |
| — |
|
|
| — |
|
|
| 12 |
|
|
| — |
|
|
| 12 |
|
| — |
|
|
| — |
|
|
| 32 |
|
|
| — |
|
|
| 32 |
|
Equity in earnings of subsidiaries |
| 331 |
|
|
| — |
|
|
| — |
|
|
| (331 | ) |
|
| — |
|
| 983 |
|
|
| 2 |
|
|
| — |
|
|
| (985 | ) |
|
| — |
|
Interest (expense) income, net |
| (56 | ) |
|
| 2 |
|
|
| 2 |
|
|
| — |
|
|
| (52 | ) |
| (159 | ) |
|
| 2 |
|
|
| 9 |
|
|
| — |
|
|
| (148 | ) |
Intercompany interest income (expense), net |
| 13 |
|
|
| 1 |
|
|
| (14 | ) |
|
| — |
|
|
| — |
|
| 35 |
|
|
| 6 |
|
|
| (41 | ) |
|
| — |
|
|
| — |
|
Loss on extinguishment of debt |
| (38 | ) |
|
| — |
|
|
| — |
|
|
| — |
|
|
| (38 | ) | |||||||||||||||||||
Other income (expense), net |
| 9 |
|
|
| 73 |
|
|
| (16 | ) |
|
| (9 | ) |
|
| 57 |
|
| 22 |
|
|
| 146 |
|
|
| (33 | ) |
|
| (20 | ) |
|
| 115 |
|
Income before income taxes |
| 287 |
|
|
| 165 |
|
|
| 245 |
|
|
| (316 | ) |
|
| 381 |
|
| 815 |
|
|
| 398 |
|
|
| 745 |
|
|
| (985 | ) |
|
| 973 |
|
(Benefit from) provision for income taxes |
| (10 | ) |
|
| 50 |
|
|
| 45 |
|
|
| (1 | ) |
|
| 84 |
|
| (39 | ) |
|
| 31 |
|
|
| 127 |
|
|
| — |
|
|
| 119 |
|
Net income |
| 297 |
|
|
| 115 |
|
|
| 200 |
|
|
| (315 | ) |
|
| 297 |
|
| 854 |
|
|
| 367 |
|
|
| 618 |
|
|
| (985 | ) |
|
| 854 |
|
Less: Net income attributable to non-controlling interests |
| — |
|
|
| — |
|
|
| 1 |
|
|
| — |
|
|
| 1 |
| |||||||||||||||||||
Net income attributable to Chemours | $ | 297 |
|
| $ | 115 |
|
| $ | 200 |
|
| $ | (315 | ) |
| $ | 297 |
| $ | 854 |
|
| $ | 367 |
|
| $ | 617 |
|
| $ | (985 | ) |
| $ | 853 |
|
Comprehensive income attributable to Chemours | $ | 373 |
|
| $ | 117 |
|
| $ | 299 |
|
| $ | (416 | ) |
| $ | 373 |
| $ | 855 |
|
| $ | 367 |
|
| $ | 618 |
|
| $ | (985 | ) |
| $ | 855 |
|
3439
The Chemours Company
Notes to the Interim Consolidated Financial Statements (Unaudited)
(Dollars in millions, except per share amounts)
Condensed Consolidating Balance Sheets
| March 31, 2019 |
| September 30, 2019 |
| ||||||||||||||||||||||||||||||||||
| Parent Issuer |
|
| Guarantor Subsidiaries |
|
| Non-Guarantor Subsidiaries |
|
| Eliminations and Adjustments |
|
| Consolidated |
| Parent Issuer |
|
| Guarantor Subsidiaries |
|
| Non-Guarantor Subsidiaries |
|
| Eliminations and Adjustments |
|
| Consolidated |
| ||||||||||
Assets |
|
|
|
|
|
|
|
|
|
|
|
|
|
|
|
|
|
|
|
|
|
|
|
|
|
|
|
|
|
|
|
|
|
|
|
|
|
|
Current assets: |
|
|
|
|
|
|
|
|
|
|
|
|
|
|
|
|
|
|
|
|
|
|
|
|
|
|
|
|
|
|
|
|
|
|
|
|
|
|
Cash and cash equivalents | $ | — |
|
| $ | 115 |
|
| $ | 582 |
|
| $ | — |
|
| $ | 697 |
| $ | — |
|
| $ | 143 |
|
| $ | 551 |
|
| $ | — |
|
| $ | 694 |
|
Accounts and notes receivable, net |
| — |
|
|
| 305 |
|
|
| 542 |
|
|
| — |
|
|
| 847 |
|
| — |
|
|
| 70 |
|
|
| 762 |
|
|
| — |
|
|
| 832 |
|
Intercompany receivables |
| 18 |
|
|
| 967 |
|
|
| 383 |
|
|
| (1,368 | ) |
|
| — |
|
| 19 |
|
|
| 1,028 |
|
|
| 375 |
|
|
| (1,422 | ) |
|
| — |
|
Inventories |
| — |
|
|
| 581 |
|
|
| 723 |
|
|
| (86 | ) |
|
| 1,218 |
|
| — |
|
|
| 660 |
|
|
| 646 |
|
|
| (83 | ) |
|
| 1,223 |
|
Prepaid expenses and other |
| — |
|
|
| 51 |
|
|
| 29 |
|
|
| 5 |
|
|
| 85 |
|
| — |
|
|
| 57 |
|
|
| 17 |
|
|
| 4 |
|
|
| 78 |
|
Total current assets |
| 18 |
|
|
| 2,019 |
|
|
| 2,259 |
|
|
| (1,449 | ) |
|
| 2,847 |
|
| 19 |
|
|
| 1,958 |
|
|
| 2,351 |
|
|
| (1,501 | ) |
|
| 2,827 |
|
Property, plant, and equipment |
| — |
|
|
| 6,956 |
|
|
| 2,133 |
|
|
| — |
|
|
| 9,089 |
|
| — |
|
|
| 7,074 |
|
|
| 2,200 |
|
|
| — |
|
|
| 9,274 |
|
Less: Accumulated depreciation |
| — |
|
|
| (4,596 | ) |
|
| (1,114 | ) |
|
| — |
|
|
| (5,710 | ) |
| — |
|
|
| (4,632 | ) |
|
| (1,122 | ) |
|
| — |
|
|
| (5,754 | ) |
Property, plant, and equipment, net |
| — |
|
|
| 2,360 |
|
|
| 1,019 |
|
|
| — |
|
|
| 3,379 |
|
| — |
|
|
| 2,442 |
|
|
| 1,078 |
|
|
| — |
|
|
| 3,520 |
|
Operating lease right-of-use assets |
| — |
|
|
| 300 |
|
|
| 23 |
|
|
| — |
|
|
| 323 |
|
| — |
|
|
| 284 |
|
|
| 23 |
|
|
| — |
|
|
| 307 |
|
Goodwill and other intangible assets, net |
| — |
|
|
| 165 |
|
|
| 15 |
|
|
| — |
|
|
| 180 |
|
| — |
|
|
| 162 |
|
|
| 14 |
|
|
| — |
|
|
| 176 |
|
Investments in affiliates |
| — |
|
|
| — |
|
|
| 166 |
|
|
| — |
|
|
| 166 |
|
| — |
|
|
| — |
|
|
| 184 |
|
|
| — |
|
|
| 184 |
|
Investments in subsidiaries |
| 4,576 |
|
|
| — |
|
|
| — |
|
|
| (4,576 | ) |
|
| — |
|
| 4,339 |
|
|
| 149 |
|
|
| — |
|
|
| (4,488 | ) |
|
| — |
|
Intercompany notes receivable |
| 1,150 |
|
|
| — |
|
|
| — |
|
|
| (1,150 | ) |
|
| — |
|
| 1,250 |
|
|
| — |
|
|
| — |
|
|
| (1,250 | ) |
|
| — |
|
Other assets |
| 17 |
|
|
| 141 |
|
|
| 281 |
|
|
| (9 | ) |
|
| 430 |
|
| 7 |
|
|
| 151 |
|
|
| 283 |
|
|
| 1 |
|
|
| 442 |
|
Total assets | $ | 5,761 |
|
| $ | 4,985 |
|
| $ | 3,763 |
|
| $ | (7,184 | ) |
| $ | 7,325 |
| $ | 5,615 |
|
| $ | 5,146 |
|
| $ | 3,933 |
|
| $ | (7,238 | ) |
| $ | 7,456 |
|
Liabilities |
|
|
|
|
|
|
|
|
|
|
|
|
|
|
|
|
|
|
|
|
|
|
|
|
|
|
|
|
|
|
|
|
|
|
|
|
|
|
Current liabilities: |
|
|
|
|
|
|
|
|
|
|
|
|
|
|
|
|
|
|
|
|
|
|
|
|
|
|
|
|
|
|
|
|
|
|
|
|
|
|
Accounts payable | $ | — |
|
| $ | 603 |
|
| $ | 439 |
|
| $ | — |
|
| $ | 1,042 |
| $ | — |
|
| $ | 598 |
|
| $ | 350 |
|
| $ | — |
|
| $ | 948 |
|
Current maturities of long-term debt |
| 13 |
|
|
| — |
|
|
| — |
|
|
| — |
|
|
| 13 |
| |||||||||||||||||||
Short-term and current maturities of long-term debt |
| 13 |
|
|
| 10 |
|
|
| 126 |
|
|
| — |
|
|
| 149 |
| |||||||||||||||||||
Intercompany payables |
| 970 |
|
|
| 103 |
|
|
| 295 |
|
|
| (1,368 | ) |
|
| — |
|
| 841 |
|
|
| 205 |
|
|
| 376 |
|
|
| (1,422 | ) |
|
| — |
|
Other accrued liabilities |
| 68 |
|
|
| 297 |
|
|
| 153 |
|
|
| (1 | ) |
|
| 517 |
|
| 61 |
|
|
| 307 |
|
|
| 179 |
|
|
| (1 | ) |
|
| 546 |
|
Total current liabilities |
| 1,051 |
|
|
| 1,003 |
|
|
| 887 |
|
|
| (1,369 | ) |
|
| 1,572 |
|
| 915 |
|
|
| 1,120 |
|
|
| 1,031 |
|
|
| (1,423 | ) |
|
| 1,643 |
|
Long-term debt, net |
| 3,891 |
|
|
| 74 |
|
|
| — |
|
|
| — |
|
|
| 3,965 |
|
| 3,862 |
|
|
| 92 |
|
|
| 53 |
|
|
| — |
|
|
| 4,007 |
|
Operating lease liabilities |
| — |
|
|
| 251 |
|
|
| 14 |
|
|
| — |
|
|
| 265 |
|
| — |
|
|
| 240 |
|
|
| 14 |
|
|
| — |
|
|
| 254 |
|
Intercompany notes payable |
| — |
|
|
| — |
|
|
| 1,150 |
|
|
| (1,150 | ) |
|
| — |
|
| — |
|
|
| — |
|
|
| 1,250 |
|
|
| (1,250 | ) |
|
| — |
|
Deferred income taxes |
| 9 |
|
|
| 135 |
|
|
| 85 |
|
|
| (17 | ) |
|
| 212 |
|
| 1 |
|
|
| 119 |
|
|
| 88 |
|
|
| — |
|
|
| 208 |
|
Other liabilities |
| — |
|
|
| 411 |
|
|
| 84 |
|
|
| — |
|
|
| 495 |
|
| — |
|
|
| 421 |
|
|
| 80 |
|
|
| — |
|
|
| 501 |
|
Total liabilities |
| 4,951 |
|
|
| 1,874 |
|
|
| 2,220 |
|
|
| (2,536 | ) |
|
| 6,509 |
|
| 4,778 |
|
|
| 1,992 |
|
|
| 2,516 |
|
|
| (2,673 | ) |
|
| 6,613 |
|
Commitments and contingent liabilities |
|
|
|
|
|
|
|
|
|
|
|
|
|
|
|
|
|
|
|
|
|
|
|
|
|
|
|
|
|
|
|
|
|
|
|
|
|
|
Equity |
|
|
|
|
|
|
|
|
|
|
|
|
|
|
|
|
|
|
|
|
|
|
|
|
|
|
|
|
|
|
|
|
|
|
|
|
|
|
Total Chemours stockholders’ equity |
| 810 |
|
|
| 3,111 |
|
|
| 1,537 |
|
|
| (4,648 | ) |
|
| 810 |
|
| 837 |
|
|
| 3,154 |
|
|
| 1,411 |
|
|
| (4,565 | ) |
|
| 837 |
|
Non-controlling interests |
| — |
|
|
| — |
|
|
| 6 |
|
|
| — |
|
|
| 6 |
|
| — |
|
|
| — |
|
|
| 6 |
|
|
| — |
|
|
| 6 |
|
Total equity |
| 810 |
|
|
| 3,111 |
|
|
| 1,543 |
|
|
| (4,648 | ) |
|
| 816 |
|
| 837 |
|
|
| 3,154 |
|
|
| 1,417 |
|
|
| (4,565 | ) |
|
| 843 |
|
Total liabilities and equity | $ | 5,761 |
|
| $ | 4,985 |
|
| $ | 3,763 |
|
| $ | (7,184 | ) |
| $ | 7,325 |
| $ | 5,615 |
|
| $ | 5,146 |
|
| $ | 3,933 |
|
| $ | (7,238 | ) |
| $ | 7,456 |
|
3540
The Chemours Company
Notes to the Interim Consolidated Financial Statements (Unaudited)
(Dollars in millions, except per share amounts)
Condensed Consolidating Balance Sheets
| December 31, 2018 |
| |||||||||||||||||
| Parent Issuer |
|
| Guarantor Subsidiaries |
|
| Non-Guarantor Subsidiaries |
|
| Eliminations and Adjustments |
|
| Consolidated |
| |||||
Assets |
|
|
|
|
|
|
|
|
|
|
|
|
|
|
|
|
|
|
|
Current assets: |
|
|
|
|
|
|
|
|
|
|
|
|
|
|
|
|
|
|
|
Cash and cash equivalents | $ | — |
|
| $ | 239 |
|
| $ | 962 |
|
| $ | — |
|
| $ | 1,201 |
|
Accounts and notes receivable, net |
| — |
|
|
| 297 |
|
|
| 564 |
|
|
| — |
|
|
| 861 |
|
Intercompany receivables |
| 2 |
|
|
| 1,057 |
|
|
| 91 |
|
|
| (1,150 | ) |
|
| — |
|
Inventories |
| — |
|
|
| 483 |
|
|
| 749 |
|
|
| (85 | ) |
|
| 1,147 |
|
Prepaid expenses and other |
| — |
|
|
| 58 |
|
|
| 26 |
|
|
| — |
|
|
| 84 |
|
Total current assets |
| 2 |
|
|
| 2,134 |
|
|
| 2,392 |
|
|
| (1,235 | ) |
|
| 3,293 |
|
Property, plant, and equipment |
| — |
|
|
| 6,870 |
|
|
| 2,122 |
|
|
| — |
|
|
| 8,992 |
|
Less: Accumulated depreciation |
| — |
|
|
| (4,591 | ) |
|
| (1,110 | ) |
|
| — |
|
|
| (5,701 | ) |
Property, plant, and equipment, net |
| — |
|
|
| 2,279 |
|
|
| 1,012 |
|
|
| — |
|
|
| 3,291 |
|
Goodwill and other intangible assets, net |
| — |
|
|
| 167 |
|
|
| 14 |
|
|
| — |
|
|
| 181 |
|
Investments in affiliates |
| — |
|
|
| — |
|
|
| 160 |
|
|
| — |
|
|
| 160 |
|
Investments in subsidiaries |
| 4,487 |
|
|
| 11 |
|
|
| — |
|
|
| (4,498 | ) |
|
| — |
|
Intercompany notes receivable |
| 1,150 |
|
|
| — |
|
|
| — |
|
|
| (1,150 | ) |
|
| — |
|
Other assets |
| 17 |
|
|
| 154 |
|
|
| 274 |
|
|
| (8 | ) |
|
| 437 |
|
Total assets | $ | 5,656 |
|
| $ | 4,745 |
|
| $ | 3,852 |
|
| $ | (6,891 | ) |
| $ | 7,362 |
|
Liabilities |
|
|
|
|
|
|
|
|
|
|
|
|
|
|
|
|
|
|
|
Current liabilities: |
|
|
|
|
|
|
|
|
|
|
|
|
|
|
|
|
|
|
|
Accounts payable | $ | — |
|
| $ | 637 |
|
| $ | 500 |
|
| $ | — |
|
| $ | 1,137 |
|
Current maturities of long-term debt |
| 13 |
|
|
| — |
|
|
| — |
|
|
| — |
|
|
| 13 |
|
Intercompany payables |
| 698 |
|
|
| 92 |
|
|
| 360 |
|
|
| (1,150 | ) |
|
| — |
|
Other accrued liabilities |
| 21 |
|
|
| 341 |
|
|
| 198 |
|
|
| (1 | ) |
|
| 559 |
|
Total current liabilities |
| 732 |
|
|
| 1,070 |
|
|
| 1,058 |
|
|
| (1,151 | ) |
|
| 1,709 |
|
Long-term debt, net |
| 3,902 |
|
|
| 57 |
|
|
| — |
|
|
| — |
|
|
| 3,959 |
|
Intercompany notes payable |
| — |
|
|
| — |
|
|
| 1,150 |
|
|
| (1,150 | ) |
|
| — |
|
Deferred income taxes |
| 8 |
|
|
| 143 |
|
|
| 82 |
|
|
| (16 | ) |
|
| 217 |
|
Other liabilities |
| — |
|
|
| 372 |
|
|
| 85 |
|
|
| — |
|
|
| 457 |
|
Total liabilities |
| 4,642 |
|
|
| 1,642 |
|
|
| 2,375 |
|
|
| (2,317 | ) |
|
| 6,342 |
|
Commitments and contingent liabilities |
|
|
|
|
|
|
|
|
|
|
|
|
|
|
|
|
|
|
|
Equity |
|
|
|
|
|
|
|
|
|
|
|
|
|
|
|
|
|
|
|
Total Chemours stockholders’ equity |
| 1,014 |
|
|
| 3,103 |
|
|
| 1,471 |
|
|
| (4,574 | ) |
|
| 1,014 |
|
Non-controlling interests |
| — |
|
|
| — |
|
|
| 6 |
|
|
| — |
|
|
| 6 |
|
Total equity |
| 1,014 |
|
|
| 3,103 |
|
|
| 1,477 |
|
|
| (4,574 | ) |
|
| 1,020 |
|
Total liabilities and equity | $ | 5,656 |
|
| $ | 4,745 |
|
| $ | 3,852 |
|
| $ | (6,891 | ) |
| $ | 7,362 |
|
3641
The Chemours Company
Notes to the Interim Consolidated Financial Statements (Unaudited)
(Dollars in millions, except per share amounts)
Condensed Consolidating Statements of Cash Flows
| Three Months Ended March 31, 2019 |
| Nine Months Ended September 30, 2019 |
| ||||||||||||||||||||||||||||||||||
| Parent Issuer |
|
| Guarantor Subsidiaries |
|
| Non-Guarantor Subsidiaries |
|
| Eliminations and Adjustments |
|
| Consolidated |
| Parent Issuer |
|
| Guarantor Subsidiaries |
|
| Non-Guarantor Subsidiaries |
|
| Eliminations and Adjustments |
|
| Consolidated |
| ||||||||||
Cash flows from operating activities |
|
|
|
|
|
|
|
|
|
|
|
|
|
|
|
|
|
|
|
|
|
|
|
|
|
|
|
|
|
|
|
|
|
|
|
|
|
|
Cash provided by (used for) operating activities | $ | 53 |
|
| $ | (26 | ) |
| $ | (32 | ) |
| $ | (39 | ) |
| $ | (44 | ) | $ | 163 |
|
| $ | (419 | ) |
| $ | 745 |
|
| $ | (239 | ) |
| $ | 250 |
|
Cash flows from investing activities |
|
|
|
|
|
|
|
|
|
|
|
|
|
|
|
|
|
|
|
|
|
|
|
|
|
|
|
|
|
|
|
|
|
|
|
|
|
|
Purchases of property, plant, and equipment |
| — |
|
|
| (113 | ) |
|
| (20 | ) |
|
| — |
|
|
| (133 | ) |
| — |
|
|
| (324 | ) |
|
| (61 | ) |
|
| — |
|
|
| (385 | ) |
Intercompany investing activities |
| — |
|
|
| 16 |
|
|
| (279 | ) |
|
| 263 |
|
|
| — |
|
| — |
|
|
| 37 |
|
|
| (344 | ) |
|
| 307 |
|
|
| — |
|
Foreign exchange contract settlements, net |
| — |
|
|
| (1 | ) |
|
| — |
|
|
| — |
|
|
| (1 | ) | |||||||||||||||||||
Acquisition of business, net |
| — |
|
|
| (10 | ) |
|
| — |
|
|
| — |
|
|
| (10 | ) | |||||||||||||||||||
Proceeds from sales of assets and businesses, net |
| — |
|
|
| 5 |
|
|
| 2 |
|
|
| — |
|
|
| 7 |
| |||||||||||||||||||
Proceeds from life insurance policies |
| — |
|
|
| 1 |
|
|
| — |
|
|
| — |
|
|
| 1 |
| |||||||||||||||||||
Cash used for investing activities |
| — |
|
|
| (98 | ) |
|
| (299 | ) |
|
| 263 |
|
|
| (134 | ) |
| — |
|
|
| (291 | ) |
|
| (403 | ) |
|
| 307 |
|
|
| (387 | ) |
Cash flows from financing activities |
|
|
|
|
|
|
|
|
|
|
|
|
|
|
|
|
|
|
|
|
|
|
|
|
|
|
|
|
|
|
|
|
|
|
|
|
|
|
Proceeds from revolving loan |
| 150 |
|
|
| — |
|
|
| — |
|
|
| — |
|
|
| 150 |
| |||||||||||||||||||
Repayments on revolving loan |
| (150 | ) |
|
| — |
|
|
| — |
|
|
| — |
|
|
| (150 | ) | |||||||||||||||||||
Proceeds from accounts receivable securitization facility |
| — |
|
|
| — |
|
|
| 125 |
|
|
|
|
|
|
| 125 |
| |||||||||||||||||||
Debt repayments |
| (3 | ) |
|
| — |
|
|
| — |
|
|
| — |
|
|
| (3 | ) |
| (10 | ) |
|
| (2 | ) |
|
| (3 | ) |
|
| — |
|
|
| (15 | ) |
Payments on finance leases |
| — |
|
|
| — |
|
|
| (2 | ) |
|
| — |
|
|
| (2 | ) | |||||||||||||||||||
Purchases of treasury stock, at cost |
| (255 | ) |
|
| — |
|
|
| — |
|
|
| — |
|
|
| (255 | ) |
| (322 | ) |
|
| — |
|
|
| — |
|
|
| — |
|
|
| (322 | ) |
Intercompany financing activities |
| 271 |
|
|
| — |
|
|
| (47 | ) |
|
| (224 | ) |
|
| — |
| |||||||||||||||||||
Intercompany financing activities (1) |
| 315 |
|
|
| 616 |
|
|
| (863 | ) |
|
| (68 | ) |
|
| — |
| |||||||||||||||||||
Proceeds from exercised stock options, net |
| 6 |
|
|
| — |
|
|
| — |
|
|
| — |
|
|
| 6 |
|
| 8 |
|
|
| — |
|
|
| — |
|
|
| — |
|
|
| 8 |
|
Payments related to tax withholdings on vested stock awards |
| (30 | ) |
|
| — |
|
|
| — |
|
|
| — |
|
|
| (30 | ) |
| (30 | ) |
|
| — |
|
|
| — |
|
|
| — |
|
|
| (30 | ) |
Payments of dividends |
| (42 | ) |
|
| — |
|
|
| — |
|
|
| — |
|
|
| (42 | ) |
| (124 | ) |
|
| — |
|
|
| — |
|
|
| — |
|
|
| (124 | ) |
Cash used for financing activities |
| (53 | ) |
|
| — |
|
|
| (47 | ) |
|
| (224 | ) |
|
| (324 | ) | |||||||||||||||||||
Cash (used for) provided by financing activities |
| (163 | ) |
|
| 614 |
|
|
| (743 | ) |
|
| (68 | ) |
|
| (360 | ) | |||||||||||||||||||
Effect of exchange rate changes on cash and cash equivalents |
| — |
|
|
| — |
|
|
| (2 | ) |
|
| — |
|
|
| (2 | ) |
| — |
|
|
| — |
|
|
| (10 | ) |
|
| — |
|
|
| (10 | ) |
Decrease in cash and cash equivalents |
| — |
|
|
| (124 | ) |
|
| (380 | ) |
|
| — |
|
|
| (504 | ) |
| — |
|
|
| (96 | ) |
|
| (411 | ) |
|
| — |
|
|
| (507 | ) |
Cash and cash equivalents at January 1, |
| — |
|
|
| 239 |
|
|
| 962 |
|
|
| — |
|
|
| 1,201 |
|
| — |
|
|
| 239 |
|
|
| 962 |
|
|
| — |
|
|
| 1,201 |
|
Cash and cash equivalents at March 31, | $ | — |
|
| $ | 115 |
|
| $ | 582 |
|
| $ | — |
|
| $ | 697 |
| |||||||||||||||||||
Cash and cash equivalents at September 30, | $ | — |
|
| $ | 143 |
|
| $ | 551 |
|
| $ | — |
|
| $ | 694 |
| |||||||||||||||||||
37
(1) | During the nine months ended September 30, 2019, the Company received $494 in collections on its accounts receivable sold into the SPE under the Securitization Facility, which, inclusive of net borrowings, led to a total of $616 received by the SPE and distributed to the Guarantor Subsidiaries during the period. |
42
The Chemours Company
Notes to the Interim Consolidated Financial Statements (Unaudited)
(Dollars in millions, except per share amounts)
Condensed Consolidating Statements of Cash Flows
| Three Months Ended March 31, 2018 |
| Nine Months Ended September 30, 2018 |
| ||||||||||||||||||||||||||||||||||
| Parent Issuer |
|
| Guarantor Subsidiaries |
|
| Non-Guarantor Subsidiaries |
|
| Eliminations and Adjustments |
|
| Consolidated |
| Parent Issuer |
|
| Guarantor Subsidiaries |
|
| Non-Guarantor Subsidiaries |
|
| Eliminations and Adjustments |
|
| Consolidated |
| ||||||||||
Cash flows from operating activities |
|
|
|
|
|
|
|
|
|
|
|
|
|
|
|
|
|
|
|
|
|
|
|
|
|
|
|
|
|
|
|
|
|
|
|
|
|
|
Cash (used for) provided by operating activities | $ | (17 | ) |
| $ | 33 |
|
| $ | 180 |
|
| $ | — |
|
| $ | 196 |
| |||||||||||||||||||
Cash provided by (used for) operating activities | $ | 2 |
|
| $ | (138 | ) |
| $ | 1,017 |
|
| $ | — |
|
| $ | 881 |
| |||||||||||||||||||
Cash flows from investing activities |
|
|
|
|
|
|
|
|
|
|
|
|
|
|
|
|
|
|
|
|
|
|
|
|
|
|
|
|
|
|
|
|
|
|
|
|
|
|
Purchases of property, plant, and equipment |
| — |
|
|
| (80 | ) |
|
| (22 | ) |
|
| — |
|
|
| (102 | ) |
| — |
|
|
| (259 | ) |
|
| (85 | ) |
|
| — |
|
|
| (344 | ) |
Intercompany investing activities |
| — |
|
|
| 76 |
|
|
| (897 | ) |
|
| 821 |
|
|
| — |
| |||||||||||||||||||
Acquisition of business, net |
| — |
|
|
| (37 | ) |
|
| — |
|
|
| — |
|
|
| (37 | ) | |||||||||||||||||||
Proceeds from sales of assets and businesses, net |
| — |
|
|
| 39 |
|
|
| — |
|
|
| — |
|
|
| 39 |
|
| — |
|
|
| 46 |
|
|
| — |
|
|
| — |
|
|
| 46 |
|
Intercompany investing activities |
| — |
|
|
| (288 | ) |
|
| — |
|
|
| 288 |
|
|
| — |
| |||||||||||||||||||
Foreign exchange contract settlements, net |
| — |
|
|
| 5 |
|
|
| — |
|
|
| — |
|
|
| 5 |
|
| — |
|
|
| 8 |
|
|
| — |
|
|
| — |
|
|
| 8 |
|
Cash used for investing activities |
| — |
|
|
| (324 | ) |
|
| (22 | ) |
|
| 288 |
|
|
| (58 | ) |
| — |
|
|
| (166 | ) |
|
| (982 | ) |
|
| 821 |
|
|
| (327 | ) |
Cash flows from financing activities |
|
|
|
|
|
|
|
|
|
|
|
|
|
|
|
|
|
|
|
|
|
|
|
|
|
|
|
|
|
|
|
|
|
|
|
|
|
|
Proceeds from issuance of debt, net |
| 520 |
|
|
| — |
|
|
| — |
|
|
| — |
|
|
| 520 |
| |||||||||||||||||||
Debt repayments |
| (4 | ) |
|
| — |
|
|
| — |
|
|
| — |
|
|
| (4 | ) |
| (675 | ) |
|
| — |
|
|
| — |
|
|
| — |
|
|
| (675 | ) |
Payments related to extinguishment of debt |
| (29 | ) |
|
| — |
|
|
| — |
|
|
| — |
|
|
| (29 | ) | |||||||||||||||||||
Payments of debt issuance costs |
| (12 | ) |
|
| — |
|
|
| — |
|
|
| — |
|
|
| (12 | ) | |||||||||||||||||||
Purchases of treasury stock, at cost |
| (240 | ) |
|
| — |
|
|
| — |
|
|
| — |
|
|
| (240 | ) |
| (520 | ) |
|
| — |
|
|
| — |
|
|
| — |
|
|
| (520 | ) |
Intercompany financing activities |
| 288 |
|
|
| — |
|
|
| — |
|
|
| (288 | ) |
|
| — |
|
| 821 |
|
|
| — |
|
|
| — |
|
|
| (821 | ) |
|
| — |
|
Proceeds from exercised stock options, net |
| 5 |
|
|
| — |
|
|
| — |
|
|
| — |
|
|
| 5 |
|
| 15 |
|
|
| — |
|
|
| — |
|
|
| — |
|
|
| 15 |
|
Payments related to tax withholdings on vested stock awards |
| (1 | ) |
|
| — |
|
|
| — |
|
|
| — |
|
|
| (1 | ) |
| (16 | ) |
|
| — |
|
|
| — |
|
|
| — |
|
|
| (16 | ) |
Payments of dividends |
| (31 | ) |
|
| — |
|
|
| — |
|
|
| — |
|
|
| (31 | ) |
| (106 | ) |
|
| — |
|
|
| — |
|
|
| — |
|
|
| (106 | ) |
Cash provided by (used for) financing activities |
| 17 |
|
|
| — |
|
|
| — |
|
|
| (288 | ) |
|
| (271 | ) | |||||||||||||||||||
Cash used for financing activities |
| (2 | ) |
|
| — |
|
|
| — |
|
|
| (821 | ) |
|
| (823 | ) | |||||||||||||||||||
Effect of exchange rate changes on cash and cash equivalents |
| — |
|
|
| — |
|
|
| 11 |
|
|
| — |
|
|
| 11 |
|
| — |
|
|
| — |
|
|
| (12 | ) |
|
| — |
|
|
| (12 | ) |
(Decrease) increase in cash and cash equivalents |
| — |
|
|
| (291 | ) |
|
| 169 |
|
|
| — |
|
|
| (122 | ) |
| — |
|
|
| (304 | ) |
|
| 23 |
|
|
| — |
|
|
| (281 | ) |
Cash and cash equivalents at January 1, |
| — |
|
|
| 761 |
|
|
| 795 |
|
|
| — |
|
|
| 1,556 |
|
| — |
|
|
| 761 |
|
|
| 795 |
|
|
| — |
|
|
| 1,556 |
|
Cash and cash equivalents at March 31, | $ | — |
|
| $ | 470 |
|
| $ | 964 |
|
| $ | — |
|
| $ | 1,434 |
| |||||||||||||||||||
Cash and cash equivalents at September 30, | $ | — |
|
| $ | 457 |
|
| $ | 818 |
|
| $ | — |
|
| $ | 1,275 |
| |||||||||||||||||||
3843
The Chemours Company
Item 2. MANAGEMENT’S DISCUSSION AND ANALYSIS OF FINANCIAL CONDITION AND RESULTS OF OPERATIONS
This Management’s Discussion and Analysis of Financial Condition and Results of Operations (“MD&A”) supplements the unaudited Interim Consolidated Financial Statements and the related notes thereto included elsewhere herein to help provide an understanding of our financial condition, changes in our financial condition, and the results of our operations for the periods presented. Unless the context otherwise requires, references herein to “The Chemours Company,” “Chemours,” “the Company,” “our Company,” “we,” “us,” and “our” refer to The Chemours Company and its consolidated subsidiaries. References herein to “DuPont” refer to E. I. du Pont de Nemours and Company, a Delaware corporation, and its consolidated subsidiaries (other than Chemours and its consolidated subsidiaries), unless the context otherwise requires.corporation.
This MD&A should be read in conjunction with the unaudited Interim Consolidated Financial Statements and the related notes thereto included in Item 1 of this Quarterly Report on Form 10-Q, as well as our audited Consolidated Financial Statements and the related notes thereto included in our Annual Report on Form 10-K for the year ended December 31, 2018.
This section and other parts of this Quarterly Report on Form 10-Q contain forward-looking statements, within the meaning of the federal securities laws, that involve risks and uncertainties. Forward-looking statements provide current expectations of future events based on certain assumptions and include any statement that does not directly relate to any historical or current fact. The words “believe,” “expect,” “anticipate,” “plan,” “estimate,” “target,” “project,” and similar expressions, among others, generally identify “forward-looking statements,” which speak only as of the date the statements were made. The matters discussed in these forward-looking statements are subject to risks, uncertainties, and other factors that could cause actual results to differ materially from those set forth in the forward-looking statements.
Our forward-looking statements are based on certain assumptions and expectations of future events that may not be accurate or realized. These statements, as well as our historical performance, are not guarantees of future performance. Forward-looking statements also involve risks and uncertainties that are beyond our control. Additionally, there may be other risks and uncertainties that we are unable to identify at this time or that we do not currently expect to have a material impact on our business. Factors that could cause or contribute to these differences include, but are not limited to, the risks, uncertainties, and other factors discussed in the Forward-looking Statements and the Risk Factors sections in our Annual Report on Form 10-K for the year ended December 31, 2018, and otherwise as discussed in this report.report and our Annual Report on Form 10-K. We assume no obligation to revise or update any forward-looking statement for any reason, except as required by law.
Overview
We are a leading, global provider of performance chemicals that are key inputs in end-products and processes in a variety of industries. We deliver customized solutions with a wide range of industrial and specialty chemicals products for markets, including plastics and coatings, refrigeration and air conditioning, general industrial, electronics, mining, and oil refining. Our principal products include refrigerants, industrial fluoropolymer resins, sodium cyanide, performance chemicals and intermediates, and titanium dioxide (“TiO2”) pigment. We manage and report our operating results through three reportable segments: Fluoroproducts, Chemical Solutions, and Titanium Technologies. Our Fluoroproducts segment is a leading, global provider of fluoroproducts, including refrigerants and industrial fluoropolymer resins. Our Chemical Solutions segment is a leading, North American provider of industrial chemicals used in gold production, industrial, and consumer applications. Our Titanium Technologies segment is a leading, global provider of TiO2 pigment, a premium white pigment used to deliver whiteness, brightness, opacity, and protection in a variety of applications.
We are committed to creating value for our customers and stakeholders through the reliable delivery of high-quality products and services around the world. To achieve this goal, we have a global team dedicated to upholding our five core values: (i) customer centricity – driving customer growth, and our own, by understanding our customers’ needs and building long-lasting relationships with them; (ii) refreshing simplicity – cutting complexity by investing in what matters, and getting results faster; (iii) collective entrepreneurship – empowering our employees to act like they own our business, while embracing the power of inclusion and teamwork; (iv) safety obsession – living our steadfast belief that a safe workplace is a profitable workplace; and, (v) unshakable integrity – doing what’s right for our customers, colleagues, and communities – always.
Additionally, our Corporate Responsibility commitment focuses on three key principles – inspired people, a shared planet, and an evolved portfolio – in an effort to achieve, among other goals, increased diversity and inclusion in our global workforce, increased sustainability of our products, and becoming carbon positive. We call this responsible chemistry – it is rooted in who we are, and we expect that our Corporate Responsibility commitment will drive sustainable, long-term earnings growth.
3944
The Chemours Company
Recent Developments
Fayetteville, North CarolinaAccounts Receivable Securitization Facility
In FebruaryJuly 2019, we, through a wholly-owned special purpose entity, entered into a final Consent Order,an accounts receivable securitization facility (“Securitization Facility”) to enhance our liquidity. The net borrowings under the Securitization Facility since July 2019 amounted to $122 million, which was originally proposed in November 2018, with the North Carolina Departmentremained outstanding as of Environmental Quality (“NC DEQ”) and Cape Fear River Watch, a non-profit organization.September 30, 2019. The final Consent Order comprehensively addressed certain litigation and other matters atproceeds were used to pay down our Fayetteville, North Carolina facility and was accepted by the North Carolina Superior Court for Bladen County. In connection with the approved final Consent Order, we accrued an additional $27 million for on-site and off-site remediation efforts during the first quarter of 2019, and our total estimated liability for this matter was $83 million at March 31, 2019.outstanding revolving loan balance.
Capital Allocation2019 Restructuring Program
DuringIn an effort to better align our cost structure with market opportunities we recorded severance charges of $17 million during the firstthree months ended September 30, 2019. This charge includes $2 million related to our exit of the Methylamines and Methylamides business as discussed below. Impacted employees are subject to our customary involuntary termination benefits. The majority of the employees will separate from the Company during the fourth quarter of 2019.
Also in the third quarter of 2019, we returned $303announced plans to exit the Methylamines and Methylamides business at our Belle, West Virginia manufacturing plant. As a result, for the three and nine months ended September 30, 2019 we recorded charges of approximately $10 million for property, plant, and equipment and $2 million for other asset impairment charges. As of September 30, 2019, we incurred, in the aggregate, $14 million in restructuring charges related to our shareholdersthese activities, including asset-related charges. We expect to incur additional charges of $22 million for property, plant, and equipment and other assets through the purchaseremainder of $2612019, and additional restructuring charges, including decommissioning and dismantling, of approximately $11 million through 2020, all of our issued and outstanding common stock under our share repurchase program, and the payment of $42 million in dividends.which relates to Chemical Solutions.
First Quarter 2019 Results of Operations and Business Highlights
Results of Operations
The following table sets forth our results of operations for the three and nine months ended March 31,September 30, 2019 and 2018.
|
| Three Months Ended March 31, |
|
| Three Months Ended September 30, |
|
| Nine Months Ended September 30, |
| |||||||||||||||
(Dollars in millions, except per share amounts) |
| 2019 |
|
| 2018 |
|
| 2019 |
|
| 2018 |
|
| 2019 |
|
| 2018 |
| ||||||
Net sales |
| $ | 1,376 |
|
| $ | 1,730 |
|
| $ | 1,390 |
|
| $ | 1,628 |
|
| $ | 4,173 |
|
| $ | 5,174 |
|
Cost of goods sold |
|
| 1,080 |
|
|
| 1,193 |
|
|
| 1,096 |
|
|
| 1,151 |
|
|
| 3,260 |
|
|
| 3,603 |
|
Gross profit |
|
| 296 |
|
|
| 537 |
|
|
| 294 |
|
|
| 477 |
|
|
| 913 |
|
|
| 1,571 |
|
Selling, general, and administrative expense |
|
| 156 |
|
|
| 143 |
|
|
| 130 |
|
|
| 163 |
|
|
| 423 |
|
|
| 466 |
|
Research and development expense |
|
| 22 |
|
|
| 20 |
|
|
| 20 |
|
|
| 20 |
|
|
| 61 |
|
|
| 61 |
|
Restructuring, asset-related, and other charges |
|
| 8 |
|
|
| 10 |
|
|
| 34 |
|
|
| 12 |
|
|
| 49 |
|
|
| 32 |
|
Total other operating expenses |
|
| 186 |
|
|
| 173 |
|
|
| 184 |
|
|
| 195 |
|
|
| 533 |
|
|
| 559 |
|
Equity in earnings of affiliates |
|
| 8 |
|
|
| 12 |
|
|
| 9 |
|
|
| 10 |
|
|
| 25 |
|
|
| 32 |
|
Interest expense, net |
|
| (51 | ) |
|
| (52 | ) |
|
| (53 | ) |
|
| (47 | ) |
|
| (156 | ) |
|
| (148 | ) |
Loss on extinguishment of debt |
|
| — |
|
|
| — |
|
|
| — |
|
|
| (38 | ) | ||||||||
Other income, net |
|
| 40 |
|
|
| 57 |
|
|
| 25 |
|
|
| 24 |
|
|
| 81 |
|
|
| 115 |
|
Income before income taxes |
|
| 107 |
|
|
| 381 |
|
|
| 91 |
|
|
| 269 |
|
|
| 330 |
|
|
| 973 |
|
Provision for income taxes |
|
| 13 |
|
|
| 84 |
| ||||||||||||||||
Provision for (benefit from) income taxes |
|
| 15 |
|
|
| (6 | ) |
|
| 65 |
|
|
| 119 |
| ||||||||
Net income |
|
| 94 |
|
|
| 297 |
|
|
| 76 |
|
|
| 275 |
|
|
| 265 |
|
|
| 854 |
|
Less: Net income attributable to non-controlling interests |
|
| — |
|
|
| — |
|
|
| — |
|
|
| 1 |
| ||||||||
Net income attributable to Chemours |
| $ | 94 |
|
| $ | 297 |
|
| $ | 76 |
|
| $ | 275 |
|
| $ | 265 |
|
| $ | 853 |
|
Per share data |
|
|
|
|
|
|
|
|
|
|
|
|
|
|
|
|
|
|
|
|
|
|
|
|
Basic earnings per share of common stock |
| $ | 0.56 |
|
| $ | 1.63 |
|
| $ | 0.46 |
|
| $ | 1.56 |
|
| $ | 1.60 |
|
| $ | 4.77 |
|
Diluted earnings per share of common stock |
|
| 0.55 |
|
|
| 1.58 |
|
|
| 0.46 |
|
|
| 1.51 |
|
|
| 1.58 |
|
|
| 4.62 |
|
45
The Chemours Company
Net Sales
The following table sets forth the impact of price, volume, and currency on our net sales for the three and nine months ended March 31, 2019.September 30, 2019, compared with the same periods in 2018.
|
| |||
|
|
| ||
|
|
| ||
|
|
| ||
|
|
| ||
Change in net sales from prior period |
| Three Months Ended September 30, 2019 |
|
| Nine Months Ended September 30, 2019 |
| ||
Price |
|
| (3 | )% |
|
| (1 | )% |
Volume |
|
| (11 | )% |
|
| (17 | )% |
Currency |
|
| (1 | )% |
|
| (1 | )% |
Total change in net sales |
|
| (15 | )% |
|
| (19 | )% |
40
The Chemours Company
Our net sales decreased by $354$238 million (or 20%15%) to $1.4 billion for the three months ended March 31,September 30, 2019, compared with net sales of $1.7$1.6 billion for the same period in 2018. The components of the decrease in our net sales by segment for the three months ended September 30, 2019 were as follows: in our Fluoroproducts segment, volume was down 2%, price declined 4%, and unfavorable currency movements added a 1% headwind to segment net sales; in our Chemical Solutions segment, volume was up 1% and price declined 11%; and, in our Titanium Technologies segment, volume and price were down 20% and 2%, respectively.
Our net sales decreased by $1.0 billion (or 19%) to $4.2 billion for the nine months ended September 30, 2019, compared with net sales of $5.2 billion for the same period in 2018. The components of the decrease in our net sales by segment for the nine months ended September 30, 2019 were as follows: in our Fluoroproducts segment, volume was down 5%, price declined 2%, and unfavorable currency movements added a 1% headwind to segment net sales; in our Chemical Solutions segment, volume and price decline by 8% and 3%, respectively; and, in our Titanium Technologies segment, volume was down 30%, while unfavorable currency movements added a 1% headwind to segment net sales.
The drivers of these changes for each of our segments are discussed further under the heading “Segment Reviews,” which follows our “Results of Operations and Business Highlights” in this MD&A.
Cost of Goods Sold
Our cost of goods sold (“COGS”) decreased by $55 million (or 5%) and $343 million (or 10%) to $1.1 billion and $3.3 billion for the three and nine months ended September 30, 2019, respectively, compared with COGS of $1.2 billion and $3.6 billion for the same periods in 2018. The decreases in our COGS for the three and nine months ended September 30, 2019 were primarily attributable to lower net sales volumes, which were partially offset by the impacts of operational headwinds.
Selling, General, and Administrative Expense
Our selling, general, and administrative (“SG&A”) expense decreased by $33 million (or 20%) to $130 million for the three months ended September 30, 2019, compared with SG&A expense of $163 million for the same period in 2018. The decrease in our net salesSG&A expense for the three months ended March 31,September 30, 2019 was primarily attributable to a 20% decrease in volume, due to lower demand and expected share loss in our Titanium Technologies segment as we implement our Ti-PureTM Value Stabilization strategy. Unfavorable foreign currency movements added another 1% of headwind to our net sales. These decreases were somewhat offset by a 1% increase in price, driven primarily by the continued implementation of stable pricescosts for Ti-PureTM TiO2 pigment in our Titanium Technologies segment, and higher prices for the Mining Solutions product line in our Chemical Solutions segment.
Cost of Goods Soldcertain legal matters.
Our cost of goods sold (“COGS”)SG&A expense decreased by $113$43 million (or 9%) to $1.1 billion$423 million for the threenine months ended March 31,September 30, 2019, compared with COGSSG&A expense of $1.2 billion$466 million for the same period in 2018. The decrease in our COGSSG&A expense for the threenine months ended March 31,September 30, 2019 was primarily attributable to lower volume, which was somewhat offset by margin compression due to decreased volume,performance-related compensation and highercosts incurred for our 2018 debt transactions that were not repeated in 2019, and lower costs for certain raw materials. We also experiencedlegal matters. These decreases were partially offset by increased legal costs accrued during the first quarter of approximately $33 million for certain operating issues2019 in our Fluoroproducts segment, which included the start-up of our new OpteonTM refrigerants facility in Corpus Christi, Texas and unplanned outages at our Louisville, Kentucky facility.
Selling, General, and Administrative Expense
Our selling, general, and administrative (“SG&A”) expense increased by $13 million (or 9%) to $156 million for the three months ended March 31, 2019, comparedconnection with SG&A expense of $143 million for the same period in 2018. The increase in our SG&A expense for the three months ended March 31, 2019 was primarily attributable to the accrual of an additional estimated liability of $27 million for the approved final Consent Order to settle certain litigation and other matters at our Fayetteville, North Carolina facility, the majority of which, was recorded as a component of our SG&A expense. This increase was somewhat offset by lower performance-related compensation expenses.facility.
Research and Development Expense
Our research and development (“R&D”) expense was largely unchanged at $22$20 million and $61 million, and $20 million and $61 million for the three and nine months ended March 31,September 30, 2019 compared with R&D expense of $20 million for the same period in 2018.and 2018, respectively.
Restructuring, Asset-Related, and Other Charges
Our restructuring, asset-related, and other charges decreasedincreased by $2$22 million (or 20%greater than 100%) and $17 million (or 53%) to $8$34 million and $49 million for the three and nine months ended March 31,September 30, 2019, respectively, compared with restructuring, asset-related, and other charges of $10$12 million and $32 million for the same periodperiods in 2018.
46
The Chemours Company
Our restructuring, asset-related, and other charges for the three months ended March 31,September 30, 2019 were primarily attributablecomposed of charges related to our 2019 Restructuring Program, including our plans to exit the Methylamines and Methylamides business at the Belle, WV manufacturing plant, both announced in the third quarter of 2019.
Our restructuring, asset-related, and other charges for the nine months ended September 30, 2019 primarily consisted of the aforementioned three months ended September 30, 2019 charges plus continuing decommissioning and dismantling-related charges associated with the demolition and removal of certain unused buildings at our Chambers Works site in Deepwater, New Jersey. NJ and the Reactive Metals Solutions business in Niagara Falls, NY.
Our restructuring, asset-related, and other changescharges for the three and nine months ended March 31,September 30, 2018 were primarily attributable to continued progress on our business process and information technology outsourcing efforts, as well as additional severance accruals under our 2017 restructuring program.
Equity in Earnings of Affiliates
Our equity in earnings of affiliates decreased by $4$1 million (or 33%10%) and $7 million (or 22%) to $8$9 million and $25 million for the three and nine months ended March 31,September 30, 2019, respectively, compared with equity in earnings of affiliates of $12$10 million and $32 million for the same periodperiods in 2018.
The decrease in our equity in earnings of affiliates for the three months ended March 31,September 30, 2019 was primarily attributable to decreased profitabilityglobal automotive market softness for our investees in the Fluoroproducts segment.
The decrease in our equity methodin earnings of affiliates for the nine months ended September 30, 2019 was primarily attributable to global semiconductor and automotive market softness for our investees in the Fluoroproducts segment.
Interest Expense, Net
Our interest expense, net decreasedincreased by $1$6 million (or 2%13%) and $8 million (or 5%) to $51$53 million and $156 million for the three and nine months ended March 31,September 30, 2019, respectively, compared with interest expense, net of $52$47 million and $148 million for the same periodperiods in 2018.
The decreaseincrease in our interest expense, net for the three months ended March 31,September 30, 2019 was primarily attributable to lower amounts of interest income and capitalized interest due to lower cash and cash equivalents balances and the completion or stoppage of certain of our large-scale construction projects, respectively.
The increase in our interest expense, net for the nine months ended September 30, 2019 was primarily attributable to lower amounts of interest income and capitalized interest due to the aforementioned reasons, which more than offset the impact of any reduced interest costs resulting from our 2018 debt transactions.
Loss on Extinguishment of Debt
We incurred a loss on extinguishment of debt of $38 million for the nine months ended September 30, 2018 in connection with our 2018 debt transactions.
Other Income, Net
Our other income, net increased by $1 million (or 4%) and decreased $34 million (or 30%) to $25 million and $81 million for the three and nine months ended September 30, 2019, respectively, compared with other income, net of $24 million and $115 million for the same periods in 2018.
The increase in our other income, net for the three months ended September 30, 2019 was primarily attributable to recognition of the previously deferred non-cash gain of $9 million, associated with the sale of the Repauno site in Gibbstown, NJ. The gain had been deferred until certain environmental obligations had been fulfilled. This was offset by lower European Union (“EU”) fluorinated greenhouse gas (“F-gas”) quota authorization sales.
The decrease in our other income, net for the nine months ended September 30, 2019 was primarily attributable to a reduction in our interest costs resulting from the purchase of $250$42 million in outstanding principalgain on our U.S. dollar-denominated 6.625% senior unsecured notes due May 2023, and the purchase and redemptionsale of all outstanding principal on our euro-denominated 6.125% senior unsecured notes due May 2023, both of which occurred during the second quarter of 2018. This decrease was mostly offset by an increaseland in interest costs resulting from the issuance of our euro-denominated 4.000% senior unsecured notes due May 2026 in June 2018, as well as lower interest income and capitalized interestLinden, New Jersey during the first quarter of 2018, which was not repeated in 2019. This decrease was partially offset by the recognition of the previously deferred non-cash gain of $9 million, associated with the sale of the Repauno site in Gibbstown, NJ.
4147
The Chemours Company
Other Income, Net
Our other income, net decreased by $17 million (or 30%) to $40 million for the three months ended March 31, 2019, compared with other income, net of $57 million for the same period in 2018. The decrease in our other income, net was primarily attributable to the net result of a $42 million decrease in gain on sales of assets and businesses due to the sale of our Linden, New Jersey site during the first quarter of 2018, and a $22 million increase in leasing, contract services, and miscellaneous income during the first quarter of 2019, due to an increase in European Union (“EU”) fluorinated greenhouse gas quota authorization sales.
Provision for Income Taxes
Our provisions for income taxes amounted to $13were $15 million and $84$65 million for the three and nine months ending March 31,ended September 30, 2019, which represented effective tax rates of 16% and 20%, respectively, compared with benefit from and provision for income taxes of $6 million and $119 million for the same periods in 2018, which represented effective income tax rates of approximately 12%negative 2% and 22%12%, respectively. The $71 million (or 85%) decreasechange in our provision for income taxesthe Company’s effective tax rate for the three months ended March 31,September 30, 2019 was primarily attributable to decreased$5 million of additional income tax expense on the revaluation of certain deferred tax assets and liabilities as result of the increased corporate tax rate for a certain foreign subsidiary, $3 million of lower income tax benefits related to windfalls on its share-based payments, reduced profitability as well as changes inand the geographic mix of ourits earnings. The change in the Company’s effective tax rate for the three months ended September 30, 2018 was primarily attributable to $17 million in income tax benefits related to the reversal of the valuation allowance on carryforward foreign tax credits, $14 million in income tax benefits related to the filing of the Company’s 2017 U.S. tax return and the associated adjustments on the revaluation of certain deferred tax assets and liabilities as a result of the reduced corporate tax rate, and the Company’s geographic mix of earnings.
The change in the Company’s effective tax rate for the nine months ended September 30, 2019 were primarily attributable to $5 million of additional income tax expense on the revaluation of certain deferred tax assets and liabilities as result of the increased corporate tax rate for a certain foreign subsidiary, $8 million of additional income tax expense associated with the recognition of a valuation allowance on the deferred tax assets of a certain foreign subsidiary, $8 million of lower income tax benefits related to windfalls on its share-based payments, reduced profitability and the geographic mix of its earnings. The change in the Company’s effective tax rate for the nine months ended September 30, 2018 was primarily attributable to $17 million in income tax benefits related to the reversal of the valuation allowance on carryforward foreign tax credits, $14 million in income tax benefits related to the filing of the Company’s 2017 U.S. tax return and the associated adjustments on the revaluation of certain deferred tax assets and liabilities as a result of the reduced corporate tax rate, and the Company’s geographic mix of earnings.
Segment Reviews
Adjusted earnings before interest, taxes, depreciation, and amortization (“Adjusted EBITDA”) is the primary measure of segment performance used by our Chief Operating Decision Maker (“CODM”) and is defined as income (loss) before income taxes, excluding the following:
| • | interest expense, depreciation, and amortization; |
| • | non-operating pension and other post-retirement employee benefit costs, which represents the component of net periodic pension (income) costs excluding the service cost component; |
| • | exchange (gains) losses included in other income (expense), net; |
| • | restructuring, asset-related, and other charges; |
| • | asset impairments; |
| • | (gains) losses on |
| • | other items not considered indicative of our ongoing operational performance and expected to occur infrequently. |
A reconciliation of Adjusted EBITDA to net income attributable to Chemours for the three and nine months ended March 31,September 30, 2019 and 2018 is included in the “Non-GAAP Financial Measures” section of this MD&A.
The following table sets forth our Adjusted EBITDA by segment for the three and nine months ended March 31,September 30, 2019 and 2018.
|
| Three Months Ended March 31, |
|
| Three Months Ended September 30, |
|
| Nine Months Ended September 30, |
| |||||||||||||||
(Dollars in millions) |
| 2019 |
|
| 2018 |
|
| 2019 |
|
| 2018 |
|
| 2019 |
|
| 2018 |
| ||||||
Fluoroproducts |
| $ | 159 |
|
| $ | 206 |
|
| $ | 122 |
|
| $ | 182 |
|
| $ | 461 |
|
| $ | 619 |
|
Chemical Solutions |
|
| 15 |
|
|
| 11 |
|
|
| 23 |
|
|
| 24 |
|
|
| 55 |
|
|
| 50 |
|
Titanium Technologies |
|
| 126 |
|
|
| 294 |
|
|
| 137 |
|
|
| 268 |
|
|
| 390 |
|
|
| 856 |
|
Corporate and Other |
|
| (38 | ) |
|
| (43 | ) |
|
| (34 | ) |
|
| (39 | ) |
|
| (113 | ) |
|
| (126 | ) |
Total Adjusted EBITDA |
| $ | 262 |
|
| $ | 468 |
|
| $ | 248 |
|
| $ | 435 |
|
| $ | 793 |
|
| $ | 1,399 |
|
4248
The Chemours Company
Fluoroproducts
The following chart sets forth the net sales, Adjusted EBITDA, and Adjusted EBITDA margin amounts for our Fluoroproducts segment for the three and nine months ended March 31,September 30, 2019 and 2018.
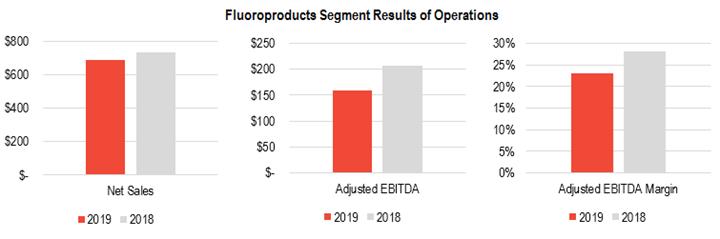
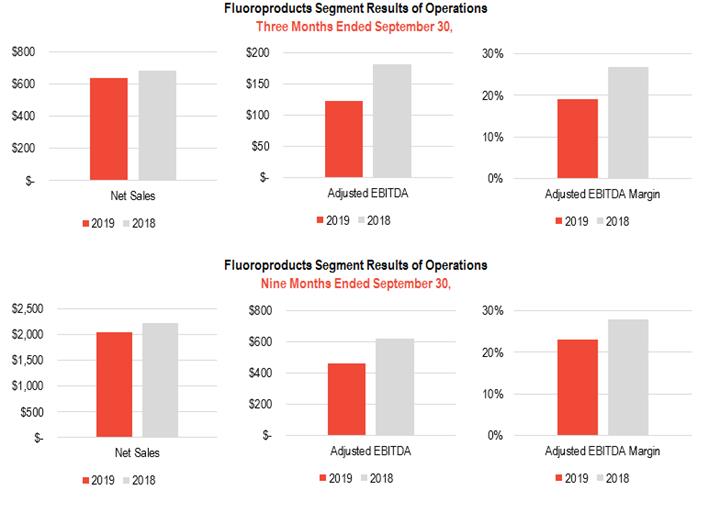
|
| Three Months Ended March 31, |
|
| Three Months Ended September 30, |
|
| Nine Months Ended September 30, |
| |||||||||||||||
(Dollars in millions) |
| 2019 |
|
| 2018 |
|
| 2019 |
|
| 2018 |
|
| 2019 |
|
| 2018 |
| ||||||
Segment net sales |
| $ | 687 |
|
| $ | 732 |
|
| $ | 636 |
|
| $ | 682 |
|
| $ | 2,034 |
|
| $ | 2,213 |
|
Adjusted EBITDA |
|
| 159 |
|
|
| 206 |
|
|
| 122 |
|
|
| 182 |
|
|
| 461 |
|
|
| 619 |
|
Adjusted EBITDA margin |
|
| 23 | % |
|
| 28 | % |
|
| 19 | % |
|
| 27 | % |
|
| 23 | % |
|
| 28 | % |
The following table sets forth the impacts of price, volume, and currency on our Fluoroproducts segment’s net sales for the three and nine months ended March 31, 2019.September 30, 2019, compared with the same periods in 2018.
|
| |||
|
|
| ||
|
|
| ||
|
|
| ||
|
|
| ||
Change in segment net sales from prior period |
| Three Months Ended September 30, 2019 |
|
| Nine Months Ended September 30, 2019 |
| ||
Price |
|
| (4 | )% |
|
| (2 | )% |
Volume |
|
| (2 | )% |
|
| (5 | )% |
Currency |
|
| (1 | )% |
|
| (1 | )% |
Total change in segment net sales |
|
| (7 | )% |
|
| (8 | )% |
49
The Chemours Company
Segment Net Sales
Our Fluoroproducts segment’s net sales decreased by $45$46 million (or 6%7%) to $687$636 million for the three months ended March 31,September 30, 2019, compared with segment net sales of $732$682 million for the same period in 2018. The decrease in segment net sales for the three months ended March 31,September 30, 2019 was driven by decreases in price and volumes of 4% and 2%, respectively. Illegal imports of legacy hydrofluorocarbon (“HFC”) refrigerants into the EU in violation of the region’s F-gas regulations, impacted both volume and price during the quarter; and, volumes also declined due to lower demand for our legacy base refrigerants and polymers due to softness in the global automotive and electronics markets. These decreases were partially offset by volume increases from the continued adoption of OpteonTM products in mobile applications and the positive impact of high-grade Fluoropolymer sales. Unfavorable currency movements added a 1% headwind to the segment’s net sales during the quarter.
Our Fluoroproducts segment’s net sales decreased by $179 million (or 8%) to $2.0 billion for the nine months ended September 30, 2019, compared with segment net sales of $2.2 billion for the same period in 2018. The decrease in segment net sales for the nine months ended September 30, 2019 was primarily attributable to a 4% decreasedecreases in price and volume which isof 2% and 5%, respectively. Illegal imports of legacy hydrofluorocarbon (“HFC”) refrigerants into the resultEU in violation of lower base refrigerant sales in North America,the region’s F-gas regulations impacted both volume and price during the quarter; and, volumes also declined due to a soft market,lower demand for our legacy base refrigerants and lower OpteonTM stationary refrigerants sales in Europe,polymers due to illegal imports. Salessoftness in the global automotive and electronics markets. These decreases were partially offset by volume increases from the continued adoption of our OpteonTM refrigerants for products in mobile applications were above 2018 levels, and our fluoropolymers sales in the electronics markets offset global automotive market weakness.positive impact of high-grade Fluoropolymer sales. Unfavorable foreign currency movements added another 2% ofa 1% headwind to ourthe segment’s net sales.sales during the nine months ended September 30, 2019.
Adjusted EBITDA and Adjusted EBITDA Margin
SegmentFor the three months ended September 30, 2019, segment Adjusted EBITDA decreased by $47$60 million (or 23%33%) to $159$122 million and Adjusted EBITDA margin decreased by approximately 800 basis points to 19%, compared with segment Adjusted EBITDA of $182 million and Adjusted EBITDA margin of 27% for the same period in 2018. These declines primarily resulted from the aforementioned impacts of illegal imports and other volume and price impacts along with operational headwinds, as well as lower F-Gas quota sales. These declines were partially offset by lower cost of goods sold from increased production at our new Corpus Christi OpteonTM site
For the nine months ended September 30, 2019, segment Adjusted EBITDA decreased by $158 million (or 26%) to $461 million and Adjusted EBITDA margin decreased by approximately 500 basis points to 23% for the three months ended March 31, 2019,, compared with segment Adjusted EBITDA of $206$619 million and Adjusted EBITDA margin of 28% for the same period in 2018. The decrease in segment Adjusted EBITDA and Adjusted EBITDA margin for the three months ended March 31, 2019 wasThese decreases were primarily attributable to the aforementioned decreasedecreases in volume, price, and unfavorable foreign currency movements. We alsoAdditionally, we experienced increased costs of approximately $33 million driven by operating issues, includingfor the nine months ended September 2019 due to the start-up of our new OpteonTM refrigerants facility in Corpus Christi, Texas, and unplanned outages at our Louisville, Kentucky facility. These impacts to segment Adjusted EBITDA and Adjusted EBITDA margin were somewhat offset by $24 million in EU fluorinated greenhouse gas quota authorization sales during the three months ended March 31, 2019, compared with $2 million for the three months ended March 31, 2018.
43
50
The Chemours Company
Chemical Solutions
The following chart sets forth the net sales, Adjusted EBITDA, and Adjusted EBITDA margin amounts for our Chemical Solutions segment for the three and nine months ended March 31,September 30, 2019 and 2018.
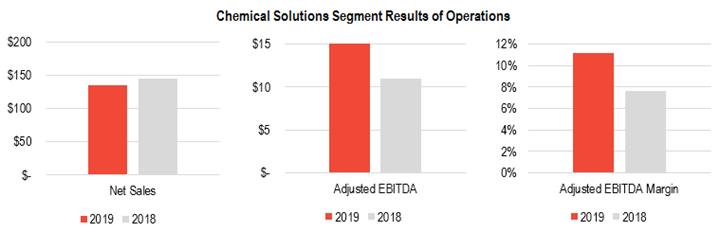
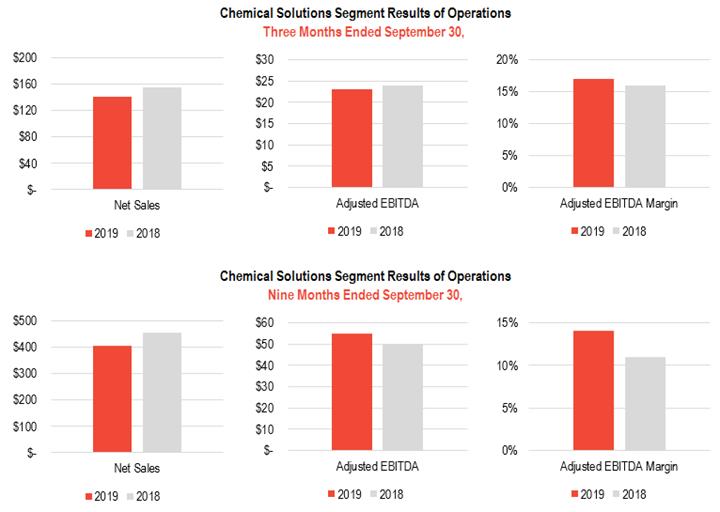
|
| Three Months Ended March 31, |
|
| Three Months Ended September 30, |
|
| Nine Months Ended September 30, |
| |||||||||||||||
(Dollars in millions) |
| 2019 |
|
| 2018 |
|
| 2019 |
|
| 2018 |
|
| 2019 |
|
| 2018 |
| ||||||
Segment net sales |
| $ | 134 |
|
| $ | 144 |
|
| $ | 140 |
|
| $ | 155 |
|
| $ | 404 |
|
| $ | 453 |
|
Adjusted EBITDA |
|
| 15 |
|
|
| 11 |
|
|
| 23 |
|
|
| 24 |
|
|
| 55 |
|
|
| 50 |
|
Adjusted EBITDA margin |
|
| 11 | % |
|
| 8 | % |
|
| 17 | % |
|
| 16 | % |
|
| 14 | % |
|
| 11 | % |
The following table sets forth the impacts of price, volume, and currency on our Chemical Solutions segment’s net sales for the three and nine months ended March 31, 2019.September 30, 2019, compared with the same periods in 2018.
|
| |||
|
|
| ||
|
|
| ||
|
|
| ||
|
|
| ||
Change in segment net sales from prior period |
| Three Months Ended September 30, 2019 |
|
| Nine Months Ended September 30, 2019 |
| ||
Price |
|
| (11 | )% |
|
| (3 | )% |
Volume |
|
| 1 | % |
|
| (8 | )% |
Currency |
|
| — | % |
|
| — | % |
Total change in segment net sales |
|
| (10 | )% |
|
| (11 | )% |
51
The Chemours Company
Segment Net Sales
Our Chemical Solutions segment’s net sales decreased by $10$15 million (or 7%10%) to $134$140 million for the three months ended March 31,September 30, 2019, compared with segment net sales of $144$155 million for the same period in 2018. The decrease in segment net sales for the three months ended March 31,September 30, 2019 was primarily attributable to a 9%lower prices, primarily in Performance Chemicals and Intermediates, mainly driven by mix and raw material cost pass-throughs as stipulated in certain contracts.
Our Chemical Solutions segment’s net sales decreased by $49 million (or 11%) to $404 million for the nine months ended September 30, 2019, compared with segment net sales of $453 million for the same period in 2018. The decrease in volume, due to lower demand across all product lines. Unfavorable foreign currency movements added another 1% of headwind to our net sales. These decreases were somewhat offset by higher prices in our Mining Solutions product line, which drove a 3% price increase in segment net sales for the threenine months ended March 31, 2019.September 30, 2019 was primarily attributable to operational issues at a key customer mine in Mining Solutions, lower prices for certain Performance Chemicals and Intermediates products, mainly driven by mix and raw material cost pass-throughs as stipulated in certain contracts.
Adjusted EBITDA and Adjusted EBITDA Margin
SegmentFor the three months ended September 30, 2019, segment Adjusted EBITDA decreased by $1 million (or 4%) to $23 million, while Adjusted EBITDA margin improved to 17% compared with segment Adjusted EBITDA of $24 million and Adjusted EBITDA margin of 16% for the same period in 2018. The impact of lower sales was largely offset by increased license income and lower cost of goods sold.
For the nine months ended September 30, 2019, segment Adjusted EBITDA increased by $4$5 million (or 36%11%) to $15$55 million and Adjusted EBITDA margin increased by approximately 300 basis points to 11% for the three months ended March 31, 2019,14%, compared with segment Adjusted EBITDA of $11$50 million and Adjusted EBITDA margin of 8%11% for the same period in 2018. The increase in segment Adjusted EBITDA and Adjusted EBITDA margin for the three months ended March 31, 2019 was primarilyThese increases were attributable to the aforementioned higher prices in our Mining Solutions product line, product mix, andincreased license income, lower costs associated with certain capital projects and lower cost of our capital projects.
44
52
The Chemours Company
Titanium Technologies
The following chart sets forth the net sales, Adjusted EBITDA, and Adjusted EBITDA margin amounts for our Titanium Technologies segment for the three and nine months ended March 31,September 30, 2019 and 2018.

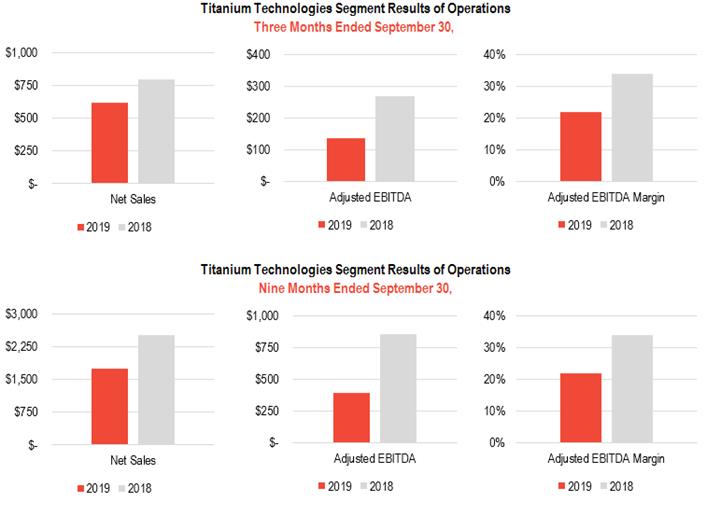
|
| Three Months Ended March 31, |
|
| Three Months Ended September 30, |
|
| Nine Months Ended September 30, |
| |||||||||||||||
(Dollars in millions) |
| 2019 |
|
| 2018 |
|
| 2019 |
|
| 2018 |
|
| 2019 |
|
| 2018 |
| ||||||
Segment net sales |
| $ | 555 |
|
| $ | 854 |
|
| $ | 614 |
|
| $ | 791 |
|
| $ | 1,735 |
|
| $ | 2,508 |
|
Adjusted EBITDA |
|
| 126 |
|
|
| 294 |
|
|
| 137 |
|
|
| 268 |
|
|
| 390 |
|
|
| 856 |
|
Adjusted EBITDA margin |
|
| 23 | % |
|
| 34 | % |
|
| 22 | % |
|
| 34 | % |
|
| 22 | % |
|
| 34 | % |
The following table sets forth the impacts of price, volume, and currency on our Titanium Technologies segment’s net sales for the three and nine months ended March 31, 2019.September 30, 2019, compared with the same periods in 2018.
|
| |||
|
|
| ||
|
|
| ||
|
|
| ||
|
|
| ||
Change in segment net sales from prior period |
| Three Months Ended September 30, 2019 |
|
| Nine Months Ended September 30, 2019 |
| ||
Price |
|
| (2 | )% |
|
| — | % |
Volume |
|
| (20 | )% |
|
| (30 | )% |
Currency |
|
| — | % |
|
| (1 | )% |
Total change in segment net sales |
|
| (22 | )% |
|
| (31 | )% |
53
The Chemours Company
Segment Net Sales
Our Titanium Technologies segment’s net sales decreased by $299$177 million (or 35%22%) to $555$614 million for the three months ended March 31,September 30, 2019, compared with segment net sales of $854$791 million for the same period in 2018. The decrease in segment net sales for the three months ended March 31,September 30, 2019 was primarily attributable to a 35%20% decrease in volume, primarily due to lower demandvolumes of Ti-PureTM titanium dioxide. Price declined slightly primarily due to customer, regional and expected share losschannel mix, but remained largely stable as we implementa result of our Ti-PureTMTi-PureTM Value Stabilization (“TVS”) strategy. Unfavorable foreign currency movements added another 1%
Our Titanium Technologies segment’s net sales decreased by $772 million (or 31%) to $1.7 billion for the nine months ended September 30, 2019, compared with segment net sales of headwind$2.5 billion for the same period in 2018. The decrease in segment net sales for the nine months ended September 30, 2019 was attributable to our net sales. Price, however, increased by 1%,a 30% decrease in volume, primarily due to lower volumes of Ti-PureTM titanium dioxide, and a 1% headwind from unfavorable currency movements. Price remained stable as a result of the continued implementation of stable prices for our Ti-PureTM TiO2 pigment.TVS strategy.
Adjusted EBITDA and Adjusted EBITDA Margin
SegmentFor the three months ended September 30, 2019, segment Adjusted EBITDA decreased by $168$131 million (or 57%49%) to $126$137 million and Adjusted EBITDA margin decreased by approximately 1,1001,200 basis points to 23% for the three months ended March 31, 2019,22%, compared with segment Adjusted EBITDA of $294$268 million and Adjusted EBITDA margin of 34% for the same period in 2018. The decrease in
For the nine months ended September 30, 2019, segment Adjusted EBITDA decreased by $466 million (or 54%) to $390 million and Adjusted EBITDA margin decreased by approximately 1,200 basis points to 22%, compared with segment Adjusted EBITDA of $856 million and Adjusted EBITDA margin of 34% for the three months ended March 31, 2019 wassame period in 2018.
These decreases were primarily attributable to the aforementioned decreasedecreases in volume and, unfavorable foreign currency movements,as well as margin compression due to decreased volume, and increased costs for certain raw materials.
45
The Chemours Company
Corporate and Otherreduced production rates as we adjust the utilization of our manufacturing units to match the reduced customer demand.
Corporate costs and certain legacy legal and environmental expenses, stock-based compensation costs, and foreign exchange gains and losses arising from the remeasurement of balances in currencies other than the functional currency of our legal entities are reflected in Corporate and Other. Other
Corporate and Other costs decreased by $5 million (or 12%13%) and $13 million (or 10%) to $38$34 million and $113 million for the three and nine months ended March 31,September 30, 2019, respectively, compared with Corporate and Other costs of $43$39 million and $126 million for the same periodperiods in 2018. This
The decrease in our Corporate and Other costs for the three months ended September 30, 2019 was primarily attributable to lower performance-related compensation expenses, and other general administrative costs, partially offset by increased costs related to business process improvement efforts.
The decrease in our Corporate and Other costs for the nine months ended September 30, 2019 was primarily attributable to lower costs associated withfor certain legacy environmental matters.and legal matters, as well as lower performance-related compensation, partially offset by increased costs related to business process improvement efforts.
2019 Outlook
Our 2019 results will be driven by the following expectations: (i) 2019 volume for our Titanium Technologies segment will be below 2018 volume levels as we execute our Ti-PureTM Value StabilizationTVS strategy; (ii) there will be continued transition to OpteonTM refrigerants as well as increased demand for fluoropolymers products in our Fluoroproducts segment;segment, which will be offset by the impacts of illegal imports of legacy HFC refrigerants into the EU in violation of the region’s F-gas regulations; and, (iii) there will be continued demand for Mining Solutions products in our Chemical Solutions segment. We expect that our capital expenditures will be approximately $500 million. Our outlook for 2019 reflects our current visibility and expectations based on market factors, such as currency movements, macro-economic factors, and end-market demand. These expectations are subject to numerous risks, including, but not limited to, those described in Item 1A – Risk Factors contained in our Annual Report on Form 10-K for the year ended December 31, 2018.
54
The Chemours Company
Liquidity and Capital Resources
Our primary sources of liquidity are cash generated from operations, available cash, receivables securitization, and borrowings under our debt financing arrangements, which are described in further detail in “Note 17 – Debt” to the Interim Consolidated Financial Statements and “Note 19 – Debt” to the Consolidated Financial Statements in our Annual Report on Form 10-K for the year ended December 31, 2018. We believe these sources are sufficient to fund our planned operations and to meet our interest, dividend, and contractual obligations. Our financial policy seeks to: (i) selectively invest in organic and inorganic growth to enhance our portfolio, including certain strategic capital investments; (ii) return cash to shareholders through dividends and share repurchases; and, (iii) maintain appropriate leverage by using free cash flows to repay outstanding borrowings. Subject to approval by our board of directors, we may raise additional capital or borrowings from time to time, or seek to refinance our existing debt. There can be no assurances that future capital or borrowings will be available to us, and the cost and availability of new capital or borrowings could be materially impacted by market conditions. Further, the decision to refinance our existing debt is based on a number of factors, including general market conditions and our ability to refinance on attractive terms at any given point in time. Any attempts to raise additional capital or borrowings or refinance our existing debt could cause us to incur significant charges. Such charges could have a material impact on our financial position, results of operations, or cash flows.
Our operating cash flow generation is driven by, among other things, the general global economic conditions at any point in time and their resulting impact on demand for our products, raw materials and energy prices, and industry-specific issues, such as production capacity and utilization. We have generated strong operating cash flows through various industry and economic cycles, evidencing the operating strength of our businesses.
We anticipate making significant payments for interest, capital expenditures, environmental remediation costs and investments, dividends, and other actions over the next 12 months, which we expect to fund through cash generated from operations, available cash, receivables securitization, and borrowings. We further anticipate that our operations and existing debt financing arrangements will provide us with sufficient liquidity over the next 12 months. The availability under our Revolving Credit Facility,revolving credit facility is subject to the last 12 months of consolidated EBITDA, as defined in our amended and restated credit agreement, which is discussed further in in “Note 17 – Debt” to the Interim Consolidated Financial Statements and “Note 19 – Debt” to the Consolidated Financial Statements in our Annual Report on Form 10-K for the year ended December 31, 2018, is subject to the last 12 months of consolidated EBITDA, as defined in our amended and restated credit agreement.2018.
At March 31,September 30, 2019, we had total cash and cash equivalents of $697$694 million, of which, $582$551 million was held by our foreign subsidiaries, and certain of these foreign subsidiaries’ earnings are indefinitely reinvested.subsidiaries. All of the cash and cash equivalents held by our foreign subsidiaries is readily convertible into currencies used in our operations, including the U.S. dollar. The cash and earnings of our foreign subsidiaries are generally used to finance their operations and capital expenditures. At March 31,September 30, 2019, management believed that sufficient liquidity was available in the U.S., which includes borrowing capacity under our revolving credit facility, and it is our intention to indefinitely reinvest the historical pre-2018 earnings of our foreign subsidiaries. Beginning in 2018, management asserts that only certain foreign subsidiaries are indefinitely reinvested. See “Note 9 – Income Taxes” to the Consolidated Financial Statements in our Annual Report on Form 10-K for the year ended December 31, 2018 for further information related to our income tax positions.
In AprilJuly 2019, we borrowed $75repaid $150 million underof our revolving loan which will be used for general corporate purposes.
46
The Chemours Companyborrowings using cash from the Securitization Facility and available cash.
Cash Flows
The following table sets forth a summary of the net cash provided by (used for) our operating, investing, and financing activities for the threenine months ended March 31,September 30, 2019 and 2018.
|
| Three Months Ended March 31, |
|
| Nine Months Ended September 30, |
| ||||||||||
(Dollars in millions) |
| 2019 |
|
| 2018 |
|
| 2019 |
|
| 2018 |
| ||||
Cash (used for) provided by operating activities |
| $ | (44 | ) |
| $ | 196 |
| ||||||||
Cash provided by operating activities |
| $ | 250 |
|
| $ | 881 |
| ||||||||
Cash used for investing activities |
|
| (134 | ) |
|
| (58 | ) |
|
| (387 | ) |
|
| (327 | ) |
Cash used for financing activities |
|
| (324 | ) |
|
| (271 | ) |
|
| (360 | ) |
|
| (823 | ) |
Operating Activities
We used $44 million in cash flows for our operating activities during the three months ended March 31, 2019, compared with the receipt of $196received $250 and $881 million in cash flows from our operating activities forduring the same period in 2018.nine months ended September 30, 2019 and 2018, respectively. The decrease in cash flows from our operating activities for the threenine months ended March 31,September 30, 2019 was primarily attributable to a decrease in our net income, as well as an increase in our operatingnet cash outflows for working capital items, primarily due to payments on our accounts payable and certain other accrued expenses.liabilities.
55
The Chemours Company
Investing Activities
We used $134$387 million and $58$327 million in cash flows for our investing activities during the threenine months ended March 31,September 30, 2019 and 2018, respectively. Our investing cash outflows forduring the threenine months ended March 31,September 30, 2019 were primarily attributable to $133 million$385 in payments for purchases of property, plant, and equipment. Our
For the nine months ended September 30, 2018, our investing cash outflows for the three months ended March 31, 2018 were primarily attributable to $102 million in purchases of property, plant, and equipment whichfor $344 million, as well as $37 million in total cash consideration payments for the acquisition of ICOR International, Inc. in April 2018. These cash outflows were somewhat offset by $39$46 million in net proceeds received from the sales of assets and businesses, primarily attributable to the sale of our Linden, New Jersey site.site in March 2018 for $39 million, and $8 million in net foreign exchange contract settlements.
Financing Activities
We used $324$360 million and $271$823 million in cash flows for our financing activities during the threenine months ended March 31,September 30, 2019 and 2018, respectively. Our financing cash outflows forduring the threenine months ended March 31,September 30, 2019 were primarily attributable to $255the following: $322 million in purchases of our issued and outstanding common stock under our share repurchase program $42in connection with our capital allocation activities; $124 million in payments for cash dividends,dividends; and, $30 million in payments for withholding taxes on certain of our vested stock-based compensation awards. We also drew $150 million on our revolving credit facility for general corporate purposes. We subsequently repaid the revolver borrowing in full, primarily using the $125 million proceeds from the Securitization Facility, as well as available cash. The Securitization Facility is further described in “Note 17 – Debt” to the Interim Consolidated Financial Statements.
Our financing cash outflows forduring the threenine months ended March 31,September 30, 2018 were primarily attributable to $240debt repayments of $675 million and debt extinguishment payments of $29 million for “make-whole” and early prepayment premiums in purchasesconnection with our debt transactions during the second quarter (discussed further under the heading “Credit Facilities and Notes” within this MD&A). Additionally, we made cash payments totaling $520 million for the repurchase of approximately 10.9 million shares of our issued and outstanding common stock under our share repurchase program,programs, and $31paid dividends amounting to $106 million during the nine months then-ended. These cash outflows were somewhat offset by $520 million in payments for cash dividends.net proceeds received from the issuance of our euro-denominated 4.000% senior unsecured notes due May 2026 (2026 Euro Notes) in June 2018.
Current Assets
The following table sets forth the components of our current assets at March 31,September 30, 2019 and December 31, 2018.
(Dollars in millions) |
| March 31, 2019 |
|
| December 31, 2018 |
|
| September 30, 2019 |
|
| December 31, 2018 |
| ||||
Cash and cash equivalents |
| $ | 697 |
|
| $ | 1,201 |
|
| $ | 694 |
|
| $ | 1,201 |
|
Accounts and notes receivable, net |
|
| 847 |
|
|
| 861 |
|
|
| 832 |
|
|
| 861 |
|
Inventories |
|
| 1,218 |
|
|
| 1,147 |
|
|
| 1,223 |
|
|
| 1,147 |
|
Prepaid expenses and other |
|
| 85 |
|
|
| 84 |
|
|
| 78 |
|
|
| 84 |
|
Total current assets |
| $ | 2,847 |
|
| $ | 3,293 |
|
| $ | 2,827 |
|
| $ | 3,293 |
|
Our accounts and notes receivable, net decreased by $14$29 million (or 2%3%) to $847$832 million at March 31,September 30, 2019, compared with accounts and notes receivable, net of $861 million at December 31, 2018. The decrease in our accounts and notes receivable, net at March 31,September 30, 2019 was primarily attributable to the timing of payments from our customers and a decrease in our net sales for the first quarter of 2019, compared with the fourth quarter of 2018.customers.
Our inventories increased by $71$76 million (or 6%7%) to $1.2 billion at March 31,September 30, 2019, compared with inventories of $1.1 billion at December 31, 2018. The increase in our inventories at March 31,September 30, 2019 was primarily attributable to an increase in our raw materials, stores, and supplies inventories due to the strategic acquisition of ore in our Titanium Technologies segment, and lower net sales volume for the three months ended March 31, 2019.segment.
Our prepaid expenses and other assets remained largely unchanged at $85decreased by $6 million (or 7%) to $78 million at March 31,September 30, 2019, compared with prepaid expenses and other assets of $84 million at December 31, 2018. The decrease in our prepaid expenses and other assets at September 30, 2019 was primarily attributable to a decrease in prepaid income tax balances, which was partially offset by prepaid insurance premiums.
4756
The Chemours Company
Current Liabilities
The following table sets forth the components of our current liabilities at March 31,September 30, 2019 and December 31, 2018.
(Dollars in millions) |
| March 31, 2019 |
|
| December 31, 2018 |
|
| September 30, 2019 |
|
| December 31, 2018 |
| ||||
Accounts payable |
| $ | 1,042 |
|
| $ | 1,137 |
|
| $ | 948 |
|
| $ | 1,137 |
|
Current maturities of long-term debt |
|
| 13 |
|
|
| 13 |
| ||||||||
Short-term and current maturities of long-term debt |
|
| 149 |
|
|
| 13 |
| ||||||||
Other accrued liabilities |
|
| 517 |
|
|
| 559 |
|
|
| 546 |
|
|
| 559 |
|
Total current liabilities |
| $ | 1,572 |
|
| $ | 1,709 |
|
| $ | 1,643 |
|
| $ | 1,709 |
|
Our accounts payable decreased by $95$189 million (or 8%17%) to $1.0 billion$948 million at March 31,September 30, 2019, compared with accounts payable of $1.1 billion at December 31, 2018. The decrease in our accounts payable at March 31,September 30, 2019 was primarily attributable to the timing of vendor payments.payments to our vendors.
Our short-term and current maturities of long-term debt remained largely unchangedincreased by $136 million (or greater than 100%) to $149 million at September 30, 2019, compared with current maturities of long-term debt of $13 million at March 31, 2019 and December 31, 2018. The increase in our short-term and current maturities of long-term debt was primarily attributable to $122 million for the Securitization Facility, $9 for financed insurance premiums, and $5 for the current portion of finance lease liability.
Our other accrued liabilities decreased by $42$13 million (or 8%2%) to $517$546 million at March 31,September 30, 2019, compared with other accrued liabilities of $559 million at December 31, 2018. The decrease in our other accrued liabilities at September 30, 2019 was primarily attributable to lower accrued compensation and employee-related costs, payments of certain accrued expenses, and changesdecreases in accrued litigation and environmental remediation costs. The decrease in our accrued liabilities for litigation and environmental remediation costs is the net result of an additional $27 million in charges under the final Consent Order to settle certain litigation and other matters at our Fayetteville, North Carolina facility, less payments and the reclassification of certain amounts to non-current liabilities on our consolidated balance sheets. These decreases were somewhat offset by our recognition of an operating lease liability in connection with our adoption of the new leasing standard on January 1, 2019, and higher amounts foran increase in accrued interest in connection with the timing of scheduled interest payments on our debt. For a more detailed discussion regarding the final Consent Order for our Fayetteville facility, see “Note 19 – Commitments and Contingent Liabilities” to the Interim Consolidated Financial Statements. For a more detailed discussion regarding our adoption of the new leasing standard, see “Note 2 – Recent Accounting Pronouncements” and “Note 12 – Leases” to the Interim Consolidated Financial Statements.interest.
Credit Facilities and Notes
See “Note 17 – Debt” to the Interim Consolidated Financial Statements and “Note 19 – Debt” to the Consolidated Financial Statements in our Annual Report on Form 10-K for the year ended December 31, 2018 for a discussion of our credit facilities and notes.
Supplier Financing
We maintain global paying services agreements with several financial institutions. Under these agreements, the financial institutions act as our paying agents with respect to accounts payable due to our suppliers who elect to participate in the program. The agreements allow our suppliers to sell their receivables to one of the participating financial institutions at the discretion of both parties on terms that are negotiated between the supplier and the respective financial institution. Our obligations to our suppliers, including the amounts due and scheduled payment dates, are not impacted by our suppliers’ decisions to sell their receivables under this program. At March 31,September 30, 2019 and December 31, 2018, the total payment instructions from us amounted to $120$116 million and $210 million, respectively. Pursuant to their agreement with one of the financial institutions, certain suppliers may elect to be paid early at their discretion. The available capacity under these programs can vary based on the number of investors and/or financial institutions participating in these programs at any point in time.
Contractual Obligations
Our contractual obligations at March 31,September 30, 2019 did not significantly change from the contractual obligations previously disclosed in our Annual Report on Form 10-K for the year ended December 31, 2018.
Off Balance Sheet Arrangements
Historically, we have not made significant payments to satisfy guarantee obligations; however, we believe we have the financial resources to satisfy these guarantees in the event required.
48
The Chemours Company
Critical Accounting Policies and Estimates
Our significant accounting policies are described in our MD&A and “Note 3 – Summary of Significant Accounting Policies” to the Consolidated Financial Statements in our Annual Report on Form 10-K for the year ended December 31, 2018. There have been no material changes to thethese critical accounting policies and estimates previously disclosed in our Annual Report on Form 10-K for the year ended December 31, 2018, except as described below and in “Note 2 – Recent Accounting Pronouncements” to the Interim Consolidated Financial Statements.
57
The Chemours Company
Netherlands Pension Plan
In accordance with the planned restructuring of our Netherlands pension plan (“Plan”), $935 million of annuity contracts were purchased by the Plan in July 2019 in an amount sufficient to pay off the pension benefits of the Plan’s vested retirees and inactive participants. The Dutch National Bank (“DNB”) responded on October 10, 2019 with a letter of non-objection to our planned transaction as a partial settlement of the Plan. Having received this, the insurance company is in the process of assuming direct and irrevocable responsibility for the payment of pension benefits to the Plan’s vested retirees and inactive participants. The irrevocable transfer of risk will then trigger a partial settlement of the Plan, which we expect will result in a non-cash settlement charge between $350 million to $400 million during the fourth quarter of 2019, most of which is already recorded as a component of our accumulated other comprehensive loss. The purchase of these annuity contracts was fully-funded by the Plan’s investment trust.
Goodwill
The excess of the purchase price over the estimated fair value of the net assets acquired in a business combination, including any identified intangible assets, is recorded as goodwill. Chemours tests its goodwill for impairment at least annually on October 1; however, these tests are performed more frequently when events or changes in circumstances indicate that the asset may be impaired. Goodwill is evaluated for impairment at the reporting unit level, which is defined as an operating segment, or one level below an operating segment. A reporting unit is the level at which discrete financial information is available and reviewed by business management on a regular basis. An impairment exists when the carrying value of a reporting unit exceeds its fair value. The amount of impairment loss recognized in the consolidated statements of operations is equal to the excess of a reporting unit’s carrying value over its fair value, which is limited to the total amount of goodwill allocated to the reporting unit.
During the third quarter of 2019, due to several factors including sustained declines in the Company’s share price, regulatory developments, and declines in actual and planned earnings compared with expectations, it was determined that an interim test of goodwill for impairment was necessary as of August 31, 2019 for our Fluorochemicals and Fluoropolymers reporting units.
The fair value of each reporting unit was determined by using a combination of income-based and market-based valuation techniques. The results of these valuations were each weighted 50%. These valuation models incorporated a number of assumptions and judgments surrounding general market and economic conditions, short and long-term revenue growth rates, gross margins and prospective financial information surrounding future reporting unit cash flows. Projections are based on internal forecasts of future business performance and are based on growth assumptions which exclude business growth opportunities not yet fully realized. Discount rate and market multiple assumptions were determined based on relevant peer companies in the chemicals sector, and for the Fluoropolymers reporting unit were 9.75% and 6.2 times Adjusted EBITDA, respectively.
As of August 31, 2019, the estimated fair value of the Fluoropolymers reporting unit was 16% higher than its carrying value. Fluoropolymers has $56 million of goodwill. Changing the weighting of the market and income approaches used for Fluoropolymers could have reduced the excess of estimated fair value over carrying value to 14%. Assuming all other factors remain the same, a 200-basis point increase in the discount rate would decrease the excess of estimated fair value over carrying value to 4%; a 1% decrease in the long-term growth rate would decrease the excess of estimated fair value over carrying value to 11%; and a 15% decrease in the market multiple assumption would decrease the excess of estimated fair value over carrying value to 7%. Under each of these sensitivity scenarios, the Fluoropolymers reporting unit's fair value exceeded its carrying value.
As of August 31, 2019, the estimated fair value of the Fluorochemicals reporting unit was more than 300% higher than its carrying value.
No adjustments to the carrying value of goodwill were necessary.
Recent Accounting Pronouncements
See “Note 2 – Recent Accounting Pronouncements” to the Interim Consolidated Financial Statements for a discussion about our recent accounting pronouncements.
Environmental Matters
Consistent with our values and our Environment, Health, Safety, and SafetyCorporate Responsibility policy, we are committed to preventing releases to the environment at our manufacturing sites to keep our people and communities safe, and to be good stewards of the environment. We are also subject to environmental laws and regulations relating to the protection of the environment. We believe that, as a general matter, our policies, standards, and procedures are properly designed to prevent unreasonable risk of harm to people and the environment, and that our handling, manufacture, use, and disposal of hazardous substances are in accordance with applicable environmental laws and regulations.
58
The Chemours Company
Environmental Remediation
In large part, because of past operations, operations of predecessor companies, or past disposal practices, we, like many other similar companies, have clean-up responsibilities and associated remediation costs, and are subject to claims by other parties, including claims for matters that are liabilities of DuPont and its subsidiaries that we may be required to indemnify pursuant to the separation-related agreements executed prior to our separation from DuPont.
Our environmental reserve includes estimated costs, including certain accruable costs associated with on-site capital projects, relatedrelated to a number of sites for which it is probable that environmental remediation will be required, whether or not subject to enforcement activities, as well as those obligations that result from environmental laws such as the Comprehensive Environmental Response Compensation and Liability Act (“CERCLA,” often referred to as “Superfund”), the Resource Conservation and Recovery Act (“RCRA”), and similar federal, state, local, and foreign laws. These laws require certain investigative, remediation, and restoration activities at sites where we conduct or once conducted operations or at sites where our generated waste was disposed. At March 31,September 30, 2019 and December 31, 2018, our consolidated balance sheets included environmental remediation accrualsliabilities of $233$239 million and $226 million, respectively, relating to these matters, which, as discussed in further detail below, included $25$29 million and $10 million for our Fayetteville, North Carolina facility at March 31,September 30, 2019 and December 31, 2018, respectively. In management’s opinion, our environmental remediation accrualsliabilities are appropriate based on existing facts and circumstances.
As remediation efforts progress, sites move from the investigation phase (“Investigation”) to the active clean-up phase (“Active Remediation”), and as construction is completed at Active Remediation sites, those sites move to the operation, maintenance, and monitoring (“OM&M”), or closure phase. As final clean-up activities for some significant sites are completed over the next several years, we expect our annual expenses related to these active sites to decline over time. The time frame for a site to go through all phases of remediation (Investigation and Active Remediation) may take about 15 to 20 years, followed by several years of OM&M activities. Remediation activities, including OM&M activities, vary substantially in duration and cost from site to site. These activities, and their associated costs, depend on the mix of unique site characteristics, evolving remediation technologies, and diverse regulatory requirements, as well as the presence or absence of other potentially responsible parties (“PRPs”). In addition, for claims that we may be required to indemnify DuPont pursuant to the separation-related agreements, we and DuPont may have limited available information for certain sites or are in the early stages of discussions with regulators. For these sites, in particular, there may be considerable variability between the clean-up activities that are currently being undertaken or planned and the ultimate actions that could be required. Therefore, considerable uncertainty exists with respect to environmental remediation costs, and, under adverse changes in circumstances, although deemed remote, the potential liability may range up to approximately $450$570 million above the amount accrued at March 31,September 30, 2019. In general, uncertainty is greatest and the range of potential liability is widest in the Investigation phase, narrowing over time as regulatory agencies approve site remedial plans. As a result, uncertainty is reduced, and sites ultimately move into OM&M, as needed. As more sites advance from Investigation to Active Remediation to OM&M or closure, the upper end of the range of potential liability is expected to decrease over time.
Some remediation sites will achieve site closure and will require no further action to protect people and the environment and comply with laws and regulations. At certain sites, we expect that there will continue to be some level of remediation activity due to ongoing OM&M of remedial systems. In addition, portfolio changes, such as an acquisition or divestiture, or notification as a PRP for a multi-party Superfund site, could result in additional remediation activity and potentially additional accrual.
49
The Chemours Company
Management does not believe that any loss, in excess of amounts accrued, related to remediation activities at any individual site will have a material impact on our financial position, results of operations, or cash flows for any given year, as such obligation can be satisfied or settled over many years.
Significant Environmental Remediation Sites
While there are many remediation sites that contribute to theour total accrued environmental remediation accrual,liabilities at September 30, 2019 and December 31, 2018, the following table sets forth the sites that are the most significant.
(Dollars in millions) |
| March 31, 2019 |
|
| December 31, 2018 |
|
| September 30, 2019 |
|
| December 31, 2018 |
| ||||
Chambers Works, Deepwater, New Jersey |
| $ | 18 |
|
| $ | 18 |
|
| $ | 20 |
|
| $ | 18 |
|
East Chicago, Indiana |
|
| 20 |
|
|
| 21 |
|
|
| 18 |
|
|
| 21 |
|
Fayetteville Works, Fayetteville, North Carolina |
|
| 25 |
|
|
| 10 |
|
|
| 29 |
|
|
| 10 |
|
Pompton Lakes, New Jersey |
|
| 45 |
|
|
| 45 |
|
|
| 43 |
|
|
| 45 |
|
USS Lead, East Chicago, Indiana |
|
| 11 |
|
|
| 15 |
|
|
| 14 |
|
|
| 15 |
|
All other sites |
|
| 114 |
|
|
| 117 |
|
|
| 115 |
|
|
| 117 |
|
Total accrued environmental remediation |
| $ | 233 |
|
| $ | 226 |
|
| $ | 239 |
|
| $ | 226 |
|
59
The Chemours Company
The five sites listed above represented 51%52% and 48% of our total accrued environmental remediation accrualliabilities at March 31,September 30, 2019 and December 31, 2018, respectively. For these five sites, we expect to spend, in the aggregate, $70$72 million over the next three years. For all other sites, we expect to spend $73 million over the next three years.
Chambers Works, Deepwater, New Jersey
The Chambers Works complex is located on the eastern shore of the Delaware River in Deepwater, Salem County, New Jersey. The site comprises the former Carneys Point Works in the northern area and the Chambers Works manufacturing area in the southern area. Site operations began in 1892 when the former Carneys Point smokeless gunpowder plant was constructed at the northern end of Carneys Point. Site operations began in the manufacturing area around 1914 and included the manufacture of dyes, aromatics, elastomers, chlorofluorocarbons, and tetraethyl lead. We continue to manufacture a variety of fluorochemicals and finished products at Chambers Works. In addition, three tenants operate processes at Chambers Works including steam/electricity generation, industrial gas production, and the manufacture of intermediate chemicals. As a result of over 100 years of continuous industrial activity, site soils and groundwater have been impacted by chemical releases.
In response to identified groundwater contamination, a groundwater interceptor well system (“IWS”) was installed in 1970, which was designed to contain contaminated groundwater and restrict off-site migration. Additional remediation is being completed under a federal RCRA Corrective Action permit. The site has been studied extensively over the years, and more than 25 remedial actions have been completed to date and engineering and institutional controls put in place to ensure protection of people and the environment. In the fourth quarter of 2017, a site perimeter sheet pile barrier intended to more efficiently contain groundwater was completed.
Remaining work beyond continued operation of the IWS and groundwater monitoring includes completion of various targeted studies on site and in adjacent water bodies to close investigation data gaps, as well as selection and implementation of final remedies under RCRA Corrective Action for various solid waste management units and areas of concern not yet addressed through interim measures.
East Chicago, Indiana
East Chicago is a former manufacturing facility we own in East Chicago, Lake County, Indiana. The approximate 440-acre site is bounded to the south by the east branch of the Grand Calumet River, to the east and north by residential and commercial areas, and to the west by industrial areas, including a former lead processing facility. The inorganic chemicals unit on site produced various chloride, ammonia, and zinc products and inorganic agricultural chemicals beginning in 1892 until 1986. Organic chemical manufacturing began in 1944, consisting primarily of chlorofluorocarbons production. Current operations, including support activities, now cover 28 acres of the site. The remaining business was sold to W.R. Grace Company (“Grace”) in early 2000, and Grace operates the unit as a tenant. Approximately 172 acres of the site were never developed and are managed by The Nature Conservancy for habitat preservation.
A comprehensive evaluation of soil and groundwater conditions at the site was performed as part of the RCRA Corrective Action process. Studies of historical site impacts began in 1983 in response to preliminary CERCLA actions undertaken by the U.S. Environmental Protection Agency (“EPA”). The EPA eventually issued an Administrative Order on Consent for the site in 1997. The order specified that remediation work be performed under RCRA Corrective Action authority. Work has proceeded under the RCRA Corrective Action process since that time.
50
The Chemours Company
Subsequent investigations included the preparation of initial environmental site assessments and multiple phases of investigation. In 2002, as an interim remedial measure, two 2,000-foot long permeable reactive barrier treatment walls were installed along the northern property boundary to address migration of chemicals in groundwater. Since that time, the investigation process has been completed and approved by the EPA, and the final remedy for the site was issued by the EPA in July 2018.
Fayetteville Works, Fayetteville, North Carolina
The Fayetteville Works facility is located 15 miles southeast of the City of Fayetteville in Cumberland and Bladen counties, North Carolina. The facility encompasses approximately 2,200 acres, which were purchased by DuPont in 1970, and are bounded to the east by the Cape Fear River and to the west by North Carolina Highway 87. Currently, the site manufactures plastic sheeting, fluorochemicals, and intermediates for plastics manufacturing. A former manufacturing area, which was sold in 1992, produced nylon strapping and elastomeric tape. DuPont sold its Butacite® and SentryGlas® manufacturing units to Kuraray America, Inc. in JuneSeptember 2014. In July 2015, upon our separation from DuPont, we became the owner of the Fayetteville Works land assets along with fluoromonomers, Nafion® membranes, and the related polymer processing aid manufacturing units. A polyvinyl fluoride resin manufacturing unit remained with DuPont.
60
The Chemours Company
Beginning in 1996, several stages of site investigation were conducted under NC DEQ oversight, as required by the facility's hazardous waste permit. In addition, the site has voluntarily agreed to agency requests for additional investigations of the potential release of “PFAS” (perfluoroalkyl and polyfluoroalkyl substances) beginning with “PFOA” (collectively, perfluorooctanoic acids and its salts, including the ammonium salt) in 2006. As a result of detection of the polymerization processing aid hexafluoropropylene oxide dimer acid (“HFPO Dimer Acid,” sometimes referred to as “GenX” or “C3 Dimer Acid”) in on-site groundwater wells during our investigations in 2017, the NC DEQ issued a Notice of Violation (“NOV”) on September 6, 2017 alleging violations of North Carolina water quality statutes and requiring further response. Since that time, and in response to three additional NOVs issued by NC DEQ, we have worked cooperatively with the agency to investigate and address releases of PFAS to on-site and off-site groundwater and surface water.
As discussed under the "Recent Developments" section of this MD&A, and further in “Note 19 – Commitments and Contingent Liabilities” to the Interim Consolidated Financial Statements, we and the NC DEQ have filed a final Consent Order that comprehensively addressed various issues, NOVs, and court filings made by the NC DEQ regarding our Fayetteville, North Carolina facility and resolved litigations filed by the NC DEQ and Cape Fear River Watch, a non-profit organization. Of the total estimated liability of $83 million accrued for this matter March 31,at September 30, 2019, $25$29 million is included within our overall environmental remediation accrual,liabilities, and is related to on-site groundwater and surface water conditions that require further study and clean-up action, and the estimated accruable costs associated with certain on-site capital projects under the final Consent Order.
Pompton Lakes, New Jersey
During the 20th century, blasting caps, fuses, and related materials were manufactured at Pompton Lakes, Passaic County, New Jersey. Operating activities at the site were ceased in the mid-1990s. The primary contaminants in the soil and sediments are lead and mercury. Groundwater contaminants include volatile organic compounds. Under the authority of the EPA and the New Jersey Department of Environmental Protection (“NJ DEP”), remedial actions at the site are focused on investigating and cleaning-up the area. Groundwater monitoring at the site is ongoing, and we have installed and continue to install vapor mitigation systems at residences within the groundwater plume. In addition, we are further assessing groundwater conditions. In JuneSeptember 2015, the EPA issued a modification to the site’s RCRA permit that requires us to dredge mercury contamination from a 36-acre area of the lake and remove sediment from two other areas of the lake near the shoreline. The remediation activities commenced when permits and implementation plans were approved in May 2016, and work on the lake dredging project is now complete.
U.S. Smelter and Lead Refinery, Inc., East Chicago, Indiana
The U.S. Smelter and Lead Refinery, Inc. (“USS Lead”) Superfund site is located in the Calumet neighborhood of East Chicago, Lake County, Indiana. The site includes the former USS Lead facility along with nearby commercial, municipal, and residential areas. The primary compounds of interest are lead and arsenic, which may be found in soils within the impacted area. The EPA is directing and organizing remediation on this site, and we are one of a number of parties working cooperatively with the EPA on the safe and timely completion of this work. DuPont’s former East Chicago manufacturing facility was located adjacent to the site, and DuPont assigned responsibility for the site to us in the separation agreement.
51
The Chemours Company
The USS Lead Superfund site was listed on the National Priorities List in 2009. To facilitate negotiations with PRPs, the EPA divided the residential part of the USS Lead Superfund site into three zones, referred to as Zone 1, Zone 2, and Zone 3. The division into three zones resulted in Atlantic Richfield Co. (“Atlantic Richfield”) and DuPont entering into an agreement in 2014 with the EPA and the State of Indiana to reimburse the EPA’s costs to implement clean-up in Zone 1 and Zone 3. More recently, in March 2017, we and three other parties – Atlantic Richfield, DuPont, and the U.S. Metals Refining Co. (“U.S. Metals”) – entered into an administrative order on consent to reimburse the EPA’s costs to clean-up a portion of Zone 2. In March 2018, the EPA issued a Unilateral Administrative Order for the remainder of the Zone 2 work to five parties, including us, Atlantic Richfield, DuPont, U.S. Metals, and USS Lead Muller Group, and these parties have entered into an interim allocation agreement to complete that work by the end of 2019. There is uncertainty as to whether these parties will be able to agree on a final allocation for Zone 2 and/or the other Zones, and whether any additional PRPs may be identified.
The environmental accrual for USS Lead continues to be based on the 2012 Record of Decision (“ROD”) and Statement of Work for Zone 1 and the associated portion of Zone 3 not yet completed, as well as the current estimate of our share of remaining Zone 2 clean-up. The EPA released a proposed amendment to the 2012 ROD for a portion of Zone 1 in December 2018 (following its August 2018 Feasibility Study Addendum), with its recommended option based on future residential use. However, the proposed amendment was sent out for public comment with the EPA’s statement that the remedy basis and cost may change based on community input on future land use. The EPA’s final decision iswas expected some timesometime in the first half of 2019.2019, but has not yet been released. We expect that our future costs for Zone 1 will be contingent on this remedy decision, as well as any final allocation between PRPs.
61
The Chemours Company
New Jersey Department of Environmental Protection Directives and Litigation
In March 2019, the NJ DEP issued two Directives and filed four lawsuits against Chemours and other defendants. Further discussion related to these matters is included in “Note 19 – Commitments and Contingent Liabilities” to the Interim Consolidated Financial Statements.
PFOA
See our discussion under the heading “PFOA” in “Note 19 – Commitments and Contingent Liabilities” to the Interim Consolidated Financial Statements.
GenX
On June 26, 2019 the Member States Committee of the European Chemicals Agency (“ECHA”) voted to list HFPO Dimer Acid as a Substance of Very High Concern. The vote was based on Article 57(f) – equivalent level of concern having probable serious effects to the environment. This identification does not impose immediate regulatory restriction or obligations, but may lead to a future authorization or restriction of the substance. On September 24, 2019 Chemours filed an application with the EU Court of Justice for the annulment of the decision of ECHA to list HFPO Dimer Acid as a Substance of Very High Concern.
Delaware Chancery Court Lawsuit
In May 2019, we filed a lawsuit in Delaware Chancery Court (“Chancery Court”) against DowDuPont, Inc., Corteva, Inc., and DuPont concerning DuPont’s contention that it is entitled to unlimited indemnity from us for specified liabilities that DuPont assigned to us in the spin-off. The lawsuit requests that the Chancery Court enter a declaratory judgment limiting DuPont’s indemnification rights against us and the transfer of liabilities to us to the actual “high-end maximum realistic exposures” it stated in connection with the spin-off, or, in the alternative, requiring the return of the approximate $4 billion dividend DuPont extracted from us in connection with the spin-off. In response, DuPont has filed a Motion to Dismiss the lawsuit seeking to have the dispute heard in a non-public arbitration rather than the Chancery Court. Many of the potential litigation liabilities discussed in “Note 19 – Commitments and Contingent Liabilities” to the Interim Consolidated Financial Statements are at issue in the lawsuit.
62
The Chemours Company
Non-GAAP Financial Measures
We prepare our interim consolidated financial statements in accordance with generally accepted accounting principles in the U.S. (“GAAP”). To supplement our financial information presented in accordance with GAAP, we provide the following non-GAAP financial measures – Adjusted EBITDA, Adjusted Net Income, Adjusted Earnings per Share (“EPS”), Free Cash Flows (“FCF”), and Return on Invested Capital (“ROIC”) – in order to clarify and provide investors with a better understanding of our performance when analyzing changes in our underlying business between reporting periods and provide for greater transparency with respect to supplemental information used by management in its financial and operational decision-making. We utilize Adjusted EBITDA as the primary measure of segment profitability used by our CODM.
Adjusted EBITDA is defined as income (loss) before income taxes, excluding the following:
| • | interest expense, depreciation, and amortization; |
| • | non-operating pension and other post-retirement employee benefit costs, which represents the components of net periodic pension (income) costs excluding the service cost component; |
| • | exchange (gains) losses included in other income (expense), net; |
| • | restructuring, asset-related, and other charges; |
| • | asset impairments; |
| • | (gains) losses on sales of business or assets; and, |
| • | other items not considered indicative of our ongoing operational performance and expected to occur infrequently. |
Adjusted Net Income is defined as our net income or loss, adjusted for items excluded from Adjusted EBITDA, except interest expense, depreciation, amortization, and certain provision for (benefit from) income tax amounts. Adjusted EPS is presented on a diluted basis and is calculated by dividing Adjusted Net Income by the weighted-average number of our common shares outstanding, accounting for the dilutive impact of our stock-based compensation awards. FCF is defined as our cash flows provided by (used for) operating activities, less purchases of property, plant, and equipment as shown in our consolidated statements of cash flows. ROIC is defined as Adjusted Earnings before Interest and Taxes (“EBIT”), divided by the average of our invested capital, which amounts to our net debt, plus equity.
52
The Chemours Company
We believe the presentation of these non-GAAP financial measures, when used in conjunction with GAAP financial measures, is a useful financial analysis tool that can assist investors in assessing our operating performance and underlying prospects. This analysis should not be considered in isolation or as a substitute for analysis of our results as reported under GAAP. In the future, we may incur expenses similar to those eliminated in this presentation. Our presentation of Adjusted EBITDA, Adjusted Net Income, Adjusted EPS, FCF, and ROIC should not be construed as an inference that our future results will be unaffected by unusual or infrequently occurring items. The non-GAAP financial measures we use may be defined differently from measures with the same or similar names used by other companies. This analysis, as well as the other information provided in this Quarterly Report on Form 10-Q, should be read in conjunction with the Interim Consolidated Financial Statements and notes thereto included in this report, as well as the Consolidated Financial Statements and notes thereto included in our Annual Report on Form 10-K for the year ended December 31, 2018.
63
The Chemours Company
The following table sets forth a reconciliation of Adjusted EBITDA, Adjusted Net Income, and Adjusted EPS to our net income attributable to Chemours for the three and nine months ended March 31,September 30, 2019 and 2018.
|
| Three Months Ended March 31, |
|
| Three Months Ended September 30, |
|
| Nine Months Ended September 30, |
| |||||||||||||||
(Dollars in millions, except per share amounts) |
| 2019 |
|
| 2018 |
|
| 2019 |
|
| 2018 |
|
| 2019 |
|
| 2018 |
| ||||||
Net income attributable to Chemours |
| $ | 94 |
|
| $ | 297 |
|
| $ | 76 |
|
| $ | 275 |
|
| $ | 265 |
|
| $ | 853 |
|
Non-operating pension and other post-retirement employee benefit income |
|
| (3 | ) |
|
| (7 | ) | ||||||||||||||||
Exchange gains, net |
|
| (6 | ) |
|
| — |
| ||||||||||||||||
Non-operating pension and other post-retirement employee benefit cost (income) |
|
| 1 |
|
|
| (4 | ) |
|
| (5 | ) |
|
| (18 | ) | ||||||||
Exchange (gains) losses, net |
|
| (5 | ) |
|
| 6 |
|
|
| (2 | ) |
|
| 4 |
| ||||||||
Restructuring, asset-related, and other charges (1) |
|
| 8 |
|
|
| 10 |
|
|
| 34 |
|
|
| 12 |
|
|
| 49 |
|
|
| 32 |
|
Loss on extinguishment of debt |
|
| — |
|
|
| — |
|
|
| — |
|
|
| 38 |
| ||||||||
Gain on sales of assets and businesses (2) |
|
| — |
|
|
| (42 | ) |
|
| (9 | ) |
|
| — |
|
|
| (11 | ) |
|
| (45 | ) |
Transaction costs |
|
| — |
|
|
| — |
|
|
| 1 |
|
|
| 9 |
| ||||||||
Legal charges (3) |
|
| 29 |
|
|
| 4 |
|
|
| 5 |
|
|
| 34 |
|
|
| 43 |
|
|
| 45 |
|
Adjustments made to income taxes (4) |
|
| (5 | ) |
|
| (5 | ) |
|
| 3 |
|
|
| (41 | ) |
|
| 5 |
|
|
| (54 | ) |
(Benefit from) provision for income taxes relating to reconciling items (5) |
|
| (8 | ) |
|
| 9 |
| ||||||||||||||||
Benefit from income taxes relating to reconciling items (5) |
|
| (7 | ) |
|
| (11 | ) |
|
| (18 | ) |
|
| (15 | ) | ||||||||
Adjusted Net Income |
|
| 109 |
|
|
| 266 |
|
|
| 98 |
|
|
| 271 |
|
|
| 327 |
|
|
| 849 |
|
Net income attributable to non-controlling interests |
|
| — |
|
|
| — |
|
|
| — |
|
|
| 1 |
| ||||||||
Interest expense, net |
|
| 51 |
|
|
| 52 |
|
|
| 53 |
|
|
| 47 |
|
|
| 156 |
|
|
| 148 |
|
Depreciation and amortization |
|
| 76 |
|
|
| 70 |
|
|
| 78 |
|
|
| 71 |
|
|
| 232 |
|
|
| 213 |
|
All remaining provision for income taxes |
|
| 26 |
|
|
| 80 |
|
|
| 19 |
|
|
| 46 |
|
|
| 78 |
|
|
| 188 |
|
Adjusted EBITDA |
| $ | 262 |
|
| $ | 468 |
|
| $ | 248 |
|
| $ | 435 |
|
| $ | 793 |
|
| $ | 1,399 |
|
|
|
|
|
|
|
|
|
|
|
|
|
|
|
|
|
|
|
|
|
|
|
|
|
|
Weighted-average number of common shares outstanding - basic |
|
| 167,866,468 |
|
|
| 182,069,982 |
|
|
| 163,815,483 |
|
|
| 176,489,881 |
|
|
| 165,254,084 |
|
|
| 178,765,676 |
|
Dilutive effect of our employee compensation plans |
|
| 4,194,432 |
|
|
| 6,263,215 |
|
|
| 1,325,380 |
|
|
| 5,387,244 |
|
|
| 2,780,874 |
|
|
| 5,891,072 |
|
Weighted-average number of common shares outstanding - diluted |
|
| 172,060,900 |
|
|
| 188,333,197 |
|
|
| 165,140,863 |
|
|
| 181,877,125 |
|
|
| 168,034,958 |
|
|
| 184,656,748 |
|
|
|
|
|
|
|
|
|
|
|
|
|
|
|
|
|
|
|
|
|
|
|
|
|
|
Per share data |
|
|
|
|
|
|
|
|
|
|
|
|
|
|
|
|
|
|
|
|
|
|
|
|
Basic earnings per share of common stock |
| $ | 0.56 |
|
| $ | 1.63 |
|
| $ | 0.46 |
|
| $ | 1.56 |
|
| $ | 1.60 |
|
| $ | 4.77 |
|
Diluted earnings per share of common stock |
|
| 0.55 |
|
|
| 1.58 |
|
|
| 0.46 |
|
|
| 1.51 |
|
|
| 1.58 |
|
|
| 4.62 |
|
Adjusted basic earnings per share of common stock |
|
| 0.65 |
|
|
| 1.46 |
|
|
| 0.60 |
|
|
| 1.54 |
|
|
| 1.97 |
|
|
| 4.75 |
|
Adjusted diluted earnings per share of common stock |
|
| 0.63 |
|
|
| 1.41 |
|
|
| 0.59 |
|
|
| 1.49 |
|
|
| 1.94 |
|
|
| 4.60 |
|
| (1) | Includes restructuring, asset-related, and other charges, which are discussed in further detail in “Note 5 – Restructuring, Asset-related, and Other Charges” to the Interim Consolidated Financial |
|
| (2) | For the three and nine months ended September 30, 2019, the Company recognized a non-cash gain of $9 million related to the sale of the Company’s Repauno, New Jersey site. For the |
|
| (3) | Includes litigation settlements, PFOA drinking water treatment accruals, and other legal charges. For the three and nine months ended |
|
| (4) | Includes the removal of certain discrete income tax impacts within our provision for income |
|
| (5) | The income tax impacts included in this caption are determined using the applicable rates in the taxing jurisdictions in which income or expense occurred and represents both current and deferred income tax expense or benefit based on the nature of the non-GAAP financial measure. |
|
5364
The Chemours Company
The following table sets forth a reconciliation of FCF to our cash flows provided by operating activities for the threenine months ended March 31,September 30, 2019 and 2018.
|
| Three Months Ended March 31, |
|
| Nine Months Ended September 30, |
| ||||||||||
(Dollars in millions) |
| 2019 |
|
| 2018 |
|
| 2019 |
|
| 2018 |
| ||||
Cash flows (used for) provided by operating activities |
| $ | (44 | ) |
| $ | 196 |
| ||||||||
Cash flows provided by operating activities |
| $ | 250 |
|
| $ | 881 |
| ||||||||
Less: Purchases of property, plant, and equipment |
|
| (133 | ) |
|
| (102 | ) |
|
| (385 | ) |
|
| (344 | ) |
Free Cash Flows |
| $ | (177 | ) |
| $ | 94 |
|
| $ | (135 | ) |
| $ | 537 |
|
The following table sets forth a reconciliation of invested capital, net, a component of ROIC, to our total debt, equity, and cash and cash equivalents at March 31,September 30, 2019 and 2018.
|
| Period Ended March 31, |
|
| Period Ended September 30, |
| ||||||||||
(Dollars in millions) |
| 2019 |
|
| 2018 |
|
| 2019 |
|
| 2018 |
| ||||
Adjusted EBITDA (1) |
| $ | 1,535 |
|
| $ | 1,605 |
|
| $ | 1,134 |
|
| $ | 1,794 |
|
Less: Depreciation and amortization (1) |
|
| (289 | ) |
|
| (272 | ) |
|
| (303 | ) |
|
| (281 | ) |
Adjusted EBIT |
|
| 1,246 |
|
|
| 1,333 |
|
|
| 831 |
|
|
| 1,513 |
|
|
|
|
|
|
|
|
|
|
|
|
|
|
|
|
|
|
Total debt |
|
| 3,978 |
|
|
| 4,155 |
|
|
| 4,156 |
|
|
| 3,999 |
|
Total equity |
|
| 816 |
|
|
| 1,002 |
|
|
| 843 |
|
|
| 1,146 |
|
Less: Cash and cash equivalents |
|
| (697 | ) |
|
| (1,434 | ) |
|
| (694 | ) |
|
| (1,275 | ) |
Invested capital, net |
| $ | 4,097 |
|
| $ | 3,723 |
|
| $ | 4,305 |
|
| $ | 3,870 |
|
|
|
|
|
|
|
|
|
|
|
|
|
|
|
|
|
|
Average invested capital (2) |
| $ | 3,853 |
|
| $ | 3,327 |
|
| $ | 4,094 |
|
| $ | 3,637 |
|
|
|
|
|
|
|
|
|
|
|
|
|
|
|
|
|
|
Return on Invested Capital |
|
| 32.3 | % |
|
| 40.1 | % |
|
| 20.3 | % |
|
| 41.6 | % |
| (1) | Based on amounts for the trailing 12 months ended |
| (2) | Average invested capital is based on a five-quarter trailing average of invested capital, net. |
5465
The Chemours Company
Item 3. QUANTITATIVE AND QUALITATIVE DISCLOSURES ABOUT MARKET RISK
We are exposed to changes in foreign currency exchange rates because of our global operations. As a result, we have assets, liabilities, and cash flows denominated in a variety of foreign currencies. We are also exposed to changes in the prices of certain commodities that we use in production. Changes in these rates and commodity prices may have an impact on our future cash flows and earnings. We manage these risks through normal operating and financing activities and, when deemed appropriate, through the use of derivative financial instruments. We do not enter into derivative financial instruments for trading or speculative purposes.
By using derivative financial instruments, we are subject to credit and market risk. The fair values of the derivative financial instruments are determined by using valuation models whose inputs are derived using market observable inputs, and reflects the asset or liability position as of the end of each reporting period. When the fair value of a derivative contract is positive, the counterparty owes us, thus creating a receivable risk for us. We are exposed to counterparty credit risk in the event of non-performance by counterparties to our derivative agreements. We minimize counterparty credit (or repayment) risk by entering into transactions with major financial institutions of investment grade credit ratings.
Foreign Currency Risks
We enter into foreign currency forward contracts to minimize the volatility in our earnings related to foreign exchange gains and losses resulting from remeasuring our monetary assets and liabilities that are denominated in non-functional currencies, and any gains and losses from the foreign currency forward contracts are intended to be offset by any gains or losses from the remeasurement of the underlying monetary assets and liabilities. These derivatives are stand-alone and, except as described below, have not been designated as a hedge. At March 31,September 30, 2019, we had 1513 foreign currency forward contracts outstanding, with an aggregate gross notional U.S. dollar equivalent of $424$399 million, the fair value of which amounted to a net gain of less than $1 million. At December 31, 2018, we had 20 foreign currency forward contracts outstanding, with an aggregate gross notional U.S. dollar equivalent of $503 million, the fair value of which amounted also to less than $1 million. We recognized a net lossgains of $2$1 million and a net gain of $4less than $1 million for the three and nine months ended March 31,September 30, 2019, respectively, and net gains of $14 million and $8 million for the three and nine months ended September 30, 2018, respectively, within other income, net related to our non-designated foreign currency forward contracts.
We enter certain qualifying foreign currency forward contracts under a cash flow hedge program to mitigate the risks associated with fluctuations in the euro against the U.S. dollar for forecasted U.S. dollar-denominated inventory purchases in certain of our international subsidiaries that use the euro as their functional currency. At March 31,September 30, 2019, we had 95142 foreign currency forward contracts outstanding under our cash flow hedge program with an aggregate notional U.S. dollar equivalent of $158$128 million, the fair value of which amounted to $3$4 million of net unrealized gain. At December 31, 2018, we had 75 foreign currency forward contracts outstanding under our cash flow hedge program with an aggregate notional U.S. dollar equivalent of $143 million, the fair value of which also amounted to $3 million of net unrealized gain. We recognized pre-tax gains of $5 million and $7 million for the three and nine months ended September 30, 2019, and a pre-tax loss of $1 million and a pre-tax gain of $2$6 million for the three and nine months ended March 31, 2019September 30, 2018, on our cash flow hedge within accumulated other comprehensive loss. For the three and nine months ended March 31,September 30, 2019, $3$2 million and $8 million of gain was reclassified to the cost of goods sold from accumulated other comprehensive loss, respectively. For the three and nine months ended September 30, 2018 $1 million of gain was reclassified to the cost of goods sold from accumulated other comprehensive loss.
We designated our euro-denominated debt as a hedge of our net investment in certain of our international subsidiaries that use the euro as their functional currency in order to reduce the volatility in stockholders’ equity caused by changes in foreign currency exchange rates of the euro with respect to the U.S. dollar. We recognized a pre-tax gaingains of $10$33 million and $36 million for the three and nine months ended September 30, 2019, respectively, and a pre-tax loss of $34$11 million and a pre-tax gain of $2 million for the three and nine months ended September 30, 2018, respectively, on our net investment hedge within accumulated other comprehensive loss for the three months ended March 31, 2019 and 2018, respectively.loss.
Our risk management programs and the underlying exposures are closely correlated, such that the potential loss in value for the risk management portfolio described above would be largely offset by the changes in the value of the underlying exposures. See “Note 22 – Financial Instruments” to the Interim Consolidated Financial Statements for further information.
5566
The Chemours Company
Item 4. CONTROLS AND PROCEDURES
Disclosure Controls and Procedures
We maintain disclosure controls and procedures designed to provide reasonable assurance that information required to be disclosed in our reports filed or submitted under the Securities Exchange Act of 1934 (“Exchange Act”) is recorded, processed, summarized, and reported within the time periods specified in the rules and forms of the U.S. Securities and Exchange Commission (“SEC”). These controls and procedures also provide reasonable assurance that information required to be disclosed in such reports is accumulated and communicated to management, including our Chief Executive Officer (“CEO”) and Chief Financial Officer (“CFO”), to allow timely decisions regarding required disclosures.
As of March 31,September 30, 2019, our CEO and CFO, together with management, conducted an evaluation of the effectiveness of our disclosure controls and procedures as defined in Rule 13a-15(e) under the Exchange Act. Based on that evaluation, the CEO and CFO have concluded that these disclosure controls and procedures are effective at the reasonable assurance level.
Changes in Internal Control over Financial Reporting
There have been no changes in our internal control over financial reporting that occurred during the quarter ended March 31,September 30, 2019 that have materially affected, or are reasonably likely to materially affect, our internal control over financial reporting.
5667
The Chemours Company
PART II. OTHER INFORMATION
Item 1. LEGAL PROCEEDINGS
Legal Proceedings
We are subject to various legal proceedings, including, but not limited to, product liability, intellectual property, personal injury, commercial, contractual, employment, governmental, environmental, anti-trust, and other such matters that arise in the ordinary course of business. Information regarding certain of these matters is set forth below and in “Note 19 – Commitments and Contingent Liabilities” to the Interim Consolidated Financial Statements.
Litigation
PFOA: Environmental and Litigation Proceedings
For purposes of this report, the term “PFOA” means, collectively, perfluorooctanoic acid and its salts, including the ammonium salt, and does not distinguish between the two forms. Information related to this and other litigation matters is included in “Note 19 – Commitments and Contingent Liabilities” to the Interim Consolidated Financial Statements.
Fayetteville, North Carolina
The following actions related to Fayetteville, North Carolina, as discussed in “Note 19 – Commitments and Contingent Liabilities” to the Interim Consolidated Financial Statements, are filed in the U.S. District Court for the Eastern District of North Carolina, Southern Division:
| • | Carey et al. vs. E. I. DuPont de Nemours and Company (7:17-cv-00189-D; 7:17-cv-00197-D; and, 7:17-cv-00201-D); |
| • | Cape Fear Public Utility Authority vs. The Chemours Company FC, LLC et al. and Brunswick County v. DowDuPont et al. (7:17-cv-00195-D and 7:17-cv-00209-D); and, |
| • | Dew et al. vs. E. I. DuPont de Nemours and Company et al. (17:18-cv-00030-D). |
Environmental Proceedings
LaPorte Plant, LaPorte, Texas
The U.S. Environmental Protection Agency (“EPA”) conducted a multimedia inspection at the DuPont LaPorte, Texas facility in January 2008. DuPont, the EPA, and the U.S. Department of Justice began discussions in the fall of 2011 relating to the management of certain materials in the facility’s waste water treatment system, hazardous waste management, flare, and air emissions. These negotiations continue. We operate a fluoroproducts production facility at this site.
Dordrecht, Netherlands
We have complied with requests from the local environmental agency (“DCMR,” formerly under the jurisdiction of “OZHZ”), the Labor Inspectorate (“iSZW”), the Inspectorate for Environment and Transportation (“ILT”), and the Water Authority (“RWS”) in the Netherlands for information and documents regarding the Dordrecht site’s operations. We have complied with the requests, and the agencies have published several reports between 2016 and 2018, all of them publicly-available. The National Institute for Public Health and the Environment (“RIVM”) has also published several reports with respect to PFOA and the polymerization processing aid hexafluoropropylene oxide dimer acid (“HFPO Dimer Acid,” sometimes referred to as “GenX” or “C3 Dimer Acid”). In December 2018, DCMR imposed a €1 million fine after undertaking waste water tests, which detected low levels of PFOA. DCMR continued taking samples and has imposed twothree additional fines inbetween January 2019 and FebruaryMay 2019, each of which was €0.25 million. We have appealed all the three fines and we believe that we have valid defenses to prevail. We continue to cooperate with all authorities in responding to information requests, including those relatedrequests.
Federal Rail Administration
In October 2019, we received a $0.15 million fine from the Federal Rail Administration (“FRA”) based on the results of an investigation of our Antimony Pentachloride railcar shipments, fleet, commodity code accuracy, and condition of valves. We are continuing to a preliminary investigation initiatedinvestigate this matter and will respond to FRA by a public prosecutor.
57
68
The Chemours Company
Fayetteville, North Carolina
In February 2019, we received a Notice of Violation (“NOV”) from the EPA alleging certain Toxic Substances Control Act violations at our Fayetteville, North Carolina site. Matters raised in the NOV could have the potential to affect operations at the Fayetteville site. We responded to the EPA in March 2019 asserting that we have not violated environmental laws. At this time, management does not believe that a loss is probable related to the matters in this NOV. Further discussion related to this matter is included in “Note 19 – Commitments and Contingent Liabilities” to the Interim Consolidated Financial Statements.
Item 1A. RISK FACTORS
There have been no material changes to the risk factors disclosed in our Annual Report on Form 10-K for the year ended December 31, 2018.
Item 2. UNREGISTERED SALES OF EQUITY SECURITIES AND USE OF PROCEEDS
Issuer Purchases of Equity Securities
2018 Share Repurchase Program
On August 1, 2018, our board of directors approved a share repurchase program authorizing the purchase of shares of our issued and outstanding common stock in an aggregate amount not to exceed $750 million, plus any associated fees or costs in connection with our share repurchase activity (“2018 Share Repurchase Program”). On February 13, 2019, our board of directors increased the authorization amount of the 2018 Share Repurchase Program from $750 million to $1.0 billion. Under the 2018 Share Repurchase Program, shares of our common stock can be purchased on the open market from time to time, subject to management’s discretion, as well as general business and market conditions. Our 2018 Share Repurchase Program became effective on August 1, 2018, was announced to the public on August 2, 2018, and will continue through the earlier of its expiration on December 31, 2020, or the completion of repurchases up to the approved amount. The program may be suspended or discontinued at any time. All common shares purchased under the 2018 Share Repurchase Program are expected to be held as treasury stock and accounted for using the cost method.
The following table sets forth the purchases of our issued and outstanding common stockThere were no share repurchases under the 2018 Share Repurchase Program for the three months ended March 31,September 30, 2019.
(Dollars in millions, except per share amounts) |
|
|
|
|
|
|
|
|
|
|
|
|
|
|
|
|
Period |
| Total Number of Shares Purchased (1) |
|
| Average Price Paid per Share (2) |
|
| Total Number of Shares Purchased as Part of Publicly Announced Plans or Programs |
|
| Approximate Dollar Value of Shares That May Yet be Purchased Under the Plans or Programs (2) |
| ||||
Month ended January 31, 2019 |
|
| 3,198,563 |
|
| $ | 33.33 |
|
|
| 3,198,563 |
|
| $ | 643 |
|
Month ended February 28, 2019 |
|
| 2,202,448 |
|
|
| 37.86 |
|
|
| 2,202,448 |
|
|
| 560 |
|
Month ended March 31, 2019 |
|
| 1,876,991 |
|
|
| 37.86 |
|
|
| 1,876,991 |
|
|
| 489 |
|
Total |
|
| 7,278,002 |
|
| $ | 35.87 |
|
|
| 7,278,002 |
|
| $ | 489 |
|
|
|
|
|
As of March 31,September 30, 2019, we have purchased a cumulative 13,628,85915,245,999 shares of our issued and outstanding common stock under the share repurchase program, which amounted to $511$572 million at an average share price of $37.47$37.52 per share. The aggregate amount of our common stock that remained available for repurchase at March 31,September 30, 2019 was $489$428 million.
Subsequent to March 31, 2019, we purchased an additional 1,387,241 shares of our issued and outstanding common stock under the 2018 Share Repurchase Program, which amounted to $53 million at an average price of $38.51 per share.
58
The Chemours Company
Item 3. DEFAULTS UPON SENIOR SECURITIES
None.
Item 4. MINE SAFETY DISCLOSURES
Information regarding mine safety and other regulatory actions at the Company’s surface mine in Starke, Florida is included in Exhibit 95 to this Quarterly Report on Form 10-Q.
Item 5. OTHER INFORMATION
None.
69
The Chemours Company
Item 6.EXHIBITS
Exhibit Number |
| Description |
3.1 |
| |
|
|
|
3.2 |
| |
|
|
|
31.1 |
| Rule 13a-14(a)/15d-14(a) Certification of the Company’s Principal Executive Officer. |
|
|
|
31.2 |
| Rule 13a-14(a)/15d-14(a) Certification of the Company’s Principal Financial Officer. |
|
|
|
32.1 |
|
|
32.2 |
| |
|
|
|
95 |
| |
|
|
|
|
|
|
|
|
|
|
| The cover page from the Company’s Quarterly Report on Form 10-Q for the period ended September 30, 2019, which has been formatted in Inline XBRL |
|
|
|
|
| |
|
| |
|
| |
|
|
5970
The Chemours Company
SIGNATURE
Pursuant to the requirements of the Securities Exchange Act of 1934, the registrant has duly caused this report to be signed on its behalf by the undersigned, thereunto duly authorized.
THE CHEMOURS COMPANY | |
(Registrant) | |
|
|
Date: |
|
|
|
|
|
By: | /s/ |
|
|
|
|
| Senior Vice President, |
| (As Duly Authorized Officer and Principal Financial Officer) |
6071