
UNITED STATES
SECURITIES AND EXCHANGE COMMISSION
WASHINGTON, DC 20549
FORM 10-Q
(Mark One)
|
|
☒QUARTERLY REPORT PURSUANT TO SECTION 13 OR 15(d) OF THE SECURITIES EXCHANGE ACT OF 1934
For the quarterly period ended March 31, 20192024
OR
|
|
☐ TRANSITION REPORT PURSUANT TO SECTION 13 OR 15(d) OF THE SECURITIES EXCHANGE ACT OF 1934
For the transition period from to
Commission File Number: 001-07782
Parsons Corporation
(Exact Name of Registrant as Specified in its Charter)
Delaware | 95-3232481 |
(State or other jurisdiction of incorporation or organization) | (I.R.S. Employer Identification No.) |
|
|
(Address of principal executive offices) | (Zip Code) |
Registrant’s telephone number, including area code: (703) (703) 988-8500
Securities registered pursuant to Section 12(b) of the Act:
Title of each class | Trading Symbol(s) | Name of each exchange on which registered | ||
Common Stock, $1 par value | PSN | New York Stock Exchange |
Indicate by check mark whether the registrant (1) has filed all reports required to be filed by Section 13 or 15(d) of the Securities Exchange Act of 1934 during the preceding 12 months (or for such shorter period that the registrant was required to file such reports), and (2) has been subject to such filing requirements for the past 90 days. Yes☐☒ No ☒☐
Indicate by check mark whether the registrant has submitted electronically every Interactive Data File required to be submitted pursuant to Rule 405 of Regulation S-T (§232.405 of this chapter) during the preceding 12 months (or for such shorter period that the registrant was required to submit such files). Yes☒ No ☐
Indicate by check mark whether the registrant is a large accelerated filer, an accelerated filer, a non-accelerated filer, smaller reporting company, or an emerging growth company. See the definitions of “large accelerated filer,” “accelerated filer,” “smaller reporting company,” and “emerging growth company” in Rule 12b-2 of the Exchange Act.
Large accelerated filer |
| Accelerated filer | ☐ | |
Non-accelerated filer |
| Smaller reporting company | ☐ | |
Emerging growth company | ☐ |
If an emerging growth company, indicate by check mark if the registrant has elected not to use the extended transition period for complying with any new or revised financial accounting standards provided pursuant to Section 13(a) of the Exchange Act. ☐
Indicate by check mark whether the registrant is a shell company (as defined in Rule 12b-2 of the Exchange Act). Yes ☐ No ☒
Securities registered pursuant to Section 12(b) of the Act:
|
|
| ||
|
|
|
As of June 6, 2019,April 23, 2024, the registrant had 99,434,877146,747,745 shares of common stock, $1.00 par value per share, outstanding.
Table of Contents
Page | |||
PART I. | 1 | ||
Item 1. | 1 | ||
1 | |||
2 | |||
3 | |||
4 | |||
Consolidated Statements of | 5 | ||
6 | |||
Item 2. | Management’s Discussion and Analysis of Financial Condition and Results of Operations |
| |
Item 3. |
| ||
Item 4. |
| ||
PART II. |
| ||
Item 1. |
| ||
Item 1A. |
| ||
Item 2. |
| ||
Item 3. |
| ||
Item 4. |
| ||
Item 5. |
| ||
Item 6. |
| ||
|
i
i
PART I—FINANCIALFINANCIAL INFORMATION
PARSONS CORPORATION AND SUBSIDIARIES
(in thousands, except share information)
(Unaudited)
|
|
| March 31, 2024 |
|
| December 31, 2023 |
| ||
|
|
| (Unaudited) |
|
|
|
| ||
Assets |
|
|
|
|
|
| |||
Current assets: |
|
|
|
|
|
| |||
| Cash and cash equivalents (including $84,810 and $128,761 Cash of consolidated joint ventures) |
| $ | 423,120 |
|
| $ | 272,943 |
|
| Accounts receivable, net (including $332,308 and $274,846 Accounts receivable of consolidated joint ventures, net) |
|
| 1,023,463 |
|
|
| 915,638 |
|
| Contract assets (including $8,521 and $11,096 Contract assets of consolidated joint ventures) |
|
| 768,007 |
|
|
| 757,515 |
|
| Prepaid expenses and other current assets (including $15,808 and $11,929 Prepaid expenses and other current assets of consolidated joint ventures) |
|
| 212,664 |
|
|
| 191,430 |
|
| Total current assets |
|
| 2,427,254 |
|
|
| 2,137,526 |
|
|
|
|
|
|
|
|
| ||
| Property and equipment, net (including $3,565 and $3,274 Property and equipment of consolidated joint ventures, net) |
|
| 98,499 |
|
|
| 98,957 |
|
| Right of use assets, operating leases (including $8,656 and $9,885 Right of use assets, operating leases of consolidated joint ventures) |
|
| 145,803 |
|
|
| 159,211 |
|
| Goodwill |
|
| 1,791,443 |
|
|
| 1,792,665 |
|
| Investments in and advances to unconsolidated joint ventures |
|
| 145,043 |
|
|
| 128,204 |
|
| Intangible assets, net |
|
| 261,856 |
|
|
| 275,566 |
|
| Deferred tax assets |
|
| 157,547 |
|
|
| 140,162 |
|
| Other noncurrent assets |
|
| 70,998 |
|
|
| 71,770 |
|
| Total assets |
| $ | 5,098,443 |
|
| $ | 4,804,061 |
|
|
|
|
|
|
|
|
| ||
Liabilities and Shareholders' Equity |
|
|
|
|
|
| |||
Current liabilities: |
|
|
|
|
|
| |||
| Accounts payable (including $33,339 and $49,234 Accounts payable of consolidated joint ventures) |
| $ | 274,140 |
|
| $ | 242,821 |
|
| Accrued expenses and other current liabilities (including $165,434 and $145,040 Accrued expenses and other current liabilities of consolidated joint ventures) |
|
| 739,211 |
|
|
| 801,423 |
|
| Contract liabilities (including $60,374 and $61,234 Contract liabilities of consolidated joint ventures) |
|
| 282,962 |
|
|
| 301,107 |
|
| Short-term lease liabilities, operating leases (including $4,445 and $4,753 Short-term lease liabilities, operating leases of consolidated joint ventures) |
|
| 55,024 |
|
|
| 58,556 |
|
| Income taxes payable |
|
| 2,366 |
|
|
| 6,977 |
|
| Total current liabilities |
|
| 1,353,703 |
|
|
| 1,410,884 |
|
|
|
|
|
|
|
|
| ||
| Long-term employee incentives |
|
| 24,447 |
|
|
| 22,924 |
|
| Long-term debt |
|
| 1,246,443 |
|
|
| 745,963 |
|
| Long-term lease liabilities, operating leases (including $4,211 and $5,132 Long-term lease liabilities, operating leases of consolidated joint ventures) |
|
| 106,692 |
|
|
| 117,505 |
|
| Deferred tax liabilities |
|
| 9,763 |
|
|
| 9,775 |
|
| Other long-term liabilities |
|
| 114,238 |
|
|
| 120,295 |
|
| Total liabilities |
|
| 2,855,286 |
|
|
| 2,427,346 |
|
Contingencies (Note 12) |
|
|
|
|
|
| |||
Shareholders' equity: |
|
|
|
|
|
| |||
| Common stock, $1 par value; authorized 1,000,000,000 shares; 146,717,387 and 146,341,363 shares issued; 48,205,185 and 45,960,122 public shares outstanding; 57,998,295 and 59,879,857 ESOP shares outstanding |
|
| 146,717 |
|
|
| 146,341 |
|
| Treasury stock, 40,501,385 shares at cost |
|
| (827,311 | ) |
|
| (827,311 | ) |
Additional paid-in capital |
|
| 2,759,867 |
|
|
| 2,779,365 |
| |
Retained earnings |
|
| 87,261 |
|
|
| 203,724 |
| |
Accumulated other comprehensive loss |
|
| (16,866 | ) |
|
| (14,908 | ) | |
Total Parsons Corporation shareholders' equity |
|
| 2,149,668 |
|
|
| 2,287,211 |
| |
Noncontrolling interests |
|
| 93,489 |
|
|
| 89,504 |
| |
Total shareholders' equity |
|
| 2,243,157 |
|
|
| 2,376,715 |
| |
| Total liabilities and shareholders' equity |
|
| 5,098,443 |
|
|
| 4,804,061 |
|
|
|
| December 31, 2018 |
|
| March 31, 2019 |
| ||
Assets |
|
|
|
|
|
|
|
| |
Current assets: |
|
|
|
|
|
|
|
| |
| Cash and cash equivalents (including $73,794 and $42,872 Cash of consolidated joint ventures) |
| $ | 280,221 |
|
| $ | 121,408 |
|
| Restricted cash and investments |
|
| 974 |
|
|
| 9,061 |
|
| Accounts receivable, net (including $180,325 and $193,597 Accounts receivable of consolidated joint ventures, net) |
|
| 623,286 |
|
|
| 651,924 |
|
| Contract assets (including $21,270 and $23,964 Contract assets of consolidated joint ventures) |
|
| 515,319 |
|
|
| 571,755 |
|
| Prepaid expenses and other current assets (including $11,837 and $9,423 Prepaid expenses and other current assets of consolidated joint ventures) |
|
| 69,007 |
|
|
| 77,013 |
|
| Total current assets |
|
| 1,488,807 |
|
|
| 1,431,161 |
|
|
|
|
|
|
|
|
|
|
|
| Property and equipment, net (including $2,561 and $2,507 Property and equipment of consolidated joint ventures, net) |
|
| 91,849 |
|
|
| 97,298 |
|
| Right of use assets, operating leases |
|
| - |
|
|
| 216,484 |
|
| Goodwill |
|
| 736,938 |
|
|
| 921,097 |
|
| Investments in and advances to unconsolidated joint ventures |
|
| 63,560 |
|
|
| 67,202 |
|
| Intangible assets, net |
|
| 179,519 |
|
|
| 250,948 |
|
| Deferred tax assets |
|
| 5,680 |
|
|
| 4,891 |
|
| Other noncurrent assets |
|
| 46,225 |
|
|
| 43,917 |
|
| Total assets |
| $ | 2,612,578 |
|
| $ | 3,032,998 |
|
|
|
|
|
|
|
|
|
|
|
Liabilities and Shareholder’s Equity |
|
|
|
|
|
|
|
| |
Current liabilities: |
|
|
|
|
|
|
|
| |
| Accounts payable (including $87,914 and $91,505 Accounts payable of consolidated joint ventures) |
| $ | 226,345 |
|
| $ | 203,684 |
|
| Accrued expenses and other current liabilities (including $73,209 and $71,593 Accrued expenses and other current liabilities of consolidated joint ventures) |
|
| 559,700 |
|
|
| 547,954 |
|
| Contract liabilities (including $38,706 and $46,754 Contract liabilities of consolidated joint ventures) |
|
| 208,576 |
|
|
| 225,017 |
|
| Short-term lease liabilities, operating leases |
|
| - |
|
|
| 53,029 |
|
| Income taxes payable |
|
| 11,540 |
|
|
| 9,415 |
|
| Short-term notes payable |
|
| - |
|
|
| 149,786 |
|
| Total current liabilities |
|
| 1,006,161 |
|
|
| 1,188,885 |
|
| Long-term employee incentives |
|
| 41,913 |
|
|
| 29,991 |
|
| Deferred gain resulting from sale-leaseback transactions |
|
| 46,004 |
|
|
| - |
|
| Long-term debt |
|
| 429,164 |
|
|
| 509,211 |
|
| Long-term lease liabilities, operating leases |
|
| - |
|
|
| 181,274 |
|
| Deferred tax liabilities |
|
| 6,240 |
|
|
| 7,922 |
|
| Other long-term liabilities |
|
| 127,863 |
|
|
| 111,023 |
|
| Total liabilities |
|
| 1,657,345 |
|
|
| 2,028,306 |
|
Commitments and contingencies (Note 14) |
|
|
|
|
|
|
|
| |
| Redeemable common stock held by Employee Stock Ownership Plan (ESOP) ,$1 par value; authorized 150,000,000 shares; 125,097,684 shares issued; 78,172,809 and 78,138,831 shares outstanding, recorded at redemption value |
|
| 1,876,309 |
|
|
| 1,875,332 |
|
|
|
|
|
|
|
|
|
|
|
Shareholder's equity (deficit): |
|
|
|
|
|
|
|
| |
| Treasury Stock, 46,918,140 and 46,958,853 shares at cost |
|
| (957,025 | ) |
|
| (957,838 | ) |
| Retained earnings |
|
| 12,445 |
|
|
| 75,771 |
|
| Accumulated other comprehensive loss |
|
| (22,957 | ) |
|
| (20,401 | ) |
| Total Parsons Corporation shareholder's equity (deficit) |
|
| (967,537 | ) |
|
| (902,468 | ) |
| Noncontrolling interests |
|
| 46,461 |
|
|
| 31,828 |
|
| Total shareholder's equity (deficit) |
|
| (921,076 | ) |
|
| (870,640 | ) |
| Total liabilities, redeemable common stock and shareholder's equity (deficit) |
| $ | 2,612,578 |
|
| $ | 3,032,998 |
|
The accompanying notes are an integral part of these consolidated financial statements.
1
PARSONS CORPORATION AND SUBSIDIARIES
Consolidated Statements of Income (Loss)
(In thousands, except per share information)
(Unaudited)
|
| For the Three Months Ended |
| |||||
|
| March 30, 2018 |
|
| March 31, 2019 |
| ||
Revenues |
| $ | 754,679 |
|
| $ | 904,405 |
|
Direct costs of contracts |
|
| 602,972 |
|
|
| 714,237 |
|
Equity in earnings of unconsolidated joint ventures |
|
| 11,031 |
|
|
| 10,397 |
|
Indirect, general and administrative expenses |
|
| 123,847 |
|
|
| 177,519 |
|
Operating income |
|
| 38,891 |
|
|
| 23,046 |
|
Interest income |
|
| 741 |
|
|
| 477 |
|
Interest expense |
|
| (3,999 | ) |
|
| (8,292 | ) |
Other income, net |
|
| 1,152 |
|
|
| 41 |
|
(Interest and other expense) gain associated with claim on long-term contract |
|
| (2,330 | ) |
|
| - |
|
Total other expense |
|
| (4,436 | ) |
|
| (7,774 | ) |
Income before income tax provision |
|
| 34,455 |
|
|
| 15,272 |
|
Income tax provision |
|
| (5,353 | ) |
|
| (1,886 | ) |
Net income including noncontrolling interests |
|
| 29,102 |
|
|
| 13,386 |
|
Net income attributable to noncontrolling interests |
|
| (3,815 | ) |
|
| (3,645 | ) |
Net income attributable to Parsons Corporation |
| $ | 25,287 |
|
| $ | 9,741 |
|
Earnings per share: |
|
|
|
|
|
|
|
|
Basic and diluted |
| $ | 0.31 |
|
| $ | 0.12 |
|
|
| Three Months Ended |
| |||||
|
| March 31, 2024 |
|
| March 31, 2023 |
| ||
Revenue |
| $ | 1,535,676 |
|
| $ | 1,173,466 |
|
Direct cost of contracts |
|
| 1,210,827 |
|
|
| 917,188 |
|
Equity in losses of unconsolidated joint ventures |
|
| (2,060 | ) |
|
| (5,840 | ) |
Selling, general and administrative expenses |
|
| 220,945 |
|
|
| 199,308 |
|
Operating income |
|
| 101,844 |
|
|
| 51,130 |
|
Interest income |
|
| 1,152 |
|
|
| 793 |
|
Interest expense |
|
| (12,998 | ) |
|
| (6,458 | ) |
Loss on extinguishment of debt |
|
| (211,018 | ) |
|
| - |
|
Other income (expense), net |
|
| (3,326 | ) |
|
| 1,314 |
|
Total other income (expense) |
|
| (226,190 | ) |
|
| (4,351 | ) |
(Loss) income before income tax expense |
|
| (124,346 | ) |
|
| 46,779 |
|
Income tax benefit (expense) |
|
| 32,234 |
|
|
| (11,503 | ) |
Net (loss) income including noncontrolling interests |
|
| (92,112 | ) |
|
| 35,276 |
|
Net income attributable to noncontrolling interests |
|
| (15,243 | ) |
|
| (9,723 | ) |
Net (loss) income attributable to Parsons Corporation |
| $ | (107,355 | ) |
| $ | 25,553 |
|
(Loss) earnings per share: |
|
|
|
|
|
| ||
Basic |
| $ | (1.01 | ) |
| $ | 0.24 |
|
Diluted |
| $ | (1.01 | ) |
| $ | 0.23 |
|
The accompanying notes are an integral part of these consolidated financial statements.
2
PARSONS CORPORATION AND SUBSIDIARIES
Consolidated Statements of Comprehensive Income (Loss)
(In thousands)
(Unaudited)
|
| For the Three Months Ended |
| |||||
|
| March 30, 2018 |
|
| March 31, 2019 |
| ||
Net income including noncontrolling interests |
| $ | 29,102 |
|
| $ | 13,386 |
|
Other comprehensive (loss) income, net of tax |
|
|
|
|
|
|
|
|
Foreign currency translation adjustment, net of tax |
|
| (2,784 | ) |
|
| 2,549 |
|
Pension adjustments, net of tax |
|
| (19 | ) |
|
| 9 |
|
Comprehensive income including noncontrolling interests, net of tax |
|
| 26,299 |
|
|
| 15,944 |
|
Comprehensive income attributable to noncontrolling interests, net of tax |
|
| (3,815 | ) |
|
| (3,645 | ) |
Comprehensive income attributable to Parsons Corporation, net of tax |
| $ | 22,484 |
|
| $ | 12,299 |
|
|
| Three Months Ended |
| |||||
|
| March 31, 2024 |
|
| March 31, 2023 |
| ||
Net (loss) income including noncontrolling interests |
| $ | (92,112 | ) |
| $ | 35,276 |
|
Other comprehensive income, net of tax |
|
|
|
|
|
| ||
Foreign currency translation adjustment, net of tax |
|
| (1,927 | ) |
|
| (177 | ) |
Pension adjustments, net of tax |
|
| (31 | ) |
|
| 1 |
|
Comprehensive (loss) income including noncontrolling interests, net of tax |
|
| (94,070 | ) |
|
| 35,100 |
|
Comprehensive income attributable to noncontrolling interests, net of tax |
|
| (15,243 | ) |
|
| (9,723 | ) |
Comprehensive (loss) income attributable to Parsons Corporation, net of tax |
| $ | (109,313 | ) |
| $ | 25,377 |
|
The accompanying notes are an integral part of these consolidated financial statements.
3
PARSONS CORPORATION AND SUBSIDIARIES
Consolidated Statements of Cash Flows
(In thousands)
(Unaudited)
|
|
| For the Three Months Ended |
|
| For the Three Months Ended |
| |||||||||||
|
|
| March 30, 2018 |
|
| March 31, 2019 |
|
| March 31, 2024 |
|
| March 31, 2023 |
| |||||
Cash flows from operating activities: | Cash flows from operating activities: |
|
|
|
|
|
|
|
| Cash flows from operating activities: |
|
|
|
|
| |||
| Net income including noncontrolling interests |
| $ | 29,102 |
|
| $ | 13,386 |
| |||||||||
| Adjustments to reconcile net income to net cash used in operating activities |
|
|
|
|
|
|
|
| |||||||||
| Depreciation and amortization |
|
| 9,009 |
|
|
| 30,591 |
| Net (loss) income including noncontrolling interests |
| $ | (92,112 | ) |
| $ | 35,276 |
|
| Amortization of deferred gain |
|
| (1,813 | ) |
|
| - |
| Adjustments to reconcile net (loss) income to net cash used in operating activities |
|
|
|
|
| |||
| Amortization of debt issue costs |
|
| 149 |
|
|
| 244 |
| Depreciation and amortization |
|
| 24,531 |
|
|
| 28,359 |
|
| (Gain) loss on disposal of property and equipment |
|
| 18 |
|
|
| (27 | ) | Amortization of debt issue costs |
|
| 4,099 |
|
|
| 657 |
|
| Provision for doubtful accounts |
|
| 2,426 |
|
|
| (279 | ) | Loss (gain) on disposal of property and equipment |
|
| 198 |
|
|
| (3 | ) |
| Deferred taxes |
|
| (138 | ) |
|
| 1,486 |
| Loss on extinguishment of debt |
|
| 211,018 |
|
|
| - |
|
| Foreign currency transaction gains and losses |
|
| (457 | ) |
|
| 618 |
| Deferred taxes |
|
| 4,796 |
|
|
| (2,586 | ) |
| Equity in earnings of unconsolidated joint ventures |
|
| (11,031 | ) |
|
| (10,397 | ) | Foreign currency transaction gains and losses |
|
| 2,311 |
|
|
| (290 | ) |
| Return on investments in unconsolidated joint ventures |
|
| 15,406 |
|
|
| 10,794 |
| Equity in losses of unconsolidated joint ventures |
|
| 2,060 |
|
|
| 5,840 |
|
| Contributions of treasury stock |
|
| 11,357 |
|
|
| 12,250 |
| Return on investments in unconsolidated joint ventures |
|
| 16,106 |
|
|
| 7,793 |
|
| Changes in assets and liabilities, net of acquisitions and newly consolidated joint ventures: |
|
|
|
|
|
|
|
| Stock-based compensation |
|
| 10,523 |
|
|
| 6,992 |
|
| Accounts receivable |
|
| 469,720 |
|
|
| (17,135 | ) | Contributions of treasury stock |
|
| 15,030 |
|
|
| 14,435 |
|
| Contract assets |
|
| (531,157 | ) |
|
| (46,984 | ) | Changes in assets and liabilities, net of acquisitions and consolidated |
|
|
|
|
| |||
| Prepaid expenses and current assets |
|
| (27,138 | ) |
|
| (1,424 | ) | Accounts receivable |
|
| (110,066 | ) |
|
| (47,482 | ) |
| Accounts payable |
|
| (723 | ) |
|
| (28,182 | ) | Contract assets |
|
| (11,715 | ) |
|
| (49,098 | ) |
| Accrued expenses and other current liabilities |
|
| (44,016 | ) |
|
| (24,023 | ) | Prepaid expenses and other assets |
|
| (21,602 | ) |
|
| (27,948 | ) |
| Billings in excess of costs |
|
| (152,147 | ) |
|
| - |
| Accounts payable |
|
| 31,685 |
|
|
| 8,009 |
|
| Contract liabilities |
|
| 299,639 |
|
|
| 14,884 |
| Accrued expenses and other current liabilities |
|
| (77,591 | ) |
|
| (10,898 | ) |
| Provision for contract losses |
|
| (143,666 | ) |
|
| - |
| Contract liabilities |
|
| (17,090 | ) |
|
| 16,113 |
|
| Income taxes |
|
| (597 | ) |
|
| (3,645 | ) | Income taxes |
|
| (51,080 | ) |
|
| 6,408 |
|
| Other long-term liabilities |
|
| 10,624 |
|
|
| (12,265 | ) | Other long-term liabilities |
|
| (4,521 | ) |
|
| (567 | ) |
| Net cash used in operating activities |
|
| (65,433 | ) |
|
| (60,108 | ) | Net cash used in operating activities |
|
| (63,420 | ) |
|
| (8,990 | ) |
Cash flows from investing activities: | Cash flows from investing activities: |
|
|
|
|
|
|
|
| Cash flows from investing activities: |
|
|
|
|
| |||
| Capital expenditures |
|
| (5,152 | ) |
|
| (11,041 | ) | Capital expenditures |
|
| (9,436 | ) |
|
| (8,146 | ) |
| Proceeds from sale of property and equipment |
|
| 29 |
|
|
| 135 |
| Proceeds from sale of property and equipment |
|
| 2 |
|
|
| 19 |
|
| Payments for acquisitions, net of cash acquired |
|
| - |
|
|
| (287,482 | ) | Investments in unconsolidated joint ventures |
|
| (36,076 | ) |
|
| (13,016 | ) |
| Investments in unconsolidated joint ventures |
|
| (3,058 | ) |
|
| (4,905 | ) | Proceeds from sales of investments in unconsolidated joint ventures |
|
| - |
|
|
| 381 |
|
| Return of investments in unconsolidated joint ventures |
|
| - |
|
|
| 2,234 |
| Net cash used in investing activities |
|
| (45,510 | ) |
|
| (20,762 | ) |
| Net cash used in investing activities |
|
| (8,181 | ) |
|
| (301,059 | ) | |||||||||
Cash flows from financing activities: | Cash flows from financing activities: |
|
|
|
|
|
|
|
| Cash flows from financing activities: |
|
|
|
|
| |||
| Proceeds from borrowings under credit agreement |
|
| - |
|
|
| 290,000 |
| Proceeds from borrowings under credit agreement |
|
| 153,200 |
|
|
| 5,700 |
|
| Repayments of borrowings under credit agreement |
|
| - |
|
|
| (60,000 | ) | Repayments of borrowings under credit agreement |
|
| (153,200 | ) |
|
| (5,700 | ) |
| Payments for debt costs and credit agreement |
|
| - |
|
|
| (286 | ) | Proceeds from issuance of convertible notes due 2029 |
|
| 800,000 |
|
|
| - |
|
| Contributions by (distributions to) noncontrolling interests, net |
|
| 6,497 |
|
|
| (18,278 | ) | Repurchases of convertible notes due 2025 |
|
| (495,575 | ) |
|
| - |
|
| Purchase of treasury stock |
|
| (366 | ) |
|
| (813 | ) | Payments for debt issuance costs |
|
| (18,941 | ) |
|
| - |
|
| Net cash provided by financing activities |
|
| 6,131 |
|
|
| 210,623 |
| Contributions by noncontrolling interests |
|
| - |
|
|
| 200 |
|
| Effect of exchange rate changes |
|
| (825 | ) |
|
| (182 | ) | Distributions to noncontrolling interests |
|
| (11,258 | ) |
|
| (638 | ) |
| Net increase (decrease) in cash, cash equivalents, and restricted cash |
|
| (68,308 | ) |
|
| (150,726 | ) | Repurchases of common stock |
|
| - |
|
|
| (6,000 | ) |
| Cash, cash equivalents and restricted cash |
|
|
|
|
|
|
|
| Taxes paid on vested stock |
|
| (16,914 | ) |
|
| (6,064 | ) |
| Beginning of year |
|
| 446,144 |
|
|
| 281,195 |
| Capped call transactions |
|
| (88,400 | ) |
|
| - |
|
| End of period |
| $ | 377,836 |
|
| $ | 130,469 |
| Bond hedge termination |
|
| 195,549 |
|
|
| - |
|
| Redemption of warrants |
|
| (104,952 | ) |
|
| - |
| |||||||||
Net cash (used in) provided by financing activities |
|
| 259,509 |
|
|
| (12,502 | ) | ||||||||||
Effect of exchange rate changes |
|
| (402 | ) |
|
| 154 |
| ||||||||||
Net increase (decrease) in cash, cash equivalents, and restricted cash |
|
| 150,177 |
|
|
| (42,100 | ) | ||||||||||
Cash, cash equivalents and restricted cash: |
|
|
|
|
| |||||||||||||
Beginning of year |
|
| 272,943 |
|
|
| 262,539 |
| ||||||||||
| End of period |
| $ | 423,120 |
|
| $ | 220,439 |
| |||||||||
The accompanying notes are an integral part of these consolidated financial statements.
4
PARSONS CORPORATION AND SUBSIDIARIES
For the Three Months Ended March 31, 2024 and March 31, 2023
(In thousands)
(Unaudited)
|
|
|
|
|
|
|
|
|
|
|
|
|
| Accumulated |
|
|
|
|
|
|
|
|
|
|
|
|
| |
|
| Redeemable |
|
|
|
|
|
|
|
|
|
| Other |
|
| Total |
|
|
|
|
|
|
|
|
| |||
|
| Common |
|
| Treasury |
|
| Retained |
|
| Comprehensive |
|
| Parsons |
|
| Noncontrolling |
|
|
|
|
| ||||||
|
| Stock |
|
| Stock |
|
| Earnings |
|
| Income (Loss) |
|
| Deficit |
|
| Interests |
|
| Total |
| |||||||
Balance at December 31, 2018 |
| $ | 1,876,309 |
|
| $ | (957,025 | ) |
| $ | 12,445 |
|
| $ | (22,957 | ) |
| $ | (967,537 | ) |
| $ | 46,461 |
|
| $ | (921,076 | ) |
Comprehensive income |
|
|
|
|
|
|
|
|
|
|
|
|
|
|
|
|
|
|
|
|
|
|
|
|
|
|
|
|
Net income |
|
|
|
|
|
|
|
|
|
| 9,741 |
|
|
|
|
|
|
| 9,741 |
|
|
| 3,645 |
|
|
| 13,386 |
|
Foreign currency translation gain |
|
|
|
|
|
|
|
|
|
|
|
|
|
| 2,547 |
|
|
| 2,547 |
|
|
|
|
|
|
| 2,547 |
|
Pension adjustments |
|
|
|
|
|
|
|
|
|
|
|
|
|
| 9 |
|
|
| 9 |
|
|
|
|
|
|
| 9 |
|
ASC 842 transition adjustment |
|
|
|
|
|
|
|
|
|
| 52,608 |
|
|
|
|
|
|
| 52,608 |
|
|
|
|
|
|
| 52,608 |
|
Purchase of treasury stock |
|
| (813 | ) |
|
| (813 | ) |
|
| 813 |
|
|
|
|
|
|
| - |
|
|
|
|
|
|
| - |
|
Distributions, net of contributions |
|
|
|
|
|
|
|
|
|
|
|
|
|
|
|
|
|
| - |
|
|
| (18,278 | ) |
|
| (18,278 | ) |
ESOP shares at redemption value |
|
| (164 | ) |
|
|
|
|
|
| 164 |
|
|
|
|
|
|
| 164 |
|
|
|
|
|
|
| 164 |
|
Balance at March 31, 2019 |
| $ | 1,875,332 |
|
| $ | (957,838 | ) |
| $ | 75,771 |
|
| $ | (20,401 | ) |
| $ | (902,468 | ) |
| $ | 31,828 |
|
| $ | (870,640 | ) |
|
|
|
|
|
|
|
|
|
|
|
|
|
|
|
|
|
|
|
|
|
|
|
|
|
|
|
|
|
Balance at December 29, 2017 |
| $ | 1,855,305 |
|
| $ | (876,372 | ) |
| $ | (186,035 | ) |
| $ | (15,003 | ) |
| $ | (1,077,410 | ) |
| $ | 27,494 |
|
| $ | (1,049,916 | ) |
Comprehensive income |
|
|
|
|
|
|
|
|
|
|
|
|
|
|
|
|
|
|
|
|
|
|
|
|
|
|
|
|
Net income |
|
|
|
|
|
|
|
|
|
| 25,287 |
|
|
|
|
|
|
| 25,287 |
|
|
| 3,815 |
|
|
| 29,102 |
|
Foreign currency translation gain (loss) |
|
|
|
|
|
|
|
|
|
|
|
|
|
| (2,781 | ) |
|
| (2,781 | ) |
|
| (3 | ) |
|
| (2,784 | ) |
Pension adjustments |
|
|
|
|
|
|
|
|
|
|
|
|
|
| (19 | ) |
|
| (19 | ) |
|
|
|
|
|
| (19 | ) |
Adoption of ASC 606 |
|
|
|
|
|
|
|
|
|
| (4,735 | ) |
|
|
|
|
|
| (4,735 | ) |
|
| 103 |
|
|
| (4,632 | ) |
Purchase of treasury stock |
|
| (367 | ) |
|
| (367 | ) |
|
| 367 |
|
|
|
|
|
|
| - |
|
|
|
|
|
|
| - |
|
Contributions, net of distributions |
|
|
|
|
|
|
|
|
|
|
|
|
|
|
|
|
|
| - |
|
|
| 6,497 |
|
|
| 6,497 |
|
Balance at March 30, 2018 |
| $ | 1,854,938 |
|
| $ | (876,738 | ) |
| $ | (165,116 | ) |
| $ | (17,803 | ) |
| $ | (1,059,658 | ) |
| $ | 37,906 |
|
| $ | (1,021,752 | ) |
|
| Common |
|
| Treasury |
|
| Additional |
|
| Retained |
|
| Accumulated |
|
| Total |
|
| Noncontrolling |
|
| Total |
| ||||||||
Balance at December 31, 2023 |
| $ | 146,341 |
|
| $ | (827,311 | ) |
| $ | 2,779,365 |
|
| $ | 203,724 |
|
| $ | (14,908 | ) |
| $ | 2,287,211 |
|
| $ | 89,504 |
|
| $ | 2,376,715 |
|
Comprehensive income |
|
|
|
|
|
|
|
|
|
|
|
|
|
|
|
|
|
|
|
|
|
|
|
| ||||||||
Net income |
|
| - |
|
|
| - |
|
|
| - |
|
|
| (107,355 | ) |
|
| - |
|
|
| (107,355 | ) |
|
| 15,243 |
|
|
| (92,112 | ) |
Foreign currency translation |
|
| - |
|
|
| - |
|
|
| - |
|
|
| - |
|
|
| (1,927 | ) |
|
| (1,927 | ) |
|
| - |
|
|
| (1,927 | ) |
Pension adjustments, net |
|
| - |
|
|
| - |
|
|
| - |
|
|
| - |
|
|
| (31 | ) |
|
| (31 | ) |
|
| - |
|
|
| (31 | ) |
Distributions |
|
| - |
|
|
| - |
|
|
| - |
|
|
| - |
|
|
| - |
|
|
| - |
|
|
| (11,258 | ) |
|
| (11,258 | ) |
Capped call transactions |
|
| - |
|
|
| - |
|
|
| (66,121 | ) |
|
| - |
|
|
| - |
|
|
| (66,121 | ) |
|
| - |
|
|
| (66,121 | ) |
Repurchase of warrants |
|
| - |
|
|
| - |
|
|
| (104,952 | ) |
|
| - |
|
|
| - |
|
|
| (104,952 | ) |
|
| - |
|
|
| (104,952 | ) |
Bond hedge termination |
|
| - |
|
|
| - |
|
|
| 149,308 |
|
|
| - |
|
|
| - |
|
|
| 149,308 |
|
|
| - |
|
|
| 149,308 |
|
Issuance of equity securities, |
|
| 376 |
|
|
| - |
|
|
| (8,256 | ) |
|
| (9,108 | ) |
|
| - |
|
|
| (16,988 | ) |
|
| - |
|
|
| (16,988 | ) |
Stock-based compensation |
|
| - |
|
|
| - |
|
|
| 10,523 |
|
|
| - |
|
|
| - |
|
|
| 10,523 |
|
|
| - |
|
|
| 10,523 |
|
Balance at March 31, 2024 |
| $ | 146,717 |
|
| $ | (827,311 | ) |
| $ | 2,759,867 |
|
| $ | 87,261 |
|
| $ | (16,866 | ) |
| $ | 2,149,668 |
|
| $ | 93,489 |
|
| $ | 2,243,157 |
|
|
|
|
|
|
|
|
|
|
|
|
|
|
|
|
|
|
|
|
|
|
|
|
|
| ||||||||
|
|
|
|
|
|
|
|
|
|
|
|
|
|
|
|
|
|
|
|
|
|
|
|
| ||||||||
Balance at December 31, 2022 |
| $ | 146,132 |
|
| $ | (844,936 | ) |
| $ | 2,717,134 |
|
| $ | 43,089 |
|
| $ | (17,849 | ) |
| $ | 2,043,570 |
|
| $ | 52,365 |
|
| $ | 2,095,935 |
|
Comprehensive income |
|
|
|
|
|
|
|
|
|
|
|
|
|
|
|
|
|
|
|
|
|
|
|
| ||||||||
Net income |
|
| - |
|
|
| - |
|
|
| - |
|
|
| 25,553 |
|
|
| - |
|
|
| 25,553 |
|
|
| 9,723 |
|
|
| 35,276 |
|
Foreign currency translation |
|
| - |
|
|
| - |
|
|
| - |
|
|
| - |
|
|
| (177 | ) |
|
| (177 | ) |
|
| - |
|
|
| (177 | ) |
Pension adjustments, net |
|
| - |
|
|
| - |
|
|
| - |
|
|
| - |
|
|
| 1 |
|
|
| 1 |
|
|
| - |
|
|
| 1 |
|
Contributions |
|
| - |
|
|
| - |
|
|
| - |
|
|
| - |
|
|
| - |
|
|
| - |
|
|
| 201 |
|
|
| 201 |
|
Distributions |
|
| - |
|
|
| - |
|
|
| - |
|
|
| - |
|
|
| - |
|
|
| - |
|
|
| (638 | ) |
|
| (638 | ) |
Issuance of equity securities, |
|
| 251 |
|
|
| - |
|
|
| (6,098 | ) |
|
| (213 | ) |
|
| - |
|
|
| (6,060 | ) |
|
| - |
|
|
| (6,060 | ) |
Repurchases of common stock |
|
| (139 | ) |
|
| - |
|
|
| (5,861 | ) |
|
| - |
|
|
| - |
|
|
| (6,000 | ) |
|
| - |
|
|
| (6,000 | ) |
Stock-based compensation |
|
| - |
|
|
| - |
|
|
| 6,992 |
|
|
| - |
|
|
| - |
|
|
| 6,992 |
|
|
| - |
|
|
| 6,992 |
|
Balance at March 31, 2023 |
| $ | 146,244 |
|
| $ | (844,936 | ) |
| $ | 2,712,167 |
|
| $ | 68,429 |
|
| $ | (18,025 | ) |
| $ | 2,063,879 |
|
| $ | 61,651 |
|
| $ | 2,125,530 |
|
The accompanying notes are an integral part of these consolidated financial statements.
5
Parsons Corporation and Subsidiaries
Notes to Consolidated Financial Statements (unaudited)
|
|
Organization
Parsons Corporation, a Delaware corporation, and its subsidiaries (collectively, the “Company”) provide sophisticated design, engineering and technical services, and smart and agile software to the United States federal government and Critical Infrastructure customers worldwide. The Company performs work in various foreign countries through local subsidiaries, joint ventures and foreign offices maintained to carry out specific projects. Parsons Employee Stock Ownership Plan (“ESOP”) is the sole shareholder
Initial Public Offering
Effective May 8, 2019, the Company consummated its initial public offering (“IPO”) whereby the Company sold 18,518,500 sharesPresentation and Principles of common stock for $27.00 per share. The underwriters exercised their share option effective May 14, 2019 to purchase an additional 2,777,775 shares at the share price of $25.515 which is the initial public offering share price of $27.00 less the underwriting discount of $1.485 per share. The net proceeds of the initial public offering and the underwriters’ share option was approximately $533.8 million, after deducting underwriting discounts and other fees, were used to fund an IPO dividend of $52.1 million, repay the outstanding balance of $150.0 million under our Term Loan, and repay outstanding indebtedness under our Revolving Credit Facility.
Stock Dividend
On April 15, 2019, the board of directors of the Company declared a common stock dividend in a ratio of two shares of common stock for every one share of common stock presently held by the Company’s stockholder (the “Stock Dividend”). The record date of this common Stock Dividend, which the Company refers to as the Stock Dividend was May 7, 2019, the day immediately prior to the consummation of the Company’s initial public offering on May 8, 2019, and the payment date of the Stock Dividend was May 8, 2019. Purchasers of the Company’s common stock in the Company’s public offering were not entitled to receive any portion of the Stock Dividend. The Company’s consolidated financial statements include the effects of this Stock Dividend.
The accompanying unaudited consolidated financial statements and related notes of the Company have been prepared in accordance with generally accepted accounting principles in the United States of America ("GAAP") and pursuant to the interim period reporting requirements of Form 10-Q. They do not include all of the information and footnotes required by GAAP for complete financial statements and, therefore, should be read in conjunction with our consolidated financial statements and the notes thereto included in the Company’s Annual Report on Form S-1/A filed on April 29, 2019.10-K for the year ended December 31, 2023.
In the opinion of management, the consolidated financial statements reflect all normal recurring adjustments necessary for a fair statement of the financial position, results of operations and cash flows for the interim periods presented. The results of operations and cash flows for any interim period are not necessarily indicative of results for the full year or for future years.
This Quarterly Report on Form 10-Q includes the accounts of our wholly-ownedParsons Corporation and its subsidiaries and affiliates which it controls. Interests in joint ventures ofthat are controlled by the Company, or for which we arethe Company is otherwise deemed to be the primary beneficiary. The equity method of accounting is applied for thebeneficiary, are consolidated. For joint ventures in which the Company does not have a controlling interest, but exerts a significant influence, the Company applies the equity method of accounting (see “Note 1614 –Investments in and Advances to Joint Ventures" for further discussion).
In the first quarter of 2019 the Company adopted Accounting Standards Update (‘ASU”) 2016-02, “Leases” (“Topic 842”), using the modified retrospective method. The new guidance was applied Intercompany accounts and transactions are eliminated in consolidation. Certain amounts may not foot due to leases that existed or were entered into on or after January 1. 2019. The Company’s results for the reporting period beginning January 1, 2019 have been presented under Topic 842, while prior period amounts have not been adjusted and continue to be reported in accordancerounding.
with previous guidance. See “Note 6 – Leases” for further discussion of the adoption and the impact on the Company’s financial statements.
Fiscal Periods
In October 2018, our board of directors approved a change in our annual and quarterly fiscal period ends from the last Friday on or before the calendar year or quarterly month-end to the last day of the calendar year or quarterly month-end. Accordingly, the period end for the first quarters of fiscal 2018 and fiscal 2019 are March 30, 2018 and March 31, 2019, respectively. The number of days in the quarters ended March 30, 2018 and March 31, 2019 were 91 and 90, respectively.
Use of Estimates
The preparation of the consolidated financial statements in accordance with GAAP requires management to make estimates and assumptions that affect the reported amounts of assets and liabilities at the date of the financial statements and the reported amounts of revenues and expenses during the reporting period. Actual amounts could differ from those estimates. The Company’s most significant estimates and judgments involve revenue recognition with respect to the determination of the costs to complete contracts and transaction price; determination of self-insurance reserves; valuation of the Company’s fair value of common stock; useful lives of property and equipment and intangible assets; calculation of allowance for doubtful accounts; valuation of deferred income tax assets and uncertain tax positions, among others. Please refer toSee “Management’s Discussion and Analysis of Financial Condition and Results of Operations—Critical Accounting Policies and Estimates” and “Note 2 – 2—Summary of Significant Accounting Policies” of Notesin the notes to Consolidated Financial Statementsour consolidated financial statements included in the Company’s Form S-1/A filed April 29, 2019,10-K for the year ended December 31, 2023, for a discussion of the significant estimates and assumptions affecting our consolidated financial statements. Estimates of costs to complete contracts are continually evaluated as work progresses and are revised when necessary. When a change in estimate is determined to have an impact on contract profit, the Company records a positive or negative adjustment to the consolidated statement of income.
|
3. New Accounting Pronouncements |
In the firstfourth quarter of 2019, the Company adopted Topic 842. See “Note 6 – Leases” for further discussion of the adoption and the impact on the Company’s financial statements.
In the first quarter of 2019, the Company adopted ASU 2018-02, “Reclassification of Certain Tax Effects from Accumulated Other Comprehensive Income” under which the Company did not elect to reclassify the income tax effects stranded in accumulated other comprehensive income to retained earnings as a result of the enactment of comprehensive tax legislation, commonly referred to as the Tax Cuts and Jobs Act. As a result, there was no impact on the Company’s financial position, results of operations or cash flows.
On December 30, 2017, the Company adopted ASC 606, “Revenue from Contracts with Customers”, using the modified retrospective method, which provides for a cumulative effect adjustment to retained earnings beginning in fiscal 2018 for those uncompleted contracts impacted by the adoption of the new standard.2023, The difference between the recognition criteria under ASC 606 and our previous recognition practices under ASC 605-35 was recognized through a cumulative adjustment of $4.7 million that was made to the opening balance of accumulated deficit as of December 30, 2017.
In January 2017, the Financial Accounting Standards Board (“FASB”("FASB") issued Issued Accounting Standards Update (“ASU”) 2023-09, "Income Taxes (Topic 740)" ("ASU 2017-04, Simplifying2023-09"). ASU 2023-09 enhances the Testtransparency and decision usefulness of income tax disclosures. The amendments in ASU 2023-09 addresses investor requests for Goodwill Impairment.more transparency about income tax information through improvements to income tax disclosures primarily related to the rate reconciliation and income taxes paid information. ASU 2017-04 simplifies2023-09 also includes certain other amendments to improve the test for goodwill impairment by removing the second stepeffectiveness of the goodwill impairment test, which requires a hypothetical purchase price allocation. A goodwill impairment will now be the amount by which a reporting unit’s carrying value exceeds its fair value, not to exceed the carrying amount of goodwill. The guidanceincome tax disclosures. ASU 2023-09 is effective for interim and annual reporting periodsfiscal years beginning after December 15, 2024.
6
Early adoption is permitted. The adoption of this ASU will not have a material impact on the Company's consolidated financial statements.
In the fourth quarter of 2023, the FASB Issued ASU 2023-07, "Segment Reporting (Topic 280)". ASU 2023-07 introduces enhanced disclosures about significant segment expenses along with other enhanced segment disclosures. ASU 2023-07 is effective for fiscal years beginning after December 15, 20192023, and should be applied prospectively with earlyinterim periods within fiscal years beginning after December 15, 2024. Early adoption is permitted. The Company early adoptedadoption of this ASU will not have a material impact on the new standard asCompany's consolidated financial statements.
During July 2023, the FASB Issued ASU 2023-03. ASU 2023-03 incorporates, into certain accounting standards, amendments to SEC paragraphs pursuant to SEC Staff Accounting Bulletin No. 120, SEC Staff Announcement at the March 24, 2022 EITF meeting, and Staff Accounting Bulletin Topic 6.B, Accounting Series Release 280—General Revisions of the beginningRegulation S-X: Income or Loss Applicable to Common Stock. These rules are effective immediately. The adoption of fiscal 2018 and its adoptionthis ASU did not have a material impact on the Company's consolidated financial statements.
|
|
Polaris AlphaI.S. Engineers, LLC
On MayOctober 31, 2018,2023, the Company entered into a Membership Interest Purchase Agreement to acquired a 100%100% ownership interest in Polaris Alpha,I.S. Engineers, LLC (“I.S. Engineers”), a privately owned, advanced technology-focused provider of innovative mission solutionsprivately-owned company, for complex defense, intelligence, and security customers, as well as other U.S. federal government customers, for $489.1$12.2 million paid in cash. Headquartered in Texas, I.S. Engineers provides full service consulting specializing in transportation engineering, including roads and highways, and program management. The Company borrowed $260 million under the credit agreement, as described in “Note 12 – Debt and Credit Facilities,” to partially fund the acquisition.acquisition was entirely funded by cash on-hand. In
connection with this acquisition, the Company recognized $6.2$0.3 million of acquisition-related expenses in “Indirect,acquisition related “Selling, general and administrative expense” in the consolidated statements of income for the fiscal year ended December 31, 2018,2023, including legal fees, consulting fees, and other miscellaneous direct expenses associated with the acquisition. Polaris AlphaThe Company allocated the purchase price to the appropriate classes of tangible assets and liabilities and assigned the excess of $11.9 million entirely to goodwill. The entire value of goodwill was assigned to the Critical Infrastructure reporting unit and represents synergies expected to be realized from this business combination. No goodwill is deductible for income tax purposes.
Sealing Technologies, Inc.
On August 23, 2023, the Company acquired a 100% ownership interest in Sealing Technologies, Inc (“SealingTech”), a privately-owned company, for $179.3 million in cash and up to an additional $25 million in the event an earn out revenue target is exceeded. The Company borrowed $175 million under the Credit Agreement to fund the acquisition. Headquartered in Maryland, SealingTech expands Parsons’ customer base across the Department of Defense and Intelligence Community, and further enhances the Company’scompany’s capabilities in defensive cyber operations; integrated mission-solutions powered by artificial intelligence (AI) and machine learning (ML); edge computing and edge access modernization; critical infrastructure protection; and secure data analytics expertisemanagement. In connection with new technologiesthis acquisition, the Company recognized $3.3 million of acquisition-related expenses in “Selling, general and solutions. Customersadministrative expense” in the consolidated statements of income for the year ended December 31, 2023, including legal fees, consulting fees, and other miscellaneous direct expenses associated with the acquisition.
The Company has agreed to pay the selling shareholders up to an additional $25 million in the event an earn out revenue target of $110 million is exceeded during the fiscal year ended December 31, 2024. The earn out payment due and payable by the Company to the selling shareholders shall be equal to (i) five-tenths (0.5), multiplied by (ii) the difference of (A) the actual earn out revenue minus (B) the earn out revenue target; provided, however, that in no event shall the earn out payment exceed $25 million. In the event that the earn out revenue is less than or equal to the earn out revenue target, the earn out payment shall be zero. The earn out payment, if any, shall be paid by the Company to the selling shareholders within 15 days following the date the earn out statement becomes final and binding on both companies will benefitparties. The fair value of the earn out (contingent consideration in the table below) was calculated using a Black-Scholes model. See “Note 2—Summary of Significant Accounting Policies” in the notes to our consolidated financial statements included in the Company’s Form 10-K for the year ended December 31, 2023 for further information on how the fair value of contingent consideration is determined.
7
The following table summarizes the acquisition date fair value of the purchase consideration transferred (in thousands):
|
| Amount |
| |
Cash paid at closing |
| $ | 179,259 |
|
Fair value of contingent consideration to be achieved |
|
| 3,231 |
|
Total purchase price |
| $ | 182,490 |
|
The estimated fair value of the SealingTech contingent consideration as of March 31, 2024 was $4.1 million, a $1.8 million increase from existing, complementary technologies and increased scale, enabling end-to-end solutions under the shared visionestimated fair value as of rapid prototyping and agile development.December 31, 2023. The change in the estimated fair value was recorded to "other income (expense), net" in the consolidated financial statements.
The following table summarizes the estimated fair values of the assets acquired and liabilities assumed based on the preliminary purchase price allocation as of the date of acquisition (in thousands):
|
| Amount |
| |
Cash and cash equivalents |
| $ | 8,133 |
|
Accounts receivable |
|
| 17,889 |
|
Contract assets |
|
| 2,946 |
|
Prepaid expenses and other current assets |
|
| 1,379 |
|
Property and equipment |
|
| 2,025 |
|
Right of use assets, operating leases |
|
| 1,836 |
|
Deferred tax assets |
|
| 357 |
|
Goodwill |
|
| 90,593 |
|
Intangible assets |
|
| 75,000 |
|
Accounts payable |
|
| (15,987 | ) |
Accrued expenses and other current liabilities |
|
| (2,408 | ) |
Contract liabilities |
|
| (668 | ) |
Short-term lease liabilities, operating leases |
|
| (418 | ) |
Long-term lease liabilities, operating leases |
|
| (1,418 | ) |
Net assets acquired |
| $ | 179,259 |
|
|
| Amount |
| |
Cash and cash equivalents |
| $ | 7,914 |
|
Accounts receivable |
|
| 29,688 |
|
Contract assets |
|
| 35,229 |
|
Prepaid expenses and other current assets |
|
| 9,295 |
|
Property and equipment |
|
| 9,024 |
|
Goodwill |
|
| 243,471 |
|
Intangible assets |
|
| 199,520 |
|
Other noncurrent assets |
|
| 2,203 |
|
Accounts payable |
|
| (13,942 | ) |
Accrued expenses and other current liabilities |
|
| (26,419 | ) |
Contract liabilities |
|
| (3,529 | ) |
Deferred tax liabilities |
|
| (2,231 | ) |
Other long-term liabilities |
|
| (1,146 | ) |
Net assets acquired |
| $ | 489,077 |
|
Of the total purchase price, the following values were assigned to intangible assets (in thousands, except for years):
|
| Gross Carrying Amount |
|
| Amortization Period | |
|
|
|
|
|
| (in years) |
Developed technology |
| $ | 84,900 |
|
| 4 |
Customer relationships |
|
| 76,000 |
|
| 8 |
Backlog |
|
| 34,900 |
|
| 2 |
Trade name |
|
| 3,600 |
|
| 1 |
Leases |
| $ | 120 |
|
| 6 |
|
| Gross |
|
| Amortization | |
|
|
|
|
| (in years) | |
Customer relationships |
| $ | 40,000 |
|
| 14 |
Backlog |
|
| 26,000 |
|
| 3 |
Developed technologies |
|
| 8,000 |
|
| 3 |
Other |
| $ | 1,000 |
|
| 1 |
Amortization expense of $13.7$3.3 million related to these intangible assets was recorded for the three months ended March 31, 2019.2024. The entire value of goodwill of $243.5 million was assigned to the Parsons Federal Solutions reporting unit and represents synergies expected to be realized from this business combination. A portionThe entire value of goodwill is deductible for tax purposes. The Company is in the process of finalizing the amount.
The amount of revenue generated by Polaris AlphaSealingTech and included within consolidated revenuesrevenue is $16.9 million for the three months ended March 31, 2019 is $93.4 million.2024. The Company has determined that the presentation of net income from the date of acquisition is impracticable due to the integration of general corporate functions upon acquisition.
Supplemental Pro Forma Information (Unaudited)
Supplemental information on anof unaudited pro forma operating results assuming the Polaris AlphaSealingTech acquisition had been consummated as of the beginning of fiscal year 2018 (December 31, 2017)2022 (in thousands) is as follows:
|
| Three Months Ended |
| |
|
| March 30, 2018 |
| |
Pro forma revenue |
| $ | 840,487 |
|
Pro forma net income |
| $ | 10,532 |
|
8
|
| Three Months Ended |
| |||||
|
| March 31, 2024 |
|
| March 31, 2023 |
| ||
Pro forma Revenue |
| $ | 1,535,676 |
|
| $ | 1,190,481 |
|
Pro forma Net Income including noncontrolling interests |
|
| (90,779 | ) |
|
| 34,195 |
|
IPKeys Power Partners
The unaudited pro forma supplemental information is based on estimates and assumptions whichOn April 13, 2023, the Company believes are reasonable and reflects the pro forma impact of additional amortization relatedentered into a merger agreement to the fair value of acquired intangible assets, pro forma impact of reflecting acquisition costs, which consisted of legal, advisory and due diligence fees and expenses and the additional pro forma interest expense related to the borrowings under the credit agreement as of the assumed acquisition date. This supplemental pro forma information has been prepared for comparative purposes and does not purport to be indicative of what would have occurred had the acquisition been consummated during the periods for which pro forma information is presented.
OGSystems
On January 7, 2019, the Company acquiredacquire a 100%100% ownership interest in OGSystems,IPKeys Power Partners (“IPKeys”), a privately owned, advanced technology-focused provider of innovative mission solutionsprivately-owned company, for complex defense, intelligence, and security customers, as well as other U.S. federal government customers, for $292.4$43.0 million paid in cash. The Company borrowed $110 million under the credit agreementmerger brings IPKeys' established customer base, expanding Parsons' presence in two rapidly growing end markets: grid modernization and $150 million oncyber resiliency for critical infrastructure. Headquartered in Tinton Falls, New Jersey, IPKeys is a short-term loan, as described in “Note 12 – Debttrusted provider of enterprise software platform solutions that is actively delivering cyber and Credit Facilities,”operational security to partially fund the acquisition.hundreds of electric, water, and gas utilities across North America. The acquisition was entirely funded by cash on-hand. In connection with this acquisition, the Company recognized $4.1$0.6 million of acquisition-related expenses in “Indirect,“Selling, general and administrative expense” in the consolidated statements of income for the periodyear ended MarchDecember 31, 2019,2023, respectively, including legal fees, consulting fees, and other miscellaneous direct expenses associated with the acquisition. OGSystems enhances the Company’s artificial intelligence and data analytics expertise with new technologies and solutions. Customers of both companies will benefit from existing, complementary technologies and increased scale, enabling end-to-end solutions under the shared vision of rapid prototyping and agile development.
The following table summarizes the estimated fair values of the assets acquired and liabilities assumed based on the preliminary purchase price allocation as of the date of acquisition (in thousands):
|
| Amount |
| |
Cash and cash equivalents |
| $ | 126 |
|
Accounts receivable |
|
| 3,937 |
|
Contract assets |
|
| 834 |
|
Prepaid expenses and other current assets |
|
| 455 |
|
Property and equipment |
|
| 86 |
|
Right of use assets, operating leases |
|
| 1,105 |
|
Other noncurrent assets |
|
| 152 |
|
Goodwill |
|
| 22,407 |
|
Intangible assets |
|
| 23,000 |
|
Accounts payable |
|
| (541 | ) |
Accrued expenses and other current liabilities |
|
| (1,768 | ) |
Contract liabilities |
|
| (1,936 | ) |
Short-term lease liabilities, operating leases |
|
| (343 | ) |
Deferred tax liabilities |
|
| (3,713 | ) |
Long-term lease liabilities, operating leases |
|
| (762 | ) |
Net assets acquired |
| $ | 43,039 |
|
|
| Amount |
| |
Cash and cash equivalents |
| $ | 5,772 |
|
Accounts receivable |
|
| 9,904 |
|
Contract assets |
|
| 9,747 |
|
Prepaid expenses and other current assets |
|
| 4,307 |
|
Property and equipment |
|
| 4,085 |
|
Right of use assets, operating leases |
|
| 8,826 |
|
Goodwill |
|
| 183,567 |
|
Intangible assets |
|
| 92,300 |
|
Other noncurrent assets |
|
| 10 |
|
Accounts payable |
|
| (5,450 | ) |
Accrued expenses and other current liabilities |
|
| (7,147 | ) |
Contract liabilities |
|
| (1,300 | ) |
Short-term lease liabilities, operating leases |
|
| (805 | ) |
Income tax payable |
|
| (1,469 | ) |
Deferred tax liabilities |
|
| (931 | ) |
Long-term lease liabilities, operating leases |
|
| (8,021 | ) |
Other long-term liabilities |
|
| (1,015 | ) |
Net assets acquired |
| $ | 292,380 |
|
Of the total purchase price, the following values were assigned to intangible assets (in thousands, except for years):
|
| Gross Carrying Amount |
|
| Amortization Period | |
|
|
|
|
|
| (in years) |
Customer relationships |
| $ | 57,100 |
|
| 5 |
Backlog |
|
| 27,700 |
|
| 3 |
Trade name |
|
| 3,800 |
|
| 2 |
Non compete agreements |
|
| 2,400 |
|
| 3 |
Developed technologies |
| $ | 1,300 |
|
| 3 |
|
| Gross |
|
| Amortization | |
|
|
|
|
| (in years) | |
Customer relationships (1) |
| $ | 15,900 |
|
| 16 |
Developed technologies |
|
| 7,000 |
|
| 11 |
Other |
| $ | 100 |
|
| 1 |
(1) The acquired business is a SaaS commercial business. Backlog for this type of business is included as customer relationships.
The Company is still in the process of finalizing its valuation of developed technology acquired.
Amortization expense of $5.9$0.4 million related to these intangible assets was recorded for the three months ended March 31, 2019.2024. The entire value of goodwill of $183.6 million was assigned to the Parsons FederalCritical Infrastructure reporting unit and represents synergies expected to be realized from this business combination. Goodwill$0.9 million of $16.0 milliongoodwill is deductible for tax purposes.
The amount of revenue generated by OGSystems since the acquisitionIPKeys and included within consolidated revenuesrevenue is $3.5 million for the three months ended March 31, 2019 is $29.0 million.2024. The Company has determined that the presentation of net income from the date of acquisition is impracticable due to the integration of general corporate functions upon acquisition.
9
Supplemental Pro Forma Information (Unaudited)
Supplemental information on anof unaudited pro forma operating results assuming the OGSystemsIPKeys acquisition had been consummated as of the beginning of fiscal year 2018 (December 31, 2017)2022 (in thousands) is as follows:
|
| Three Months Ended |
| |||||
|
| March 31, 2024 |
|
| March 31, 2023 |
| ||
Pro forma Revenue |
| $ | 1,535,676 |
|
| $ | 1,176,321 |
|
Pro forma Net Income including noncontrolling interests |
|
| (91,953 | ) |
|
| 35,362 |
|
|
| Three Months Ended |
| |||||
|
| March 30, 2018 |
|
| March 31, 2019 |
| ||
Pro forma revenue |
| $ | 782,218 |
|
| $ | 906,360 |
|
Pro forma net income |
| $ | 15,739 |
|
| $ | 17,458 |
|
The unaudited pro forma supplemental information is based on estimates and assumptions which the Company believes are reasonable and reflects the pro forma impact of additional amortization related to the fair value of acquired intangible assets, pro forma impact of reflecting acquisition costs, which consisted of legal, advisory and due diligence fees and expenses and the additional pro forma interest expense related to the borrowings under the credit agreement as of the assumed acquisition date. This supplemental pro forma information has been prepared for comparative purposes and does not purport to be indicative of what would have occurred had the acquisition been consummated during the periods for which pro forma information is presented.
|
|
Disaggregation of Revenue
The Company’s contracts contain both fixed-price and cost reimbursable components. Contract types are based on the component that represents the majority of the contract. The following table presents revenue disaggregated by contract type (in thousands):
|
| Three Months Ended |
| |||||||||||||
|
| March 30, 2018 |
|
| March 31, 2019 |
|
| Three Months Ended |
| |||||||
Fixed-Price |
| $ | 265,408 |
|
| $ | 257,695 |
| ||||||||
|
| March 31, 2024 |
|
| March 31, 2023 |
| ||||||||||
Fixed-price |
| $ | 631,219 |
|
| $ | 341,012 |
| ||||||||
Time-and-Materials |
|
| 227,741 |
|
|
| 255,706 |
|
|
| 350,651 |
|
|
| 318,315 |
|
Cost-Plus |
|
| 261,530 |
|
|
| 391,004 |
| ||||||||
Cost-plus |
|
| 553,806 |
|
|
| 514,139 |
| ||||||||
Total |
| $ | 754,679 |
|
| $ | 904,405 |
|
| $ | 1,535,676 |
|
| $ | 1,173,466 |
|
Refer toSee “Note 2018 – Segments Information” for the Company’s revenues by business lines.
Contract Assets and Contract Liabilities
Contract assets and contract liabilities balances at March 31, 2024 and December 31, 2018 and March 31, 20192023 were as follows (in thousands):
|
| March 31, 2024 |
|
| December 31, 2023 |
| ||
Contract assets |
| $ | 768,007 |
|
| $ | 757,515 |
|
Contract liabilities |
|
| 282,962 |
|
|
| 301,107 |
|
Net contract assets (liabilities) (1) |
| $ | 485,045 |
|
| $ | 456,408 |
|
|
| December 31, 2018 |
|
| March 31, 2019 |
|
| $ change |
|
| % change |
| ||||
Contract assets |
| $ | 515,319 |
|
| $ | 571,755 |
|
| $ | 56,436 |
|
|
| 11.0 | % |
Contract liabilities |
|
| 208,576 |
|
|
| 225,017 |
|
|
| 16,441 |
|
|
| 7.9 | % |
Net contract assets (liabilities) (1) |
| $ | 306,743 |
|
| $ | 346,738 |
|
| $ | 39,995 |
|
|
| 13.0 | % |
During the three months ended March 30, 201831, 2024 and March 31, 2019,2023, the Company recognized revenue of approximately $26.3$138.3 million and $85.7$78.1 million, respectively,that was included in the corresponding contract liability balancebalances at December 30, 201731, 2023 and December 31, 2018,2022, respectively. The change in contract assets and contract liabilities was the result of normal business activity and not significantly impacted by other factors, except as follows:
|
| December 31, 2018 |
|
| March 31, 2019 |
| ||
Acquired contract assets |
| $ | 35,229 |
|
| $ | 9,747 |
|
Acquired contract liabilities |
|
| 3,529 |
|
|
| 1,300 |
|
Reversal of provision for contract losses (1) |
| $ | 133,180 |
|
| $ | - |
|
|
|
There was no significant impairment of contract assets recognized during the three months ended March 30, 201831, 2024 and March 31, 2019.2023.
DuringThere have been no revisions in estimates, such as changes in estimated claims or incentives, related to performance obligations partially satisfied in previous periods that individually had an impact of $5 million or more on revenue.
10
Accounts Receivable, net
Accounts receivable, net consisted of the three months ended March 30, 2018 andfollowing as of March 31, 2019,2024 and December 31, 2023 (in thousands):
|
| 2024 |
|
| 2023 |
| ||
Billed |
| $ | 674,861 |
|
| $ | 646,375 |
|
Unbilled |
|
| 352,542 |
|
|
| 273,215 |
|
Total accounts receivable, gross |
|
| 1,027,403 |
|
|
| 919,590 |
|
Allowance for doubtful accounts |
|
| (3,940 | ) |
|
| (3,952 | ) |
Total accounts receivable, net |
| $ | 1,023,463 |
|
| $ | 915,638 |
|
Billed accounts receivable represents amounts billed to clients that have not been collected. Unbilled accounts receivable represents amounts where the Company recognized revenueshas a present contractual right to bill but an invoice has not been issued to the customer at the period-end date. Receivables from contracts with the U.S. federal government and its agencies were 22% and 18% as of $18.7 millionMarch 31, 2024 and $4.5 million, respectively,December 31, 2023, respectively.
The allowance for doubtful accounts was determined based on consideration of unapproved change orderstrends in actual and claims from changes in transaction price associated with performance obligationsforecasted credit quality of clients, including delinquency and payment history, type of client, such as a government agency or commercial sector client, and general economic conditions and particular industry conditions that were satisfied or partially satisfied. These amounts represent management’s estimates of additional contract revenues that had been earned and were probable of collection. The amount ultimately realized by the Company cannot currently be determined but could be significantly higher or lower than the estimated amount.may affect a client’s ability to pay.
Transaction Price Allocated to the Remaining Unsatisfied Performance Obligations
The Company’s remaining unsatisfied performance obligations (“RUPO”) as of March 31, 20192024 represent a measure of the total dollar value of work to be performed on contracts awarded and in progress.in-progress. The Company had $5.3$6.3 billion in RUPO as of March 31, 2019.2024.
RUPO will increase with awards of new contracts and decrease as the Company performs work and recognizes revenue on existing contracts. Projects are included within RUPO at such time the project is awarded and agreement on contract terms has been reached. The difference between RUPO and backlog relates to unexercised option years that are included within backlog and the value of Indefinite Delivery/Indefinite Quantity (“IDIQ”) contracts included in backlog for which delivery orders have not been issued for the Federal Solutions segment.issued.
RUPO is comprised of: (a) original transaction price, (b) change orders for which written confirmations from our customers have been received, (c) pending change orders for which the Company expects to receive confirmations in the ordinary course of business, and (d) claim amounts that the Company has made against customers for which it has
determined that it has a legal basis under existing contractual arrangements and a significant reversal of revenue is not probable, less revenue recognized to-date.
The Company expects to satisfy its RUPO as of March 31, 20192024 over the following periods (in thousands):
Period RUPO Will Be Satisfied |
| Within One Year |
|
| Within One to |
|
| Thereafter |
| |||
Federal Solutions |
| $ | 1,762,653 |
|
| $ | 350,568 |
|
| $ | 159,288 |
|
Critical Infrastructure |
|
| 2,010,225 |
|
|
| 975,277 |
|
|
| 992,388 |
|
Total |
| $ | 3,772,878 |
|
| $ | 1,325,845 |
|
| $ | 1,151,676 |
|
Period RUPO Will Be Satisfied |
| Within One Year |
|
| Within One to Two Years |
|
| Thereafter |
| |||
Federal solutions |
| $ | 982,972 |
|
| $ | 577,405 |
|
| $ | 324,510 |
|
Critical infrastructure |
|
| 1,560,074 |
|
|
| 783,585 |
|
|
| 1,098,715 |
|
Total |
| $ | 2,543,046 |
|
| $ | 1,360,990 |
|
| $ | 1,423,225 |
|
11
|
|
In February 2016, the FASB issued ASU 2016-02 “Leases (Topic 842)”, which is a new standard related to leases to increase transparency and comparability among organizations by requiring the recognition of right-of-use (“ROU”) assets obtained in exchange for lease liabilities on the balance sheet. Most prominent among the changes in the standard is the recognition of ROU assets and lease liabilities by lessees for those leases classified as operating leases. Under the standard, disclosures are required to meet the objective of enabling users of financial statements to assess the amount, timing, and uncertainty of cash flows arising from leases.
The Company elected to adopt the standard, and available practical expedients, effective January 1, 2019. These practical expedients allowed the Company to keep the lease classification assessed under the previous lease accounting standard (ASC 840) without reassessment under the new standard, and allowed all separate lease components, including non-lease components, to be accounted for as a single lease component for all existing leases prior to adoption of the new standard. Furthermore, the Company made an accounting policy election to not recognize a lease liability and ROU asset for leases with lease terms of twelve months or less.
The Company adopted this new standard under the modified retrospective transition approach without adjusting comparative periods in the financial statements, as allowed under Topic 842, and implemented internal controls and key system functionality to enable the preparation of financial information on adoption.
The standard had a material impact on the Company’s consolidated balance sheets but did not have an impact on the consolidated income statements. The most significant impact was the recognition of ROU assets and lease liabilities for operating leases, while accounting for finance leases remained substantially unchanged.
As a result of the adoption, the Company recorded a cumulative-effect adjustment to retained earnings of $52.6 million net of deferred tax asset adjustment of $0.7 million, representing the unamortized portion of a deferred gain previously recorded as a sale-leaseback transaction associated with the sale of an office building in 2011. The Company concluded the transaction resulted in the transfer of control of the office building to the buyer-lessor at market terms and would have qualified as a sale under Topic 842 with gain recognition in the period the sale was recognized.
The Company determines if an arrangement is a lease at inception. Operating leases are included in operating lease ROU assets and current and long-term operating lease liabilities in the consolidated balance sheets. Finance leases are included in other noncurrent assets, accrued expenses and other current liabilities and other long-term liabilities in the consolidated balance sheets.
ROU assets represent the Company’s right to use an underlying asset for the lease term and lease liabilities represent our obligation to make lease payments arising from the lease. Operating lease ROU assets and liabilities are recognized at commencement date based on the present value of lease payments over the lease term. As most of the Company’s leases do not provide an implicit rate, incremental borrowing rates are used based on the information available at commencement date in determining the present value of lease payments. The operating lease ROU asset also includes any lease payments made and excludes lease incentives. Lease terms may include options to extend or terminate the lease when it is reasonably certain that we will exercise that option. Lease expense for operating lease payments is recognized on a straight-line basis over the lease term.
We have lease agreements with lease and non-lease components, which are generally accounted for separately. For certain equipment leases, such as vehicles, we account for the lease and non-lease components as a single lease component. Additionally, for certain equipment leases, we apply a portfolio approach to effectively account for the operating lease ROU assets and liabilities.
The Company has operating and finance leases for corporate and project office spaces, vehicles, heavy machinery and office equipment. Our leases have remaining lease terms of one year to 11eight years, some of which may include options to extend the leases for up to five years, and some of which may include options to terminate the leases up toafter the seventh year. As of March 31, 2019, assets recorded under finance leases were $1.3 million and accumulated depreciation associated with finance leases was $0.2 million. third year.
The components of lease costs for the three months ended March 31, 20192024 and March 31, 2023 are as follows (in thousands):
|
| Three Months Ended |
| |||||
|
| March 31, 2024 |
|
| March 31, 2023 |
| ||
Operating lease cost |
| $ | 16,677 |
|
| $ | 16,625 |
|
Short-term lease cost |
|
| 3,652 |
|
|
| 3,663 |
|
Amortization of right-of-use assets |
|
| 777 |
|
|
| 516 |
|
Interest on lease liabilities |
|
| 94 |
|
|
| 33 |
|
Sublease income |
|
| (1,119 | ) |
|
| (1,124 | ) |
Total lease cost |
| $ | 20,081 |
|
| $ | 19,713 |
|
|
| Three Months Ended |
| |
|
| March 31, 2019 |
| |
Operating lease cost |
| $ | 18,285 |
|
Short-term lease cost |
|
| 2,004 |
|
Amortization of right-of-use assets |
|
| 225 |
|
Interest on lease liabilities |
|
| 16 |
|
Sublease income |
|
| (930 | ) |
Total lease cost |
| $ | 19,600 |
|
Supplemental cash flow information related to leases for the three months ended March 31, 20192024 and March 31, 2023 is as follows (in thousands):
|
| Three Months Ended |
| |||||
|
| March 31, 2024 |
|
| March 31, 2023 |
| ||
Operating cash flows for operating leases |
| $ | 17,525 |
|
| $ | 17,785 |
|
Operating cash flows for finance leases |
|
| 94 |
|
|
| 33 |
|
Financing cash flows from finance leases |
|
| 740 |
|
|
| 516 |
|
Right-of-use assets obtained in exchange for new operating lease liabilities |
|
| 1,994 |
|
|
| 4,707 |
|
Right-of-use assets obtained in exchange for new finance lease liabilities |
| $ | 1,380 |
|
| $ | 1,228 |
|
|
| Three Months Ended |
| |
|
| March 31, 2019 |
| |
Operating cash flows for operating leases |
| $ | 18,333 |
|
Operating cash flows for financing activities |
|
| 16 |
|
Financing cash flows for finance leases |
|
| 246 |
|
Right-of-use assets operating leases |
|
| 249,848 |
|
Right-of-use assets financing leases |
| $ | 1,341 |
|
Supplemental balance sheet and other information related to leases as of March 31, 2019 is2024 and December 31, 2023 are as follows (in thousands):
|
| Three Months Ended |
| |||||||||
|
| March 31, 2019 |
|
| March 31, 2024 |
|
| December 31, 2023 |
| |||
Operating Leases: |
|
|
|
|
|
|
|
|
|
| ||
Right-of-use assets |
| $ | 216,484 |
|
| $ | 145,803 |
|
| $ | 159,211 |
|
Lease liabilities: |
|
|
|
|
|
|
|
|
|
| ||
Current |
| $ | 53,029 |
|
|
| 55,024 |
|
|
| 58,556 |
|
Long-term |
|
| 181,274 |
|
|
| 106,692 |
|
|
| 117,505 |
|
Total operating lease liabilities |
| $ | 234,303 |
|
| $ | 161,716 |
|
| $ | 176,061 |
|
Finance Leases: |
|
|
|
|
|
|
|
|
|
| ||
Other noncurrent assets |
| $ | 1,341 |
|
| $ | 8,467 |
|
| $ | 7,779 |
|
Accrued expenses and other current liabilities |
| $ | 521 |
|
| $ | 2,973 |
|
| $ | 2,682 |
|
Other long-term liabilities |
| $ | 798 |
|
| $ | 5,563 |
|
| $ | 5,129 |
|
|
|
|
|
|
|
|
|
|
|
| ||
Weighted Average Remaining Lease Term: |
|
|
|
|
|
|
|
|
|
| ||
Operating leases |
| 6 years |
|
| 3.8 years |
|
| 3.9 years |
| |||
Finance leases |
| 3 years |
|
| 3.1 years |
|
| 3.1 years |
| |||
Weighted Average Discount Rate: |
|
|
|
|
|
|
|
|
|
| ||
Operating leases |
|
| 4.5 | % |
|
| 4.2 | % |
|
| 4.2 | % |
Finance leases |
|
| 4.5 | % |
|
| 4.7 | % |
|
| 4.6 | % |
As of March 31, 2019,2024, the Company has additionalno operating leases primarily for office spaces, that have not yet commenced of $6.2 million. These operating leases will commence in 2019 with lease terms of 4 years to 6 years.commenced.
12
A maturity analysis of the future undiscounted cash flows associated with the Company’s operating and finance lease liabilities as of March 31, 20192024 is as follows (in thousands):
|
| Operating Leases |
|
| Finance Leases |
| ||
2019 |
| $ | 47,084 |
|
| $ | 427 |
|
2020 |
|
| 51,139 |
|
|
| 510 |
|
2021 |
|
| 44,062 |
|
|
| 353 |
|
2022 |
|
| 37,987 |
|
|
| 113 |
|
2023 |
|
| 30,997 |
|
|
| - |
|
Thereafter |
|
| 53,870 |
|
|
| - |
|
Total lease payments |
|
| 265,139 |
|
|
| 1,403 |
|
Less: imputed interest |
|
| (30,836 | ) |
|
| (84 | ) |
Total present value of lease liabilities |
| $ | 234,303 |
|
| $ | 1,319 |
|
|
| Operating Leases |
|
| Finance Leases |
| ||
2024 (remaining) |
| $ | 47,189 |
|
| $ | 2,505 |
|
2025 |
|
| 48,831 |
|
|
| 2,922 |
|
2026 |
|
| 32,581 |
|
|
| 2,281 |
|
2027 |
|
| 19,215 |
|
|
| 1,110 |
|
2028 |
|
| 14,472 |
|
|
| 359 |
|
Thereafter |
|
| 12,950 |
|
|
| - |
|
Total lease payments |
|
| 175,238 |
|
|
| 9,177 |
|
Less: imputed interest |
|
| (13,522 | ) |
|
| (641 | ) |
Total present value of lease liabilities |
| $ | 161,716 |
|
| $ | 8,536 |
|
As of December 31, 2018, $276.7 million of minimum rental commitments on operating leases was payable as follows: $67.9 million in 2019, $51.0 million in 2020, $42.5 million in 2021, $35.9 million in 2022, $29.4 million in 2023, and $50.0 million thereafter. Rental expense for the three months ended March 30, 2018 was $18.2 million.
|
|
Accounts receivable, net consisted of the following as of December 31, 2018 and March 31, 2019 (in thousands):
|
| December 31, 2018 |
|
| March 31, 2019 |
| ||
Billed |
| $ | 538,808 |
|
| $ | 534,288 |
|
Unbilled |
|
| 135,180 |
|
|
| 164,034 |
|
Total accounts receivable, gross |
|
| 673,988 |
|
|
| 698,322 |
|
Allowance for doubtful accounts |
|
| (50,702 | ) |
|
| (46,398 | ) |
Total accounts receivable, net |
| $ | 623,286 |
|
| $ | 651,924 |
|
Billed accounts receivable represent amounts billed to clients that have not been collected. Unbilled accounts receivable represent revenue recognized but not yet billed pursuant to contract terms or billed after the period-end date. Substantially all unbilled receivables as of March 31, 2019 are expected to be billed and collected within 12 months. Unbilled accounts receivable at December 31, 2018 and March 31, 2019 include approximately $47.1 million and $49.4 million, respectively, related to unapproved change orders, claims, and requests for equitable adjustment. The Company regularly evaluates these amounts and records adjustments to operating income when recoverability is deemed to have changed. For the periods ended December 31, 2018 and March 31, 2019, no material losses were recognized related to the collectability of claims, unapproved change orders, and requests for equitable adjustment.
The allowance for doubtful accounts was determined based on consideration of trends in actual and forecasted credit quality of clients, including delinquency and payment history, type of client, such as a government agency or commercial sector client, and general economic conditions and particular industry conditions that may affect a client’s ability to pay.
The following table summarizes the changes in the carrying value of goodwill by reporting segment atfrom December 31, 2018 and2023 to March 31, 20192024 (in thousands):
|
| December 31, 2018 |
|
| Acquisitions |
|
| Foreign Exchange |
|
| March 31, 2019 |
|
| December 31, 2023 |
|
| Acquisitions |
|
| Foreign Exchange |
|
| March 31, 2024 |
| ||||||||
Federal Solutions |
| $ | 666,841 |
|
| $ | 183,500 |
|
| $ | - |
|
| $ | 850,341 |
|
| $ | 1,686,901 |
|
| $ | - |
|
| $ | - |
|
| $ | 1,686,901 |
|
Critical Infrastructure |
|
| 70,097 |
|
|
| - |
|
|
| 659 |
|
|
| 70,756 |
|
|
| 105,764 |
|
|
| - |
|
|
| (1,222 | ) |
|
| 104,542 |
|
Total |
| $ | 736,938 |
|
| $ | 183,500 |
|
| $ | 659 |
|
| $ | 921,097 |
|
| $ | 1,792,665 |
|
| $ | - |
|
| $ | (1,222 | ) |
| $ | 1,791,443 |
|
The Company performed a qualitative triggering analysis and determined there was no triggering event indicating a potential impairment to the carrying value of its goodwill at March 31, 2024 and concluded there has not been an impairment.
| 8. Intangible Assets |
The gross amount and accumulated amortization of intangible assets with finite useful lives included in “Intangible assets, net” on the consolidated balance sheets wereare as follows (in thousands except for years):
|
| December 31, 2018 |
|
| March 31, 2019 |
|
| Weighted Average |
|
| March 31, 2024 |
|
| December 31, 2023 |
|
| Weighted |
| ||||||||||||||||||||||||||||||||||||||
|
| Gross Carrying Amount |
|
| Accumulated Amortization |
|
| Net Carrying Amount |
|
| Gross Carrying Amount |
|
| Accumulated Amortization |
|
| Net Carrying Amount |
|
| Amortization Period (in years) |
|
| Gross |
|
| Accumulated |
|
| Net |
|
| Gross |
|
| Accumulated |
|
| Net |
|
| Amortization |
| ||||||||||||||
Backlog |
| $ | 80,754 |
|
| $ | (58,295 | ) |
| $ | 22,459 |
|
| $ | 108,454 |
|
| $ | (65,636 | ) |
| $ | 42,818 |
|
|
| 3 |
|
| $ | 130,000 |
|
| $ | (53,444 | ) |
| $ | 76,556 |
|
| $ | 130,000 |
|
| $ | (45,964 | ) |
| $ | 84,036 |
|
|
| 4.0 |
|
Customer relationships |
|
| 121,629 |
|
|
| (38,974 | ) |
|
| 82,655 |
|
|
| 178,729 |
|
|
| (45,839 | ) |
|
| 132,890 |
|
|
| 7 |
|
|
| 297,120 |
|
|
| (128,679 | ) |
|
| 168,441 |
|
|
| 297,120 |
|
|
| (124,194 | ) |
|
| 172,926 |
|
|
| 9.5 |
|
Leases |
|
| 670 |
|
|
| (561 | ) |
|
| 109 |
|
|
| 670 |
|
|
| (566 | ) |
|
| 104 |
|
|
| 5 |
|
|
| 120 |
|
|
| (112 | ) |
|
| 8 |
|
|
| 120 |
|
|
| (106 | ) |
|
| 14 |
|
|
| 1.0 |
|
Developed technology |
|
| 87,839 |
|
|
| (15,174 | ) |
|
| 72,665 |
|
|
| 89,139 |
|
|
| (20,736 | ) |
|
| 68,403 |
|
|
| 4 |
|
|
| 31,600 |
|
|
| (17,221 | ) |
|
| 14,379 |
|
|
| 31,600 |
|
|
| (15,823 | ) |
|
| 15,777 |
|
|
| 4.6 |
|
Trade name |
|
| 3,600 |
|
|
| (2,100 | ) |
|
| 1,500 |
|
|
| 7,400 |
|
|
| (2,992 | ) |
|
| 4,408 |
|
|
| 1 |
|
|
| 1,000 |
|
|
| (667 | ) |
|
| 333 |
|
|
| 1,000 |
|
|
| (417 | ) |
|
| 583 |
|
|
| 1.1 |
|
Non compete agreements |
|
| - |
|
|
| - |
|
|
| - |
|
|
| 2,400 |
|
|
| (200 | ) |
|
| 2,200 |
|
|
| 2 |
| ||||||||||||||||||||||||||||
Non-compete agreements |
|
| 1,500 |
|
|
| (1,222 | ) |
|
| 278 |
|
|
| 1,500 |
|
|
| (1,097 | ) |
|
| 403 |
|
|
| 3.3 |
| ||||||||||||||||||||||||||||
In process research and development |
|
| 1,800 |
|
|
| - |
|
|
| 1,800 |
|
|
| 1,800 |
|
|
| - |
|
|
| 1,800 |
|
| n/a |
| |||||||||||||||||||||||||||||
Other intangibles |
|
| 275 |
|
|
| (145 | ) |
|
| 130 |
|
|
| 275 |
|
|
| (150 | ) |
|
| 125 |
|
|
| 10 |
|
|
| 275 |
|
|
| (214 | ) |
|
| 61 |
|
|
| 375 |
|
|
| (348 | ) |
|
| 27 |
|
|
| 9.9 |
|
Total intangible assets |
| $ | 294,767 |
|
| $ | (115,249 | ) |
| $ | 179,518 |
|
| $ | 387,067 |
|
| $ | (136,119 | ) |
| $ | 250,948 |
|
|
|
|
|
| $ | 463,415 |
|
| $ | (201,559 | ) |
| $ | 261,856 |
|
| $ | 463,515 |
|
| $ | (187,949 | ) |
| $ | 275,566 |
|
|
|
| |
The aggregate amortization expense of intangible assets was $1.8 million and $20.9 million for the three months ended March 30, 201831, 2024 and March 31, 2019,2023 was $13.7 million and $18.0 million, respectively.
13
Estimated amortization expense for the remainder of the current fiscal year and in each of the next fivefour years and beyond is as follows (in thousands):
|
| March 31, 2024 |
| |
2024 |
| $ | 36,096 |
|
2025 |
|
| 43,448 |
|
2026 |
|
| 37,024 |
|
2027 |
|
| 32,542 |
|
2028 |
|
| 24,329 |
|
Thereafter |
|
| 86,617 |
|
Total |
| $ | 260,056 |
|
|
| March 31, 2019 |
| |
2019 (remaining) |
| $ | 61,883 |
|
2020 |
|
| 72,542 |
|
2021 |
|
| 68,401 |
|
2022 |
|
| 25,808 |
|
2023 |
|
| 15,999 |
|
Thereafter |
|
| 6,315 |
|
Total |
| $ | 250,948 |
|
|
|
Property and equipment consisted of the following at March 31, 2024 and December 31, 2018 and March 31, 20192023 (in thousands):
|
| December 31, 2018 |
|
| March 31, 2019 |
|
| Useful lives (years) |
| March 31, 2024 |
|
| December 31, 2023 |
|
| Useful life | ||||
Buildings and leasehold improvements |
| $ | 54,348 |
|
| $ | 61,631 |
|
| 1-15 |
| $ | 102,041 |
|
| $ | 102,372 |
|
| 1-15 |
Furniture and equipment |
|
| 81,705 |
|
|
| 86,174 |
|
| 3-10 |
|
| 84,417 |
|
|
| 84,244 |
|
| 3-10 |
Computer systems and equipment |
|
| 148,255 |
|
|
| 152,558 |
|
| 3-10 |
|
| 174,950 |
|
|
| 168,926 |
|
| 3-10 |
Construction equipment |
|
| 12,074 |
|
|
| 11,832 |
|
| 5-7 |
|
| 6,463 |
|
|
| 6,173 |
|
| 5-7 |
Construction in progress |
|
| 21,536 |
|
|
| 21,030 |
|
|
| ||||||||||
|
|
| 389,407 |
|
|
| 382,745 |
|
|
| ||||||||||
Accumulated depreciation |
|
| (204,533 | ) |
|
| (214,896 | ) |
|
|
|
| (290,908 | ) |
|
| (283,788 | ) |
|
|
Property and equipment, net |
| $ | 91,849 |
|
| $ | 97,298 |
|
|
|
| $ | 98,499 |
|
| $ | 98,957 |
|
|
|
Depreciation expense of $7.2 million and $9.7 million was recorded for the three months ended March 30, 201831, 2024 and March 31, 2019, respectively.
|
|
During fiscal 2011, the Company consummated two sale-leaseback transactions associated with the sale of two office buildings from which the Company recognized a total gain in the consolidated statements of income (loss) of approximately $106.72023 was $9.4 million and a total deferred gain of approximately $107.8 million. The current$9.4 million, respectively.
|
|
Debt consisted of the following (in thousands):
Long-Term: |
| December 31, 2018 |
|
| March 31, 2019 |
| ||
Revolving credit facility |
| $ | 180,000 |
|
| $ | 260,000 |
|
Senior notes |
|
| 250,000 |
|
|
| 250,000 |
|
Debt issuance costs |
|
| (836 | ) |
|
| (789 | ) |
Total long-term |
|
| 429,164 |
|
|
| 509,211 |
|
Short-Term: |
|
|
|
|
|
|
|
|
Term Loan |
|
| - |
|
|
| 150,000 |
|
Debt issuance costs |
|
| - |
|
|
| (214 | ) |
Total Short-Term |
|
| - |
|
|
| 149,786 |
|
Total Debt |
| $ | 429,164 |
|
| $ | 658,997 |
|
|
| March 31, 2024 |
|
| December 31, 2023 |
| ||
Long-Term Debt: |
|
|
|
|
|
| ||
Delayed draw term loan |
| $ | 350,000 |
|
| $ | 350,000 |
|
Convertible senior notes due 2025 |
|
| 115,443 |
|
|
| 400,000 |
|
Convertible senior notes due 2029 |
|
| 800,000 |
|
|
| - |
|
Revolving credit facility |
|
| - |
|
|
| - |
|
Debt issuance costs |
|
| (19,000 | ) |
|
| (4,037 | ) |
Total |
| $ | 1,246,443 |
|
| $ | 745,963 |
|
Delayed Draw Term Loan
In November 2017,September 2022, the Company entered into a $350 million unsecured Delayed Draw Term Loan with an amendedincrease option of up to $150 million (the “2022 Delayed Draw Term Loan”). Proceeds of the 2022 Delayed Draw Term Loan Agreement may be used (a) to pay off in full, or partially payoff, the Company’s existing Senior Notes, (b) to prepay revolving loans outstanding under the Revolving Credit Agreement (as defined below), or (c) for working capital, capital expenditures and restated Credit Agreement.other lawful corporate purposes. The Company drew $350.0 million from the 2022 Delayed Draw Term Loan in November 2022. The Company incurred $0.9 million of debt issuance costs in connection with the delayed draw term loan. These costs are presented as a direct deduction from long-term debt on the face of the balance sheet. Interest expense related to the Delayed Draw Term Loan for the three months ended March 31, 2024 and March 31, 2023 were $6.0 million and $5.1 million, respectively. The amortization of debt issuance costs and interest expense is recorded in “Interest expense” on the consolidated statements of income. As of March 31, 2024 and December 31, 2023, there was $350.0 million outstanding under the Delayed Draw Term Loan.
14
The 2022 Delayed Draw Term Loan has a three-year maturity and permits the Company to borrow in U.S. dollars. The 2022 Delayed Draw Term Loan does not require any amortization payments by the Company. Depending on the Company’s consolidated leverage ratio (or debt rating after such time as the Company has such rating), borrowings under the 2022 Delayed Draw Term Loan Agreement will bear interest at either an adjusted Term SOFR benchmark rate plus a margin between 0.875% and 1.500% or a base rate plus a margin of between 0% and 0.500% and will initially bear interest at the middle of this range. The Company will pay a ticking fee on unused term loan commitments at a rate of 0.175% commencing with the date that is ninety (90) days after the Closing Date. Amounts outstanding under the 2022 Delayed Draw Term Loan Agreement may be prepaid at the option of the Company without premium or penalty, subject to customary breakage fees in connection with the prepayment of benchmark rate loans. The interest rates on March 31, 2024 and December 31, 2023 were 6.4% and 6.6%, respectively.
Convertible Senior Notes due 2025
In August 2020, the Company issued an aggregate $400.0 million of 0.25% Convertible Senior Notes due 2025, including the exercise of a $50.0 million initial purchasers’ option. The Company received proceeds from the issuance and sale of the Convertible Senior Notes of $389.7 million, net of $10.3 million of transaction fees and other third-party offering expenses. The Convertible Senior Notes accrue interest at a rate of 0.25% per annum, payable semi-annually on February 15 and August 15 of each year beginning on February 15, 2021, and will mature on August 15, 2025, unless earlier repurchased, redeemed or converted.
The Convertible Senior Notes are the Company’s senior unsecured obligations and will rank senior in right of payment to any of the Company’s indebtedness that is expressly subordinated in right of payment to the Notes; equal in right of payment to any of the Company’s unsecured indebtedness that is not so subordinated; effectively junior in right of payment to any of the Company’s secured indebtedness, to the extent of the value of the assets securing such indebtedness; and structurally junior to all indebtedness and other liabilities (including trade payables) of the Company’s subsidiaries
Each $1,000 of principal of the Notes will initially be convertible into 22.2913 shares of our common stock, which is equivalent to an initial conversion price of $44.86 per share, subject to adjustment upon the occurrence of specified events. On or after March 15, 2025 until the close of business on the second scheduled trading day immediately preceding the maturity date of the Convertible Senior Notes, holders may convert all or a portion of their Convertible Senior Notes, regardless of the conditions below.
Prior to the close of business on the business day immediately preceding March 15, 2025, the Notes will be convertible at the option of the holders thereof only under the following circumstances:
15
The Company may redeem all or any portion of the Convertible Senior Notes for cash, at its option, on or after August 21, 2023 and before the 51st scheduled trading day immediately before the maturity date at a redemption price equal to 100% of the principal amount of the Notes to be redeemed, plus accrued and unpaid interest, but only if the last reported sale price per share of the Company’s common stock exceeds 130% of the conversion price for a specified period of time. In addition, calling any Convertible Senior Note for redemption will constitute a Make-Whole Fundamental Change with respect to that Convertible Senior Note, in which case the conversion rate applicable to the conversion of that Convertible Senior Note will be increased in certain circumstances if it is converted after it is called for redemption.
Upon the occurrence of a fundamental change prior to the maturity date of the Convertible Senior Notes, holders of the Convertible Senior Notes may require the Company to repurchase all or a portion of the Convertible Senior Notes for cash at a price equal to 100% of the principal amount of the Convertible Senior Notes to be repurchased, plus any accrued and unpaid interest to, but excluding, the fundamental change repurchase date.
Upon conversion, the Company may settle the Convertible Senior Notes for cash, shares of the Company’s common stock, or a combination thereof, at the Company’s option. If the Company satisfies its conversion obligation solely in cash or through payment and delivery of a combination of cash and shares of the Company’s common stock, the amount of cash and shares of common stock due upon conversion will be based on a daily conversion value calculated on a proportionate basis for each trading day in a 50-trading day observation period.
The Company recognized interest expense of $3.7 million and $0.8 million for the three months ended March 31, 2024 and March 31, 2023, respectively. The net, carrying value of the Convertible Senior Notes were $115.4 million and $396.5 million as of March 31, 2024 and December 31, 2023, respectively.
See the discussion of the partial repurchase of Convertible Senior Notes due 2025 and the unwind of the related note hedge and warrants below.
Note Hedge and Warrant - Convertible Senior Notes due 2025
In connection with the sale of the Convertible Senior Notes, the Company purchased a bond hedge designed to mitigate the potential dilution from the conversion of the Convertible Senior Notes. Under the five-year term of the bond hedge, upon a conversion of the bonds, the Company will receive the number of shares of common stock equal to the remaining common stock deliverable upon conversion of the Convertible Senior Notes if the conversion value exceeds the principal amount of the Notes. The aggregate number of shares that the Company could be obligated to issue upon conversion of the Convertible Senior Notes is approximately $2.08.9 million shares. The cost of the convertible note hedge transactions was $55.0 million.
The cost of the convertible note hedge was partially offset by the Company’s sale of warrants to acquire approximately 8.9 million shares of the Company’s common stock. The warrants were initially exercisable at a price of at least $66.46 per share and are subject to customary adjustments upon the occurrence of certain events, such as the payment of dividends. The Company received $13.8 million in cash proceeds from the sales of these warrants.
The bond hedge and warrant transactions effectively increased the conversion price associated with the Convertible Senior Notes during the term of these transactions from 35%, or $44.86, to 100%, or $66.46, at their issuance, thereby reducing the dilutive economic effect to shareholders upon actual conversion.
The bond hedges and warrants are indexed to, and potentially settled in, shares of the Company’s common stock. The net cost of $41.2 million for the purchase of the bond hedges and sale of the warrants was recorded as a reduction to additional paid-in capital in the consolidated balance sheets.
At issuance, the Company recorded a deferred tax liability of $16.2 million related to the Convertible Senior Notes debt discount and the capitalized debt issuance costs. The Company also recorded a deferred tax asset of $16.5 million related to the convertible note hedge transactions and the tax basis of the capitalized debt issuance costs through additional paid-in capital. The deferred tax liability and deferred tax asset were included net in “Deferred tax assets” on the consolidated balance sheets. Upon adoption of ASU 2020-06, the Company reversed the deferred tax liability of $13.9 million that the Company had recorded at issuance related to the Convertible Senior Note debt discount and recorded an additional deferred tax liability of $0.4 million related to the capitalized debt issuance costs. In addition, the Company recorded a $0.9 million adjustment to the deferred tax asset through retained earnings related to the tax effect of book accretion recorded in 2020 and reversed upon adoption.
16
Convertible Senior Notes due 2029
In February 2024, the Company issued an aggregate $800.0 million of 2.625% Convertible Senior Notes due 2029 (the “2029 Convertible Notes”), including the exercise of a $100.0 million initial purchasers’ option in full. The Company received proceeds from the issuance and sale of the 2029 Convertible Notes of $781.1 million, net of $18.9 million of transaction fees and other third-party offering expenses. The 2029 Convertible Notes accrue interest at a rate of 2.625% per annum, payable semi-annually on March 1 and September 1 of each year beginning on September 1, 2024, and will mature on March 1, 2029, unless earlier repurchased, redeemed or converted.
The 2029 Convertible Notes are the Company’s senior unsecured obligations and will rank senior in right of payment to any of the Company’s indebtedness that is expressly subordinated in right of payment to the 2029 Convertible Notes; equal in right of payment to any of the Company’s unsecured indebtedness that is not so subordinated; effectively junior in right of payment to any of the Company’s secured indebtedness, including borrowings under the Company’s revolving credit facility and delayed draw term loan credit facility, to the extent of the value of the assets securing such indebtedness; and structurally junior to all indebtedness and other liabilities (including trade payables) of the Company’s subsidiaries.
Each $1,000 of principal of the 2029 Convertible Notes will initially be convertible into 10.6256 shares of our common stock, which is equivalent to an initial conversion price of approximately $94.11 per share, subject to adjustment upon the occurrence of specified events. On or after October 1, 2028 until the close of business on the second scheduled trading day immediately preceding the maturity date of the 2029 Convertible Notes, holders may convert all or a portion of their 2029 Convertible Notes, regardless of the conditions below.
Prior to the close of business on the business day immediately preceding October 1, 2028, the 2029 Convertible Notes will be convertible at the option of the holders thereof only under the following circumstances:
The Company may redeem all or any portion of the 2029 Convertible Notes for cash, at its option, on or after March 8, 2027 and before the 51st scheduled trading day immediately before the maturity date at a redemption price equal to 100% of the principal amount of the 2029 Convertible Notes to be redeemed, plus accrued and unpaid interest, but only if the last reported sale price per share of the Company’s common stock exceeds 130% of the conversion price for a specified period of time. In addition, calling any 2029 Convertible Notes for redemption will constitute a Make-Whole Fundamental Change with respect to that 2029 Convertible Note, in which case the conversion rate applicable to the conversion of that 2029 Convertible Notes will be increased in certain circumstances if it is converted after it is called for redemption.
Upon the occurrence of a fundamental change prior to the maturity date of the 2029 Convertible Notes, holders of the 2029 Convertible Notes may require the Company to repurchase all or a portion of the 2029 Convertible Notes for cash at a price equal to 100% of the principal amount of the 2029 Convertible Notes to be repurchased, plus any accrued and unpaid interest to, but excluding, the fundamental change repurchase date.
Upon conversion, the Company will settle the principal amount of the 2029 Convertible Notes converted in cash and will settle the remainder of the consideration owed upon conversion in cash, shares of the Company’s common stock, or a combination thereof, at the Company’s option, with such amount of cash and, if applicable, shares of common stock
17
due upon conversion based on a daily conversion value calculated on a proportionate basis for each trading day in a 50-trading day observation period.
The Company recognized interest expense with respect to the 2029 Convertible Notes of $2.4 million for the three months ended March 31, 2024. As of March 31, 2024, the net, carrying value of the 2029 Convertible Notes was $781.5 million.
Capped Call Transactions - Convertible Senior Notes due 2029
In February 2024, in connection with the offering of the 2029 Convertible Notes, the Company entered into capped call transactions (the “Capped Call Transactions”) with certain financial institutions. The Capped Call Transactions are expected generally to reduce the potential dilution to the Company’s common stock upon any conversion of the Convertible Senior Notes due 2029 and/or offset any cash payments the Company is required to make in excess of the principal amount of any converted Convertible Senior Notes due 2029, as the case may be. If, however, the market price per share of the Company’s common stock, as measured under the terms of the Capped Call Transactions, exceeds the cap price of the Capped Call Transactions, there would nevertheless be dilution and/or there would not be an offset of such cash payments, in each case, to the extent that such market price exceeds the cap price of the Capped Call Transactions.
The cap price of the Capped Call Transactions is initially $131.7575 per share, which represents a premium of 75% over the last reported sale price of the Company’s common stock of $75.29 per share on the New York Stock Exchange on February 21, 2024, and is subject to certain adjustments under the terms of the Capped Call Transactions. The cost of $88.4 million for the Capped Call Transactions was recorded as a reduction to additional paid-in capital in the consolidated balance sheets.
At issuance, the Company recorded a deferred tax asset of $22.3 million related to the Capped Call Transactions costs through additional paid-in capital. The deferred tax asset was included in Deferred tax assets in the consolidated balance sheets.
Convertible Senior Notes due 2025 Partial Repurchase and Note Hedge and Warrants Partial Unwind
In connection with the issuance of the Convertible Senior Notes due 2029, we used $391.8 million of the net proceeds to purchase approximately $228.1 million aggregate principal amount of our Convertible Senior Notes due 2025 concurrently with the offering in separate and individually negotiated transactions. In addition, we used $103.8 million to settle the repurchase of approximately $56.5 million aggregate principal amount of our Convertible Senior Notes due 2025 in a separately negotiated transaction that settled in March 2024. We also received approximately $90.6 million in cash from the note hedge counterparties for the partial termination of the existing bond hedge relating to the Convertible Senior Notes due 2025 repurchased, net of our obligations to the counterparties in connection with the partial termination of the related warrant transactions. The tax effect of $46.2 million from the partial unwind of the existing bond hedge was recognized as a reduction in additional paid-in capital in the consolidated balance sheets. The income tax payable was included in Income taxes payable in the consolidated balance sheets.
The partial repurchase resulted in a $214.2 million loss on debt extinguishment which includes a $3.2 million charge to interest expense for the acceleration of the amortization of debt issuance costs associated with the 0.25% Convertible Senior Notes due 2025. The tax effect of the debt extinguishment, excluding the interest expense, was recognized as a discrete event to the quarter giving rise to an increase in the effective tax rate and tax benefit of $49.9 million recognized in the income statement.
Revolving Credit Facility
In June 2021, the Company entered into a $650 million unsecured revolving credit facility (the “Credit Agreement”). The Company incurred $1.9 million of costs in connection with this amendment.Credit Agreement. The 2021 Credit Agreement replaced an existing Fifth Amended and Restated Credit Agreement dated as of November 15, 2017. Under the new agreement, the Company’s revolving credit facility was increased from $500$550 million to $550 million$650 million. The credit facility has a five-year maturity, which may be extended up to two times for periods determined by the Company and the term ofapplicable extending lenders, and permits the agreement was extended through November 2022. Company to borrow in U.S. dollars, certain specified foreign currencies, and each other currency that may be approved in accordance with the 2021 Facility.The borrowings under the Credit Agreement bear interest at the Company’s option, at either the Base RateTerm SOFR rate plus a margin between 1.0% and 1.625% or a base rate (as defined in the Credit Agreement), plus an applicablea margin or LIBOR plus an applicable margin. The applicable margin for Base Rate loans is a range of 0.125% to 1.00%between 0% and the applicable margin for LIBOR loans is a range of 1.125% to 2.00%, both based on the leverage ratio of the Company at the end of each fiscal quarter. 0.625%.The rates aton March 31, 2024 and December 31, 20182023 were 6.6% and March 31, 2019 were 4.253% and 4.267%6.7%, respectively. Borrowings under this Credit Agreement are guaranteed by certain of the Company’sCompany operating
18
subsidiaries. Letters of credit commitments outstanding under this agreement aggregated approximately $49.8to $42.1 million and $48.8$43.8 million at March 31, 2024 and December 31, 2018 and March 31, 2019,2023, respectively, which reduced borrowing limits available to the Company. Interest expense related to the credit agreementCredit Agreement was $3.4$0.3 million and$0.1 millionfor the three months ended March 31, 2019. There were no amounts outstanding during the three months ended March 30, 2018.
On July 1, 2014, the Company finalized a private placement whereby the Company raised an aggregate amount of $250.0 million in debt repayable as follows (in thousands):
Tranche |
| Debt Amount |
|
| Maturity Date |
| Interest Rates |
| ||
Senior Note, Series A |
| $ | 50,000 |
|
| July 15, 2021 |
|
| 4.44 | % |
Senior Note, Series B |
|
| 100,000 |
|
| July 15, 2024 |
|
| 4.98 | % |
Senior Note, Series C |
|
| 60,000 |
|
| July 15, 2026 |
|
| 5.13 | % |
Senior Note, Series D |
| $ | 40,000 |
|
| July 15, 2029 |
|
| 5.38 | % |
The Company incurred approximately $1.1 million of debt issuance costs in connection with the private placement. On August 10, 2018, the Company finalized an amended and restated intercreditor agreement related to this private placement to more closely align certain covenants and definitions with the terms under the 2017 amended and restated Credit Agreement and incurred approximately $0.5 million of additional issuance costs. These costs are presented as a direct deduction from the debt on the face of the consolidated balance sheets. Interest expense related to the Senior Notes approximated $3.1 million and $3.1 million for the periods ended March 30, 20182024 and March 31, 2019,2023, respectively. The amortization of debt issuance costs and interest expense are recorded in “Interest expense” onThere were no loan amounts outstanding under the consolidated statements of income. The Company made interest payments related to the Senior Notes of approximately $6.2 million and $6.2 million during the periods ended March 30, 2018 andCredit Agreement at March 31, 2019. Interest payable of approximately $5.7 million and $2.6 million is recorded in “Accrued expenses and other current liabilities” on the consolidated balance sheets at December 31, 2018 and March 31, 2019, respectively, related to the Senior Notes.2024.
The Credit Agreement and private placement includes various covenants, including restrictions on indebtedness, liens, acquisitions, investments or dispositions, payment of dividends and maintenance of certain financial ratios and conditions. The Company was in compliance with these covenants at March 31, 2024 and December 31, 2018 and March 31, 2019.2023.
Letters of Credit
The Company also has in place several secondary bank credit lines for issuing letters of credit, principally for foreign contracts, to support performance and completion guarantees. Letters of credit commitments outstanding under these bank lines aggregated approximately $223.0$281.0 million and $227.7$320.7 million at March 31, 2024 and December 31, 20182023, respectively.
In 2021 the Organization for Economic Co-operation and March 31, 2019, respectively.
UsingDevelopment (OECD) announced an inclusive Framework on Base Erosion and Profit Shifting (BEPS) including Pillar Two Model Rules defining the global minimum tax, also known as the Global Anti-Base Erosion (GloBE), which aims to ensure that multinational enterprises (MNEs) pay a discounted cash flow technique that incorporates a market interest yield curve with adjustments for duration, optionality, and risk profile,15% minimum level of tax regardless of where the Company has determined that the fair value (level 2)MNE operates. Subsequently, multiple sets of its debt approximates the carrying value. Referadministrative guidance have been issued. Many non-US tax jurisdictions have either recently enacted legislation to “Note 18 – Fair Value of Financial Instruments” for the definition of level 2adopt components of the fair value hierarchy.
In January 2019,Pillar Two Model Rules beginning in 2024 and/or have announced their plans to enact legislation in future years. At this time, we do not expect Pillar Two to result in any material impact to the Company borrowed $150.0 million under our Term Loan AgreementCompany’s income tax provision. We are continuing to partially financeevaluate the OGSystems Acquisition. The Term Loan is comprised of Offshore Rate Loans and Base Rate Loans (each as defined in the Term Loan Agreement), with an initial aggregate principal amount of $150.0 million. The Offshore Rate Loans bear interest at a rate per annum of LIBOR, divided by 1.00 minus the Eurodollar Reserve Percentage, plus 1.25%. The Base Rate Loans bear interest at a rate per annumpotential impact on future periods of the sumPillar Two Framework, pending enactment of (a) the highest of (1) the administrative agent’s reference rate; (2) thelegislation by individual countries.
The Company’s effective tax rate equal to 1.50% per annum above the Offshore Rate;was 25.9% and (3) the rate equal to 0.50% per annum above the latest federal funds rate, plus (b) 0.25%. On May 10, 2019, the Company used proceeds from its May 8, 2019, initial public offering to repay the $150.0 million outstanding balance under the Term Loan. Upon payment of the outstanding balance the loan was closed. Interest expense related to the term loan was $1.4 million24.6% for the three months ended March 31, 2019. There were no amounts outstanding during2024 and March 31, 2023, respectively. The increase in the three months ended March 30, 2018.
Amortizationeffective tax rate was due primarily to a change in jurisdictional mix of debt issuance costs for allearnings, the Company’s debtforeign-derived intangible income (FDII) deduction, and credit facilities was approximately $0.1 millionequity-based compensation, partially offset by executive compensation subject to Section 162(m). The difference between the effective tax rate and $0.2 millionthe statutory U.S. Federal income tax rate of 21% for the three months ended March 30, 201831, 2024 primarily relates to a change in jurisdictional earnings partially resulting from a loss in partially unwinding Convertible Senior Notes, the FDII deduction, equity based compensation, and March 31, 2019, respectively.
|
|
Historically, the Company has electeduntaxed income attributable to be taxed under the provisions of Subchapter ”S” of the Internal Revenue Code for federal tax purposes. As a result, income has not been subjectnoncontrolling interests, partially offset by rate impacts related to U.S. federal income taxes or state income taxes in those states where the ”S” Corporation status is recognized. No provision or liability for federal or state income tax has been provided in the consolidated financial statements except for those states where the ”S” Corporation status is not recognized and for the 1.5% California franchise tax to which the Company is also subject as a California “S” Corporation. The provision for income tax in the historical periods prior to the Company’s initial public offering consists of these taxes and certain foreign taxes where the Company is subject to tax.withholding taxes.
In connection with the initial public offering on May 8, 2019, the Company’s “S” Corporation status terminated and the Company will be treated as a “C” Corporation under Subchapter C of the Internal Revenue Code. The revocation of the Company’s “S” Corporation election will have a material impact on the Company’s results of operations, financial condition and cash flows. The Company’s effective income tax rate will increase and net income will decrease since the Company will be subject to both federal and state taxes on our earnings.
The termination of the “S” Corporation status will be treated as a change in tax status under ASC 740, “Income Taxes”. These rules require that the deferred tax effects of a change in tax status be recorded to income from continuing operations on the date the “S” Corporation status terminates. The Company estimates the effects of the change in tax
status based upon forecasted temporary differences for the year to be approximately $55 million to $61 million. This range is subject to revision based upon actual results.
As a Subchapter “S” corporation the effective tax rates for the quarters ended March 30, 2018 and March 31, 2019 were 15.54% and 12.35%, respectively. The decrease in the effective rate is principally the result of a change in the jurisdictional earnings.
The US government enacted comprehensive tax legislation on December 22, 2017, which is commonly referred to as the Tax Cuts and Jobs Act ("TCJA"). The TCJA significantly revised the U.S. corporate income tax regime by, among other things, lowering the U.S. corporate tax rate from 35% to 21% effective January 1, 2018. The TCJA also repealed the deduction for domestic production activities, limited the deductibility of certain executive compensation, and implemented a modified territorial tax system with the introduction of the Global Intangible Low-Taxed Income (“GILTI”) tax rules. The TCJA also imposes a one-time transition tax on deemed repatriation of historical earnings of foreign subsidiaries. As a Subchapter “S” corporation, the TCJA has had limited effect on our effective tax rate. However, after the Company revokes the “S” Corporation election, the Company expects to be subject to the federal and state rates, the GILTI tax rules and other changes in the rules under the TCJA.
Because of the complexity of the new GILTI tax rules, and the expected change in status, the Company will continue to evaluate the impact of this provision and the application of ASC 740, Income Taxes. Under GAAP, the Company is allowed to make an accounting policy election of either (i) treating taxes due on future U.S. inclusions in taxable income related to GILTI as a current-period expense when incurred (the "period cost method"), or (ii) factoring such amounts into a Company's measurement of its deferred taxes (the "deferred method"). The Company has elected the period cost method.
As of March 31, 2019,2024, the Company’s deferred tax assets includedwere subject to a valuation allowance of $ 6.736.1 million primarily related to foreign net operating loss carryforwards, foreign tax credit carryforwards, and capital losses that the Company has determined wereare not more likely than notmore-likely-than-not to be realized. The factors used to assess the likelihood of realization wereinclude: the past performance of the related entities, our forecastforecasts of future taxable income, future reversals of existing taxable temporary differences, and available tax planning strategies that could be implemented to realize the deferred tax assets. The ability or failure to achieve the forecasted taxable income in these entities could affect the ultimate realization of deferred tax assets.
As of March 31, 2024 and December 31, 2018 and March 31, 2019,2023, the liability for income taxes associated with uncertain tax positions was $9.9$26.7 million and $10.7$25.5 million, respectively. In the normal course of business,It is reasonably possible that the Company is subject tomay realize a decrease in our uncertain tax audit by several jurisdictionspositions of approximately $7.2 million during the next 12 months as a result of concluding various tax audits and closing tax years.
Although the Company believes its reserves for its tax positions are reasonable, the outcomes which arefinal outcome of tax audits could be materially different, both favorably and unfavorably. It is reasonably possible withinthat certain audits may conclude in the next twelve12 months including lapsesand that the unrecognized tax benefits the Company has recorded in statutes of limitations, could result in adjustments, but will not result in a materialrelation to these tax years may change incompared to the liabilityliabilities recorded for uncertain tax positions.these periods.
|
|
19
We areThe Company is subject to certain lawsuits, claims and assessments that arise in the ordinary course of business. Additionally, the Company has been named as a defendant in lawsuits alleging personal injuries as a result of contact with asbestos products at various project sites. We believeManagement believes that any significant costs relating to these claims will be reimbursed by applicable insurance and, although there can be no assurance that these matters will be resolved favorably, management believes that the ultimate resolution of any of these claims will not have a material adverse effect on our consolidated financial position, results of operations, or cash flows. We record aA liability is recorded when we believe that it is both probable that a loss has been incurred and the amount of loss or range of loss can be reasonably estimated. When using a range of loss estimate, the Company records the liability using the low end of the range unless some amount within the range of loss appears at that time to be a better estimate than any other amount in the range. The Company records a corresponding receivable for costs covered under its insurance policies. Management judgment is required to determine the outcome and the estimated amount of a loss related to such matters. Management believes that there are no claims or assessments outstanding which would materially affect ourthe consolidated results of operations or ourthe Company’s financial position.
On or about March 1, 2017, the Peninsula Corridor Joint Powers Board, or the JPB, filed a lawsuit against Parsons Transportation Group, Inc., or PTG, in the Superior Court of California, County of San Mateo, in connection with a positive train control project on which PTG was engaged prior to termination of its contract by the JPB. PTG had previously filed a lawsuit against the JPB for breach of contract and wrongful termination. The JPB seeks damages in excess of $100.0 million, which the Company is currently disputing. In addition to filing a complaint for breach of contract and wrongful termination, the Company has denied the allegations raised by the JPB and, accordingly, filed affirmative defenses. The Company is currently defending against the JPB’s claims and the parties are still engaged in discovery. The Company also has a professional liability insurance policy to the extent the JPB proves any errors or omissions occurred. At this time, it is too soon to determine the outcome of the litigation or assess the potential range of loss, if any. The Company has also filed a third party claim against a subcontractor for indemnification in connection with this matter.
In September 2015, a former Parsons employee filed an action in the United States District Court for the Northern District of Alabama against us as a qui tam relator on behalf of the United States (the “Relator”) alleging violation of the False Claims Act. The plaintiff alleges that, as a result of these actions, the United States paid in excess of $1 million per month between February and September 2006 that it should have paid to another contractor, plus $2.9 million to acquire vehicles for the contractor defendant to perform its security services. The lawsuit sought (i) that we cease and desist from violating the False Claims Act, (ii) monetary damages equal to three times the amount of damages that the United States has sustained because of our alleged violations, plus a civil penalty of not less than $5,500 and not more than $11,000 for each alleged violation of the False Claims Act, (iii) monetary damages equal to the maximum amount allowed pursuant to §3730(d) of the False Claims Act, and (iv) Relator’s costs for this action, including recovery of attorneys’ fees and costs incurred in the lawsuit. The United States government did not intervene in this matter as it is allowed to do so under the statute. The Companycourt heard dispositive motions in 2023, including Parsons’ motion for summary judgment. We are awaiting the court’s rulings upon such motions, which will determine whether a trial will be necessary for this matter in 2024.
On November 28, 2023, a Proposed Statement of Decision was filed a motion to dismisswith the lawsuit onclerk of the grounds that the Relator did not meet the applicable statute of limitations. The District Court granted the motion to dismiss. The Relator’s attorney appealed the decision to the United StatesSuperior Court of Appealsthe State of California In and For the Eleventh Circuit, which ultimately ruledCounty of San Mateo proposing an award of damages in the total amount of approximately $102.5 million in favor of Parsons Transportation Group, Inc. and against Alstom Signaling Operations LLC (Alstom") (including approximately $62.5 million relating to claims assigned to Parsons pursuant to a prior settlement with the Relator,Peninsula Corridor Joint Powers Board and approximately $40 million attributable to Parsons’ contractual and indemnification claims). This proposed award relates back to a lawsuit Parsons initially filed against the Peninsula Corridor Joint Powers Board for breach of contract and wrongful termination in February 2017 (which was settled between Parsons and the Company petitioned the United States Supreme Court to review the decision. The Supreme Court reviewed the decisionJoint Powers Board in 2021) and accepted the positiona cross-complaint filed against Alstom Signaling Operations LLC in November 2017, as subsequently amended, for breach of the relator. The case was thus remandedcontract, negligence and intentional misrepresentation. Alstom filed objections to the United States DistrictProposed Statement of Decision, and Parsons has filed its responses to the objections. The Court forhas scheduled a hearing upon the Northern DistrictObjections and post-trial motions filed by Alstom in the second quarter of Alabama. The defendants, including Parsons, will file appropriate pleadings opposing the allegations. 2024.
At this time, itthe Company is too soonunable to determine the probability of the outcome of the litigation or assess the potential range of loss, if any.litigation.
Federal government contracts are subject to audits, which are performed for the most part by the Defense Contract Audit Agency (“DCAA”). Audits by the DCAA and other agencies consist of reviews of our overhead rates, operating systems and cost proposals to ensure that we account for such costs in accordance with the Cost Accounting Standards (“CAS”). If the DCAA determines we have not accounted for such costs in accordance with the CAS, the DCAA may disallow these costs. The disallowance of such costs may result in a reduction of revenue and additional liability for the Company. Historically, the Company has not experienced any material disallowed costs as a result of government audits. However, the Company can provide no assurance that the DCAA or other government audits will not result in
20
material disallowances for incurred costs in the future. All audits of costs incurred on work performed through 20092018 have been closed, and years thereafter remain open.
Although there can be no assurance that these matters will be resolved favorably, management believes that their ultimate resolution will not have a material adverse impact on the Company’s consolidated financial position, results of operations, or cash flows. The Company accrues a liability when management believes it is both probable that a liability has been incurred and the amount of loss or range of loss can be reasonably estimated. The Company records a corresponding receivable for costs covered under the insurance policies.
|
|
The Company’s principal retirement benefit plan is the ESOP,Parsons Employee Stock Ownership Plan (“ESOP”), a stock bonus plan, established in 1975 to cover eligible employees of the Company and certain affiliated companies. Contributions of treasury stock to the ESOP are made annually in amounts determined by the Company’s board of directors and are held in trust for the sole benefit of the participants. Shares allocated to a participant’s account are fully vested after sixthree years of credited service, or in the event(s) of reaching age 65, death or disability while an active employee of the Company. All As of March 31, 2024 and December 31, 2023, total shares of the Company’s common stock was acquiredoutstanding were 106,203,479 and 105,839,978, respectively, of which 57,998,295and 59,879,857, respectively, were held by the ESOP.
A participant’s interest in their ESOP in conjunction with a reorganization in 1984, which was financed by the Company.
Uponaccount is redeemable upon certain events, including retirement, death, termination due to permanent disability, a severe financial hardship following termination of employment, certain conflicts of interest following termination of employment, or the exercise of diversification rights,rights. Distributions from the ESOP of participants’ interests are made in their ESOP accounts are redeemable at the current price perCompany’s common stock based on quoted prices of a share of the stock. Such per share prices are established byCompany’s common stock on the ESOP trustee, taking into account, among other things,NYSE. A participant will be able to sell such shares of common stock in the advice of a third-party valuation consultant for the ESOP trustee, as well as the ESOP trustee’s knowledgemarket, subject to any requirements of the Company, as of the end of the plan year preceding distribution.federal securities laws.
Under the terms of the ESOP plan, when participants hold shares that are not readily tradeable, the Company is obligated to redeem eligible participants’ interests in their ESOP accounts for cash upon an employee’s election. All shares held by the ESOP are eventually redeemable in the future for cash at the option of the holder once vesting and eligibility requirements have been met. The Company presents all shares held by the ESOP as temporary equity on the consolidated balance sheets at their redemption value.
Total ESOP contribution expense was approximately $11.2$15.0 million and $12.2$14.4 million for the three months ended March 30, 201831, 2024 and March 31, 2019, respectively, and2023, respectively.The expense is recorded in “Direct costs of contracts” and “Indirect,“Selling, general and administrative expense” in the consolidated statements of income. The fiscal 20192024 ESOP contribution has not yet been made. The amount is currently included in accrued liabilities.
At December 31, 2018
The Company also maintains a defined contribution plan (the “401(k) Plan”). Substantially all domestic employees are entitledAdvances to participate in the 401(k) Plan, subject to certain minimum requirements. The Company’s contribution to the
401(k) Plan for the three months ended March 30, 2018 and March 31, 2019 amounted to $4.7 million and $9.2 million, respectively.
As part of an acquisition in 2014, the Company acquired a defined contribution pension plan, a defined benefit pension plan, and supplemental retirement plan. For the defined contribution pension plan, the Company contributes a base amount plus an additional amount based upon a predetermined formula. At December 31, 2018 and March 31, 2019, the defined benefit pension plan was in a net asset position of $1.7 million and $1.7 million, respectively, which is recorded in “Other noncurrent assets” on the consolidated balance sheets.
|
|
The Company participates in joint ventures to bid, negotiate and complete specific projects. The Company is required to consolidate these joint ventures if it holds the majority voting interest or if the Company meets the criteria under the consolidation model, as described below.
The Company performs an analysis to determine whether its variable interests give the Company a controlling financial interest in a Variable Interest Entity (“VIE”) for which the Company is the primary beneficiary and should, therefore, be consolidated. Such analysis requires the Company to assess whether it has the power to direct the activities of the VIE and the obligation to absorb losses or the right to receive benefits that could potentially be significant to the VIE.
The Company analyzed all of its joint ventures and classified them into two groups: (1) joint ventures that must be consolidated because they are either not VIEs and the Company holds the majority voting interest, or because they are VIEs and the Company is the primary beneficiary; and (2) joint ventures that do not need to be consolidated because they are either not VIEs and the Company holds a minority voting interest, or because they are VIEs and the Company is not the primary beneficiary.
Many of the Company’s joint venture agreements provide for capital calls to fund operations, as necessary; however, such funding is infrequent and is not anticipated to be material.
Letters of credit outstanding described in “Note 1210 – Debt and Credit Facilities” that relate to project ventures are approximately $76.8$149.9 million and $77.2$147.7 million at March 31, 2024 and December 31, 2018 and March 31, 2019, respectively.2023.
In the table below, aggregated financial information relating to the Company’s joint ventures is provided because their nature, risk and reward characteristics are similar. None of the Company’s current joint ventures that meet the characteristics of a VIE are individually significant to the consolidated financial statements.
21
Consolidated Joint Ventures
The following represents financial information for consolidated joint ventures included in the consolidated financial statements (in thousands):
|
| December 31, 2018 |
|
| March 31, 2019 |
|
| March 31, 2024 |
|
| December 31, 2023 |
| ||||
Current assets |
| $ | 287,227 |
|
| $ | 269,856 |
|
| $ | 441,446 |
|
| $ | 426,633 |
|
Noncurrent assets |
|
| 2,689 |
|
|
| 2,285 |
|
|
| 13,011 |
|
|
| 14,295 |
|
Total assets |
|
| 289,916 |
|
|
| 272,141 |
|
|
| 454,457 |
|
|
| 440,928 |
|
Current liabilities |
|
| 199,833 |
|
|
| 209,909 |
|
|
| 263,690 |
|
|
| 260,286 |
|
Noncurrent liabilities |
|
| 4,211 |
|
|
| 5,132 |
| ||||||||
Total liabilities |
|
| 199,833 |
|
|
| 209,909 |
|
|
| 267,901 |
|
|
| 265,418 |
|
Total joint venture equity |
| $ | 90,083 |
|
| $ | 62,232 |
|
| $ | 186,556 |
|
| $ | 175,510 |
|
|
| Three Months Ended |
| |||||
|
| March 31, 2024 |
|
| March 31, 2023 |
| ||
Revenue |
| $ | 202,017 |
|
| $ | 161,484 |
|
Costs |
|
| 171,148 |
|
|
| 141,598 |
|
Net income |
| $ | 30,869 |
|
| $ | 19,886 |
|
Net income attributable to noncontrolling interests |
| $ | 15,243 |
|
| $ | 9,723 |
|
|
| Three Months Ended |
| |||||
|
| March 30, 2018 |
|
| March 31, 2019 |
| ||
Revenue |
| $ | 112,121 |
|
| $ | 115,104 |
|
Costs |
|
| 106,166 |
|
|
| 107,206 |
|
Net income |
|
| 5,955 |
|
|
| 7,898 |
|
Net income attributable to noncontrolling interests |
| $ | 3,815 |
|
| $ | 3,645 |
|
The assets of the consolidated joint ventures are restricted for use only by the particular joint venture and are not available for the Company’s general operations.
Unconsolidated Joint Ventures
The Company accounts for its unconsolidated joint ventures using the equity method of accounting. Under this method, the Company recognizes its proportionate share of the net earnings of these joint ventures as “Equity in (losses) earnings (loss) of unconsolidated joint ventures” in the consolidated statements of income. The Company’s maximum exposure to loss as a result of its investments in unconsolidated VIEsjoint ventures is typically limited to the aggregate of the carrying value of the investment and future funding commitments.
The following represents the financial information of the Company’s unconsolidated joint ventures as presented in their unaudited financial statements (in thousands):
|
| December 31, 2018 |
|
| March 31, 2019 |
|
| March 31, 2024 |
|
| December 31, 2023 |
| ||||
Current assets |
| $ | 707,457 |
|
| $ | 675,030 |
|
| $ | 1,620,565 |
|
| $ | 1,607,953 |
|
Noncurrent assets |
|
| 876,385 |
|
|
| 894,191 |
|
|
| 475,188 |
|
|
| 483,693 |
|
Total assets |
|
| 1,583,842 |
|
|
| 1,569,221 |
|
|
| 2,095,753 |
|
|
| 2,091,646 |
|
Current liabilities |
|
| 560,306 |
|
|
| 487,933 |
|
|
| 1,040,231 |
|
|
| 1,057,113 |
|
Noncurrent liabilities |
|
| 813,269 |
|
|
| 848,105 |
|
|
| 509,299 |
|
|
| 518,647 |
|
Total liabilities |
|
| 1,373,575 |
|
|
| 1,336,038 |
|
|
| 1,549,530 |
|
|
| 1,575,760 |
|
Total joint venture equity |
|
| 210,267 |
|
|
| 233,183 |
|
| $ | 546,223 |
|
| $ | 515,886 |
|
Investments in and advances to unconsolidated joint ventures |
| $ | 63,560 |
|
| $ | 67,202 |
|
| $ | 145,043 |
|
| $ | 128,204 |
|
|
| Three Months Ended |
| |||||
|
| March 31, 2024 |
|
| March 31, 2023 |
| ||
Revenue |
| $ | 473,532 |
|
| $ | 349,157 |
|
Costs |
|
| 476,750 |
|
|
| 359,395 |
|
Net income (loss) |
| $ | (3,218 | ) |
| $ | (10,238 | ) |
Equity in losses of unconsolidated joint ventures |
| $ | (2,060 | ) |
| $ | (5,840 | ) |
|
| Three Months Ended |
| |||||
|
| March 30, 2018 |
|
| March 31, 2019 |
| ||
Revenue |
| $ | 281,078 |
|
| $ | 229,466 |
|
Costs |
|
| 253,664 |
|
|
| 216,780 |
|
Net income |
|
| 27,414 |
|
|
| 12,686 |
|
Equity in earnings of unconsolidated joint ventures |
| $ | 11,031 |
|
| $ | 10,397 |
|
The Company receivedhad net distributions fromcontributions to its unconsolidated joint ventures of $12.3 million and $8.1 million for the three months ended March 30, 201831, 2024 and March 31, 2019,2023 of $20.0 million and of $4.8 million, respectively.
|
|
22
The following table presents certain financial statement impacts from changes in estimates on unconsolidated joint ventures in the Critical Infrastructure segment.
|
| March 31, 2024 |
|
| March 31, 2023 |
| ||
Operating loss |
| $ | (8,361 | ) |
| $ | (6,840 | ) |
Net loss |
|
| (6,258 | ) |
|
| (5,121 | ) |
Diluted loss per share |
| $ | (0.06 | ) |
| $ | (0.04 | ) |
The Company often provides services to unconsolidated joint ventures and revenues include amounts related to recovering overhead costs for these services. For the three months ended March 30, 2018 and March 31, 2019, revenues included $33.7 million and $33.6 million, respectively,Revenues related to services the Company provided to unconsolidated joint ventures. ventures for the three months ended March 31, 2024 and March 31, 2023 were $46.8 million and $50.9 million, respectively.For the three months ended March 30, 201831, 2024 and March 31, 2019,2023, the Company incurred approximately $25.9$35.4 million and $27.2$39.2 million, respectively, of reimbursable costs. The revenue and reimbursable cost prior period amounts have been updated to reflect all joint ventures for the comparable period. Amounts included in the consolidated balance sheets related to services the Company provided to unconsolidated joint ventures isare as follows (in thousands):
|
| December 31, 2018 |
|
| March 31, 2019 |
| ||
Accounts receivable |
| $ | 38,742 |
|
| $ | 30,263 |
|
Contract assets |
|
| 2,648 |
|
|
| 3,527 |
|
Contract liabilities |
| $ | 10,861 |
|
| $ | 9,603 |
|
|
| March 31, 2024 |
|
| December 31, 2023 |
| ||
Accounts receivable |
| $ | 41,237 |
|
| $ | 38,898 |
|
Contract assets |
|
| 13,432 |
|
|
| 38,009 |
|
Contract liabilities |
|
| 15,111 |
|
|
| 15,287 |
|
|
|
The authoritative guidance on fair value measurement defines fair value as the price that would be received to sell an asset or paid to transfer a liability in an orderly transaction between market participants at the measurement date (referred to as an “exit price”). At March 31, 2024 and December 31, 2018 and March 31, 2019,2023, the Company’s financial instruments include cash, cash equivalents, accounts receivable, accounts payable, and other liabilities. The fair values of these financial instruments approximate their carrying values due to their short-term maturities.
Investments measured at fair value are based on one or more of the following three valuation techniques:
Market approach—Prices and other relevant information generated by market transactions involving identical or comparable assets or liabilities;
Cost approach—Amount that would be required to replace the service capacity of an asset (i.e., replacement cost); and
Income approach—Techniques to convert future amounts to a single present amount based on market expectations (including present value techniques, option-pricing models and lattice models).
In addition, the guidance establishes a fair value hierarchy that prioritizes the inputs to valuation techniques used to measure fair value. The hierarchy gives the highest priority to unadjusted quoted market prices in active markets for identical assets and liabilities (Level 1 measurements) and the lowest priority to unobservable inputs (Level 3 measurements). The three levels of the fair value hierarchy are:
|
|
|
|
|
|
Level 1 Unadjusted quoted prices in active markets that are accessible at the measurement date for identical assets and liabilities;
Level 2 Pricing inputs that include quoted prices for similar assets and liabilities in active markets and inputs that are observable for the asset or liability, either directly or indirectly, for substantially the full term of the instrument; and
Level 3 Prices or valuations that require inputs that are both significant to the fair value measurements and unobservable.
The methods described above may produce a fair value calculation that may not be indicative of net realizable value or reflective of future fair values. Furthermore, while the Company believes its valuation methods are appropriate
23
and consistent with other market participants, the use of different methodologies or assumptions to determine the fair value of certain financial instruments could result in a different fair value measurement at the reporting date.
The following table sets forthFinancial assets associated with the pension plan in “Note 15 – Retirement and Other Benefit Plans” that are accounted forliabilities measured at fair value by Level within the fairon a quarterly basis are as follows:
Fair value hierarchy.as of March 31, 2024 (in thousands):
|
| Level 1 |
|
| Level 2 |
|
| Level 3 |
|
| Total |
| ||||
Contingent consideration |
|
|
|
|
|
|
|
|
|
|
|
| ||||
Earnout liability |
| $ | - |
|
| $ | - |
|
| $ | 4,142 |
|
| $ | 4,142 |
|
Total liabilities at fair value |
| $ | - |
|
| $ | - |
|
| $ | 4,142 |
|
| $ | 4,142 |
|
Fair value as of December 31, 20182023 (in thousands):
December 31, 2108 |
| Level 1 |
|
| Level 2 |
|
| Level 3 |
|
| Total |
| ||||
Mutual funds |
| $ | 2,539 |
|
| $ | - |
|
| $ | - |
|
| $ | 2,539 |
|
Fixed income |
|
| - |
|
|
| 10,168 |
|
|
| - |
|
|
| 10,168 |
|
Cash and cash equivalents |
|
| 361 |
|
|
| - |
|
|
| - |
|
|
| 361 |
|
|
| $ | 2,900 |
|
| $ | 10,168 |
|
| $ | - |
|
| $ | 13,068 |
|
|
| Level 1 |
|
| Level 2 |
|
| Level 3 |
|
| Total |
| ||||
Contingent consideration |
|
|
|
|
|
|
|
|
|
|
|
| ||||
Earnout liability |
| $ | - |
|
| $ | - |
|
| $ | 2,300 |
|
| $ | 2,300 |
|
Total liabilities at fair value |
| $ | - |
|
| $ | - |
|
| $ | 2,300 |
|
| $ | 2,300 |
|
Fair value as of March 31, 2019 (in thousands):
March 31, 2109 |
| Level 1 |
|
| Level 2 |
|
| Level 3 |
|
| Total |
| ||||
Mutual funds |
| $ | 2,715 |
|
| $ | - |
|
| $ | - |
|
| $ | 2,715 |
|
Fixed income |
|
| - |
|
|
| 10,689 |
|
|
| - |
|
|
| 10,689 |
|
Cash and cash equivalents |
|
| 264 |
|
|
| - |
|
|
| - |
|
|
| 264 |
|
|
| $ | 2,979 |
|
| $ | 10,689 |
|
| $ | - |
|
| $ | 13,667 |
|
As describedRefer to Notes to Consolidated Financial Statements included in “Note 15 – Retirement and Other Benefit Plans,” the Company acquired a defined contribution pension plan, a defined benefit pension plan, and supplemental retirement plans. AtCompany’s Form 10-K for the year ended December 31, 2018 and March 31, 2019,2023 for a more complete discussion of the Company measured the mutual funds heldvarious items within the defined benefit pension planconsolidated financial statements measured at fair value using unadjusted quoted prices in active marketsand the methods used to determine fair value.
The carrying values and estimated fair values of our financial instruments that are accessible for identical assets. The Company measured the fixed income securities using market bid and ask prices. The inputs that are significantnot required to valuation of fixed income securities are generally observable and therefore have been classified as Level 2.
The following table sets forth redeemable common stock associated with the ESOP in as described in “Note 14 – Retirement and Other Benefit Plans” that is accounted forbe recorded at fair value by Level within the fair value hierarchy.
Fair value as of December 31, 2018 (in thousands):
December 31, 2108 |
| Level 1 |
|
| Level 2 |
|
| Level 3 |
|
| Total |
| ||||
Redeemable common stock |
| $ | - |
|
| $ | - |
|
| $ | 1,876,309 |
|
| $ | 1,876,309 |
|
Fair value as of March 31, 2019 (in thousands):
March 31, 2109 |
| Level 1 |
|
| Level 2 |
|
| Level 3 |
|
| Total |
| ||||
Redeemable common stock |
| $ | - |
|
| $ | - |
|
| $ | 1,875,332 |
|
| $ | 1,875,332 |
|
As described in “Note 15 – Retirement and Other Benefit Plans,” the Company is obligated to redeem eligible participants’ interests in their ESOP accounts for cash upon an employee’s election. All shares held by the ESOP are eventually redeemable in the future for cash at the option of the holder once vesting and eligibility requirements have been met. The Company presents all shares held by the ESOP as temporary equity on theour consolidated balance sheets, at their redemption value. At December 31, 2018 and March 31, 2019, approximately 78,172,809 shares and 78,138,831 shares, respectivelyon the basis of the Company’s stockLevel 2 inputs, were held by the ESOP which the Company recorded at their aggregate redemption values of $1.9 billion. The redemption values are based on a share price established by the ESOP trustee, taking into account, among other things, the advice of a third-party valuation consultant for the ESOP trustee as well as the ESOP trustee’s knowledge of the Company. The share price valuation was determined using a combination of income and market-based methods that utilized unobservable Level 3 inputs, including significant assumptions such as forecasted revenue and operating margins, working capital requirements, and weighted average cost of capital.
The following tables present a reconciliation of the beginning and ending balances of the fair value measurements using significant unobservable inputs (Level 3)follows (in thousands):
|
| March 31, 2024 |
|
| December 31, 2023 |
| ||||||||||
|
| Carrying Value |
|
| Fair Value |
|
| Carrying Value |
|
| Fair Value |
| ||||
Liabilities: |
|
|
|
|
|
|
|
|
|
|
|
| ||||
Convertible senior notes due 2025 |
| $ | 115,443 |
|
| $ | 211,261 |
|
| $ | 400,000 |
|
| $ | 568,000 |
|
Convertible senior notes due 2029 |
|
| 800,000 |
|
|
| 872,080 |
|
|
| - |
|
|
| - |
|
Delayed draw term loan |
|
| 350,000 |
|
|
| 350,000 |
|
|
| 350,000 |
|
|
| 350,000 |
|
Total |
| $ | 1,265,443 |
|
| $ | 1,433,341 |
|
| $ | 750,000 |
|
| $ | 918,000 |
|
Balance at December 31, 2018 |
| $ | 1,876,309 |
|
Purchases of treasury stock |
|
| (813 | ) |
Share price adjustment |
|
| (164 | ) |
Balance at March 31, 2019 |
| $ | 1,875,332 |
|
|
|
Basic earnings per common share (“EPS”) is computed using the weighted average number of shares outstanding during the period and income available to shareholders. Diluted EPS includes additional common shares that would have been outstanding if potential common shares with a dilutive effect had been issued using the if-converted method for Convertible Debt and the treasury stock method for all other instruments.
Diluted earnings per share (“EPS”) is computed similar to basic EPS, exceptUnder the treasury stock method, the weighted average number of shares outstanding is increasedadjusted to includereflect the dilutive effects of outstanding stock options and other stock-based awards. There were
Under the if-converted method:
24
The following tables reconcile the denominator and numerator used to compute basic EPS to the denominator and numerator used to compute diluted EPS for the three months ended March 30, 201831, 2024 and March 31, 2019.2023 (in thousands):
The weighted average
|
| Three Months Ended |
| |||||
|
| March 31, 2024 |
|
| March 31, 2023 |
| ||
Numerator for Basic and Diluted EPS: |
|
|
|
|
|
| ||
Net income attributable to Parsons Corporation - basic |
| $ | (107,355 | ) |
| $ | 25,553 |
|
Convertible senior notes if-converted method interest adjustment |
|
| - |
|
|
| 551 |
|
Net income attributable to Parsons Corporation - diluted |
| $ | (107,355 | ) |
| $ | 26,104 |
|
|
|
|
|
|
|
| ||
Denominator for Basic and Diluted EPS: |
|
|
|
|
|
| ||
Basic weighted average number of shares outstanding |
|
| 106,037 |
|
|
| 104,805 |
|
Dilutive effect of stock-based awards |
|
| - |
|
|
| 1,032 |
|
Dilutive effect of convertible senior notes due 2025 |
|
| - |
|
|
| 8,917 |
|
Diluted weighted average number of shares outstanding |
|
| 106,037 |
|
|
| 114,754 |
|
|
|
|
|
|
|
| ||
Earnings per share: |
|
|
|
|
|
| ||
Basic |
| $ | (1.01 | ) |
| $ | 0.24 |
|
Diluted |
| $ | (1.01 | ) |
| $ | 0.23 |
|
Due to the loss for the three months ended March 31, 2024, stock based awards of 1.5 million shares, the potential dilution from convertible senior notes due 2025 of 6.8 million shares and convertible senior notes due 2025 interest expense of $2.8 million have been excluded from the calculation of diluted earnings per share, as their inclusion would have been antidilutive.
Anti-dilutive stock-based awards excluded from the calculation of earnings per share for the three months ended March 31, 2023 were 8,831.
Share Repurchases
On August 9, 2021, the Company’s Board of Directors authorized the Company to acquire a number of shares usedof Common Stock having an aggregate market value of not greater than $100 million from time to compute basictime, commencing on August 12, 2021. The Board further amended this authorization in August 2022 to remove the prior expiration date and diluted EPSgrant executive leadership the discretion to determine the price for such share repurchases. The Board further amended this authorization in February 2024 to restore the repurchase capacity to $100 million and removed the $25 million quarterly cap on such repurchases.
At the time of the February 2024 authorization, the Company had repurchased shares with an aggregated market value (including fees) of $54.7 million. As of March 31, 2024, the Company has $100 million remaining under the stock repurchase program. The aggregate market value of shares of Common Stock the Company is authorized to acquire is now not greater than $154.7 million.
Repurchased shares of common stock are retired and included in “Repurchases of common stock” in cash flows from financing activities in the Consolidated Statements of Cash Flows. The primary purpose of the Company’s share repurchase program is to reduce the dilutive effect of shares issued under the Company’s ESOP and other stock benefit plans. The timing, amount and manner of share repurchases may depend upon market conditions and economic circumstances, availability of investment opportunities, the availability and costs of financing, the market price of the Company's common stock, other uses of capital and other factors.
There were (in thousands):no share repurchases during the three months ended March 31, 2024.
The following table summarizes the repurchase activity under the stock repurchase program:
|
| Three Months Ended |
| |||||
|
| March 30, 2018 |
|
| March 31, 2019 |
| ||
Basic weighted average number of shares outstanding |
|
| 81,846,305 |
|
|
| 78,161,484 |
|
Dilutive common share equivalents |
|
| - |
|
|
| - |
|
Diluted weighted average number of shares outstanding |
|
| 81,846,305 |
|
|
| 78,161,484 |
|
|
| Three Months Ended |
| |||||
|
| March 31, 2024 |
|
| March 31, 2023 |
| ||
Total shares repurchased |
|
| - |
|
|
| 139,398 |
|
Total shares retired |
|
| - |
|
|
| 139,398 |
|
Average price paid per share |
| $ | - |
|
| $ | 43.04 |
|
|
|
25
The Company operates in two reportable segments: Federal Solutions and Critical Infrastructure.
The Federal Solutions segment is a high-end services providerprovides advanced technical solutions to the U.S. government, delivering timely, cost-effective solutionshardware, software and services for mission-critical projects. The segment provides advanced technologies, includingsupporting national security missions in cybersecurity,
missile defense, systems, and subsurface munitions detection, as well as military facility modernization, logistics support, chemical weaponhazardous material remediation and engineering services.
The Critical Infrastructure segment provides integrated designengineering and engineeringmanagement services for complex physical and digital infrastructure around the globe. The Critical Infrastructure segment is a technology innovator focused on next generation infrastructure.digital systems and complex structures. Industry leading capabilities in designengineering and project management allow the Company to deliver significant value to customers by employing cutting-edge technologies, improving timelines and reducing costs.
The Company defines its reportable segments based on the way the chief operating decision maker (“CODM”), currently its Chairman and Chief Executive Officer, evaluates the performance of each segment and manages the operations of the Company for purposes of allocating resources among the segments. The CODM evaluates segment operating performance using segment Revenue and segment Adjusted EBITDA attributable to Parsons Corporation.
The following table summarizes business segment revenue for the periods presented (in thousands):
|
| Three Months Ended |
|
| Three Months Ended |
| ||||||||||
|
| March 30, 2018 |
|
| March 31, 2019 |
|
| March 31, 2024 |
|
| March 31, 2023 |
| ||||
Federal Solutions revenue |
| $ | 291,335 |
|
| $ | 422,812 |
|
| $ | 909,608 |
|
| $ | 634,546 |
|
Critical Infrastructure revenue |
|
| 463,344 |
|
|
| 481,593 |
|
|
| 626,068 |
|
|
| 538,920 |
|
Total revenue |
| $ | 754,679 |
|
| $ | 904,405 |
|
| $ | 1,535,676 |
|
| $ | 1,173,466 |
|
|
| Three Months Ended |
| |||||
|
| March 31, 2024 |
|
| March 31, 2023 |
| ||
Equity in (losses) earnings of unconsolidated joint ventures: |
|
|
|
|
|
| ||
Federal Solutions |
| $ | (469 | ) |
| $ | 1,112 |
|
Critical Infrastructure |
|
| (1,591 | ) |
|
| (6,952 | ) |
Total equity in (losses) earnings of unconsolidated joint ventures |
| $ | (2,060 | ) |
| $ | (5,840 | ) |
The Company defines Adjusted EBITDA attributable to Parsons Corporation as Adjusted EBITDA excluding Adjusted EBITDA attributable to noncontrolling interests. The Company defines Adjusted EBITDA as net income (loss) attributable to Parsons Corporation, adjusted to include net income (loss) attributable to noncontrolling interests and to exclude interest expense (net of interest income), provision for income taxes, depreciation and amortization and certain other items that are not considered in the evaluation of ongoing operating performance. These other items include net income (loss) attributable to noncontrolling interests, asset impairment charges, equity-based compensation, income and expense recognized on litigation matters, expenses incurred in connection with acquisitions and other non-recurring transaction costs and expenses related to our prior restructuring. The following table reconciles business segment
26
Adjusted EBITDA attributable to Parsons Corporation to Net Income attributable to Parsons Corporation for the periods presented (in thousands):
|
| Three Months Ended |
| |||||
Adjusted EBITDA attributable to Parsons Corporation |
| March 31, 2024 |
|
| March 31, 2023 |
| ||
Federal Solutions |
| $ | 92,541 |
|
| $ | 56,148 |
|
Critical Infrastructure |
|
| 32,963 |
|
|
| 24,357 |
|
Adjusted EBITDA attributable to Parsons Corporation |
|
| 125,504 |
|
|
| 80,505 |
|
Adjusted EBITDA attributable to noncontrolling interests |
|
| 15,589 |
|
|
| 9,886 |
|
Depreciation and amortization |
|
| (24,531 | ) |
|
| (28,359 | ) |
Interest expense, net |
|
| (11,846 | ) |
|
| (5,665 | ) |
Income tax benefit (expense) |
|
| 32,234 |
|
|
| (11,503 | ) |
Equity-based compensation expense |
|
| (12,656 | ) |
|
| (6,703 | ) |
Loss on extinguishment of debt |
|
| (211,018 | ) |
|
| - |
|
Transaction-related costs (a) |
|
| (2,886 | ) |
|
| (1,618 | ) |
Restructuring expense (b) |
|
| - |
|
|
| (546 | ) |
Other (c) |
|
| (2,502 | ) |
|
| (721 | ) |
Net (loss) income including noncontrolling interests |
|
| (92,112 | ) |
|
| 35,276 |
|
Net income attributable to noncontrolling interests |
|
| 15,243 |
|
|
| 9,723 |
|
Net (loss) income attributable to Parsons Corporation |
| $ | (107,355 | ) |
| $ | 25,553 |
|
|
| Three Months Ended |
| |||||
Adjusted EBITDA attributable to Parsons Corporation |
| March 30, 2018 |
|
| March 31, 2019 |
| ||
Federal Solutions |
| $ | 20,154 |
|
| $ | 38,866 |
|
Critical Infrastructure |
|
| 23,656 |
|
|
| 25,559 |
|
Adjusted EBITDA attributable to Parsons Corporation |
|
| 43,810 |
|
|
| 64,425 |
|
Adjusted EBITDA attributable to noncontrolling interests |
|
| 3,920 |
|
|
| 3,749 |
|
Depreciation and amortization |
|
| (9,009 | ) |
|
| (30,591 | ) |
Interest expense, net |
|
| (3,258 | ) |
|
| (7,815 | ) |
Income tax expense |
|
| (5,353 | ) |
|
| (1,886 | ) |
Litigation-related expenses(a) |
|
| (2,330 | ) |
|
| - |
|
Amortization of deferred gain resulting from sale-leaseback transactions(b) |
|
| 1,813 |
|
|
| - |
|
Transaction-related costs(c) |
|
| (125 | ) |
|
| (9,355 | ) |
Restructuring(d) |
|
| - |
|
|
| (2,218 | ) |
HCM software implementation costs(e) |
|
| - |
|
|
| (2,912 | ) |
Other(f) |
|
| (366 | ) |
|
| (11 | ) |
Net income including noncontrolling interests |
|
| 29,102 |
|
|
| 13,386 |
|
Net income attributable to noncontrolling interests |
|
| 3,815 |
|
|
| 3,645 |
|
Net income attributable to Parsons Corporation |
| $ | 25,287 |
|
| $ | 9,741 |
|
|
|
|
|
|
|
|
|
|
|
|
|
Asset information by segment is not a key measure of performance used by the CODM.
The following tables presentspresent revenues and property and equipment, net by geographic area (in thousands):
|
| Three Months Ended |
|
| Three Months Ended |
| ||||||||||
|
| March 30, 2018 |
|
| March 31, 2019 |
|
| March 31, 2024 |
|
| March 31, 2023 |
| ||||
Revenue |
|
|
|
|
|
|
|
|
|
|
|
|
|
| ||
North America |
| $ | 587,307 |
|
| $ | 731,030 |
|
| $ | 1,272,250 |
|
| $ | 948,715 |
|
Middle East |
|
| 162,406 |
|
|
| 167,952 |
|
|
| 258,921 |
|
|
| 217,398 |
|
Rest of World |
|
| 4,966 |
|
|
| 5,423 |
|
|
| 4,505 |
|
|
| 7,353 |
|
Total Revenue |
| $ | 754,679 |
|
| $ | 904,405 |
|
| $ | 1,535,676 |
|
| $ | 1,173,466 |
|
The geographic location of revenue is determined by the location of the customer.
|
| Three Months Ended |
| |||||||||||||
|
| December 31, 2018 |
|
| March 31, 2019 |
|
| March 31, 2024 |
|
| December 31, 2023 |
| ||||
Property and Equipment, Net |
|
|
|
|
|
|
|
|
|
|
|
|
|
| ||
North America |
| $ | 86,847 |
|
| $ | 92,262 |
|
| $ | 90,189 |
|
| $ | 91,766 |
|
Middle East |
|
| 5,002 |
|
|
| 5,036 |
|
|
| 8,310 |
|
|
| 7,191 |
|
Total Property and Equipment, Net |
| $ | 91,849 |
|
| $ | 97,298 |
|
| $ | 98,499 |
|
| $ | 98,957 |
|
North America includes revenue includes $540.5 million and $669.2 million ofin the United States revenue for the three months ended March 30, 201831, 2024 and March 31, 2019,2023 of $1.2 billion and $882.3 million, respectively.North America property and equipment, net includes $79.9$82.5 million and $86.2$83.9 million of property and equipment, net in the United States at March 31, 2024 and December 31, 2018 and March 31, 2019,2023, respectively.
27
The following table presents revenues by business linesunits (in thousands):
|
| Three Months Ended |
| |||||
|
| March 30, 2018 |
|
| March 31, 2019 |
| ||
Revenue |
|
|
|
|
|
|
|
|
Cyber & Intelligence |
| $ | 44,367 |
|
| $ | 76,110 |
|
Defense |
|
| 73,540 |
|
|
| 134,990 |
|
Mission Solutions |
|
| 74,149 |
|
|
| 68,090 |
|
Engineered Systems |
|
| 99,279 |
|
|
| 114,666 |
|
Geospatial |
|
| - |
|
|
| 28,956 |
|
Federal Solutions revenues |
|
| 291,335 |
|
|
| 422,812 |
|
Connect Communities |
|
| 160,913 |
|
|
| 156,876 |
|
Mobility Solutions |
|
| 255,679 |
|
|
| 269,114 |
|
Industrial |
|
| 46,752 |
|
|
| 55,603 |
|
Critical Infrastructure revenues |
|
| 463,344 |
|
|
| 481,593 |
|
Total Revenue |
| $ | 754,679 |
|
| $ | 904,405 |
|
|
| Three Months Ended |
| |||||
|
| March 31, 2024 |
|
| March 31, 2023 |
| ||
Revenue |
|
|
|
|
|
| ||
Defense and Intelligence |
| $ | 408,388 |
|
| $ | 364,360 |
|
Engineered Systems |
|
| 501,220 |
|
|
| 270,186 |
|
Federal Solutions revenues |
|
| 909,608 |
|
|
| 634,546 |
|
Infrastructure – North America |
|
| 365,282 |
|
|
| 319,559 |
|
Infrastructure – Europe, Middle East and Africa |
|
| 260,786 |
|
|
| 219,361 |
|
Critical Infrastructure revenues |
|
| 626,068 |
|
|
| 538,920 |
|
Total Revenue |
| $ | 1,535,676 |
|
| $ | 1,173,466 |
|
On April 3, 2019,Effective October 1, 2023, the Company’s board of directors declared a cash dividendCompany reorganized its Critical Infrastructure business units from Mobility Solutions and Connected Communities to Infrastructure – North America and Infrastructure – Europe, Middle East and Africa. The prior year information in the table above has been reclassified to conform to the Company’s existing shareholder in the amount of $2.00 per share, or $52.1 million in the aggregate (the “IPO Dividend”). The IPO Dividend was paid on May 10, 2019.business unit changes.
None
On April 15, 2019, the board of directors of the Company declared a common stock dividend in a ratio of two shares of common stock for every one share of common stock presently held by the Company’s stockholder (the “Stock Dividend”). The record date of this common stock dividend, which the Company refers to as the Stock Dividend was May 7, 2019, the day immediately prior to the consummation of the Company’s initial public offering on May 8, 2019, and the payment date of the Stock Dividend was May 8, 2019. Purchasers of the Company’s common stock in the Company’s public offering will not be entitled to receive any portion of the Stock Dividend.28
Item 2. Management’s Discussion and Analysis of Financial Condition and Results of Operations.
The following discussion and analysis is intended to help investors understand our business, financial condition, results of operations, liquidity and capital resources. You should read this discussion together with our consolidated financial statements and related notes thereto included elsewhere in this Form 10-Q and in conjunction with the Company’s Form S-1/A filed April 29, 2019.10-K for the year ended December 31, 2023. Certain amounts may not foot due to rounding.
The statements in this discussion regarding industry outlook, our expectations regarding our future performance, liquidity and capital resources and other non-historical statements in this discussion are forward-looking statements. These forward-looking statements are subject to numerous risks and uncertainties, including, but not limited to, the risks and uncertainties described in “Risk Factors” and “Special Note Regarding Forward-Looking Statements” in the Company’s Form S-1/A filed April 29, 2019.10-K for the year ended December 31, 2023. We undertake no obligation to revise publicly any forward-looking statements. Actual results may differ materially from those contained in any forward-looking statements.
Overview
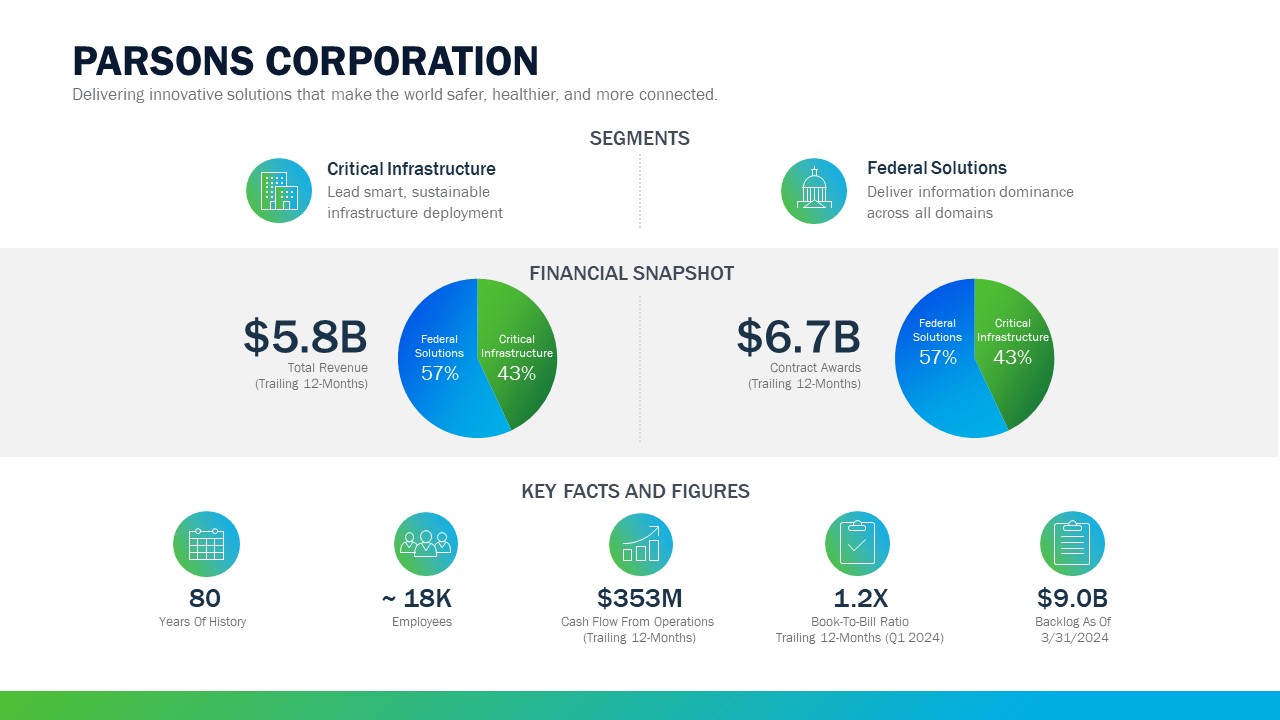
PARSONS CORPORATION Enabling a safer, smarter, and more interconnected world. Engineered solutions for complex physical and digital infrastructure challenges SEGMENTS KEY FACTS AND FIGURES Technology-driven solutions for defense and intelligence customers FINANCIAL SNAPSHOT $4B Total Revenue Trailing 12-Months (Q2 2020) $4B Contract Awards Trailing 12-Months (Q2 2020) 75+ Years Of History Federal Solutions 49% Critical Infrastructure 51% Federal Solutions 58% Critical Infrastructure 42% Federal Solutions Critical Infrastructure ~16K Employees 6% Revenue Growth Trailing 12-Months (Q2 2020) 1.0X Book-To-Bill Ratio Trailing 12-Months (Q2 2020) $7.7B Backlog As Of 6/30/2020 PARSONS CORPORATION.
Overview
We are a leading provider of the integrated solutions and services required in today’s complex security environment and a world of digital transformation. We deliver innovative technology-driven solutions in the defense, intelligence and critical infrastructure markets. We provide technical design and engineering services and software to address our customers’ challenges.customers worldwide. We have developed significant expertise and differentiated capabilities in key areas of cybersecurity, intelligence, missile defense, military trainingC5ISR, space, transportation, water/wastewater and development, connected communities, physical infrastructure and mobility solutions.environmental remediation. By combining our talented team of professionals and advanced technology, we help solve complex technical challenges to enable a safer, smarter, more secure and more interconnectedconnected world.
We operate in two reporting segments, Federal Solutions and Critical Infrastructure. Our Federal Solutions business is a high-end services and technology providerprovides advanced technical solutions to the U.S. government. Our Critical Infrastructure business provides integrated designengineering and engineeringmanagement services for complex physical and digital infrastructure to state and local governments and large companies.
Our employees provide services pursuant to contracts that we are awarded by the customer and specific task orders relating to such contracts. These contracts are often multi-year, which provides us backlog and visibility on our revenues for future periods. Many of our contracts and task orders are subject to renewal and rebidding at the end of their term, and some are subject to the exercise of contract options and issuance of delivery or task orders by the applicable government
29
entity. In addition to focusing on increasing our revenues through increased contract awards and backlog, we focus our financial performance on margin expansion and cash flow.
Key Metrics
We manage and assess the performance of our business by evaluating a variety of metrics. The following table sets forth selected key metrics (in thousands, except Book-to-Bill):
|
| March 31, 2024 |
|
| March 31, 2023 |
| ||
Awards (year to date) |
| $ | 2,082,309 |
|
| $ | 1,382,229 |
|
Backlog (1) |
| $ | 9,028,843 |
|
| $ | 8,365,242 |
|
Book-to-Bill (year to date) |
|
| 1.4 |
|
|
| 1.2 |
|
|
| Three Months Ended |
| |||||
|
| March 30, 2018 |
|
| March 31, 2019 |
| ||
Awards |
| $ | 608,314 |
|
| $ | 1,221,068 |
|
Backlog (1) |
| $ | 6,322,334 |
|
| $ | 8,553,969 |
|
Book-to-Bill |
|
| 0.81 |
|
|
| 1.35 |
|
|
|
Awards
Awards generally represent the amount of revenue expected to be earned in the future from funded and unfunded contract awards received during the period. Contract awards include both new and re-compete contracts and task orders. Given that new contract awards generate growth, we closely track our new awards each year.
The following table summarizes the totalyear to-date value of new awards for the periods presented below (in thousands):
|
| Three Months Ended |
|
| Three Months Ended |
| ||||||||||
|
| March 30, 2018 |
|
| March 31, 2019 |
|
| March 31, 2024 |
|
| March 31, 2023 |
| ||||
Federal Solutions |
| $ | 111,441 |
|
| $ | 808,540 |
|
| $ | 1,282,640 |
|
| $ | 695,644 |
|
Critical Infrastructure |
|
| 496,873 |
|
|
| 412,528 |
|
|
| 799,669 |
|
|
| 686,585 |
|
Total Awards |
| $ | 608,314 |
|
| $ | 1,221,068 |
|
| $ | 2,082,309 |
|
| $ | 1,382,229 |
|
The change in new awards from year to year in our Federal Solutions segment is primarily due to significant new awards in our legacy business and from business acquisitions. The change in new awards in our Critical Infrastructure segment was primarily due to ordinary course fluctuations.fluctuations in our business. The volume of contract awards can fluctuate in any given period due to win rate and the timing and size of the awards issued by our customers. The increase in awards for the three months ended March 31, 2024 when compared to the corresponding period last year was primarily driven by significant option period awards from a customer in our Federal Solutions segment.
Backlog
We define backlog to include the following two components:
Funded—Funded backlog represents thefuture revenue value ofanticipated from orders for services under existing contracts for which funding is appropriated or otherwise authorized less revenue previously recognized on these contracts.
Unfunded—Unfunded backlog represents thefuture revenue value ofanticipated from orders for services under existing contracts for which funding has not been appropriated or otherwise authorized less revenue previously recognized on these contracts.
Backlog includes (i) unissued deliverytask orders and unexercised option years, to the extent their issuance or exercise is probable, as well as (ii) contract awards, to the extent we believe contract execution and funding is probable.
30
The following table summarizes the value of our backlog at the respective dates presented below:below (in thousands):
|
| March 31, 2024 |
|
| March 31, 2023 |
| ||
Federal Solutions: |
|
|
|
|
|
| ||
Funded |
| $ | 1,804,251 |
|
| $ | 1,694,740 |
|
Unfunded |
|
| 3,450,328 |
|
|
| 3,175,568 |
|
Total Federal Solutions |
|
| 5,254,579 |
|
|
| 4,870,308 |
|
Critical Infrastructure: |
|
|
|
|
|
| ||
Funded |
|
| 3,706,435 |
|
|
| 3,445,068 |
|
Unfunded |
|
| 67,829 |
|
|
| 49,866 |
|
Total Critical Infrastructure |
|
| 3,774,264 |
|
|
| 3,494,934 |
|
Total Backlog (1) |
| $ | 9,028,843 |
|
| $ | 8,365,242 |
|
|
| March 30, 2018 |
|
| March 31, 2019 |
| ||
Federal Solutions: |
|
|
|
|
|
|
|
|
Funded |
| $ | 936,467 |
|
| $ | 1,681,816 |
|
Unfunded |
|
| 2,224,354 |
|
|
| 3,429,779 |
|
Total Federal Solutions |
|
| 3,160,821 |
|
|
| 5,111,595 |
|
Critical Infrastructure: |
|
|
|
|
|
|
|
|
Funded |
|
| 3,161,513 |
|
|
| 3,442,374 |
|
Unfunded |
|
| - |
|
|
| - |
|
Total Critical Infrastructure |
|
| 3,161,513 |
|
|
| 3,442,374 |
|
Total Backlog (1) |
| $ | 6,322,334 |
|
| $ | 8,553,969 |
|
|
|
Our backlog includes orders under contracts that in some cases extend for several years. For example, the U.S. Congress generally appropriates funds for our U.S. federal government customers on a yearly basis, even though their contracts with us may call for performance that is expected to take a number of years to complete. As a result, our federal contracts typically are only partially funded at any point during their term and allterm. All or some of the work to be performed under the contracts may remain unfunded unless and until the U.S. Congress makes subsequent appropriations and the procuring agency allocates funding to the contract.
We expect to recognize $2.5$3.8 billion of our funded backlog at March 31, 20192024 as revenues in the following twelve months. However, our U.S. federal government customers may cancel their contracts with us at any time through a termination for convenience or may elect to not exercise option periods under such contracts. In the case of a termination for convenience, we would not receive anticipated future revenues, but would generally be permitted to recover all or a portion of our incurred costs and fees for work performed. See “Risk Factors—RisksRisk Relating to Our Business—We may not realize the full value of our backlog, which may result in lower than expected revenue” in the Company’s Form S-1/A filed on April 29, 2019.10-K for the year ended December 31, 2023.
The changes in backlog in ourboth the Federal Solutions segment isand Critical Infrastructure segments were primarily from business acquisition which contributed $1.3 billion. The change in backlog in our Critical Infrastructure segment was primarily due to ordinary course fluctuations in our business. Our backlog will fluctuate in any given period based onbusiness and the volume of awards issued in comparisonimpacts related to the revenue generated from our existing contracts.Company’s awards discussed above.
Book-to-Bill
Book-to-bill is the ratio of total awards to total revenue recorded in the same period. Our management believes our book-to-bill ratio is a useful indicator of our potential future revenue growth in that it measures the rate at which we are generating new awards compared to the Company’s current revenue. To drive future revenue growth, our goal is for the level of awards in a given period to exceed the revenue booked. A book-to-bill ratio greater than 1.0 indicates that awards generated in a given period exceeded the revenue recognized in the same period, while a book-to-bill ratio of less than 1.0 indicates that awards generated in such period were less than the revenue recognized in such period. The following table sets forth the book-to-bill ratio for the periods presented below:
|
| Three Months Ended |
|
| Three Months Ended |
| ||||||||||
|
| March 30, 2018 |
|
| March 31, 2019 |
|
| March 31, 2024 |
|
| March 31, 2023 |
| ||||
Federal Solutions |
|
| 0.38 |
|
|
| 1.91 |
|
|
| 1.4 |
|
|
| 1.1 |
|
Critical Infrastructure |
|
| 1.07 |
|
|
| 0.86 |
|
|
| 1.3 |
|
|
| 1.3 |
|
Overall |
|
| 0.81 |
|
|
| 1.35 |
|
|
| 1.4 |
|
|
| 1.2 |
|
Factors and Trends Affecting Our Results of Operations
We believe that the financial performance of our business and our future success are dependent upon many factors, including those highlighted in this section. Our operating performance will depend upon many variables, including the success of our growth strategies and the timing and size of investments and expenditures that we choose to undertake, as well as market growth and other factors that are not within our control.
31
Government Spending
Changes in the relative mix of government spending and areas of spending growth, with shifts in priorities on homeland security, intelligence, defense-related programs, infrastructure and urbanization, and continued increased spending on technology and innovation, including cybersecurity, artificial intelligence, connected communities and physical infrastructure, could impact our business and results of operations. Cost-cutting and efficiency initiatives, current and future budget restrictions, spending cuts and other efforts to reduce government spending could cause our government customers to reduce or delay funding or invest appropriated funds on a less consistent basis or not at all, and demand for our solutions or services could diminish. Furthermore, any disruption in the functioning of government agencies, including as a result of government closures and shutdowns, could have a negative impact on our operations and cause us to lose revenue or incur additional costs due to, among other things, our inability to deploy our staff to customer locations or facilities as a result of such disruptions.
Federal Budget Uncertainty
There is uncertainty around the timing, extent, nature and effect of Congressional and other U.S. government actions to address budgetary constraints, caps on the discretionary budget for defense and non-defense departments and agencies, and the ability of Congress to determine how to allocate the available budget authority and pass appropriations bills to fund both U.S. government departments and agencies that are, and those that are not, subject to the caps. Additionally, budget deficits and the growing U.S. national debt increase pressure on the U.S. government to reduce federal spending across all federal agencies, with uncertainty about the size and timing of those reductions. Furthermore, delays in the completion of future U.S. government budgets could in the future delay procurement of the federal government services we provide. A reduction in the amount of, or delays, or cancellations of funding for, services that we are contracted to provide to the U.S. government as a result of any of these impacts or related initiatives, legislation or otherwise could have a material adverse effect on our business and results of operations.
Regulations
Increased audit, review, investigation and general scrutiny by government agencies of performance under government contracts and compliance with the terms of those contracts and applicable laws could affect our operating results. Negative publicity and increased scrutiny of government contractors in general, including us, relating to government expenditures for contractor services and incidents involving the mishandling of sensitive or classified information, as well as the increasingly complex requirements of the U.S. Department of Defense and the U.S. intelligence community,Intelligence Community, including those related to cybersecurity, could impact our ability to perform in the markets we serve.
Competitive Markets
The industries we operate in consist of a large number of enterprises ranging from small, niche-oriented companies to multi-billion dollarmulti-billion-dollar corporations that serve many government and commercial customers. We compete on the basis of our technical expertise, technological innovation, our ability to deliver cost-effective multi-faceted services in a timely manner, our reputation and relationships with our customers, qualified and/or security-clearance personnel, and pricing. We believe that we are uniquely positioned to take advantage of the markets in which we operate because of our proven track record, long-term customer relationships, technology innovation, scalable and agile business offerings and world class talent. Our ability to effectively deliver on project engagements and successfully assist our customers affects our ability to win new contracts and drives our financial performance.
Acquired Operations
Polaris AlphaI.S. Engineers, LLC
On MayOctober 31, 2018, we acquired Polaris Alpha2023, the Company entered into a Membership Interest Purchase Agreement to acquire a 100% ownership interest in I.S. Engineers, LLC, a privately-owned company, for $489.1 million. Polaris Alpha is an advanced, technology-focused provider of innovative mission solutions for national security, intelligence$12.2 million, subject to certain adjustments. Headquartered in Texas, I.S. Engineers, LLC provides full-service consulting specializing in transportation engineering, including roads and other U.S. federal customers. The acquisition was funded by cash on-handhighways, and borrowings under our Revolving Credit Facility.program management. The financial results of Polaris AlphaI.S. Engineers have been included in our consolidated results of operations from June 1, 2018October 31, 2023 onward.
OGSystemsSealing Technologies, Inc.
On January 7, 2019, weAugust 23, 2023, the Company acquired OGSystemsa 100% ownership interest in Sealing Technologies, Inc (“SealingTech”), a privately-owned company, for $292.4 million. OGSystems provides geospatial$179.3 million and up to an additional $25 million in the event an earn out revenue target is exceeded. Headquartered in Maryland, SealingTech expands Parsons’ customer base across the Department of Defense and Intelligence Community, and further enhances the company’s capabilities in defensive cyber operations; integrated mission-solutions powered by artificial intelligence big(AI) and machine learning (ML); edge computing and edge access modernization; critical infrastructure protection; and secure data analytics and threat mitigation for defense and intelligence customers. The acquisition was funded by cash on-hand and borrowings under our Term Loan and Revolving Credit Facility.management. The financial results of OGSystemsSealingTech have been included in our consolidated results of operations from January 7, 2019August 23, 2023 onward.
SeasonalityIPKeys Power Partners
On April 13, 2023, the Company entered into a merger agreement to acquire a 100% ownership interest in IPKeys Power Partners (“IPKeys”), a privately-owned company, for $43.0 million. The merger brings IPKeys' established customer base, expanding Parsons' presence in two rapidly growing end markets: grid modernization and cyber resiliency for critical infrastructure. Headquartered in Tinton Falls, New Jersey, IPKeys is a trusted provider of enterprise software platform solutions that is actively delivering cyber and operational security to hundreds of electric, water, and gas utilities across North America. The financial results of IPKeys have been included in our consolidated results of operations from April 13, 2023 onward.
Seasonality
Our results may be affected by variances as a result of weather conditions and contract award seasonality impacts that we experience across our businesses. This patternThe latter issue is typically driven by the U.S. federal government fiscal year-end, September 30. While not certain, it is not uncommon for U.S. government agencies to award extra taskstask orders or complete other contract actions in the weeks before the end of the U.S. federal government fiscal year in order to avoid the loss of unexpended U.S. federal government fiscal year funds. In addition, we have also historically experienced higher bid and proposal costs in the months leading up to the U.S. federal government fiscal year-end as we pursue new contract opportunities expected to be awarded early in the following U.S. federal government fiscal year as a result of funding appropriated for that U.S. federal government fiscal year. Furthermore, many U.S. state governments with fiscal years ending on June 30 tend to accelerate spending during their first quarter, when new funding becomes available. We may continue to experience this seasonality in future periods, and our results of operations may be affected by it.
Taxes
Historically, the Company has elected to be taxed under the provisions of Subchapter “S” of the Internal Revenue Code for federal tax purposes. As a result, the Company’s income has not been subject to U.S. federal income taxes or state income taxes in those states where the “S” Corporation status is recognized. No provision or liability for federal or state income tax has been provided in the Company’s consolidated financial statements except for those states where the “S” Corporation status is not recognized and for the 1.5% California franchise tax to which the Company are also subject as a California “S” Corporation. The provision for income tax in the historical periods prior to the initial public offering consists of these taxes.
In connection with the initial public offering on May 8, 2019, the Company’s “S” Corporation status terminated and the Company will be treated as a “C” Corporation under Subchapter C of the Internal Revenue Code. The revocation of the Company’s “S” Corporation election will have a material impact on the Company’s results of operations, financial condition and cash flows. The effective income tax rate will increase and net income will decrease since the Company will be subject to both federal and state taxes on our earnings.
Results of Operations
In October 2018, our board of directors approved a change in our annual and quarterly fiscal period ends from the last Friday on or before the calendar year or quarterly month-end to the last day of the calendar year or quarterly month-end. Accordingly, the period end for the first quarters of fiscal 2018 and fiscal 2019 are March 30, 2018 and March 31, 2019, respectively. The number of days in the quarters ended March 30, 2018 and March 31, 2019 were 91 and 90, respectively.Revenue
Revenue
Our revenue consists of both services provided by our employees and pass-through fees from subcontractors and other direct costs. Our Federal Solutions segment derives revenue primarily from the U.S. federal government and our Critical Infrastructure segment derives revenue primarily from government and commercial customers.
We recognize revenue for work performed under cost-plus, time-and-materials and fixed-priceenter into the following types of contracts as follows:with our customers:
Please referRefer to “Management’s Discussion and Analysis of Financial Condition and Results of Operations—Critical Accounting Policies and Estimates” and “Note 2—Summary of Significant Accounting Polices”Policies” in the notes to our consolidated financial statements included in the Company’s Form S-1/A filed on April 29, 201910-K for the year ended December 31, 2023 for a further description of our policies on revenue recognition.
33
The table below presents the percentage of total revenue for each type of contract.
|
| Three Months Ended |
|
| Three Months Ended | |||||
|
| March 30, 2018 |
|
| March 31, 2019 |
|
| March 31, 2024 |
| March 31, 2023 |
Fixed-price |
| 35.2% |
|
| 28.5% |
|
| 41.1% |
| 29.1% |
Time-and-materials |
| 30.2% |
|
| 28.3% |
|
| 22.8% |
| 27.1% |
Cost-plus |
| 34.6% |
|
| 43.2% |
|
| 36.1% |
| 43.8% |
The amount of risk and potential reward varies under each type of contract. Under cost-plus contracts, there is limited financial risk, because we are reimbursed for all allowable costs up to a ceiling. However, profit margins on this type of contract tend to be lower than on time-and-materials and fixed-price contracts. Under time-and-materials contracts, we are reimbursed for the hours worked using the predetermined hourly rates for each labor category. In addition, we are typically reimbursed for other direct contract costs and expenses at cost. We assume financial risk on
time-and-materials contracts because our labor costs may exceed the negotiated billing rates. Profit margins on well-managed time-and-materials contracts tend to be higher than profit margins on cost-plus contracts as long as we are able to staff those contracts with people who have an appropriate skill set. Under fixed-price contracts, we are required to deliver the objectives under the contract for a pre-determined price. Compared to time-and-materials and cost-plus contracts, fixed-price contracts generally offer higher profit margin opportunities because we receive the full benefit of any cost savings, but they also generally involve greater financial risk because we bear the risk of any cost overruns. In the aggregate, the contract type mix in our revenue for any given period will affect that period’s profitability. Over time, we have generally experienced a relatively stable contract mix.
The significant change in the contract mix for the three months ended March 31, 2024 compared to the corresponding period last year relates to increased business volume from a significant fixed price contract in our Federal Solutions segment.
Our recognition of profit on long-term contracts requires the use of assumptions related to transaction price and total cost of completion. Estimates are continually evaluated as work progresses and are revised when necessary. When a change in estimateestimated cost or transaction price is determined to have an impact on contract profit, we record a positive or negative adjustment to revenue and/or direct cost of contracts.revenue.
Joint Ventures
We conduct a portion of our business through joint ventures or similar partnership arrangements. For the joint ventures we control, we consolidate all the revenues and expenses in the Company’sour consolidated statements of income (including revenues and expenses attributable to noncontrolling interests). For the joint ventures we do not control, we recognize equity in (losses) earnings (loss) of unconsolidated joint ventures. Our revenues included $33.7 million and $33.6 million for the three months ended March 30, 2018 and March 31, 2019, respectivelyamounts related to services we provided to our unconsolidated joint ventures.ventures for the three months ended March 31, 2024 and March 31, 2023 of $46.8 million and $50.9 million, respectively.
Operating costs and expenses
Operating costs and expenses primarily include direct costs of contracts and indirect,selling, general and administrative expenses. Costs associated with compensation-related expenses for our people and facilities, which includes ESOP contribution expenses, are the most significant component of our operating expenses. Total ESOP contribution expense was $11.2 million and $12.2 million for the three months ended March 30, 201831, 2024 and March 31, 2019,2023 was $15.0 million and $14.4 million, respectively, and is recorded in “Direct cost of contracts” and “Indirect,“Selling, general and administrative expenses.” We expect operating expenses to increase due to our anticipated growth and the incremental costs associated with being a public company. In particular, under our existing compensation plans, we will adjust our compensation expense on a quarterly basis for any change in our share price from the end of the prior quarter. However, on a forward-looking basis, we generally expect these costs to decline as a percentage of our total revenue as we realize the benefits of scale.
Direct costs of contracts consist of direct labor and associated fringe benefits, indirect overhead, subcontractor costs,and materials (“pass-through costs”), travel expenses and other expenses incurred to perform on contracts.
Indirect,Selling, general and administrative expenses (“SG&A”) include salaries and wages and fringe benefits of our employees not performing work directly for customers, facility costs and other costs related to these indirect functions.
Other income and expenses
Other income and expenses primarily consist of interest income, interest expense and other income, net and interest and other expense associated with claim on long-term contract.net.
Interest income primarily consists of interest earned on U.S. government money market funds.
34
Interest expense consists of interest expense incurred under our Senior Notes, Convertible Senior Notes, and Credit Agreement.
Other income, net primarily consists of gain or loss on sale of assets, sublease income and transaction gain or loss related to movements in foreign currency exchange rates.
The following table sets forth Adjusted EBITDA, Net Income Margin, and Adjusted EBITDA Margin for the three months ended March 30, 201831, 2024 and March 31, 2019.2023.
|
| Three Months Ended |
| |||||
(U.S. dollars in thousands) |
| March 31, 2024 |
|
| March 31, 2023 |
| ||
Adjusted EBITDA (1) |
| $ | 141,093 |
|
| $ | 90,391 |
|
Net Income Margin (2) |
|
| -6.0 | % |
|
| 3.0 | % |
Adjusted EBITDA Margin (3) |
|
| 9.2 | % |
|
| 7.7 | % |
|
| Three Months Ended |
| |||||
(U.S. dollars in thousands) |
| March 30, 2018 |
|
| March 31, 2019 |
| ||
Adjusted EBITDA (1) |
| $ | 47,730 |
|
| $ | 68,174 |
|
Net Income Margin (2) |
|
| 3.9 | % |
|
| 1.5 | % |
Adjusted EBITDA Margin (3) |
|
| 6.3 | % |
|
| 7.5 | % |
|
| Three Months Ended |
| |||||
|
| March 31, 2024 |
|
| March 31, 2023 |
| ||
Net (loss) income attributable to Parsons Corporation |
| $ | (107,355 | ) |
| $ | 25,553 |
|
Interest expense, net |
|
| 11,846 |
|
|
| 5,665 |
|
Income tax benefit (expense) |
|
| (32,234 | ) |
|
| 11,503 |
|
Depreciation and amortization |
|
| 24,531 |
|
|
| 28,359 |
|
Net income attributable to noncontrolling interests |
|
| 15,243 |
|
|
| 9,723 |
|
Equity-based compensation |
|
| 12,656 |
|
|
| 6,703 |
|
Loss on extinguishment of debt |
|
| 211,018 |
|
|
| - |
|
Transaction-related costs (a) |
|
| 2,886 |
|
|
| 1,618 |
|
Restructuring (b) |
|
| - |
|
|
| 546 |
|
Other (c) |
|
| 2,502 |
|
|
| 721 |
|
Adjusted EBITDA |
| $ | 141,093 |
|
| $ | 90,391 |
|
|
|
|
| Three Months Ended |
| |||||
|
| March 30, 2018 |
|
| March 31, 2019 |
| ||
Net income attributable to Parsons Corporation |
| $ | 25,287 |
|
| $ | 9,741 |
|
Interest expense, net |
|
| 3,258 |
|
|
| 7,815 |
|
Income tax expense |
|
| 5,353 |
|
|
| 1,886 |
|
Depreciation and amortization |
|
| 9,009 |
|
|
| 30,591 |
|
Net income attributable to noncontrolling interests |
|
| 3,815 |
|
|
| 3,645 |
|
Litigation-related expenses(a) |
|
| 2,330 |
|
|
| - |
|
Amortization of deferred gain resulting from sale-leaseback transactions(b) |
|
| (1,813 | ) |
|
| - |
|
Transaction-related costs(c) |
|
| 125 |
|
|
| 9,355 |
|
Restructuring(d) |
|
| - |
|
|
| 2,218 |
|
HCM software implementation costs(e) |
|
| - |
|
|
| 2,912 |
|
Other(f) |
|
| 366 |
|
|
| 11 |
|
Adjusted EBITDA |
| $ | 47,730 |
|
| $ | 68,174 |
|
|
|
|
|
|
|
|
|
Adjusted EBITDA is a supplemental measure of our operating performance used by management and our board of directors to assess our financial performance both on a segment and on a consolidated basis. We discuss Adjusted EBITDA because our management uses this measure for business planning purposes, including to manage the business against internal projected results of operations and measure the performance of the business generally. Adjusted EBITDA is frequently used by analysts, investors and other interested parties to evaluate companies in our industry.
Adjusted EBITDA is not a GAAP measure of our financial performance or liquidity and should not be considered as an alternative to net income (loss) as a measure of financial performance or cash flows from operations as measures of liquidity, or any other performance measure derived in accordance with GAAP. We define Adjusted EBITDA as net income (loss) attributable to Parsons Corporation, adjusted to include net income (loss) attributable to noncontrolling interests and to exclude interest expense (net of interest income), provision for income taxes, depreciation and amortization and certain other items that we do not consider in our evaluation of ongoing operating performance. These other items include, among other things, impairment of goodwill, intangible and other assets, interest and other expenses recognized on litigation matters, amortization of deferred gain resulting from sale-leaseback transactions, expenses
incurred in connection with acquisitions and other non-recurring transaction costs and expenses related to our corporate restructuring initiatives. Adjusted EBITDA should not be construed as an inference that
35
our future results will be unaffected by unusual or non-recurring items. Additionally, Adjusted EBITDA is not intended to be a measure of free cash flow for management’s discretionary use, as it does not reflect tax payments, debt service requirements, capital expenditures and certain other cash costs that may recur in the future, including, among other things, cash requirements for working capital needs and cash costs to replace assets being depreciated and amortized. Management compensates for these limitations by relying on our GAAP results in addition to using Adjusted EBITDA supplementally. Our measure of Adjusted EBITDA is not necessarily comparable to similarly titled captions of other companies due to different methods of calculation.
The following table shows Adjusted EBITDA attributable to Parsons Corporation for each of our reportable segments and Adjusted EBITDA attributable to noncontrolling interests (in thousands):
|
| Three Months Ended |
|
| Variance |
|
| Three Months Ended |
|
| Variance |
| ||||||||||||||||||||
|
| March 30, 2018 |
|
| March 31, 2019 |
|
| Dollar |
|
| Percent |
|
| March 31, 2024 |
|
| March 31, 2023 |
|
| Dollar |
|
| Percent |
| ||||||||
Federal Solutions Adjusted EBITDA attributable to Parsons Corporation |
| $ | 20,154 |
|
| $ | 38,866 |
|
| $ | 18,712 |
|
|
| 92.8 | % |
| $ | 92,541 |
|
| $ | 56,148 |
|
| $ | 36,393 |
|
|
| 64.8 | % |
Critical Infrastructure Adjusted EBITDA attributable to Parsons Corporation |
|
| 23,656 |
|
|
| 25,559 |
|
|
| 1,903 |
|
|
| 8.0 | % |
|
| 32,963 |
|
|
| 24,357 |
|
|
| 8,606 |
|
|
| 35.3 | % |
Adjusted EBITDA attributable to noncontrolling interests |
|
| 3,920 |
|
|
| 3,749 |
|
|
| (171 | ) |
|
| -4.4 | % |
|
| 15,589 |
|
|
| 9,886 |
|
|
| 5,703 |
|
|
| 57.7 | % |
Total Adjusted EBITDA |
| $ | 47,730 |
|
| $ | 68,174 |
|
| $ | 20,444 |
|
|
| 42.8 | % |
| $ | 141,093 |
|
| $ | 90,391 |
|
| $ | 50,702 |
|
|
| 56.1 | % |
|
|
|
|
The following table sets forth our results of operations for the three months ended March 30, 201831, 2024 and March 31, 20192023 as a percentage of revenue.
|
| Three Months Ended |
|
| Three Months Ended |
| ||||||||||
|
| March 30, 2018 |
|
| March 31, 2019 |
|
| March 31, 2024 |
|
| March 31, 2023 |
| ||||
Revenues |
|
| 100 | % |
|
| 100 | % |
|
| 100 | % |
|
| 100 | % |
Direct costs of contracts |
|
| 79.9 | % |
|
| 79.0 | % |
|
| 78.8 | % |
|
| 78.2 | % |
Equity in earnings of unconsolidated joint ventures |
|
| 1.5 | % |
|
| 1.1 | % | ||||||||
Indirect, general and administrative expenses |
|
| 16.4 | % |
|
| 19.6 | % | ||||||||
Equity in losses of unconsolidated joint ventures |
|
| -0.1 | % |
|
| -0.5 | % | ||||||||
Selling, general and administrative expenses |
|
| 14.4 | % |
|
| 17.0 | % | ||||||||
Operating income |
|
| 5.2 | % |
|
| 2.5 | % |
|
| 6.6 | % |
|
| 4.4 | % |
Interest income |
|
| 0.1 | % |
|
| 0.1 | % |
|
| 0.1 | % |
|
| 0.1 | % |
Interest expense |
|
| -0.5 | % |
|
| -0.9 | % |
|
| -0.8 | % |
|
| -0.6 | % |
Loss on extinguishment of debt |
|
| -13.7 | % |
|
| 0.0 | % | ||||||||
Other income, net |
|
| 0.2 | % |
|
| 0.0 | % |
|
| -0.2 | % |
|
| 0.1 | % |
(Interest and other expense) gain associated with claim on long-term contract |
|
| -0.3 | % |
|
| 0.0 | % | ||||||||
Total other income (expense) |
|
| -0.6 | % |
|
| -0.9 | % |
|
| -14.7 | % |
|
| -0.4 | % |
Income before income tax provision |
|
| 4.6 | % |
|
| 1.7 | % | ||||||||
Income tax provision |
|
| -0.7 | % |
|
| -0.2 | % | ||||||||
Net income including noncontrolling interests |
|
| 3.9 | % |
|
| 1.5 | % | ||||||||
Income before income tax expense |
|
| -8.1 | % |
|
| 4.0 | % | ||||||||
Income tax benefit (expense) |
|
| 2.1 | % |
|
| -1.0 | % | ||||||||
Net (loss) income including noncontrolling interests |
|
| -6.0 | % |
|
| 3.0 | % | ||||||||
Net income attributable to noncontrolling interests |
|
| -0.5 | % |
|
| -0.4 | % |
|
| -1.0 | % |
|
| -0.8 | % |
Net income attributable to Parsons Corporation |
|
| 3.4 | % |
|
| 1.1 | % | ||||||||
Net (loss) income attributable to Parsons Corporation |
|
| -7.0 | % |
|
| 2.2 | % | ||||||||
Revenue
|
| Three Months Ended |
|
| Variance |
|
| Three Months Ended |
|
| Variance |
| ||||||||||||||||||||
(U.S. dollars in thousands) |
| March 30, 2018 |
|
| March 31, 2019 |
|
| Dollar |
|
| Percent |
|
| March 31, 2024 |
|
| March 31, 2023 |
|
| Dollar |
|
| Percent |
| ||||||||
Revenue |
| $ | 754,679 |
|
| $ | 904,405 |
|
| $ | 149,726 |
|
|
| 19.8 | % |
| $ | 1,535,676 |
|
| $ | 1,173,466 |
|
| $ | 362,210 |
|
|
| 30.9 | % |
Revenue increased $362.2 million for the three months ended March 31, 20192024 when compared to March 30, 2018 primarilythe corresponding period last year, due to an increaseincreases in revenue in both our Federal Solutions segmentand Critical Infrastructure segments of $131.5$275.1 million and from our Critical Infrastructure segment of $18.2 million.$87.1 million, respectively. See “—Segment“Segment Results” below for a further discussion.discussion of the changes in the Company's revenue.
36
Direct costs of contracts
|
| Three Months Ended |
|
| Variance |
|
| Three Months Ended |
|
| Variance |
| ||||||||||||||||||||
(U.S. dollars in thousands) |
| March 30, 2018 |
|
| March 31, 2019 |
|
| Dollar |
|
| Percent |
|
| March 31, 2024 |
|
| March 31, 2023 |
|
| Dollar |
|
| Percent |
| ||||||||
Direct costs of contracts |
| $ | 602,972 |
|
| $ | 714,237 |
|
| $ | 111,265 |
|
|
| 18.5 | % |
| $ | 1,210,827 |
|
| $ | 917,188 |
|
| $ | 293,639 |
|
|
| 32.0 | % |
Direct cost of contracts increased $293.6 million for the three months ended March 31, 20192024 when compared to March 30, 2018the corresponding period last year, primarily due to an increase of $93.2$227.7 million in our Federal Solutions segment and from an increase of $18.1$66.0 million in our Critical Infrastructure segment. The increase in ourdirect costs of contracts is primarily related to increased business volume from a significant contract in the Federal Solutions segment was due primarily from business acquisitions which added $91.3 million. Directsegment. Changes in direct cost of contracts in ourthe Critical Infrastructure segment are primarily related to increased $18.1 million primarily due to an increase in business volume underfrom new and existing contracts.
Equity in (losses) earnings of unconsolidated joint ventures
|
| Three Months Ended |
|
| Variance |
|
| Three Months Ended |
|
| Variance |
| ||||||||||||||||||||
(U.S. dollars in thousands) |
| March 30, 2018 |
|
| March 31, 2019 |
|
| Dollar |
|
| Percent |
|
| March 31, 2024 |
|
| March 31, 2023 |
|
| Dollar |
|
| Percent |
| ||||||||
Equity in earnings of unconsolidated joint ventures |
| $ | 11,031 |
|
| $ | 10,397 |
|
| $ | (634 | ) |
|
| -5.7 | % | ||||||||||||||||
Equity in losses of unconsolidated joint ventures |
| $ | (2,060 | ) |
| $ | (5,840 | ) |
| $ | 3,780 |
|
|
| 64.7 | % | ||||||||||||||||
Equity in (losses) earnings of unconsolidated joint ventures decreasedimproved $3.8 million for the three months ended March 31, 2019 when2024 compared to March 30, 2018 primarily due to timingthe corresponding period last year. Impacting equity in losses of the completion ofunconsolidated joint ventures and the startingwas a write-down of new$8.4 million related to Parsons' participation in a design build joint venture. This write-down was offset by improved results in certain other joint ventures as part of ordinary course timing fluctuations in our business.compared to the corresponding period last year.
Indirect,Selling, general and administrative expenses
|
| Three Months Ended |
|
| Variance |
|
| Three Months Ended |
|
| Variance |
| ||||||||||||||||||||
(U.S. dollars in thousands) |
| March 30, 2018 |
|
| March 31, 2019 |
|
| Dollar |
|
| Percent |
|
| March 31, 2024 |
|
| March 31, 2023 |
|
| Dollar |
|
| Percent |
| ||||||||
Indirect, general and administrative expenses |
| $ | 123,847 |
|
| $ | 177,519 |
|
| $ | 53,672 |
|
|
| 43.3 | % | ||||||||||||||||
Selling, general and administrative expenses |
| $ | 220,945 |
|
| $ | 199,308 |
|
| $ | 21,637 |
|
|
| 10.9 | % | ||||||||||||||||
Indirect, general and administrative expenses (“IG&A”) increasedThe increase in SG&A of $21.6 million for the three months ended March 31, 20192024 when compared to March 30, 2018the corresponding period last year was primarily due to our Federal Solutions segment, most of which is$10.2 million increase related to additional expenses of $18.9employee incentive programs, a $9.0 million increase in other SG&A costs, and $5.2 million from business acquisitions, $20.4acquisitions. These increases were offset in part by a $4.3 million from the amortizationdecrease in intangible asset amortization. As a percentage of intangible assets relatedrevenue, our SG&A decreased by 2.6% to our acquisitions and $9.4 million in acquisition-related expenses. In our Critical Infrastructure segment, expenses increased in-line with the increase in business volume.
Total other expense
|
| Three Months Ended |
|
| Variance |
| ||||||||||
(U.S. dollars in thousands) |
| March 30, 2018 |
|
| March 31, 2019 |
|
| Dollar |
|
| Percent |
| ||||
Interest income |
| $ | 741 |
|
| $ | 477 |
|
| $ | (264 | ) |
|
| -35.6 | % |
Interest expense |
|
| (3,999 | ) |
|
| (8,292 | ) |
|
| (4,293 | ) |
|
| 107.4 | % |
Other income, net |
|
| 1,152 |
|
|
| 41 |
|
|
| (1,111 | ) |
|
| -96.4 | % |
Interest and other expense associated with claim on long-term contract |
|
| (2,330 | ) |
|
| - |
|
|
| 2,330 |
|
|
| -100.0 | % |
Total other expense |
| $ | (4,436 | ) |
| $ | (7,774 | ) |
| $ | (3,338 | ) |
|
| 75.2 | % |
The increase in interest expense14.4% for the three months ended March 31, 2019 when2024 compared to 17.0% for the corresponding period last year.
Total other income (expense)
|
| Three Months Ended |
|
| Variance |
| ||||||||||
(U.S. dollars in thousands) |
| March 31, 2024 |
|
| March 31, 2023 |
|
| Dollar |
|
| Percent |
| ||||
Interest income |
| $ | 1,152 |
|
| $ | 793 |
|
| $ | 359 |
|
|
| 45.3 | % |
Interest expense |
|
| (12,998 | ) |
|
| (6,458 | ) |
|
| (6,540 | ) |
|
| 101.3 | % |
Loss on extinguishment of debt |
|
| (211,018 | ) |
|
| - |
|
|
| (211,018 | ) |
|
| - |
|
Other income (expense), net |
|
| (3,326 | ) |
|
| 1,314 |
|
|
| (4,640 | ) |
|
| -353.1 | % |
Total other income (expense) |
| $ | (226,190 | ) |
| $ | (4,351 | ) |
| $ | (221,839 | ) |
|
| - |
|
During the three months ended March 30, 201831, 2024, we paid $495.6 million in cash to repurchase $284.6 million aggregate principal amount of our Convertible Senior Notes due 2025 (the "Repurchase Transaction") concurrently with the offering of 2.625% Convertible Senior Notes due 2029. As a result of the Repurchase Transaction, we incurred a $211.0 million loss on debt extinguishment. The Repurchase Transaction is a partial repurchase of our Convertible Senior Notes due 2025. See “Note 10 – Debt and Credit Facilities,” for a further discussion of this transaction.
Interest income is related to interest earned on investments in government money funds.
37
Interest expense is primarily due to debt related to our Delayed Draw Term Loan and Convertible Senior Notes. The increase in interest expense during the three months ended March 31, 2024 compared to the corresponding period last year is primarily related to an increase in debt related to our business acquisitions. balances, increase in interest rates, the issuance of Convertible Senior Notes due 2029, and a $3.2 million charge for the acceleration of the amortization of debt issuance costs associated with the partial repurchase of the 0.25% Convertible Senior Notes due 2025 discussed above.
The amounts in other income (expense), net relateare primarily related to transaction gains and losses on foreign currency transactions, sublease income and sublease income.
Interest and other expense associated with claim on long-term contract relates to a lawsuit against a joint venture in which the Company is the managing partner. Please see “Note 15 – Commitments and Contingencies”changes in the Company’s Form S-1/A filed on April 29, 2019, for a descriptionestimated fair value of this matter, which was resolved in favor of the Company on June 13, 2018.contingent consideration.
Income tax (benefit) expense
|
| Three Months Ended |
|
| Variance |
|
| Three Months Ended |
|
| Variance |
| ||||||||||||||||||||
(U.S. dollars in thousands) |
| March 30, 2018 |
|
| March 31, 2019 |
|
| Dollar |
|
| Percent |
|
| March 31, 2024 |
|
| March 31, 2023 |
|
| Dollar |
|
| Percent |
| ||||||||
Income tax expense |
| $ | 5,353 |
|
| $ | 1,886 |
|
| $ | (3,467 | ) |
|
| -64.8 | % | ||||||||||||||||
Income tax (benefit) expense |
| $ | (32,234 | ) |
| $ | 11,503 |
|
| $ | (43,737 | ) |
|
| -380.2 | % | ||||||||||||||||
IncomeThe Company’s effective tax rate was 25.9% and 24.6% and income tax benefit was $32.2 million and income tax expense decreasedwas $11.5 million for the three months ended March 31, 2019 when compared2024 and March 31, 2023, respectively. The most significant items contributing to March 30, 2018 primarily due to a reductionthe increase in pre-tax earnings in the foreign jurisdictions in which we operate.
Historically, the Company recognized income taxes as an “S” Corporation for federal and state income tax purposes and, therefore, with the exception of a limited number of state and local jurisdictions, income has not been subject to income taxes. As a Subchapter “S” corporation the effective tax rates for the three months ended March 30, 2018 and March 31, 2019 were 15.54% and 12.35%, respectively.
In connection with the Company’s initial public offering on May 8, 2019, we convertedrate relates to a “C” Corporation. On a pro forma basis, ifchange in jurisdictional mix of earnings, the Company had been taxed as a “C” Corporation forforeign-derived intangible income (FDII) deduction, and equity-based compensation,partially offset by executive compensation subject to Section 162(m). The difference between the three months ended March 30, 2018 and March 31, 2019 the Company’s assumed combinedstatutory U.S. federal state, local and foreign effective income tax rate would have been 33.02%of 21.0% and 31.29%, respectively and incomethe effective tax expense would have been $11.4 million and $4.8 million, respectively.
The terminationrate for the “S” Corporation status will be treated asquarter ended March 31, 2024 primarily relates to a change in tax status for Accounting Standards Codification 740, “Income Taxes”. These rules require thatjurisdictional mix of earnings partially resulting from a loss in partially unwinding Convertible Senior Notes, the deferred tax effects of a change in tax statusFDII deduction, equity based compensation, and untaxed income attributable to be recordednoncontrolling interests, partially offset by rate impacts related to state income from continuing operations on the date the “S” Corporation status terminates. The Company is estimating that the effects of the change in tax status based upon our forecasted temporary differences for the year to be approximately $55 million to $61 million. This range is subject to revision based upon actual results.taxes and foreign withholding taxes.
Segment Results
We evaluate segment operating performance using segment revenue and segment Adjusted EBITDA attributable to Parsons Corporation. Adjusted EBITDA attributable to Parsons Corporation is Adjusted EBITDA excluding Adjusted EBITDA attributable to noncontrolling interests. Presented above, inthis Management’s Discussion and Analysis of Financial Condition and Results of Operations, is a discussion of our definition of Adjusted EBITDA, how we use this metric, why we present this metric and the material limitations on the usefulness of this metric. See “Note 20—18—Segments Information” in the notes to the consolidated financial statements in this Form 10-Q for further discussion regarding our segment Adjusted EBITDA attributable to Parsons Corporation.
The following table shows Adjusted EBITDA attributable to Parsons Corporation for each of our reportable segments and Adjusted EBITDA attributable to noncontrolling interests:
|
| Three Months Ended |
|
| Three Months Ended |
| ||||||||||
(U.S. dollars in thousands) |
| March 30, 2018 |
|
| March 31, 2019 |
|
| March 31, 2024 |
|
| March 31, 2023 |
| ||||
Federal Solutions Adjusted EBITDA attributable to Parsons Corporation |
| $ | 20,154 |
|
| $ | 38,866 |
|
| $ | 92,541 |
|
| $ | 56,148 |
|
Critical Infrastructure Adjusted EBITDA attributable to Parsons Corporation |
|
| 23,656 |
|
|
| 25,559 |
|
|
| 32,963 |
|
|
| 24,357 |
|
Adjusted EBITDA attributable to noncontrolling interests |
|
| 3,920 |
|
|
| 3,749 |
|
|
| 15,589 |
|
|
| 9,886 |
|
Total Adjusted EBITDA |
| $ | 47,730 |
|
| $ | 68,174 |
|
| $ | 141,093 |
|
| $ | 90,391 |
|
|
| Three Months Ended |
|
| Variance |
| ||||||||||
(U.S. dollars in thousands) |
| March 31, 2024 |
|
| March 31, 2023 |
|
| Dollar |
|
| Percent |
| ||||
Revenue |
| $ | 909,608 |
|
| $ | 634,546 |
|
| $ | 275,062 |
|
|
| 43.3 | % |
Adjusted EBITDA attributable to Parsons Corporation |
| $ | 92,541 |
|
| $ | 56,148 |
|
| $ | 36,393 |
|
|
| 64.8 | % |
|
| Three Months Ended |
|
| Variance |
| ||||||||||
(U.S. dollars in thousands) |
| March 30, 2018 |
|
| March 31, 2019 |
|
| Dollar |
|
| Percent |
| ||||
Revenue |
| $ | 291,335 |
|
| $ | 422,812 |
|
| $ | 131,477 |
|
|
| 45.1 | % |
Adjusted EBITDA attributable to Parsons Corporation |
| $ | 20,154 |
|
| $ | 38,866 |
|
| $ | 18,712 |
|
|
| 92.8 | % |
The increase in Federal Solutions revenue for the three months ended March 31, 2024 compared to the corresponding period last year was primarily related to organic growth of 41% and $16.9 million from business acquisitions. Organic growth was due to business acquisitions which added $122.4 million. Federal Solutions legacy revenue increased $9.1 million.the ramp up of new awards on a significant contract along with the ramp up of
38
other new awards. Partially offsetting these increases is the timing of task order awards for additional follow-on phases of work on certain existing contracts.
The increase in Federal Solutions Adjusted EBITDA attributable to Parsons Corporation for the three months ended March 31, 2024 compared to the corresponding period last year was primarily due to business acquisitions and improved profit margins.organic growth described above.
Critical Infrastructure
|
| Three Months Ended |
|
| Variance |
| ||||||||||
(U.S. dollars in thousands) |
| March 31, 2024 |
|
| March 31, 2023 |
|
| Dollar |
|
| Percent |
| ||||
Revenue |
| $ | 626,068 |
|
| $ | 538,920 |
|
| $ | 87,148 |
|
|
| 16.2 | % |
Adjusted EBITDA attributable to Parsons Corporation |
| $ | 32,963 |
|
| $ | 24,357 |
|
| $ | 8,606 |
|
|
| 35.3 | % |
|
| Three Months Ended |
|
| Variance |
| ||||||||||
(U.S. dollars in thousands) |
| March 30, 2018 |
|
| March 31, 2019 |
|
| Dollar |
|
| Percent |
| ||||
Revenue |
| $ | 463,344 |
|
| $ | 481,593 |
|
| $ | 18,249 |
|
|
| 3.9 | % |
Adjusted EBITDA attributable to Parsons Corporation |
| $ | 23,656 |
|
| $ | 25,559 |
|
| $ | 1,903 |
|
|
| 8.0 | % |
The increase in Critical Infrastructure revenue for the three months ended March 31, 2024 compared to the corresponding periods last year was primarily related to revenueorganic growth onof 15% and $6.2 million from business acquisitions. Organic growth was primarily due to an increase in business volume from existing contracts.contracts and ramping up of recent awards.
The increase in Critical Infrastructure Adjusted EBITDA attributable to Parsons Corporation for the three months ended March 31, 2024 compared to the corresponding period last year was primarily due to a reductionthe revenue impacts discussed above and improvement in IG&A.equity in losses from unconsolidated joint ventures.
Liquidity and Capital Resources
Historically, we have financedWe currently finance our operations and capital expenditures and satisfied redemptions of ESOP interests through a combination of internally generated cash from operations, our Convertible Senior Notes, Delayed Draw Term Loan and fromperiodic borrowings under our Revolving Credit Facility.
Generally, cash provided by operating activities has been adequate to fund our operations. Due to fluctuations in our cash flows and growth in our operations, it may be necessary from time to time in the future to borrow under our Credit Agreement to meet cash demands. Our management regularly monitors certain liquidity measures to monitor performance. We calculate our available liquidity as a sum of cash and cash equivalents from our consolidated balance sheet plus the amount available and unutilized on our Credit Agreement.
WeAs of March 31, 2024, we believe we have adequate liquidity and capital resources to fund our operations, support our debt service and support our ongoing acquisition strategy for at least the next twelve months based on the liquidity from cash provided by our operating activities, cash and cash equivalents on handon-hand and our borrowing capacity under our Revolving Credit Facility. Management continually monitors debt maturities to strategically execute optimal terms and ensure appropriate levels of working capital liquidity are maintained for the company.
Cash Flows
Cash received from customers, either from the payment of invoices for work performed or for advances in excess of revenue recognized, is our primary source of cash. We generally do not begin work on contracts until funding is appropriated by the customers. Billing timetables and payment terms on our contracts vary based on a number of factors, including whether the contract type is cost-plus, time-and-materials, or fixed-price contracts.fixed-price. We generally bill and collect cash more frequently under cost-plus and time-and-materials contracts, as we are authorized to bill as the costs are incurred or work is performed. In contrast, we may be limited to bill certain fixed-price contracts only when specified milestones, including deliveries, are achieved. A number of our contracts may provide for performance-based payments, which allow us to bill and collect cash prior to completing the work.
Billed accounts receivable represents amounts billed to clients that have not been collected. Unbilled accounts receivable represents amounts where the Company has a present contractual right to bill but an invoice has not been issued to the customer at the period-end date.
Accounts receivable is the principal component of our working capital and is generally driven by revenue growth. Accounts receivable reflects amountsincludes billed to our clients as of each balance sheet date and receivable amounts that are currently due but unbilled.unbilled amounts. The total amount of our accounts receivable can vary significantly over time but is generally sensitive to revenue levels. We experience delays in collections from time to time from Middle East customers. Net days sales outstanding, which we refer to as netNet DSO, is calculated by dividing
(i) (accounts receivable plus contract assets) less (contract liabilities plus
39
accounts payable) by (ii) average revenue per day (calculated by dividing trailing twelve months revenue by the number of days in that period). In the last few years we have focusedWe focus on collecting outstanding receivables to reduce Net DSO and working capital. Net DSO was 75 days at March 30, 2018 and 6163 days at March 31, 2019.2024 down from 69 days at March 31, 2023. Our working capital (current assets less current liabilities) was $482.6$1.1 billion at March 31, 2024 and $726.6 million at December 31, 20182023.
Our cash and $242.3cash equivalents increased by $150.2 million to $423.1 million at March 31, 2019.
Our cash, cash equivalents and restricted cash decreased by $150.7 million to $130.52024 from $272.9 million at MarchDecember 31, 2019 from $281.2 million at March 30, 2018.2023.
The following table summarizes our sources and uses of cash over the periods presented (in thousands):
|
| Three Months Ended |
|
| Three Months Ended |
| ||||||||||
|
| March 30, 2018 |
|
| March 31, 2019 |
|
| March 31, 2024 |
|
| March 31, 2023 |
| ||||
Net cash used in operating activities |
| $ | (65,433 | ) |
| $ | (60,108 | ) |
| $ | (63,420 | ) |
| $ | (8,990 | ) |
Net cash used in investing activities |
|
| (8,181 | ) |
|
| (301,059 | ) |
|
| (45,510 | ) |
|
| (20,762 | ) |
Net cash provided by financing activities |
|
| 6,131 |
|
|
| 210,623 |
| ||||||||
Net cash provided by (used in) financing activities |
|
| 259,509 |
|
|
| (12,502 | ) | ||||||||
Effect of exchange rate changes |
|
| (825 | ) |
|
| (182 | ) |
|
| (402 | ) |
|
| 154 |
|
Net decrease in cash and cash equivalents |
| $ | (68,308 | ) |
| $ | (150,726 | ) | ||||||||
Net increase (decrease) in cash and cash equivalents |
| $ | 150,177 |
|
| $ | (42,100 | ) | ||||||||
Operating Activities
Net cash provided by (used in)used in operating activities consistconsists primarily of net income (loss) adjusted for noncash items, such as: equity in earnings (loss)losses (earnings) of unconsolidated joint ventures, contributions of treasury stock, depreciation and amortization of property and equipment and intangible assets, and provisions for doubtful accounts, amortization of deferred gains, and impairment charges.accounts. The timing between the conversion of our billed and unbilled receivables into cash from our customers and disbursements to our employees and vendors is the primary driver of changes in our working capital. Our operating cash flows are primarily affected by our ability to invoice and collect from our clients in a timely manner, our ability to manage our vendor payments and the overall profitability of our contracts.
Net cash used in operating activities decreased $5.3 million to $60.1increased $54.4 million for the three months ended March 31, 20192024 compared to $65.4 million for the three months ended March 30, 2018.31, 2023. The decreaseprimary driver of the increase in net cash flows used in operating activities is primarily due to a $23.6was an $152.6 million improvementincrease in cash flowsoutflows from our working capital accounts (primarily from accounts receivable, accrued expenses and a $4.6other current liabilities, contract liabilities, and income taxes partially offset by contract assets and accounts payable) this increase in cash flows used in operating activities was offset, in part by $102.1 million increase in net income after adjusting for non-cash items. These positive changes in operating cash flows were offset, in part, by a $22.9 million change in the use of cash related to other long-term liabilities, primarily related to our insurance reserves. Net DSOs improved from 75 days to 61 days primarily driven by the increase in the Company’s revenue from business acquisitions.items and debt extinguishment.
Investing Activities
Net cash used in investing activities consists primarily of cash flows associated with capital expenditures, joint ventures and business acquisitions.
Net cash used in investing activities increased $292.9 million to $301.1$24.7 million for the three months ended March 31, 2019,2024, when compared to $8.2 for the three months ended March 30, 2018,31, 2023. This change was primarily due to the use of $287.5driven by a $23.1 million net of cash acquired, for the acquisition of OGSystems. The Company had no business acquisition activity during the quarter ended March 30, 2018.increase in investments in unconsolidated joint ventures.
Financing Activities
Net cash provided by financing activities is primarily associated with proceeds from debt, the repayment thereof, and distributions to noncontrolling interests and payments to the ESOP in connection with the redemption of ESOP participants’ interests. We spent $0.4 million and $0.8 million for the three months ended March 30, 2018 and March 31, 2019 respectively, in connection with the redemption of ESOP participants’ interests. With a public market for the Company’s common stock, cash will no longer be required for ESOP redemptions following the 180-day lock-up period which ends November 4, 2019.
Net cash provided byused in financing activities increased $204.5 million to $210.6$272.0 million for the three months ended March 31, 2019 when2024 compared to $6.1 million for the three months ended March 30, 2018, primarily due to an increase
31, 2023. The change in borrowings under our Credit Agreement of $230.0 million, net of $60.0 million of repayments used primarily to pay for the Company’s business acquisitions. These cash flows provided byfrom financing activities were offset,is primarily driven by net cash inflows from our convertible bond transactions which generated $287.7 million in part, by an increasecash. See “Note 10 – Debt and Credit Facilities,” for a further discussion of $24.8 million of distributions, net to noncontrolling interests.these transactions.
Letters of Credit
We also have in place several secondary bank credit lines for issuing letters of credit, principally for foreign contracts, to support performance and completion guarantees. Letters of credit commitments outstanding under these bank lines aggregated $227.7to $281.1 million as of March 31, 2019, including $48.8 million of letters2024. Letters of credit outstanding under the Credit Agreement.Agreement total $42.1 million as of March 31, 2024.
40
Recent Accounting Pronouncements
See the information set forth in “Note 3—Summary of Significant Accounting Policies—Recently AdoptedNew Accounting Pronouncements” in the notes to our consolidated financial statements.statements included elsewhere in this Quarterly Report on Form 10-Q.
Off-Balance Sheet Arrangements
As of March 31, 2019,2024, we have no off-balance sheet arrangements that have or are reasonably likely to have a material current or future effect on our financial condition, changes in financial condition, revenue or expenses, results of operations, liquidity, capital expenditures or capital resources.
Item 3. Quantitative and QualitativeQualitative Disclosures About Market Risk.
Interest Rate Risk
We are exposed to interest rate risks related to both the Company’s Revolving Credit Facility and our Delayed Draw
Term Loan Agreement. BorrowingsLoan.
As of March 31, 2024, there were no amounts outstanding under the Revolving Credit Facility. Borrowings under the new Credit Facility effective June 2021 bear interest at our option, at either (i) the Base RateTerm SOFR rate plus a margin between 1.0% and 1.625%, or a base rate (as defined in the Revolving Credit Facility)Agreement) plus an applicablea margin or (ii) LIBOR plus an applicable margin. of between 0% and 0.625%, both based on the leverage ratio of the Company at the end of each quarter.The rates on March 31, 2024 and December 31, 2023 were 6.6% and 6.7%, respectively.
As of DecemberMarch 31, 2018, we had outstanding borrowings under the Revolving Credit Facility of $180.0 million. Based on the $180.02024, there was $350.0 million outstanding under the Credit Agreement, an increase or decrease of 100 basis points inDelayed Draw Term Loan.
Borrowings under the Base Rate and/or LIBOR rates would result in an increase or decrease in annual interest expense of approximately $1.8 million. Borrowing under our2022 Delayed Draw Term Loan is comprised of Offshore Rate Loans and Base Rate Loans (each as defined in the Term Loan Agreement), with an initial aggregate principal amount of $150.0 million. The Offshore Rate LoansAgreement will bear interest at either an adjusted Term
SOFR benchmark rate plus a margin between 0.875% and 1.500% or a base rate per annumplus a margin of LIBOR, divided by 1.00 minus the Eurodollar Reserve Percentage, plus 1.25%. The Base Rate Loansbetween 0%
and 0.500% and will initially bear interest at the middle of this range. The Company will pay a ticking fee on
unused term loan commitments at a rate per annum of 0.175% commencing with the sum of (a)date that is ninety (90) days after the highest of (1) the administrative agent’s reference rate; (2) the rate equal to 1.50% per annum above the Offshore Rate; and (3) the rate equal to 0.50% per annum above the latest federal funds rate, plus (b) 0.25%. Based on the $150.0 million outstanding principal balance under the Term Loan, an increase or decrease of 100 basis points in the Term Loan’s applicable
Closing Date. The interest rate would result in an increase or decrease in annual interest expense of approximately $1.5 million. The Term Loan has a maturity date of January 3, 2020at March 31, 2024 and we used the proceeds from the May 8, 2019 initial public offering to pay off the full outstanding balance under the Term Loan.December 31, 2023 were 6.4% and 6.6%, respectively.
Foreign Currency Exchange Risk
We are exposed to foreign currency exchange rate risk resulting from our operations outside of the U.S. We limit exposure to foreign currency fluctuations in most of our contracts through provisions that require client payments in currencies corresponding to the currency in which costs are incurred. As a result of this natural hedge, we generally do not need to hedge foreign currency cash flows for contract work performed.
Item 4. Controls and Procedures.
Evaluation of Disclosure Control and Procedures
Our management carried out, as of March 31, 2019 ,2024, with the participation of our Chief Executive Officer and our Chief Financial Officer, an evaluation of the effectiveness of our disclosure controls and procedures (as defined in Rules 13a-15(e) and 15d-15(e) under the Securities Exchange Act of 1934, as amended (the “Exchange Act”)). Based on that evaluation, our Chief Executive Officer and Chief Financial Officer concluded that, as of March 31, 2019 ,2024, our disclosure controls and procedures were effective to provide reasonable assurance that material information required to be disclosed by us in reports we file under the Exchange Act is recorded, processed, summarized and reported within the time periods specified in the SEC rules and forms and that information required to be disclosed by us in the reports we file or submit
under the Exchange Act is accumulated and communicated to our management, including our Chief Executive Officer and Chief Financial Officer, as appropriate to allow timely decisions regarding required disclosure.
Changes in Internal Control Over Financial Reporting
On January 1, 2019During the Company adopted ASU 2016-02, “Leases”. In connection with the adoption, the Company implemented certain changes to our processes, systems, and controls. Therefirst quarter of 2024, there were no other changes to our internal control over financial reporting that have materially affected, or are reasonably likely to materially affect, our internal control over financial reporting.
41
The information required by this Item 1 is included in “Note 1412 – Commitments and Contingencies” included in the Notes to Consolidated Financial Statements appearing under Part I, Item 1 of this Quarterly Report on Form 10-Q which is incorporated herein by reference.
There have been no material changes fromto our Risk Factors disclosed in the Company’s Form S-1/A filed on April 29, 2019.10-K for the year ended December 31, 2023.
Item 2. Unregistered Sales of Equity Securities and Use of Proceeds.
NoneIssuer Purchases of Equity Securities
On August 9, 2021, the Company’s Board of Directors authorized the Company to acquire a number of shares of Common Stock having an aggregate market value of not greater than $100 million from time to time, commencing on August 12, 2021. The Board further amended this authorization in August 2022 to remove the prior expiration date and grant executive leadership the discretion to determine the price for such share repurchases. The Board further amended this authorization in February 2024 to restore the repurchase capacity to $100 million and removed the $25 million quarterly cap on such repurchases.
At the time of the February 2024 authorization, the Company had repurchased shares with an aggregated market value (including fees) of $54.7 million. As of March 31, 2024, the Company has $100 million remaining under the stock repurchase program. The aggregate market value of shares of Common Stock the Company is authorized to acquire is now not greater than $154.7 million.
Repurchased shares of common stock are retired and included in “Repurchases of common stock” in cash flows from financing activities in the Consolidated Statements of Cash Flows. The primary purpose of the Company’s share repurchase program is to reduce the dilutive effect of shares issued under the Company’s ESOP and other stock benefit plans. The timing, amount and manner of share repurchases may depend upon market conditions and economic circumstances, availability of investment opportunities, the availability and costs of financing, the market price of the Company's common stock, other uses of capital and other factors.
As of March 31, 2024, the Company has spent $54.7 million (which includes commissions paid of $29 thousand)
repurchasing 1,426,476 shares of Common Stock (all of which have been retired) at an average price of $38.35 per share.
There were no share repurchases during the three months ended March 31, 2024.
Item 3. Defaults Upon Senior Securities.
None
Item 4. Mine Safety Disclosures.
Not Applicable
NoneInsider Trading Relationships and Policies
In conformance with updated SEC regulations, the Company has adopted amended insider trading policies and procedures governing the purchase, sale and/or other dispositions of the Company's securities by directors, officers and employees, or the Company itself, that are reasonably designed to promote compliance with insider trading laws, rules and regulations, and New York Stock Exchange standards.
42
Item 6. Exhibits.
Exhibit Number | Description | |
| ||
4.2* | Form of 2.625% Convertible Senior Note due 2029 (included in Exhibit 4.1). | |
10.1* | ||
31.1* | ||
31.2* | ||
32.1* | ||
32.2* | ||
|
| |
| Cover Page Interactive Data File (formatted as inline XBRL | |
|
| |
|
| |
|
| |
|
|
* Filed herewith.
43
|
|
Pursuant to the requirements of the Securities Exchange Act of 1934, the registrant has duly caused this report to be signed on its behalf by the undersigned thereunto duly authorized.
| ||
Date: | By: | /s/ |
| ||
Chief Financial Officer | ||
(Principal Financial Officer) | ||
44
42