

UNITED STATES
SECURITIES AND EXCHANGE COMMISSION
WASHINGTON, D.C. 20549
FORM 10-Q
☒QUARTERLY REPORT PURSUANT TO SECTION 13 OR 15(d) OF THE SECURITIES EXCHANGE ACT OF 1934
For the quarterly period endedMarch 31, 20202021
OR
☐TRANSITION REPORT PURSUANT TO SECTION 13 OR 15(d) OF THE SECURITIES EXCHANGE ACT OF 1934
For the transition period fromto
Commission file number: 1-36313
TIMKENSTEEL CORPORATION
(Exact name of registrant as specified in its charter)
Ohio |
| 46-4024951 |
(State or other jurisdiction of incorporation or organization) |
| (I.R.S. Employer Identification No.) |
|
|
|
1835 Dueber Avenue SW, Canton, OH |
| 44706 |
(Address of principal executive offices) |
| (Zip Code) |
330.471.7000
(Registrant’s telephone number, including area code)
Securities registered pursuant to Section 12(b) of the Securities Exchange Act of 1934:
Title of each class |
| Trading symbol |
| Name of exchange in which registered |
Common shares |
| TMST |
| New York Stock Exchange |
Indicate by check mark whether the registrant (1) has filed all reports required to be filed by Section 13 or 15(d) of the Securities Exchange Act of 1934 during the preceding 12 months (or for such shorter period that the registrant was required to file such reports), and (2) has been subject to such filing requirements for the past 90 days. Yes ☒ No ☐
Indicate by check mark whether the registrant has submitted electronically every Interactive Data File required to be submitted pursuant to Rule 405 of Regulation S-T during the preceding 12 months (or for such shorter period that the registrant was required to submit such files).�� Yes ☒ No ☐
Indicate by check mark whether the registrant is a large accelerated filer, an accelerated filer, a non-accelerated filer, or a smaller reporting company. See the definitions of “large accelerated filer,” “accelerated filer” and “smaller reporting company” in Rule 12b-2 of the Exchange Act
Large accelerated filer |
| ☐ |
|
| Accelerated filer | ☒ |
|
|
|
|
|
|
|
Non-accelerated filer |
| ☐ |
|
| Smaller reporting company | ☐ |
|
|
|
|
|
|
|
|
|
|
|
| Emerging growth company | ☐ |
If an emerging growth company, indicate by check mark if the registrant has elected not to use the extended transition period for complying with any new or revised financial reporting accounting standards provided pursuant to Section 13(a) of the Exchange Act. ☐
Indicate by check mark whether the registrant is a shell company (as defined in Rule 12b-2 of the Exchange Act). Yes ☐ No ☒
Indicate the number of shares outstanding of each of the issuer’s classes of common stock, as of the latest practicable date.
Class |
| Outstanding at April 30, |
Common Shares, without par value |
|
|
TimkenSteel Corporation
|
|
|
| ||
| Consolidated Statements of Comprehensive Income (Loss) (Unaudited) | |
| ||
| ||
| ||
| ||
Management’s Discussion and Analysis of Financial Condition and Results of Operations | ||
| ||
2
Part I. FINANCIAL INFORMATIONFinancial Information
ITEMItem 1. FINANCIAL STATEMENTSFinancial Statements
TimkenSteel Corporation
Consolidated Statements of Operations (Unaudited)
|
|
|
| Three Months Ended March 31, |
|
| Three Months Ended March 31, |
| ||||||||||||
|
|
|
|
|
| 2020 |
|
| 2019 |
|
| 2021 |
|
| 2020 |
| ||||
(Dollars in millions, except per share data) |
|
|
|
|
|
|
|
|
|
|
|
|
|
|
|
|
|
|
|
|
Net sales |
|
|
|
|
| $ | 259.7 |
|
| $ | 371.0 |
|
| $ | 273.6 |
|
| $ | 259.7 |
|
Cost of products sold |
|
|
|
|
|
| 251.9 |
|
|
| 342.6 |
|
|
| 242.9 |
|
|
| 251.9 |
|
Gross Profit |
|
|
|
|
|
| 7.8 |
|
|
| 28.4 |
|
|
| 30.7 |
|
|
| 7.8 |
|
|
|
|
|
|
|
|
|
|
|
|
|
|
|
|
|
|
|
|
|
|
Selling, general and administrative expenses |
|
|
|
|
|
| 23.4 |
|
|
| 23.3 |
|
|
| 19.5 |
|
|
| 23.4 |
|
Restructuring charges |
|
|
|
|
|
| 0.6 |
|
|
| — |
|
|
| 0.5 |
|
|
| 0.6 |
|
Loss (gain) on sale or asset disposals |
|
|
|
|
|
| (2.3 | ) |
|
| — |
| ||||||||
Loss (gain) on sale or disposal of assets, net |
|
| — |
|
|
| (2.3 | ) | ||||||||||||
Impairment charges |
|
| 8.2 |
|
|
| — |
| ||||||||||||
Interest expense |
|
|
|
|
|
| 3.2 |
|
|
| 4.2 |
|
|
| 1.9 |
|
|
| 3.2 |
|
Other expense (income), net |
|
|
|
|
|
| 2.7 |
|
|
| (2.7 | ) | ||||||||
Other (income) expense, net |
|
| (9.4 | ) |
|
| 2.7 |
| ||||||||||||
Income (Loss) Before Income Taxes |
|
|
|
|
|
| (19.8 | ) |
|
| 3.6 |
|
|
| 10.0 |
|
|
| (19.8 | ) |
Provision (benefit) for income taxes |
|
|
|
|
|
| 0.1 |
|
|
| 0.1 |
|
|
| 0.2 |
|
|
| 0.1 |
|
Net Income (Loss) |
|
|
|
|
| $ | (19.9 | ) |
| $ | 3.5 |
|
| $ | 9.8 |
|
| $ | (19.9 | ) |
|
|
|
|
|
|
|
|
|
|
|
|
|
|
|
|
|
|
|
|
|
Per Share Data: |
|
|
|
|
|
|
|
|
|
|
|
|
|
|
|
|
|
|
|
|
Basic earnings (loss) per share |
|
|
|
|
| $ | (0.44 | ) |
| $ | 0.08 |
|
| $ | 0.22 |
|
| $ | (0.44 | ) |
Diluted earnings (loss) per share |
|
|
|
|
| $ | (0.44 | ) |
| $ | 0.08 |
|
| $ | 0.20 |
|
| $ | (0.44 | ) |
See accompanying Notes to the unaudited Consolidated Financial Statements.
3
TimkenSteel Corporation
Consolidated Statement of Comprehensive Income (Loss) (Unaudited)
|
| Three Months Ended March 31, |
|
| Three Months Ended March 31, |
| ||||||||||
|
| 2020 |
|
| 2019 |
|
| 2021 |
|
| 2020 |
| ||||
(Dollars in millions) |
|
|
|
|
|
|
|
|
|
|
|
|
|
|
|
|
Net income (loss) |
| $ | (19.9 | ) |
| $ | 3.5 |
|
| $ | 9.8 |
|
| $ | (19.9 | ) |
Other comprehensive income (loss), net of tax: |
|
|
|
|
|
|
|
| ||||||||
Other comprehensive income (loss) |
|
|
|
|
|
|
|
| ||||||||
Foreign currency translation adjustments |
|
| (1.8 | ) |
|
| 0.4 |
|
|
| 0.1 |
|
|
| (1.8 | ) |
Pension and postretirement liability adjustments |
|
| (1.1 | ) |
|
| 0.1 |
|
|
| (1.5 | ) |
|
| (1.1 | ) |
Other comprehensive income (loss), net of tax |
|
| (2.9 | ) |
|
| 0.5 |
|
|
| (1.4 | ) |
|
| (2.9 | ) |
Comprehensive Income (Loss), net of tax |
| $ | (22.8 | ) |
| $ | 4.0 |
|
| $ | 8.4 |
|
| $ | (22.8 | ) |
See accompanying Notes to the unaudited Consolidated Financial Statements.
4
TimkenSteel Corporation
Consolidated Balance Sheets (Unaudited)
|
| March 31, 2020 |
|
| December 31, 2019 |
|
| March 31, 2021 |
|
| December 31, 2020 |
| ||||
(Dollars in millions) |
|
|
|
|
|
|
|
|
|
|
|
|
|
|
|
|
ASSETS |
|
|
|
|
|
|
|
|
|
|
|
|
|
|
|
|
Current Assets |
|
|
|
|
|
|
|
|
|
|
|
|
|
|
|
|
Cash and cash equivalents |
| $ | 65.6 |
|
| $ | 27.1 |
|
| $ | 115.7 |
|
| $ | 102.8 |
|
Accounts receivable, net of allowances (2020 - $2.8 million; 2019 - $1.5 million) |
|
| 94.9 |
|
|
| 77.5 |
| ||||||||
Accounts receivable, net of allowances (2021 - $1.6 million; 2020 - $1.3 million) |
|
| 96.3 |
|
|
| 63.3 |
| ||||||||
Inventories, net |
|
| 240.5 |
|
|
| 281.9 |
|
|
| 202.7 |
|
|
| 178.4 |
|
Deferred charges and prepaid expenses |
|
| 3.6 |
|
|
| 3.3 |
|
|
| 3.7 |
|
|
| 4.0 |
|
Assets held for sale |
|
| 2.2 |
|
|
| 4.1 |
|
|
| — |
|
|
| 0.3 |
|
Other current assets |
|
| 5.3 |
|
|
| 7.8 |
|
|
| 12.0 |
|
|
| 8.8 |
|
Total Current Assets |
|
| 412.1 |
|
|
| 401.7 |
|
|
| 430.4 |
|
|
| 357.6 |
|
|
|
|
|
|
|
|
|
|
|
|
|
|
|
|
|
|
Property, plant and equipment, net |
|
| 608.7 |
|
|
| 626.4 |
|
|
| 550.0 |
|
|
| 569.8 |
|
Operating lease right-of-use assets |
|
| 16.3 |
|
|
| 14.3 |
|
|
| 19.3 |
|
|
| 21.0 |
|
Pension assets |
|
| 17.2 |
|
|
| 25.2 |
|
|
| 37.3 |
|
|
| 33.5 |
|
Intangible assets, net |
|
| 12.4 |
|
|
| 14.3 |
|
|
| 8.5 |
|
|
| 9.3 |
|
Other non-current assets |
|
| 3.3 |
|
|
| 3.3 |
|
|
| 2.6 |
|
|
| 2.8 |
|
Total Assets |
| $ | 1,070.0 |
|
| $ | 1,085.2 |
|
| $ | 1,048.1 |
|
| $ | 994.0 |
|
|
|
|
|
|
|
|
|
|
|
|
|
|
|
|
|
|
LIABILITIES AND SHAREHOLDERS’ EQUITY |
|
|
|
|
|
|
|
|
|
|
|
|
|
|
|
|
Current Liabilities |
|
|
|
|
|
|
|
|
|
|
|
|
|
|
|
|
Accounts payable |
| $ | 96.0 |
|
| $ | 69.3 |
|
| $ | 136.4 |
|
| $ | 89.5 |
|
Salaries, wages and benefits |
|
| 21.3 |
|
|
| 13.9 |
|
|
| 28.7 |
|
|
| 29.4 |
|
Accrued pension and postretirement costs |
|
| 3.0 |
|
|
| 3.0 |
|
|
| 2.3 |
|
|
| 2.3 |
|
Current operating lease liabilities |
|
| 6.6 |
|
|
| 6.2 |
|
|
| 7.0 |
|
|
| 7.5 |
|
Current convertible notes, net |
|
| 40.2 |
|
|
| 38.9 |
| ||||||||
Other current liabilities |
|
| 16.5 |
|
|
| 19.9 |
|
|
| 12.5 |
|
|
| 13.4 |
|
Total Current Liabilities |
|
| 143.4 |
|
|
| 112.3 |
|
|
| 227.1 |
|
|
| 181.0 |
|
|
|
|
|
|
|
|
|
|
|
|
|
|
|
|
|
|
Convertible notes, net |
|
| 79.8 |
|
|
| 78.6 |
| ||||||||
Non-current convertible notes, net |
|
| 44.7 |
|
|
| 39.3 |
| ||||||||
Credit Agreement |
|
| 60.0 |
|
|
| 90.0 |
|
|
| — |
|
|
| — |
|
Non-current operating lease liabilities |
|
| 9.7 |
|
|
| 8.2 |
|
|
| 12.3 |
|
|
| 13.5 |
|
Accrued pension and postretirement costs |
|
| 222.3 |
|
|
| 222.1 |
|
|
| 239.4 |
|
|
| 240.7 |
|
Deferred income taxes |
|
| 0.9 |
|
|
| 0.9 |
|
|
| 1.0 |
|
|
| 1.0 |
|
Other non-current liabilities |
|
| 11.8 |
|
|
| 10.0 |
|
|
| 10.3 |
|
|
| 11.0 |
|
Total Liabilities |
|
| 527.9 |
|
|
| 522.1 |
|
|
| 534.8 |
|
|
| 486.5 |
|
|
|
|
|
|
|
|
|
|
|
|
|
|
|
|
|
|
Shareholders’ Equity |
|
|
|
|
|
|
|
|
|
|
|
|
|
|
|
|
Preferred shares, without par value; authorized 10.0 million shares, none issued |
|
| — |
|
|
| — |
| ||||||||
Common shares, without par value; authorized 200.0 million shares; issued 2020 and 2019 - 45.7 million shares |
|
| — |
|
|
| — |
| ||||||||
Preferred shares, without par value; authorized 10.0 million shares, NaN issued |
|
| 0 |
|
|
| 0 |
| ||||||||
Common shares, without par value; authorized 200.0 million shares; issued 2021 and 2020 - 45.7 million shares |
|
| 0 |
|
|
| 0 |
| ||||||||
Additional paid-in capital |
|
| 841.1 |
|
|
| 844.8 |
|
|
| 824.7 |
|
|
| 843.4 |
|
Retained deficit |
|
| (321.4 | ) |
|
| (301.5 | ) |
|
| (349.4 | ) |
|
| (363.4 | ) |
Treasury shares - 2020 - 0.8 million; 2019 - 0.9 million |
|
| (19.4 | ) |
|
| (24.9 | ) | ||||||||
Treasury shares - 2021 - 0.1 million; 2020 - 0.6 million |
|
| (1.0 | ) |
|
| (12.9 | ) | ||||||||
Accumulated other comprehensive income (loss) |
|
| 41.8 |
|
|
| 44.7 |
|
|
| 39.0 |
|
|
| 40.4 |
|
Total Shareholders’ Equity |
|
| 542.1 |
|
|
| 563.1 |
|
|
| 513.3 |
|
|
| 507.5 |
|
Total Liabilities and Shareholders’ Equity |
| $ | 1,070.0 |
|
| $ | 1,085.2 |
|
| $ | 1,048.1 |
|
| $ | 994.0 |
|
See accompanying Notes to the unaudited Consolidated Financial Statements.
5
TimkenSteel Corporation
Consolidated Statements of Shareholders’ Equity (Unaudited)
(Dollars in millions) |
| Common Shares Outstanding |
|
| Additional Paid-in Capital |
|
| Retained Deficit |
|
| Treasury Shares |
|
| Accumulated Other Comprehensive Income (Loss) |
|
| Total |
|
| Common Shares Outstanding |
|
| Additional Paid-in Capital |
|
| Retained Deficit |
|
| Treasury Shares |
|
| Accumulated Other Comprehensive Income (Loss) |
|
| Total |
| ||||||||||||
Balance at December 31, 2019 |
|
| 44,820,153 |
|
| $ | 844.8 |
|
| $ | (301.5 | ) |
| $ | (24.9 | ) |
| $ | 44.7 |
|
| $ | 563.1 |
| ||||||||||||||||||||||||
Balance at December 31, 2020 |
|
| 45,164,308 |
|
| $ | 843.4 |
|
| $ | (363.4 | ) |
| $ | (12.9 | ) |
| $ | 40.4 |
|
| $ | 507.5 |
| ||||||||||||||||||||||||
Net income (loss) |
|
| — |
|
|
| — |
|
|
| (19.9 | ) |
|
| — |
|
|
| — |
|
|
| (19.9 | ) |
|
| — |
|
|
| — |
|
|
| 9.8 |
|
|
| — |
|
|
| — |
|
|
| 9.8 |
|
Other comprehensive income (loss) |
|
| — |
|
|
| — |
|
|
| — |
|
|
| — |
|
|
| (2.9 | ) |
|
| (2.9 | ) |
|
| — |
|
|
| — |
|
|
| — |
|
|
| — |
|
|
| (1.4 | ) |
|
| (1.4 | ) |
Adoption of new accounting standard |
|
| — |
|
|
| (10.6 | ) |
|
| 4.2 |
|
|
| — |
|
|
| — |
|
|
| (6.4 | ) | ||||||||||||||||||||||||
Stock-based compensation expense |
|
| — |
|
|
| 2.0 |
|
|
| — |
|
|
| — |
|
|
| — |
|
|
| 2.0 |
|
|
| — |
|
|
| 1.8 |
|
|
| — |
|
|
| — |
|
|
| — |
|
|
| 1.8 |
|
Stock option activity |
|
| — |
|
|
| 2.5 |
|
|
| — |
|
|
| — |
|
|
| — |
|
|
| 2.5 |
| ||||||||||||||||||||||||
Issuance of treasury shares |
|
| 215,708 |
|
|
| (5.7 | ) |
|
| — |
|
|
| 5.7 |
|
|
| — |
|
|
| — |
|
|
| 580,248 |
|
|
| (12.4 | ) |
|
| — |
|
|
| 12.4 |
|
|
| — |
|
|
| — |
|
Shares surrendered for taxes |
|
| (70,033 | ) |
|
| — |
|
|
| — |
|
|
| (0.2 | ) |
|
| — |
|
|
| (0.2 | ) |
|
| (72,174 | ) |
|
| — |
|
|
| — |
|
|
| (0.5 | ) |
|
| — |
|
|
| (0.5 | ) |
Balance at March 31, 2020 |
|
| 44,965,828 |
|
| $ | 841.1 |
|
| $ | (321.4 | ) |
| $ | (19.4 | ) |
| $ | 41.8 |
|
| $ | 542.1 |
| ||||||||||||||||||||||||
Balance at March 31, 2021 |
|
| 45,672,382 |
|
| $ | 824.7 |
|
| $ | (349.4 | ) |
| $ | (1.0 | ) |
| $ | 39.0 |
|
| $ | 513.3 |
| ||||||||||||||||||||||||
|
| Common Shares Outstanding |
|
| Additional Paid-in Capital |
|
| Retained Deficit |
|
| Treasury Shares |
|
| Accumulated Other Comprehensive Income (Loss) |
|
| Total |
|
| Common Shares Outstanding |
|
| Additional Paid-in Capital |
|
| Retained Deficit |
|
| Treasury Shares |
|
| Accumulated Other Comprehensive Income (Loss) |
|
| Total |
| ||||||||||||
Balance at December 31, 2018 |
|
| 44,584,668 |
|
| $ | 846.3 |
|
| $ | (191.5 | ) |
| $ | (33.0 | ) |
| $ | (8.9 | ) |
| $ | 612.9 |
| ||||||||||||||||||||||||
Balance at December 31, 2019 |
|
| 44,820,153 |
|
| $ | 844.8 |
|
| $ | (301.5 | ) |
| $ | (24.9 | ) |
| $ | 44.7 |
|
| $ | 563.1 |
| ||||||||||||||||||||||||
Net income (loss) |
|
| — |
|
|
| — |
|
|
| 3.5 |
|
|
| — |
|
|
| — |
|
|
| 3.5 |
|
|
| — |
|
|
| — |
|
|
| (19.9 | ) |
|
| — |
|
|
| — |
|
|
| (19.9 | ) |
Other comprehensive income (loss) |
|
| — |
|
|
| — |
|
|
| — |
|
|
| — |
|
|
| 0.5 |
|
|
| 0.5 |
|
|
| — |
|
|
| — |
|
|
| — |
|
|
| — |
|
|
| (2.9 | ) |
|
| (2.9 | ) |
Stock-based compensation expense |
|
| — |
|
|
| 2.2 |
|
|
| — |
|
|
| — |
|
|
| — |
|
|
| 2.2 |
|
|
| — |
|
|
| 2.0 |
|
|
| — |
|
|
| — |
|
|
| — |
|
|
| 2.0 |
|
Stock option activity |
|
| — |
|
|
| 0.2 |
|
|
| — |
|
|
| — |
|
|
| — |
|
|
| 0.2 |
| ||||||||||||||||||||||||
Issuance of treasury shares |
|
| 261,130 |
|
|
| (7.5 | ) |
|
| — |
|
|
| 7.5 |
|
|
| — |
|
|
| — |
|
|
| 215,708 |
|
|
| (5.7 | ) |
|
| — |
|
|
| 5.7 |
|
|
| — |
|
|
| — |
|
Shares surrendered for taxes |
|
| (79,889 | ) |
|
| — |
|
|
| — |
|
|
| (1.0 | ) |
|
| — |
|
|
| (1.0 | ) |
|
| (70,033 | ) |
|
| — |
|
|
| — |
|
|
| (0.2 | ) |
|
| — |
|
|
| (0.2 | ) |
Balance at March 31, 2019 |
|
| 44,765,909 |
|
| $ | 841.2 |
|
| $ | (188.0 | ) |
| $ | (26.5 | ) |
| $ | (8.4 | ) |
| $ | 618.3 |
| ||||||||||||||||||||||||
Balance at March 31, 2020 |
|
| 44,965,828 |
|
| $ | 841.1 |
|
| $ | (321.4 | ) |
| $ | (19.4 | ) |
| $ | 41.8 |
|
| $ | 542.1 |
| ||||||||||||||||||||||||
See accompanying Notes to the unaudited Consolidated Financial Statements.
6
TimkenSteel Corporation
Consolidated Statements of Cash Flows (Unaudited)
|
| Three Months Ended March 31, |
|
| Three Months Ended March 31, |
| ||||||||||
|
| 2020 |
|
| 2019 |
|
| 2021 |
|
| 2020 |
| ||||
(Dollars in millions) |
|
|
|
|
|
|
|
|
|
|
|
|
|
|
|
|
CASH PROVIDED (USED) |
|
|
|
|
|
|
|
|
|
|
|
|
|
|
|
|
Operating Activities |
|
|
|
|
|
|
|
|
|
|
|
|
|
|
|
|
Net income (loss) |
| $ | (19.9 | ) |
| $ | 3.5 |
|
| $ | 9.8 |
|
| $ | (19.9 | ) |
Adjustments to reconcile net income (loss) to net cash provided (used) by operating activities: |
|
|
|
|
|
|
|
|
|
|
|
|
|
|
|
|
Depreciation and amortization |
|
| 18.6 |
|
|
| 17.8 |
|
|
| 17.6 |
|
|
| 18.6 |
|
Amortization of deferred financing fees and debt discount |
|
| 1.3 |
|
|
| 1.3 |
|
|
| 0.3 |
|
|
| 1.3 |
|
Loss (gain) on sale or disposal of assets |
|
| (2.3 | ) |
|
| — |
|
|
| — |
|
|
| (2.3 | ) |
Impairment charges |
|
| 8.2 |
|
|
| — |
| ||||||||
Deferred income taxes |
|
| 0.2 |
|
|
| (0.2 | ) |
|
| — |
|
|
| 0.2 |
|
Stock-based compensation expense |
|
| 2.0 |
|
|
| 2.2 |
|
|
| 1.8 |
|
|
| 2.0 |
|
Pension and postretirement expense (benefit), net |
|
| 8.1 |
|
|
| 1.8 |
| ||||||||
Pension and postretirement contributions and payments |
|
| (2.5 | ) |
|
| (2.4 | ) | ||||||||
Pension and postretirement (benefit) expense, net |
|
| (4.7 | ) |
|
| 8.1 |
| ||||||||
Changes in operating assets and liabilities: |
|
|
|
|
|
|
|
|
|
|
|
|
|
|
|
|
Accounts receivable, net |
|
| (16.3 | ) |
|
| 12.1 |
|
|
| (33.0 | ) |
|
| (16.3 | ) |
Inventories, net |
|
| 41.2 |
|
|
| (26.8 | ) |
|
| (28.2 | ) |
|
| 41.2 |
|
Accounts payable |
|
| 26.7 |
|
|
| (30.7 | ) |
|
| 48.1 |
|
|
| 26.7 |
|
Other accrued expenses |
|
| 5.7 |
|
|
| (11.4 | ) |
|
| (2.4 | ) |
|
| 5.7 |
|
Pension and postretirement contributions and payments |
|
| (1.6 | ) |
|
| (2.5 | ) | ||||||||
Deferred charges and prepaid expenses |
|
| (0.3 | ) |
|
| 0.1 |
|
|
| 0.3 |
|
|
| (0.3 | ) |
Other, net |
|
| 1.3 |
|
|
| (0.9 | ) |
|
| (3.0 | ) |
|
| 1.3 |
|
Net Cash Provided (Used) by Operating Activities |
|
| 63.8 |
|
|
| (33.6 | ) |
|
| 13.2 |
|
|
| 63.8 |
|
|
|
|
|
|
|
|
|
|
|
|
|
|
|
|
|
|
Investing Activities |
|
|
|
|
|
|
|
|
|
|
|
|
|
|
|
|
Capital expenditures |
|
| (2.9 | ) |
|
| (4.4 | ) |
|
| (2.3 | ) |
|
| (2.9 | ) |
Proceeds from disposals of property, plant and equipment |
|
| 7.8 |
|
|
| — |
|
|
| — |
|
|
| 7.8 |
|
Net Cash Provided (Used) by Investing Activities |
|
| 4.9 |
|
|
| (4.4 | ) |
|
| (2.3 | ) |
|
| 4.9 |
|
|
|
|
|
|
|
|
|
|
|
|
|
|
|
|
|
|
Financing Activities |
|
|
|
|
|
|
|
|
|
|
|
|
|
|
|
|
Proceeds from exercise of stock options |
|
| — |
|
|
| 0.2 |
|
|
| 2.5 |
|
|
| — |
|
Shares surrendered for employee taxes on stock compensation |
|
| (0.2 | ) |
|
| (1.0 | ) |
|
| (0.5 | ) |
|
| (0.2 | ) |
Repayments on credit agreements |
|
| (30.0 | ) |
|
| (5.0 | ) |
|
| — |
|
|
| (30.0 | ) |
Borrowings on credit agreements |
|
| — |
|
|
| 30.0 |
| ||||||||
Net Cash Provided (Used) by Financing Activities |
|
| (30.2 | ) |
|
| 24.2 |
|
|
| 2.0 |
|
|
| (30.2 | ) |
Increase (Decrease) in Cash and Cash Equivalents |
|
| 38.5 |
|
|
| (13.8 | ) |
|
| 12.9 |
|
|
| 38.5 |
|
Cash and cash equivalents at beginning of period |
|
| 27.1 |
|
|
| 21.6 |
|
|
| 102.8 |
|
|
| 27.1 |
|
Cash and Cash Equivalents at End of Period |
| $ | 65.6 |
|
| $ | 7.8 |
|
| $ | 115.7 |
|
| $ | 65.6 |
|
See accompanying Notes to the unaudited Consolidated Financial Statements.
7
TimkenSteel Corporation
Notes to Unaudited Consolidated Financial Statements
(dollars in millions, except per share data)
Note1-Basis of Presentation
The accompanying unaudited Consolidated Financial Statements have been prepared by TimkenSteel Corporation (the Company“Company” or TimkenSteel)“TimkenSteel”) in accordance with generally accepted accounting principles in the United States (U.S. GAAP)(“U.S. GAAP”) for interim financial information. Accordingly, they do not include all of the information and footnotes required by U.S. GAAP for complete financial statements. In the opinion of management, all adjustments (consisting of normal recurring accruals) and disclosures considered necessary for a fair presentation have been included. For further information, refer to TimkenSteel’s audited Consolidated Financial Statements and Notes included in its Annual Report on Form 10-K for the year ended December 31, 2019.2020.
Certain items previously reported in specific financial statement captions have been reclassified to conform with the current year presentation.
Customer Receivables
The Company’s accounts receivables arise from sales to customers across all end markets. Historically, TimkenSteel’s allowance for doubtful accounts write-offs have been immaterial. The allowance for doubtful account reserve has been established using qualitative and quantitative methods. In general, account balances greater than one year of age or sent to third party collection are fully reserved. Account balances for customers that are viewed as higher risk are also analyzed for a reserve. In addition to these methods, for the first quarter of 2020 the allowance for doubtful accounts was adjusted for forward looking uncollectible balances, primarily in the energy and automotive end markets. The amount recorded was based on the Company’s assessment of the risk presented to customers in these end markets as a result of the COVID-19 pandemic as well as geo-political factors facing the energy end market. At this time, the full impact of COVID-19 is difficult to predict with the current uncertainty surrounding the pandemic and the timeline for economic activities to recover.
Change in Accounting Principle
During the fourth quarter of 2019, TimkenSteel elected to change its method for valuing its inventories that previously used the last-in, first-out (LIFO) method to the first-in, first-out (FIFO) method. The Company believes that the FIFO method is preferable as it improves comparability with our peers, more closely resembles the physical flow of our inventory and aligns with how the Company internally manages the business. The effects of the change in accounting principle from LIFO to FIFO were retrospectively applied. As a result of the retrospective application of the change in accounting principle, certain financial statement line items in the Company’s consolidated balance sheets as of March 31, 2019 and the consolidated statements of operations, comprehensive income (loss), shareholders’ equity and cash flows for the three months ended March 31, 2019 were adjusted as necessary. For further information, refer to TimkenSteel’s audited Consolidated Financial Statements and Notes included in its Annual Report on Form 10-K for the year ended December 31, 2019.
The following tables reflect the impact to the financial statement line items as a result of the change in accounting principle for the prior periods presented in the accompanying financial statements (dollars in millions, except per share data):
Consolidated Statement of Operations |
| Three Months Ended March 31, 2019 |
| |||||||||
|
| As Reported |
|
| Adjustments |
|
| As Adjusted |
| |||
Cost of products sold |
| $ | 341.9 |
|
| $ | 0.7 |
|
| $ | 342.6 |
|
Gross profit |
|
| 29.1 |
|
|
| (0.7 | ) |
|
| 28.4 |
|
Income (loss) before income taxes |
|
| 4.3 |
|
|
| (0.7 | ) |
|
| 3.6 |
|
Net income (loss) |
|
| 4.2 |
|
|
| (0.7 | ) |
|
| 3.5 |
|
|
|
|
|
|
|
|
|
|
|
|
|
|
Per Share Data: |
|
|
|
|
|
|
|
|
|
|
|
|
Basic earnings (loss) per share |
|
| 0.09 |
|
|
| (0.01 | ) |
|
| 0.08 |
|
Diluted earnings (loss) per share |
|
| 0.09 |
|
|
| (0.01 | ) |
|
| 0.08 |
|
Consolidated Statement of Comprehensive Income (Loss) |
| Three Months Ended March 31, 2019 |
| |||||||||
|
| As Reported |
|
| Adjustments |
|
| As Adjusted |
| |||
Net income (loss) |
| $ | 4.2 |
|
| $ | (0.7 | ) |
| $ | 3.5 |
|
Comprehensive income (loss), net of tax |
|
| 4.7 |
|
|
| (0.7 | ) |
|
| 4.0 |
|
8
Consolidated Statement of Cash Flows |
| Three Months Ended March 31, 2019 |
| |||||||||
|
| As Reported |
|
| Adjustments |
|
| As Adjusted |
| |||
Net income (loss) |
| $ | 4.2 |
|
| $ | (0.7 | ) |
| $ | 3.5 |
|
Changes in operating assets and liabilities: |
|
|
|
|
|
|
|
|
|
|
|
|
Inventories, net |
|
| (27.5 | ) |
|
| 0.7 |
|
|
| (26.8 | ) |
Note2-Recent Accounting Pronouncements
Adoption of New Accounting Standards
The Company adopted the following Accounting Standard Updates (ASU)(“ASU”) in the first quarter of 2020, all of which were effective as of January 1, 2020, except ASU 2020-04, which became effective upon issuance on March 12, 2020. The adoption of these standards did not have a material impact on the unaudited Consolidated Financial Statements or the related Notes to the unaudited Consolidated Financial Statements.
|
|
|
|
|
|
|
|
|
|
Accounting Standards Issued But Not Yet Adopted
The Company has considered the recent ASUs issued by the Financial Accounting Standards Board summarized below:2021.
Standard | Description |
Date of Adoption |
|
ASU 2019-12, Income Taxes (Topic 740) | The standard simplifies the accounting for income taxes by removing various exceptions. | January 1, 2021 | The |
ASU | The standard | January 1, 2021 | The Company |
|
| January 1, 2021 | using the modified retrospective method of transition. The |
Upon adoption of ASU 2020-06 prospectively as of January 1, 2021, all outstanding Convertible Notes are now fully classified as a liability, there is no longer a separate equity component and the Convertible Notes will no longer have a debt discount that is amortized. This resulted in a decrease of $10.6 million to additional paid-in capital and an increase of $1.1 million and $5.3 million to current convertible notes, net and non-current convertible notes, net, respectively, on the Consolidated Balance Sheets as of January 1, 2021. Additionally, retained deficit was reduced by $4.2 million in the Consolidated Balance Sheets as of January 1, 2021 to remove amortization expense recognized in prior periods. The adoption of this standard did not have an effect on the Company’s cash flows, liquidity, and the methodology used for the earnings per share calculation. Refer to “Note 10 – Financing Arrangements” for additional information on the Company’s Convertible Notes.
9There are no current ASUs issued, but not adopted, that will have an impact on the Company.
Legislation related to the COVID-19 Pandemic
Coronavirus Aid, Relief, and Economic Security ("CARES") Act
On March 27, 2020, the President of the United States signed the Coronavirus Aid, Relief, and Economic Security ("CARES") Act, an economic stimulus package intended to provide support, principally in the form of tax benefits, to companies and individuals negatively impacted by the COVID-19 pandemic. Although the majority of the provisions included in the CARES Act did not immediately benefit the Company from a cash tax perspective due to its significant net operating losses, the Company took advantage of the deferral of the employer share (6.2% of employee wages) of Social Security payroll taxes that would otherwise have been owed from the date of enactment of the legislation through December 31, 2020, as afforded by the CARES Act. At December 31, 2020, the Company had deferred $6.4 million in cash payments and recorded reserves for such deferred payroll taxes in salaries, wages and benefits on the Consolidated Balance Sheets. The deferred amount of payments is to be paid in 2 equal installments at December 31, 2021 and December 31, 2022.
The CARES Act also provided for an employee retention credit (“Employee Retention Credit”), which is a refundable tax credit against certain employment taxes of up to $5,000 per employee for eligible employers. The tax credit is equal to 50% of qualified wages paid to
8
employees during a quarter, capped at $10,000 of qualified wages per employee throughout the year. The Company qualified for the tax credit in the second and third quarters of 2020 and accrued a benefit of $2.3 million in the fourth quarter of 2020 related to the Employee Retention Credit in other (income) expense, net on the Company’s Consolidated Statements of Operations. The Company is currently in the process of filing for this credit.
Consolidated Appropriations Act, 2021 (“CAA”)
On December 27, 2020, the President of the United States signed the Consolidated Appropriation Act, 2021 (“CAA”). The CAA includes additional COVID-19 relief that expands upon the relief provided in the CARES Act, including, but not limited to, the extension of tax deductions, credits, and incentives. The Company has evaluated the CAA for any potential impact. While it was determined that the CAA revised and extended the Employee Retention Credit into 2021, the CAA is not expected to have an impact on the Company as furloughs related to the COVID-19 pandemic ceased in 2020. Furthermore, the Company does not expect any of the other provisions within the CAA to provide a benefit.
American Rescue Plan Act of 2021 (“ARPA”)
On March 11, 2021, the President of the United States signed the American Rescue Plan Act of 2021 (“ARPA”). APRA strengthens and extends certain programs enacted through the CARES Act and establishes new relief programs aimed at mitigating the financial impact of the COVID-19 pandemic. The Company is evaluating the provisions within the ARPA. At this time, 2 provisions are anticipated to impact the Company.
The first applicable provision imposes new requirements related to health coverage provided by the Consolidated Omnibus Budget Reconciliation Act (“COBRA”). Under the ARPA, employers are required to provide a 100% premium subsidy for COBRA health care continuation coverage for certain employees for the period of April 1, 2021 through September 30, 2021. The Company will be reimbursed for this additional coverage through fully refundable payroll tax credits.
The second applicable provision offers funding relief for single-employer defined benefit pension plans. Specifically, the ARPA provides enhanced interest rate stabilization, as well as extended amortization of funding shortfalls. The Company is currently evaluating the impact and timing of election options permitted by the ARPA on required contributions to our domestic defined benefit pension plans. At this time based on current assumptions and expected asset returns, pending further IRS guidance, we believe that the ARPA provisions are likely to result in a delay in the timing of required Company contributions until 2028. However, these estimates are subject to significant uncertainty.
Note3-Revenue Recognition
The following table provides the major sources of revenue by end-market sector for the three months ended March 31, 20202021 and 2019:2020:
|
| Three Months Ended March 31, |
|
| Three Months Ended March 31, |
| ||||||||||
|
| 2020 |
|
| 2019 |
|
| 2021 |
|
| 2020 |
| ||||
Mobile |
| $ | 97.7 |
|
| $ | 144.2 |
|
| $ | 133.6 |
|
| $ | 97.7 |
|
Industrial |
|
| 113.3 |
|
|
| 147.0 |
|
|
| 124.7 |
|
|
| 113.3 |
|
Energy |
|
| 25.2 |
|
|
| 60.8 |
|
|
| 7.7 |
|
|
| 25.2 |
|
Other(1) |
|
| 23.5 |
|
|
| 19.0 |
|
|
| 7.6 |
|
|
| 23.5 |
|
Total Net Sales |
| $ | 259.7 |
|
| $ | 371.0 |
|
| $ | 273.6 |
|
| $ | 259.7 |
|
(1) “Other” for sales by end-market sector includes the Company’s scrap and oil country tubular goods (OCTG)(“OCTG”) billet sales.
The following table provides the major sources of revenue by product type for the three months ended March 31, 20202021 and 2019:2020:
|
| Three Months Ended March 31, |
|
| Three Months Ended March 31, |
| ||||||||||
|
| 2020 |
|
| 2019 |
|
| 2021 |
|
| 2020 |
| ||||
Bar |
| $ | 168.1 |
|
| $ | 239.9 |
|
| $ | 173.2 |
|
| $ | 168.1 |
|
Tube |
|
| 30.4 |
|
|
| 49.6 |
|
|
| 36.1 |
|
|
| 30.4 |
|
Value-add |
|
| 55.5 |
|
|
| 73.7 |
|
|
| 56.7 |
|
|
| 55.5 |
|
Other(2) |
|
| 5.7 |
|
|
| 7.8 |
|
|
| 7.6 |
|
|
| 5.7 |
|
Total Net Sales |
| $ | 259.7 |
|
| $ | 371.0 |
|
| $ | 273.6 |
|
| $ | 259.7 |
|
(2) “Other” for sales by product type includes the Company’s scrap sales.
9
Note4-Restructuring Charges
DuringBeginning in 2019, and into the first quarter of 2020, TimkenSteel made organizational changes to enhance profitable and sustainable growth. These company-wide actions included the restructuring of its business support functions, the reduction of management layers throughout the organization, the closure of the TimkenSteel Material Services (TMS)(“TMS”) facility in Houston, Texas and other domestic and international actions to further improve the Company’s overall cost structure. Through these restructuring efforts, to date the Company has eliminated approximately 160230 salaried positions and recognized restructuring charges of $9.1$12.2 million.
Restructuring charges in the first quarter of 2021 amounted to $0.5 million,, consisting of $0.3 million related to the transition of customers to other TimkenSteel manufacturing equipment due to the discontinuation of specific small-diameter seamless mechanical tube manufacturing and the indefinite idling of our Harrison melt and casting activities (refer to “Note 5 – Disposition of Non-Core Assets” for additional information). The remaining $0.2 million related to severance and employee-related benefits.benefits as a result of continued organizational changes. Approximately 10 of these15 salaried positions were eliminated in the first quarter of 2020. 2021. TimkenSteel recorded reserves for such restructuring charges as other current liabilities on the Consolidated Balance Sheets. The reserve balance at March 31, 20202021 is expected to be substantially used in the next twelve months.
The following is a summary of the restructuring reserve for the three months ended March 31, 2020:2021 and 2020.
|
|
|
|
|
Balance at December 31, 2020 |
| $ | 1.5 |
|
Expenses |
|
| 0.5 |
|
Payments |
|
| (1.4 | ) |
Balance at March 31, 2021 |
| $ | 0.6 |
|
Balance at December 31, 2019 |
| $ | 6.0 |
|
Expenses |
|
| 0.6 |
|
Payments |
|
| (4.0 | ) |
Balance at March 31, 2020 |
| $ | 2.6 |
|
There was no reserve for restructuring at March 31, 2019.
Note 5 - Disposition of Non-Core Assets
During the fourth quarter of 2019, management entered into an agreement to dispose of the Company’s scrap processing facility in Akron, Ohio for cash consideration of approximately $4.0 million. An impairment charge of $7.3 million was recognized in the fourth quarter of 2019 in connection with the sale. The sale was completed, and the Company received all cash consideration in the first quarter of 2020. An additional loss on disposal of $0.2 million was recognized in the first quarter as the sale was completed.TimkenSteel Material Services Facility
Additionally, duringDuring the first quarter of 2020, management completed its previously announced plan to close the Company’s TMS facility in Houston and initiated a plan to market and sellbegan selling the assets at the facility. Accelerated depreciation and amortization on TMS assets of $1.6 million was recorded in the first quarter of 2020 to reduce the net book value of the machinery and equipment to its expected fair value. Subsequent to the closure, certain assets were sold and a gain on sale of $3.2 million was recognized. recognized for the three months ended March 31, 2020.
At March 31, 2020,2021, the remaining associated machinery and equipment that was classified as held for sale with a net book value of $2.2$0.3 million as of December 31, 2020, was fully impaired as there is no longer an expected market value for these assets. This is classified as held for saleimpairment charges on the Consolidated Balance Sheet. Statements of Operations.
The land and buildings associated with TMS were notare classified as heldproperty, plant and equipment, net on the Consolidated Balance Sheets, as it is not probable that these assets will be sold within the next 12 months.
Small-Diameter Seamless Mechanical Tubing Machinery and Equipment
In the third quarter of 2020, TimkenSteel informed customers that as of December 31, 2020 the Company will discontinue the commercial offering of specific small-diameter seamless mechanical tubing products. As a result, the Company recognized accelerated depreciation of $1.5 million for sale, as they were not considered available for immediate salethe three months ended March 31, 2021 in their present condition. The Company began sellingalignment with the inventory associated with TMSramp down of the machinery and equipment used in the manufacturing of these specific products, which was completed in the first quarter of 2020 at prices that were2021. Spare parts related to this machinery and equipment of $0.5 million was also written down in line with the net realizable valuefirst quarter of 2021, as management determined there was no alternative use.
Harrison Melt and Casting Assets
On February 16, 2021, management announced a plan to indefinitely idle its Harrison melt and casting assets, which was completed in the first quarter of 2021. Going forward, all of the inventory that was established inCompany’s melt and casting activities will take place at the fourth quarterFaircrest location. The Company worked collaboratively with employees, suppliers and a number of 2019. customers to ensure a well-organized and efficient transition. The Company’s rolling and finishing operations at Harrison were not impacted by this action.
10
10
The Company recognized non-cash charges of $9.5 million related to the write-down of the associated Harrison melt and casting assets in the first quarter of 2021. These charges include $7.9 million related to the impairment of the associated machinery and equipment, which is classified as impairment charges on the Consolidated Statements of Operations, as well as a write-down of spare parts of $1.6 million, as management determined there was no alternative use. The Company did not incur any cash expenditures related to these charges.
TimkenSteel (Shanghai) Corporation Limited
On March 31, 2021, the Company entered into an agreement pursuant to which Daido Steel (Shanghai) Co., Ltd. has agreed to acquire all of the Company’s ownership interest in TimkenSteel (Shanghai) Corporation Limited in an all-cash transaction for approximately $7 million, subject to certain regulatory approvals and other closing conditions. As of March 31, 2021, the Company does not expect a material impact to our Consolidated Statements of Operations. The transaction is expected to close during the third quarter of 2021.
Note6–Other (Income) Expense, (Income), net
The following table provides the components of other (income) expense, (income), net for the three months ended March 31, 20202021 and 2019:2020:
|
| Three Months Ended March 31, |
| |||||
|
| 2020 |
|
| 2019 |
| ||
Pension and postretirement non-service benefit loss (income) |
| $ | (6.6 | ) |
| $ | (2.8 | ) |
Loss from remeasurement of benefit plan |
|
| 9.5 |
|
|
| — |
|
Foreign currency exchange loss (gain) |
|
| — |
|
|
| 0.1 |
|
Miscellaneous expense (income) |
|
| (0.2 | ) |
|
| — |
|
Total other expense (income), net |
| $ | 2.7 |
|
| $ | (2.7 | ) |
|
| Three Months Ended March 31, |
| |||||
|
| 2021 |
|
| 2020 |
| ||
Pension and postretirement non-service benefit (income) loss |
| $ | (9.6 | ) |
| $ | (6.6 | ) |
Loss (gain) from remeasurement of benefit plans |
|
| 0.2 |
|
|
| 9.5 |
|
Miscellaneous (income) expense |
|
| — |
|
|
| (0.2 | ) |
Total other (income) expense, net |
| $ | (9.4 | ) |
| $ | 2.7 |
|
Non-service benefit income is derived from the Company’srelated pension and other postretirement plans. The Company’sbenefit income, for all years, consists of the interest cost, expected return on plan assets has exceeded the interest cost component, resulting in income for the three months ended March 31, 2020 and 2019.amortization components of net periodic cost.
The TimkenSteel Corporation Retirement Plan (Salaried Plan)(“Salaried Plan”) has a provision that permits employees to elect to receive their pension benefits in a lump sum. In the first quarter of 2020,2021, the cumulative cost of all lump sum payments was projected to exceedexceeded the sum of the service cost and interest cost components of net periodic pension cost for the Salaried Plan. TheAs a result, the Company completed a full remeasurement of its pension obligations and plan assets associated with the Salaried Plan asduring the first quarter of March 31, 2020,2021, which resulted in a non-cash loss from remeasurement of $0.2 million. A full remeasurement of the pension obligations and plan assets associated with the Salaried Plan was also required in the first quarter of 2020 resulting in a non-cash loss from remeasurement of $9.5 million.million for the three months ended March 31, 2020. For more details on the remeasurement, refer to “Note 11 - Retirement and Postretirement Plans.”
Plans”.
Note7-Income Tax Provision
TimkenSteel’s provision for income taxes in interim periods is computed by applying the appropriate estimated annual effective tax rates to income or loss before income taxes for the period. In addition, non-recurring or discrete items, including interest on prior-year tax liabilities, are recorded during the periods in which they occur.
|
| Three Months Ended March 31, |
|
| Three Months Ended March 31, |
| ||||||||||
|
| 2020 |
|
| 2019 |
|
| 2021 |
|
| 2020 |
| ||||
Provision (benefit) for incomes taxes |
| $ | 0.1 |
|
| $ | 0.1 |
|
| $ | 0.2 |
|
| $ | 0.1 |
|
Effective tax rate |
|
| (0.5 | )% |
|
| 1.3 | % |
|
| 2.0 | % |
|
| (0.5 | )% |
In light ofDue to TimkenSteel’s recenthistorical operating performance in the U.S. and current industry conditions,, the Company assessed its U.S. deferred tax assets and concluded, based upon all available evidence, that it was more likely than not that it would not realize the assets. As a result, the Company maintains a full valuation allowance against its deferred tax assets in the U.S. and applicable foreign countries until sufficient positive evidence exists to conclude that a valuation allowance is not necessary. Going forward, the need to maintain valuation allowances against deferred tax assets in the U.S. and other affected countries will cause variability in the Company’s effective tax rate. The majority of TimkenSteel’s income taxes are derived from foreign operations.
On March 27, 2020, the President
11
Note 8 - Earnings (Loss) Per Share
Basic earnings (loss) per share is computed based upon the weighted average number of common shares outstanding. Diluted earnings (loss) per share is computed based upon the weighted average number of common shares outstanding plus the dilutive effect of common share equivalents calculated using the treasury stock method or if-converted method. For the Convertible Notes, the Company utilizes the if-converted method to calculate diluted earnings (loss) per share. Under the if-converted method, the Company adjusts net earnings to add back interest expense (including amortization of debt discount)issuance costs) recognized on the Convertible Notes and includes the number of shares potentially issuable related to the Convertible Notes in the weighted average shares outstanding. Treasury stock is excluded from the denominator in calculating both basic and diluted earnings (loss) per share.
11
CommonMarch 31, 2021 and March 31, 2020, respectively. As of March 31, 2021, 2.3 million shares primarily related to options with exercise prices more than the average market price of our common shares (i.e., “underwater” options) were excluded from the computation of diluted earnings (loss) per share because the effect of their inclusion would have been anti-dilutive. The difference between the remaining 2.8 million shares assumed issued and the 1.6 million shares assumed purchased with potential proceeds were included in the denominator of the diluted earnings (loss) per share calculation. All common share equivalents for shares issuable for equity-based awards were excluded from the computation of diluted earnings (loss) per share for the three months ended March 31, 2020 because the effect of their inclusion would have been anti-dilutive.
Common share equivalents for shares issuable upon the conversion of outstanding convertible notes were included in the computation of diluted earnings (loss) per share for the three months ended March 31, 2021 as these shares would be dilutive. Common share equivalents for shares issuable upon the conversion of outstanding convertible notes were excluded from the computation of diluted earnings (loss) per share for the three months ended March 31, 2020 and 2019 because the effect of their inclusion would have been anti-dilutive.
The following table sets forth the reconciliation of the numerator and the denominator of basic and diluted earnings (loss) per share for the three months ended March 31, 20202021 and 2019:2020:
|
| Three Months Ended March 31, |
|
| Three Months Ended March 31, |
| ||||||||||
|
| 2020 |
|
| 2019 |
|
| 2021 |
|
| 2020 |
| ||||
Numerator: |
|
|
|
|
|
|
|
|
|
|
|
|
|
|
|
|
Net income (loss) |
| $ | (19.9 | ) |
| $ | 3.5 |
| ||||||||
Net income (loss), basic |
| $ | 9.8 |
|
| $ | (19.9 | ) | ||||||||
Add convertible notes interest |
|
| 1.3 |
|
|
| — |
| ||||||||
Net income (loss), diluted |
| $ | 11.1 |
|
| $ | (19.9 | ) | ||||||||
|
|
|
|
|
|
|
|
|
|
|
|
|
|
|
|
|
Denominator: |
|
|
|
|
|
|
|
|
|
|
|
|
|
|
|
|
Weighted average shares outstanding, basic |
|
| 44.9 |
|
|
| 44.7 |
|
|
| 45.4 |
|
|
| 44.9 |
|
Dilutive effect of stock-based awards |
|
| — |
|
|
| 0.5 |
|
|
| 1.2 |
|
|
| — |
|
Dilutive effect of convertible notes |
|
| 9.1 |
|
|
| — |
| ||||||||
Weighted average shares outstanding, diluted |
|
| 44.9 |
|
|
| 45.2 |
|
|
| 55.7 |
|
|
| 44.9 |
|
|
|
|
|
|
|
|
|
|
|
|
|
|
|
|
|
|
Basic earnings (loss) per share |
| $ | (0.44 | ) |
| $ | 0.08 |
|
| $ | 0.22 |
|
| $ | (0.44 | ) |
Diluted earnings (loss) per share |
| $ | (0.44 | ) |
| $ | 0.08 |
|
| $ | 0.20 |
|
| $ | (0.44 | ) |
Note9-Inventories
The components of inventories, net of reserves as of March 31, 20202021 and December 31, 20192020 were as follows:
|
| March 31, 2020 |
|
| December 31, 2019 |
|
| March 31, 2021 |
|
| December 31, 2020 |
| ||||
Manufacturing supplies |
| $ | 43.5 |
|
| $ | 49.8 |
|
| $ | 28.5 |
|
| $ | 37.6 |
|
Raw materials |
|
| 16.2 |
|
|
| 26.0 |
|
|
| 25.1 |
|
|
| 20.0 |
|
Work in process |
|
| 111.6 |
|
|
| 123.7 |
|
|
| 99.5 |
|
|
| 79.1 |
|
Finished products |
|
| 79.5 |
|
|
| 93.1 |
|
|
| 58.2 |
|
|
| 55.6 |
|
Gross inventory |
|
| 250.8 |
|
|
| 292.6 |
|
|
| 211.3 |
|
|
| 192.3 |
|
Allowance for inventory reserves |
|
| (10.3 | ) |
|
| (10.7 | ) |
|
| (8.6 | ) |
|
| (13.9 | ) |
Total Inventories, net |
| $ | 240.5 |
|
| $ | 281.9 |
| ||||||||
Total inventories, net |
| $ | 202.7 |
|
| $ | 178.4 |
| ||||||||
12
Note10-Financing Arrangements
For a detailed discussion of the Company's long-term debt and credit arrangements, refer to “Note 14 - Financing Arrangements” in the Company’s Annual Report on Form 10-K for the year ended December 31, 2019.
Convertible Notes2020.
The components offollowing table summarizes the Convertible Notescurrent and non-current debt as of March 31, 20202021 and December 31, 2019 were as follows:
|
| March 31, 2020 |
|
| December 31, 2019 |
| ||
Principal |
| $ | 86.3 |
|
| $ | 86.3 |
|
Less: Debt issuance costs, net of amortization |
|
| (0.6 | ) |
|
| (0.7 | ) |
Less: Debt discount, net of amortization |
|
| (5.9 | ) |
|
| (7.0 | ) |
Convertible notes, net |
| $ | 79.8 |
|
| $ | 78.6 |
|
The initial value of the principal amount recorded as a liability at the date of issuance was $66.9 million, using an effective interest rate of 12.0%. The remaining $19.4 million of principal amount was allocated to the conversion feature and recorded as a component of shareholders’ equity at the date of issuance. This amount represents a discount to the debt to be amortized through interest expense using the effective interest method through the maturity of the Convertible Notes. Transaction costs were allocated to the liability and equity components based on their relative values. Transaction costs attributable to the liability component of $2.4 million are amortized to interest expense over the term of the Convertible Notes, and transaction costs attributable to the equity component of $0.7 million are included in shareholders’ equity.
12
Table of Contents2020.
The following table sets forth total interest expense recognized related to the Convertible Notes:
|
| Three Months Ended March 31, |
| |||||
|
| 2020 |
|
| 2019 |
| ||
Contractual interest expense |
| $ | 1.3 |
|
| $ | 1.3 |
|
Amortization of debt issuance costs |
|
| 0.1 |
|
|
| 0.1 |
|
Amortization of debt discount |
|
| 1.1 |
|
|
| 1.0 |
|
Total |
| $ | 2.5 |
|
| $ | 2.4 |
|
|
| March 31, 2021 |
|
| December 31, 2020 |
| ||
Credit Agreement |
| $ | — |
|
| $ | — |
|
Convertible Senior Notes due 2021 |
|
| 40.2 |
|
|
| 38.9 |
|
Convertible Senior Notes due 2025 |
|
| 44.7 |
|
|
| 39.3 |
|
Total debt |
| $ | 84.9 |
|
| $ | 78.2 |
|
Less current portion of debt |
|
| 40.2 |
|
|
| 38.9 |
|
Total non-current portion of debt |
| $ | 44.7 |
|
| $ | 39.3 |
|
Amended Credit Agreement
On October 15, 2019, the Company, as borrower, and certain domestic subsidiaries of the Company, as subsidiary guarantors, entered into a Third Amended and Restated Credit Agreement (the Amended“Amended Credit Agreement)Agreement”), with JP Morgan Chase Bank, N.A., as administrative agent (the Administrative Agent)“Administrative Agent”), Bank of America, N.A., as syndication agent, and the other lenders party thereto (collectively, the Lenders)“Lenders”), which further amended and restated the Company’s Second Amended and Restated Credit Agreement dated as of January 26, 2018. The interest rateAs of March 31, 2021, the amount available under the Amended Credit Agreement was 2.2%$241.8 million, reflective of the Company’s asset borrowing base with 0 outstanding borrowings. Additionally, the Company is in compliance with all covenants outlined in the Amended Credit Agreement.
Convertible Senior Notes due 2021
The components of the Convertible Senior Notes due 2021 as of March 31, 2020. 2021 and December 31, 2020 were as follows:
|
| March 31, 2021 |
|
| December 31, 2020 |
| ||
Principal |
| $ | 40.2 |
|
| $ | 40.2 |
|
Less: Debt issuance costs, net of amortization |
|
| — |
|
|
| (0.1 | ) |
Less: Debt discount, net of amortization |
|
| — |
|
|
| (1.2 | ) |
Convertible Senior Notes due 2021, net |
| $ | 40.2 |
|
| $ | 38.9 |
|
The principal amount available for borrowings underof the credit agreementoutstanding Convertible Senior Notes due 2021 as of March 31, 2020 was $224.42021 is $40.2 million. AsTransaction costs related to the outstanding Convertible Senior Notes due 2021 were $1.4 million. These costs are amortized to interest expense over the term of the notes. The Convertible Senior Notes due 2021 mature on June 1, 2021. The Convertible Senior Notes due 2021 are currently convertible at the option of holders into a combination of the Company’s common shares and cash, up until the close of business on the business day immediately preceding the maturity date; upon maturity, the Convertible Senior Notes due 2021 remaining outstanding will be settled in cash. For details regarding conversion mechanics and method of settlement, refer to the Indenture for the Convertible Senior Notes due 2021 filed as an exhibit to a Form 8-K on May 31, 2016 and incorporated by reference in our most recent 10-K filing. The Convertible Senior Notes due 2021 are classified as a current liability in the Consolidated Balance Sheets as of March 31, 2021.
Convertible Senior Notes due 2025
The components of the Convertible Senior Notes due 2025 as of March 31, 2021 and December 31, 2020 were as follows:
|
| March 31, 2021 |
|
| December 31, 2020 |
| ||
Principal |
| $ | 46.0 |
|
| $ | 46.0 |
|
Less: Debt issuance costs, net of amortization |
|
| (1.3 | ) |
|
| (1.3 | ) |
Less: Debt discount, net of amortization |
|
| — |
|
|
| (5.4 | ) |
Convertible Senior Notes due 2025, net |
| $ | 44.7 |
|
| $ | 39.3 |
|
The principal amount of the Company wasConvertible Senior Notes due 2025 as of March 31, 2021 is $46.0 million. Transaction costs related to the Convertible Senior Notes due 2025 were $1.5 million. These costs are amortized to interest expense over the term of the notes. The Convertible Senior Notes due 2025 mature on December 1, 2025. The Convertible Senior Notes due 2025 are convertible at the option of holders in compliance with all covenants.certain circumstances and during certain periods into the Company’s common shares, cash, or a combination thereof, at the Company’s election. For details regarding conversion mechanics and method of settlement, refer to the Indenture for the Convertible Senior Notes due 2025 filed as an exhibit to a Form 8-K on December 15, 2020 and incorporated by reference in our most recent 10-K filing. The Convertible Senior Notes due 2025 are classified as a non-current liability in the Consolidated Balance Sheets as of March 31, 2021.
13
Convertible Notes Interest Expense
The following table sets forth total interest expense recognized related to the Convertible Notes:
|
| Three Months Ended March 31, |
| |||||
|
| 2021 |
|
| 2020 |
| ||
Contractual interest expense |
| $ | 1.2 |
|
| $ | 1.3 |
|
Amortization of debt issuance costs |
|
| 0.1 |
|
|
| 0.1 |
|
Amortization of debt discount |
|
| — |
|
|
| 1.1 |
|
Total |
| $ | 1.3 |
|
| $ | 2.5 |
|
Fair Value Measurement
The fair value of the Convertible Senior Notes due 2021 was approximately $69.0$40.8 million as of March 31, 2020.2021. The fair value of the Convertible Senior Notes due 2021, which falls within Level 1 of the fair value hierarchy as defined by Accounting Standards Codification (ASC) 820, Fair Value Measurements,applicable accounting guidance, is based on the price traded closest to March 31, 2021.
The fair value of the Convertible Senior Notes due 2025 was approximately $77.2 million as of March 31, 2021. The fair value of the Convertible Senior Notes due 2025, which falls within Level 1 of the fair value hierarchy as defined by applicable accounting guidance, is based on the last price traded in March 2020.2021.
TimkenSteel’s Credit AgreementFacility is variable-rate debt. As such, theany outstanding carrying value is a reasonable estimate of fair value as interest rates on these borrowings approximate current market rates. This valuation falls within Level 2 of the fair value hierarchy and is based on quoted prices for similar assets and liabilities in active markets that are observable either directly or indirectly. There were 0 outstanding borrowings on the Credit Facility as of March 31, 2021.
Cash Interest Paid
The total cash interest paid for the three months ended March 31, 2021 and 2020 and 2019 was $0.8$0.3 million and $1.5$0.8 million, respectively.
Note11-Retirement and Postretirement Plans
The components of net periodic benefit cost (income) for the three months ended March 31, 20202021 and 20192020 were as follows:
|
| Three Months Ended March 31, 2020 |
|
| Three Months Ended March 31, 2019 |
|
| Three Months Ended March 31, 2021 |
|
| Three Months Ended March 31, 2020 |
| ||||||||||||||||||||
|
| Pension |
|
| Postretirement |
|
| Pension |
|
| Postretirement |
|
| Pension |
|
| Postretirement |
|
| Pension |
|
| Postretirement |
| ||||||||
Service cost |
| $ | 4.9 |
|
| $ | 0.3 |
|
| $ | 4.3 |
|
| $ | 0.3 |
|
| $ | 4.4 |
|
| $ | 0.3 |
|
| $ | 4.9 |
|
| $ | 0.3 |
|
Interest cost |
|
| 10.9 |
|
|
| 1.0 |
|
|
| 12.2 |
|
|
| 2.0 |
|
|
| 9.1 |
|
|
| 0.8 |
|
|
| 10.9 |
|
|
| 1.0 |
|
Expected return on plan assets |
|
| (16.2 | ) |
|
| (0.9 | ) |
|
| (16.2 | ) |
|
| (0.9 | ) |
|
| (17.2 | ) |
|
| (0.9 | ) |
|
| (16.2 | ) |
|
| (0.9 | ) |
Amortization of prior service cost |
|
| 0.1 |
|
|
| (1.5 | ) |
|
| 0.1 |
|
|
| — |
|
|
| 0.1 |
|
|
| (1.5 | ) |
|
| 0.1 |
|
|
| (1.5 | ) |
Net remeasurement losses |
|
| 9.5 |
|
|
| — |
|
|
| — |
|
|
| — |
|
|
| 0.2 |
|
|
| — |
|
|
| 9.5 |
|
|
| — |
|
Net Periodic Benefit Cost (Income) |
| $ | 9.2 |
|
| $ | (1.1 | ) |
| $ | 0.4 |
|
| $ | 1.4 |
|
| $ | (3.4 | ) |
| $ | (1.3 | ) |
| $ | 9.2 |
|
| $ | (1.1 | ) |
The Salaried Plan has a provision that permits employees to elect to receive their pension benefits in a lump sum. In the first quarter of 2020,2021, the cumulative cost of all lump sum payments was projected to exceedexceeded the sum of the service cost and interest cost components of net periodic pension cost for the Salaried Plan. TheAs a result, the Company completed a full remeasurement of its pension obligations and plan assets associated with the Salaried Plan asduring the first quarter of March 31, 2020,2021, which resulted in a non-cash loss from remeasurement of $0.2 million. A full remeasurement of the pension obligations and plan assets associated with the Salaried Plan was also required in the first quarter of 2020, resulting in a non-cash loss from remeasurement of $9.5 million included in other expense (income), net onfor the Unaudited Consolidated Statements of Operation. As ofthree months ended March 31, 2019, the cumulative cost2020.
14
Note 12 – Stock-Based Compensation
During the first quarter of 20202021, the Board of Directors granted 598,919 time-vested restricted stock units, 143,280 performance-vested797,320 time-based restricted stock units and 511,020651,240 performance-based restricted stock options.units, which includes the annual grant to our employees, as well as the inducement grant made to our newly hired CEO in January 2021. There were 0 stock option grants in the first quarter of 2021.
13
Time-vestedTime-based restricted stock units are issued with the fair value equal to the closing market price of TimkenSteel common shares on the date of grant. These restricted stock units do not have any performance conditions for vesting. Expense is recognized over the service period, adjusted for any forfeitures that should occur during the vesting period. The weighted average fair value of the restricted stock units granted during the three months ended March 31, 20202021 was $5.26$6.79 per share.
Performance-vestedPerformance-based restricted stock units issued in the first quarter of 20202021 vest based on achievement of a total shareholder return (TSR)(“TSR”) metric. The TSR metric is considered a market condition, which requires TimkenSteel to reflect it in the fair value on grant date using an advanced option-pricing model. The fair value of each performance share was therefore determined using a Monte Carlo valuation model, a generally accepted lattice pricing model under ASC 718 – Stock-based Compensation. The Monte Carlo valuation model, among other factors, uses commonly-accepted economic theory underlying all valuation models, estimates fair value using simulations of future share prices based on stock price behavior and considers the correlation of peer company returns in determining fair value. The weighted average fair value of the performance-vestedperformance-based restricted stock units granted during the three months ended March 31, 20202021 was $5.23$7.57 per share.
Stock options are issued with an exercise price equal to the closing market price of TimkenSteel common shares on the date of grant. The fair value of stock options is determined using a Black-Scholes option pricing model, which incorporates assumptions regarding the expected volatility, the expected option life, the risk-free interest rate and the expected dividend yield. The weighted average exercise price and weighted average fair value of the stock option grants during the three months ended March 31, 2020 were $5.26 per share and $2.23 per share, respectively.
TimkenSteel recognized stock-based compensation expense of $1.8 million and $2.0 million and $2.1 million duringfor the three months ended March 31, 20202021 and 2019,2020, respectively. Future stock-based compensation expense regarding the unvested portion of all awards is approximately $9.9$15.2 million. The future expense is expected to be recognized over the remaining vesting periods through 2024.
14
Note13-Accumulated Other Comprehensive Income (Loss)
Changes in accumulated other comprehensive income (loss) for the three months ended March 31, 20202021 and 20192020 by component were as follows:
|
| Foreign Currency Translation Adjustments |
|
| Pension and Postretirement Liability Adjustments |
|
| Total |
| |||
Balance as of December 31, 2019 |
| $ | (6.8 | ) |
| $ | 51.5 |
|
| $ | 44.7 |
|
Other comprehensive income before reclassifications, before income tax |
|
| (1.8 | ) |
|
| — |
|
|
| (1.8 | ) |
Amounts reclassified from accumulated other comprehensive income (loss), before income tax |
|
| — |
|
|
| (1.4 | ) |
|
| (1.4 | ) |
Amounts deferred to accumulated other comprehensive income (loss), before income tax |
|
| — |
|
|
| 0.3 |
|
|
| 0.3 |
|
Tax effect |
|
| — |
|
|
| — |
|
|
| — |
|
Net current period other comprehensive income, net of income taxes |
|
| (1.8 | ) |
|
| (1.1 | ) |
|
| (2.9 | ) |
Balance as of March 31, 2020 |
| $ | (8.6 | ) |
| $ | 50.4 |
|
| $ | 41.8 |
|
|
|
|
|
|
|
|
|
|
|
|
|
|
|
| Foreign Currency Translation Adjustments |
|
| Pension and Postretirement Liability Adjustments |
|
| Total |
| |||
Balance at December 31, 2018 |
| $ | (7.3 | ) |
| $ | (1.6 | ) |
| $ | (8.9 | ) |
Other comprehensive income before reclassifications, before income tax |
|
| 0.4 |
|
|
| — |
|
|
| 0.4 |
|
Amounts reclassified from accumulated other comprehensive loss, before income tax |
|
| — |
|
|
| 0.1 |
|
|
| 0.1 |
|
Tax effect |
|
| — |
|
|
| — |
|
|
| — |
|
Net current period other comprehensive income, net of income taxes |
|
| 0.4 |
|
|
| 0.1 |
|
|
| 0.5 |
|
Balance as of March 31, 2019 |
| $ | (6.9 | ) |
| $ | (1.5 | ) |
| $ | (8.4 | ) |
|
| Foreign Currency Translation Adjustments |
|
| Pension and Postretirement Liability Adjustments |
|
| Total |
| |||
Balance as of December 31, 2020 |
| $ | (5.4 | ) |
| $ | 45.8 |
|
| $ | 40.4 |
|
Other comprehensive income (loss) before reclassifications, before income tax |
|
| 0.1 |
|
|
| 0 |
|
|
| 0.1 |
|
Amounts reclassified from accumulated other comprehensive income (loss), before income tax |
|
| 0 |
|
|
| (1.5 | ) |
|
| (1.5 | ) |
Tax effect |
|
| 0 |
|
|
| 0 |
|
|
| 0 |
|
Net current period other comprehensive income (loss), net of income taxes |
|
| 0.1 |
|
|
| (1.5 | ) |
|
| (1.4 | ) |
Balance as of March 31, 2021 |
| $ | (5.3 | ) |
| $ | 44.3 |
|
| $ | 39.0 |
|
|
|
|
|
|
|
|
|
|
|
|
|
|
|
| Foreign Currency Translation Adjustments |
|
| Pension and Postretirement Liability Adjustments |
|
| Total |
| |||
Balance at December 31, 2019 |
| $ | (6.8 | ) |
| $ | 51.5 |
|
| $ | 44.7 |
|
Other comprehensive income (loss) before reclassifications, before income tax |
|
| (1.8 | ) |
|
| 0 |
|
|
| (1.8 | ) |
Amounts reclassified from accumulated other comprehensive income (loss), before income tax |
|
| 0 |
|
|
| (1.4 | ) |
|
| (1.4 | ) |
Amounts deferred to accumulated other comprehensive income (loss), before income tax |
|
| 0 |
|
|
| 0.3 |
|
|
| 0.3 |
|
Tax effect |
|
| 0 |
|
|
| 0 |
|
|
| 0 |
|
Net current period other comprehensive income (loss), net of income taxes |
|
| (1.8 | ) |
|
| (1.1 | ) |
|
| (2.9 | ) |
Balance as of March 31, 2020 |
| $ | (8.6 | ) |
| $ | 50.4 |
|
| $ | 41.8 |
|
The amount reclassified from accumulated other comprehensive income (loss) in the three months ended March 31, 2021 and 2020 for the pension and postretirement liability adjustment was included in other income,(income) expense, net in the unaudited Consolidated Statements of Operations.
15
Note14–Contingencies
TimkenSteel has a number of loss exposures incurred in the ordinary course of business, such as environmental claims, product warranty claims, and litigation. Establishing loss reserves for these matters requires management’s estimate and judgment regarding risk exposure and ultimate liability or realization. These loss reserves are reviewed periodically and adjustments are made to reflect the most recent facts and circumstances. Accruals related to environmental claims represent management’s best estimate of the fees and costs associated with these claims. Although it is not possible to predict with certainty the outcome of such claims, management believes that their ultimate dispositions should not have a material adverse effect on our financial position, cash flows or results of operations. As of March 31, 20202021 and December 31, 2019,2020, TimkenSteel had a $1.0$0.9 million and a $1.5$1.0 million contingency reserve, respectively, related to loss exposures incurred in the ordinary course of business.business
Note 15 – Subsequent Events
Effective May 7, 2021, Thomas D. Moline, executive vice president of commercial operations, and William P. Bryan, executive vice president of manufacturing and supply chain, will leave the company. Kevin A. Raketich, currently serving as executive vice president of strategy and corporate development at TimkenSteel, will assume a new role as executive vice president of sales, marketing, and business development. In connection with these leadership changes, the Company is expecting to recognize severance and transition charges of approximately $2.1 million in the second quarter of 2021, of which approximately $1.3 million will be a cash charge.
16
Item 2. MANAGEMENT’S DISCUSSION AND ANALYSIS OF FINANCIAL CONDITION AND RESULTS OF OPERATIONSManagement’s Discussion and Analysis of Financial Condition and Results of Operations
(dollars in millions, except per share data)
Business Overview
We manufacture alloy steel, as well as carbon and micro-alloy steel, with an annual melt capacity of approximately 2 million tons and shipment capacity of 1.5 million tons.steel. Our portfolio includes special bar quality (SBQ)(“SBQ”) bars, seamless mechanical tubing (tubes)(“tubes”), value-added solutions such as precision steel components, and billets. In addition, we supply machining and thermal treatment services and manage raw material recycling programs, which are also used as a feeder system for our melt operations. Our products and services are used in a diverse range of demanding applications in the following market sectors: automotive; oil and gas; industrial equipment; mining; construction; rail; defense; heavy truck; agriculture; power generation; and oil country tubular goods (OCTG)(“OCTG”).
SBQ steel is made to restrictive chemical compositions and high internal purity levels and is used in critical mechanical applications. We make these products from nearly 100% recycled steel, using our expertise in raw materials to create custom steel products. We focus on creating tailored products and services for our customers’ most demanding applications. Our engineers are experts in both materials and applications, so we can work closely with each customer to deliver flexible solutions related to our products as well as to their applications and supply chains.
The SBQ bar, tube, and billet production processes take place at our Canton, Ohio manufacturing location. This location accounts for all of the SBQ bars, seamless mechanical tubes and billets we produce and includes three manufacturing facilities: the Faircrest, Harrison, and Gambrinus facilities. Our value-added solutions production processes take place at two downstream manufacturing facilities: Tryon Peak (Columbus, North Carolina), and St. Clair (Eaton, Ohio). Many of the production processes are integrated, and the manufacturing facilities produce products that are sold in all of our market sectors. As a result, investments in our facilities and resource allocation decisions affecting our operations are designed to benefit the overall business, not any specific aspect of the business.
InThe lead time for our products varies based on product type and specifications. As of the date of this filing, lead times for SBQ bars are averaging 15 to 18 weeks and lead times for tubes are averaging 18 weeks.
On February 16, 2021, management announced a plan to indefinitely idle our Harrison melt and casting assets, which was completed in the first quarter of 2020,2021. Going forward, all of our melt and casting activities will take place at the Faircrest location. We worked collaboratively with employees, suppliers and a number of customers to ensure a well-organized and efficient transition. Our rolling and finishing operations at Harrison were not impacted by this action. Prior to indefinitely idling these assets, we closedhad an annual melt capacity of approximately 2 million tons and shipment capacity of 1.5 million tons. After indefinitely idling these assets, our TimkenSteel Material Services facility in Houston, Texas. See “Note 5 - Disposition of Non-Core Assets” in the Notes to the unaudited Consolidated Financial Statements for additional information.annual melt capacity is approximately 1.2 million tons and our shipment capacity is approximately 0.9 million tons.
We conduct our business activities and report financial results as one business segment. The presentation of financial results as one reportable segment is consistent with the way we operate our business and is consistent with the manner in which the CODMChief Operating Decision Maker (“CODM”) evaluates performance and makes resource and operating decisions for the business as described above. Furthermore, the Company notes that monitoring financial results as one reportable segment helps the CODM manage costs on a consolidated basis, consistent with the integrated nature of our operations.
Impact of COVID-19 Pandemic
We continue to closely monitor the impact of the COVID-19 pandemic on our Company, customers, employees and supply chain. The full extent to which the COVID-19 pandemic will impact our operations and financial results is uncertain and ultimately will depend on, among many other factors, the duration of the pandemic, further Federal and State government actions and the speed of economic recovery. We estimate the impact on our first quarter of 2020 results was lost sales of approximately $10 million. The negative impact on our second quarter, remainder of the year and beyond remains unknown but at a minimum, we expect customer demand in the COVID-19 environment to be sharply lower in the second quarter of 2020, resulting in periodic production outages as the Company continues to balance production schedules with demand.
In response to the significant reduction in customer demand resulting from the COVID-19 crisis, the company has taken additional actions to further reduce operating expenses, conserve cash and maximize liquidity, such as:
Reduced interim CEO and senior executives’ base salaries by 20 percent and other executives’ base salaries by 10 percent, effective May 1;
Reduced cash retainer for its board of directors by 20 percent beginning with the second-quarter 2020, and reduced the value of the board’s annual equity grant by 20 percent;
Suspended company’s 401(k) plan matching contributions for salaried employees, effective June 1;
Implemented unpaid rolling furloughs for approximately 80 percent of salaried employees, beginning in early April;
Aggressively reduced production schedules at all plants to align operations with customer demand, resulting in the temporary layoff of manufacturing employees;
Reduced planned 2020 capital expenditures to a maximum of $25 million, a $5 million reduction from previously stated guidance; and
Deferred Social Security payroll tax remittance as permitted by the CARES Act.
16
Impact of Raw Material Prices
In the ordinary course of business, we are exposed to the volatility of the costs of our raw materials. Whenever possible, we manage our exposure to commodity risks primarily through the use of supplier pricing agreements that enable us to establish the purchase prices for certain inputs that are used in our manufacturing process. We utilize a raw material surcharge mechanism when pricing products to our customers, which is designed to mitigate the impact of increases or decreases in raw material costs, although generally with a one-month lag effect. This timing effect can result in raw material spread whereby costs can be over- or under-recovered in certain periods. While the surcharge generally protects gross profit, it has the effect of diluting gross margin as a percent of sales.
17
Results of Operations
Net Sales
The charts below present net sales and shipments for the three months ended March 31, 20202021 and 2019.2020.
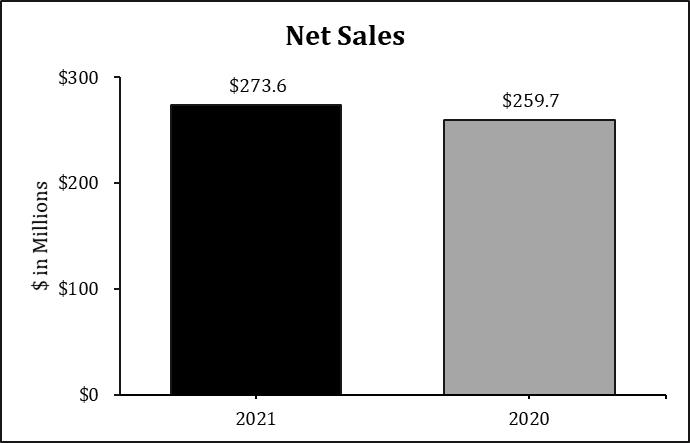
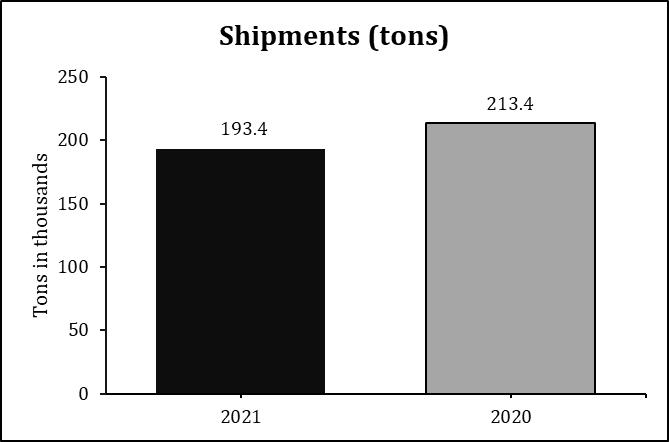
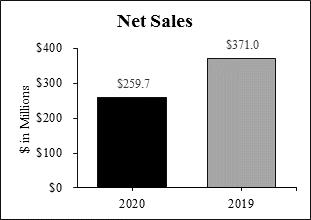
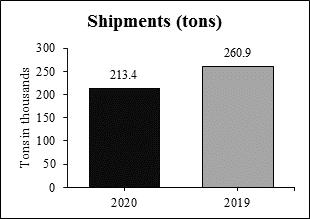
Net sales for the three months ended March 31, 20202021 were $259.7$273.6 million, a decreasean increase of $111.3$13.9 million, or 30.0%,5.4% compared with the three months ended March 31, 2019.2020. The decreaseincrease was due to a reduction in volume of approximately 47.5 thousand ship tons, resulting in a decrease of $54.1 million of net sales, lower surcharges of $43.6 million, and change in mix of $9.3 million. The primary driver in the decrease in volume was lower customer demand across all end markets, partially offsetprimarily driven by an increase in OCTG billet shipments. The decrease in surcharges was primarilyof $21.7 million across all end-market sectors due to a 38% decline in the average surcharge per ton due to lowerhigher market prices for scrap and alloys. Unfavorable favorable price/mix was primarilyof $11.5 million driven by increasedthe mobile end-market sector. These increases were partially offset by lower volumes of $19.3 million, primarily due to lower energy and OCTG billet shipments. We estimateshipments in the impactfirst quarter of the COVID-19 pandemic on our net sales was a reduction of approximately $10.0 million.2021. Excluding surcharges, net sales decreased $67.5$7.8 million or 24.0%3.6%.
17
Gross Profit
The chart below presents the drivers of the gross profit variance from the three months ended March 31, 20192021 to March 31, 2020.
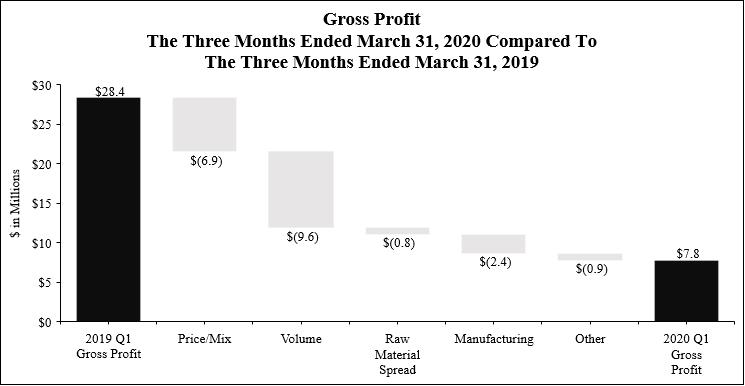
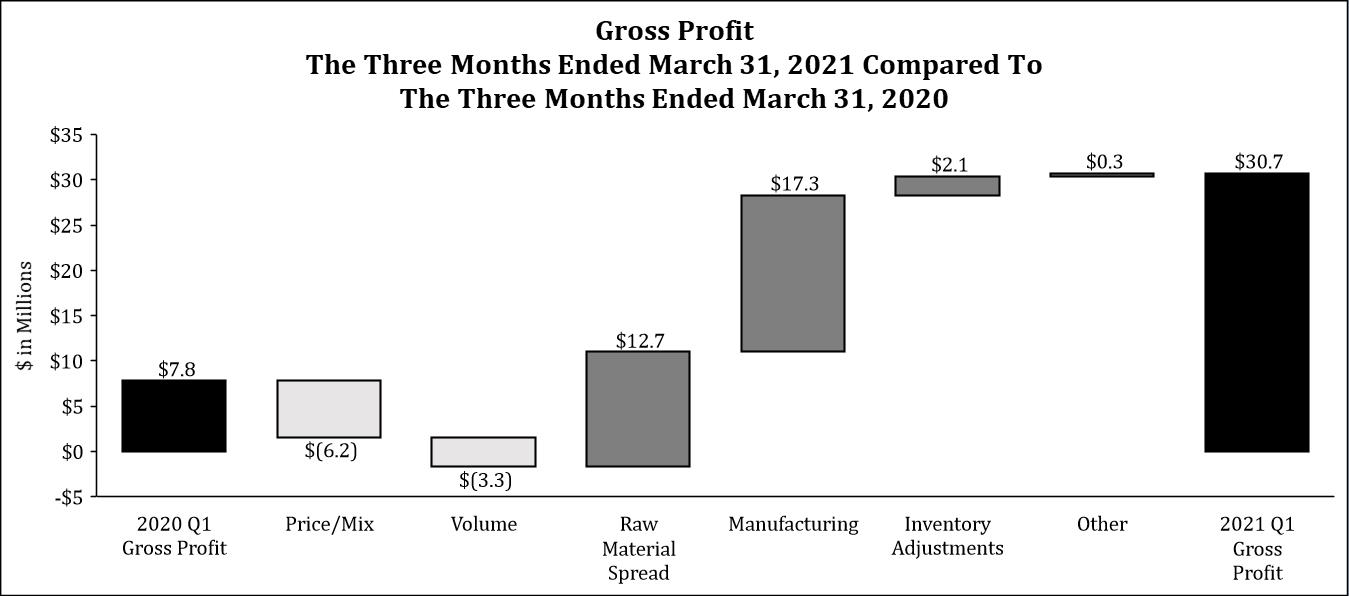
Gross profit for the three months ended March 31, 2020 decreased $20.62021 increased $22.9 million, or 72.5%293.6%, compared with the three months ended March 31, 2019.2020. The decreaseincrease was driven primarily by lower volumes, unfavorablefavorable manufacturing costs and raw material spread, partially offset by price/mix and unfavorablelower volumes. Favorable manufacturing costs. The primary driver incosts were primarily due to the decrease in volume was lower customer demand across all end markets,Company’s significant cost reduction actions and a favorable impact of higher production levels on fixed cost leverage, partially offset by an increase in OCTG billet shipments.higher variable compensation costs. Raw material spread was favorable due to higher scrap and alloy spreads. Unfavorable price/mix was driven by lower pricing, primarilyhigher sales in the mobile end-market sector compared with the industrial end market, and unfavorable mix, primarilyenergy end-market sectors. Unfavorable volume was due to increased billet shipments. Unfavorable manufacturing costslower sales of OCTG billets in 2020 were primarily due tothe first quarter of 2021 and a decline in melt utilization, resulting in lower fixed cost leverage, as well as the impactweak energy market.
18
Selling, General and Administrative Expenses
The charts below present selling, general and administrative (SG&A)(“SG&A”) expense for the three months ended March 31, 20202021 and 2019.2020.
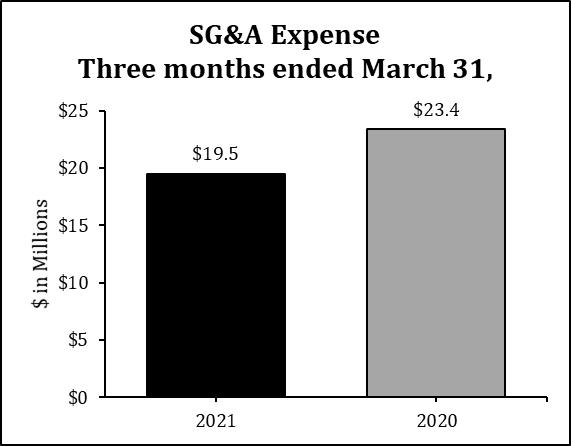
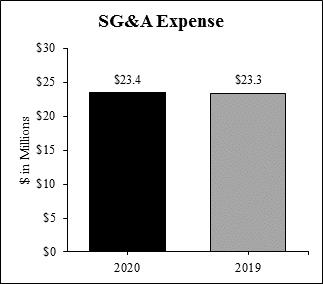
18
Selling, general and administrative (SG&A)SG&A expense for the three months ended March 31, 2020 of $23.42021 decreased by $3.9 million, was relatively consistentcompared with the prior year quarter.same period in 2020. The increase isdecreases are primarily due to the increase in variable compensation and bad debt expense, substantially offset by lower wages and benefits asexpense, which are a result of a reduction in employeesemployee headcount following the Company’s recent restructuring actions. Other related cost reduction actions and lower controllable spend also contributed to the decrease. These decreases are partially offset by increases in variable compensation.
Restructuring Charges
During
Beginning in 2019, and into the first quarter of 2020, TimkenSteel made organizational changes to enhance profitable and sustainable growth. These company-wide actions included the restructuring of its business support functions, the reduction of management layers throughout the organization, the closure of the TimkenSteel Material Services (TMS)(“TMS”) facility in Houston, Texas and other domestic and international actions to further improve the Company’s overall cost structure. Through these restructuring efforts, to date the Company has eliminated approximately 160230 salaried positions and recognized restructuring charges of $9.1 million, consisting of severance and employee-related benefits. $12.2 million. Approximately 10 of these15 salaried positions were eliminated in the first quarter of 2020. During the three months ended March 31, 2020, there were additional restructuring charges of $0.6 million, as well as a cash outflow of approximately $4 million primarily related to prior year restructuring actions. 2021. The Company expects to realize annual savings of approximately $20$27 million in 2020 and beyond as a result of these plans.actions. Refer to “Note 4 - Restructuring Charges” in the Notes to the unaudited Consolidated Financial Statements for additional information.
Interest Expense
Interest expense for the three months ended March 31, 20202021 was $3.2$1.9 million, a decrease of $1.0$1.3 million, compared with the three months ended March 31, 2019.2020. The decrease in interest expense was primarily due to the adoption of the Accounting Standard Update 2020-06 on January 1, 2021, which caused the Convertible Notes to no longer have a debt discount that is amortized. The remaining decrease is due to a reduction in outstanding borrowings as well as a lower overall interest rate environment.rates. Refer to “Note 10 - Financing Arrangements” in the Notes to the unaudited Consolidated Financial Statements for additional information.
Other (Income) Expense, (Income), net
|
| Three Months Ended March 31, |
| |||||||||
|
| 2020 |
|
| 2019 |
|
| $ Change |
| |||
Pension and postretirement non-service benefit loss (income) |
| $ | (6.6 | ) |
| $ | (2.8 | ) |
| $ | (3.8 | ) |
Loss from remeasurement benefit plan |
|
| 9.5 |
|
|
| — |
|
|
| 9.5 |
|
Foreign currency exchange loss (gain) |
|
| — |
|
|
| 0.1 |
|
|
| (0.1 | ) |
Miscellaneous expense (income) |
|
| (0.2 | ) |
|
| — |
|
|
| (0.2 | ) |
Total other expense (income), net |
| $ | 2.7 |
|
| $ | (2.7 | ) |
| $ | 5.4 |
|
|
| Three Months Ended March 31, |
| |||||||||
|
| 2021 |
|
| 2020 |
|
| $ Change |
| |||
Pension and postretirement non-service benefit (income) loss |
| $ | (9.6 | ) |
| $ | (6.6 | ) |
| $ | (3.0 | ) |
Loss (gain) from remeasurement benefit plan |
|
| 0.2 |
|
|
| 9.5 |
|
|
| (9.3 | ) |
Miscellaneous (income) expense |
|
| — |
|
|
| (0.2 | ) |
|
| 0.2 |
|
Total other (income) expense, net |
| $ | (9.4 | ) |
| $ | 2.7 |
|
| $ | (12.1 | ) |
Non-service benefit income is derived from the Company’srelated pension and other postretirement plans. The Company’sbenefit income, for all years, consists of the interest cost, expected return on plan assets has exceeded the interest cost component, resulting in income for the three months ended March 31, 2020 and 2019.amortization components of net periodic cost.
The TimkenSteel Corporation Retirement Plan (“Salaried PlanPlan”) has a provision that permits employees to elect to receive their pension benefits in a lump sum. In the first quarter of 2020,2021, the cumulative cost of all lump sum payments was projected to exceedexceeded the sum of the service cost and interest cost components of net periodic pension cost for the Salaried Plan. TheAs a result, the Company completed a full remeasurement of its pension obligations and plan assets associated with the Salaried Plan asduring the first quarter of March 31, 2020,2021, which resulted in a non-cash loss from remeasurement of $0.2 million. A full remeasurement of the pension obligations and plan assets
19
associated with the Salaried Plan was also required in the first quarter of 2020 resulting in a non-cash loss from remeasurement of $9.5 million.million for the three months ended March 31, 2020. For more details on the remeasurement, refer to “Note 11 - Retirement and Postretirement Plans.”Plans”.
Provision for Income Taxes
|
| Three Months Ended March 31, |
|
| Three Months Ended March 31, |
| ||||||||||||||||||
|
| 2020 |
|
| 2019 |
|
| $ Change |
|
| 2021 |
|
| 2020 |
|
| $ Change |
| ||||||
Provision (benefit) for income taxes |
| $ | 0.1 |
|
| $ | 0.1 |
|
| $ | — |
|
| $ | 0.2 |
|
| $ | 0.1 |
|
| $ | 0.1 |
|
Effective tax rate |
|
| (0.5 | )% |
|
| 1.3 | % |
| NM |
|
|
| 2.0 | % |
|
| (0.5 | )% |
| NM(1) |
| ||
(1) “NM” represents data that is not meaningful.
The majority of the Company’s income tax expense is derived from foreign operations. The Company remains in a full valuation for the U.S. jurisdiction for the three months ended March 31, 20202021 and 2019.2020.
19
NON-GAAP FINANCIAL MEASURESNon-GAAP Financial Measures
Net Sales, Excluding Surcharges
The table below presents net sales by end marketend-market sector, adjusted to exclude surcharges, which represents a financial measure that has not been determined in accordance with accounting principles generally accepted in the United States (U.S. GAAP)(“U.S. GAAP”). We believe presenting net sales by end marketend-market sector adjusted to exclude raw material surcharges provides additional insight into key drivers of net sales such as base price and product mix.
(dollars in millions, tons in thousands) | (dollars in millions, tons in thousands) |
|
|
|
|
|
|
|
|
|
|
|
|
|
|
|
|
| (dollars in millions, tons in thousands) |
|
|
|
|
|
|
|
|
|
|
|
|
|
|
|
|
| ||||
|
| Three Months Ended March 31, 2020 |
|
| Three Months Ended March 31, 2021 |
| ||||||||||||||||||||||||||||||||||
|
| Mobile |
|
| Industrial |
|
| Energy |
|
| Other |
|
| Total |
|
| Mobile |
|
| Industrial |
|
| Energy |
|
| Other |
|
| Total |
| ||||||||||
Tons |
|
| 88.8 |
|
|
| 81.2 |
|
|
| 18.4 |
|
|
| 25.0 |
|
|
| 213.4 |
|
|
| 103.5 |
|
|
| 84.4 |
|
|
| 5.5 |
|
|
| — |
|
|
| 193.4 |
|
|
|
|
|
|
|
|
|
|
|
|
|
|
|
|
|
|
|
|
|
|
|
|
|
|
|
|
|
|
|
|
|
|
|
|
|
|
|
|
|
|
Net Sales |
| $ | 97.7 |
|
| $ | 113.3 |
|
| $ | 25.2 |
|
| $ | 23.5 |
|
| $ | 259.7 |
|
| $ | 133.6 |
|
| $ | 124.7 |
|
| $ | 7.7 |
|
| $ | 7.6 |
|
| $ | 273.6 |
|
Less: Surcharges |
|
| 16.6 |
|
|
| 18.8 |
|
|
| 4.2 |
|
|
| 6.3 |
|
|
| 45.9 |
|
|
| 32.8 |
|
|
| 32.7 |
|
|
| 2.1 |
|
|
| — |
|
|
| 67.6 |
|
Base Sales |
| $ | 81.1 |
|
| $ | 94.5 |
|
| $ | 21.0 |
|
| $ | 17.2 |
|
| $ | 213.8 |
|
| $ | 100.8 |
|
| $ | 92.0 |
|
| $ | 5.6 |
|
| $ | 7.6 |
|
| $ | 206.0 |
|
|
|
|
|
|
|
|
|
|
|
|
|
|
|
|
|
|
|
|
|
|
|
|
|
|
|
|
|
|
|
|
|
|
|
|
|
|
|
|
|
|
Net Sales / Ton |
| $ | 1,100 |
|
| $ | 1,395 |
|
| $ | 1,370 |
|
| $ | 940 |
|
| $ | 1,217 |
|
| $ | 1,291 |
|
| $ | 1,477 |
|
| $ | 1,400 |
|
| $ | — |
|
| $ | 1,415 |
|
Surcharges / Ton |
| $ | 317 |
|
| $ | 387 |
|
| $ | 382 |
|
| $ | — |
|
| $ | 350 |
| ||||||||||||||||||||
Base Sales / Ton |
| $ | 913 |
|
| $ | 1,164 |
|
| $ | 1,141 |
|
| $ | 688 |
|
| $ | 1,002 |
|
| $ | 974 |
|
| $ | 1,090 |
|
| $ | 1,018 |
|
| $ | — |
|
| $ | 1,065 |
|
|
|
|
|
|
|
|
|
|
|
|
|
|
|
|
|
|
|
|
|
|
|
|
|
|
|
|
|
|
|
|
|
|
|
|
|
|
|
|
|
|
|
| Three Months Ended March 31, 2019 |
|
| Three Months Ended March 31, 2020 |
| ||||||||||||||||||||||||||||||||||
|
| Mobile |
|
| Industrial |
|
| Energy |
|
| Other |
|
| Total |
|
| Mobile |
|
| Industrial |
|
| Energy |
|
| Other |
|
| Total |
| ||||||||||
Tons |
|
| 112.8 |
|
|
| 102.5 |
|
|
| 31.4 |
|
|
| 14.2 |
|
|
| 260.9 |
|
|
| 88.8 |
|
|
| 81.2 |
|
|
| 18.4 |
|
|
| 25.0 |
|
|
| 213.4 |
|
|
|
|
|
|
|
|
|
|
|
|
|
|
|
|
|
|
|
|
|
|
|
|
|
|
|
|
|
|
|
|
|
|
|
|
|
|
|
|
|
|
Net Sales |
| $ | 144.2 |
|
| $ | 147.0 |
|
| $ | 60.8 |
|
| $ | 19.0 |
|
| $ | 371.0 |
|
| $ | 97.7 |
|
| $ | 113.3 |
|
| $ | 25.2 |
|
| $ | 23.5 |
|
| $ | 259.7 |
|
Less: Surcharges |
|
| 37.5 |
|
|
| 35.1 |
|
|
| 12.5 |
|
|
| 4.6 |
|
|
| 89.7 |
|
|
| 16.6 |
|
|
| 18.8 |
|
|
| 4.2 |
|
|
| 6.3 |
|
|
| 45.9 |
|
Base Sales |
| $ | 106.7 |
|
| $ | 111.9 |
|
| $ | 48.3 |
|
| $ | 14.4 |
|
| $ | 281.3 |
|
| $ | 81.1 |
|
| $ | 94.5 |
|
| $ | 21.0 |
|
| $ | 17.2 |
|
| $ | 213.8 |
|
|
|
|
|
|
|
|
|
|
|
|
|
|
|
|
|
|
|
|
|
|
|
|
|
|
|
|
|
|
|
|
|
|
|
|
|
|
|
|
|
|
Net Sales / Ton |
| $ | 1,278 |
|
| $ | 1,434 |
|
| $ | 1,936 |
|
| $ | 1,338 |
|
| $ | 1,422 |
|
| $ | 1,100 |
|
| $ | 1,395 |
|
| $ | 1,370 |
|
| $ | 940 |
|
| $ | 1,217 |
|
Surcharges / Ton |
| $ | 187 |
|
| $ | 231 |
|
| $ | 229 |
|
| $ | 252 |
|
| $ | 215 |
| ||||||||||||||||||||
Base Sales / Ton |
| $ | 946 |
|
| $ | 1,092 |
|
| $ | 1,538 |
|
| $ | 1,014 |
|
| $ | 1,078 |
|
| $ | 913 |
|
| $ | 1,164 |
|
| $ | 1,141 |
|
| $ | 688 |
|
| $ | 1,002 |
|
20
LIQUIDITY AND CAPITAL RESOURCESLiquidity and Capital Resources
Amended Credit Agreement
On October 15, 2019, the Company entered into a Third Amended and Restated Credit Agreement (the “Amended Credit Agreement”) with JP Morgan Chase Bank, N.A., as administrative agent, Bank of America, N.A., as syndication agent, and the other lenders party thereto, which further amended and restated the Company’s Second Amended and Restated Credit Agreement dated as of January 26, 2018.
The Amended Credit Agreement requires the Company to (i) unless certain conditions are met, maintain certain minimum liquidity as specified in the Amended Credit Agreement during the period commencing on March 1, 2021 and ending on June 1, 2021 and (ii) maintain a minimum specified fixed charge coverage ratio on a springing basis if minimum availability requirements as specified in the Amended Credit Agreement are not maintained.
The minimum liquidity required for the period commencing on March 1, 2021 and ending on June 1, 2021 is equal to the sum of (i) the aggregate outstanding principal amount of the Convertible Senior Notes due 2021 and (ii) an amount equal to 12.5% of the lesser of the borrowing base and the total capacity of $400 million. As of March 31, 2021, the total minimum liquidity requirement is $71.1 million (calculated as the sum of $40.2 million in outstanding Convertible Senior Notes due 2021 and $30.9 million, representing 12.5% of the borrowing base as of March 31, 2021). The Company is currently compliant with this minimum liquidity requirement and expects to remain compliant through June 1, 2021.
For additional details regarding the Amended Credit Agreement please refer to “Note 14 - Financing Arrangements” in the Company’s Annual Report on Form 10-K for the year ended December 31, 2020.
Convertible Notes
In May 2016, wethe Company issued $75.0 million aggregate principal amount of Convertible Senior Notes due 2021, plus an additional $11.3 million principal amount to cover over-allotments. The Convertible Senior Notes due 2021 bear cash interest at a rate of 6.0% per year, payable semiannually on June 1 and December 1, beginning on December 1, 2016. The Convertible Senior Notes due 2021 will mature on June 1, 2021, unless earlier repurchased or converted. The net proceeds received from the offering were $83.2 million, after deducting the initial underwriters’ discount and fees and paying the offering expenses. We used the net proceeds to repay a portion of the amounts outstanding under our credit agreement.
Amended Credit Agreement
On October 15, 2019,In December 2020, the Company entered into separate, privately negotiated exchange agreements with a Third Amended and Restated Credit Agreement (the Amended Credit Agreement), with JP Morgan Chase Bank, N.A., as administrative agent, Banklimited number of America, N.A., as syndication agent, and the other lenders party thereto, which further amends and restatesholders of the Company’s Second Amended and Restated Credit Agreement dated ascurrently outstanding Convertible Senior Notes due 2021. Pursuant to the exchange agreements, the Company exchanged $46.0 million aggregate principal amount of January 26, 2018.Convertible Senior Notes due 2021 for $46.0 million aggregate principal amount of its new Convertible Senior Notes due 2025. The Company did not receive any cash proceeds from the issuance of the Convertible Senior Notes due 2025.
The Amended Credit Agreement increases capacityConvertible Senior Notes due 2025 bear cash interest at a rate of 6.0% per year, payable semiannually on June 1 and December 1, beginning on June 1, 2021. The Convertible Senior Notes due 2025 will mature on December 1, 2025, unless earlier repurchased or converted. The net amount of this exchange was $44.5 million, after deducting the initial underwriters’ fees and paying other transaction costs.
For additional details regarding the Convertible Notes please refer to $400 million compared to $300 million“Note 14 - Financing Arrangements” in the previous facility and extendsCompany’s Annual Report on Form 10-K for the maturity date to October 15, 2024. Furthermore, the Amended Credit Agreement provides for an enhanced asset base with reappraised fixed assets and investment grade foreign accounts receivable collateral in the borrowing base, improves interest rate spread pricingyear ended December 31, 2020.
21
Additional Liquidity Considerations
The following represents a summary of key liquidity measures under the Amended Credit Agreement as of March 31, 20202021 and December 31, 2019:
2020:
|
| March 31, 2020 |
|
| December 31, 2019 |
|
| March 31, 2021 |
|
| December 31, 2020 |
| ||||
Cash and cash equivalents |
| $ | 65.6 |
|
| $ | 27.1 |
|
| $ | 115.7 |
|
| $ | 102.8 |
|
|
|
|
|
|
|
|
|
|
|
|
|
|
|
|
|
|
Credit Agreement: |
|
|
|
|
|
|
|
|
|
|
|
|
|
|
|
|
Maximum availability |
| $ | 400.0 |
|
| $ | 400.0 |
|
| $ | 400.0 |
|
| $ | 400.0 |
|
Suppressed availability(1) |
|
| (111.9 | ) |
|
| (103.0 | ) |
|
| (152.7 | ) |
|
| (183.2 | ) |
Availability |
|
| 288.1 |
|
|
| 297.0 |
|
|
| 247.3 |
|
|
| 216.8 |
|
Amount borrowed |
|
| (60.0 | ) |
|
| (90.0 | ) |
|
| — |
|
|
| — |
|
Letter of credit obligations |
|
| (3.7 | ) |
|
| (3.8 | ) |
|
| (5.5 | ) |
|
| (5.5 | ) |
Availability not borrowed |
|
| 224.4 |
|
|
| 203.2 |
|
| $ | 241.8 |
|
| $ | 211.3 |
|
|
|
|
|
|
|
|
|
|
|
|
|
|
|
|
|
|
Total liquidity |
| $ | 290.0 |
|
| $ | 230.3 |
|
| $ | 357.5 |
|
| $ | 314.1 |
|
(1)1) As of March 31, 20202021, and December 31, 2019,2020, TimkenSteel had less than $400 million in collateral assets to borrow against.
Our principal sources of liquidity are cash and cash equivalents, cash flows from operations and available borrowing capacity under our credit agreement. As of March 31, 2020,2021, taking into account our view of automotive,mobile, industrial, and energy market demands for our products, and our 20202021 operating and long-range plan, we believe that our cash balance as of March 31, 2020,2021, projected cash generated from operations, and borrowings available under the Amended Credit Agreement, will be sufficient to satisfy our working capital needs, capital expenditures and other liquidity requirements associated with our operations, including servicing our debt obligations, for at least the next twelve months. Regarding the Convertible Senior Notes due June 1, 2021, we plan to repay the remaining outstanding principal balance plus accrued interest upon maturity with available cash. As of March 31, 2021, the outstanding principal balance on the Convertible Senior Notes due June 1, 2021 was $40.2 million.
The full extent to which the COVID-19 pandemic will impact our operations and financial results is uncertain and ultimately will depend on, among many other factors, the duration of the pandemic, further Federal and State government actions from the Federal and State governments and the speed of economic recovery. While the negative impact on our second quarter, remainder of the year and beyond remains unknown, at a minimum, we expect customer demand in the COVID-19 environment to be sharply lower in the second quarter of 2020. To the extent our liquidity needs prove to be greater than expected or cash generated from operations is less than anticipated, and cash on hand or credit availability is insufficient, we would seek additional financing to provide additional liquidity. We regularly evaluate our potential access to the equity and debt capital markets as sources of liquidity and we believe additional financing would likely be available if necessary, although we can make no assurance as to the form or terms of any such financing. We would also consider additional cost reductions and restructuring, changes in working capital management and further reductions of capital expenditures. Regardless, we will continue to evaluate additional financing or may seek to refinance outstanding borrowings under the Amended Credit Agreement to provide us with additional flexibility and liquidity. Any additional financing beyond that incurred to refinance existing debt would increase our overall debt and could increase interest expense.
21
Table of ContentsFor additional details regarding the Amended Credit Agreement and the Convertible Notes please refer to “Note 14 - Financing Arrangements” in the Company’s Annual Report on Form 10-K for the year ended December 31, 2020.
Coronavirus Aid, Relief, and Economic Security ("CARES") Act
On March 27, 2020, the President of the United States signed the Coronavirus Aid, Relief, and Economic Security ("CARES") Act, an economic stimulus package intended to provide support, principally in the form of tax benefits and additional liquidity, to companies and individuals negatively impacted by the COVID-19 pandemic. Although the majority of the provisions included in the CARES Act willdid not immediately benefit the Company from a cash tax perspective due to its significant net operating losses, the Company has taken advantage of the deferral of the employer share (6.2% of employee wages) of Social Security payroll taxes that would otherwise have been owed from the date of enactment of the legislation through December 31, 2020, as afforded by the Act. TheAt December 31, 2020, the Company expects this to result in deferred cash paymentsapproximately $6.4 million of approximately $7 million to $10 million forpayroll taxes as permitted by the remainderCARES Act, all of 2020, towhich will be paid in two equal installments at December 31, 2021 and December 31, 2022.
For additional details regardingAdditionally, the Amended Credit Agreement and the Convertible Notes, please refer to “Note 14 - Financing Arrangements”Company is currently in the Company’s Annual Report on Form 10-Kprocess of filing for the year endedEmployee Retention Credit and accrued a benefit of approximately $2.3 million for this credit in the fourth quarter of 2020.
Consolidated Appropriations Act, 2021 (“CAA”)
On December 31, 2019.27, 2020, the President of the United States signed the Consolidated Appropriation Act, 2021 (“CAA”). The CAA includes additional COVID-19 relief that expands upon the relief provided in the CARES Act, including, but not limited to, the extension of tax deductions, credits, and incentives. The Company has evaluated the CAA for any potential impact. While it was determined that the CAA revised and extended the Employee Retention Credit into 2021, the CAA is not expected to have an impact on the Company as
22
furloughs related to the COVID-19 pandemic ceased in 2020. Furthermore, the Company does not expect any of the other provisions within the CAA to provide a benefit.
American Rescue Plan Act of 2021 (“ARPA”)
On March 11, 2021, the President of the United States signed the American Rescue Plan Act of 2021 (“ARPA”). The ARPA strengthens and extends certain programs enacted through the CARES Act and establishes new relief programs aimed at mitigating the financial impact of the COVID-19 pandemic. The Company is evaluating the provisions within the ARPA. At this time, two provisions are anticipated to impact the Company.
The first applicable provision imposes new requirements related to health coverage provided by the Consolidated Omnibus Budget Reconciliation Act (“COBRA”). Under the ARPA, employers are required to provide a 100% premium subsidy for COBRA health care continuation coverage for certain employees for the period of April 1, 2021 through September 30, 2021. The Company will be reimbursed for this additional coverage through fully refundable payroll tax credits.
The second applicable provision offers funding relief for single-employer defined benefit pension plans. Specifically, the ARPA provides enhanced interest rate stabilization, as well as extended amortization of funding shortfalls. The Company is currently evaluating the impact and timing of election options permitted by the ARPA on required contributions to our domestic defined benefit pension plans. At this time based on current assumptions and expected asset returns, pending further IRS guidance, we believe that the ARPA provisions are likely to result in a delay in the timing of required Company contributions until 2028. However, these estimates are subject to significant uncertainty.
Cash Flows
The following table reflects the major categories of cash flows for the three months ended March 31, 20202021 and 2019.2020. For additional details, please refer to the unaudited Consolidated Statements of Cash Flows included in this quarterly report.
|
| Three Months Ended March 31, |
|
| Three Months Ended March 31, |
| ||||||||||
|
| 2020 |
|
| 2019 |
|
| 2021 |
|
| 2020 |
| ||||
Net cash provided (used) by operating activities |
| $ | 63.8 |
|
| $ | (33.6 | ) |
| $ | 13.2 |
|
| $ | 63.8 |
|
Net cash provided (used) by investing activities |
|
| 4.9 |
|
|
| (4.4 | ) |
|
| (2.3 | ) |
|
| 4.9 |
|
Net cash (used) provided by financing activities |
|
| (30.2 | ) |
|
| 24.2 |
| ||||||||
(Decrease) Increase in Cash and Cash Equivalents |
| $ | 38.5 |
|
| $ | (13.8 | ) | ||||||||
Net cash provided (used) by financing activities |
|
| 2.0 |
|
|
| (30.2 | ) | ||||||||
Increase (Decrease) in Cash and Cash Equivalents |
| $ | 12.9 |
|
| $ | 38.5 |
| ||||||||
Operating activities
Net cash provided by operating activities for the three months ended March 31, 20202021 was $63.8$13.2 million compared to net cash usedprovided of $33.6$63.8 million for the three months ended March 31, 2019. 2020. The increase in cash provided by operating activities of $97.4 million was primarily due to management actions to improve working capital.
The improvement in working capital between periods was due to inventories and accounts payable, partially offset by accounts receivable. The additional cash provided by inventory was primarily driven by the Company’s inventory management program implemented late in 2019, which resulted in decreases in raw material inventory on hand, as compared to higher inventorydecrease in the first quarter of 2019. The additional cash provided by accounts payable2021 as compared to the first quarter of 2020 was primarily driven by harmonization of the Company’s payment procedures instituteddue to lower cash flows from working capital in the first quarter of 2020, as well as a lower level2021 due to increasing customer demand and production levels during the first quarter of overall purchases and a decline in scrap raw material prices in recent months2021 as compared to the prior year comparable period. The increased usebenefits of cash in accounts receivable was primarily due to higher sales in the first three months of 2020 in comparison to the last quarter of 2019, which resulted in first quarter of 2020 billings exceeding collections. In comparison, sales declined in the first three months of 2019 in comparison to the last quarter of 2018, which resulted in collections exceeding billingscost saving initiatives achieved in the first quarter of 2019. Refer to the unaudited Consolidated Statements of Cash Flows for additional information.2020.
Investing activities
Net cash providedused by investing activities for the three months ended March 31, 20202021 was $4.9$2.3 million, as compared to net cash usedprovided of $4.4$4.9 million for the three months ended March 31, 2019. Cash provided by investing activities in the first quarter of 20202020. The change was primarily relatesdue to no proceeds from salesdisposals of property, plant and equipment in conjunction with the disposition of non-core assets, as discussed in “Note 5 – Disposition of Non-Core Assets” in the Notes to the unaudited Consolidated Financial Statements, partially offset by capital investments in our manufacturing facilities. Cash used for investing activities in the first quarter of 2019 primarily relates2021 compared to capital investments in our manufacturing facilities.
Given the current economic environment, the Company reduced its capital expenditure budget by $5 million to a maximumfirst quarter of $25 million in 2020 (made up of approximately $6 million relating to growth initiatives and the remainder related to continuous improvement). The Company has no material capital expenditure plans or commitments beyond 2020 at this time.2020.
Financing activities
Net cash usedprovided by financing activities for the three months ended March 31, 20202021 was $30.2$2.0 million compared to net cash providedused by financing activities of $24.2$30.2 million for the three months ended March 31, 2019,2020. The change was primarily due to changes in borrowingsno repayments on credit agreements.agreements in the first quarter of 2021 compared to the first quarter of 2020.
CRITICAL ACCOUNTING POLICIES AND ESTIMATES23
Critical Accounting Policies and Estimates
Our financial statements are prepared in accordance with U.S. GAAP. The preparation of these financial statements requires management to make estimates and assumptions that affect the reported amounts of assets and liabilities at the date of the financial statements and the reported amounts of revenues and expenses during the periods presented. We review our critical accounting policies throughout the year.
22
New Accounting Guidance
See “Note 2 - Recent Accounting Pronouncements” in the Notes to the unaudited Consolidated Financial Statements.
FORWARD-LOOKING STATEMENTSForward-Looking Statements
Certain statements set forth in this Quarterly Report on Form 10-Q (including our forecasts, beliefs and expectations) that are not historical in nature are “forward-looking” statements within the meaning of the Private Securities Litigation Reform Act of 1995. In particular, Management’s Discussion and Analysis of Financial Condition and Results of Operations contains numerous forward-looking statements. Forward-looking statements generally will be accompanied by words such as “anticipate,” “believe,” “could,” “estimate,” “expect,” “forecast,” “outlook,” “intend,” “may,” “plan,” “possible,” “potential,” “predict,” “project,” “seek,” “should,” “target,” “will,” “would,” or other similar words, phrases or expressions that convey the uncertainty of future events or outcomes. You are cautioned not to place undue reliance on forward-looking statements, which speak only as of the date of this Form 10-Q. We caution readers that actual results may differ materially from those expressed or implied in forward-looking statements made by or on behalf of us due to a variety of factors, such as:
deterioration in world economic conditions, or in economic conditions in any of the geographic regions in which we conduct business, including additional adverse effects from global economic slowdown, terrorism or hostilities. This includes: political risks associated with the potential instability of governments and legal systems in countries in which we or our customers conduct business, and changes in currency valuations;
• | deterioration in world economic conditions, or in economic conditions in any of the geographic regions in which we conduct business, including additional adverse effects from global economic slowdown, terrorism or hostilities. This includes: political risks associated with the potential instability of governments and legal systems in countries in which we or our customers conduct business, and changes in currency valuations; |
the effects of fluctuations in customer demand on sales, product mix and prices in the industries in which we operate. This includes: our ability to respond to rapid changes in customer demand; the effects of customer bankruptcies or liquidations; the impact of changes in industrial business cycles; and whether conditions of fair trade exist in the U.S. markets;
• | the effects of fluctuations in customer demand on sales, product mix and prices in the industries in which we operate. This includes: our ability to respond to rapid changes in customer demand; the effects of customer bankruptcies or liquidations; the impact of changes in industrial business cycles; and whether conditions of fair trade exist in the U.S. markets; |
the potential impact of the COVID-19 pandemic on our operations, financial results, and liquidity;
• | the potential impact of the COVID-19 pandemic on our operations and financial results, including cash flows and liquidity; |
competitive factors, including changes in market penetration; increasing price competition by existing or new foreign and domestic competitors; the introduction of new products by existing and new competitors; and new technology that may impact the way our products are sold or distributed;
• | competitive factors, including changes in market penetration; increasing price competition by existing or new foreign and domestic competitors; the introduction of new products by existing and new competitors; and new technology that may impact the way our products are sold or distributed; |
changes in operating costs, including the effect of changes in our manufacturing processes; changes in costs associated with varying levels of operations and manufacturing capacity; availability of raw materials and energy; our ability to mitigate the impact of fluctuations in raw materials and energy costs and the effectiveness of our surcharge mechanism; changes in the expected costs associated with product warranty claims; changes resulting from inventory management, cost reduction initiatives and different levels of customer demands; the effects of unplanned work stoppages; and changes in the cost of labor and benefits;
• | changes in operating costs, including the effect of changes in our manufacturing processes; changes in costs associated with varying levels of operations and manufacturing capacity; availability of raw materials and energy; our ability to mitigate the impact of fluctuations in raw materials and energy costs and the effectiveness of our surcharge mechanism; changes in the expected costs associated with product warranty claims; changes resulting from inventory management, cost reduction initiatives and different levels of customer demands; the effects of unplanned work stoppages; and changes in the cost of labor and benefits; |
the success of our operating plans, announced programs, initiatives and capital investments; and our ability to maintain appropriate relations with unions that represent our associates in certain locations in order to avoid disruptions of business;
• | the success of our operating plans, announced programs, initiatives and capital investments; and our ability to maintain appropriate relations with unions that represent our associates in certain locations in order to avoid disruptions of business; |
unanticipated litigation, claims or assessments, including claims or problems related to intellectual property, product liability or warranty, and environmental issues and taxes, among other matters;
• | unanticipated litigation, claims or assessments, including claims or problems related to intellectual property, product liability or warranty, and environmental issues and taxes, among other matters; |
the availability of financing and interest rates, which affect our cost of funds and/or ability to raise capital; our pension obligations and investment performance; and/or customer demand and the ability of customers to obtain financing to purchase our products or equipment that contain our products; and the amount of any dividend declared by our Board of Directors on our common shares;
• | the availability of financing and interest rates, which affect our cost of funds and/or ability to raise capital, including our ability to refinance and/or repay prior to or at maturity the Convertible Notes; our pension obligations and investment performance; and/or customer demand and the ability of customers to obtain financing to purchase our products or equipment that contain our products; and the amount of any dividend declared by our Board of Directors on our common shares; |
the overall impact of the pension and postretirement mark-to-market accounting; and
• | the overall impact of the pension and postretirement mark-to-market accounting; and |
those items identified under the caption Risk Factors in our Annual Report on Form 10-K for the year ended December 31, 2019.
• | those items identified under the caption Risk Factors in our Annual Report on Form 10-K for the year ended December 31, 2020. |
You are cautioned that it is not possible to predict or identify all of the risks, uncertainties and other factors that may affect future results, and that the above list should not be considered to be a complete list. Except as required by the federal securities laws, we
24
undertake no obligation to publicly update or revise any forward-looking statement, whether as a result of new information, future events or otherwise.
ITEMItem 3. QUANTITATIVE AND QUALITATIVE DISCLOSURES ABOUT MARKET RISKQuantitative and Qualitative Disclosures About Market Risk
Interest Rate Risk
Our borrowings include both fixed and variable-rate debt. The variable debt consists principally of borrowings under our Credit Agreement. We are exposed to the risk of rising interest rates to the extent we fund our operations with these variable-rate borrowings. As of March 31, 2020,2021, we have $139.8$84.9 million of aggregate debt outstanding. None of our outstanding debt as of which $60.0 million consists of debt withMarch 31, 2021 has variable interest rates. Based on the amount of debt with variable-rate interest outstanding,rates, thus a 1% rise in interest rates would result in an increase innot impact our interest expense of $0.6 million annually.
23
at this point in time.
Foreign Currency Exchange Rate Risk
Fluctuations in the value of the U.S. dollar compared to foreign currencies may impact our earnings. Geographically, our sales are primarily made to customers in the United States. Currency fluctuations could impact us to the extent they impact the currency or the price of raw materials in foreign countries in which our competitors operate or have significant sales.
Commodity Price Risk
In the ordinary course of business, we are exposed to market risk with respect to commodity price fluctuations, primarily related to our purchases of raw materials and energy, principally scrap steel, other ferrous and non-ferrous metals, alloys, natural gas and electricity. Whenever possible, we manage our exposure to commodity risks primarily through the use of supplier pricing agreements that enable us to establish the purchase prices for certain inputs that are used in our manufacturing business. We utilize a raw material surcharge as a component of pricing steel to pass through the cost increases of scrap, alloys and other raw materials, as well as natural gas. From time to time, we may use financial instruments to hedge a portion of our exposure to commodity price risk related to natural gas and electricity purchases.risk. In periods of stable demand for our products, the surcharge mechanism has worked effectively to reduce the normal time lag in passing through higher raw material costs so that we can maintain our gross margins. When demand and cost of raw materials are lower, however, the surcharge impacts sales prices to a lesser extent.
25
Item 4. CONTROLS AND PROCEDURESControls and Procedures
(a) Disclosure Controls and Procedures
As of the end of the period covered by this quarterly report, we carried out an evaluation, under the supervision and with the participation of our management, including our principal executive officer and principal financial officer, of the effectiveness of the design and operation of our disclosure controls and procedures (as defined in Exchange Act Rule 13a-15(e)). Based upon that evaluation, the principal executive officer and principal financial officer concluded that our disclosure controls and procedures were effective as of the end of the period covered by this quarterly report.
(b) Changes in Internal Control Over Financial Reporting
During the Company’s most recent fiscal quarter, there have been no changes in the Company’s internal control over financial reporting that have materially affected, or are reasonably likely to materially affect, the Company’s internal control over financial reporting.
24
PARTPart II. OTHER INFORMATIONOther Information
ITEMItem 1. LEGAL PROCEEDINGSLegal Proceedings
We are involved in various claims and legal actions arising in the ordinary course of business. In the opinion of our management, the ultimate disposition of these matters will not have a material adverse effect on our consolidated financial position, results of operations or cash flows.
Canton, Ohio U.S. Environmental Protection Agency Notice of Violation
The U.S. Environmental Protection Agency (EPA) issued two related Notices of Violation (NOV) to TimkenSteel on August 5, 2014 and November 2, 2015. The EPA alleges violations under the Clean Air Act based on alleged violations of permitted emission limits and engineering requirements at TimkenSteel’s Faircrest and Harrison Steel Plants in Canton, Ohio. TimkenSteel disputes many of EPA’s allegations but is working cooperatively with EPA and the U.S. Department of Justice to resolve the government’s claims. Negotiations to resolve the NOVs are ongoing, and it is not anticipated that the ultimate resolution of the NOVs will have a material adverse effect on our consolidated financial position, results of operations or cash flows.
ITEMItem 1A. RISK FACTORSRisk Factors
We are subject to various risks and uncertainties in the course of our business. The discussion of such risks and uncertainties may be found under Risk Factors in our Annual Report on Form 10-K for the year ended December 31, 20192020 filed with the SEC.
Risks Related to COVID-1926
The COVID-19 pandemic could have a material, adverse impact on our operations and financial results including cash flows and liquidity.
We continue to closely monitor the impact of the COVID-19 pandemic on our Company, customers, employees and supply chain. The full extent to which the COVID-19 pandemic will impact our operations and financial results is uncertain and ultimately will depend on, among many other factors, the duration of the pandemic, further Federal and State government actions and the speed of economic recovery. The negative impact on our second quarter, remainder of the year and beyond remains unknown.
The effects of the COVID-19 pandemic also may impact other risk factors previously disclosed in Item 1A. Risk Factors in the Company’s Annual Report on Form 10-K for the fiscal year ended December 31, 2019. This impact could be to cause previously disclosed risks to occur or to increase the severity of the negative affect inherent in those other risk factors.
25
Exhibit Number |
| Exhibit Description |
|
|
|
10.1* |
| Form of Performance-Based Restricted |
10.2* | ||
31.1* |
| |
|
|
|
31.2* |
| |
|
|
|
32.1** |
| |
101.INS* |
| Inline XBRL Instance Document. |
|
|
|
101.SCH* |
| Inline XBRL Taxonomy Extension Schema Document. |
|
|
|
101.PRE* |
| Inline XBRL Taxonomy Extension Presentation Linkbase Document. |
|
|
|
101.CAL* |
| Inline XBRL Taxonomy Extension Calculation Linkbase Document. |
|
|
|
101.LAB* |
| Inline XBRL Taxonomy Extension Label Linkbase Document. |
|
|
|
101.DEF* |
| Inline XBRL Taxonomy Extension Definition Linkbase Document. |
104 | Cover Page Interactive Data File (formatted as Inline XBRL and contained in Exhibit 101). |
* | Filed herewith. |
** | Furnished herewith. |
2627
Signatures
Pursuant to the requirements of the Securities Exchange Act of 1934, the registrant has duly caused this report to be signed on its behalf by the undersigned thereunto duly authorized.
|
| TIMKENSTEEL CORPORATION |
|
|
|
|
|
|
Date: | May | /s/Kristopher R. Westbrooks |
|
| Kristopher R. Westbrooks Executive Vice President and Chief Financial Officer (Principal Financial Officer) |
2728