UNITED STATES
SECURITIES AND EXCHANGE COMMISSION
WASHINGTON, D.C. 20549
FORM 10-Q
☒ | QUARTERLY REPORT PURSUANT TO SECTION 13 OR 15(d) OF THE SECURITIES EXCHANGE ACT OF 1934 |
For the quarterly period ended September 30, 20202021
☐ | TRANSITION REPORT PURSUANT TO SECTION 13 OR 15(d) OF THE SECURITIES EXCHANGE ACT OF 1934 |
For the transition period from to .
Commission file number: 1-6615
SUPERIOR INDUSTRIES INTERNATIONAL, INC.
(Exact Name of Registrant as Specified in Its Charter)
Delaware | 95-2594729 |
(State or Other Jurisdiction of Incorporation or Organization) | (I.R.S. Employer Identification No.) |
|
|
26600 Telegraph Road, Suite 400 |
|
Southfield, Michigan | 48033 |
(Address of Principal Executive Offices) | (Zip Code) |
Registrant’s Telephone Number, Including Area Code: (248) 352-7300
Securities registered pursuant to Section 12(b) of the Act:
|
|
|
|
|
Title of Each Class |
| Trading Symbol |
| Name of Each Exchange on Which Registered |
Common Stock, $0.01 par value |
| SUP |
| New York Stock Exchange |
Indicate by check mark whether the registrant: (1) has filed all reports required to be filed by Section 13 or 15(d) of the Securities Exchange Act of 1934 during the preceding 12 months (or for such shorter period that the registrant was required to file such reports), and (2) has been subject to such filing requirements for the past 90 days. Yes ☒ No ☐
Indicate by check mark whether the registrant has submitted electronically every Interactive Data File required to be submitted pursuant to Rule 405 of Regulation S-T (§232.405 of this chapter) during the preceding 12 months (or for such shorter period that the registrant was required to submit such files). Yes ☒ No ☐
Indicate by check mark whether the registrant is a large accelerated filer, an accelerated filer, a non-accelerated filer, a smaller reporting company, or an emerging growth company. See the definitions of “large accelerated filer,” “accelerated filer,” “smaller reporting company” and “emerging growth company” in Rule 12b-2 of the Exchange Act.
Large Accelerated Filer | ☐ | Accelerated Filer |
|
Non-Accelerated Filer |
| Smaller Reporting Company | ☒ |
|
| Emerging Growth Company | ☐ |
If an emerging growth company, indicate by check mark if the registrant has elected not to use the extended transition period for complying with any new or revised financial accounting standards provided pursuant to Section 13(a) of the Exchange Act. ☐
Indicate by check mark whether the registrant is a shell company (as defined in Rule 12b-2 of the Exchange Act). Yes ☐ No ☒
Number of shares of common stock outstanding as of October 26, 2020: 25,591,930��28, 2021: 26,163,077
TABLE OF CONTENTS
|
|
|
|
| Page |
PART I | - |
| |||
|
|
|
|
|
|
|
| Item 1 |
|
| |
|
|
|
|
|
|
|
|
|
| 1 | |
|
|
|
|
|
|
|
|
|
| Condensed Consolidated Statements of Comprehensive Income (Loss) | 2 |
|
|
|
|
|
|
|
|
|
| 3 | |
|
|
|
|
|
|
|
|
|
| 4 | |
|
|
|
|
|
|
|
|
|
| Condensed Consolidated Statements of Shareholders’ Equity (Deficit) | 5 |
|
|
|
|
|
|
|
|
|
| 7 | |
|
|
|
|
|
|
|
| Item 2 | - | Management’s Discussion and Analysis of Financial Condition and Results of Operations |
|
|
|
|
|
|
|
|
| Item 3 | - |
| |
|
|
|
|
|
|
|
| Item 4 | - |
| |
|
|
|
| ||
PART II | - |
| |||
|
|
|
|
|
|
|
| Item 1 | - |
| |
|
|
|
|
|
|
|
| Item 1A | - |
| |
|
|
|
|
|
|
|
| Item 2 | - |
| |
|
|
|
|
|
|
|
| Item 5 | - |
| |
|
|
|
|
|
|
|
| Item 6 | - |
| |
|
|
|
| ||
|
|
| |||
PART I
FINANCIAL INFORMATION
Item 1. Financial Statements
SUPERIOR INDUSTRIES INTERNATIONAL, INC.
CONDENSED CONSOLIDATED STATEMENTS OF INCOME (LOSS)
(Dollars in thousands, except per share data)amounts)
(Unaudited)
|
| Three Months Ended |
|
| Nine Months Ended |
|
| Three Months Ended |
|
| Nine Months Ended |
| ||||||||||||||||||||
|
| September 30, 2020 |
|
| September 30, 2019 |
|
| September 30, 2020 |
|
| September 30, 2019 |
|
| September 30, 2021 |
|
| September 30, 2020 |
|
| September 30, 2021 |
|
| September 30, 2020 |
| ||||||||
NET SALES |
| $ | 317,103 |
|
| $ | 352,014 |
|
| $ | 763,050 |
|
| $ | 1,062,206 |
|
| $ | 310,780 |
|
| $ | 317,103 |
|
| $ | 1,016,440 |
|
| $ | 763,050 |
|
Cost of sales |
|
| 285,135 |
|
|
| 335,967 |
|
|
| 730,762 |
|
|
| 973,042 |
|
|
| 292,637 |
|
|
| 285,135 |
|
|
| 922,637 |
|
|
| 730,762 |
|
GROSS PROFIT |
|
| 31,968 |
|
|
| 16,047 |
|
|
| 32,288 |
|
|
| 89,164 |
|
|
| 18,143 |
|
|
| 31,968 |
|
|
| 93,803 |
|
|
| 32,288 |
|
Selling, general and administrative expenses |
|
| 12,730 |
|
|
| 16,290 |
|
|
| 36,541 |
|
|
| 46,737 |
|
|
| 10,769 |
|
|
| 12,730 |
|
|
| 45,190 |
|
|
| 36,541 |
|
Impairment of goodwill and indefinite-lived intangibles |
|
| — |
|
|
| — |
|
|
| 193,641 |
|
|
| — |
|
|
| — |
|
|
| — |
|
|
| — |
|
|
| 193,641 |
|
INCOME (LOSS) FROM OPERATIONS |
|
| 19,238 |
|
|
| (243 | ) |
|
| (197,894 | ) |
|
| 42,427 |
|
|
| 7,374 |
|
|
| 19,238 |
|
|
| 48,613 |
|
|
| (197,894 | ) |
Interest expense, net |
|
| (10,414 | ) |
|
| (11,807 | ) |
|
| (34,448 | ) |
|
| (35,532 | ) |
|
| (10,619 | ) |
|
| (10,414 | ) |
|
| (31,378 | ) |
|
| (34,448 | ) |
Other (expense) income, net |
|
| (1,576 | ) |
|
| 634 |
|
|
| (923 | ) |
|
| 3,393 |
| ||||||||||||||||
INCOME (LOSS) BEFORE INCOME TAXES |
|
| 7,248 |
|
|
| (11,416 | ) |
|
| (233,265 | ) |
|
| 10,288 |
| ||||||||||||||||
Income tax benefit (provision) |
|
| 3,898 |
|
|
| 4,785 |
|
|
| 11,111 |
|
|
| (7,699 | ) | ||||||||||||||||
NET INCOME (LOSS) |
| $ | 11,146 |
|
| $ | (6,631 | ) |
| $ | (222,154 | ) |
| $ | 2,589 |
| ||||||||||||||||
EARNINGS (LOSS) PER SHARE – BASIC |
| $ | 0.12 |
|
| $ | (0.57 | ) |
| $ | (9.66 | ) |
| $ | (0.84 | ) | ||||||||||||||||
EARNINGS (LOSS) PER SHARE – DILUTED |
| $ | 0.12 |
|
| $ | (0.57 | ) |
| $ | (9.66 | ) |
| $ | (0.84 | ) | ||||||||||||||||
Other expense, net |
|
| (2,094 | ) |
|
| (1,576 | ) |
|
| (6,028 | ) |
|
| (923 | ) | ||||||||||||||||
(LOSS) INCOME BEFORE INCOME TAXES |
|
| (5,339 | ) |
|
| 7,248 |
|
|
| 11,207 |
|
|
| (233,265 | ) | ||||||||||||||||
Income tax (provision) benefit |
|
| (1,841 | ) |
|
| 3,898 |
|
|
| (3,570 | ) |
|
| 11,111 |
| ||||||||||||||||
NET (LOSS) INCOME |
| $ | (7,180 | ) |
| $ | 11,146 |
|
| $ | 7,637 |
|
| $ | (222,154 | ) | ||||||||||||||||
(LOSS) EARNINGS PER SHARE – BASIC |
| $ | (0.61 | ) |
| $ | 0.12 |
|
| $ | (0.69 | ) |
| $ | (9.66 | ) | ||||||||||||||||
(LOSS) EARNINGS PER SHARE – DILUTED |
| $ | (0.61 | ) |
| $ | 0.12 |
|
| $ | (0.69 | ) |
| $ | (9.66 | ) | ||||||||||||||||
The accompanying unaudited notes are an integral part of these condensed consolidated financial statements.
SUPERIOR INDUSTRIES INTERNATIONAL, INC.
CONDENSED CONSOLIDATED STATEMENTS OF COMPREHENSIVE INCOME (LOSS)
(Dollars in thousands)
(Unaudited)
|
| Three Months Ended |
|
| Nine Months Ended |
| ||||||||||
|
| September 30, 2020 |
|
| September 30, 2019 |
|
| September 30, 2020 |
|
| September 30, 2019 |
| ||||
Net income (loss) |
| $ | 11,146 |
|
| $ | (6,631 | ) |
| $ | (222,154 | ) |
| $ | 2,589 |
|
Other comprehensive income (loss), net of tax: |
|
|
|
|
|
|
|
|
|
|
|
|
|
|
|
|
Foreign currency translation gain (loss) |
|
| 16,384 |
|
|
| (22,143 | ) |
|
| (9,706 | ) |
|
| (21,459 | ) |
Change in unrecognized gains (losses) on derivative instruments: |
|
|
|
|
|
|
|
|
|
|
|
|
|
|
|
|
Change in fair value of derivatives |
|
| 5,818 |
|
|
| (10,406 | ) |
|
| (32,934 | ) |
|
| (1,862 | ) |
Tax (provision) benefit |
|
| (1,135 | ) |
|
| 2,104 |
|
|
| 7,618 |
|
|
| 342 |
|
Change in unrecognized gains (losses) on derivative instruments, net of tax |
|
| 4,683 |
|
|
| (8,302 | ) |
|
| (25,316 | ) |
|
| (1,520 | ) |
Defined benefit pension plan: |
|
|
|
|
|
|
|
|
|
|
|
|
|
|
|
|
Amortization of actuarial losses on pension obligations |
|
| 72 |
|
|
| 50 |
|
|
| 216 |
|
|
| 155 |
|
Tax (provision) |
|
| (15 | ) |
|
| (11 | ) |
|
| (45 | ) |
|
| (33 | ) |
Pension changes, net of tax |
|
| 57 |
|
|
| 39 |
|
|
| 171 |
|
|
| 122 |
|
Other comprehensive income (loss), net of tax |
|
| 21,124 |
|
|
| (30,406 | ) |
|
| (34,851 | ) |
|
| (22,857 | ) |
Comprehensive income (loss) |
| $ | 32,270 |
|
| $ | (37,037 | ) |
| $ | (257,005 | ) |
| $ | (20,268 | ) |
|
| Three Months Ended |
|
| Nine Months Ended |
| ||||||||||
|
| September 30, 2021 |
|
| September 30, 2020 |
|
| September 30, 2021 |
|
| September 30, 2020 |
| ||||
Net (loss) income |
| $ | (7,180 | ) |
| $ | 11,146 |
|
| $ | 7,637 |
|
| $ | (222,154 | ) |
Other comprehensive (loss) income, net of tax: |
|
|
|
|
|
|
|
|
|
|
|
|
|
|
|
|
Foreign currency translation (loss) gain |
|
| (9,068 | ) |
|
| 16,384 |
|
|
| (16,336 | ) |
|
| (9,706 | ) |
Change in unrecognized (losses) gains on derivative instruments: |
|
|
|
|
|
|
|
|
|
|
|
|
|
|
|
|
Change in fair value of derivatives |
|
| (7,735 | ) |
|
| 5,818 |
|
|
| 290 |
|
|
| (32,934 | ) |
Tax benefit (provision) |
|
| 851 |
|
|
| (1,135 | ) |
|
| (189 | ) |
|
| 7,618 |
|
Change in unrecognized (losses) gains on derivative instruments, net of tax |
|
| (6,884 | ) |
|
| 4,683 |
|
|
| 101 |
|
|
| (25,316 | ) |
Defined benefit pension plan: |
|
|
|
|
|
|
|
|
|
|
|
|
|
|
|
|
Amortization of actuarial losses on pension obligations |
|
| 96 |
|
|
| 72 |
|
|
| 290 |
|
|
| 216 |
|
Tax provision |
|
| — |
|
|
| (15 | ) |
|
| — |
|
|
| (45 | ) |
Pension changes, net of tax |
|
| 96 |
|
|
| 57 |
|
|
| 290 |
|
|
| 171 |
|
Other comprehensive (loss) income, net of tax |
|
| (15,856 | ) |
|
| 21,124 |
|
|
| (15,945 | ) |
|
| (34,851 | ) |
Comprehensive (loss) income |
| $ | (23,036 | ) |
| $ | 32,270 |
|
| $ | (8,308 | ) |
| $ | (257,005 | ) |
The accompanying unaudited notes are an integral part of these condensed consolidated financial statements.
SUPERIOR INDUSTRIES INTERNATIONAL, INC.
CONDENSED CONSOLIDATED BALANCE SHEETS
(Dollars in thousands)
(Unaudited)
|
| September 30, 2020 |
|
| December 31, 2019 |
|
| September 30, 2021 |
|
| December 31, 2020 |
| ||||
ASSETS |
|
|
|
|
|
|
|
|
|
|
|
|
|
|
|
|
Current assets: |
|
|
|
|
|
|
|
|
|
|
|
|
|
|
|
|
Cash and cash equivalents |
| $ | 111,131 |
|
| $ | 77,927 |
|
| $ | 76,117 |
|
| $ | 152,423 |
|
Accounts receivable, net |
|
| 77,675 |
|
|
| 76,786 |
|
|
| 94,167 |
|
|
| 48,995 |
|
Inventories, net |
|
| 141,287 |
|
|
| 168,470 |
|
|
| 214,972 |
|
|
| 154,980 |
|
Income taxes receivable |
|
| 4,067 |
|
|
| 4,630 |
|
|
| 4,689 |
|
|
| 4,957 |
|
Other current assets |
|
| 16,329 |
|
|
| 26,375 |
|
|
| 32,520 |
|
|
| 22,301 |
|
Total current assets |
|
| 350,489 |
|
|
| 354,188 |
|
|
| 422,465 |
|
|
| 383,656 |
|
Property, plant and equipment, net |
|
| 507,037 |
|
|
| 529,282 |
|
|
| 501,772 |
|
|
| 522,124 |
|
Deferred income tax assets, net |
|
| 53,307 |
|
|
| 38,607 |
|
|
| 28,020 |
|
|
| 30,860 |
|
Goodwill |
|
| — |
|
|
| 184,832 |
|
|
| — |
|
|
| — |
|
Intangibles, net |
|
| 112,341 |
|
|
| 137,078 |
|
|
| 85,177 |
|
|
| 110,796 |
|
Other non-current assets |
|
| 55,837 |
|
|
| 67,880 |
|
|
| 54,834 |
|
|
| 61,889 |
|
Total assets |
| $ | 1,079,011 |
|
| $ | 1,311,867 |
|
| $ | 1,092,268 |
|
| $ | 1,109,325 |
|
LIABILITIES, MEZZANINE EQUITY AND SHAREHOLDERS’ EQUITY (DEFICIT) |
|
|
|
|
|
|
|
|
|
|
|
|
|
|
|
|
Current liabilities: |
|
|
|
|
|
|
|
|
|
|
|
|
|
|
|
|
Accounts payable |
| $ | 149,808 |
|
| $ | 123,112 |
|
| $ | 162,936 |
|
| $ | 151,839 |
|
Short-term debt |
|
| 6,034 |
|
|
| 4,010 |
|
|
| 6,297 |
|
|
| 6,112 |
|
Accrued expenses |
|
| 72,857 |
|
|
| 60,845 |
|
|
| 76,573 |
|
|
| 71,079 |
|
Income taxes payable |
|
| 2,208 |
|
|
| 3,148 |
|
|
| 1,380 |
|
|
| 2,107 |
|
Total current liabilities |
|
| 230,907 |
|
|
| 191,115 |
|
|
| 247,186 |
|
|
| 231,137 |
|
Long-term debt (less current portion) |
|
| 611,706 |
|
|
| 611,025 |
|
|
| 609,445 |
|
|
| 625,492 |
|
Non-current income tax liabilities |
|
| 7,451 |
|
|
| 6,523 |
|
|
| 7,928 |
|
|
| 7,635 |
|
Deferred income tax liabilities, net |
|
| — |
|
|
| 12,369 |
|
|
| 3,243 |
|
|
| 9,104 |
|
Other non-current liabilities |
|
| 81,321 |
|
|
| 71,640 |
|
|
| 78,257 |
|
|
| 76,426 |
|
Commitments and contingent liabilities (Note 17) |
|
| — |
|
|
| — |
|
|
|
|
|
|
|
|
|
Mezzanine equity: |
|
|
|
|
|
|
|
|
|
|
|
|
|
|
|
|
Preferred stock, $0.01 par value |
|
|
|
|
|
|
|
|
|
|
|
|
|
|
|
|
Authorized - 1,000,000 shares |
|
|
|
|
|
|
|
|
|
|
|
|
|
|
|
|
Issued and outstanding – 150,000 shares outstanding at September 30, 2020 and December 31, 2019 |
|
| 174,597 |
|
|
| 160,980 |
| ||||||||
Issued and outstanding – 150,000 shares outstanding at September 30, 2021 and December 31, 2020 |
|
| 194,560 |
|
|
| 179,387 |
| ||||||||
European non-controlling redeemable equity |
|
| 1,580 |
|
|
| 6,525 |
|
|
| 1,552 |
|
|
| 1,666 |
|
Shareholders’ equity (deficit): |
|
|
|
|
|
|
|
|
|
|
|
|
|
|
|
|
Common stock, $0.01 par value |
|
|
|
|
|
|
|
|
|
|
|
|
|
|
|
|
Authorized - 100,000,000 shares |
|
|
|
|
|
|
|
|
|
|
|
|
|
|
|
|
Issued and outstanding – 25,591,930 and 25,128,158 shares at September 30, 2020 and December 31, 2019 |
|
| 94,058 |
|
|
| 93,331 |
| ||||||||
Issued and outstanding – 26,148,797 and 25,591,930 shares at September 30, 2021 and December 31, 2020 |
|
| 100,618 |
|
|
| 95,247 |
| ||||||||
Accumulated other comprehensive loss |
|
| (134,929 | ) |
|
| (100,078 | ) |
|
| (115,391 | ) |
|
| (99,446 | ) |
Retained earnings |
|
| 12,320 |
|
|
| 258,437 |
|
|
| (35,130 | ) |
|
| (17,323 | ) |
Total shareholders’ equity (deficit) |
|
| (28,551 | ) |
|
| 251,690 |
|
|
| (49,903 | ) |
|
| (21,522 | ) |
Total liabilities, mezzanine equity and shareholders’ equity (deficit) |
| $ | 1,079,011 |
|
| $ | 1,311,867 |
|
| $ | 1,092,268 |
|
| $ | 1,109,325 |
|
The accompanying unaudited notes are an integral part of these condensed consolidated financial statements.
SUPERIOR INDUSTRIES INTERNATIONAL, INC.
CONDENSED CONSOLIDATED STATEMENTS OF CASH FLOWS
(Dollars in thousands)
(Unaudited)
|
| Nine Months Ended |
|
| Nine Months Ended |
| ||||||||||
|
| September 30, 2020 |
|
| September 30, 2019 |
|
| September 30, 2021 |
|
| September 30, 2020 |
| ||||
CASH FLOWS FROM OPERATING ACTIVITIES: |
|
|
|
|
|
|
|
|
|
|
|
|
|
|
|
|
Net (loss) income |
| $ | (222,154 | ) |
| $ | 2,589 |
| ||||||||
Adjustments to reconcile net (loss) income to net cash provided by operating activities: |
|
|
|
|
|
|
|
| ||||||||
Net income (loss) |
|
| 7,637 |
|
| $ | (222,154 | ) | ||||||||
Adjustments to reconcile net loss to net cash provided by operating activities: |
|
|
|
|
|
|
|
| ||||||||
Depreciation and amortization |
|
| 73,134 |
|
|
| 77,500 |
|
|
| 75,446 |
|
|
| 73,134 |
|
Income tax, non-cash changes |
|
| (19,389 | ) |
|
| (3,472 | ) |
|
| (4,198 | ) |
|
| (19,389 | ) |
Impairment of goodwill and indefinite-lived intangibles |
|
| 193,641 |
|
|
| — |
|
|
| - |
|
|
| 193,641 |
|
Stock-based compensation |
|
| 727 |
|
|
| 3,695 |
|
|
| 6,844 |
|
|
| 727 |
|
Amortization of debt issuance costs |
|
| 3,140 |
|
|
| 3,681 |
|
|
| 3,195 |
|
|
| 3,140 |
|
Other non-cash items |
|
| (1,493 | ) |
|
| 444 |
|
|
| (10,710 | ) |
|
| (1,493 | ) |
Changes in operating assets and liabilities: |
|
|
|
|
|
|
|
|
|
|
|
|
|
|
|
|
Accounts receivable |
|
| (4,062 | ) |
|
| (30,464 | ) |
|
| (47,899 | ) |
|
| (4,062 | ) |
Inventories |
|
| 29,292 |
|
|
| 9,028 |
|
|
| (66,513 | ) |
|
| 29,292 |
|
Other assets and liabilities |
|
| 11,520 |
|
|
| 20,313 |
|
|
| 14,538 |
|
|
| 11,520 |
|
Accounts payable |
|
| 27,438 |
|
|
| 11,176 |
|
|
| 7,181 |
|
|
| 27,438 |
|
Income taxes |
|
| 717 |
|
|
| 7,861 |
|
|
| (99 | ) |
|
| 717 |
|
NET CASH PROVIDED BY OPERATING ACTIVITIES |
|
| 92,511 |
|
|
| 102,351 |
| ||||||||
NET CASH (USED IN) PROVIDED BY OPERATING ACTIVITIES |
|
| (14,578 | ) |
|
| 92,511 |
| ||||||||
CASH FLOWS FROM INVESTING ACTIVITIES: |
|
|
|
|
|
|
|
|
|
|
|
|
|
|
|
|
Additions to property, plant and equipment |
|
| (33,592 | ) |
|
| (47,584 | ) | ||||||||
Additions to property, plant, and equipment |
|
| (47,571 | ) |
|
| (33,592 | ) | ||||||||
Proceeds from sale of fixed assets |
|
| 859 |
|
|
| — |
|
|
| 6,589 |
|
|
| 859 |
|
Other investing activities |
|
| — |
|
|
| 9,631 |
| ||||||||
NET CASH USED IN INVESTING ACTIVITIES |
|
| (32,733 | ) |
|
| (37,953 | ) |
|
| (40,982 | ) |
|
| (32,733 | ) |
CASH FLOWS FROM FINANCING ACTIVITIES: |
|
|
|
|
|
|
|
|
|
|
|
|
|
|
|
|
Proceeds from issuance of long-term debt |
|
| 11,690 |
|
|
| — |
|
|
| 1,658 |
|
|
| 11,690 |
|
Repayments of debt |
|
| (24,851 | ) |
|
| (35,015 | ) |
|
| (3,569 | ) |
|
| (24,851 | ) |
Cash dividends paid |
|
| (10,161 | ) |
|
| (19,171 | ) | ||||||||
Purchase of non-controlling redeemable shares |
|
| (4,981 | ) |
|
| (3,888 | ) | ||||||||
Payments related to tax withholdings for stock-based compensation |
|
| — |
|
|
| (108 | ) | ||||||||
Proceeds from borrowings on revolving credit facility |
|
| 313,825 |
|
|
| 69,600 |
|
|
| - |
|
|
| 313,825 |
|
Repayments of borrowings on revolving credit facility |
|
| (316,910 | ) |
|
| (69,600 | ) |
|
| - |
|
|
| (316,910 | ) |
Other financing activities |
|
| (723 | ) |
|
| (1,035 | ) | ||||||||
Cash dividends paid |
|
| (10,140 | ) |
|
| (10,161 | ) | ||||||||
Financing costs paid and other |
|
| (4,339 | ) |
|
| (4,981 | ) | ||||||||
Payments related to tax withholdings for stock-based compensation |
|
| (1,473 | ) |
|
| — |
| ||||||||
Finance lease payments |
|
| (1,012 | ) |
|
| (723 | ) | ||||||||
NET CASH USED IN FINANCING ACTIVITIES |
|
| (32,111 | ) |
|
| (59,217 | ) |
|
| (18,875 | ) |
|
| (32,111 | ) |
Effect of exchange rate changes on cash |
|
| 5,537 |
|
|
| (3,337 | ) |
|
| (1,871 | ) |
|
| 5,537 |
|
Net increase in cash and cash equivalents |
|
| 33,204 |
|
|
| 1,844 |
| ||||||||
Net (decrease) increase in cash and cash equivalents |
|
| (76,306 | ) |
|
| 33,204 |
| ||||||||
Cash and cash equivalents at the beginning of the period |
|
| 77,927 |
|
|
| 47,464 |
|
|
| 152,423 |
|
|
| 77,927 |
|
Cash and cash equivalents at the end of the period |
| $ | 111,131 |
|
| $ | 49,308 |
|
|
| 76,117 |
|
| $ | 111,131 |
|
The accompanying unaudited notes are an integral part of these condensed consolidated financial statements.
SUPERIOR INDUSTRIES INTERNATIONAL, INC.
CONDENSED CONSOLIDATED STATEMENTS OF SHAREHOLDERS’ EQUITY (DEFICIT)
(Dollars in thousands)
For the nine months ended September 30, 2019(Unaudited)
(Unaudited) |
| Common Stock |
|
| Accumulated Other Comprehensive (Loss) Income |
|
|
|
|
|
|
|
|
|
| ||||||||||||||
|
| Number of Shares |
|
| Amount |
|
| Unrecognized Gains (Losses) on Derivative Instruments |
|
| Pension Obligations |
|
| Cumulative Translation Adjustment |
|
| Retained Earnings |
|
| Total |
|
| |||||||
BALANCE AT DECEMBER 31, 2018 |
|
| 25,019,237 |
|
| $ | 87,723 |
|
| $ | (3,205 | ) |
| $ | (3,000 | ) |
| $ | (99,290 | ) |
| $ | 391,037 |
|
| $ | 373,265 |
|
|
Net income |
|
| — |
|
|
| — |
|
|
| — |
|
|
| — |
|
|
| — |
|
|
| 2,589 |
|
|
| 2,589 |
|
|
Change in unrecognized gains/losses on derivative instruments, net of tax |
|
| — |
|
|
| — |
|
|
| (1,520 | ) |
|
| — |
|
|
| — |
|
|
| — |
|
|
| (1,520 | ) |
|
Change in employee benefit plans, net of taxes |
|
| — |
|
|
| — |
|
|
| — |
|
|
| 122 |
|
|
| — |
|
|
| — |
|
|
| 122 |
|
|
Net foreign currency translation adjustment |
|
| — |
|
|
| — |
|
|
| — |
|
|
| — |
|
|
| (21,459 | ) |
|
| — |
|
|
| (21,459 | ) |
|
Common stock issued, net of shares withheld for employee taxes |
|
| 108,921 |
|
|
| — |
|
|
| — |
|
|
| — |
|
|
| — |
|
|
| — |
|
|
| — |
|
|
Stock-based compensation |
|
| — |
|
|
| 3,587 |
|
|
| — |
|
|
| — |
|
|
| — |
|
|
| — |
|
|
| 3,587 |
|
|
Cash dividend declared ($0.09 per common share) |
|
| — |
|
|
| — |
|
|
| — |
|
|
| — |
|
|
| — |
|
|
| (4,597 | ) |
|
| (4,597 | ) |
|
Redeemable preferred 9% dividend, participating dividend and accretion |
|
| — |
|
|
| — |
|
|
| — |
|
|
| — |
|
|
| — |
|
|
| (23,275 | ) |
|
| (23,275 | ) |
|
European non-controlling redeemable equity dividend |
|
| — |
|
|
| — |
|
|
| — |
|
|
| — |
|
|
| — |
|
|
| (496 | ) |
|
| (496 | ) |
|
BALANCE AT SEPTEMBER 30, 2019 |
|
| 25,128,158 |
|
| $ | 91,310 |
|
| $ | (4,725 | ) |
| $ | (2,878 | ) |
| $ | (120,749 | ) |
| $ | 365,258 |
|
| $ | 328,216 |
|
|
|
|
|
|
|
|
|
|
|
|
|
|
|
|
|
|
|
|
|
|
|
|
|
|
|
|
|
|
|
|
For the three months ended September 30, 2019 |
|
|
|
|
|
|
|
|
|
|
|
|
|
|
|
|
|
|
|
|
|
|
|
|
|
| |||
|
|
|
|
|
|
|
|
|
|
|
|
|
|
|
|
|
|
|
|
|
|
|
|
|
|
|
|
|
|
(Unaudited) |
| Common Stock |
|
| Accumulated Other Comprehensive (Loss) Income |
|
|
|
|
|
|
|
|
|
| ||||||||||||||
|
| Number of Shares |
|
| Amount |
|
| Unrecognized Gains (Losses) on Derivative Instruments |
|
| Pension Obligations |
|
| Cumulative Translation Adjustment |
|
| Retained Earnings |
|
| Total |
|
| |||||||
BALANCE AT JUNE 30, 2019 |
|
| 25,114,598 |
|
| $ | 89,532 |
|
| $ | 3,577 |
|
| $ | (2,917 | ) |
| $ | (98,606 | ) |
| $ | 379,604 |
|
| $ | 371,190 |
|
|
Net loss |
|
| — |
|
|
| — |
|
|
| — |
|
|
| — |
|
|
| — |
|
|
| (6,631 | ) |
|
| (6,631 | ) |
|
Change in unrecognized gains/losses on derivative instruments, net of tax |
|
| — |
|
|
| — |
|
|
| (8,302 | ) |
|
| — |
|
|
| — |
|
|
| — |
|
|
| (8,302 | ) |
|
Change in employee benefit plans, net of taxes |
|
| — |
|
|
| — |
|
|
| — |
|
|
| 39 |
|
|
| — |
|
|
| — |
|
|
| 39 |
|
|
Net foreign currency translation adjustment |
|
| — |
|
|
| — |
|
|
| — |
|
|
| — |
|
|
| (22,143 | ) |
|
| — |
|
|
| (22,143 | ) |
|
Common stock issued, net of shares withheld for employee taxes |
|
| 13,560 |
|
|
| — |
|
|
| — |
|
|
| — |
|
|
| — |
|
|
| — |
|
|
| — |
|
|
Stock-based compensation |
|
| — |
|
|
| 1,778 |
|
|
| — |
|
|
| — |
|
|
| — |
|
|
| — |
|
|
| 1,778 |
|
|
Cash dividend declared ($0.09 per common share) |
|
| — |
|
|
| — |
|
|
| — |
|
|
| — |
|
|
| — |
|
|
| (15 | ) |
|
| (15 | ) |
|
Redeemable preferred 9% dividend and accretion |
|
| — |
|
|
| — |
|
|
| — |
|
|
| — |
|
|
| — |
|
|
| (7,587 | ) |
|
| (7,587 | ) |
|
European non-controlling redeemable equity dividend |
|
| — |
|
|
| — |
|
|
| — |
|
|
| — |
|
|
| — |
|
|
| (113 | ) |
|
| (113 | ) |
|
BALANCE AT SEPTEMBER 30, 2019 |
|
| 25,128,158 |
|
| $ | 91,310 |
|
| $ | (4,725 | ) |
| $ | (2,878 | ) |
| $ | (120,749 | ) |
| $ | 365,258 |
|
| $ | 328,216 |
|
|
For the nine months ended September 30, 2020 |
|
|
|
|
|
|
|
|
|
|
|
|
|
|
|
|
|
|
|
|
|
|
|
|
|
|
|
|
|
|
| Common Stock |
|
| Accumulated Other Comprehensive (Loss) Income |
|
|
|
|
|
|
|
|
|
| ||||||||||||||
|
| Number of Shares |
|
| Amount |
|
| Unrecognized Gains (Losses) on Derivative Instruments |
|
| Pension Obligations |
|
| Cumulative Translation Adjustment |
|
| Retained Earnings |
|
| Total |
|
| |||||||
BALANCE AT DECEMBER 31, 2019 |
|
| 25,128,158 |
|
| $ | 93,331 |
|
| $ | 9,951 |
|
| $ | (5,571 | ) |
| $ | (104,458 | ) |
| $ | 258,437 |
|
| $ | 251,690 |
|
|
Net loss |
|
| — |
|
|
| — |
|
|
| — |
|
|
| — |
|
|
| — |
|
|
| (222,154 | ) |
|
| (222,154 | ) |
|
Change in unrecognized gains/losses on derivative instruments, net of tax |
|
| — |
|
|
| — |
|
|
| (25,316 | ) |
|
| — |
|
|
| — |
|
|
| — |
|
|
| (25,316 | ) |
|
Change in defined benefit plans, net of taxes |
|
| — |
|
|
| — |
|
|
| — |
|
|
| 171 |
|
|
| — |
|
|
| — |
|
|
| 171 |
|
|
Net foreign currency translation adjustment |
|
| — |
|
|
| — |
|
|
| — |
|
|
| — |
|
|
| (9,706 | ) |
|
| — |
|
|
| (9,706 | ) |
|
Common stock issued, net of shares withheld for employee taxes |
|
| 463,772 |
|
|
| — |
|
|
| — |
|
|
| — |
|
|
| — |
|
|
| — |
|
|
| — |
|
|
Stock-based compensation |
|
| — |
|
|
| 727 |
|
|
| — |
|
|
| — |
|
|
| — |
|
|
| — |
|
|
| 727 |
|
|
Redeemable preferred 9% dividend and accretion |
|
| — |
|
|
| — |
|
|
| — |
|
|
| — |
|
|
| — |
|
|
| (23,811 | ) |
|
| (23,811 | ) |
|
European non-controlling redeemable equity dividend |
|
| — |
|
|
| — |
|
|
| — |
|
|
| — |
|
|
| — |
|
|
| (152 | ) |
|
| (152 | ) |
|
BALANCE AT SEPTEMBER 30, 2020 |
|
| 25,591,930 |
|
| $ | 94,058 |
|
| $ | (15,365 | ) |
| $ | (5,400 | ) |
| $ | (114,164 | ) |
| $ | 12,320 |
|
| $ | (28,551 | ) |
|
|
|
|
|
|
|
|
|
|
|
|
|
|
|
|
|
|
|
|
|
|
|
|
|
|
|
|
|
|
|
For the three months ended September 30, 2020 |
|
|
|
|
|
|
|
|
|
|
|
|
|
|
|
|
|
|
|
|
|
|
|
|
|
|
|
|
|
|
| Common Stock |
|
| Accumulated Other Comprehensive (Loss) Income |
|
|
|
|
|
|
|
|
|
| ||||||||||||||
|
| Number of Shares |
|
| Amount |
|
| Unrecognized Gains (Losses) on Derivative Instruments |
|
| Pension Obligations |
|
| Cumulative Translation Adjustment |
|
| Retained Earnings |
|
| Total |
|
| |||||||
BALANCE AT JUNE 30, 2020 |
|
| 25,591,930 |
|
| $ | 93,541 |
|
| $ | (20,048 | ) |
| $ | (5,457 | ) |
| $ | (130,548 | ) |
| $ | 9,336 |
|
| $ | (53,176 | ) |
|
Net income |
|
| — |
|
|
| — |
|
|
| — |
|
|
| — |
|
|
| — |
|
|
| 11,146 |
|
|
| 11,146 |
|
|
Change in unrecognized gains/losses on derivative instruments, net of tax |
|
| — |
|
|
| — |
|
|
| 4,683 |
|
|
| — |
|
|
| — |
|
|
| — |
|
|
| 4,683 |
|
|
Change in defined benefit plans, net of taxes |
|
| — |
|
|
| — |
|
|
| — |
|
|
| 57 |
|
|
| — |
|
|
| — |
|
|
| 57 |
|
|
Net foreign currency translation adjustment |
|
| — |
|
|
| — |
|
|
| — |
|
|
| — |
|
|
| 16,384 |
|
|
| — |
|
|
| 16,384 |
|
|
Common stock issued, net of shares withheld for employee taxes |
|
| — |
|
|
| — |
|
|
| — |
|
|
| — |
|
|
| — |
|
|
| — |
|
|
| — |
|
|
Stock-based compensation |
|
| — |
|
|
| 517 |
|
|
| — |
|
|
| — |
|
|
| — |
|
|
| — |
|
|
| 517 |
|
|
Redeemable preferred 9% dividend and accretion |
|
| — |
|
|
| — |
|
|
| — |
|
|
| — |
|
|
| — |
|
|
| (8,056 | ) |
|
| (8,056 | ) |
|
European non-controlling redeemable equity dividend |
|
| — |
|
|
| — |
|
|
| — |
|
|
| — |
|
|
| — |
|
|
| (106 | ) |
|
| (106 | ) |
|
BALANCE AT SEPTEMBER 30, 2020 |
|
| 25,591,930 |
|
| $ | 94,058 |
|
| $ | (15,365 | ) |
| $ | (5,400 | ) |
| $ | (114,164 | ) |
| $ | 12,320 |
|
| $ | (28,551 | ) |
|
|
|
|
|
|
|
|
|
|
|
|
|
|
|
|
|
|
|
|
|
|
|
|
|
|
|
|
|
|
|
For the nine months ended September 30, 2020
(Unaudited) |
| Common Stock |
|
| Accumulated Other Comprehensive (Loss) Income |
|
|
|
|
|
|
|
|
|
| ||||||||||||||
|
| Number of Shares |
|
| Amount |
|
| Unrecognized Gains (Losses) on Derivative Instruments |
|
| Pension Obligations |
|
| Cumulative Translation Adjustment |
|
| Retained Earnings |
|
| Total |
|
| |||||||
BALANCE AT DECEMBER 31, 2019 |
|
| 25,128,158 |
|
| $ | 93,331 |
|
| $ | 9,951 |
|
| $ | (5,571 | ) |
| $ | (104,458 | ) |
| $ | 258,437 |
|
| $ | 251,690 |
|
|
Net loss |
|
| — |
|
|
| — |
|
|
| — |
|
|
| — |
|
|
| — |
|
|
| (222,154 | ) |
|
| (222,154 | ) |
|
Change in unrecognized gains/losses on derivative instruments, net of tax |
|
| — |
|
|
| — |
|
|
| (25,316 | ) |
|
| — |
|
|
| — |
|
|
| — |
|
|
| (25,316 | ) |
|
Change in employee benefit plans, net of taxes |
|
| — |
|
|
| — |
|
|
| — |
|
|
| 171 |
|
|
| — |
|
|
| — |
|
|
| 171 |
|
|
Net foreign currency translation adjustment |
|
| — |
|
|
| — |
|
|
| — |
|
|
| — |
|
|
| (9,706 | ) |
|
| — |
|
|
| (9,706 | ) |
|
Common stock issued, net of shares withheld for employee taxes |
|
| 463,772 |
|
|
| — |
|
|
| — |
|
|
| — |
|
|
| — |
|
|
| — |
|
|
| — |
|
|
Stock-based compensation |
|
| — |
|
|
| 727 |
|
|
| — |
|
|
| — |
|
|
| — |
|
|
| — |
|
|
| 727 |
|
|
Redeemable preferred 9% dividend and accretion |
|
| — |
|
|
| — |
|
|
| — |
|
|
| — |
|
|
| — |
|
|
| (23,811 | ) |
|
| (23,811 | ) |
|
European non-controlling redeemable equity dividend |
|
| — |
|
|
| — |
|
|
| — |
|
|
| — |
|
|
| — |
|
|
| (152 | ) |
|
| (152 | ) |
|
BALANCE AT SEPTEMBER 30, 2020 |
|
| 25,591,930 |
|
| $ | 94,058 |
|
| $ | (15,365 | ) |
| $ | (5,400 | ) |
| $ | (114,164 | ) |
| $ | 12,320 |
|
| $ | (28,551 | ) |
|
|
|
|
|
|
|
|
|
|
|
|
|
|
|
|
|
|
|
|
|
|
|
|
|
|
|
|
|
|
|
For the three months ended September 30, 2020 |
|
|
|
|
|
|
|
|
|
|
|
|
|
|
|
|
|
|
|
|
|
|
|
|
|
| |||
|
|
|
|
|
|
|
|
|
|
|
|
|
|
|
|
|
|
|
|
|
|
|
|
|
|
|
|
|
|
(Unaudited) |
| Common Stock |
|
| Accumulated Other Comprehensive (Loss) Income |
|
|
|
|
|
|
|
|
|
| ||||||||||||||
|
| Number of Shares |
|
| Amount |
|
| Unrecognized Gains (Losses) on Derivative Instruments |
|
| Pension Obligations |
|
| Cumulative Translation Adjustment |
|
| Retained Earnings |
|
| Total |
|
| |||||||
BALANCE AT JUNE 30, 2020 |
|
| 25,591,930 |
|
| $ | 93,541 |
|
| $ | (20,048 | ) |
| $ | (5,457 | ) |
| $ | (130,548 | ) |
| $ | 9,336 |
|
| $ | (53,176 | ) |
|
Net income |
|
| — |
|
|
| — |
|
|
| — |
|
|
| — |
|
|
| — |
|
|
| 11,146 |
|
|
| 11,146 |
|
|
Change in unrecognized gains/losses on derivative instruments, net of tax |
|
| — |
|
|
| — |
|
|
| 4,683 |
|
|
| — |
|
|
| — |
|
|
| — |
|
|
| 4,683 |
|
|
Change in employee benefit plans, net of taxes |
|
| — |
|
|
| — |
|
|
| — |
|
|
| 57 |
|
|
| — |
|
|
| — |
|
|
| 57 |
|
|
Net foreign currency translation adjustment |
|
| — |
|
|
| — |
|
|
| — |
|
|
| — |
|
|
| 16,384 |
|
|
| — |
|
|
| 16,384 |
|
|
Common stock issued, net of shares withheld for employee taxes |
|
| — |
|
|
| — |
|
|
| — |
|
|
| — |
|
|
| — |
|
|
| — |
|
|
| — |
|
|
Stock-based compensation |
|
| — |
|
|
| 517 |
|
|
| — |
|
|
| — |
|
|
| — |
|
|
| — |
|
|
| 517 |
|
|
Redeemable preferred 9% dividend and accretion |
|
| — |
|
|
| — |
|
|
| — |
|
|
| — |
|
|
| — |
|
|
| (8,056 | ) |
|
| (8,056 | ) |
|
European non-controlling redeemable equity dividend |
|
| — |
|
|
| — |
|
|
| — |
|
|
| — |
|
|
| — |
|
|
| (106 | ) |
|
| (106 | ) |
|
BALANCE AT SEPTEMBER 30, 2020 |
|
| 25,591,930 |
|
| $ | 94,058 |
|
| $ | (15,365 | ) |
| $ | (5,400 | ) |
| $ | (114,164 | ) |
| $ | 12,320 |
|
| $ | (28,551 | ) |
|
For the nine months ended September 30, 2021 |
|
|
|
|
|
|
|
|
|
|
|
|
|
|
|
|
|
|
|
|
|
|
|
|
|
|
|
|
|
|
| Common Stock |
|
| Accumulated Other Comprehensive (Loss) Income |
|
|
|
|
|
|
|
|
|
| ||||||||||||||
|
| Number of Shares |
|
| Amount |
|
| Unrecognized Gains (Losses) on Derivative Instruments |
|
| Pension Obligations |
|
| Cumulative Translation Adjustment |
|
| Retained Earnings |
|
| Total |
|
| |||||||
BALANCE AT DECEMBER 31, 2020 |
|
| 25,591,930 |
|
| $ | 95,247 |
|
| $ | (1,738 | ) |
| $ | (7,447 | ) |
| $ | (90,261 | ) |
| $ | (17,323 | ) |
| $ | (21,522 | ) |
|
Net income |
|
| — |
|
|
| — |
|
|
| — |
|
|
| — |
|
|
| — |
|
|
| 7,637 |
|
|
| 7,637 |
|
|
Change in unrecognized gains/losses on derivative instruments, net of tax |
|
| — |
|
|
| — |
|
|
| 101 |
|
|
| — |
|
|
| — |
|
|
| — |
|
|
| 101 |
|
|
Change in defined benefit plans, net of taxes |
|
| — |
|
|
| — |
|
|
| — |
|
|
| 290 |
|
|
| — |
|
|
| — |
|
|
| 290 |
|
|
Net foreign currency translation adjustment |
|
| — |
|
|
| — |
|
|
| — |
|
|
| — |
|
|
| (16,336 | ) |
|
| — |
|
|
| (16,336 | ) |
|
Common stock issued, net of shares withheld for employee taxes |
|
| 556,867 |
|
|
| — |
|
|
| — |
|
|
| — |
|
|
| — |
|
|
| — |
|
|
| — |
|
|
Stock-based compensation |
|
| — |
|
|
| 5,371 |
|
|
| — |
|
|
| — |
|
|
| — |
|
|
| — |
|
|
| 5,371 |
|
|
Redeemable preferred 9% dividend and accretion |
|
| — |
|
|
| — |
|
|
| — |
|
|
| — |
|
|
| — |
|
|
| (25,310 | ) |
|
| (25,310 | ) |
|
European non-controlling redeemable equity dividend |
|
| — |
|
|
| — |
|
|
| — |
|
|
| — |
|
|
| — |
|
|
| (134 | ) |
|
| (134 | ) |
|
BALANCE AT SEPTEMBER 30, 2021 |
|
| 26,148,797 |
|
| $ | 100,618 |
|
| $ | (1,637 | ) |
| $ | (7,157 | ) |
| $ | (106,597 | ) |
| $ | (35,130 | ) |
| $ | (49,903 | ) |
|
|
|
|
|
|
|
|
|
|
|
|
|
|
|
|
|
|
|
|
|
|
|
|
|
|
|
|
|
|
|
For the three months ended September 30, 2021 |
|
|
|
|
|
|
|
|
|
|
|
|
|
|
|
|
|
|
|
|
|
|
|
|
|
|
|
|
|
|
| Common Stock |
|
| Accumulated Other Comprehensive (Loss) Income |
|
|
|
|
|
|
|
|
|
| ||||||||||||||
|
| Number of Shares |
|
| Amount |
|
| Unrecognized Gains (Losses) on Derivative Instruments |
|
| Pension Obligations |
|
| Cumulative Translation Adjustment |
|
| Retained Earnings |
|
| Total |
|
| |||||||
BALANCE AT JUNE 30, 2021 |
|
| 26,107,462 |
|
| $ | 98,236 |
|
| $ | 5,247 |
|
| $ | (7,253 | ) |
| $ | (97,529 | ) |
| $ | (19,256 | ) |
| $ | (20,555 | ) |
|
Net loss |
|
| — |
|
|
| — |
|
|
| — |
|
|
| — |
|
|
| — |
|
|
| (7,180 | ) |
|
| (7,180 | ) |
|
Change in unrecognized gains/losses on derivative instruments, net of tax |
|
| — |
|
|
| — |
|
|
| (6,884 | ) |
|
| — |
|
|
| — |
|
|
| — |
|
|
| (6,884 | ) |
|
Change in defined benefit plans, net of taxes |
|
| — |
|
|
| — |
|
|
| — |
|
|
| 96 |
|
|
| — |
|
|
| — |
|
|
| 96 |
|
|
Net foreign currency translation adjustment |
|
| — |
|
|
| — |
|
|
| — |
|
|
| — |
|
|
| (9,068 | ) |
|
| — |
|
|
| (9,068 | ) |
|
Common stock issued, net of shares withheld for employee taxes |
|
| 41,335 |
|
|
| — |
|
|
| — |
|
|
| — |
|
|
| — |
|
|
| — |
|
|
| — |
|
|
Stock-based compensation |
|
| — |
|
|
| 2,382 |
|
|
| — |
|
|
| — |
|
|
| — |
|
|
| — |
|
|
| 2,382 |
|
|
Redeemable preferred 9% dividend and accretion |
|
| — |
|
|
| — |
|
|
| — |
|
|
| — |
|
|
| — |
|
|
| (8,598 | ) |
|
| (8,598 | ) |
|
European non-controlling redeemable equity dividend |
|
| — |
|
|
| — |
|
|
| — |
|
|
| — |
|
|
| — |
|
|
| (96 | ) |
|
| (96 | ) |
|
BALANCE AT SEPTEMBER 30, 2021 |
|
| 26,148,797 |
|
| $ | 100,618 |
|
| $ | (1,637 | ) |
| $ | (7,157 | ) |
| $ | (106,597 | ) |
| $ | (35,130 | ) |
| $ | (49,903 | ) |
|
|
|
|
|
|
|
|
|
|
|
|
|
|
|
|
|
|
|
|
|
|
|
|
|
|
|
|
|
|
|
The accompanying unaudited notes are an integral part of these condensed consolidated financial statements.
Superior Industries International, Inc.
Notes to Condensed Consolidated Financial Statements
September 30, 20202021
(Unaudited)
NOTE 1 – NATURE OF OPERATIONS AND PRESENTATION OF CONDENSED CONSOLIDATED FINANCIAL STATEMENTS
Nature of Operations
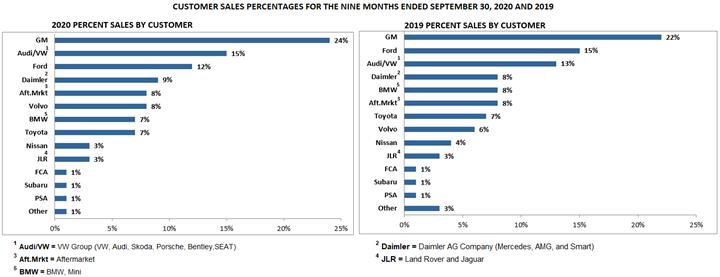
Superior Industries International, Inc.’s (referred herein as the “Company,” “Superior,” or “we” and “our”) principal business is the design and manufacture of aluminum wheels for sale to original equipment manufacturers (OEMs)(“OEMs”) in North America and Europe and to the aftermarket distributors in Europe. We employ approximately 7,5008,000 full-time employees, operating in 8 manufacturing facilities in North America and Europe with a combined annual manufacturing capacity of approximately 20 million wheels.Europe. We are one of the largest aluminum wheel suppliers to global OEMs and we believe we are the #1 European aluminum wheel aftermarket manufacturer and supplier. Our OEM aluminum wheels accounted for approximately 92 percent of our sales in the first nine months of 20202021 and are primarily sold for factory installation on vehicle models manufactured by BMW (including Mini), Daimler AG Company (Mercedes-Benz, AMG, Smart), FCA, Ford, GM, Honda, Jaguar-Land Rover, Lucid Motors, Mazda, Mitsubishi, Nissan, PSA, Renault, Stellantis, Subaru, Suzuki, Toyota, VW Group (Volkswagen, Audi, SEAT, Skoda, Porsche, Bentley) and Volvo. We also sell aluminum wheels to the European aftermarket under the brands ATS, RIAL, ALUTEC and ANZIO. North America and Europe represent the principal markets for our products, but we have a diversified global presence and diversified customer base consisting of North American, European and Asian OEMs. We have determined that our North American and European operations should be treated as separate reportable segments as further described in Note 5, “Business Segments.”
Presentation of Condensed Consolidated Financial Statements
The accompanying unaudited condensed consolidated financial statements have been prepared in accordanceconformity with the Security and Exchange Commission’s (“SEC’s”) requirements for quarterly reports on Form 10-Q and U.S. Generally Accepted Accounting Principles (“GAAP”) pursuant to the rules and regulations of the Securities and Exchange Commission (“SEC”) for interim financial information. Accordingly, they do not include all the information and notes required by U.S. GAAP for complete financial statements. These unaudited condensed consolidated financial statements, in our opinion, containinclude all adjustments, of a normal and recurring nature, which are necessary for fair presentation of (i) the condensed consolidated statements of income (loss) for the three and nine-month periods ended September 30, 20202021 and September 30, 2019,2020, (ii) the condensed consolidated statements of comprehensive income (loss) for the three and nine-month periods ended September 30, 20202021 and September 30, 2019,2020, (iii) the condensed consolidated balance sheets at September 30, 20202021 and December 31, 2019,2020, (iv) the condensed consolidated statements of cash flows for the nine-month periods ended September 30, 20202021 and September 30, 2019,2020, and (v) the condensed consolidated statements of shareholders’ equity (deficit) for the three and nine-month periods ended September 30, 20202021 and September 30, 2019.2020. This Quarterly Report on Form 10-Q should be read in conjunction with our consolidated financial statements and notes thereto filed with the SEC in our 20192020 Annual Report on Form 10-K.
Interim financial reporting standards require us to make estimates that are based on assumptions regarding the outcome of future events and circumstances not known at that time, including the use of estimated effective tax rates.time. Inevitably, some assumptions will not materialize, unanticipated events or circumstances may occur which vary from those estimates and such variations may significantly affect our future results. Additionally, interim results may not be indicative of our results for future interim periods or our annual results.
Reclassifications
Certain prior year amounts have been reclassified to conform with the current year presentation.
Cash Paid for Interest and Taxes and Non-Cash Investing Activities
Cash paid for interest was $27.1$23.5 million and $28.2$27.1 million for the nine months ended September 30, 20202021 and September 30, 2019,2020, respectively. Net cash paid for income taxes paid was $7.6$8.3 million and $6.5$7.6 million for the nine months ended September 30, 20202021 and September 30, 2019,2020, respectively. As of September 30, 20202021 and September 30, 2019, $0.22020, $10.8 million and $15.8$0.2 million, respectively, of equipment had been purchased but not yet paid and was included in accounts payable in our condensed consolidated balance sheets.
New Accounting Standards
Accounting Standards Update (“ASU”) 2018-13, “Fair Value Measurement.” Effective January 1, 2020, the Company adopted ASU 2018-13 which allows companies to remove, modify and add certain disclosures related to fair value measurements. The adoption of this standard did not have a significant impact on the Company’s condensed consolidated financial statement disclosures.
Accounting Standards Issued but Not Yet Adopted
ASUAccounting Standards Update (ASU) 2016-13, “Financial Instruments – Credit Losses (Topic 326): Measurement of Credit Losses on Financial Instruments.” In June 2016, the Financial Accounting Standards Board (“FASB”) issued ASU 2016-13, "Financial Instruments – Credit Losses (Topic 326): Measurement of Credit Losses on Financial Instruments", which requires entities to use a new impairment
model based on current expected credit losses (“CECL”) rather than incurred losses. Under CECL, estimated credit losses would incorporate relevant information about past events, current conditions and reasonable and supportable forecasts and any expected credit losses would be recognized at the time of sale. As a smaller reporting company (as defined under SEC regulations), theThe Company is not required to adopt the standard until fiscal years beginning after December 31, 2022.January 1, 2023. We are evaluating the impact this standard will have on our financial statements and disclosures.
ASU 2018-14, “Compensation - Retirement Benefits - Defined Benefit Plans.” In August 2018, the FASB issued an ASU entitled “Compensation - Retirement Benefits - Defined Benefit Plans - General Subtopic 715-20 - Disclosure Framework - Changes to the Disclosure Requirements for Defined Benefit Plans” (ASU 2018-14), which is designed to improve the effectiveness of disclosures by removing and adding disclosures related to defined benefit plans. ASU 2018-14 is effective for fiscal years ending after December 15, 2020. We are evaluating the impact this new standard will have on our financial statement disclosures.
ASU 2020-04, “Reference Rate Reform (Topic 848): Facilitation of the Effects of Reference Rate Reform on Financial Reporting.” In March 2020, the FASB issued ASU 2020-04 entitled “Reference Rate Reform (Topic 848): Facilitation of the Effects of Reference Rate Reform on Financial Reporting,” which provides temporary optional guidance to ease the potential burden in accounting for (or recognizing the effects of) reference rate reform on financial reporting. The relief provided by this guidance is elective and applies to all entities, subject to meeting certain criteria, that have contracts, hedging relationships, and other transactions that reference the London Interbank Offered Rate (“LIBOR”) or another reference rate expected to be discontinued because of reference rate reform initiatives being undertaken in an effort to identify alternative reference rates that are more observable or transaction based and less susceptible to manipulation. The optional amendments of this guidance are effective for all entities upon adoption. We are currently assessing the impact of this new standard on our financial statements and disclosures.
NOTE 2 – REVENUE
In accordance with Accounting Standards Codification (“ASC”) 606, “Revenue from Contracts with Customers,” theThe Company disaggregates revenue from contracts with customers into our reportable segments, North America and Europe. Revenues by segment for the three and nine-month periods ended September 30, 2021 and September 30, 2020, and 2019respectively, are summarized in Note 5, “Business Segments.”
The opening and closing balances of the Company’s customer receivables and current and long-term contract liabilities balances as of September 30, 2020 and December 31, 2019 are as follows (in thousands):follows:
|
| September 30, 2020 |
|
| December 31, 2019 |
|
| Change |
| |||||||||||||||
(Dollars in thousands) |
| September 30, 2021 |
|
| December 31, 2020 |
|
| Change |
| |||||||||||||||
Customer receivables |
| $ | 72,272 |
|
| $ | 68,283 |
|
| $ | 3,989 |
|
| $ | 82,717 |
|
| $ | 40,785 |
|
| $ | 41,932 |
|
Contract liabilities—current |
|
| 8,105 |
|
|
| 5,880 |
|
|
| 2,225 |
|
|
| 7,193 |
|
|
| 8,249 |
|
|
| (1,056 | ) |
Contract liabilities—noncurrent |
|
| 12,465 |
|
|
| 13,577 |
|
|
| (1,112 | ) |
|
| 11,026 |
|
|
| 13,106 |
|
|
| (2,080 | ) |
NOTE 3 – FAIR VALUE MEASUREMENTS
The Company applies fair value accounting for all financial assets and liabilities and non-financial assets and liabilities that are recognized or disclosed at fair value in the financial statements on a recurring basis, while other assets and liabilities are measured at fair value on a nonrecurring basis, such as an asset impairment. Fair value is estimated by applying the following hierarchy, which prioritizes the inputs used to measure fair value into three levels and bases the categorization within the hierarchy upon the lowest level of input that is available and significant to the fair value measurement:
Level 1 - Quoted prices in active markets for identical assets or liabilities.
Level 2 - Observable inputs other than quoted prices in active markets for identical assets and liabilities, quoted prices for identical or similar assets or liabilities in inactive markets, or other inputs that are observable or can be corroborated by observable market data for substantially the full term of the assets or liabilities.
Level 3 - Inputs that are generally unobservable and typically reflect management’s estimate of assumptions that market participants would use in pricing the asset or liability.
The carrying amounts for cash and cash equivalents, accounts receivable, accounts payable and accrued expenses approximate their fair values due to the short period of time until maturity.
Cash and Cash Equivalents
Cash and cash equivalents generally consist of cash, certificates of deposit and fixed deposits and money market funds with original maturities of three months or less.
Derivative Financial Instruments
Our derivatives are over-the-counter customized derivative transactions and are not exchange traded. We estimate the fair value of these instruments using industry-standard valuation models such as discounted cash flow. These models project future cash flows and discount the future amounts to a present value using market-based expectations for interest rates, foreign exchange rates, commodity prices and the contractual terms of the derivative instruments. The discount rate used is the relevant interbank deposit rate (e.g., LIBOR) plus an adjustment for non-performance risk.
The following tables categorize items measured at fair value as of September 30, 20202021 and December 31, 2019:2020:
|
|
|
|
|
| Fair Value Measurement at Reporting Date Using |
|
|
|
|
|
| Fair Value Measurement at Reporting Date Using |
| ||||||||||||||||||
September 30, 2020 |
|
|
|
|
| Quoted Prices in Active Markets for Identical Assets (Level 1) |
|
| Significant Other Observable Inputs (Level 2) |
|
| Significant Unobservable Inputs (Level 3) |
| |||||||||||||||||||
September 30, 2021 |
|
|
|
|
| Quoted Prices in Active Markets for Identical Assets (Level 1) |
|
| Significant Other Observable Inputs (Level 2) |
|
| Significant Unobservable Inputs (Level 3) |
| |||||||||||||||||||
(Dollars in thousands) |
|
|
|
|
|
|
|
|
|
|
|
|
|
|
|
|
|
|
|
|
|
|
|
|
|
|
|
|
|
|
|
|
Assets |
|
|
|
|
|
|
|
|
|
|
|
|
|
|
|
|
|
|
|
|
|
|
|
|
|
|
|
|
|
|
|
|
Derivative contracts |
| $ | 3,016 |
|
| $ | — |
|
| $ | 3,016 |
|
| $ | — |
|
| $ | 13,884 |
|
| $ | — |
|
| $ | 13,884 |
|
| $ | — |
|
Total |
| $ | 3,016 |
|
| $ | — |
|
| $ | 3,016 |
|
| $ | — |
|
| $ | 13,884 |
|
| $ | — |
|
| $ | 13,884 |
|
| $ | — |
|
Liabilities |
|
|
|
|
|
|
|
|
| . |
|
|
|
|
|
|
|
|
|
|
|
|
|
| . |
|
|
|
|
| ||
Derivative contracts |
| $ | 28,984 |
|
| $ | — |
|
| $ | 28,984 |
|
| $ | — |
|
| $ | 17,213 |
|
| $ | — |
|
| $ | 17,213 |
|
| $ | — |
|
Total |
| $ | 28,984 |
|
| $ | — |
|
| $ | 28,984 |
|
| $ | — |
|
| $ | 17,213 |
|
| $ | — |
|
| $ | 17,213 |
|
| $ | — |
|
|
|
|
|
|
| Fair Value Measurement at Reporting Date Using |
|
|
|
|
|
| Fair Value Measurement at Reporting Date Using |
| ||||||||||||||||||
December 31, 2019 |
|
|
|
|
| Quoted Prices in Active Markets for Identical Assets (Level 1) |
|
| Significant Other Observable Inputs (Level 2) |
|
| Significant Unobservable Inputs (Level 3) |
| |||||||||||||||||||
December 31, 2020 |
|
|
|
|
| Quoted Prices in Active Markets for Identical Assets (Level 1) |
|
| Significant Other Observable Inputs (Level 2) |
|
| Significant Unobservable Inputs (Level 3) |
| |||||||||||||||||||
(Dollars in thousands) |
|
|
|
|
|
|
|
|
|
|
|
|
|
|
|
|
|
|
|
|
|
|
|
|
|
|
|
|
|
|
|
|
Assets |
|
|
|
|
|
|
|
|
|
|
|
|
|
|
|
|
|
|
|
|
|
|
|
|
|
|
|
|
|
|
|
|
Derivative contracts |
| $ | 21,973 |
|
| $ | — |
|
| $ | 21,973 |
|
| $ | — |
|
| $ | 10,218 |
|
| $ | — |
|
| $ | 10,218 |
|
| $ | — |
|
Total |
| $ | 21,973 |
|
| $ | — |
|
| $ | 21,973 |
|
| $ | — |
|
| $ | 10,218 |
|
| $ | — |
|
| $ | 10,218 |
|
| $ | — |
|
Liabilities |
|
|
|
|
|
|
|
|
|
|
|
|
|
|
|
|
|
|
|
|
|
|
|
|
|
|
|
|
|
|
|
|
Derivative contracts |
| $ | 8,709 |
|
| $ | — |
|
| $ | 8,709 |
|
| $ | — |
|
| $ | 15,259 |
|
| $ | — |
|
| $ | 15,259 |
|
| $ | — |
|
Total |
| $ | 8,709 |
|
| $ | — |
|
| $ | 8,709 |
|
| $ | — |
|
| $ | 15,259 |
|
| $ | — |
|
| $ | 15,259 |
|
| $ | — |
|
Debt Instruments
The carrying values of the Company’s debt instruments vary from their fair values. The fair values were determined by reference to transacted prices ofand quotes for these instruments (Level 2 input based on the U.S. GAAP fair value hierarchy)2). The estimated fair value, as well as the carrying value, of the Company’s debt instruments are shown below:
|
| September 30, 2020 |
|
| December 31, 2019 |
|
| September 30, 2021 |
|
| December 31, 2020 |
| ||||
(Dollars in thousands) |
|
|
|
|
|
|
|
|
|
|
|
|
|
|
|
|
Estimated aggregate fair value |
| $ | 563,568 |
|
| $ | 606,093 |
|
| $ | 624,713 |
|
| $ | 624,207 |
|
Aggregate carrying value (1) |
|
| 630,200 |
|
|
| 630,635 |
|
|
| 624,223 |
|
|
| 643,184 |
|
(1) |
|
NOTE 4 - DERIVATIVE FINANCIAL INSTRUMENTS
Derivative Instruments and Hedging Activities
We use derivatives to partially offset our exposure to foreign currency, interest rate, aluminum and other commodity price risk.risks. We may enter into forward contracts, option contracts, swaps, collars or other derivative instruments to offset some of the risk on expected future cash flows and on certain existing assets and liabilities. However, we may choose not to hedge certain exposures for a variety of reasons including, but not limited to, accounting considerations and the prohibitive economic cost of hedging particular exposures. There can be no assurance the hedges will offset more than a portion of the full financial impact resulting from movements in foreign currency exchange rates, interest rates, and aluminum or other commodity prices.
To help protectmitigate gross margins frommargin fluctuations due to changes in foreign currency exchange rates, certain of our subsidiaries, whose functional currency is the U.S. dollar or the Euro, hedge a portion of their forecasted foreign currency costs denominated in the Mexican Peso and Polish Zloty, respectively. We may hedge portions of our forecasted foreign currency exposure up to 48 months.
We record all derivatives in the condensed consolidated balance sheets at fair value. Our accounting treatment for these instruments is based on the hedge designation. Gains or losses on derivatives that are designated as hedging instruments are recorded in accumulated other comprehensive income (loss) (“AOCI”) until the hedged item is recognized in earnings, at which point accumulated gains or losses will be recognized in earnings and classified with the underlying hedged transaction. Derivatives that are not designated as hedging instruments are adjusted to fair value through earnings in the financial statement line item to which the derivative relates. The Company has derivatives that are designated as hedging instruments, as well as derivatives that do not qualify for designation as hedging instruments.
The following tables display the fair value of derivatives by balance sheet line item at September 30, 20202021 and December 31, 2019:2020:
|
| September 30, 2020 |
|
| September 30, 2021 |
| ||||||||||||||||||||||||||
|
| Other Current Assets |
|
| Other Non-current Assets |
|
| Accrued Liabilities |
|
| Other Non-current Liabilities |
|
| Other Current Assets |
|
| Other Non-current Assets |
|
| Accrued Liabilities |
|
| Other Non-current Liabilities |
| ||||||||
(Dollars in thousands) |
|
|
|
|
|
|
|
|
|
|
|
|
|
|
|
|
|
|
|
|
|
|
|
|
|
|
|
|
|
|
|
|
Foreign exchange forward contracts designated as hedging instruments |
| $ | 794 |
|
| $ | 867 |
|
| $ | 7,753 |
|
| $ | 10,293 |
|
| $ | 2,145 |
|
| $ | 3,027 |
|
| $ | 2,391 |
|
| $ | 8,448 |
|
Foreign exchange forward contracts not designated as hedging instruments |
|
| 7 |
|
|
| — |
|
|
| 466 |
|
|
| — |
|
|
| 524 |
|
|
| — |
|
|
| 739 |
|
|
| — |
|
Aluminum forward contracts designated as hedging instruments |
|
| — |
|
|
| — |
|
|
| 123 |
|
|
| — |
|
|
| 3,620 |
|
|
| — |
|
|
| — |
|
|
| — |
|
Natural gas forward contracts designated as hedging instruments |
|
| 837 |
|
|
| 511 |
|
|
| 142 |
|
|
| 39 |
|
|
| 3,590 |
|
|
| 978 |
|
|
| 6 |
|
|
| 42 |
|
Interest rate swap contracts designated as hedging instruments |
|
| — |
|
|
| — |
|
|
| 4,872 |
|
|
| 5,296 |
|
|
| — |
|
|
| — |
|
|
| 4,781 |
|
|
| 806 |
|
Total derivative financial instruments |
| $ | 1,638 |
|
| $ | 1,378 |
|
| $ | 13,356 |
|
| $ | 15,628 |
|
| $ | 9,879 |
|
| $ | 4,005 |
|
| $ | 7,917 |
|
| $ | 9,296 |
|
|
| December 31, 2019 |
|
| December 31, 2020 |
| ||||||||||||||||||||||||||
|
| Other Current Assets |
|
| Other Non-current Assets |
|
| Accrued Liabilities |
|
| Other Non-current Liabilities |
|
| Other Current Assets |
|
| Other Non-current Assets |
|
| Accrued Liabilities |
|
| Other Non-current Liabilities |
| ||||||||
(Dollars in thousands) |
|
|
|
|
|
|
|
|
|
|
|
|
|
|
|
|
|
|
|
|
|
|
|
|
|
|
|
|
|
|
|
|
Foreign exchange forward contracts designated as hedging instruments |
| $ | 7,808 |
|
| $ | 12,821 |
|
| $ | 60 |
|
| $ | 100 |
|
| $ | 1,218 |
|
| $ | 6,531 |
|
| $ | 3,435 |
|
| $ | 2,645 |
|
Foreign exchange forward contracts not designated as hedging instruments |
|
| 1,196 |
|
|
| — |
|
|
| 554 |
|
|
| — |
|
|
| 1,167 |
|
|
| — |
|
|
| 122 |
|
|
| — |
|
Aluminum forward contracts designated as hedging instruments |
|
| 60 |
|
|
| — |
|
|
| 127 |
|
|
| — |
|
|
| 262 |
|
|
| — |
|
|
| — |
|
|
| — |
|
Natural gas forward contracts designated as hedging instruments |
|
| 81 |
|
|
| 7 |
|
|
| 1,312 |
|
|
| 727 |
|
|
| 816 |
|
|
| 224 |
|
|
| 22 |
|
|
| 70 |
|
Interest rate swap contracts designated as hedging instruments |
|
| — |
|
|
| — |
|
|
| 2,304 |
|
|
| 3,525 |
|
|
| — |
|
|
| — |
|
|
| 4,771 |
|
|
| 4,194 |
|
Total derivative financial instruments |
| $ | 9,145 |
|
| $ | 12,828 |
|
| $ | 4,357 |
|
| $ | 4,352 |
|
| $ | 3,463 |
|
| $ | 6,755 |
|
| $ | 8,350 |
|
| $ | 6,909 |
|
The following table summarizes the notional amount and estimated fair value of our derivative financial instruments:
|
| September 30, 2020 |
|
| December 31, 2019 |
|
| September 30, 2021 |
|
| December 31, 2020 |
| ||||||||||||||||||||
|
| Notional U.S. Dollar Amount |
|
| Fair Value |
|
| Notional U.S. Dollar Amount |
|
| Fair Value |
|
| Notional U.S. Dollar Amount |
|
| Fair Value |
|
| Notional U.S. Dollar Amount |
|
| Fair Value |
| ||||||||
(Dollars in thousands) |
|
|
|
|
|
|
|
|
|
|
|
|
|
|
|
|
|
|
|
|
|
|
|
|
|
|
|
|
|
|
|
|
Foreign currency forward contracts designated as hedging instruments |
| $ | 431,025 |
|
| $ | (16,385 | ) |
| $ | 449,181 |
|
| $ | 20,469 |
| ||||||||||||||||
Foreign exchange forward contracts designated as hedging instruments |
| $ | 487,425 |
|
| $ | (5,667 | ) |
| $ | 421,253 |
|
| $ | 1,669 |
| ||||||||||||||||
Foreign exchange forward contracts not designated as hedging instruments |
|
| 15,539 |
|
|
| (459 | ) |
|
| 73,491 |
|
|
| 642 |
|
|
| 25,668 |
|
|
| (215 | ) |
|
| 71,217 |
|
|
| 1,045 |
|
Aluminum forward contracts designated as hedging instruments |
|
| 4,971 |
|
|
| (123 | ) |
|
| 9,405 |
|
|
| (67 | ) |
|
| 19,257 |
|
|
| 3,620 |
|
|
| 4,068 |
|
|
| 262 |
|
Natural gas forward contracts designated as hedging instruments |
|
| 6,254 |
|
|
| 1,167 |
|
|
| 5,816 |
|
|
| (1,951 | ) |
|
| 8,094 |
|
|
| 4,520 |
|
|
| 5,523 |
|
|
| 948 |
|
Interest rate swap contracts designated as hedging instruments |
|
| 235,000 |
|
|
| (10,168 | ) |
|
| 260,000 |
|
|
| (5,829 | ) |
|
| 200,000 |
|
|
| (5,587 | ) |
|
| 200,000 |
|
|
| (8,965 | ) |
Total derivative financial instruments |
| $ | 692,789 |
|
| $ | (25,968 | ) |
| $ | 797,893 |
|
| $ | 13,264 |
|
| $ | 740,444 |
|
| $ | (3,329 | ) |
| $ | 702,061 |
|
| $ | (5,041 | ) |
Notional amounts are presented on a net basis. The notional amounts of the derivative financial instruments do not represent amounts exchanged by the parties and, therefore, are not a direct measure of our exposure to the financial risks. The amounts exchanged are calculated by reference to the notional amounts and by other terms of the derivatives, such as interest rates, foreign currency exchange rates or commodity prices.
The following tables summarize the gain or loss recognized in AOCI, as of September 30, 2020 and 2019, the amounts reclassified from AOCI into earnings and the amounts recognized directly into earnings for the three and nine months ended September 30, 20202021 and 2019:2020:
Three Months Ended September 30, 2020 |
| Amount of Gain or (Loss) Recognized in AOCI on Derivatives |
|
| Amount of Pre-tax Gain or (Loss) Reclassified from AOCI into Income |
|
| Amount of Pre-tax Gain or (Loss) Recognized in Income on Derivatives |
| |||||||||||||||
Three Months Ended September 30, 2021 |
| Amount of Gain or (Loss) Recognized in AOCI on Derivatives |
|
| Amount of Pre-tax Gain or (Loss) Reclassified from AOCI into Income |
|
| Amount of Pre-tax Gain or (Loss) Recognized in Income on Derivatives |
| |||||||||||||||
(Dollars in thousands) |
|
|
|
|
|
|
|
|
|
|
|
|
|
|
|
|
|
|
|
|
|
|
|
|
Derivative Contracts |
| $ | 4,683 |
|
| $ | (2,261 | ) |
| $ | 3,458 |
|
| $ | (6,884 | ) |
| $ | 1,731 |
|
| $ | (219 | ) |
Total |
| $ | 4,683 |
|
| $ | (2,261 | ) |
| $ | 3,458 |
|
| $ | (6,884 | ) |
| $ | 1,731 |
|
| $ | (219 | ) |
|
|
|
|
|
|
|
|
|
|
|
|
|
|
|
|
|
|
|
|
|
|
|
|
|
Nine Months Ended September 30, 2020 |
| Amount of Gain or (Loss) Recognized in AOCI on Derivatives |
|
| Amount of Pre-tax Gain or (Loss) Reclassified from AOCI into Income |
|
| Amount of Pre-tax Gain or (Loss) Recognized in Income on Derivatives |
| |||||||||||||||
Nine Months Ended September 30, 2021 |
| Amount of Gain or (Loss) Recognized in AOCI on Derivatives |
|
| Amount of Pre-tax Gain or (Loss) Reclassified from AOCI into Income |
|
| Amount of Pre-tax Gain or (Loss) Recognized in Income on Derivatives |
| |||||||||||||||
(Dollars in thousands) |
|
|
|
|
|
|
|
|
|
|
|
|
|
|
|
|
|
|
|
|
|
|
|
|
Derivative Contracts |
| $ | (25,316 | ) |
| $ | (7,355 | ) |
| $ | (289 | ) |
| $ | 101 |
|
| $ | 2,050 |
|
| $ | (1,485 | ) |
Total |
| $ | (25,316 | ) |
| $ | (7,355 | ) |
| $ | (289 | ) |
| $ | 101 |
|
| $ | 2,050 |
|
| $ | (1,485 | ) |
Three Months Ended September 30, 2019 |
| Amount of Gain or (Loss) Recognized in AOCI on Derivatives |
|
| Amount of Pre-tax Gain or (Loss) Reclassified from AOCI into Income |
|
| Amount of Pre-tax Gain or (Loss) Recognized in Income on Derivatives |
| |||||||||||||||
Three Months Ended September 30, 2020 |
| Amount of Gain or (Loss) Recognized in AOCI on Derivatives |
|
| Amount of Pre-tax Gain or (Loss) Reclassified from AOCI into Income |
|
| Amount of Pre-tax Gain or (Loss) Recognized in Income on Derivatives |
| |||||||||||||||
(Dollars in thousands) |
|
|
|
|
|
|
|
|
|
|
|
|
|
|
|
|
|
|
|
|
|
|
|
|
Derivative Contracts |
| $ | (8,302 | ) |
| $ | 703 |
|
| $ | 1,817 |
|
| $ | 4,683 |
|
| $ | (2,261 | ) |
| $ | 3,458 |
|
Total |
| $ | (8,302 | ) |
| $ | 703 |
|
| $ | 1,817 |
|
| $ | 4,683 |
|
| $ | (2,261 | ) |
| $ | 3,458 |
|
|
|
|
|
|
|
|
|
|
|
|
|
|
|
|
|
|
|
|
|
|
|
|
|
|
Nine Months Ended September 30, 2019 |
| Amount of Gain or (Loss) Recognized in AOCI on Derivatives |
|
| Amount of Pre-tax Gain or (Loss) Reclassified from AOCI into Income |
|
| Amount of Pre-tax Gain or (Loss) Recognized in Income on Derivatives |
| |||||||||||||||
Nine Months Ended September 30, 2020 |
| Amount of Gain or (Loss) Recognized in AOCI on Derivatives |
|
| Amount of Pre-tax Gain or (Loss) Reclassified from AOCI into Income |
|
| Amount of Pre-tax Gain or (Loss) Recognized in Income on Derivatives |
| |||||||||||||||
(Dollars in thousands) |
|
|
|
|
|
|
|
|
|
|
|
|
|
|
|
|
|
|
|
|
|
|
|
|
Derivative Contracts |
| $ | (1,520 | ) |
| $ | 2,417 |
|
| $ | 3,557 |
|
| $ | (25,316 | ) |
| $ | (7,355 | ) |
| $ | (289 | ) |
Total |
| $ | (1,520 | ) |
| $ | 2,417 |
|
| $ | 3,557 |
|
| $ | (25,316 | ) |
| $ | (7,355 | ) |
| $ | (289 | ) |
NOTE 5 - BUSINESS SEGMENTS
The North American and European businesses represent separate operating segments in view of significantly different markets, customers and products in each of these regions. Within each of these regions, markets, customers, products and production processes are similar and production can be transferred between production facilities.similar. Moreover, our business within each region generally leverages common systems, processes and infrastructure. Accordingly, North America and Europe comprise the Company’s reportable segments.
(Dollars in thousands) |
| Net Sales |
|
| Income from Operations |
|
| Net Sales |
|
| Income (loss) from Operations |
| ||||||||||||||||||||
Three Months Ended |
| September 30, 2020 |
|
| September 30, 2019 |
|
| September 30, 2020 |
|
| September 30, 2019 |
|
| September 30, 2021 |
|
| September 30, 2020 |
|
| September 30, 2021 |
|
| September 30, 2020 |
| ||||||||
North America |
| $ | 166,662 |
|
| $ | 188,089 |
|
| $ | 16,113 |
|
| $ | (4,440 | ) |
| $ | 180,496 |
|
| $ | 166,662 |
|
| $ | 12,581 |
|
| $ | 16,113 |
|
Europe |
|
| 150,441 |
|
|
| 163,925 |
|
|
| 3,125 |
|
|
| 4,197 |
|
|
| 130,284 |
|
|
| 150,441 |
|
|
| (5,207 | ) |
|
| 3,125 |
|
|
| $ | 317,103 |
|
| $ | 352,014 |
|
| $ | 19,238 |
|
| $ | (243 | ) |
| $ | 310,780 |
|
| $ | 317,103 |
|
| $ | 7,374 |
|
| $ | 19,238 |
|
|
|
|
|
|
|
|
|
|
|
|
|
|
|
|
|
|
|
|
|
|
|
|
|
|
|
|
|
|
|
|
|
|
(Dollars in thousands) |
| Depreciation and Amortization |
|
| Capital Expenditures |
|
| Depreciation and Amortization |
|
| Capital Expenditures |
| ||||||||||||||||||||
Three Months Ended |
| September 30, 2020 |
|
| September 30, 2019 |
|
| September 30, 2020 |
|
| September 30, 2019 |
|
| September 30, 2021 |
|
| September 30, 2020 |
|
| September 30, 2021 |
|
| September 30, 2020 |
| ||||||||
North America |
| $ | 8,742 |
|
| $ | 15,432 |
|
| $ | 6,673 |
|
| $ | 5,425 |
|
| $ | 8,732 |
|
| $ | 8,742 |
|
| $ | 10,223 |
|
| $ | 6,673 |
|
Europe |
|
| 16,076 |
|
|
| 15,396 |
|
|
| 4,158 |
|
|
| 13,494 |
|
|
| 15,744 |
|
|
| 16,076 |
|
|
| 16,797 |
|
|
| 4,158 |
|
|
| $ | 24,818 |
|
| $ | 30,828 |
|
| $ | 10,831 |
|
| $ | 18,919 |
|
| $ | 24,476 |
|
| $ | 24,818 |
|
| $ | 27,020 |
|
| $ | 10,831 |
|
(Dollars in thousands) |
| Net Sales |
|
| Income from Operations |
|
| Net Sales |
|
| Income (loss) from Operations |
| ||||||||||||||||||||
Nine Months Ended |
| September 30, 2020 |
|
| September 30, 2019 |
|
| September 30, 2020 |
|
| September 30, 2019 |
|
| September 30, 2021 |
|
| September 30, 2020 |
|
| September 30, 2021 |
|
| September 30, 2020 |
| ||||||||
North America |
| $ | 381,129 |
|
| $ | 553,607 |
|
| $ | 2,430 |
|
| $ | 13,586 |
|
| $ | 549,457 |
|
| $ | 381,129 |
|
| $ | 37,964 |
|
| $ | 2,430 |
|
Europe |
|
| 381,921 |
|
|
| 508,599 |
|
|
| (200,324 | ) |
|
| 28,841 |
|
|
| 466,983 |
|
|
| 381,921 |
|
|
| 10,649 |
|
|
| (200,324 | ) |
|
| $ | 763,050 |
|
| $ | 1,062,206 |
|
| $ | (197,894 | ) |
| $ | 42,427 |
|
| $ | 1,016,440 |
|
| $ | 763,050 |
|
| $ | 48,613 |
|
| $ | (197,894 | ) |
|
|
|
|
|
|
|
|
|
|
|
|
|
|
|
|
|
|
|
|
|
|
|
|
|
|
|
|
|
|
|
|
|
(Dollars in thousands) |
| Depreciation and Amortization |
|
| Capital Expenditures |
|
| Depreciation and Amortization |
|
| Capital Expenditures |
| ||||||||||||||||||||
Nine Months Ended |
| September 30, 2020 |
|
| September 30, 2019 |
|
| September 30, 2020 |
|
| September 30, 2019 |
|
| September 30, 2021 |
|
| September 30, 2020 |
|
| September 30, 2021 |
|
| September 30, 2020 |
| ||||||||
North America |
| $ | 25,967 |
|
| $ | 31,248 |
|
| $ | 19,109 |
|
| $ | 15,988 |
|
| $ | 27,453 |
|
| $ | 25,967 |
|
| $ | 18,330 |
|
| $ | 19,109 |
|
Europe |
|
| 47,167 |
|
|
| 46,252 |
|
|
| 14,483 |
|
|
| 31,596 |
|
|
| 47,993 |
|
|
| 47,167 |
|
|
| 29,241 |
|
|
| 14,483 |
|
|
| $ | 73,134 |
|
| $ | 77,500 |
|
| $ | 33,592 |
|
| $ | 47,584 |
|
| $ | 75,446 |
|
| $ | 73,134 |
|
| $ | 47,571 |
|
| $ | 33,592 |
|
(Dollars in thousands) |
| Property, Plant and Equipment, net |
|
| Goodwill and Intangible Assets |
|
| Property, Plant and Equipment, net |
|
| Intangible Assets |
| ||||||||||||||||||||
|
| September 30, 2020 |
|
| December 31, 2019 |
|
| September 30, 2020 |
|
| December 31, 2019 |
|
| September 30, 2021 |
|
| December 31, 2020 |
|
| September 30, 2021 |
|
| December 31, 2020 |
| ||||||||
North America |
| $ | 214,656 |
|
| $ | 237,372 |
|
| $ | — |
|
| $ | — |
|
| $ | 211,253 |
|
| $ | 220,145 |
|
| $ | — |
|
| $ | — |
|
Europe |
|
| 292,381 |
|
|
| 291,910 |
|
|
| 112,341 |
|
|
| 321,910 |
|
|
| 290,519 |
|
|
| 301,979 |
|
|
| 85,177 |
|
|
| 110,796 |
|
|
| $ | 507,037 |
|
| $ | 529,282 |
|
| $ | 112,341 |
|
| $ | 321,910 |
|
| $ | 501,772 |
|
| $ | 522,124 |
|
| $ | 85,177 |
|
| $ | 110,796 |
|
(Dollars in thousands) |
| Total Assets |
|
| Total Assets |
| ||||||||||
|
| September 30, 2020 |
|
| December 31, 2019 |
|
| September 30, 2021 |
|
| December 31, 2020 |
| ||||
North America |
| $ | 433,645 |
|
| $ | 484,689 |
|
| $ | 477,922 |
|
| $ | 479,873 |
|
Europe |
|
| 645,366 |
|
|
| 827,178 |
|
|
| 614,346 |
|
|
| 629,452 |
|
|
| $ | 1,079,011 |
|
| $ | 1,311,867 |
|
| $ | 1,092,268 |
|
| $ | 1,109,325 |
|
Geographic information
Net sales and long-lived assets by manufacturing geographic location are as follows:
(Dollars in thousands) |
| Three Months Ended |
|
| Nine Months Ended |
|
| |||||||||||||||||||||||||||
|
| Three Months Ended |
|
| Nine Months Ended |
|
|
| September 30, 2021 |
|
| September 30, 2020 |
|
| September 30, 2021 |
|
| September 30, 2020 |
|
| ||||||||||||||
|
| September 30, 2020 |
|
| September 30, 2019 |
|
| September 30, 2020 |
|
| September 30, 2019 |
|
| |||||||||||||||||||||
(Dollars in thousands) |
|
|
|
|
|
|
|
|
|
|
|
|
|
|
|
|
| |||||||||||||||||
Net sales: |
|
|
|
|
|
|
|
|
|
|
|
|
|
|
|
|
|
|
|
|
|
|
|
|
|
|
|
|
|
|
|
|
|
|
U.S. |
| $ | 5,094 |
|
| $ | 26,916 |
|
| $ | 24,890 |
|
| $ | 81,638 |
|
|
| $ | 2,832 |
|
| $ | 5,094 |
|
| $ | 5,651 |
|
| $ | 24,890 |
|
|
Mexico |
|
| 161,568 |
|
|
| 161,173 |
|
|
| 356,239 |
|
|
| 471,969 |
|
|
|
| 177,664 |
|
|
| 161,568 |
|
|
| 543,806 |
|
|
| 356,239 |
|
|
Germany |
|
| 58,413 |
|
|
| 59,548 |
|
|
| 142,177 |
|
|
| 180,785 |
|
|
|
| 43,084 |
|
|
| 58,413 |
|
|
| 166,483 |
|
|
| 142,177 |
|
|
Poland |
|
| 92,028 |
|
|
| 104,377 |
|
|
| 239,744 |
|
|
| 327,814 |
|
|
|
| 87,200 |
|
|
| 92,028 |
|
|
| 300,500 |
|
|
| 239,744 |
|
|
Consolidated net sales |
| $ | 317,103 |
|
| $ | 352,014 |
|
| $ | 763,050 |
|
| $ | 1,062,206 |
|
|
| $ | 310,780 |
|
| $ | 317,103 |
|
| $ | 1,016,440 |
|
| $ | 763,050 |
|
|
|
|
|
|
|
|
|
|
|
|
|
|
|
|
|
|
|
| |||||||||||||||||
|
|
|
|
|
|
|
|
|
|
|
|
|
|
|
|
|
| |||||||||||||||||
(Dollars in thousands) |
|
|
|
|
|
|
|
|
| Property, Plant and Equipment, net |
|
| ||||||||||||||||||||||
|
|
|
|
|
|
|
|
|
| September 30, 2021 |
|
| December 31, 2020 |
|
| |||||||||||||||||||
U.S. |
|
|
|
|
|
|
|
|
| $ | 2,291 |
|
| $ | 7,324 |
|
| |||||||||||||||||
Mexico |
|
|
|
|
|
|
|
|
|
| 208,962 |
|
|
| 212,821 |
|
| |||||||||||||||||
Germany |
|
|
|
|
|
|
|
|
|
| 85,019 |
|
|
| 82,162 |
|
| |||||||||||||||||
Poland |
|
|
|
|
|
|
|
|
|
| 205,500 |
|
|
| 219,817 |
|
| |||||||||||||||||
Property, plant and equipment, net |
|
|
|
|
|
|
|
|
| $ | 501,772 |
|
| $ | 522,124 |
|
| |||||||||||||||||
NOTE 6 - INVENTORIES
|
| September 30, 2020 |
|
| December 31, 2019 |
|
| September 30, 2021 |
|
| December 31, 2020 |
| ||||
(Dollars in thousands) |
|
|
|
|
|
|
|
|
|
|
|
|
|
|
|
|
Raw materials |
| $ | 32,536 |
|
| $ | 44,245 |
|
| $ | 48,344 |
|
| $ | 46,712 |
|
Work in process |
|
| 40,459 |
|
|
| 40,344 |
|
|
| 73,425 |
|
|
| 45,394 |
|
Finished goods |
|
| 68,292 |
|
|
| 83,881 |
|
|
| 93,203 |
|
|
| 62,874 |
|
Inventories, net |
| $ | 141,287 |
|
| $ | 168,470 |
|
| $ | 214,972 |
|
| $ | 154,980 |
|
Service wheel and supplies inventory included in other non-current assets in the condensed consolidated balance sheets totaled $10.8$10.5 million and $10.6$12.1 million at September 30, 20202021 and December 31, 2019,2020, respectively.
NOTE 7 - PROPERTY, PLANT AND EQUIPMENT
|
| September 30, 2020 |
|
| December 31, 2019 |
|
| September 30, 2021 |
|
| December 31, 2020 |
| ||||
(Dollars in thousands) |
|
|
|
|
|
|
|
|
|
|
|
|
|
|
|
|
Land and buildings |
| $ | 168,758 |
|
| $ | 158,907 |
|
| $ | 129,221 |
|
| $ | 149,295 |
|
Machinery and equipment |
|
| 829,983 |
|
|
| 856,961 |
|
|
| 861,218 |
|
|
| 899,764 |
|
Leasehold improvements and others |
|
| 11,176 |
|
|
| 12,173 |
|
|
| 12,421 |
|
|
| 14,912 |
|
Construction in progress |
|
| 44,045 |
|
|
| 30,179 |
|
|
| 59,275 |
|
|
| 46,718 |
|
|
|
| 1,053,962 |
|
|
| 1,058,220 |
|
|
| 1,062,135 |
|
|
| 1,110,689 |
|
Accumulated depreciation |
|
| (546,925 | ) |
|
| (528,938 | ) |
|
| (560,363 | ) |
|
| (588,565 | ) |
Property, plant and equipment, net |
| $ | 507,037 |
|
| $ | 529,282 |
|
| $ | 501,772 |
|
| $ | 522,124 |
|
Depreciation expense for the three and nine months ended September 30, 2021 was $18.0 million and $55.5 million, respectively.
Depreciation expense for the three and nine months ended September 30, 2020 was $18.3 million and $54.4 million, respectively. Depreciation expense for the three and nine months ended September 30, 2019 was $24.2 million and $57.4 million, respectively. Depreciation expense for the three months ended September 30, 2019 included accelerated depreciation of $7.6 million related to excess equipment arising from the plan to reduce production at our Fayetteville, Arkansas manufacturing facility (refer to Note 19, “Restructuring”).
NOTE 8 -– GOODWILL AND OTHER INTANGIBLE ASSETS
At March 31, 2020, the impact of COVID-19 and uncertainty with respect to the economic effects of the pandemic had introduced significant volatility in the financial markets and was having and continues to have, a widespread adverse effect on the automotive industry, including reductions in both consumer demand and OEM automotive production.industry. In response to the COVID-19 pandemic, our key customers temporarily closed nearly all their production facilities in Europe and North America (our primary markets) during the quarter ended March 31, 2020. As a result, we concluded that an interim test of our goodwill was required as of March 31, 2020. More specifically, the Company concluded that the following events and circumstances, in the aggregate, indicated that it was more likely than not that the carrying value of our European reporting unit exceeded its fair value: (1) our European reporting unit’s carrying value was effectively set to fair value at December 31, 2019, due to the $102.2 million impairment charges to goodwill and indefinite-lived intangibles, (2) lower forecasted 2020 industry production volumes for Western and Central Europe, including those for our primary European customers, due to OEM shutdowns to mitigate COVID-19 spread and subsequent reduced production levels over the remainder of the year, as compared to our prior production forecasts (including estimates used in our 2019 assessment) and (3) the volatility in financial markets that hashad both increased European interest rates due to rising credit spreads and risk premiums and lowered median European automotive market multiples. Based on the results of our quantitative analysis, we recognized a non-cash goodwill impairment charge equal to the remaining goodwill balance of $182.6 million since the carrying value exceeded the fair value of the European reporting unit by more than the amount of the goodwill balance at March 31, 2020. Additionally, we recognized a non-cash impairment charge of $11.0 million related to our aftermarket trade name indefinite-lived intangible asset which was primarily attributable to a further decline in forecasted aftermarket revenues and a decline in associated profitability. Total impairment charges of $193.6 million were recognized as a separate charge at March 31, 2020 and included in income (loss) from operations.
We utilized both an income and a market approach, weighted 75 percent and 25 percent respectively, to determine the fair value of the European reporting unit as part of our goodwill impairment assessment. The income approach is based on projected debt-free cash flow, which is discounted to the present value using discount factors that consider the timing and risk of cash flows. The discount rate used is the weighted average of an estimated cost of equity and of debt (“weighted average cost of capital”). The weighted average cost of capital is adjusted as necessary to reflect risk associated with the business of the European reporting unit. Financial projections are based on estimated production volumes, product prices and expenses, including raw material cost, wages, energy and other expenses. Other significant assumptions include terminal value cash flow and growth rates, future capital expenditures and changes in future working capital requirements. The market approach is based on the observed ratios of enterprise value to earnings before interest, taxes, depreciation and amortization (EBITDA) of comparable, publicly traded companies. The market approach fair value is determined by multiplying historical and anticipated financial metrics of the European reporting unit by the EBITDA pricing multiples derived from comparable, publicly traded companies.
At March 31, 2020, we determined that the carrying value of the European reporting unit exceeded its fair value by an amount greater than the remaining goodwill balance. The decline in fair value was primarily due to significantly lower market multiples and increased discount rates, as well as further declines in forecasted industry production volumes in Western and Central Europe as a result of the COVID-19 pandemic and consequent economic instability. Forecasted revenues, EBITDA and cash flow for the European reporting unit also declined as compared to the prior year long-range plan due to lower forecasted industry production volumes which adversely impacted fair value under both the income and market approaches. In determining the fair value, the Company weighted the income
and market approaches, 75 percent and 25 percent, respectively. Significant assumptions used under the income approach included a weighted average cost of capital (WACC) of 12.0 percent and a long-term growth rate of 1.5 percent, as compared to 10.0 percent and 2.0 percent, respectively, used in the 2019 assessment. In determining the WACC, management considered the level of risk inherent in the cash flow projections and current market conditions, including the significant increase in credit spreads and systemic market and Company specific risk premiums. The decline in the fair value under the market approach is attributable to the decline in the average EBITDA market multiple (4.9X EBITDA in 2020, 5.7X EBITDA in 2019) and lower forecasted EBITDA, as compared to the 2019 assessment. The use of these unobservable inputs results in classification of the fair value estimate as a Level 3 measurement in the fair value hierarchy. A considerable amount of management judgment and assumptions are required in performing the quantitative impairment test, principally related to determining the fair value of the reporting unit. While the Company believes its judgments and assumptions are reasonable, different assumptions could change the estimated fair value.
Following is a summary of the Company’s finite-lived and indefinite-lived intangible assets and goodwill as of September 30, 20202021 and December 31, 2019.2020.
As of September 30, 2020 |
| Gross Carrying Amount |
|
| Impairment |
|
| Accumulated Amortization |
|
| Currency Translation |
|
| Net Carrying Amount |
|
| Remaining Weighted Average Amortization Period | |||||||||||||||||||||||||||
As of September 30, 2021 |
| Gross Carrying Amount |
|
| Accumulated Impairment |
|
| Accumulated Amortization |
|
| Currency Translation |
|
| Net Carrying Amount |
|
| Remaining Weighted Average Amortization Period | |||||||||||||||||||||||||||
(Dollars in thousands) |
|
|
|
|
|
|
|
|
|
|
|
|
|
|
|
|
|
|
|
|
|
|
|
|
|
|
|
|
|
|
|
|
|
|
|
|
|
|
|
|
|
|
|
|
Brand name |
| $ | 9,000 |
|
| $ | — |
|
| $ | (6,136 | ) |
| $ | 269 |
|
| $ | 3,133 |
|
| 2-3 |
| $ | 9,000 |
|
| $ | — |
|
| $ | (8,047 | ) |
| $ | 284 |
|
| $ | 1,237 |
|
| 1-2 |
Technology |
|
| 15,000 |
|
|
| — |
|
|
| (10,226 | ) |
|
| 441 |
|
|
| 5,215 |
|
| 1-3 |
|
| 15,000 |
|
|
| — |
|
|
| (13,412 | ) |
|
| 474 |
|
|
| 2,062 |
|
| 2 |
Customer relationships |
|
| 167,000 |
|
|
| — |
|
|
| (68,940 | ) |
|
| 5,933 |
|
|
| 103,993 |
|
| 3-8 |
|
| 167,000 |
|
|
| — |
|
|
| (90,417 | ) |
|
| 5,295 |
|
|
| 81,878 |
|
| 2-7 |
Total finite |
|
| 191,000 |
|
|
| — |
|
|
| (85,302 | ) |
|
| 6,643 |
|
|
| 112,341 |
|
|
|
|
| 191,000 |
|
|
| — |
|
|
| (111,876 | ) |
|
| 6,053 |
|
|
| 85,177 |
|
|
|
Trade names |
|
| 14,000 |
|
|
| (13,772 | ) |
|
| — |
|
|
| (228 | ) |
|
| — |
|
| Indefinite |
|
| 14,000 |
|
|
| (13,772 | ) |
|
| — |
|
|
| (228 | ) |
|
| — |
|
| Indefinite |
Total intangibles |
| $ | 205,000 |
|
| $ | (13,772 | ) |
| $ | (85,302 | ) |
| $ | 6,415 |
|
| $ | 112,341 |
|
|
|
| $ | 205,000 |
|
| $ | (13,772 | ) |
| $ | (111,876 | ) |
| $ | 5,825 |
|
| $ | 85,177 |
|
|
|
As of December 31, 2020 |
| Gross Carrying Amount |
|
| Accumulated Impairment |
|
| Accumulated Amortization |
|
| Currency Translation |
|
| Net Carrying Amount |
|
| Remaining Weighted Average Amortization Period | |||||
(Dollars in thousands) |
|
|
|
|
|
|
|
|
|
|
|
|
|
|
|
|
|
|
|
|
|
|
Brand name |
| $ | 9,000 |
|
| $ | — |
|
| $ | (6,615 | ) |
| $ | 399 |
|
| $ | 2,784 |
|
| 2-3 |
Technology |
|
| 15,000 |
|
|
| — |
|
|
| (11,024 | ) |
|
| 666 |
|
|
| 4,642 |
|
| 1-3 |
Customer relationships |
|
| 167,000 |
|
|
| — |
|
|
| (74,322 | ) |
|
| 10,692 |
|
|
| 103,370 |
|
| 3-8 |
Total finite |
|
| 191,000 |
|
|
| — |
|
|
| (91,961 | ) |
|
| 11,757 |
|
|
| 110,796 |
|
|
|
Trade names |
|
| 14,000 |
|
|
| (13,772 | ) |
|
| — |
|
|
| (228 | ) |
|
| — |
|
| Indefinite |
Total intangibles |
| $ | 205,000 |
|
| $ | (13,772 | ) |
| $ | (91,961 | ) |
| $ | 11,529 |
|
| $ | 110,796 |
|
|
|
Nine Months Ended September 30, 2020 |
| Beginning Balance |
|
|
|
|
|
|
|
|
|
| Ending Balance |
| ||||||||||||||||||
|
| Gross |
|
| Accumulated Impairment |
|
| Net Balance |
|
| Impairment |
|
| Currency Translation |
|
| Gross |
|
| Accumulated Impairment |
|
| Net Balance |
| ||||||||
(Dollars in thousands) |
|
|
|
|
|
|
|
|
|
|
|
|
|
|
|
|
|
|
|
|
|
|
|
|
|
|
|
|
|
|
|
|
Goodwill |
| $ | 284,337 |
|
| $ | (99,505 | ) |
| $ | 184,832 |
|
| $ | (182,528 | ) |
| $ | (2,304 | ) |
| $ | 282,033 |
|
| $ | (282,033 | ) |
| $ | — |
|
As of December 31, 2019 |
| Gross Carrying Amount |
|
| Impairment |
|
| Accumulated Amortization |
|
| Currency Translation |
|
| Net Carrying Amount |
|
| Remaining Weighted Average Amortization Period | |||||
(Dollars in thousands) |
|
|
|
|
|
|
|
|
|
|
|
|
|
|
|
|
|
|
|
|
|
|
Brand name |
| $ | 9,000 |
|
| $ | — |
|
| $ | (4,778 | ) |
| $ | 110 |
|
| $ | 4,332 |
|
| 3-4 |
Technology |
|
| 15,000 |
|
|
| — |
|
|
| (7,963 | ) |
|
| 183 |
|
|
| 7,220 |
|
| 2-4 |
Customer relationships |
|
| 167,000 |
|
|
| — |
|
|
| (53,681 | ) |
|
| 954 |
|
|
| 114,273 |
|
| 4-9 |
Total finite |
|
| 191,000 |
|
|
| — |
|
|
| (66,422 | ) |
|
| 1,247 |
|
|
| 125,825 |
|
|
|
Trade names |
|
| 14,000 |
|
|
| (2,733 | ) |
|
| — |
|
|
| (14 | ) |
|
| 11,253 |
|
| Indefinite |
Total intangibles |
| $ | 205,000 |
|
| $ | (2,733 | ) |
| $ | (66,422 | ) |
| $ | 1,233 |
|
| $ | 137,078 |
|
|
|
Year Ended December 31, 2019 |
| Beginning Balance |
|
|
|
|
|
|
|
|
|
| Ending Balance |
| ||||||||||||||||||||||||||||||||||||||||||||||||||
Year Ended December 31, 2020 |
| Beginning Balance |
|
|
|
|
|
|
|
|
|
| Ending Balance |
| ||||||||||||||||||||||||||||||||||||||||||||||||||
|
| Gross |
|
| Accumulated Impairment |
|
| Net Balance |
|
| Impairment |
|
| Currency Translation |
|
| Gross |
|
| Accumulated Impairment |
|
| Net Balance |
|
| Gross |
|
| Accumulated Impairment |
|
| Net Balance |
|
| Impairment |
|
| Currency Translation |
|
| Gross |
|
| Accumulated Impairment |
|
| Net Balance |
| ||||||||||||||||
(Dollars in thousands) |
|
|
|
|
|
|
|
|
|
|
|
|
|
|
|
|
|
|
|
|
|
|
|
|
|
|
|
|
|
|
|
|
|
|
|
|
|
|
|
|
|
|
|
|
|
|
|
|
|
|
|
|
|
|
|
|
|
|
|
|
|
|
|
|
Goodwill |
| $ | 291,434 |
|
| $ | — |
|
| $ | 291,434 |
|
| $ | (99,505 | ) |
| $ | (7,097 | ) |
| $ | 284,337 |
|
| $ | (99,505 | ) |
| $ | 184,832 |
|
| $ | 284,337 |
|
| $ | (99,505 | ) |
| $ | 184,832 |
|
| $ | (182,602 | ) |
| $ | (2,230 | ) |
| $ | 282,107 |
|
| $ | (282,107 | ) |
| $ | — |
|
Amortization expense for these intangible assets was $6.5 million and $6.6 millionfor the three months ended September 30, 20202021 and 2019,2020, respectively. Amortization expense for the nine months endingended September 30, 2021 and 2020 and 2019 was $18.8$19.9 million and $20.1$18.8 million, respectively. The anticipated annual amortization expense for these intangible assets is $24.5$25.8 million for 2020 to 2021, $21.7$22.9 million for 2022, and $19.8$20.9 million for 2023 and 2024.2024, and $10.3 million for 2025.
NOTE 9 – DEBT
A summary of long-term debt and the related weighted average interest rates is shown below:
|
| September 30, 2020 (Dollars in Thousands) |
|
| September 30, 2021 (Dollars in Thousands) |
| ||||||||||||||||||||||||||
Debt Instrument |
| Total Debt |
|
| Debt Issuance Costs (1) |
|
| Total Debt, Net |
|
| Weighted Average Interest Rate |
|
| Total Debt |
|
| Debt Issuance Costs (1) |
|
| Total Debt, Net |
|
| Weighted Average Interest Rate |
| ||||||||
Term Loan Facility |
| $ | 349,200 |
|
| $ | (7,790 | ) |
| $ | 341,410 |
|
|
| 4.1 | % |
| $ | 349,200 |
|
| $ | (4,794 | ) |
| $ | 344,406 |
|
|
| 4.1 | % |
6.00% Senior Notes due 2025 |
|
| 254,904 |
|
|
| (4,670 | ) |
|
| 250,234 |
|
|
| 6.0 | % | ||||||||||||||||
6.00% Senior Notes |
|
| 251,735 |
|
|
| (3,687 | ) |
|
| 248,048 |
|
|
| 6.0 | % | ||||||||||||||||
European CapEx Loans |
|
| 23,410 |
|
|
| — |
|
|
| 23,410 |
|
|
| 2.4 | % |
|
| 20,348 |
|
|
| — |
|
|
| 20,348 |
|
|
| 2.3 | % |
Finance Leases |
|
| 2,686 |
|
|
| — |
|
|
| 2,686 |
|
|
| 3.0 | % |
|
| 2,940 |
|
|
| — |
|
|
| 2,940 |
|
|
| 2.8 | % |
|
| $ | 630,200 |
|
| $ | (12,460 | ) |
|
| 617,740 |
|
|
|
|
|
| $ | 624,223 |
|
| $ | (8,481 | ) |
|
| 615,742 |
|
|
|
|
|
Less: Current portion |
|
|
|
|
|
|
|
|
|
| (6,034 | ) |
|
|
|
|
|
|
|
|
|
|
|
|
|
| (6,297 | ) |
|
|
|
|
Long-term debt |
|
|
|
|
|
|
|
|
| $ | 611,706 |
|
|
|
|
|
|
|
|
|
|
|
|
|
| $ | 609,445 |
|
|
|
|
|
|
| December 31, 2019 (Dollars in Thousands) |
|
| December 31, 2020 (Dollars in Thousands) |
| ||||||||||||||||||||||||||
Debt Instrument |
| Total Debt |
|
| Debt Issuance Costs (1) |
|
| Total Debt, Net |
|
| Weighted Average Interest Rate |
|
| Total Debt |
|
| Debt Issuance Costs (1) |
|
| Total Debt, Net |
|
| Weighted Average Interest Rate |
| ||||||||
Term Loan Facility |
| $ | 371,800 |
|
| $ | (10,192 | ) |
| $ | 361,608 |
|
|
| 5.7 | % |
| $ | 349,200 |
|
| $ | (7,155 | ) |
| $ | 342,045 |
|
|
| 4.1 | % |
6.00% Senior Notes due 2025 |
|
| 243,074 |
|
|
| (5,408 | ) |
|
| 237,666 |
|
|
| 6.0 | % | ||||||||||||||||
European CapEx Loan |
|
| 12,693 |
|
|
| — |
|
|
| 12,693 |
|
|
| 2.2 | % | ||||||||||||||||
6.00% Senior Notes |
|
| 266,928 |
|
|
| (4,425 | ) |
|
| 262,503 |
|
|
| 6.0 | % | ||||||||||||||||
European CapEx Loans |
|
| 23,668 |
|
|
| — |
|
|
| 23,668 |
|
|
| 2.3 | % | ||||||||||||||||
Finance Leases |
|
| 3,068 |
|
|
| — |
|
|
| 3,068 |
|
|
| 2.9 | % |
|
| 3,388 |
|
|
| — |
|
|
| 3,388 |
|
|
| 3.0 | % |
|
| $ | 630,635 |
|
| $ | (15,600 | ) |
|
| 615,035 |
|
|
|
|
|
| $ | 643,184 |
|
| $ | (11,580 | ) |
|
| 631,604 |
|
|
|
|
|
Less: Current portion |
|
|
|
|
|
|
|
|
|
| (4,010 | ) |
|
|
|
|
|
|
|
|
|
|
|
|
|
| (6,112 | ) |
|
|
|
|
Long-term debt |
|
|
|
|
|
|
|
|
| $ | 611,025 |
|
|
|
|
|
|
|
|
|
|
|
|
|
| $ | 625,492 |
|
|
|
|
|
| (1) | Unamortized portion |
Senior Notes
On June 15, 2017, the Company issued €250.0 million aggregate principal amount of 6.00 percent Senior Notes (“Notes”) due June 15, 2025. Interest on the Notes is payable semiannually, on June 15 and December 15. The Company may redeem the Notes, in whole or in part, on or after June 15, 20202021 at a redemption pricesprice of 103.0101.5 percent and 101.5 percent of the principal amount thereof, if the redemption occurs during the 12-month period beginningon or after June 15, 2020 or June 15, 2021, respectively, and2022 at a redemption price of 100 percent, of the principal amount thereof on or after June 15, 2022, in each case plus any accrued and unpaid interest to, but not including,as of the applicable redemption date. If we experience a change of control or sell certain assets, the Company may be required to offer to purchase the Notes from the holders. The Notes are senior unsecured obligations ranking equally in right of payment with all of its existing and future senior indebtedness and senior in right of payment to any subordinated indebtedness. The Notes are effectively subordinated in right of payment to the existing and future secured indebtedness of the Company, including the Senior Secured Credit Facilities (as defined below), to the extent of the assets securing such indebtedness.
During the second and third quarters of 2019, the Company opportunistically purchased Notes on the open market with face values of $22.4 million (20.0 million Euro) and $7.8 million (7.0 million Euro) for $19.4 million $6.6 million, respectively. The carrying values associated with the Note purchases in the second and third quarters of 2019, net of allocable debt issuance costs, were $21.8 million and $7.6 million, respectively, resulting in gains of $2.4 million and $1.0 million, respectively, which were included in other income. During the fourth quarter of 2019, the Company purchased additional Notes on the open market with a face value of $6.6 million (6.0 million Euro) for $6.3 million. The associated carrying value of the Notes, net of allocable debt issuance costs, was $6.5 million, resulting in a net gain of $0.3 million for the fourth quarter, which was included in other income.
Guarantee
The Notes are unconditionally guaranteed by all material wholly-owned direct and indirect domestic restricted subsidiaries of the Company (the “Subsidiary Guarantors”), with customary exceptions including, among other things, where providing such guarantees is not permitted by law, regulation or contract, or would result in adverse tax consequences.
Covenants
Subject to certain exceptions, the indenture governing the Notes contains restrictive covenants that, among other things, limit the ability of the Company and the Subsidiary Guarantors to: (i) incur additional indebtedness or issue certain preferred stock; (ii) pay dividends on, or make distributions in respect of, their capital stock; (iii) make certain investments or other restricted payments; (iv) sell certain assets or issue capital stock of restricted subsidiaries; (v) create liens; (vi) merge, consolidate, transfer or dispose of substantially all of their assets; and (vii) engage in certain transactions with affiliates. These covenants are subject to several important limitations and exceptions that are described in the indenture.
The indenture provides for customary events of default that include, among other things (subject in certain cases to customary grace and cure periods): (i) nonpayment of principal, premium, if any, and interest, when due; (ii) failure for 60 days to comply with any obligations, covenants or agreements in the indenture after receipt of written notice from the Bank of New York Mellon, London Branch (“the Trustee”) or holders of at least 30 percent in principal amount of the then outstanding Notes of such failure (other than defaults referred to in the foregoing clause (i)); (iii) default under any mortgage, indenture or instrument for money borrowed by the Company or certain of its subsidiaries, (iv) a failure to pay certain judgments; and (iv) certain events of bankruptcy and insolvency. If an event of default occurs and is continuing, the Bank of New York Mellon, London Branch (“the Trustee”)Trustee or holders of at least 30 percent in principal amount of the then outstanding Notes may declare the principal, premium, if any, and accrued and unpaid interest on all the Notes to be due and payable. These events of default are subject to several important qualifications, limitations and exceptions that are described in the indenture. As of September 30, 2020,2021, the Company was in compliance with all covenants under the indenture governing the Notes.
Senior Secured Credit Facilities
On March 22, 2017, the Company entered into a senior secured credit agreement (“Credit Agreement”) with Citibank, N.A, as Administrative Agent, Collateral Agentcertain banks and Issuing Bank, JP Morgan Chase N.A., Royal Bank of Canada and Deutsche Bank A.G. New York Branch as Joint Lead Arrangers and Joint Book Runners, and the other lenders party thereto (collectively, the “Lenders”).lenders. The Credit Agreement consisted of a $400.0 million senior secured term loan facility (“Term Loan Facility”), which matures on May 23, 2024, and a $160.0 million revolving credit facility originally maturing on May 23, 2022 (“Revolving(the “Revolving Credit Facility” and,), together with the Term Loan Facility, the USD Senior Secured Credit Facilities (“USD SSCF”)). On May 3, 2021, the Company extended the term of the Revolving Credit Facility under its USD SSCF and reduced the commitment under the facility from $160.0 million to $132.5 million, with $25.0 million of the commitment maturing May 23, 2022 and the remaining $107.5 million maturing October 31, 2023. The extension was treated as a modification of the revolving credit facility and the related debt issuance costs have been recognized as a deferred charge in other non-current assets and are being amortized ratably over the remaining term of the extended facility.
Borrowings under the Term Loan Facility will bear interest at a rate equal to, at the Company’s option, either (a) LIBOR for the relevant interest period, adjusted for statutory requirements, subject to a floor of 0.00 percent per annum, plus an applicable rate of 4.00 percent or (b) a base rate, subject to a floor of 2.00 percent per annum, equal to the highest of (1) the rate of interest in effect as publicly announced by the administrative agent as its prime rate, (2) the federal funds rate plus 0.50 percent and (3) LIBOR for an interest period of one month plus 1.00 percent, in each case, plus an applicable rate of 3.00 percent.
Borrowings under the Revolving Credit Facility bear interest at a rate equal to, at the Company’s option, either (a) LIBOR for the relevant interest period, with a floor of 0.00 percent per annum, plus the applicable rate or (b) a base rate, with a floor of 0.00 percent, equal to the highest of (1) the rate of interest in effect as publicly announced by the administrative agent as its prime rate, (2) the federal funds effective rate plus 0.50 percent and (3) LIBOR for an interest period of one month plus 1.00 percent, in each case, plus the applicable rate. The applicable rates for borrowings under the Revolving Credit Facility and commitment fees for unused commitments under the Revolving Credit Facility are based upon the First Lien Net Leverage Ratio effective for the preceding quarter, with LIBOR applicable rates ranging between 3.50 percent and 3.00 percent, currently 3.503.00 percent, and base rate applicable rates ranging between 2.50 percent and 2.00 percent, currently 2.50 percent2.00 percent. Commitment fees for the unused commitment under the Revolving Credit Facility are also based upon the First Lien Net Leverage Ratio, effective for the preceding quarter, and commitment feesrange between 0.50 percent and 0.25 percent for the commitment maturing May 23, 2022, currently 0.500.25 percent, and between 0.625 percent and 0.375 percent for the remaining commitment maturing October 31, 2023, currently 0.375 percent. Commitment fees are included in interest expense.
As of September 30, 2020,2021, the Company had repaid $50.8 million under the Term Loan Facility resulting in a balance of $349.2 million. In addition, the Company had 0 borrowings outstanding under the Revolving Credit Facility, outstanding letters of credit of $4.8 million and available unused commitments under this facility of $155.2$127.7 million as of September 30, 2020.2021.
Guarantees and Collateral Security
Our obligations under the Credit Agreement are unconditionally guaranteed by the Subsidiary Guarantors, with customary exceptions including, among other things, where providing such guarantees is not permitted by law, regulation or contract or would result in adverse tax consequences. The guarantees of such obligations, will be secured, subject to permitted liens and other exceptions, by substantially all of our assets and the Subsidiary Guarantors’ assets, including but not limited to: (i) a perfected pledge of all of the capital stock issued by each of the Subsidiary Guarantors (subject to certain exceptions) and up to 65 percent of the capital stock issued by each direct wholly-owned foreign restricted subsidiary of the Company (subject to certain exceptions) and (ii) perfected security interests in and mortgages on substantially all tangible and intangible personal property and material fee-owned real property of the Company and the Subsidiary Guarantors (subject to certain exceptions and exclusions).
Covenants
The Credit Agreement contains a number of restrictive covenants that, among other things, restrict, subject to certain exceptions, our ability to incur additional indebtedness and guarantee indebtedness, create or incur liens, engage in mergers or consolidations, sell, transfer or otherwise dispose of assets, make investments, acquisitions, loans or advances, pay dividends, distributions or other restricted payments, or repurchase our capital stock,stock. The Credit Agreement also restricts our ability to prepay, redeem, or repurchase any subordinated indebtedness, enter into agreements which limit our ability to incur liens on our assets or that restrict the ability of restricted subsidiaries to pay dividends or make other restricted payments to us, and enter into certain transactions with our affiliates, affiliates. Solelyand, solely with respect to the Revolving Credit Facility, the Credit Agreement also requires a Total Net Leverage Ratio (calculated as defined in the Credit Agreement) of not more than 4.5 to 1.0 as of each fiscal quarter-end when outstanding borrowings, together with undrawn letters of credit exceeding $20 million, under the Revolving Credit Facility exceed 35 quarter-end.percent of the $160 million commitment amount.
In addition, the Credit Agreement contains customary default provisions, representations and warranties and other covenants. The Credit Agreement also contains a provision permitting the Lenders to accelerate the repayment of all loans outstanding under the Senior Secured Credit FacilitiesUSD SSCF during an event of default. As of September 30, 2020,2021, the Company was in compliance with all covenants under the Credit Agreement.
European Debt
In connection with the acquisition of Uniwheels,UNIWHEELS AG, the Company assumed $70.7 million of outstanding debt. At September 30, 2020, $11.02021, $7.7 million of the assumed debt remained outstandingoutstanding. This debt matures March 31, 2024 and is collateralized by financed equipment, guaranteed by Superior and bears interest at 2.2 percent. Covenants under the loan agreement include a default provision for non-payment, as well as a material adverse change default provision pursuant to which the lender could accelerate the loan maturity. As of September 30, 2021, the Company was in compliance with all covenants under the loan agreement.
During the second quarter of 2019,2021, the Company amended its European Revolving Credit Facility (“EUR SSCF”), increasing the available borrowing limit from €30.0 million to €45.0 million and extending the term to May 22, 2022. On January 31, 2020,2023 and increasing the available borrowing limit ofapplicable margin and commitment fees, while maintaining the EUR SSCF was increased from €45.0€60.0 million to €60.0 million.commitment. All other terms of the EUR SSCF remained unchanged. At September 30, 2020,2021, the Company had 0 borrowings outstanding, outstanding letters of credit of $0.5 million (€0.4 million)0.4million) and available unused commitments under this facility of $70.0$69.1 million (€59.6 million). The EUR SSCF bears interest at Euribor (with a floor of 0)0.00 percent) plus a margin (ranging from 1.552.05 percent to 3.03.50 percent based on the net debt leverage ratio of Superior Industries Europe AG and its wholly owned subsidiaries, collectively “Superior Europe AG”), currently 1.552.05 percent. The annual commitment fee for unused commitments (ranging from 0.500.625 percent to 1.051.225 percent based on the net debt leverage ratio of Superior Europe AG), is currently 0.500.625 percent per annum. In addition, a management fee is assessed equal to 0.07 percent of borrowings outstanding at each month end. The commitment and management fees are bothfee is included in interest expense. Superior Europe AG has pledged substantially all of its assets, including land and buildings, receivables, inventory, and other moveable assets (other than collateral associated with equipment loans) as collateral under the EUR SSCF.
The EUR SSCF is subject to a number of restrictive covenants that, among other things, restrict, subject to certain exceptions, the ability of Superior Europe AG to incur additional indebtedness and guarantee indebtedness, create or incur liens, engage in mergers or consolidations, sell, transfer or otherwise dispose of assets, make investments, acquisitions, loans or advances, pay dividends or distributions, or repurchase our capital stock, prepay, redeem, or repurchase any subordinated indebtedness, and enter into agreements which limit our ability to incur liens on our assets. In addition, the EUR SSCF includes an annual pay down provision requiring outstanding balances to be repaid but not reborrowed for a period of three business days and a material adverse change default provision pursuant to which the lender could accelerate the loan maturity. At September 30, 2020,2021, Superior Europe AG was in compliance with all covenants under the EUR SSCF.
During the fourth quarter
The balance of 2019, the Company entered into newcertain post-acquisition equipment loan agreements totaling $13.4loans was $12.6 million (€12.0 million) whichas of September 30, 2021. The loans bear interest at 2.672.3 percent, and mature on September 30, 2027. Interest2027 and require quarterly principal repayments are due quarterly.and interest payments. The loans are secured with liens on the financed equipment and are subject to covenants that, among other things, include a material adverse change default provision pursuant to which the lender could accelerate the loan maturity, as well as a provision that restricts the ability of Superior Europe AG to reduce its ownership interest in Superior Industries Production Germany GmbH, its wholly-owned subsidiary and the borrower under the loan. DuringThe Company drew down €10.6 million on these equipment loans in the first quarter of 2020 and drew the Company had drawn down onremaining €1.4 million in the equipment loans and the balance outstanding at September 30, 2020 was $12.4 million (€10.6 million).first quarter of 2021. Quarterly installment payments of $0.5 million (€0.4 million) under the loan agreements will beginbegan in DecemberJune of 20202021. At September 30, 2020,2021, the Company was in compliance with all covenants under the loans.
Debt maturities as of September 30, 2021, which are due in the next five years and thereafter, are as follows:
|
|
|
|
|
(Dollars in thousands) |
|
|
|
|
Debt Maturities |
| Amount |
| |
Three remaining months of 2021 |
| $ | 1,634 |
|
2022 |
|
| 6,286 |
|
2023 |
|
| 5,893 |
|
2024 |
|
| 352,345 |
|
2025 |
|
| 254,016 |
|
Thereafter |
|
| 4,049 |
|
Total debt liabilities |
| $ | 624,223 |
|
NOTE 10 - REDEEMABLE PREFERRED STOCK
During 2017, we issued 150,000 shares of Series A (140,202 shares) and Series B (9,798 shares) Perpetual Convertible Preferred Stock, par value $0.01 per share to TPG Growth III Sidewall, L.P. (“TPG”) for an aggregate purchase price of $150.0 million. On August 30, 2017, the Series B shares were converted into Series A redeemable preferred stock, the “redeemable preferred stock,” after approval by our shareholders. The redeemable preferred stock has an initial stated value of $1,000 per share, par value of $0.01 per share and liquidation preference over common stock.
The redeemable preferred stock is convertible into shares of our common stock equal to the number of shares determined by dividing the sum of the stated value and any accrued and unpaid dividends by the conversion price of $28.162. The redeemable preferred stock
accrues dividends at a rate of 99.0 percent per annum, payable at our election either in-kind or in cash and is also entitled to participate in dividends on common stock in an amount equal to that which would have been due had the shares been converted into common stock.
We may mandate conversion of the redeemable preferred stock if the price of the common stock exceeds $84.49. TPGThe holder may redeem the shares upon the occurrence of any of the following events (referred to as a “redemption event”): a change in control, recapitalization, merger, sale of substantially all of the Company’s assets, liquidation or delisting of the Company’s common stock. In addition, as originally issued, TPGthe holder has the right, at its option, to unconditionally redeem the shares at any time after May 23, 2024, subsequently extended to September 14, 2025 (the “redemption date”).2025. We may, at our option, redeem in whole at any time all of the shares of redeemable preferred stock outstanding. At redemption by either party, the redemption value will be the greater of two times the initial face value ($150.0 million) and any accrued unpaid dividends or dividends paid-in-kind, currently $300.0 million, or the product of the number of common shares into which the redeemable preferred stock could be converted (approximately 5.3(5.3 million shares currently) and the then current market price of the common stock. We have determined that the conversion option and the redemption option exercisable upon occurrence of a “redemption event” which are embedded in the redeemable preferred stock must be accounted for separately from the redeemable preferred stock as a derivative liability.
Since the redeemable preferred stock may be redeemed at the option of the holder, but is not mandatorily redeemable, the redeemable preferred stock has been classified as mezzanine equity and initially recognized at fair value of $150.0 million (the proceeds on the date of issuance) less issuance costs of $3.7 million resulting in an initial value of $146.3 million. This amount was further reduced byand $10.9 million assigned to the embedded derivative liability at date of issuance, resulting in an adjusted initial value of $135.5 million.
The difference between the adjusted initial value of $135.5 million and the redemption value of $300 million wasthe redeemable preferred stock and the carrying value (the “premium”) is being accreted over theseven-year period from the date of issuance through May 23, 2024 (the original date at which the holder had the unconditional right to redeem the shares, deemed to be the earliest likely redemption date)September 14, 2025 using the effective interest method. The accretion to the carrying value of the redeemable preferred stock is treated as a deemed dividend, recorded as a charge to retained earnings and deducted in computing earnings per share (analogous to the treatment for stated and participating dividends paid on the redeemable preferred stock).
On November 7, 2018, the Company filed a Certificate of Correction to the Certificate of Designations for the preferred stock, which became effective upon filing and corrected the redemption date to September 14, 2025. This resulted in a modification of the redeemable preferred stock. As a result of the modification, the carrying value of the redeemable preferred stock decreased $17.2 million (which was credited to retained earnings, treated as a deemed dividend and is added back to compute earnings per share) and the period for The cumulative premium accretion of the carrying value to the redemption value has been extended to September 14, 2025. The accretion has been adjusted to amortize the excess of the redemption value over the carrying value over the period through September 14, 2025. The accumulated accretion net of the modification adjustment as of September 30, 2021 and December 31, 2020 is $39.1was $59.1 million and $43.9 million, respectively, resulting in an adjusted redeemable preferred stock balancebalances of $174.6 million.$194.6 million and $179.4 million, respectively.
NOTE 11 – EUROPEAN NON-CONTROLLING REDEEMABLE EQUITY
On May 30, 2017, the Company acquired 92.3 percent of the outstanding shares of Uniwheels, Inc.UNIWHEELS AG. Subsequently, the Company commenced a delisting and associated tender offer for the remaining shares. On January 17, 2018, the Company entered into a Domination and Profit and Loss Transfer agreement (“DPLTA”) retroactively effective as of January 1, 2018 pursuant to which we offered to purchase the remaining outstanding shares at €62.18. This price may be subject to change based on appraisal proceedings initiated by the minority shareholders which have not yet been concluded. The Company must also pay an annual dividend of €3.23 as long as the DPLTA is in effect. For any shares tendered prior to the annual dividend payment, we must pay interest at a statutory rate, currently 4.12 percent, in place of the dividend. As a result non-controlling interests with a carrying value of $51.9 million were reclassified from stockholders’ equity to mezzanine equity as of January 1, 2018 because non-controlling interests with redemption rights (not within the Company’s control) are considered redeemable and must be classified outside shareholders’ equity. As a result of purchases pursuant to the tender offer and the DPLTA, the Company has increased its ownership to 99.9 percent as of September 30, 2020. In addition, the carrying value of the non-controlling interests must be adjusted to redemption value since they are currently redeemable.2021. The following table summarizes the European non-controlling redeemable equity activity through the period ended September 30, 2020 (in thousands):2021:
Balance at December 31, 2018 |
| $ | 13,849 |
| ||||
Dividends accrued |
|
| 566 |
| ||||
Dividends paid |
|
| (848 | ) | ||||
Translation adjustment |
|
| (361 | ) | ||||
Purchase of shares |
|
| (6,681 | ) | ||||
(Dollars in thousands) |
|
|
|
| ||||
Balance at December 31, 2019 |
|
| 6,525 |
|
| $ | 6,525 |
|
Dividends accrued |
|
| 152 |
|
|
| 205 |
|
Dividends paid |
|
| (45 | ) |
|
| (46 | ) |
Translation adjustment |
|
| (71 | ) |
|
| 2 |
|
Purchase of shares |
|
| (4,981 | ) |
|
| (5,020 | ) |
Balance at September 30, 2020 |
| $ | 1,580 |
| ||||
Balance at December 31, 2020 |
|
| 1,666 |
| ||||
Dividends accrued |
|
| 134 |
| ||||
Dividends paid |
|
| (3 | ) | ||||
Translation adjustment |
|
| (156 | ) | ||||
Purchase of shares |
|
| (89 | ) | ||||
Balance at September 30, 2021 |
| $ | 1,552 |
| ||||
NOTE 12 – EARNINGS PER SHARE
Basic earnings per share is computed by dividing net income (loss), after deducting preferred dividends and accretion and European non-controlling redeemable equity dividends, by the weighted average number of common shares outstanding. For purposes of calculating diluted earnings per share, the weighted average shares outstanding includes the dilutive effect of outstanding stock options and time and performance based restricted stock units under the treasury stock method. The redeemable preferred shares discussed in Note 10, “Redeemable Preferred Stock” have not been included in the diluted earnings per share because the conversioninclusion of such shares on an as converted basis would be anti-dilutive for the three and nine months ended September 30, 20202021 and 2019.2020.
|
|
|
|
|
|
| ||||||||||||||||||||||||||
|
| Three Months Ended |
|
| Nine Months Ended |
|
| Three Months Ended |
|
| Nine Months Ended |
| ||||||||||||||||||||
|
| September 30, 2020 |
|
| September 30, 2019 |
|
| September 30, 2020 |
|
| September 30, 2019 |
|
| September 30, 2021 |
|
| September 30, 2020 |
|
| September 30, 2021 |
|
| September 30, 2020 |
| ||||||||
(Dollars in thousands, except per share amounts) |
|
|
|
|
|
|
|
|
|
|
|
|
|
|
|
|
|
|
|
|
|
|
|
|
|
|
|
|
|
|
|
|
Basic Earnings Per Share: |
|
|
|
|
|
|
|
|
|
|
|
|
|
|
|
|
|
|
|
|
|
|
|
|
|
|
|
|
|
|
|
|
Net income (loss) |
| $ | 11,146 |
|
| $ | (6,631 | ) |
| $ | (222,154 | ) |
| $ | 2,589 |
| ||||||||||||||||
Net (loss) income |
| $ | (7,180 | ) |
| $ | 11,146 |
|
| $ | 7,637 |
|
| $ | (222,154 | ) | ||||||||||||||||
Less: Redeemable preferred stock dividends and accretion |
|
| (8,056 | ) |
|
| (7,587 | ) |
|
| (23,811 | ) |
|
| (23,275 | ) |
|
| (8,598 | ) |
|
| (8,056 | ) |
|
| (25,310 | ) |
|
| (23,811 | ) |
Less: European non-controlling redeemable equity dividend |
|
| (106 | ) |
|
| (113 | ) |
|
| (152 | ) |
|
| (496 | ) |
|
| (96 | ) |
|
| (106 | ) |
|
| (134 | ) |
|
| (152 | ) |
Basic numerator |
| $ | 2,984 |
|
| $ | (14,331 | ) |
| $ | (246,117 | ) |
| $ | (21,182 | ) |
| $ | (15,874 | ) |
| $ | 2,984 |
|
| $ | (17,807 | ) |
| $ | (246,117 | ) |
Basic earnings (loss) per share |
| $ | 0.12 |
|
| $ | (0.57 | ) |
| $ | (9.66 | ) |
| $ | (0.84 | ) | ||||||||||||||||
Basic (loss) earnings per share |
| $ | (0.61 | ) |
| $ | 0.12 |
|
| $ | (0.69 | ) |
| $ | (9.66 | ) | ||||||||||||||||
Weighted average shares outstanding – Basic |
|
| 25,592 |
|
|
| 25,127 |
|
|
| 25,466 |
|
|
| 25,089 |
|
|
| 26,129 |
|
|
| 25,592 |
|
|
| 25,938 |
|
|
| 25,466 |
|
Diluted Earnings Per Share: |
|
|
|
|
|
|
|
|
|
|
|
|
|
|
|
|
|
|
|
|
|
|
|
|
|
|
|
|
|
|
|
|
Net income (loss) |
| $ | 11,146 |
|
| $ | (6,631 | ) |
| $ | (222,154 | ) |
| $ | 2,589 |
| ||||||||||||||||
Net (loss) income |
| $ | (7,180 | ) |
| $ | 11,146 |
|
| $ | 7,637 |
|
| $ | (222,154 | ) | ||||||||||||||||
Less: Redeemable preferred stock dividends and accretion |
|
| (8,056 | ) |
|
| (7,587 | ) |
|
| (23,811 | ) |
|
| (23,275 | ) |
|
| (8,598 | ) |
|
| (8,056 | ) |
|
| (25,310 | ) |
|
| (23,811 | ) |
Less: European non-controlling redeemable equity dividend |
|
| (106 | ) |
|
| (113 | ) |
|
| (152 | ) |
|
| (496 | ) |
|
| (96 | ) |
|
| (106 | ) |
|
| (134 | ) |
|
| (152 | ) |
Diluted numerator |
| $ | 2,984 |
|
| $ | (14,331 | ) |
| $ | (246,117 | ) |
| $ | (21,182 | ) |
| $ | (15,874 | ) |
| $ | 2,984 |
|
| $ | (17,807 | ) |
| $ | (246,117 | ) |
Diluted earnings (loss) per share |
| $ | 0.12 |
|
| $ | (0.57 | ) |
| $ | (9.66 | ) |
| $ | (0.84 | ) | ||||||||||||||||
Diluted (loss) earnings per share |
| $ | (0.61 | ) |
| $ | 0.12 |
|
| $ | (0.69 | ) |
| $ | (9.66 | ) | ||||||||||||||||
Weighted average shares outstanding – Basic |
|
| 25,592 |
|
|
| 25,127 |
|
|
| 25,466 |
|
|
| 25,089 |
|
|
| 26,129 |
|
|
| 25,592 |
|
|
| 25,938 |
|
|
| 25,466 |
|
Dilutive effect of common share equivalents |
|
| 118 |
|
|
| — |
|
|
| — |
|
|
| — |
|
|
| — |
|
|
| 118 |
|
|
| — |
|
|
| — |
|
Weighted average shares outstanding – Diluted |
|
| 25,710 |
|
|
| 25,127 |
|
|
| 25,466 |
|
|
| 25,089 |
|
|
| 26,129 |
|
|
| 25,710 |
|
|
| 25,938 |
|
|
| 25,466 |
|
NOTE 13 - INCOME TAXES
The estimated annual effective tax rate is forecasted quarterly using actual historical information and forward-looking estimates and applied to year-to-date ordinary income. The tax effects of unusual or infrequently occurring items, including changes in judgment about valuation allowances, settlements with taxing authorities and effects of changes in tax laws or rates, are reported in the interim period in which they occur.
The income tax provision for the three and nine months ended September 30, 2021 was $1.8 million and $3.6 million, respectively, on pre-tax loss of $5.3 million and pre-tax earnings of $11.2 million, resulting in effective income tax rates of (34.5) percent and 31.9 percent, respectively. The effective income tax rate for the three months ended September 30, 2021 differs from the statutory rate primarily due to U.S. valuation allowances and the mix of earnings among tax jurisdictions. The effective income tax rate for the nine months ended September 30, 2021 differs from the statutory rate primarily due to U.S. valuation allowances and the mix of earnings among tax jurisdictions, partially offset by a favorable adjustment to a tax credit and the reversal of an uncertain tax position.
The income tax benefit for the three and nine months ended September 30, 2020 was $3.9 million and $11.1 million, respectively, on pre-tax earnings of $7.2 million and pre-tax loss of $233.3 million, respectively, resulting in an effective income tax raterates of (53.8) percent and 4.8 percent, respectively.
The effective income tax rate for the three months endingended September 30, 2020 differsdiffered from the statutory rate primarily due to the mix of earnings among tax jurisdictions, and recognition of a valuation allowance on non-deductible interest.
The effective income tax rate for the nine months endingended September 30, 2020 differsdiffered from the statutory rate primarily due to the impairment of goodwill for which there is no corresponding tax benefit, the mix of earnings among tax jurisdictions, and recognition of a valuation allowance on non-deductible interest.
The income tax benefit and provision for the three and nine months ended September 30, 2019 was $4.8 and $7.7 million, resulting in an effective income tax rate of 41.9 percent and 75.0 percent, respectively. The effective tax rate was higher than the statutory rate primarily due to the United States taxation of foreign earnings under the Global Intangible Low-Tax Income (“GILTI”) provisions, and the recognition of a valuation allowance on non-deductible interest, partially offset by a benefit due to the mix of earnings among tax jurisdictions.
NOTE 14 - LEASES
The Company determines whether an arrangement is or contains a lease at the inception of the arrangement. Operating leases are included in other non-current assets, accrued expenses and other non-current liabilities in our condensed consolidated balance sheets. Finance leases are included in property, plant and equipment, net, short-term debt and long-term debt (less current portion) in our condensed consolidated balance sheets.
Right-of-use (“ROU”) assets represent our right to use an underlying asset for the lease term and lease liabilities represent our obligation to make lease payments arising from the lease. OperatingFinance and operating lease ROU assets and liabilities are recognized at the commencement date based on the present value of the lease payments over the lease term. Since we generally do not have access to the interest rate implicit in the lease, the Company uses our incremental borrowing rate (for fully collateralized debt) at the inception of the lease in determining the present value of the lease payments. The implicit rate is, however, used where readily available. Lease expense under operating leases is recognized on a straight-line basis over the term of the lease. Certain of our leases contain both lease and non-lease components, which are accounted for separately.
The Company has operating and finance leases for office facilities, a data center and certain equipment. The remaining terms of our leases range from over one year to just under nineeight years. Certain leases include options to extend the lease term for up to ten years, as well as options to terminate which have been excluded from the term of the lease since exercise of these options is not reasonably certain.
Lease expense and cash flow for the three and nine months ended September 30, 20202021 and 20192020 and operating and finance lease assets and liabilities, average lease term and average discount rate as of September 30, 20202021 and December 31, 20192020 are as follows:
|
| Three Months Ended |
|
| Nine Months Ended |
|
|
| Three Months Ended |
|
| Nine Months Ended |
| ||||||||||||||||||||
|
| September 30, 2020 |
|
| September 30, 2019 |
|
| September 30, 2020 |
|
| September 30, 2019 |
|
|
| September 30, 2021 |
|
| September 30, 2020 |
|
| September 30, 2021 |
|
| September 30, 2020 |
| ||||||||
(Dollars in thousands) |
|
|
|
|
|
|
|
|
|
|
|
|
|
|
|
| |||||||||||||||||
Lease Expense |
|
|
|
|
|
|
|
|
|
|
|
|
|
|
|
|
|
|
|
|
|
|
|
|
|
|
|
|
|
|
|
|
|
Finance lease expense: |
|
|
|
|
|
|
|
|
|
|
|
|
|
|
|
|
|
|
|
|
|
|
|
|
|
|
|
|
|
|
|
|
|
Amortization of right-of-use assets |
| $ | 615 |
|
| $ | 548 |
|
| $ | 906 |
|
| $ | 1,551 |
|
|
| $ | 335 |
|
| $ | 615 |
|
| $ | 1,006 |
|
| $ | 906 |
|
Interest on lease liabilities |
|
| 43 |
|
|
| 34 |
|
|
| 63 |
|
|
| 65 |
|
|
|
| 20 |
|
|
| 43 |
|
|
| 65 |
|
|
| 63 |
|
Operating lease expense |
|
| 1,699 |
|
|
| 846 |
|
|
| 2,534 |
|
|
| 2,560 |
|
|
|
| 727 |
|
|
| 1,699 |
|
|
| 2,375 |
|
|
| 2,534 |
|
Total lease expense |
| $ | 2,357 |
|
| $ | 1,428 |
|
| $ | 3,503 |
|
| $ | 4,176 |
|
|
| $ | 1,082 |
|
| $ | 2,357 |
|
| $ | 3,446 |
|
| $ | 3,503 |
|
|
|
|
|
|
|
|
|
|
|
|
|
|
|
|
|
|
|
|
|
|
|
|
|
|
|
|
|
|
|
|
|
|
|
Cash Flow Components |
|
|
|
|
|
|
|
|
|
|
|
|
|
|
|
|
|
|
|
|
|
|
|
|
|
|
|
|
|
|
|
|
|
Cash paid for amounts included in the measurement of lease liabilities: |
|
|
|
|
|
|
|
|
|
|
|
|
|
|
|
|
| ||||||||||||||||
Cash paid for amounts included in the measurement of lease liabilities |
|
|
|
|
|
|
|
|
|
|
|
|
|
|
|
| |||||||||||||||||
Operating cash outflows from finance leases |
| $ | 43 |
|
| $ | 34 |
|
| $ | 63 |
|
| $ | 65 |
|
|
| $ | 20 |
|
| $ | 43 |
|
| $ | 65 |
|
| $ | 63 |
|
Operating cash outflows from operating leases |
|
| 1,818 |
|
|
| 821 |
|
|
| 2,692 |
|
|
| 2,484 |
|
|
|
| 884 |
|
|
| 1,818 |
|
|
| 2,687 |
|
|
| 2,692 |
|
Financing cash outflows from finance leases |
|
| 467 |
|
|
| 381 |
|
|
| 723 |
|
|
| 1,035 |
|
|
|
| 367 |
|
|
| 467 |
|
|
| 1,012 |
|
|
| 723 |
|
Right-of-use assets obtained in exchange for finance lease liabilities, net of terminations and disposals |
|
| 180 |
|
|
| 1,292 |
|
|
| 252 |
|
|
| 1,803 |
|
|
|
| 50 |
|
|
| 180 |
|
|
| 885 |
|
|
| 252 |
|
Right-of-use assets obtained in exchange for operating lease liabilities, net of terminations and disposals |
|
| 422 |
|
|
| 12 |
|
|
| 637 |
|
|
| 18,353 |
|
|
|
| 76 |
|
|
| 422 |
|
|
| 284 |
|
|
| 637 |
|
|
|
|
|
|
|
|
|
|
|
|
|
|
|
|
|
|
|
|
|
|
|
|
|
|
|
|
|
|
|
|
|
|
|
|
|
|
|
|
|
|
|
|
|
|
|
|
|
|
|
|
|
|
|
|
|
|
|
|
|
|
|
|
|
|
|
|
|
|
| September 30, 2020 |
|
| December 31, 2019 |
|
|
|
|
|
|
|
|
|
|
|
|
|
|
|
|
|
|
| September 30, 2021 |
|
| December 31, 2020 |
| ||||
(Dollars in thousands, except lease term and discount rate) |
|
|
|
|
|
|
|
|
|
|
|
|
|
|
|
| |||||||||||||||||
Balance Sheet Information |
|
|
|
|
|
|
|
|
|
|
|
|
|
|
|
|
|
|
|
|
|
|
|
|
|
|
|
|
|
|
|
|
|
Operating leases: |
|
|
|
|
|
|
|
|
|
|
|
|
|
|
|
|
|
|
|
|
|
|
|
|
|
|
|
|
|
|
|
|
|
Other non-current assets |
| $ | 14,087 |
|
| $ | 15,201 |
|
|
|
|
|
|
|
|
|
|
|
|
|
|
|
|
|
|
| $ | 11,442 |
|
| $ | 13,598 |
|
Accrued liabilities |
| $ | (2,926 | ) |
| $ | (2,949 | ) |
|
|
|
|
|
|
|
|
|
|
|
|
|
|
|
|
|
| $ | (2,473 | ) |
| $ | (2,868 | ) |
Other non-current liabilities |
|
| (12,120 | ) |
|
| (13,282 | ) |
|
|
|
|
|
|
|
|
|
|
|
|
|
|
|
|
|
|
| (9,509 | ) |
|
| (11,513 | ) |
Total operating lease liabilities |
| $ | (15,046 | ) |
| $ | (16,231 | ) |
|
|
|
|
|
|
|
|
|
|
|
|
|
|
|
|
|
| $ | (11,982 | ) |
| $ | (14,381 | ) |
|
|
|
|
|
|
|
|
|
|
|
|
|
|
|
|
|
|
|
|
|
|
|
|
|
|
|
|
|
|
|
|
|
|
Finance leases: |
|
|
|
|
|
|
|
|
|
|
|
|
|
|
|
|
|
|
|
|
|
|
|
|
|
|
|
|
|
|
|
|
|
Property and equipment gross |
| $ | 5,299 |
|
| $ | 4,821 |
|
|
|
|
|
|
|
|
|
| ||||||||||||||||
Property, plant and equipment gross |
|
|
|
|
|
|
|
|
| $ | 6,937 |
|
| $ | 5,735 |
| |||||||||||||||||
Accumulated depreciation |
|
| (3,024 | ) |
|
| (2,118 | ) |
|
|
|
|
|
|
|
|
|
|
|
|
|
|
|
|
|
|
| (4,325 | ) |
|
| (3,319 | ) |
Property and equipment, net |
| $ | 2,275 |
|
| $ | 2,703 |
|
|
|
|
|
|
|
|
|
| ||||||||||||||||
Property, plant and equipment, net |
|
|
|
|
|
|
|
|
| $ | 2,612 |
|
| $ | 2,416 |
| |||||||||||||||||
Current portion of long-term debt |
| $ | (893 | ) |
| $ | (1,023 | ) |
|
|
|
|
|
|
|
|
|
|
|
|
|
|
|
|
|
| $ | (1,075 | ) |
| $ | (1,113 | ) |
Long-term debt |
|
| (1,793 | ) |
|
| (2,045 | ) |
|
|
|
|
|
|
|
|
| ||||||||||||||||
Long-term debt (less current portion) |
|
|
|
|
|
|
|
|
|
| (1,865 | ) |
|
| (2,275 | ) | |||||||||||||||||
Total finance lease liabilities |
| $ | (2,686 | ) |
| $ | (3,068 | ) |
|
|
|
|
|
|
|
|
|
|
|
|
|
|
|
|
|
| $ | (2,940 | ) |
| $ | (3,388 | ) |
|
|
|
|
|
|
|
|
|
|
|
|
|
|
|
|
|
|
|
|
|
|
|
|
|
|
|
|
|
|
|
|
|
|
Lease Term and Discount Rates |
|
|
|
|
|
|
|
|
|
|
|
|
|
|
|
|
|
|
|
|
|
|
|
|
|
|
|
|
|
|
|
|
|
Weighted-average remaining lease term - finance leases (years) |
|
| 3.9 |
|
|
| 4.1 |
|
|
|
|
|
|
|
|
|
|
|
|
|
|
|
|
|
|
|
| 3.5 |
|
|
| 3.9 |
|
Weighted-average remaining lease term - operating leases (years) |
|
| 6.1 |
|
|
| 6.4 |
|
|
|
|
|
|
|
|
|
|
|
|
|
|
|
|
|
|
|
| 5.2 |
|
|
| 6.1 |
|
Weighted-average discount rate - finance leases |
|
| 3.0 | % |
|
| 2.9 | % |
|
|
|
|
|
|
|
|
|
|
|
|
|
|
|
|
|
|
| 2.8 | % |
|
| 3.0 | % |
Weighted-average discount rate - operating leases |
|
| 3.8 | % |
|
| 3.9 | % |
|
|
|
|
|
|
|
|
|
|
|
|
|
|
|
|
|
|
| 3.6 | % |
|
| 3.8 | % |
Summarized future minimum payments under our leases as of September 30, 20202021 are as follows:
|
| September 30, 2020 |
|
|
|
|
|
| Amount |
| ||||||||||
|
| Finance Leases |
|
| Operating Leases |
| ||||||||||||||
Lease Maturities (in thousands) |
|
|
|
|
|
|
|
| ||||||||||||
Three remaining months of 2020 |
| $ | 151 |
|
| $ | 1,798 |
| ||||||||||||
2021 |
|
| 1,083 |
|
|
| 3,216 |
| ||||||||||||
(Dollars in thousands) |
|
|
|
|
|
|
|
|
|
|
|
| ||||||||
Lease Maturities |
|
|
|
|
| Finance Leases |
|
| Operating Leases |
| ||||||||||
Three remaining months of 2021 |
|
|
|
|
| $ | 329 |
|
| $ | 774 |
| ||||||||
2022 |
|
| 771 |
|
|
| 2,672 |
|
|
|
|
|
|
| 1,064 |
|
|
| 2,793 |
|
2023 |
|
| 364 |
|
|
| 2,316 |
|
|
|
|
|
|
| 671 |
|
|
| 2,446 |
|
2024 |
|
| 122 |
|
|
| 2,094 |
|
|
|
|
|
|
| 243 |
|
|
| 2,198 |
|
2025 |
|
|
|
|
|
| 152 |
|
|
| 2,128 |
| ||||||||
Thereafter |
|
| 432 |
|
|
| 4,958 |
|
|
|
|
|
|
| 619 |
|
|
| 2,772 |
|
Total |
|
| 2,923 |
|
|
| 17,054 |
|
|
|
|
|
|
| 3,078 |
|
|
| 13,111 |
|
Less: Imputed interest |
|
| (237 | ) |
|
| (2,008 | ) |
|
|
|
|
|
| (138 | ) |
|
| (1,129 | ) |
Total lease liabilities, net of interest |
| $ | 2,686 |
|
| $ | 15,046 |
|
|
|
|
|
| $ | 2,940 |
|
| $ | 11,982 |
|
NOTE 15 – RETIREMENT PLANS
We have an unfunded salary continuation plan covering certain directors, officers and other key members of management. Subject to certain vesting requirements, the plan provides for a benefit based on final average compensation, which becomes payable on the employee’s death or upon attaining age 65, if retired. The plan was closed to new participants effective February 3, 2011.
For the nine months ended September 30, 2020,2021, payments to retirees or their beneficiaries totaled approximately $1.1 million. We presently anticipate benefit payments in 20202021 to total approximately $1.3$1.4 million. The following table summarizes the components of net periodic pension cost for the three and nine months ended September 30, 20202021 and 2019.2020.
|
| Three Months Ended |
|
| Nine Months Ended |
|
| Three Months Ended |
|
| Nine Months Ended |
| ||||||||||||||||||||
|
| September 30, 2020 |
|
| September 30, 2019 |
|
| September 30, 2020 |
|
| September 30, 2019 |
|
| September 30, 2021 |
|
| September 30, 2020 |
|
| September 30, 2021 |
|
| September 30, 2020 |
| ||||||||
(Dollars in thousands) |
|
|
|
|
|
|
|
|
|
|
|
|
|
|
|
|
|
|
|
|
|
|
|
|
|
|
|
|
|
|
|
|
Interest cost |
| $ | 251 |
|
| $ | 286 |
|
| $ | 753 |
|
| $ | 858 |
|
| $ | 206 |
|
| $ | 251 |
|
| $ | 618 |
|
| $ | 753 |
|
Net amortization |
|
| 72 |
|
|
| 52 |
|
|
| 216 |
|
|
| 156 |
|
|
| 96 |
|
|
| 72 |
|
|
| 290 |
|
|
| 216 |
|
Net periodic pension cost |
| $ | 323 |
|
| $ | 338 |
|
| $ | 969 |
|
| $ | 1,014 |
|
| $ | 302 |
|
| $ | 323 |
|
| $ | 908 |
|
| $ | 969 |
|
NOTE 16 - STOCK-BASED COMPENSATION
Equity Incentive Plan
Our 2018 Equity Incentive Plan (the “Plan”) was approved by stockholders in May 2018. The Plan authorizes2018, authorizing us to issue up to 4.35 million shares of common stock, along with non-qualified stock options, stock appreciation rights, restricted stock and performance units to our officers, key employees, non-employee directors and consultants. In May 2021, the stockholders approved an amendment to the Plan that, among other things, increased the authorized shares by 2 million. At September 30, 2020,2021, there were 0.61.3 million shares available for future grants under this Plan. No more than 1.2 million shares may be used under the Plan as “full value” awards, which include restricted stock and performance units. It is our policy to issue shares from authorized but not issued shares upon the exercise of stock options.
Under the terms of the Plan, each year eligible participants are granted time value restricted stock units (“RSUs”), vesting ratably over a three-year period, and performance restricted stock units (“PSUs”), with three-year cliff vesting. Upon vesting, each restricted stock award is exchangeable for one share of the Company’s common stock, with accrued dividends.
Other Awards
On May 16, 2019 the Company granted the following equity awards to our then new President and Chief Executive Officer in connection with the 2019 Inducement Grant Plan (the “Inducement Plan”): (i) an initial award consisting of (a) 666,667 PSUs at target, vesting in three approximately equal installments, to the extent the performance metrics are satisfied, during each of three performance periods and (b) 333,333 RSUs, vesting in approximately equal installments on February 28, 2020, 2021 and 2022; (ii) a 2019-2021 PSU grant, with the target number of 316,832 PSUs, which will vest to the extent the performance metrics are satisfied; and (iii) a 2019 RSU grant of 158,416 RSUs, vesting in approximately equal installments on February 28, 2020, 2021 and 2022. The PSU awards may be earned at up to 200 percent of target depending on the level of achievement of the performance metrics.
Restricted stock unit, and restricted performance stock unit and option activity for the nine months ended September 30, 20202021 is summarized in the following table:
|
| Equity Incentive Awards |
|
| Equity Incentive Awards |
| ||||||||||||||||||||||||||||||||||||||||||
|
| Restricted Stock Units |
|
| Weighted Average Grant Date Fair Value |
|
| Performance Shares |
|
| Weighted Average Grant Date Fair Value |
|
| Options |
|
| Weighted Average Exercise Price |
|
| Restricted Stock Units |
|
| Weighted Average Grant Date Fair Value |
|
| Performance Shares |
|
| Weighted Average Grant Date Fair Value |
|
| Options |
|
| Weighted Average Exercise Price |
| ||||||||||||
Balance at December 31, 2019 |
|
| 1,047,256 |
|
| $ | 5.39 |
|
|
| 1,548,793 |
|
| $ | 7.17 |
|
|
| 50,250 |
|
| $ | 18.86 |
| ||||||||||||||||||||||||
Balance at December 31, 2020 |
|
| 1,213,667 |
|
| $ | 3.59 |
|
|
| 2,176,290 |
|
| $ | 4.88 |
|
|
| 24,000 |
|
| $ | 20.39 |
| ||||||||||||||||||||||||
Granted |
|
| 634,317 |
|
|
| 2.87 |
|
|
| 948,636 |
|
|
| 3.25 |
|
|
| — |
|
|
| — |
|
|
| 411,291 |
|
|
| 5.94 |
|
|
| 653,438 |
|
|
| 8.41 |
|
|
| — |
|
|
| — |
|
Settled |
|
| (401,723 | ) |
|
| 6.14 |
|
|
| (245,713 | ) |
|
| 5.05 |
|
|
| — |
|
|
| — |
|
|
| (606,004 | ) |
|
| 3.30 |
|
|
| (193,778 | ) |
|
| 5.45 |
|
|
| — |
|
|
| — |
|
Forfeited or expired |
|
| (195,540 | ) |
|
| 4.27 |
|
|
| (334,141 | ) |
|
| 7.44 |
|
|
| (26,250 | ) |
|
| 17.46 |
|
|
| (32,525 | ) |
|
| 8.13 |
|
|
| (151,369 | ) |
|
| 12.61 |
|
|
| (15,000 | ) |
|
| 22.57 |
|
Balance at September 30, 2020 |
|
| 1,084,310 |
|
| $ | 3.84 |
|
|
| 1,917,575 |
|
| $ | 5.28 |
|
|
| 24,000 |
|
| $ | 20.39 |
| ||||||||||||||||||||||||
Balance at September 30, 2021 |
|
| 986,429 |
|
| $ | 4.60 |
|
|
| 2,484,581 |
|
| $ | 6.67 |
|
|
| 9,000 |
|
| $ | 16.76 |
| ||||||||||||||||||||||||
|
|
|
|
|
|
|
|
|
|
|
|
|
|
|
|
|
|
|
|
|
|
|
|
|
|
|
|
|
|
|
|
|
|
|
|
|
|
|
|
|
|
|
|
|
|
|
|
|
Vested or expected to vest at September 30, 2020 |
|
| 981,873 |
|
| $ | 3.82 |
|
|
| 323,862 |
|
| $ | 7.79 |
|
|
| 24,000 |
|
| $ | 20.39 |
| ||||||||||||||||||||||||
Awards estimated to vest in the future |
|
| 945,154 |
|
| $ | 4.65 |
|
|
| 2,080,561 |
|
| $ | 6.82 |
|
|
| 9,000 |
|
| $ | 16.76 |
| ||||||||||||||||||||||||
Stock-based compensation expense was $0.5 million and $1.8 million for the three months ended September 30, 2021 and 2020 was $2.5 million and 2019,$0.5 million, respectively. Stock-based compensation expense was $1.2 million and $3.7 million for the nine months ended September 30, 2021 and 2020 was $6.8 million and 2019,$1.2 million, respectively. The lowerhigher expense in 2020 (forfor the three months and nine months ended September 30, 2020)2021 was primarily attributable to the modification of the 2019 and 2020 PSU awards, substituting budgeted amounts for actual performance for the second quarter of 2020 (one of twelve quarters in the respective performance periods), to offset the impact of COVID-19. This increased stock-based compensation for the three and nine months ended September 30, 2021 by $1.2 million and $3.5 million, respectively. In addition, 2020 stock-based compensation was lower due to the reductionfirst quarter 2020 reversal of our estimates regarding the$1.2 million of previously accrued expense as a result of lower expected performance achievement, of the performance metric, to 0, in light of the global pandemic. Unrecognized stock-based compensation expense related to non-vested awards of $3.7$12.3 million is expected to be recognized over a weighted average period of approximately 1.61.7 years as of September 30, 2020.2021.
NOTE 17 – COMMITMENTS AND CONTINGENCIES
Purchase Commitments
When market conditions warrant, we may enter into purchase commitments to secure the supply of certain commodities used in the manufacture of our products, such as aluminum, natural gas and other raw materials. Prices under our aluminum contracts are based on a market index, the London Mercantile Exchange, and regional premiums for processing, transportation and alloy components which are adjusted quarterly for purchases in the ensuing quarter. Changes in aluminum prices are generally passed through to our OEM customers and adjusted on a quarterly basis. Certain of our purchase agreements include volume commitments; however, any excess commitments are generally negotiated with suppliers and those which have occurred in the past have been carried over to future periods.
Contingencies
We are party to various legal and environmental proceedings incidental to our business. Certain claims, suits and complaints arising in the ordinary course of business have been filed or are pending against us. Based on facts now known, we believe all such matters are adequately provided for, covered by insurance, are without merit and/or involve such amounts that would not materially adversely affect our consolidated results of operations, cash flows or financial position.
Casualty Loss
On July 12, 2021, the city of Werdohl, Germany, and surrounding area experienced torrential rains which resulted in extensive flooding. The flooding caused damage to our Werdohl manufacturing facility and production was temporarily halted on July 14, 2021. On July 16, 2021, operations at the facility resumed with the exception of the paint line and certain machining operations. The Company recognized an estimated casualty loss of $5.9 million related to the write-off of certain machinery and equipment, building renovation and repairs, equipment repairs and clean up expenses during the third quarter of 2021. In the third quarter of 2021, the Company received a $1.0 million advance from its insurers and accrued an estimated insurance recovery receivable of $3.4 million, subject to final settlement by the insurers, resulting in a net casualty loss of $1.5 million which was included in other expense, net in our condensed consolidated statements of income (loss). There was only nominal disruption to our ability to fulfill orders and deliver product to our customers due to the expeditious resumption of operations at the facility.
NOTE 18 – RECEIVABLES FACTORING
The Company sells certain customer trade receivables on a non-recourse basis under factoring arrangements with designated financial institutions. These transactions are accounted for as sales and cash proceeds are included in cash provided by operating activities. Factoring arrangements incorporate customary representations and warranties, including representations as to validity of amounts due, completeness of performance obligations and absence of commercial disputes. During the three months ended September 30, 20202021 and 2019,2020, the Company sold trade receivables totaling $169.8$174.4 million and $80.6$169.8 million, respectively, and incurred factoring fees of $0.4$0.5 million and $0.2$0.4 million, respectively. During the nine months ended September 30, 20202021 and 2019,2020, the Company sold trade receivables totaling $307.4$558.4 million and $272.4$307.4 million, respectively, and incurred factoring fees of $0.8$1.5 million and $0.8 million, respectively. As of September 30, 20202021 and December 31, 2019, $101.42020, receivables of $95.1 million and $49.6$96.6 million, respectively, of receivables had been factored underand had not yet been paid by customers to the arrangements.respective financial institutions. The collective limit under our factoring arrangements as of September 30, 20202021 was $115.9$127.4 million. The limit has decreased to $105.9 million as of October 15, 2020 due to a $10 million decrease in North American factoring limit. The collective limit under our factoring arrangements as of December 31, 20192020 was $117.3$132.0 million. Our factoring limit will be reduced by $11.6 million (€10 million) effective November 30, 2021.
NOTE 19 – RESTRUCTURING
During the quarter ended June 30, 2020, the Company discontinueddecided to discontinue the manufacture and sale of high performance aftermarket wheels for the automotive racing market segment. The Company incurred a total non-cash charge of $3.4 million, including $2.8 million recorded in cost of sales, comprised of $1.3 million relating to write-downs of certain after-market inventory to salvage value, $1.0 million of employee severance costs and $0.5 million in contract terminations and other costs, as well as a $0.6 million non-cash charge recorded in selling, general and administrative expense related to non-production employee severance costs. DuringIn addition, during the three-monthsix-month period ended September 30,December 31, 2020, we recognized an additional $0.4$0.7 million of severance costs.costs, including charges to costs of sales of $0.4 million and selling, general and administrative expense of $0.3 million. As of September 30, 2020, $1.5 million of2021, the restructuring severance accrual remains.benefits have been paid.
During the third quarter of 2019, the Company initiated a plan to significantly reduce production and manufacturing operations at its Fayetteville, Arkansas location. As a result, the Company recognized a non-cash charge of $13.0 million in cost of sales, principally comprised of (1) $7.6 million of accelerated depreciation for excess equipment (2) $3.2 million relating toand the write-down of certain supplies inventory to net salvage value, (3) $1.6 million of employee severance and (4) $0.6 million of accelerated amortization of right of use assets under operating leases.value. In addition, relocation costs for redeployment of machinery and equipment of $1.8 million were recognized in the fourth quarter of 2019. During the nine months ended September 30, 2020, we recognized additional charges to cost of sales of $3.3 million, principally related to relocation costs for redeployment of machinery and equipment. During the three and nine months ended September 30, 2021, we recognized additional relocation costs in cost of sales for redeployment of machinery and equipment of $2.3$0.5 million and additional other costs of $0.4 million. Additional relocation costs are expected to be incurred over the next three months.$1.8 million, respectively. As of September 30, 2020, $0.32021, $0.2 million of the restructuring severance accrual remains. On July 15, 2021, the Company consummated the sale of the Fayetteville facility for a net sale price of $7.1 million, resulting in a gain of $4.4 million which has been credited against selling, general and administrative expenses. During the three and nine months ended September 30, 2021, the Company also incurred costs relating to environmental remediation and repairs required under the sale agreement of $0.1 million and $1.5million, respectively, which have been charged to cost of sales.
Item 2. Management’s Discussion and Analysis of Financial Condition and Results of Operations
Forward-Looking Statements
The Private Securities Litigation Reform Act of 1995 provides a safe harbor for forward-looking statements made by us or on our behalf. We have included or incorporated by reference in this Quarterly Report on Form 10-Q (including in the sectionssection entitled “Risk Factors” and “Management’s Discussion and Analysis of Financial Condition and Results of Operations”) and from time to time our management may make statements that may constitute “forward-looking statements” within the meaning of Section 27A of the Securities Exchange Act of 1933 and Section 21E of the Securities Act of 1934. These forward-looking statements are based upon management’s current expectations, estimates, assumptions and beliefs concerning future events and conditions and may discuss, among other things, the impact of COVID-19 and supply chain disruption on our future business, results, operation and prospects, anticipated future performance (including sales and earnings), expected growth, future business plans and costs and potential liability for environmental-related matters. Any statement that is not historical in nature is a forward-looking statement and may be identified using words and phrases such as “expects,” “anticipates,” “believes,” “will,”“expects”, “anticipates”, “believes”, “will”, “will likely result,”result”, “will continue,”continue”, “plans to” and similar expressions. These statements include our belief regarding general automotive industry and market conditions and growth rates, as well as general domestic and international economic conditions.
Readers are cautioned not to place undue reliance on forward-looking statements. Forward-looking statements are necessarily subject to risks, uncertainties and other factors, many of which are outside the control of the company,Company, which could cause actual results to differ materially from such statements and from the company’sCompany’s historical results and experience. These risks, uncertainties and other factors include, but are not limited to, those described in Part I—Item 1A—“Risk Factors” and Part II—Item 7—“Management’s Discussion and Analysis of Financial Condition and Results of Operations” of our Annual Report on Form 10-K for the year ended December 31, 2019, Part II —Item 1A—“Risk Factors” of our Quarterly Report on Form 10-Q for the quarters ended March 31, 2020 and June 30, 2020 and Part I—Item 2—“Management’s Discussion and Analysis of Financial Condition and Results of Operations” as well as Part II—Item 1A—“Risk Factors” of this Quarterly Report on Form 10-Q and elsewhere in thethis Quarterly Report and those described from time to time in our other reports filed with the Securities and Exchange Commission.SEC.
Readers are cautioned that it is not possible to predict or identify all the risks, uncertainties and other factors that may affect future results and that the risks described herein should not be considered to be a complete list. Any forward-looking statement speaks only as of the date on which such statement is made, and the companyCompany undertakes no obligation to update or revise any forward-looking statement, whether as a result of new information, future events or otherwise.
Management’s Discussion and Analysis of Financial Condition and Results of Operations should be read in conjunction with the accompanying unaudited condensed consolidated financial statements and notes thereto and with the audited consolidated financial statements and notes thereto and Management’s Discussion and Analysis of Financial Condition and Results of Operations included in our Annual Report on Form 10-K for the year ended December 31, 2019.2020.
Executive Overview
Overview of Superior
Superior Industries International, Inc.’s (referred herein as the “Company,” “Superior,”“Company”, “Superior”, or “we” and “our”) principal business is the design and manufacture of aluminum wheels for sale to original equipment manufacturers (OEMs)(“OEMs”) in North America and Europe and to the aftermarket distributors in Europe. We employ approximately 7,5008,000 full-time employees, operating in eight manufacturing facilities in North America and Europe with a combined annual manufacturing capacity of approximately 20 million wheels.Europe. We are one of the largest aluminum wheel suppliers to global OEMs and we believe we are the #1 European aluminum wheel aftermarket manufacturer and supplier. Our OEM aluminum wheels accounted for approximately 92 percent of our sales in the first nine months of 20202021 and are primarily sold for factory installation on vehicle models manufactured by BMW (including Mini), Daimler AG Company (Mercedes-Benz, AMG, Smart), FCA, Ford, GM, Honda, Jaguar-Land Rover, Lucid Motors, Mazda, Mitsubishi, Nissan, PSA, Renault, Stellantis, Subaru, Suzuki, Toyota, VW Group (Volkswagen, Audi, SEAT, Skoda, Porsche, Bentley) and Volvo. We sell aluminum wheels to the European aftermarket under the brands ATS, RIAL, ALUTEC and ANZIO. North America and Europe represent the principal markets for our products, but we have a diversified global presence and diversified customer base consisting of North American, European and Asian OEMs. We continue to deliver on our strategic plan to be one of the leading light vehicle aluminum wheel suppliers globally, delivering innovative wheel solutions to our customers.
Our global reach encompasses sales to the ten largest OEMs in the world. The following chart shows our sales by customer for the nine months ended September 30, 2020 and 2019.
Demand for our products is primarily driven by the production of light vehicles in North America and Europe and customer take rates on specific vehicle platforms that we serve and wheel SKUs that we produce. The majority of our customers’ wheel programs are awarded two to four years in advance. Our purchase orders with OEMs are typically specific to a particular vehicle model.
COVID-19 Pandemic Overview
DuringGM, VW Group and Ford were our only customers individually accounting for 10 percent or more of our consolidated sales for the three and nine months ended September 30, 2021 and 2020. Our sales to these customers in 2021 and 2020 were as follows:
Three months ended |
| September 30, 2021 |
|
| September 30, 2020 |
| ||||||||||
(Dollars in millions) |
| Percent of Sales |
|
| Dollars |
|
| Percent of Sales |
|
| Dollars |
| ||||
GM |
| 26% |
|
| $ | 80.6 |
|
| 27% |
|
| $ | 85.6 |
| ||
VW Group |
| 11% |
|
| $ | 34.9 |
|
| 14% |
|
| $ | 46.0 |
| ||
Ford |
| 16% |
|
| $ | 49.3 |
|
| 13% |
|
| $ | 38.0 |
| ||
|
|
|
|
|
|
|
|
|
|
|
|
|
|
|
|
|
|
|
|
|
|
|
|
|
|
|
|
|
|
|
|
|
|
Nine months ended |
| September 30, 2021 |
|
| September 30, 2020 |
| ||||||||||
(Dollars in millions) |
| Percent of Sales |
|
| Dollars |
|
| Percent of Sales |
|
| Dollars |
| ||||
GM |
| 27% |
|
| $ | 268.1 |
|
| 24% |
|
| $ | 185.6 |
| ||
VW Group |
| 14% |
|
| $ | 142.8 |
|
| 15% |
|
| $ | 118.5 |
| ||
Ford |
| 13% |
|
| $ | 129.4 |
|
| 12% |
|
| $ | 90.3 |
| ||
Effect of COVID-19 Pandemic
In 2020, the impact of the COVID-19 pandemic and uncertainty with respect to the economic effects of the pandemic introduced significant volatility in the financial markets and continues to havehad a widespread adverse effect on the automotive industry, including reductions in consumer demand and OEM automotive production.industry.
While navigating through this period of volatility and uncertainty, Superior’s top priorities continue to be:were:
| • | Ensuring the health and safety of our employees |
| • | Maintaining the financial health of the Company, and |
| • | Serving our customers. |
Consistent with these priorities,In order to ensure the health and safety of our employees globally and respond to the then current industry production environment, we closed production at our European facilities in late March 2020. In North America, our manufacturing operations ceased production in early April 2020. The Company reopened all of its facilities by June 1, 2020, in line with productionindustry demand and finished goods levels, and in accordance with local government requirements.
To ensure the health and safety of its employees, Superior has developed and is executing a Safe Work Playbook across its footprint in connection with our employees’ return to work. We have also instituted a Global Employee Health & Safety (“EH&S”) Steering Team, led by our Director of EH&S, and comprised of our global and regional leaders from Operations and Human Resources. We have invested in facility updates to ensure social distancing, including changes in cafeteria layout and practices, transportation services and marked spacing throughout our manufacturing facilities. In the event of a COVID-19 incident, the local COVID-19 response team immediately executes the defined protocols, including isolation of any employee showing symptoms, and conducts traceability activities to identify and quarantine all potentially exposed individuals. Since resuming operations, the Company has identified 76 employees with COVID-19 infections, 61 of whom have returned to work and the rest are currently in quarantine. We do not believe that any of these cases arose from work related exposure based on the Company’s contact tracing procedures.
As a result, of the COVID-19 pandemic, our global units shipped for the nine months ended September 30, 2020 declined approximately 27.4 percent as compared to the nine months ended September 30, 2019. The decline began to moderate during the month of June, with units shipped declining only 12.5 percent in June as industry production volumes started to recover. The rates of decline continued to decrease during the third quarter of 2020. Our units shipped reflectedhad a decline of 10.1 percent in the third quarter of 2020 as compared to the third quarter of 2019, with North America shipments declining 4.5 percent and European shipments declining 16.0 percent year-over-year. Our volumes were down only 2.1 percent globally for September of 2020 on a year-over-year basis. The decline was due to the 5.6 percent volume decline in Europe offset by a slight increase in units shipped in North America in September 2020 as compared to September 2019. As such, our North American operations’ recovery from COVID-19 has been strong, while the European operations’ recovery has been slower (refer to the discussion under Results of Operations for further details on year-over-year comparisons and the impact of COVID-19 on our results).
While Superior experienced stronger demand from its customers during the third quarter as compared to the second quarter, the Company continued to extend cost reduction initiatives to align costs to the lower production environment. During the nine months ended September 30, 2020, Superior has executed temporary and permanent cost savings including furloughs, compensation and benefit reductions, temporary facility closures, deferral of merit increases, reduced travel, personnel restructurings, and use of government subsidies where available. While some of the temporary measures such as the wage reductions were discontinued in the third quarter as Superior restored its salaried workforce to full pay in mid-September, other temporary initiatives will remain in place through the end of the year and into 2021. In total, the cost initiatives implemented in response to the COVID-19 pandemic are expected to benefit 2020 by more than $40 million.
Based on recent IHS production forecasts, full-year 2020 industry volumes are now expected to be down approximately 22.1 percent in our key regions, 20.3 percent in North America and 23.7 percent in Western and Central Europe, as compared to the prior year. This represents a 3.2 percent improvement globally compared to the IHS forecast as of the end of the second quarter. The ultimate impact that COVID-19 will havesignificant adverse effect on our business, results of operations and financial condition will depend on a number of evolving factors that we may not be able to accurately predict, including:in 2020, but this effect had largely subsided by the duration and scopeend of the pandemic; governmental, OEMs’, suppliers’, customers’ and individuals’ actions that have been and continue to be taken in response to the pandemic; and the impact of the pandemic on economic activity and actions that continue to be taken in response to such impact by the OEMs’ suppliers and customers.year. We are continuing to monitor the resurgence of the virus, including the emergence of new virus strains and the progress of the vaccination efforts.
Industry Overview and Supply Chain Disruption
There is a broad range of factors which impact automotive industry sales and production volumes, including consumer demand and preferences, dealer inventory levels, labor relations issues, trade agreements, cost and availability of raw materials and components, fuel prices, regulatory requirements, government initiatives, availability and cost of credit, changing consumer attitudes toward vehicle ownership and other factors. Our sales are driven generally by overall automotive industry production volumes and, more specifically, by the volumes of the vehicles for which we supply wheels. In addition, favorable product mix drives higher sales since larger diameter wheels and premium finishes command higher unit prices. Larger cars and light trucks, as well as premium vehicle platforms, such as luxury, sport utility and crossover vehicles, typically employ larger diameter wheels and premium finishes.
The automotive industry has been, and will likely continue to be, impacted by the supply chain disruption which emerged as OEM vehicle production resumed and began to scale following the shutdown as a result of the COVID-19 pandemic. The supply chain disruption includes shortages of semiconductor chips, electric vehicle batteries, shipping containers, steel, resin and foam. The semiconductor chip shortage, which began to affect global automotive industry production in the first two quarters of 2021, drove significantly lower OEM vehicle production and high OEM production volatility in the third quarter of 2021. Although automotive industry production volumes in the first half of 2021 were higher than the corresponding period of the prior year, production volumes in the second half are expected to be lower. Lower production volumes coupled with OEM customer order volatility have resulted in manufacturing inefficiencies, including elevated labor, scrap and equipment change over costs. In addition, our critical commodity costs significantly increased in 2021, particularly aluminum raw materials and energy costs. While the prices under our OEM contracts are adjusted for changes in aluminum prices, our aftermarket contracts do not provide for pass through pricing on rising
commodity costs. Additionally, rising raw material costs and OEM production plans forvolatility have caused our inventory levels to increase, negatively impacting our cash flows.
Automotive industry production volumes in the remainderNorth American and Western and Central European regions in the first nine months of 2021, as compared to the year, ascorresponding periods of 2020 and 2019, are shown below:
|
|
| September 30, |
|
| 2021 vs 2020 |
| 2021 vs 2019 |
|
| |||||||||
| (Units in millions) |
| 2021 |
| 2020 |
| 2019 |
|
| % Change |
| % Change |
|
| |||||
|
|
|
|
|
|
|
|
|
|
|
|
|
|
|
|
|
|
|
|
| North America |
|
| 9.8 |
|
| 9.2 |
|
| 12.4 |
|
|
| 6.5 | % |
| (21.0 | %) |
|
| Western and Central Europe |
|
| 9.7 |
|
| 9.3 |
|
| 13.6 |
|
|
| 4.3 | % |
| (28.7 | %) |
|
|
|
|
|
|
|
|
|
|
|
|
|
|
|
|
|
|
|
|
|
| Total |
|
| 19.5 |
|
| 18.5 |
|
| 26.0 |
|
|
| 5.4 | % |
| (25.0 | %) |
|
Despite the modest 2021 year-to-date improvement over 2020, production volumes for the fourththird quarter remain somewhat uncertainof 2021 declined 28.8 percent on a year-over-year basis (25.2 percent in North America and 32.9 percent in Western and Central Europe). As a result, there has been a significant reduction in forecast industry production volume for the 2021 full year. In January 2021, the IHS forecast projected that full year 2021 automotive passenger and light truck vehicle production in North America and Western and Central Europe would increase 20.5 percent (25.1 percent in North America and 16.2 percent in Western and Central Europe) over 2020 and would lag 2019 by only 5.9 percent. The October 2021 IHS forecast now projects that the 2021 production will be 2.5 percent lower than 2020 (declining 0.2 percent in North America and 4.7 percent in Western and Central Europe) and 24.1 percent lower than 2019. While semiconductor manufacturers have announced plans to expand capacity over the next several years, it is unclear when automotive industry chip shortages will begin to subside.
Sustainability
All Superior manufacturing plants have implemented Environmental Management Systems that are ISO14001 certified and are dependent uponsubject to annual audits by an independent third party. In 2019, we assessed the progress in containingproduct carbon footprint of our European operations for the pandemic and associated impactfirst time based on the economy.Greenhouse Gas Protocol, and we assessed the carbon footprint for our operations globally in connection with our UN Global Compact Sustainability Report published in June 2021. These assessments can help us identify potential opportunities to reduce fuel consumption and greenhouse gas emissions. Superior is committed to reducing natural gas, electricity and water consumption and solid waste and air emissions at all of our facilities globally. Furthermore, our research and development team is developing automotive light weighting solutions, such as our patented Alulite™ technology, and aerodynamic solutions which will assist in reducing our customers’ carbon footprint. We are also collaborating with our suppliers regarding sustainability practices throughout their supply chains.
Overview of the Third Quarter of 20202021
The following charts show the operational performance in the quarter ended September 30, 20202021 in comparison to the quarter ended September 30, 20192020 ($ in millions):
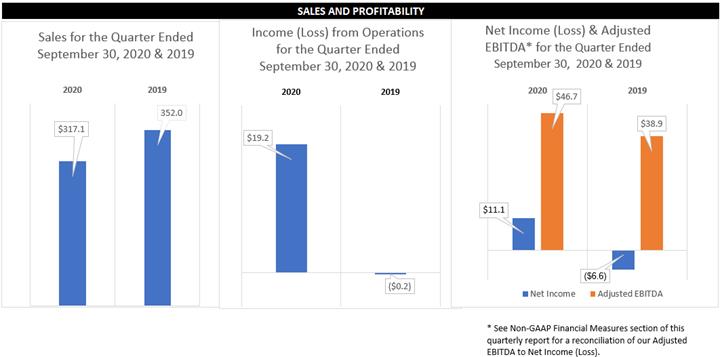
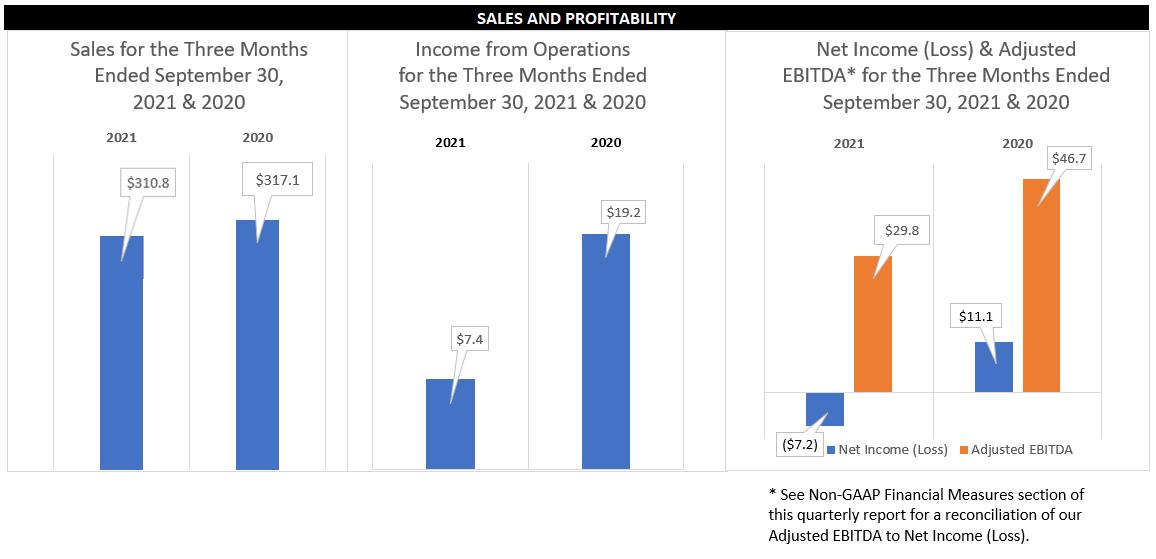
SALES AND PROFITABILITY FOR THE 3RD QUARTER OF 2019 AND 2018 ($ in millions) Sales for 3rd Quarter 2019 & 2018 $352.0 $347.6 2019 2019 Income from Operations 3rd Quarter 2019 & 2018$(0.2) $7.7 2019 218 Net Income & Adjusted EBITDA* for 3rd Quarter 2019 & 2018 Net Income Adjusted EBITDA $38.9 $30.6 $(6.6) 2019 2018 * See the Non-GAAP Financial Measures section of this quarterly report for a reconciliation of our Adjusted EBITDA to Net Income (Loss).
Results of Operations
|
| Three Months Ended |
|
|
|
|
|
| Three Months Ended |
|
|
|
|
| ||||||||||
|
| September 30, 2020 |
|
| September 30, 2019 |
|
| Net Change |
|
| September 30, 2021 |
|
| September 30, 2020 |
|
| Net Change |
| ||||||
(Dollars in thousands, except per share data) |
|
|
|
|
|
|
|
|
|
|
|
|
|
|
|
|
|
|
|
|
|
|
|
|
Net sales |
|
|
|
|
|
|
|
|
|
|
|
|
|
|
|
|
|
|
|
|
|
|
|
|
North America |
| $ | 166,662 |
|
| $ | 188,089 |
|
| $ | (21,427 | ) |
| $ | 180,496 |
|
| $ | 166,662 |
|
| $ | 13,834 |
|
Europe |
|
| 150,441 |
|
|
| 163,925 |
|
|
| (13,484 | ) |
|
| 130,284 |
|
|
| 150,441 |
|
|
| (20,157 | ) |
Net sales |
|
| 317,103 |
|
|
| 352,014 |
|
|
| (34,911 | ) |
|
| 310,780 |
|
|
| 317,103 |
|
|
| (6,323 | ) |
Cost of sales |
|
| 285,135 |
|
|
| 335,967 |
|
|
| 50,832 |
|
|
| 292,637 |
|
|
| 285,135 |
|
|
| (7,502 | ) |
Gross profit |
|
| 31,968 |
|
|
| 16,047 |
|
|
| 15,921 |
|
|
| 18,143 |
|
|
| 31,968 |
|
|
| (13,825 | ) |
Percentage of net sales |
|
| 10.1 | % |
|
| 4.6 | % |
|
| 5.5 | % |
|
| 5.8 | % |
|
| 10.1 | % |
|
| (4.3 | )% |
Selling, general and administrative |
|
| 12,730 |
|
|
| 16,290 |
|
|
| 3,560 |
|
|
| 10,769 |
|
|
| 12,730 |
|
|
| 1,961 |
|
Income (loss) from operations |
|
| 19,238 |
|
|
| (243 | ) |
|
| 19,481 |
| ||||||||||||
Income from operations |
|
| 7,374 |
|
|
| 19,238 |
|
|
| (11,864 | ) | ||||||||||||
Percentage of net sales |
|
| 6.1 | % |
|
| (0.1 | )% |
|
| 6.2 | % |
|
| 2.4 | % |
|
| 6.1 | % |
|
| (3.7 | )% |
Interest expense, net |
|
| (10,414 | ) |
|
| (11,807 | ) |
|
| 1,393 |
|
|
| (10,619 | ) |
|
| (10,414 | ) |
|
| (205 | ) |
Other (expense) income, net |
|
| (1,576 | ) |
|
| 634 |
|
|
| (2,210 | ) | ||||||||||||
Income tax benefit |
|
| 3,898 |
|
|
| 4,785 |
|
|
| (887 | ) | ||||||||||||
Net income (loss) |
| $ | 11,146 |
|
| $ | (6,631 | ) |
| $ | 17,777 |
| ||||||||||||
Other expense, net |
|
| (2,094 | ) |
|
| (1,576 | ) |
|
| (518 | ) | ||||||||||||
Income tax (provision) benefit |
|
| (1,841 | ) |
|
| 3,898 |
|
|
| (5,739 | ) | ||||||||||||
Net (loss) income |
| $ | (7,180 | ) |
| $ | 11,146 |
|
| $ | (18,326 | ) | ||||||||||||
Percentage of net sales |
|
| 3.5 | % |
|
| (1.9 | )% |
|
| 5.4 | % |
|
| (2.3 | )% |
|
| 3.5 | % |
|
| (5.8 | )% |
Diluted earnings (loss) per share |
| $ | 0.12 |
|
| $ | (0.57 | ) |
| $ | 0.69 |
| ||||||||||||
Diluted (loss) earnings per share |
| $ | (0.61 | ) |
| $ | 0.12 |
|
| $ | (0.73 | ) | ||||||||||||
Value added sales (1) |
| $ | 192,469 |
|
| $ | 195,451 |
|
| $ | (2,982 | ) |
| $ | 162,198 |
|
| $ | 192,469 |
|
| $ | (30,271 | ) |
Adjusted EBITDA (2) |
| $ | 46,723 |
|
| $ | 38,852 |
|
| $ | 7,871 |
|
| $ | 29,777 |
|
| $ | 46,723 |
|
| $ | (16,946 | ) |
Percentage of net sales |
|
| 14.7 | % |
|
| 11.0 | % |
|
| 3.7 | % |
|
| 9.6 | % |
|
| 14.7 | % |
|
| (5.1 | )% |
Percentage of value added sales |
|
| 24.3 | % |
|
| 19.9 | % |
|
| 4.4 | % |
|
| 18.4 | % |
|
| 24.3 | % |
|
| (5.9 | )% |
Unit shipments in thousands |
|
| 4,362 |
|
|
| 4,851 |
|
|
| (489 | ) |
|
| 3,500 |
|
|
| 4,362 |
|
|
| (862 | ) |
| (1) | Value added sales is a key measure that is not calculated according to U.S. GAAP. Refer to “Non-U.S. GAAP Financial Measures” for a definition of value added sales and a reconciliation of value added sales to net sales, the most comparable U.S. GAAP measure. |
| (2) | Adjusted EBITDA is a key measure that is not calculated according to U.S. GAAP. Refer to “Non-U.S. GAAP Financial Measures” for a definition of adjusted EBITDA and a reconciliation of our adjusted EBITDA to net income, the most comparable U.S. GAAP measure. |
Shipments
Wheel unit shipments were 4.43.5 million for the third quarter of 20202021 compared to unit shipments of 4.94.4 million in the prior year period, a decrease of 10.119.8 percent. The decrease was driven by lower volumes primarily within both regions due to reduced 2021 production schedules at our key European OEM customers.
customers in response to the global semiconductor supply shortage.
Net Sales
Net salesfor the third quarter of 20202021 were $317.1$310.8 million, compared to net sales of $352.0$317.1 million for the same period in 2019. 2020. The decrease in the quarter was driven by lower volumes and a decrease in both regions due to the global semiconductor supply shortage, which was offset in large part by higher aluminum prices partially offset by favorableand stronger product mix in both our North American and a stronger Euro.
European regions.
Cost of Sales
Cost of sales were $285.1$292.6 million for the third quarter of 20202021 compared to cost of sales of $336.0$285.1 million for the same period in 2019.2020. The decrease in cost of sales was primarily due toincrease, despite lower volumes in Europeboth regions, was principally driven by higher aluminum prices. Manufacturing cost performance was adversely impacted by significantly lower vehicle production and North America, lower aluminum prices, reduced headcount, the utilization of government subsidies in Europe, and the prior year rationalization of the Company’s North American manufacturing footprint.certain production inefficiencies caused by OEM production volatility.
Selling, General and Administrative Expenses
Selling, general and administrative (“SG&A”) expenses for the third quarter of 20202021 were $12.7$10.8 million compared to SG&A expense of $16.3$12.7 million for same period in 2019.2020. The decrease in SG&A expenses were lowerexpense is principally due to a $4.4 million gain recognized for the sale of our Fayetteville, Arkansas facility in 2021, partially offset by increased compensation and benefit and headcount reductions implementedexpenses due to thetemporary cost savings actions taken in 2020 in response to COVID-19 pandemic.
OEM and Superior production shutdowns.
Net Interest Expense
Net interest expense for the third quarter of 20202021 was $10.4$10.6 million compared to net interest expense of $11.8$10.4 million for same period in 2019.2020. The decreaseincrease was primarily due to increased amortization of debt issuance costs related to our revolving lines of credit during the early extinguishment of a portion of the 6% Senior Notes (the “Notes”) in 2019, additional principal repayments of the Term Loan Facility in 2019 and 2020 and current period.lower interest rates on the Term Loan Facility. This was partially offset by incremental interest expense due to the Company’s drawings on our North American and European revolvers in 2020.
Other Income (Expense)
Other expense was $1.6$2.1 million for the third quarter of 20202021 compared to other income of $0.6$1.6 million for the same period in 2019. 2020. The year-over-year change wascurrent year expense is primarily driven byattributable to cost associated with a $1.0 million gain on early extinguishment of a portion offlood at our Notes and a foreign exchange gain of $0.3 millionWerdohl, Germany facility in the third quarter of 2019 versus a foreign exchange loss of $1.4 million in the third quarter of 2020.
July, 2021.
Income Tax (Provision) Benefit
The income tax provision for the third quarter of 2021 was $1.8 million on a pre-tax loss of $5.3 million, representing an effective income tax rate of (34.5) percent. This differs from the statutory rate primarily due to U.S. valuation allowances and the mix of earnings among tax jurisdictions. The income tax benefit for the third quarter ended September 30,of 2020 was $3.9 million on a pre-tax income of $7.2 million, representing an effective income tax rate of negative 53.8(53.8) percent. This differs from the statutory rate due to the mix of earnings among tax jurisdictions and recognition of a valuation allowance on non-deductible interest. The income tax benefit for the quarter ended September 30, 2019 was $4.8 million on a pre-tax loss of $11.4 million, representing an effective income tax rate of 41.9 percent. This was higher than the statutory rate due to the United States Global Intangible Low-Tax Income (“GILTI”) provisions and the recognition of a valuation allowance on non-deductible interest, offset by a mix of earnings among tax jurisdictions.
Net Income (Loss)
Net incomeloss for the third quarter of 20202021 was $11.1$7.2 million, or earningsa loss of $0.12$0.61 per diluted share, compared to a net lossincome of $6.6$11.1 million, or a loss of $0.57$0.12 per diluted share, for the same period in 2019.
2020.
Segment Sales and Income from Operations
|
| Three Months Ended |
|
|
|
|
|
| Three Months Ended |
|
|
|
|
| ||||||||||
|
| September 30, 2020 |
|
| September 30, 2019 |
|
| Change |
|
| September 30, 2021 |
|
| September 30, 2020 |
|
| Change |
| ||||||
(Dollars in thousands) |
|
|
|
|
|
|
|
|
|
|
|
|
|
|
|
|
|
|
|
|
|
|
|
|
Selected data |
|
|
|
|
|
|
|
|
|
|
|
|
|
|
|
|
|
|
|
|
|
|
|
|
Net sales |
|
|
|
|
|
|
|
|
|
|
|
|
|
|
|
|
|
|
|
|
|
|
|
|
North America |
| $ | 166,662 |
|
| $ | 188,089 |
|
| $ | (21,427 | ) |
| $ | 180,496 |
|
| $ | 166,662 |
|
| $ | 13,834 |
|
Europe |
|
| 150,441 |
|
|
| 163,925 |
|
|
| (13,484 | ) |
|
| 130,284 |
|
|
| 150,441 |
|
|
| (20,157 | ) |
Total net sales |
| $ | 317,103 |
|
| $ | 352,014 |
|
| $ | (34,911 | ) |
| $ | 310,780 |
|
| $ | 317,103 |
|
| $ | (6,323 | ) |
Income (loss) from operations |
|
|
|
|
|
|
|
|
|
|
|
|
|
|
|
|
|
|
|
|
|
|
|
|
North America |
| $ | 16,113 |
|
| $ | (4,440 | ) |
| $ | 20,553 |
|
| $ | 12,581 |
|
| $ | 16,113 |
|
| $ | (3,532 | ) |
Europe |
|
| 3,125 |
|
|
| 4,197 |
|
|
| (1,072 | ) |
|
| (5,207 | ) |
|
| 3,125 |
|
|
| (8,332 | ) |
Total income (loss) from operations |
| $ | 19,238 |
|
| $ | (243 | ) |
| $ | 19,481 |
|
| $ | 7,374 |
|
| $ | 19,238 |
|
| $ | (11,864 | ) |
North America
Net sales for our North American segment for the third quarter of 2020 decreased 11.42021 increased 8.3 percent, compared to the same period in 20192020 predominantly due to a 4.5 percent decrease in volumeshigher aluminum prices and lower aluminum prices. The reduction in net salesstronger product mix, which was partially offset by improved product mix compriseda 17.6 percent decrease in unit volumes. For the third quarter of larger diameter wheels and premium wheel finishes.2021, North American sales were almost exclusively from Mexico, which compares to U.S. sales of 3.1 percent and Mexico sales as a percentage of North America total sales were approximately 3.1 percent and 96.9 percent, respectively, for the quarter ended September 30, 2020, which compares to 14.3 percent and 85.7 percent for the same period of the prior year. The change in North American sales by country is due to discontinuation of manufacturing activities at our Fayetteville, Arkansas location in the fourth quarter of 2019.location. North American segment income (loss) from operations for the third quarter of 20202021 was higherlower than the same period of the prior year, principally due to reduced headcountlower volumes resulting from the global semiconductor shortage and operating expenses, reduced selling and general administrative expenses and the benefits from prior year rationalization of the Company’s manufacturing footprint.
certain production inefficiencies caused by OEM production volatility, partially offset by favorable product mix.
Europe
Net sales for our European segment for the third quarter of 20202021 decreased 8.213.4 percent, compared to the same period in 2019,2020 predominantly due to a 16.022.3 percent decrease in unit volumes, and lower aluminum pricing partially offset by favorablehigher aluminum pricing and stronger product mix and Euro foreign exchange. The decline in unit shipments was mainly due to lower volumes for Superior’s key European OEM customers related to the on-going COVID-19 pandemic. mix.
European segment sales in Germany and Poland were approximately33.1 percent and 66.9 percent, respectively, for the third quarter of 2021, which compares to 38.8 percent and 61.2 percent, respectively, during the quarter ended September 30, 2020, which compares to 36.3 percent and 63.7 percent for the same period of the prior year. European segment income from operations for the third quarter in 2020 decreased compared toof 2021 was lower than the same period in 2019of the prior year, principally due to lower volumes resulting from the global semiconductor shortage and certain production volumes for our key Europeaninefficiencies caused by OEM customers related to the on-going COVID-19 pandemic, partially offset by favorable product mix, the use of government labor subsidies and reduced manufacturing headcount.production volatility.
Overview of the First Nine Months of 20202021
The following chart shows the operational performance in the nine months ended September 30, 20202021 in comparison to the nine months ended September 30, 20192020 ($ in millions):
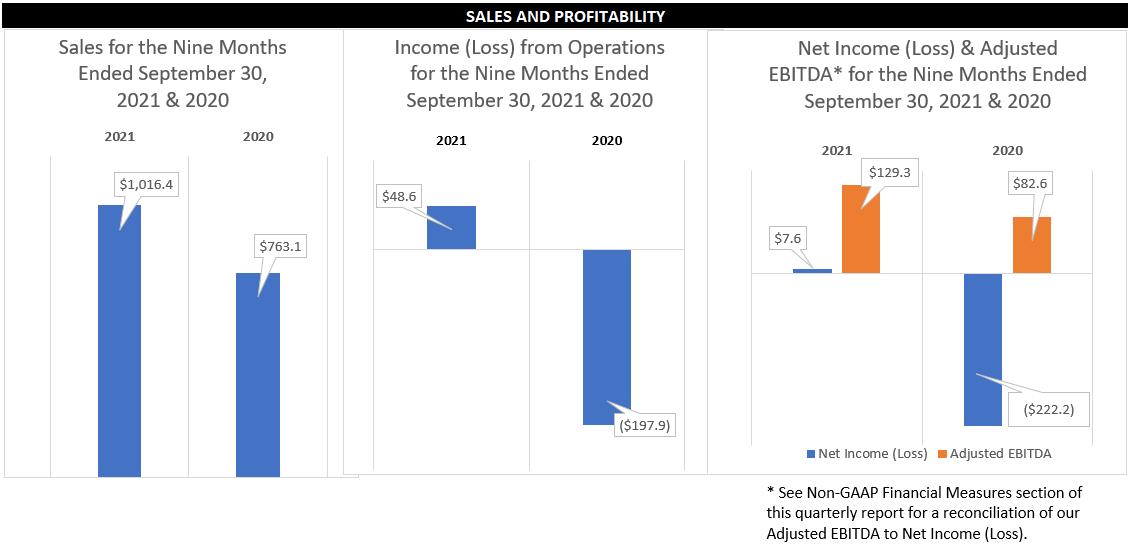

Results of Operations
|
| Nine Months Ended |
|
|
|
|
|
| Nine Months Ended |
|
|
|
|
| ||||||||||
|
| September 30, 2020 |
|
| September 30, 2019 |
|
| Net Change |
|
| September 30, 2021 |
|
| September 30, 2020 |
|
| Net Change |
| ||||||
(Dollars in thousands, except per share data) |
|
|
|
|
|
|
|
|
|
|
|
|
|
|
|
|
|
|
|
|
|
|
|
|
Net sales |
|
|
|
|
|
|
|
|
|
|
|
|
|
|
|
|
|
|
|
|
|
|
|
|
North America |
| $ | 381,129 |
|
| $ | 553,607 |
|
| $ | (172,478 | ) |
| $ | 549,457 |
|
| $ | 381,129 |
|
| $ | 168,328 |
|
Europe |
|
| 381,921 |
|
|
| 508,599 |
|
|
| (126,678 | ) |
|
| 466,983 |
|
|
| 381,921 |
|
|
| 85,062 |
|
Net sales |
|
| 763,050 |
|
|
| 1,062,206 |
|
|
| (299,156 | ) |
|
| 1,016,440 |
|
|
| 763,050 |
|
|
| 253,390 |
|
Cost of sales |
|
| 730,762 |
|
|
| 973,042 |
|
|
| (242,280 | ) |
|
| 922,637 |
|
|
| 730,762 |
|
|
| 191,875 |
|
Gross profit |
|
| 32,288 |
|
|
| 89,164 |
|
|
| (56,876 | ) |
|
| 93,803 |
|
|
| 32,288 |
|
|
| 61,515 |
|
Percentage of net sales |
|
| 4.2 | % |
|
| 8.4 | % |
|
| (4.2 | )% |
|
| 9.2 | % |
|
| 4.2 | % |
|
| 5.0 | % |
Selling, general and administrative |
|
| 36,541 |
|
|
| 46,737 |
|
|
| 10,196 |
|
|
| 45,190 |
|
|
| 36,541 |
|
|
| (8,649 | ) |
Impairment of goodwill and indefinite-lived intangibles |
|
| 193,641 |
|
|
| — |
|
|
| (193,641 | ) |
|
| — |
|
|
| 193,641 |
|
|
| 193,641 |
|
(Loss) income from operations |
|
| (197,894 | ) |
|
| 42,427 |
|
|
| (240,321 | ) | ||||||||||||
Income (loss) from operations |
|
| 48,613 |
|
|
| (197,894 | ) |
|
| 246,507 |
| ||||||||||||
Percentage of net sales |
|
| (25.9 | )% |
|
| 4.0 | % |
|
| (29.9 | )% |
|
| 4.8 | % |
|
| (25.9 | )% |
|
| 30.7 | % |
Interest expense, net |
|
| (34,448 | ) |
|
| (35,532 | ) |
|
| 1,084 |
|
|
| (31,378 | ) |
|
| (34,448 | ) |
|
| 3,070 |
|
Other (expense) income, net |
|
| (923 | ) |
|
| 3,393 |
|
|
| (4,316 | ) | ||||||||||||
Income tax benefit (provision) |
|
| 11,111 |
|
|
| (7,699 | ) |
|
| 18,810 |
| ||||||||||||
Net (loss) income |
| $ | (222,154 | ) |
| $ | 2,589 |
|
| $ | (224,743 | ) | ||||||||||||
Other expense, net |
|
| (6,028 | ) |
|
| (923 | ) |
|
| (5,105 | ) | ||||||||||||
Income tax (provision) benefit |
|
| (3,570 | ) |
|
| 11,111 |
|
|
| (14,681 | ) | ||||||||||||
Net income (loss) |
| $ | 7,637 |
|
| $ | (222,154 | ) |
| $ | 229,791 |
| ||||||||||||
Percentage of net sales |
|
| (29.1 | )% |
|
| 0.2 | % |
|
| (29.3 | )% |
|
| 0.8 | % |
|
| (29.1 | )% |
|
| 29.9 | % |
Diluted loss per share |
| $ | (9.66 | ) |
| $ | (0.84 | ) |
| $ | (8.82 | ) |
| $ | (0.69 | ) |
| $ | (9.66 | ) |
| $ | 8.97 |
|
Value added sales (1) |
| $ | 446,844 |
|
| $ | 581,899 |
|
| $ | (135,055 | ) |
| $ | 564,931 |
|
| $ | 446,844 |
|
| $ | 118,087 |
|
Adjusted EBITDA (2) |
| $ | 82,557 |
|
| $ | 131,282 |
|
| $ | (48,725 | ) |
| $ | 129,345 |
|
| $ | 82,557 |
|
| $ | 46,788 |
|
Percentage of net sales |
|
| 10.8 | % |
|
| 12.4 | % |
|
| (1.6 | )% |
|
| 12.7 | % |
|
| 10.8 | % |
|
| 1.9 | % |
Percentage of value added sales |
|
| 18.5 | % |
|
| 22.6 | % |
|
| (4.1 | )% |
|
| 22.9 | % |
|
| 18.5 | % |
|
| 4.4 | % |
Unit shipments in thousands |
|
| 10,737 |
|
|
| 14,780 |
|
|
| (4,043 | ) |
|
| 12,193 |
|
|
| 10,737 |
|
|
| 1,456 |
|
| (1) | Value added sales is a key measure that is not calculated according to U.S. GAAP. Refer to “Non-U.S. GAAP Financial Measures” for a definition of value added sales and a reconciliation of value added sales to net sales, the most comparable U.S. GAAP measure. |
| (2) | Adjusted EBITDA is a key measure that is not calculated according to U.S. GAAP. Refer to “Non-U.S. GAAP Financial Measures” for a definition of adjusted EBITDA and a reconciliation of our adjusted EBITDA to net income, the most comparable U.S. GAAP measure. |
Shipments
Wheel unit shipments were 10.712.2 million for the first nine months of 20202021 compared to unit shipments of 14.810.7 million in the prior year period, a decreasean increase of 27.413.6 percent. The decrease occurredincrease was attributable to higher volumes in both our North AmericanAmerica and European operations and wasEurope primarily driven by lowerthe 2020 production volumesshutdowns at our key North American and European OEM customers duein response to the on-going COVID-19 pandemic, including production shut-downs in the second quarter of 2020. pandemic.
Net Sales
Net salesfor the first nine months of 20202021 were $763.0$1,016.4 million, compared to net sales of $1,062.2$763.1 million for the same period in 2019.2020. The decreaseincrease in net sales was primarily driven by lowerhigher production volumes in North America and Europe relateddue to the on-going2020 production shutdowns at our key OEM customers in response to the COVID-19 pandemic, and loweras well as favorable product mix, higher aluminum prices partially offset byand favorable product mix.Euro foreign exchange.
Cost of Sales
Cost of sales were $730.8$922.6 million for the first nine monthsof 20202021 compared to cost of sales of $973.0$730.8 million for the same period in 2019.2020. The decreaseincrease in cost of sales was primarily due to lowerhigher production volumes in North America and Europe relateddriven by the 2020 production shutdowns at our key OEM customers in response to the on-going COVID-19 pandemic, lowerfavorable mix, higher aluminum prices and utilityreduced prior period manufacturing costs (due to both lower volumes and cost savingsresulting from our North American plant investmentsproduction shutdowns in 2019 to use electricity from the secondary market), reduced headcount, the use of European government subsidies and the reduced operating expense relatedresponse to the prior year rationalizationonset of the Company’s North American manufacturing footprint.pandemic.
Selling, General and Administrative Expenses
Selling, general and administrative (“SG&A”) expenses for the first nine months of 20202021 were $36.5$45.2 million, compared to SG&A expense of $46.7$36.5 million for same period in 20192020. The increase in SG&A expenses is due to reducedlower prior period compensation and benefits related to COVID-19benefit expense resulting from cost savings programsactions taken in response to the COVID-19 OEM and lower travel expenses.Superior production shutdowns and 2021 compensation expense returning to more normalized levels, partially offset by a $4.4 million gain recognized on the sale of our Fayetteville, Arkansas facility in 2021.
Impairment of Goodwill and Indefinite-LivedIndefinite-lived Intangibles
In
During the first quarternine months of 2020, we recognized a goodwill and indefinite-lived intangible asset impairment charge totaling $193.6 million relating to our European reporting unit (refer to Note 8, “Goodwill and Other Intangible Assets” in the notes to the condensed consolidated financial statements).
Net Interest Expense
Net interest expense for the first nine months of 20202021 was $34.4$31.4 million compared to net interest expense of $35.5$34.4 million for same period in 2019.2020. The decrease was primarily due to early extinguishmentborrowings under our revolving lines of a portion of the Notes in 2019credit during 2020 and additional principal repayments oflower 2021 interest rates on the Term Loan Facility in 2019 and 2020, along with lower Term Loan interest rates. This was partially offset by the incremental interest expenses due to the Company’s drawings on our North American and European revolvers in 2020.Facility.
Other Income (Expense)
Other expense was $0.9$6.0 million for the first nine months of 20202021 compared to other income of $3.4$0.9 million for same period in 2019.2020. The decline2021 expense was primarily attributable to the increase in other incomethe preferred stock embedded derivative liability due to the increase in 2020the Company’s stock price and costs associated with a flood at our Werdohl, Germany facility while the prior period expense was primarily driven by a $3.4 million gain on early extinguishment of a portion of the Notes recognized in 2019 and higher foreign exchange losses in 2020..
Income Tax (Provision) Benefit
The income tax benefitprovision for the first nine months ended September 30, 2021 was $3.6 million on a pre-tax income of $11.2 million, representing an effective rate of 31.9 percent. The effective income tax rate for the nine months ended September 30, 2021 differs from the statutory rate primarily due to U.S. valuation allowances and the mix of earnings among tax jurisdictions, partially offset by a favorable adjustment to a tax credit and the reversal of an uncertain tax position. The income tax benefit for the nine months ended September 30, 2020 was $11.1 million on a pre-tax loss of $233.3 million, representing an effective income tax rate of 4.8 percent. This differsdiffered from the statutory rate due to the impairment of goodwill for which there is no corresponding tax benefit, the mix of earnings among tax jurisdictions, and recognition of a valuation allowance on non-deductible interest. The
Net Income (Loss)
Net income tax provision for the first nine months of 20192021 was $7.7$7.6 million, on pre-tax incomeor a loss of $10.3 million, representing an effective income tax rate$0.69 per diluted share, compared to a net loss of 75.0 percent. This was higher than the statutory rate due to the GILTI provisions and the recognition of a valuation allowance on non-deductible interest, offset by a benefit due to the mix of earnings among tax jurisdictions.
Net Income (Loss)
Net loss for the first nine months of 2020 was $222.2 million, or a loss of $9.66 per diluted share, compared to a net income of $2.6 million, or a loss of $0.84 per diluted share, for the same period in 2019.2020.
Segment Sales and Income from Operations
|
| Nine Months Ended |
|
|
|
|
| |||||
|
| September 30, 2021 |
|
| September 30, 2020 |
|
| Change |
| |||
(Dollars in thousands) |
|
|
|
|
|
|
|
|
|
|
|
|
Selected data |
|
|
|
|
|
|
|
|
|
|
|
|
Net Sales |
|
|
|
|
|
|
|
|
|
|
|
|
North America |
| $ | 549,457 |
|
| $ | 381,129 |
|
| $ | 168,328 |
|
Europe |
|
| 466,983 |
|
|
| 381,921 |
|
|
| 85,062 |
|
Total net sales |
| $ | 1,016,440 |
|
| $ | 763,050 |
|
| $ | 253,390 |
|
Income (loss) from operations |
|
|
|
|
|
|
|
|
|
|
|
|
North America |
| $ | 37,964 |
|
| $ | 2,430 |
|
| $ | 35,534 |
|
Europe |
|
| 10,649 |
|
|
| (200,324 | ) |
|
| 210,973 |
|
Total income (loss) from operations |
| $ | 48,613 |
|
| $ | (197,894 | ) |
| $ | 246,507 |
|
|
| Nine Months Ended |
|
|
|
|
| |||||
|
| September 30, 2020 |
|
| September 30, 2019 |
|
| Change |
| |||
(Dollars in thousands) |
|
|
|
|
|
|
|
|
|
|
|
|
Selected data |
|
|
|
|
|
|
|
|
|
|
|
|
Net Sales |
|
|
|
|
|
|
|
|
|
|
|
|
North America |
| $ | 381,129 |
|
| $ | 553,607 |
|
| $ | (172,478 | ) |
Europe |
|
| 381,921 |
|
|
| 508,599 |
|
|
| (126,678 | ) |
Total net sales |
| $ | 763,050 |
|
| $ | 1,062,206 |
|
| $ | (299,156 | ) |
Income (loss) from operations |
|
|
|
|
|
|
|
|
|
|
|
|
North America |
| $ | 2,430 |
|
| $ | 13,586 |
|
| $ | (11,156 | ) |
Europe |
|
| (200,324 | ) |
|
| 28,841 |
|
|
| (229,165 | ) |
Total income (loss) from operations |
| $ | (197,894 | ) |
| $ | 42,427 |
|
| $ | (240,321 | ) |
North America
Net sales for our North American segment for the first nine months of 2020 decreased 31.22021 increased 44.2 percent, compared to the same period in 2019,2020, due to a 28.419.7 percent decreaseincrease in volumes which was primarily attributablerelated to the on-going COVID-19 pandemic, including a2020 production shut-down within the second quarter of the year and lower aluminum prices, partially offset by improvedshutdowns at our key customers, favorable product mix comprised of larger diameter wheels and premium wheel finishes. U.S. and Mexico sales as a percentage of North America total sales were approximately 6.5 percent and 93.5 percent, respectively, forhigher aluminum prices. For the first nine months of 2020,2021, North American sales were almost exclusively shipped from Mexico, which compares to 14.7 U.S. sales of 6.5 percent and 85.3Mexico sales of 93.5 percent for the prior year period. The change in North American sales by country is due to endingdiscontinuing manufacturing activities at our Fayetteville, Arkansas location in the fourth quarter of 2019. North American segment income from operations for the first nine months of 20202021 was lowerhigher than the prior year period, principally due to reduced productionhigher volumes, at our key North American OEM customers primarily driven by the on-going COVID-19 pandemic, including a production shutdown within the second quarter,favorable product mix and improved manufacturing performance, partially offset by favorable product mix, utility cost savings associated with plant investments made in 2019 to use electricity from a competitively priced market and cost reductions including furloughs, hourly and salary wage and benefit reductions, the temporary closure of our manufacturing facilities in April and May, reduced travel expenses and reduced operating expenses related to the prior year rationalization of the Company’s North American manufacturing footprint.increased compensation expense.
Europe
Net sales for our European segment for the first nine months of 2020 decreased 24.92021 increased 22.3 percent, compared to the same period in 2019,2020, due to a 26.27.2 percent decreaseincrease in volumes which was primarily attributablerelated to the on-going COVID-19 pandemic, including a2020 production shut-down within the second quarter of the year and lowershutdowns at our key customers, favorable product mix, higher aluminum prices partially offset by improved product mix comprised of higher diameter wheels and premium wheel finishes.favorable foreign exchange. European segment sales betweenfor Germany and Poland were approximately 37.235.7 percent and 62.864.3 percent, respectively, during the first nine months of 2020,2021, which compares to 35.537.2 percent and 64.562.8 percent for the first nine months of 2019.2020. European segment income from operations for the first nine months of 20202021 was lowerhigher than the prior year period primarilyprincipally due to the first quarter 2020 goodwill and indefinite-lived intangible asset impairment charge, loweras well as improved manufacturing performance associated with higher production volumes, related to our key European OEM customers primarily due to the on-going COVID-19 pandemic, including a production shutdown within the second quarter, partially offset by favorable product mix and cost reductions related to second quarter facility closures and use of government subsidies in both Poland and Germany, reduced travel expenses and personnel restructurings.favorable foreign exchange.
Financial Condition, Liquidity and Capital Resources
As of September 30, 2020,2021, our cash and cash equivalents totaled $111.1$76.1 million compared to $49.3$111.1 million and $77.9$152.4 million at September 30, 20192020 and December 31, 2019,2020, respectively. Our sources of liquidity primarily include cash and cash equivalents, cash provided by operating activities, borrowings under available debt facilities, factoring arrangements for trade receivables and, from time to time, other external sources of funds. Working capital (current assets minus current liabilities) and our current ratio (current assets divided by current liabilities) were $119.6$175.3 million and 1.5:1.7:1.0, respectively, at September 30, 2020,2021, versus $163.1$152.5 million and 1.9:1.7:1.0 at December 31, 2019.2020. While the Company continues to tightly manage all elements of working capital, inventories have increased in 2021 not only due to rising raw material prices, but also the volatility in customer orders arising from customer supply chain constraints.
Our working capital requirements, investing activities and cash dividend payments have historically been funded from internally generated funds, debt facilities, cash and cash equivalents, and we believe these sources will continue to meet our requirements,future requirements. Capital expenditures relate to improving production quality and efficiency and extending the useful lives of existing property and expenditures for new product offerings, as well as our currently anticipated short-term needs. Capital expenditures consist of ongoing maintenance and operational improvements (“maintenance”), as well as capital related to new product offerings and expanded capacity for existing products (“new business”). Over time capital expenditures have consisted of roughly equal components of maintenance and new business, the most significant of which in recent years has been our investment in physical vapor deposition technology which went into production in 2019.
products.
In connection with the acquisition of our European operations, we entered into several debt and equity financing arrangements during 2017. On March 22, 2017, we entered into a USD Senior Secured Credit facility (“USD SSCF”) consisting of a $400.0 million Senior Secured Term Loan Facility (“Term Loan Facility”) and a $160.0 million Revolving Credit Facility (“Revolving Credit Facility”). On May 22, 2017, we issued 150,000 shares of redeemable preferred stock for an aggregate purchase price of $150.0 million. On June 15, 2017, we issued €250.0 million aggregate principal amount of 6.00 percent Senior Notes due June 15, 2025 (“the Notes”). Finally, as part of the European business acquisition, we also assumed $70.7 million of outstanding debt, including a €30.0 million European Revolving Credit Facility (“EUR SSCF”) (subsequently increased to €45.0€60.0 million during the second quarter of 2019). Onon January 31, 2020, the available borrowing limit of the EUR SSCF was increased from €45.0 million to €60.0 million. All other terms of the EUR SSCF remained unchanged.2020). In addition, the European business entered into equipment loan agreements totaling $13.4 million (€12.0 million) in the fourth quarter of 2019. DuringThe Company drew down €10.6 million on these equipment loans in the first quarter of 2020 and drew the Company drew down on these equipment loans andremaining €1.4 million in the outstanding balance was $12.4 million asfirst quarter of September 30, 2020.
2021. With the onset of the COVID-19 pandemic and the ensuing economic uncertainty, the Company drew down on its USD SSCF and EUR SSCF revolving credit facilities to provide additional liquidity during the production shutdown and following resumption of operations until we were able to scale production volumes and restore profitability and positive free cash flow.liquidity. As of March 31, 2020, the Company had borrowings outstanding under these facilities of $207.9 million. In addition theThe Company took swift action beginning in March 2020 to reduce costs, including temporary facility closures, salary reductions, layoffs, furloughs, personnel restructurings, elimination or deferral of merit increases and reduced selected employee benefits across our global workforce in accordance with local laws and regulations. In the third quarterresumed all its operations by June of 2020 our sales volume had returned to levels comparable to 2019, with sales 9.9 percent lower year-over-year in the third quarter and only 2.0 percent lower for the month of September on a year-over-year basis. In addition, we restored profitability with net income of $11.1 million, generated cash flow from operations of $99.6 million and fully repaid the borrowings under the revolving credit facilities during the third quarter ofby September 30, 2020.
BothAs part of our revolving credit facilities matureongoing efforts to improve our cash flow and related liquidity, we negotiate with suppliers to optimize our terms and conditions, including extended payment terms. Beginning in May 2022, and based on various forecasted scenarios, Superior expects, at this time,2021, the Company receives extended payment terms for a portion of our purchases with one of our principal aluminum suppliers in exchange for a nominal adjustment to remain compliantthe product pricing. The payment terms provided to us are consistent with aluminum industry norms, as well as those offered to the supplier’s other customers. The supplier intends to finance these extended terms by factoring receivables due from us with a financial institution. We are not a party to the supplier’s factoring agreement with the financial institution. We remit payments directly to our supplier, except with respect to product purchased under extended terms which have been factored by the supplier. These payments are remitted directly to the financial institution in accordance with the payment terms originally negotiated with our supplier. As of these facilities.September 30, 2021, the
Company owed $20.8 million to the financial institution which is included in accounts payable in the Company’s condensed consolidated balance sheets. The Company has no other significant funded debt obligations until May 2024.
made $47.8 million in payments to the financial institution pursuant to the supplier’s factoring arrangement for the nine months ended September 30, 2021. These payments are included in cash flows from operations within the condensed consolidated statements of cash flows.
Balances outstanding under the Term Loan Facility, Notes and equipment loans as of September 30, 20202021 were $349.2 million, $254.9$251.7 million and $23.4$20.3 million, respectively. The redeemable preferred stock amounted to $174.6$194.6 million as of September 30, 2020.2021. Our liquidity totaled $336.3$272.9 million at September 30, 2020,2021, including cash on hand of $111.1$76.1 million and available unused commitments under credit facilities of $225.2$196.8 million.
On May 3, 2021, the Company extended the term of the Revolving Credit Facility under its USD SSCF. The commitment under the facility was reduced from $160.0 million to $132.5 million, with $25.0 million of the commitment maturing May 23, 2022 and the remaining $107.5 million maturing October 31, 2023. During the second quarter of 2021, the Company amended its European Revolving Credit Facility (“EUR SSCF”), extending the term to May 22, 2023 and increasing the applicable margins and commitment fees, while maintaining the €60.0 million commitment.
The following table summarizes the cash flows from operating, investing and financing activities as reflected in the condensed consolidated statements of cash flows.
|
| Nine Months Ended |
|
|
|
|
|
| Nine Months Ended |
|
| ||||||||||
|
| September 30, 2020 |
|
| September 30, 2019 |
|
| Change |
|
| September 30, 2021 |
|
| September 30, 2020 |
|
| |||||
(Dollars in thousands) |
|
|
|
|
|
|
|
|
|
|
|
|
|
|
|
|
|
|
|
|
|
Net cash provided by operating activities |
|
| 92,511 |
|
|
| 102,351 |
|
|
| (9,840 | ) | |||||||||
Net cash (used in) provided by operating activities |
|
| (14,578 | ) |
|
| 92,511 |
|
| ||||||||||||
Net cash used in investing activities |
|
| (32,733 | ) |
|
| (37,953 | ) |
|
| 5,220 |
|
|
| (40,982 | ) |
|
| (32,733 | ) |
|
Net cash used in financing activities |
|
| (32,111 | ) |
|
| (59,217 | ) |
|
| 27,106 |
|
|
| (18,875 | ) |
|
| (32,111 | ) |
|
Effect of exchange rate changes on cash |
|
| 5,537 |
|
|
| (3,337 | ) |
|
| 8,874 |
|
|
| (1,871 | ) |
|
| 5,537 |
|
|
Net increase in cash and cash equivalents |
| $ | 33,204 |
|
| $ | 1,844 |
|
| $ | 31,360 |
| |||||||||
Net (decrease) increase in cash and cash equivalents |
| $ | (76,306 | ) |
| $ | 33,204 |
|
| ||||||||||||
Operating Activities
Net cash provided byused in operating activities was $92.5$14.6 million for the first nine months of 20202021 compared to net cash provided by operating activities of $102.4$92.5 million for the same period in 2019.2020. The decrease in cash flow provided by operating activities was primarily driven by second quarter lossesincreased receivables and inventory of $45.2 million and $60.0 million, respectively, partially offset by increased profitability. The increase in receivables and inventories was due to higher production shutdownslevels, increases in Aprilaluminum prices and May of 2020 at our key North American and European OEM customers. This was offset by bothhigher inventory levels due to customer order volatility resulting from the year-over-year reduction in net working capital and year-over-year increased earnings in the third quarter.global semiconductor supply shortage.
Investing Activities
Net cash used in investing activities was $32.7$41.0 million for the first nine months of 20202021 compared to $38.0$32.7 million for the same period in 2019.2020. The decreaseincrease in cash used in investing activities is driven by resumption of certain capital projects that were suspended in 2020 reductionsdue to COVID-19 production shutdowns and ongoing investments to support increased production capabilities in capital expenditures,both regions, partially offset by a one-time benefitproceeds from the sale of other assets in the second quarter of 2019.our Fayetteville, Arkansas facility.
Financing Activities
Net cash used in financing activities was $32.1$18.9 million for the first nine months of 20202021 compared to net cash used in financing activities of $59.2$32.1 million for the same period in 2019.2020. This change was primarily due to lower debt repayments, first quarter 2020 proceeds from capital equipment loans andprepayments on the elimination of the common stock dividendTerm Loan in the third quarterfirst nine months of 2019.2020 that did not occur in 2021.
Off-Balance Sheet Arrangements
As of September 30, 2020,2021, we had no significant off-balance sheet arrangements other than factoring of $101.4$95.1 million of our trade receivables.
Non-GAAP Financial Measures
In this quarterly report, we discuss two importantfinancial measures that are not calculated according to U.S. GAAP, value added sales and adjusted EBITDA.
Value added sales is a key measure that is not calculated according to U.S. GAAP. In the discussion of operating results, we provide information regarding value added sales. Value added sales represents net sales less the value of aluminum and services provided by outsourced service providers (“OSP”) that are included in net sales. As discussed further below, arrangements with our customers allow us to pass on changes in aluminum prices; therefore, fluctuations in underlying aluminum price generally does not directly impact our profitability. Accordingly,Our presentation of value added sales is worthy of being highlighted for the benefit of users of our financial statements. Our intent isintended to allow users of the financial statements to consider our net sales information both with and without the aluminum and OSP cost components. Management utilizes value added sales as a key metric to determine growth of the Company because it eliminates the volatility of aluminum prices.
Adjusted EBITDA is a key measure that is not calculated according to U.S. GAAP. Adjusted EBITDA is defined as earnings before interest income and expense, income taxes, depreciation, amortization, restructuring charges and other closure costs and impairments of long-lived assets and investments, changes in fair value of redeemable preferred stock embedded derivative, acquisition and integration and other related costs, certain hiring and separation related costs, proxy contest fees, gains associated with early debt extinguishment and accounts receivable factoring fees. We use adjusted EBITDA as an important indicator of the operating performance of our business. Adjusted EBITDA is used in our internal forecasts and models when establishing internal operating budgets, supplementing the financial results and forecasts reported to our Board of Directors and evaluating short-term and long-term operating trends in our operations. We believe the adjusted EBITDA financial measure assists in providing a more complete understanding of our underlying operational measures to manage our business, to evaluate our performance compared to prior periods and the marketplace and to establish operational goals. Adjusted EBITDA is a non-GAAP financial measure and should not be considered in isolation or as a substitute for financial information provided in accordance with U.S. GAAP. This non-GAAP financial measure may not be computed in the same manner as similarly titled measures used by other companies.
The following table reconciles our net sales, the most directly comparable U.S. GAAP financial measure, to our value added sales:
|
| Three Months Ended |
|
| Nine Months Ended |
|
| Three Months Ended |
|
| Nine Months Ended |
| ||||||||||||||||||||
|
| September 30, 2020 |
|
| September 30, 2019 |
|
| September 30, 2020 |
|
| September 30, 2019 |
|
| September 30, 2021 |
|
| September 30, 2020 |
|
| September 30, 2021 |
|
| September 30, 2020 |
| ||||||||
(Dollars in thousands) |
|
|
|
|
|
|
|
|
|
|
|
|
|
|
|
|
|
|
|
|
|
|
|
|
|
|
|
|
|
|
|
|
Net sales |
| $ | 317,103 |
|
| $ | 352,014 |
|
| $ | 763,050 |
|
| $ | 1,062,206 |
|
| $ | 310,780 |
|
| $ | 317,103 |
|
| $ | 1,016,440 |
|
| $ | 763,050 |
|
Less: aluminum value and outside service provider costs |
|
| (124,634 | ) |
|
| (156,563 | ) |
|
| (316,206 | ) |
|
| (480,307 | ) |
|
| (148,582 | ) |
|
| (124,634 | ) |
|
| (451,509 | ) |
|
| (316,206 | ) |
Value added sales |
| $ | 192,469 |
|
| $ | 195,451 |
|
| $ | 446,844 |
|
| $ | 581,899 |
|
| $ | 162,198 |
|
| $ | 192,469 |
|
| $ | 564,931 |
|
| $ | 446,844 |
|
The following table reconciles our net income, the most directly comparable U.S. GAAP financial measure, to our adjusted EBITDA:
|
| Three Months Ended |
|
| Nine Months Ended |
|
| Three Months Ended |
|
| Nine Months Ended |
| ||||||||||||||||||||
|
| September 30, 2020 |
|
| September 30, 2019 |
|
| September 30, 2020 |
|
| September 30, 2019 |
|
| September 30, 2021 |
|
| September 30, 2020 |
|
| September 30, 2021 |
|
| September 30, 2020 |
| ||||||||
(Dollars in thousands) |
|
|
|
|
|
|
|
|
|
|
|
|
|
|
|
|
|
|
|
|
|
|
|
|
|
|
|
|
|
|
|
|
Net income (loss) |
| $ | 11,146 |
|
| $ | (6,631 | ) |
| $ | (222,154 | ) |
| $ | 2,589 |
| ||||||||||||||||
Net (loss) income |
| $ | (7,180 | ) |
| $ | 11,146 |
|
| $ | 7,637 |
|
| $ | (222,154 | ) | ||||||||||||||||
Interest expense, net |
|
| 10,414 |
|
|
| 11,807 |
|
|
| 34,448 |
|
|
| 35,532 |
|
|
| 10,619 |
|
|
| 10,414 |
|
|
| 31,378 |
|
|
| 34,448 |
|
Income tax provision (benefit) |
|
| (3,898 | ) |
|
| (4,785 | ) |
|
| (11,111 | ) |
|
| 7,699 |
|
|
| 1,841 |
|
|
| (3,898 | ) |
|
| 3,570 |
|
|
| (11,111 | ) |
Depreciation |
|
| 18,315 |
|
|
| 24,192 |
|
|
| 54,367 |
|
|
| 57,382 |
|
|
| 17,965 |
|
|
| 18,315 |
|
|
| 55,520 |
|
|
| 54,367 |
|
Amortization |
|
| 6,503 |
|
|
| 6,636 |
|
|
| 18,767 |
|
|
| 20,118 |
|
|
| 6,511 |
|
|
| 6,503 |
|
|
| 19,926 |
|
|
| 18,767 |
|
Impairment of goodwill and indefinite-lived intangibles |
|
| — |
|
|
| — |
|
|
| 193,641 |
|
|
| — |
|
|
| — |
|
|
| — |
|
|
| — |
|
|
| 193,641 |
|
Integration, restructuring, factoring fees and other (1) (2) (3) (4) |
|
| 4,243 |
|
|
| 7,633 |
|
|
| 14,599 |
|
|
| 7,962 |
| ||||||||||||||||
Integration, restructuring, factoring fees and other (1)(2)(3)(4) |
|
| 21 |
|
|
| 4,243 |
|
|
| 7,854 |
|
|
| 14,599 |
| ||||||||||||||||
Change in fair value of redeemable preferred stock embedded derivative liability (5) |
|
| — |
|
|
| — |
|
|
| 3,460 |
|
|
| — |
| ||||||||||||||||
Adjusted EBITDA |
| $ | 46,723 |
|
| $ | 38,852 |
|
| $ | 82,557 |
|
| $ | 131,282 |
|
| $ | 29,777 |
|
| $ | 46,723 |
|
| $ | 129,345 |
|
| $ | 82,557 |
|
Adjusted EBITDA as a percentage of net sales |
|
| 14.7 | % |
|
| 11.0 | % |
|
| 10.8 | % |
|
| 12.4 | % |
|
| 9.6 | % |
|
| 14.7 | % |
|
| 12.7 | % |
|
| 10.8 | % |
Adjusted EBITDA as a percentage of value added sales |
|
| 24.3 | % |
|
| 19.9 | % |
|
| 18.5 | % |
|
| 22.6 | % |
|
| 18.4 | % |
|
| 24.3 | % |
|
| 22.9 | % |
|
| 18.5 | % |
| (1) | In the third quarter of 2021, we incurred $1.6 million of restructuring costs comprised of ongoing fixed costs associated with our Fayetteville, Arkansas facility, relocation and installation costs of repurposed machinery and costs of site preparation activities which occurred as part of the sale of the facility. Additionally, in the third quarter we recognized a gain on sale of $4.4 million related to the sale of the Fayetteville, Arkansas facility. We also incurred $1.5 million of costs from a flood at our Werdohl, Germany facility, $0.7 million of certain hiring and separation costs, $0.5 million of accounts receivable factoring fees and $0.1 million of other costs. |
(2) | In the first nine months of 2021, we incurred $4.7 million of restructuring costs comprised of ongoing fixed costs associated with our Fayetteville, Arkansas facility, relocation and installation costs of repurposed machinery and costs of site preparation activities which occurred as part of the sale of the facility. Additionally, we recognized a gain on sale of $4.4 million related to the sale of the Fayetteville, Arkansas facility. We also incurred $1.5 million of costs from a flood at our Werdohl, Germany facility, $3.8 million of certain hiring and separation costs, $1.5 million of accounts receivable factoring fees, and $0.8 million of other costs. |
(3) | In the third quarter of 2020, we incurred |
|
| In the first nine months of 2020, we incurred |
|
|
|
|
|
Critical Accounting Policies and Estimates
The preparation of consolidated financial statements in conformity with U.S. GAAP requires management to apply significant judgment in making estimates and assumptions that affect amounts reported therein, as well as financial information included in this Management’s Discussion and Analysis of Financial Condition and Results of Operations. These estimates and assumptions, which are based upon historical experience, industry trends, terms of various past and present agreements and contracts, and information available from other sources that are believed to be reasonable under the circumstances, form the basis for making judgments about the carrying values of assets and liabilities that are not readily apparent through other sources. There can be no assurance that actual results reported inWe believe the future will not differ from theseaccounting estimates or that future changes in these estimates will not adversely impact our results of operations or financial condition.
Impairment of Goodwill –Goodwillemployed are appropriate and indefinite-lived intangible assets, such as certain trade names,the resulting balances are not amortized, but are instead evaluated for impairment annually at the end of the fiscal year, or more frequently if events or circumstances indicate that impairment may be more likely than not.
At March 31, 2020, the impact of the COVID-19 developments and uncertainty with respect to the economic effects of the pandemic had introduced significant volatility in the financial markets and was having, and continues to have, a widespread adverse effect on the automotive industry, including reductions in both consumer demand and OEM automotive production. In response, our key customers temporarily closed nearly all production facilities in Europe and North America (our primary markets) during the quarter ended March 31, 2020. As a result, we concluded that an interim test of our goodwill was required. More specifically, the Company concluded that the following events and circumstances, in the aggregate, indicated that it was more likely than not that the carrying value of our European reporting unit exceeded its fair value at March 31, 2020: (1) our European reporting unit’s carrying value was effectively set to fair value at December 31, 2019,reasonable; however, due to the $102.2 million impairment chargesinherent uncertainties in developing estimates, actual results could differ from the original estimates, requiring adjustments to goodwill and indefinite-lived intangibles, (2) lower forecasted 2020 industry production volumes for Western and Central Europe, including those for our primary European customers, due to OEM shutdowns to mitigate COVID-19 spread and subsequent reduced production levels over the remainder of the year, as compared to our prior production forecasts (including estimates used in our 2019 assessment), and (3) the volatility in financial markets that has both increased European interest rates due to rising credit spreads and risk premiums and lowered median European automotive market multiples. Based on the results of our quantitative analysis, we recognized a non-cash goodwill impairment charge equal to the remaining goodwill balance of $182.6 million since the carrying value exceeded the fair value of the European reporting unit by more than the amount of the goodwill balance at March 31, 2020. This impairment was recognized at March 31, 2020 as a separate charge (together with the indefinite-lived intangible asset trade name) included in income (loss) from operations.
We utilized both an income and a market approach, weighted 75 percent and 25 percent respectively, to determine the fair value of the European reporting unit as part of our goodwill impairment assessment. The income approach is based on projected debt-free cash flow, which is discounted to the present value using discount factors that consider the timing and risk of cash flows. The discount rate used is the weighted average of an estimated cost of equity and of debt (“weighted average cost of capital”). The weighted average cost of capital is adjusted as necessary to reflect risk associated with the business of the European reporting unit. Financial projections are based on estimated production volumes, product prices and expenses, including raw material cost, wages, energy and other expenses. Other significant assumptions include terminal value cash flow and growth rates, future capital expenditures and changesthese balances in future working capital requirements. The market approach is based onperiods. Critical accounting estimates that affect the observed ratios of enterprise value to earnings before interest, taxes, depreciation and amortization (EBITDA) of comparable, publicly traded companies. The market approach fair value is determined by multiplying historical and anticipated financial metrics of the European reporting unit by the EBITDA pricing multiples derived from comparable, publicly traded companies.
At March 31, 2020, we determined that the carrying value of the European reporting unit exceeded its fair value by an amount greater than the remaining goodwill balance. The decline in fair value was primarily due to significantly lower market multiples and increased discount rates, as well as further declines in forecasted industry production volumes in Western and Central Europe as a result of the COVID-19 pandemic and consequent economic instability. Forecasted revenues, EBITDA and cash flow for the European reporting unit also declined as compared to the prior year long-range plan due to lower forecasted industry production volumes which adversely impacted fair value under both the income and market approaches. In determining the fair value, the Company weighted the income and market approaches, 75 percent and 25 percent, respectively. Significant assumptions used under the income approach included a weighted average cost of capital (WACC) of 12.0 percent and a long-term growth rate of 1.5 percent, as compared to 10.0 percent and 2.0 percent, respectively, used in the 2019 assessment. In determining the WACC, management considered the level of risk inherent in
the cash flow projections and current market conditions, including the significant increase in credit spreads and systemic market and Company specific risk premiums. The decline in the fair value under the market approach is attributable to the decline in the average EBITDA market multiple (4.9X EBITDA in 2020, 5.7X EBITDA in 2019) and lower forecasted EBITDA, as compared to the 2019 assessment.The use of these unobservable inputs results in classification of the fair value estimate as a Level 3 measurement in the fair value hierarchy. A considerable amount of management judgment and assumptions are required in performing the quantitative impairment test, principally related to determining the fair value of the reporting unit. While the Company believes its judgments and assumptions are reasonable, different assumptions could change the estimated fair value.
Impairment of Intangible Assets – Intangible assets include both finite and indefinite-lived intangible assets. Finite-lived intangible assets consist of brand names, technology and customer relationships. Finite-lived intangible assets are amortized on a straight-line over their estimated useful lives (since the pattern in which the asset will be consumed cannot be reliably determined). Indefinite-lived intangible assets, excluding goodwill, consist of trade names associated with our aftermarket business. In the first quarter of 2020, we recognized a non-cash impairment charge of $11.0 million related to our aftermarket trade name indefinite-lived intangible asset which was primarily attributable to a further decline in forecasted aftermarket revenues and a decline in associated profitability (refer to Note 8, “Goodwill and Other Intangible Assets” in the notes to condensed consolidated financial statements and the judgments and assumptions used are consistent with those described in Item 1, “Financial Statementsthe management’s discussion and Supplementary Data”analysis in this Quarterly Report for further discussion of asset impairments).
Also see Item 7—our 2020 Form 10-K (refer to “Management’s Discussion and Analysis of Financial Condition and Results of Operations” in Part II of our 2019 Annual Report on Form 10-K.10-K for the year ended December 31, 2020).
Item 3. Quantitative and Qualitative Disclosures About Market Risk
Not applicable forAs a smaller reporting companies.company, as defined in Rule 10(f)(1) of Regulation S-K under the Securities and Exchange Act of 1934, as amended (the “Exchange Act”), the Company is not required to provide the information required by this item.
Item 4. Controls and Procedures
Evaluation of Disclosure Controls and Procedures
The Company’s management, with the participation of our Chief Executive Officer and Chief Financial Officer, evaluated the effectiveness of the Company’s disclosure controls and procedures (as defined in Rules 13a-15(e) and 15d-15(e) under the Exchange Act) as of September 30, 2020.2021. Our disclosure controls and procedures are designed to ensure that information required to be disclosed in reports we file or submit under the Exchange Act is recorded, processed, summarized and reported within the time periods specified in SEC rules and forms and that such information is accumulated and communicated to our management, including our Chief Executive Officer and Chief Financial Officer, to allow timely decisions regarding required disclosures.
Based on this evaluation, our Chief Executive Officer and Chief Financial Officer concluded that, as of September 30, 20202021 our disclosure controls and procedures were effective.
Changes in Internal Control Over Financial Reporting
There has been no change in our internal control over financial reporting during the ninethree months ended September 30, 20202021 that has materially affected, or is reasonably likely to materially affect, our internal control over financial reporting.
PART II
OTHER INFORMATION
Item 1. Legal Proceedings
We are party to various legal and environmental proceedings incidental to our business. Certain claims, suits and complaints arising in the ordinary course of business have been filed or are pending against us. Based on facts now known, we believe all such matters are adequately provided for, covered by insurance, are without merit, and/or involve such amounts that would not materially adversely affect our consolidated results of operations, cash flows or financial position. See also under Item 1A, “Risk Factors - We are from time to time subject to litigation, which could adversely impact our financial condition or results of operations” of our Annual Report on Form 10-K for the year ended December 31, 2019.2020.
Item 1A. Risk Factors
In our Quarterly Report on Form 10-Q for the quarters ended March 31, 2020
We are exposed to certain risks and June 30, 2020, we added the below risk factors entitled “The COVID-19 pandemic has disrupted, and may continue to disrupt our business, which we expect will have a material adverse impact on our business, results of operations and financial condition” and “A delisting of our common stock from the NYSE could reduce the liquidity and market price of our common stock; reduce the number of investors and analystsuncertainties that cover our common stock; limit our ability to issue additional shares, and damage our reputation which could have a material adverse impact on our business, results of operations, andcash flows or financial condition. In addition, a delisting of our common stock from the NYSE could cause a redemption of some or all of our outstanding redeemable preferred stock which would negatively impact our liquidity”There have been no material changes to the risk factors as previously disclosedRisk Factors described in “Item 1A Risk Factors” ofPart I, Item 1A-Risk Factors in our annual report on Form 10-K for the year ended December 31, 2019. Other than2020, except as set forth below, there have been no material changes tootherwise indicated herein. During May 2021, the risk factors set forthNYSE notified the Company that, in “Item 1A Risk Factors”view of our Form 10-Kimproved market capitalization which has been well in excess of the required threshold for the year ended December 31, 2019. However, many of the risk factors set forth in our Form 10-K for the year ended December 31, 2019 are, and will continue to be, exacerbated by the COVID-19 pandemic and any resulting worsening of the economic environment.
The COVID-19 pandemic has disrupted, and may continue to disrupt our business, whichpreceding six months, we expect will have a material adverse impact on our business, results of operations and financial condition.
The ongoing COVID-19 pandemic has caused a widespread health crisis, resulting in an economic downturn and government imposed measures to reduce the spread of COVID-19. In Europe and North America (our primary markets), federal, state and local governments have either recommended or mandated actions to slow the transmission of COVID-19. Most U.S. states and most countries have been implementing shelter-in-place orders, quarantines, significant restrictions on travel, as well as work restrictions that prohibit non-essential employees from going to work. The impact of COVID-19 and uncertaintyregained compliance with respect to the economic effects of the pandemic has introduced significant volatility in the financial markets and is having a widespread adverse effect on the automotive industry. Specific risks to our Company associated with the COVID-19 pandemic include the following:
|
|
|
|
|
|
|
|
|
|
|
|
|
|
|
|
|
|
The ultimate impact that COVID-19 will have on our business, results of operations and financial condition will depend on a number of evolving factors that we may not be able to accurately predict, including: the duration and scope of the pandemic; governmental, OEMs’, suppliers’, customers’ and individuals’ actions that have been and continue to be taken in response to the pandemic and the impact of the pandemic on economic activity and actions taken in response to such impact by the OEMs’ suppliers and customers.
A delisting of our common stock from the NYSE could reduce the liquidity and market price of our common stock; reduce the number of investors and analysts that cover our common stock; limit our ability to issue additional shares, and damage our reputation which could have a material adverse impact on our business, results of operations and financial condition. In addition, a delisting of our common stock from the NYSE could cause a redemption of some or all of our outstanding redeemable preferred stock which would negatively impact our liquidity.
We are required under the NYSEits continued listing standards to maintain a market capitalization of at least $50 million, over a consecutive 30 trading-day period, and maintain stockholders’ equity of at least $50 million. As of March 31, 2020, our market capitalization was less than $50 million over a consecutive 30-day trading period and our stockholders’ equity was less that the minimum threshold. As a result, on June 5, 2020, the NYSE sent us a formal notification that we were not compliance with the NYSE continued listing standards. In response, on July 20, 2020, we submitted a remediation plan to the NYSE and on September 8, 2020 we announced that our remediation plan had been accepted by the NYSE. The cure period effectively began on July 1, 2020 and will end on January 1, 2022. In the event we are unable to cure the deficiency during the 18-month period, our stock may be delisted from the NYSE.
A delisting of our common stock could have a material adverse impact on our business, results of operations and financial condition by, among other things:
|
|
|
|
|
|
|
|
|
|
In addition, the holder of our redeemable preferred stock has the right to redeem all of the outstanding shares of redeemable preferred stock if our common stock is delisted from the NYSE. If we are delisted from the NYSE and the holder exercises its right to redeem all of the outstanding shares of redeemable preferred stock, we would be required to: (1) increase the then carrying value of the redeemable preferred stock to the $300 million redemption value through a corresponding charge (decrease) to our retained earnings, and (2) make a redemption payment in any amount up to $300 million if our Board determined, under Delaware law, that there was a “surplus” to fund a full or partial redemption and such payment would not render us insolvent. The shares of preferred stock that have not been redeemed would continue to receive a dividend of 9 percent per annum on the Stated Value, as defined in the Certificate of Designations, until such shares of preferred stock are redeemed. A redemption payment, if required, for some or all of our outstanding shares of preferred stock would negatively impact our liquidity and could adversely affect our business, results of operations and financial condition.
Item 2. Unregistered Sales of Equity Securities and Use of Proceeds
Not applicable.
Item 5. Other Information
Not applicable.
Item 6. Exhibits
10.1 | ||
| ||
| ||
31.1 | ||
|
| |
31.2 | ||
|
| |
32.1 | ||
|
| |
101.INS | Inline XBRL Instance Document—the instance document does not appear in the Interactive Data File because its XBRL tags are embedded within the Inline XBRL document **** | |
|
| |
101.SCH | Inline XBRL Taxonomy Extension Schema Document **** | |
|
| |
101.CAL | Inline XBRL Taxonomy Extension Calculation Linkbase Document **** | |
|
| |
101.LAB | Inline XBRL Taxonomy Extension Label Linkbase Document **** | |
|
| |
101.PRE | Inline XBRL Taxonomy Extension Presentation Linkbase Document **** | |
|
| |
101.DEF | Inline XBRL Taxonomy Extension Definition Linkbase Document **** | |
|
| |
104 | Cover Page Interactive Data File (formatted as Inline XBRL and contained in exhibit 101) **** |
* |
|
| Filed herewith. |
|
|
**** | Submitted electronically with the report. |
SIGNATURES
Pursuant to the requirements of the Securities Exchange Act of 1934, the registrant has duly caused this report to be signed on its behalf by the undersigned thereunto duly authorized.
SUPERIOR INDUSTRIES INTERNATIONAL, INC.
(Registrant)
Date: November | /s/ Majdi B. Abulaban |
| Majdi B. Abulaban President and Chief Executive Officer |
Date: November | /s/ C. Timothy Trenary |
| C. Timothy Trenary Executive Vice President and Chief Financial Officer |
4441