UNITED STATES
SECURITIES AND EXCHANGE COMMISSION
WASHINGTON, D.C. 20549
FORM 10-Q
(Mark One)
☒ QUARTERLY REPORT PURSUANT TO SECTION 13 OR 15(d) OF THE SECURITIES EXCHANGE ACT OF 1934 ☒
| QUARTERLY REPORT PURSUANT TO SECTION 13 OR 15(d) OF THE SECURITIES EXCHANGE ACT OF 1934
|
For the quarterly period ended December 31, 20202021
or
☐ TRANSITION REPORT PURSUANT TO SECTION 13 OR 15(d) OF THE SECURITIES EXCHANGE ACT OF 1934 ☐
| TRANSITION REPORT PURSUANT TO SECTION 13 OR 15(d) OF THE SECURITIES EXCHANGE ACT OF 1934
|
For the transition period from _____________ to ___________
Commission File Number 1-084621-8462
GRAHAM CORPORATION
(Exact name of registrant as specified in its charter)
| |
Delaware | 16-1194720 |
(State or other jurisdiction of incorporation or organization) | (I.R.S. Employer Identification No.) |
20 Florence Avenue, Batavia, New York | 14020 |
(Address of principal executive offices) | (Zip Code) |
585-343-2216585-343-2216
(Registrant's telephone number, including area code)
Securities registered pursuant to Section 12(b) of the Act:
| | | | |
Title of each class |
| Trading Symbol(s) |
| Name of each exchange on which registered |
Common Stock, Par Value $0.10 Per Share |
| GHM |
| NYSE |
Indicate by check mark whether the registrant (1) has filed all reports required to be filed by Section 13 or 15(d) of the Securities Exchange Act of 1934 during the preceding 12 months (or for such shorter period that the registrant was required to file such reports), and (2) has been subject to such filing requirements for the past 90 days. Yes☒ No ☐
Indicate by check mark whether the registrant has submitted electronically every Interactive Data File required to be submitted pursuant to Rule 405 of Regulation S-T (§232.405 of this chapter) during the preceding 12 months (or for such shorter period that the registrant was required to submit such files). Yes☒ No ☐
Indicate by check mark whether the registrant is a large accelerated filer, an accelerated filer, a non-accelerated filer, a smaller reporting company, or an emerging growth company. See the definitions of "large accelerated filer," "accelerated filer," "smaller reporting company," and "emerging growth company" in Rule 12b-2 of the Exchange Act.
| | | | |
Large accelerated filer | ☐ | | Accelerated filer | ☐ |
Non-accelerated filer | ☒ |
| Smaller reporting company | ☒ |
Emerging growth company | ☐
| ☐ |
|
|
|
If an emerging growth company, indicate by check mark if the registrant has elected not to use the extended transition period for complying with any new or revised financial accounting standards provided pursuant to Section 13(a) of the Exchange Act. ☐
Indicate by check mark whether the registrant is a shell company (as defined in Rule 12b-2 of the Exchange Act).
Yes ☐ No ☒
As of January 27, 2021,31, 2022, there were outstanding 9,988,66810,638,041 shares of the registrant’s common stock, par value $0.10 per share.
Graham Corporation and Subsidiaries
Index to Form 10-Q
As of December 31, 20202021 and March 31, 20202021 and for the Threethree and Nine-Month Periods Endednine months ended December 31, 2020 and 2019 2021
2
GRAHAM CORPORATION AND SUBSIDIARIES
FORM 10-Q
DECEMBER 31, 20202021
PART I – FINANCIAL INFORMATION
3
Item 1. Unaudited Condensed Consolidated Financial Statements Item 1.
| Unaudited Condensed Consolidated Financial Statements
|
GRAHAM CORPORATION AND SUBSIDIARIES
CONDENSED CONSOLIDATED STATEMENTS OF INCOMEOPERATIONS
(Unaudited)
| | | Three Months Ended | | | Nine Months Ended | | | Three Months Ended | | Nine Months Ended | |
| | December 31, | | | December 31, | | | December 31, | | | December 31, | | |
| | 2020 | | | 2019 | | | 2020 | | | 2019 | | | 2021 | | | 2020 | | | 2021 | | | 2020 | | |
| | (Amounts in thousands, except per share data) | | | (Amounts in thousands, except per share data) | | | (Amounts in thousands, except per share data) | | (Amounts in thousands, except per share data) | |
Net sales | | $ | 27,154 | | | $ | 25,286 | | | $ | 71,818 | | | $ | 67,522 | | | $ | 28,774 | | | $ | 27,154 | | | $ | 83,077 | | | $ | 71,818 | | |
Cost of products sold | | | 20,927 | | | | 21,242 | | | | 56,330 | | | | 53,816 | | | | 28,213 | | | | 20,927 | | | | 78,159 | | | | 56,330 | | |
Gross profit | | | 6,227 | | | | 4,044 | | | | 15,488 | | | | 13,706 | | | | 561 | | | | 6,227 | | | | 4,918 | | | | 15,488 | | |
Other expenses and income: | | | | | | | | | | | | | | | | | | | | | | | | | | | |
Selling, general and administrative | | | 4,936 | | | | 4,441 | | | | 13,091 | | | | 12,844 | | | | 4,729 | | | | 4,936 | | | | 14,534 | | | | 13,091 | | |
Selling, general and administrative – amortization | | | — | | | | — | | | | — | | | | 11 | | | | 274 | | | | — | | | | 639 | | | | — | | |
Other expense | | | — | | | | — | | | | — | | | | 523 | | |
Other operating income, net | | | | 140 | | | | — | | | | (962 | ) | | | — | | |
Operating (loss) income | | | | (4,582 | ) | | | 1,291 | | | | (9,293 | ) | | | 2,397 | | |
Other income | | | (55 | ) | | | (87 | ) | | | (164 | ) | | | (261 | ) | | | (111 | ) | | | (55 | ) | | | (416 | ) | | | (164 | ) | |
Interest income | | | (23 | ) | | | (318 | ) | | | (143 | ) | | | (1,080 | ) | | | (12 | ) | | | (23 | ) | | | (43 | ) | | | (143 | ) | |
Interest expense | | | 1 | | | | 2 | | | | 9 | | | | 9 | | | | 132 | | | | 1 | | | | 300 | | | | 9 | | |
Total other expenses and income | | | 4,859 | | | | 4,038 | | | | 12,793 | | | | 12,046 | | |
Income before provision for income taxes | | | 1,368 | | | | 6 | | | | 2,695 | | | | 1,660 | | |
Provision (benefit) for income taxes | | | 308 | | | | (3 | ) | | | 709 | | | | 364 | | |
Net income | | $ | 1,060 | | | $ | 9 | | | $ | 1,986 | | | $ | 1,296 | | |
(Loss) income before benefit provision for income taxes | | | | (4,591 | ) | | | 1,368 | | | | (9,134 | ) | | | 2,695 | | |
(Benefit) provision for income taxes | | | | (861 | ) | | | 308 | | | | (1,786 | ) | | | 709 | | |
Net (loss) income | | | $ | (3,730 | ) | | $ | 1,060 | | | $ | (7,348 | ) | | $ | 1,986 | | |
Per share data | | | | | | | | | | | | | | | | | | | | | | | | | | | |
Basic: | | | | | | | | | | | | | | | | | | | | | | | | | | | |
Net income | | $ | 0.11 | | | $ | — | | | $ | 0.20 | | | $ | 0.13 | | |
Net (loss) income | | | $ | (0.35 | ) | | $ | 0.11 | | | $ | (0.70 | ) | | $ | 0.20 | | |
Diluted: | | | | | | | | | | | | | | | | | | | | | | | | | | | |
Net income | | $ | 0.11 | | | $ | — | | | $ | 0.20 | | | $ | 0.13 | | |
Net (loss) income | | | $ | (0.35 | ) | | $ | 0.11 | | | $ | (0.70 | ) | | $ | 0.20 | | |
Weighted average common shares outstanding: | | | | | | | | | | | | | | | | | | | | | | | | | | | |
Basic | | | 9,977 | | | | 9,884 | | | | 9,950 | | | | 9,874 | | | | 10,638 | | | | 9,977 | | | | 10,507 | | | | 9,950 | | |
Diluted | | | 9,977 | | | | 9,888 | | | | 9,950 | | | | 9,877 | | | | 10,638 | | | | 9,977 | | | | 10,507 | | | | 9,950 | | |
Dividends declared per share | | $ | 0.11 | | | $ | 0.11 | | | $ | 0.33 | | | $ | 0.32 | | | $ | 0.11 | | | $ | 0.11 | | | $ | 0.33 | | | $ | 0.33 | | |
See Notes to Condensed Consolidated Financial Statements.
43
GRAHAM CORPORATION AND SUBSIDIARIES
CONDENSED CONSOLIDATED STATEMENTS OF COMPREHENSIVE (LOSS) INCOME
(Unaudited)
| | Three Months Ended | | | Nine Months Ended | | | | | | | | | | | | | | | | | | |
| | December 31, | | | December 31, | | | Three Months Ended | | Nine Months Ended | |
| | 2020 | | | 2019 | | | 2020 | | | 2019 | | | December 31, | | | December 31, | | |
| | (Amounts in thousands) | | | (Amounts in thousands) | | | 2021 | | | 2020 | | | 2021 | | | 2020 | | |
Net income | | $ | 1,060 | | | $ | 9 | | | $ | 1,986 | | | $ | 1,296 | | |
| | | (Amounts in thousands) | | (Amounts in thousands) | |
Net (loss) income | | | $ | (3,730 | ) | | $ | 1,060 | | | $ | (7,348 | ) | | $ | 1,986 | | |
Other comprehensive income: | | | | | | | | | | | | | | | | | | | | | | | | | | | | | |
Foreign currency translation adjustment | | | 261 | | | | 88 | | | | 416 | | | | (135 | ) | | | 108 | | | | 261 | | | | 201 | | | | 416 | | |
Defined benefit pension and other postretirement plans net of income tax expense of $61 and $55 for the three months ended December 31, 2020 and 2019, respectively, and $185 and $164 for the nine months ended December 31, 2020 and 2019, respectively | | | 205 | | | | 194 | | | | 614 | | | | 583 | | |
Defined benefit pension and other postretirement plans net
of income tax expense of $60 and $61 for the three months
ended December 31, 2021 and 2020, respectively, and $182
and $185 for the nine months ended December 31, 2021 and
2020, respectively | | | | 210 | | | | 205 | | | | 631 | | | | 614 | | |
Total other comprehensive income | | | 466 | | | | 282 | | | | 1,030 | | | | 448 | | | | 318 | | | | 466 | | | | 832 | | | | 1,030 | | |
Total comprehensive income | | $ | 1,526 | | | $ | 291 | | | $ | 3,016 | | | $ | 1,744 | | |
Total comprehensive (loss) income | | | $ | (3,412 | ) | | $ | 1,526 | | | $ | (6,516 | ) | | $ | 3,016 | | |
See Notes to Condensed Consolidated Financial Statements.
54
GRAHAM CORPORATION AND SUBSIDIARIES
CONDENSED CONSOLIDATED BALANCE SHEETS
(Unaudited)
| | | | | | | | |
| | December 31, 2021 | | | March 31, 2021 | |
| | (Amounts in thousands, except per share data) | |
Assets | | | | | | |
Current assets: | | | | | | |
Cash and cash equivalents | | $ | 13,991 | | | $ | 59,532 | |
Investments | | | — | | | | 5,500 | |
Trade accounts receivable, net of allowances ($176 and $29 at December 31 and
March 31, 2021, respectively) | | | 36,650 | | | | 17,378 | |
Unbilled revenue | | | 24,930 | | | | 19,994 | |
Inventories | | | 20,428 | | | | 17,332 | |
Prepaid expenses and other current assets | | | 1,905 | | | | 512 | |
Income taxes receivable | | | 2,670 | | | | — | |
Total current assets | | | 100,574 | | | | 120,248 | |
Property, plant and equipment, net | | | 25,218 | | | | 17,618 | |
Prepaid pension asset | | | 7,121 | | | | 6,216 | |
Operating lease assets | | | 8,708 | | | | 95 | |
Goodwill | | | 22,823 | | | | — | |
Customer relationships | | | 11,456 | | | | — | |
Technology and technical know-how | | | 9,805 | | | | — | |
Other intangible assets, net | | | 10,173 | | | | — | |
Other assets | | | 202 | | | | 103 | |
Total assets | | $ | 196,080 | | | $ | 144,280 | |
Liabilities and stockholders’ equity | | | | | | |
Current liabilities: | | | | | | |
Short-term debt obligations | | $ | 9,750 | | | $ | — | |
Current portion of long-term debt | | | 2,000 | | | | — | |
Current portion of finance lease obligations | | | 23 | | | | 21 | |
Accounts payable | | | 14,650 | | | | 17,972 | |
Accrued compensation | | | 7,951 | | | | 6,106 | |
Accrued expenses and other current liabilities | | | 5,414 | | | | 4,628 | |
Customer deposits | | | 27,665 | | | | 14,059 | |
Operating lease liabilities | | | 1,114 | | | | 46 | |
Income taxes payable | | | — | | | | 741 | |
Total current liabilities | | | 68,567 | | | | 43,573 | |
Long-term debt | | | 17,000 | | | | — | |
Finance lease obligations | | | 17 | | | | 34 | |
Operating lease liabilities | | | 7,702 | | | | 37 | |
Deferred income tax liability | | | 977 | | | | 635 | |
Accrued pension and postretirement benefit liabilities | | | 1,958 | | | | 2,072 | |
Other long-term liabilities | | | 2,320 | | | | — | |
Total liabilities | | | 98,541 | | | | 46,351 | |
Commitments and contingencies (Note 10) | | | | | | |
Stockholders’ equity: | | | | | | |
Preferred stock, $1.00 par value, 500 shares authorized | | | — | | | | — | |
Common stock, $0.10 par value, 25,500 shares authorized, 10,810 and 10,748 shares
issued and 10,638 and 9,959 shares outstanding at December 31 and March 31, 2021,
respectively | | | 1,081 | | | | 1,075 | |
Capital in excess of par value | | | 27,608 | | | | 27,272 | |
Retained earnings | | | 78,500 | | | | 89,372 | |
Accumulated other comprehensive loss | | | (6,565 | ) | | | (7,397 | ) |
Treasury stock (172 and 790 shares at December 31 and March 31, 2021, respectively) | | | (3,085 | ) | | | (12,393 | ) |
Total stockholders’ equity | | | 97,539 | | | | 97,929 | |
Total liabilities and stockholders’ equity | | $ | 196,080 | | | $ | 144,280 | |
| | December 31, | | | March 31, | |
| | 2020 | | | 2020 | |
| | (Amounts in thousands, except per share data) | |
Assets | | | | | | | | |
Current assets: | | | | | | | | |
Cash and cash equivalents | | $ | 63,792 | | | $ | 32,955 | |
Investments | | | 5,500 | | | | 40,048 | |
Trade accounts receivable, net of allowances ($30 and $33 at December 31 and March 31, 2020, respectively) | | | 19,884 | | | | 15,400 | |
Unbilled revenue | | | 14,950 | | | | 14,592 | |
Inventories | | | 17,463 | | | | 22,291 | |
Prepaid expenses and other current assets | | | 1,004 | | | | 906 | |
Income taxes receivable | | | 604 | | | | 485 | |
Total current assets | | | 123,197 | | | | 126,677 | |
Property, plant and equipment, net | | | 17,457 | | | | 17,587 | |
Prepaid pension asset | | | 4,091 | | | | 3,460 | |
Operating lease assets | | | 135 | | | | 243 | |
Other assets | | | 106 | | | | 153 | |
Total assets | | $ | 144,986 | | | $ | 148,120 | |
Liabilities and stockholders’ equity | | | | | | | | |
Current liabilities: | | | | | | | | |
Current portion of finance lease obligations | | $ | 21 | | | $ | 40 | |
Accounts payable | | | 15,753 | | | | 14,253 | |
Accrued compensation | | | 5,410 | | | | 4,453 | |
Accrued expenses and other current liabilities | | | 4,123 | | | | 3,352 | |
Customer deposits | | | 19,115 | | | | 26,983 | |
Operating lease liabilities | | | 80 | | | | 153 | |
Total current liabilities | | | 44,502 | | | | 49,234 | |
Finance lease obligations | | | 39 | | | | 55 | |
Operating lease liabilities | | | 45 | | | | 82 | |
Deferred income tax liability | | | 1,668 | | | | 721 | |
Accrued pension liability | | | 827 | | | | 747 | |
Accrued postretirement benefits | | | 572 | | | | 557 | |
Total liabilities | | | 47,653 | | | | 51,396 | |
Commitments and contingencies (Note 10) | | | | | | | | |
Stockholders’ equity: | | | | | | | | |
Preferred stock, $1.00 par value, 500 shares authorized | | | — | | | | — | |
Common stock, $0.10 par value, 25,500 shares authorized, 10,779 and 10,689 shares issued and 9,976 and 9,881 shares outstanding at December 31 and March 31, 2020, respectively | | | 1,078 | | | | 1,069 | |
Capital in excess of par value | | | 27,193 | | | | 26,361 | |
Retained earnings | | | 90,083 | | | | 91,389 | |
Accumulated other comprehensive loss | | | (8,526 | ) | | | (9,556 | ) |
Treasury stock (803 and 808 shares at December 31 and March 31, 2020, respectively) | | | (12,495 | ) | | | (12,539 | ) |
Total stockholders’ equity | | | 97,333 | | | | 96,724 | |
Total liabilities and stockholders’ equity | | $ | 144,986 | | | $ | 148,120 | |
See Notes to Condensed Consolidated Financial Statements.
5
GRAHAM CORPORATION AND SUBSIDIARIES
CONDENSED CONSOLIDATED STATEMENTS OF CASH FLOWS
(Unaudited)
| | | Nine Months Ended | | | Nine Months Ended | |
| | December 31, | | | December 31, | |
| | 2020 | | | 2019 | | | 2021 | | | 2020 | |
Operating activities: | | (Dollar amounts in thousands) | | | (Dollar amounts in thousands) | |
Net income | | $ | 1,986 | | | $ | 1,296 | | |
Adjustments to reconcile net income to net cash provided (used) by operating activities: | | | | | | | | | |
Net (loss) income | | | $ | (7,348 | ) | | $ | 1,986 | |
Adjustments to reconcile net (loss) income to net cash (used) provided by operating
activities: | | | | | | | |
Depreciation | | | 1,458 | | | | 1,468 | | | | 2,232 | | | | 1,458 | |
Amortization | | | — | | | | 11 | | | | 1,765 | | | | — | |
Amortization of actuarial losses | | | 799 | | | | 747 | | | | 725 | | | | 799 | |
Equity-based compensation expense | | | 821 | | | | 731 | | | | 599 | | | | 821 | |
Gain on disposal or sale of property, plant and equipment | | | 3 | | | | (2 | ) | | | 22 | | | | 3 | |
Loss on sale of Energy Steel & Supply Co. | | | — | | | | 87 | | |
Change in fair value of contingent consideration | | | | (1,900 | ) | | | — | |
Deferred income taxes | | | 776 | | | | 33 | | | | 152 | | | | 776 | |
(Increase) decrease in operating assets: | | | | | | | | | | | | | | |
Accounts receivable | | | (4,220 | ) | | | (438 | ) | | | (10,964 | ) | | | (4,220 | ) |
Unbilled revenue | | | (284 | ) | | | (6,799 | ) | | | 2,186 | | | | (284 | ) |
Inventories | | | 4,999 | | | | 4,225 | | | | 579 | | | | 4,999 | |
Prepaid expenses and other current and non-current assets | | | (76 | ) | | | (7 | ) | | | (933 | ) | | | (76 | ) |
Income taxes receivable | | | (119 | ) | | | 301 | | | | (3,423 | ) | | | (119 | ) |
Operating lease assets | | | 116 | | | | 176 | | | | 744 | | | | 116 | |
Prepaid pension asset | | | (631 | ) | | | (653 | ) | | | (905 | ) | | | (631 | ) |
Increase (decrease) in operating liabilities: | | | | | | | | | | | | | | |
Accounts payable | | | 1,401 | | | | (3,036 | ) | | | (6,058 | ) | | | 1,401 | |
Accrued compensation, accrued expenses and other current and non-current liabilities | | | 1,754 | | | | (299 | ) | | | 465 | | | | 1,754 | |
Customer deposits | | | (8,092 | ) | | | (1,938 | ) | | | 7,553 | | | | (8,092 | ) |
Operating lease liabilities | | | (116 | ) | | | (101 | ) | | | (663 | ) | | | (116 | ) |
Long-term portion of accrued compensation, accrued pension liability and accrued postretirement benefits | | | 95 | | | | 79 | | | | 620 | | | | 95 | |
Net cash provided (used) by operating activities | | | 670 | | | | (4,119 | ) | |
Net cash (used) provided by operating activities | | | | (14,552 | ) | | | 670 | |
Investing activities: | | | | | | | | | | | | | | |
Purchase of property, plant and equipment | | | (1,462 | ) | | | (1,389 | ) | | | (1,909 | ) | | | (1,462 | ) |
Proceeds from disposal of property, plant and equipment | | | 6 | | | | 2 | | | | — | | | | 6 | |
Proceeds from the sale of Energy Steel & Supply Co. | | | — | | | | 602 | | |
Purchase of investments | | | (37,103 | ) | | | (141,414 | ) | | | — | | | | (37,103 | ) |
Redemption of investments at maturity | | | 71,651 | | | | 145,146 | | | | 5,500 | | | | 71,651 | |
Net cash provided by investing activities | | | 33,092 | | | | 2,947 | | |
Acquisition of Barber-Nichols, LLC | | | | (59,563 | ) | | | — | |
Net cash (used) provided by investing activities | | | | (55,972 | ) | | | 33,092 | |
Financing activities: | | | | | | | | | | | | | | |
Principal repayments on finance lease obligations | | | (35 | ) | | | (38 | ) | |
Increase in short-term debt obligations | | | | 9,750 | | | | — | |
Principal repayments on long-term debt | | | (4,599 | ) | | | — | | | | (1,000 | ) | | | (4,599 | ) |
Proceeds from the issuance of long-term debt | | | 4,599 | | | | — | | | | 20,000 | | | | 4,599 | |
Issuance of common stock | | | — | | | | 24 | | |
Principal repayments on finance lease obligations | | | | (15 | ) | | | (35 | ) |
Repayments on lease financing obligations | | | | (157 | ) | | | — | |
Payment of debt issuance costs | | | | (150 | ) | | | — | |
Dividends paid | | | (3,292 | ) | | | (3,163 | ) | | | (3,524 | ) | | | (3,292 | ) |
Purchase of treasury stock | | | (23 | ) | | | (230 | ) | | | (41 | ) | | | (23 | ) |
Net cash used by financing activities | | | (3,350 | ) | | | (3,407 | ) | |
Net cash provided (used) by financing activities | | | | 24,863 | | | | (3,350 | ) |
Effect of exchange rate changes on cash | | | 425 | | | | (143 | ) | | | 120 | | | | 425 | |
Net increase (decrease) in cash and cash equivalents, including cash classified within current assets held for sale | | | 30,837 | | | | (4,722 | ) | |
Net decrease in cash classified within current assets held for sale | | | — | | | | 552 | | |
Net increase (decrease) in cash and cash equivalents | | | 30,837 | | | | (4,170 | ) | |
Net (decrease) increase in cash and cash equivalents | | | | (45,541 | ) | | | 30,837 | |
Cash and cash equivalents at beginning of period | | | 32,955 | | | | 15,021 | | | | 59,532 | | | | 32,955 | |
Cash and cash equivalents at end of period | | $ | 63,792 | | | $ | 10,851 | | | $ | 13,991 | | | $ | 63,792 | |
See Notes to Condensed Consolidated Financial Statements.
6
GRAHAM CORPORATION AND SUBSIDIARIES
CONDENSED CONSOLIDATED STATEMENTS OF CHANGES IN STOCKHOLDERS’ EQUITY
NINE MONTHS ENDED DECEMBER 31, 20202021
(Dollar Amounts in Thousands)
(Unaudited)
(Unaudited)
| | Common Stock | | | Capital in | | | | | | | Accumulated Other | | | | | | | Total | | | | | | | | | | | | | | | | | | | | | | | | | | | | | |
| | | | | | Par | | | Excess of | | | Retained | | | Comprehensive | | | Treasury | | | Stockholders' | | | Common Stock | | | Capital in | | | | Accumulated
Other | | | | Total | |
| | Shares | | | Value | | | Par Value | | | Earnings | | | Loss | | | Stock | | | Equity | | | | | Par | | Excess of | | Retained | | Comprehensive | | Treasury | | Stockholders' | |
Balance at April 1, 2020 | | | 10,689 | | | $ | 1,069 | | | $ | 26,361 | | | $ | 91,389 | | | $ | (9,556 | ) | | $ | (12,539 | ) | | $ | 96,724 | | |
Comprehensive income | | | | | | | | | | | | | | | (1,818 | ) | | | 214 | | | | | | | | (1,604 | ) | |
| | | Shares | | | Value | | | Par Value | | | Earnings | | | Loss | | | Stock | | | Equity | |
Balance at April 1, 2021 | | | 10,748 | | $ | 1,075 | | $ | 27,272 | | $ | 89,372 | | $ | (7,397 | ) | | $ | (12,393 | ) | | $ | 97,929 | |
Comprehensive loss | | | | | | | | | | | | (3,126 | ) | | 298 | | | | | (2,828 | ) |
Issuance of shares | | | 113 | | | | 11 | | | | (11 | ) | | | | | | | | | | | | | | | — | | | 135 | | 13 | | (13 | ) | | | | | | | | | | | — | |
Forfeiture of shares | | | (22 | ) | | | (2 | ) | | | 2 | | | | | | | | | | | | | | | | — | | | (9 | ) | | (1 | ) | | 1 | | | | | | | | | | | — | |
Dividends | | | | | | | | | | | | | | | (1,097 | ) | | | | | | | | | | | (1,097 | ) | | | | | | | | | | | (1,177 | ) | | | | | | | | (1,177 | ) |
Recognition of equity-based compensation expense | | | | | | | | | | | 164 | | | | | | | | | | | | | | | | 164 | | | | | | | | | 353 | | | | | | | | | | | 353 | |
Issuance of treasury stock | | | | | | | | | (194 | ) | | | | | | | | 9,158 | | 8,964 | |
Purchase of treasury stock | | | | | | | | | | | | | | | | | | | | | | | (23 | ) | | | (23 | ) | | | | | | | | | | | | | | | | | | (41 | ) | | | (41 | ) |
Balance at June 30, 2020 | | | 10,780 | | | | 1,078 | | | | 26,516 | | | | 88,474 | | | | (9,342 | ) | | | (12,562 | ) | | | 94,164 | | |
Balance at June 30, 2021 | | | 10,874 | | 1,087 | | 27,419 | | 85,069 | | (7,099 | ) | | (3,276 | ) | | 103,200 | |
Comprehensive loss | | | | | | | | | | | | (492 | ) | | 216 | | | | | (276 | ) |
Issuance of shares | | | 27 | | 3 | | (3 | ) | | | | | | | | | | | — | |
Forfeiture of shares | | | (91 | ) | | (9 | ) | | 9 | | | | | | | | | | | — | |
Dividends | | | | | | | | | | | | (1,177 | ) | | | | | | | | (1,177 | ) |
Recognition of equity-based
compensation expense | | | | | | | | | (23 | ) | | | | | | | | | | | (23 | ) |
Issuance of treasury stock | | | | | | | | | | (63 | ) | | | | | | | | | 191 | | | | 128 | |
Balance at September 30, 2021 | | | 10,810 | | 1,081 | | 27,339 | | 83,400 | | (6,883 | ) | | (3,085 | ) | | 101,852 | |
Comprehensive income | | | | | | | | | | | | | | | 2,744 | | | | 350 | | | | | | | | 3,094 | | | | | | | | | | | | (3,730 | ) | | 318 | | | | | (3,412 | ) |
Dividends | | | | | | | | | | | | | | | (1,098 | ) | | | | | | | | | | | (1,098 | ) | | | | | | | | | | | (1,170 | ) | | | | | | | | (1,170 | ) |
Recognition of equity-based compensation expense | | | | | | | | | | | 330 | | | | | | | | | | | | | | | | 330 | | | | | | | | | 269 | | | | | | | | | | | 269 | |
Issuance of treasury stock | | | | | | | | | | | 20 | | | | | | | | | | | | 67 | | | | 87 | | |
Balance at September 30, 2020 | | | 10,780 | | | | 1,078 | | | | 26,866 | | | | 90,120 | | | | (8,992 | ) | | | (12,495 | ) | | | 96,577 | | |
Comprehensive income | | | | | | | | | | | | | | | 1,060 | | | | 466 | | | | | | | | 1,526 | | |
Forfeiture of shares | | | (1 | ) | | | | | | | | | | | | | | | | | | | | | | | — | | |
Dividends | | | | | | | | | | | | | | | (1,097 | ) | | | | | | | | | | | (1,097 | ) | |
Recognition of equity-based compensation expense | | | | | | | | | | | 327 | | | | | | | | | | | | | | | | 327 | | |
Balance at December 31, 2020 | | | 10,779 | | | $ | 1,078 | | | $ | 27,193 | | | $ | 90,083 | | | $ | (8,526 | ) | | $ | (12,495 | ) | | $ | 97,333 | | |
Balance at December 31, 2021 | | | | 10,810 | | | $ | 1,081 | | | $ | 27,608 | | | $ | 78,500 | | | $ | (6,565 | ) | | $ | (3,085 | ) | | $ | 97,539 | |
| | | | | | | | | | | | | | | | | | | | | | | | | | | | | | | | | | | | | | | | | | | |
See Notes to Condensed Consolidated Financial Statements.
7
GRAHAM CORPORATION AND SUBSIDIARIES
CONDENSED CONSOLIDATED STATEMENTS OF CHANGES IN STOCKHOLDERS’ EQUITY
NINE MONTHS ENDED DECEMBER 31, 20192020
(Dollar Amounts in Thousands)
(Unaudited)
(Unaudited)
| | Common Stock | | | Capital in | | | | | | | Accumulated Other | | | | | | | Total | | | | | | | | | | | | | | | | | | | | | | | | | | | | | |
| | | | | | Par | | | Excess of | | | Retained | | | Comprehensive | | | Treasury | | | Stockholders' | | | Common Stock | | | Capital in | | | | Accumulated
Other | | | | Total | |
| | Shares | | | Value | | | Par Value | | | Earnings | | | Loss | | | Stock | | | Equity | | | | | Par | | Excess of | | Retained | | Comprehensive | | Treasury | | Stockholders' | |
Balance at April 1, 2019 | | | 10,650 | | | $ | 1,065 | | | $ | 25,277 | | | $ | 93,847 | | | $ | (8,833 | ) | | $ | (12,390 | ) | | $ | 98,966 | | |
Cumulative effect of change in accounting principle | | | | | | | | | | | | | | | (80 | ) | | | | | | | | | | | (80 | ) | |
| | | Shares | | | Value | | | Par Value | | | Earnings | | | Loss | | | Stock | | | Equity | |
Balance at April 1, 2020 | | | 10,689 | | $ | 1,069 | | $ | 26,361 | | $ | 91,389 | | $ | (9,556 | ) | | $ | (12,539 | ) | | $ | 96,724 | |
Comprehensive income | | | | | | | | | | | | | | | 82 | | | | 107 | | | | | | | | 189 | | | | | | | | | | | | (1,818 | ) | | 214 | | | | | (1,604 | ) |
Issuance of shares | | | 83 | | | | 8 | | | | (8 | ) | | | | | | | | | | | | | | | — | | | 113 | | 11 | | (11 | ) | | | | | | | | | | | — | |
Forfeiture of shares | | | (34 | ) | | | (3 | ) | | | 3 | | | | | | | | | | | | | | | | — | | | (22 | ) | | (2 | ) | | 2 | | | | | | | | | | | — | |
Dividends | | | | | | | | | | | | | | | (988 | ) | | | | | | | | | | | (988 | ) | | | | | | | | | | | (1,097 | ) | | | | | | | | (1,097 | ) |
Recognition of equity-based compensation expense | | | | | | | | | | | 88 | | | | | | | | | | | | | | | | 88 | | | | | | | | | 164 | | | | | | | | | | | 164 | |
Purchase of treasury stock | | | | | | | | | | | | | | | | | | | | | | | (230 | ) | | | (230 | ) | | | | | | | | | | | | | | | | | | (23 | ) | | | (23 | ) |
Balance at June 30, 2019 | | | 10,699 | | | | 1,070 | | | | 25,360 | | | | 92,861 | | | | (8,726 | ) | | | (12,620 | ) | | | 97,945 | | |
Balance at June 30, 2020 | | | 10,780 | | 1,078 | | 26,516 | | 88,474 | | (9,342 | ) | | (12,562 | ) | | 94,164 | |
Comprehensive income | | | | | | | | | | | | | | | 1,205 | | | | 59 | | | | | | | | 1,264 | | | | | | | | | | | | 2,744 | | 350 | | | | | 3,094 | |
Dividends | | | | | | | | | | | | | | | (1,087 | ) | | | | | | | | | | | (1,087 | ) | | | | | | | | | | | (1,098 | ) | | | | | | | | (1,098 | ) |
Recognition of equity-based compensation expense | | | | | | | | | | | 324 | | | | | | | | | | | | | | | | 324 | | | | | | | | | 330 | | | | | | | | | | | 330 | |
Issuance of treasury stock | | | | | | | | | | | 30 | | | | | | | | | | | | 19 | | | | 49 | | | | | | | | | | 20 | | | | | | | | | | 67 | | | | 87 | |
Balance at September 30, 2019 | | | 10,699 | | | | 1,070 | | | | 25,714 | | | | 92,979 | | | | (8,667 | ) | | | (12,601 | ) | | | 98,495 | | |
Balance at September 30, 2020 | | | 10,780 | | 1,078 | | 26,866 | | 90,120 | | (8,992 | ) | | (12,495 | ) | | 96,577 | |
Comprehensive income | | | | | | | | | | | | | | | 9 | | | | 282 | | | | | | | | 291 | | | | | | | | | | | | 1,060 | | 466 | | | | | 1,526 | |
Issuance of shares | | | 2 | | | | | | | | 24 | | | | | | | | | | | | | | | | 24 | | |
Forfeiture of shares | | | (1 | ) | | | | | | | | | | | | | | | | | | | | | | | — | | | (1 | ) | | | | | | | | | | | | | | | | | — | |
Dividends | | | | | | | | | | | | | | | (1,088 | ) | | | | | | | | | | | (1,088 | ) | | | | | | | | | | | (1,097 | ) | | | | | | | | (1,097 | ) |
Recognition of equity-based compensation expense | | | | | | | | | | | 319 | | | | | | | | | | | | | | | | 319 | | | | | | | | | 327 | | | | | | | | | | | 327 | |
Balance at December 31, 2019 | | | 10,700 | | | $ | 1,070 | | | $ | 26,057 | | | $ | 91,900 | | | $ | (8,385 | ) | | $ | (12,601 | ) | | $ | 98,041 | | |
| | | | | | | | | | | | | | | | | | | | | | | | | | | | | |
Balance at December 31, 2020 | | | | 10,779 | | | $ | 1,078 | | | $ | 27,193 | | | $ | 90,083 | | | $ | (8,526 | ) | | $ | (12,495 | ) | | $ | 97,333 | |
See Notes to Condensed Consolidated Financial Statements.
98
GRAHAM CORPORATION AND SUBSIDIARIES
NOTES TO CONDENSED CONSOLIDATED FINANCIAL STATEMENTS
(Unaudited)
(Amounts in thousands, except per share data)
NOTE 1 – BASIS OF PRESENTATION:
Graham Corporation's (the "Company's") Condensed Consolidated Financial Statements include its wholly-owned foreign subsidiaries located in Suzhou, China and Ahmedabad, India.India at December 31, 2021 and March 31, 2021, and its recently acquired wholly-owned subsidiary, Barber-Nichols, LLC ("BN"), located in Arvada, Colorado at December 31, 2021 and for the period June 1, 2021 through December 31, 2021 (See Note 2). The Condensed Consolidated Financial Statements have been prepared in accordance with accounting principles generally accepted in the U.S. ("GAAP") for interim financial information and the instructions to Form 10-Q and Rule 8-03 of Regulation S-X, each as promulgated by the U.S. Securities and Exchange Commission. The Company's Condensed Consolidated Financial Statements do not include all information and notes required by GAAP for complete financial statements. The unaudited Condensed Consolidated Balance Sheet as of March 31, 20202021 presented herein was derived from the Company’s audited Consolidated Balance Sheet as of March 31, 2020.2021. For additional information, please refer to the consolidated financial statements and notes included in the Company's Annual Report on Form 10-K for the fiscal year ended March 31, 20202021 ("fiscal 2020"2021"). In the opinion of management, all adjustments, including normal recurring accruals considered necessary for a fair presentation, have been included in the Company's Condensed Consolidated Financial Statements.
The Company's results of operations and cash flows for the three and nine months ended December 31, 20202021 are not necessarily indicative of the results that may be expected for the current fiscal year, which ends March 31, 20212022 ("fiscal 2021"2022"). The three-month period ended December 31, 2021 is also referred to as “the third quarter”.
Going Concern - The accompanying condensed consolidated financial statements are prepared in accordance with generally accepted accounting principles applicable to a going concern, which contemplates the realization of assets and the satisfaction of liabilities in the normal course of business.
The Company determined that as of December 31, 2021, it did not meet its financial covenants required by its loan agreement to maintain a maximum total leverage ratio of 3.25 to 1.0, nor did it maintain a minimum fixed charge coverage ratio of 1.2 to 1.0. On February 4, 2022, management obtained a waiver from Bank of America waiving their right to call the debt immediately due and payable as of December 31, 2021. As a term of receiving the waiver, until such time as Bank of America has received all required financial information with respect to the Company for the period ending on or about March 31, 2022, and such financial information confirms to the Bank of America's satisfaction that no default exists at such time, the Company will not permit the principal balance outstanding under the line of credit with Bank of America to exceed $15,000. Absent a waiver or an amendment of the loan agreement, the Company anticipates that it will not meet these covenants as of March 31, 2022, which would be an event of default. Violation of its covenants under the loan agreement provides the bank with the option to accelerate the maturity of the term loan under the loan agreement, which carries a balance of $19,000 as of December 31, 2021 and the revolving credit facility, which has a principal balance outstanding of $9,750 as of December 31, 2021. If the Company's lenders accelerate the maturity of the term loan and the revolving credit facility, the Company does not have sufficient cash to repay the outstanding debt. These conditions and events raise substantial doubt about the Company's ability to continue as a going concern within one year after the date that these financial statements were issued.
In response to these conditions, management has begun to actively engage in negotiations with the bank regarding amendments to its term loan and its revolving credit facility and related financial covenants. However, this plan has not been finalized and is not within the Company's control, and therefore cannot be deemed probable. As a result, the Company has concluded that management's plans do not alleviate substantial doubt about the Company's ability to continue as a going concern. The condensed consolidated financial statements do not include any adjustments relating to the recoverability and classification of recorded asset amounts and classification of liabilities that might result from the outcome of this uncertainty.
NOTE 2 – ACQUISITION:
On June 1, 2021, the Company completed its acquisition of Barber-Nichols, LLC ("BN"), a privately-owned designer and manufacturer of turbomachinery products located in Arvada, Colorado that serves the defense and aerospace industry as well as the energy and cryogenic markets. The Company believes this acquisition furthers its growth strategy through market and product diversification, broadens its offerings and strengthens its presence in the defense industry, builds on its presence in the energy markets and adds capabilities in the space industry.
This transaction was accounted for as a business combination which requires that assets acquired and liabilities assumed be recognized at their fair value as of the acquisition date. The purchase price of $72,014 was comprised of 610 shares of the Company's
9
common stock, representing a value of $8,964 at a price of $14.69 per share, and cash consideration of $61,150, subject to certain potential adjustments, including a customary working capital adjustment. The cash consideration was funded through cash on-hand and debt proceeds (See Note 15). The purchase agreement included a contingent earn-out dependent upon certain financial measures of BN post-acquisition, in which the sellers were eligible to receive up to $14,000 in additional cash consideration. At June 30, 2021, a liability of $1,900 was recorded for the contingent earn-out. Subsequent to the acquisition, the earn out agreement was terminated and the contingent liability was reversed into Other operating income, net, on the Company’s Condensed Statement of Operations. Prior to the acquisition, BN and Ascent Properties Group, LLC, a related party, entered into a nine year operating lease agreement for an office and manufacturing building in Arvada, Colorado. This lease was acquired as part of the Company's acquisition of BN and has a monthly payment in the amount of $40 with a 3% yearly escalation. Acquisition related costs of $111 and $373 were expensed in the three and nine month periods ending December 31, 2021, and are included in Selling, general and administrative expenses in the Condensed Consolidated Statement of Operations.
The cost of the acquisition was preliminarily allocated to the assets acquired and liabilities assumed based upon its estimated fair value at the date of the acquisition and the amount exceeding the fair value of $22,923 was recorded as goodwill, which is not deductible for tax purposes. During the second quarter of fiscal 2022, the preliminary valuation of backlog was increased by $100, therefore goodwill was reduced to $22,823. As the values of certain assets and liabilities are preliminary in nature, they are subject to adjustment as additional information is obtained, including, but not limited to, the finalization of the valuation of intangible assets, the final reconciliation and confirmation of tangible assets. The valuation of acquisition-related intangible assets will be finalized within twelve months of the close of the acquisition. The fair value of acquisition-related intangible assets includes customer relationships, technology and technical know-how, backlog and trade name. Backlog and trade name are included in the line item "Other intangible assets, net" in the Condensed Consolidated Balance Sheet. Customer relationships were valued using an income approach, specifically the Multi Period Excess Earnings method, which incorporates assumptions regarding retention rate, new customer growth and customer related costs. Trade name and technology and technical know-how were both valued using a Relief from Royalty method, which develops a market based royalty rate used to reflect the after tax royalty savings attributable to owning the intangible asset. The fair value of backlog was determined using a net realizable value methodology, and was computed as the present value of the expected sales attributable to backlog less the remaining costs to fulfill the backlog. Changes to the preliminary valuation may result in material adjustments to the fair value of assets and liabilities acquired.
The purchase price was allocated to specific intangible assets on a preliminary basis as follows:
| | | | | | |
| | Fair Value Assigned | | | Weighted Average Amortization Period |
At December 31, 2021 | | | | | |
Intangibles subject to amortization: | | | | | |
Customer relationships | | $ | 11,800 | | | 20 years |
Technology and technical know-how | | | 10,100 | | | 20 years |
Backlog | | | 3,900 | | | 4 years |
| | $ | 25,800 | | | |
Intangibles not subject to amortization: | | | | | |
Tradename | | | 7,400 | | | Indefinite |
| | $ | 7,400 | | | |
Technology and technical know-how and customer relationships are amortized in selling, general and administrative expense on a straight line basis over their estimated useful lives. Backlog is amortized in cost of products sold over the projected conversion period based on management estimates at time of purchase. Intangible amortization was $756 and $1,765 for the three and nine months ended December 31, 2021. The estimated annual amortization expense is as follows:
| | | | |
| | Annual Amortization | |
Remainder of 2022 | | $ | 756 | |
2023 | | | 2,476 | |
2024 | | | 1,782 | |
2025 | | | 1,318 | |
2026 | | | 1,095 | |
2027 and thereafter | | | 16,608 | |
Total intangible amortization | | $ | 24,035 | |
| | | |
10
During the three months ended December 31, 2021, the Company made adjustments to the initial purchase price allocation of accounts receivable and accounts payable in the amount of $80.. The following table summarizes the preliminary allocation of the cost of the acquisition, as adjusted, to the assets acquired and liabilities assumed as of the close of the acquisition:
| | | | |
| | June 1, | |
| | 2021 | |
Assets acquired: | | | |
Cash and cash equivalents | | $ | 1,587 | |
Accounts receivable | | | 8,074 | |
Unbilled revenue | | | 7,068 | |
Inventory | | | 3,669 | |
Other current assets | | | 409 | |
Property, plant & equipment | | | 8,037 | |
Operating lease asset | | | 9,026 | |
Goodwill | | | 22,823 | |
Backlog | | | 3,900 | |
Customer relationships | | | 11,800 | |
Technology and technical know-how | | | 10,100 | |
Tradename | | | 7,400 | |
Total assets acquired | | | 93,893 | |
Liabilities assumed: | | | |
Accounts payable | | | 2,656 | |
Accrued compensation | | | 1,341 | |
Other current liabilities | | | 665 | |
Customer deposits | | | 6,048 | |
Operating lease liabilities | | | 9,066 | |
Other long term liabilities | | | 2,103 | |
Total liabilities assumed | | | 21,879 | |
Purchase price | | $ | 72,014 | |
The Condensed Consolidated Statement of Operations for the three and nine months ended December 31, 2021 includes net sales of BN of $11,968 and $31,925, respectively. The following unaudited pro forma information presents the consolidated results of operations of the Company as if the BN acquisition had occurred at the beginning of each of the fiscal periods presented:
| | | | | | | | | | | | | | | | |
| | Three Months Ended | | | Nine Months Ended | |
| | December 31, | | | December 31, | |
| | 2021 | | | 2020 | | | 2021 | | | 2020 | |
Net sales | | $ | 28,774 | | | $ | 40,649 | | | $ | 94,890 | | | $ | 117,009 | |
Net (loss) income | | | (3,646 | ) | | | (684 | ) | | | (5,902 | ) | | | 4,465 | |
(Loss) earnings per share | | | | | | | | | | | | |
Basic | | $ | (0.34 | ) | | $ | (0.06 | ) | | $ | (0.55 | ) | | $ | 0.42 | |
Diluted | | $ | (0.34 | ) | | $ | (0.06 | ) | | $ | (0.55 | ) | | $ | 0.42 | |
The unaudited pro forma information presents the combined operating results of Graham Corporation and BN, with the results prior to the acquisition date adjusted to include the pro forma impact of the adjustment of depreciation of fixed assets based on the preliminary purchase price allocation, the adjustment to interest income reflecting the cash paid in connection with the acquisition, including acquisition-related expenses, at the Company’s weighted average interest income rate, interest expense and loan origination fees at the Company’s current interest rate, amortization expense related to the fair value adjustments for intangible assets, non-recurring acquisition-related costs and the impact of income taxes on the pro forma adjustments utilizing the applicable statutory tax rate.
The unaudited pro forma results are presented for illustrative purposes only. These pro forma results do not purport to be indicative of the results that would have actually been obtained if the acquisition occurred as of the beginning of each of the periods presented, nor does the pro forma data intend to be a projection of results that may be obtained in the future.
11
NOTE 3 – REVENUE RECOGNITION:
The Company recognizes revenue on contracts when or as it satisfies a performance obligation by transferring control of the product to the customer. For contracts in which revenue is recognized upon shipment, control is generally transferred when products are shipped, title is transferred, significant risks of ownership have transferred, the Company has rights to payment, and rewards of ownership pass to the customer. For contracts in which revenue is recognized over time, control is generally transferred as the Company creates an asset that does not have an alternative use to the Company and the Company has an enforceable right to payment for the performance completed to date.
The following table presents the Company’s revenue disaggregated by product line and geographic area:
| | | Three Months Ended | | | Nine Months Ended | | | Three Months Ended | | | Nine Months Ended | | |
| | December 31, | | | December 31, | | | December 31, | | | December 31, | | |
Product Line | | 2020 | | | 2019 | | | 2020 | | | 2019 | | | 2021 | | | 2020 | | | 2021 | | | 2020 | | |
Heat transfer equipment | | $ | 8,165 | | | $ | 7,062 | | | $ | 32,145 | | | $ | 21,394 | | | $ | 6,284 | | | $ | 8,165 | | | $ | 21,754 | | | $ | 32,145 | | |
Vacuum equipment | | | 14,969 | | | | 12,969 | | | | 26,901 | | | | 27,232 | | | | 5,412 | | | | 14,969 | | | | 13,946 | | | | 26,901 | | |
Fluid systems | | | | 6,939 | | | | — | | | | 15,342 | | | | — | | |
Power systems | | | | 5,030 | | | | — | | | | 16,583 | | | | — | | |
All other | | | 4,020 | | | | 5,255 | | | | 12,772 | | | | 18,896 | | | | 5,109 | | | | 4,020 | | | | 15,452 | | | | 12,772 | | |
Net sales | | $ | 27,154 | | | $ | 25,286 | | | $ | 71,818 | | | $ | 67,522 | | | $ | 28,774 | | | $ | 27,154 | | | $ | 83,077 | | | $ | 71,818 | | |
| | | | | | | | | | | | | | | | | | | | | | | | | | | |
| | | | | | | | | | | | | | | | | | | | | | | | | | | |
Geographic Region | | | | | | | | | | | | | | | | | | | | | | | | | | | |
Asia | | $ | 11,211 | | | $ | 723 | | | $ | 20,903 | | | $ | 4,960 | | | $ | 1,493 | | | $ | 11,211 | | | $ | 10,485 | | | $ | 20,903 | | |
Canada | | | 1,874 | | | | 2,666 | | | | 4,804 | | | | 5,910 | | | | 924 | | | | 1,874 | | | | 3,011 | | | | 4,804 | | |
Middle East | | | 806 | | | | 7,498 | | | | 2,243 | | | | 8,783 | | | | 627 | | | | 806 | | | | 2,202 | | | | 2,243 | | |
South America | | | 2,426 | | | | 808 | | | | 5,238 | | | | 3,284 | | | | 242 | | | | 2,426 | | | | 720 | | | | 5,238 | | |
U.S. | | | 10,716 | | | | 13,409 | | | | 37,406 | | | | 43,589 | | | | 24,737 | | | | 10,716 | | | | 64,832 | | | | 37,406 | | |
All other | | | 121 | | | | 182 | | | | 1,224 | | | | 996 | | | | 751 | | | | 121 | | | | 1,827 | | | | 1,224 | | |
Net sales | | $ | 27,154 | | | $ | 25,286 | | | $ | 71,818 | | | $ | 67,522 | | | $ | 28,774 | | | $ | 27,154 | | | $ | 83,077 | | | $ | 71,818 | | |
A performance obligation represents a promise in a contract to provide a distinct good or service to a customer. The Company accounts for a contract when it has approval and commitment from both parties, the rights of the parties are identified, payment terms are identified, the contract has commercial substance and collectability of consideration is probable. Transaction price reflects the amount of consideration to which the Company expects to be entitled in exchange for transferred products. A contract’s transaction
10
price is allocated to each distinct performance obligation and revenue is recognized as the performance obligation is satisfied. In certain cases, the Company may separate a contract into more than one performance obligation, while in other cases, several products may be part of a fully integrated solution and are bundled into a single performance obligation. If a contract is separated into more than one performance obligation, the Company allocates the total transaction price to each performance obligation in an amount based on the estimated relative standalone selling prices of the promised goods underlying each performance obligation. The Company has made an accounting policy election to exclude from the measurement of the contract price all taxes assessed by government authorities that are collected by the Company from its customers. The Company does not adjust the contract price for the effects of a financing component if the Company expects, at contract inception, that the period between when a product is transferred to a customer and when the customer pays for the product will be one year or less. Shipping and handling fees billed to the customer are recorded in revenue and the related costs incurred for shipping and handling are included in cost of products sold.
Revenue on the majority of the Company’s contracts, as measured by number of contracts, is recognized upon shipment to the customer. Revenue on larger contracts, which are fewer in number but represent the majority of revenue, is recognized over time. Revenue from contracts that is recognized upon shipment accounted for approximately 40%25% and 20%40% of revenue for the three-month periods ended December 31, 20202021 and 2019,2020, respectively, and revenue from contracts that is recognized over time accounted for approximately 60%75% and 80%60% of revenue for the three-month periods ended December 31, 20202021 and 2019,2020, respectively. Revenue from contracts that is recognized upon shipment accounted for approximately 50%25% and 30%50% of revenue for the nine-month periods ended December 31, 20202021 and 2019,2020, respectively, and revenue from contracts that is recognized over time accounted for approximately 50%75% and 70%50% of revenue for the nine-month periods ended December 31, 20202021 and 2019,2020, respectively. During the nine months ended December 31, 2020,2021, revenue recognized over time as a percentage of total revenue was lowerhigher as compared with the prior year period due to the prior year having limited production on large contracts during the first quarter of fiscal 2021 as a result of the COVID-19 pandemic, as well as the completion of two large projects in China which did not meet the criteria for recognizing revenue over time. The Company recognizes revenue over time when contract performance results in the creation of a product for which the Company does not have an alternative use and the contract includes an enforceable right to payment in an amount that corresponds directly with the
12
value of the performance completed. To measure progress towards completion on performance obligations for which revenue is recognized over time the Company utilizes an input method based upon a ratio of direct labor hours incurred to date to management’s estimate of the total labor hours to be incurred on each contract, an input method based upon a ratio of total contract costs incurred to date to management’s estimate of the total contract costs to be incurred or an output method based upon completion of operational milestones, depending upon the nature of the contract. The Company has established the systems and procedures essential to developing the estimates required to account for performance obligations over time. These procedures include monthly review by management of costs incurred, progress towards completion, identified risks and opportunities, sourcing determinations, changes in estimates of costs yet to be incurred, availability of materials, and execution by subcontractors. Sales and earnings are adjusted in current accounting periods based on revisions in the contract value due to pricing changes and estimated costs at completion. Losses on contracts are recognized immediately when evident to management.
The timing of revenue recognition, invoicing and cash collections affect trade accounts receivable, unbilled revenue (contract assets) and customer deposits (contract liabilities) on the Condensed Consolidated Balance Sheets. Unbilled revenue represents revenue on contracts that is recognized over time and exceeds the amount that has been billed to the customer. Unbilled revenue is separately presented in the Condensed Consolidated Balance Sheets. The Company may have an unconditional right to payment upon billing and prior to satisfying the performance obligations. The Company will then record a contract liability and an offsetting asset of equal amount until the deposit is collected and the performance obligations are satisfied. Customer deposits are separately presented in the Condensed Consolidated Balance Sheets. Customer deposits are not considered a significant financing component as they are generally received less than one year before the product is completed or used to procure specific material on a contract, as well as related overhead costs incurred during design and construction.
Net contract assets (liabilities) consisted of the following:
| | | December 31, 2020 | | | March 31, 2020 | | | Change | | | December 31, 2021 | | | March 31, 2021 | | | Change | |
| | | | | | | | | | | | | | | | | | | | |
Unbilled revenue (contract assets) | | $ | 14,950 | | | $ | 14,592 | | | $ | 358 | | | $ | 24,930 | | | $ | 19,994 | | | $ | 4,936 | |
Customer deposits (contract liabilities) | | | (19,115 | ) | | | (26,983 | ) | | | 7,868 | | | | (27,665 | ) | | | (14,059 | ) | | | (13,606 | ) |
Net contract liabilities | | $ | (4,165 | ) | | $ | (12,391 | ) | | $ | 8,226 | | | $ | (2,735 | ) | | $ | 5,935 | | | $ | (8,670 | ) |
Contract liabilities at December 31, 2020 and March 31, 20202021 include $3,290$6,468 and $3,660,$1,603, respectively, of customer deposits for which the Company has an unconditional right to collect payment. Trade accounts receivable, as presented on the Condensed Consolidated Balance Sheets, includes corresponding balances at December 31, 2020 and March 31, 2020,2021, respectively. Revenue recognized in the three and nine months ended December 31, 20202021 that was included in the contract liability balance at March 31, 20202021 and the contract liability balance acquired on June 1, 2021 of $6,048, was $5,518$5,659 and $15,568,$18,951, respectively. Changes in the net contract liability balance during the nine months ended December 31, 20202021 were impacted by a $358$4,936 increase in contract assets, of which $27,109$36,141 was due to contract progress and the acquisition of BN’s contract assets of $7,068 offset by invoicing to customers of $26,751.$38,273. In addition, contract liabilities increased $7,868$13,606 driven new customer deposits of $26,509 offset by revenue recognized in the current period that was included in the contract liability balance at March 31, 2020 offset by new customer deposits2021, and the acquisition of $7,700.BN’s contract liabilities of $6,048.
11
Receivables billed but not paid under retainage provisions in the Company’s customer contracts were $2,840$2,786 and $2,016$3,747 at December 31, 2020 and March 31, 2020,2021, respectively.
Incremental costs to obtain a contract consist of sales employee and agent commissions. Commissions paid to employees and sales agents are capitalized when paid and amortized to selling, general and administrative expense when the related revenue is recognized. Capitalized costs, net of amortization, to obtain a contract were $60$149 and $45$39 at December 31, 2020 and March 31, 2020,2021, respectively, and are included in the line item "Prepaid expenses and other current assets" in the Condensed Consolidated Balance Sheets. The related amortization expense was $309$12 and $53$309 in the three months ended December 31, 20202021 and 2019,2020, respectively, and $561$46 and $139$561 in the nine months ended December 31, 20202021 and 2019, respectively.2020
The Company’s remaining unsatisfied performance obligations represent a measure of the total dollar value of work to be performed on contracts awarded and in progress. The Company also refers to this measure as backlog. As of December 31, 2020,2021, the Company had remaining unsatisfied performance obligations of $149,736.$272,599. The Company expects to recognize revenue on approximately 45%40% to 50%50% of the remaining performance obligations within one year 20%, 25% to 25%35% in one to two years and the remaining beyond two years.
NOTE 3 – INVESTMENTS:
Investments consist of certificates of deposits with financial institutions. All investments have original maturities of greater than three months and less than one year and are classified as held-to-maturity, as the Company believes it has the intent and ability to hold the securities to maturity. Investments are stated at amortized cost which approximates fair value. All investments held by the Company at December 31, 2020 are scheduled to mature on or before March 25, 2021.
NOTE 4 – INVENTORIES:
Inventories are stated at the lower of cost or net realizable value, using the average cost method.
13
Major classifications of inventories are as follows:
| | | December 31, | | | March 31, | | | December 31, | | March 31, | |
| | 2020 | | | 2020 | | | 2021 | | | 2021 | |
Raw materials and supplies | | $ | 3,389 | | | $ | 3,061 | | | $ | 3,951 | | | $ | 3,490 | |
Work in process | | | 12,386 | | | | 18,018 | | | | 14,997 | | | | 12,196 | |
Finished products | | | 1,688 | | | | 1,212 | | | | 1,480 | | | | 1,646 | |
Total | | $ | 17,463 | | | $ | 22,291 | | | $ | 20,428 | | | $ | 17,332 | |
NOTE 5 – EQUITY-BASED COMPENSATION:
The 2020 Graham Corporation Equity Incentive Plan (the "2020 Plan") was, as approved by the Company’s stockholders at the Annual Meeting on August 11, 2020, and provides for the issuance of 422 shares of common stock in connection with grants of incentive stock options, non-qualified stock options, restricted stock units and stock awards to officers, key employees and outside directors. The shares available for issuance include 112 remaining shares that remain available shares under the Company’s prior plan, the Amended and Restated 2000 Graham Corporation Incentive Plan to Increase Shareholder Value (the "2000(the"2000 Plan"). As of August 11, 2020, the effective date of the 2020 Plan, 0 further awards will be granted under the 2000 Plan. However, any previously outstanding award grantedstock options for 33 shares and 53 shares of unvested restricted stock under the 2000 Plan remains subject to the terms of such plan until the time it is no longer outstanding.such options expire or are exercised and such shares of restricted stock vest or are forfeited.
NaN restricted stock awards were granted in the three-month periods ended December 31, 20202021 and 2019. Restricted2020. 162 and 113 restricted stock awards were granted in the nine-month periods ended December 31, 2021 and 2020, respectively. 88 restricted shares and 201954 restricted shares were 113 and 83, respectively. Restricted shares of 54 and 40 granted to officers in fiscal 20212022 and fiscal 2020,2021, respectively, that vest 100%100% on the third anniversary of the grant date subject to the satisfaction of the performance metrics for the applicable three-year period. Restricted54 restricted shares of 38 and 2838 restricted shares granted to officers and key employees in fiscal 20212022 and fiscal 2020,2021, respectively, vest 33⅓% per year over a three-year term. Restricted20 restricted shares of 21 and 1521 restricted shares granted to directors in fiscal 20212022 and fiscal 2020,2021, respectively, vest 100%100% on the first year anniversary of the grant date. Stock options may be granted at prices not less than the fair market value at the date of grant and expire no later than ten years after the date of grant. NaN stock option awards were granted in the three-month or nine-month periods ended December 31, 20202021 and 2019.2020.
During the three months ended December 31, 20202021 and 2019,2020, the Company recognized equity-based compensation costs related to restricted stock awards of $312$260 and $308,$312, respectively. The income tax benefit recognized related to equity-based compensation was $72$58 and $67$72 for the three months ended December 31, 20202021 and 2019,2020, respectively. During the nine months ended December 31, 20202021 and 2019,2020, the Company recognized equity-based compensation costs related to restricted stock awards of $783$575 and $709,$783, respectively. The income tax benefit recognized related to equity-based compensation was $183$127 and $156$183 for the nine months ended December 31, 2021 and 2020, and 2019, respectively.
The Company has an Employee Stock Purchase Plan (the "ESPP"), which allows eligible employees to purchase shares of the Company's common stock at a discount of up to 15%15% of its fair market value on the (1) last, (2) first or (3) lower of the last or first day of the six-month offering period. A total of 200 shares of common stock may be purchased under the ESPP. During the three months ended December 31, 20202021 and 2019,2020, the Company recognized equity-based compensation costs of $15$9 and $11,$15, respectively, related to the ESPP and $4$1 and $3,$4, respectively, of related tax benefits. During the nine monthsnine-months ended December 31, 20202021 and 2019,2020, the Company recognized equity-based compensation costs of $38$24 and $22,$38, respectively, related to the ESPP and $9$5 and $5,$9, respectively, of related tax benefits.
NOTE 6 – (LOSS) INCOME PER SHARE:
Basic (loss) income per share is computed by dividing net (loss) income by the weighted average number of common shares outstanding for the period. Diluted (loss) income per share is calculated by dividing net (loss) income by the weighted average number
14
of common shares outstanding and, when applicable, potential common shares outstanding during the period. A reconciliation of the numerators and denominators of basic and diluted (loss) income per share is presented below:
| | Three Months Ended | | | Nine Months Ended | |
| | December 31, | | | December 31, | |
| | 2020 | | | 2019 | | | 2020 | | | 2019 | |
Basic income per share | | | | | | | | | | | | | | | | |
Numerator: | | | | | | | | | | | | | | | | |
Net income | | $ | 1,060 | | | $ | 9 | | | $ | 1,986 | | | $ | 1,296 | |
Denominator: | | | | | | | | | | | | | | | | |
Weighted average common shares outstanding | | | 9,977 | | | | 9,884 | | | | 9,950 | | | | 9,874 | |
Basic income per share | | $ | 0.11 | | | $ | — | | | $ | 0.20 | | | $ | .13 | |
Diluted income per share | | | | | | | | | | | | | | | | |
Numerator: | | | | | | | | | | | | | | | | |
Net income | | $ | 1,060 | | | $ | 9 | | | $ | 1,986 | | | $ | 1,296 | |
Denominator: | | | | | | | | | | | | | | | | |
Weighted average common shares outstanding | | | 9,977 | | | | 9,884 | | | | 9,950 | | | | 9,874 | |
Stock options outstanding | | | — | | | | 4 | | | | — | | | | 3 | |
Weighted average common and potential common shares outstanding | | | 9,977 | | | | 9,888 | | | | 9,950 | | | | 9,877 | |
Diluted income per share | | $ | 0.11 | | | $ | — | | | $ | 0.20 | | | $ | 0.13 | |
| | | | | | | | | | | | | | | | | |
| | Three Months Ended | | | Nine Months Ended | | |
| | December 31, | | | December 31, | | |
| | 2021 | | | 2020 | | | 2021 | | | 2020 | | |
Basic (loss) income per share | | | | | | | | | | | | | |
Numerator: | | | | | | | | | | | | | |
Net (loss) income | | $ | (3,730 | ) | | $ | 1,060 | | | $ | (7,348 | ) | | $ | 1,986 | | |
Denominator: | | | | | | | | | | | | | |
Weighted average common shares
outstanding | | | 10,638 | | | | 9,977 | | | | 10,507 | | | | 9,950 | | |
Basic (loss) income per share | | $ | (0.35 | ) | | $ | 0.11 | | | $ | (0.70 | ) | | $ | 0.20 | | |
| | | | | | | | | | | | | |
Diluted (loss) income per share | | | | | | | | | | | | | |
Numerator: | | | | | | | | | | | | | |
Net (loss) income | | $ | (3,730 | ) | | $ | 1,060 | | | $ | (7,348 | ) | | $ | 1,986 | | |
Denominator: | | | | | | | | | | | | | |
Weighted average common shares
outstanding | | | 10,638 | | | | 9,977 | | | | 10,507 | | | | 9,950 | | |
Stock options outstanding | | | — | | | | — | | | | — | | | | — | | |
Weighted average common and
potential common shares
outstanding | | | 10,638 | | | | 9,977 | | | | 10,507 | | | | 9,950 | | |
Diluted (loss) income per share | | $ | (0.35 | ) | | $ | 0.11 | | | $ | (0.70 | ) | | $ | 0.20 | | |
OptionsNone of the options to purchase a total of 3733 shares of common stock at December 31, 2021 were outstandingincluded in the computation of diluted income per share as the affect would be anti-dilutive due to the net losses in the quarters. None of the options to purchase 37 shares of common stock at December 31, 2020 but were not included in the above computation of diluted income per share given their exercise prices as they would not be dilutive upon issuance.
NOTE 7 – PRODUCT WARRANTY LIABILITY:
The reconciliation of the changes in the product warranty liability is as follows:
| | | Three Months Ended | | | Nine Months Ended | | | Three Months Ended | | | Nine Months Ended | | |
| | December 31, | | | December 31, | | | December 31, | | | December 31, | | |
| | 2020 | | | 2019 | | | 2020 | | | 2019 | | | 2021 | | | 2020 | | | 2021 | | | 2020 | | |
Balance at beginning of period | | $ | 308 | | | $ | 348 | | | $ | 359 | | | $ | 366 | | | $ | 449 | | | $ | 308 | | | $ | 626 | | | $ | 359 | | |
Expense for product warranties | | | 28 | | | | 67 | | | | 23 | | | | 96 | | |
BNI warranty accrual acquired | | | | — | | | | | | | 169 | | | | | |
Expense (income) for product warranties | | | | 19 | | | | 28 | | | | (2 | ) | | | 23 | | |
Product warranty claims paid | | | (21 | ) | | | (3 | ) | | | (67 | ) | | | (50 | ) | | | (35 | ) | | | (21 | ) | | | (360 | ) | | | (67 | ) | |
Balance at end of period | | $ | 315 | | | $ | 412 | | | $ | 315 | | | $ | 412 | | | $ | 433 | | | $ | 315 | | | $ | 433 | | | $ | 315 | | |
Income of $2 for product warranties in the nine months ended December 31, 2021 resulted from the reversal of provisions made that were no longer required due to lower claims experience.
The product warranty liability is included in the line item "Accrued expenses and other current liabilities" in the Condensed Consolidated Balance Sheets.
NOTE 8 – CASH FLOW STATEMENT:
Interest paid was $9$263 and $9 in each of the nine-month periods ended December 31, 2021 and 2020, and 2019.respectively. Income taxes paid for the nine months ended December 31, 2021 and 2020 were $1,388and 2019 were $51 and $27,$51, respectively.
In the nine months ended December 31, 2020 and 2019, non-cash activities included the issuance of treasury stock valued at $87 and $49, respectively, to the Company’s ESPP.
At December 31, 20202021 and 2019,2020, there were $37$80 and $10,$37, respectively, of capital purchases that were recorded in accounts payable and are not included in the caption "Purchase of property, plant and equipment" in the Condensed Consolidated Statements of Cash Flows.
15
The cash utilized for the acquisition of BN of $59,563 included the cash consideration of $61,150, net of cash acquired of $1,587. In the nine months ended December 31, 2021, non-cash activities included the issuance of 610 treasury shares valued at $8,964, included as part of the consideration for the acquisition of BN.
In the second quarter ended September 30, 2021, non-cash activities included pension adjustments, net of income tax, of $68.
NOTE 9 – EMPLOYEE BENEFIT PLANS:
The components of pension cost are as follows:
| | | Three Months Ended | | | Nine Months Ended | | | Three Months Ended | | | Nine Months Ended | |
| | December 31, | | | December 31, | | | December 31, | | | December 31, | |
| | 2020 | | | 2019 | | | 2020 | | | 2019 | | | 2021 | | | 2020 | | | 2021 | | | 2020 | |
Service cost | | $ | 115 | | | $ | 124 | | | $ | 346 | | | $ | 372 | | | $ | 93 | | | $ | 115 | | | $ | 280 | | | $ | 346 | |
Interest cost | | | 303 | | | | 322 | | | | 909 | | | | 968 | | | | 296 | | | | 303 | | | | 894 | | | | 909 | |
Expected return on assets | | | (628 | ) | | | (663 | ) | | | (1,885 | ) | | | (1,992 | ) | | | (681 | ) | | | (628 | ) | | | (2,045 | ) | | | (1,885 | ) |
Amortization of actuarial loss | | | 259 | | | | 242 | | | | 779 | | | | 726 | | | | 265 | | | | 259 | | | | 707 | | | | 779 | |
Net pension cost | | $ | 49 | | | $ | 25 | | | $ | 149 | | | $ | 74 | | | $ | (27 | ) | | $ | 49 | | | $ | (164 | ) | | $ | 149 | |
The Company made 0 contributions to its defined benefit pension plan during the nine months ended December 31, 20202021 and does 0t0t expect to make any contributions to the plan for the balance of fiscal 2021.2022.
During the second quarter ended September 30, 2021, the Company remeasured the projected benefit obligation to the supplemental executive retirement plan due to the retirement of the Company’s chief executive officer, who was the only active participant in the plan. Recognition of an actuarial gain, net of tax, of $68 was included in other comprehensive (loss) income.
The components of the postretirement benefit cost are as follows:
| | | Three Months Ended | | | Nine Months Ended | | | Three Months Ended | | Nine Months Ended | |
| | December 31, | | | December 31, | | | December 31, | | | December 31, | |
| | 2020 | | | 2019 | | | 2020 | | | 2019 | | | 2021 | | | 2020 | | | 2021 | | | 2020 | |
Interest cost | | $ | 4 | | | $ | 5 | | | $ | 13 | | | $ | 16 | | | $ | 3 | | | $ | 4 | | | $ | 10 | | | $ | 13 | |
Amortization of actuarial loss | | | 7 | | | | 7 | | | | 20 | | | | 21 | | | | 6 | | | | 7 | | | | 18 | | | | 20 | |
Net postretirement benefit cost | | $ | 11 | | | $ | 12 | | | $ | 33 | | | $ | 37 | | | $ | 9 | | | $ | 11 | | | $ | 28 | | | $ | 33 | |
The Company paid 0 benefits related to its postretirement benefit plan during the nine months ended December 31, 2020.2021. The Company expects to pay benefits of approximately $77$72 for the balance of fiscal 2021.2022.
The components of net periodic benefit cost other than service cost are included in the line item “Other income”"Other income" in the Condensed Consolidated Statements of Income.Operations.
The Company self-funds the medical insurance coverage it provides to its U.S. based employees.employees in certain locations. The Company maintains a stop loss insurance policy in order to limit its exposure to claims. The liability of $138$133 and $124$184 on December 31, 20202021 and March 31, 2020,2021, respectively, related to the self-insured medical plan is primarily based upon claim history and is included in the caption “Accrued compensation”"Accrued compensation" as a current liability in the Condensed Consolidated Balance Sheets.
NOTE 10 – COMMITMENTS AND CONTINGENCIES:
The Company has been named as a defendant in lawsuits alleging personal injury from exposure to asbestos allegedly contained in, or accompanying, products made by the Company. The Company is a co-defendant with numerous other defendants in these lawsuits and intends to vigorously defend itself against these claims. The claims in the Company’s current lawsuits are similar to those made in previous asbestos-related suits that named the Company as a defendant, which either were dismissed when it was shown that the Company had not supplied products to the plaintiffs’ places of work or were settled for immaterial amounts. The Company cannot provide any assurances that any pending or future matters will be resolved in the same manner as previous lawsuits.
14
As of December 31, 2020,2021, the Company was subject to the claims noted above, as well as other legal proceedings and potential claims that have arisen in the ordinary course of business.
16
Although the outcome of the lawsuits, legal proceedings or potential claims to which the Company is, or may become, a party to cannot be determined and an estimate of the reasonably possible loss or range of loss cannot be made for the majority of the claims, management does not believe that the outcomes, either individually or in the aggregate, will have a material adverse effect on the Company’s results of operations, financial position or cash flows.
NOTE 11 – INCOME TAXES:
The Company files federal and state income tax returns in several domestic and international jurisdictions. In most tax jurisdictions, returns are subject to examination by the relevant tax authorities for a number of years after the returns have been filed. The Company is subject to U.S. federal examination for the tax years 20162017 through 20192020 and examination in state tax jurisdictions for the tax years 20152016 through 2019.2020. The Company is subject to examination in the People’s Republic of China for tax years 20162017 through 20192020 and in India for tax year 2019.2019 through 2020.
There was 0 liability for unrecognized tax benefits at either December 31, 20202021 or March 31, 2020.2021.
NOTE 12 – CHANGES IN ACCUMULATED OTHER COMPREHENSIVE LOSS:
The changes in accumulated other comprehensive loss by component for the nine months ended December 31, 20202021 and 20192020 are as follows:
| | | | | | | | | | | | |
| | Pension and
Other
Postretirement
Benefit Items | | | Foreign
Currency
Items | | | Total | |
Balance at April 1, 2021 | | $ | (7,698 | ) | | $ | 301 | | | $ | (7,397 | ) |
Other comprehensive income before reclassifications | | | 68 | | | | 201 | | | | 269 | |
Amounts reclassified from accumulated other comprehensive
loss | | | 563 | | | | — | | | | 563 | |
Net current-period other comprehensive income | | | 631 | | | | 201 | | | | 832 | |
Balance at December 31, 2021 | | $ | (7,067 | ) | | $ | 502 | | | $ | (6,565 | ) |
| | | | | | | | | | | | |
| | Pension and
Other
Postretirement
Benefit Items | | | Foreign
Currency
Items | | | Total | |
Balance at April 1, 2020 | | $ | (9,472 | ) | | $ | (84 | ) | | $ | (9,556 | ) |
Other comprehensive loss before reclassifications | | | — | | | | 416 | | | | 416 | |
Amounts reclassified from accumulated other comprehensive
loss | | | 614 | | | | — | | | | 614 | |
Net current-period other comprehensive income | | | 614 | | | | 416 | | | | 1,030 | |
Balance at December 31, 2020 | | $ | (8,858 | ) | | $ | 332 | | | $ | (8,526 | ) |
| | Pension and Other Postretirement Benefit Items | | | Foreign Currency Items | | | Total | |
Balance at April 1, 2020 | | $ | (9,472 | ) | | $ | (84 | ) | | $ | (9,556 | ) |
Other comprehensive income before reclassifications | | | — | | | | 416 | | | | 416 | |
Amounts reclassified from accumulated other comprehensive loss | | | 614 | | | | — | | | | 614 | |
Net current-period other comprehensive income | | | 614 | | | | 416 | | | | 1,030 | |
Balance at December 31, 2020 | | $ | (8,858 | ) | | $ | 332 | | | $ | (8,526 | ) |
| | Pension and Other Postretirement Benefit Items | | | Foreign Currency Items | | | Total | |
Balance at April 1, 2019 | | $ | (8,947 | ) | | $ | 114 | | | $ | (8,833 | ) |
Other comprehensive loss before reclassifications | | | — | | | | (135 | ) | | | (135 | ) |
Amounts reclassified from accumulated other comprehensive loss | | | 583 | | | | — | | | | 583 | |
Net current-period other comprehensive income (loss) | | | 583 | | | | (135 | ) | | | 448 | |
Balance at December 31, 2019 | | $ | (8,364 | ) | | $ | (21 | ) | | $ | (8,385 | ) |
The reclassifications out of accumulated other comprehensive loss by component for the three and nine months ended December 31, 20202021 and 20192020 are as follows:
| | | | | | | | | | | | |
Details about Accumulated Other
Comprehensive Loss Components | | Amount Reclassified from
Accumulated Other
Comprehensive Loss | | | | Affected Line Item in the Condensed
Consolidated Statements of Income |
| | Three Months Ended | | | | |
| | December 31, | | | | |
| | 2021 | | | | 2020 | | | | |
Pension and other postretirement benefit items: | | | | | | | | | | |
Amortization of actuarial loss | | $ | (270 | ) | (1) | | $ | (266 | ) | (1) | | Loss before benefit for income taxes |
| | | (60 | ) | | | | (61 | ) | | | Benefit for income taxes |
| | $ | (210 | ) | | | $ | (205 | ) | | | Net loss |
17
| | | | | | | | | | | | |
Details about Accumulated Other
Comprehensive Loss Components | | Amount Reclassified from
Accumulated Other
Comprehensive Loss | | | | Affected Line Item in the Condensed
Consolidated Statements of Income |
| | Nine Months Ended | | | | |
| | December 31, | | | | |
| | 2021 | | | | 2020 | | | | |
Pension and other postretirement benefit items: | | | | | | | | | | |
Amortization of actuarial loss | | $ | (725 | ) | (1) | | $ | (799 | ) | (1) | | Loss before benefit for income taxes |
| | | (162 | ) | | | | (185 | ) | | | Benefit for income taxes |
| | $ | (563 | ) | | | $ | (614 | ) | | | Net loss |
Details about Accumulated Other Comprehensive Loss Components | | Amount Reclassified from Accumulated Other Comprehensive Loss | | | | Affected Line Item in the Condensed Consolidated Statements of Income |
| | Three Months Ended | | | | |
| | December 31, | | | | |
| | 2020 | | | | 2019 | | | | |
Pension and other postretirement benefit items: | | | | | | | | | | | | |
Amortization of actuarial loss | | $ | (266 | ) | (1) | | $ | (249 | ) | (1) | | Income before provision for income taxes |
| | | (61 | ) | | | | (55 | ) | | | Provision for income taxes |
| | $ | (205 | ) | | | $ | (194 | ) | | | Net income |
These accumulated other comprehensive loss components are included within the computation of pension and other postretirement benefit costs. See Note 9.
Details about Accumulated Other Comprehensive Loss Components | | Amount Reclassified from Accumulated Other Comprehensive Loss | | | | Affected Line Item in the Condensed Consolidated Statements of Income |
| | Nine Months Ended | | | | |
| | December 31, | | | | |
| | 2020 | | | | 2019 | | | | |
Pension and other postretirement benefit items: | | | | | | | | | | | | |
Amortization of actuarial loss | | $ | (799 | ) | (1) | | $ | (747 | ) | (1) | | Income before provision for income taxes |
| | | (185 | ) | | | | (164 | ) | | | Provision for income taxes |
| | $ | (614 | ) | | | $ | (583 | ) | | | Net income |
(1)
| These accumulated other comprehensive loss components are included within the computation of pension and other postretirement benefit costs. See Note 9.
|
NOTE 13 – DEBT:LEASES:
The Company leases certain manufacturing facilities, office space, machinery and office equipment. An arrangement is considered to contain a lease if it conveys the right to use and control an identified asset for a period of time in exchange for consideration. If it is determined that an arrangement contains a lease, then a classification of a lease as operating or finance is determined by evaluating the five criteria outlined in the lease accounting guidance at inception. Leases generally have remaining terms of one year to five years, whereas leases with an initial term of twelve months or less are not recorded on the Condensed Consolidated Balance Sheets. The depreciable life of leased assets related to finance leases is limited by the expected term of the lease, unless there is a transfer of title or purchase option that the Company believes is reasonably certain of exercise. Certain leases include options to renew or terminate. Renewal options are exercisable per the discretion of the Company and vary based on the nature of each lease. The term of the lease includes renewal periods only if the Company is reasonably certain that it will exercise the renewal option. When determining if a renewal option is reasonably certain of being exercised, the Company considers several factors, including but not limited to, the cost of moving to another location, the cost of disrupting operations, whether the purpose or location of the leased asset is unique and the contractual terms associated with extending the lease. The Company’s lease agreements do not contain any residual value guarantees or any material restrictive covenants and the Company does not sublease to any third parties. As of December 31, 2021, the Company did not have any material leases that have been signed but not commenced.
Right-of-use ("ROU") lease assets and lease liabilities are recognized based on the present value of the future minimum lease payments over the lease term at commencement date. ROU assets represent the Company’s right to use an underlying asset for the lease term and lease liabilities represent the Company’s obligation to make payments in exchange for that right of use. Finance lease ROU assets and operating lease ROU assets are included in the line items "Property, plant and equipment, net" and "Operating lease assets", respectively, in the Condensed Consolidated Balance Sheets. The current portion and non-current portion of finance and operating lease liabilities are all presented separately in the Condensed Consolidated Balance Sheets.
The discount rate implicit within the Company’s leases is generally not readily determinable, and therefore, the Company uses an incremental borrowing rate in determining the present value of lease payments based on rates available at commencement.
The weighted average remaining lease term and discount rate for finance and operating leases are as follows:
| | | | | | | | |
| | December 31, | | | December 31, | |
| | 2021 | | | 2020 | |
Finance Leases | | | | | | |
Weighted-average remaining lease term in years | | | 1.67 | | | | 2.63 | |
Weighted-average discount rate | | | 10.67 | % | | | 10.77 | % |
| | | | | | |
Operating Leases | | | | | | |
Weighted-average remaining lease term in years | | | 7.72 | | | | 1.67 | |
Weighted-average discount rate | | | 3.27 | % | | | 5.49 | % |
18
The components of lease expense are as follows:
| | | | | | | | | | | | | | | | |
| | Three Months Ended | | | Nine Months Ended | |
| | December 31, | | | December 31, | |
| | 2021 | | | 2020 | | | 2021 | | | 2020 | |
Finance lease cost: | | | | | | | | | | | | |
Amortization of right-of-use assets | | $ | 5 | | | $ | 5 | | | $ | 15 | | | $ | 15 | |
Interest on lease liabilities | | | 1 | | | | 2 | | | | 4 | | | | 6 | |
Operating lease cost | | | 384 | | | | 41 | | | | 924 | | | | 122 | |
Short-term lease cost | | | 3 | | | | 1 | | | | 18 | | | | 7 | |
Total lease cost | | $ | 393 | | | $ | 49 | | | $ | 961 | | | $ | 150 | |
Operating lease costs during the nine months ended December 31, 2021 and 2020 were included within cost of sales and selling, general and administrative expenses.
As of December 31, 2021, future minimum payments required under non-cancelable leases are:
| | | | | | | | |
| | Operating
Leases | | | Finance
Leases | |
Remainder of 2022 | | $ | 342 | | | $ | 7 | |
2023 | | | 1,325 | | | | 26 | |
2024 | | | 1,183 | | | | 11 | |
2025 | | | 1,164 | | | | — | |
2026 | | | 1,169 | | | | — | |
2027 and thereafter | | | 4,856 | | | | — | |
Total lease payments | | | 10,039 | | | | 44 | |
| | | | | | |
Less – amount representing interest | | | 1,223 | | | | 4 | |
Present value of net minimum lease payments | | $ | 8,816 | | | $ | 40 | |
NOTE 14 – DEBT:
On December 2, 2020,June 1, 2021, the Company entered into a new$20,000five-year term loan with Bank of America. The term loan requires monthly principal payments of $167 through June 1, 2026, with the remaining principal amount plus all interest due on the maturity date. The interest rate on the term loan is the applicable Bloomberg Short-Term Bank Yield Index ("BSBY"), plus 1.50%, subject to a 0.00% floor. In addition, on June 1, 2021, the Company terminated its revolving credit facility agreement with JPMorgan Chase Bank, N.A. and entered into a revolving credit facility with Bank of America that provides a $22,000$30,000 line of credit, including letters of credit and bank guarantees, expandable at the Company’s option and upon the bank’s approval at any time up to $37,000, including a $7,000 commitment for letters$40,000. As of credit and bank guarantees.December 31, 2021, the Company had $9,750 outstanding on the line of credit. The agreement has a one yearfive-year term. This facility replaced the previous facility with JPMorgan Chase Bank, N.A.
At the Company’s option, amountsAmounts outstanding under the facility agreement will bear interest at either: (i) a rate equal to the bank’s prime rate; or (ii) a rate equal to LIBORBSBY plus 1.75%. Amounts available for borrowing under the agreement are1.50%, subject to an unused commitment feea 0.00% floor. As of 0.375%December 31, 2021, the BSBY rate was 0.0558%.
Outstanding letters of credit under the agreement are subject to a fee of 0.75%. The agreement requires1.50% per annum of the Company to secure outstanding lettersundrawn amount of each letter of credit withthat is not secured by cash and cash equivalents0.6% of each letter of credit that is secured by cash. The upfront fee for both the term loan and investments.
revolving credit facility was 0.20% of the committed facilities and amounts available for borrowing under the revolving credit facility are subject to an unused commitment fee of 0.25%. Under the newterm loan agreement and revolving credit facility, the Company covenants to maintain a maximum funded debt to EBITDA (astotal leverage ratio, as defined in such agreements, of 3.0 to 1.0, which may be increased to 3.25 to 1.0 following an acquisition for a period of twelve months following the agreement)closing of the acquisition. In addition, the Company covenants to maintain a minimum fixed charge coverage ratio, as defined in such agreements, of 3.51.2 to 1.0 and minimum margined assets, as defined in such agreements, of 100% of total amounts outstanding on the revolving credit facility, including letters of credit. At December 31, 2021, we were out of compliance with our bank agreement covenants and were granted a minimum earnings before interest expense and income taxeswaiver for noncompliance by Bank of America, N.A. (See Note 1). As part of the waiver, until such time as Bank of America has received all required financial information with respect to interest ratio of 4.0 to 1.0. The agreement also provides that the Company is permittedfor the period ending on or about March 31, 2022, and such financial information confirms to pay dividends without limitation if it maintains a maximum funded debt to EBITDA ratio equal to or less than 2.0 to 1.0 and permitsthe Bank of America's satisfaction that no default exists at such time, the Company will not permit the principal balance outstanding under the line of credit with Bank of America to pay dividends in an amount equal to 25% of net income if it maintains a maximum funded debt to EBITDA ratio of greater than 2.0 to 1.0. The Company was in compliance with all such provisions as of December 31, 2020.exceed $15,000.
On October 28, 2020,June, 1, 2021, the Company entered into a letteran agreement to amend theits letter of credit facility agreement with HSBC Bank USA, N.A. The letter agreement increasesand decreased the letterCompany’s line of credit facility from $14,000$15,000 to $15,000 and requires$7,500. Under the amended agreement, the Company to secureincurs an annual facility fee of $5 and outstanding letters of credit with cash and cash equivalents and investments. Outstanding letters of credit under the agreement are subject to a fee of between 0.75%0.75% and 0.85%0.85%, depending on the term of the letter
19
of credit.
Availability for borrowings and Interest is payable on the principal amounts of unreimbursed letter of credit draws under the facility at a rate of 3% plus the bank’s prime rate. The Company's obligations under the agreement are secured by cash held with the bank. As of December 31, 2021, there was $7,215 letters of credit was $15,000 and $4,900, respectively, underoutstanding with HSBC. The agreement is subject to an annual renewal by the JPMorgan Chase Bank, N.A. and HSBC Bank USA, N.A. facilities atbank on July 31 of each year.
Letters of credit outstanding as of December 31, 2020. At2021 and March 31, 2020 availability was $21,672 under the previous facilities.
NOTE 14 – OTHER EXPENSE:
On June 24, 2019, the Company completed the sale of its subsidiary, Energy Steel & Supply Co.2021 were $8,399 and $11,567, to Hayward Tyler, a division of Avingtrans PLC, a global leader in performance-critical pumps and motors for the energy sector. Under the terms of the stock purchase agreement, the Company received proceeds of $602, subject to certain adjustments, including a customary working capital adjustment. The Company recognized a loss on the disposal of $87 in the first quarter of fiscal 2020. In addition, during the first quarter of fiscal 2020, the Company incurred a bad debt charge of $98 and an inventory write down of $338 related to the bankruptcy of Westinghouse Electric Company. All of these items are included in the line item “Other expense” in the Condensed Consolidated Statement of Income for the nine months ended December 31, 2019. respectively.
NOTE 15 – ACCOUNTING AND REPORTING CHANGES:
In the normal course of business, management evaluates all new accounting pronouncements issued by the Financial Accounting Standards Board ("FASB"), the Securities and Exchange Commission, the Emerging Issues Task Force, the American
16
Institute of Certified Public Accountants or any other authoritative accounting body to determine the potential impact they may have on the Company's consolidated financial statements.
In December 2019, the FASB issued Accounting Standards Update ("ASU") No. 2019-12, "Simplifying the Accounting for Income Taxes." The amended guidance simplifies the accounting for income taxes, eliminating certain exceptions to the general income tax principles, in an effort to reduce the cost and complexity of application. The amended guidance is effective for fiscal years beginning after December 15, 2020, including interim periods within those fiscal years. The guidance requires application on either a prospective, retrospective or modified retrospective basis, contingent on the income tax exception being applied. The Company adopted the new guidance, on a prospective basis, on April 1, 2021. The adoption of this ASU did not have a material impact on the Company’s consolidated financial statements.
Management does not expect any other recently issued accounting pronouncements, which have not already been adopted, to have a material impact onon the Company's consolidated financial statements.
NOTE 16 – OTHER OPERATING INCOME, NET:
On August 9, 2021, the Company and James R. Lines entered into a Severance and Transition Agreement (the "Transaction Agreement") pursuant to which Mr. Lines resigned from his position as the Company’s Chief Executive Officer and as a member of the Board of Directors, and from positions he holds with all Company subsidiaries and affiliates, effective as of the close of business on August 31, 2021. The Transition Agreement provides that for a period of 18 months following the separation date, Mr. Lines is paid his base salary as well as health care premiums. As a result, a liability was recorded in the amount of $798 in Accrued Compensation on the Company’s Condensed Consolidated Balance Sheets and recognized against Other operating income, net on the Condensed Consolidated Statements of Operations.
During the second quarter ended September 30, 2021, the Company terminated the earn out agreement related to the acquisition of BN (see Note 2), therefore the Company recognized a change in fair value of the contingent liability in the amount of $1,900, which was included in Other operating income, net on the Company’s Condensed Consolidated Statement of Operations.
20
Item 2.Management’s Management’s Discussion and Analysis of Financial Condition and Results of Operations
(Dollar(Dollar and share amounts in thousands, except per share data)
Overview
We are a global business that designs, manufactures and sells critical equipment for the defense/space, energy/new energy defense and chemical/petrochemical industries. Our energy markets include oil refining, cogeneration, and alternative power. For the defense and space industry, our equipment is used in nuclear propulsion power systems, for the U.S. Navy.undersea and space propulsion, power and energy management systems and for life support systems in space. Our energy and new energy markets include oil refining, cogeneration, and alternative power to produce hydrogen. For the chemical and petrochemical industries, our equipment is used in fertilizer, ethylene, methanol and downstream chemical facilities.
Our global brand isbrands are built upon our world-renowned engineering expertise in vacuum and heat transfer technology, responsiveclose customer collaboration to design, develop, and flexibleproduce mission critical equipment and systems that enable our customers to meet their economic and operational objectives. Continual improvement of our processes and systems to ensure qualified and compliant equipment are hallmarks of our brand. Our early engagement with customers and support until the end of service and high quality standards. We design and manufacture custom-engineered ejectors, vacuum pumping systems, surface condensers and vacuum systems. Our equipment can also be found in other diverse applications such as metal refining, pulp and paper processing, water heating, refrigeration, desalination, food processing, pharmaceutical, and heating, ventilating and air conditioning.life are values upon which our brands are built.
Our corporate headquarters are located in Batavia, New York. We have production facilities co-located with our headquarters in Batavia. Our wholly-owned subsidiary, Barber-Nichols, LLC ("BN"), based in Arvada, Colorado, designs, develops, manufactures and sells specialty turbomachinery products for the aerospace, cryogenic, defense and energy markets (see "Acquisition" below). We also have wholly-owned foreign subsidiaries, Graham Vacuum and Heat Transfer Technology (Suzhou) Co., Ltd. ("GVHTT"), located in Suzhou, China and Graham India Private Limited ("GIPL"), located in Ahmedabad, India. GVHTT provides sales and engineering support for us in the People's Republic of China and management oversight throughout Southeast Asia. GIPL serves as a sales and market development office focusing on the refining, petrochemical and fertilizer markets in India.
In the first quarter of the fiscal year ended March 31, 2020 (which we refer to as "fiscal 2020"), we completed the sale of our commercial nuclear utility business, Energy Steel and Supply Co. ("Energy Steel").
Our current fiscal year (which we refer to as "fiscal 2021"2022") ends March 31, 2021.2022.
Highlights
Acquisition
We completed the acquisition of BN on June 1, 2021. Founded as a specialty turbomachinery engineering company in 1966, BN has grown rapidly from programs that involve complex production and systems integration. By integrating knowledge in rotating equipment, power generation cycles, and electrical management systems, BN has successfully won the design and development of different power and propulsion systems used in underwater vehicles among many other accomplishments.
The acquisition of BN has changed the composition of the Company’s end market mix. Year-to-date, sales to the defense industry were 52% of our business compared with just 25% of sales to the defense industry in all of fiscal 2021. Space industry sales represent 4% of our year-to-date business, compared with 0% in all of fiscal 2021. The remaining 44% of our year-to-date sales came from the refining, chemical/petrochemical and other commercial markets. These markets represented 75% of our fiscal 2021 sales. BN has outperformed expectations since being acquired.
The BN transaction was accounted for as a business combination, which requires that assets acquired and liabilities assumed be recognized at their fair value as of the acquisition date. The purchase price of $72,014 was comprised of 610 shares of the Company’s common stock, representing a value of $8,964 at $14.69 per share, and cash consideration of $61,150, subject to certain potential adjustments, including a customary working capital adjustment. The cash consideration was funded through cash on-hand and debt proceeds (See Note 15 to the Condensed Consolidated Financial Statements included in Item 1 in this Quarterly Report on Form 10-Q). The purchase agreement with respect to the acquisition also included a contingent earn-out dependent upon certain financial measures of BN post-acquisition, pursuant to which the sellers were eligible to receive up to $14,000 in additional cash consideration. Subsequent to the acquisition, the earn out agreement was terminated. Acquisition related costs of $373 were expensed in the first nine months of fiscal 2022 and are included in Selling, general and administrative expenses for the nine months ended December 31, 2021 in the Condensed Consolidated Statement of Operations. As of October 26, 2021, the Company entered into a Performance Bonus Agreement (the "Bonus Agreement") to provide certain employees of BN with performance-based awards considering the BN business results on a stand-alone basis. The purpose of the bonus arrangement is to align a broader number of the BN leadership team with the achievement of BN performance objectives. The Bonus Agreement provides for payments to be made for certain performance-based results of BN for fiscal years ending March 31, 2024, 2025 and 2026.
Summary
Highlights for the three and nine months ended December 31, 20202021 include:
•Barber-Nichols has outperformed our expectations during the first seven months of ownership. Sales at BN were ahead of those expectations and its profit margins have expanded further.
21
•Orders booked in the third quarter of fiscal 2022 of $67,964 increased 10% compared with $61,753 of orders booked in the third quarter of fiscal 2021. Orders booked in the first nine months of fiscal 2022 were up 11% to $120,217, compared with the first nine months of fiscal 2021 when orders booked were $108,195. The BN contributed $37,251 and $53,301 in orders in the quarter and year-to-date period, respectively. For more information on this performance indicator see "Orders and Backlog" below.
•Backlog reached a record $272,599 at December 31, 2021, with BN contributing $119,096 to that backlog. Backlog was $233,247 at September 30, 2021. For more information on this performance indicator see "Orders and Backlog" below.
•Net sales for the third quarter of fiscal 2022 were $28,774, up 6% , or $1,590, compared with $27,154 for the third quarter of the fiscal year ended March 31, 2021 (which we refer to as "fiscal 2021"). Sales in the quarter include $11,968 related to the BN acquisition which more than offsets declines of $10,378 in the organic business. Net sales for the first nine months of fiscal 2022 were $83,077, up 16%, or $12,259, from $71,818 in the first nine months of fiscal 2021. Sales in the first nine months of fiscal 2022 include $31,925 from the BN acquisition, more than offsetting a reduction of $20,666 in the organic business.
•Gross profit margin and operating margin for the third quarter of fiscal 2022 were 2% and (16%), respectively, compared with 23% and 5%, respectively, for the third quarter of fiscal 2021. Gross profit margin and operating margin for the first nine months of fiscal 2022 were 6% and (11%), respectively, compared with 22% and 3%, respectively, for the first nine months of fiscal 2022.
•Net loss and loss per diluted share for the third quarter of fiscal 2022 were $3,730 and $0.35, respectively, compared with net income and income per diluted share of $1,060 and $0.11, respectively, for the third quarter of fiscal 2021. Net loss and loss per diluted share for the first nine months of fiscal 2022 were $7,348 and $0.70, respectively, compared with net income of $1,986 and income per diluted share of $0.20 for the first nine months of fiscal 2021. The net losses incurred in the first three and nine-month periods of fiscal 2022 were primarily due to Navy project labor and material cost overruns related to defense contracts at our Batavia facility. The losses at our Batavia facility were partly offset by over achievement at our BN subsidiary.
•Cash and short-term investments at December 31, 2021 were $13,991, compared with $16,463 at September 30, 2021.
•We have suspended our dividend due to missing two bank covenants in the third quarter of fiscal 2022. We have obtained a waiver of financial covenants and are working with the bank to amend our credit facility in the fourth quarter.
| •
| Net sales for the third quarter of fiscal 2021 were $27,154, up 7% compared with $25,286 for the third quarter of fiscal 2020. Net sales for the first nine months of fiscal 2021 were $71,818, up 6% compared with net sales of $67,522 for the first nine months of fiscal 2020. Included in the first nine months of fiscal 2020 were sales of $1,276 for our commercial nuclear utility business, which was sold in the first quarter of fiscal 2020.
|
| •
| Net income and income per diluted share for the third quarter of fiscal 2021 were $1,060 and $0.11, respectively, compared with $9 and $0, respectively, in the third quarter of fiscal 2020. Net income and income per diluted share for the first nine months of fiscal 2021 were $1,986 and $0.20, respectively, compared with net income of $1,296 and income per diluted share of $0.13 for the first nine months of fiscal 2020. Included in net income and income per diluted share for the first nine months of fiscal 2020 was a loss of $893 and $0.09, respectively, for our commercial nuclear utility business, which was sold in the first quarter of fiscal 2020.
|
| •
| Results for the first nine months of fiscal 2021 were impacted by the COVID-19 pandemic. During the first quarter, we purposely reduced production at our facility in Batavia, New York to proactively address the risk to our employees from the COVID-19 pandemic. We began the first quarter at 10% of normal staffing capacity and gradually increased production, returning to normal capacity by early June 2020. On average, we were at approximately 50% of normal staffing capacity across the first quarter. While the second quarter staffing was at expected levels, we did have a significant increase in COVID-19 related employee absences in the third quarter. This reduction in staffing adversely affected our sales and earnings in such quarters, which negatively impacted the first nine months of fiscal 2021.
|
| •
| Orders booked in the third quarter of fiscal 2021 were $61,753, compared with the third quarter of fiscal 2020 when orders booked were $20,057. Orders booked in the first nine months of fiscal 2021 were $108,195, compared with the first nine months of fiscal 2020 when orders booked were $67,698.
|
| •
| Backlog was a record $149,736 at December 31, 2020, compared with $114,851 at September 30, 2020 and $112,389 at March 31, 2020.
|
| •
| Gross profit margin and operating margin for the third quarter of fiscal 2021 were 23% and 5%, respectively, compared with 16% and (2%), respectively, for the third quarter of fiscal 2020. Gross profit margin and operating margin for the first nine months of fiscal 2021 were 22% and 3%, respectively, compared with 20% and 0%, respectively, for the first nine months of fiscal 2020.
|
| •
| Cash and short-term investments at December 31, 2020 were $69,292, compared with $67,856 at September 30, 2020 and $73,003 at March 31, 2020.
|
Forward-Looking Statements
This report and other documents we file with the Securities and Exchange Commission include "forward-looking statements" within the meaning of Section 27A of the Securities Act of 1933, as amended, and Section 21E of the Securities Exchange Act of 1934, as amended.amended (the "Exchange Act").
These statements involve known and unknown risks, uncertainties and other factors that may cause actual results to be materially different from any future results implied by the forward-looking statements. Such factors include, but are not limited to, the risks and uncertainties identified by us under the headingheadline "Risk Factors" in Item 1A of our Annual Report on Form 10-K for fiscal 20202021 and included under Part II, Item 1A, of"Risk Factors", in this Quarterly Report on Form 10-Q.
Forward-looking statements may also include, but are not limited to, statements about:
• the ability to execute historic U.S. Navy projects to estimates; •our ability to amend our loan agreement for out term loan and revolving credit facility; •the continuing impacts of, and risks caused by, the COVID-19 pandemic on our business operations, our customers and our markets; •the current and future economic environments, including the volatility associated with the COVID-19 pandemic, affecting us and the markets we serve; •the impact of potential government COVID-19 vaccine mandates on our ability to attract and retain employees and on our business and results of operations; •our ability to successfully integrate and operate BN; •expectations regarding investments in new projects by our customers; •sources of revenue and anticipated revenue, including the contribution from anticipated growth; •expectations regarding achievement of revenue and profitability; 22
•plans for future products and services and for enhancements to existing products and services; •our operations in foreign countries, including among other things, the impact of nationalization in certain countries of suppliers for the markets we serve; •political instability in regions in which our customers are located; •tariffs and trade relations between the United States and its trading partners; •our ability to affect our growth and acquisition strategy; •our ability to maintain or expand work for the U.S. Navy; •our ability to maintain or expand work for the commercial space market; •our ability to successfully execute our existing contracts; •estimates regarding our liquidity and capital requirements; •timing of conversion of backlog to sales; •production preferences directed toward Navy orders with priority ratings; •our ability to attract or retain customers; •the outcome of any existing or future litigation; and •our ability to increase our productivity and capacity.
| •
| the impacts of, and risks caused by, the COVID-19 pandemic on our business operations, our customers and our markets;
|
| •
| the current and future economic environments, including the downturn associated with the COVID-19 pandemic, affecting us and the markets we serve;
|
| •
| expectations regarding investments in new projects by our customers;
|
| •
| sources of revenue and anticipated revenue, including the contribution from anticipated growth;
|
| •
| expectations regarding achievement of revenue and profitability;
|
| •
| plans for future products and services and for enhancements to existing products and services;
|
| •
| our operations in foreign countries;
|
| •
| political instability in regions in which our customers are located;
|
| •
| tariffs and trade relations between the United States and its trading partners;
|
| •
| our ability to execute our growth and acquisition strategy;
|
| •
| our ability to maintain or expand work for the U.S. Navy;
|
| •
| our ability to successfully execute our existing contracts;
|
| •
| estimates regarding our liquidity and capital requirements;
|
| •
| timing of conversion of backlog to sales;
|
| •
| our ability to attract or retain customers;
|
| •
| the outcome of any existing or future litigation; and
|
| •
| our ability to increase our productivity and capacity.
|
Forward-looking statements are usually accompanied by words such as "anticipate," "believe," "contemplate," "continue," "could," "estimate," "may," "might," "intend," "interest," "appear," "expect," "suggest," "plan," "predict," "project," "encourage," "potential," "should," "view," "will," and similar expressions. Actual results could differ materially from historical results or those implied by the forward-looking statements contained in this report.
Undue reliance should not be placed on our forward-looking statements. Except as required by law, we undertake no obligation to update or announce any revisions to forward-looking statements contained in this report, whether as a result of new information, future events or otherwise.
Current Market Conditions
Demand for our equipment and systems for the defense industry is expected to remain strong and continue to expand, based on the planned procurement of submarines, aircraft carriers and undersea propulsion and power systems. Based on defense budget plans and the solutions we provide, we anticipate demand for our equipment and systems will continue to increase in coming years. With the addition of revenue from the BN acquisition, consolidated revenue to the U.S. Navy for the nine-month period was $43.5 million sales, or 52% of total, and is expected to be $60 million to $65 million in fiscal 2022. In addition to U.S. Navy applications, we also provide specialty pumps, turbines, compressors and controllers for various fluid and thermal management systems used in DoD radar, laser, electronics and power systems. We have built a leading position, and in some instances, a sole source position, for certain systems and equipment for the defense/space industry and others.
The ongoing slowdown
Our traditional energy markets are undergoing significant transition. While we expect that fossil fuels will continue to be an important component in the energy industry for many years to come, there are significant changes in the priorities for capital investments by our customers and the regions in which those investments are being made. We expect that the systemic changes in the energy and petrochemical markets, (whichwhich are influenced by the increasing use by consumers of alternative fuels, will lead to demand growth for fossil-based fuels that is less than the global GDP growth rate. Accordingly, we refer to as our "commercial markets") began during the latter part of fiscal 2020 and was primarily caused by an excess supply ofexpect that crude oil which had a negative impact on
19
commodity pricing which resultedrefiners will focus new investments toward the installed base, that inefficient refineries will close and new refining capacity will be co-located where fuels and petrochemicals are produced. We also anticipate that future investment by refiners in more measured investmentrenewable fuels (e.g., renewable diesel), in maintenanceexisting refineries (e.g., to expand feedstock processing flexibility and capital projects within our commercial markets. The economic slowdown and corresponding reductions into improve conversion of oil to refined products) to gain greater throughput, or to build new capacity (e.g., integrated refineries with petrochemical products capabilities), will continue to drive demand for transportation fuel and petrochemical products caused by the ongoing COVID-19 global pandemic further adversely affected our commercial markets. As a result of these combined adverse supply-side and demand-side disruptions, our commercial customers have significantly reduced their operating budgets for the types of products and services we provide.services. The timing and catalyst for a recovery in our commercialthese markets (crude oil refining and chemical/petrochemical) remains uncertain. Accordingly, we believe that in the near term the quantity of projects available for us to compete for will be fewer and that the pricing environment will remain challenging. We also expect that new capacity investment will occur within new or emerging markets over the next several years. Given the growing awareness of supply chain and distribution challenges, these markets are expected to require additional local refining capacity to meet local demand for petroleum products. Therefore, we expect Asia will lead the recovery with new capacity rebuilding there over the next 12-18 months.
23
Of note, we have experienced a noticeable increase in our short cycle and aftermarket orders in the second and third quarters of fiscal 2022, primarily from the domestic market. Aftermarket orders have historically been a leading indicator of future capital investment by our customers in their facilities for upgrades and expansions. Industry analysts have pointed to expectations of increased investment by our customers to address the shortages in supply of refined petrochemical products resulting from the downturn in production following the economic lockdowns which have occurred since the global pandemic, and the subsequent strong global economic recovery.
The alternative and clean energy opportunities for our heat transfer, power production and fluid transfer systems are expected to continue to grow. We assist in designing, developing and producing equipment for hydrogen production, distribution and fueling systems, concentrated solar power and storage, and small modular nuclear systems. We believe that we are positioning the Company to be a more significant contributor as these markets continue to develop.
We believe in the near and medium-term that chemical and petrochemical capital investment will continue to decouple from energy investment. Over the long term, we expect that population growth, an expanding global middle class and an increasing desire for improved quality of life and access to consumer products will drive increased demand for industrial goods within the plastics and resins value chain along with fertilizers or related products. Consequently, oncewhen global economies return to stable growth, we expect investment in new global chemical and petrochemical capacity will resume and that such investments will in turn drive growth in demand for our products and services.
Energy markets, in particular crude oil refining, simultaneous with the above-described slowdown, are undergoing a more fundamental evolution. We believe that systemic changesBN products and market access provide revenue and growth potential in the energy markets are occurringcommercial space/aerospace markets. The commercial space market has grown and evolved rapidly, and BN has provided rocket engine turbo pump systems and components for many of the launch providers. We expect that such changes are being driven, in part, by the increasing use by consumers of alternative fuels in lieu of fossil fuel. As a result,long term extended space exploration will become more prevalent, and we anticipate demand growththat our thermal/fluid management and environmental control and life support system turbomachinery will play important roles. BN is also participating in future aerospace power and propulsion system development through supply of fluid and thermal management systems components. Small power dense systems are imperative for fossil-based fuelsthese applications and we believe our technology and expertise will be less than the global GDP growth rate. Accordingly, we expect that crude oil refiners will focus new investments toward the installed base, and that inefficient refineries will close and new refining capacity will be co-located where fuels and petrochemicals are produced. We also anticipate that future investment by refinersenable us to achieve sales in renewable fuels (e.g., renewable diesel), in existing refineries (e.g., to expand feedstock processing flexibility and to improve conversion of oil to refined products), to gain greater throughput, or to build new capacity (e.g., integrated refineries with petrochemical products capabilities) will continue to drive demand for our products and services.this market as well.
Demand for our products in the defense industry is related to the naval nuclear propulsion market which is tied to aircraft carrier and submarine vessel construction schedules of the primary shipyards contracted by the U.S. Navy. We expect growth in our naval nuclear propulsion business will result from our strategic actions to increase our market share, our successful performance, and expected demand increases. The economic slowdown caused by the COVID-19 pandemic has not adversely affected demand for our products or services in the naval market.
The chart below shows our strategy to increase our participation in the impact of our successful diversification strategy into multiple U.S. Navy defense platforms. Our U.S. Navymarket. The defense business, which began with our entry into the nuclear carrier program and expanded into both the Virginia and Columbia class nuclear submarine programs, made up 70%market comprised 77% of our total backlog at December 31, 2020. Each vessel platform has made up at least 10% of our total backlog for the past three years.2021. We believe this diversification is especially beneficial when our commercial markets are weak, as is presently the case.
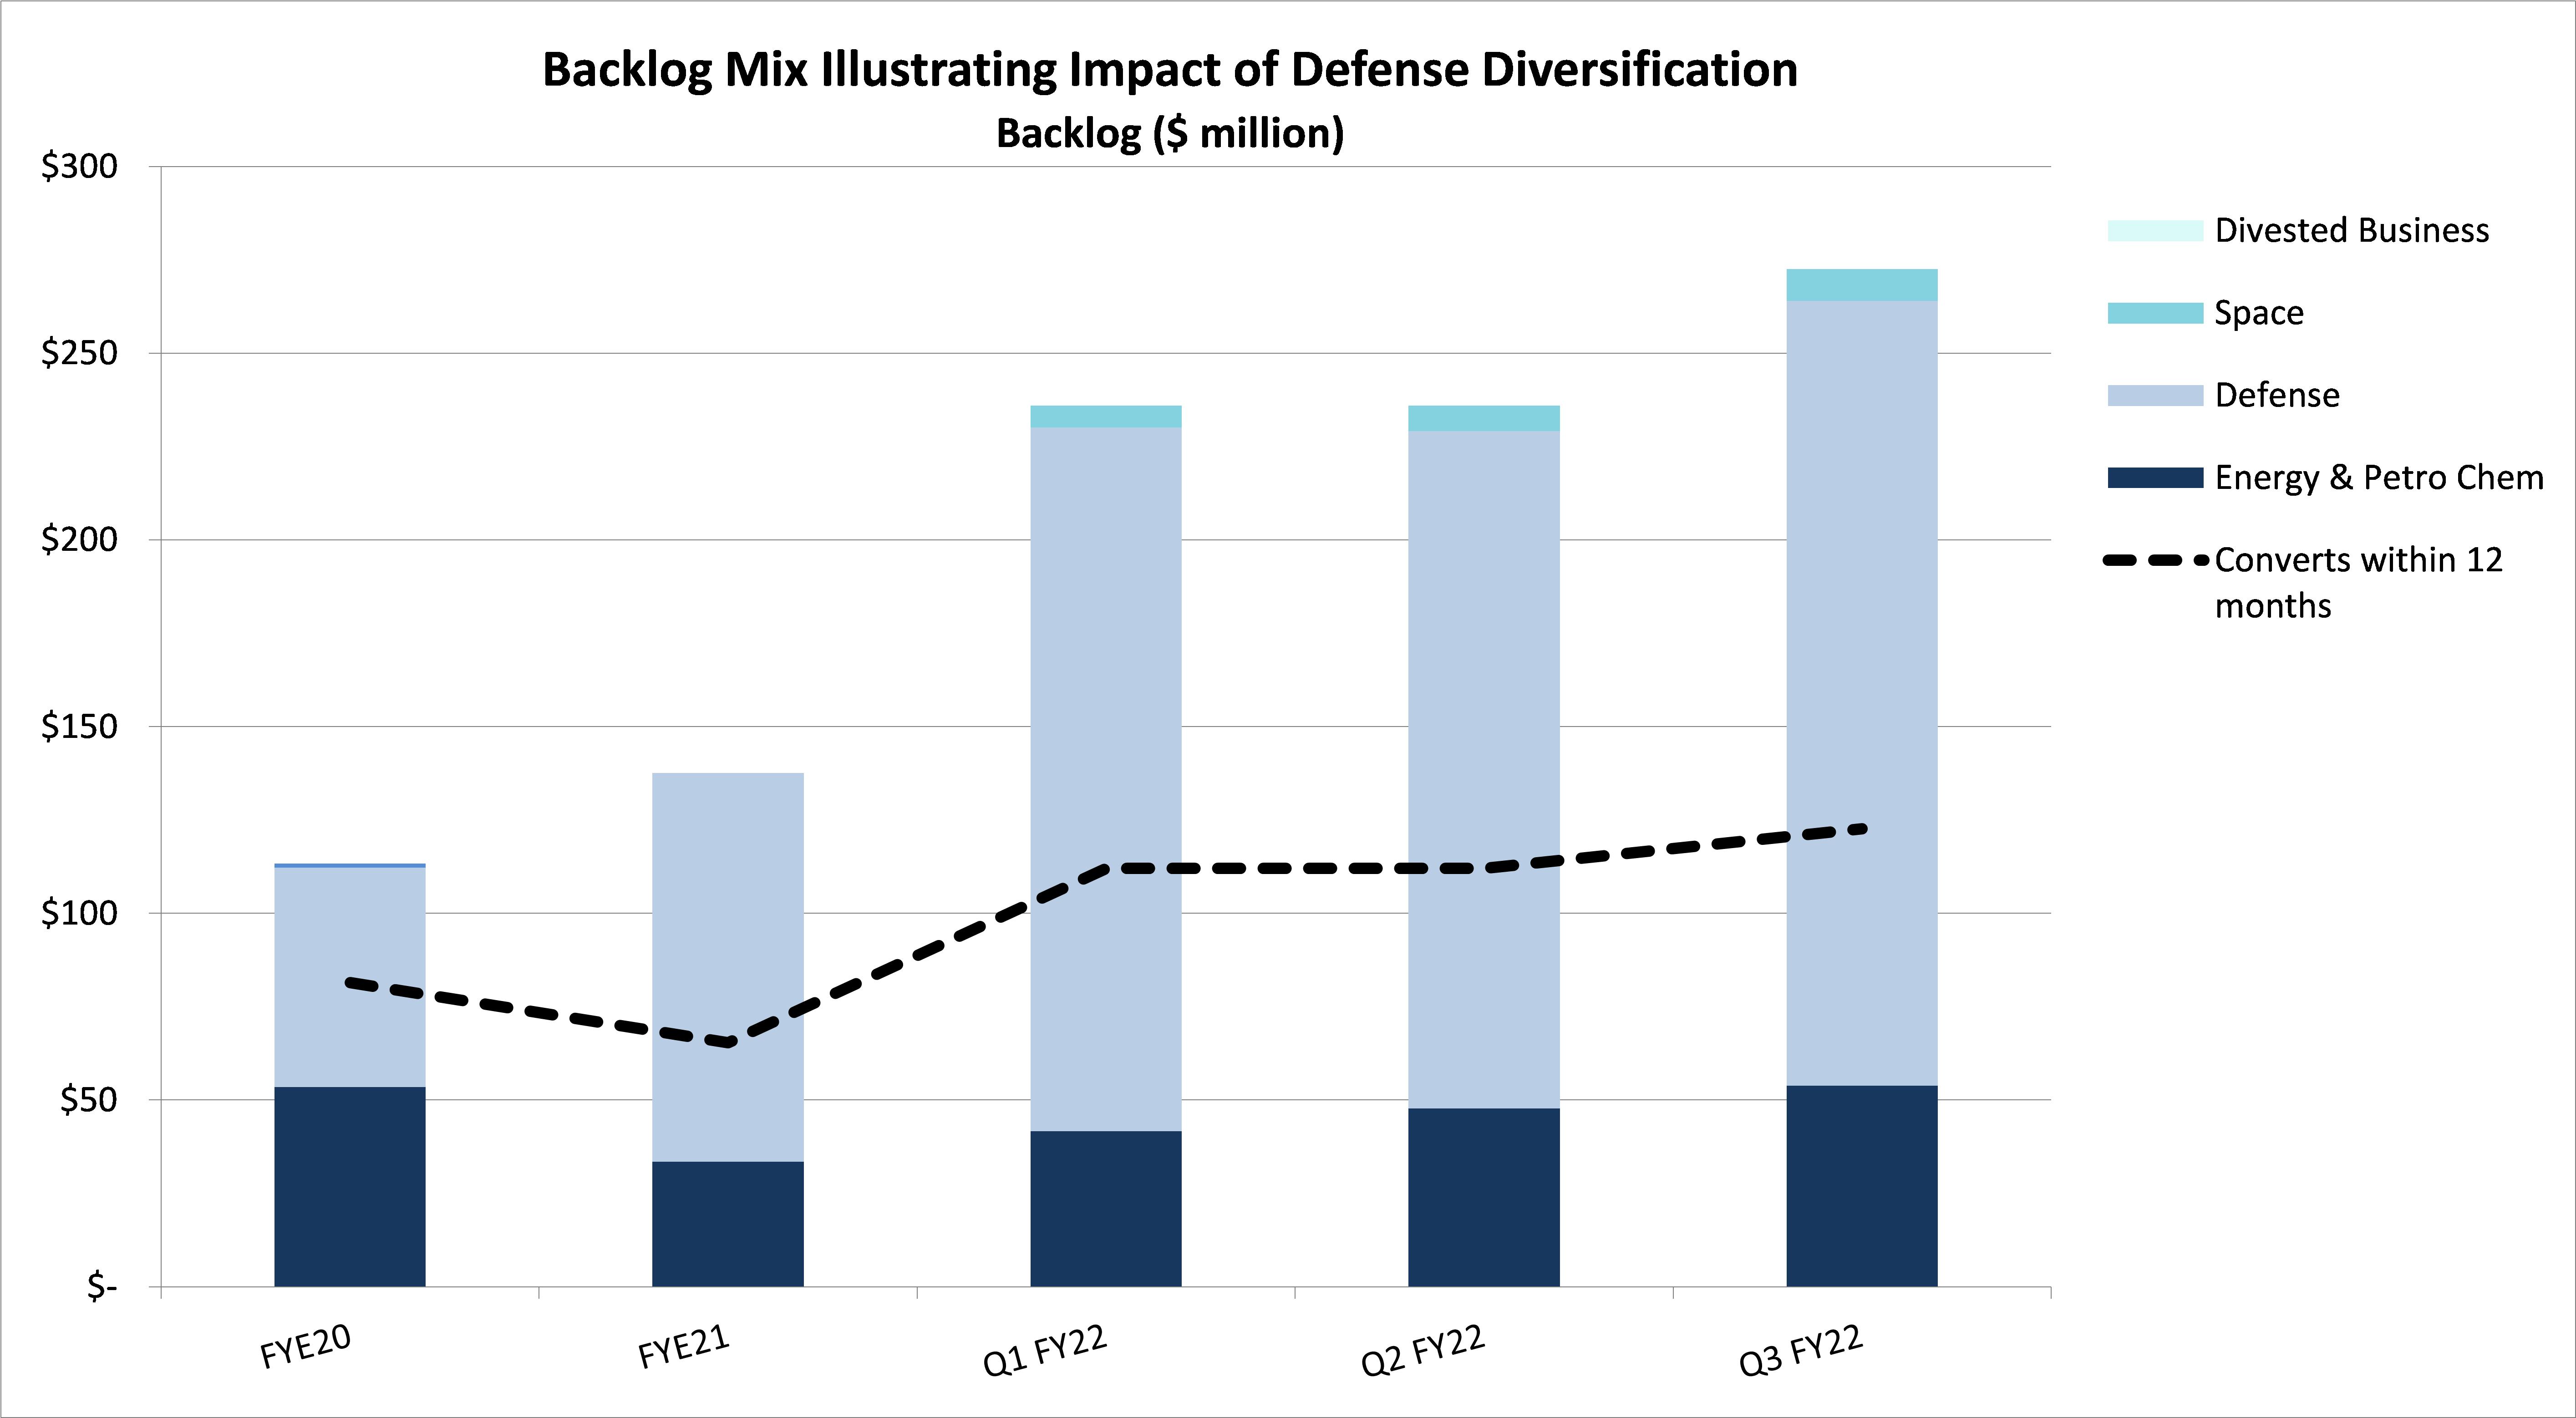

*Note: FYE refers to fiscal year ended March 31
2024
Results of Operations
To better understand the significant factors that influenced our performance during the periods presented, the following discussion should be read in conjunction with our Condensed Consolidated Financial Statements and the notes to our Condensed Consolidated Financial Statements included in Part I, Item 1, of this Quarterly Report on Form 10-Q. Results for the three-month and nine-month periods in 2021 include the results of BN which was acquired on June 1, 2021.
The following table summarizes our results of operations for the periods indicated:
| | | | | | | | | | | | | | | | |
| | Three Months Ended | | | Nine Months Ended | |
| | December 31, | | | December 31, | |
| | 2021 | | | 2020 | | | 2021 | | | 2020 | |
Net sales | | $ | 28,774 | | | $ | 27,154 | | | $ | 83,077 | | | $ | 71,818 | |
Gross profit | | $ | 561 | | | $ | 6,227 | | | $ | 4,918 | | | $ | 15,488 | |
Gross profit margin | | | 2 | % | | | 23 | % | | | 6 | % | | | 22 | % |
SG&A expenses (1) | | $ | 5,003 | | | $ | 4,936 | | | $ | 15,173 | | | $ | 13,091 | |
SG&A as a percent of sales | | | 17 | % | | | 18 | % | | | 18 | % | | | 18 | % |
Net (loss) income | | $ | (3,730 | ) | | $ | 1,060 | | | $ | (7,348 | ) | | $ | 1,986 | |
Diluted (loss) income per share | | $ | (0.35 | ) | | $ | 0.11 | | | $ | (0.70 | ) | | $ | 0.20 | |
Total assets | | $ | 196,080 | | | $ | 144,986 | | | $ | 196,080 | | | $ | 144,986 | |
Total assets excluding cash, cash equivalents and investments | | $ | 182,089 | | | $ | 75,694 | | | $ | 182,089 | | | $ | 75,694 | |
| | Three Months Ended | | | Nine Months Ended | |
| | December 31, | | | December 31, | |
| | 2020 | | | 2019 | | | 2020 | | | 2019 | |
Net sales | | $ | 27,154 | | | $ | 25,286 | | | $ | 71,818 | | | $ | 67,522 | |
Gross profit | | $ | 6,227 | | | $ | 4,044 | | | $ | 15,488 | | | $ | 13,706 | |
Gross profit margin | | | 23 | % | | | 16 | % | | | 22 | % | | | 20 | % |
SG&A expense (1) | | $ | 4,936 | | | $ | 4,441 | | | $ | 13,091 | | | $ | 12,855 | |
SG&A as a percent of sales | | | 18 | % | | | 18 | % | | | 18 | % | | | 19 | % |
Net income | | $ | 1,060 | | | $ | 9 | | | $ | 1,986 | | | $ | 1,296 | |
Diluted income per share | | $ | 0.11 | | | $ | — | | | $ | 0.20 | | | $ | 0.13 | |
Total assets | | $ | 144,986 | | | $ | 146,801 | | | $ | 144,986 | | | $ | 146,801 | |
Total assets excluding cash, cash equivalents and investments | | $ | 75,694 | | | $ | 76,950 | | | $ | 75,694 | | | $ | 76,950 | |
Selling, general and administrative expenses are referred to as "SG&A".
| (1)
| Selling, general and administrative expense is referred to as "SG&A".
|
The Third Quarter and First Nine Months of Fiscal 20212022 Compared With the Third Quarter and First Nine Months of Fiscal 20202021
Sales for the third quarter of fiscal 20212022 were $27,154,$28,774, a 7%6% increase compared with $25,286from sales of $27,154 for the third quarter of fiscal 2020.2021. Sales from the acquisition in the quarter were $11,968. Our domestic sales, as a percentage of aggregate product sales, were 86% in the third quarter of fiscal 2022 compared with 39% in the third quarter of fiscal 2021 compared with 53%2021. Domestic sales increased $14,020 in the third quarter of fiscal 2020. Domestic sales2022, or 131% year-over-year, decreased $2,693, or 20%.reflecting the contribution of the acquisition which helped to offset lower international refining sales. International sales increased $4,561,decreased $12,400, or 38%75%, in the third quarter of fiscal 20212022 compared with the third quarter of fiscal 2020.2021, primarily due to significant China refining sales which occurred in the prior year period. Sales in the three months ended December 31, 20202021 were 60%58% for the defense (U.S. Navy) industry, 14% to the refining industry, 18%11% to the chemical and petrochemical industries, 17% for the defense industry (U.S. Navy),5% to space, and 5%12% to other commercial and industrial applications. Sales in the three months ended December 31, 20192020 were 49%17% for the defense (U.S. Navy) industry, 60% to the refining industry, 24%18% to the chemical and petrochemical industries, 17% for the defense industry (U.S. Navy), and 10%5% to other commercial and industrial applications. Fluctuation in sales among markets, products and geographic locations varies, sometimes significantly, from quarter-to-quarter based on timing quantity, and valuemagnitude of projects. See also "Current Market Conditions," above. For additional information on anticipated future sales and our markets, see "Orders and Backlog" below.
Sales in the third quarter of fiscal 2021 were reduced by approximately $900 due to COVID-19 related employee absences. Gross profit and operating profit were also adversely impacted by approximately $400.
Sales for the first nine months of fiscal 20212022 were $71,818, a 6%$83,077, an increase of $11,259, or 16% compared with $67,522$71,818 for the first nine months of fiscal 2020.2021. Sales from the acquisition in the first nine months of fiscal 2022 were $31,925. Our domestic sales, as a percentage of aggregate product sales, were 52%78% in the first nine months of fiscal 20212022 compared with 65%52% in the same period in fiscal 2020.2021. Domestic sales decreased $6,182,increased $27,426, or 14%73%, while international sales increaseddecreased by $10,478,$16,167, or 44%47%, each as compared with the same prior year period. The reduction in international sales is related to the refining and petrochemical markets. International sales accounted for 48%22% and 35%48% of total sales for the first nine months of fiscal 20212022 and fiscal 2020,2021, respectively. Sales in the nine months ended December 31, 20202021 were 41%52% for the defense industry (U.S. Navy), 18% to the refining industry, 26%13% to the chemical and petrochemical industries, 24% for the defense industry (U.S. Navy),4% to space and 9%13% to other commercial and industrial applications. Sales in the nine months ended December 31, 20192020 were 39%24% for the defense (U.S. Navy) industry, 41% to the refining industry, 35%26% to the chemical and petrochemical industries, 13% for the defense industry (U.S. Navy), and 13%9% to other commercial and industrial applications.
Gross profit margin and operating margin for the third quarter of fiscal 2021 was 23%2022 were 2% and (16%), respectively, compared with 16%23% and 5%, respectively, for the third quarter of fiscal 2020.2021. Gross profit for the third quarter of fiscal 2021 increased 54%2022 decreased compared with fiscal 2020,2021, to $6,227$561 from $4,044.$6,227. The increasedecline in gross profit margin was driventhe result of continued cost and schedule issues related to our defense business at our Batavia operation. We have chosen, in the near term, to over-resource certain critical defense orders to ensure we meet delivery expectations of our customers. We have continued to be challenged by labor shortages in our local market and to meet delivery schedule we increased our use of external contract welders, at a better mixmuch higher cost. Redirecting resources to defense contracts at our Batavia operation has also impacted our commercial market orders which we had to outsource. In addition, we identified the
25
requirement for more production hours and material costs for certain large orders, primarily defense projects, in our Batavia operation. The positive contribution from the BN acquisition in the quarter was not sufficient to offset the combination of projects compared withexecution-related challenges which impacted gross margin in the third quarter of fiscal 2020, which had an abnormally poor gross profit margin. Volume was also higher primarily due to outsourced production for two Asian projects.quarter.
Gross profit margin for the first nine months of fiscal 20212022 was 22%6% compared with 20%22% for the first nine months of fiscal 2020.2021. Gross profit for the first nine months of fiscal 2021 increased 13%2022 compared with the first nine months of fiscal 2020,2021, decreased to $15,488$4,918 from $13,706.$15,488. Gross profit and margin declined due to the same factors which impacted the third quarter as described above. The flow of low margin defense projects and cost overruns for those projects through the Batavia operation was more heavily weighted in the first nine months of fiscal 2021 was adversely impacted by2022 and are expected to be nearing completion in fiscal 2022. The BN acquisition contribution to gross profit helped to offset the underutilization of our
21
losses from the Batavia facility in the first quarterdefense projects and to a lesser extent in the third quarter as a result of the COVID-19 pandemic, however, this was more than offset by improved project mix and increased outsourced volume.other cost overruns.
SG&A expenses as a percent of sales for each ofboth the three and nine-monththree-month periods ended December 31, 2021 and 2020 werewas 17% and 18%., respectively. SG&A expenses in the third quarter of fiscal 20212022 were $4,936,$5,003, an increase of $495$67 compared with SG&A expenses of $4,441 in the third quarter of fiscal 2020.2021 SG&A expenses of $4,936. SG&A expenses included intangible amortization of $274. SG&A expenses in the first nine months of fiscal 20212022 were $13,091,$15,173, an increase of $236$2,082, compared with SG&A expenses of $12,855$13,091 in the first nine months of fiscal 2020. Included in the first nine months of fiscal 2020 was $621 for the divested commercial nuclear utility business.2021. The increase in SG&A in the three and nine month periods ended December 31, 2020 was primarily due to an increase in commissions related to two Asian projects in the third quarter.addition of BN, including $639 of intangible amortization.
Interest income for the threethree-month period and nine-month periods ended December 31, 2020 was2021 were $12 and $43, respectively, compared with $23 and $143, respectively, compared with $318 and $1,080, respectively, for the same periods ended December 31, 2019.2020. The significant decrease in interest income iswas due to market investment rates, which are significantly lower when compared with rates one year ago. less cash and investments after the BN acquisition.
Interest expense for the three and nine-month periods ended December 31, 20202021 was $1$132 and $9,$300, respectively, compared with $2$1 and $9, respectively, for the same periods ended December 31, 2019. 2020. The increase was due to increased borrowings related to the BN acquisition.
Our effective tax rate for the three and nine-month periods ended December 31, 2021 was 19% and 20%, respectively. The effective tax rate for the three and nine-month periods ended December 31, 2020 was 23% and 26%, respectively. The effective tax rate for the three-month period ended December 31, 2019 was not meaningful, since income before taxes
Net loss and net income were near breakeven. The effective tax rate for the nine-month period ended December 31, 2019 was 22%.
Net income and incomeloss per diluted share for the third quarter of fiscal 20212022 were $3,730 and $0.35, respectively, compared with net income and income per diluted share of $1,060 and $0.11, respectively, compared with $9 and $0.00, respectively, in the third quarter of fiscal 2020.2021. Net incomeloss and incomeloss per diluted share for the first nine months of fiscal 20212022 were $1,986$7,348 and $0.20,$0.70, respectively, compared with net income of $1,296$1,986 and income per diluted share of $0.13$0.20 for the first nine months of fiscal 2020. Included in net income and income per diluted share for the first nine months of fiscal 2020 was a loss of $893 and $0.09, respectively, for our commercial nuclear utility business, which was sold in the first quarter of fiscal 2020. 2021.
Liquidity and Capital Resources
The following discussion should be read in conjunction with our Condensed Consolidated Balance Sheets and Statements of Cash Flows:
| | | December 31, | | | March 31, | | | December 31, | | March 31, | |
| | 2020 | | | 2020 | | | 2021 | | | 2021 | |
Cash and investments | | $ | 69,292 | | | $ | 73,003 | | | $ | 13,991 | | | $ | 65,032 | |
Working capital | | | 78,695 | | | | 77,443 | | | | 32,007 | | | | 76,675 | |
Working capital ratio(1) | | | 2.8 | | | | 2.6 | | | | 1.5 | | | | 2.8 | |
Working capital excluding cash and investments | | | 9,403 | | | | 4,440 | | | | 18,016 | | | | 11,643 | |
Working capital excluding cash and investments as a percent of net sales(2) | | | 9.9 | % | | | 4.9 | % | | | 13.5 | % | | | 11.9 | % |
| (1)
| Working capital ratio equals current assets divided by current liabilities.
|
(1)Working capital ratio equals current assets divided by current liabilities.
| (2)
| (2) Working capital excluding cash and investments as a percent of net sales is based upon trailing twelve month sales. |
Net cash provided by operating activities for the first nine months of fiscal 2021 was $670, compared with cash usage of $4,119 for the first nine months of fiscal 2020. The greater cash flow year over year was attributable primarily to a decrease in unbilled revenue and an increase in accounts payable partly offset by a decrease in customer deposits and an increase in accounts receivable. The increase in working capital excluding cash and investments as a percent of net sales is based upon trailing twelve month sales, including BN pre-acquisition sales.
Net cash used by operating activities for the first nine months of fiscal 2022 was $14,552 compared with $670 of cash generated for the first nine months of fiscal 2021. The increase in cash used was primarily due to timing of working capital.operating earnings and changes in accounts receivable, income taxes and accounts payable, partly offset by a decrease in unbilled revenue and increased customer deposits.
Capital expenditures were $1,909 for the nine-month period and are expected to be approximately $2,500 to $3,000 for fiscal 2022. Dividend payments and capital expenditures in the first nine months of fiscal 20212022 were $3,292 and $1,462, respectively,$3,524 compared with $3,163 and $1,389, respectively, for$3,292 in the first nine monthssame period of fiscal 2020. 2021.
Capital expenditures for fiscal 2021 are expected to be between approximately $2,000 and $2,500.
26
Cash and investments were $69,292 on$13,991 at December 31, 20202021 compared with $73,003$16,463 on September 30, 2021, down $2,472, and down from $65,032, on March 31, 2020, down $3,711, primarily due to timing of working capital.2021.
We invest net cash generated from operations in excess of cash held for near-term needs in short-term, or less than 365 days, certificates of deposit, money market accounts or U.S. government instruments, generally with maturity periods of up to 180 days.
22
Our money market account is used to securitize our outstanding letters of credit, which reduces our cost on those letters of credit. Approximately 90%70% of our cash and investments are held in the U.S. The remaining 30% is invested inheld by our AsianChina and India operations.
OurOn June 1, 2021, we entered into a $20,000 five-year term loan with Bank of America. The term loan requires monthly principal payments of $167 through June 1, 2026, with the remaining principal amount plus all interest due on the maturity date. The interest rate on the term loan is the applicable Bloomberg Short-Term Bank Yield Index ("BSBY"), plus 1.50%, subject to a 0.00% floor. The BSBY rate at December 31, 2021 was 0.0558%. In addition, on June 1, 2021, we terminated our revolving credit facility agreement with JPMorgan Chase Bank, N.A. and entered into a revolving credit facility with JP Morgan Chase, N.A. ("JP Morgan Chase")Bank of America that provides us with a $30,000 line of credit, of $15,000 and an additional $7,000 which can be used forincluding letters of credit and bank guarantees.guarantees, expandable at our option and the bank’s approval at any time up to $40,000. The agreement has a five-year term. Amounts outstanding under the facility agreement bear interest at a rate equal to BSBY plus 1.50% per annum of the outstanding undrawn amount of each letter of credit that is not secured by cash and 0.6% of each commercial letter of credit that is secured by cash, subject to a 0.00% floor. Outstanding letters of credit under the agreement are subject to a fee of 1.50%. The upfront fee for both the term loan and revolving credit facility was 0.20% of the committed facilities and amounts available for borrowing under the revolving credit facility are subject to an unused commitment fee of 0.25%. Under the term loan agreement and revolving credit facility, we covenant to maintain a maximum total leverage ratio, as defined in such agreements, of 3.0 to 1.0, which may be increased to 3.25 to 1.0 following an acquisition for a period of twelve months following the close of the acquisition. In addition, we covenant to maintain a minimum fixed charge coverage ratio, as defined in such agreements, of 1.2 to 1.0 and minimum margined assets, as defined in such agreements, of 100% of total amounts outstanding on the revolving credit facility, including letters of credit.
We determined that as of December 31, 2021, we did not meet the financial covenants required by our JP Morgan Chaseloan agreement allows us to increasemaintain a maximum total leverage ratio of 3.25 to 1.0, nor did we maintain a minimum fixed charge coverage ratio of 1.2 to 1.0. On February 4, 2022, we obtained a waiver from Bank of America waiving their right to call the debt immediately due and payable as of December 31, 2021. As a term of receiving the waiver, until such time as Bank of America has received all required financial information with respect to the Company for the period ending on or about March 31, 2022, and such financial information confirms to the Bank of America's satisfaction that no default exists at such time, The Company will not permit the principal balance outstanding under the line of credit by another $15,000, upwith Bank of America to exceed $15,000. Absent a waiver or amendment of the loan agreement, we anticipate that we will not meet these covenants as of March 31, 2022, which would be an aggregateevent of $37,000. Borrowingsdefault. Violation of the covenants under thisthe loan agreement provides the bank with the option to accelerate the maturity of the term loan, which carries a balance of $19,000 as of December 31, 2021 and the revolving credit facility, are secured by allwhich has a principal balance outstanding of $9,750 as of December 31, 2021. If our assets. Welenders accelerate the maturity of the term loan and the revolving credit facility, we do not have sufficient cash to repay the outstanding debt. These conditions and events raise substantial doubt about our ability to continue as a $15,000going concern within one year after the date that the financial statements were issued.
In response to these conditions, we have begun to actively engage in negotiations with the bank regarding amendments to our term loan and our revolving credit facility and related financial covenants. However, this plan has not been finalized and is not within our control, and therefore cannot be deemed probable. As a result, we have concluded that our plans do not alleviate substantial doubt about our ability to continue as a going concern. The condensed consolidated financial statements do not include any adjustments relating to the recoverability and classification of recorded asset amounts and classification of liabilities that might result from the outcome of this uncertainty.
On June, 1, 2021, we entered into an agreement to amend and restate our letter of credit facility agreement with HSBC Bank USA, N.A. ("HSBC") secured by certainand decreased our line of our deposit accounts with HSBC. credit from $15,000 to $7,500. Under the amended agreement, we incur an annual facility fee of $5 and outstanding letters of credit are subject to a fee of between 0.75% and 0.85%, depending on the term of the letter of credit. Interest is payable on the principal amounts of unreimbursed letter of credit draws under the facility at a rate of 3% plus the bank’s prime rate.
Letters of credit outstanding on December 31, 20202021 and March 31, 20202021 were $17,100$8,399 and $13,328,$11,567, respectively. The outstanding letters of credit as of December 31, 20202021 were issued by Bank of America, HSBC and residual items from our prior agreement with JP Morgan Chase and HSBC.Morgan. There were no other amountswas $9,750 outstanding on our Bank of America revolving credit facilities at December 31, 20202021. Availability under the Bank of America line of credit and March 31, 2020. The borrowing rate under our JP Morgan Chase facility asHSBC secured line of credit on December 31, 20202021 was the bank’s prime rate, or 3.25%. Availability for borrowings and letters of credit was $15,000 and $4,900, respectively, under the JP Morgan Chase and HSBC facilities at December 31, 2020. At March 31, 2020 availability was $21,672 under our previous facilities.$19,608. We believe that cash generated from operations, combined with our investments and available financing capacity under our credit facility, will be adequate both to meet our cash needs for the immediate future and to support our growth strategies.
Dividend payments in the first nine months of fiscal 2022 were $3,524 and $1,909, respectively, compared with $3,292 and $1,462, respectively, for the first nine months of fiscal 2021. Graham has suspended its dividend as a condition to the waiver of financial covenants and is working with the bank to amend its loan agreement in the fourth quarter.
Orders and Backlog
27
Management uses orders and backlog as measures of our current and future business and financial performance. Orders for the three-month period ended December 31, 20202021 were $61,753,$67,964, an increase of $6,211, or 10%, and were driven by the acquisition which contributed $37,251 of orders in the quarter. This compared with $20,057$61,753 for the same period last year.of fiscal 2021. Orders represent written communications received from customers requesting us to supply products and/or services. Domestic orders were 94%89% of total orders, or $58,110,$60,655, and international orders were 6%11% of total orders, or $3,643,$7,309, in the third quarter of fiscal 20212022 compared with the third quarter of fiscal 20202021 when domestic orders were 77%94%, or $15,478,$58,110, of total orders, and international orders were 23%6%, or $4,579,$3,643, of total orders.
During the first nine months of fiscal 2021,2022, orders were $108,195,grew 11%, or $12,022, to $120,217, compared with $67,698$108,195 for the same period of fiscal 2020.2021. The acquisition was the primary driver of the growth and contributed $53,301 in orders for the nine-month period. Domestic orders were 72%84% of total orders, or $77,459,$101,022, and international orders were 28%16% of total orders, or $30,736,$19,195, in the first nine months of fiscal 20212022 compared with the same period of fiscal 20202021 when domestic orders were 55%72%, or $37,395,$77,459, of total orders, and international orders were 45%28%, or $30,303,$30,736, of total orders.
Backlog was a record $149,736$272,599 at December 31, 2020,2021, up 17% compared with $114,851 on$233,247 at September 30, 2020,2021 and $112,389nearly double from $137,567 at March 31, 2020.2021. Included in backlog at December 31, 2021 was $119,096 from BN. Backlog is defined as the total dollar value of orders received for which revenue has not yet been recognized. The $37,347 increase in backlog from March 31, 2020 to December 31, 2020 was attributable to an increase in our backlog for defense of $46,376 which was partially offset by an $9,029 decline in backlog from our commercial markets. Approximately 45%40% to 50% of orders currently in our backlog are expected to be converted to sales within one year. The majority of the backlogorders that isare expected to convert beyond twelve months isare for the defense industry, specifically the U.S. Navy. At December 31, 2020, 20%2021, 77% of our backlog was attributable to equipmentU.S. Navy projects, 11% for refinery project work, 7%5% for chemical and petrochemical projects, 70%3% for defense (U.S. Navy)space projects and 3%4% for other commercial and industrial applications. At December 31, 2019, 30%September 30, 2021, 78% of our backlog was attributable to equipmentU.S. Navy projects, 11% was for refinery project work, 13%4% for chemical and petrochemical projects, 52%3% for defense (U.S. Navy)space projects and 5%4% for power and other industrial applications. We had one project of $654 cancelled in the first nine months of fiscal 2021. At December 31, 2020,2021, we had twono projects totaling $562 on hold.
Outlook
Outlook
Capital spendingOur defense business continues to be strong. With the acquisition of BN, 77% of our $272,599 backlog is in defense. While much of the commercial marketsdefense backlog includes projects with order to shipment of up to five years, we serve beganexpect 45% to decrease during the second half50% of our sales in fiscal 2020 and the pace of activity further materially contracted as COVID-19 became a global pandemic in the fourth quarter of fiscal 2020. Our weak commercial markets have continued into fiscal 2021 and are particularly evident in North America. As a result, our overall bidding activity has slowed. There has also been a shift toward more opportunities in emerging markets. Our strong order level2022 to be from the defense industry (U.S. Navy) during the current fiscal year has increased our backlog for defense projects to $105,219 on December 31, 2020 from $58,843 on March 31, 2020. At December 31, 2020, 70% of our backlog was for the defense industry,market. Defense spending, specifically the U.S. Navy. Our pipeline for the U.S. Navy, continuesis expected to be robust, but quarterly fluctuations in order levels will occur due toremain steady over the size and timing of release of the U.S. Navy projects. Defense programs in backlog are planned to deliver $20,000 to $30,000 per year of revenue in fiscal 2021 and beyond.foreseeable future.
Near term opportunities in the global energy and petrochemical markets have slowed significantly due to the combined impact of the COVID-19 pandemic and the geopolitical imbalance of supply as previously discussed. Although we do not knowand demand imbalance. However, the recent improvements in our aftermarket and short cycle business in North America is encouraging. We believe when the COVID-19 pandemic will end or when the supply imbalance will subside, we continue to believe theour energy markets do recover, it will improve. In addition,be more muted and not to historical levels of strength. Strategically, we believe the petrochemical markets provide long-term growthare implementing efforts to capture more aftermarket opportunity less oriented to capital projects.
Our objective is to leverage our engineering knowhow and depth of application experience to identify more opportunities for our products and services. Coupled with our diversification strategy into the defense industry, we remain confidenttechnologies in our ability to achievetargeted markets.
All of the long-term goalbelow expectations are inclusive of significantly growing our business. We have invested in capacity to serve our customers in our commercial markets as well as to
23
expand the work we doBN for the U.S. Navy. We intend to continue to look for organic growth opportunities as well as acquisitions or other business coten-month period we will own it during fiscal 2022.mbinations that we believe will allow us to expand our presence in both our existing and ancillary markets.
Our expectations for sales and profitability in fiscal 2021 assume that we are able to operate our production facilityfacilities in Batavia, New York and Arvada, Colorado at or near normal"normal" (pre-COVID-19 pandemic) capacity for the last quarter ofthroughout fiscal 2021 without any significant COVID-19 related reductions in production capacity. In our first quarter of fiscal 2021, our production capability was significantly reduced, by approximately 50%, due to the COVID-19 pandemic. Our production capacity returned to an expected level in the second quarter of fiscal 2021, however, we did have numerous COVID-19 related employee absences in the latter part of the third quarter. Our outlook for sales and profitability for the remainder of fiscal 2021 is based upon the assumption that we are able to operate our production facility, and have access to the global supply chain, including our subcontractors, with minimal or no disruptions, whether as a result of the COVID-19 pandemic or any other circumstances.
2022. We project that approximately 45%40% to 50% of our $149,736 backlog at December 31, 2020 will convert to sales over the next twelve12 months. We expect the remaining backlog will convert beyond twelve months,fiscal 2022, which includes a combination of U.S. Navy orders that have a long conversion cycle (up to fivesix years) as well as certain commercial orders, the conversion of which has been extended by our customers.
Revenue in fiscal 2022 is expected to be $120,000 to $125,000, inclusive of $45,000 to $48,000 related to BN for the ten-month period we will own the business in fiscal 2022. We had one projectexpect to have approximately $2,700 of $654 cancelledacquisition related purchase price accounting costs to be recognized in fiscal 2022, which primarily will be amortization of intangible assets. Approximately $1,600 are expected to be charged to cost of goods sold and the remaining $1,100 to SG&A. Inclusive of the purchase accounting costs, we expect gross profit margins to be 8% to 10% of sales and SG&A to be 16% to 17% of sales. Our expected effective tax rate for fiscal 2022 is 18% to 20%. Adjusted earnings before net interest expense, income taxes, depreciation and amortization for the combined business is expected to be a loss of approximately $5,0001.
Although cash flow was negative in the first three quarters of fiscal 2022, we expect positive cash flow from operations for the remaining three months of fiscal 2022. While we paid a dividend in the first nine months of fiscal 2021. At December 31, 2020, we had two projects totaling $562 on hold by our customers. In addition,2022, we have three projects whichsuspended the dividend.
28
1 We have been delayed by our customers due to COVID-19not reconciled non-GAAP forward-looking adjusted earnings before net interest expense, income taxes, depreciation and disruptions in our commercial markets, and we therefore expect revenue of $4,118 to be delayed beyond fiscal 2021. None of these amounts changed during the third quarter of fiscal 2021.
We expect fiscal year 2021 revenue to be between $93,000 and $97,000, gross profit margin to be in the 21% to 22% range and SG&A expenses to be between $17,250 and $17,750. We expect interest income to be de minimis, given the low market rates on short term cash and investments. Our effective tax rate during fiscal 2021 is expected to be between 22% to 24%. This outlook incorporates the very challenged first quarter which we experienced as a result of the COVID-19 pandemic, assumes that we are able to continue to operate near normal capacityamortization for the last three monthscombined business to its most directly comparable GAAP measure, as permitted by Item 10(e)(1)(i)(B) of fiscal 2021,Regulation S-K. Such reconciliation would require unreasonable efforts to estimate and quantify various necessary GAAP components largely because forecasting or predicting our future operating results is subject to the same assumptions described above.many factors out of our control or not readily predictable.
Our cash position decreased in the first nine months of fiscal 2021. However, we expect an improvement in cash in the fourth quarter of fiscal 2021.
29
Contingencies and Commitments
We have been named as a defendant in lawsuits alleging personal injury from exposure to asbestos allegedly contained in or accompanying our products. We are a co-defendant with numerous other defendants in these lawsuits and intend to vigorously defend ourselves against these claims. The claims in our current lawsuits are similar to those made in previous asbestos lawsuits that named us as a defendant. Such previous lawsuits either were dismissed when it was shown that we had not supplied products to the plaintiffs’ places of work, or were settled by us for immaterial amounts.
As of December 31, 2020,2021, we are subject to the claims noted above, as well as other legal proceedings and potential claims that have arisen in the ordinary course of business. Although the outcome of the lawsuits, legal proceedings or potential claims to which we are or may become a party cannot be determined and an estimate of the reasonably possible loss or range of loss cannot be made for the majority of the claims, we do not believe that the outcomes, either individually or in the aggregate, will have a material adverse effect on our results of operations, financial position or cash flows.
Critical Accounting Policies, Estimates, and Judgments
Our unaudited condensed consolidated financial statements are based on the selection of accounting policies and the application of significant accounting estimates, some of which require management to make significant assumptions. We believe that the most critical accounting estimates used in the preparation of our condensed consolidated financial statements relate to labor hour and total cost estimates and establishment of operational milestones which are used to recognize revenue under the overtime recognition model, accounting for contingencies, under which we accrue a loss when it is probable that a liability has been incurred and the amount can be reasonably estimated, and accounting for pensions and other postretirement benefits. For further information, refer to Item 7 "Management's Discussion and Analysis of Financial Condition and Results of Operations" and Item 8 "Financial Statements and Supplementary Data" included in our Annual Report on Form 10-K for the year ended March 31, 2020. 2021.
Off Balance Sheet ArrangementsIn addition to the critical accounting policies noted above, the Company has one additional critical accounting policy as follows:
We didBusiness Combinations and Intangible Assets. Assets and liabilities acquired in a business combination are recorded at their estimated fair values at the acquisition date. The fair value of identifiable intangible assets is based upon detailed valuations that use various assumptions made by management. Goodwill is recorded when the purchase price exceeds the estimated fair value of the net identifiable tangible and intangible assets acquired. Definite lived intangible assets are amortized over their estimated useful lives and are assessed for impairment if certain indicators are present. Goodwill and intangible assets deemed to have indefinite lives are not amortized but are subject to impairment testing annually or earlier if an event or change in circumstances indicates that the fair value of a reporting unit may have any off balance sheet arrangements as of December 31, 2020 or March 31, 2020, other than letters of credit.been reduced below its carrying value.
Item 3. Quantitative and Qualitative Disclosures About Market Risk
The principal market risks (i.e., the risk of loss arising from market changes) to which we are exposed are foreign currency exchange rates, price risk, project cancellation risk and trade policy.
The assumptions applied in preparing the following qualitative and quantitative disclosures regarding foreign currency exchange rate, price risk and project cancellation risk are based upon volatility ranges experienced by us in relevant historical periods, our current knowledge of the marketplace, and our judgment of the probability of future volatility based upon the historical trends and economic conditions of the markets in which we operate.
Foreign Currency
International consolidated sales for the threethird quarter and first nine months ended December 31, 2020of fiscal 2022 were 61%14% and 48%, respectively,22% of total sales, respectively, compared with 47%61% and 35%, respectively,48% for the same periods of fiscal 2020.2021, respectively. Operating in markets throughout the world exposes us to movements in currency exchange rates. Currency movements can affect sales in several ways, the foremost being our ability to compete for orders against foreign competitors that base their prices on relatively weaker currencies. Business lost due to competition for orders against competitors using a relatively weaker currency cannot be quantified. In addition, cash can be adversely impacted by the conversion of sales made by us in a foreign currency to U.S. dollars. In each of the first three and nine months of fiscal 20212022 and fiscal 2020,2021, all sales by us and our wholly-owned subsidiaries, for which we were paid, were denominated in the local currency of the respective subsidiarybusiness (U.S. dollars, Chinese RMB or Chinese RMB)India INR).
We have limited exposure to foreign currency purchases. In each of the first nine months of fiscal 2022 and fiscal 2021, our purchases in foreign currencies represented approximately 1% and 0% of the cost of products sold, respectively. In the three and nine months ended December 31, 2021 and 2020, our purchases in foreign currencies represented 0% and 1% of cost of products sold, respectively. In the three and nine months ended December 31, 2019, our purchases in foreign currencies represented 0% and 1% of cost of products sold, respectively.. At certain times, we may enter into forward foreign currency exchange agreements to hedge our exposure against potential unfavorable changes in foreign currency values on
30
significant sales and purchase contracts negotiated in foreign currencies. Forward foreign currency exchange contracts were not used in the periods being reported on in this Quarterly Report on Form 10-Q and as of December 31, 20202021 and March 31, 2020,2021, we held no forward foreign currency contracts.
Price Risk
Operating in a global marketplace requires us to compete with other global manufacturers which, in some instances, benefit from lower production costs and more favorable economic conditions. Although we believe that our customers differentiate our products on the basis of our manufacturing quality, responsive and flexible service, and engineering experience and excellence, among other things, such lower production costs and more favorable economic conditions mean that certain of our competitors are able to offer products similar to ours at lower prices. The cost of metals and other materials used in our products can also experience significant volatility, and as such, can impact our ability to reflect this volatility in our pricing.
Project Cancellation and Project Continuation Risk
Open orders are reviewed continuously through communications with customers. If it becomes evident to us that a project is delayed well beyond its original shipment date, management will move the project into "placed on hold" (i.e. suspended) category. Furthermore, if a project is cancelled by our customer, it is removed from our backlog. We attempt to mitigate the risk of cancellation by structuring contracts with our customers to maximize the likelihood that progress payments made to us for individual projects cover the costs we have incurred. As a result, we do not believe we have a significant cash exposure to projects which may be cancelled. At December 31, 2020,2021, we had twono projects totaling $562 on hold by our customers. hold.
Item 4.Controls Controls and Procedures
Conclusion regarding the effectiveness of disclosure controls and procedures
Our President and Chief Executive Officer (principal(our principal executive officer) and Vice President-FinancePresident - Finance & Administration and Chief Financial Officer (principal(our principal financial officer) each have evaluated the effectiveness of our disclosure controls and procedures (as defined in Exchange Act Rules 13a-15(e) and 15d-15(e)) as of the end of the period covered by this Quarterly Report on Form 10-Q. Based on such evaluation, and as of such date, our President and Chief Executive Officer and Vice President-FinancePresident - Finance & Administration and Chief Financial Officer concluded that our disclosure controls and procedures were effective in all material respects.
Changes in internal control over financial reporting
ThereOther than the events discussed under the section entitled Barber-Nichols Acquisition below, there has been no change to our internal control over financial reporting during the quarter covered by this Quarterly Report on Form 10-Q that has materially affected, or that is reasonably likely to materially affect, our internal control over financial reporting. We have not experienced any material impact to our internal controls over financial reporting despitereporting.
Barber-Nichols Acquisition
On June 1, 2021, we acquired Barber-Nichols, LLC, a privately-owned designer and manufacturer of turbomachinery products for the factaerospace, cryogenic, defense and energy markets, located in Arvada, Colorado. For additional information regarding the acquisition, refer to Note 2 to the Condensed Consolidated Financial Statements included in Item 1 in this Quarterly Report on Form 10-Q and Management’s Discussion and Analysis of Financial Condition and Results of Operations included in Item 2 in this Quarterly Report on Form 10-Q. Based on the recent completion of this acquisition and, pursuant to the Securities and Exchange Commission’s guidance that mostan assessment of a recently acquired business may be omitted from the scope of an assessment for a period not to exceed one year form the date of acquisition, the scope of our administrative, non-production line employees were working remotelyassessment of the effectiveness of internal control over financial reporting as of the end of the period covered by this report does not include Barber-Nichols, LLC.
We are in the process of implementing our internal control structure over the Barber-Nichols, LLC acquisition and we expect that this effort will be completed during the majority of the first quarter due to the COVID-19 pandemic. We are continually monitoring and assessing the COVID-19 pandemic situation on our internal controls to minimize the impact on their design and operating effectiveness.fiscal year ending March 31, 2023.
31
GRAHAM CORPORATION AND SUBSIDIARIES
FORM 10-Q
DECEMBER 31, 2020
PART II - OTHER INFORMATION
Item 1A. Risk Factors
Item 1A.
| Risk Factors
|
Except as stated below, there have been no material changes from the risk factors previously disclosed in Part I1 – Item 1A of the Company’s Form 10-K for the fiscal year ended March 31, 2020.2021.
Our business, financial condition
We may be unsuccessful in amending our loan agreement for out term loan and resultsrevolving credit facility prior to March 31, 2022. The failure to amend the loan agreement, or otherwise to obtain a waiver, may lead to an event of operations have beendefault under our term loan and may continue to be adversely affected by global public health pandemics, including the ongoing COVID-19 pandemic.
Our business, financial condition and results of operations have been and may continue to be adversely affected if the COVID-19 pandemic, or another global health crisis, impacts our employees, suppliers, customers, financing sources or others’ ability to conduct business or negatively affects consumer and business confidence or the global economy. The COVID-19 pandemic has affected large segments of the global economy, including the markets we operate in, since the fourth quarter of fiscal 2020. In response to the COVID-19 pandemic, beginning in late March 2020, we reduced staffing at ourrevolving credit facility, in Batavia, New York. We began the first quarter of fiscal 2021 at 10% of normal staffing capacity and gradually increased to normal capacity by early June 2020, though we did have numerous COVID-19 related employee absences in the latter part of the third quarter. We have applied numerous new health and safety protocols for those working on site.
The pandemic and any additional preventative or protective actions that governments or we may take in response to the COVID-19 pandemic maywhich would have a material adverse effect on our business orfinancial condition and which gives rise to substantial doubt about our suppliers, distribution channels, and customers, including business shutdowns or disruptions for an indefinite period of time, reduced operations, restrictions on shipping, fabricating or installing products, reduced consumer demand or customers’ ability to make payments. We have and may continue to experience additional operating costs due to increased challenges with our workforce (including as a resultgoing concern.
As of illness, absenteeismDecember 31, 2021, we did not meet the financial covenants required by our loan agreement with Bank of America. On February 4, 2022, management obtained a waiver from Bank of America waiving its right to call the debt immediately due and payable as of December 31, 2021. In addition, the waiver provides that, until such time as Bank of America has received all required financial information with respect to the Company for the period ending on or government orders), implementing further precautionary measuresabout March 31, 2022, and such financial information confirms to protectBank of America's satisfaction that no default exists at such time, we will not permit the healthprincipal balance outstanding under the line of credit with Bank of America to exceed $15,000. Further, we have suspended our dividend in connection with the non-compliance of the lending covenants. We anticipate that we will not be in compliance with the covenants as of March 31, 2022, which would be an event of default. Violation of our workforce, increased project cancellationscovenants under the loan agreement provides the bank with the option to accelerate the maturity of the term loan extended under the loan agreement, which carried a balance of $19,000 as of December 31, 2021, and our revolving credit facility under the loan agreement, which had a principal balance outstanding of $9,750 as of December 31, 2021. We do not expect to have adequate cash on hand or projects putavailable liquidity to repay the outstanding debt if the bank requires immediate repayment.
Management's primary mitigation plan to avoid a default under the term loan and revolving credit facility is to amend the loan agreement to amend the financial covenants. However, this plan has not been finalized and is not within the Company's control, and therefore there can be no assurances that we will be able to amend the loan agreement in a timely manner, or on hold, and accessacceptable terms, if at all. The failure to supplies, capital, and fundamental support services (such as shipping and transportation). Duringamend the first quarter of fiscal 2021 we had two projects on hold, one project cancelled, and three projects delayed by our customers due to the COVID-19 pandemic and related energy market dynamics. Any resulting financial impactloan agreement, or otherwise obtain an additional waiver from the pandemic cannot be fully estimated at this time, but may materiallybank or repay the debt, could lead to an event of default which would have a material adverse effect on our financial condition and which gives rise to substantial doubt about our ability to continue as a going concern.
Potential government imposed COVID-19 vaccine mandates could adversely affect our business, financial condition or results of operations. The extentability to which the COVID-19 pandemic affects our results will depend on future developments, which are highly uncertainattract and cannot be predicted, including new information which may emerge concerning the severity of COVID-19 and the actions to contain the pandemic or treat its impact, among others.
The impact of the COVID-19 pandemic may also exacerbate other risks discussed in Item 1A - Risk Factors of our Form 10-K for the fiscal year ended March 31, 2020, any ofretain employees which could have a material adverse impact on our business and results of operations.
As required by executive order, employers with covered U.S. government contracts may be required to ensure that their U.S. based employees, contractors and subcontractors, that work on or in support of the U.S. government contracts, are fully vaccinated against COVID-19. The executive order includes on-site and remote U.S. based employees, contractors and subcontractors and provides for limited medical and religious exceptions. While the enforceability of the order is not known with certainty, if enforceable, this is expected to apply to federal contractors and subcontractors, such as the Company. Any requirement to mandate COVID-19 vaccination of our workforce could result in employee attrition and difficulty securing future labor needs, and may have an adverse effect on us. The situation surroundingour future revenues, costs, and results of operations.
If we fail to successfully integrate the COVID-19 pandemicoperations of Barber-Nichols, LLC, our financial condition and its impactresults of operations could be adversely affected.
On June 1, 2021, we acquired Barber-Nichols, LLC, which provides products to the aerospace, cryogenic and defense and energy markets. We cannot provide any assurances that we will be able to integrate the operations of Barber-Nichols, LLC without encountering difficulties, including unanticipated costs, difficulty in retaining customers and supplier or other relationships, failure to retain key employees, diversion of management’s attention, failure to integrate our information and accounting systems or establish and maintain proper internal control over financial reporting, any of which would harm our business and results of operations.
Furthermore, we may not realize the revenue and net income that we expect to achieve or that would justify our investment in Barber-Nichols, LLC, and we may incur costs in excess of what we anticipate. To effectively manage our expected future growth, we must continue to change rapidlysuccessfully manage our integration of Barber-Nichols, LLC and additional impacts thatcontinue to improve our operational systems, internal procedures, accounts receivable and management, financial and operational controls. If we fail in any of these areas, our business and results of operations could be harmed.
Our acquisition of Barber-Nichols, LLC might subject us to unknown and unforeseen liabilities.
32
Barber-Nichols, LLC may have unknown and unforeseen liabilities, including, but not limited to, product liability, workers’ compensation liability, tax liability and liability for improper business practices. Although we are presently unawareentitled to indemnification from the seller of may arise.Barber-Nichols, LLC for these and other matters, we could experience difficulty enforcing those obligations or we could incur material liabilities for the past activities of Barber-Nichols, LLC. Such liabilities and related legal or other costs could harm our business or results of operations.
On February 4, 2022, the Company, BN, GHM Acquisition Corp., and Graham Acquisition I, LLC, entered into the Amendment to Loan Agreement and Waiver (the "Amendment and Waiver") with Bank of America, N.A. The Amendment and Waiver provides a limited waiver of certain defaults and events of default under the Loan Agreement, dated as of June 1, 2021, as amended (the "Loan Agreement"), that have occurred and are continuing as a result of the Company’s failure to comply with the covenants with respect to the funded debt to EBITDA ratio and the basic fixed charge coverage ratio for the period ended December 31, 2021.
The Amendment and Waiver also provides that, until such time as Bank of America has received all required financial information with respect to the Company for the period ending on or about March 31, 2022, and such financial information confirms to the Bank of America’s satisfaction that no default exists at such time, the Company will not permit the principal balance outstanding under the line of credit with Bank of America to exceed $15.0 million and, except as otherwise provided, the Company will not declare or pay any dividends.
In addition, the Amendment and Waiver includes certain clarifications and corrections to the Loan Agreement. In connection with the Amendment and Waiver, the Company agreed to pay to Bank of America a non-refundable fee of $250,000, of which $25,000 was paid on the effective date of the Amendment and Waiver and the remainder of which is payable upon the earliest to occur of (i) any default or event of default under the Loan Agreement, (ii) the last date of availability under the revolving credit facility, and (iii) repayment in full of all principal, interest, fees and other obligations under the Loan Agreement and the other loan documents.
The foregoing description of the Amendment and Waiver does not purport to be complete and is qualified in its entirety by reference to the Amendment and Waiver, which is filed as an exhibit to this Quarterly Report on Form 10-Q and is incorporated herein by reference.
33
Item 6. Exhibits INDEX OF EXHIBITS
INDEX OF EXHIBITS
(10)
| Material Contracts | Material Contracts
|
|
|
|
| + |
| 10.1 | CreditTermination Agreement dated as of October 26, 2021 by and between the CompanyGraham Acquisition I, LLC and JPMorgan Chase Bank, N.A., dated December 2, 2020.BNI Holdco, LLC.
|
|
|
|
| # |
| 10.2 | LetterSeverance and Transition Agreement dated October 28, 2020as of November 29, 2021 between the CompanyGraham Corporation and HSBC Bank USA, N.A.Jeffrey F. Glajch is incorporated herein by reference from Exhibit 10.1 to the Company’s Current Report on Form 8-K dated October 28, 2020.November 29, 2021.
|
|
|
|
| + |
| 10.3 | Third Amendment to CreditLoan Agreement and Waiver dated October 28, 2020 between the CompanyFebruary 4, 2022 by and JPMorgan Chaseamong Graham Corporation, Bank of America, N.A. is incorporated herein by reference from Exhibit 10.2 to the Company’s Current Report on Form 8-K dated October 28, 2020., GHM Acquisition Corp., Graham Acquisition I, LLC, and Barber-Nichols, LLC.
|
| | | | | (31) |
| Rule 13a-14(a)/15d-14(a) Certifications |
|
|
|
|
| + |
| 31.1 | Certification of Principal Executive Officer |
|
|
|
|
| ++ |
| 31.2 | Certification of Principal Financial Officer |
|
|
|
|
| (32) |
| Section 1350 Certification |
|
|
|
|
| + |
| 32.1 | Section 1350 Certifications |
|
|
|
|
| (101) |
| Interactive Data File |
|
|
|
|
| + |
| 101.INS | Inline XBRL Instance Document – the instance document does not appear in the Interactive Data File because its XBRL tags are embedded within the Inline XBRL document. |
|
|
|
|
| + |
| 101.SCH | Inline XBRL Taxonomy Extension Schema Document |
|
|
|
|
| + |
| 101.CAL | Inline XBRL Taxonomy Extension Calculation Linkbase Document |
|
|
|
|
| + |
| 101.DEF | Inline XBRL Taxonomy Extension Definition Linkbase Document |
|
|
|
|
| + |
| 101.LAB | Inline XBRL Taxonomy Extension Label Linkbase Document |
|
|
|
|
| + |
| 101.PRE | Inline XBRL Taxonomy Extension Presentation Linkbase Document |
| | | | |
|
|
|
|
| (104) |
| |
| | 104
| Cover Page Interactive Data File (formatted as inlineembedded within the Inline XBRL and contained in Exhibit 101).document
|
|
|
|
|
|
|
| + ++ # | Exhibit filed with this report Exhibit furnished with this report Management contract or compensation plan |
SIGNATURES
34
SIGNATURES Pursuant to the requirements of the Securities Exchange Act of 1934, the registrant has duly caused this report to be signed on its behalf by the undersigned thereunto duly authorized.
| | | |
| GRAHAM CORPORATION
| By: |
|
| /s/ Jeffrey Glajch |
|
|
| Jeffrey Glajch |
|
|
| Vice President-Finance & Administration and |
|
|
| Chief Financial Officer |
|
|
| (On behalf of the Registrant and as Principal Financial Officer) |
Date: February 1, 20218, 2022
35 29
|