`
SECURITIES AND EXCHANGE COMMISSION
WASHINGTON, D.C. 20549
FORM 10-Q
FORM 10-Q
| | | | | |
| ☒ | Quarterly Report pursuant to Section 13 or 15(d) of the Securities Exchange Act of 1934 |
For the quarterly period ended June 30,
20212022
or
| | | | | |
| ☐ | Transition Report Pursuant to Section 13 or 15(d) of the Securities Exchange Act of 1934 |
For the transition period from to
4350 Congress Street, Suite 600
Charlotte, North Carolina 28209
(Address of principal executive offices)
(Registrant's telephone number, including area code)
| | | | | | | | | | | | | | | | | | | | | | | | | | |
| number | | Exact name of registrant as specified in its charter | | Identification No. | | State or other jurisdiction of incorporation or organization | |
| 1-03560 | | Glatfelter Corporation | | 23-0628360 | | Pennsylvania | |
Former name or former address, if changed since last report
Securities registered pursuant to Section 12(b) of the Act:
| | | | | | | | | | | | | | |
| Title of each class | | Trading Symbol(s) | | Name of each exchange on which registered |
Common Stock | | GLT | | New York Stock Exchange |
Indicate by check mark whether the registrant (1) has filed all reports required to be filed by Section 13 or 15(d) of the Securities Exchange Act of 1934 during the preceding 12 months (or for such shorter period that the registrant was required to file such reports), and (2) has been subject to such filing requirements for at the past 90 days. Yes ☒ No ☐. Indicate by check mark whether the registrant has submitted electronically every Interactive Data File required to be submitted pursuant to Rule 405 of Regulation S-T (§232.405 of this chapter) during the preceding 12 months (or for such shorter period that the registrant was required to submit such files). Yes ☒ No ☐. Indicate by check mark whether the registrant is a large accelerated filer, an accelerated filer, a non-accelerated filer, a small reporting company or emerging growth company. See the definitions of “large accelerated filer”, “accelerated filer”, “smaller reporting company” and “emerging growth company” in Rule 12b-2 of the Exchange Act.
Large accelerated filer
| ☒
| | Accelerated filer
| ☐
| | | | | | | | | | | | | |
Large Accelerated Filer | ☒ | | Accelerated filer | ☐ |
| Non-accelerated filer | ☐ | | Smaller reporting company | ☐ |
| | Emerging growth company | ☐ | | |
If an emerging growth company, indicate by check mark if the registrant has elected not to use the extended transition period for complying with any new or revised financial accounting standards provided pursuant to Section 13(a) of the Exchange Act. | ☐ |
Indicate by check mark whether the registrant is a shell company (as defined in Rule 12b-2 of the Exchange Act) Yes ☐ No ☒. Common Stock outstanding on July
26, 202129, 2022 totaled
44,525,08944,774,912 shares.
GLATFELTER CORPORATION AND SUBSIDIARIES
For the
QUARTERLY PERIOD ENDEDQuarterly Period Ended
PART I
Item 1 – Financial Statements
GLATFELTER CORPORATION AND SUBSIDIARIES
CONDENSED CONSOLIDATED STATEMENTS OF INCOME
| | | Three months ended June 30 | | | Six months ended June 30 | | | Three months ended June 30, | | Six months ended June 30, |
In thousands, except per share | | 2021 | | | 2020 | | | 2021 | | | 2020 | | In thousands, except per share | 2022 | | 2021 | | 2022 | | 2021 |
| | | | | | | | | | | | | | | | | | | | | | | | |
Net sales | | $ | 244,911 | | | $ | 216,183 | | | $ | 470,585 | | | $ | 447,743 | | Net sales | $ | 363,963 | | | $ | 244,911 | | | $ | 745,643 | | | $ | 470,585 | |
Costs of products sold | | | 209,357 | | | | 184,120 | | | | 395,735 | | | | 378,878 | | Costs of products sold | 326,566 | | | 209,357 | | | 676,581 | | | 395,735 | |
Gross profit | | | 35,554 | | | | 32,063 | | | | 74,850 | | | | 68,865 | | Gross profit | 37,397 | | | 35,554 | | | 69,062 | | | 74,850 | |
Selling, general and administrative expenses | | | 28,984 | | | | 23,551 | | | | 51,811 | | | | 48,072 | | Selling, general and administrative expenses | 28,400 | | | 28,984 | | | 61,566 | | | 51,811 | |
Gains on dispositions of plant, equipment and timberlands, net | | | (1,553 | ) | | | (597 | ) | | | (2,403 | ) | | | (597 | ) | |
Operating income | | | 8,123 | | | | 9,109 | | | | 25,442 | | | | 21,390 | | |
| Goodwill and other asset impairment charges | | Goodwill and other asset impairment charges | — | | | — | | | 117,349 | | | — | |
| Loss (gains) on dispositions of plant, equipment and timberlands, net | | Loss (gains) on dispositions of plant, equipment and timberlands, net | 73 | | | (1,553) | | | (2,888) | | | (2,403) | |
| Operating income (loss) | | Operating income (loss) | 8,924 | | | 8,123 | | | (106,965) | | | 25,442 | |
Non-operating income (expense) | | | | | | | | | | | | | | | | | Non-operating income (expense) | |
Interest expense | | | (1,772 | ) | | | (1,759 | ) | | | (3,303 | ) | | | (3,537 | ) | Interest expense | (7,672) | | | (1,772) | | | (15,534) | | | (3,303) | |
Interest income | | | 11 | | | | 87 | | | | 31 | | | | 351 | | Interest income | 38 | | | 11 | | | 55 | | | 31 | |
Pension settlement expenses, net | | | — | | | | (6,330 | ) | | | — | | | | (6,403 | ) | |
| Other, net | | | (849 | ) | | | (835 | ) | | | (1,073 | ) | | | (1,515 | ) | Other, net | (455) | | | (849) | | | (1,795) | | | (1,073) | |
Total non-operating expense | | | (2,610 | ) | | | (8,837 | ) | | | (4,345 | ) | | | (11,104 | ) | Total non-operating expense | (8,089) | | | (2,610) | | | (17,274) | | | (4,345) | |
Income from continuing operations before income taxes | | | 5,513 | | | | 272 | | | | 21,097 | | | | 10,286 | | |
Income tax provision | | | 4,021 | | | | 2,553 | | | | 11,211 | | | | 5,161 | | |
| Income (loss) from continuing operations before income taxes | | Income (loss) from continuing operations before income taxes | 835 | | | 5,513 | | | (124,239) | | | 21,097 | |
| Income tax provision (benefit) | | Income tax provision (benefit) | 3,295 | | | 4,021 | | | (13,489) | | | 11,211 | |
Income (loss) from continuing operations | | | 1,492 | | | | (2,281 | ) | | | 9,886 | | | | 5,125 | | Income (loss) from continuing operations | (2,460) | | | 1,492 | | | (110,750) | | | 9,886 | |
| | | | | | | | | | | | | | | | | | |
Discontinued operations: | | | | | | | | | | | | | | | | | Discontinued operations: | |
Loss before income taxes | | | (82 | ) | | | (135 | ) | | | (82 | ) | | | (135 | ) | |
| Income (loss) before income taxes | | Income (loss) before income taxes | 408 | | | (82) | | | 371 | | | (82) | |
Income tax provision | | | — | | | | — | | | | — | | | | — | | Income tax provision | — | | | — | | | — | | | — | |
Loss from discontinued operations | | | (82 | ) | | | (135 | ) | | | (82 | ) | | | (135 | ) | Loss from discontinued operations | 408 | | | (82) | | | 371 | | | (82) | |
Net income (loss) | | $ | 1,410 | | | $ | (2,416 | ) | | $ | 9,804 | | | $ | 4,990 | | Net income (loss) | $ | (2,052) | | | $ | 1,410 | | | $ | (110,379) | | | $ | 9,804 | |
| | | | | | | | | | | | | | | | | | | | | | | | |
Basic earnings per share | | | | | | | | | | | | | | | | | Basic earnings per share | |
Income (loss) from continuing operations | | $ | 0.03 | | | $ | (0.05 | ) | | $ | 0.22 | | | $ | 0.12 | | Income (loss) from continuing operations | $ | (0.05) | | | $ | 0.03 | | | $ | (2.47) | | | $ | 0.22 | |
Loss from discontinued operations | | | — | | | | — | | | | — | | | | (0.01 | ) | |
Basic earnings per share | | $ | 0.03 | | | $ | (0.05 | ) | | $ | 0.22 | | | $ | 0.11 | | |
| Income from discontinued operations | | Income from discontinued operations | 0.01 | | | — | | | 0.01 | | | — | |
| Basic earnings (loss) per share | | Basic earnings (loss) per share | $ | (0.04) | | | $ | 0.03 | | | $ | (2.46) | | | $ | 0.22 | |
| | | | | | | | | | | | | | | | | | | | | | | | |
Diluted earnings per share | | | | | | | | | | | | | | | | | Diluted earnings per share | |
Income (loss) from continuing operations | | $ | 0.03 | | | $ | (0.05 | ) | | $ | 0.22 | | | $ | 0.12 | | Income (loss) from continuing operations | $ | (0.05) | | | $ | 0.03 | | | $ | (2.47) | | | $ | 0.22 | |
Loss from discontinued operations | | | — | | | | — | | | | — | | | | (0.01 | ) | |
Diluted earnings per share | | $ | 0.03 | | | $ | (0.05 | ) | | $ | 0.22 | | | $ | 0.11 | | |
| | | | | | | | | | | | | | | | | |
| Income from discontinued operations | | Income from discontinued operations | 0.01 | | | — | | | 0.01 | | | — | |
| Diluted earnings (loss) per share | | Diluted earnings (loss) per share | $ | (0.04) | | | $ | 0.03 | | | $ | (2.46) | | | $ | 0.22 | |
| | | | | | | | | | | | | | | | | | | | | | | | |
Weighted average shares outstanding | | | | | | | | | | | | | | | | | Weighted average shares outstanding | |
Basic | | | 44,563 | | | | 44,343 | | | | 44,507 | | | | 44,309 | | Basic | 44,841 | | 44,563 | | | 44,775 | | 44,507 |
Diluted | | | 44,872 | | | | 44,343 | | | | 44,865 | | | | 44,541 | | Diluted | 44,841 | | 44,872 | | | 44,775 | | 44,865 |
The accompanying notes are an integral part of these condensed consolidated financial statements.
GLATFELTER CORPORATION AND SUBSIDIARIES
CONDENSED CONSOLIDATED STATEMENTS OF COMPREHENSIVE INCOME
| | Three months ended June 30 | | | Six months ended June 30 | |
In thousands | | 2021 | | | 2020 | | | 2021 | | | 2020 | |
Net income (loss) | | $ | 1,410 | | | $ | (2,416 | ) | | $ | 9,804 | | | $ | 4,990 | |
Foreign currency translation adjustments | | | 3,846 | | | | 5,891 | | | | (9,347 | ) | | | (8,012 | ) |
Net change in: | | | | | | | | | | | | | | | | |
Deferred gains (losses) on cash flow hedges, net of taxes of $114, $295, $(1,187) and $696, respectively | | | (316 | ) | | | (552 | ) | | | 2,945 | | | | (1,869 | ) |
Unrecognized retirement obligations, net of taxes of $(14), $52, $(87) and $103, respectively | | | 150 | | | | (99 | ) | | | 242 | | | | (200 | ) |
Other comprehensive income (loss) | | | 3,680 | | | | 5,240 | | | | (6,160 | ) | | | (10,081 | ) |
Comprehensive income (loss) | | $ | 5,090 | | | $ | 2,824 | | | $ | 3,644 | | | $ | (5,091 | ) |
| | | | | | | | | | | | | | | | | | | | | | | |
| | Three months ended June 30, | | Six months ended June 30, |
| In thousands | 2022 | | 2021 | | 2022 | | 2021 |
| Net income (loss) | $ | (2,052) | | | $ | 1,410 | | | $ | (110,379) | | | $ | 9,804 | |
| | | | | | | |
| Foreign currency translation adjustments | (28,675) | | | 3,846 | | | (39,590) | | | (9,347) | |
| Net change in: | | | | | | | |
Deferred gains (losses) on derivatives, net of taxes of $(2,029), $114, $(2,629) and $(1,187), respectively | 8,534 | | | (316) | | | 8,177 | | | 2,945 | |
Unrecognized retirement obligations, net of taxes of $(49), $(14), $(101) and $(87), respectively | 152 | | | 150 | | | 304 | | | 242 | |
| Other comprehensive income (loss) | (19,989) | | | 3,680 | | | (31,109) | | | (6,160) | |
| Comprehensive income (loss) | $ | (22,041) | | | $ | 5,090 | | | $ | (141,488) | | | $ | 3,644 | |
The accompanying notes are an integral part of these condensed consolidated financial statements.
GLATFELTER CORPORATION AND SUBSIDIARIES
CONDENSED CONSOLIDATED BALANCE SHEETS
| | June 30 | | | December 31 | | | | | | | | | | | |
In thousands | | 2021 | | | 2020 | | In thousands | June 30,
2022 | | December 31,
2021 |
Assets | | | | | | | | | Assets | | | |
Cash and cash equivalents | | $ | 84,164 | | | $ | 99,581 | | Cash and cash equivalents | $ | 71,476 | | | $ | 138,436 | |
Accounts receivable, net | | | 144,155 | | | | 122,817 | | Accounts receivable, net | 209,455 | | | 170,212 | |
Inventories | | | 220,206 | | | | 196,230 | | Inventories | 307,612 | | | 279,520 | |
Prepaid expenses and other current assets | | | 43,578 | | | | 34,297 | | Prepaid expenses and other current assets | 46,083 | | | 48,398 | |
Total current assets | | | 492,103 | | | | 452,925 | | Total current assets | 634,626 | | | 636,566 | |
| | | | | | | | | | |
Plant, equipment and timberlands, net | | | 621,103 | | | | 543,267 | | Plant, equipment and timberlands, net | 690,228 | | | 758,812 | |
Goodwill | | | 195,461 | | | | 164,369 | | Goodwill | 168,288 | | | 236,165 | |
Intangible assets, net | | | 95,022 | | | | 81,835 | | Intangible assets, net | 110,096 | | | 156,304 | |
Other assets | | | 56,401 | | | | 44,485 | | Other assets | 94,052 | | | 92,760 | |
Total assets | | $ | 1,460,090 | | | $ | 1,286,881 | | Total assets | $ | 1,697,290 | | | $ | 1,880,607 | |
| | | | | | | | | | | | |
Liabilities and Shareholders' Equity | | | | | | | | | Liabilities and Shareholders' Equity | |
Current portion of long-term debt | | $ | 24,267 | | | $ | 25,057 | | Current portion of long-term debt | $ | 22,117 | | | $ | 26,437 | |
Short-term debt | | | 11,884 | | | | — | | Short-term debt | 10,610 | | | 22,843 | |
Accounts payable | | | 122,834 | | | | 127,505 | | Accounts payable | 208,181 | | | 214,015 | |
Dividends payable | | | 6,233 | | | | 5,988 | | Dividends payable | 6,269 | | | 6,237 | |
Environmental liabilities | | | 3,206 | | | | 3,700 | | Environmental liabilities | 2,200 | | | 2,200 | |
Other current liabilities | | | 73,930 | | | | 71,093 | | Other current liabilities | 78,143 | | | 99,438 | |
Total current liabilities | | | 242,354 | | | | 233,343 | | Total current liabilities | 327,520 | | | 371,170 | |
| | | | | | | | | | |
Long-term debt | | | 445,261 | | | | 288,464 | | Long-term debt | 779,026 | | | 738,075 | |
Deferred income taxes | | | 77,123 | | | | 77,131 | | Deferred income taxes | 63,025 | | | 87,285 | |
Other long-term liabilities | | | 124,107 | | | | 110,011 | | Other long-term liabilities | 137,797 | | | 141,315 | |
Total liabilities | | | 888,845 | | | | 708,949 | | Total liabilities | 1,307,368 | | | 1,337,845 | |
| | | | | | | | | | |
Commitments and contingencies | | | — | | | | — | | Commitments and contingencies | — | | | — | |
| | | | | | | | | | |
Shareholders’ equity | | | | | | | | | Shareholders’ equity | |
Common stock | | | 544 | | | | 544 | | Common stock | 544 | | | 544 | |
Capital in excess of par value | | | 62,796 | | | | 63,261 | | Capital in excess of par value | 62,555 | | | 64,779 | |
Retained earnings | | | 720,934 | | | | 723,365 | | Retained earnings | 582,687 | | | 705,600 | |
Accumulated other comprehensive loss | | | (64,813 | ) | | | (58,653 | ) | Accumulated other comprehensive loss | (111,413) | | | (80,304) | |
| | | 719,461 | | | | 728,517 | | | 534,373 | | | 690,619 | |
Less cost of common stock in treasury | | | (148,216 | ) | | | (150,585 | ) | Less cost of common stock in treasury | (144,451) | | | (147,857) | |
Total shareholders’ equity | | | 571,245 | | | | 577,932 | | Total shareholders’ equity | 389,922 | | | 542,762 | |
Total liabilities and shareholders’ equity | | $ | 1,460,090 | | | $ | 1,286,881 | | Total liabilities and shareholders’ equity | $ | 1,697,290 | | | $ | 1,880,607 | |
The accompanying notes are an integral part of these condensed consolidated financial statements.
GLATFELTER CORPORATION AND SUBSIDIARIES
CONDENSED CONSOLIDATED STATEMENTS OF CASH FLOWS
(unaudited) | | Six months ended June 30 | |
In thousands | | 2021 | | | 2020 | |
Operating activities | | | | | | | | |
Net income | | $ | 9,804 | | | $ | 4,990 | |
Loss from discontinued operations, net of taxes | | | 82 | | | | 135 | |
| | | | | | | | |
Adjustments to reconcile to net cash provided (used) by continuing operations: | | | | | | | | |
Depreciation, depletion and amortization | | | 28,466 | | | | 29,608 | |
Amortization of debt issue costs and original issue discount | | | 309 | | | | 293 | |
Asset impairment charge | | | — | | | | 900 | |
Deferred income tax provision (benefit) | | | 616 | | | | (2,432 | ) |
Gains on dispositions of plant, equipment and timberlands, net | | | (2,403 | ) | | | (597 | ) |
Share-based compensation | | | 2,537 | | | | 2,377 | |
Change in operating assets and liabilities: | | | | | | | | |
Accounts receivable | | | (11,533 | ) | | | 1,388 | |
Inventories | | | (21,870 | ) | | | (7,450 | ) |
Prepaid and other current assets | | | 3,377 | | | | (1,757 | ) |
Accounts payable | | | (4,542 | ) | | | (33,062 | ) |
Accruals and other current liabilities | | | (5,841 | ) | | | 2,510 | |
Other | | | 2,363 | | | | 2,185 | |
Net cash provided (used) by operating activities from continuing operations | | | 1,365 | | | | (912 | ) |
Investing activities | | | | | | | | |
Expenditures for purchases of plant, equipment and timberlands | | | (11,211 | ) | | | (12,011 | ) |
Proceeds from disposals of plant, equipment and timberlands, net | | | 2,510 | | | | 613 | |
Acquisition, net of cash acquired | | | (172,331 | ) | | | — | |
Other | | | (104 | ) | | | (50 | ) |
Net cash used by investing activities from continuing operations | | | (181,136 | ) | | | (11,448 | ) |
Financing activities | | | | | | | | |
Proceeds from short-term debt | | | 11,725 | | | | — | |
Net borrowings under revolving credit facility | | | 178,077 | | | | — | |
Payments of borrowing costs | | | (35 | ) | | | — | |
Repayment of term loans | | | (12,159 | ) | | | (11,300 | ) |
Payments of dividends | | | (11,991 | ) | | | (11,513 | ) |
Payments related to share-based compensation awards and other | | | (479 | ) | | | (362 | ) |
Net cash provided (used) by financing activities from continuing operations | | | 165,138 | | | | (23,175 | ) |
Effect of exchange rate changes on cash | | | (1,432 | ) | | | (123 | ) |
Net decrease in cash, cash equivalents and restricted cash | | | (16,065 | ) | | | (35,658 | ) |
Decrease in cash, cash equivalents and restricted cash from discontinued operations | | | (238 | ) | | | (945 | ) |
Cash, cash equivalents and restricted cash at the beginning of period | | | 111,665 | | | | 126,201 | |
Cash, cash equivalents and restricted cash at the end of period | | | 95,362 | | | | 89,598 | |
Less: restricted cash in Prepaid expenses and other current assets | | | (2,000 | ) | | | (2,000 | ) |
Less: restricted cash in Other assets | | | (9,197 | ) | | | (10,979 | ) |
Cash and cash equivalents at the end of period | | $ | 84,165 | | | $ | 76,619 | |
| | | | | | | | |
Supplemental cash flow information | | | | | | | | |
Cash paid for: | | | | | | | | |
Interest | | $ | 2,920 | | | $ | 3,175 | |
Income taxes, net | | | 7,098 | | | | 4,669 | |
| | | | | | | | | | | |
| | Six months ended June 30, |
| In thousands | 2022 | | 2021 |
| Operating activities | | | |
| Net income (loss) | $ | (110,379) | | | $ | 9,804 | |
| Loss (income) from discontinued operations, net of taxes | (371) | | | 82 | |
| Adjustments to reconcile to net cash provided (used) by continuing operations: | | | |
| Depreciation, depletion and amortization | 34,936 | | | 28,466 | |
| Amortization of debt issue costs and original issue discount | 963 | | | 309 | |
| | | |
| Goodwill and other asset impairment charges | 117,349 | | | — | |
| Inventory and accounts receivable charges | 3,948 | | | — | |
| Deferred income tax expense (benefit) | (22,186) | | | 616 | |
| Gains on dispositions of plant, equipment and timberlands, net | (2,888) | | | (2,403) | |
| Share-based compensation | 2,419 | | | 2,537 | |
| Change in operating assets and liabilities: | | | |
| Accounts receivable | (52,936) | | | (11,533) | |
| Inventories | (45,148) | | | (21,870) | |
| Prepaid and other current assets | 3,472 | | | 3,377 | |
| Accounts payable | 9,516 | | | (4,542) | |
| Accruals and other current liabilities | (16,910) | | | (5,841) | |
| Other | (1,320) | | | 2,363 | |
| Net cash provided (used) by operating activities from continuing operations | (79,535) | | | 1,365 | |
| Investing activities | | | |
| Expenditures for purchases of plant, equipment and timberlands | (22,697) | | | (11,211) | |
| Proceeds from disposals of plant, equipment and timberlands, net | 3,173 | | | 2,510 | |
| Acquisition, net of cash acquired | 1,413 | | | (172,331) | |
| Other | (25) | | | (104) | |
| Net cash used by investing activities from continuing operations | (18,136) | | | (181,136) | |
| Financing activities | | | |
| | | |
| Proceeds from term loans | — | | | 11,725 | |
| Repayment of term loans | (23,793) | | | (12,159) | |
| | | |
| Net borrowings under revolving credit facility | 72,176 | | | 178,077 | |
| Payments of borrowing costs | (1,102) | | | (35) | |
| Payments of dividends | (12,498) | | | (11,991) | |
| | | |
| Payments related to share-based compensation awards and other | (1,237) | | | (479) | |
| Net cash provided by financing activities from continuing operations | 33,546 | | | 165,138 | |
| Effect of exchange rate changes on cash | (3,587) | | | (1,432) | |
| Net decrease in cash, cash equivalents and restricted cash | (67,712) | | | (16,065) | |
| Decrease in cash, cash equivalents and restricted cash from discontinued operations | (231) | | | (238) | |
| Cash, cash equivalents and restricted cash at the beginning of period | 148,814 | | | 111,665 | |
| Cash, cash equivalents and restricted cash at the end of period | 80,871 | | | 95,362 | |
| Less: restricted cash in Prepaid expenses and other current assets | (2,000) | | | (2,000) | |
| Less: restricted cash in Other assets | (7,395) | | | (9,197) | |
| Cash and cash equivalents at the end of period | $ | 71,476 | | | $ | 84,165 | |
| | | | |
| Supplemental cash flow information | | | |
| Cash paid for: | | | |
| Interest | $ | 15,879 | | | $ | 2,920 | |
| Income taxes, net | 14,699 | | | 7,098 | |
The accompanying notes are an integral part of these condensed consolidated financial statements.
GLATFELTER CORPORATION AND SUBSIDIARIES
STATEMENTS OF SHAREHOLDERS’ EQUITY
(unaudited)
| | | | | | | | | | | | | | | | | | | | | | | | | | | | | | | | | | | |
| In thousands | Common stock | | Capital in Excess of Par Value | | Retained Earnings | | Accumulated Other Comprehensive Loss | | Treasury Stock | | Total Shareholders’ Equity |
| Balance at April 1, 2022 | $ | 544 | | | $ | 61,873 | | | $ | 591,012 | | | $ | (91,424) | | | $ | (145,272) | | | $ | 416,733 | |
| Net loss | | | | | (2,052) | | | | | | | (2,052) | |
| Other comprehensive loss | | | | | | | (19,989) | | | | | (19,989) | |
| Comprehensive loss | | | | | | | | | | | (22,041) | |
| Cash dividends declared ($0.14 per share) | | | | | (6,273) | | | | | | | (6,273) | |
| Share-based compensation expense | | | 1,510 | | | | | | | | | 1,510 | |
| Delivery of treasury shares: | | | | | | | | | | | |
| RSUs and PSAs | | | (828) | | | | | | | 821 | | | (7) | |
| Balance at June 30, 2022 | $ | 544 | | | $ | 62,555 | | | $ | 582,687 | | | $ | (111,413) | | | $ | (144,451) | | | $ | 389,922 | |
| | | | | | | | | | | | |
| Balance at April 1, 2021 | $ | 544 | | | $ | 62,576 | | | $ | 725,756 | | | $ | (68,493) | | | $ | (149,322) | | | $ | 571,061 | |
| Net income | | | | | 1,410 | | | | | | | 1,410 | |
| Other comprehensive income | | | | | | | 3,680 | | | | | 3,680 | |
| Comprehensive income | | | | | | | | | | | 5,090 | |
| Cash dividends declared ($0.14 per share) | | | | | (6,232) | | | | | | | (6,232) | |
| Share-based compensation expense | | | 1,329 | | | | | | | | | 1,329 | |
| Delivery of treasury shares: | | | | | | | | | | | |
| RSUs and PSAs | | | (1,109) | | | | | | | 1,106 | | | (3) | |
| | | | | | | | | | | |
| Balance at June 30, 2021 | $ | 544 | | | $ | 62,796 | | | $ | 720,934 | | | $ | (64,813) | | | $ | (148,216) | | | $ | 571,245 | |
| | | | | | | | | | | | |
| Balance at January 1, 2022 | $ | 544 | | | $ | 64,779 | | | $ | 705,600 | | | $ | (80,304) | | | $ | (147,857) | | | $ | 542,762 | |
| Net loss | | | | | (110,379) | | | | | | | (110,379) | |
| Other comprehensive loss | | | | | | | (31,109) | | | | | (31,109) | |
| Comprehensive loss | | | | | | | | | | | (141,488) | |
| Cash dividends declared ($0.14 per share) | | | | | (12,534) | | | | | | | (12,534) | |
| Share-based compensation expense | | | 2,419 | | | | | | | | | 2,419 | |
| Delivery of treasury shares: | | | | | | | | | | | |
| RSUs and PSAs | | | (4,643) | | | | | | | 3,406 | | | (1,237) | |
| Balance at June 30, 2022 | $ | 544 | | | $ | 62,555 | | | $ | 582,687 | | | $ | (111,413) | | | $ | (144,451) | | | $ | 389,922 | |
| | | | | | | | | | | | |
| Balance at January 1, 2021 | $ | 544 | | | $ | 63,261 | | | $ | 723,365 | | | $ | (58,653) | | | $ | (150,585) | | | $ | 577,932 | |
| Net income | | | | | 9,804 | | | | | | | 9,804 | |
| Other comprehensive loss | | | | | | | (6,160) | | | | | (6,160) | |
| Comprehensive income | | | | | | | | | | | 3,644 | |
| Cash dividends declared ($0.275 per share) | | | | | (12,235) | | | | | | | (12,235) | |
| Share-based compensation expense | | | 2,537 | | | | | | | | | 2,537 | |
| Delivery of treasury shares: | | | | | | | | | | | |
| RSUs and PSAs | | | (3,002) | | | | | | | 2,369 | | | (633) | |
| | | | | | | | | | | |
| Balance at June 30, 2021 | $ | 544 | | | $ | 62,796 | | | $ | 720,934 | | | $ | (64,813) | | | $ | (148,216) | | | $ | 571,245 | |
(unaudited)
In thousands | | Common stock | | | Capital in Excess of Par Value | | | Retained Earnings | | | Accumulated Other Comprehensive Loss | | | Treasury Stock | | | Total Shareholders’ Equity | |
Balance at April 1, 2021 | | $ | 544 | | | $ | 62,576 | | | $ | 725,756 | | | $ | (68,493 | ) | | $ | (149,322 | ) | | $ | 571,061 | |
Net income | | | | | | | | | | | 1,410 | | | | | | | | | | | | 1,410 | |
Other comprehensive income | | | | | | | | | | | | | | | 3,680 | | | | | | | | 3,680 | |
Comprehensive income | | | | | | | | | | | | | | | | | | | | | | | 5,090 | |
Cash dividends declared ($0.14 per share) | | | | | | | | | | | (6,232 | ) | | | | | | | | | | | (6,232 | ) |
Share-based compensation expense | | | | | | | 1,329 | | | | | | | | | | | | | | | | 1,329 | |
Delivery of treasury shares | | | | | | | | | | | | | | | | | | | | | | | | |
RSUs and PSAs | | | | | | | (1,109 | ) | | | | | | | | | | | 1,106 | | | | (3 | ) |
Balance at June 30, 2021 | | $ | 544 | | | $ | 62,796 | | | $ | 720,934 | | | $ | (64,813 | ) | | $ | (148,216 | ) | | $ | 571,245 | |
| | | | | | | | | | | | | | | | | | | | | | | | |
Balance at April 1, 2020 | | $ | 544 | | | $ | 59,623 | | | $ | 727,440 | | | $ | (93,217 | ) | | $ | (151,480 | ) | | $ | 542,910 | |
Net loss | | | | | | | | | | | (2,416 | ) | | | | | | | | | | | (2,416 | ) |
Other comprehensive income | | | | | | | | | | | | | | | 5,240 | | | | | | | | 5,240 | |
Comprehensive income | | | | | | | | | | | | | | | | | | | | | | | 2,824 | |
Cash dividends declared ($0.135 per share) | | | | | | | | | | | (5,989 | ) | | | | | | | | | | | (5,989 | ) |
Share-based compensation expense | | | | | | | 1,292 | | | | | | | | | | | | | | | | 1,292 | |
Delivery of treasury shares | | | | | | | | | | | | | | | | | | | | | | | | |
RSUs and PSAs | | | | | | | (865 | ) | | | | | | | | | | | 850 | | | | (15 | ) |
Employee stock options exercised — net | | | | | | | (68 | ) | | | | | | | | | | | 45 | | | | (23 | ) |
Balance at June 30, 2020 | | $ | 544 | | | $ | 59,982 | | | $ | 719,035 | | | $ | (87,977 | ) | | $ | (150,585 | ) | | $ | 540,999 | |
| | | | | | | | | | | | | | | | | | | | | | | | |
Balance at January 1, 2021 | | $ | 544 | | | $ | 63,261 | | | $ | 723,365 | | | $ | (58,653 | ) | | $ | (150,585 | ) | | $ | 577,932 | |
Net income | | | | | | | | | | | 9,804 | | | | | | | | | | | | 9,804 | |
Other comprehensive loss | | | | | | | | | | | | | | | (6,160 | ) | | | | | | | (6,160 | ) |
Comprehensive income | | | | | | | | | | | | | | | | | | | | | | | 3,644 | |
Cash dividends declared ($0.275 per share) | | | | | | | | | | | (12,235 | ) | | | | | | | | | | | (12,235 | ) |
Share-based compensation expense | | | | | | | 2,537 | | | | | | | | | | | | | | | | 2,537 | |
Delivery of treasury shares | | | | | | | | | | | | | | | | | | | | | | | | |
RSUs and PSAs | | | | | | | (3,002 | ) | | | | | | | | | | | 2,369 | | | | (633 | ) |
Balance at June 30, 2021 | | $ | 544 | | | $ | 62,796 | | | $ | 720,934 | | | $ | (64,813 | ) | | $ | (148,216 | ) | | $ | 571,245 | |
| | | | | | | | | | | | | | | | | | | | | | | | |
Balance at January 1, 2020 | | $ | 544 | | | $ | 59,900 | | | $ | 725,795 | | | $ | (77,896 | ) | | $ | (152,384 | ) | | $ | 555,959 | |
Net income | | | | | | | | | | | 4,990 | | | | | | | | | | | | 4,990 | |
Other comprehensive loss | | | | | | | | | | | | | | | (10,081 | ) | | | | | | | (10,081 | ) |
Comprehensive loss | | | | | | | | | | | | | | | | | | | | | | | (5,091 | ) |
Cash dividends declared ($0.265 per share) | | | | | | | | | | | (11,750 | ) | | | | | | | | | | | (11,750 | ) |
Share-based compensation expense | | | | | | | 2,377 | | | | | | | | | | | | | | | | 2,377 | |
Delivery of treasury shares | | | | | | | | | | | | | | | | | | | | | | | | |
RSUs and PSAs | | | | | | | (2,078 | ) | | | | | | | | | | | 1,657 | | | | (421 | ) |
Employee stock options exercised — net | | | | | | | (217 | ) | | | | | | | | | | | 142 | | | | (75 | ) |
Balance at June 30, 2020 | | $ | 544 | | | $ | 59,982 | | | $ | 719,035 | | | $ | (87,977 | ) | | $ | (150,585 | ) | | $ | 540,999 | |
The accompanying notes are an integral part of these condensed consolidated financial statements.
GLATFELTER CORPORATION AND SUBSIDIARIES
NOTES TO CONDENSED CONSOLIDATED FINANCIAL STATEMENTS
1.ORGANIZATION
Glatfelter Corporation and subsidiaries (“Glatfelter”("Glatfelter") is a leading global supplier of engineered materials. Our high-quality,materials with a strong focus on innovation and sustainability. Glatfelter's high quality, technology-driven, innovative, and customizable nonwovens solutions arecan be found in teaproducts that are Enhancing Everyday Life®. These include personal care and single-serve coffeehygiene products, food and beverage filtration, critical cleaning products, medical and personal hygiene andprotection, packaging products, as well as home improvement and industrial applications. We are headquarteredHeadquartered in Charlotte, NC, the Company’s 2021 net sales were $1.1 billion with approximately 3,250 employees worldwide. Glatfelter’s operations utilize a variety of manufacturing technologies including airlaid, wetlaid and operate facilitiesspunlace with 16 manufacturing sites located in the United States, Canada, Germany, France, the United Kingdom, France, Spain, and the Philippines. We haveThe Company has sales and distribution offices in all major geographies serving customers under the United States, Europe, Russia, Italy,Glatfelter and China. Our products are marketed worldwide, either directly to customers or through brokers and agents.Sontara brands. Additional information about Glatfelter may be found at www.glatfelter.com. The terms “we,” “us,” “our,” “the Company,” or “Glatfelter,” refer to Glatfelter Corporation and subsidiaries unless the context indicates otherwise.
2. ACCOUNTING POLICIES 2.
| ACCOUNTING POLICIES
|
Basis of Presentation The unaudited condensed consolidated financial statements (“financial statements”) include the accounts of Glatfelter and its wholly-owned subsidiaries. All intercompany balances and transactions have been eliminated.
We prepared these financial statements in accordance with accounting principles generally accepted in the United States of America (“generally accepted accounting principles” or “GAAP”) and pursuant to the rules and regulations of the Securities and Exchange Commission pertaining to interim financial statements. In our opinion, the financial statements reflect all normal, recurring adjustments needed to present fairly our results for the interim periods. When preparing these financial statements, we have assumed you have read the audited consolidated financial statements included in our
20202021 Annual Report on Form 10-K.
Discontinued Operations The results of operations and cash flows of our former Specialty Papers business have been classified as discontinued operations for all periods presented in the condensed consolidated statements of income. Accounting Estimates The preparation of financial statements in conformity with GAAP requires management to make estimates and assumptions that affect the reported amounts of assets and liabilities and disclosures of contingencies as of the balance sheet date and the reported amounts of revenues and expenses during the reporting period. Management believes the estimates and assumptions used in the preparation of these financial statements are reasonable, based upon currently available facts and known circumstances, but recognizes actual results may differ from those estimates and assumptions.Recently Issued Accounting Pronouncements
Inventories In Our inventories are stated at the lower of cost or net realizable value. Raw materials, in-process and finished goods inventories are valued principally using the average-cost method.
3.DecemberACQUISITION
2019, the Financial Accounting Standards Board issued Accounting Standards Update No. 2019-12, Income Taxes (Topic 740): Simplifying the Accounting for Income Taxes (“ASU No. 2019-12”). The update eliminates, clarifies, and modifies certain guidance related to the accounting for income taxes. We adopted ASU No. 2019-12 effective January 1, 2021 and it did not have a material impact on our financial statements.On May 13, 2021, we completed the acquisition of all the outstanding equity interests in Georgia-Pacific Mt. Holly LLC, Georgia-Pacific's U.S. nonwovens business ("Mount Holly"), for $170.7 million, subject to customary post-closing purchase price adjustments. This business includes the Mount Holly, NC manufacturing facility with annual production capacity of approximately 37,000 metric tons and an R&D center and pilot line for nonwovens product development in Memphis, TN. The Mount Holly facility produces high-quality airlaid products for the wipes, hygiene, and other nonwoven materials markets, competing in the marketplace with nonwoven technologies and substrates, as well as other materials focused primarily on consumer based end-use applications. The facility employs approximately 140 people.$170.9 million. Mount Holly’s results are reported prospectively from the acquisition date as part of our Airlaid Materials segment.Mount Holly had annual net sales
On October 29, 2021, we completed the acquisition of PMM Holding (Luxembourg) AG, the owner of all of the equity interest in Jacob Holm, a global leading manufacturer of premium quality spunlace nonwoven fabrics for critical
cleaning, high-performance materials, personal care, hygiene and medical applications, for approximately
$100$304.0 million
in 2020.for all outstanding shares and the extinguishment of Jacob Holm’s debt.
For the quarter ended June 30, 2022, we adjusted the preliminary purchase price allocation related to the Jacob Holm acquisition by reducing preacquistion compensation incentive accruals by approximately $0.5 million, and reducing goodwill by the same amount, based on incentive payouts made during the quarter.
The
acquisition was financed through a combination of cash on hand and borrowings under our revolving credit facility.following table sets forth information related to the consideration exchanged for each acquisition.
| | | | | | | | | | | | | | | | | |
| In thousands | Mount Holly | | Jacob Holm | | Total |
| Total consideration | $ | 170,919 | | | $ | 303,952 | | | $ | 474,871 | |
| Less: Debt repaid | — | | | (148,000) | | | (148,000) | |
| Cash consideration | $ | 170,919 | | | $ | 155,952 | | | $ | 326,871 | |
The preliminary purchase price allocationallocations set forth in the following table are based on all information available to us at the present time and is subject to change. With respect to the Mount Holly acquisition, the purchase price allocation is complete. However, the Jacob Holm purchase price allocation is preliminary as we are in the process of finalizing our analysis of certain matters, primarily related to the assessment of potential tax liabilities associated with the acquired entities. In the event new information becomes available, the measurement of the amount of goodwill reflected may be affected.
| | | | | | | | | | | | | | | | | |
| In thousands | Mount Holly | | Jacob Holm | | Total |
| Assets | | | | | |
| Cash and cash equivalents | $ | — | | | $ | 11,426 | | | $ | 11,426 | |
| Accounts receivable | 11,599 | | | 30,271 | | | 41,870 | |
| Inventory | 7,031 | | 45,340 | | 52,371 |
| Prepaid and other current assets | 11 | | 6,727 | | 6,738 |
| Plant, equipment and timberlands | 100,498 | | 158,612 | | 259,110 |
| Intangible assets | 20,000 | | 70,240 | | 90,240 |
| Goodwill | 35,793 | | 48,355 | | 84,148 |
| Other assets | 8,041 | | 26,929 | | 34,970 |
| Total assets | 182,973 | | 397,900 | | 580,873 |
| Liabilities | | | | | |
| Short-term debt | 0 | | 14,081 | | 14,081 |
| Accounts payable | 2,321 | | 25,264 | | 27,585 |
| Other current liabilities | 1,868 | | 21,263 | | 23,131 |
| Other long-term liabilities | 7,865 | | 33,340 | | 41,205 |
| Total liabilities | 12,054 | | 93,948 | | 106,002 |
| Total preliminary purchase price | $ | 170,919 | | | $ | 303,952 | | | $ | 474,871 | |
The preliminary purchase price allocations set forth in the table above are based on all information available to us at the present time and is subject to change. In the event new information becomes available,
primarily related to the finalization of post-closing working capital adjustments, the measurement of the amount of goodwill reflected may be affected.
- 7 -
GLATFELTER
Form 10-Q
The following table summarizes preliminary allocation of the purchase price to assets acquired and liabilities assumed is as follows:
In thousands | | | | | Preliminary Allocation | |
Assets | | | | | | | |
Accounts receivable | | | | | $ | 11,576 | |
Inventory | | | | | | 7,031 | |
Prepaid and other current assets | | | | | | 11 | |
Plant, equipment and timberlands | | | | | | 100,498 | |
Intangible assets | | | | | | 20,000 | |
Goodwill | | | | | | 36,045 | |
Other assets | | | | | | 8,041 | |
Total assets | | | | | | 183,202 | |
Liabilities | | | | | | | |
Accounts payable | | | | | | 2,587 | |
Other current liabilities | | | | | | 2,017 | |
Other long-term liabilities | | | | | | 7,865 | |
Total liabilities | | | | | | 12,469 | |
Total purchase price | | | | | $ | 170,733 | |
For purposes of allocating the total purchase price, assets acquired and liabilities assumed are recorded at their estimated fair market value.values. The allocationallocations set forth above isare based on management’s estimate of the fair value using valuation techniques such as discounted cash flow models, appraisals and similar methodologies.
The
amount allocatedfollowing table sets forth information related to
intangible assets represents the estimated valueamounts of
customer relationships.Acquired property, plant and equipment are being depreciated on a straight-line basis with estimated remaining lives ranging from five years to 35 years. Intangible assets are being amortized on a straight-line basis over an estimated remaining life of 11 years reflecting the expected future value.
In connection with the Mount Holly acquisition, we recorded $36.0 million of goodwill and $20.0 million of identifiable intangible assets consisting of customer relationships. The goodwill arising from the acquisition largely relates to strategic benefits, product and market diversification, assembled workforce, and similar factors. For tax purposes, the goodwill is deductible over 15 years.
Revenuenet sales and operating income (loss) of Mount Hollythe acquired businesses included in our consolidated results of operations for 2021 totaled $10.1 millionin the three and $1.3 million, respectively. six months ended 2022:
| | | | | | | | | | | |
| Three months ended June 30, | | Six months ended June 30, |
| In thousands | 2022 | | 2022 |
| Mount Holly | | | |
| Net sales | $ | 26,300 | | | $ | 53,604 | |
| Operating income | 1,911 | | | 4,635 | |
| Jacob Holm | | | |
| Net sales | 96,917 | | | 193,304 | |
| Operating loss | (1,808) | | | (3,380) | |
The following table summarizes annual unaudited pro forma financial information as if the acquisition occurred as of January 1, 2020:2021:
| (unaudited) | | Three months ended June 30 | | | | Six months ended June 30 | | | (unaudited) | Three months ended June 30, | | Six months ended June 30, |
In thousands, except per share | | | 2021 | | | | | 2020 | | | | | 2021 | | | | 2020 | | | In thousands, except per share | 2021 | | 2021 |
Pro forma | | | | | | | | | | | | | | | | | | | | | Pro forma | | |
Net sales | | $ | 254,452 | | | | $ | 241,641 | | | | $ | 501,083 | | | | $ | 498,352 | | | Net sales | $ | 347,895 | | | $ | 690,448 | |
Income (loss) from continuing operations | | | (919 | ) | | | | (766 | ) | | | | 7,824 | | | | | 8,286 | | | Income (loss) from continuing operations | (10,546) | | | 12,892 | |
Income (loss) per share from continuing operations | | | (0.02 | ) | | | | (0.02 | ) | | | | 0.17 | | | | | 0.19 | | | |
The pro forma financial information set forth above for the three
months ended and
the six months ended June 30, 2021 includes $3.7 million and $4.3 million, respectively, of one-time costs directly related to the Mount Holly transaction. Such costs are presented under the caption “Selling, general and administrative expenses” in the accompanying condensed consolidated statements of income.
-
89 -
GLATFELTER
Form 10-Q
4.REVENUE
The following tables set forth disaggregated information pertaining to our net sales:
| | Three months ended June 30 | | | Six months ended June 30 | |
In thousands | | 2021 | | | 2020 | | | 2021 | | | 2020 | |
Composite Fibers | | | | | | | | | | | | | | | | |
Food & beverage | | $ | 73,535 | | | $ | 73,014 | | | $ | 150,488 | | | $ | 144,481 | |
Wallcovering | | | 24,182 | | | | 11,259 | | | | 46,811 | | | | 31,152 | |
Technical specialties | | | 24,708 | | | | 18,816 | | | | 48,203 | | | | 38,823 | |
Composite laminates | | | 10,549 | | | | 8,126 | | | | 20,358 | | | | 17,889 | |
Metallized | | | 8,624 | | | | 10,922 | | | | 16,987 | | | | 22,503 | |
| | | 141,598 | | | | 122,137 | | | | 282,847 | | | | 254,848 | |
Airlaid Materials | | | | | | | | | | | | | | | | |
Feminine hygiene | | | 47,184 | | | | 50,668 | | | | 94,825 | | | | 100,764 | |
Specialty wipes | | | 21,371 | | | | 20,947 | | | | 37,287 | | | | 38,159 | |
Tabletop | | | 17,188 | | | | 5,529 | | | | 24,051 | | | | 20,581 | |
Adult incontinence | | | 5,083 | | | | 5,011 | | | | 9,761 | | | | 11,156 | |
Home care | | | 6,339 | | | | 6,278 | | | | 10,262 | | | | 11,490 | |
Other | | | 6,148 | | | | 5,613 | | | | 11,552 | | | | 10,745 | |
| | | 103,313 | | | | 94,046 | | | | 187,738 | | | | 192,895 | |
| | $ | 244,911 | | | $ | 216,183 | | | $ | 470,585 | | | $ | 447,743 | |
| | | Three months ended June 30 | | | Six months ended June 30 | | | Three months ended June 30, | | Six months ended June 30, |
In thousands | | 2021 | | | 2020 | | | 2021 | | | 2020 | | In thousands | 2022 | | 2021 | | 2022 | | 2021 |
| Revenue by product category | | Revenue by product category | | | | | | | |
| Composite Fibers | | Composite Fibers | |
| Food & beverage | | Food & beverage | $ | 74,465 | | | $ | 73,535 | | | $ | 149,688 | | | $ | 150,488 | |
| Wallcovering | | Wallcovering | 9,902 | | | 24,182 | | | 25,733 | | | 46,811 | |
| Technical specialties | | Technical specialties | 18,603 | | | 24,708 | | | 41,739 | | | 48,203 | |
| Composite laminates | | Composite laminates | 11,570 | | | 10,549 | | | 22,867 | | | 20,358 | |
| Metallized | | Metallized | 8,798 | | | 8,624 | | | 19,140 | | | 16,987 | |
| | | | 123,338 | | | 141,598 | | | 259,167 | | | 282,847 | |
| Airlaid Materials | | Airlaid Materials | |
| Feminine hygiene | | Feminine hygiene | 56,943 | | | 47,184 | | | 116,255 | | | 94,825 | |
| Specialty wipes | | Specialty wipes | 37,908 | | | 21,371 | | | 75,003 | | | 37,287 | |
| Tabletop | | Tabletop | 26,771 | | | 17,188 | | | 57,518 | | | 24,051 | |
| Food pads | | Food pads | 3,475 | | | 2,440 | | | 6,951 | | | 4,797 | |
| Home care | | Home care | 5,513 | | | 6,339 | | | 11,798 | | | 10,262 | |
| Adult incontinence | | Adult incontinence | 6,260 | | | 5,083 | | | 12,989 | | | 9,761 | |
| Other | | Other | 6,838 | | | 3,708 | | | 12,658 | | | 6,755 | |
| | | 143,708 | | | 103,313 | | | 293,172 | | | 187,738 | |
| Spunlace | | Spunlace | |
| Consumer wipes | | Consumer wipes | 39,549 | | | — | | | 85,706 | | | — | |
| Critical cleaning | | Critical cleaning | 27,783 | | | — | | | 52,061 | | | — | |
| Health care | | Health care | 15,434 | | | — | | | 29,039 | | | — | |
| Hygiene | | Hygiene | 6,233 | | | — | | | 12,146 | | | — | |
| High performance | | High performance | 4,018 | | | — | | | 8,130 | | | — | |
| Beauty care | | Beauty care | 3,900 | | | — | | | 6,222 | | | — | |
| | | | 96,917 | | | — | | | 193,304 | | | — | |
| Total | | Total | $ | 363,963 | | | $ | 244,911 | | | $ | 745,643 | | | $ | 470,585 | |
| | Revenue by geography | | Revenue by geography | |
Composite Fibers | | | | | | | | | | | | | | | | | Composite Fibers | |
Europe, Middle East and Africa | | $ | 85,796 | | | $ | 68,807 | | | $ | 172,741 | | | $ | 148,402 | | Europe, Middle East and Africa | $ | 59,868 | | | $ | 85,796 | | | $ | 133,472 | | | $ | 172,741 | |
Americas | | | 35,369 | | | | 33,352 | | | | 67,210 | | | | 66,073 | | Americas | 42,077 | | | 35,369 | | | 80,053 | | | 67,210 | |
Asia Pacific | | | 20,433 | | | | 19,978 | | | | 42,896 | | | | 40,373 | | Asia Pacific | 21,393 | | | 20,433 | | | 45,642 | | | 42,896 | |
| | | 141,598 | | | | 122,137 | | | | 282,847 | | | | 254,848 | | |
| | | | | | | | | | | | | | | | | | 123,338 | | | 141,598 | | | 259,167 | | | 282,847 | |
Airlaid Materials | | | | | | | | | | | | | | | | | Airlaid Materials | |
Europe, Middle East and Africa | | | 49,552 | | | | 45,879 | | | | 94,624 | | | | 98,599 | | Europe, Middle East and Africa | 63,355 | | | 49,552 | | | 126,491 | | | 94,624 | |
Americas | | | 52,031 | | | | 45,262 | | | | 89,516 | | | | 89,648 | | Americas | 77,608 | | | 52,031 | | | 158,521 | | | 89,516 | |
Asia Pacific | | | 1,730 | | | | 2,905 | | | | 3,598 | | | | 4,648 | | Asia Pacific | 2,745 | | | 1,730 | | | 8,160 | | | 3,598 | |
| | | 103,313 | | | | 94,046 | | | | 187,738 | | | | 192,895 | | | 143,708 | | | 103,313 | | | 293,172 | | | 187,738 | |
| Spunlace | | Spunlace | |
| Europe, Middle East and Africa | | Europe, Middle East and Africa | 30,245 | | | — | | | 60,070 | | | — | |
| Americas | | Americas | 54,985 | | | — | | | 110,469 | | | — | |
| Asia Pacific | | Asia Pacific | 11,687 | | | — | | | 22,765 | | | — | |
| | $ | 244,911 | | | $ | 216,183 | | | $ | 470,585 | | | $ | 447,743 | | |
| | | 96,917 | | | — | | | 193,304 | | | — | |
| Total | | Total | $ | 363,963 | | | $ | 244,911 | | | $ | 745,643 | | | $ | 470,585 | |
In the first quarter of
2020,
we announced restructuring actions within the Composite Fibers operating segment. The actions primarily consisted of the consolidation of our metallizing operation from Gernsbach, Germany to our Caerphilly, U.K. site.
| | Three months ended June 30 | | | | Six months ended June 30 | | |
In thousands | | 2020 | | | | 2020 | | |
Severance and benefit continuation | | $ | 2,689 | | | | $ | 6,143 | | |
Accelerated depreciation | | | 1,352 | | | | | 3,885 | | |
Inventory and spare parts | | | 935 | | | | | 935 | | |
Other | | | 91 | | | | | 91 | | |
Total | | $ | 5,067 | | | | $ | 11,054 | | |
The restructuring charge is recorded under the caption “Costs of product sold” in the accompanying condensed consolidated statements of income for the three months and six months ended June 30, 2020. The amounts accrued for severance and benefit continuation are recorded as other current liabilities in the accompanying condensed consolidated balance sheet as of June 30, 2021
-
910 -
GLATFELTER
Form 10-Q
and December 31, 2020. The accrued and unpaid restructuring charge totaled approximately $0.2 million and $1.0 million as of June 30, 2021 and December 31, 2020, respectively. With the exception of the severance and benefit continuation amounts, substantially all other amounts accrued represent accelerated non-cash asset write-downs.
During the second quarter of 2020, in
connection5. with an assessment of potential impairment of indefinite lived intangible assets, we recorded a $0.9 million non-cash asset impairment charge related to a trade name intangible asset acquired in connection with our Composite Fibers segment’s 2013 Dresden acquisition. The charge was due to a change in the estimated fair value of the trade name, primarily driven by lower forecasted wallcover revenues associated with economic instability in Russia and Ukraine and incremental impacts from the COVID-19 pandemic on this business. The charge is recorded in the accompanying condensed consolidated statements of income under the caption “Selling, general and administrative expenses.” The fair value of the asset was estimated using a discounted cash flow model, Level 3 fair value classification.GAINS ON DISPOSITION OF PLANT, EQUIPMENT AND TIMBERLANDS7.
| GAINS ON DISPOSITION OF PLANT, EQUIPMENT AND TIMBERLANDS
|
The following table sets forth sales of timberlands and other assets completed during the first six months of
20212022 and
2020:2021:Dollars in thousands | | Acres | | | Proceeds | | | Gain | | |
2021 | | | | | | | | | | | | | |
Timberlands | | 936 | | | $ | 2,510 | | | $ | 2,403 | | |
Other | | n/a | | | | — | | | | — | | |
Total | | | | | | $ | 2,510 | | | $ | 2,403 | | |
| | | | | | | | | | | | | |
2020 | | | | | | | | | | | | | |
Timberlands | | | 216 | | | $ | 613 | | | $ | 601 | | |
Other | | n/a | | | | — | | | | (4 | ) | |
Total | | | | | | $ | 613 | | | $ | 597 | | |
| | | | | | | | | | | | | | | | | |
| Dollars in thousands | Acres | | Proceeds | | Gain (loss) |
| 2022 | | | | | |
| Timberlands | 790 | | $ | 3,130 | | | $ | 2,962 | |
| Other | n/a | | 43 | | | (74) | |
| Total | | | $ | 3,173 | | | $ | 2,888 | |
| | | | | | |
| 2021 | | | | | |
| Timberlands | 936 | | $ | 2,510 | | | $ | 2,403 | |
| Other | n/a | | — | | | — | |
| Total | | | $ | 2,510 | | | $ | 2,403 | |
6.GOODWILL AND OTHER ASSET IMPAIRMENT
During the first quarter of 2022, in connection with an assessment of potential impairment of long-lived and indefinite lived intangible assets stemming from the compounding impacts resulting from the Russia/Ukraine military conflict and related sanctions, we recorded a $117.3 million non-cash asset impairment charge related to Composite Fibers' Dresden facility and an impairment of Composite Fibers' goodwill. Dresden is a single-line facility that produces wallcover base paper, the majority of which is sold into the Russian and Ukrainian markets. As a direct result of the economic impacts from the conflict, and the disruptions in the underlying financial systems and prohibition of the export of sanctioned wallcover base paper to Russia, management expects a significant reduction in wallcover revenues and associated cash flows for the foreseeable future. In addition, the conflict is expected to significantly impact energy prices and also impact other Composite Fibers products that are also subject to export sanctions into Russia. Accordingly, a charge was recorded to reduce the carrying value of the Dresden fixed assets and intangible assets (technological know-how, customer relationships, and an indefinite-lived trade name), along with Composite Fibers’ goodwill to fair value. The following table summarizes the impairment charge recorded in the accompanying condensed consolidated statements of income under the caption “Goodwill and other asset impairment charges:”
8.
| DISCONTINUED OPERATIONS
| | | | | | | |
| In thousands | | Six months ended June 30, |
| Machinery and equipment | | $ | 27,619 | |
| Technological know-how | | 18,443 | |
| Customer relationships | | 11,695 | |
| Tradename | | 3,530 | |
| Goodwill | | 56,062 | |
| Total | | $ | 117,349 | |
On October 31, 2018,
The fair value of the underlying assets was estimated using discounted cash flow models, independent appraisals and similar methods, all of which are Level 3 fair value classification.
In addition, as a result of economic sanctions and disruptions to the financial markets, certain customers are not able to satisfy outstanding accounts receivables. As such, during the first six months of 2022, we
completedrecognized bad debt expense of approximately $2.9 million directly related to Russian and Ukrainian customers. Furthermore, during the
previously announced salefirst six months of
our Specialty Papers business on a cash free and debt free basis2022, we increased inventory reserves by approximately $1.0 million, primarily related to
Pixelle Specialty Solutions LLC, an affiliate of Lindsay Goldberg (the “Purchaser”) for $360 million.wallcover products.
7.DISCONTINUED OPERATIONS
For both the three
months and six months ended June 30,
2022, we recognized income of $0.4 million which primarily represents the successful appeal of a sales and use tax audit partially offset by legal costs. For 2021,
we reported a netthe $0.1 million loss
from discontinued operations of $82 thousand compared with a net loss of $135 thousand in each of the same periods of 2020.is primarily related to legal costs.
The following table sets forth a summary of cash flows from discontinued operations which is included in the condensed consolidated statements of cash flows:
| | | Six months ended June 30 | | | | Six months ended June 30, |
In thousands | | 2021 | | | 2020 | | | In thousands | 2022 | | 2021 |
Net cash used by operating activities | | $ | (238 | ) | | $ | (945 | ) | | Net cash used by operating activities | $ | (231) | | | $ | (238) | |
Net cash used by investing activities | | | — | | | | — | | | Net cash used by investing activities | — | | | — | |
Net cash provided by financing activities | | | — | | | | — | | | Net cash provided by financing activities | — | | | — | |
Change in cash and cash equivalents from discontinued operations | | $ | (238 | ) | | $ | (945 | ) | | Change in cash and cash equivalents from discontinued operations | $ | (231) | | | $ | (238) | |
- 10 -
GLATFELTER
Form 10-Q
8.EARNINGS PER SHARE
The following table sets forth the details of basic and diluted earnings per share (“EPS”) from continuing operations:
| | Three months ended June 30 | | | Six months ended June 30 | | |
In thousands, except per share | | 2021 | | | | 2020 | | | 2021 | | | | 2020 | | |
Income (loss) from continuing operations | | $ | 1,492 | | | | $ | (2,281 | ) | | $ | 9,886 | | | | $ | 5,125 | | |
| | | | | | | | | | | | | | | | | | | |
Weighted average common shares outstanding used in basic EPS | | | 44,563 | | | | | 44,343 | | | | 44,507 | | | | | 44,309 | | |
Common shares issuable upon exercise of dilutive stock options and PSAs / RSUs | | | 309 | | | | | — | | | | 358 | | | | | 232 | | |
Weighted average common shares outstanding and common share equivalents used in diluted EPS | | | 44,872 | | | | | 44,343 | | | | 44,865 | | | | | 44,541 | | |
| | | | | | | | | | | | | | | | | | | |
Earnings (loss) per share from continuing operations | | | | | | | | | | | | | | | | | | | |
Basic | | $ | 0.03 | | | | $ | (0.05 | ) | | $ | 0.22 | | | | $ | 0.12 | | |
Diluted | | | 0.03 | | | | | (0.05 | ) | | | 0.22 | | | | | 0.12 | | |
| | | | | | | | | | | | | | | | | | | | | | | |
| | Three months ended June 30, | | Six months ended June 30, |
| In thousands, except per share | 2022 | | 2021 | | 2022 | | 2021 |
| Income (loss) from continuing operations | $ | (2,460) | | | $ | 1,492 | | | $ | (110,750) | | | $ | 9,886 | |
| | | | | | | | |
| Weighted average common shares outstanding used in basic EPS | 44,841 | | | 44,563 | | | 44,775 | | | 44,507 | |
Common shares issuable upon exercise of dilutive stock options and PSAs / RSUs | — | | | 309 | | | — | | | 358 | |
Weighted average common shares outstanding and common share equivalents used in diluted EPS | 44,841 | | | 44,872 | | | 44,775 | | | 44,865 | |
| | | | | | | | |
| Earnings (loss) per share from continuing operations | | | | | | | |
| Basic | $ | (0.05) | | | $ | 0.03 | | | $ | (2.47) | | | $ | 0.22 | |
| Diluted | (0.05) | | | 0.03 | | | (2.47) | | | 0.22 | |
The following table sets forth potential common shares outstanding that were not included in the computation of diluted EPS for the periods indicated, because their effect would be anti-dilutive:
| | Three months ended June 30 | | | Six months ended June 30 | | |
In thousands | | 2021 | | | | 2020 | | | 2021 | | | | 2020 | | |
Potential common shares | | | 1,082 | | | | | 1,129 | | | | 1,082 | | | | | 1,129 | | |
| | | | | | | | | | | | | | | | | | | | | | | |
| | Three months ended June 30, | | Six months ended June 30, |
| In thousands | 2022 | | 2021 | | 2022 | | 2021 |
| Potential common shares | 934 | | | 1,082 | | | 934 | | | 1,082 | |
-
1112 -
GLATFELTER
Form 10-Q
10.
| ACCUMULATED OTHER COMPREHENSIVE INCOME
|
9.ACCUMULATED OTHER COMPREHENSIVE INCOME
The following table sets forth details of the changes in accumulated other comprehensive income (losses) for the three months and six months ended June 30,
20212022 and
2020.2021.In thousands | Currency translation adjustments | | | Unrealized gain (loss) on cash flow hedges | | | Change in pensions | | | Change in other postretirement defined benefit plans | | | Total | | |
| | | | | | | | | | | | | | | | | | | | |
Balance at April 1, 2021 | $ | (55,718 | ) | | $ | 765 | | | $ | (12,706 | ) | | $ | (834 | ) | | $ | (68,493 | ) | |
Other comprehensive income (loss) before reclassifications (net of tax) | | 3,846 | | | | (341 | ) | | | — | | | | — | | | | 3,505 | | |
Amounts reclassified from accumulated other comprehensive income (net of tax) | | — | | | | 25 | | | | 197 | | | | (47 | ) | | | 175 | | |
Net current period other comprehensive income (loss) | | 3,846 | | | | (316 | ) | | | 197 | | | | (47 | ) | | | 3,680 | | |
Balance at June 30, 2021 | $ | (51,872 | ) | | $ | 449 | | | $ | (12,509 | ) | | $ | (881 | ) | | $ | (64,813 | ) | |
| | | | | | | | | | | | | | | | | | | | |
Balance at April 1, 2020 | $ | (90,249 | ) | | $ | 2,999 | | | $ | (7,105 | ) | | $ | 1,138 | | | $ | (93,217 | ) | |
Other comprehensive income before reclassifications (net of tax) | | 5,891 | | | | 516 | | | | — | | | | — | | | | 6,407 | | |
Amounts reclassified from accumulated other comprehensive income (net of tax) | | — | | | | (1,068 | ) | | | 149 | | | | (248 | ) | | | (1,167 | ) | |
Net current period other comprehensive income (loss) | | 5,891 | | | | (552 | ) | | | 149 | | | | (248 | ) | | | 5,240 | | |
Balance at June 30, 2020 | $ | (84,358 | ) | | $ | 2,447 | | | $ | (6,956 | ) | | $ | 890 | | | $ | (87,977 | ) | |
| | In thousands | | In thousands | Currency translation adjustments | | Unrealized gain (loss) on derivatives | | Change in pensions | | Change in other postretirement defined benefit plans | | Total |
| | Balance at April 1, 2022 | | Balance at April 1, 2022 | $ | (80,672) | | | $ | 1,631 | | | $ | (11,356) | | | $ | (1,027) | | | $ | (91,424) | |
| Other comprehensive income (loss) before reclassifications (net of tax) | | Other comprehensive income (loss) before reclassifications (net of tax) | (28,675) | | | 9,760 | | | — | | | — | | | (18,915) | |
Amounts reclassified from accumulated other comprehensive income (net of tax) | | Amounts reclassified from accumulated other comprehensive income (net of tax) | — | | | (1,226) | | | 126 | | | 26 | | | (1,074) | |
| Net current period other comprehensive income (loss) | | Net current period other comprehensive income (loss) | (28,675) | | | 8,534 | | | 126 | | | 26 | | | (19,989) | |
| Balance at June 30, 2022 | | Balance at June 30, 2022 | $ | (109,347) | | | $ | 10,165 | | | $ | (11,230) | | | $ | (1,001) | | | $ | (111,413) | |
| | | | | | | | | | | | |
| Balance at April 1, 2021 | | Balance at April 1, 2021 | $ | (55,718) | | | $ | 765 | | | $ | (12,706) | | | $ | (834) | | | $ | (68,493) | |
| Other comprehensive income (loss) before reclassifications (net of tax) | | Other comprehensive income (loss) before reclassifications (net of tax) | 3,846 | | | (341) | | | — | | | — | | | 3,505 | |
Amounts reclassified from accumulated other comprehensive income (net of tax) | | Amounts reclassified from accumulated other comprehensive income (net of tax) | — | | | 25 | | | 197 | | | (47) | | | 175 | |
| Net current period other comprehensive income (loss) | | Net current period other comprehensive income (loss) | 3,846 | | | (316) | | | 197 | | | (47) | | | 3,680 | |
| Balance at June 30, 2021 | | Balance at June 30, 2021 | $ | (51,872) | | | $ | 449 | | | $ | (12,509) | | | $ | (881) | | | $ | (64,813) | |
| | Balance at January 1, 2022 | | Balance at January 1, 2022 | $ | (69,757) | | | $ | 1,988 | | | $ | (11,482) | | | $ | (1,053) | | | $ | (80,304) | |
| Other comprehensive income (loss) before reclassifications (net of tax) | | Other comprehensive income (loss) before reclassifications (net of tax) | (39,590) | | | 10,143 | | | — | | | — | | | (29,447) | |
| Amounts reclassified from accumulated other comprehensive income (net of tax) | | Amounts reclassified from accumulated other comprehensive income (net of tax) | — | | | (1,966) | | | 252 | | | 52 | | | (1,662) | |
| Net current period other comprehensive income (loss) | | Net current period other comprehensive income (loss) | (39,590) | | | 8,177 | | | 252 | | | 52 | | | (31,109) | |
| Balance at June 30, 2022 | | Balance at June 30, 2022 | $ | (109,347) | | | $ | 10,165 | | | $ | (11,230) | | | $ | (1,001) | | | $ | (111,413) | |
| | | | | | | | | | | | | | | | | | | | | | | | | | | | | | |
Balance at January 1, 2021 | $ | (42,525 | ) | | $ | (2,496 | ) | | $ | (12,844 | ) | | $ | (788 | ) | | $ | (58,653 | ) | | Balance at January 1, 2021 | $ | (42,525) | | | $ | (2,496) | | | $ | (12,844) | | | $ | (788) | | | $ | (58,653) | |
Other comprehensive income (loss) before reclassifications (net of tax) | | (9,347 | ) | | | 2,933 | | | | — | | | | — | | | | (6,414 | ) | | Other comprehensive income (loss) before reclassifications (net of tax) | (9,347) | | | 2,933 | | | — | | | — | | | (6,414) | |
Amounts reclassified from accumulated other comprehensive income (net of tax) | | — | | | | 12 | | | | 335 | | | | (93 | ) | | | 254 | | | Amounts reclassified from accumulated other comprehensive income (net of tax) | — | | | 12 | | | 335 | | | (93) | | | 254 | |
Net current period other comprehensive income (loss) | | (9,347 | ) | | | 2,945 | | | | 335 | | | | (93 | ) | | | (6,160 | ) | | Net current period other comprehensive income (loss) | (9,347) | | | 2,945 | | | 335 | | | (93) | | | (6,160) | |
Balance at June 30, 2021 | $ | (51,872 | ) | | $ | 449 | | | $ | (12,509 | ) | | $ | (881 | ) | | $ | (64,813 | ) | | Balance at June 30, 2021 | $ | (51,872) | | | $ | 449 | | | $ | (12,509) | | | $ | (881) | | | $ | (64,813) | |
| | | | | | | | | | | | | | | | | | | | | |
Balance at January 1, 2020 | $ | (76,346 | ) | | $ | 4,316 | | | $ | (7,253 | ) | | $ | 1,387 | | | $ | (77,896 | ) | | |
Other comprehensive income (loss) before reclassifications (net of tax) | | (8,012 | ) | | | 799 | | | | — | | | | — | | | | (7,213 | ) | | |
Amounts reclassified from accumulated other comprehensive income (net of tax) | | — | | | | (2,668 | ) | | | 297 | | | | (497 | ) | | | (2,868 | ) | | |
Net current period other comprehensive income (loss) | | (8,012 | ) | | | (1,869 | ) | | | 297 | | | | (497 | ) | | | (10,081 | ) | | |
Balance at June 30, 2020 | $ | (84,358 | ) | | $ | 2,447 | | | $ | (6,956 | ) | | $ | 890 | | | $ | (87,977 | ) | | |
-
1213 -
GLATFELTER
Form 10-Q
Reclassifications out of accumulated other comprehensive income and into the condensed consolidated statements of income were as follows:
| | Three months ended June 30 | | | Six months ended June 30 | | | |
In thousands | | 2021 | | | 2020 | | | 2021 | | | 2020 | | | |
Description | | | | | | | | | | | | | | | | | | Line Item in Statements of Income |
Cash flow hedges (Note 20) | | | | | | | | | | | | | | | | | | |
(Gains) losses on cash flow hedges | | $ | 33 | | | $ | (1,488 | ) | | $ | 57 | | | $ | (3,670 | ) | | Costs of products sold |
Tax expense (benefit) | | | (22 | ) | | | 420 | | | | (73 | ) | | | 1,002 | | | Income tax provision |
Net of tax | | | 11 | | | | (1,068 | ) | | | (16 | ) | | | (2,668 | ) | | |
| | | | | | | | | | | | | | | | | | |
Loss on interest rate swaps | | | 22 | | | | — | | | | 43 | | | | — | | | Interest expense |
Tax benefit | | | (8 | ) | | | — | | | | (15 | ) | | | — | | | Income tax provision |
Net of tax | | | 14 | | | | — | | | | 28 | | | | — | | | |
Total cash flow hedges | | | 25 | | | | (1,068 | ) | | | 12 | | | | (2,668 | ) | | |
Retirement plan obligations (Note 12) | | | | | | | | | | | | | | | | | | |
Amortization of deferred benefit pension plans | | | | | | | | | | | | | | | | | | |
Prior service costs | | | 12 | | | | 11 | | | | 24 | | | | 23 | | | Other, net |
Actuarial losses | | | 199 | | | | 161 | | | | 398 | | | | 321 | | | Other, net |
| | | 211 | | | | 172 | | | | 422 | | | | 344 | | | |
Tax benefit | | | (14 | ) | | | (23 | ) | | | (87 | ) | | | (47 | ) | | Income tax provision |
Net of tax | | | 197 | | | | 149 | | | | 335 | | | | 297 | | | |
Amortization of deferred benefit other plans | | | | | | | | | | | | | | | | | | |
Prior service costs | | | (59 | ) | | | (116 | ) | | | (117 | ) | | | (232 | ) | | Other, net |
Actuarial gains | | | 12 | | | | (208 | ) | | | 24 | | | | (417 | ) | | Other, net |
| | | (47 | ) | | | (324 | ) | | | (93 | ) | | | (649 | ) | | |
Tax expense | | | — | | | 76 | | | | — | | | 152 | | | Income tax provision |
Net of tax | | | (47 | ) | | | (248 | ) | | | (93 | ) | | | (497 | ) | | |
Total reclassifications, net of tax | | $ | 175 | | | $ | (1,167 | ) | | $ | 254 | | | $ | (2,868 | ) | | |
11.
| | | | | | | | | | | | | | | | | | | | | | | | | | | | | | | | |
| | | Three months ended June 30, | | Six months ended June 30, | | |
| In thousands | | 2022 | | 2021 | | 2022 | | 2021 | | |
| Description | | | | | | | | | | Line Item in Statements of Income |
| Cash flow hedges (Note 18) | | | | | | | | | | |
| Loss (gains) on cash flow hedges | | $ | (1,697) | | | $ | 33 | | | $ | (2,769) | | | $ | 57 | | | Costs of products sold |
| Tax expense (benefit) | | 480 | | | (22) | | | 792 | | | (73) | | | Income tax provision |
| Net of tax | | (1,217) | | | 11 | | | (1,977) | | | (16) | | | |
| | | | | | | | | | | |
| Loss (gains) on interest rate swaps | | (9) | | | 22 | | | 11 | | | 43 | | | Interest expense |
| Tax benefit | | — | | | (8) | | | — | | | (15) | | | Income tax provision |
| Net of tax | | (9) | | | 14 | | | 11 | | | 28 | | | |
| Total cash flow hedges | | (1,226) | | | 25 | | | (1,966) | | | 12 | | | |
| | | | | | | | | | |
| Retirement plan obligations (Note 11) | | | | | | | | | | |
| Amortization of deferred benefit pension plans | | | | | | | | | | |
| Prior service costs | | 11 | | | 12 | | | 22 | | | 24 | | | Other, net |
| Actuarial losses | | 164 | | | 199 | | | 331 | | | 398 | | | Other, net |
| | | 175 | | | 211 | | | 353 | | | 422 | | | |
| Tax benefit | | (49) | | | (14) | | | (101) | | | (87) | | | Income tax provision |
| Net of tax | | 126 | | | 197 | | | 252 | | | 335 | | | |
| Amortization of deferred benefit other plans | | | | | | | | | | |
| Prior service costs (credits) | | 26 | | | (59) | | | 52 | | | (117) | | | Other, net |
| Actuarial losses | | — | | | 12 | | | — | | | 24 | | | Other, net |
| | | 26 | | | (47) | | | 52 | | | (93) | | | |
| Tax expense | | — | | | — | | | — | | | — | | | Income tax provision |
| Net of tax | | 26 | | | (47) | | | 52 | | | (93) | | | |
| Total reclassifications, net of tax | | $ | (1,074) | | | $ | 175 | | | $ | (1,662) | | | $ | 254 | | | |
10.STOCK-BASED COMPENSATION COMPENSATIONThe
On May 5, 2022, upon Board and shareholder approval, the Glatfelter Corporation 2022 Long-Term Incentive Plan became effective and is a successor plan to the P. H. Glatfelter Amended and Restated Long-Term Incentive Plan
(the(collectively, the “LTIP”)
provides. The LTIP continues to provide for the issuance of Glatfelter common stock to eligible participants in the form of restricted stock units, restricted stock awards, non-qualified stock options, performance shares, incentive stock options and performance units.
Furthermore, the LTIP increases the number shares previously available for issuance by 1,400,000 shares. As of June 30, 2022, there were 2,670,523 shares of common stock available for future issuance under the LTIP.
Pursuant to terms of the LTIP, we have issued to eligible participants restricted stock units (“RSUs”), performance share awards (“PSAs”) and
stock onlystock-only stock appreciation rights.
- 13 -
GLATFELTER
Form 10-Q
In 2021,2022, we issued awards to employees of RSUs and PSAs under our LTIP. ApproximatelyIn 2022, 40% of fair value of the awards granted in 2021 were RSUs, which vest based on the passage of time, generally over a graded three-year period or, in certain instances, the RSUs were issued with five-yearcliff vesting.vesting after one or three years. In addition, some awards vest over one year or less depending upon the retirement eligibility of the grantees in the LTIP. The remaining 60% of the fair value of the awards granted in 20212022 were PSAs. The PSAs awarded in 20212022 vest based on either the achievement of a cumulative financial performance targettargets covering a two-year period followed by an additional one-year service period or based on the three-year total shareholder return relative to a broad market index. The performance measures include a minimum, target and maximum performance level providing the grantees an opportunity to receive more or less shares than targeted depending on actual financial performance. For RSUs, the grant date fair value of the awards, or the closing price per common share on the date of the award, is used to determine the amount of expense to be recognized over the applicable service period. For PSAs, the grant date fair value is estimated using a lattice model. The significant inputs include the stock price, volatility, dividend yield, and risk-free rate of return. Settlement of RSUs and PSAs will be made in shares of our common stock currently held in treasury. The following table summarizes RSU and PSA activity during periods indicated:
Units | | 2021 | | | | 2020 | |
Balance at January 1, | | | 1,071,652 | | | | | 896,463 | |
Granted | | | 352,763 | | | | | 369,975 | |
Forfeited | | | (98,012 | ) | | | | (81,046 | ) |
Shares delivered | | | (196,637 | ) | | | | (136,182 | ) |
Balance at June 30, | | | 1,129,766 | | | | | 1,049,210 | |
| | | | | | | | | | | |
| Units | 2022 | | 2021 |
| Balance at January 1, | 1,111,382 | | | 1,071,652 | |
| Granted | 718,668 | | | 352,763 | |
| Forfeited | (215,656) | | | (98,012) | |
| Shares delivered | (305,739) | | | (196,637) | |
| Balance at June 30, | 1,308,655 | | | 1,129,766 | |
The amount granted in
2022 and 2021
includes 341,429 and
2020 includes 162,480,
and 169,983, respectively, of PSAs exclusive of reinvested dividends.
The following table sets forth aggregate RSU and PSA compensation expense included in continuing operations for the periods indicated:
| | | June 30 | | | June 30, |
In thousands | | 2021 | | | 2020 | | In thousands | 2022 | | 2021 |
Three months ended | | $ | 1,329 | | | $ | 1,292 | | Three months ended | $ | 1,509 | | | $ | 1,329 | |
Six months ended | | | 2,537 | | | | 2,377 | | Six months ended | $ | 2,418 | | | $ | 2,537 | |
Stock Only
Stock-Only Stock Appreciation Rights (“SOSARs”) Under terms of the SOSAR, a recipient receives the right to a payment in the form of shares of common stock equal to the difference, if any, in the fair market value of one1 share of common stock at the time of exercising the SOSAR and the exercise price. TheAll SOSARs vest ratably over a three-year periodare vested and have a term of ten years. NaNNo SOSARs were awarded since 2016. The following table sets forth information related to outstanding
SOSARS:SOSARs: | | 2021 | | | 2020 | |
SOSARS | | Shares | | | | Wtd Avg Exercise Price | | | Shares | | | Wtd Avg Exercise Price | |
Outstanding at January 1, | | | 1,082,413 | | | | $ | 20.40 | | | | 1,291,947 | | | $ | 20.05 | |
Granted | | | — | | | | | — | | | | — | | | | — | |
Exercised | | | — | | | | | — | | | | (58,460 | ) | | | 12.85 | |
Canceled / forfeited | | | — | | | | | — | | | | (104,801 | ) | | | 21.57 | |
Outstanding at June 30, | | | 1,082,413 | | | | $ | 20.40 | | | | 1,128,686 | | | $ | 20.28 | |
| | | | | | | | | | | | | | | | | |
12.
| RETIREMENT PLANS AND OTHER POST-RETIREMENT BENEFITS
|
| | | | | | | | | | | | | | | | | | | | | | | |
| | 2022 | | 2021 |
| Shares | | Wtd Avg Exercise Price | | Shares | | Wtd Avg Exercise Price |
| Outstanding at January 1, | 1,079,113 | | | $ | 20.42 | | | 1,082,413 | | | $ | 20.40 | |
| Granted | — | | | — | | | — | | | — | |
| Exercised | — | | | — | | | — | | | — | |
| Canceled / forfeited | (145,440) | | | 15.61 | | | — | | | — | |
| Outstanding at June 30, | 933,673 | | | $ | 21.17 | | | 1,082,413 | | | $ | 20.40 | |
11.RETIREMENT PLANS AND OTHER POST-RETIREMENT BENEFITS
The following tables provide information with respect to the net periodic costs of our pension and post-retirement medical benefit plans included in continuing operations.
| | | Three months ended June 30 | | | Six months ended June 30 | | Three months ended June 30, | | Six months ended June 30, |
In thousands | | 2021 | | | 2020 | | | 2021 | | | 2020 | | | In thousands | 2022 | | 2021 | | 2022 | | 2021 |
Pension Benefits | | | | | | | | | | | | | | | | | | Pension Benefits | | | | | | | |
Service cost | | $ | — | | | $ | 48 | | | $ | — | | | $ | 92 | | | Service cost | $ | — | | | $ | — | | | $ | — | | | $ | — | |
Interest cost | | | 273 | | | | 300 | | | | 523 | | | | 601 | | | Interest cost | 179 | | | 273 | | | 414 | | | 523 | |
Amortization of prior service cost | | | 12 | | | | 11 | | | | 24 | | | | 23 | | | Amortization of prior service cost | 11 | | | 12 | | | 22 | | | 24 | |
Amortization of actuarial loss | | | 199 | | | | 161 | | | | 398 | | | | 321 | | | Amortization of actuarial loss | 164 | | | 199 | | | 331 | | | 398 | |
Total net periodic benefit expense | | $ | 484 | | | $ | 520 | | | $ | 945 | | | $ | 1,037 | | | Total net periodic benefit expense | $ | 354 | | | $ | 484 | | | $ | 767 | | | $ | 945 | |
| | | | | | | | | | | | | | | | | | | | | | | | | |
Other Benefits | | | | | | | | | | | | | | | | | | Other Benefits | |
Service cost | | $ | 7 | | | $ | 7 | | | $ | 14 | | | $ | 14 | | | Service cost | $ | — | | | $ | 7 | | | $ | — | | | $ | 14 | |
Interest cost | | | 32 | | | | 46 | | | | 64 | | | | 92 | | | Interest cost | 32 | | | 32 | | | 65 | | | 64 | |
Amortization of prior service credit | | | (59 | ) | | | (116 | ) | | | (117 | ) | | | (232 | ) | | |
| Amortization of prior service cost (credit) | | Amortization of prior service cost (credit) | 26 | | | (59) | | | 52 | | | (117) | |
Amortization of actuarial loss | | | 12 | | | | (208 | ) | | | 24 | | | | (417 | ) | | Amortization of actuarial loss | — | | | 12 | | | — | | | 24 | |
Total net periodic benefit income | | $ | (8 | ) | | $ | (271 | ) | | $ | (15 | ) | | $ | (543 | ) | | |
| Total net periodic benefit expense (income) | | Total net periodic benefit expense (income) | $ | 58 | | | $ | (8) | | | $ | 117 | | | $ | (15) | |
- 14 -
GLATFELTER
Form 10-Q
12.INCOME TAXES
Income taxes are recognized for the amount of taxes payable or refundable for the current year, and deferred tax liabilities and assets for the future tax consequences of events that have been recognized in our condensed consolidated financial statements or tax returns. The effects of income taxes are measured based on enacted tax laws and rates.
For the six months ended June 30,
20212022, we had pretax
loss from continuing operations of $124.2 million and income
tax benefit of
$21.1$13.5 million. The income tax benefit includes $19.2 million of deferred tax benefit associated with the asset impairment charge and related bad debt and inventory reserves (refer to Note 6). Absent these charges, the Company had pre-tax loss of $2.9 million and income tax expense of
$11.2 million. The effective income tax rate for the period ended June 30, 2021$5.7 million, which was unfavorably impacted
by the jurisdictional mix of pretax results among the Company and its subsidiaries, primarily by
$15.6 million inthe pretax losses in the U.S.
, which generated
0no tax
benefit, and a $2.1 million unfavorable impact attributable to income tax rate increases in Germany and the United Kingdom.benefit.
For the six months ended June 30,
2021,2022, we recorded
a decreasean increase in our
federal valuation allowance of
$0.6$4.5 million against our net deferred tax assets. In assessing the need for a valuation allowance, management considers all available positive and negative evidence in its analysis. Based on this analysis, we recorded a valuation allowance for the portion of deferred tax assets where the weight of the evidence indicated it is more likely than not that the deferred assets will not be realized.
As of June 30,
20212022 and December 31,
2020,2021, we had
$48.3$56.8 million and
$46.3$55.7 million, respectively, of gross unrecognized tax benefits. As of June 30,
2021,2022, if such benefits were to be recognized, approximately
$37.9$53.0 million would be recorded as a component of income tax expense, thereby affecting our effective tax rate.
We, or one of our subsidiaries, file income tax returns with the United States Internal Revenue Service, as well as various state and foreign authorities.
- 15 -
GLATFELTER
Form 10-Q
The following table summarizes, by major jurisdiction, tax years that remain subject to examination:
| Open Tax Years
|
Jurisdiction
| Examinations not
yet initiated
| | | Examinations in
progress
|
| | | | |
United States
| | | | |
Federal
| 2014 - 2015;
2017 - 2020
| | | N/A
|
State
| 2016 - 2020
| | | 2015 - 2018
|
Canada(1)
| 2013 - 2018; 2020
| | | 2019
|
Germany(1)
| 2020
| | | 2016 - 2019
|
France
| 2018 - 2020
| | | N/A
|
United Kingdom
| 2019 - 2020
| | | N/A
|
Philippines
| 2019 - 2020
| | | 2018
|
(1)
| includes provincial or similar local jurisdictions, as applicable
|
The amount of income taxes we pay is subject to ongoing audits by federal, state and foreign tax authorities, which often result in proposed assessments. Management performs a comprehensive review of its global tax positions on a
quarterly basis and accrues amounts for uncertain tax positions. Based on these reviews and the result of discussions and resolutions of matters with certain tax authorities and the closure of tax years subject to tax audit, reserves are adjusted as necessary. However, future results may include favorable or unfavorable adjustments to our estimated tax liabilities in the period the assessments are determined or resolved or as such statutes are closed. Due to potential for resolution of federal, state and foreign examinations, and the lapse of various statutes of limitation, it is reasonably possible our gross unrecognized tax benefits balance may decrease within the next twelve months by a range of 0zero to $6.4$1.7 million. Substantially all of this range relates to tax positions taken in the U.S.We recognize interest and penalties related to uncertain tax
positions as income tax expense. The following table summarizes information included in continuing operations related to interest on uncertain tax positions:
| | Six months ended June 30 | | | Six months ended June 30, |
In millions | 2021 | | | | 2020 | | In millions | 2022 | | 2021 |
Interest expense (income) | $ | 0.4 | | | | $ | 0.2 | | |
| Interest expense | | Interest expense | $ | 0.8 | | | $ | 0.4 | |
| June 30 | | | | December 31 | |
| 2021 | | | | 2020 | |
Accrued interest payable | $ | 2.2 | | | | $ | 1.8 | |
| | | | | | | | | | | |
| | June 30,
2022 | | December 31,
2021 |
| Accrued interest payable | $ | 4.7 | | | $ | 3.9 | |
| Accrued penalties | 3.0 | | | 3.0 | |
13.INVENTORIES
Inventories, net of reserves, were as follows:
| | June 30 | | | December 31 | | | | | | | | | | | |
In thousands | | 2021 | | | 2020 | | In thousands | June 30,
2022 | | December 31,
2021 |
Raw materials | | $ | 68,069 | | | $ | 55,466 | | Raw materials | $ | 100,129 | | | $ | 87,448 | |
In-process and finished | | | 105,064 | | | | 97,109 | | In-process and finished | 153,224 | | | 139,058 | |
Supplies | | | 47,073 | | | | 43,655 | | Supplies | 54,259 | | | 53,014 | |
Total | | $ | 220,206 | | | $ | 196,230 | | Total | $ | 307,612 | | | $ | 279,520 | |
- 16 -
GLATFELTER
Form 10-Q
15.
| GOODWILL AND OTHER INTANGIBLE ASSETS
|
14.GOODWILL AND OTHER INTANGIBLE ASSETS
The following table sets forth changes in the amounts of goodwill and other intangible assets recorded by each of our segments during the periods indicated:
| December 31 | | | | | | | | | | | | | | | June 30 | | |
In thousands | 2020 | | | Acquisitions | | | Amortization | | | Translation | | | 2021 | | |
Goodwill | | | | | | | | | | | | | | | | | | | | |
Composite Fibers | $ | 84,586 | | | $ | — | | | $ | — | | | $ | (2,436 | ) | | $ | 82,150 | | |
Airlaid Materials | | 79,783 | | | | 36,045 | | | | — | | | | (2,517 | ) | | | 113,311 | | |
Total | $ | 164,369 | | | $ | 36,045 | | | $ | — | | | $ | (4,953 | ) | | $ | 195,461 | | |
| | | | | | | | | | | | | | | | | | | | |
Other Intangible Assets | | | | | | | | | | | | | | | | | | | | |
Composite Fibers | | | | | | | | | | | | | | | | | | | | |
Tradename - non amortizing | $ | 3,902 | | | $ | — | | | $ | — | | | $ | (123 | ) | | $ | 3,779 | | |
| | | | | | | | | | | | | | | | | | | | |
Technology and related | | 41,578 | | | | — | | | | — | | | | (1,141 | ) | | | 40,437 | | |
Accumulated amortization | | (18,636 | ) | | | — | | | | (969 | ) | | | 432 | | | | (19,173 | ) | |
Net | | 22,942 | | | | — | | | | (969 | ) | | | (709 | ) | | | 21,264 | | |
| | | | | | | | | | | | | | | | | | | | |
Customer relationships and related | | 37,535 | | | | — | | | | — | | | | (1,111 | ) | | | 36,424 | | |
Accumulated amortization | | (21,290 | ) | | | — | | | | (1,262 | ) | | | 617 | | | | (21,935 | ) | |
Net | | 16,245 | | | | — | | | | (1,262 | ) | | | (494 | ) | | | 14,489 | | |
| | | | | | | | | | | | | | | | | | | | |
Airlaid Materials | | | | | | | | | | | | | | | | | | | | |
Tradename | | 3,960 | | | | — | | | | — | | | | (125 | ) | | | 3,835 | | |
Accumulated amortization | | (456 | ) | | | — | | | | (97 | ) | | | 16 | | | | (537 | ) | |
Net | | 3,504 | | | | — | | | | (97 | ) | | | (109 | ) | | | 3,298 | | |
| | | | | | | | | | | | | | | | | | | | |
Technology and related | | 20,053 | | | | — | | | | — | | | | (615 | ) | | | 19,438 | | |
Accumulated amortization | | (3,591 | ) | | | — | | | | (645 | ) | | | 113 | | | | (4,123 | ) | |
Net | | 16,462 | | | | — | | | | (645 | ) | | | (502 | ) | | | 15,315 | | |
| | | | | | | | | | | | | | | | | | | | |
Customer relationships and related | | 26,636 | | | | 20,000 | | | | — | | | | (840 | ) | | | 45,796 | | |
Accumulated amortization | | (7,856 | ) | | | — | | | | (1,326 | ) | | | 263 | | | | (8,919 | ) | |
net | | 18,780 | | | | 20,000 | | | | (1,326 | ) | | | (577 | ) | | | 36,877 | | |
| | | | | | | | | | | | | | | | | | | | |
Total intangibles | | 133,664 | | | | 20,000 | | | | — | | | | (3,955 | ) | | | 149,709 | | |
Total accumulated amortization | | (51,829 | ) | | | — | | | | (4,299 | ) | | | 1,441 | | | | (54,687 | ) | |
Net intangibles | $ | 81,835 | | | $ | 20,000 | | | $ | (4,299 | ) | | $ | (2,514 | ) | | $ | 95,022 | | |
- 17 -
As discussed in Note 3, “Acquisition”, we recorded $36.0 million of goodwill and $20.0 million of
identifiable intangible assets consisting of customer relationships
in connection with the May 13, 2021 Mount Holly acquisition.
| | | | | | | | | | | | | | | | | | | | | | | | | | | | | |
| In thousands | December 31,
2021 | | Impairment | | Purchase price allocation adjustment | | Translation | | June 30,
2022 |
| Goodwill | | | | | | | | | |
| Composite Fibers | $ | 78,438 | | | $ | (56,062) | | | $ | — | | | $ | (1,968) | | | $ | 20,408 | |
| Airlaid Materials | 109,486 | | | — | | | — | | | (6,105) | | | 103,381 | |
| Spunlace | 48,241 | | | — | | | (500) | | | (3,242) | | | 44,499 | |
| Total | $ | 236,165 | | | $ | (56,062) | | | $ | (500) | | | $ | (11,315) | | | $ | 168,288 | |
| Other Intangible Assets | December 31,
2021 | | Impairment | | Amortization | | Translation | | June 30,
2022 |
| Composite Fibers | | | | | | | | | |
| Tradename - non-amortizing | $ | 3,601 | | | $ | (3,530) | | | $ | — | | | $ | (71) | | | $ | — | |
| | | | | | | | | | |
| Technology and related | 38,614 | | | (37,823) | | | — | | | (791) | | | — | |
| Accumulated amortization | (19,224) | | | 19,380 | | | (424) | | | 268 | | | — | |
| Net | 19,390 | | | (18,443) | | | (424) | | | (523) | | | — | |
| | | | | | | | | | |
| Customer relationships and related | 34,739 | | | (34,046) | | | — | | | (693) | | | — | |
| Accumulated amortization | (22,104) | | | 22,351 | | | (587) | | | 340 | | | — | |
| Net | 12,635 | | | (11,695) | | | (587) | | | (353) | | | — | |
| | | | | | | | | | |
| Airlaid Materials | | | | | | | | | |
| Tradename | 4,485 | | | — | | | — | | | (1,133) | | | 3,352 | |
| Accumulated amortization | (603) | | | — | | | (88) | | | 63 | | | (628) | |
| Net | 3,882 | | | — | | | (88) | | | (1,070) | | | 2,724 | |
| | | | | | | | | | |
| Technology and related | 17,825 | | | — | | | — | | | (756) | | | 17,069 | |
| Accumulated amortization | (4,552) | | | — | | | (587) | | | 387 | | | (4,752) | |
| Net | 13,273 | | | — | | | (587) | | | (369) | | | 12,317 | |
| | | | | | | | | | |
| Customer relationships and related | 44,585 | | | | | — | | | (2,038) | | | 42,547 | |
| Accumulated amortization | (10,512) | | | — | | | (1,864) | | | 895 | | | (11,481) | |
| Net | 34,073 | | | — | | | (1,864) | | | (1,143) | | | 31,066 | |
| | | | | | | | | |
| Spunlace | | | | | | | | | |
| Products and Tradenames | 27,623 | | | | | — | | | (1,638) | | | 25,985 | |
| Accumulated amortization | (253) | | | — | | | (801) | | | 343 | | | (711) | |
| Net | 27,370 | | | — | | | (801) | | | (1,295) | | | 25,274 | |
| | | | | | | | | |
| Technology and related | 14,547 | | | | | — | | | (862) | | | 13,685 | |
| Accumulated amortization | (202) | | | — | | | (676) | | | 335 | | | (543) | |
| Net | 14,345 | | | — | | | (676) | | | (527) | | | 13,142 | |
| | | | | | | | | |
| Customer relationships and related | 28,003 | | | | | — | | | (1,660) | | | 26,343 | |
| Accumulated amortization | (268) | | | — | | | (846) | | | 344 | | | (770) | |
| Net | 27,735 | | | — | | | (846) | | | (1,316) | | | 25,573 | |
| | | | | | | | | |
| Total intangibles | 214,022 | | | (75,399) | | | — | | | (9,642) | | | 128,981 | |
| Total accumulated amortization | (57,718) | | | 41,731 | | | (5,873) | | | 2,975 | | | (18,885) | |
| Net intangibles | $ | 156,304 | | | $ | (33,668) | | | $ | (5,873) | | | $ | (6,667) | | | $ | 110,096 | |
15.LEASES
We enter into a variety of arrangements in which we are the lessee for the use of automobiles, forklifts and other production equipment, production facilities, warehouses, office space and land. We determine if an arrangement contains a lease at inception. All our lease arrangements are operating leases and are recorded in the condensed consolidated balance sheet under the caption “Other assets” and the lease obligation is under “Other current liabilities” and “Other long-term liabilities.” We do not have any finance leases.
Operating lease right of use (“ROU”) assets and operating lease liabilities are recognized based on the present value of the future minimum lease payments over the lease term at commencement date. ROU assets also include any initial direct costs incurred and any lease payments made at or before the lease commencement date, less lease incentives received. We use our incremental borrowing rate
- 17 -
GLATFELTER
Form 10-Q
based on information available at the commencement date in determining the lease liabilities as our leases generally do not provide an implicit rate. For purposes of recording the lease arrangement, the term of lease may include options to extend or terminate when we are reasonably certain that the option will be exercised. Lease expense is recognized on a straight-line basis over the lease term.
The following table sets forth information related to our leases as of the periods indicated.
| | June 30 | | | December 31 | | |
Dollars in thousands | | 2021 | | | 2020 | | |
Right of use asset | | $ | 24,865 | | | $ | 11,789 | | |
Weighted average discount rate | | | 3.37 | % | | | 2.94 | % | |
Weighted average remaining maturity (months) | | | 345 | | | | 66 | | |
| | | | | | | | | |
The following table sets forth operating lease expense for the periods indicated: |
| | June 30 | | |
In thousands | | 2021 | | | 2020 | | |
Three months ended | | $ | 1,452 | | | $ | 1,443 | | |
Six months ended | | | 2,799 | | | | 2,885 | | |
| | | | | | | | | | | |
| Dollars in thousands | June 30,
2022 | | December 31,
2021 |
| Right of use asset | $ | 26,275 | | $ | 27,186 |
| Weighted average discount rate | 2.97 | % | | 3.31 | % |
Weighted average remaining maturity (years) | 21.2 | | 26.0 |
The following table sets forth operating lease expense for the periods indicated:
| | | | | | | | | | | | | | |
| | | Six months ended June 30, |
| In thousands | | 2022 | | 2021 |
| Three months ended | | $ | 1,499 | | | $ | 1,452 | |
| Six months ended | | $ | 2,920 | | | $ | 2,799 | |
The following table sets forth required remaining future minimum lease payments forduring the years indicated: | In thousands | | | | | | | | In thousands | |
2021 | | | | $ | 2,595 | | | |
2022 | | | | | 4,299 | | | 2022 | $ | 2,988 | |
2023 | | | | | 2,868 | | | 2023 | 3,606 | |
2024 | | | | | 2,280 | | | 2024 | 2,742 | |
2025 | | | | | 1,962 | | | 2025 | 2,350 | |
| 2026 | | 2026 | 2,270 | |
Thereafter | | | | | 40,437 | | | Thereafter | 22,416 | |
In connection with the May 2021 Mount Holly acquisition, we assumed a long-term lease of the land on which the facility is situated. The lease obligation, including renewal options that are expected to be exercised, expires in
July 2077
, and a corresponding right of use asset totaled of $7.7 million at the time the acquisition was completed.- 19 -
On March 30, 2021, through Glatfelter Gernsbach GmbH, a wholly-owned subsidiary, we borrowed $11.7 million from Commerzbank AG, a German financial institution. The non-amortizing borrowing bears a fixed-interest rate of 0.75% per annum and the loan matures on March 29, 2022. The proceeds were used for general corporate purposes.
16.LONG-TERM DEBT
Long-term debt is summarized as follows:
| | June 30 | | | | December 31 | |
In thousands | | 2021 | | | | 2020 | |
Revolving credit facility, due Feb. 2024 | | $ | 213,478 | | | | $ | 36,813 | |
Term loan, due Feb. 2024 | | | 235,303 | | | | | 249,715 | |
2.40% Term Loan, due Jun. 2022 | | | 1,698 | | | | | 2,629 | |
2.05% Term Loan, due Mar. 2023 | | | 11,100 | | | | | 14,737 | |
1.30% Term Loan, due Jun. 2023 | | | 3,396 | | | | | 4,382 | |
1.55% Term Loan, due Sep. 2025 | | | 6,189 | | | | | 7,143 | |
Total long-term debt | | | 471,164 | | | | | 315,419 | |
Less current portion | | | (24,267 | ) | | | | (25,057 | ) |
Unamortized deferred issuance costs | | | (1,636 | ) | | | | (1,898 | ) |
Long-term debt, net of current portion | | $ | 445,261 | | | | $ | 288,464 | |
| | | | | | | | | | | |
| In thousands | June 30,
2022 | | December 31,
2021 |
| Revolving credit facility, due Sep 2026 | $ | 81,161 | | | $ | 10,000 | |
| 4.750% Senior Notes, due Oct 2029 | 500,000 | | | 500,000 | |
| Term loan, due Feb 2024 | 194,237 | | | 218,026 | |
| 2.40% Term Loan, due Jun 2022 | — | | | 809 | |
| 2.05% Term Loan, due Mar 2023 | 4,158 | | | 7,556 | |
| 1.30% Term Loan, due Jun 2023 | 1,484 | | | 2,427 | |
| 1.55% Term Loan, due Sep 2025 | 4,137 | | | 5,204 | |
| 1.10% Term Loan, due Mar 2024 | 6,610 | | | 9,267 | |
| 0.57% Term Loan, due Jul 2023 | 20,774 | | | 22,652 | |
| Total long-term debt | 812,561 | | | 775,941 | |
| Less current portion | (22,117) | | | (26,437) | |
| Unamortized deferred issuance costs | (11,418) | | | (11,429) | |
| Long-term debt, net of current portion | $ | 779,026 | | | $ | 738,075 | |
In connection with the Mount Holly acquisition, we borrowed $160.0 million under the Revolving Credit Facility.
- 18 -
GLATFELTER
Form 10-Q
On February 8, 2019,September 2, 2021, we entered into an amendeda restatement agreement as part of a Fourth Amended and restatedRestated $400 million Revolving Credit Facility and a €220€220.0 million Term Loan with a consortium of banks (together,(collectively, the “Credit Agreement”). which matures September 6, 2026 and February 8, 2024, respectively.
On May 9, 2022, we entered into an amendment to the Credit Agreement. The
proceedsamendment: i) increases the permitted maximum ratio of
consolidated total net debt to consolidated adjusted EBITDA (“leverage ratio”); ii) increases the
Term Loan due Feb. 2024 were used to redeem in its entirety the 5.375% Notes. The principal amount of the Term Loan amortizes in consecutive quarterly installments of principal, with each such quarterly installmentmaximum interest rate borrowing margin to be
in an amount equalapplied to
1.25% of the
Term Loan funded, commencing on July 1, 2019applicable index by 25 basis points; and
continuing quarterly thereafter.Foriii) pledges as collateral substantially all U.S. dollar denominated borrowingsdomestic assets to secure obligations owed under the Revolving Credit Facility,Agreement. As amended, we are obligated to maintain a maximum ratio of consolidated total net debt to consolidated adjusted EBITDA of 6.75 to 1.0 until the borrowing rate is, at our option, either, (a)quarter ended December 31, 2023, after which the bank’s base rate which is equal to the greater of i) the prime rate; ii) the federal funds rate plus 50 basis points; or iii) the Euro-rate plus 100 basis points plus an applicable spread over either i), ii) or iii) ranging from 12.5 basis points to 100 basis points based on the Company’smaximum leverage ratio and its corporate credit ratings determined by Standard & Poor’s Rating Services and Moody’s Investor Service, Inc. (the “Corporate Credit Rating”); or (b) the Euro-rate plus an applicable margin ranging from 112.5 basis pointssteps down to 200 basis points based on the Company’s leverage ratio and the Corporate Credit Rating. For non-US dollar denominated borrowings, the borrowing rate is, at our option, based on (b) above or for Euro denominated borrowings, the Euro Interbank Offering Rate (“EURIBOR”) plus an applicable margin ranging from 112.5 basis points4.0 to 200 basis points based on the Company’s leverage ratio and the Corporate Credit Rating.
1.0.
The Credit Agreement also contains covenants requiring a number of customary covenants for financings of this type that,minimum interest coverage ratio and provisions limiting our ability to, among other things, restrict our ability to dispose of(i) incur debt and guaranty obligations, (ii) incur liens, (iii) make loans, advances, investments and acquisitions, (iv) merge or create liens onliquidate, (v) sell or transfer assets, (vi) incur additional indebtedness repay other indebtedness, limits certain intercompany financing arrangements, make acquisitions and engage in mergers or consolidations. We are also required to comply with specified financial tests and ratios including: i) maximum net debt to EBITDA ratio (the “leverage ratio”); and ii) a consolidated EBITDA to interest expense ratio. The most restrictive of our covenants is a maximum leverage ratio of 4.0x provided that such ratio increases to 4.5x during the period of four fiscal quarters immediately following a material acquisition.
As of June 30, 2021,2022, the leverage ratio as calculated in accordance with the definition in our Credit Agreement was 3.0x. 5.3x. A breach of these requirements would give rise to certain remedies under the Revolving Credit Facility,Agreement, among which are the termination of the agreement and acceleratedthe repayment of the outstanding borrowings plus accrued and unpaid interest under the Credit Agreement.All remaining principal outstanding and accrued interest under the Credit Agreement will be due and payable on February 8, 2024.
Glatfelter Gernsbach GmbH (“Gernsbach”), a wholly-owned subsidiary of ours, entered into a series of borrowing agreements with IKB Deutsche Industriebank AG, Düsseldorf (“IKB”) as summarized below:
Amounts in thousands | | Original Principal | | | | Interest Rate | | | | Maturity |
Borrowing date | | | | | | | | | | | | |
Apr. 11, 2013 | | € | 42,700 | | | | | 2.05 | % | | | Mar. 2023 |
Sep. 4, 2014 | | | 10,000 | | | | | 2.40 | % | | | Jun. 2022 |
Oct. 10, 2015 | | | 2,608 | | | | | 1.55 | % | | | Sep. 2025 |
Apr. 26, 2016 | | | 10,000 | | | | | 1.30 | % | | | Jun. 2023 |
May 4, 2016 | | | 7,195 | | | | | 1.55 | % | | | Sep. 2025 |
Each of the borrowings require quarterly repayments of principal and interest and provide for representations, warranties and covenants customary for financings of these types. The financial covenants contained in each of the IKB loans, which relate to the minimum ratio of consolidated EBITDA to consolidated interest expense and the maximum ratio of consolidated total net debt to consolidated adjusted EBITDA, are calculated by reference to our Credit Agreement.
Glatfelter Corporation guarantees all debt obligations of its subsidiaries. All such obligations are recorded in these condensed consolidated financial statements.
Letters of credit issued to us by certain financial institutions totaled
$7.0 million and $7.3$6.7 million as of June 30,
20212022 and December 31,
2020, respectively.2021. The letters of credit, which reduce amounts available under our Revolving Credit Facility, primarily provide financial assurances for the benefit of certain state workers compensation insurance agencies in conjunction with our self-insurance program and for performance of certain remediation activity related to the Fox River matter. We bear the credit risk on this amount to the extent that we do not comply with the provisions of certain agreements.
NaNNo amounts are outstanding under the letters of credit.
-
1920 -
GLATFELTER
Form 10-Q
19.
| FAIR VALUE OF FINANCIAL INSTRUMENTS
|
17.FAIR VALUE OF FINANCIAL INSTRUMENTS
The amounts reported on the condensed consolidated balance sheets for cash and cash equivalents, accounts receivable, accounts payable and short-term debt approximate their respective fair value. The following table sets forth carrying value and fair value of long-term debt:
| June 30, 2021 | | | | December 31, 2020 | |
In thousands | Carrying Value | | | Fair Value | | | | Carrying Value | | | Fair Value | |
Variable rate debt | $ | 213,478 | | | $ | 213,478 | | | | $ | 36,813 | | | $ | 36,813 | |
Term loan, due Feb. 2024 | | 235,303 | | | | 235,303 | | | | | 249,715 | | | | 249,715 | |
2.40% Term Loan | | 1,698 | | | | 1,713 | | | | | 2,629 | | | | 2,651 | |
2.05% Term Loan | | 11,100 | | | | 11,216 | | | | | 14,737 | | | | 14,873 | |
1.30% Term Loan | | 3,396 | | | | 3,407 | | | | | 4,382 | | | | 4,384 | |
1.55% Term Loan | | 6,189 | | | | 6,253 | | | | | 7,143 | | | | 7,210 | |
Total | $ | 471,164 | | | $ | 471,370 | | | | $ | 315,419 | | | $ | 315,646 | |
| | | | | | | | | | | | | | | | | | | | | | | |
| | June 30, 2022 | | December 31, 2021 |
| In thousands | Carrying Value | | Fair Value | | Carrying Value | | Fair Value |
| Variable rate debt | $ | 81,161 | | | $ | 81,161 | | | $ | 10,000 | | | $ | 10,000 | |
| 4.750% Senior Notes, due Oct. 2029 | 500,000 | | | 348,750 | | | 500,000 | | | 516,875 | |
| Term loan, due Feb. 2024 | 194,237 | | | 194,237 | | | 218,026 | | | 218,026 | |
| 2.40% Term Loan | — | | | — | | | 809 | | | 813 | |
| 2.05% Term Loan | 4,158 | | | 4,162 | | | 7,556 | | | 7,616 | |
| 1.30% Term Loan | 1,484 | | | 1,477 | | | 2,427 | | | 2,433 | |
| 1.55% Term Loan | 4,137 | | | 4,047 | | | 5,204 | | | 5,234 | |
| 1.10% Term Loan | 6,610 | | | 6,514 | | | 9,267 | | | 9,252 | |
| 0.57% Term Loan | 20,774 | | | 20,484 | | | 22,652 | | | 22,657 | |
| Total | $ | 812,561 | | | $ | 660,832 | | | $ | 775,941 | | | $ | 792,906 | |
The values set forth above are based on observable inputs and other relevant market data (Level 2). The fair value of financial derivatives is set forth below in Note 20.18. 20.
| FINANCIAL DERIVATIVES AND HEDGING ACTIVITIES
|
18.FINANCIAL DERIVATIVES AND HEDGING ACTIVITIES
As part of our overall risk management practices, we enter into financial derivatives primarily designed to either i) hedge foreign currency risks associated with forecasted transactions (“cash flow hedges”); ii) mitigate the impact that changes in currency exchange rates have on intercompany financing transactions and foreign currency denominated receivables and payables (“foreign currency hedges”); or iii) convert variable-interest-rate debt to fixed rates.
Derivatives Designated as Hedging Instruments - Cash Flow Hedges We use currency forward contracts as cash flow hedges to manage our exposure to fluctuations in the currency exchange rates on certain forecasted production costs. Currency forward contracts involve fixing the exchange for delivery of a specified amount of foreign currency on a specified date. As of June 30, 2021,2022, the maturity of currency forward contracts ranged from one month to 18 months. We designate certain currency forward contracts as cash flow hedges of forecasted raw material purchases, certain production costs or capital expenditures with exposure to changes in foreign currency exchange rates. Changes in the fair value of derivatives designated and that qualify as cash flow hedges of foreign exchange risk is deferred as a component of accumulated other comprehensive income in the accompanying condensed consolidated balance sheets. With respect to hedges of forecasted raw material purchases or production costs, the amount deferred is subsequently reclassified into costs of products sold in the period that, inventory produced using the hedged transaction, affects earnings. For hedged capital expenditures, deferred gains or losses are reclassified and included in the historical cost of the capital asset and subsequently affect earnings as depreciation is recognized.
We had the following outstanding derivatives that were used to hedge foreign exchange risks associated with forecasted transactions and designated as hedging instruments:
In thousands | | June 30, 2021 | | | December 31, 2020 | |
Derivative | | | | | | | | |
Sell/Buy - sell notional | | | | | | | | |
Philippine Peso / Euro | | | 53,075 | | | | 18,522 | |
Euro / British Pound | | | 18,653 | | | | 18,638 | |
U.S. Dollar / British Pound | | | 11,634 | | | | — | |
U.S. Dollar / Euro | | | 658 | | | | 1,041 | |
Canadian Dollar / U.S. Dollar | | | — | | | | 70 | |
| | | | | | | | |
Sell/Buy - buy notional | | | | | | | | |
Euro / Philippine Peso | | | 924,747 | | | | 853,686 | |
British Pound / Philippine Peso | | | 1,096,306 | | | | 1,081,791 | |
Euro / U.S. Dollar | | | 88,426 | | | | 69,324 | |
U.S. Dollar / Canadian Dollar | | | 34,749 | | | | 34,847 | |
- 20 -
GLATFELTER
Form 10-Q
In October 2019,
| | | | | | | | | | | |
| In thousands | June 30, 2022 | | December 31, 2021 |
| Derivative | | | |
| Sell/Buy - sell notional | | | |
| Euro / British Pound | 22,083 | | 18,823 |
| | | |
| U.S. Dollar / British Pound | 27,221 | | 16,205 |
| U.S. Dollar / Euro | 3,402 | | 658 |
| | | |
| | | | |
| Sell/Buy - buy notional | | | |
| Euro / Philippine Peso | 965,540 | | 896,291 |
| British Pound / Philippine Peso | 1,303,213 | | 1,121,183 |
| Euro / U.S. Dollar | 107,614 | | 108,467 |
| U.S. Dollar / Canadian Dollar | 36,493 | | 36,904 |
| | | |
On June 15, 2022, we
entered intoterminated a €180 million notional value floating-to-fixed interest rate swap agreement with certain financial
institutions. Underinstitutions that was entered into in October 2019 and was to mature in December 2022. During the
termslife of the swap, we
will paypaid a fixed interest rate of the applicable margin plus 0.0395% on €180 million of the underlying variable rate term loan. We
will receivereceived the greater of 0.00% or EURIBOR.
At termination, we recognized a deferred gain of $0.4 million that will be amortized into interest expense through December 2022.
Derivatives Designated as Hedging Instruments – Net Investment Hedge The €220 million Term Loan discussed in Note 1816 – “Long-Term Debt” is designated as a net investment hedge of our Euro functional currency foreign subsidiaries. During the first six months of 2022 and 2021, we recognized a pre-tax gain of $15.7 million and $7.8 million, and in the same period of 2020 a pre-tax gain of $0.8 millionrespectively, on the remeasurement of the term loan from changes in currency exchange rates. Such amounts are recorded as a component of Other Comprehensive Income (Loss). On March 3, 2022, we entered into cross-currency swaps with an aggregate notional value of $150.0 million. Pursuant to the terms of the swaps, we agreed to receive 4.750% interest denominated in U.S. dollars and we agreed to pay 3.06% interest denominated in euros. Interest is paid semi-annually on May 15 and November 15 and the swaps mature on May 15, 2025. We designated the cross-currency swaps as a hedge of our net investment in certain euro functional currency subsidiaries.
Derivatives Not Designated as Hedging Instruments - Foreign Currency Hedges We also entered into forward foreign exchange contracts to mitigate the impact changes in currency exchange rates have on balance sheet monetary assets and liabilities. None of these contracts are designated as hedges for financial accounting purposes and, accordingly, changes in value of the foreign exchange forward contracts and in the offsetting underlying on-balance-sheet transactions are reflected in the accompanying condensed consolidated statements of income under the caption “Other, net.” The following sets forth derivatives used to mitigate the impact changes in currency exchange rates have on balance sheet monetary assets and liabilities:
In thousands | | June 30, 2021 | | | December 31, 2020 | |
Derivative | | | | | | | | |
Sell/Buy - sell notional | | | | | | | | |
U.S. Dollar / British Pound | | | 22,300 | | | | 25,250 | |
Euro / British Pound | | | — | | | | 600 | |
British Pound / Euro | | | 1,650 | | | | 1,900 | |
| | | | | | | | |
Sell/Buy - buy notional | | | | | | | | |
Euro / U.S. Dollar | | | 5,500 | | | | 7,500 | |
| | | | | | | | | | | |
| In thousands | June 30, 2022 | | December 31, 2021 |
| Derivative | | | |
| Sell/Buy - sell notional | | | |
| U.S. Dollar / British Pound | 29,450 | | 26,600 |
| | | |
| British Pound / Euro | 2,800 | | 3,400 |
| U.S. Dollar / Swiss Franc | 7,960 | | 2,180 |
| British Pound / Swiss Franc | 2,290 | | 1,025 |
| Euro / Swiss Franc | 6,520 | | 2,750 |
| Euro / U.S. Dollar | 6,400 | | 11,000 |
| | | |
| Sell/Buy - buy notional | | | |
| Euro / U.S. Dollar | 2,700 | | 20,900 |
| British Pound / Euro | 15,300 | | 5,300 |
These contracts have maturities of one month from the date originally entered into.
Fair Value Measurements The following table summarizes the fair values of derivative instruments for the period indicated and the line items in the accompanying condensed consolidated balance sheets where the instruments are recorded: In thousands | | June 30, 2021 | | | December 31, 2020 | | | June 30, 2021 | | | December 31, 2020 | |
| | Prepaid Expenses and Other | | | Other | |
Balance sheet caption | | Current Assets | | | Current Liabilities | |
Designated as hedging: | | | | | | | | | | | | | | | | |
Forward foreign currency exchange contracts | | $ | 1,440 | | | $ | 577 | | | $ | 428 | | | $ | 4,342 | |
Interest rate swap | | | — | | | | — | | | | 108 | | | | 136 | |
| | | | | | | | | | | | | | | | |
Not designated as hedging: | | | | | | | | | | | | | | | | |
Forward foreign currency exchange contracts | | $ | 118 | | | $ | 456 | | | $ | 452 | | | $ | 118 | |
| | | | | | | | | | | | | | | | | | | | | | | |
| In thousands | June 30, 2022 | | December 31, 2021 | | June 30, 2022 | | December 31, 2021 |
| Balance sheet caption | Prepaid Expenses and Other
Current Assets | | Other
Current Liabilities |
| Designated as hedging: | | | | | | | |
| Forward foreign currency exchange contracts | $ | 7,151 | | | $ | 3,197 | | | $ | 2,037 | | | $ | 288 | |
| Interest rate swap | — | | | — | | | — | | | 44 | |
| | | | | | | | |
| Not designated as hedging: | | | | | | | |
| Forward foreign currency exchange contracts | $ | 822 | | | 701 | | | $ | 1,124 | | | $ | 116 | |
The amounts set forth in the table above represent the net asset or liability giving effect to rights of offset with each counterparty. The effect of netting the amounts presented above did not have a material effect on our consolidated financial position.
- 21 -
GLATFELTER
Form 10-Q
The fair value hierarchy consists of three broad levels, which gives the highest priority to unadjusted quoted prices in active markets for identical assets or liabilities (Level 1) and the lowest priority to unobservable inputs (Level 3). The fair values of the foreign exchange forward contracts are considered to be Level 2. Foreign currency forward contracts are valued using foreign currency forward and interest rate curves. The fair value of each contract is determined by comparing the contract rate to the forward rate and discounting to present value. Contracts in a gain position are recorded in the condensed consolidated balance sheets under the caption “Prepaid expenses and other current assets” and the value of contracts in a loss position is recorded under the caption “Other current liabilities.”
The following table summarizes the amount of income or (loss) from derivative instruments recognized in our results of operations for the periods indicated and the line items in the accompanying condensed consolidated statements of income where the results are recorded:
| | | | Three months ended June 30 | | | Six months ended June 30 | |
In thousands | | | | 2021 | | | 2020 | | | 2021 | | | 2020 | |
Designated as hedging: | | | | | | | | | | | | | | | | | | |
Forward foreign currency exchange contracts: | | | | | | | | | | | | | | | | | | |
Cost of products sold | | | | $ | (33 | ) | | $ | 1,488 | | | $ | (57 | ) | | $ | 3,670 | |
Interest expense | | | | | 22 | | | | — | | | | 43 | | | | — | |
| | | | | | | | | | | | | | | | | | |
Not designated as hedging: | | | | | | | | | | | | | | | | | | |
Forward foreign currency exchange contracts: | | | | | | | | | | | | | | | | | | |
Other – net | | | | $ | 433 | | | $ | 92 | | | $ | 703 | | | $ | (527 | ) |
| | | | | | | | | | | | | | | | | | | | | | | |
| | Three months ended June 30, | | Six months ended June 30, |
| In thousands | 2022 | | 2021 | | 2022 | | 2021 |
| Designated as hedging: | | | | | | | |
| Forward foreign currency exchange contracts: | | | | | | | |
| Cost of products sold | $ | (1,697) | | | $ | (33) | | | $ | (2,769) | | | $ | (57) | |
| Interest expense | (9) | | | 22 | | | 11 | | | 43 | |
| | | | | | | | |
| Not designated as hedging: | | | | | | | |
| Forward foreign currency exchange contracts: | | | | | | | |
| Other – net | $ | 1,289 | | | $ | 433 | | | $ | 1,729 | | | $ | 703 | |
The impact of activity not designated as hedging was substantially all offset by the remeasurement of the underlying on-balance-sheet item.
A rollforward of fair value amounts recorded as a component of accumulated other comprehensive income (loss), before taxes, is as follows:
In thousands | | 2021 | | | 2020 | |
Balance at January 1, | | $ | (3,460 | ) | | $ | 5,859 | |
Deferred gains on cash flow hedges | | | 4,117 | | | | 1,103 | |
Reclassified to earnings | | | 14 | | | | (3,670 | ) |
Balance at June 30, | | $ | 671 | | | $ | 3,292 | |
| | | | | | | | | | | |
| In thousands | 2022 | | 2021 |
| Balance at January 1, | $ | 2,889 | | | $ | (3,460) | |
| Deferred gains on cash flow hedges | 6,565 | | | 4,117 | |
| Reclassified to earnings | (2,758) | | | 14 | |
| Balance at June 30, | $ | 6,696 | | | $ | 671 | |
We expect substantially all of the amounts recorded as a component of accumulated other comprehensive income will be recorded in results of operations within the next 12 to 18 months and the amount ultimately recognized will vary depending on actual market rates.
Credit risk related to derivative activity arises in the event the counterparty fails to meet its obligations to us. This exposure is generally limited to the amounts, if any, by which the counterparty’s obligations exceed our obligation to them. Our policy is to enter into contracts only with financial institutions which meet certain minimum credit ratings.
- 22 -
GLATFELTER
Form 10-Q
21.
| COMMITMENTS, CONTINGENCIES AND LEGAL PROCEEDINGS
|
19.COMMITMENTS, CONTINGENCIES AND LEGAL PROCEEDINGS
Fox River - Neenah, Wisconsin
Background We have previously reported that we face liabilities associated with environmental claims arising out of the presence of polychlorinated biphenyls (“PCBs”) in sediments in the lower Fox River, on which our former Neenah facility was located, and in the Bay of Green Bay, Wisconsin (collectively, the “Site”). Since the early 1990s, the United States, the State of Wisconsin and two Indian tribes (collectively, the “Governments”) have pursued a cleanup of a 39-mile stretch of river from Little Lake Butte des Morts into Green Bay and natural resource damages (“NRDs”). The United States originally notified several entities that they were potentially responsible parties (“PRPs”); however, after giving effect to settlements reached with the Governments, the remaining PRPs exposed to continuing obligations to implement the remainder of the cleanup consist of us, Georgia-Pacific Consumer Products, L.P. (“Georgia-Pacific”) and NCR Corporation. The United States Environmental Protection Agency (“EPA”) has divided the Site into 5 “operable units”, including the most upstream portion of the Site on which our facility was located (“OU1”) and four downstream reaches of the river and bay (“OU2-5”). Over the past several years, we and certain other PRPs completed all remedial actions pursuant to applicable consent decrees or a Unilateral Administrative Order. In January 2019, we reached an agreement with the United States, the State of Wisconsin, and Georgia-Pacific to resolve all remaining claims among those parties. Under the Glatfelter consent decree, we are primarily responsible for long-term monitoring and maintenance in OU2-OU4a and for reimbursement of government oversight costs paid after October 2018. Finally, we remain responsible for our obligation to continue long-term monitoring and maintenance under our OU1 consent decree.
Cost estimates Our remaining obligations under the OU1 consent decree consist of long-term monitoring and maintenance. Furthermore, we are primarily responsible for long-term monitoring and maintenance in OU2-OU4a over a period of at least 30 years. The monitoring activities consist of, among others, testing fish tissue, sampling water quality and sediment, and inspections of the engineered caps. In 2018, we entered into a fixed-price, 30-year agreement with a third party for the performance of all of our monitoring and maintenance obligations in OU1 through OU4a with limited
exceptions, such as, for extraordinary amounts of cap maintenance or replacement. Our obligation under this agreement is included in our total reserve for the Site. We are obligated to make the regular payments under that fixed-price contract until the remaining amount due is less than the OU1 escrow account balance. We are permitted to pay for this contract using the remaining balance of the escrow account established by us and WTM I Company (“WTM I”) another PRP, under the OU1 consent decree during any period that the balance in the escrow account exceeds the amount due under our fixed-price contract. As of June 30, 2021,2022, the balance in the escrow is less than amounts due under the fixed-price contract by approximately $1.6$1.3 million. Our obligation to pay this difference is secured by a letter of credit. At June 30,
2021,2022, the escrow account balance totaled
$8.9$8.7 million which is included in the condensed consolidated balance sheet under the caption “Other assets.”
Under the consent decree, we are responsible for reimbursement of government oversight costs paid from October 2018 and later over approximately the next 30 years. We anticipate that oversight costs will decline as activities at the site
transitionhave transitioned from remediation to long-term monitoring and maintenance.
Reserves for the Site Our reserve for past and future government oversight costs and long-term monitoring and maintenance is set forth below: | | Six months ended June 30 | |
In thousands | | | 2021 | | | | | 2020 | |
Balance at January 1, | | $ | 18,455 | | | | $ | 21,870 | |
Payments | | | (886 | ) | | | | (2,234 | ) |
Accretion | | | 101 | | | | 104 | |
Balance at June 30, | | $ | 17,670 | | | | $ | 19,740 | |
The payments set forth above represent amounts due under the long-term monitoring and maintenance agreement. With respect to our total reserve for the Fox River, $3.2totaled $14.8 million at June 30, 2022, of which $2.2 million is recorded in the accompanying June 30, 20212022 condensed consolidated balance sheet under the caption “Environmental liabilities” and the remaining $14.5$12.6 million is recorded under the caption “Other long-term liabilities.”
Range of Reasonably Possible Outcomes Based on our analysis of all available information, including but not limited to decisions of the courts, official documents such as records of decision, discussions with legal counsel, cost estimates for future monitoring and maintenance and other post-remediation costs to be performed at the Site, we do not believe that our costs associated with the Fox River matter could exceed the aggregate amounts accrued by a material amount. -
2325 -
GLATFELTER
Form 10-Q
20.SEGMENT INFORMATION
The following tables set forth financial and other information by segment for the period indicated:
Three months ended June 30 | | | | | | | Other and | | | | |
Dollars in thousands | Composite Fibers | | | Airlaid Materials | | | Unallocated | | | Total | |
| 2021 | | | 2020 | | | 2021 | | | 2020 | | | 2021 | | | 2020 | | | 2021 | | | 2020 | |
Net sales | $ | 141,598 | | | $ | 122,137 | | | $ | 103,313 | | | $ | 94,046 | | | $ | — | | | $ | — | | | $ | 244,911 | | | $ | 216,183 | |
Cost of products sold | | 119,334 | | | | 100,387 | | | | 90,138 | | | | 77,581 | | | | (115 | ) | | | 6,152 | | | | 209,357 | | | | 184,120 | |
Gross profit (loss) | | 22,264 | | | | 21,750 | | | | 13,175 | | | | 16,465 | | | | 115 | | | | (6,152 | ) | | | 35,554 | | | | 32,063 | |
SG&A | | 11,201 | | | | 10,263 | | | | 4,744 | | | | 4,173 | | | | 13,039 | | | | 9,115 | | | | 28,984 | | | | 23,551 | |
Gains on dispositions of plant, equipment and timberlands, net | | — | | | | — | | | | — | | | | — | | | | (1,553 | ) | | | (597 | ) | | | (1,553 | ) | | | (597 | ) |
Total operating income (loss) | | 11,063 | | | | 11,487 | | | | 8,431 | | | | 12,292 | | | | (11,371 | ) | | | (14,670 | ) | | | 8,123 | | | | 9,109 | |
Non-operating expense | | — | | | | — | | | | — | | | | — | | | | (2,610 | ) | | | (8,837 | ) | | | (2,610 | ) | | | (8,837 | ) |
Income (loss) before income taxes | $ | 11,063 | | | $ | 11,487 | | | $ | 8,431 | | | $ | 12,292 | | | $ | (13,981 | ) | | $ | (23,507 | ) | | $ | 5,513 | | | $ | 272 | |
Supplementary Data | | | | | | | | | | | | | | | | | | | | | | | | | | | | | | | |
Net tons sold | | 34,471 | | | | 29,032 | | | | 34,315 | | | | 33,277 | | | | — | | | | — | | | | 68,786 | | | | 62,309 | |
Depreciation, depletion and amortization ($ in thousands) (1) | $ | 7,000 | | | $ | 6,431 | | | $ | 6,767 | | | $ | 5,473 | | | $ | 966 | | | $ | 2,302 | | | $ | 14,733 | | | $ | 14,206 | |
Capital expenditures | | 2,882 | | | | 2,105 | | | | 1,297 | | | | 1,712 | | | | 1,653 | | | | 1,180 | | | | 5,832 | | | | 4,997 | |
Six months ended June 30 | | | | | | | Other and | | | | |
Dollars in thousands | Composite Fibers | | | Airlaid Materials | | | Unallocated | | | Total | |
| 2021 | | | 2020 | | | 2021 | | | 2020 | | | 2021 | | | 2020 | | | 2021 | | | 2020 | |
Net sales | $ | 282,847 | | | $ | 254,848 | | | $ | 187,738 | | | $ | 192,895 | | | $ | — | | | $ | — | | | $ | 470,585 | | | $ | 447,743 | |
Cost of products sold | | 233,601 | | | | 207,372 | | | | 162,723 | | | | 159,827 | | | | (589 | ) | | | 11,679 | | | | 395,735 | | | | 378,878 | |
Gross profit (loss) | | 49,246 | | | | 47,476 | | | | 25,015 | | | | 33,068 | | | | 589 | | | | (11,679 | ) | | | 74,850 | | | | 68,865 | |
SG&A | | 22,118 | | | | 20,887 | | | | 9,387 | | | | 8,754 | | | | 20,306 | | | | 18,431 | | | | 51,811 | | | | 48,072 | |
Gains on dispositions of plant, equipment and timberlands, net | | — | | | | — | | | | — | | | | — | | | | (2,403 | ) | | | (597 | ) | | | (2,403 | ) | | | (597 | ) |
Total operating income (loss) | | 27,128 | | | | 26,589 | | | | 15,628 | | | | 24,314 | | | | (17,314 | ) | | | (29,513 | ) | | | 25,442 | | | | 21,390 | |
Non-operating expense | | — | | | | — | | | | — | | | | — | | | | (4,345 | ) | | | (11,104 | ) | | | (4,345 | ) | | | (11,104 | ) |
Income (loss) before income taxes | $ | 27,128 | | | $ | 26,589 | | | $ | 15,628 | | | $ | 24,314 | | | $ | (21,659 | ) | | $ | (40,617 | ) | | $ | 21,097 | | | $ | 10,286 | |
Supplementary Data | | | | | | | | | | | | | | | | | | | | | | | | | | | | | | | |
Net tons sold | | 68,611 | | | | 65,015 | | | | 63,179 | | | | 68,316 | | | | — | | | | — | | | | 131,790 | | | | 133,331 | |
Depreciation, depletion and amortization ($ in thousands) (1) | $ | 13,981 | | | $ | 12,897 | | | $ | 12,615 | | | $ | 10,924 | | | $ | 1,870 | | | $ | 5,787 | | | $ | 28,466 | | | $ | 29,608 | |
Capital expenditures | | 5,655 | | | | 6,061 | | | | 3,036 | | | | 3,815 | | | | 2,520 | | | | 2,135 | | | | 11,211 | | | | 12,011 | |
| | | | | | | | | | | | | | | | | | | | | | | |
| Three months ended June 30, | | Six months ended June 30, |
| Dollars in thousands | 2022 | | 2021 | | 2022 | | 2021 |
| Net Sales | | | | | | | |
| Composite Fibers | $ | 123,338 | | | $ | 141,598 | | | $ | 259,167 | | | $ | 282,847 | |
| Airlaid Material | 143,708 | | | 103,313 | | | 293,172 | | | 187,738 | |
| Spunlace | 96,917 | | | — | | | 193,304 | | | — | |
| Total | $ | 363,963 | | | $ | 244,911 | | | $ | 745,643 | | | $ | 470,585 | |
| | | | | | | |
| Operating income (loss) | | | | | | | |
| Composite Fibers | $ | 5,779 | | | $ | 11,063 | | | $ | 5,444 | | | $ | 27,128 | |
| Airlaid Material | 11,944 | | | 8,431 | | | 24,165 | | | 15,628 | |
| Spunlace | (1,808) | | | — | | | (3,380) | | | — | |
| Other and unallocated | (6,991) | | | (11,371) | | | (133,194) | | | (17,314) | |
| Total | $ | 8,924 | | | $ | 8,123 | | | $ | (106,965) | | | $ | 25,442 | |
| | | | | | | |
| Depreciation and amortization | | | | | | | |
| Composite Fibers | $ | 4,796 | | | $ | 7,000 | | | $ | 11,315 | | | $ | 13,981 | |
| Airlaid Material | 7,542 | | | 6,767 | | | 15,171 | | | 12,615 | |
| Spunlace | 2,945 | | | — | | | 5,859 | | | — | |
| Other and unallocated | 1,169 | | | 966 | | | 2,591 | | | 1,870 | |
| Total | $ | 16,452 | | | $ | 14,733 | | | $ | 34,936 | | | $ | 28,466 | |
| | | | | | | |
| Capital expenditures | | | | | | | |
| Composite Fibers | $ | 4,131 | | | $ | 2,882 | | | $ | 10,258 | | | $ | 5,655 | |
| Airlaid Material | 2,064 | | | 1,297 | | | 5,532 | | | 3,036 | |
| Spunlace | 1,801 | | | — | | | 3,886 | | | — | |
| Other and unallocated | 2,353 | | | 1,653 | | | 3,021 | | | 2,520 | |
| Total | 10,349 | | | 5,832 | | | $ | 22,697 | | | $ | 11,211 | |
| | | | | | | |
| Tons shipped (metric) | | | | | | | |
| Composite Fibers | 24,246 | | | 34,471 | | | 52,457 | | | 68,611 | |
| Airlaid Material | 40,681 | | | 34,315 | | | 83,733 | | | 63,179 | |
| Spunlace | 19,358 | | | — | | | 40,094 | | | — | |
| | | | | | | |
| Total | 84,285 | | | 68,786 | | | 176,284 | | | 131,790 | |
| (1)Segments
| The amount presented in 2020 in the Other and unallocated columns represents accelerated depreciation incurred in connection with the restructuring of our metallized operations.
|
Segments Results of individual operating segments are presented based on our management accounting practices and management structure. There is no comprehensive, authoritative body of guidance for management accounting equivalent to accounting principles generally accepted in the United States of America; therefore, the financial results of individual segments are not necessarily comparable with similar information for any other company. The management accounting process uses assumptions and allocations to measure performance of the segments. Methodologies are refined from time to time as management accounting practices are enhanced and businesses change. The costs incurred by support areas not directly aligned with the segment are allocated primarily based on an estimated utilization of support area services or are included in “Other and Unallocated” in the table set forth above.
Management evaluates results of operations of the operating segments before certain corporate level costs and the effects of certain gains or losses not considered to be related to the core business operations. Management believes that this is a more meaningful representation of the operating performance of its core businesses, the profitability of the segments
and the extent of cash flow generated from these core operations. Such amounts are presented under the caption “Other and Unallocated.” In the evaluation of operating segments results, management does not use any measures of total assets. This presentation is aligned with the management and operating structure of our company. It is also on this basis that the Company’s performance is evaluated internally and by the Company’s Board of Directors.
-
2427 -
GLATFELTER
Form 10-Q
On July 22, 2021, we enteredintoadefinitiveagreementtoacquire Jacob Holm,aglobal leading manufacturerof premium quality spunlace nonwoven fabrics for critical cleaning, high-performance materials, personal care, hygiene and medical applications, for approximately $308million for the outstanding shares and the extinguishment of Jacob Holm’s debt and subject to post-closing adjustments.
Jacob Holm’s broadproductofferingsandblue-chipcustomerbasewillexpand Glatfelter’s portfolio to include surgical drapes and gowns, wound care, face masks, facial wipes and cosmetic masks. The acquisition of Jacob Holm’sSontarabusiness,aleadingbrandoffinished products for critical cleaning wipes and medical apparel, will also enhanceGlatfelter’stechnologicalcapabilities. Jacob Holm generated approximately $400 million in revenue and about $45 million of EBITDA on a trailing twelve-month basis as of June 30, 2021, supported by strong pandemic tailwinds.
The transaction is subject to the satisfaction of customary closing conditions, including receipt of required regulatory clearances, and is expected to be completed later in 2021.
- 25 -
GLATFELTER
Form 10-Q
ITEM 2. MANAGEMENT'S DISCUSSION AND ANALYSIS OF FINANCIAL CONDITION AND RESULTS OF OPERATIONS
The following discussion should be read in conjunction with the information in the unaudited condensed consolidated financial statements and notes thereto included herein and Glatfelter’s Financial Statements and Management’s Discussion and Analysis of Financial Condition and Results of Operations included in our
20202021 Annual Report on Form
10-K.10-K ("2021 Form 10-K").
Forward-Looking Statements This Quarterly Report on Form 10-Q includes forward-looking statements within the meaning of the Private Securities Litigation Reform Act of 1995. All statements other than statements of historical fact, including statements regarding industry prospects and future consolidated financial position or results of operations, made in this Report on Form 10-Q are forward looking. We use words such as “anticipates”, “believes”, “expects”, “future”, “intends” and similar expressions to identify forward-looking statements. Forward-looking statements reflect management’s current expectations and are inherently uncertain. Our actual results may differ significantly from such expectations. The following discussion includes forward-looking statements all of which are inherently difficult to predict. Although we make such statements based on assumptions that we believe to be reasonable, there can be no assurance that actual results will not differ materially from our expectations. Accordingly, we identify the following important factors, among others, which could cause our results to differ from any results that might be projected, forecasted or estimated in any such forward-looking statements:
| i.
| i.risks related to the military conflict between Russia and Ukraine and its impact on our production, sales, supply chain, cost of energy, and availability of energy due to potential natural gas supply issues into Europe from the Nord Stream 1 pipeline; ii.risks associated with the impact of the COVID-19 pandemic, including global and regional economic conditions, changes in demand for our products, interruptions in our global supply chain, ability to continue production by our facilities, credit conditions of our customers or suppliers, or potential legal actions that could arise due to our operations during the pandemic; | |
| ii.
| variations in demand for our products, including the impact of unplanned market-related downtime, variations in product pricing, or product substitution;
|
| iii.
| the impact of competition, changes in industry production capacity, including the construction of new facilities or new machines, the closing of facilities and incremental changes due to capital expenditures or productivity increases;
| |
| iv.
| risks associated with our international operations, including local economic and political environments and fluctuations in currency exchange rates;
|
| v.
| geopolitical matters, including any impact to our operations from events in Russia, Ukraine and Philippines;
|
| vi.
| our ability to develop new, high value-added products;
|
| vii.
| changes in the price or availability of raw materials we use, particularly woodpulp, pulp substitutes, synthetic pulp, other specialty fibers and abaca fiber;
| |
| viii.
| changes in energy-related prices and commodity raw materials with an energy component;
|
| ix.
| the impact of unplanned production interruption at our facilities or at any of our key suppliers;
|
| x.
| disruptions in production and/or increased costs due to labor disputes;
|
| xi.
| the gain or loss of significant customers and/or on-going viability of such customers;
|
| xii.
| the impact of war and terrorism;
|
| xiii.
| the impact of unfavorable outcomes of audits by various state, federal or international tax authorities or changes in pre-tax income and its impact on the valuation of deferred taxes;
|
| xiv.
| enactment of adverse state, federal or foreign tax or other legislation or changes in government legislation, policy or regulation; and
|
| xv.
| our ability to finance, consummate and integrate acquisitions.
|
COVID-19 Pandemic On March 11, 2020, the World Health Organization declared the COVID-19 outbreak a pandemic, asincluding global and regional economic conditions, changes in demand for our products, interruptions in our global supply chain, ability to continue production by our facilities, credit conditions of our customers or suppliers, or potential legal actions that could arise due to our operations during the virus spread throughoutpandemic;
iii.disruptions of our global supply chain, including the world. The COVID-19 pandemicavailability of key raw materials and transportation for the delivery of critical inputs and of products to customers, and the actions undertaken throughoutincrease in the worldcosts of transporting materials and products;
iv.risks associated with our ability to increase selling prices quickly or sufficiently enough to recover rapid cost inflation in our raw materials, energy, freight and other costs;
v.variations in demand for our products, including the impact of unplanned market-related downtime, variations in product pricing, or product substitution;
vi.the impact of competition, changes in industry production capacity, including the construction of new facilities or new machines, the closing of facilities and incremental changes due to capital expenditures or productivity increases;
vii.risks associated with our international operations, including local economic and political environments and fluctuations in currency exchange rates;
viii.our ability to develop new, high value-added products;
ix.changes in the price or availability of raw materials we use, particularly woodpulp, pulp substitutes, synthetic pulp, other specialty fibers and abaca fiber;
x.changes in energy-related prices and commodity raw materials with an attemptenergy component;
xi.the impact of unplanned production interruption at our facilities or at any of our key suppliers;
xii.disruptions in production and/or increased costs due to contain labor disputes;
xiii.the virus have had an unprecedentedgain or loss of significant customers and/or on-going viability of such customers;
xiv.the impact of war and significant adverseterrorism;
xv.the impact of unfavorable outcomes of audits by various state, federal or international tax authorities or changes in pre-tax income and its impact on global economiesthe valuation of deferred taxes;
xvi.enactment of adverse state, federal or foreign tax or other legislation or changes in termsgovernment legislation, policy or regulation; and
xvii.our ability to finance, consummate and integrate acquisitions, including our acquisitions of reduced GDP, increased unemployment, and insolvencies in a variety of industries and markets. As a result, we have experienced and may continue to experience weaker demand for certain of our products due to the effects of the pandemic. Shortly after the pandemic began and through the first several months of 2021, our financial performance and results of operations were adversely impacted by the pandemic, particularly by weaker demand for tabletop products used by restaurants, catering and similar venues, all of which were impacted by “lockdowns” throughout many regions of the world. However, demand is improving as restaurants around the world begin to reopen. The majority of our other product portfolios are considered to be “essential or life-sustaining” and we continued to produce products used in the global response effort to the pandemic. We believe demand for certain of our products, such as Composite Fibers’ food & beverage filtration products and Airlaid Materials’ personal hygiene and wipes, will remain stable.- 26 -
GLATFELTER
Form 10-Q
Acquisition As discussed in Item 1 - Financial Statements, Note 3 “Acquisition,” on May 13, 2021, we completed our acquisition of Georgia-Pacific's U.S. nonwovens business (“Mount Holly”) for $170.7 million, subject to customary post-closing adjustments. This business includes the Mount Holly NC manufacturing facility, with annual production capacity of approximately 37,000 metric tons, and an R&D center and pilot line for nonwovens product development in Memphis, TN. Mount Holly’s net sales in 2020 were approximately $100 million. Prospectively from the date of acquisition, Mount Holly’s results of operation are included as part of our Airlaid Materials reporting segment.Jacob Holm
RESULTS OF OPERATIONS
.
Introduction We manufacture a wide array of engineered materials and reportmanage our resultscompany along twothree operating segments: | •
| Composite Fibers with revenue from the sale of single-serve tea and coffee filtration products, wallcovering base materials, composite laminates, technical specialties including substrates for electrical applications, and metallized products; and
|
| •Composite Fibers with sales of single-serve tea and coffee filtration papers, wallcovering base materials, composite laminate papers, technical specialties including substrates for electrical applications, and metallized products; | Airlaid Materials with revenue from the sale of airlaid nonwoven fabric-like materials used in feminine hygiene and adult incontinence products, specialty wipes, home care products and other airlaid applications.
|
•Airlaid Materials with sales of airlaid nonwoven fabric-like materials used in feminine hygiene products, adult incontinence products, tabletop, specialty wipes, home care products and other airlaid applications; and
•Spunlace with sales of premium quality spunlace nonwovens for critical cleaning, high-performance materials, personal care, hygiene and medical applications.
The former Specialty Papers business’ results of operations and financial condition are reported as discontinued operations. Following is a discussion and analysis primarily of the financial results of operations and financial condition of our continuing operations.
Acquisition As discussed in Item 1 - Financial Statements and Supplementary Data, Note 3 “Acquisitions,” we completed our acquisitions of Georgia-Pacific's U.S. nonwovens business (“Mount Holly”) on May 13, 2021 for $170.9 million and the acquisition of all outstanding equity of PMM Holdings (Luxembourg) AG ("Jacob Holm") on October 29, 2021 for $304.0 million. Refer to Note 3 - “Acquisitions"”for additional information about these transactions.
RESULTS OF OPERATIONS
Six months ended June 30,
20212022 versus the six months ended June 30,
20202021
Overview For the first six months of 2021,2022, we reported incomea loss from continuing operations of $9.9$110.8 million, or $0.22$2.47 per diluted share compared with $5.1income of $9.9 million and $0.12$0.22 per diluted share in the year earlier period. The following table sets forth summarized consolidated results of operations:
| | Six months ended June 30 | | | Six months ended June 30, |
In thousands, except per share | 2021 | | | 2020 | | In thousands, except per share | 2022 | | 2021 |
Net sales | $ | 470,585 | | | $ | 447,743 | | Net sales | $ | 745,643 | | | $ | 470,585 | |
Gross profit | | 74,850 | | | | 68,865 | | Gross profit | 69,062 | | | 74,850 | |
Operating income | | 25,442 | | | | 21,390 | | |
| Operating income (loss) | | Operating income (loss) | (106,965) | | | 25,442 | |
Continuing operations | | | | | | | | Continuing operations | |
Income | | 9,886 | | | | 5,125 | | |
| Income (loss) | | Income (loss) | (110,750) | | | 9,886 | |
Earnings per share | | 0.22 | | | | 0.12 | | Earnings per share | (2.47) | | | 0.22 | |
Net income | | 9,804 | | | | 4,990 | | |
| Net income (loss) | | Net income (loss) | (110,379) | | | 9,804 | |
Earnings per share | $ | 0.22 | | | $ | 0.11 | | Earnings per share | (2.46) | | | 0.22 | |
The reported results are in accordance with generally accepted accounting principles in the United States (“GAAP”) and reflect the impact of a number of significant actions we undertookitems including a goodwill and other asset impairment charge related to our Dresden operations and Composite Fibers segment, strategic initiatives, corporate headquarters relocation and cost optimization, and the restructuring and consolidation of our metallized business, among others. Excluding these items from reported results,On an adjusted earnings basis, a non-GAAP measure, waswe had a loss from continuing operations of $7.8 million, or $0.17 per share for the first six months of 2022, compared with income of $16.5 million, or $0.37 per diluted share, for 2021, compared with $20.7 million, or $0.46 per diluted share, a year ago. Operating income
Our operating results for
Composite Fibers increased by $0.5the first six months of 2022 reflect: i) the impact of Russia/Ukraine military conflict which commenced on February 24, 2022 and the compounding impacts, including sanctions on the sale of certain products into Russia, adversely impacted sales, prices paid for energy, production and collection of receivables and resulted in the recording of a $117.3 million
or 2.0%; however, Airlaid Materials’ operating income was $8.7asset impairment charge; ii) the completion of two significant acquisitions in 2021, which collectively added $246.9 million
or 35.7% lower primarily due toof net sales; iii) the adverse impact of
significant inflationary pressures, particularly energy costs, which outpaced our efforts to realize higher selling prices; and iv) interest expense increased reflecting the
pandemic on demand for certain products and the related machine downtime to manage inventory levels.acquisition financing.
In addition to the results reported in accordance with GAAP, we evaluate our performance using adjusted earnings and adjusted earnings per
diluted share. We disclose this information to allow investors to evaluate our performance exclusive of certain items that impact the comparability of results from period to period, and we believe it is helpful in understanding underlying operating trends and cash flow generation.
Adjusted earnings
consistconsists of net income determined in accordance with GAAP adjusted to exclude the impact of the following:
Strategic initiatives. These adjustments primarily reflect professional and legal fees incurred directly related to evaluating and executing certain strategic initiatives including costs associated with acquisitions, related integrations, and related integrations.charges incurred to step-up acquired inventory to fair-value.
Corporate headquarters relocation.These adjustments reflect costs incurred in connection with the strategic relocation of the Company’s corporate headquarters to Charlotte, NC. The costs are primarily related to employee relocation costs and exit costs at the former corporate headquarters.- 27 -
GLATFELTER
Form 10-Q
Restructuring charge – Metallized operations. This adjustment represents the charges incurred in 2020 in connection with the decision to restructure a portion of the Composite Fibers segment, primarily consisting of the consolidation of our metallizing operation from Gernsbach, Germany to Caerphilly, UK.Cost optimization actions.These adjustments reflect charges incurred in connection with initiatives to optimize the cost structure of the Company, including costs related to the organizational change to a functional operating model. The costs are primarily related to executive separations,improve efficiencies or other objectives. Such actions may include asset rationalization, headcount reductions professional fees, asset write-offs and certain contract termination costs.or similar actions. These adjustments, which have occurred at various times in the past, are irregular in timing and relate to specific identified programs to reduce or optimize the cost structure of a particular operating segment or the corporate function.
Pension settlement expenses, net.
Goodwill and other asset impairment charges. This adjustment reflects professional feesrepresents a non-cash charge recorded in connection withto reduce the Company’s terminationcarrying amount of its qualified pension plancertain long-lived assets, intangible assets and goodwill of our Dresden facility and the Composite Fibers reporting segment. The impairment was directly related actions to settle all obligations to the plan’s participants. Since the pension plan was fully funded, the settlement of pension obligations did not require the useadverse impact of the Company’s cash, but instead was accomplished with plan assets.Russia/Ukraine military conflict on our projected revenue and EBITDA. Russia/Ukraine conflict charges. This adjustment represents a non-cash charge recorded to reduce the carrying amount of accounts receivable and inventory directly related to the Russia/Ukraine military conflict.
Timberland sales and related costs. These adjustments exclude gains from the sales of timberlands as these items are not considered to be part of our core business, ongoing results of operations or cash flows. These adjustments are irregular in timing and amount and may benefit our operating results. Coronavirus Aid, Relief, and Economic Security (CARES) Act 2020. This adjustment reflects taxes recorded as a resultin connection with passage of the March 27, 2020 change in U.S. taxCoronavirus Aid, Relief, and Economic Security Act (“CARES”) related to provisions that modified the “net operating loss” provisions of previous law which, among others, allows net operatingto allow certain losses to be carried back five years. These adjustments are each unique and not considered to be on-going in nature. The transactions are irregular in timing and amount and may significantly impact our operating performance. As such, these items may not be indicative of our past or future performance and therefore are excluded for comparability purposes.
Adjusted earnings and adjusted earnings per share are considered measures not calculated in accordance with GAAP, and therefore are non-GAAP measures. The non-GAAP financial information should not be considered in isolation from, or as a substitute for, measures of financial performance prepared in accordance with GAAP.
The following table sets forth the reconciliation of net income to adjusted earnings for the period indicated:
| | Six months ended June 30 | | |
| | 2021 | | | 2020 | | |
In thousands, except per share | | Amount | | | EPS | | | Amount | | | EPS | | |
Net income | | $ | 9,804 | | | $ | 0.22 | | | $ | 4,990 | | | $ | 0.11 | | |
Exclude: Loss from discontinued operations | | | 82 | | | | — | | | | 135 | | | | 0.01 | | |
Income from continuing operations | | | 9,886 | | | | 0.22 | | | | 5,125 | | | | 0.12 | | |
Adjustments (pre-tax) | | | | | | | | | | | | | | | | | |
Strategic initiatives | | | 8,434 | | | | | | | | — | | | | | | |
Corporate headquarters relocation | | | 361 | | | | | | | | — | | | | | | |
Restructuring charge - Metallized operations | | | — | | | | | | | | 11,054 | | | | | | |
Cost optimization actions | | | — | | | | | | | | 3,097 | | | | | | |
Pension settlement expenses, net | | | — | | | | | | | | 6,403 | | | | | | |
COVID 19 - incremental costs | | | — | | | | | | | | 1,180 | | | | | | |
Asset impairment charge | | | — | | | | | | | | 900 | | | | | | |
Timberland sales and related costs | | | (2,403 | ) | | | | | | | (601 | ) | | | | | |
Total adjustments (pre-tax) | | | 6,392 | | | | | | | | 22,033 | | | | | | |
Income taxes (1) | | | 31 | | | | | | | | (3,882 | ) | | | | | |
CARES Act of 2020 tax provision (benefit) (2) | | | 183 | | | | | | | | (2,569 | ) | | | | | |
Total after-tax adjustments | | | 6,606 | | | | 0.15 | | | | 15,582 | | | | 0.34 | | |
Adjusted earnings | | $ | 16,492 | | | $ | 0.37 | | | $ | 20,707 | | | $ | 0.46 | | |
| | | | | | | | | | | | | | | | | | | | | | | |
| | Six months ended June 30, |
| | 2022 | | 2021 |
| In thousands, except per share | Amount | | EPS | | Amount | | EPS |
| Net income (loss) | $ | (110,379) | | | $ | (2.46) | | | $ | 9,804 | | | $ | 0.22 | |
| Exclude: Loss (income) from discontinued operations, net of tax | (371) | | | (0.01) | | | 82 | | | — | |
| Income (loss) from continuing operations | (110,750) | | | (2.47) | | | 9,886 | | | 0.22 | |
Adjustments (pre-tax): | | | | | | | |
Goodwill and other asset impairment charges (1) | 117,349 | | | | | — | | | |
Russia/Ukraine conflict charges (2) | 3,948 | | | | | — | | | |
Strategic initiatives (3) | 2,488 | | | | | 8,434 | | | |
| Corporate headquarters relocation | 223 | | | | | 361 | | | |
Cost optimization actions (4) | 941 | | | | | — | | | |
| Timberland sales and related costs | (2,962) | | | | | (2,403) | | | |
| Total adjustments (pre-tax) | 121,987 | | | | | 6,392 | | | |
Income taxes (5) | (19,167) | | | | | 31 | | | |
CARES Act of 2020 tax provision (6) | 175 | | | | | 183 | | | |
| Total after-tax adjustments | 102,995 | | | 2.30 | | | 6,606 | | | 0.15 | |
| Adjusted earnings (loss) from continuing operations | $ | (7,755) | | | $ | (0.17) | | | $ | 16,492 | | | $ | 0.37 | |
(1)Reflects goodwill impairment charge of $56.1 million and other asset impairment charges of $61.3 million. Refer to Note 6, Goodwill and Other Asset Impairment, for details of this item.
(2)Reflects bad debt expense charges of $2.9 million and inventory reserves charges $1.0 million. Refer to Note 6, Goodwill and Other Asset Impairment, for details of this item.
(3)For 2022, primarily reflects professional services fees (including legal, audit, valuation specialists and consulting) of $1.7 million, employee separation and other costs of $0.8 million and other costs, all of which are directly related to acquisitions. For 2021, primarily reflects
professional services fees related to acquisitions (including legal, audit and valuation specialists) of $7.1 million, employee separation and other costs of $0.6 million, inventory valuation step-up costs of $0.5 million and other costs, all of which are directly related to acquisitions.
(4)Primarily reflects employee separation costs of $0.4 million, equipment write-down of $0.4 million and other costs of $0.1 million directly associated with closure of synthetic fiber production facility in the U.K..
(5)Tax effect on adjustments calculated based on the incremental effective tax rate of the jurisdiction in which each adjustment originated. For items originating in the U.S., no tax effect is recognized due to the previously established valuation allowance on the net deferred tax assets. No tax effects were recognized on the goodwill impairment as there were no related deferred taxes.
(6)Reflects the tax effect of applying certain provisions of the CARES Act of 2020.
Segment Financial Performance
| | | | | | | | | | | | | | | | | |
| | | Six months ended June 30, |
| Dollars in thousands | | | | | 2022 | | 2021 |
| Net Sales | | | | | | | |
| Composite Fibers | | | | | $ | 259,167 | | | $ | 282,847 | |
| Airlaid Material | | | | | 293,172 | | | 187,738 | |
| Spunlace | | | | | 193,304 | | | — | |
| Total | | | | | $ | 745,643 | | | $ | 470,585 | |
| | | | | | | |
| Operating income (loss) | | | | | | | |
| Composite Fibers | | | | | $ | 5,444 | | | $ | 27,128 | |
| Airlaid Material | | | | | 24,165 | | | 15,628 | |
| Spunlace | | | | | (3,380) | | | — | |
| Other and unallocated | | | | | (133,194) | | | (17,314) | |
| Total | | | | | $ | (106,965) | | | $ | 25,442 | |
| | | | | | | |
| Depreciation and amortization | | | | | | | |
| Composite Fibers | | | | | $ | 11,315 | | | $ | 13,981 | |
| Airlaid Material | | | | | 15,171 | | | 12,615 | |
| Spunlace | | | | | 5,859 | | | — | |
| Other and unallocated | | | | | 2,591 | | | 1,870 | |
| Total | | | | | $ | 34,936 | | | $ | 28,466 | |
| | | | | | | |
| Capital expenditures | | | | | | | |
| Composite Fibers | | | | | $ | 10,258 | | | $ | 5,655 | |
| Airlaid Material | | | | | 5,532 | | | 3,036 | |
| Spunlace | | | | | 3,886 | | | — | |
| Other and unallocated | | | | | 3,021 | | | 2,520 | |
| Total | | | | | $ | 22,697 | | | $ | 11,211 | |
| | | | | | | |
| Tons shipped (metric) | | | | | | | |
| Composite Fibers | | | | | 52,457 | | | 68,611 | |
| Airlaid Material | | | | | 83,733 | | | 63,179 | |
| Spunlace | | | | | 40,094 | | | — | |
| Total | | | | | 176,284 | | | $ | 131,790 | |
Segments Results of individual operating segments are presented based on our management accounting practices and management structure. There is no comprehensive, authoritative body of guidance for management accounting equivalent to accounting principles generally accepted in the United States of America; therefore, the financial results of individual segments are not necessarily comparable with similar information for any other company. The management accounting process uses assumptions and allocations to measure performance of the segments. Methodologies are refined from time to time as management accounting practices are enhanced and businesses change. The costs incurred by support areas not
directly aligned with the segment are allocated primarily based on an estimated utilization of support area services or are included in “Other and Unallocated” in the table set forth above.
Management evaluates results of operations of the operating segments before certain corporate level costs and the effects of certain gains or losses not considered to be related to the core business operations. Management believes that this is a more meaningful representation of the operating performance of its core businesses, the profitability of the segments and the extent of cash flow generated from these core operations. Such amounts are presented under the caption “Other and Unallocated.” In the evaluation of operating segments results, management does not use any measures of total assets. This presentation is aligned with the management and operating structure of our company. It is also on this basis that the Company’s performance is evaluated internally and by the Company’s Board of Directors.
Sales and Costs of Products Sold
| | | | | | | | | | | | | | | | | |
| | Six months ended June 30, | | |
| In thousands | 2022 | | 2021 | | Change |
| Net sales | $ | 745,643 | | | $ | 470,585 | | | $ | 275,058 | |
| Costs of products sold | 676,581 | | | 395,735 | | | 280,846 | |
| Gross profit | $ | 69,062 | | | $ | 74,850 | | | $ | (5,788) | |
| Gross profit as a percent of Net sales | 9.3 | % | | 15.9 | % | | |
The following table sets forth the contribution to consolidated net sales by each segment:
| | | | | | | | | | | |
| | Six months ended June 30, |
| Percent of Total | 2022 | | 2021 |
| Segment | | | |
| Composite Fibers | 34.8 | % | | 60.1 | % |
| Airlaid Materials | 39.3 | | | 39.9 | |
| Spunlace | 25.9 | | | — | |
| Total | 100.0 | % | | 100.0 | % |
Net sales totaled $745.6 million and $470.6 million in the first six months of 2022 and 2021, respectively. Net sales for Composite Fibers and Airlaid Materials (including Mount Holly) decreased by 2.0% and increased by 63.7%, respectively, on a constant currency basis. The Spunlace segment, formed in connection with the Jacob Holm acquisition, had net sales of approximately $193.3 million in the first six months of 2022.
Composite Fibers’ net sales decreased $23.7 million or 8.4% in the first six months of 2022, compared to the year-ago quarter. Wallcover shipments were below prior year by 49% due to lower shipments to customers in Russia and Ukraine, resulting from the continuation of the military conflict in this region and prohibition of the export of sanctioned wallcover base paper and tea filter products to Russia. Lower shipments were partially offset by higher selling prices of $32.0 million. Currency translation was unfavorable $18.0 million.
Composite Fibers had operating income of $5.4 million in the first six months of 2022 compared with $27.1 million in the year-ago period. Higher selling prices and energy surcharges of $32.0 million fell $14.0 million short of recovering continued inflation in energy and raw material. Lower shipments and market related downtime, primarily in our Dresden facility, negatively impacted results by $12.2 million. The impact of currency and related hedging positively impacted earnings by $4.5 million. The primary drivers of the change in Composite Fibers’ operating income are summarized in the following chart (presented in millions):
Airlaid Materials’ net sales increased $105.4 million in the year-over-year comparison driven by higher shipments in all major product categories and higher selling prices from cost-pass-through arrangements with customers. Shipments were 32.5% higher driven by strong growth in the tabletop, wipes, and hygiene product categories, including the benefit from a full six months of Mount Holly in 2022. Currency translation was $14.1 million unfavorable.
Airlaid Materials’ operating income, for the first six months of 2022, of $24.2 million was $8.5 million higher than the same period in 2021. Higher shipments and product mix positively impacted results by $11.9 million. Selling price increases of $36.4 million was $2.4 million short of offsetting the higher raw material prices and energy inflation costs. Operations were favorable $1.6 million driven by higher production, which offset other general inflationary pressures. The impact of currency and related hedging negatively impacted earnings by $2.5 million. The primary drivers are summarized in the following chart (presented in millions):
Spunlace net sales for the first six months were approximately $193.3 million. An operating loss of $3.4 million was mainly driven by higher raw material and energy costs only partially offset by higher selling prices and energy surcharges.
Asset Impairment During the first quarter of 2022, in connection with an assessment of potential impairment of long-lived and indefinite-lived intangible assets stemming from the compounding impacts resulting from the Russia/Ukraine military conflict and related sanctions, we recorded a $117.3 million non-cash asset impairment charge related to Composite Fibers' Dresden facility and an impairment of Composite Fibers' goodwill. Dresden is a single-line facility that produces wallcover base paper, the majority of which is directly sold into the Russian and Ukrainian markets. As a direct
result of the economic impacts from the conflict, including disruptions in the underlying financial systems and prohibition of the export of sanctioned wallcover base paper to Russia, management expects a significant reduction in wallcover revenues and associated cash flows for the foreseeable future. In addition, the conflict is expected to significantly impact energy prices and also impact other Composite Fibers products that are subject to export sanctions into Russia. During the year ended December 31, 2021, we had total net sales of wallcover and other products to customers in Russia and Ukraine totaling approximately $95 million. We do not expect significant sales to customers in this region for the foreseeable future as a result of the military conflict, its impact on Ukrainian customers, and the economic sanctions on sales of certain products to customers in Russia. Accordingly, a charge was recorded to reduce the carrying value of the Dresden fixed assets and intangible assets (technological know-how, customer relationships, and an indefinite-lived trade name), along with Composite Fiber's goodwill to fair value.
In addition, as a result of economic sanctions and disruptions to the financial markets, certain customers are not able to satisfy outstanding accounts receivables. As such, during the first quarter of 2022, we recognized bad debt expense of approximately $2.9 million directly related to Russian and Ukrainian customers which is included in “Selling, general and administrative expenses” in the accompanying condensed consolidated statements of income for the six months ended June 30, 2022. At June 30, 2022, we had accounts receivable, net of reserves, from customers in this region totaling approximately $2.6 million which we expect to collect in normal course. However, if circumstances change such that some customers are unable to satisfy their obligations, we may be required to recognize additional bad debt expense in future periods. Furthermore, during the first quarter of 2022, we increased inventory reserves by approximately $1.0 million, primarily related to wallcover products. The charge related to inventory reserves is included in “Cost of products sold” in the accompanying condensed consolidated statements of income for the six months ended June 30, 2022. Substantially all other products which we will no longer be able to export to Russia due to sanctions can be sold to existing customers outside the Russia/Ukraine region.
Other and Unallocated The amount of operating expense not allocated to a reporting segment in the Segment Financial Information totaled $133.2 million in the first six months of 2022 compared with $17.3 million in the same period a year ago. Excluding the items identified to present “adjusted earnings,” unallocated expenses for the first six months of 2022 decreased $0.3 million compared to the same period in 2021.
Income taxes In the first six months of 2022, our loss from continuing operations totaled $124.2 million and we recorded an income tax benefit of $13.5 million. On adjusted pre-tax loss of $2.3 million, income tax provision was $5.5 million in the first six months of 2022, which primarily related to reserves for uncertain tax positions and valuation allowances for losses for which no tax benefit could be recognized. The comparable amounts in the first six months of 2021 were adjusted pre-tax income of $27.5 million and income tax expense of $11.0 million, respectively.
Foreign Currency We own and operate facilities in Canada, Germany, France, the United Kingdom, Spain, and the Philippines. The functional currency of our Canadian operations is the U.S. dollar. However, in Germany, France and Spain, it is the euro, in the UK, it is the British pound sterling, and in the Philippines the functional currency is the peso. On an annual basis, our euro denominated net sales exceeds euro expenses by an estimated €150 million. For the first six months of 2022, the average currency exchange rate was 1.09 dollar/euro compared with 1.20 in the same period of 2021. With respect to the British pound sterling, Canadian dollar, and Philippine peso, we have differing amounts of inflows and outflows of these currencies, although to a lesser degree than the euro. As a result, we are exposed to changes in currency exchange rates and such changes could be significant. The translation of the results from international operations into U.S. dollars is subject to changes in foreign currency exchange rates.
The table below summarizes the translation impact on reported results that changes in currency exchange rates had on our non-U.S. based operations from the conversion of these operation’s results for the first six months of 2022.
| (1)
| Tax effect on adjustments calculated based on the incremental effective tax rate of the jurisdiction in which each adjustment originated.
|
| (2)
| Tax impact recorded in connection with passage of the Coronavirus Aid, Relief, and Economic Security Act (“CARES”) related to provisions that modified the “net operating loss” provisions of previous law to allow certain losses to be carried back five years.
|
- 28 -
GLATFELTER
Form 10-Q
| | |
| In thousands | Six months ended June 30, |
| Favorable
(unfavorable)
|
| Net sales | $ | (32,135) | |
| Costs of products sold | 31,774 | |
| SG&A expenses | 2,010 | |
| Income taxes and other | 241 | |
| Net loss | $ | 1,890 | |
The above table only presents the financial reporting impact of foreign currency translations assuming currency exchange rates in 2022 were the same as 2021. It does not present the impact of certain competitive advantages or disadvantages of operating or competing in multi-currency markets.
Three months ended June 30, 2022 versus the three months ended June 30, 2021
Overview For the second quarter of 2022, we reported loss from continuing operations of $2.5 million, or $0.05 per share compared with income of $1.5 million and $0.03 per diluted share in the year earlier period. The following table sets forth summarized consolidated results of operations:
| | | | | | | | | | | |
| | Three months ended June 30, |
| In thousands, except per share | 2022 | | 2021 |
| Net sales | $ | 363,963 | | | $ | 244,911 | |
| Gross profit | 37,397 | | | 35,554 | |
| Operating income | 8,924 | | | 8,123 | |
| Continuing operations: | | | |
| Income (loss) | (2,460) | | | 1,492 | |
| Earnings per share | (0.05) | | | 0.03 | |
| Net income (loss) | (2,052) | | | 1,410 | |
| Earnings per share | (0.05) | | | 0.03 | |
The reported results are in accordance with generally accepted accounting principles in the United States (“GAAP”) and reflect the impact of significant items including strategic initiatives and corporate headquarters relocation costs, among others. On an adjusted earnings basis, a non-GAAP measure, we had a loss from continuing operations of $1.6 million, or $0.04 per share for the second quarter of 2022, compared with income of $8.0 million, or $0.18 per diluted share, a year ago.
Our second quarter of 2022 operating results reflect: i) the continuation of the compounding impacts of the Russia/Ukraine military conflict commencing on February 24, 2022 including the adverse impact of the prohibition of the export of sanctioned products into Russia; ii) the completion of two significant acquisitions in 2021, which collectively added $123.2 million of net sales; iii) the adverse impact of significant inflationary pressures, particularly energy costs, which outpaced our efforts to realize higher selling prices; and iv) interest expense increased reflecting the acquisition financing.
The following table sets forth the reconciliation of net income to adjusted earnings for the period indicated:
| | | | | | | | | | | | | | | | | | | | | | | |
| | Three months ended June 30, |
| | 2022 | | 2021 |
| In thousands, except per share | Amount | | EPS | | Amount | | EPS |
| Net income (loss) | $ | (2,052) | | | $ | (0.04) | | | $ | 1,410 | | | $ | 0.03 | |
| Exclude: Income from discontinued operations, net of tax | (408) | | | (0.01) | | | 82 | | | — | |
| Income (loss) from continuing operations | (2,460) | | | (0.05) | | | 1,492 | | | 0.03 | |
Adjustments (pre-tax): | | | | | | | |
| | | | | | | |
| | | | | | | |
Strategic initiatives (1) | 653 | | | | | 7,831 | | | |
| Corporate headquarters relocation | 135 | | | | | 206 | | | |
| | | | | | | |
| Timberland sales and related costs | — | | | | | (1,553) | | | |
| Total adjustments (pre-tax) | 788 | | | | | 6,484 | | | |
Income taxes (2) | (20) | | | | | (50) | | | |
CARES Act of 2020 tax provision (3) | 96 | | | | | 90 | | | |
| Total after-tax adjustments | 864 | | | 0.01 | | | 6,524 | | | 0.15 | |
| Adjusted earnings (loss) from continuing operations | $ | (1,596) | | | $ | (0.04) | | | $ | 8,016 | | | $ | 0.18 | |
(1)For 2022, primarily reflects professional services fees (including legal, audit, valuation specialists and consulting) of $0.5 million, employee separation and other costs of $0.4 million and other costs, all of which are directly related to acquisitions. For 2021, reflects professional services fees related to acquisitions (including transaction advisory, legal, audit and valuation specialists) of $6.5 million, employee separation and other costs of $0.6 million, inventory valuation step-up costs of $0.5 million and other costs all of which are directly related to acquisitions.
(2)Tax effect on adjustments calculated based on the incremental effective tax rate of the jurisdiction in which each adjustment originated. For items originating in the U.S., no tax effect is recognized due to the previously established valuation allowance on the net deferred tax assets.
(3)Reflects the tax effect of applying certain provisions of the CARES Act of 2020.
Segment Financial PerformanceSix months ended June 30 | | | | | | | Other and | | | | |
Dollars in thousands | Composite Fibers | | | Airlaid Materials | | | Unallocated | | | Total | |
| 2021 | | | 2020 | | | 2021 | | | 2020 | | | 2021 | | | 2020 | | | 2021 | | | 2020 | |
Net sales | $ | 282,847 | | | $ | 254,848 | | | $ | 187,738 | | | $ | 192,895 | | | $ | — | | | $ | — | | | $ | 470,585 | | | $ | 447,743 | |
Cost of products sold | | 233,601 | | | | 207,372 | | | | 162,723 | | | | 159,827 | | | | (589 | ) | | | 11,679 | | | | 395,735 | | | | 378,878 | |
Gross profit (loss) | | 49,246 | | | | 47,476 | | | | 25,015 | | | | 33,068 | | | | 589 | | | | (11,679 | ) | | | 74,850 | | | | 68,865 | |
SG&A | | 22,118 | | | | 20,887 | | | | 9,387 | | | | 8,754 | | | | 20,306 | | | | 18,431 | | | | 51,811 | | | | 48,072 | |
Gains on dispositions of plant, equipment and timberlands, net | | — | | | | — | | | | — | | | | — | | | | (2,403 | ) | | | (597 | ) | | | (2,403 | ) | | | (597 | ) |
Total operating income (loss) | | 27,128 | | | | 26,589 | | | | 15,628 | | | | 24,314 | | | | (17,314 | ) | | | (29,513 | ) | | | 25,442 | | | | 21,390 | |
Non-operating expense | | — | | | | — | | | | — | | | | — | | | | (4,345 | ) | | | (11,104 | ) | | | (4,345 | ) | | | (11,104 | ) |
Income (loss) before income taxes | $ | 27,128 | | | $ | 26,589 | | | $ | 15,628 | | | $ | 24,314 | | | $ | (21,659 | ) | | $ | (40,617 | ) | | $ | 21,097 | | | $ | 10,286 | |
Supplementary Data | | | | | | | | | | | | | | | | | | | | | | | | | | | | | | | |
Net tons sold | | 68,611 | | | | 65,015 | | | | 63,179 | | | | 68,316 | | | | — | | | | — | | | | 131,790 | | | | 133,331 | |
Depreciation, depletion and amortization ($ in thousands) (1) | $ | 13,981 | | | $ | 12,897 | | | $ | 12,615 | | | $ | 10,924 | | | $ | 1,870 | | | $ | 5,787 | | | $ | 28,466 | | | $ | 29,608 | |
Capital expenditures | | 5,655 | | | | 6,061 | | | | 3,036 | | | | 3,815 | | | | 2,520 | | | | 2,135 | | | | 11,211 | | | | 12,011 | |
| (1) | | | | | | | | | | | | | | | | | | | | | Three months ended June 30, | | Dollars in thousands | | | | | 2022 | | 2021 | | Net sales | | | | | | | | | Composite Fibers | | | | | $ | 123,338 | | | $ | 141,598 | | | Airlaid Material | | | | | 143,708 | | | 103,313 | | | Spunlace | | | | | 96,917 | | | — | | | Total | | | | | $ | 363,963 | | | $ | 244,911 | | | | | | | | | | | Operating income (loss) | | | | | | | | | Composite Fibers | | | | | $ | 5,779 | | | $ | 11,063 | | | Airlaid Material | | | | | 11,944 | | | 8,431 | | | Spunlace | | | | | (1,808) | | | — | | | Other and unallocated | | | | | (6,991) | | | (11,371) | | | Total | | | | | $ | 8,924 | | | $ | 8,123 | | | | | | | | | | | Depreciation and amortization | | | | | | | | | Composite Fibers | | | | | $ | 4,796 | | | $ | 7,000 | | | Airlaid Material | | | | | 7,542 | | | 6,767 | | | Spunlace | | | | | 2,945 | | | — | | | Other and unallocated | | | | | 1,169 | | | 966 | | | Total | | | | | $ | 16,452 | | | $ | 14,733 | | | | | | | | | | | Capital expenditures | | | | | | | | | Composite Fibers | | | | | $ | 4,131 | | | $ | 2,882 | | | Airlaid Material | | | | | 2,064 | | | 1,297 | | | Spunlace | | | | | 1,801 | | | — | | | Other and unallocated | | | | | 2,353 | | | 1,653 | | | Total | | | | | $ | 10,349 | | | $ | 5,832 | | | | | | | | | | | Tons shipped (metric) | | | | | | | | | Composite Fibers | | | | | 24,246 | | | 34,471 | | | Airlaid Material | | | | | 40,681 | | | 34,315 | | | Spunlace | | | | | 19,358 | | | — | | | Total | | | | | 84,285 | | | $ | 68,786 | | | | | | | | | |
Segments
| The amount presented in 2020 in the Other and unallocated column represents accelerated depreciation incurred in connection with the restructuring of the metallized operations.
|
Segments Results of individual operating segments are presented based on our management accounting practices and management structure. There is no comprehensive, authoritative body of guidance for management accounting equivalent to accounting principles generally accepted in the United States of America; therefore, the financial results of individual segments are not necessarily comparable with similar information for any other company. The management accounting process uses assumptions and allocations to measure performance of the segments. Methodologies are refined from time to time as management accounting practices are enhanced and businesses change. The costs incurred by support areas not directly aligned with the segment are allocated primarily based on an estimated utilization of support area services or are included in “Other and Unallocated” in the table set forth above.
Management evaluates results of operations of the operating segments before certain corporate level costs and the effects of certain gains or losses not considered to be related to the core business operations. Management believes that this is a more meaningful representation of the operating performance of its core businesses, the profitability of the segments
and the extent of cash flow generated from these core operations. Such amounts are presented under the caption “Other and Unallocated.” In the evaluation of operating segments results, management does not use any measures of total assets. This presentation is aligned with the management and operating structure of our company. It is also on this basis that the Company’s performance is evaluated internally and by the Company’s Board of Directors.
Sales and Costs of Products Sold
| | Six months ended June 30 | | | | | | | Three months ended June 30, | | |
In thousands | 2021 | | | 2020 | | | Change | | In thousands | 2022 | | 2021 | | Change |
Net sales | $ | 470,585 | | | $ | 447,743 | | | $ | 22,842 | | Net sales | $ | 363,963 | | | $ | 244,911 | | | $ | 119,052 | |
Costs of products sold | | 395,735 | | | | 378,878 | | | | 16,857 | | Costs of products sold | 326,566 | | | 209,357 | | | 117,209 | |
Gross profit | $ | 74,850 | | | $ | 68,865 | | | $ | 5,985 | | Gross profit | $ | 37,397 | | | $ | 35,554 | | | $ | 1,843 | |
Gross profit as a percent of Net sales | | 15.9 | % | | | 15.4 | % | | | | | Gross profit as a percent of Net sales | 10.3 | % | | 14.5 | % | | |
- 29 -
GLATFELTER
Form 10-Q
The following table sets forth the contribution to consolidated net sales by each segment:
| | Six months ended June 30 | | | Three months ended June 30, |
Percent of Total | 2021 | | | 2020 | | Percent of Total | 2022 | | 2021 |
Segment | | | | | | | | Segment | |
Composite Fibers | | 60.1 | % | | | 56.9 | % | Composite Fibers | 33.9 | % | | 57.8 | % |
Airlaid Materials | | 39.9 | | | | | 43.1 | | Airlaid Materials | 39.5 | | | 42.2 | |
| Spunlace | | Spunlace | 26.6 | | | — | |
Total | | 100.0 | % | | | | 100.0 | % | Total | 100.0 | % | | 100.0 | % |
Net sales totaled $470.6$364.0 million and $447.7$244.9 million in the first six months of 2021 and 2020, respectively.Composite Fibers’ net sales increased $28.0 million or 11% in the first six months of 2021 compared to the year-ago period, driven by favorable currency translation of $21.1 million, as well as improved year-over-year shipments the largest of which is in the wallcover product category. Overall shipments increased 5.5% in the period-over-period comparison, due to solid demand for most markets other than metallized products, which was restructured in the second quarter of 2020.
2022 and 2021, respectively. Net sales for Composite Fibers and Airlaid Materials (including Mount Holly) decreased by 4.4% and increased by 47.7%, respectively, on a constant currency basis. The Spunlace segment, formed in connection with the Jacob Holm acquisition, had net sales of approximately $96.9 million in the second quarter of 2022.
Composite Fibers’ operating incomenet sales decreased $18.3 million or 12.9% in the second quarter of $27.1 million was $0.5 million higher, or approximately 2% favorable,2022, compared to the first six monthsyear-ago quarter. Higher selling prices of 2020 as a result$14.4 million were more than offset by lower shipments of improved sales mix29.7%. Wallcover shipments were below prior year by 62% due to lower shipments to customers in Russia and higher selling price, which favorablyUkraine, resulting from the continuation of the geopolitical conflict in this region and prohibition of the export of sanctioned wallcover and tea filter products into Russia. Currency translation was unfavorable $12.0 million.
Composite Fibers had operating income for the second quarter of $5.8 million compared with $11.1 million operating income in the second quarter of 2021. Lower shipments and market-related downtime, primarily in our Dresden facility, negatively impacted results by
$2.3$6.4 million. Higher selling prices and energy surcharges of $14.4 million
and $1.9fell $2.5 million
respectively. Solid cost control and increased production to meet the strong demand for product improved earnings. Rawshort of fully recovering continued inflation in energy, raw material and
energy prices were $7.3freight of $16.9 million. The impact of currency and related hedging positively impacted earnings by $3.6 million
higher thanmainly driven by weakening of the
same period last year reflecting significant inflation in primarily wood pulp, as well as other input costs. In April 2021, we announced an 8% price increase in response to significantly higher input costs; however, the realization of increased selling prices is not yet fully offsetting the significant inflation. Realization is expected to continue over the next few quarters and success is dependent on customer negotiations.British Pound. The primary drivers of the change in Composite Fibers’ operating income are summarized in the following
chart: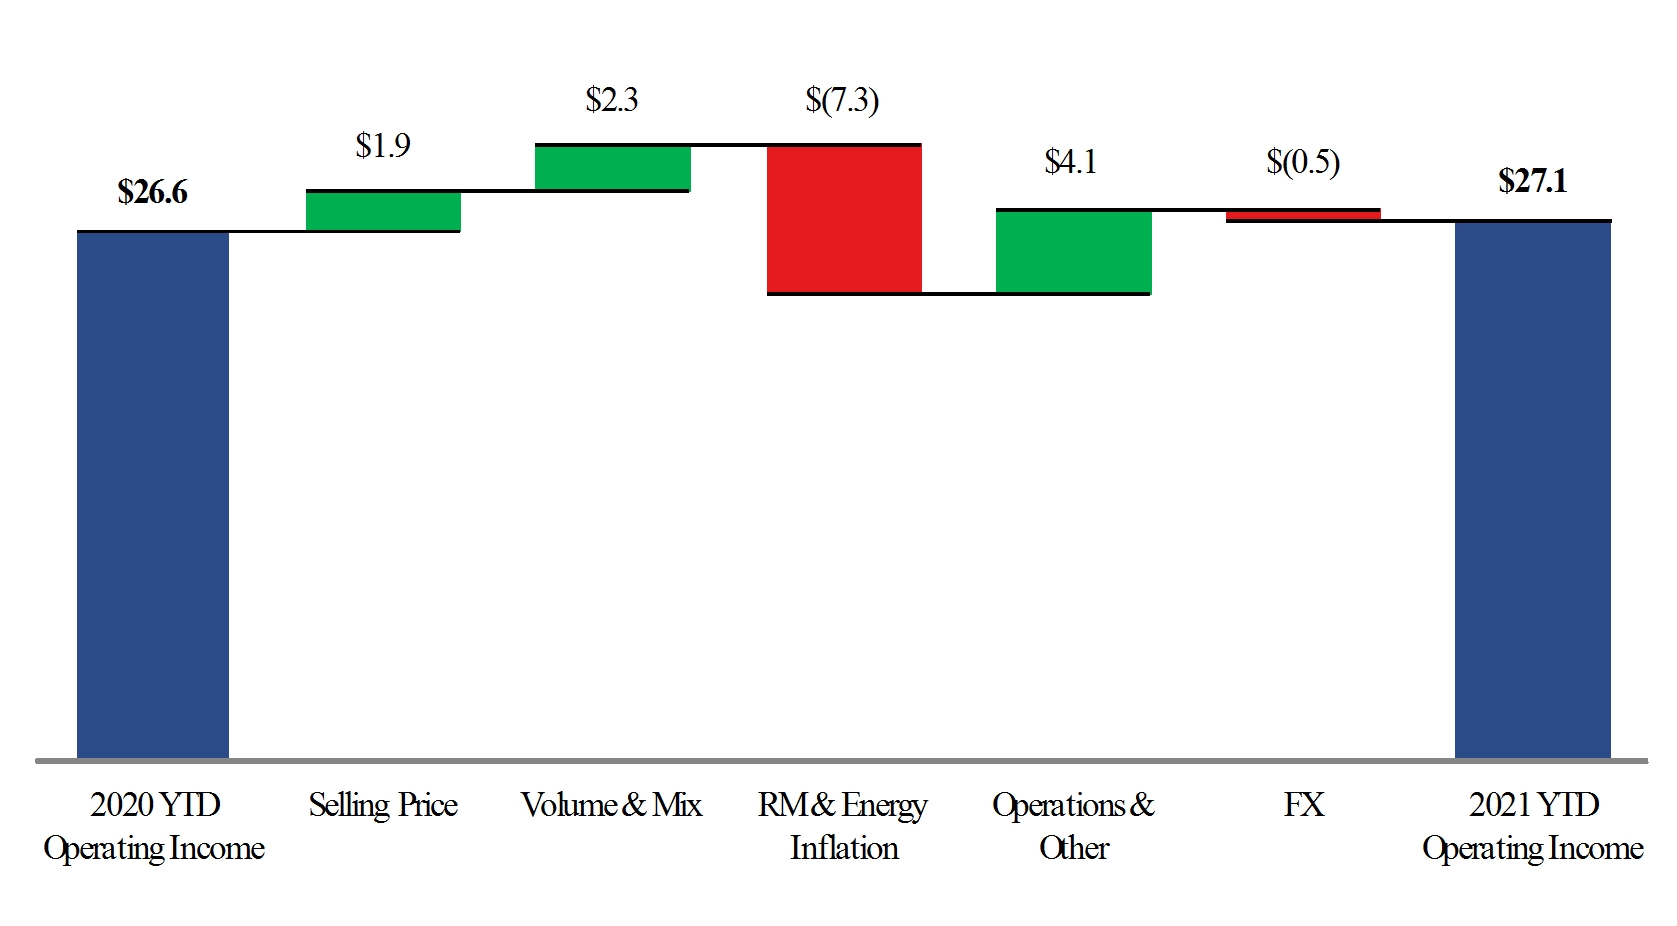
chart (presented in millions):
Airlaid Materials’ net sales
decreased $5.2increased $40.4 million in the year-over-year
comparison. Shipments were 7.5% lowercomparison driven by
continued softness in tabletop demand from delays in restaurant opening, as well as lower shipments in the hygiene and wipes categories as customers adjusted their buying patterns following elevated year-end inventory levels maintained due to the pandemic. Currency translation was $8.7 million favorable, and the Mount Holly acquisition,
is included prospectivelyhigher shipments in all major product categories, and higher selling prices from
cost-pass-through arrangements with customers. Shipments were 18.6% higher driven by strong growth in the
May 13, 2021 closing of the transaction, adding $10.5 million.- 30 -
GLATFELTER
Form 10-Q
wipes, tabletop, and hygiene product categories. Currency translation was $8.9 million unfavorable.
Airlaid Materials’ first six months 2021second quarter operating income of $15.6$11.9 million was $8.7$3.5 million lowerhigher when compared to the same period in 2020. Lower shipping volumes unfavorablysecond quarter of 2021. Higher shipments positively impacted earningsresults by $4.0$3.9 million. Selling price increases and energy surcharges of $18.0 million and operations were $3.3 million unfavorable driven by lower production to manage customer demand and inventory levels. Higher average selling prices largely due to raw material pass-through provisions, added $4.9 million. Higherfully offset the higher raw material and energy prices more thancosts which improved results by $0.8 million. Operations were slightly favorable by $0.3 million as higher production was mostly offset the benefitby general inflationary pressures. The impact of higher selling prices.currency and related hedging negatively impacted earnings by $1.5 million due to a weakening Euro. The primary drivers are summarized in the following chart:chart (presented in millions):
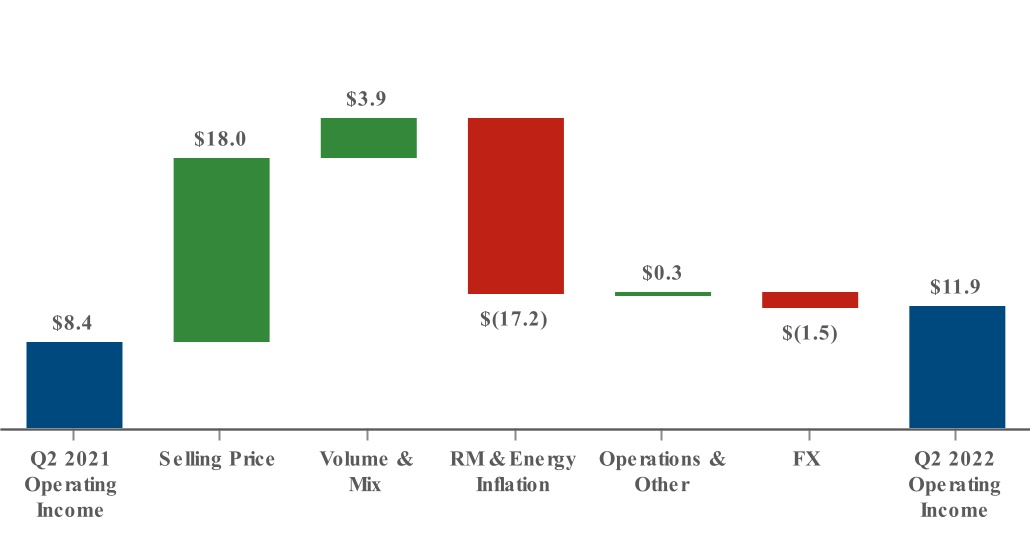
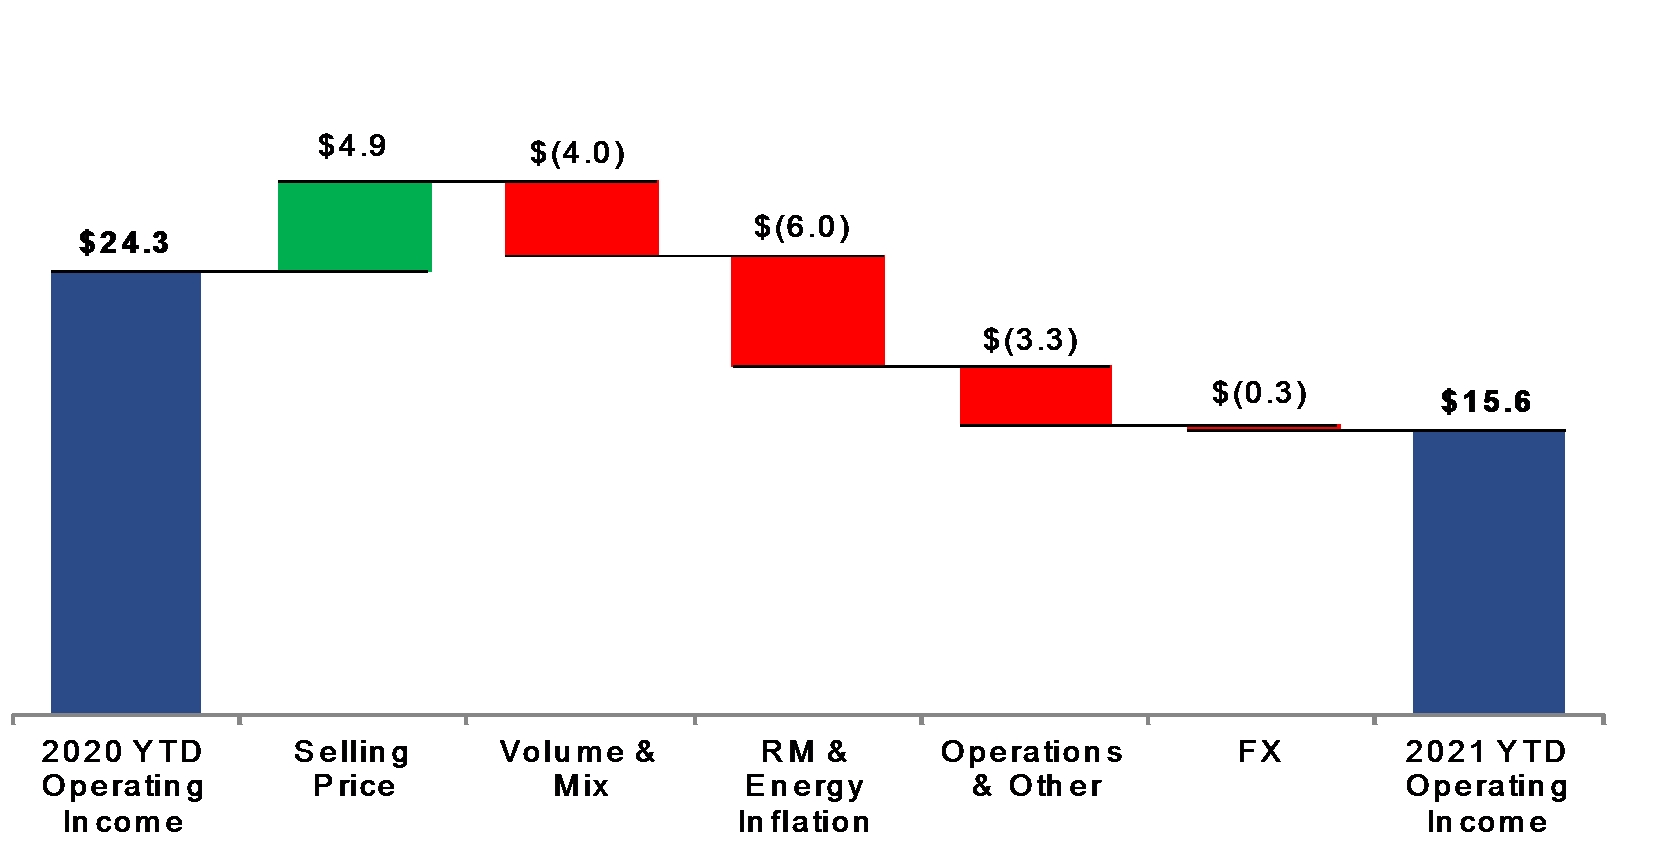
Spunlace net sales for the second quarter were approximately $96.9 million. An operating loss of $1.8 million was mainly driven by higher raw material and energy costs only partially offset by higher selling prices and energy surcharges.
Other and Unallocated The amount of “Other and Unallocated” operating expense not allocated to a reporting segment in our table ofthe Segment Financial Information totaled $17.3$7.0 million in the first six monthssecond quarter of 20212022 compared with $29.5$11.4 million in the first six months of 2020.same period a year ago. Excluding the items identified to present “adjusted earnings,” unallocated expenses for the comparison decreased $3.0 million.second quarter of 2022 increased $1.3 million compared to the second quarter of 2021.
Income taxes DuringIn the first six monthssecond quarter of 2021,2022, our income from continuing operations totaled $21.1$0.8 million and we recorded an income tax expense totaled $11.2provision of $3.3 million. On adjusted pre-tax income of $27.5$1.6 million, the income tax expense was $11.0$3.2 million in the first six monthssecond quarter of 2021.2022, which primarily related to reserves for uncertain tax positions and valuation allowances for losses for which no tax benefit could be recognized. The comparable amounts in the same periodquarter of 20202021 were $32.3adjusted pre-tax income of $12.0 million and $11.6 million, respectively. The income tax expense in the first six months of 2020 includes a $2.6$4.0 million, tax benefit recorded in connection with passage of the CARES Act. respectively.
The effective tax rate on adjusted earnings was 40% in the first six months of 2021.Foreign Currency We own and operate facilities in Canada, Germany, France, the United Kingdom, Spain, and the Philippines. The functional currency of our Canadian operations is the U.S. dollar. However, in Germany, France and FranceSpain, it is the Euro, in the UK, it is the British Pound Sterling,pound sterling, and in the Philippines the functional currency is the Peso.peso. On an annual basis, our Euroeuro denominated revenuenet sales exceeds Euroeuro expenses by an estimated €150 million. For the first sixthree months of 2021,ended June 30, 2022, the average currency exchange rate was 1.201.07 dollar/euro compared with 1.101.19 in the same period of 2020.2021. With respect to the British Pound Sterling,pound sterling, Canadian Dollar,dollar, and Philippine Peso,peso, we have differing amounts of inflows and outflows of these currencies, although to a lesser degree than the Euro.euro. As a result, we are exposed to changes in currency exchange rates and such changes could be significant. The translation of the results from international operations into U.S. dollars is subject to changes in foreign currency exchange rates.
The table below summarizes the translation impact on reported results that changes in currency exchange rates had on our non-U.S. based operations from the conversion of these operation’s results for the first six months of 2021.
In thousands | Six months ended June 30, 2021 | |
| Favorable (unfavorable) | |
Net sales | | | | $ | 29,814 | |
Costs of products sold | | | | | (28,760 | ) |
SG&A expenses | | | | | (1,884 | ) |
Income taxes and other | | | | | (422 | ) |
Net loss | | | | $ | (1,252 | ) |
- 31 -
GLATFELTER
Form 10-Q
The above table only presents the financial reporting impact of foreign currency translations assuming currency exchange rates in 2021 were the same as 2020. It does not present the impact of certain competitive advantages or disadvantages of operating or competing in multi-currency markets.
Three months ended June 30, 2021 versus the three months ended June 30, 2020
Overview For the second quarter of 2021, we reported income from continuing operations of $1.5 million, or $0.03 per diluted share compared with a net loss of $2.3 million, or $0.05 per share in the second quarter of 2020. On an adjusted basis earnings from continuing operations for the second quarter of 2021 was $8.0 million, or $0.18 per share compared with $9.9 million, or $0.22 per share, for the same period a year ago. The following table sets forth summarized results of operations:
| Three months ended June 30 | |
In thousands, except per share | 2021 | | | | 2020 | |
Net sales | $ | 244,911 | | | | $ | 216,183 | |
Gross profit | | 35,554 | | | | | 32,063 | |
Operating income | | 8,123 | | | | | 9,109 | |
Continuing operations | | | | | | | | |
Income (loss) | | 1,492 | | | | | (2,281 | ) |
Earnings (loss) per share | | 0.03 | | | | | (0.05 | ) |
Net income (loss) | | 1,410 | | | | | (2,416 | ) |
Earnings (loss) per share | $ | 0.03 | | | | $ | (0.05 | ) |
The following table sets forth the reconciliation of net income (loss) to adjusted earnings for the three months ended June 30, 2021 and 2020:
| | Three months ended June 30 | | |
| | 2021 | | | 2020 | | |
In thousands, except per share | | Amount | | | EPS | | | Amount | | | EPS | | |
Net income | | $ | 1,410 | | | $ | 0.03 | | | $ | (2,416 | ) | | $ | (0.05 | ) | |
Exclude: Loss from discontinued operations | | | 82 | | | | — | | | | 135 | | | | — | | |
Income (loss) from continuing operations | | | 1,492 | | | | 0.03 | | | | (2,281 | ) | | | (0.05 | ) | |
Adjustments (pre-tax) | | | | | | | | | | | | | | | | | |
Strategic initiatives | | | 7,831 | | | | | | | | — | | | | | | |
Corporate headquarters relocation | | | 206 | | | | | | | | — | | | | | | |
Restructuring charge - Metallized operations | | | — | | | | | | | | 5,067 | | | | | | |
Cost optimization actions | | | — | | | | | | | | 1,349 | | | | | | |
Pension settlement expenses, net | | | — | | | | | | | | 6,330 | | | | | | |
COVID 19 - incremental costs | | | — | | | | | | | | 1,180 | | | | | | |
Asset impairment charge | | | — | | | | | | | | 900 | | | | | | |
Timberland sales and related costs | | | (1,553 | ) | | | | | | | (601 | ) | | | | | |
Total adjustments (pre-tax) | | | 6,484 | | | | | | | | 14,225 | | | | | | |
Income taxes (1) | | | (50 | ) | | | | | | | (2,047 | ) | | | | | |
CARES Act of 2020 tax provision (2) | | | 90 | | | | | | | | — | | | | | | |
Total after-tax adjustments | | | 6,524 | | | | 0.15 | | | | 12,178 | | | | 0.27 | | |
Adjusted earnings | | $ | 8,016 | | | $ | 0.18 | | | $ | 9,897 | | | $ | 0.22 | | |
| (1)
| Tax effect on adjustments calculated based on the incremental effective tax rate of the jurisdiction in which each adjustment originated.
|
| (2)
| Tax benefit recorded in connection with passage of CARES related to provisions that modified the “net operating loss” provisions of previous law to allow certain losses to be carried back five years.
|
- 32 -
GLATFELTER
Form 10-Q
Segment Financial Performance
Three months ended June 30 | | | | | | | Other and | | | | |
Dollars in thousands | Composite Fibers | | | Airlaid Materials | | | Unallocated | | | Total | |
| 2021 | | | 2020 | | | 2021 | | | 2020 | | | 2021 | | | 2020 | | | 2021 | | | 2020 | |
Net sales | $ | 141,598 | | | $ | 122,137 | | | $ | 103,313 | | | $ | 94,046 | | | $ | — | | | $ | — | | | $ | 244,911 | | | $ | 216,183 | |
Cost of products sold | | 119,334 | | | | 100,387 | | | | 90,138 | | | | 77,581 | | | | (115 | ) | | | 6,152 | | | | 209,357 | | | | 184,120 | |
Gross profit (loss) | | 22,264 | | | | 21,750 | | | | 13,175 | | | | 16,465 | | | | 115 | | | | (6,152 | ) | | | 35,554 | | | | 32,063 | |
SG&A | | 11,201 | | | | 10,263 | | | | 4,744 | | | | 4,173 | | | | 13,039 | | | | 9,115 | | | | 28,984 | | | | 23,551 | |
Gains on dispositions of plant, equipment and timberlands, net | | — | | | | — | | | | — | | | | — | | | | (1,553 | ) | | | (597 | ) | | | (1,553 | ) | | | (597 | ) |
Total operating income (loss) | | 11,063 | | | | 11,487 | | | | 8,431 | | | | 12,292 | | | | (11,371 | ) | | | (14,670 | ) | | | 8,123 | | | | 9,109 | |
Non-operating expense | | — | | | | — | | | | — | | | | — | | | | (2,610 | ) | | | (8,837 | ) | | | (2,610 | ) | | | (8,837 | ) |
Income (loss) before income taxes | $ | 11,063 | | | $ | 11,487 | | | $ | 8,431 | | | $ | 12,292 | | | $ | (13,981 | ) | | $ | (23,507 | ) | | $ | 5,513 | | | $ | 272 | |
Supplementary Data | | | | | | | | | | | | | | | | | | | | | | | | | | | | | | | |
Net tons sold | | 34,471 | | | | 29,032 | | | | 34,315 | | | | 33,277 | | | | — | | | | — | | | | 68,786 | | | | 62,309 | |
Depreciation, depletion and amortization ($ in thousands) (1) | $ | 7,000 | | | $ | 6,431 | | | $ | 6,767 | | | $ | 5,473 | | | $ | 966 | | | $ | 2,302 | | | $ | 14,733 | | | $ | 14,206 | |
Capital expenditures | | 2,882 | | | | 2,105 | | | | 1,297 | | | | 1,712 | | | | 1,653 | | | | 1,180 | | | | 5,832 | | | | 4,997 | |
The sum of individual amounts set forth above may not agree to the condensed consolidated financial statements included herein due to rounding
Sales and Costs of Products Sold
| Three months ended June 30 | | | | | | | |
In thousands | 2021 | | | | 2020 | | | | Change | | |
Net sales | $ | 244,911 | | | | $ | 216,183 | | | | $ | 28,728 | | |
Costs of products sold | | 209,357 | | | | | 184,120 | | | | | 25,237 | | |
Gross profit | $ | 35,554 | | | | $ | 32,063 | | | | $ | 3,491 | | |
Gross profit as a percent of Net sales | | 14.5 | % | | | | 14.8 | % | | | | | | |
The following table sets forth the contribution to consolidated net sales by each segment:
| Three months ended June 30 | |
Percent of Total | 2021 | | | | 2020 | |
Segment | | | | | | | | |
Composite Fibers | | 57.8 | % | | | | 56.5 | % |
Airlaid Materials | | 42.2 | | | | | 43.5 | |
Total | | 100.0 | % | | | | 100.0 | % |
Net sales totaled $244.9 million and $216.2 million in the second quarters of 2021 and 2020, respectively. On a constant currency basis, Composite Fibers’ net sales increased by 7.1% and Airlaid Materials’ increased by 5.0%.
Composite Fibers’ net sales increased $19.5 million or 15.9% in the second quarter of 2021, compared to the year-ago quarter, mainly driven by a 95% increase in our wallcover sales from the trough of the pandemic in 2020 and favorable currency translation of $10.7 million. Overall shipments, excluding metallized, which was restructured in the second quarter of 2020, were up 26% versus the second quarter of 2020.
Composite Fibers’ operating income of $11.1 million was $0.4 million lower, compared to the second quarter of 2020. Raw material and energy prices were $6.0 million higher than the same period last year and partly offset by approximately $2.0 million of price increases. In addition, the higher sales volume for wallcover, electrical, and coffee products, combined with increased production to meet customer demand, fully offset input price inflation. The impact of currency and related hedging activity negatively impacted earnings by $0.6 million. The primary drivers are summarized in the following chart:
- 33 -
GLATFELTER
Form 10-Q
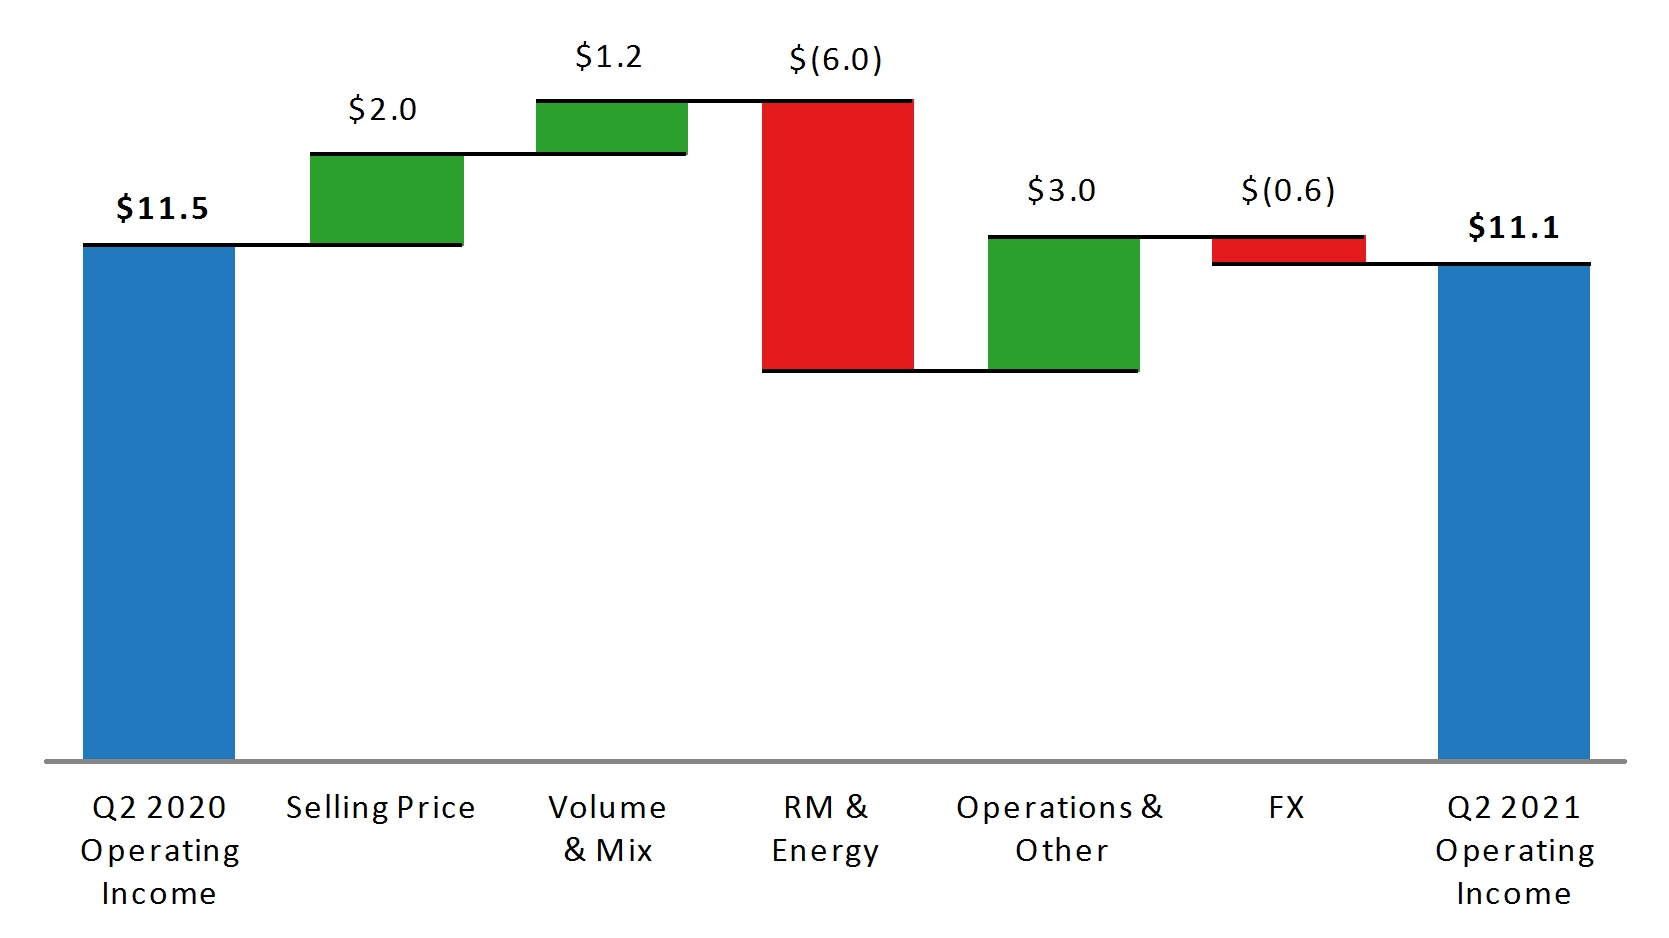
Airlaid Materials’ net sales increased $9.3 million in the year-over-year comparison, including six weeks of sales from the recent Mount Holly acquisition. Shipments were 3.1% higher driven by Mount Holly, as well as a significant increase in tabletop demand as in-person dining began to recover globally. These increases were partially offset by lower shipments in the hygiene and wipes categories related to customer destocking from elevated inventory levels maintained during the pandemic. Currency translation was $4.6 million favorable.
Airlaid Materials’ second quarter 2021 operating income of $8.4 million was $3.9 million lower when compared to the second quarter of 2020. Higher shipments were more than offset by unfavorable mix negatively impacting earnings by $0.9 million while operations were $1.9 million unfavorable driven by lower production to adjust to customer demand and manage inventory levels. Selling price increases due to raw material pass-through provisions were more than offset by higher raw material and energy prices, reducing earnings by net $0.8 million. The impact of currency and related hedging activity negatively impacted earnings by $0.3 million. The primary drivers are summarized in the following chart:
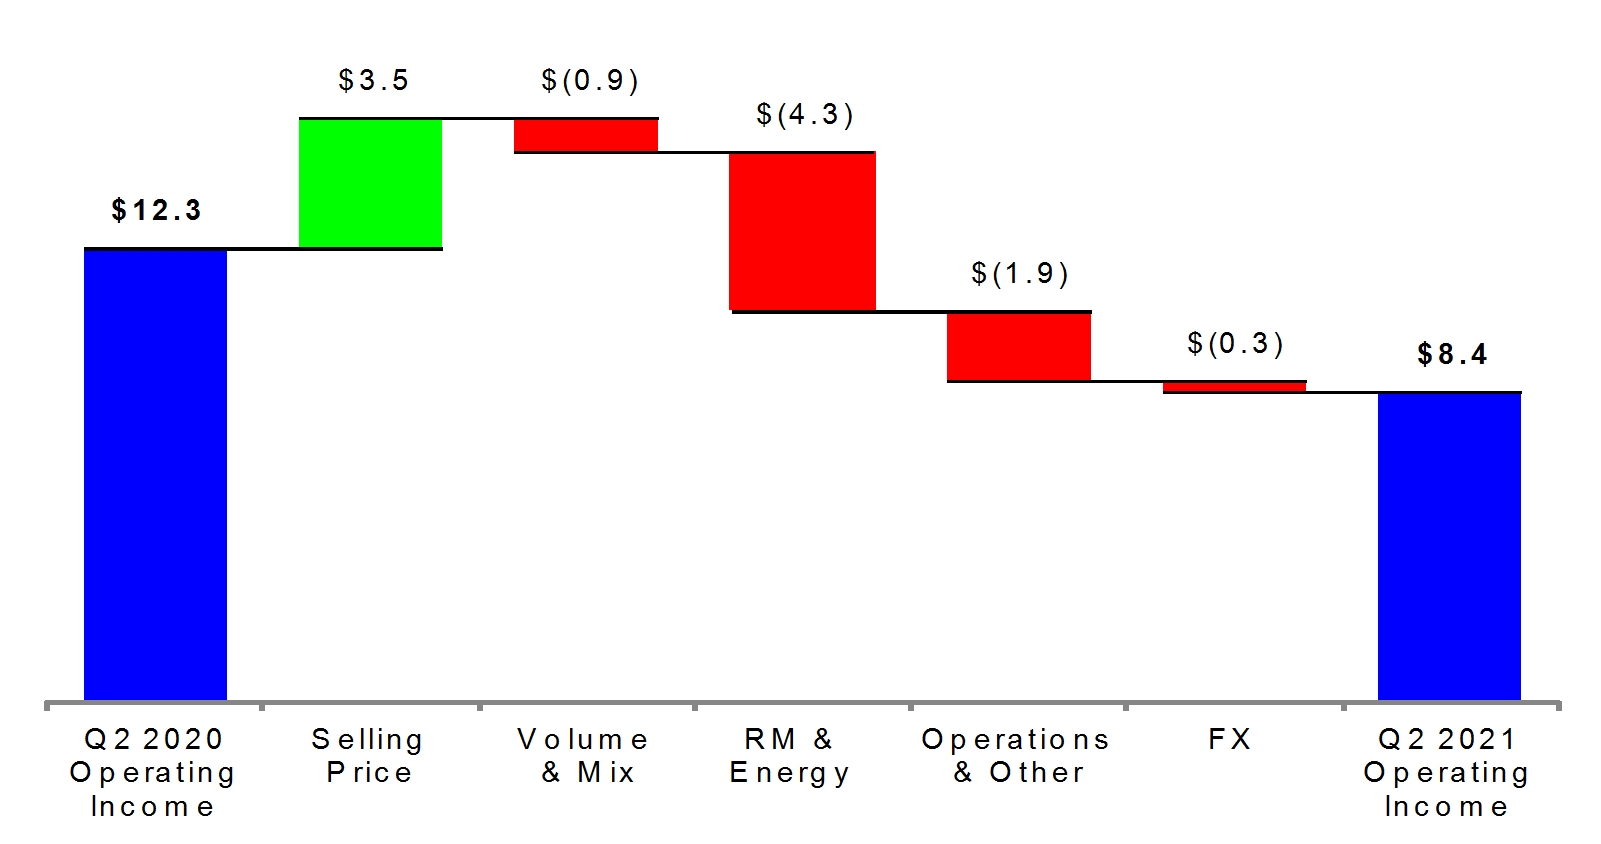
Other and Unallocated The amount of “Other and Unallocated” operating expense in our table of Segment Financial Performance totaled $11.4 million in the second quarter of 2021 compared with $14.7 million in the second quarter of 2020. Excluding the items identified to present “adjusted earnings,” unallocated expenses for the second quarter of 2021 decreased $1.9 million compared to the second quarter of 2020.
Income Taxes In the second quarter of 2021, income from continuing operations totaled $5.5 million and income tax expense totaled $4.0 million. On adjusted pre-tax income of $12.0 million, income tax expense was $4.0 million in the second quarter of 2021.
- 34 -
GLATFELTER
Form 10-Q
The comparable amounts in the same quarter of 2020 were $14.5 million and $4.6 million, respectively. The effective tax rate on adjusted earnings was 33% in the second quarter of 2021.
Foreign Currency For the three months ended June 30, 2021, the average currency exchange rate was 1.21 dollar/euro compared with 1.10 in the same period of 2020. The table below summarizes the translation impact on reported results that changes in currency exchange rates had on our non-U.S. based operations from the conversion of these operation’s results for the second quarter of 2021.
2022.In thousands | Three months ended June 30, 2021 | | |
| Favorable (unfavorable) | | |
Net sales | | | | $ | 15,287 | | |
Costs of products sold | | | | | (15,173 | ) | |
SG&A expenses | | | | | (1,021 | ) | |
Income taxes and other | | | | | (221 | ) | |
Net loss | | | | $ | (1,128 | ) | |
| | | | | |
| In thousands | Three months ended June 30, 2022 |
| Favorable
(unfavorable)
|
| Net sales | $ | (20,875) | |
| Costs of products sold | 21,553 | |
| SG&A expenses | 1,384 | |
| Income taxes and other | 190 | |
| Net loss | $ | 2,252 | |
The above table only presents the financial reporting impact of foreign currency translations assuming currency exchange rates in
20212022 were the same as
2020.2021. It does not present the impact of certain competitive advantages or disadvantages of operating or competing in multi-currency markets.
LIQUIDITY AND CAPITAL RESOURCES
Our business requires significant expenditures for new or enhanced equipment, to support our research and development efforts, and to support our business strategy. In addition, we have mandatory debt service requirements of both principal and interest. The following table summarizes cash flow information for each of the periods presented:
| Six months ended June 30 | | |
In thousands | 2021 | | | | 2020 | | |
Cash, cash equivalents and restricted cash at the beginning of period | $ | 111,665 | | | | $ | 126,201 | | |
Cash provided (used) by | | | | | | | | | |
Operating activities | | 1,365 | | | | | (912 | ) | |
Investing activities | | (181,136 | ) | | | | (11,448 | ) | |
Financing activities | | 165,138 | | | | | (23,175 | ) | |
Effect of exchange rate changes on cash | | (1,432 | ) | | | | (123 | ) | |
Change in cash and cash equivalents from discontinued operations | | (238 | ) | | | | (945 | ) | |
Net cash used | | (16,303 | ) | | | | (36,603 | ) | |
Cash, cash equivalents and restricted cash at the end of period | | 95,362 | | | | | 89,598 | | |
Less: restricted cash in Prepaid and other current assets | | (2,000 | ) | | | | (2,000 | ) | |
Less: restricted cash in Other assets | | (9,197 | ) | | | | (10,979 | ) | |
Cash and cash equivalents at the end of period | $ | 84,165 | | | | $ | 76,619 | | |
| | | | | | | | | | | |
| | Six months ended June 30, |
| In thousands | 2022 | | 2021 |
| Cash, cash equivalents and restricted cash at the beginning of period | $ | 148,814 | | | $ | 111,665 | |
| Cash provided (used) by | | | |
| Operating activities | (79,535) | | | 1,365 | |
| Investing activities | (18,136) | | | (181,136) | |
| Financing activities | 33,546 | | | 165,138 | |
| Effect of exchange rate changes on cash | (3,587) | | | (1,432) | |
| Change in cash and cash equivalents from discontinued operations | (231) | | | (238) | |
| Net cash used | (67,943) | | | (16,303) | |
| Cash, cash equivalents and restricted cash at the end of period | 80,871 | | | 95,362 | |
| Less: restricted cash in Prepaid and other current assets | (2,000) | | | (2,000) | |
| Less: restricted cash in Other assets | (7,395) | | | (9,197) | |
| Cash and cash equivalents at the end of period | $ | 71,476 | | | $ | 84,165 | |
At June 30, 2021,2022, we had $84.2$71.5 million in cash and cash equivalents (“cash”) held by both domestic and foreign subsidiaries. Approximately 72.5%89.3% of our cash and cash equivalents is held by our foreign subsidiaries but could be repatriated without incurring a significant amount of additional taxes.
In addition to cash, as of June 30, 2021, $113.0 million was available under our existing revolving credit agreement.Cash providedused by operating activities in the first six months of 20212022 totaled $1.4$79.5 million compared with a usecash provided by operating activities of $(0.9)$1.4 million in the same period a year ago. The change in operating cash flow reflects a $5.8 millionThe increase was primarily due to an increase in earnings before interest, taxes, depreciation and amortization, as well as by improved working capital usage, primarily accounts receivable, inventory and the termination of a factoring arrangement previously utilized by certain former Jacob Holm entities, an $11.5 million reduction in adjusted EBITDA, a $7.6 million increase in income taxes paid and a $13.0 million increase in interest paid.
| | | | | | | | | | | | | | |
| Adjusted EBITDA | | Six months ended June 30, |
| In thousands | | 2022 | | 2021 |
| | | | |
| Net income (loss) | | $ | (110,379) | | | $ | 9,804 | |
| Exclude: Income (loss) from discontinued operations, net of tax | | (371) | | | 82 | |
| Add back: Taxes on Continuing operations | | (13,489) | | | 11,211 | |
| Depreciation and amortization | | 34,936 | | | 28,466 | |
| Interest expense, net | | 15,479 | | | 3,272 | |
| EBITDA | | (73,824) | | | 52,835 | |
| Adjustments: | | | | |
| Goodwill and other asset impairment charges | | 117,349 | | | — | |
| Russia/Ukraine conflict charges | | 3,948 | | | — | |
| Strategic initiatives | | 2,488 | | | 8,434 | |
Share-based compensation (1) | | 2,419 | | | 2,537 | |
| | | | |
| | | | |
| Corporate headquarters relocation | | 223 | | | 361 | |
| Cost optimization actions | | 589 | | | — | |
| | | | |
| Timberland sales and related costs | | (2,962) | | | (2,403) | |
| Adjusted EBITDA | | $ | 50,230 | | | $ | 61,764 | |
(1)Adjusted EBITDA for 2021 has been restated to add back share-based compensation consistent with our amended credit agreement. The share-based compensation adjustment represents the non-cash amount of share-based compensation expense included in results of operations.
EBITDA is a measure used by management to assess our operating performance and is calculated using income (loss) from accounts payable. These factors were partially offset bycontinuing operations and excludes interest expense, interest income, income taxes and depreciation and amortization. Adjusted EBITDA is calculated using EBITDA and further excludes certain items management considers to be unrelated to the paymentcompany’s core operations. The adjustments include asset impairment charges, costs of approximately $11.8 million relatedstrategic initiatives, certain cost optimization and restructuring activities, corporate headquarters relocation expenses, as well as the elimination of gains
from sales of timberlands. Adjusted EBITDA is a performance measure that excludes costs that we do not consider to
value-added tax liabilities identified in the first quarter while reviewing certain customer sales arrangements. We expect to fully recover these payments from customers during the second halfbe indicative of
2021.- 35 -
GLATFELTER
Form 10-Q
our ongoing operating performance.
Net cash used by investing activities was
$181.1$18.1 million compared with
$11.4$181.1 million in the same period a year ago.
The increase was due toDuring the
Mountsix months ended June 30, 2021, we used $172.3 million for the Mount. Holly acquisition. Capital expenditures totaled
$11.2$22.7 million and
$12.0$11.2 million for the six months ended June 30,
20212022 and
2020,2021, respectively, and are expected to be
$30$45 million to
$35$50 million,
including $7 million to $8 million for Spunlace integration, for the full year
2021.2022.
Net cash provided by financing activities totaled
$165.1$33.5 million in the first six months of
20212022 compared with
a use of $23.2$165.1 million in the same period of
2020.2021. The change in financing activities primarily reflects
$160 milliona decrease in
additional borrowings under our revolving credit
agreement. In 2021, we used borrowings under the revolving credit facility to
fundpay for the Mount Holly
acquisition, and $11.7 million short-term borrowing, the proceeds of which were used for general purposes.The 2019 Facilityacquisition.
As discussed in Item 1 - Financial Information, Note - 16, our Credit Agreement contains a number of customary compliance covenants, the most restrictive of which is a maximum leverage ratio of 4.0x provided that such ratio increases to 4.5x during the period of four fiscal quarters immediately following a material acquisition.covenants. As of June 30, 2021,2022, the leverage ratio, as calculated in accordance with the definition in our amended credit agreement,Credit Agreement, was 3.0x,5.3x, well within the limits set forthmaximum limit allowed under our Credit Agreement. A breach of these requirements would give rise to certain remedies under the Revolving Credit Facility, among which are the termination of the agreement and accelerated repayment of the outstanding borrowings plus accrued and unpaid interest under the Credit Agreement. As discussed in Note 16 - “Long Term Debt,” on May 9, 2022, we amended our credit agreement. In July 2021, we announced a definitive agreementCredit Agreement to acquire Jacob Holm in a transaction valued at $308 million. In connection withincrease the transaction, we have obtained commitments formaximum leverage ratio to 6.75 to 1.0 until the necessary financing and we intendquarter ended December 31, 2023, after which the maximum ratio will step down to fund the acquisition with unsecured debt. In addition, we intend4.0 to pursue extending the maturity1.0.
Details of our revolving credit facility. Based on our expectations of future results of operations and capital needs, we do not believe the debt covenants will impact our operations or limit our ability to undertake financings that may be necessary to meet our capital needs.The following table sets forth our outstanding long-term indebtedness:
indebtedness are set forth under Item 1 - Financial Statements – Note 16 -“Long-Term Debt." | | June 30 | | | | December 31 | |
In thousands | | 2021 | | | | 2020 | |
Revolving credit facility, due Feb. 2024 | | $ | 213,478 | | | | $ | 36,813 | |
Term Loan, due Feb. 2024 | | | 235,303 | | | | | 249,715 | |
2.40% Term Loan, due Jun. 2022 | | | 1,698 | | | | | 2,629 | |
2.05% Term Loan, due Mar. 2023 | | | 11,100 | | | | | 14,737 | |
1.30% Term Loan, due Jun. 2023 | | | 3,396 | | | | | 4,382 | |
1.55% Term Loan, due Sep. 2025 | | | 6,189 | | | | | 7,143 | |
Total long-term debt | | | 471,164 | | | | | 315,419 | |
Less current portion | | | (24,267 | ) | | | | (25,057 | ) |
Unamortized deferred issuance costs | | | (1,636 | ) | | | | (1,898 | ) |
Long-term debt, net of current portion | | $ | 445,261 | | | | $ | 288,464 | |
Financing activities include cash used for common stock dividends. In both the first six months of 20212022 and 2020,2021, we used $12.0$12.5 million and $11.5$12.0 million, respectively, of cash for dividends on our common stock. Our Board of Directors determines what, if any, dividends will be paid to our shareholders. In the second quarter of 2021, our quarterly dividend was increased by 3.7% to $0.14 per share. Dividend payment decisions are based upon then-existing factors and conditions and, therefore, historical trends of dividend payments are not necessarily indicative of future payments.
We are subject to various federal, state and local laws and regulations intended to protect the environment, as well as human health and safety. At various times, we have incurred significant costs to comply with these regulations and we could incur additional costs as new regulations are developed or regulatory priorities change.
At June 30,
2021,2022, we had ample liquidity consisting of
$84.2$71.5 million of cash on hand and
$113.0$131.6 million of capacity under our revolving credit facility. We expect to meet all of our near and long-term cash needs from a combination of operating cash flow, cash and cash equivalents, our existing credit facility and other long-term debt.
Off-Balance-Sheet Arrangements As of June 30, 20212022 and December 31, 2020,2021, we had not entered into any off-balance-sheet arrangements. Financial derivative instruments, to which we are a party, and guarantees of indebtedness, which solely consist of obligations of subsidiaries, are reflected in the condensed consolidated balance sheets included herein in Item 1 – Financial Statements. -
3641 -
GLATFELTER
Form 10-Q
ITEM 3. QUANTITATIVE AND QUALITATIVE DISCLOSURES ABOUT MARKET RISKS
| | | Year Ended December 31 | | | June 30, 2021 | | | | Year Ended December 31 | | June 30, 2022 |
In thousands, except percentages | | 2021 | | | 2022 | | | 2023 | | | 2024 | | | 2025 | | | Carrying Value | | | Fair Value | | | In thousands, except percentages | 2022 | | 2023 | | 2024 | | 2025 | | 2026 | | Carrying Value | | Fair Value |
Long-term debt | | | | | | | | | | | | | | | | | | | | | | | | | | | | | | | Long-term debt | | | | | | | | | | | | | |
Average principal outstanding | | | | | | | | | | | | | | | | | | | | | | | | | | | | | | | Average principal outstanding | | | | | | | | | | | | | |
At variable interest rates | | $ | 442,245 | | | $ | 432,441 | | | $ | 419,368 | | | $ | 62,681 | | | $ | — | | | | $ | 448,781 | | | $ | 448,781 | | | At variable interest rates | $ | 272,541 | | $ | 261,116 | | | $ | 255,403 | | | $ | 81,161 | | | $ | 54,700 | | | $ | 275,398 | | | $ | 275,398 | |
At fixed interest rates – Term Loans | | | 25,927 | | | | 16,994 | | | | 8,289 | | | | 2,137 | | | | 437 | | | | | 22,383 | | | | 22,589 | | | At fixed interest rates – Term Loans | 533,306 | | 521,934 | | 502,221 | | 500,382 | | 500,000 | | 537,163 | | | 385,434 | |
| | | | | | | | | | | | | | | | | | | | | | | $ | 471,164 | | | $ | 471,370 | | | | | $ | 812,561 | | | $ | 660,832 | |
Weighted-average interest rate | | | | | | | | | | | | | | | | | | | | | | | | | | | | | | | Weighted-average interest rate | | | | |
On variable rate debt | | | 1.32 | % | | | 1.32 | % | | | 1.32 | % | | | 1.32 | % | | | — | | | | | | | | | | | | On variable rate debt | 2.44 | % | | 2.44 | % | | 2.44 | % | | 2.44 | % | | 2.44 | % | | | | |
On fixed rate debt – Term Loans | | | 1.87 | % | | | 1.84 | % | | | 1.83 | % | | | 1.62 | % | | | 1.55 | % | | | | | | | | | | | On fixed rate debt – Term Loans | 4.51 | % | | 4.58 | % | | 4.74 | % | | 4.75 | % | | 4.75 | % | | | | |
| | | | | | | | | | | | | | | | | | | | | | | | | | | | | | | |
Interest rate swap | | | | | | | | | | | | | | | | | | | | | | | | | | | | | | | |
Pay fixed/received variable (notional) | | € | 180,000 | | | € | 180,000 | | | € | 180,000 | | | | — | | | | — | | | | | | | | | | | | |
Rate paid | | | 0.0395 | % | | | 0.0395 | % | | | 0.0395 | % | | | — | | | | — | | | | | | | | | | | | |
Rate received | | | — | | | | — | | | | — | | | | — | | | | — | | | | | | | | | | | | |
The table above presents the average principal outstanding and related interest rates for the next five years for debt outstanding as of June 30,
2021.2022. Fair values included herein have been determined based upon rates currently available to us for debt with similar terms and remaining maturities.
Our market risk exposure primarily results from changes in interest rates and currency exchange rates. At June 30,
2021,2022, we had
$469.5$812.6 million of long-term debt,
net of unamortized debt issuance costs, of which
95.6%33.9% was at variable interest rates.
After giving effect to the interest rate swap agreement, approximately 50% of our debt was at variable interest rates. The fixed rate Term Loans and the variable rate debt are primarily euro-based borrowings and thus the value of which is also subject to currency risk. Variable-rate debt
outstanding represents borrowings under our
revolving credit agreement
primarily Euro-denominated, that accrues interest based on one-month
U.S. Dollar LIBOR or one-month Euro LIBOR
indexes, but in no event less than zero, plus the applicable margin.
In addition, variable-rate debt includes U.S. dollar denominated borrowings that accrue interest based on one-month U.S. dollar LIBOR. At June 30,
2021,2022, the weighted-average interest rate paid was equal to
1.32%2.44%. A hypothetical 100 basis point increase in the interest rate on variable rate debt would increase annual interest expense by
$1.9$1.6 million. In the event rates are 100 basis points lower, interest expense would be
$0.1$0.5 million lower.
We entered into a €180 million notional value floating-to-fixed interest rate swap agreement with certain financial institutions. Under the terms of the swap, we will pay a fixed interest rate of 0.0395% on €180 million of the underlying variable rate term loan. We will receive the greater of 0.00% or EURIBOR.
As part of our overall risk management practices, we enter into financial derivatives primarily designed to either i) hedge foreign currency risks associated with forecasted transactions – “cash flow hedges”; or ii) mitigate the impact that changes in currency exchange rates have on intercompany financing transactions and foreign currency denominated receivables and payables – “foreign currency hedges.” For a more complete discussion of this activity, refer to Item 1 – Financial Statements – Note
20.18.
We are subject to certain risks associated with changes in foreign currency exchange rates to the extent our operations are conducted in currencies other than the U.S. Dollar. On an annual basis, our Euro denominated revenue exceeds euro expenses by an estimated €150 million. With respect to the British Pound Sterling, Canadian Dollar, and Philippine Peso, we have differing amounts of inflows and outflows of these currencies, although to a lesser degree than the Euro. As a result, particularly with respect to the Euro, we are exposed to changes in currency exchange rates and such changes could be significant.
Long- and indefinite-lived Assets We evaluate the recoverability of our long- and indefinite-lived assets, including plant, equipment, timberlands, goodwill, and other intangible assets periodically or whenever events or changes in circumstances indicate that the carrying amounts may not be recoverable. Goodwill is reviewed for impairment annually during the fourth quarter, or more frequently if impairment indicators are present.
The fair value of our reporting units, which are also our operating segments, is determined using a market approach and a discounted cash flow model. Our evaluations include a variety of qualitative factors and analyses based on estimates of future cash flows expected to be generated from the use of the underlying assets, trends or other determinants of fair value. If the value of an asset determined by these evaluations is less than its carrying amount, a loss is recognized for the difference between the fair value and the carrying value of the asset. Our Airlaid Materials segment’s fair value substantially exceeded its carrying value at the time of its last valuation performed in connection with the last annual impairment test in the fourth quarter of 2021. Our Composite Fibers segment, having performed its last valuation and having recognized a goodwill impairment in the first quarter of 2022, has a fair value that approximates its carrying value. Our Spunlace segment, which was formed in conjunction with the Jacob Holm acquisition on October 29, 2021, also has a fair value that approximates its carrying value. Both Composite Fibers’ and Spunlace’s fair value could be impacted by factors such as unexpected changes in inflation, significant disruptions in the delivery of energy to our sites, particularly in Europe, or the Company’s inability to continue to increase selling prices in response to inflationary pressures. Future adverse changes such as these or in market conditions or poor operating results of the related business may indicate an inability to recover the carrying value of the assets, thereby possibly requiring an impairment charge in the future.
ITEM 4. CONTROLS AND PROCEDURES
Evaluation of Disclosure Controls and Procedures Our Chief Executive Officer and our principal financial officer, after evaluating the effectiveness of our disclosure controls and procedures (as defined in Exchange Act Rules 13a-15(e) and 15d-15(e)) as of June 30, 2021,2022, have concluded that, as of the evaluation date, our disclosure controls and procedures are effective. Changes in Internal Controls On May 13, 2021, we complete the Mount Holly acquisition. We are in the process of incorporating Mount Holly’s internal controls into our structure. We consider the ongoing integration of Mount Holly a material change in our internal control over financial reporting. There were no other changes in our internal control over financial reporting during the three months ended June 30, 2021,2022, that have materially affected or are reasonably likely to materially affect our internal control over financial reporting. -
3743 -
GLATFELTER
Form 10-Q
PART II – OTHER INFORMATION
ITEM 1A. RISK FACTORS
The following updated risk factor should be considered in addition to the risk factors set forth under Part I, Item 1A. Risk Factors in our 2021 Form 10-K. Except as described herein, there have been no material changes with respect to the risk factors disclosed in our 2021 Form 10-K.
The conflict between Russia and Ukraine has adversely affected, and may continue to adversely affect, our business, financial condition, and results of operations.
Approximately $95 million of our net sales in 2021, or 7.3% of our net sales in 2021, was earned from customers located in Russia and Ukraine. The geopolitical conditions resulting from the Russia/Ukraine military conflict, including government-imposed sanctions and the current macroeconomic climate in Russia and Ukraine, have adversely impacted both demand for our products and our ability to deliver products to this region, as well as, limited customers' access to financial resources and their ability to satisfy obligations to us. For example, as a direct result of the military conflict, economic sanctions, and the disruptions in the region’s financial systems, our management expects a significant reduction in wallcover revenues and cash flows, for the foreseeable future, from our facility located in Dresden, Germany that produces wallcover paper, a significant portion of which historically was sold into the Ukraine and Russian markets. Certain wallcover base paper, together with certain filtration products produced by our Composite Fibers segment, are subject to sanction restrictions and currently are unable to be sold into the Russian market. As a result, during the first six months of 2022, we recorded a $117.3 million non-cash asset impairment charge related to assets of our Dresden facility and an impairment of our Composite Fibers business' goodwill. Moreover, certain customers have not been able to satisfy outstanding accounts receivables and, as such, during the first six months of 2022, we recognized bad debt expense of approximately $2.9 million directly related to Russian and Ukrainian customers. At June 30, 2022, we had accounts receivable, net of reserves, from customers in this region totaling approximately $2.6 million which we expect to collect in normal course.
In addition, we operate manufacturing sites elsewhere in Europe that have been adversely impacted as a result of the military conflict in Ukraine and related geopolitical events and sanctions. In many instances, these sites depend on the availability of natural gas for use in the production of products. The supply of a substantial portion of the natural gas used may originate from Russia. We expect that shortages in supply and increases in costs of natural gas will adversely impact our ability to operate these sites in an efficient and cost-effective manner, for the foreseeable future.
The risk of cyber-security incidents and cyber attacks has increased in connection with the ongoing conflict, driven by justifications such as retaliation for the sanctions imposed in conjunction with the conflict. It is possible that such incidents or attacks could have collateral effects on additional critical infrastructure and financial institutions globally, which could adversely affect our operations and could increase the frequency and severity of cyber-based attacks against our information technology systems. The proliferation of malware from the conflict, into systems unrelated to the conflict, or cyberattacks against U.S. companies in retaliation for U.S. sanctions against Russia or U.S. support of Ukraine, could also adversely affect our operations and our supply chain.
To the extent the current conflict adversely affects our business, financial condition and results of operations, it may also have the effect of heightening many other risks disclosed in Part I, Item 1A. Risk Factors in our 2021 Form 10-K, any of which could materially and adversely affect our business and results of operations, however, due to the continually evolving nature of the conflict, the potential impact that the conflict could have on such risk factors, and others that cannot yet be identified, remains uncertain.
In the event that current geopolitical tensions fail to abate, or deteriorate further, or additional governmental sanctions are enacted against the Russian economy or its banking and monetary systems, we may face additional adverse consequences to our business and results of operations. Even if the conflict moderates or a resolution between Ukraine and Russia is reached, we expect that we will continue to experience ongoing adverse consequences to our business, financial condition and results of operation resulting from the conflict for the foreseeable future, including because certain of the economic and other sanctions imposed, or that may be imposed, against Russia may continue for a period of time after any resolution has been reached.
The following exhibits are filed
or furnished herewith or incorporated by reference as indicated.
| | | | | | | | |
31.1
| | Incorporated by reference to |
| 31.1 | | |
| 31.2 | |
31.2
| | |
| 32.1 | |
32.1
| | |
| 32.2 | |
32.2
| | |
| 10.1 | | Ex. 10.1 to Form 8-K filed May 10, 2022 |
101.INS
10.2 | | Ex. 99.1 to Form S-8 filed May 11, 2022 |
| 10.3 | | |
| 10.4 | | |
| 10.5 | | |
| 10.6 | | |
| 10.7 | | |
| 101.INS | Inline XBRL Instance Document – the instance document does not appear in the Interactive Data file because its iXBRL tags are embedded within the Inline XBRL document. | |
| 101.SCH | |
101.SCH
| Inline XBRL Taxonomy Extension Schema. | |
| 101.CAL | |
101.CAL
| Inline XBRL Extension Calculation Linkbase. | |
| 101.DEF | |
101.DEF
| Inline XBRL Extension Definition Linkbase. | |
| 101.LAB | |
101.LAB
| Inline XBRL Extension Label Linkbase. | |
| 101.PRE | |
101.PRE
| Inline XBRL Extension Presentation Linkbase. | |
| 104 | |
104
| Cover Page Interactive Data File (formatted as an inline XBRL and contained in Exhibit 101). | |
-
3845 -
GLATFELTER
Form 10-Q
Pursuant to the requirements of Section 13 or 15(d) of the Securities Exchange Act of 1934, the Registrant has duly caused this report to be signed on its behalf by the undersigned, thereunto duly authorized.
| Glatfelter Corporation
(Registrant)
| | | | | | | | | | |
| | | Glatfelter Corporation (Registrant) |
August 3, 2021
| | | |
| August 2, 2022 | | | |
| By
| |
|
| By | | /s/ David C. Elder |
| | | David C. Elder |
| | | Vice President, Finance and Chief Accounting Officer (Principal Accounting Officer) |
-
3946 -
GLATFELTER
Form 10-Q