
UNITED STATES
SECURITIES AND EXCHANGE COMMISSION
Washington, D.C. 20549
Form 10-Q
(Mark One)
☑ |
| QUARTERLY REPORT PURSUANT TO SECTION 13 OR 15(d) OF THE SECURITIES EXCHANGE ACT OF 1934 |
For the quarterly period ended March 31, 20222023
or
☐ |
| TRANSITION REPORT PURSUANT TO SECTION 13 OR 15(d) OF THE SECURITIES EXCHANGE ACT OF 1934 |
For the transition period from to
Commission File Number: 001-36228
Navient Corporation
(Exact name of registrant as specified in its charter)
Delaware | 46-4054283 |
(State or other jurisdiction of incorporation or organization) | (I.R.S. Employer Identification No.) |
123 Justison Street, Wilmington, Delaware19801 |
|
(Address of principal executive offices) | ( |
(302)283-8000
(Registrant’s telephone number, including area code)
(Former name, former address and former fiscal year, if changed since last report)
Indicate by check mark whether the registrant: (1) has filed all reports required to be filed by Section 13 or 15(d) of the Securities Exchange Act of 1934 during the preceding 12 months (or for such shorter period that the registrant was required to file such reports), and (2) has been subject to such filing requirements for the past 90 days. days. Yes☑ No ☐
Indicate by check mark whether the registrant has submitted electronically every Interactive Data File required to be submitted pursuant to Rule 405 of Regulation S-T (§(§ 232.405 of this chapter)during the preceding 12 months (or for such shorter period that the registrant was required to submit such files). Yes☑ No ☐
Indicate by check mark whether the registrant is a large accelerated filer, an accelerated filer, a non-accelerated filer, a smaller reporting company, or an emerging growth company. See the definitions of “large accelerated filer,” “accelerated filer,” “smaller reporting company”company,” and “emerging growth company” in Rule 12b-2 of the Exchange Act. (Check one):
Large accelerated filer |
| ☒ |
| Accelerated filer | ☐ | ||
Non-accelerated filer |
| ☐ | Smaller reporting company | ☐ | |||
Emerging growth company | ☐ | ||||||
If an emerging growth company, indicate by check mark if the registrant has elected not to use the extended transition period for complying with any new or revised financial accounting standards provided pursuant to Section 13(a) of the Exchange Act. ☐
Indicate by check mark whether the registrant is a shell company (as defined in Rule 12b-2 of the Exchange Act). Yes ☐ No ☑
SecuSecurities registered pursuant to Section 12(b) of the Act.rities
registeredpursuanttoSection12(b)oftheAct.
Title of each class | Trading Symbol(s) |
| ||
Common stock, par value $.01 per share | NAVI | The NASDAQ Global Select Market | ||
6% Senior Notes due December 15, 2043 | JSM | The NASDAQ Global Select Market | ||
Preferred Stock Purchase Rights | None | The NASDAQ Global Select Market |
As of March 31, 2022,2023, there were 148,744,651126,464,845 shares of common stock outstanding.

TABLE OF CONTENTS
Organization ofOur Form 10-Q
The order and presentation of content in our Form 10-Q differsdiffers from the traditional Securities and Exchange Commission (SEC) Form 10-Q format. Our format is designed to improve readability and to betterpresent how we organize and manage our business. See Appendix A, "Form 10-Q Cross-Reference Index" for a cross-reference index to the traditional SEC Form 10-Q format.
Page Number | |||||
| |||||
Management’s Discussion and Analysis of Financial Condition and Results of Operations |
| ||||
| |||||
| |||||
| |||||
| |||||
| |||||
| |||||
| |||||
| |||||
FORWARD-LOOKING AND CAUTIONARY STATEMENTS
This Quarterly Report on Form 10-Q contains “forward-looking” statements and other information that is based on management’s current expectations as of the date of this report. Statements that are not historical facts, including statements about our beliefs, opinions, or expectations and statements that assume or are dependent upon future events, are forward-looking statements and often contain words such as “expect,” “anticipate,” “intend,” “plan,” “believe,” “seek,” “see,” “will,” “would,” “may,” “could,” “should,” “goals,” or “target.” Such statements are based on management's expectations as of the date of this filing and involve many risks and uncertainties that could cause our actual results to differ materially from those expressed or implied in our forward-looking statements. Such risks and uncertainties are discussed more fully under the section titled “Risk Factors” and include, but are not limited to the following:
• the continuing impacts of the COVID-19 pandemic and related risks; • general economic conditions, including the potential impact of persistent inflation and increasing interest rates on Navient and its clients and customers and on the creditworthiness of third parties; • increased defaults on education loans held by us; • the cost and availability of funding in the capital markets; • changes in the general interest rate environment, including the availability of any relevant money-market index rate, including LIBOR, or the relationship between the relevant money-market index rate and the rate at which our assets are priced; • unanticipated repayment trends on education loans including prepayments or deferrals resulting from new interpretations of current laws, rules or regulations or future laws, executive orders or other policy initiatives which operate to encourage or require consolidation, abolish existing or create additional income-based repayment or debt forgiveness programs or establish other policies and programs which may increase the prepayment rates on education loans and accelerate repayment of the bonds in our securitization trusts; • our unhedged Floor Income is dependent on the future interest rate environment and therefore is variable; • a reduction in our credit ratings; • adverse market conditions or an inability to effectively manage our liquidity risk or access liquidity could negatively impact us; • the interest rate characteristics of our assets do not always match those of our funding arrangements; • our use of derivatives exposes us to credit and market risk; • our ability to continually and effectively align our cost structure with our business operations; • a failure or breach of our operating systems, infrastructure or information technology systems; • failure by any third party providing us material services or products or a breach or violation of law by one of these third parties; • changes to applicable laws, rules, regulations and government policies and expanded regulatory and governmental oversight; • our work with government clients exposes us to additional risks inherent in the government contracting environment; • shareholder activism; • shareholders’ percentage ownership in Navient may be diluted in the future; • reputational risk and social factors; • obligations owed to parties under various transaction agreements that were executed as part of the spin-off of Navient from SLM Corporation (the Spin-Off); and • acquisitions or strategic investments that we pursue. |
|
|
|
|
|
|
|
|
|
|
|
|
|
|
|
|
|
|
|
|
|
|
|
|
|
|
|
|
|
|
|
|
|
|
|
|
|
|
|
|
|
|
Given these risks and uncertainties, readers are cautioned not to place undue reliance on such forward-looking statements. Readers are urged to carefully review and consider the various disclosures made in this Form 10-Q and in other documents we file from time to time with the SEC that disclose risks and uncertainties that may affect our business.
The preparation of our consolidated financial statements also requires management to make certain estimates and assumptions including estimates and assumptions about future events. These estimates or assumptions may prove to be incorrect and actual results could differ materially. All forward-looking statements contained in this report are qualified by these cautionary statements and are made only as of the date of this report. We do not undertake any obligation to update or revise these forward-looking statements except as required by law.
Through this discussion and analysis, we intend to provide the reader with some narrative context for how our management views our consolidated financial statements, additional context within which to assess our operating results, and information on the quality and variability of our earnings, liquidity and cash flows.
1
USE OF NON-GAAP FINANCIAL MEASURES
We prepare financial statements and present financial results in accordance with GAAP. However, we also evaluate our business segments and present our financial results on a basis that differs from GAAP. We refer to this different basis of presentation as Core Earnings, which is a non-GAAP financial measure. We provide this Core Earnings basis of presentation on a consolidated basis and for each business segment because this is what we review internally when making management decisions regarding our performance and how we allocate resources. We also include this information in our presentations with credit rating agencies, lenders and investors. Because our Core Earnings basis of presentation corresponds tois our segment financial presentations,measure of profit or loss for our segments, we are required by GAAP to provide Core Earnings disclosures in the notes to our consolidated financial statements for our business segments.
In addition to Core Earnings, we present the following other non-GAAP financial measures: Adjusted Core Earnings, Tangible Equity, Adjusted Tangible Equity Ratio, Pro forma Adjusted Tangible Equity Ratio, and Earnings before Interest, Taxes, Depreciation and Amortization Expense (EBITDA) (for the Business Processing segment)., and Allowance for Loan Losses Excluding Expected Future Recoveries on Previously Fully Charged-off Loans. Definitions for the non-GAAP financial measures and reconciliations are provided below, except that reconciliations of forward-looking non-GAAP financial measures are not provided because the company is unable to provide such reconciliations without unreasonable effort due to the uncertainty and inherent difficulty of predicting the occurrence and financial impact of certain items, including, but not limited to, the impact of any mark-to-market gains/losses resulting from our use of derivative instruments to hedge our economic risks. See “Management’s Discussion and Analysis of Financial Condition and Results of Operations – Non-GAAP Financial Measures” for a further discussion and a complete reconciliation between GAAP net income and Core Earnings.
2
OverviewOverview and Fundamentals of Our Business
Navient (Nasdaq: NAVI) provides technology-enabled education finance and business processing solutions that simplify complex programs and help millions of people achieve success. Our customer-focused, data-driven services deliver exceptional results for clients in education, health care and government. Learn more at navient.com.
With a focus on data-driven insights, service, compliance and innovative support, Navient’s business consists of:


| • Federal Education Loans
|
|
We own a portfolio of $51.0$42.1 billion of federally guaranteed Federal Family Education Loan Program (FFELP) Loans. We service and provide asset recovery servicesAs a servicer on thisour own portfolio and for third parties, deployingwe deploy data-driven approaches to support the success of our customers. Our flexible and scalable infrastructure manages large volumes of complex transactions, simplifying the customer experience and continually improving efficiency.
|
|
We own, servicehelp students and originatefamilies succeed through the college journey with innovative planning tools, student loans and refinancing products. Our $18.3 billion Private Education Loans that enable people to pursue higher education and improve their economic opportunities. Our $20.1 billion private loanLoan portfolio demonstrates high customer success rates. We help people simplify their finances through student loan refinancing, and we help families finance their higher education through transparent, affordable Private Education Loans. In the first quarter of 2022,2023, we originated $966$168 million inof Private Education Loans.
|
|
We leverage our loan servicing expertise to provide business processing solutions for more than 600approximately 500 public sector and healthcare organizations, and their tens of millions of clients, patients, and constituents. Our suite of solutions andomnichannel customer experience, expertise enabledigital processing and revenue cycle solutions enables our clients to focus on their missions, optimize their cash flow and deliver essential services, while helping thosebetter results for the people they serve successfully navigate complex programs, transactions and decisions. For each client, we customize a blend of technologies to deliver personalized, omnichannel communication experiences; machine learning automation; root-cause business analytics; secure cloud computing; and intelligent customer relationship platforms.serve.
Superior Operational Performance with a Strong Customer Service and Compliance Commitment
We help our customers — both individuals and institutions — navigate the path to financial success through proactive, data-driven, simplified service and innovative solutions.
|
|
We leverage our•
Using technology-enabled solutions, we have rapidly staffed, trained, and activated several call centers with thousands of remote staff for clients needing urgent support, such as during the COVID-19 pandemic.
Across all our businesses, we use real-time dashboards and data visualization tools to monitor performance metrics and identify, track, and address trends and opportunities.
|
|
|
|
|
|
|
|
|
|
|
|
|
|
|
|
|
|
We leverage leading-edge technology, data-driven insights, scale, and exemplary customer service to maximize our value for our clients and outperformcustomers.
We leverage our customer service expertise, data-driven insights, technology platforms, and scale to maximize value for our clients.
3
| • Simplify complex processes. On our clients’ behalf, we help individuals successfully navigate a broad spectrum of complex transactions. Our people and platforms simplify complex programs to help customers and constituents achieve their goals. • Improving customer experience and success. We continually make enhancements to improve the customer experience, drawing from a variety of inputs including customer surveys, research panels, analysis of customer inquiries and activities, complaint data, and regulator commentary. Across our businesses, our customer-facing representatives are trained to provide empathetic, accurate support. • Commitment to compliance.We maintain a robust, multi-layered compliance management system and thoroughly understand and comply with applicable federal, state, and local laws. We use a “Three Lines of Defense” compliance framework, considered best practice by the U.S. Federal Financial Institutions Examination Council (FFIEC). This framework and other compliance protocols ensure we adhere to key industry laws and regulations including: Fair and Accurate Credit Transactions Act (FACTA); Fair Credit Reporting Act (FCRA); Fair Debt Collection Practices Act (FDCPA); Electronic Funds Transfer Act (EFTA); Equal Credit Opportunity Act (ECOA); Federal Information Security Management Act (FISMA); Gramm-Leach-Bliley Act (GLBA); Health Insurance Portability and Accountability Act (HIPAA); IRS Publication 1075; Servicemembers Civil Relief Act (SCRA); Military Lending Act (MLA); Telephone Consumer Protection Act (TCPA); Truth in Lending Act (TILA); Unfair, Deceptive, or Abusive Acts and Practices (UDAAP); state laws; and state and city licensing. • Corporate social responsibility.We are committed to contributing to the social and economic wellbeing of our communities; fostering the success of our customers; supporting a culture of integrity, inclusion and equality in our workforce; and embracing sustainable business practices. Navient has earned recognition from the Forum of Executive Women, Human Rights Campaign Foundation, and military publisher VIQTORY, among other organizations, for our continued commitment to fostering diversity. Our employees are active in our communities, through local and national organizations, including a national partnership with Boys & Girls Clubs of America.
|
|
Navient is committed to a sustainable future. Our work is largely services based; as a result, our day-to-day operations require relatively small amounts of natural resource and energy inputs. We focus on reducing the total amount of CO2 and CO2 equivalents through various initiatives, includingleverage technology that minimizes energy usageuse in our office buildings and thepromote widespread adoption of “paperless” digital customer communications. Navient prioritizes adding or updating insulation and otherthe usage of power-saving features to our buildings to further reduce our carbon emissions. We consider our energy usage. Energy efficiency and reducing CO2 and CO2 equivalents are among the many factors considered in our growth and real estate decisions.
Strong Financial Performance Resulting in a Strong Capital Return
Our first-quarter 20222023 results continue to build upon our previous year’s results demonstratingdemonstrate the strength of our business model and our ability to deliver predictable and meaningful cash flow and earnings in all types of economic environments.
Our significant earnings generate significant capital which results inallows for a strong capital return to our investors. Navient expects to continue to return excess capital to shareholders through dividends and share repurchases in accordance with our capital allocation policy.
By optimizing capital adequacy and allocating capital to highly accretive opportunities, including organic growth and acquisitions, we remain well positioned to pay dividends and repurchase stock, while maintaining appropriate leverage that supports our credit ratings and ensures ongoing access to capital markets.
In December 2021, our Board approved a share repurchase program authorizing the purchase of up to $1 billion of the Company’s outstanding common stock. At March 31, 2022, $8852023, $515 million remained in share repurchase authorization.
To inform our capital allocation decisions, we use the Adjusted Tangible Equity Ratio(1) in addition to other metrics. Our Adjusted Tangible Equity Ratio(1) was 7.0%8.5% as of March 31, 2022.2023.
(Dollars and shares in millions) |
| Q1-23 |
|
| Q1-22 |
| ||
Shares repurchased |
|
| 4.9 |
|
|
| 6.2 |
|
Reduction in shares outstanding |
|
| 3 | % |
|
| 3 | % |
Total repurchases in dollars |
| $ | 85 |
|
| $ | 115 |
|
Dividends paid |
| $ | 21 |
|
| $ | 24 |
|
Total Capital Returned(2) |
| $ | 106 |
|
| $ | 139 |
|
Adjusted Tangible Equity Ratio(1) |
|
| 8.5 | % |
|
| 7.0 | % |
(Dollars and shares in millions) |
| Q1-22 |
|
| Q1-21 |
| ||
Shares repurchased |
|
| 6.2 |
|
|
| 8.2 |
|
Reduction in shares outstanding |
|
| 3 | % |
|
| 4 | % |
Total repurchases in dollars |
| $ | 115 |
|
| $ | 100 |
|
Dividends paid |
| $ | 24 |
|
| $ | 29 |
|
Total Capital Returned(2) |
| $ | 139 |
|
| $ | 129 |
|
Adjusted Tangible Equity Ratio(1) |
|
| 7.0 | % |
|
| 6.2 | % |
4
|
|
|
|
How We Organize Our Business
We operate our business in three primary segments: Federal Education Loans, Consumer Lending and Business Processing.
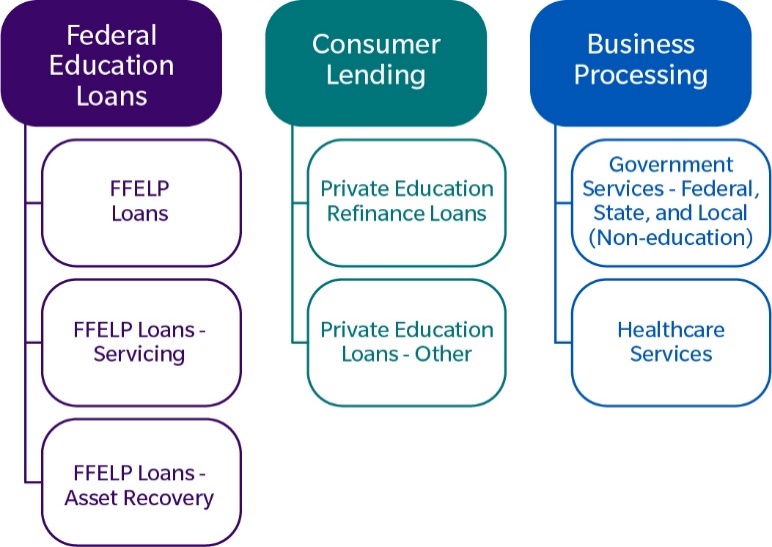
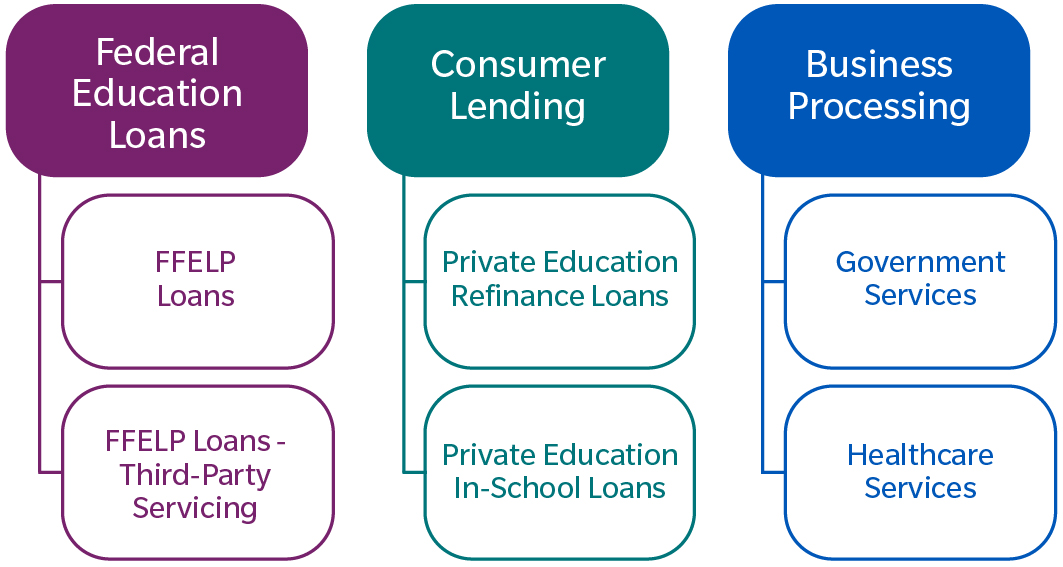
Federal Education Loans Segment
In this segment, Navient owns FFELP Loans and performs servicing and asset recovery services on this portfolio. We also service and perform asset recovery services on FFELP Loans owned by other institutions. Our servicing quality, data-driven strategies and omnichannel education about federal repayment options translate into positive results for the millions of borrowers we serve. We generate revenue primarily through net interest income on our FFELP Loans and servicing-related fee income.
Consumer Lending Segment
In this segment, Navient owns, originates acquires and services high-qualityin-school and refinance and in-school Private Education Loans. "In-school" Private Education Loans are loans originally made to borrowers while they are attending school whereas "Refinance" Private Education Loans are loans where a borrower has refinanced their education loans. We generate revenue primarily through net interest income on our Private Education Loan portfolio.
Navient helps students and families through the going-to and paying-for-college journey. Our digital tools empower people to find grants and scholarships, compare financial aid offers and complete the FAFSA. Our Private Education Loans offer easy-to-understand payment options. After graduation, we offer student loan refinancing to help people simplify their repayment and earn a better rate. We believe our more than 4550 years of experience, product design, digital marketing strategies, and origination and servicing platform provide a unique competitive advantage. We see meaningful growth opportunities in originating Private Education Loans, to financially responsible consumers, generating attractive long-term, risk-adjusted returns. We generate revenue primarily through net interest income on our Private Education Loan portfolio.
Business Processing Segment
In this segment, Navient performsprovides business processing solutions such as omnichannel contact center services, workflow processing, and revenue cycle optimization. We leverage the same expertise and intelligent tools we use to deliver successful results for over 600 governmentportfolios we own. Our support enables our clients to ensure better constituent outcomes, meet rapidly changing needs, improve technology, reduce operating expenses, manage risk and optimize revenue opportunities. Our clients include:
| providers and public health departments.
|
|
|
|
Other Segment
This segment consists of our corporate liquidity portfolio, gains and losses incurred on the repurchase of debt, unallocated expenses of shared services (which includes regulatory expenses) and restructuring/other reorganization expenses.
5
Management’s Discussion and Analysis of Financial Condition and Results of Operations
Selected Historical Financial Information and Ratios
|
| Three Months Ended March 31, |
| |||||
(In millions, except per share data) |
| 2022 |
|
| 2021 |
| ||
GAAP Basis |
|
|
|
|
|
|
|
|
Net income |
| $ | 255 |
|
| $ | 370 |
|
Diluted earnings per common share |
| $ | 1.67 |
|
| $ | 2.00 |
|
Weighted average shares used to compute diluted earnings per share |
| $ | 153 |
|
|
| 185 |
|
Return on assets |
|
| 1.34 | % |
|
| 1.78 | % |
|
|
|
|
|
|
|
|
|
Core Earnings Basis(1) |
|
|
|
|
|
|
|
|
Net income(1) |
| $ | 135 |
|
| $ | 305 |
|
Diluted earnings per common share(1) |
| $ | .88 |
|
| $ | 1.65 |
|
Adjusted diluted earnings per common share(1) |
| $ | .90 |
|
| $ | 1.71 |
|
Weighted average shares used to compute diluted earnings per share |
|
| 153 |
|
|
| 185 |
|
Net interest margin, Federal Education Loans segment |
|
| 1.04 | % |
|
| .97 | % |
Net interest margin, Consumer Lending segment |
|
| 2.80 | % |
|
| 2.99 | % |
Return on assets |
|
| .71 | % |
|
| 1.46 | % |
|
|
|
|
|
|
|
|
|
Education Loan Portfolios |
|
|
|
|
|
|
|
|
Ending FFELP Loans, net |
| $ | 51,013 |
|
| $ | 56,873 |
|
Ending Private Education Loans, net |
|
| 20,088 |
|
|
| 19,742 |
|
Ending total education loans, net |
| $ | 71,101 |
|
| $ | 76,615 |
|
Average FFELP Loans |
| $ | 52,258 |
|
| $ | 58,078 |
|
Average Private Education Loans |
|
| 21,157 |
|
|
| 22,143 |
|
Average total education loans |
| $ | 73,415 |
|
| $ | 80,221 |
|
|
| Three Months Ended March 31, |
| |||||
(In millions, except per share data) |
| 2023 |
|
| 2022 |
| ||
GAAP Basis |
|
|
|
|
|
| ||
Net income |
| $ | 111 |
|
| $ | 255 |
|
Diluted earnings per common share |
| $ | .86 |
|
| $ | 1.67 |
|
Weighted average shares used to compute diluted earnings per share |
| $ | 130 |
|
|
| 153 |
|
Return on assets |
|
| .68 | % |
|
| 1.34 | % |
|
|
|
|
|
|
| ||
Core Earnings Basis(1) |
|
|
|
|
|
| ||
Net income(1) |
| $ | 133 |
|
| $ | 135 |
|
Diluted earnings per common share(1) |
| $ | 1.02 |
|
| $ | .88 |
|
Adjusted diluted earnings per common share(1) |
| $ | 1.06 |
|
| $ | .90 |
|
Weighted average shares used to compute diluted earnings per share |
|
| 130 |
|
|
| 153 |
|
Net interest margin, Federal Education Loans segment |
|
| 1.12 | % |
|
| 1.04 | % |
Net interest margin, Consumer Lending segment |
|
| 3.12 | % |
|
| 2.80 | % |
Return on assets |
|
| .82 | % |
|
| .71 | % |
|
|
|
|
|
|
| ||
Education Loan Portfolios |
|
|
|
|
|
| ||
Ending FFELP Loans, net |
| $ | 42,148 |
|
| $ | 51,013 |
|
Ending Private Education Loans, net |
|
| 18,275 |
|
|
| 20,088 |
|
Ending total education loans, net |
| $ | 60,423 |
|
| $ | 71,101 |
|
Average FFELP Loans |
| $ | 43,263 |
|
| $ | 52,258 |
|
Average Private Education Loans |
|
| 19,289 |
|
|
| 21,157 |
|
Average total education loans |
| $ | 62,552 |
|
| $ | 73,415 |
|
76
The Quarter inin Review
We prepare financial statements and present financial results in accordance with GAAP. However, we also evaluate our business segments and present financial results on a basis that differs from GAAP. We refer to this different basis of presentation as Core Earnings. We provide this Core Earnings basis of presentation on a consolidated basis and for each business segment because this is what we review internally when making management decisions regarding our performance and how we allocate resources. We also include this information in our presentations with credit rating agencies, lenders and investors. Because our Core Earnings basis of presentation corresponds to our segment financial presentations, we are required by GAAP to provide certain Core Earnings disclosures in the notes to our consolidated financial statements for our business segments. See “Non-GAAP Financial Measures — Core Earnings” for a further discussion and a complete reconciliation between GAAP net income and Core Earnings.
First-quarter 20222023 GAAP net income was $255$111 million ($1.670.86 diluted earnings per share), compared with $370$255 million ($2.001.67 diluted Core Earnings per share) for the year-ago quarter. See “Results of Operations – GAAP Comparison of First-Quarter 20222023 Results with First-Quarter 2021”2022" for a discussion of the primary contributors to the change in GAAP earnings between periods.
First-quarter 20222023 Core Earnings net income was $135$133 million ($0.881.02 diluted Core Earnings per share), compared with $305$135 million ($1.650.88 diluted Core Earnings per share) for the year-ago quarter. First-quarter 20222023 and 20212022 adjusted diluted Core Earnings(1) per share were $0.90$1.06 and $1.71,$0.90, respectively. See “Segment Results” for a discussion of the primary contributors to the change in Core Earnings between periods.
Financial highlights of first-quarter 20222023 include:
Federal Education Loans segment:
| • Net income of $87 million. • Net interest margin of 1.12%.
|
|
|
|
Consumer Lending segment:
| • Net income of $110 million. • Net interest margin of 3.12%. • Originated $168 million of Private Education Loans.
|
|
|
|
|
|
Business Processing segment:
| • Revenue of $72 million. • Net income of $4 million and EBITDA(1) of $5 million.
|
|
|
|
Capital, funding and liquidity:
| • GAAP equity-to-asset ratio of 4.4% and adjusted tangible equity ratio(1) of 8.5%. • Repurchased $85 million of common shares. $515 million common share repurchase authority remains outstanding. • Paid $21 million in common stock dividends. • Retired $1 billion of unsecured debt. Expenses: • GAAP operating expenses of $185 million and Adjusted Core Earnings expenses(1) of $183 million. (1) Item is a non-GAAP financial measure. For a description and reconciliation, see “Non-GAAP Financial Measures.” 7
|
|
|
|
|
|
|
|
Expenses:
|
|
|
|
Navient’s Response to COVID-19
Since its emergence in early 2020, the COVID-19 pandemic has been dynamic and unpredictable. Variants continue to emerge while efforts to mitigate and contain the impact of the pandemic continue to evolve. In response to the COVID-19 pandemic, we have prioritized the safety of our employees and business partners, while continually striving to support the needs of our customers and communities during this unprecedented period. During 2021 and the first quarter of 2022, the COVID-19 pandemic has continued to affect our business operations. The future direct and indirect impact of the pandemic on our businesses, results of operations and financial condition remains uncertain. Should current economic conditions deteriorate or if the pandemic worsens due to various factors, including through the spread of more easily communicable variants of COVID-19, such conditions could have an adverse effect on our businesses and results of operations and could adversely affect our financial condition. For more information on the pandemic, see “Management’s Discussion and Analysis of Financial Condition and Results of Operations – Navient’s Response to COVID-19” in our 2021 Form 10-K.
Results of Operations
GAAP Income Statements (Unaudited)
|
| Three Months Ended March 31, |
|
| Increase (Decrease) |
|
| Three Months Ended March 31, |
|
| Increase |
| ||||||||||||||||||||
(In millions, except per share data) |
| 2022 |
|
| 2021 |
|
| $ |
|
| % |
|
| 2023 |
|
| 2022 |
|
| $ |
|
| % |
| ||||||||
Interest income |
|
|
|
|
|
|
|
|
|
|
|
|
|
|
|
|
|
|
|
|
|
|
|
|
|
|
|
| ||||
FFELP Loans |
| $ | 349 |
|
| $ | 373 |
|
| $ | (24 | ) |
|
| (6 | )% |
| $ | 693 |
|
| $ | 349 |
|
| $ | 344 |
|
|
| 99 | % |
Private Education Loans |
|
| 276 |
|
|
| 319 |
|
|
| (43 | ) |
|
| (13 | ) |
|
| 344 |
|
|
| 276 |
|
|
| 68 |
|
|
| 25 |
|
Cash and investments |
|
| 1 |
|
|
| — |
|
|
| 1 |
|
|
| 100 |
|
|
| 34 |
|
|
| 1 |
|
|
| 33 |
|
|
| 3,300 |
|
Total interest income |
|
| 626 |
|
|
| 692 |
|
|
| (66 | ) |
|
| (10 | ) |
|
| 1,071 |
|
|
| 626 |
|
|
| 445 |
|
|
| 71 |
|
Total interest expense |
|
| 289 |
|
|
| 329 |
|
|
| (40 | ) |
|
| (12 | ) |
|
| 837 |
|
|
| 289 |
|
|
| 548 |
|
|
| 190 |
|
Net interest income |
|
| 337 |
|
|
| 363 |
|
|
| (26 | ) |
|
| (7 | ) |
|
| 234 |
|
|
| 337 |
|
|
| (103 | ) |
|
| (31 | ) |
Less: provisions for loan losses |
|
| 16 |
|
|
| (87 | ) |
|
| 103 |
|
|
| (118 | ) |
|
| (14 | ) |
|
| 16 |
|
|
| (30 | ) |
|
| (188 | ) |
Net interest income after provisions for loan losses |
|
| 321 |
|
|
| 450 |
|
|
| (129 | ) |
|
| (29 | ) |
|
| 248 |
|
|
| 321 |
|
|
| (73 | ) |
|
| (23 | ) |
Other income (loss): |
|
|
|
|
|
|
|
|
|
|
|
|
|
|
|
|
|
|
|
|
|
|
|
|
|
|
|
| ||||
Servicing revenue |
|
| 18 |
|
|
| 53 |
|
|
| (35 | ) |
|
| (66 | ) |
|
| 17 |
|
|
| 18 |
|
|
| (1 | ) |
|
| (6 | ) |
Asset recovery and business processing revenue |
|
| 97 |
|
|
| 139 |
|
|
| (42 | ) |
|
| (30 | ) |
|
| 72 |
|
|
| 97 |
|
|
| (25 | ) |
|
| (26 | ) |
Other income |
|
| 10 |
|
|
| — |
|
|
| 10 |
|
|
| 100 |
|
|
| 7 |
|
|
| 10 |
|
|
| (3 | ) |
|
| (30 | ) |
Gains on sales of loans |
|
| — |
|
|
| 76 |
|
|
| (76 | ) |
|
| (100 | ) | ||||||||||||||||
Gains (losses) on derivative and hedging activities, net |
|
| 98 |
|
|
| 36 |
|
|
| 62 |
|
|
| 172 |
|
|
| (8 | ) |
|
| 98 |
|
|
| (106 | ) |
|
| (108 | ) |
Total other income |
|
| 223 |
|
|
| 304 |
|
|
| (81 | ) |
|
| (27 | ) |
|
| 88 |
|
|
| 223 |
|
|
| (135 | ) |
|
| (61 | ) |
Expenses: |
|
|
|
|
|
|
|
|
|
|
|
|
|
|
|
|
|
|
|
|
|
|
|
|
|
|
|
| ||||
Operating expenses |
|
| 205 |
|
|
| 259 |
|
|
| (54 | ) |
|
| (21 | ) |
|
| 185 |
|
|
| 205 |
|
|
| (20 | ) |
|
| (10 | ) |
Goodwill and acquired intangible assets impairment and amortization expense |
|
| 4 |
|
|
| 5 |
|
|
| (1 | ) |
|
| (20 | ) |
|
| 3 |
|
|
| 4 |
|
|
| (1 | ) |
|
| (25 | ) |
Restructuring/other reorganization expenses |
|
| 3 |
|
|
| 6 |
|
|
| (3 | ) |
|
| (50 | ) |
|
| 4 |
|
|
| 3 |
|
|
| 1 |
|
|
| 33 |
|
Total expenses |
|
| 212 |
|
|
| 270 |
|
|
| (58 | ) |
|
| (21 | ) |
|
| 192 |
|
|
| 212 |
|
|
| (20 | ) |
|
| (9 | ) |
Income before income tax expense |
|
| 332 |
|
|
| 484 |
|
|
| (152 | ) |
|
| (31 | ) |
|
| 144 |
|
|
| 332 |
|
|
| (188 | ) |
|
| (57 | ) |
Income tax expense |
|
| 77 |
|
|
| 114 |
|
|
| (37 | ) |
|
| (32 | ) |
|
| 33 |
|
|
| 77 |
|
|
| (44 | ) |
|
| (57 | ) |
Net income |
| $ | 255 |
|
| $ | 370 |
|
| $ | (115 | ) |
|
| (31 | )% |
| $ | 111 |
|
| $ | 255 |
|
| $ | (144 | ) |
|
| (56 | )% |
Basic earnings per common share |
| $ | 1.69 |
|
| $ | 2.02 |
|
| $ | (.33 | ) |
|
| (16 | %) |
| $ | .87 |
|
| $ | 1.69 |
|
| $ | (.82 | ) |
|
| (49 | )% |
Diluted earnings per common share |
| $ | 1.67 |
|
| $ | 2.00 |
|
| $ | (.33 | ) |
|
| (17 | %) |
| $ | .86 |
|
| $ | 1.67 |
|
| $ | (.81 | ) |
|
| (49 | )% |
Dividends per common share |
| $ | .16 |
|
| $ | .16 |
|
| $ | — |
|
|
| — | % |
| $ | .16 |
|
| $ | .16 |
|
| $ | — |
|
|
| — |
|
8
GAAP Comparison of First-Quarter 20222023 Results with First-Quarter 20212022
For the three months ended March 31, 2022,2023, net income was $255$111 million, or $1.67$0.86 diluted earnings per common share, compared with net income of $370$255 million, or $2.00$1.67 diluted earnings per common share, for the year-ago period.
The primary contributors to the change in net income are as follows:
|
Net interest income decreased by $103 million primarily as a result of a $47 million decrease in mark-to-market gains on fair value hedges recorded in interest expense, an increase in interest rates as well as the • Provisions for loan losses decreased $30 million from $16 million to $(14) million: o The provision for FFELP Loan losses increased $10 million from $0 to $10 million. o The provision for Private Education Loan losses decreased $40 million from $16 million to $(24) million. The FFELP Loan |
|
|
|
|
|
|
The provision for loan losses of $10 million in the current period was primarily relateda result of the extension of the portfolio and the resulting increase in unamortized premium allocated to expected future defaults.
The Private Education Loan provision for loan originations. There has been an improvementlosses of $(24) million in the current period included $(52) million in connection with the adoption of a new accounting standard (ASU 2022-02), $5 million in connection with loan originations and forecasted economic conditions since$23 million in connection with the prior period, but such improvement has not mitigated the uncertainty related to the potential negative impact on the portfolio from the endresolution of various payment relief and stimulus benefits recently andcertain private legacy loans in the future.bankruptcy. The negative provision of $(87)$16 million in the year-ago quarter included $11 million in connection with loan originations and $5 million related to a reserve build.
We adopted ASU No. 2022-02, “Financial Instruments – Credit Losses: Troubled Debt Restructurings and Vintage Disclosures” on January 1, 2023. This new ASU eliminates the troubled debt restructurings (TDRs) recognition and measurement guidance. Prior to adopting this new guidance, as it relates to interest rate concessions granted as part of our Private Education Loan modification program, a discounted cash flow model was used to calculate the amount of interest forgiven for loans that were in the program and the present value of that interest rate concession was included as a part of the allowance for loan loss. This new guidance no longer allows the measurement and recognition of this element of our allowance for loan loss for new modifications that occur subsequent to January 1, 2023. As of December 31, 2022, the allowance for loan loss included $77 million related to this interest rate concession component of the allowance for loan loss. We elected to adopt this amendment using a prospective transition method which results in the $77 million releasing in 2023 and 2024 as the borrowers exit their current modification programs. $52 million of the $77 million was released in the first quarter of 2023.
|
|
|
|
|
|
|
|
|
|
|
|
|
|
We repurchased 6.24.9 million and 8.26.2 million shares of our common stock during the first quarters of 20222023 and 2021,2022, respectively. As a result of repurchases, our average outstanding diluted shares decreased by 3223 million common shares (or 17%15%) from the year-ago period.
9
Segment Results
Federal Education Loans Segment
The following table presents Core Earnings results for our Federal Education Loans segment.
|
| Three Months Ended March 31, |
|
| % Increase (Decrease) |
|
| Three Months Ended March 31, |
|
| % Increase |
| ||||||||||||
(Dollars in millions) |
| 2022 |
|
| 2021 |
|
| 2022 vs. 2021 |
|
| 2023 |
|
| 2022 |
|
| 2023 vs. 2022 |
| ||||||
Interest income: |
|
|
|
|
|
|
|
|
|
|
|
|
|
|
|
|
|
|
|
|
| |||
FFELP Loans |
| $ | 334 |
|
| $ | 359 |
|
|
| (7 | )% |
| $ | 695 |
|
| $ | 334 |
|
|
| 108 | % |
Cash and investments |
|
| — |
|
|
| — |
|
|
| — |
|
|
| 20 |
|
|
| — |
|
|
| 100 |
|
Total interest income |
|
| 334 |
|
|
| 359 |
|
|
| (7 | ) |
|
| 715 |
|
|
| 334 |
|
|
| 114 |
|
Total interest expense |
|
| 195 |
|
|
| 215 |
|
|
| (9 | ) |
|
| 590 |
|
|
| 195 |
|
|
| 203 |
|
Net interest income |
|
| 139 |
|
|
| 144 |
|
|
| (3 | ) |
|
| 125 |
|
|
| 139 |
|
|
| (10 | ) |
Less: provision for loan losses |
|
| — |
|
|
| — |
|
|
| — |
|
|
| 10 |
|
|
| — |
|
|
| 100 |
|
Net interest income after provision for loan losses |
|
| 139 |
|
|
| 144 |
|
|
| (3 | ) |
|
| 115 |
|
|
| 139 |
|
|
| (17 | ) |
Other income (loss): |
|
|
|
|
|
|
|
|
|
|
|
|
|
|
|
|
|
|
|
|
| |||
Servicing revenue |
|
| 15 |
|
|
| 52 |
|
|
| (71 | ) |
|
| 14 |
|
|
| 15 |
|
|
| (7 | ) |
Asset recovery and business processing revenue |
|
| 3 |
|
|
| 14 |
|
|
| (79 | ) |
|
| — |
|
|
| 3 |
|
|
| (100 | ) |
Other income |
|
| 11 |
|
|
| — |
|
|
| 100 |
|
|
| 5 |
|
|
| 11 |
|
|
| (55 | ) |
Total other income |
|
| 29 |
|
|
| 66 |
|
|
| (56 | ) |
|
| 19 |
|
|
| 29 |
|
|
| (34 | ) |
Direct operating expenses |
|
| 28 |
|
|
| 63 |
|
|
| (56 | ) |
|
| 20 |
|
|
| 28 |
|
|
| (29 | ) |
Income before income tax expense |
|
| 140 |
|
|
| 147 |
|
|
| (5 | ) |
|
| 114 |
|
|
| 140 |
|
|
| (19 | ) |
Income tax expense |
|
| 33 |
|
|
| 35 |
|
|
| (6 | ) |
|
| 27 |
|
|
| 33 |
|
|
| (18 | ) |
Net income |
| $ | 107 |
|
| $ | 112 |
|
|
| (4 | )% |
| $ | 87 |
|
| $ | 107 |
|
|
| (19 | )% |
Comparison of First-Quarter 20222023 Results with First-Quarter 20212022
| • Net income was $87 million compared to $107 million. • Net interest income decreased $14 million primarily due to the paydown of the portfolio. • Provision for loan losses increased $10 million. The $10 million of provision for loan losses in the current period primarily was a result of the extension of the portfolio and the resulting increase in unamortized premium allocated to expected future defaults. o Net charge-offs were $18 million compared to $7 million. o Delinquencies greater than 90 days were $2.7 billion compared to $2.7 billion. o Forbearances were $6.8 billion compared to $6.3 billion. • Other revenue decreased $10 million due to a decrease in transition services as well as a decrease in asset recovery revenue. • Expenses were $8 million lower as a result of the paydown of the loan portfolio and the decrease in other revenue discussed above. 10
|
|
|
|
|
|
|
|
|
|
|
|
|
|
|
|
Key performance metrics are as follows:
|
| Three Months Ended March 31, |
| |||||
(Dollars in millions) |
| 2022 |
|
| 2021 |
| ||
Segment net interest margin |
|
| 1.04 | % |
|
| .97 | % |
FFELP Loans: |
|
|
|
|
|
|
|
|
FFELP Loan spread |
|
| 1.11 | % |
|
| 1.03 | % |
Provision for loan losses |
| $ | — |
|
| $ | — |
|
Charge-offs |
| $ | 7 |
|
| $ | 6 |
|
Charge-off rate |
|
| .07 | % |
|
| .06 | % |
Greater than 30-days delinquency rate |
|
| 13.5 | % |
|
| 8.3 | % |
Greater than 90-days delinquency rate |
|
| 6.4 | % |
|
| 3.5 | % |
Forbearance rate |
|
| 12.9 | % |
|
| 15.5 | % |
Average FFELP Loans |
| $ | 52,258 |
|
| $ | 58,078 |
|
Ending FFELP Loans, net |
| $ | 51,013 |
|
| $ | 56,873 |
|
|
|
|
|
|
|
|
|
|
(Dollars in billions) |
|
|
|
|
|
|
|
|
Number of accounts serviced for ED (in millions)(1) |
|
| — |
|
|
| 5.6 |
|
Total federal loans serviced(1) |
| $ | 59 |
|
| $ | 285 |
|
|
| |||||||||||||||||||||||||||||||||||||||||||||||||||||||||||||||||||||||||||||||||||||||||||||||||||||||||||||||||||||||||||||||||||||||||||||||||||||||||
Net Interest Margin
The following table details the net interest margin.
|
| Three Months Ended March 31, |
| |||||
|
| 2023 |
|
| 2022 |
| ||
FFELP Loan yield |
|
| 6.07 | % |
|
| 2.10 | % |
Floor Income |
|
| .45 |
|
|
| .49 |
|
FFELP Loan net yield |
|
| 6.52 |
|
|
| 2.59 |
|
FFELP Loan cost of funds |
|
| (5.27 | ) |
|
| (1.48 | ) |
FFELP Loan spread |
|
| 1.25 |
|
|
| 1.11 |
|
Other interest-earning asset spread impact |
|
| (.13 | ) |
|
| (.07 | ) |
Net interest margin(1) |
|
| 1.12 | % |
|
| 1.04 | % |
|
| Three Months Ended March 31, |
| |||||
|
| 2022 |
|
| 2021 |
| ||
FFELP Loan yield |
|
| 2.10 | % |
|
| 1.92 | % |
Hedged Floor Income |
|
| .35 |
|
|
| .40 |
|
Unhedged Floor Income |
|
| .14 |
|
|
| .18 |
|
FFELP Loan net yield |
|
| 2.59 |
|
|
| 2.50 |
|
FFELP Loan cost of funds |
|
| (1.48 | ) |
|
| (1.47 | ) |
FFELP Loan spread |
|
| 1.11 |
|
|
| 1.03 |
|
Other interest-earning asset spread impact |
|
| (.07 | ) |
|
| (.06 | ) |
Net interest margin(1) |
|
| 1.04 | % |
|
| .97 | % |
|
| ||||||||||||||||||||||||||||||||||||||||||||||||||||||
|
| Three Months Ended March 31, |
| |||||
(Dollars in millions) |
| 2022 |
|
| 2021 |
| ||
FFELP Loans |
| $ | 52,258 |
|
| $ | 58,078 |
|
Other interest-earning assets |
|
| 1,930 |
|
|
| 1,794 |
|
Total FFELP Loan interest-earning assets |
| $ | 54,188 |
|
| $ | 59,872 |
|
As of March 31, 2022,2023, our FFELP Loan portfolio totaled $51.0$42.1 billion, comprised of $17.8$15.2 billion of FFELP Stafford Loans and $33.2$26.9 billion of FFELP Consolidation Loans. The weighted-average life of these portfolios as of March 31, 20222023 was 67 years and 78 years, respectively, assuming a Constant Prepayment Rate (CPR) of 9%8% and 5%, respectively.
11
Floor Income
The following table analyzes on a Core Earnings basis the ability of the FFELP Loans in our portfolio to earn Floor Income after March 31, 20222023 and 2021,2022, based on interest rates as of those dates.
|
|
|
|
|
|
|
|
|
|
|
|
|
| |||
(Dollars in billions) |
| March 31, 2022 |
|
| March 31, 2021 |
|
| March 31, 2023 |
|
| March 31, 2022 |
| ||||
Education loans eligible to earn Floor Income |
| $ | 50.7 |
|
| $ | 56.4 |
|
| $ | 41.8 |
|
| $ | 50.7 |
|
Less: post-March 31, 2006 disbursed loans required to rebate Floor Income |
|
| (23.6 | ) |
|
| (25.9 | ) |
|
| (19.9 | ) |
|
| (23.6 | ) |
Less: economically hedged Floor Income |
|
| (13.0 | ) |
|
| (13.5 | ) |
|
| (9.1 | ) |
|
| (13.0 | ) |
Education loans eligible to earn Floor Income after rebates and economically hedged |
| $ | 14.1 |
|
| $ | 17.0 |
|
| $ | 12.8 |
|
| $ | 14.1 |
|
Education loans earning Floor Income |
| $ | 5.6 |
|
| $ | 12.0 |
|
| $ | — |
|
| $ | 5.6 |
|
The following table presents a projection of the average balance of FFELP Consolidation Loans for which Fixed Rate Floor Income has been economically hedged with derivatives for the period April 1, 20222023 to December 31, 2026.2027.
(Dollars in billions) |
| April 1, 2022 to December 31, 2022 |
|
| 2023 |
|
| 2024 |
|
| 2025 |
|
| 2026 |
|
| April 1, 2023 |
|
| 2024 |
|
| 2025 |
|
| 2026 |
|
| 2027 |
| ||||||||||
Average balance of FFELP Consolidation Loans whose Floor Income is economically hedged |
| $ | 12.6 |
|
| $ | 7.8 |
|
| $ | 2.0 |
|
| $ | 1.0 |
|
| $ | 1.0 |
|
| $ | 6.3 |
|
| $ | 2.0 |
|
| $ | 1.0 |
|
| $ | 1.0 |
|
| $ | .3 |
|
|
|
|
|
|
|
|
|
|
|
|
|
|
|
|
|
|
|
|
|
|
|
|
|
|
|
|
|
|
|
|
| |||||||||
Servicing Revenue
Servicing revenue decreased $37 million primarily related to the transfer of the servicing contract for 5.6 million ED owned student loan accounts from Navient to a third party on October 6, 2021. As a result, Navient no longer is a party to the ED servicing contract. To aid in the transition, Navient will provide certain services into 2022 to the third party through a transition services agreement (see discussion below related to “Other income”). As part of the transaction, approximately 700 Navient employees were transferred to the third party.This transaction provided a seamless transition for millions of borrowers ensuring the ongoing servicing capacity for the Department of ED through the knowledge transfer and ongoing employment of 700 employees. Additional benefits to Navient of this transaction are the simplification of our business, reducing our overall risk profile and avoiding significant severance expense.
Third-party loan servicing fees in the three months ended March 31, 2022 and 2021 included $0 and $34 million, respectively, of servicing revenue related to the ED servicing contract.
Asset Recovery and Business Processing Revenue
Asset recovery and business processing revenue decreased $11$3 million primarily as a result of exiting the impactFFELP asset recovery business in the fourth quarter of COVID-19 on certain collection and processing activities (temporary stoppage or other restrictions on certain activities).2022.
Other Income
Other income increased $11decreased $6 million primarily related to thelower contract-exit transition services being performed in connection with the transfer of the ED Servicing contract to a third party as discussed above. services.
Operating Expenses
Operating expenses for the Federal Education Loans segment primarily include costs incurred to perform servicing and asset recovery activities on our FFELP Loan portfolio and federal education loans held by other institutions. Expenses were $35$8 million lower primarily as a result of the paydown of the loan portfolio and the decrease in servicingother income discussed above.
12
Federal Loan Forgiveness
On August 24, 2022, the Biden-Harris Administration announced its Student Debt Relief (SDR) Plan. The SDR Plan provides up to $20,000 in one-time debt relief to income-qualified recipients with ED held student loans and asset recovery revenue discussed above.initially extended the repayment pause on ED held loans through December 31, 2022. This repayment pause has been further extended as detailed below. As the SDR Plan is currently configured, privately held FFELP Loans, like ours, do not qualify for debt forgiveness.
Following the initial announcement of the SDR Plan, ED provided more specific guidance on debt relief through its studentaid.gov website on September 29, 2022. Following publication of the SDR Plan, a number of states and private organizations initiated legal challenges to the SDR Plan in various courts throughout the country, which ultimately resulted in the implementation of the SDR Plan being disallowed. The Biden-Harris Administration and ED subsequently appealed both cases to the Supreme Court of the United States which heard the cases on February 28, 2023, and a ruling is expected prior to the end of the Supreme Court's current term. If the SDR Plan has not been implemented and the litigation is not resolved by June 30, 2023, payments are scheduled to resume 60 days after that date. While the current version of the SDR Plan provides that borrowers with federal student loans not held by ED cannot obtain one-time debt relief by consolidating those loans into Direct Loans, ED states that they are assessing whether there are alternative pathways to provide relief to borrowers with federal student loans not held by ED, including FFELP Loans.
We estimate that borrowers with approximately $600 million of FFELP Loans (1% of the FFELP portfolio’s average 2022 balance) had consolidated their loans with ED prior to the deadline to qualify for debt relief established by the SDR Plan.
As a result, there was not a material impact on the Company’s accounting and related 2022 and 2023 results related to the SDR Plan as currently:
As a result, at this time we do not expect there to be incremental consolidation activity in the future related to potential loan forgiveness under the SDR Plan.
13
Consumer Lending Segment
The following table presents Core Earnings results for our Consumer Lending segment.
|
| Three Months Ended March 31, |
|
| % Increase (Decrease) |
|
| Three Months Ended March 31, |
|
| % Increase |
| ||||||||||||
(Dollars in millions) |
| 2022 |
|
| 2021 |
|
| 2022 vs. 2021 |
|
| 2023 |
|
| 2022 |
|
| 2023 vs. 2022 |
| ||||||
Interest income: |
|
|
|
|
|
|
|
|
|
|
|
|
|
|
|
|
|
|
|
|
| |||
Private Education Loans |
| $ | 276 |
|
| $ | 319 |
|
|
| (13 | )% |
| $ | 344 |
|
| $ | 276 |
|
|
| 25 | % |
Cash and investments |
|
| 1 |
|
|
| — |
|
|
| 100 |
|
|
| 6 |
|
|
| 1 |
|
|
| 500 |
|
Interest income |
|
| 277 |
|
|
| 319 |
|
|
| (13 | ) |
|
| 350 |
|
|
| 277 |
|
|
| 26 |
|
Interest expense |
|
| 125 |
|
|
| 150 |
|
|
| (17 | ) |
|
| 197 |
|
|
| 125 |
|
|
| 58 |
|
Net interest income |
|
| 152 |
|
|
| 169 |
|
|
| (10 | ) |
|
| 153 |
|
|
| 152 |
|
|
| 1 |
|
Less: provision for loan losses |
|
| 16 |
|
|
| (87 | ) |
|
| 118 |
|
|
| (24 | ) |
|
| 16 |
|
|
| (250 | ) |
Net interest income after provision for loan losses |
|
| 136 |
|
|
| 256 |
|
|
| (47 | ) |
|
| 177 |
|
|
| 136 |
|
|
| 30 |
|
Other income (loss): |
|
|
|
|
|
|
|
|
|
|
|
| ||||||||||||
Servicing revenue |
|
| 3 |
|
|
| 1 |
|
|
| 200 |
|
|
| 3 |
|
|
| 3 |
|
|
| — |
|
Gains on sales of loans |
|
| — |
|
|
| 89 |
|
|
| (100 | ) | ||||||||||||
Total other income |
|
| 3 |
|
|
| 90 |
|
|
| (97 | ) | ||||||||||||
Direct operating expenses |
|
| 35 |
|
|
| 41 |
|
|
| (15 | ) |
|
| 37 |
|
|
| 35 |
|
|
| 6 |
|
Income before income tax expense |
|
| 104 |
|
|
| 305 |
|
|
| (66 | ) |
|
| 143 |
|
|
| 104 |
|
|
| 38 |
|
Income tax expense |
|
| 25 |
|
|
| 71 |
|
|
| (65 | ) |
|
| 33 |
|
|
| 25 |
|
|
| 32 |
|
Net income |
| $ | 79 |
|
| $ | 234 |
|
|
| (66 | )% |
| $ | 110 |
|
| $ | 79 |
|
|
| 39 | % |
Comparison of First-Quarter 20222023 Results with First-Quarter 20212022
| • Originated $168 million of Private Education Loans compared to $966 million. o Refinance Loan originations were $135 million compared to $941 million. The decrease in originations is primarily the result of borrowers with fixed interest rate loans having less of an incentive to refinance in light of the significant increase in interest rates that occurred in 2022. o In-school loan originations were $33 million compared to $25 million. • Net income was $110 million compared to $79 million. • Net interest income increased $1 million due to an increase in the net interest margin primarily due to improved funding spreads. This was partially offset by the paydown of the portfolio. • Provision for loan losses decreased $40 million. The provision for loan losses of $(24) million in the current period included $(52) million in connection with the adoption of a new accounting standard (ASU 2022-02) (see "GAAP Comparison of First-Quarter 2023 Results with First-Quarter 2022" for further discussion), $5 million in connection with loan originations and $23 million in connection with the resolution of certain private legacy loans in bankruptcy. The provision of $16 million in the year-ago period included $11 million in connection with loan originations and $5 million related to a reserve build. The increases in charge-offs and delinquencies detailed below are primarily the result of loans that were experiencing repayment difficulties pre-COVID returning to repayment after pandemic relief. o Net charge-offs were $75 million compared with $69 million. o Private Education Loan delinquencies greater than 90 days: $364 million, up $50 million from $314 million. o Private Education Loan forbearances: $354 million, down $64 million from $418 million. • Expenses increased $2 million. 14
|
|
|
|
|
|
|
|
|
|
|
|
|
|
|
|
|
|
|
|
Key performance metrics are as follows:
|
| Three Months Ended March 31, |
|
| Three Months Ended March 31, |
| ||||||||||
(Dollars in millions) |
| 2022 |
|
| 2021 |
|
| 2023 |
|
| 2022 |
| ||||
Segment net interest margin |
|
| 2.80 | % |
|
| 2.99 | % |
|
| 3.12 | % |
|
| 2.80 | % |
Private Education Loans (including Refinance Loans): |
|
|
|
|
|
|
|
|
|
|
|
|
|
| ||
Private Education Loan spread |
|
| 2.97 | % |
|
| 3.21 | % |
|
| 3.28 | % |
|
| 2.97 | % |
Provision for loan losses |
| $ | 16 |
|
| $ | (87 | ) |
| $ | (24 | ) |
| $ | 16 |
|
Charge-offs |
| $ | 69 |
|
| $ | 35 |
| ||||||||
Charge-off rate |
|
| 1.38 | % |
|
| .68 | % | ||||||||
Net charge-offs(1) |
| $ | 75 |
|
| $ | 69 |
| ||||||||
Net charge-off rate(1) |
|
| 1.63 | % |
|
| 1.38 | % | ||||||||
Greater than 30-days delinquency rate |
|
| 4.0 | % |
|
| 2.3 | % |
|
| 4.5 | % |
|
| 4.0 | % |
Greater than 90-days delinquency rate |
|
| 1.6 | % |
|
| .9 | % |
|
| 2.0 | % |
|
| 1.6 | % |
Forbearance rate |
|
| 2.0 | % |
|
| 3.9 | % |
|
| 1.9 | % |
|
| 2.0 | % |
Average Private Education Loans |
| $ | 21,157 |
|
| $ | 22,143 |
|
| $ | 19,289 |
|
| $ | 21,157 |
|
Ending Private Education Loans, net |
| $ | 20,088 |
|
| $ | 19,742 |
|
| $ | 18,275 |
|
| $ | 20,088 |
|
Private Education Refinance Loans: |
|
|
|
|
|
|
|
|
|
|
|
|
|
| ||
Charge-offs |
| $ | 6 |
|
| $ | 3 |
| ||||||||
Net charge-offs |
| $ | 8 |
|
| $ | 6 |
| ||||||||
Greater than 90-day delinquency rate |
|
| .1 | % |
|
| .1 | % |
|
| .3 | % |
|
| .1 | % |
Average balance of Private Education Refinance Loans |
| $ | 10,084 |
|
| $ | 8,604 |
|
| $ | 9,521 |
|
| $ | 10,084 |
|
Ending balance of Private Education Refinance Loans |
| $ | 9,995 |
|
| $ | 7,882 |
|
| $ | 9,274 |
|
| $ | 9,995 |
|
Private Education Refinance Loan originations |
| $ | 941 |
|
| $ | 1,671 |
|
| $ | 135 |
|
| $ | 941 |
|
Net Interest Margin
The following table details the net interest margin.
|
| Three Months Ended March 31, |
| |||||
|
| 2023 |
|
| 2022 |
| ||
Private Education Loan yield |
|
| 7.24 | % |
|
| 5.28 | % |
Private Education Loan cost of funds |
|
| (3.96 | ) |
|
| (2.31 | ) |
Private Education Loan spread |
|
| 3.28 |
|
|
| 2.97 |
|
Other interest-earning asset spread impact |
|
| (.16 | ) |
|
| (.17 | ) |
Net interest margin(1) |
|
| 3.12 | % |
|
| 2.80 | % |
|
| Three Months Ended March 31, |
| |||||
|
| 2022 |
|
| 2021 |
| ||
Private Education Loan yield |
|
| 5.28 | % |
|
| 5.84 | % |
Private Education Loan cost of funds |
|
| (2.31 | ) |
|
| (2.63 | ) |
Private Education Loan spread |
|
| 2.97 |
|
|
| 3.21 |
|
Other interest-earning asset spread impact |
|
| (.17 | ) |
|
| (.22 | ) |
Net interest margin(1) |
|
| 2.80 | % |
|
| 2.99 | % |
|
| ||||||||||||||||||||||||||||||||||||||||||||||||||||||
|
| Three Months Ended March 31, |
| |||||
(Dollars in millions) |
| 2022 |
|
| 2021 |
| ||
Private Education Loans |
| $ | 21,157 |
|
| $ | 22,143 |
|
Other interest-earning assets |
|
| 732 |
|
|
| 822 |
|
Total Private Education Loan interest-earning assets |
| $ | 21,889 |
|
| $ | 22,965 |
|
The decreaseincrease in the net interest margin from the prior year is primarily a result of an increase in the net interest margin on the refinance loan portfolio becoming a larger percentagedue to an improvement in the cost of the overall portfolio.funds.
As of March 31, 2022,2023, our Private Education Loan portfolio totaled $20.1$18.3 billion, comprised of $10.0$9.3 billion of refinance loans and $10.1$9.0 billion of non-refinance loans. The weighted-average life of these portfolios as of March 31, 20222023 was 34 years and 5 years, respectively, assuming a Constant Prepayment Rate (CPR) of 20%15% and 9%10%, respectively.
Provision for Loan Losses
The provision for Private Education Loan losses increased $103decreased $40 million. The provision for loan losses of $(24) million in the current period primarily related to loan originations. There has been an improvement in the current and forecasted economic conditions since the prior period, but such improvement has not mitigated the uncertainty related to the potential negative impact on the portfolio from the end of various payment relief and stimulus benefits recently and in the future. The negative provision of $(87) million in the first quarter of 2021 was primarily related to the reversal of $102 million of allowance for loan losses in connection with the sale of $1.6 billion of Private Education Loans, partially offset by $15 million of provision primarily related to loan originations.
Gains on Sales of Loans
Gains on sales of loans decreased $89saleadoption of $1.6 billiona new accounting standard (ASU 2022-02), $5 million in connection with loan originations and $23 million in connection with the resolution of Private Education Loanscertain private legacy loans in first-quarter 2021. There were no such salesbankruptcy. The provision of $16 million in the current period.year-ago quarter included $11 million in connection with loan originations and $5 million related to a reserve build.
See "Note 1 — Significant Accounting Policies" for further discussion and detail on the adoption of ASU 2022-22.
Operating Expenses
Operating expenses for our consumer lending segment include costs to originate, acquire, service and collect on our consumer loan portfolio. Operating expenses decreased $6 million primarily related to lower originations.increased $2 million.
15
Business Processing Segment
The following table presents Core Earnings results for our Business Processing segment.
|
| Three Months Ended March 31, |
|
| % Increase |
| ||||||
(Dollars in millions) |
| 2023 |
|
| 2022 |
|
| 2023 vs. 2022 |
| |||
Business processing revenue |
| $ | 72 |
|
| $ | 94 |
|
|
| (23 | )% |
Direct operating expenses |
|
| 67 |
|
|
| 76 |
|
|
| (12 | ) |
Income before income tax expense |
|
| 5 |
|
|
| 18 |
|
|
| (72 | ) |
Income tax expense |
|
| 1 |
|
|
| 4 |
|
|
| (75 | ) |
Net income |
| $ | 4 |
|
| $ | 14 |
|
|
| (71 | )% |
|
| Three Months Ended March 31, |
|
| % Increase (Decrease) |
| ||||||
(Dollars in millions) |
| 2022 |
|
| 2021 |
|
| 2022 vs. 2021 |
| |||
Business processing revenue |
| $ | 94 |
|
| $ | 125 |
|
|
| (25 | )% |
Direct operating expenses |
|
| 76 |
|
|
| 91 |
|
|
| (16 | ) |
Income before income tax expense |
|
| 18 |
|
|
| 34 |
|
|
| (47 | ) |
Income tax expense |
|
| 4 |
|
|
| 8 |
|
|
| (50 | ) |
Net income |
| $ | 14 |
|
| $ | 26 |
|
|
| (46 | )% |
Comparison of First-Quarter 20222023 Results with First-Quarter 20212022
| • Revenue was $72 million, $22 million lower due to the expected $37 million wind-down of pandemic-related contracts which was partially offset by a $15 million growth in ongoing government and healthcare services. • Net income was $4 million compared to $14 million. • EBITDA(1) was $5 million, down $14 million, primarily the result of the revenue decrease discussed above. Upfront start-up costs on new contracts were $4 million in first-quarter 2023. Excluding these contract start-up costs, first-quarter 2023 EBITDA and EBITDA margin would be $9 million and 13%, respectively.
|
|
|
|
|
|
Key performance metrics are as follows:
|
| Three Months Ended March 31, |
| |||||
(Dollars in millions) |
| 2023 |
|
| 2022 |
| ||
Revenue from government services |
| $ | 40 |
|
| $ | 49 |
|
Revenue from healthcare services |
|
| 32 |
|
|
| 45 |
|
Total fee revenue |
| $ | 72 |
|
| $ | 94 |
|
EBITDA(1) |
| $ | 5 |
|
| $ | 19 |
|
EBITDA margin(1) |
|
| 7 | % |
|
| 20 | % |
|
| Three Months Ended March 31, |
| |||||
(Dollars in millions) |
| 2022 |
|
| 2021 |
| ||
Revenue from government services |
| $ | 49 |
|
| $ | 63 |
|
Revenue from healthcare services |
|
| 45 |
|
|
| 62 |
|
Total fee revenue |
| $ | 94 |
|
| $ | 125 |
|
EBITDA(1) |
| $ | 19 |
|
| $ | 36 |
|
EBITDA margin(1) |
|
| 20 | % |
|
| 29 | % |
(1)
16
Other Segment
The following table presents Core Earnings results for our Other segment.
|
| Three Months Ended March 31, |
|
| % Increase (Decrease) |
|
| Three Months Ended March 31, |
|
| % Increase |
| ||||||||||||
(Dollars in millions) |
| 2022 |
|
| 2021 |
|
| 2022 vs. 2021 |
|
| 2023 |
|
| 2022 |
|
| 2023 vs. 2022 |
| ||||||
Net interest loss after provision for loan losses |
| $ | (15 | ) |
| $ | (18 | ) |
|
| (17 | )% |
| $ | (25 | ) |
| $ | (15 | ) |
|
| 67 | % |
Other income |
|
| (1 | ) |
|
| — |
|
|
| (100 | ) | ||||||||||||
Other income (loss) |
|
| 2 |
|
|
| (1 | ) |
|
| 300 |
| ||||||||||||
Expenses: |
|
|
|
|
|
|
|
|
|
|
|
|
|
|
|
|
|
|
|
|
| |||
Unallocated shared services expenses: |
|
|
|
|
|
|
|
|
|
|
|
|
|
|
|
|
|
|
|
|
| |||
Unallocated information technology costs |
|
| 21 |
|
|
| 21 |
|
|
| — |
|
|
| 19 |
|
|
| 21 |
|
|
| (10 | ) |
Unallocated corporate costs |
|
| 45 |
|
|
| 43 |
|
|
| 5 |
|
|
| 42 |
|
|
| 45 |
|
|
| (7 | ) |
Total unallocated shared services expenses |
|
| 66 |
|
|
| 64 |
|
|
| 3 |
|
|
| 61 |
|
|
| 66 |
|
|
| (8 | ) |
Restructuring/other reorganization expenses |
|
| 3 |
|
|
| 6 |
|
|
| (50 | ) |
|
| 4 |
|
|
| 3 |
|
|
| 33 |
|
Total expenses |
|
| 69 |
|
|
| 70 |
|
|
| (1 | ) |
|
| 65 |
|
|
| 69 |
|
|
| (6 | ) |
Loss before income tax benefit |
|
| (85 | ) |
|
| (88 | ) |
|
| (3 | ) |
|
| (88 | ) |
|
| (85 | ) |
|
| 4 |
|
Income tax benefit |
|
| (20 | ) |
|
| (21 | ) |
|
| (5 | ) |
|
| (20 | ) |
|
| (20 | ) |
|
| — |
|
Net income (loss) |
| $ | (65 | ) |
| $ | (67 | ) |
|
| (3 | )% |
| $ | (68 | ) |
| $ | (65 | ) |
|
| 5 | % |
Net Interest Loss after Provision for Loan Losses
Net interest loss after provision for loan losses is due to the negative carrying cost of our corporate liquidity portfolio. The decrease inamount of the net interest loss is primarily a result of a decrease in the size of the liquidity portfolio as well as a decrease in the cost of funds of the debt funding the corporate liquidity portfolio.
Unallocated Shared Services Expenses
Unallocated shared services expenses are comprised of costs primarily related to information technology costs related to infrastructure and operations, stock-based compensation expense, accounting, finance, legal, compliance and risk management, regulatory-related expenses, human resources, certain executive management and the board of directors. Regulatory-related expenses include actual settlement amounts as well as third-party professional fees we incur in connection with such regulatory matters and are presented net of any insurance reimbursements for covered costs related to such matters. On an adjusted basis, expenses increased $9decreased $6 million from the year-ago quarter, primarily related to the year-ago period having a $10 million insurance reimbursement related to litigation matters.quarter. Adjusted expenses exclude $1$2 million and $8$1 million, respectively, of regulatory-related expenses in the first quarters of 20222023 and 2021.2022.
See “Note 9 – Commitments and Contingencies” for a discussion of legal and regulatory matters where it is reasonably possible that a loss contingency exists. The Company is unable to anticipate the timing of a resolution or the impact that these matters may have on the Company’s consolidated financial position, liquidity, results of operation or cash flows. As a result, it is not possible at this time to estimate a range of potential exposure, if any, for amounts that may be payable in connection with these matters and reserves have not been established. It is possible that an adverse ruling or rulings may have a material adverse impact on the Company.
Restructuring/Other Reorganization Expenses
During the first quarters of 20222023 and 2021,2022, the Company incurred $3$4 million and $6$3 million, respectively, of restructuring/other reorganization expenses in connection with an effort to reduce costs and improve operating efficiency. These charges were primarily due to facility lease terminationsexit and severance-related costs.
17
Financial Condition
This section provides information regarding the balances, activity and credit performance metrics of our education loan portfolio.
Summary of Our Education Loan Portfolio
Ending Education Loan Balances, net
|
| March 31, 2023 |
| |||||||||||||||||
(Dollars in millions) |
| FFELP |
|
| FFELP |
|
| Total |
|
| Private |
|
| Total |
| |||||
Total education loan portfolio: |
|
|
|
|
|
|
|
|
|
|
|
|
|
|
| |||||
In-school(1) |
| $ | 15 |
|
| $ | — |
|
| $ | 15 |
|
| $ | 73 |
|
| $ | 88 |
|
Grace, repayment and other(2) |
|
| 15,339 |
|
|
| 27,008 |
|
|
| 42,347 |
|
|
| 18,908 |
|
|
| 61,255 |
|
Total |
|
| 15,354 |
|
|
| 27,008 |
|
|
| 42,362 |
|
|
| 18,981 |
|
|
| 61,343 |
|
Allowance for loan losses |
|
| (155 | ) |
|
| (59 | ) |
|
| (214 | ) |
|
| (706 | ) |
|
| (920 | ) |
Total education loan portfolio |
| $ | 15,199 |
|
| $ | 26,949 |
|
| $ | 42,148 |
|
| $ | 18,275 |
|
| $ | 60,423 |
|
% of total FFELP |
|
| 36 | % |
|
| 64 | % |
|
| 100 | % |
|
|
|
|
|
| ||
% of total |
|
| 25 | % |
|
| 45 | % |
|
| 70 | % |
|
| 30 | % |
|
| 100 | % |
|
| December 31, 2022 |
| |||||||||||||||||
(Dollars in millions) |
| FFELP |
|
| FFELP |
|
| Total |
|
| Private |
|
| Total |
| |||||
Total education loan portfolio: |
|
|
|
|
|
|
|
|
|
|
|
|
|
|
| |||||
In-school(1) |
| $ | 16 |
|
| $ | — |
|
| $ | 16 |
|
| $ | 54 |
|
| $ | 70 |
|
Grace, repayment and other(2) |
|
| 15,834 |
|
|
| 27,897 |
|
|
| 43,731 |
|
|
| 19,471 |
|
|
| 63,202 |
|
Total |
|
| 15,850 |
|
|
| 27,897 |
|
|
| 43,747 |
|
|
| 19,525 |
|
|
| 63,272 |
|
Allowance for loan losses |
|
| (159 | ) |
|
| (63 | ) |
|
| (222 | ) |
|
| (800 | ) |
|
| (1,022 | ) |
Total education loan portfolio |
| $ | 15,691 |
|
| $ | 27,834 |
|
| $ | 43,525 |
|
| $ | 18,725 |
|
| $ | 62,250 |
|
% of total FFELP |
|
| 36 | % |
|
| 64 | % |
|
| 100 | % |
|
|
|
|
|
| ||
% of total |
|
| 25 | % |
|
| 45 | % |
|
| 70 | % |
|
| 30 | % |
|
| 100 | % |
|
| March 31, 2022 |
| |||||||||||||||||
(Dollars in millions) |
| FFELP |
|
| FFELP |
|
| Total |
|
| Private |
|
| Total |
| |||||
Total education loan portfolio: |
|
|
|
|
|
|
|
|
|
|
|
|
|
|
| |||||
In-school(1) |
| $ | 21 |
|
| $ | — |
|
| $ | 21 |
|
| $ | 40 |
|
| $ | 61 |
|
Grace, repayment and other(2) |
|
| 17,983 |
|
|
| 33,264 |
|
|
| 51,247 |
|
|
| 21,012 |
|
|
| 72,259 |
|
Total |
|
| 18,004 |
|
|
| 33,264 |
|
|
| 51,268 |
|
|
| 21,052 |
|
|
| 72,320 |
|
Allowance for loan losses |
|
| (176 | ) |
|
| (79 | ) |
|
| (255 | ) |
|
| (964 | ) |
|
| (1,219 | ) |
Total education loan portfolio |
| $ | 17,828 |
|
| $ | 33,185 |
|
| $ | 51,013 |
|
| $ | 20,088 |
|
| $ | 71,101 |
|
% of total FFELP |
|
| 35 | % |
|
| 65 | % |
|
| 100 | % |
|
|
|
|
|
| ||
% of total |
|
| 25 | % |
|
| 47 | % |
|
| 72 | % |
|
| 28 | % |
|
| 100 | % |
|
| March 31, 2022 |
| |||||||||||||||||
(Dollars in millions) |
| FFELP Stafford and Other |
|
| FFELP Consolidation Loans |
|
| Total FFELP Loans |
|
| Private Education Loans |
|
| Total Portfolio |
| |||||
Total education loan portfolio: |
|
|
|
|
|
|
|
|
|
|
|
|
|
|
|
|
|
|
|
|
In-school(1) |
| $ | 21 |
|
| $ | — |
|
| $ | 21 |
|
| $ | 40 |
|
| $ | 61 |
|
Grace, repayment and other(2) |
|
| 17,983 |
|
|
| 33,264 |
|
|
| 51,247 |
|
|
| 21,012 |
|
|
| 72,259 |
|
Total |
|
| 18,004 |
|
|
| 33,264 |
|
|
| 51,268 |
|
|
| 21,052 |
|
|
| 72,320 |
|
Allowance for loan losses |
|
| (176 | ) |
|
| (79 | ) |
|
| (255 | ) |
|
| (964 | ) |
|
| (1,219 | ) |
Total education loan portfolio |
| $ | 17,828 |
|
| $ | 33,185 |
|
| $ | 51,013 |
|
| $ | 20,088 |
|
| $ | 71,101 |
|
% of total FFELP |
|
| 35 | % |
|
| 65 | % |
|
| 100 | % |
|
|
|
|
|
|
|
|
% of total |
|
| 25 | % |
|
| 47 | % |
|
| 72 | % |
|
| 28 | % |
|
| 100 | % |
|
| December 31, 2021 |
| |||||||||||||||||
(Dollars in millions) |
| FFELP Stafford and Other |
|
| FFELP Consolidation Loans |
|
| Total FFELP Loans |
|
| Private Education Loans |
|
| Total Portfolio |
| |||||
Total education loan portfolio: |
|
|
|
|
|
|
|
|
|
|
|
|
|
|
|
|
|
|
|
|
In-school(1) |
| $ | 20 |
|
| $ | — |
|
| $ | 20 |
|
| $ | 19 |
|
| $ | 39 |
|
Grace, repayment and other(2) |
|
| 18,379 |
|
|
| 34,504 |
|
|
| 52,883 |
|
|
| 21,161 |
|
|
| 74,044 |
|
Total |
|
| 18,399 |
|
|
| 34,504 |
|
|
| 52,903 |
|
|
| 21,180 |
|
|
| 74,083 |
|
Allowance for loan losses |
|
| (180 | ) |
|
| (82 | ) |
|
| (262 | ) |
|
| (1,009 | ) |
|
| (1,271 | ) |
Total education loan portfolio |
| $ | 18,219 |
|
| $ | 34,422 |
|
| $ | 52,641 |
|
| $ | 20,171 |
|
| $ | 72,812 |
|
% of total FFELP |
|
| 35 | % |
|
| 65 | % |
|
| 100 | % |
|
|
|
|
|
|
|
|
% of total |
|
| 25 | % |
|
| 47 | % |
|
| 72 | % |
|
| 28 | % |
|
| 100 | % |
|
| March 31, 2021 |
| |||||||||||||||||
(Dollars in millions) |
| FFELP Stafford and Other |
|
| FFELP Consolidation Loans |
|
| Total FFELP Loans |
|
| Private Education Loans |
|
| Total Portfolio |
| |||||
Total education loan portfolio: |
|
|
|
|
|
|
|
|
|
|
|
|
|
|
|
|
|
|
|
|
In-school(1) |
| $ | 28 |
|
| $ | — |
|
| $ | 28 |
|
| $ | 21 |
|
| $ | 49 |
|
Grace, repayment and other(2) |
|
| 19,381 |
|
|
| 37,746 |
|
|
| 57,127 |
|
|
| 20,713 |
|
|
| 77,840 |
|
Total |
|
| 19,409 |
|
|
| 37,746 |
|
|
| 57,155 |
|
|
| 20,734 |
|
|
| 77,889 |
|
Allowance for loan losses |
|
| (191 | ) |
|
| (91 | ) |
|
| (282 | ) |
|
| (992 | ) |
|
| (1,274 | ) |
Total education loan portfolio |
| $ | 19,218 |
|
| $ | 37,655 |
|
| $ | 56,873 |
|
| $ | 19,742 |
|
| $ | 76,615 |
|
% of total FFELP |
|
| 34 | % |
|
| 66 | % |
|
| 100 | % |
|
|
|
|
|
|
|
|
% of total |
|
| 25 | % |
|
| 49 | % |
|
| 74 | % |
|
| 26 | % |
|
| 100 | % |
18
|
|
|
|
Education Loan Activity
|
| Three Months Ended March 31, 2023 |
| |||||||||||||||||
(Dollars in millions) |
| FFELP |
|
| FFELP |
|
| Total |
|
| Private |
|
| Total |
| |||||
Beginning balance |
| $ | 15,691 |
|
| $ | 27,834 |
|
| $ | 43,525 |
|
| $ | 18,725 |
|
| $ | 62,250 |
|
Acquisitions (originations and purchases)(1) |
|
| — |
|
|
| — |
|
|
| — |
|
|
| 274 |
|
|
| 274 |
|
Capitalized interest and premium/discount |
|
| 146 |
|
|
| 163 |
|
|
| 309 |
|
|
| 49 |
|
|
| 358 |
|
Refinancings and consolidations to third |
|
| (252 | ) |
|
| (435 | ) |
|
| (687 | ) |
|
| (72 | ) |
|
| (759 | ) |
Repayments and other |
|
| (386 | ) |
|
| (613 | ) |
|
| (999 | ) |
|
| (701 | ) |
|
| (1,700 | ) |
Ending balance |
| $ | 15,199 |
|
| $ | 26,949 |
|
| $ | 42,148 |
|
| $ | 18,275 |
|
| $ | 60,423 |
|
|
| Three Months Ended March 31, 2022 |
| |||||||||||||||||
(Dollars in millions) |
| FFELP |
|
| FFELP |
|
| Total |
|
| Private |
|
| Total |
| |||||
Beginning balance |
| $ | 18,219 |
|
| $ | 34,422 |
|
| $ | 52,641 |
|
| $ | 20,171 |
|
| $ | 72,812 |
|
Acquisitions (originations and purchases)(1) |
|
| — |
|
|
| 1 |
|
|
| 1 |
|
|
| 1,090 |
|
|
| 1,091 |
|
Capitalized interest and premium/discount |
|
| 170 |
|
|
| 183 |
|
|
| 353 |
|
|
| 53 |
|
|
| 406 |
|
Refinancings and consolidations to third |
|
| (245 | ) |
|
| (686 | ) |
|
| (931 | ) |
|
| (222 | ) |
|
| (1,153 | ) |
Repayments and other |
|
| (316 | ) |
|
| (735 | ) |
|
| (1,051 | ) |
|
| (1,004 | ) |
|
| (2,055 | ) |
Ending balance |
| $ | 17,828 |
|
| $ | 33,185 |
|
| $ | 51,013 |
|
| $ | 20,088 |
|
| $ | 71,101 |
|
|
| Three Months Ended March 31, 2022 |
| |||||||||||||||||
(Dollars in millions) |
| FFELP Stafford and Other |
|
| FFELP Consolidation Loans |
|
| Total FFELP Loans |
|
| Total Private Education Loans |
|
| Total Portfolio |
| |||||
Beginning balance |
| $ | 18,219 |
|
| $ | 34,422 |
|
| $ | 52,641 |
|
| $ | 20,171 |
|
| $ | 72,812 |
|
Acquisitions (originations and purchases)(1) |
|
| — |
|
|
| 1 |
|
|
| 1 |
|
|
| 1,090 |
|
|
| 1,091 |
|
Capitalized interest and premium/discount amortization |
|
| 170 |
|
|
| 183 |
|
|
| 353 |
|
|
| 53 |
|
|
| 406 |
|
Refinancings and consolidations to third parties |
|
| (245 | ) |
|
| (686 | ) |
|
| (931 | ) |
|
| (222 | ) |
|
| (1,153 | ) |
Repayments and other |
|
| (316 | ) |
|
| (735 | ) |
|
| (1,051 | ) |
|
| (1,004 | ) |
|
| (2,055 | ) |
Ending balance |
| $ | 17,828 |
|
| $ | 33,185 |
|
| $ | 51,013 |
|
| $ | 20,088 |
|
| $ | 71,101 |
|
|
| Three Months Ended March 31, 2021 |
| |||||||||||||||||
(Dollars in millions) |
| FFELP Stafford and Other |
|
| FFELP Consolidation Loans |
|
| Total FFELP Loans |
|
| Total Private Education Loans |
|
| Total Portfolio |
| |||||
Beginning balance |
| $ | 19,607 |
|
| $ | 38,677 |
|
| $ | 58,284 |
|
| $ | 21,079 |
|
| $ | 79,363 |
|
Acquisitions (originations and purchases)(1) |
|
| 2 |
|
|
| 2 |
|
|
| 4 |
|
|
| 1,730 |
|
|
| 1,734 |
|
Capitalized interest and premium/discount amortization |
|
| 191 |
|
|
| 210 |
|
|
| 401 |
|
|
| 45 |
|
|
| 446 |
|
Refinancings and consolidations to third parties |
|
| (248 | ) |
|
| (432 | ) |
|
| (680 | ) |
|
| (139 | ) |
|
| (819 | ) |
Loan sales |
|
| — |
|
|
| — |
|
|
| — |
|
|
| (1,465 | ) |
|
| (1,465 | ) |
Repayments and other |
|
| (334 | ) |
|
| (802 | ) |
|
| (1,136 | ) |
|
| (1,508 | ) |
|
| (2,644 | ) |
Ending balance |
| $ | 19,218 |
|
| $ | 37,655 |
|
| $ | 56,873 |
|
| $ | 19,742 |
|
| $ | 76,615 |
|
19
|
|
FFELP Loan Portfolio Performance
|
| March 31, 2023 |
|
| December 31, 2022 |
|
| March 31, 2022 |
| |||||||||||||||
(Dollars in millions) |
| Balance |
|
| % |
|
| Balance |
|
| % |
|
| Balance |
|
| % |
| ||||||
Loans in-school/grace/deferment(1) |
| $ | 1,778 |
|
|
|
|
| $ | 1,772 |
|
|
|
|
| $ | 2,232 |
|
|
|
| |||
Loans in forbearance(2) |
|
| 6,844 |
|
|
|
|
|
| 7,603 |
|
|
|
|
|
| 6,312 |
|
|
|
| |||
Loans in repayment and percentage of each status: |
|
|
|
|
|
|
|
|
|
|
|
|
|
|
|
|
|
| ||||||
Loans current |
|
| 28,886 |
|
|
| 85.6 | % |
|
| 29,004 |
|
|
| 84.4 | % |
|
| 36,948 |
|
|
| 86.5 | % |
Loans delinquent 31-60 days(3) |
|
| 1,270 |
|
|
| 3.8 |
|
|
| 1,247 |
|
|
| 3.6 |
|
|
| 1,888 |
|
|
| 4.4 |
|
Loans delinquent 61-90 days(3) |
|
| 902 |
|
|
| 2.7 |
|
|
| 833 |
|
|
| 2.4 |
|
|
| 1,148 |
|
|
| 2.7 |
|
Loans delinquent greater than 90 days(3) |
|
| 2,682 |
|
|
| 7.9 |
|
|
| 3,288 |
|
|
| 9.6 |
|
|
| 2,740 |
|
|
| 6.4 |
|
Total FFELP Loans in repayment |
|
| 33,740 |
|
|
| 100 | % |
|
| 34,372 |
|
|
| 100 | % |
|
| 42,724 |
|
|
| 100 | % |
Total FFELP Loans |
|
| 42,362 |
|
|
|
|
|
| 43,747 |
|
|
|
|
|
| 51,268 |
|
|
|
| |||
FFELP Loan allowance for losses |
|
| (214 | ) |
|
|
|
|
| (222 | ) |
|
|
|
|
| (255 | ) |
|
|
| |||
FFELP Loans, net |
| $ | 42,148 |
|
|
|
|
| $ | 43,525 |
|
|
|
|
| $ | 51,013 |
|
|
|
| |||
Percentage of FFELP Loans in repayment |
|
|
|
|
| 79.6 | % |
|
|
|
|
| 78.6 | % |
|
|
|
|
| 83.3 | % | |||
Delinquencies as a percentage of FFELP Loans in |
|
|
|
|
| 14.4 | % |
|
|
|
|
| 15.6 | % |
|
|
|
|
| 13.5 | % | |||
FFELP Loans in forbearance as a percentage of |
|
|
|
|
| 16.9 | % |
|
|
|
|
| 18.1 | % |
|
|
|
|
| 12.9 | % | |||
|
| March 31, 2022 |
|
| December 31, 2021 |
|
| March 31, 2021 |
| |||||||||||||||
(Dollars in millions) |
| Balance |
|
| % |
|
| Balance |
|
| % |
|
| Balance |
|
| % |
| ||||||
Loans in-school/grace/deferment(1) |
| $ | 2,232 |
|
|
|
|
|
| $ | 2,220 |
|
|
|
|
|
| $ | 2,781 |
|
|
|
|
|
Loans in forbearance(2) |
|
| 6,312 |
|
|
|
|
|
|
| 6,292 |
|
|
|
|
|
|
| 8,452 |
|
|
|
|
|
Loans in repayment and percentage of each status: |
|
|
|
|
|
|
|
|
|
|
|
|
|
|
|
|
|
|
|
|
|
|
|
|
Loans current |
|
| 36,948 |
|
|
| 86.5 | % |
|
| 39,679 |
|
|
| 89.4 | % |
|
| 42,127 |
|
|
| 91.7 | % |
Loans delinquent 31-60 days(3) |
|
| 1,888 |
|
|
| 4.4 |
|
|
| 1,696 |
|
|
| 3.8 |
|
|
| 1,377 |
|
|
| 3.0 |
|
Loans delinquent 61-90 days(3) |
|
| 1,148 |
|
|
| 2.7 |
|
|
| 904 |
|
|
| 2.0 |
|
|
| 813 |
|
|
| 1.8 |
|
Loans delinquent greater than 90 days(3) |
|
| 2,740 |
|
|
| 6.4 |
|
|
| 2,112 |
|
|
| 4.8 |
|
|
| 1,605 |
|
|
| 3.5 |
|
Total FFELP Loans in repayment |
|
| 42,724 |
|
|
| 100 | % |
|
| 44,391 |
|
|
| 100 | % |
|
| 45,922 |
|
|
| 100 | % |
Total FFELP Loans |
|
| 51,268 |
|
|
|
|
|
|
| 52,903 |
|
|
|
|
|
|
| 57,155 |
|
|
|
|
|
FFELP Loan allowance for losses |
|
| (255 | ) |
|
|
|
|
|
| (262 | ) |
|
|
|
|
|
| (282 | ) |
|
|
|
|
FFELP Loans, net |
| $ | 51,013 |
|
|
|
|
|
| $ | 52,641 |
|
|
|
|
|
| $ | 56,873 |
|
|
|
|
|
Percentage of FFELP Loans in repayment |
|
|
|
|
|
| 83.3 | % |
|
|
|
|
|
| 83.9 | % |
|
|
|
|
|
| 80.3 | % |
Delinquencies as a percentage of FFELP Loans in repayment |
|
|
|
|
|
| 13.5 | % |
|
|
|
|
|
| 10.6 | % |
|
|
|
|
|
| 8.3 | % |
FFELP Loans in forbearance as a percentage of loans in repayment and forbearance |
|
|
|
|
|
| 12.9 | % |
|
|
|
|
|
| 12.4 | % |
|
|
|
|
|
| 15.5 | % |
|
|
|
|
|
|
Private Education Loan Portfolio Performance
|
| March 31, 2023 |
|
| December 31, 2022 |
|
| March 31, 2022 |
| |||||||||||||||
(Dollars in millions) |
| Balance |
|
| % |
|
| Balance |
|
| % |
|
| Balance |
|
| % |
| ||||||
Loans in-school/grace/deferment(1) |
| $ | 369 |
|
|
|
|
| $ | 354 |
|
|
|
|
| $ | 377 |
|
|
|
| |||
Loans in forbearance(2) |
|
| 354 |
|
|
|
|
|
| 401 |
|
|
|
|
|
| 418 |
|
|
|
| |||
Loans in repayment and percentage of each status: |
|
|
|
|
|
|
|
|
|
|
|
|
|
|
|
|
|
| ||||||
Loans current |
|
| 17,439 |
|
|
| 95.5 | % |
|
| 17,838 |
|
|
| 95.0 | % |
|
| 19,447 |
|
|
| 96.0 | % |
Loans delinquent 31-60 days(3) |
|
| 290 |
|
|
| 1.6 |
|
|
| 335 |
|
|
| 1.8 |
|
|
| 290 |
|
|
| 1.4 |
|
Loans delinquent 61-90 days(3) |
|
| 165 |
|
|
| .9 |
|
|
| 186 |
|
|
| 1.0 |
|
|
| 206 |
|
|
| 1.0 |
|
Loans delinquent greater than 90 days(3) |
|
| 364 |
|
|
| 2.0 |
|
|
| 411 |
|
|
| 2.2 |
|
|
| 314 |
|
|
| 1.6 |
|
Total Private Education Loans in repayment |
|
| 18,258 |
|
|
| 100 | % |
|
| 18,770 |
|
|
| 100 | % |
|
| 20,257 |
|
|
| 100 | % |
Total Private Education Loans |
|
| 18,981 |
|
|
|
|
|
| 19,525 |
|
|
|
|
|
| 21,052 |
|
|
|
| |||
Private Education Loan allowance for losses |
|
| (706 | ) |
|
|
|
|
| (800 | ) |
|
|
|
|
| (964 | ) |
|
|
| |||
Private Education Loans, net |
| $ | 18,275 |
|
|
|
|
| $ | 18,725 |
|
|
|
|
| $ | 20,088 |
|
|
|
| |||
Percentage of Private Education Loans in |
|
|
|
|
| 96.2 | % |
|
|
|
|
| 96.1 | % |
|
|
|
|
| 96.2 | % | |||
Delinquencies as a percentage of Private Education |
|
|
|
|
| 4.5 | % |
|
|
|
|
| 5.0 | % |
|
|
|
|
| 4.0 | % | |||
Loans in forbearance as a percentage of loans in |
|
|
|
|
| 1.9 | % |
|
|
|
|
| 2.1 | % |
|
|
|
|
| 2.0 | % | |||
Percentage of Private Education Loans with a |
|
|
|
|
| 33 | % |
|
|
|
|
| 33 | % |
|
|
|
|
| 34 | % | |||
|
|
|
|
|
|
|
|
|
|
|
|
|
|
|
|
|
|
| ||||||
|
| March 31, 2022 |
|
| December 31, 2021 |
|
| March 31, 2021 |
| |||||||||||||||
(Dollars in millions) |
| Balance |
|
| % |
|
| Balance |
|
| % |
|
| Balance |
|
| % |
| ||||||
Loans in-school/grace/deferment(1) |
| $ | 377 |
|
|
|
|
|
| $ | 361 |
|
|
|
|
|
| $ | 457 |
|
|
|
|
|
Loans in forbearance(2) |
|
| 418 |
|
|
|
|
|
|
| 535 |
|
|
|
|
|
|
| 797 |
|
|
|
|
|
Loans in repayment and percentage of each status: |
|
|
|
|
|
|
|
|
|
|
|
|
|
|
|
|
|
|
|
|
|
|
|
|
Loans current |
|
| 19,447 |
|
|
| 96.0 | % |
|
| 19,634 |
|
|
| 96.8 | % |
|
| 19,020 |
|
|
| 97.7 | % |
Loans delinquent 31-60 days(3) |
|
| 290 |
|
|
| 1.4 |
|
|
| 222 |
|
|
| 1.1 |
|
|
| 179 |
|
|
| .9 |
|
Loans delinquent 61-90 days(3) |
|
| 206 |
|
|
| 1.0 |
|
|
| 131 |
|
|
| .6 |
|
|
| 100 |
|
|
| .5 |
|
Loans delinquent greater than 90 days(3) |
|
| 314 |
|
|
| 1.6 |
|
|
| 297 |
|
|
| 1.5 |
|
|
| 181 |
|
|
| .9 |
|
Total Private Education Loans in repayment |
|
| 20,257 |
|
|
| 100 | % |
|
| 20,284 |
|
|
| 100 | % |
|
| 19,480 |
|
|
| 100 | % |
Total Private Education Loans |
|
| 21,052 |
|
|
|
|
|
|
| 21,180 |
|
|
|
|
|
|
| 20,734 |
|
|
|
|
|
Private Education Loan allowance for losses |
|
| (964 | ) |
|
|
|
|
|
| (1,009 | ) |
|
|
|
|
|
| (992 | ) |
|
|
|
|
Private Education Loans, net |
| $ | 20,088 |
|
|
|
|
|
| $ | 20,171 |
|
|
|
|
|
| $ | 19,742 |
|
|
|
|
|
Percentage of Private Education Loans in repayment |
|
|
|
|
|
| 96.2 | % |
|
|
|
|
|
| 95.8 | % |
|
|
|
|
|
| 94.0 | % |
Delinquencies as a percentage of Private Education Loans in repayment |
|
|
|
|
|
| 4.0 | % |
|
|
|
|
|
| 3.2 | % |
|
|
|
|
|
| 2.3 | % |
Loans in forbearance as a percentage of loans in repayment and forbearance |
|
|
|
|
|
| 2.0 | % |
|
|
|
|
|
| 2.6 | % |
|
|
|
|
|
| 3.9 | % |
Percentage of Private Education Loans with a cosigner(4) |
|
|
|
|
|
| 34 | % |
|
|
|
|
|
| 35 | % |
|
|
|
|
|
| 40 | % |
|
|
|
|
|
|
|
|
|
|
|
|
|
|
|
|
|
|
|
|
|
|
|
|
|
20
|
|
|
|
|
|
|
|
Allowance for Loan Losses
|
| Three Months Ended March 31, |
| |||||||||||||||||||||
|
| 2023 |
|
| 2022 |
| ||||||||||||||||||
(Dollars in millions) |
| FFELP Loans |
|
| Private Education Loans |
|
| Total |
|
| FFELP Loans |
|
| Private Education Loans |
|
| Total |
| ||||||
Allowance at beginning of period |
| $ | 222 |
|
| $ | 800 |
|
| $ | 1,022 |
|
| $ | 262 |
|
| $ | 1,009 |
|
| $ | 1,271 |
|
Total provision |
|
| 10 |
|
|
| (24 | ) |
|
| (14 | ) |
|
| — |
|
|
| 16 |
|
|
| 16 |
|
Charge-offs: |
|
|
|
|
|
|
|
|
|
|
|
|
|
|
|
|
|
| ||||||
Gross charge-offs |
|
| (18 | ) |
|
| (88 | ) |
|
| (106 | ) |
|
| (7 | ) |
|
| (81 | ) |
|
| (88 | ) |
Expected future recoveries on current period gross |
|
| — |
|
|
| 13 |
|
|
| 13 |
|
|
| — |
|
|
| 12 |
|
|
| 12 |
|
Net charge-offs(1) |
|
| (18 | ) |
|
| (75 | ) |
|
| (93 | ) |
|
| (7 | ) |
|
| (69 | ) |
|
| (76 | ) |
Decrease in expected future recoveries on charged- |
|
| — |
|
|
| 5 |
|
|
| 5 |
|
|
| — |
|
|
| 8 |
|
|
| 8 |
|
Allowance at end of period (GAAP) |
|
| 214 |
|
|
| 706 |
|
|
| 920 |
|
|
| 255 |
|
|
| 964 |
|
|
| 1,219 |
|
Plus: expected future recoveries on previously fully |
|
| — |
|
|
| 268 |
|
|
| 268 |
|
|
| — |
|
|
| 321 |
|
|
| 321 |
|
Allowance at end of period excluding expected future |
| $ | 214 |
|
| $ | 974 |
|
| $ | 1,188 |
|
| $ | 255 |
|
| $ | 1,285 |
|
| $ | 1,540 |
|
Net charge-offs as a percentage of average loans in |
|
| .22 | % |
|
| 1.63 | % |
|
|
|
|
| .07 | % |
|
| 1.38 | % |
|
|
| ||
Allowance coverage of charge-offs (annualized)(3) |
|
| 2.9 |
|
|
| 3.2 |
|
| (Non-GAAP) |
|
|
| 8.8 |
|
|
| 4.6 |
|
| (Non-GAAP) |
| ||
Allowance as a percentage of the ending total loan |
|
| .5 | % |
|
| 5.1 | % |
| (Non-GAAP) |
|
|
| .5 | % |
|
| 6.1 | % |
| (Non-GAAP) |
| ||
Allowance as a percentage of ending loans in |
|
| .6 | % |
|
| 5.4 | % |
| (Non-GAAP) |
|
|
| .6 | % |
|
| 6.3 | % |
| (Non-GAAP) |
| ||
Ending total loans |
| $ | 42,362 |
|
| $ | 18,981 |
|
|
|
|
| $ | 51,268 |
|
| $ | 21,052 |
|
|
|
| ||
Average loans in repayment |
| $ | 34,305 |
|
| $ | 18,552 |
|
|
|
|
| $ | 43,125 |
|
| $ | 20,387 |
|
|
|
| ||
Ending loans in repayment |
| $ | 33,740 |
|
| $ | 18,258 |
|
|
|
|
| $ | 42,724 |
|
| $ | 20,257 |
|
|
|
| ||
|
| Three Months Ended March 31, |
| |||||||||||||||||||||
|
| 2022 |
|
| 2021 |
| ||||||||||||||||||
(Dollars in millions) |
| FFELP Loans |
|
| Private Education Loans |
|
| Total |
|
| FFELP Loans |
|
| Private Education Loans |
|
| Total |
| ||||||
Allowance at beginning of period |
| $ | 262 |
|
| $ | 1,009 |
|
| $ | 1,271 |
|
| $ | 288 |
|
| $ | 1,089 |
|
| $ | 1,377 |
|
Provision: |
|
|
|
|
|
|
|
|
|
|
|
|
|
|
|
|
|
|
|
|
|
|
|
|
Reversal of allowance related to loan sales(1) |
|
| — |
|
|
| — |
|
|
| — |
|
|
| — |
|
|
| (102 | ) |
|
| (102 | ) |
Remaining provision |
|
| — |
|
|
| 16 |
|
|
| 16 |
|
|
| — |
|
|
| 15 |
|
|
| 15 |
|
Total provision |
|
| — |
|
|
| 16 |
|
|
| 16 |
|
|
| — |
|
|
| (87 | ) |
|
| (87 | ) |
Charge-offs(2) |
|
| (7 | ) |
|
| (69 | ) |
|
| (76 | ) |
|
| (6 | ) |
|
| (35 | ) |
|
| (41 | ) |
Decrease in expected future recoveries on charged- off loans(3) |
|
| — |
|
|
| 8 |
|
|
| 8 |
|
|
| — |
|
|
| 25 |
|
|
| 25 |
|
Allowance at end of period |
|
| 255 |
|
|
| 964 |
|
|
| 1,219 |
|
|
| 282 |
|
|
| 992 |
|
|
| 1,274 |
|
Plus: expected future recoveries on charged-off loans(3) |
|
| — |
|
|
| 321 |
|
|
| 321 |
|
|
| — |
|
|
| 454 |
|
|
| 454 |
|
Allowance at end of period excluding expected future recoveries on charged-off loans(4) |
| $ | 255 |
|
| $ | 1,285 |
|
| $ | 1,540 |
|
| $ | 282 |
|
| $ | 1,446 |
|
| $ | 1,728 |
|
Charge-offs as a percentage of average loans in repayment (annualized) |
|
| .07 | % |
|
| 1.38 | % |
|
|
|
|
|
| .06 | % |
|
| .68 | % |
|
|
|
|
Allowance coverage of charge-offs (annualized)(4) |
|
| 8.8 |
|
|
| 4.6 |
|
|
|
|
|
|
| 10.7 |
|
|
| 10.2 |
|
|
|
|
|
Allowance as a percentage of the ending total loan balance(4) |
|
| .5 | % |
|
| 6.1 | % |
|
|
|
|
|
| .5 | % |
|
| 7.0 | % |
|
|
|
|
Allowance as a percentage of ending loans in repayment(4) |
|
| .6 | % |
|
| 6.3 | % |
|
|
|
|
|
| .6 | % |
|
| 7.4 | % |
|
|
|
|
Ending total loans |
| $ | 51,268 |
|
| $ | 21,052 |
|
|
|
|
|
| $ | 57,155 |
|
| $ | 20,734 |
|
|
|
|
|
Average loans in repayment |
| $ | 43,125 |
|
| $ | 20,387 |
|
|
|
|
|
| $ | 47,044 |
|
| $ | 20,883 |
|
|
|
|
|
Ending loans in repayment |
| $ | 42,724 |
|
| $ | 20,257 |
|
|
|
|
|
| $ | 45,922 |
|
| $ | 19,480 |
|
|
|
|
|
|
| Three Months Ended March 31, |
| |||||
(Dollars in millions) |
| 2023 |
|
| 2022 |
| ||
Beginning of period expected future recoveries on |
| $ | 274 |
|
| $ | 329 |
|
Expected future recoveries of current period defaults |
|
| 13 |
|
|
| 12 |
|
Recoveries (cash collected) |
|
| (13 | ) |
|
| (15 | ) |
Charge-offs (as a result of lower recovery expectations) |
|
| (6 | ) |
|
| (5 | ) |
End of period expected future recoveries on previously |
|
| 268 |
|
| $ | 321 |
|
Change in balance during period |
| $ | (5 | ) |
| $ | (8 | ) |
21
|
|
|
|
|
|
|
| Three Months Ended March 31, |
| |||||
(Dollars in millions) |
| 2022 |
|
| 2021 |
| ||
Beginning of period expected recoveries |
| $ | 329 |
|
| $ | 479 |
|
Expected future recoveries of current period defaults |
|
| 12 |
|
|
| 5 |
|
Recoveries |
|
| (15 | ) |
|
| (25 | ) |
Charge-offs |
|
| (5 | ) |
|
| (5 | ) |
End of period expected recoveries |
| $ | 321 |
|
| $ | 454 |
|
Change in balance during period |
| $ | (8 | ) |
| $ | (25 | ) |
|
|
Liquidity and Capital Resources
Funding and Liquidity Risk Management
The following “Liquidity and Capital Resources” discussion concentrates primarily on our Federal Education Loans and Consumer Lending segments. Our Business Processing and Other segments require minimal liquidity and funding. See “Navient’s Response to COVID-19” for a discussion of COVID-19’s impact on liquidity and capital resources.
We define liquidity as cash and high-quality liquid assets that we can use to meet our cash requirements. Our two primary liquidity needs are: (1) servicing our debt and (2) our ongoing ability to meet our cash needs for running the operations of our businesses (including derivative collateral requirements) throughout market cycles, including during periods of financial stress. Secondary liquidity needs, which can be adjusted as needed, include the origination of Private Education Loans, acquisitions of Private Education Loan and FFELP Loan portfolios, acquisitions of companies, the payment of common stock dividends and the repurchase of our common stock. To achieve these objectives, we analyze and monitor our liquidity needs and maintain excess liquidity and access to diverse funding sources including the issuance of unsecured debt and the issuance of secured debt primarily through asset-backed securitizations and/or other financing facilities.
We define our liquidity risk as the potential inability to meet our obligations when they become due without incurring unacceptable losses or to invest in future asset growth and business operations at reasonable market rates. Our primary liquidity risk relates to our ability to service our debt, meet our other business obligations and to continue to grow our business. The ability to access the capital markets is impacted by general market and economic conditions, our credit ratings, as well as the overall availability of funding sources in the marketplace. In addition, credit ratings may be important to customers or counterparties when we compete in certain markets and when we seek to engage in certain transactions, including over-the-counter derivatives.
Credit ratings and outlooks are opinions subject to ongoing review by the rating agencies and may change, from time to time, based on our financial performance, industry and market dynamics and other factors. Other factors that influence our credit ratings include the rating agencies’ assessment of the general operating environment, our relative positions in the markets in which we compete, reputation, liquidity position, the level and volatility of earnings, corporate governance and risk management policies, capital position and capital management practices. A negative change in our credit rating could have a negative effect on our liquidity because it might raise the cost and availability of funding and potentially require additional cash collateral or restrict cash currently held as collateral on existing borrowings or derivative collateral arrangements. It is our objective to improve our credit ratings so that we can continue to efficiently access the capital markets even in difficult economic and market conditions. We have unsecured debt totaling $7.1$6.0 billion at March 31, 2022.2023. Three credit rating agencies currently rate our long-term unsecured debt at below investment grade.
We expect to fund our ongoing liquidity needs, including the repayment of $1.0$1.1 billion of senior unsecured notes that mature in the short term (i.e., over the next 12 months) and the remaining $6.1$4.9 billion of senior unsecured notes that mature in the long term (from 20232024 to 2043 with 81%77% maturing by 2029), through a number of sources. These sources primarily areinclude our cash on hand, unencumbered FFELP Loan and Private Education Refinance Loan portfolios (see “Sources of Primary Liquidity” below), the predictable operating cash flows provided by operating activities, the repayment of principal on unencumbered education loan assets, and the distribution of overcollateralization from our securitization trusts. We may also, depending on market conditions and availability, draw down on our secured FFELP Loan and Private Education Loan facilities, issue term ABS, enter into additional Private Education Loan ABS repurchase facilities, or issue additional unsecured debtdebt..
We originate Private Education Loans (a portion of which are doneis obtained through a forward purchase agreement). We also have purchased and may purchase, in future periods, Private Education Loan and FFELP Loan portfolios from third parties. ThoseLoan originations and purchases are part of our ongoing liquidity needs. We purchased 6.24.9 million shares of common stock for $115$85 million in the first quarter of 20222023 and have $885$515 million of unused share repurchase authority as of March 31, 2022.2023.
22
Sources of Primary Liquidity
|
|
|
|
|
|
|
|
|
|
|
|
|
|
|
|
|
|
|
| |||||
(Dollars in millions) |
| March 31, 2022 |
|
| December 31, 2021 |
|
| March 31, 2021 |
|
| March 31, 2023 |
|
| December 31, 2022 |
|
| March 31, 2022 |
| ||||||
Ending Balances: |
|
|
|
|
|
|
|
|
|
|
|
|
|
|
|
|
|
|
|
| ||||
Total unrestricted cash and liquid investments |
| $ | 708 |
|
| $ | 905 |
|
| $ | 1,497 |
|
| $ | 570 |
|
| $ | 1,535 |
|
| $ | 708 |
|
Unencumbered FFELP Loans |
|
| 222 |
|
|
| 124 |
|
|
| 259 |
|
|
| 62 |
|
|
| 68 |
|
|
| 222 |
|
Unencumbered Private Education Refinance Loans |
|
| 232 |
|
|
| 383 |
|
|
| 936 |
|
|
| 37 |
|
|
| 55 |
|
|
| 232 |
|
Total |
| $ | 1,162 |
|
| $ | 1,412 |
|
| $ | 2,692 |
|
| $ | 669 |
|
| $ | 1,658 |
|
| $ | 1,162 |
|
|
| Three Months Ended |
| |||||||||
(Dollars in millions) |
| March 31, 2023 |
|
| December 31, 2022 |
|
| March 31, 2022 |
| |||
Average Balances: |
|
|
|
|
|
|
|
|
| |||
Total unrestricted cash and liquid |
| $ | 825 |
|
| $ | 1,517 |
|
| $ | 874 |
|
Unencumbered FFELP Loans |
|
| 85 |
|
|
| 153 |
|
|
| 177 |
|
Unencumbered Private Education |
|
| 66 |
|
|
| 300 |
|
|
| 343 |
|
Total |
| $ | 976 |
|
| $ | 1,970 |
|
| $ | 1,394 |
|
|
| Three Months Ended |
| |||||||||
(Dollars in millions) |
| March 31, 2022 |
|
| December 31, 2021 |
|
| March 31, 2021 |
| |||
Average Balances: |
|
|
|
|
|
|
|
|
|
|
|
|
Total unrestricted cash and liquid investments |
| $ | 874 |
|
| $ | 1,339 |
|
| $ | 1,198 |
|
Unencumbered FFELP Loans |
|
| 177 |
|
|
| 119 |
|
|
| 276 |
|
Unencumbered Private Education Refinance Loans |
|
| 343 |
|
|
| 565 |
|
|
| 752 |
|
Total |
| $ | 1,394 |
|
| $ | 2,023 |
|
| $ | 2,226 |
|
Sources of Additional Liquidity
Liquidity may also be available under our secured credit facilities. Maximum borrowing capacity under the FFELP Loan and Private Education Loan asset-backed commercial paper (ABCP) facilities will vary and be subject to each agreement’s borrowing conditions, including, among others, facility size, current usage and availability of qualifying collateral from unencumbered loans. The following tables detail the additional borrowing capacity of these facilities with maturity dates ranging from June 20222023 to April 2024.
(Dollars in millions) |
| March 31, 2022 |
|
| December 31, 2021 |
|
| March 31, 2021 |
|
| March 31, 2023 |
|
| December 31, 2022 |
|
| March 31, 2022 |
| ||||||
Ending Balances |
|
|
|
|
|
|
|
|
|
|
|
|
|
|
|
|
|
|
|
| ||||
FFELP Loan ABCP facilities |
| $ | 352 |
|
| $ | 546 |
|
| $ | 826 |
|
| $ | 57 |
|
| $ | 101 |
|
| $ | 352 |
|
Private Education Loan ABCP facilities |
|
| 2,137 |
|
|
| 2,235 |
|
|
| 2,844 |
|
|
| 1,028 |
|
|
| 1,248 |
|
|
| 2,137 |
|
Total |
| $ | 2,489 |
|
| $ | 2,781 |
|
| $ | 3,670 |
|
| $ | 1,085 |
|
| $ | 1,349 |
|
| $ | 2,489 |
|
|
| Three Months Ended |
|
| Three Months Ended |
| ||||||||||||||||||
(Dollars in millions) |
| March 31, 2022 |
|
| December 31, 2021 |
|
| March 31, 2021 |
|
| March 31, 2023 |
|
| December 31, 2022 |
|
| March 31, 2022 |
| ||||||
Average Balances |
|
|
|
|
|
|
|
|
|
|
|
|
|
|
|
|
|
|
|
| ||||
FFELP Loan ABCP facilities |
| $ | 382 |
|
| $ | 441 |
|
| $ | 656 |
|
| $ | 107 |
|
| $ | 193 |
|
| $ | 382 |
|
Private Education Loan ABCP facilities |
|
| 2,239 |
|
|
| 2,419 |
|
|
| 2,420 |
|
|
| 1,141 |
|
|
| 1,556 |
|
|
| 2,239 |
|
Total |
| $ | 2,621 |
|
| $ | 2,860 |
|
| $ | 3,076 |
|
| $ | 1,248 |
|
| $ | 1,749 |
|
| $ | 2,621 |
|
At March 31, 2022,2023, we had a total of $4.0$3.0 billion of unencumbered tangible assets inclusive of those listed in the table above as sources of primary liquidity. Total unencumbered education loans comprised $2.1$1.5 billion principal of our unencumbered tangible assets of which $1.9$1.5 billion and $222$62 million related to Private Education Loans and FFELP Loans, respectively. In addition, as of March 31, 2022,2023, we had $5.7$5.4 billion of encumbered net assets (i.e., overcollateralization) in our various financing facilities (consolidated variable interest entities). Our secured financing facilities include Private Education Loan ABS Repurchase Facilities, which had $0.5$0.6 billion outstanding as of March 31, 2022.2023. These repurchase facilities are collateralized by the net assets in previously issued Private Education Loan ABS trusts and have had a cost of funds lower than that of a new unsecured debt issuance.
23
The following table reconciles encumbered and unencumbered assets and their net impact on total Tangible Equity.
(Dollars in billions) |
| March 31, 2023 |
|
| December 31, 2022 |
| ||
Net assets of consolidated variable interest entities |
| $ | 3.7 |
|
|
| 3.7 |
|
Net assets of consolidated variable interest entities |
|
| 1.7 |
|
|
| 1.5 |
|
Tangible unencumbered assets(1) |
|
| 3.0 |
|
|
| 4.1 |
|
Senior unsecured debt |
|
| (6.0 | ) |
|
| (7.0 | ) |
Mark-to-market on unsecured hedged debt(2) |
|
| .2 |
|
|
| .3 |
|
Other liabilities, net |
|
| (.3 | ) |
|
| (.3 | ) |
Total Tangible Equity (1) |
| $ | 2.3 |
|
| $ | 2.3 |
|
(Dollars in billions) |
| March 31, 2022 |
|
| December 31, 2021 |
| ||
Net assets of consolidated variable interest entities (encumbered assets) — FFELP Loans |
| $ | 3.8 |
|
|
| 3.8 |
|
Net assets of consolidated variable interest entities (encumbered assets) — Private Education Loans |
|
| 1.9 |
|
|
| 1.7 |
|
Tangible unencumbered assets(1) |
|
| 4.0 |
|
|
| 4.5 |
|
Senior unsecured debt |
|
| (7.0 | ) |
|
| (7.0 | ) |
Mark-to-market on unsecured hedged debt(2) |
|
| (.1 | ) |
|
| (.3 | ) |
Other liabilities, net |
|
| (.5 | ) |
|
| (.8 | ) |
Total Tangible Equity (1) |
| $ | 2.1 |
|
| $ | 1.9 |
|
Borrowings |
|
|
|
|
Borrowings
Ending Balances
|
| March 31, 2023 |
|
| December 31, 2022 |
| ||||||||||||||||||
(Dollars in millions) |
| Short |
|
| Long |
|
| Total |
|
| Short |
|
| Long |
|
| Total |
| ||||||
Unsecured borrowings: |
|
|
|
|
|
|
|
|
|
|
|
|
|
|
|
|
|
| ||||||
Senior unsecured debt |
| $ | 1,149 |
|
| $ | 4,864 |
|
| $ | 6,013 |
|
| $ | 1,301 |
|
| $ | 5,711 |
|
| $ | 7,012 |
|
Total unsecured borrowings |
|
| 1,149 |
|
|
| 4,864 |
|
|
| 6,013 |
|
|
| 1,301 |
|
|
| 5,711 |
|
|
| 7,012 |
|
Secured borrowings: |
|
|
|
|
|
|
|
|
|
|
|
|
|
|
|
|
|
| ||||||
FFELP Loan securitizations |
|
| 68 |
|
|
| 40,275 |
|
|
| 40,343 |
|
|
| 76 |
|
|
| 42,675 |
|
|
| 42,751 |
|
Private Education Loan securitizations |
|
| 648 |
|
|
| 12,187 |
|
|
| 12,835 |
|
|
| 725 |
|
|
| 12,744 |
|
|
| 13,469 |
|
FFELP Loan ABCP facilities |
|
| 887 |
|
|
| 428 |
|
|
| 1,315 |
|
|
| 923 |
|
|
| 386 |
|
|
| 1,309 |
|
Private Education Loan ABCP facilities |
|
| 2,917 |
|
|
| — |
|
|
| 2,917 |
|
|
| 2,734 |
|
|
| — |
|
|
| 2,734 |
|
Other |
|
| 105 |
|
|
| — |
|
|
| 105 |
|
|
| 121 |
|
|
| — |
|
|
| 121 |
|
Total secured borrowings |
|
| 4,625 |
|
|
| 52,890 |
|
|
| 57,515 |
|
|
| 4,579 |
|
|
| 55,805 |
|
|
| 60,384 |
|
Core Earnings basis borrowings(1) |
|
| 5,774 |
|
|
| 57,754 |
|
|
| 63,528 |
|
|
| 5,880 |
|
|
| 61,516 |
|
|
| 67,396 |
|
Adjustment for GAAP accounting treatment |
|
| (21 | ) |
|
| (366 | ) |
|
| (387 | ) |
|
| (10 | ) |
|
| (490 | ) |
|
| (500 | ) |
GAAP basis borrowings |
| $ | 5,753 |
|
| $ | 57,388 |
|
| $ | 63,141 |
|
| $ | 5,870 |
|
| $ | 61,026 |
|
| $ | 66,896 |
|
|
| March 31, 2022 |
|
| December 31, 2021 |
| ||||||||||||||||||
(Dollars in millions) |
| Short Term |
|
| Long Term |
|
| Total |
|
| Short Term |
|
| Long Term |
|
| Total |
| ||||||
Unsecured borrowings: |
|
|
|
|
|
|
|
|
|
|
|
|
|
|
|
|
|
|
|
|
|
|
|
|
Senior unsecured debt |
| $ | 999 |
|
| $ | 6,018 |
|
| $ | 7,017 |
|
| $ | — |
|
| $ | 7,014 |
|
| $ | 7,014 |
|
Total unsecured borrowings |
|
| 999 |
|
|
| 6,018 |
|
|
| 7,017 |
|
|
| — |
|
|
| 7,014 |
|
|
| 7,014 |
|
Secured borrowings: |
|
|
|
|
|
|
|
|
|
|
|
|
|
|
|
|
|
|
|
|
|
|
|
|
FFELP Loan securitizations |
|
| — |
|
|
| 49,622 |
|
|
| 49,622 |
|
|
| — |
|
|
| 51,841 |
|
|
| 51,841 |
|
Private Education Loan securitizations |
|
| 515 |
|
|
| 14,038 |
|
|
| 14,553 |
|
|
| 543 |
|
|
| 14,074 |
|
|
| 14,617 |
|
FFELP Loan ABCP facilities |
|
| 619 |
|
|
| 145 |
|
|
| 764 |
|
|
| 282 |
|
|
| 150 |
|
|
| 432 |
|
Private Education Loan ABCP facilities |
|
| 1,462 |
|
|
| 1,114 |
|
|
| 2,576 |
|
|
| 1,363 |
|
|
| 1,152 |
|
|
| 2,515 |
|
Other |
|
| 204 |
|
|
| — |
|
|
| 204 |
|
|
| 302 |
|
|
| — |
|
|
| 302 |
|
Total secured borrowings |
|
| 2,800 |
|
|
| 64,919 |
|
|
| 67,719 |
|
|
| 2,490 |
|
|
| 67,217 |
|
|
| 69,707 |
|
Core Earnings basis borrowings(1) |
|
| 3,799 |
|
|
| 70,937 |
|
|
| 74,736 |
|
|
| 2,490 |
|
|
| 74,231 |
|
|
| 76,721 |
|
Adjustment for GAAP accounting treatment |
|
| 3 |
|
|
| (112 | ) |
|
| (109 | ) |
|
| — |
|
|
| 257 |
|
|
| 257 |
|
GAAP basis borrowings |
| $ | 3,802 |
|
| $ | 70,825 |
|
| $ | 74,627 |
|
| $ | 2,490 |
|
| $ | 74,488 |
|
| $ | 76,978 |
|
Average Balances
|
| Three Months Ended March 31, |
| |||||||||||||
|
| 2023 |
|
| 2022 |
| ||||||||||
(Dollars in millions) |
| Average |
|
| Average |
|
| Average |
|
| Average |
| ||||
Unsecured borrowings: |
|
|
|
|
|
|
|
|
|
|
|
| ||||
Senior unsecured debt |
| $ | 6,279 |
|
|
| 8.14 | % |
| $ | 7,015 |
|
|
| 4.30 | % |
Total unsecured borrowings |
|
| 6,279 |
|
|
| 8.14 |
|
|
| 7,015 |
|
|
| 4.30 |
|
Secured borrowings: |
|
|
|
|
|
|
|
|
|
|
|
| ||||
FFELP Loan securitizations |
|
| 41,377 |
|
|
| 5.15 |
|
|
| 50,553 |
|
|
| 1.31 |
|
Private Education Loan securitizations |
|
| 13,172 |
|
|
| 3.25 |
|
|
| 14,653 |
|
|
| 2.29 |
|
FFELP Loan ABCP facilities |
|
| 1,288 |
|
|
| 5.90 |
|
|
| 692 |
|
|
| 1.57 |
|
Private Education Loan ABCP facilities |
|
| 2,828 |
|
|
| 6.25 |
|
|
| 2,496 |
|
|
| 1.90 |
|
Other |
|
| 108 |
|
|
| 5.03 |
|
|
| 251 |
|
|
| .67 |
|
Total secured borrowings |
|
| 58,773 |
|
|
| 4.79 |
|
|
| 68,645 |
|
|
| 1.54 |
|
Core Earnings basis borrowings(1) |
|
| 65,052 |
|
|
| 5.11 |
|
|
| 75,660 |
|
|
| 1.79 |
|
Adjustment for GAAP accounting treatment |
|
| — |
|
|
| .11 |
|
|
| — |
|
|
| (.24 | ) |
GAAP basis borrowings |
| $ | 65,052 |
|
|
| 5.22 | % |
| $ | 75,660 |
|
|
| 1.55 | % |
|
| Three Months Ended March 31, |
| |||||||||||||
|
| 2022 |
|
| 2021 |
| ||||||||||
(Dollars in millions) |
| Average Balance |
|
| Average Rate |
|
| Average Balance |
|
| Average Rate |
| ||||
Unsecured borrowings: |
|
|
|
|
|
|
|
|
|
|
|
|
|
|
|
|
Senior unsecured debt |
| $ | 7,015 |
|
|
| 4.30 | % |
| $ | 8,675 |
|
|
| 4.60 | % |
Total unsecured borrowings |
|
| 7,015 |
|
|
| 4.30 |
|
|
| 8,675 |
|
|
| 4.60 |
|
Secured borrowings: |
|
|
|
|
|
|
|
|
|
|
|
|
|
|
|
|
FFELP Loan securitizations |
|
| 50,553 |
|
|
| 1.31 |
|
|
| 54,533 |
|
|
| 1.28 |
|
Private Education Loan securitizations |
|
| 14,653 |
|
|
| 2.29 |
|
|
| 14,644 |
|
|
| 2.55 |
|
FFELP Loan ABCP facilities |
|
| 692 |
|
|
| 1.57 |
|
|
| 2,043 |
|
|
| 1.49 |
|
Private Education Loan ABCP facilities |
|
| 2,496 |
|
|
| 1.90 |
|
|
| 2,355 |
|
|
| 2.08 |
|
Other |
|
| 251 |
|
|
| .67 |
|
|
| 283 |
|
|
| .32 |
|
Total secured borrowings |
|
| 68,645 |
|
|
| 1.54 |
|
|
| 73,858 |
|
|
| 1.56 |
|
Core Earnings basis borrowings(1) |
|
| 75,660 |
|
|
| 1.79 |
|
|
| 82,533 |
|
|
| 1.88 |
|
Adjustment for GAAP accounting treatment |
|
| — |
|
|
| (.24 | ) |
|
| — |
|
|
| (.27 | ) |
GAAP basis borrowings |
| $ | 75,660 |
|
|
| 1.55 | % |
| $ | 82,533 |
|
|
| 1.61 | % |
24
|
|
Critical Accounting Policies and Estimates
Management’s Discussion and Analysis of Financial Condition and Results of Operations addresses our consolidated financial statements, which have been prepared in accordance with generally accepted accounting principles in the United States of America (GAAP). A discussion of our critical accounting policies, which includes the allowance for loan losses, goodwill impairment assessment, and premium and discount amortization, and the impact of the SDR Plan on our accounting policies and estimates, can be found in our 20212022 Form 10-K. In the first quarter of 2022, we considered the potential negative impact associated with the uncertainty in connection with both historically high inflation and the war in Ukraine and the potential impact on these critical accounting policies. We concluded there was not a material impact at this time. This will continue to be monitored and assessed during 2022.
Non-GAAP Financial Measures
In addition to financial results reported on a GAAP basis, Navient also provides certain performance measures which are non-GAAP financial measures. We present the following non-GAAP financial measures: (1) Core Earnings (as well as Adjusted Core Earnings), (2) Tangible Equity (as well as the Adjusted Tangible Equity Ratio andRatio), (3) EBITDA for the Business Processing segment.segment, and (4) Allowance for Loan Losses Excluding Expected Future Recoveries on Previously Fully Charged-off Loans. Definitions for the non-GAAP financial measures and reconciliations are provided below, except that reconciliations of forward-looking non-GAAP financial measures are not provided because the company is unable to provide such reconciliations without unreasonable effort due to the uncertainty and inherent difficulty of predicting the occurrence and financial impact of certain items, including, but not limited to, the impact of any mark-to-market gains/losses resulting from our use of derivative instruments to hedge our economic risks.
1. Core Earnings
We prepare financial statements and present financial results in accordance with GAAP. However, we also evaluate our business segments and present financial results on a basis that differs from GAAP. We refer to this different basis of presentation as Core Earnings. We provide this Core Earnings basis of presentation on a consolidated basis and for each business segment because this is what we review internally when making management decisions regarding our performance and how we allocate resources. We also refer to this information in our presentations with credit rating agencies, lenders and investors. Because our Core Earnings basis of presentation corresponds to our segment financial presentations, we are required by GAAP to provide certain Core Earnings disclosures in the notes to our consolidated financial statements for our business segments.
Core Earnings are not a substitute for reported results under GAAP. We use Core Earnings to manage our business segments because Core Earnings reflect adjustments to GAAP financial results for two items, discussed below, that can create significant volatility mostly due to timing factors generally beyond the control of management. Accordingly, we believe that Core Earnings provide management with a useful basis from which to better evaluate results from ongoing operations against the business plan or against results from prior periods. Consequently, we disclose this information because we believe it provides investors with additional information regarding the operational and performance indicators that are most closely assessed by management. When compared to GAAP results, the two items we remove to result in our Core Earnings presentations are:
| (1) Mark-to-market gains/losses resulting from our use of derivative instruments to hedge our economic risks that do not qualify for hedge accounting treatment or do qualify for hedge accounting treatment but result in ineffectiveness; and (2) The accounting for goodwill and acquired intangible assets.
|
|
|
|
While GAAP provides a uniform, comprehensive basis of accounting, for the reasons described above, our Core Earnings basis of presentation does not. Core Earnings are subject to certain general and specific limitations that investors should carefully consider. For example, there is no comprehensive, authoritative guidance for management reporting. Our Core Earnings are not defined terms within GAAP and may not be comparable to similarly titled measures reported by other companies. Accordingly, our Core Earnings presentation does not represent a comprehensive basis of accounting. Investors, therefore, may not be able to compare our performance with that of other financial services companies based upon Core Earnings. Core Earnings results are only meant to supplement GAAP results by providing additional information regarding the operational and performance indicators that are most closely used by management, our board of directors, credit rating agencies, lenders and investors to assess performance.
26
25
The following tables show our consolidated GAAP results, Core Earnings results (including for each reportable segment and our business as a wholesegment) along with the adjustments made to the income/expense items to reconcile the amountsconsolidated GAAP results to our reported GAAPthe Core Earnings results as required by GAAP and reported in “Note 12 — Segment Reporting.”
|
| Three Months Ended March 31, 2023 |
| |||||||||||||||||||||||||||||||||
|
|
|
|
| Adjustments |
|
|
|
|
| Reportable Segments |
| ||||||||||||||||||||||||
(Dollars in millions) |
| Total |
|
| Reclassi- |
|
| Additions/ |
|
| Total |
|
| Total |
|
| Federal Education Loans |
|
| Consumer Lending |
|
| Business Processing |
|
| Other |
| |||||||||
Interest income: |
|
|
|
|
|
|
|
|
|
|
|
|
|
|
|
|
|
|
|
|
|
|
|
|
|
|
| |||||||||
Education loans |
| $ | 1,037 |
|
|
|
|
|
|
|
|
|
|
|
|
|
| $ | 695 |
|
| $ | 344 |
|
| $ | — |
|
| $ | — |
| ||||
Cash and investments |
|
| 34 |
|
|
|
|
|
|
|
|
|
|
|
|
|
|
| 20 |
|
|
| 6 |
|
|
| — |
|
|
| 8 |
| ||||
Total interest income |
|
| 1,071 |
|
|
|
|
|
|
|
|
|
|
|
|
|
|
| 715 |
|
|
| 350 |
|
|
| — |
|
|
| 8 |
| ||||
Total interest expense |
|
| 837 |
|
|
|
|
|
|
|
|
|
|
|
|
|
|
| 590 |
|
|
| 197 |
|
|
| — |
|
|
| 33 |
| ||||
Net interest income |
|
| 234 |
|
| $ | 12 |
|
| $ | 7 |
|
| $ | 19 |
|
| $ | 253 |
|
|
| 125 |
|
|
| 153 |
|
|
| — |
|
|
| (25 | ) |
Less: provisions for loan |
|
| (14 | ) |
|
|
|
|
|
|
|
|
|
|
| (14 | ) |
|
| 10 |
|
|
| (24 | ) |
|
| — |
|
|
| — |
| |||
Net interest income |
|
| 248 |
|
|
|
|
|
|
|
|
|
|
|
|
|
|
| 115 |
|
|
| 177 |
|
|
| — |
|
|
| (25 | ) | ||||
Other income (loss): |
|
|
|
|
|
|
|
|
|
|
|
|
|
|
|
|
|
|
|
|
|
|
|
|
|
|
| |||||||||
Servicing revenue |
|
| 17 |
|
|
|
|
|
|
|
|
|
|
|
|
|
|
| 14 |
|
|
| 3 |
|
|
| — |
|
|
| — |
| ||||
Asset recovery and |
|
| 72 |
|
|
|
|
|
|
|
|
|
|
|
|
|
|
| — |
|
|
| — |
|
|
| 72 |
|
|
| — |
| ||||
Other income (loss) |
|
| (1 | ) |
|
|
|
|
|
|
|
|
|
|
|
|
|
| 5 |
|
|
| — |
|
|
| — |
|
|
| 2 |
| ||||
Total other income |
|
| 88 |
|
|
| (12 | ) |
|
| 20 |
|
|
| 8 |
|
|
| 96 |
|
|
| 19 |
|
|
| 3 |
|
|
| 72 |
|
|
| 2 |
|
Expenses: |
|
|
|
|
|
|
|
|
|
|
|
|
|
|
|
|
|
|
|
|
|
|
|
|
|
|
| |||||||||
Direct operating |
|
| 124 |
|
|
|
|
|
|
|
|
|
|
|
|
|
|
| 20 |
|
|
| 37 |
|
|
| 67 |
|
|
| — |
| ||||
Unallocated shared |
|
| 61 |
|
|
|
|
|
|
|
|
|
|
|
|
|
|
| — |
|
|
| — |
|
|
| — |
|
|
| 61 |
| ||||
Operating expenses |
|
| 185 |
|
|
| — |
|
|
| — |
|
|
| — |
|
|
| 185 |
|
|
| 20 |
|
|
| 37 |
|
|
| 67 |
|
|
| 61 |
|
Goodwill and acquired |
|
| 3 |
|
|
| — |
|
|
| (3 | ) |
|
| (3 | ) |
|
| — |
|
|
| — |
|
|
| — |
|
|
| — |
|
|
| — |
|
Restructuring/other |
|
| 4 |
|
|
| — |
|
|
| — |
|
|
| — |
|
|
| 4 |
|
|
| — |
|
|
| — |
|
|
| — |
|
|
| 4 |
|
Total expenses |
|
| 192 |
|
|
| — |
|
|
| (3 | ) |
|
| (3 | ) |
|
| 189 |
|
|
| 20 |
|
|
| 37 |
|
|
| 67 |
|
|
| 65 |
|
Income (loss) before |
|
| 144 |
|
|
| — |
|
|
| 30 |
|
|
| 30 |
|
|
| 174 |
|
|
| 114 |
|
|
| 143 |
|
|
| 5 |
|
|
| (88 | ) |
Income tax expense |
|
| 33 |
|
|
| — |
|
|
| 8 |
|
|
| 8 |
|
|
| 41 |
|
|
| 27 |
|
|
| 33 |
|
|
| 1 |
|
|
| (20 | ) |
Net income (loss) |
| $ | 111 |
|
| $ | — |
|
| $ | 22 |
|
| $ | 22 |
|
| $ | 133 |
|
| $ | 87 |
|
| $ | 110 |
|
| $ | 4 |
|
| $ | (68 | ) |
|
| Three Months Ended March 31, 2022 |
| |||||||||||||||||||||||||||||||||
|
|
|
|
|
|
|
|
|
|
|
|
|
|
|
|
|
|
|
|
|
| Adjustments |
|
|
|
|
| |||||||||
(Dollars in millions) |
| Federal Education Loans |
|
| Consumer Lending |
|
| Business Processing |
|
| Other |
|
| Total Core Earnings |
|
| Reclassi- fications |
|
| Additions/ (Subtractions) |
|
| Total Adjustments(1) |
|
| Total GAAP |
| |||||||||
Interest income: |
|
|
|
|
|
|
|
|
|
|
|
|
|
|
|
|
|
|
|
|
|
|
|
|
|
|
|
|
|
|
|
|
|
|
|
|
Education loans |
| $ | 334 |
|
| $ | 276 |
|
| $ | — |
|
| $ | — |
|
| $ | 610 |
|
| $ | 19 |
|
| $ | (4 | ) |
| $ | 15 |
|
| $ | 625 |
|
Cash and investments |
|
| — |
|
|
| 1 |
|
|
| — |
|
|
| — |
|
|
| 1 |
|
|
| — |
|
|
| — |
|
|
| — |
|
|
| 1 |
|
Total interest income |
|
| 334 |
|
|
| 277 |
|
|
| — |
|
|
| — |
|
|
| 611 |
|
|
| 19 |
|
|
| (4 | ) |
|
| 15 |
|
|
| 626 |
|
Total interest expense |
|
| 195 |
|
|
| 125 |
|
|
| — |
|
|
| 15 |
|
|
| 335 |
|
|
| — |
|
|
| (46 | ) |
|
| (46 | ) |
|
| 289 |
|
Net interest income (loss) |
|
| 139 |
|
|
| 152 |
|
|
| — |
|
|
| (15 | ) |
|
| 276 |
|
|
| 19 |
|
|
| 42 |
|
|
| 61 |
|
|
| 337 |
|
Less: provisions for loan losses |
|
| — |
|
|
| 16 |
|
|
| — |
|
|
| — |
|
|
| 16 |
|
|
| — |
|
|
| — |
|
|
| — |
|
|
| 16 |
|
Net interest income (loss) after provisions for loan losses |
|
| 139 |
|
|
| 136 |
|
|
| — |
|
|
| (15 | ) |
|
| 260 |
|
|
| 19 |
|
|
| 42 |
|
|
| 61 |
|
|
| 321 |
|
Other income (loss): |
|
|
|
|
|
|
|
|
|
|
|
|
|
|
|
|
|
|
|
|
|
|
|
|
|
|
|
|
|
|
|
|
|
|
|
|
Servicing revenue |
|
| 15 |
|
|
| 3 |
|
|
| — |
|
|
| — |
|
|
| 18 |
|
|
| — |
|
|
| — |
|
|
| — |
|
|
| 18 |
|
Asset recovery and business processing revenue |
|
| 3 |
|
|
| — |
|
|
| 94 |
|
|
| — |
|
|
| 97 |
|
|
| — |
|
|
| — |
|
|
| — |
|
|
| 97 |
|
Other income (loss) |
|
| 11 |
|
|
| — |
|
|
| — |
|
|
| (1 | ) |
|
| 10 |
|
|
| (19 | ) |
|
| 117 |
|
|
| 98 |
|
|
| 108 |
|
Total other income (loss) |
|
| 29 |
|
|
| 3 |
|
|
| 94 |
|
|
| (1 | ) |
|
| 125 |
|
|
| (19 | ) |
|
| 117 |
|
|
| 98 |
|
|
| 223 |
|
Expenses: |
|
|
|
|
|
|
|
|
|
|
|
|
|
|
|
|
|
|
|
|
|
|
|
|
|
|
|
|
|
|
|
|
|
|
|
|
Direct operating expenses |
|
| 28 |
|
|
| 35 |
|
|
| 76 |
|
|
| — |
|
|
| 139 |
|
|
| — |
|
|
| — |
|
|
| — |
|
|
| 139 |
|
Unallocated shared services expenses |
|
| — |
|
|
| — |
|
|
| — |
|
|
| 66 |
|
|
| 66 |
|
|
| — |
|
|
| — |
|
|
| — |
|
|
| 66 |
|
Operating expenses |
|
| 28 |
|
|
| 35 |
|
|
| 76 |
|
|
| 66 |
|
|
| 205 |
|
|
| — |
|
|
| — |
|
|
| — |
|
|
| 205 |
|
Goodwill and acquired intangible asset impairment and amortization |
|
| — |
|
|
| — |
|
|
| — |
|
|
| — |
|
|
| — |
|
|
| — |
|
|
| 4 |
|
|
| 4 |
|
|
| 4 |
|
Restructuring/other reorganization expenses |
|
| — |
|
|
| — |
|
|
| — |
|
|
| 3 |
|
|
| 3 |
|
|
| — |
|
|
| — |
|
|
| — |
|
|
| 3 |
|
Total expenses |
|
| 28 |
|
|
| 35 |
|
|
| 76 |
|
|
| 69 |
|
|
| 208 |
|
|
| — |
|
|
| 4 |
|
|
| 4 |
|
|
| 212 |
|
Income (loss) before income tax expense (benefit) |
|
| 140 |
|
|
| 104 |
|
|
| 18 |
|
|
| (85 | ) |
|
| 177 |
|
|
| — |
|
|
| 155 |
|
|
| 155 |
|
|
| 332 |
|
Income tax expense (benefit)(2) |
|
| 33 |
|
|
| 25 |
|
|
| 4 |
|
|
| (20 | ) |
|
| 42 |
|
|
| — |
|
|
| 35 |
|
|
| 35 |
|
|
| 77 |
|
Net income (loss) |
| $ | 107 |
|
| $ | 79 |
|
| $ | 14 |
|
| $ | (65 | ) |
| $ | 135 |
|
| $ | — |
|
| $ | 120 |
|
| $ | 120 |
|
| $ | 255 |
|
|
| Three Months Ended March 31, 2023 |
| |||||||||
(Dollars in millions) |
| Net Impact of |
|
| Net Impact of |
|
| Total |
| |||
Net interest income (loss) after provisions for loan losses |
| $ | 19 |
|
| $ | — |
|
| $ | 19 |
|
Total other income (loss) |
|
| 8 |
|
|
| — |
|
|
| 8 |
|
Goodwill and acquired intangible asset impairment and amortization |
|
| — |
|
|
| (3 | ) |
|
| (3 | ) |
Total Core Earnings adjustments to GAAP |
| $ | 27 |
|
| $ | 3 |
|
|
| 30 |
|
Income tax expense (benefit) |
|
|
|
|
|
|
|
| 8 |
| ||
Net income (loss) |
|
|
|
|
|
|
| $ | 22 |
| ||
| (2) Income taxes are based on a percentage of net income before tax for the individual reportable segment. 26
(1) Core Earnings adjustments to GAAP:
(2) Income taxes are based on a percentage of net income before tax for the individual reportable segment. 27
|
| ||||||||||||||||||||||||||||||||||||||||||||||||||||||||||||||||||||||||||||||||||||||||||||||||||||||||||||||||||||||||||||||||||||||||||||||||||||||||||||||||||||||||||||||||||||||||||||||||||||||||||||||||||||||||||||||||||||||||||||||||||||||||||||||||||||||||||||||||||||||||||||||||||||||||||||||||||||||||||||||||||||||||||||||||||||||||||||||||||||||||||||||||||||||||||||||||||||||||||||||||||||||||||||||||||||||||||||||||||||||||||||||||||||||||||||||||||||||||||||||||||||||||||||||||||||||||||||||||||||||||||||||||||||||||||||||||||||||||||||||||||||||||||||||||||||||||||||||||||||||||||||||||||||||||||||||||||||||||||||||||||||||||||||||||||||||||||||||||||||||||||||||||||||||||||||||||||||||||||||||||||||||||||||||||||||||||||||||||||||||||||||||||||||||||||||||||||||||||||||||||||||||||||||||||||||||||||||||||||||||||||||||||||||||||||||||||||||||||||||||||||||||||||||||||||||||||||||||||||||||||||||||||||||||||||||||||||||||||||||||||||||||||||||||||||||||||||||||||||||||
|
| Three Months Ended March 31, 2022 |
| |||||||||
(Dollars in millions) |
| Net Impact of Derivative Accounting |
|
| Net Impact of Goodwill and Acquired Intangibles |
|
| Total |
| |||
Net interest income (loss) after provisions for loan losses |
| $ | 61 |
|
| $ | — |
|
| $ | 61 |
|
Total other income (loss) |
|
| 98 |
|
|
| — |
|
|
| 98 |
|
Goodwill and acquired intangible asset impairment and amortization |
|
| — |
|
|
| 4 |
|
|
| 4 |
|
Total Core Earnings adjustments to GAAP |
| $ | 159 |
|
| $ | (4 | ) |
|
| 155 |
|
Income tax expense (benefit) |
|
|
|
|
|
|
|
|
|
| 35 |
|
Net income (loss) |
|
|
|
|
|
|
|
|
| $ | 120 |
|
|
|
|
| Three Months Ended March 31, 2021 |
| |||||||||||||||||||||||||||||||||
|
|
|
|
|
|
|
|
|
|
|
|
|
|
|
|
|
|
|
|
|
| Adjustments |
|
|
|
|
| |||||||||
(Dollars in millions) |
| Federal Education Loans |
|
| Consumer Lending |
|
| Business Processing |
|
| Other |
|
| Total Core Earnings |
|
| Reclassi- fications |
|
| Additions/ (Subtractions) |
|
| Total Adjustments(1) |
|
| Total GAAP |
| |||||||||
Interest income: |
|
|
|
|
|
|
|
|
|
|
|
|
|
|
|
|
|
|
|
|
|
|
|
|
|
|
|
|
|
|
|
|
|
|
|
|
Education loans |
| $ | 359 |
|
| $ | 319 |
|
| $ | — |
|
| $ | — |
|
| $ | 678 |
|
| $ | 23 |
|
| $ | (9 | ) |
| $ | 14 |
|
| $ | 692 |
|
Cash and investments |
|
| — |
|
|
| — |
|
|
| — |
|
|
| — |
|
|
| — |
|
|
| — |
|
|
| — |
|
|
| — |
|
|
| — |
|
Total interest income |
|
| 359 |
|
|
| 319 |
|
|
| — |
|
|
| — |
|
|
| 678 |
|
|
| 23 |
|
|
| (9 | ) |
|
| 14 |
|
|
| 692 |
|
Total interest expense |
|
| 215 |
|
|
| 150 |
|
|
| — |
|
|
| 18 |
|
|
| 383 |
|
|
| (1 | ) |
|
| (53 | ) |
|
| (54 | ) |
|
| 329 |
|
Net interest income (loss) |
|
| 144 |
|
|
| 169 |
|
|
| — |
|
|
| (18 | ) |
|
| 295 |
|
|
| 24 |
|
|
| 44 |
|
|
| 68 |
|
|
| 363 |
|
Less: provisions for loan losses |
|
| — |
|
|
| (87 | ) |
|
| — |
|
|
| — |
|
|
| (87 | ) |
|
| — |
|
|
| — |
|
|
| — |
|
|
| (87 | ) |
Net interest income (loss) after provisions for loan losses |
|
| 144 |
|
|
| 256 |
|
|
| — |
|
|
| (18 | ) |
|
| 382 |
|
|
| 24 |
|
|
| 44 |
|
|
| 68 |
|
|
| 450 |
|
Other income (loss): |
|
|
|
|
|
|
|
|
|
|
|
|
|
|
|
|
|
|
|
|
|
|
|
|
|
|
|
|
|
|
|
|
|
|
|
|
Servicing revenue |
|
| 52 |
|
|
| 1 |
|
|
| — |
|
|
| — |
|
|
| 53 |
|
|
| — |
|
|
| — |
|
|
| — |
|
|
| 53 |
|
Asset recovery and business processing revenue |
|
| 14 |
|
|
| — |
|
|
| 125 |
|
|
| — |
|
|
| 139 |
|
|
| — |
|
|
| — |
|
|
| — |
|
|
| 139 |
|
Other income (loss) |
|
| — |
|
|
| — |
|
|
| — |
|
|
| — |
|
|
| — |
|
|
| (11 | ) |
|
| 47 |
|
|
| 36 |
|
|
| 36 |
|
Gains on sales of loans |
|
| — |
|
|
| 89 |
|
|
| — |
|
|
| — |
|
|
| 89 |
|
|
| (13 | ) |
|
| — |
|
|
| (13 | ) |
|
| 76 |
|
Total other income (loss) |
|
| 66 |
|
|
| 90 |
|
|
| 125 |
|
|
| — |
|
|
| 281 |
|
|
| (24 | ) |
|
| 47 |
|
|
| 23 |
|
|
| 304 |
|
Expenses: |
|
|
|
|
|
|
|
|
|
|
|
|
|
|
|
|
|
|
|
|
|
|
|
|
|
|
|
|
|
|
|
|
|
|
|
|
Direct operating expenses |
|
| 63 |
|
|
| 41 |
|
|
| 91 |
|
|
| — |
|
|
| 195 |
|
|
| — |
|
|
| — |
|
|
| — |
|
|
| 195 |
|
Unallocated shared services expenses |
|
| — |
|
|
| — |
|
|
| — |
|
|
| 64 |
|
|
| 64 |
|
|
| — |
|
|
| — |
|
|
| — |
|
|
| 64 |
|
Operating expenses |
|
| 63 |
|
|
| 41 |
|
|
| 91 |
|
|
| 64 |
|
|
| 259 |
|
|
| — |
|
|
| — |
|
|
| — |
|
|
| 259 |
|
Goodwill and acquired intangible asset impairment and amortization |
|
| — |
|
|
| — |
|
|
| — |
|
|
| — |
|
|
| — |
|
|
| — |
|
|
| 5 |
|
|
| 5 |
|
|
| 5 |
|
Restructuring/other reorganization expenses |
|
| — |
|
|
| — |
|
|
| — |
|
|
| 6 |
|
|
| 6 |
|
|
| — |
|
|
| — |
|
|
| — |
|
|
| 6 |
|
Total expenses |
|
| 63 |
|
|
| 41 |
|
|
| 91 |
|
|
| 70 |
|
|
| 265 |
|
|
| — |
|
|
| 5 |
|
|
| 5 |
|
|
| 270 |
|
Income (loss) before income tax expense (benefit) |
|
| 147 |
|
|
| 305 |
|
|
| 34 |
|
|
| (88 | ) |
|
| 398 |
|
|
| — |
|
|
| 86 |
|
|
| 86 |
|
|
| 484 |
|
Income tax expense (benefit)(2) |
|
| 35 |
|
|
| 71 |
|
|
| 8 |
|
|
| (21 | ) |
|
| 93 |
|
|
| — |
|
|
| 21 |
|
|
| 21 |
|
|
| 114 |
|
Net income (loss) |
| $ | 112 |
|
| $ | 234 |
|
| $ | 26 |
|
| $ | (67 | ) |
| $ | 305 |
|
| $ | — |
|
| $ | 65 |
|
| $ | 65 |
|
| $ | 370 |
|
|
|
|
|
|
|
|
|
|
|
|
|
|
|
|
|
|
|
|
|
|
|
|
|
|
|
|
|
|
|
|
|
|
|
|
|
|
|
|
|
| Three Months Ended March 31, 2021 |
| |||||||||
(Dollars in millions) |
| Net Impact of Derivative Accounting |
|
| Net Impact of Goodwill and Acquired Intangibles |
|
| Total |
| |||
Net interest income (loss) after provisions for loan losses |
| $ | 68 |
|
| $ | — |
|
| $ | 68 |
|
Total other income (loss) |
|
| 23 |
|
|
| — |
|
|
| 23 |
|
Goodwill and acquired intangible asset impairment and amortization |
|
| — |
|
|
| 5 |
|
|
| 5 |
|
Total Core Earnings adjustments to GAAP |
| $ | 91 |
|
| $ | (5 | ) |
|
| 86 |
|
Income tax expense (benefit) |
|
|
|
|
|
|
|
|
|
| 21 |
|
Net income (loss) |
|
|
|
|
|
|
|
|
| $ | 65 |
|
|
|
The following discussion summarizes the differences between GAAP and Core Earnings and GAAP net income and details each
specific adjustment required to reconcile our GAAP earnings to our Core Earnings segment presentation to our GAAP earnings.presentation.
|
| Three Months Ended March 31, |
|
| Three Months Ended March 31, |
| ||||||||||
(Dollars in millions) |
| 2022 |
|
| 2021 |
|
| 2023 |
|
| 2022 |
| ||||
Core Earnings net income |
| $ | 135 |
|
| $ | 305 |
| ||||||||
GAAP net income |
| $ | 111 |
|
| $ | 255 |
| ||||||||
Core Earnings adjustments to GAAP: |
|
|
|
|
|
|
|
|
|
|
|
|
|
| ||
Net impact of derivative accounting |
|
| 159 |
|
|
| 91 |
|
|
| 27 |
|
|
| (159 | ) |
Net impact of goodwill and acquired intangible assets |
|
| (4 | ) |
|
| (5 | ) |
|
| 3 |
|
|
| 4 |
|
Net income tax effect |
|
| (35 | ) |
|
| (21 | ) |
|
| (8 | ) |
|
| 35 |
|
Total Core Earnings adjustments to GAAP |
|
| 120 |
|
|
| 65 |
|
|
| 22 |
|
|
| (120 | ) |
GAAP net income |
| $ | 255 |
|
| $ | 370 |
| ||||||||
Core Earnings net income |
| $ | 133 |
|
| $ | 135 |
| ||||||||
|
|
|
|
|
| |||||||||||
(1) Derivative Accounting: Core Earnings exclude periodic gains and losses that are caused by the mark-to-market valuations on derivatives that do not qualify for hedge accounting treatment under GAAP, as well as the periodic mark-to-market gains and losses that are a result of ineffectiveness recognized related to effective hedges under GAAP. Under GAAP, for our derivatives that are held to maturity, the mark-to-market gain or loss over the life of the contract will equal $0 except for Floor Income Contracts, where the mark-to-market gain will equal the amount for which we originally sold the contract. In our Core Earnings presentation, we recognize the economic effect of these hedges, which generally results in any net settlement cash paid or received being recognized ratably as an interest expense or revenue over the hedged item’s life.
The accounting for derivatives requires that changes in the fair value of derivative instruments be recognized currently in earnings, with no fair value adjustment of the hedged item, unless specific hedge accounting criteria are met. The gains and losses recorded in “Gains (losses) on derivative and hedging activities, net” and interest expense (for qualifying fair value hedges) are primarily caused by interest rate and foreign currency exchange rate volatility and changing credit spreads during the period as well as the volume and term of derivatives not receiving hedge accounting treatment. We believe that our derivatives are effective economic hedges, and as such, are a critical element of our interest rate and foreign currency risk management strategy. However, some of our derivatives, primarily Floor Income Contracts, basis swaps and at times, certain other LIBOR swaps do not qualify for hedge accounting treatment and the stand-alone derivative is adjusted to fair value in the income statement with no consideration for the corresponding change in fair value of the hedged item.
Our Floor Income Contracts are written options that must meet more stringent requirements than other hedging relationships to achieve hedge effectiveness. Specifically, our Floor Income Contracts do not qualify for hedge accounting treatment because the pay down of principal of the education loans underlying the Floor Income embedded in those education loans does not exactly match the change in the notional amount of our written Floor Income Contracts. Additionally, the term, the interest rate index, and the interest rate index reset frequency of the Floor Income Contract can be different than that of the education loans. Under derivative accounting treatment, the upfront contractual payment is deemed a liability and changes in fair value are recorded through income throughout the life of the contract. The change in the fair value of Floor Income Contracts is primarily caused by changing interest rates that cause the amount of Floor Income paid to the counterparties to vary. This is economically offset by the change in the amount of Floor Income earned on the underlying education loans but that offsetting change in fair value is not recognized. We believe the Floor Income Contracts are economic hedges because they effectively fix the amount of Floor Income earned over the contract period, thus eliminating the timing and uncertainty that changes in interest rates can have on Floor Income for that period. Therefore, for purposes of Core Earnings, we have removed the mark-to-market gains and losses related to these contracts and added back the amortization of the net contractual premiums received on the Floor Income Contracts. The amortization of the net contractual premiums received on the Floor Income Contracts for Core Earnings is reflected in education loan interest income. Under GAAP accounting, the premiums received on the Floor Income Contracts are recorded as revenue in the “gains (losses) on derivative and hedging activities, net” line item by the end of the contracts’ lives.
28
Basis swaps are used to convert floating rate debt from one floating interest rate index to another to better match the interest rate characteristics of the assets financed by that debt. We primarily use basis swaps to hedge our education loan assets that are primarily indexed to LIBOR or Prime. The accounting for derivatives requires that when using basis swaps, the change in the cash flows of the hedge effectively offset both the change in the cash flows of the asset and the change in the cash flows of the liability. Our basis swaps hedge variable interest rate risk; however, they generally do not meet this effectiveness test because the index of the swap does not exactly match the index of the hedged assets as required for hedge accounting treatment. Additionally, some of our FFELP Loans can earn interest at either a variable or a fixed interest rate depending on market interest rates and therefore swaps economically hedging these FFELP Loans do not meet the criteria for hedge accounting treatment. As a result, under GAAP, these swaps are recorded at fair value with changes in fair value reflected currently in the income statement.
The table below quantifies the adjustments for derivative accounting between GAAP and Core Earnings net income.
|
| Three Months Ended March 31, |
| |||||
(Dollars in millions) |
| 2023 |
|
| 2022 |
| ||
Core Earnings derivative adjustments: |
|
|
|
|
|
| ||
(Gains) losses on derivative and hedging activities, net, included |
| $ | 8 |
|
| $ | (98 | ) |
Plus: (Gains) losses on fair value hedging activity included |
|
| 6 |
|
|
| (41 | ) |
Total (gains) losses in GAAP net income |
|
| 14 |
|
|
| (139 | ) |
Plus: Reclassification of settlement income (expense) on |
|
| 12 |
|
|
| (19 | ) |
Mark-to-market (gains) losses on derivative and hedging |
|
| 26 |
|
|
| (158 | ) |
Amortization of net premiums on Floor Income Contracts |
|
| 2 |
|
|
| 4 |
|
Other derivative accounting adjustments(3) |
|
| (1 | ) |
|
| (5 | ) |
Total net impact of derivative accounting |
| $ | 27 |
|
| $ | (159 | ) |
|
| Three Months Ended March 31, |
| |||||
(Dollars in millions) |
| 2022 |
|
| 2021 |
| ||
Core Earnings derivative adjustments: |
|
|
|
|
|
|
|
|
Gains (losses) on derivative and hedging activities, net, included in other income |
| $ | 98 |
|
| $ | 36 |
|
Plus: Gains (losses) on fair value hedging activity included in interest expense |
|
| 41 |
|
|
| 45 |
|
Total gains (losses) in GAAP net income |
|
| 139 |
|
|
| 81 |
|
Plus: Reclassification of settlement expense (income) on derivative and hedging activities, net(1) |
|
| 19 |
|
|
| 11 |
|
Mark-to-market gains (losses) on derivative and hedging activities, net(2) |
|
| 158 |
|
|
| 92 |
|
Amortization of net premiums on Floor Income Contracts in net interest income for Core Earnings |
|
| (4 | ) |
|
| (9 | ) |
Other derivative accounting adjustments(3) |
|
| 5 |
|
|
| 8 |
|
Total net impact of derivative accounting |
| $ | 159 |
|
| $ | 91 |
|
|
| Three Months Ended March 31, |
| |||||
(Dollars in millions) |
| 2023 |
|
| 2022 |
| ||
Reclassification of settlements on derivative and |
|
|
|
|
|
| ||
Net settlement expense on Floor Income Contracts |
| $ | — |
|
| $ | (19 | ) |
Net settlement income (expense) on interest rate |
|
| 12 |
|
|
| — |
|
Total reclassifications of settlement income (expense) on derivative |
| $ | 12 |
|
| $ | (19 | ) |
|
|
|
|
|
|
| ||
|
| Three Months Ended March 31, |
| |||||
(Dollars in millions) |
| 2023 |
|
| 2022 |
| ||
Fair value hedges |
| $ | 4 |
|
| $ | (25 | ) |
Foreign currency hedges |
|
| 2 |
|
|
| (16 | ) |
Floor Income Contracts |
|
| — |
|
|
| (55 | ) |
Basis swaps |
|
| 2 |
|
|
| (2 | ) |
Other - LIBOR swaps |
|
| 18 |
|
|
| (60 | ) |
Total mark-to-market (gains) losses on derivative |
| $ | 26 |
|
| $ | (158 | ) |
| (3) Other derivative accounting adjustments consist of adjustments related to certain terminated derivatives that did not receive hedge accounting treatment under GAAP but were economic hedges under Core Earnings and, as a result, such gains or losses are amortized into Core Earnings over the life of the hedged item. 29
|
|
|
| Three Months Ended March 31, |
| |||||
(Dollars in millions) |
| 2022 |
|
| 2021 |
| ||
Reclassification of settlements on derivative and hedging activities: |
|
|
|
|
|
|
|
|
Net settlement expense on Floor Income Contracts reclassified to net interest income |
| $ | (19 | ) |
| $ | (23 | ) |
Net settlement income (expense) on interest rate swaps reclassified to net interest income |
|
| — |
|
|
| (1 | ) |
Net realized gains (losses) on terminated derivative contracts reclassified to other income |
|
| — |
|
|
| 13 |
|
Total reclassifications of settlements on derivative and hedging activities |
| $ | (19 | ) |
| $ | (11 | ) |
|
|
|
|
|
|
|
|
|
|
|
|
| Three Months Ended March 31, |
| |||||
(Dollars in millions) |
| 2022 |
|
| 2021 |
| ||
Floor Income Contracts |
| $ | 55 |
|
| $ | 37 |
|
Basis swaps |
|
| 2 |
|
|
| 4 |
|
Foreign currency hedges |
|
| 16 |
|
|
| 30 |
|
Other |
|
| 85 |
|
|
| 21 |
|
Total mark-to-market gains (losses) on derivative and hedging activities, net |
| $ | 158 |
|
| $ | 92 |
|
|
|
Cumulative Impact of Derivative Accounting under GAAP compared to Core Earnings
As of March 31, 2022,2023, derivative accounting has decreasedincreased GAAP equity by approximately $63$81 million as a result of cumulative net mark-to-market lossesgains (after tax) recognized under GAAP, but not in Core Earnings. The following table rolls forward the cumulative impact to GAAP equity due to these after-tax mark-to-market net gains and losses related to derivative accounting.
|
| Three Months Ended March 31, |
| |||||
(Dollars in millions) |
| 2023 |
|
| 2022 |
| ||
Beginning impact of derivative accounting on GAAP equity |
| $ | 122 |
|
| $ | (299 | ) |
Net impact of net mark-to-market gains (losses) |
|
| (41 | ) |
|
| 236 |
|
Ending impact of derivative accounting on GAAP equity |
| $ | 81 |
|
| $ | (63 | ) |
|
| Three Months Ended March 31, |
| |||||
(Dollars in millions) |
| 2022 |
|
| 2021 |
| ||
Beginning impact of derivative accounting on GAAP equity |
| $ | (299 | ) |
| $ | (616 | ) |
Net impact of net mark-to-market gains (losses) under derivative accounting(1) |
|
| 236 |
|
|
| 117 |
|
Ending impact of derivative accounting on GAAP equity |
| $ | (63 | ) |
| $ | (499 | ) |
|
| Three Months Ended March 31, |
| |||||
(Dollars in millions) |
| 2023 |
|
| 2022 |
| ||
Total pre-tax net impact of derivative accounting recognized |
| $ | (27 | ) |
| $ | 159 |
|
Tax and other impacts of derivative accounting adjustments |
|
| 7 |
|
|
| (37 | ) |
Change in mark-to-market gains (losses) on derivatives, |
|
| (21 | ) |
|
| 114 |
|
Net impact of net mark-to-market gains (losses) under |
| $ | (41 | ) |
| $ | 236 |
|
| (2) See “Core Earnings derivative adjustments” table above. 30
|
|
|
| Three Months Ended March 31, |
| |||||
(Dollars in millions) |
| 2022 |
|
| 2021 |
| ||
Total pre-tax net impact of derivative accounting recognized in net income(2) |
| $ | 159 |
|
| $ | 91 |
|
Tax and other impacts of derivative accounting adjustments |
|
| (37 | ) |
|
| (22 | ) |
Change in mark-to-market gains (losses) on derivatives, net of tax recognized in other comprehensive income |
|
| 114 |
|
|
| 48 |
|
Net impact of net mark-to-market gains (losses) under derivative accounting |
| $ | 236 |
|
| $ | 117 |
|
|
|
Hedging Embedded Floor Income
We use Floor Income Contracts, pay-fixed swaps and fixed rate debt to economically hedge embedded floor incomeFloor Income in our FFELP loans.Loans. Historically, we have used these instruments on a periodic basis and depending upon market conditions and pricing, we may enter into additional hedges in the future. Under GAAP, the Floor Income Contracts do not qualify for hedge accounting and the pay-fixed swaps are accounted for as cashflowcash flow hedges. The table below shows the amount of Hedgedhedged Floor Income that will be recognized in Core Earnings in future periods based on these hedge strategies.
(Dollars in millions) |
| March 31, 2023 |
|
| March 31, 2022 |
| ||
Total hedged Floor Income, net of tax(1)(2) |
| $ | 166 |
|
| $ | 289 |
|
(Dollars in millions) |
| March 31, 2022 |
|
| March 31, 2021 |
| ||
Total hedged Floor Income, net of tax(1)(2) |
| $ | 289 |
|
| $ | 364 |
|
|
|
|
|
(2) Goodwill and Acquired Intangible Assets: Our Core Earnings exclude goodwill and intangible asset impairment and the amortization of acquired intangible assets. The following table summarizes the goodwill and acquired intangible asset adjustments.
|
| Three Months Ended March 31, |
|
| Three Months Ended March 31, |
| ||||||||||
(Dollars in millions) |
| 2022 |
|
| 2021 |
|
| 2023 |
|
| 2022 |
| ||||
Core Earnings goodwill and acquired intangible asset adjustments |
| $ | (4 | ) |
| $ | (5 | ) |
| $ | 3 |
|
| $ | 4 |
|
Adjusted Core Earnings
Adjusted Core Earnings net income and Adjusted Core Earnings operating expenses exclude restructuring and regulatory-related expenses. Management excludes these expenses as itAdjusted Core Earnings is one of the measures we review internally when making management decisions regarding our performance and how we allocate resources, as this presentation is a useful basis for management and investors to further analyze Core Earnings. We also refer to this information in our presentations with credit rating agencies, lenders and investors.
The following table summarizes these expenses which are excluded:
|
| Three Months Ended March 31, |
|
| Three Months Ended March 31, |
| ||||||||||
(Dollars in millions) |
| 2022 |
|
| 2021 |
|
| 2023 |
|
| 2022 |
| ||||
Restructuring/other reorganization expenses |
| $ | 3 |
|
| $ | 6 |
|
| $ | 4 |
|
| $ | 3 |
|
Regulatory-related expenses |
|
| 1 |
|
|
| 8 |
|
|
| 2 |
|
|
| 1 |
|
Total |
| $ | 4 |
|
| $ | 14 |
|
| $ | 6 |
|
| $ | 4 |
|
31
2. Tangible Equity and Adjusted Tangible Equity Ratio
Adjusted Tangible Equity Ratio measures the ratio of Navient’s Tangible Equity to its tangible assets. We adjust this ratio to exclude the assets and equity associated with our FFELP Loan portfolio because FFELP Loans are no longer originated and the FFELP Loan portfolio bears a 3% maximum loss exposure under the terms of the federal guaranty. Management believes that excluding this portfolio from the ratio enhances its usefulness to investors. Management uses this ratio, in addition to other metrics, for analysis and decision making related to capital allocation decisions. The Adjusted Tangible Equity Ratio is calculated as:
(Dollars in millions) |
| March 31, 2022 |
|
| March 31, 2021 |
|
| March 31, 2023 |
|
| March 31, 2022 |
| ||||
Navient Corporation's stockholders' equity |
| $ | 2,824 |
|
| $ | 2,723 |
|
| $ | 2,958 |
|
| $ | 2,824 |
|
Less: Goodwill and acquired intangible assets |
|
| 722 |
|
|
| 731 |
|
|
| 703 |
|
|
| 722 |
|
Tangible Equity |
|
| 2,102 |
|
|
| 1,992 |
|
|
| 2,255 |
|
|
| 2,102 |
|
Less: Equity held for FFELP Loans |
|
| 255 |
|
|
| 284 |
|
|
| 211 |
|
|
| 255 |
|
Adjusted Tangible Equity |
| $ | 1,847 |
|
| $ | 1,708 |
|
| $ | 2,044 |
|
| $ | 1,847 |
|
Divided by: |
|
|
|
|
|
|
|
|
|
|
|
|
|
| ||
Total assets |
| $ | 78,158 |
|
| $ | 84,957 |
|
| $ | 66,913 |
|
| $ | 78,158 |
|
Less: |
|
|
|
|
|
|
|
|
|
|
|
|
|
| ||
Goodwill and acquired intangible assets |
|
| 722 |
|
|
| 731 |
|
|
| 703 |
|
|
| 722 |
|
FFELP Loans |
|
| 51,013 |
|
|
| 56,873 |
|
|
| 42,148 |
|
|
| 51,013 |
|
Adjusted tangible assets |
| $ | 26,423 |
|
| $ | 27,353 |
|
| $ | 24,062 |
|
| $ | 26,423 |
|
Adjusted Tangible Equity Ratio(1) |
|
| 7.0 | % |
|
| 6.2 | % | ||||||||
Adjusted Tangible Equity Ratio |
|
| 8.5 | % |
|
| 7.0 | % | ||||||||
|
|
(Dollars in millions) |
| March 31, 2022 |
|
| March 31, 2021 |
| ||
Adjusted Tangible Equity (from above table) |
| $ | 1,847 |
|
| $ | 1,708 |
|
Plus: ending impact of derivative accounting on GAAP equity |
|
| 63 |
|
|
| 499 |
|
Pro forma Adjusted Tangible Equity |
| $ | 1,910 |
|
| $ | 2,207 |
|
Divided by: adjusted tangible assets (from above table) |
| $ | 26,423 |
|
| $ | 27,353 |
|
Pro forma Adjusted Tangible Equity Ratio |
|
| 7.2 | % |
|
| 8.1 | % |
3. Earnings before Interest, Taxes, Depreciation and Amortization Expense (EBITDA)
This measures the operating performance of the Business Processing segment and is used by management and equity investors to monitor operating performance and determine the value of those businesses. EBITDA for the Business Processing segment is calculated as:
|
| Three Months Ended March 31, |
| |||||
(Dollars in millions) |
| 2023 |
|
| 2022 |
| ||
Pre-tax income |
| $ | 5 |
|
| $ | 18 |
|
Plus: |
|
|
|
|
|
| ||
Depreciation and amortization expense(1) |
|
| — |
|
|
| 1 |
|
EBITDA |
| $ | 5 |
|
| $ | 19 |
|
Divided by: |
|
|
|
|
|
| ||
Total revenue |
| $ | 72 |
|
| $ | 94 |
|
EBITDA margin |
|
| 7 | % |
|
| 20 | % |
|
| Three Months Ended March 31, |
| |||||
(Dollars in millions) |
| 2022 |
|
| 2021 |
| ||
Pre-tax income |
| $ | 18 |
|
| $ | 34 |
|
Plus: |
|
|
|
|
|
|
|
|
Depreciation and amortization expense(1) |
|
| 1 |
|
|
| 2 |
|
EBITDA |
| $ | 19 |
|
| $ | 36 |
|
Divided by: |
|
|
|
|
|
|
|
|
Total revenue |
| $ | 94 |
|
| $ | 125 |
|
EBITDA margin |
|
| 20 | % |
|
| 29 | % |
32
4. Allowance for Loan Losses Excluding Expected Future Recoveries on Previously Fully Charged-off
Loans
The allowance for loan losses on the Private Education Loan portfolio used for the three credit metrics below excludes the expected future recoveries on previously fully charged-off loans to better reflect the current expected credit losses remaining in connection with the loans on balance sheet that have not charged off. That is, as of March 31, 2023, the $974 million Private Education Loan allowance for loan losses excluding expected future recoveries on previously fully charged-off loans represents the current expected credit losses that remain in connection with the $18,275 million Private Education Loan portfolio. The $268 million of expected future recoveries on previously fully charged-off loans, which is collected over an average 15-year period, mechanically is a reduction to the overall allowance for loan losses. However, it is not related to the $18,275 million Private Education Loan portfolio on our balance sheet and, as a result, management excludes this impact to the allowance to better evaluate and assess our overall credit loss coverage on the Private Education Loan portfolio. We believe this provides a more meaningful and holistic view of the available credit loss coverage on our non-charged-off Private Education Loan portfolio. We believe this information is useful to our investors, lenders and rating agencies.
Allowance for Loan Losses Metrics – Private Education Loans
|
| Three Months Ended March 31, |
| |||||
(Dollars in millions) |
| 2023 |
|
| 2022 |
| ||
Allowance at end of period (GAAP) |
| $ | 706 |
|
| $ | 964 |
|
Plus: expected future recoveries on previously fully charged-off loans |
|
| 268 |
|
|
| 321 |
|
Allowance at end of period excluding expected future recoveries on |
| $ | 974 |
|
| $ | 1,285 |
|
Ending total loans |
| $ | 18,981 |
|
| $ | 21,052 |
|
Ending loans in repayment |
| $ | 18,258 |
|
| $ | 20,257 |
|
Net charge-offs |
| $ | 75 |
|
| $ | 69 |
|
|
|
|
|
|
|
| ||
Allowance coverage of charge-offs (annualized): |
|
|
|
|
|
| ||
GAAP |
|
| 2.3 |
|
|
| 3.4 |
|
Adjustment(1) |
|
| .9 |
|
|
| 1.2 |
|
Non-GAAP Financial Measure(1) |
|
| 3.2 |
|
|
| 4.6 |
|
|
|
|
|
|
|
| ||
Allowance as a percentage of the ending total loan balance: |
|
|
|
|
|
| ||
GAAP |
|
| 3.7 | % |
|
| 4.6 | % |
Adjustment(1) |
|
| 1.4 |
|
|
| 1.5 |
|
Non-GAAP Financial Measure(1) |
|
| 5.1 | % |
|
| 6.1 | % |
|
|
|
|
|
|
| ||
Allowance as a percentage of the ending loans in repayment: |
|
|
|
|
|
| ||
GAAP |
|
| 3.9 | % |
|
| 4.8 | % |
Adjustment(1) |
|
| 1.5 |
|
|
| 1.5 |
|
Non-GAAP Financial Measure(1) |
|
| 5.4 | % |
|
| 6.3 | % |
| (1) The allowance used for these credit metrics excludes the expected future recoveries on previously fully charged-off loans. See discussion above. 33
|
|
Legal Proceedings
For a discussion of legal matters as of March 31, 2022,2023, please refer to “Note 9 – Commitments and Contingencies” to our consolidated financial statements included in this report, which is incorporated into this item by reference.
Risk Factors
The risk factors disclosed in our Annual Report on Form 10-K for the fiscal year ended December 31, 20212022 (the “Form 10-K”) should be considered together with information included in this Quarterly Report on Form 10-Q for the quarter ended March 31, 2022. For a discussion of our risk factors, please see “Risk Factors” in our 2021 Annual Report on Form 10-K.10-Q. These are not the only risks to which we are exposed. The following information amends and restates in their entirety the previously disclosed risk factors in our Form 10-K relating to adverse market conditions and potential inability to manage our liquidity risk or access liquidity and credit risk related to use of our derivatives. Except for such additional information, we believe there have been no material changes from the risk factors previously disclosed in our Form 10-K.
Adverse market conditions or an inability to effectively manage our liquidity risk or access liquidity could negatively impact our ability to meet our liquidity and funding needs, which could materially and adversely impact our results of operations, cash flow or financial condition.
We must effectively manage our liquidity risk. We require liquidity and the ability to access funds held at banks and other financial institutions to meet cash requirements such as day-to-day operating expenses, origination of loans, required payments of principal and interest on borrowings, and distributions to shareholders. We expect to fund our ongoing liquidity needs, including the repayment of $6.0 billion of senior unsecured notes that mature in 2023 to 2043, primarily through our current cash, investments and unencumbered FFELP Loan and Private Education Refinance Loan portfolios, the predictable operating cash flows provided by operating activities, the repayment of principal on unencumbered education loan assets, and the distribution of overcollateralization from our securitization trusts. We may also, depending on market conditions and availability, draw down on our secured FFELP Loan and Private Education Loan facilities, issue term ABS, enter into additional Private Education Loan ABS repurchase facilities, or issue additional unsecured debt. We may maintain too much liquidity, which can be costly, or may be too illiquid or may be unable to access funds held at banks and other financial institutions due to such banks or financial institutions entering receivership or becoming insolvent, which could result in financial distress during times of financial stress or capital market disruptions.
Our use of derivatives to manage interest rate and foreign currency sensitivity exposes us to credit and market risk that could have a material adverse effect on our earnings and liquidity.
We strive to maintain an overall strategy that uses derivatives to minimize the economic effect of interest rate and/or foreign currency changes. However, developing an effective strategy for dealing with these movements is complex, and no strategy can completely avoid the risks associated with these fluctuations. For example, our education loan portfolio is subject to prepayment risk that could result in being under- or over-hedged, which could result in material losses. As a result, there can be no assurance that hedging activities using derivatives will effectively manage our interest rate or foreign currency sensitivity, have the desired beneficial impact on our results of operations or financial condition or not adversely impact our liquidity.
Our use of derivatives also exposes us to market risk and credit risk. Market risk is the chance of financial loss resulting from changes in interest rates, foreign exchange rates and market liquidity. Our Floor Income Contracts and basis swaps we use to manage earnings variability caused by different reset characteristics on interest-earning assets and interest-bearing liabilities do not qualify for hedge accounting treatment. Therefore, the change in fair value, called the “mark-to-market,” of these derivative instruments is included in our statement of income without a corresponding mark-to-market of the economically hedged item. A decline in the fair value of these derivatives could have a material adverse effect on our reported earnings. In addition, a change in the mark-to-market value of these instruments may cause us to have to post more collateral to our counterparty or to a clearing house. If these values change significantly, the increased collateral posting requirement could have a material adverse impact on our liquidity.
Credit risk is the risk that a counterparty, for a period of time or indefinitely, will not perform its obligations under a contract or is not permitted to perform its obligations under a contract due to the counterparty entering receivership or becoming insolvent. Credit risk is limited to the loss of the fair value gain in a derivative that the counterparty or clearinghouse owes or will owe in the future to us. If a counterparty or clearinghouse fails to perform its obligations, we could, depending on the type of counterparty arrangement, experience a loss of liquidity or an economic loss. In addition, we might not be able to cost effectively replace the derivative position depending on the type of derivative and the current economic environment.
Our securitization trusts, which we consolidate on our balance sheet, had $1.7 billion of Euro denominated bonds outstanding as of March 31, 2023. To convert these non-U.S. dollar denominated bonds into U.S. dollar liabilities, the trusts have entered into foreign-currency swaps with highly rated counterparties. A failure by a swap counterparty to perform its obligations could, if the swap has a positive fair value to us and was not adequately collateralized, materially and adversely affect our earnings.
34
Quantitative and Qualitative Disclosures about Market Risk
LIBOR Transition
We continue to work internally as well as with external parties to ensure an orderly transition from one-month and three-month LIBOR to an alternative benchmark rate by the June 30, 2023 transition date. We have established an internal LIBOR transition team whose purpose is to assess impacts, recommend plans and coordinate transition efforts among different business areas. Executive management and the LIBOR transition team provide quarterly reports to our Board of Directors. We have also established internal LIBOR working groups comprised of members from different business areas who meet regularly to assess specific business-level impacts and to implement operational changes necessary to effectuate a successful transition from LIBOR. In addition to our enterprise-wide efforts, we engage with market participants, industry groups and regulators, including the Alternative Reference Rates Committee (the ARRC), to develop plans and documentation to facilitate the transition to an alternative benchmark rate.
We support the ARRC’s recommendation to replace LIBOR with the Secured Overnight Financing Rate (SOFR) and continue to complywork to align with the ARRC’s recommended best practices for completing the transition from LIBOR. All our new variable rate Private Education Loans issued since December 2021 are indexed to SOFR. Also, as of December 31, 2021, we have ceased entering into any other new contracts that are indexed to LIBOR and, where practicable, have engaged with counterparties to modify certain existing contracts to transition the existing reference rate from LIBOR to SOFR. With respect to our legacy variable rate Private Education Loans and other financial contracts that reference USD LIBOR and contain fallbacks provisions that clearly specify a method for the transition from LIBOR, we plan to transition such loans using such existing fallbacks. We have engaged with our IT vendors and impacted internal work groups to prepare and update our systems, procedures and processes to transition LIBOR-indexed contracts to SOFR. With respect to our financial instruments that do not include fallback provisions that clearly specify a method for the transition from LIBOR to an alternative benchmark rate, where practicable and commercially reasonable, we have made efforts to engage with customers, counterparties and investors to modify such instruments. Due to stringent noteholder consent requirements, it may be impracticable or impossible to modify certain financial instruments like certain of our ABS. Further, the SAP formula for our FFELP Loans, which is indexed to one-month LIBOR, cannot be modified without legislative action. Thus, in such instances, we maywill need to rely on the New York state LIBOR legislation or the proposed federal legislation to transition to SOFR.
On March 15, 2022, the Adjustable Interest Rate (LIBOR) Act (the “LIBOR Act”)LIBOR Act) was signed into law. The LIBOR Act provides that for contracts that contain no fallback provision or contain fallback provisions that do not identify a specific USD LIBOR benchmark replacement (including the SAP formula for FFELP Loans), a benchmark replacement based on SOFR, as recommended by the Federal Reserve Bank of New York, will automatically replace the USD LIBOR benchmark in the contract after June 30, 2023. The recommended benchmark replacement will be based on the SOFR published byOn December 16, 2022, the Federal Reserve Bank of New York including any recommended spread adjustment andadopted a final rule that implements the LIBOR Act by identifying benchmark replacement conforming changes.rates based on SOFR that will replace LIBOR in certain financial contracts after June 30, 2023. Following the enactment and implementation of the LIBOR Act, all of our financial instruments which are currently indexed to USD LIBOR will transition to SOFR by no later than June 30, 2023. Specifically, after June 30, 2023, the SAP formula for FFELP Loans will transition to 30-day Average SOFR and our LIBOR-indexed FFELP ABS contracts that are subject to the LIBOR Act will transition to 30-day or 90-day Average SOFR. Our LIBOR-indexed Private Education Loan ABS contracts that are subject to the LIBOR Act will transition to 1-month or 3-month Term SOFR. Similarly, our LIBOR-indexed Private Education Loans will transition to 1-month or 3-month Term SOFR. Our LIBOR-indexed derivatives will transition to the Fallback Rate (SOFR) as defined in the ISDA 2020 IBOR Fallbacks Protocol published by the International Swaps and Derivatives Association, Inc. on October 23, 2020.
For a discussion of the risks related to the LIBOR transition, see “Risk Factors – Market, Funding & Liquidity Risk – The transition away from the LIBOR reference rate to an alternative reference ratethe Secured Overnight Financing Rate (SOFR) may create uncertainty in the capital markets and may negatively impact the value of existing LIBOR based financial instruments. Post transition alternative reference rates may perform significantly different than LIBOR”instruments and our financial results and business” in our Annual Report on Form 10-K for the fiscal year ended December 31, 2021.10-K.
35
Interest Rate Sensitivity Analysis
Our interest rate risk management seeks to limit the impact of short-term movements in interest rates on our results of operations and financial position. The following tables summarize the potential effect on earnings over the next 12 months and the potential effect on fair values of balance sheet assets and liabilities at March 31, 20222023 and 2021,2022, based upon a sensitivity analysis performed by management assuming a hypothetical increase and decrease in market interest rates of 100 basis points. The earnings sensitivities assume an immediate increase and decrease in market interest rates of 100 basis points and are applied only to financial assets and liabilities, including hedging instruments, that existed at the balance sheet date and do not take into account any new assets, liabilities or hedging instruments that may arise over the next 12 months.
|
| As of March 31, 2022 |
|
| As of March 31, 2021 |
|
| As of March 31, 2023 |
|
| As of March 31, 2022 |
| ||||||||||||||||||||
|
| Impact on Annual Earnings If: |
|
| Impact on Annual Earnings If: |
|
| Impact on Annual Earnings If: |
|
| Impact on Annual Earnings If: |
| ||||||||||||||||||||
|
| Interest Rates |
|
| Interest Rates |
|
| Interest Rates |
|
| Interest Rates |
| ||||||||||||||||||||
(Dollars in millions, except per share amounts) |
| Increase 100 Basis Points |
|
| Decrease 100 Basis Points |
|
| Increase 100 Basis Points |
|
| Decrease 100 Basis Points |
|
| Increase |
|
| Decrease |
|
| Increase |
|
| Decrease |
| ||||||||
Effect on Earnings: |
|
|
|
|
|
|
|
|
|
|
|
|
|
|
|
|
|
|
|
|
|
|
|
|
|
|
|
| ||||
Change in pre-tax net income before mark-to -market gains (losses) on derivative and hedging activities(1) |
| $ | 25 |
|
| $ | 4 |
|
| $ | (34 | ) |
| $ | 13 |
| ||||||||||||||||
Change in pre-tax net income before mark-to |
| $ | 39 |
|
| $ | (26 | ) |
| $ | 25 |
|
| $ | 4 |
| ||||||||||||||||
Mark-to-market gains (losses) on derivative and hedging activities |
|
| 43 |
|
|
| (63 | ) |
|
| 115 |
|
|
| (153 | ) |
|
| 32 |
|
|
| (33 | ) |
|
| 43 |
|
|
| (63 | ) |
Increase (decrease) in income before taxes |
| $ | 68 |
|
| $ | (59 | ) |
| $ | 81 |
|
| $ | (140 | ) |
| $ | 71 |
|
| $ | (59 | ) |
| $ | 68 |
|
| $ | (59 | ) |
Increase (decrease) in net income after taxes |
| $ | 52 |
|
| $ | (45 | ) |
| $ | 62 |
|
| $ | (108 | ) |
| $ | 55 |
|
| $ | (45 | ) |
| $ | 52 |
|
| $ | (45 | ) |
Increase (decrease) in diluted earnings per common share |
| $ | .35 |
|
| $ | (.30 | ) |
| $ | .35 |
|
| $ | (.60 | ) |
| $ | .43 |
|
| $ | (.36 | ) |
| $ | .35 |
|
| $ | (.30 | ) |
36
|
| |||||||||||||||||||||||||||||||||||||||||||||||||||||||||||||||||||||||||||||||||||||||||||||||||||||||||||||||||||||||||||||||||||||||||||||||||||||||||||||||||||||||||||||||||||||||||||||||||||||||||||||||||||||||||||||||||||||||||||||||||||||||||||||||||||||||||||||||||||||||||||||||||||||||||||||||||||||||||||||||||||||||||||||||||||||||||||||||||||||||||||||||||||||||||||||||||||||||||||||||||||||||||||||||||||||||||||||||||||||||||||||||||||||||||||||||||||||||||||||||||||||||||||||||||||||||||||||||||||||||||||||||||||||||||||||||||||||||||||||||||||||||||||||||||||||||||||||||||||||||||||||||||||||||||||||||||||||||||||||||||||||||||||
|
| At March 31, 2022 |
| |||||||||||||||||
|
|
|
|
|
| Interest Rates: |
| |||||||||||||
|
|
|
|
|
| Change from Increase of 100 Basis Points |
|
| Change from Decrease of 100 Basis Points |
| ||||||||||
(Dollars in millions) |
| Fair Value |
|
| $ |
|
| % |
|
| $ |
|
| % |
| |||||
Effect on Fair Values: |
|
|
|
|
|
|
|
|
|
|
|
|
|
|
|
|
|
|
|
|
Assets |
|
|
|
|
|
|
|
|
|
|
|
|
|
|
|
|
|
|
|
|
Education Loans |
| $ | 70,588 |
|
| $ | (152 | ) |
|
| — |
|
| $ | 231 |
|
|
| — |
|
Other earning assets |
|
| 3,424 |
|
|
| — |
|
|
| — |
|
|
| — |
|
|
| — |
|
Other assets |
|
| 3,633 |
|
|
| 18 |
|
|
| — |
|
|
| 85 |
|
|
| 2 |
|
Total assets gain/(loss) |
| $ | 77,645 |
|
| $ | (134 | ) |
|
| — | % |
| $ | 316 |
|
|
| — | % |
Liabilities |
|
|
|
|
|
|
|
|
|
|
|
|
|
|
|
|
|
|
|
|
Interest-bearing liabilities |
| $ | 73,328 |
|
| $ | (321 | ) |
|
| — | % |
| $ | 347 |
|
|
| — | % |
Other liabilities |
|
| 701 |
|
|
| 119 |
|
|
| 17 |
|
|
| (8 | ) |
|
| (1 | ) |
Total liabilities (gain)/loss |
| $ | 74,029 |
|
| $ | (202 | ) |
|
| — | % |
| $ | 339 |
|
|
| — | % |
|
|
|
|
|
|
|
|
|
|
|
|
|
|
|
|
|
|
|
|
|
|
| At December 31, 2021 |
| |||||||||||||||||
|
|
|
|
|
| Interest Rates: |
| |||||||||||||
|
|
|
|
|
| Change from Increase of 100 Basis Points |
|
| Change from Decrease of 100 Basis Points |
| ||||||||||
(Dollars in millions) |
| Fair Value |
|
| $ |
|
| % |
|
| $ |
|
| % |
| |||||
Effect on Fair Values: |
|
|
|
|
|
|
|
|
|
|
|
|
|
|
|
|
|
|
|
|
Assets |
|
|
|
|
|
|
|
|
|
|
|
|
|
|
|
|
|
|
|
|
Education Loans |
| $ | 74,772 |
|
| $ | (279 | ) |
|
| — |
|
| $ | 432 |
|
|
| 1 | % |
Other earning assets |
|
| 3,845 |
|
|
| — |
|
|
| — |
|
|
| — |
|
|
| — |
|
Other assets |
|
| 3,948 |
|
|
| (124 | ) |
|
| (3 | ) |
|
| 263 |
|
|
| 7 |
|
Total assets gain/(loss) |
| $ | 82,565 |
|
| $ | (403 | ) |
|
| — | % |
| $ | 695 |
|
|
| 1 | % |
Liabilities |
|
|
|
|
|
|
|
|
|
|
|
|
|
|
|
|
|
|
|
|
Interest-bearing liabilities |
| $ | 77,040 |
|
| $ | (356 | ) |
|
| — | % |
| $ | 386 |
|
|
| 1 | % |
Other liabilities |
|
| 1,019 |
|
|
| (40 | ) |
|
| (4 | ) |
|
| 193 |
|
|
| 19 |
|
Total liabilities (gain)/loss |
| $ | 78,059 |
|
| $ | (396 | ) |
|
| (1 | )% |
| $ | 579 |
|
|
| 1 | % |
A primary objective in our funding is to minimize our sensitivity to changing interest rates by generally funding our floating rate education loan portfolio with floating rate debt and our fixed rate education loan portfolio with fixed rate debt although we can have a mismatch at times. In addition, we can have a mismatch in the index (including the frequency of reset) of floating rate debt versus floating rate assets. In addition, due to the ability of some FFELP Loans to earn Floor Income, we can have a fixed versus floating mismatch in funding if the education loan earns at the fixed borrower rate and the funding remains floating. During 2021 and 2020, certain FFELP Loans were earningWe use Floor Income Contracts, pay-fixed swaps and we locked in a portion of thatfixed rate debt to economically hedge embedded Floor Income throughin our FFELP loans. Historically, we have used these instruments on a periodic basis and depending upon market conditions and pricing, we may enter into additional hedges in the use of derivative contracts.future. The result of these hedging transactions wasis to fix the relative spread between the education loan asset rate and the variable rate liability.
In the preceding tables, under the scenario where interest rates increase or decrease by 100 basis points, the change in pre-tax net income before the mark-to-market gains (losses) on derivative and hedging activities is primarily due to the impact of (i) our unhedged FFELP Loans being in a fixed-rate mode due to Floor Income, while being funded with variable rate debt in low interest rate environments; (ii) certain FFELP fixed rate loans becoming variable interest rate loans when variable interest rates rise above a certain level (Special Allowance Payment of “SAP”). When these loans are funded with fixed rate debt (as we do for a portion of the portfolio to economically hedge Floor Income) we earn additional interest income when earning the higher variable rate that is in effect; and (ii)(iii) a portion of our variable rate assets being funded with fixed rate liabilities. Item (i) will generally cause income to decrease when interest rates increase and income to increase when interest rates decrease. Item (ii) hasand (iii) have the opposite effect. The changes due to the interest rate scenarios in the current period in relation to each other and in relation to the prior period, are primarily a result of item (ii) having a more significant impact than item (i) as a result of interest rates being significantly higher compared to the 1-year LIBOR forward curve increasing significantly fromprior period. The changes in the prior period which results in less lossare a result of Floor Income whenitem (i) having a more significant impact than item (ii) primarily as a result of interest rates are increased andbeing significantly lower at that time. In addition, item (iii) had more of an impact in the prior period due to a greater increase to Floor Income when rates are decreased.higher balance of variable rate assets being funded with fixed rate liabilities.
37
In the preceding tables, under the scenario where interest rates increase or decrease by 100 basis points, the change in mark-to-market gains (losses) on derivative and hedging activities in both periods is primarily due to (i) the notional amount and remaining term of our derivative portfolio and related hedged debt and (ii) the interest rate environment. In both periods, the mark-to-market gains (losses) are primarily related to derivatives that don’t qualify for hedge accounting that are used to economically hedge Floor Income as well as the origination of fixed rate Private Education Refinance loans. As a result of not qualifying for hedge accounting, there is not an offsetting mark- to-market of the hedged item in this analysis. The mark-to-market gains (losses) where interest rates increase and decrease 100 basis points are lower in 20222023 than 20212022 primarily as a result of an increased2023's higher interest rate environment
37
in 2022environment's impact on derivatives used to hedge Floor Income and a decline in the notional amount of derivatives outstanding in connection with the decrease in the education loan portfolio over that time period.
In addition to interest rate risk addressed in the preceding tables, we are also exposed to risks related to foreign currency exchange rates. Foreign currency exchange risk is primarily the result of foreign currency denominated debt issued by us. When we issue foreign denominated corporate unsecured and securitization debt, our policy is to use cross currency interest rate swaps to swap all foreign currency denominated debt payments (fixed and floating) to USD LIBOR using a fixed exchange rate. In the tables above, there would be an immaterial impact on earnings if exchange rates were to decrease or increase, due to the terms of the hedging instrument and hedged items matching. The balance sheet interest-bearing liabilities would be affected by a change in exchange rates; however, the change would be materially offset by the cross-currency interest rate swaps in other assets or other liabilities. In certain economic environments, volatility in the spread between spot and forward foreign exchange rates has resulted in mark-to-market impacts to current period earnings which have not been factored into the above analysis. The earnings impact is noncash, and at maturity of the instruments the cumulative mark-to-market impact will be zero. Navient has not issued foreign currency denominated debt since 2008.
Asset and Liability Funding Gap
The tables below present our assets and liabilities (funding) arranged by underlying indices as of March 31, 2022.2023. In the following GAAP presentation, the funding gap only includes derivatives that qualify as effective hedges (those derivatives which are reflected in net interest margin, as opposed to those reflected in the “gains (losses) on derivatives and hedging activities, net” line on the consolidated statements of income). The difference between the asset and the funding is the funding gap for the specified index. This represents our exposure to interest rate risk in the form of basis risk and repricing risk, which is the risk that the different indices may reset at different frequencies or may not move in the same direction or at the same magnitude.
Management analyzes interest rate risk and in doing so includes all derivatives that are economically hedging our debt whether they qualify as effective hedges or not (Core Earnings basis). Accordingly, we are also presenting the asset and liability funding gap on a Core Earnings basis in the table that follows the GAAP presentation.
GAAP Basis:
Index |
| Frequency of |
| Assets |
|
| Funding(1) |
|
| Funding |
| |||
3-month Treasury bill |
| weekly |
| $ | 2.2 |
|
| $ | — |
|
| $ | 2.2 |
|
3-month Treasury bill |
| annual |
|
| .1 |
|
|
| — |
|
|
| .1 |
|
Prime |
| annual |
|
| .1 |
|
|
| — |
|
|
| .1 |
|
Prime |
| quarterly |
|
| 1.2 |
|
|
| — |
|
|
| 1.2 |
|
Prime |
| monthly |
|
| 4.1 |
|
|
| — |
|
|
| 4.1 |
|
3-month LIBOR |
| quarterly |
|
| .2 |
|
|
| 17.2 |
|
|
| (17.0 | ) |
1-month LIBOR |
| monthly |
|
| 2.6 |
|
|
| 24.8 |
|
|
| (22.2 | ) |
1-month LIBOR |
| daily |
|
| 39.7 |
|
|
| — |
|
|
| 39.7 |
|
SOFR(2) |
| various |
|
| .1 |
|
|
| .7 |
|
|
| (.6 | ) |
Non-Discrete reset(2)(3) |
| monthly |
|
| — |
|
|
| 4.6 |
|
|
| (4.6 | ) |
Non-Discrete reset(4) |
| daily/weekly |
|
| 3.0 |
|
|
| .1 |
|
|
| 2.9 |
|
Fixed Rate(5) |
|
|
|
| 13.6 |
|
|
| 19.5 |
|
|
| (5.9 | ) |
Total |
|
|
| $ | 66.9 |
|
| $ | 66.9 |
|
| $ | — |
|
Index (Dollars in billions) |
| Frequency of Variable Resets |
| Assets |
|
| Funding(1) |
|
| Funding Gap |
| |||
3-month Treasury bill |
| weekly |
| $ | 2.6 |
|
| $ | — |
|
| $ | 2.6 |
|
3-month Treasury bill |
| annual |
|
| .2 |
|
|
| — |
|
|
| .2 |
|
Prime |
| annual |
|
| .2 |
|
|
| — |
|
|
| .2 |
|
Prime |
| quarterly |
|
| 1.4 |
|
|
| — |
|
|
| 1.4 |
|
Prime |
| monthly |
|
| 5.1 |
|
|
| — |
|
|
| 5.1 |
|
3-month LIBOR |
| quarterly |
|
| .3 |
|
|
| 22.2 |
|
|
| (21.9 | ) |
3-month LIBOR(2) |
| monthly |
|
| — |
|
|
| .5 |
|
|
| (.5 | ) |
3-month LIBOR(2) |
| daily |
|
| — |
|
|
| .1 |
|
|
| (.1 | ) |
1-month LIBOR |
| monthly |
|
| 3.4 |
|
|
| 29.8 |
|
|
| (26.4 | ) |
1-month LIBOR |
| daily |
|
| 48.2 |
|
|
| — |
|
|
| 48.2 |
|
SOFR(3) |
| various |
|
| — |
|
|
| .1 |
|
|
| (.1 | ) |
Non-Discrete reset(2)(4) |
| monthly |
|
| — |
|
|
| 3.7 |
|
|
| (3.7 | ) |
Non-Discrete reset(5) |
| daily/weekly |
|
| 3.4 |
|
|
| .2 |
|
|
| 3.2 |
|
Fixed Rate(6) |
|
|
|
| 13.4 |
|
|
| 21.6 |
|
|
| (8.2 | ) |
Total |
|
|
| $ | 78.2 |
|
| $ | 78.2 |
|
| $ | — |
|
38
|
|
|
|
|
|
|
|
|
|
|
|
Core Earnings Basis:
Index |
| Frequency of |
| Assets |
|
| Funding(1) |
|
| Funding |
| |||
3-month Treasury bill |
| weekly |
| $ | 2.2 |
|
| $ | — |
|
| $ | 2.2 |
|
3-month Treasury bill |
| annual |
|
| .1 |
|
|
| — |
|
|
| .1 |
|
Prime |
| annual |
|
| .1 |
|
|
| — |
|
|
| .1 |
|
Prime |
| quarterly |
|
| 1.2 |
|
|
| — |
|
|
| 1.2 |
|
Prime |
| monthly |
|
| 4.1 |
|
|
| — |
|
|
| 4.1 |
|
3-month LIBOR |
| quarterly |
|
| .2 |
|
|
| 6.2 |
|
|
| (6.0 | ) |
1-month LIBOR |
| monthly |
|
| 2.6 |
|
|
| 34.3 |
|
|
| (31.7 | ) |
1-month LIBOR |
| daily |
|
| 39.7 |
|
|
| — |
|
|
| 39.7 |
|
SOFR(2) |
| various |
|
| .1 |
|
|
| .7 |
|
|
| (.6 | ) |
Non-Discrete reset(2)(3) |
| monthly |
|
| — |
|
|
| 4.6 |
|
|
| (4.6 | ) |
Non-Discrete reset(4) |
| daily/weekly |
|
| 3.0 |
|
|
| .1 |
|
|
| 2.9 |
|
Fixed Rate(5) |
|
|
|
| 13.7 |
|
|
| 21.1 |
|
|
| (7.4 | ) |
Total |
|
|
| $ | 67.0 |
|
| $ | 67.0 |
|
| $ | — |
|
Index (Dollars in billions) |
| Frequency of Variable Resets |
| Assets |
|
| Funding(1) |
|
| Funding Gap |
| |||
3-month Treasury bill |
| weekly |
| $ | 2.6 |
|
| $ | — |
|
| $ | 2.6 |
|
3-month Treasury bill |
| annual |
|
| .2 |
|
|
| — |
|
|
| .2 |
|
Prime |
| annual |
|
| .2 |
|
|
| — |
|
|
| .2 |
|
Prime |
| quarterly |
|
| 1.4 |
|
|
| — |
|
|
| 1.4 |
|
Prime |
| monthly |
|
| 5.1 |
|
|
| — |
|
|
| 5.1 |
|
3-month LIBOR |
| quarterly |
|
| .3 |
|
|
| 4.2 |
|
|
| (3.9 | ) |
3-month LIBOR(2) |
| monthly |
|
| — |
|
|
| .5 |
|
|
| (.5 | ) |
3-month LIBOR(2) |
| daily |
|
| — |
|
|
| .1 |
|
|
| (.1 | ) |
1-month LIBOR |
| monthly |
|
| 3.4 |
|
|
| 46.4 |
|
|
| (43.0 | ) |
1-month LIBOR |
| daily |
|
| 48.2 |
|
|
| — |
|
|
| 48.2 |
|
SOFR(3) |
| various |
|
| — |
|
|
| .1 |
|
|
| (.1 | ) |
Non-Discrete reset(2)(4) |
| monthly |
|
| — |
|
|
| 3.7 |
|
|
| (3.7 | ) |
Non-Discrete reset(5) |
| daily/weekly |
|
| 3.4 |
|
|
| .2 |
|
|
| 3.2 |
|
Fixed Rate(6) |
|
|
|
| 13.3 |
|
|
| 22.9 |
|
|
| (9.6 | ) |
Total |
|
|
| $ | 78.1 |
|
| $ | 78.1 |
|
| $ | — |
|
|
|
|
|
|
|
|
|
|
|
|
|
We use interest rate swaps and other derivatives to achieve our risk management objectives. Our asset liability management strategy is to match assets with debt (in combination with derivatives) that have the same underlying index and reset frequency or, when economical, have interest rate characteristics that we believe are highly correlated. Interest earned on our FFELP Loans is primarily indexed to daily one-month LIBOR and our cost of funds is primarily indexed to rates other than daily one-month LIBOR. A source of variability in FFELP net interest income could also be Floor Income we earn on certain FFELP Loans. Pursuant to the terms of the FFELP, certain FFELP Loans can earn interest at the stated fixed rate of interest as underlying debt interest rate expense remains variable. We refer to this additional spread income as “Floor Income.” Floor Income can be volatile since it is dependent on interest rate levels. We frequently hedge this volatility with derivatives whichto lock in the value of the Floor Income over the term of the contract. Interest earned on our Private Education Refinance Loans is generally fixed rate with the related cost of funds generally fixed rate as well. Interest earned on the remaining Private Education Loans is generally indexed to either one-month Prime or LIBOR rates and our cost of funds is primarily indexed to one-month or three-month LIBOR. The use of funding with index types and reset frequencies that are different from our assets exposes us to interest rate risk in the form of basis and repricing risk. This could result in our cost of funds not moving in the same direction or with the same magnitude as the yield on our assets. While we believe this risk is low, as all of these indices are short-term with rate movements that are highly correlated over a long period of time, market disruptions (which have occurred in prior years) can lead to a temporary divergence between indices resulting in a negative impact to our earnings.
earnings.
39
Unregistered Sales of Equity Securities and Use of Proceeds
Share Repurchases
The following table provides information relating to our purchases of shares of our common stock in the three months ended March 31, 2022.2023.
(In millions, except per share data) |
| Total Number |
|
| Average Price |
|
| Total Number of |
|
| Approximate Dollar |
| ||||
Period: |
|
|
|
|
|
|
|
|
|
|
|
| ||||
January 1 — January 31, 2023 |
|
| 1.6 |
|
| $ | 17.58 |
|
|
| 1.6 |
|
| $ | 573 |
|
February 1 — February 28, 2023 |
|
| 1.8 |
|
|
| 18.68 |
|
|
| 1.4 |
|
| $ | 547 |
|
March 1 — March 31, 2023 |
|
| 2.1 |
|
|
| 16.53 |
|
|
| 1.9 |
|
| $ | 515 |
|
Total first-quarter 2023 |
|
| 5.5 |
|
| $ | 17.52 |
|
|
| 4.9 |
|
|
|
| |
(In millions, except per share data) |
| Total Number of Shares Purchased(1) |
|
| Average Price Paid per Share |
|
| Total Number of Shares Purchased as Part of Publicly Announced Plans or Programs(2) |
|
| Approximate Dollar Value of Shares That May Yet Be Purchased Under Publicly Announced Plans or Programs(2) |
| ||||
Period: |
|
|
|
|
|
|
|
|
|
|
|
|
|
|
|
|
January 1 — January 31, 2022 |
|
| 2.0 |
|
| $ | 20.03 |
|
|
| 1.9 |
|
| $ | 963 |
|
February 1 — February 28, 2022 |
|
| 3.5 |
|
|
| 18.12 |
|
|
| 2.7 |
|
| $ | 913 |
|
March 1 — March 31, 2022 |
|
| 1.9 |
|
|
| 17.00 |
|
|
| 1.6 |
|
| $ | 885 |
|
Total first-quarter 2022 |
|
| 7.4 |
|
| $ | 18.33 |
|
|
| 6.2 |
|
|
|
|
|
|
|
|
|
Controls and Procedures
Disclosure Controls and Procedures
Our management, with the participation of our Principal Executive and Principal Financial Officers, evaluated the effectiveness of our disclosure controls and procedures (as defined in Rules 13a-15(e) and 15d-15(e) under the Securities Exchange Act of 1934, as amended (the Exchange Act)) as of March 31, 2022.2023. Based on this evaluation, our Principal Executive and Principal Financial Officers concluded that, as of March 31, 2022,2023, our disclosure controls and procedures were effective to ensure that information required to be disclosed by us in the reports that we file or submit under the Exchange Act is (a) recorded, processed, summarized and reported within the time periods specified in the SEC’s rules and forms and (b) accumulated and communicated to our management, including our Principal Executive and Principal Financial Officers as appropriate, to allow timely decisions regarding required disclosure.
Changes in Internal Control over Financial Reporting
No change in our internal control over financial reporting (as defined in Rules 13a-15(f) and 15d-15(f) under the Exchange Act) occurred during the fiscal quarter ended March 31, 20222023 that has materially affected, or is reasonably likely to materially affect, our internal control over financial reporting.
40
Exhibits
10.1†* | Form of Navient Corporation 2014 Omnibus Incentive Plan Performance Stock Unit | |
| ||
31.1* | ||
| Certification Pursuant to Section 302 of the Sarbanes-Oxley Act of | |
| ||
31.2* | ||
| Certification Pursuant to Section 302 of the Sarbanes-Oxley Act of | |
| ||
32.1** | ||
| ||
| ||
32.2** | ||
| ||
| ||
101.INS* | ||
| Inline XBRL Instance Document – the instance document does not appear in the Interactive Data File because its XBRL tags are embedded within the Inline XBRL document. | |
101.SCH* | Inline XBRL Taxonomy Extension Schema Document. | |
101.CAL* | Inline XBRL Taxonomy Extension Calculation Linkbase Document. | |
101.DEF* | Inline XBRL Taxonomy Extension Definition Linkbase Document. | |
101.LAB* | Inline XBRL Taxonomy Extension Label Linkbase Document. | |
101.PRE* | Inline XBRL Taxonomy Extension Presentation Linkbase Document. | |
104 | Cover Page Interactive Data File (formatted as Inline XBRL and contained in Exhibit 101). |
† Management Contract or Compensatory Plan or Arrangement * Filed herewith ** Furnished herewith 41
|
|
|
|
|
|
Financial Statements
NAVIENT CORPORATION
CONSOLIDATED BALANCE SHEETS
(In millions, except per share amounts)
(Unaudited)
|
| March 31, 2022 |
|
| December 31, 2021 |
|
| March 31, 2023 |
|
| December 31, 2022 |
| ||||
Assets |
|
|
|
|
|
|
|
|
|
|
|
|
|
| ||
FFELP Loans (net of allowance for losses of $255 and $262, respectively) |
| $ | 51,013 |
|
| $ | 52,641 |
| ||||||||
Private Education Loans (net of allowance for losses of $964 and $1,009, respectively) |
|
| 20,088 |
|
|
| 20,171 |
| ||||||||
FFELP Loans (net of allowance for losses of $214 and $222, respectively) |
| $ | 42,148 |
|
| $ | 43,525 |
| ||||||||
Private Education Loans (net of allowance for losses of $706 and $800, |
|
| 18,275 |
|
|
| 18,725 |
| ||||||||
Investments |
|
|
|
|
|
|
|
|
|
|
|
|
|
| ||
Held-to-maturity |
|
| 69 |
|
|
| 74 |
|
|
| 57 |
|
|
| 60 |
|
Other |
|
| 141 |
|
|
| 193 |
|
|
| 96 |
|
|
| 107 |
|
Total investments |
|
| 210 |
|
|
| 267 |
|
|
| 153 |
|
|
| 167 |
|
Cash and cash equivalents |
|
| 708 |
|
|
| 905 |
|
|
| 570 |
|
|
| 1,535 |
|
Restricted cash and cash equivalents |
|
| 2,506 |
|
|
| 2,673 |
|
|
| 2,208 |
|
|
| 3,272 |
|
Goodwill and acquired intangible assets, net |
|
| 722 |
|
|
| 725 |
|
|
| 703 |
|
|
| 705 |
|
Other assets |
|
| 2,911 |
|
|
| 3,223 |
|
|
| 2,856 |
|
|
| 2,866 |
|
Total assets |
| $ | 78,158 |
|
| $ | 80,605 |
|
| $ | 66,913 |
|
| $ | 70,795 |
|
Liabilities |
|
|
|
|
|
|
|
|
|
|
|
|
|
| ||
Short-term borrowings |
| $ | 3,802 |
|
| $ | 2,490 |
|
| $ | 5,753 |
|
| $ | 5,870 |
|
Long-term borrowings |
|
| 70,825 |
|
|
| 74,488 |
|
|
| 57,388 |
|
|
| 61,026 |
|
Other liabilities |
|
| 701 |
|
|
| 1,019 |
|
|
| 814 |
|
|
| 922 |
|
Total liabilities |
|
| 75,328 |
|
|
| 77,997 |
|
|
| 63,955 |
|
|
| 67,818 |
|
Commitments and contingencies |
|
|
|
|
|
|
|
|
|
|
|
|
|
| ||
Equity |
|
|
|
|
|
|
|
|
|
|
|
|
|
| ||
Series A Junior Participating Preferred Stock, par value $0.20 per share; 2 million shares authorized at December 31, 2021; 0 shares issued or outstanding |
|
| — |
|
|
| — |
| ||||||||
Common stock, par value $0.01 per share, 1.125 billion shares authorized: 461 million and 459 million shares issued, respectively |
|
| 4 |
|
|
| 4 |
| ||||||||
Series A Junior Participating Preferred Stock, par value $0.20 per share; |
|
| — |
|
|
| — |
| ||||||||
Common stock, par value $0.01 per share, 1.125 billion shares authorized: |
|
| 4 |
|
|
| 4 |
| ||||||||
Additional paid-in capital |
|
| 3,302 |
|
|
| 3,282 |
|
|
| 3,335 |
|
|
| 3,313 |
|
Accumulated other comprehensive loss (net of tax benefit of $7 and $45, respectively) |
|
| (19 | ) |
|
| (133 | ) | ||||||||
Accumulated other comprehensive income (net of tax expense |
|
| 66 |
|
|
| 87 |
| ||||||||
Retained earnings |
|
| 4,167 |
|
|
| 3,939 |
|
|
| 4,579 |
|
|
| 4,490 |
|
Total Navient Corporation stockholders’ equity before treasury stock |
|
| 7,454 |
|
|
| 7,092 |
|
|
| 7,984 |
|
|
| 7,894 |
|
Less: Common stock held in treasury at cost: 312 million and 305 million shares, respectively |
|
| (4,630 | ) |
|
| (4,495 | ) | ||||||||
Less: Common stock held in treasury at cost: 337 million and 331 million |
|
| (5,026 | ) |
|
| (4,917 | ) | ||||||||
Total Navient Corporation stockholders’ equity |
|
| 2,824 |
|
|
| 2,597 |
|
|
| 2,958 |
|
|
| 2,977 |
|
Noncontrolling interest |
|
| 6 |
|
|
| 11 |
|
|
| — |
|
|
| — |
|
Total equity |
|
| 2,830 |
|
|
| 2,608 |
|
|
| 2,958 |
|
|
| 2,977 |
|
Total liabilities and equity |
| $ | 78,158 |
|
| $ | 80,605 |
|
| $ | 66,913 |
|
| $ | 70,795 |
|
Supplemental information — assets and liabilities of consolidated variable interest entities:
|
| March 31, 2022 |
|
| December 31, 2021 |
|
| March 31, 2023 |
|
| December 31, 2022 |
| ||||
FFELP Loans |
| $ | 50,779 |
|
| $ | 52,502 |
|
| $ | 42,086 |
|
| $ | 43,465 |
|
Private Education Loans |
|
| 18,224 |
|
|
| 18,147 |
|
|
| 16,822 |
|
|
| 17,207 |
|
Restricted cash |
|
| 2,471 |
|
|
| 2,649 |
|
|
| 2,180 |
|
|
| 3,233 |
|
Other assets, net |
|
| 1,500 |
|
|
| 1,522 |
|
|
| 1,534 |
|
|
| 1,356 |
|
Short-term borrowings |
|
| 2,596 |
|
|
| 2,188 |
|
|
| 4,520 |
|
|
| 4,458 |
|
Long-term borrowings |
|
| 64,755 |
|
|
| 67,107 |
|
|
| 52,714 |
|
|
| 55,598 |
|
Net assets of consolidated variable interest entities |
| $ | 5,623 |
|
| $ | 5,525 |
|
| $ | 5,388 |
|
| $ | 5,205 |
|
See accompanying notes to consolidated financial statements.
42
NAVIENT CORPORATION
CONSOLIDATED STATEMENTS OF INCOME
(In millions, except per share amounts)
(Unaudited)
|
| Three Months Ended March 31, |
|
| Three Months Ended March 31, |
| ||||||||||
|
| 2022 |
|
| 2021 |
|
| 2023 |
|
| 2022 |
| ||||
Interest income: |
|
|
|
|
|
|
|
|
|
|
|
|
|
| ||
FFELP Loans |
| $ | 349 |
|
| $ | 373 |
|
| $ | 693 |
|
| $ | 349 |
|
Private Education Loans |
|
| 276 |
|
|
| 319 |
|
|
| 344 |
|
|
| 276 |
|
Cash and investments |
|
| 1 |
|
|
| — |
|
|
| 34 |
|
|
| 1 |
|
Total interest income |
|
| 626 |
|
|
| 692 |
|
|
| 1,071 |
|
|
| 626 |
|
Total interest expense |
|
| 289 |
|
|
| 329 |
|
|
| 837 |
|
|
| 289 |
|
Net interest income |
|
| 337 |
|
|
| 363 |
|
|
| 234 |
|
|
| 337 |
|
Less: provisions for loan losses |
|
| 16 |
|
|
| (87 | ) |
|
| (14 | ) |
|
| 16 |
|
Net interest income after provisions for loan losses |
|
| 321 |
|
|
| 450 |
|
|
| 248 |
|
|
| 321 |
|
Other income (loss): |
|
|
|
|
|
|
|
|
|
|
|
|
|
| ||
Servicing revenue |
|
| 18 |
|
|
| 53 |
|
|
| 17 |
|
|
| 18 |
|
Asset recovery and business processing revenue |
|
| 97 |
|
|
| 139 |
|
|
| 72 |
|
|
| 97 |
|
Other income |
|
| 10 |
|
|
| — |
|
|
| 7 |
|
|
| 10 |
|
Gains on sales of loans |
|
| — |
|
|
| 76 |
| ||||||||
Gains (losses) on derivative and hedging activities, net |
|
| 98 |
|
|
| 36 |
|
|
| (8 | ) |
|
| 98 |
|
Total other income |
|
| 223 |
|
|
| 304 |
|
|
| 88 |
|
|
| 223 |
|
Expenses: |
|
|
|
|
|
|
|
|
|
|
|
|
|
| ||
Salaries and benefits |
|
| 120 |
|
|
| 149 |
|
|
| 105 |
|
|
| 120 |
|
Other operating expenses |
|
| 85 |
|
|
| 110 |
|
|
| 80 |
|
|
| 85 |
|
Total operating expenses |
|
| 205 |
|
|
| 259 |
|
|
| 185 |
|
|
| 205 |
|
Goodwill and acquired intangible asset impairment and amortization expense |
|
| 4 |
|
|
| 5 |
|
|
| 3 |
|
|
| 4 |
|
Restructuring/other reorganization expenses |
|
| 3 |
|
|
| 6 |
|
|
| 4 |
|
|
| 3 |
|
Total expenses |
|
| 212 |
|
|
| 270 |
|
|
| 192 |
|
|
| 212 |
|
Income before income tax expense |
|
| 332 |
|
|
| 484 |
|
|
| 144 |
|
|
| 332 |
|
Income tax expense |
|
| 77 |
|
|
| 114 |
|
|
| 33 |
|
|
| 77 |
|
Net income |
| $ | 255 |
|
| $ | 370 |
|
| $ | 111 |
|
| $ | 255 |
|
Basic earnings per common share |
| $ | 1.69 |
|
| $ | 2.02 |
|
| $ | .87 |
|
| $ | 1.69 |
|
Average common shares outstanding |
|
| 151 |
|
|
| 183 |
|
|
| 129 |
|
|
| 151 |
|
Diluted earnings per common share |
| $ | 1.67 |
|
| $ | 2.00 |
|
| $ | .86 |
|
| $ | 1.67 |
|
Average common and common equivalent shares outstanding |
|
| 153 |
|
|
| 185 |
|
|
| 130 |
|
|
| 153 |
|
Dividends per common share |
| $ | .16 |
|
| $ | .16 |
|
| $ | .16 |
|
| $ | .16 |
|
See accompanying notes to consolidated financial statements.
43
NAVIENT CORPORATION
CONSOLIDATED STATEMENTS OF COMPREHENSIVE INCOME
(In millions)
(Unaudited)
|
| Three Months Ended March 31, |
| |||||
|
| 2023 |
|
| 2022 |
| ||
Net income |
| $ | 111 |
|
| $ | 255 |
|
Net changes in cash flow hedges, net of taxes(1) |
|
| (21 | ) |
|
| 114 |
|
Total comprehensive income |
| $ | 90 |
|
| $ | 369 |
|
|
| Three Months Ended March 31, |
| |||||
|
| 2022 |
|
| 2021 |
| ||
Net income |
| $ | 255 |
|
| $ | 370 |
|
Net changes in cash flow hedges, net of taxes(1) |
|
| 114 |
|
|
| 48 |
|
Total comprehensive income |
| $ | 369 |
|
| $ | 418 |
|
|
|
See accompanying notes to consolidated financial statements.
44
NAVIENT CORPORATION
CONSOLIDATED STATEMENTS OF CHANGES IN STOCKHOLDERS’ EQUITY
(In millions, except share and per share amounts)
(Unaudited)
|
|
|
|
|
|
|
|
|
|
|
|
|
|
|
|
|
|
|
|
|
| Accumulated |
|
|
|
|
|
|
|
|
|
|
|
|
|
|
|
|
|
|
|
|
| |||||||||||||||||||||||||||||||||||||||||||||
|
| Common Stock Shares |
|
|
|
|
|
| Additional |
|
| Other |
|
|
|
|
|
|
|
|
|
| Total |
|
|
|
|
|
|
|
|
|
|
|
|
|
|
|
|
|
|
|
|
|
|
| Accumulated |
|
|
|
|
|
|
|
|
|
|
|
|
|
|
|
| |||||||||||||||||||||||||
|
|
|
|
|
|
|
|
|
|
|
|
|
| Common |
|
| Paid-In |
|
| Comprehensive |
|
| Retained |
|
| Treasury |
|
| Stockholders' |
|
| Noncontrolling |
|
| Total |
|
| Common Stock Shares |
|
|
|
|
| Additional |
|
| Other |
|
|
|
|
|
|
|
| Total |
|
|
|
|
|
|
| |||||||||||||||||||||||||
|
| Issued |
|
| Treasury |
|
| Outstanding |
|
| Stock |
|
| Capital |
|
| Income (Loss) |
|
| Earnings |
|
| Stock |
|
| Equity |
|
| Interest |
|
| Equity |
|
|
|
|
|
|
|
|
| Common |
|
| Paid-In |
|
| Comprehensive |
|
| Retained |
|
| Treasury |
|
| Stockholders' |
|
| Noncontrolling |
|
| Total |
| ||||||||||||||||||||||||
Balance at December 31, 2020 |
|
| 453,778,975 |
|
|
| (267,476,521 | ) |
|
| 186,302,454 |
|
| $ | 4 |
|
| $ | 3,226 |
|
| $ | (274 | ) |
| $ | 3,331 |
|
| $ | (3,854 | ) |
| $ | 2,433 |
|
| $ | 14 |
|
| $ | 2,447 |
| ||||||||||||||||||||||||||||||||||||||||||||
Comprehensive income (loss): |
|
|
|
|
|
|
|
|
|
|
|
|
|
|
|
|
|
|
|
|
|
|
|
|
|
|
|
|
|
|
|
|
|
|
|
|
|
|
|
|
|
|
|
| ||||||||||||||||||||||||||||||||||||||||||||
Net income |
|
| — |
|
|
| — |
|
|
| — |
|
|
| — |
|
|
| — |
|
|
| — |
|
|
| 370 |
|
|
| — |
|
|
| 370 |
|
|
| — |
|
|
| 370 |
| ||||||||||||||||||||||||||||||||||||||||||||
Other comprehensive income (loss), net of tax |
|
| — |
|
|
| — |
|
|
| — |
|
|
| — |
|
|
| — |
|
|
| 48 |
|
|
| — |
|
|
| — |
|
|
| 48 |
|
|
| — |
|
|
| 48 |
| ||||||||||||||||||||||||||||||||||||||||||||
Total comprehensive income (loss) |
|
| — |
|
|
| — |
|
|
| — |
|
|
| — |
|
|
| — |
|
|
| — |
|
|
| — |
|
|
| — |
|
|
| 418 |
|
|
| — |
|
|
| 418 |
| ||||||||||||||||||||||||||||||||||||||||||||
Cash dividends: |
|
|
|
|
|
|
|
|
|
|
|
|
|
|
|
|
|
|
|
|
|
|
|
|
|
|
|
|
|
|
|
|
|
|
|
|
|
|
|
|
|
|
|
| ||||||||||||||||||||||||||||||||||||||||||||
Common stock ($.16 per share) |
|
| — |
|
|
| — |
|
|
| — |
|
|
| — |
|
|
| — |
|
|
| — |
|
|
| (29 | ) |
|
| — |
|
|
| (29 | ) |
|
| — |
|
|
| (29 | ) | ||||||||||||||||||||||||||||||||||||||||||||
Dividend equivalent units related to employee stock-based compensation plans |
|
| — |
|
|
| — |
|
|
| — |
|
|
| — |
|
|
| — |
|
|
| — |
|
|
| (2 | ) |
|
| — |
|
|
| (2 | ) |
|
| — |
|
|
| (2 | ) | ||||||||||||||||||||||||||||||||||||||||||||
Issuance of common shares |
|
| 3,624,586 |
|
|
| — |
|
|
| 3,624,586 |
|
|
| — |
|
|
| 19 |
|
|
| — |
|
|
| — |
|
|
| — |
|
|
| 19 |
|
|
| — |
|
|
| 19 |
| ||||||||||||||||||||||||||||||||||||||||||||
Stock-based compensation expense |
|
| — |
|
|
| — |
|
|
| — |
|
|
| — |
|
|
| 10 |
|
|
| — |
|
|
| — |
|
|
| — |
|
|
| 10 |
|
|
| — |
|
|
| 10 |
| ||||||||||||||||||||||||||||||||||||||||||||
Common stock repurchased |
|
| — |
|
|
| (8,178,100 | ) |
|
| (8,178,100 | ) |
|
| — |
|
|
| — |
|
|
| — |
|
|
| — |
|
|
| (100 | ) |
|
| (100 | ) |
|
| — |
|
|
| (100 | ) | ||||||||||||||||||||||||||||||||||||||||||||
Shares repurchased related to employee stock-based compensation plans |
|
| — |
|
|
| (2,235,658 | ) |
|
| (2,235,658 | ) |
|
| — |
|
|
| — |
|
|
| — |
|
|
| — |
|
|
| (26 | ) |
|
| (26 | ) |
|
| — |
|
|
| (26 | ) | ||||||||||||||||||||||||||||||||||||||||||||
Balance at March 31, 2021 |
|
| 457,403,561 |
|
|
| (277,890,279 | ) |
|
| 179,513,282 |
|
| $ | 4 |
|
| $ | 3,255 |
|
| $ | (226 | ) |
| $ | 3,670 |
|
| $ | (3,980 | ) |
| $ | 2,723 |
|
| $ | 14 |
|
| $ | 2,737 |
| ||||||||||||||||||||||||||||||||||||||||||||
|
|
|
|
|
|
|
|
|
|
|
|
|
|
|
|
|
|
|
|
|
|
|
|
|
|
|
|
|
|
|
|
|
|
|
|
|
|
|
|
|
|
|
|
|
| Issued |
|
| Treasury |
|
| Outstanding |
|
| Stock |
|
| Capital |
|
| Income (Loss) |
|
| Earnings |
|
| Stock |
|
| Equity |
|
| Interest |
|
| Equity |
| |||||||||||
Balance at December 31, 2021 |
|
| 458,629,384 |
|
|
| (304,886,613 | ) |
|
| 153,742,771 |
|
| $ | 4 |
|
| $ | 3,282 |
|
| $ | (133 | ) |
| $ | 3,939 |
|
| $ | (4,495 | ) |
| $ | 2,597 |
|
| $ | 11 |
|
| $ | 2,608 |
|
|
| 458,629,384 |
|
|
| (304,886,613 | ) |
|
| 153,742,771 |
|
| $ | 4 |
|
| $ | 3,282 |
|
| $ | (133 | ) |
| $ | 3,939 |
|
| $ | (4,495 | ) |
| $ | 2,597 |
|
| $ | 11 |
|
| $ | 2,608 |
|
Comprehensive income (loss): |
|
|
|
|
|
|
|
|
|
|
|
|
|
|
|
|
|
|
|
|
|
|
|
|
|
|
|
|
|
|
|
|
|
|
|
|
|
|
|
|
|
|
|
|
|
|
|
|
|
|
|
|
|
|
|
|
|
|
|
|
|
|
|
|
|
|
|
|
|
|
|
|
|
|
|
|
| |||||||||||
Net income |
|
| — |
|
|
| — |
|
|
| — |
|
|
| — |
|
|
| — |
|
|
| — |
|
|
| 255 |
|
|
| — |
|
|
| 255 |
|
|
| — |
|
|
| 255 |
|
|
| — |
|
|
| — |
|
|
| — |
|
|
| — |
|
|
| — |
|
|
| — |
|
|
| 255 |
|
|
| — |
|
|
| 255 |
|
|
| — |
|
|
| 255 |
|
Other comprehensive income (loss), net of tax |
|
| — |
|
|
| — |
|
|
| — |
|
|
| — |
|
|
| — |
|
|
| 114 |
|
|
| — |
|
|
| — |
|
|
| 114 |
|
|
| — |
|
|
| 114 |
| ||||||||||||||||||||||||||||||||||||||||||||
Other comprehensive income |
|
| — |
|
|
| — |
|
|
| — |
|
|
| — |
|
|
| — |
|
|
| 114 |
|
|
| — |
|
|
| — |
|
|
| 114 |
|
|
| — |
|
|
| 114 |
| ||||||||||||||||||||||||||||||||||||||||||||
Total comprehensive income (loss) |
|
| — |
|
|
| — |
|
|
| — |
|
|
| — |
|
|
| — |
|
|
| — |
|
|
| — |
|
|
| — |
|
|
| 369 |
|
|
| — |
|
|
| 369 |
|
|
| — |
|
|
| — |
|
|
| — |
|
|
| — |
|
|
| — |
|
|
| — |
|
|
| — |
|
|
| — |
|
|
| 369 |
|
|
| — |
|
|
| 369 |
|
Cash dividends: |
|
| — |
|
|
|
|
|
|
|
|
|
|
|
|
|
|
|
|
|
|
|
|
|
|
|
|
|
|
|
|
|
|
|
|
|
|
|
|
|
|
|
|
|
|
|
|
|
|
|
|
|
|
|
|
|
|
|
|
|
|
|
|
|
|
|
|
|
|
|
|
|
|
|
|
|
| |||||||||||
Common stock ($.16 per share) |
|
| — |
|
|
| — |
|
|
| — |
|
|
| — |
|
|
| — |
|
|
| — |
|
|
| (24 | ) |
|
| — |
|
|
| (24 | ) |
|
| — |
|
|
| (24 | ) | ||||||||||||||||||||||||||||||||||||||||||||
Common stock ($.16 per share) |
|
| — |
|
|
| — |
|
|
| — |
|
|
| — |
|
|
| — |
|
|
| — |
|
|
| (24 | ) |
|
| — |
|
|
| (24 | ) |
|
| — |
|
|
| (24 | ) | ||||||||||||||||||||||||||||||||||||||||||||
Dividend equivalent units related to employee stock-based compensation plans |
|
| — |
|
|
| — |
|
|
| — |
|
|
| — |
|
|
| — |
|
|
| — |
|
|
| (3 | ) |
|
| — |
|
|
| (3 | ) |
|
| — |
|
|
| (3 | ) |
|
| — |
|
|
| — |
|
|
| — |
|
|
| — |
|
|
| — |
|
|
| — |
|
|
| (3 | ) |
|
| — |
|
|
| (3 | ) |
|
| — |
|
|
| (3 | ) |
Issuance of common shares |
|
| 2,359,901 |
|
|
| — |
|
|
| 2,359,901 |
|
|
| — |
|
|
| 11 |
|
|
| — |
|
|
| — |
|
|
| — |
|
|
| 11 |
|
|
| — |
|
|
| 11 |
|
|
| 2,359,901 |
|
|
| — |
|
|
| 2,359,901 |
|
|
| — |
|
|
| 11 |
|
|
| — |
|
|
| — |
|
|
| — |
|
|
| 11 |
|
|
| — |
|
|
| 11 |
|
Stock-based compensation expense |
|
| — |
|
|
| — |
|
|
| — |
|
|
| — |
|
|
| 9 |
|
|
| — |
|
|
| — |
|
|
| — |
|
|
| 9 |
|
|
| — |
|
|
| 9 |
|
|
| — |
|
|
| — |
|
|
| — |
|
|
| — |
|
|
| 9 |
|
|
| — |
|
|
| — |
|
|
| — |
|
|
| 9 |
|
|
| — |
|
|
| 9 |
|
Common stock repurchased |
|
| — |
|
|
| (6,247,437 | ) |
|
| (6,247,437 | ) |
|
| — |
|
|
| — |
|
|
| — |
|
|
| — |
|
|
| (115 | ) |
|
| (115 | ) |
|
| — |
|
|
| (115 | ) |
|
| — |
|
|
| (6,247,437 | ) |
|
| (6,247,437 | ) |
|
| — |
|
|
| — |
|
|
| — |
|
|
| — |
|
|
| (115 | ) |
|
| (115 | ) |
|
| — |
|
|
| (115 | ) |
Shares repurchased related to employee stock-based compensation plans |
|
| — |
|
|
| (1,110,584 | ) |
|
| (1,110,584 | ) |
|
| — |
|
|
| — |
|
|
| — |
|
|
| — |
|
|
| (20 | ) |
|
| (20 | ) |
|
| — |
|
|
| (20 | ) |
|
| — |
|
|
| (1,110,584 | ) |
|
| (1,110,584 | ) |
|
| — |
|
|
| — |
|
|
| — |
|
|
| — |
|
|
| (20 | ) |
|
| (20 | ) |
|
| — |
|
|
| (20 | ) |
Net activity in noncontrolling interest |
|
| — |
|
|
| — |
|
|
| — |
|
|
| — |
|
|
| — |
|
|
| — |
|
|
| — |
|
|
| — |
|
|
| — |
|
|
| (5 | ) |
|
| (5 | ) |
|
| — |
|
|
| — |
|
|
| — |
|
|
| — |
|
|
| — |
|
|
| — |
|
|
| — |
|
|
| — |
|
|
| — |
|
|
| (5 | ) |
|
| (5 | ) |
Balance at March 31, 2022 |
|
| 460,989,285 |
|
|
| (312,244,634 | ) |
|
| 148,744,651 |
|
| $ | 4 |
|
| $ | 3,302 |
|
| $ | (19 | ) |
| $ | 4,167 |
|
| $ | (4,630 | ) |
| $ | 2,824 |
|
| $ | 6 |
|
| $ | 2,830 |
|
|
| 460,989,285 |
|
|
| (312,244,634 | ) |
|
| 148,744,651 |
|
| $ | 4 |
|
| $ | 3,302 |
|
| $ | (19 | ) |
| $ | 4,167 |
|
| $ | (4,630 | ) |
| $ | 2,824 |
|
| $ | 6 |
|
| $ | 2,830 |
|
|
|
|
|
|
|
|
|
|
|
|
|
|
|
|
|
|
|
|
|
|
|
|
|
|
|
|
|
|
|
|
|
|
| |||||||||||||||||||||||||||||||||||||||||||||||||||||||
Balance at December 31, 2022 |
|
| 461,087,590 |
|
|
| (330,878,152 | ) |
|
| 130,209,438 |
|
| $ | 4 |
|
| $ | 3,313 |
|
| $ | 87 |
|
| $ | 4,490 |
|
| $ | (4,917 | ) |
| $ | 2,977 |
|
| $ | — |
|
| $ | 2,977 |
| ||||||||||||||||||||||||||||||||||||||||||||
Comprehensive income (loss): |
|
|
|
|
|
|
|
|
|
|
|
|
|
|
|
|
|
|
|
|
|
|
|
|
|
|
|
|
|
|
|
|
| |||||||||||||||||||||||||||||||||||||||||||||||||||||||
Net income |
|
| — |
|
|
| — |
|
|
| — |
|
|
| — |
|
|
| — |
|
|
| — |
|
|
| 111 |
|
|
| — |
|
|
| 111 |
|
|
| — |
|
|
| 111 |
| ||||||||||||||||||||||||||||||||||||||||||||
Other comprehensive income |
|
| — |
|
|
| — |
|
|
| — |
|
|
| — |
|
|
| — |
|
|
| (21 | ) |
|
| — |
|
|
| — |
|
|
| (21 | ) |
|
| — |
|
|
| (21 | ) | ||||||||||||||||||||||||||||||||||||||||||||
Total comprehensive income (loss) |
|
| — |
|
|
| — |
|
|
| — |
|
|
| — |
|
|
| — |
|
|
| — |
|
|
| — |
|
|
| — |
|
|
| 90 |
|
|
| — |
|
|
| 90 |
| ||||||||||||||||||||||||||||||||||||||||||||
Cash dividends: |
|
| — |
|
|
|
|
|
|
|
|
|
|
|
|
|
|
|
|
|
|
|
|
|
|
|
|
|
|
|
|
|
|
| ||||||||||||||||||||||||||||||||||||||||||||||||||||||
Common stock ($.16 per share) |
|
| — |
|
|
| — |
|
|
| — |
|
|
| — |
|
|
| — |
|
|
| — |
|
|
| (21 | ) |
|
| — |
|
|
| (21 | ) |
|
| — |
|
|
| (21 | ) | ||||||||||||||||||||||||||||||||||||||||||||
Dividend equivalent units related to |
|
| — |
|
|
| — |
|
|
| — |
|
|
| — |
|
|
| — |
|
|
| — |
|
|
| (1 | ) |
|
| — |
|
|
| (1 | ) |
|
| — |
|
|
| (1 | ) | ||||||||||||||||||||||||||||||||||||||||||||
Issuance of common shares |
|
| 2,420,932 |
|
|
| — |
|
|
| 2,420,932 |
|
|
| — |
|
|
| 13 |
|
|
| — |
|
|
| — |
|
|
| — |
|
|
| 13 |
|
|
| — |
|
|
| 13 |
| ||||||||||||||||||||||||||||||||||||||||||||
Stock-based compensation expense |
|
| — |
|
|
| — |
|
|
| — |
|
|
| — |
|
|
| 9 |
|
|
| — |
|
|
| — |
|
|
| — |
|
|
| 9 |
|
|
| — |
|
|
| 9 |
| ||||||||||||||||||||||||||||||||||||||||||||
Common stock repurchased |
|
| — |
|
|
| (4,888,812 | ) |
|
| (4,888,812 | ) |
|
| — |
|
|
| — |
|
|
| — |
|
|
| — |
|
|
| (85 | ) |
|
| (85 | ) |
|
| — |
|
|
| (85 | ) | ||||||||||||||||||||||||||||||||||||||||||||
Shares repurchased related to |
|
| — |
|
|
| (1,276,713 | ) |
|
| (1,276,713 | ) |
|
| — |
|
|
| — |
|
|
| — |
|
|
| — |
|
|
| (23 | ) |
|
| (23 | ) |
|
| — |
|
|
| (23 | ) | ||||||||||||||||||||||||||||||||||||||||||||
Other |
|
| — |
|
|
| — |
|
|
| — |
|
|
| — |
|
|
| — |
|
|
| — |
|
|
| — |
|
|
| (1 | ) |
|
| (1 | ) |
|
| — |
|
|
| (1 | ) | ||||||||||||||||||||||||||||||||||||||||||||
Balance at March 31, 2023 |
|
| 463,508,522 |
|
|
| (337,043,677 | ) |
|
| 126,464,845 |
|
| $ | 4 |
|
| $ | 3,335 |
|
| $ | 66 |
|
| $ | 4,579 |
|
| $ | (5,026 | ) |
| $ | 2,958 |
|
| $ | — |
|
| $ | 2,958 |
| ||||||||||||||||||||||||||||||||||||||||||||
See accompanying notes to consolidated financial statements.
45
NAVIENT CORPORATION
CONSOLIDATED STATEMENTS OF CASH FLOWS
(In millions)
(Unaudited)
|
| Three Months Ended March 31, |
|
| Three Months Ended March 31, |
| ||||||||||
|
| 2022 |
|
| 2021 |
|
| 2023 |
|
| 2022 |
| ||||
Cash flows from operating activities |
|
|
|
|
|
|
|
|
|
|
|
|
|
| ||
Net income |
| $ | 255 |
|
| $ | 370 |
|
| $ | 111 |
|
| $ | 255 |
|
Adjustments to reconcile net income to net cash (used in) provided by operating activities: |
|
|
|
|
|
|
|
| ||||||||
(Gains) on sales of education loans |
|
| — |
|
|
| (76 | ) | ||||||||
Adjustments to reconcile net income to net cash provided by (used in) operating activities: |
|
|
|
|
|
| ||||||||||
Goodwill and acquired intangible asset impairment and amortization expense |
|
| 4 |
|
|
| 5 |
|
|
| 3 |
|
|
| 4 |
|
Stock-based compensation expense |
|
| 9 |
|
|
| 10 |
|
|
| 9 |
|
|
| 9 |
|
Mark-to-market (gains) losses on derivative and hedging activities, net |
|
| (314 | ) |
|
| (198 | ) |
|
| 65 |
|
|
| (314 | ) |
Provisions for loan losses |
|
| 16 |
|
|
| (87 | ) |
|
| (14 | ) |
|
| 16 |
|
Decrease in accrued interest receivable |
|
| 48 |
|
|
| 80 |
| ||||||||
(Decrease) in accrued interest payable |
|
| (15 | ) |
|
| (45 | ) | ||||||||
(Increase) decrease in accrued interest receivable |
|
| (12 | ) |
|
| 48 |
| ||||||||
Decrease in accrued interest payable |
|
| (49 | ) |
|
| (15 | ) | ||||||||
Decrease in other assets |
|
| 174 |
|
|
| 111 |
|
|
| 58 |
|
|
| 174 |
|
(Decrease) increase in other liabilities |
|
| (286 | ) |
|
| 9 |
| ||||||||
Decrease in other liabilities |
|
| (26 | ) |
|
| (286 | ) | ||||||||
Total adjustments |
|
| (364 | ) |
|
| (191 | ) |
|
| 34 |
|
|
| (364 | ) |
Net cash (used in) provided by operating activities |
|
| (109 | ) |
|
| 179 |
| ||||||||
Net cash provided by (used in) operating activities |
|
| 145 |
|
|
| (109 | ) | ||||||||
Cash flows from investing activities |
|
|
|
|
|
|
|
|
|
|
|
|
|
| ||
Education loans originated and acquired |
|
| (1,091 | ) |
|
| (1,734 | ) |
|
| (274 | ) |
|
| (1,091 | ) |
Proceeds from payments on education loans |
|
| 2,789 |
|
|
| 3,009 |
|
|
| 2,118 |
|
|
| 2,789 |
|
Proceeds from sales of education loans |
|
| — |
|
|
| 1,588 |
| ||||||||
Other investing activities, net |
|
| 53 |
|
|
| 22 |
|
|
| 4 |
|
|
| 53 |
|
Net cash provided by investing activities |
|
| 1,751 |
|
|
| 2,885 |
|
|
| 1,848 |
|
|
| 1,751 |
|
Cash flows from financing activities |
|
|
|
|
|
|
|
|
|
|
|
|
|
| ||
Borrowings collateralized by loans in trust - issued |
|
| 995 |
|
|
| 1,828 |
|
|
| — |
|
|
| 995 |
|
Borrowings collateralized by loans in trust - repaid |
|
| (3,296 | ) |
|
| (2,846 | ) |
|
| (3,047 | ) |
|
| (3,296 | ) |
Asset-backed commercial paper conduits, net |
|
| 391 |
|
|
| (1,735 | ) |
|
| 189 |
|
|
| 391 |
|
Long-term unsecured notes issued |
|
| — |
|
|
| 495 |
| ||||||||
Long-term unsecured notes repaid |
|
| — |
|
|
| (78 | ) |
|
| (1,001 | ) |
|
| — |
|
Other financing activities, net |
|
| 43 |
|
|
| (34 | ) |
|
| (57 | ) |
|
| 43 |
|
Common stock repurchased |
|
| (115 | ) |
|
| (100 | ) |
|
| (85 | ) |
|
| (115 | ) |
Common dividends paid |
|
| (24 | ) |
|
| (29 | ) |
|
| (21 | ) |
|
| (24 | ) |
Net cash used in financing activities |
|
| (2,006 | ) |
|
| (2,499 | ) |
|
| (4,022 | ) |
|
| (2,006 | ) |
Net (decrease) increase in cash, cash equivalents, restricted cash and restricted cash equivalents |
|
| (364 | ) |
|
| 565 |
| ||||||||
Net decrease in cash, cash equivalents, restricted cash and restricted cash equivalents |
|
| (2,029 | ) |
|
| (364 | ) | ||||||||
Cash, cash equivalents, restricted cash and restricted cash equivalents at beginning of period |
|
| 3,578 |
|
|
| 3,537 |
|
|
| 4,807 |
|
|
| 3,578 |
|
Cash, cash equivalents, restricted cash and restricted cash equivalents at end of period |
| $ | 3,214 |
|
| $ | 4,102 |
|
| $ | 2,778 |
|
| $ | 3,214 |
|
Supplemental disclosure of cash flow information: |
|
|
|
|
|
|
|
|
|
|
|
|
|
| ||
Cash disbursements made (refunds received) for: |
|
|
|
|
|
|
|
|
|
|
|
|
|
| ||
Interest paid |
| $ | 300 |
|
| $ | 362 |
|
| $ | 845 |
|
| $ | 300 |
|
Income taxes paid |
| $ | 5 |
|
| $ | 1 |
|
| $ | 6 |
|
| $ | 5 |
|
Income taxes refunds received |
| $ | (4 | ) |
| $ | — |
|
| $ | (2 | ) |
| $ | (4 | ) |
Noncash activity: |
|
|
|
|
|
|
|
| ||||||||
Investing activity - Held-to-maturity asset backed securities retained related to sales of education loans |
| $ | — |
|
| $ | 53 |
| ||||||||
Operating activity - Servicing assets recognized upon sales of education loans |
| $ | — |
|
| $ | 20 |
| ||||||||
|
|
|
|
|
|
|
|
| ||||||||
Reconciliation of the Consolidated Statements of Cash Flows to the Consolidated Balance Sheets: |
|
|
|
|
|
|
|
|
|
|
|
|
|
| ||
Cash and cash equivalents |
| $ | 708 |
|
| $ | 1,497 |
|
| $ | 570 |
|
| $ | 708 |
|
Restricted cash and restricted cash equivalents |
|
| 2,506 |
|
|
| 2,605 |
|
|
| 2,208 |
|
|
| 2,506 |
|
Total cash, cash equivalents, restricted cash and restricted cash equivalents at end of period |
| $ | 3,214 |
|
| $ | 4,102 |
|
| $ | 2,778 |
|
| $ | 3,214 |
|
See accompanying notes to consolidated financial statements.
46
NAVIENT CORPORATION
NOTES TO CONSOLIDATED FINANCIAL STATEMENTS
(Information at March 31, 20222023 and for the three months ended
March 31, 20222023 and 20212022 is unaudited)
1.
1.Significant Accounting Policies
Basis of Presentation
The accompanying unaudited, consolidated financial statements of Navient have been prepared in accordance with generally accepted accounting principles in the United States of America (GAAP) for interim financial information. Accordingly, they do not include all of the information and footnotes required by GAAP for complete consolidated financial statements. The consolidated financial statements include the accounts of Navient and its majority-owned and controlled subsidiaries and those Variable Interest Entities (VIEs) for which we are the primary beneficiary, after eliminating the effects of intercompany accounts and transactions. In the opinion of management, all adjustments considered necessary for a fair statement of the results for the interim periods have been included. The preparation of financial statements in conformity with GAAP requires management to make estimates and assumptions that affect the amounts reported in the consolidated financial statements and accompanying notes. Actual results could differ from those estimates. Operating results for the three months ended March 31, 20222023 are not necessarily indicative of the results for the year ending December 31, 20212022 or for any other period. These unaudited financial statements should be read in conjunction with the audited financial statements and related notes included in our Annual Report on Form 10-K for the year ended December 31, 20212022 (the 20212022 Form 10-K). Definitions for certain capitalized terms used but not otherwise defined in this Quarterly Report on Form 10-Q can be found in our 20212022 Form 10-K.
Recently Issued Accounting Pronouncements
Effective in 2020 and Forward
Rate Reform
In March 2020 (and as amended in December 2022), the FASB issued ASU No. 2020-04, “Reference Rate Reform: Facilitation of the Effects of Reference Rate Reform on Financial Reporting,” which provides optional temporary relief for companies who are preparing for the discontinuation of interest rates indexed to the London Interbank Offered Rate (LIBOR). The ASU provides companies with guidance in the form of expedients and exceptions related to contract modifications and hedge accounting to ease the burden of and simplify the accounting associated with transitioning away from LIBOR. Modifications of qualifying contracts are accounted for as the continuation of an existing contract rather than as a new contract. Modifications of qualifying hedging relationships will not require discontinuation of the existing hedge accounting relationships. One-month and three-month LIBOR will be discontinued after June 30, 2023. Our instruments that are indexed to one-month and three-month LIBOR will be indexed to SOFR after that date. There is $13 billion of debt as of March 31, 2023, that is in either a fair value or cash flow hedge relationship using LIBOR swaps. We will use the hedge accounting expedients in this ASU when those swaps transition to SOFR. As a result, these hedges will not result in the discontinuation of the existing hedge accounting relationships.
47
NAVIENT CORPORATION
NOTES TO CONSOLIDATED FINANCIAL STATEMENTS
(Information at March 31, 2023 and for the three months ended
March 31, 2023 and 2022 is unaudited)
1.Significant Accounting Policies (Continued)
Troubled Debt Restructurings
In March 2022, the FASB issued ASU No. 2022-02, “Financial Instruments – Credit Losses: Troubled Debt Restructurings and Vintage Disclosures,” which eliminates the troubled debt restructurings (TDRs) recognition and measurement guidance and instead requires an entity to evaluate whether the modification represents a new loan or a continuation of an existing loan. The ASU also enhances the disclosure requirements for certain modifications of receivables made to borrowers experiencing financial difficulty. This guidance iswas effective on January 1, 2023. Early adoption is permissible. The Company is currently assessingPrior to adopting this new guidance on January 1, 2023, as it relates to interest rate concessions granted as part of our Private Education Loan modification program, a discounted cash flow model was used to calculate the potential impactamount of interest forgiven for loans that were in the program and the present value of that interest rate concession was included as a part of the allowance for loan loss. This new guidance no longer requires the measurement and recognition of this amendment. element of our allowance for loan loss for new modifications that occur subsequent to January 1, 2023. As of December 31, 2022, the allowance for loan loss included $77 million related to this interest rate concession component of the allowance for loan loss. We elected to adopt this amendment using a prospective transition method which results in the $77 million releasing in 2023 and 2024 as the borrowers exit their current modification programs. $52 million of the $77 million was released in first-quarter 2023.
2. Allowance for Loan Losses
Allowance for Loan Losses Roll Forward
|
| Three Months Ended March 31, 2023 |
| |||||||||
(Dollars in millions) |
| FFELP |
|
| Private |
|
| Total |
| |||
Allowance at beginning of period |
| $ | 222 |
|
| $ | 800 |
|
| $ | 1,022 |
|
Total provision |
|
| 10 |
|
|
| (24 | ) |
|
| (14 | ) |
Charge-offs: |
|
|
|
|
|
|
|
|
| |||
Gross charge-offs |
|
| (18 | ) |
|
| (88 | ) |
|
| (106 | ) |
Expected future recoveries on current period gross charge-offs |
|
| — |
|
|
| 13 |
|
|
| 13 |
|
Net charge-offs(1) |
|
| (18 | ) |
|
| (75 | ) |
|
| (93 | ) |
Decrease in expected future recoveries on previously fully |
|
| — |
|
|
| 5 |
|
|
| 5 |
|
Allowance at end of period |
| $ | 214 |
|
| $ | 706 |
|
| $ | 920 |
|
Net charge-offs as a percentage of average loans in repayment |
|
| .22 | % |
|
| 1.63 | % |
|
|
| |
Ending total loans |
| $ | 42,362 |
|
| $ | 18,981 |
|
|
|
| |
Average loans in repayment |
| $ | 34,305 |
|
| $ | 18,552 |
|
|
|
| |
Ending loans in repayment |
| $ | 33,740 |
|
| $ | 18,258 |
|
|
|
| |
|
| Three Months Ended March 31, |
| |
(Dollars in millions) |
| 2023 |
| |
Beginning of period expected future recoveries on previously fully charged-off loans |
| $ | 274 |
|
Expected future recoveries of current period defaults |
|
| 13 |
|
Recoveries (cash collected) |
|
| (13 | ) |
Charge-offs (as a result of lower recovery expectations) |
|
| (6 | ) |
End of period expected future recoveries on previously fully charged-off loans |
|
| 268 |
|
Change in balance during period |
| $ | (5 | ) |
4748
NAVIENT CORPORATION
NOTES TO CONSOLIDATED FINANCIAL STATEMENTS
(Information at March 31, 20222023 and for the three months ended
March 31, 20222023 and 20212022 is unaudited)
2. Allowance for Loan Losses (Continued)
Allowance
|
| Three Months Ended March 31, 2022 |
| |||||||||
(Dollars in millions) |
| FFELP Loans |
|
| Private Education Loans |
|
| Total |
| |||
Allowance at beginning of period |
| $ | 262 |
|
| $ | 1,009 |
|
| $ | 1,271 |
|
Total provision |
|
| — |
|
|
| 16 |
|
|
| 16 |
|
Charge-offs: |
|
|
|
|
|
|
|
|
| |||
Gross charge-offs |
|
| (7 | ) |
|
| (81 | ) |
|
| (88 | ) |
Expected future recoveries on current period gross charge-offs |
|
| — |
|
|
| 12 |
|
|
| 12 |
|
Net charge-offs(1) |
|
| (7 | ) |
|
| (69 | ) |
|
| (76 | ) |
Decrease in expected future recoveries on previously fully |
|
| — |
|
|
| 8 |
|
|
| 8 |
|
Allowance at end of period |
| $ | 255 |
|
| $ | 964 |
|
| $ | 1,219 |
|
Net charge-offs as a percentage of average loans in repayment |
|
| .07 | % |
|
| 1.38 | % |
|
|
| |
Ending total loans |
| $ | 51,268 |
|
| $ | 21,052 |
|
|
|
| |
Average loans in repayment |
| $ | 43,125 |
|
| $ | 20,387 |
|
|
|
| |
Ending loans in repayment |
| $ | 42,724 |
|
| $ | 20,257 |
|
|
|
| |
|
| Three Months Ended March 31, 2022 |
| |||||||||
(Dollars in millions) |
| FFELP Loans |
|
| Private Education Loans |
|
| Total |
| |||
Allowance at beginning of period |
| $ | 262 |
|
| $ | 1,009 |
|
| $ | 1,271 |
|
Total provision |
|
| — |
|
|
| 16 |
|
|
| 16 |
|
Charge-offs(1) |
|
| (7 | ) |
|
| (69 | ) |
|
| (76 | ) |
Decrease in expected future recoveries on charged-off loans(2) |
|
| — |
|
|
| 8 |
|
|
| 8 |
|
Allowance at end of period |
|
| 255 |
|
|
| 964 |
|
|
| 1,219 |
|
Plus: expected future recoveries on charged-off loans(2) |
|
| — |
|
|
| 321 |
|
|
| 321 |
|
Allowance at end of period excluding expected future recoveries on charged-off loans(3) |
| $ | 255 |
|
| $ | 1,285 |
|
| $ | 1,540 |
|
Charge-offs as a percentage of average loans in repayment (annualized) |
|
| .07 | % |
|
| 1.38 | % |
|
|
|
|
Allowance coverage of charge-offs (annualized)(3) |
|
| 8.8 |
|
|
| 4.6 |
|
|
|
|
|
Allowance as a percentage of the ending total loan balance(3) |
|
| .5 | % |
|
| 6.1 | % |
|
|
|
|
Allowance as a percentage of ending loans in repayment(3) |
|
| .6 | % |
|
| 6.3 | % |
|
|
|
|
Ending total loans |
| $ | 51,268 |
|
| $ | 21,052 |
|
|
|
|
|
Average loans in repayment |
| $ | 43,125 |
|
| $ | 20,387 |
|
|
|
|
|
Ending loans in repayment |
| $ | 42,724 |
|
| $ | 20,257 |
|
|
|
|
|
|
| |||||||||||||||||||||||||||||||||||||||||||||
|
|
|
| Three Months Ended March 31, |
| |
(Dollars in millions) |
| 2022 |
| |
Beginning of period expected recoveries |
| $ | 329 |
|
Expected future recoveries of current period defaults(1) |
|
| 12 |
|
Recoveries(2) |
|
| (15 | ) |
Charge-offs(3) |
|
| (5 | ) |
End of period expected recoveries |
| $ | 321 |
|
Change in balance during period |
| $ | (8 | ) |
49 |
|
48
NAVIENT CORPORATION
NOTES TO CONSOLIDATED FINANCIAL STATEMENTS
(Information at March 31, 20222023 and for the three months ended
March 31, 20222023 and 20212022 is unaudited)
2. Allowance for Loan Losses (Continued)
Key Credit Quality Indicators
We assess and determine the collectability of our education loan portfolios by evaluating certain risk characteristics we refer to as key credit quality indicators. Key credit quality indicators are incorporated into the allowance for loan losses calculation.
FFELP Loans
FFELP Loans are substantially insured and guaranteed as to their principal and accrued interest in the event of default. The key credit quality indicators are loan status and loan type.
|
| Three Months Ended March 31, 2021 |
| |||||||||
(Dollars in millions) |
| FFELP Loans |
|
| Private Education Loans |
|
| Total |
| |||
Allowance at beginning of period |
| $ | 288 |
|
| $ | 1,089 |
|
| $ | 1,377 |
|
Provision: |
|
|
|
|
|
|
|
|
|
|
|
|
Reversal of allowance related to loan sales(1) |
|
| — |
|
|
| (102 | ) |
|
| (102 | ) |
Remaining provision |
|
| — |
|
|
| 15 |
|
|
| 15 |
|
Total provision |
|
| — |
|
|
| (87 | ) |
|
| (87 | ) |
Charge-offs(2) |
|
| (6 | ) |
|
| (35 | ) |
|
| (41 | ) |
Decrease in expected future recoveries on charged-off loans(3) |
|
| — |
|
|
| 25 |
|
|
| 25 |
|
Allowance at end of period |
|
| 282 |
|
|
| 992 |
|
|
| 1,274 |
|
Plus: expected future recoveries on charged-off loans(3) |
|
| — |
|
|
| 454 |
|
|
| 454 |
|
Allowance at end of period excluding expected future recoveries on charged-off loans(4) |
| $ | 282 |
|
| $ | 1,446 |
|
| $ | 1,728 |
|
Charge-offs as a percentage of average loans in repayment (annualized) |
|
| .06 | % |
|
| .68 | % |
|
|
|
|
Allowance coverage of charge-offs(4) |
|
| 10.7 |
|
|
| 10.2 |
|
|
|
|
|
Allowance as a percentage of the ending total loan balance(4) |
|
| .5 | % |
|
| 7.0 | % |
|
|
|
|
Allowance as a percentage of ending loans in repayment(4) |
|
| .6 | % |
|
| 7.4 | % |
|
|
|
|
Ending total loans |
| $ | 57,155 |
|
| $ | 20,734 |
|
|
|
|
|
Average loans in repayment |
| $ | 47,044 |
|
| $ | 20,883 |
|
|
|
|
|
Ending loans in repayment |
| $ | 45,922 |
|
| $ | 19,480 |
|
|
|
|
|
|
| FFELP Loan Delinquencies |
| |||||||||||||||||||||
|
| March 31, 2023 |
|
| December 31, 2022 |
|
| March 31, 2022 |
| |||||||||||||||
(Dollars in millions) |
| Balance |
|
| % |
|
| Balance |
|
| % |
|
| Balance |
|
| % |
| ||||||
Loans in-school/grace/deferment(1) |
| $ | 1,778 |
|
|
|
|
| $ | 1,772 |
|
|
|
|
| $ | 2,232 |
|
|
|
| |||
Loans in forbearance(2) |
|
| 6,844 |
|
|
|
|
|
| 7,603 |
|
|
|
|
|
| 6,312 |
|
|
|
| |||
Loans in repayment and percentage of each status: |
|
|
|
|
|
|
|
|
|
|
|
|
|
|
|
|
|
| ||||||
Loans current |
|
| 28,886 |
|
|
| 85.6 | % |
|
| 29,004 |
|
|
| 84.4 | % |
|
| 36,948 |
|
|
| 86.5 | % |
Loans delinquent 31-60 days(3) |
|
| 1,270 |
|
|
| 3.8 |
|
|
| 1,247 |
|
|
| 3.6 |
|
|
| 1,888 |
|
|
| 4.4 |
|
Loans delinquent 61-90 days(3) |
|
| 902 |
|
|
| 2.7 |
|
|
| 833 |
|
|
| 2.4 |
|
|
| 1,148 |
|
|
| 2.7 |
|
Loans delinquent greater than 90 days(3) |
|
| 2,682 |
|
|
| 7.9 |
|
|
| 3,288 |
|
|
| 9.6 |
|
|
| 2,740 |
|
|
| 6.4 |
|
Total FFELP Loans in repayment |
|
| 33,740 |
|
|
| 100 | % |
|
| 34,372 |
|
|
| 100 | % |
|
| 42,724 |
|
|
| 100 | % |
Total FFELP Loans |
|
| 42,362 |
|
|
|
|
|
| 43,747 |
|
|
|
|
|
| 51,268 |
|
|
|
| |||
FFELP Loan allowance for losses |
|
| (214 | ) |
|
|
|
|
| (222 | ) |
|
|
|
|
| (255 | ) |
|
|
| |||
FFELP Loans, net |
| $ | 42,148 |
|
|
|
|
| $ | 43,525 |
|
|
|
|
| $ | 51,013 |
|
|
|
| |||
Percentage of FFELP Loans in repayment |
|
|
|
|
| 79.6 | % |
|
|
|
|
| 78.6 | % |
|
|
|
|
| 83.3 | % | |||
Delinquencies as a percentage of FFELP Loans in |
|
|
|
|
| 14.4 | % |
|
|
|
|
| 15.6 | % |
|
|
|
|
| 13.5 | % | |||
FFELP Loans in forbearance as a percentage of |
|
|
|
|
| 16.9 | % |
|
|
|
|
| 18.1 | % |
|
|
|
|
| 12.9 | % | |||
Loan type:
|
| ||||||||||||||||||||||||||||||||||||||||||||||||||||||||||||||||||||||||||||||
|
|
|
|
|
| Three Months Ended March 31, |
| |
(Dollars in millions) |
| 2021 |
| |
Beginning of period expected recoveries |
| $ | 479 |
|
Expected future recoveries of current period defaults |
|
| 5 |
|
Recoveries |
|
| (25 | ) |
Charge-offs |
|
| (5 | ) |
End of period expected recoveries |
| $ | 454 |
|
Change in balance during period |
| $ | (25 | ) |
|
|
4950
NAVIENT CORPORATION
NOTES TO CONSOLIDATED FINANCIAL STATEMENTS
(Information at March 31, 20222023 and for the three months ended
March 31, 20222023 and 20212022 is unaudited)
2. Allowance for Loan Losses (Continued)
Troubled Debt RestructuringsPrivate Education Loans
The key credit quality indicators are credit scores (FICO scores), loan status, loan seasoning, certain loan modifications, the existence of a cosigner and school type. The FICO score is the higher of the borrower or co-borrower score and is updated at least every six months while school type is assessed at origination. The other Private Education Loan key quality indicators are updated quarterly.
|
| Private Education Loan Credit Quality Indicators by Origination Year |
| |||||||||||||||||||||||||||||
|
| March 31, 2023 |
| |||||||||||||||||||||||||||||
(Dollars in millions) |
| 2023 |
|
| 2022 |
|
| 2021 |
|
| 2020 |
|
| 2019 |
|
| Prior |
|
| Total |
|
| % of Total |
| ||||||||
Credit Quality |
|
|
|
|
|
|
|
|
|
|
|
|
|
|
|
|
|
|
|
|
|
|
|
| ||||||||
FICO Scores: |
|
|
|
|
|
|
|
|
|
|
|
|
|
|
|
|
|
|
|
|
|
|
|
| ||||||||
640 and above |
| $ | 167 |
|
| $ | 1,761 |
|
| $ | 4,368 |
|
| $ | 1,438 |
|
| $ | 1,353 |
|
| $ | 8,133 |
|
| $ | 17,220 |
|
|
| 91 | % |
Below 640 |
|
| 3 |
|
|
| 40 |
|
|
| 92 |
|
|
| 24 |
|
|
| 43 |
|
|
| 1,559 |
|
|
| 1,761 |
|
|
| 9 |
|
Total |
| $ | 170 |
|
| $ | 1,801 |
|
| $ | 4,460 |
|
| $ | 1,462 |
|
| $ | 1,396 |
|
| $ | 9,692 |
|
| $ | 18,981 |
|
|
| 100 | % |
Loan Status: |
|
|
|
|
|
|
|
|
|
|
|
|
|
|
|
|
|
|
|
|
|
|
|
| ||||||||
In-school/grace/ |
| $ | 9 |
|
| $ | 67 |
|
| $ | 91 |
|
| $ | 27 |
|
| $ | 31 |
|
| $ | 498 |
|
| $ | 723 |
|
|
| 4 | % |
Current/90 days or |
|
| 161 |
|
|
| 1,729 |
|
|
| 4,360 |
|
|
| 1,432 |
|
|
| 1,359 |
|
|
| 8,853 |
|
|
| 17,894 |
|
|
| 94 |
|
Greater than 90 days |
|
| — |
|
|
| 5 |
|
|
| 9 |
|
|
| 3 |
|
|
| 6 |
|
|
| 341 |
|
|
| 364 |
|
|
| 2 |
|
Total |
| $ | 170 |
|
| $ | 1,801 |
|
| $ | 4,460 |
|
| $ | 1,462 |
|
| $ | 1,396 |
|
| $ | 9,692 |
|
| $ | 18,981 |
|
|
| 100 | % |
Seasoning(1): |
|
|
|
|
|
|
|
|
|
|
|
|
|
|
|
|
|
|
|
|
|
|
|
| ||||||||
1-12 payments |
| $ | 161 |
|
| $ | 1,386 |
|
| $ | 80 |
|
| $ | 9 |
|
| $ | 8 |
|
| $ | 71 |
|
| $ | 1,715 |
|
|
| 9 | % |
13-24 payments |
|
| — |
|
|
| 362 |
|
|
| 4,084 |
|
|
| 32 |
|
|
| 23 |
|
|
| 86 |
|
|
| 4,587 |
|
|
| 24 |
|
25-36 payments |
|
| — |
|
|
| — |
|
|
| 242 |
|
|
| 1,251 |
|
|
| 106 |
|
|
| 157 |
|
|
| 1,756 |
|
|
| 9 |
|
37-48 payments |
|
| — |
|
|
| — |
|
|
| — |
|
|
| 155 |
|
|
| 1,190 |
|
|
| 272 |
|
|
| 1,617 |
|
|
| 9 |
|
More than 48 |
|
| — |
|
|
| — |
|
|
| — |
|
|
| — |
|
|
| 53 |
|
|
| 8,884 |
|
|
| 8,937 |
|
|
| 47 |
|
Loans in-school/ |
|
| 9 |
|
|
| 53 |
|
|
| 54 |
|
|
| 15 |
|
|
| 16 |
|
|
| 222 |
|
|
| 369 |
|
|
| 2 |
|
Total |
| $ | 170 |
|
| $ | 1,801 |
|
| $ | 4,460 |
|
| $ | 1,462 |
|
| $ | 1,396 |
|
| $ | 9,692 |
|
| $ | 18,981 |
|
|
| 100 | % |
Certain Loan |
|
|
|
|
|
|
|
|
|
|
|
|
|
|
|
|
|
|
|
|
|
|
|
| ||||||||
Modified |
| $ | — |
|
| $ | 14 |
|
| $ | 89 |
|
| $ | 38 |
|
| $ | 72 |
|
| $ | 6,279 |
|
| $ | 6,492 |
|
|
| 34 | % |
Non-Modified |
|
| 170 |
|
|
| 1,787 |
|
|
| 4,371 |
|
|
| 1,424 |
|
|
| 1,324 |
|
|
| 3,413 |
|
|
| 12,489 |
|
|
| 66 |
|
Total |
| $ | 170 |
|
| $ | 1,801 |
|
| $ | 4,460 |
|
| $ | 1,462 |
|
| $ | 1,396 |
|
| $ | 9,692 |
|
| $ | 18,981 |
|
|
| 100 | % |
Cosigners: |
|
|
|
|
|
|
|
|
|
|
|
|
|
|
|
|
|
|
|
|
|
|
|
| ||||||||
With cosigner(3) |
| $ | 35 |
|
| $ | 189 |
|
| $ | 103 |
|
| $ | 26 |
|
| $ | 9 |
|
| $ | 5,894 |
|
| $ | 6,256 |
|
|
| 33 | % |
Without cosigner |
|
| 135 |
|
|
| 1,612 |
|
|
| 4,357 |
|
|
| 1,436 |
|
|
| 1,387 |
|
|
| 3,798 |
|
|
| 12,725 |
|
|
| 67 |
|
Total |
| $ | 170 |
|
| $ | 1,801 |
|
| $ | 4,460 |
|
| $ | 1,462 |
|
| $ | 1,396 |
|
| $ | 9,692 |
|
| $ | 18,981 |
|
|
| 100 | % |
School Type: |
|
|
|
|
|
|
|
|
|
|
|
|
|
|
|
|
|
|
|
|
|
|
|
| ||||||||
Not-for-profit |
| $ | 158 |
|
| $ | 1,704 |
|
| $ | 4,202 |
|
| $ | 1,397 |
|
| $ | 1,300 |
|
| $ | 8,150 |
|
| $ | 16,911 |
|
|
| 89 | % |
For-profit |
|
| 12 |
|
|
| 97 |
|
|
| 258 |
|
|
| 65 |
|
|
| 96 |
|
|
| 1,542 |
|
|
| 2,070 |
|
|
| 11 |
|
Total |
| $ | 170 |
|
| $ | 1,801 |
|
| $ | 4,460 |
|
| $ | 1,462 |
|
| $ | 1,396 |
|
| $ | 9,692 |
|
| $ | 18,981 |
|
|
| 100 | % |
Allowance for loan |
|
|
|
|
|
|
|
|
|
|
|
|
|
|
|
|
|
|
|
| (706 | ) |
|
|
| |||||||
Total loans, net |
|
|
|
|
|
|
|
|
|
|
|
|
|
|
|
|
|
|
| $ | 18,275 |
|
|
|
| |||||||
|
|
|
|
|
|
|
|
|
|
|
|
|
|
|
|
|
|
|
|
|
|
|
|
| ||||||||
1Q-23 Net Charge-Offs |
| $ | — |
|
| $ | (2 | ) |
| $ | (2 | ) |
| $ | (1 | ) |
| $ | (2 | ) |
| $ | (68 | ) |
| $ | (75 | ) |
|
| 100 | % |
51
NAVIENT CORPORATION
NOTES TO CONSOLIDATED FINANCIAL STATEMENTS
(Information at March 31, 2023 and for the three months ended
March 31, 2023 and 2022 is unaudited)
2. Allowance for Loan Losses (Continued)
|
| Private Education Loan Credit Quality Indicators by Origination Year |
| |||||||||||||||||||||||||||||
|
| March 31, 2022 |
| |||||||||||||||||||||||||||||
(Dollars in millions) |
| 2022 |
|
| 2021 |
|
| 2020 |
|
| 2019 |
|
| 2018 |
|
| Prior |
|
| Total |
|
| % of Total |
| ||||||||
Credit Quality |
|
|
|
|
|
|
|
|
|
|
|
|
|
|
|
|
|
|
|
|
|
|
|
| ||||||||
FICO Scores: |
|
|
|
|
|
|
|
|
|
|
|
|
|
|
|
|
|
|
|
|
|
|
|
| ||||||||
640 and above |
| $ | 948 |
|
| $ | 5,037 |
|
| $ | 1,783 |
|
| $ | 1,683 |
|
| $ | 626 |
|
| $ | 9,314 |
|
| $ | 19,391 |
|
|
| 92 | % |
Below 640 |
|
| 8 |
|
|
| 44 |
|
|
| 16 |
|
|
| 37 |
|
|
| 21 |
|
|
| 1,535 |
|
| $ | 1,661 |
|
|
| 8 |
|
Total |
| $ | 956 |
|
| $ | 5,081 |
|
| $ | 1,799 |
|
| $ | 1,720 |
|
| $ | 647 |
|
| $ | 10,849 |
|
| $ | 21,052 |
|
|
| 100 | % |
Loan Status: |
|
|
|
|
|
|
|
|
|
|
|
|
|
|
|
|
|
|
|
|
|
|
|
| ||||||||
In-school/grace/ |
| $ | 5 |
|
| $ | 64 |
|
| $ | 25 |
|
| $ | 34 |
|
| $ | 13 |
|
| $ | 654 |
|
| $ | 795 |
|
|
| 4 | % |
Current/90 days or |
|
| 951 |
|
|
| 5,015 |
|
|
| 1,772 |
|
|
| 1,684 |
|
|
| 632 |
|
|
| 9,889 |
|
| $ | 19,943 |
|
|
| 95 |
|
Greater than 90 days |
|
| — |
|
|
| 2 |
|
|
| 2 |
|
|
| 2 |
|
|
| 2 |
|
|
| 306 |
|
|
| 314 |
|
|
| 1 |
|
Total |
| $ | 956 |
|
| $ | 5,081 |
|
| $ | 1,799 |
|
| $ | 1,720 |
|
| $ | 647 |
|
| $ | 10,849 |
|
| $ | 21,052 |
|
|
| 100 | % |
Seasoning(1): |
|
|
|
|
|
|
|
|
|
|
|
|
|
|
|
|
|
|
|
|
|
|
|
| ||||||||
1-12 payments |
| $ | 951 |
|
| $ | 4,740 |
|
| $ | 26 |
|
| $ | 17 |
|
| $ | 3 |
|
| $ | 115 |
|
| $ | 5,852 |
|
|
| 28 | % |
13-24 payments |
|
| — |
|
|
| 300 |
|
|
| 1,555 |
|
|
| 108 |
|
|
| 11 |
|
|
| 134 |
|
| $ | 2,108 |
|
|
| 10 |
|
25-36 payments |
|
| — |
|
|
| — |
|
|
| 201 |
|
|
| 1,507 |
|
|
| 46 |
|
|
| 225 |
|
| $ | 1,979 |
|
|
| 9 |
|
37-48 payments |
|
| — |
|
|
| — |
|
|
| — |
|
|
| 68 |
|
|
| 545 |
|
|
| 369 |
|
| $ | 982 |
|
|
| 5 |
|
More than 48 |
|
| — |
|
|
| — |
|
|
| — |
|
|
| — |
|
|
| 35 |
|
|
| 9,719 |
|
| $ | 9,754 |
|
|
| 46 |
|
Loans in-school/ |
|
| 5 |
|
|
| 41 |
|
|
| 17 |
|
|
| 20 |
|
|
| 7 |
|
|
| 287 |
|
|
| 377 |
|
|
| 2 |
|
Total |
| $ | 956 |
|
| $ | 5,081 |
|
| $ | 1,799 |
|
| $ | 1,720 |
|
| $ | 647 |
|
| $ | 10,849 |
|
| $ | 21,052 |
|
|
| 100 | % |
Certain Loan |
|
|
|
|
|
|
|
|
|
|
|
|
|
|
|
|
|
|
|
|
|
|
|
| ||||||||
Modified |
| $ | — |
|
| $ | 9 |
|
| $ | 15 |
|
| $ | 43 |
|
| $ | 28 |
|
| $ | 6,998 |
|
| $ | 7,093 |
|
|
| 34 | % |
Non-Modified |
|
| 956 |
|
|
| 5,072 |
|
|
| 1,784 |
|
|
| 1,677 |
|
|
| 619 |
|
|
| 3,851 |
|
|
| 13,959 |
|
|
| 66 |
|
Total |
| $ | 956 |
|
| $ | 5,081 |
|
| $ | 1,799 |
|
| $ | 1,720 |
|
| $ | 647 |
|
| $ | 10,849 |
|
| $ | 21,052 |
|
|
| 100 | % |
Cosigners: |
|
|
|
|
|
|
|
|
|
|
|
|
|
|
|
|
|
|
|
|
|
|
|
| ||||||||
With cosigner(3) |
| $ | 11 |
|
| $ | 97 |
|
| $ | 31 |
|
| $ | 11 |
|
| $ | — |
|
| $ | 6,994 |
|
| $ | 7,144 |
|
|
| 34 | % |
Without cosigner |
|
| 945 |
|
|
| 4,984 |
|
|
| 1,768 |
|
|
| 1,709 |
|
|
| 647 |
|
|
| 3,855 |
|
|
| 13,908 |
|
|
| 66 |
|
Total |
| $ | 956 |
|
| $ | 5,081 |
|
| $ | 1,799 |
|
| $ | 1,720 |
|
| $ | 647 |
|
| $ | 10,849 |
|
| $ | 21,052 |
|
|
| 100 | % |
School Type: |
|
|
|
|
|
|
|
|
|
|
|
|
|
|
|
|
|
|
|
|
|
|
|
| ||||||||
Not-for-profit |
| $ | 893 |
|
| $ | 4,786 |
|
| $ | 1,719 |
|
| $ | 1,602 |
|
| $ | 595 |
|
| $ | 9,048 |
|
| $ | 18,643 |
|
|
| 89 | % |
For-profit |
|
| 63 |
|
|
| 295 |
|
|
| 80 |
|
|
| 118 |
|
|
| 52 |
|
|
| 1,801 |
|
|
| 2,409 |
|
|
| 11 |
|
Total |
| $ | 956 |
|
| $ | 5,081 |
|
| $ | 1,799 |
|
| $ | 1,720 |
|
| $ | 647 |
|
| $ | 10,849 |
|
| $ | 21,052 |
|
|
| 100 | % |
Allowance for loan |
|
|
|
|
|
|
|
|
|
|
|
|
|
|
|
|
|
|
|
| (964 | ) |
|
|
| |||||||
Total loans, net |
|
|
|
|
|
|
|
|
|
|
|
|
|
|
|
|
|
|
| $ | 20,088 |
|
|
|
| |||||||
52
NAVIENT CORPORATION
NOTES TO CONSOLIDATED FINANCIAL STATEMENTS
(Information at March 31, 2023 and for the three months ended
March 31, 2023 and 2022 is unaudited)
2. Allowance for Loan Losses (Continued)
|
| Private Education Loan Delinquencies |
| |||||||||||||||||||||
|
| March 31, 2023 |
|
| December 31, 2022 |
|
| March 31, 2022 |
| |||||||||||||||
(Dollars in millions) |
| Balance |
|
| % |
|
| Balance |
|
| % |
|
| Balance |
|
| % |
| ||||||
Loans in-school/grace/deferment(1) |
| $ | 369 |
|
|
|
|
| $ | 354 |
|
|
|
|
| $ | 377 |
|
|
|
| |||
Loans in forbearance(2) |
|
| 354 |
|
|
|
|
|
| 401 |
|
|
|
|
|
| 418 |
|
|
|
| |||
Loans in repayment and percentage of each status: |
|
|
|
|
|
|
|
|
|
|
|
|
|
|
|
|
|
| ||||||
Loans current |
|
| 17,439 |
|
|
| 95.5 | % |
|
| 17,838 |
|
|
| 95.0 | % |
|
| 19,447 |
|
|
| 96.0 | % |
Loans delinquent 31-60 days(3) |
|
| 290 |
|
|
| 1.6 |
|
|
| 335 |
|
|
| 1.8 |
|
|
| 290 |
|
|
| 1.4 |
|
Loans delinquent 61-90 days(3) |
|
| 165 |
|
|
| .9 |
|
|
| 186 |
|
|
| 1.0 |
|
|
| 206 |
|
|
| 1.0 |
|
Loans delinquent greater than 90 days(3) |
|
| 364 |
|
|
| 2.0 |
|
|
| 411 |
|
|
| 2.2 |
|
|
| 314 |
|
|
| 1.6 |
|
Total loans in repayment |
|
| 18,258 |
|
|
| 100 | % |
|
| 18,770 |
|
|
| 100 | % |
|
| 20,257 |
|
|
| 100 | % |
Total loans |
|
| 18,981 |
|
|
|
|
|
| 19,525 |
|
|
|
|
|
| 21,052 |
|
|
|
| |||
Allowance for losses |
|
| (706 | ) |
|
|
|
|
| (800 | ) |
|
|
|
|
| (964 | ) |
|
|
| |||
Loans, net |
| $ | 18,275 |
|
|
|
|
| $ | 18,725 |
|
|
|
|
| $ | 20,088 |
|
|
|
| |||
Percentage of loans in repayment |
|
|
|
|
| 96.2 | % |
|
|
|
|
| 96.1 | % |
|
|
|
|
| 96.2 | % | |||
Delinquencies as a percentage of loans in |
|
|
|
|
| 4.5 | % |
|
|
|
|
| 5.0 | % |
|
|
|
|
| 4.0 | % | |||
Loans in forbearance as a percentage of loans in |
|
|
|
|
| 1.9 | % |
|
|
|
|
| 2.1 | % |
|
|
|
|
| 2.0 | % | |||
53
NAVIENT CORPORATION
NOTES TO CONSOLIDATED FINANCIAL STATEMENTS
(Information at March 31, 2023 and for the three months ended
March 31, 2023 and 2022 is unaudited)
2. Allowance for Loan Losses (Continued)
Loan Modifications to Borrowers Experiencing Financial Difficulty
We sometimes modifyadjust the terms of Private Education Loans for certain borrowers when we believe such changes will help our customers better manage their student loan obligations, achieve better outcomes and increase the collectability of the loans. These changes generally take the form of a temporary interest rate reduction, a temporary forbearance of payments, a temporary interest only payment, and a temporary interest rate reduction with a permanent extension of the loan term. The effect of most modifications of loans for customersmade to borrowers who are experiencing financial difficulty.difficulty is already included in the allowance for credit losses because of the measurement methodologies used to estimate the allowance. The model design predicts borrowers that will have financial difficulty in the future and require loan modification and increased life of loan default risk.
Under our current forbearance practices, temporary hardship forbearance of payments generally cannot exceed 12 months over the life of the loan. However, exceptions can be made in cases where borrowers have shown the ability to make a substantial number of monthly principal and interest payments and in those cases borrowers can be granted up to 24 months of hardship forbearance over the life of the loan. We offer other administrative forbearances (e.g., death and disability, bankruptcy, military service, and disaster forbearance) that are either required by law (such as the Servicemembers Civil Relief Act) or are considered separate from our active loss mitigation programs and therefore are not considered to be loan modifications requiring disclosure under ASU No. 2022-02.
FFELP loans are at least 97 percent guaranteed as to their principal and accrued interest by the federal government in the event of default and, therefore, we do not deem FFELP loans as nonperforming from a credit risk perspective at any point in their life cycle prior to claim payment and continue to accrue interest on those loans through the date of claim. Further, FFELP loan modification events are either legal entitlements subject to regulatory-driven eligibility criteria or addressed in the promissory note terms, so we do not consider these events as a component of our loan modification programs.
The following table shows the amortized cost basis as of March 31, 2023 of the loans to borrowers experiencing financial difficulty that were modified in first-quarter 2023.
|
| Loan Modifications Made to Borrowers Experiencing Financial Difficulty |
| |||||||||||||||||||||
(Dollars in millions) |
| Interest Rate Reductions(1) |
|
| More Than an Insignificant Payment Delay (2) |
|
| Combination Rate Reduction and Term Extension |
| |||||||||||||||
Loan Type |
| Amortized Cost |
|
| % of Loan Type |
|
| Amortized Cost |
|
| % of Loan Type |
|
| Amortized Cost |
|
| % of Loan Type |
| ||||||
Private Education |
| $ | 611 |
|
|
| 3.2 | % |
| $ | 275 |
|
|
| 1.4 | % |
| $ | 46 |
|
|
| .2 | % |
For those loans modified in first-quarter 2023, the following table shows the impact of such modification.
Loan Type | Interest Rate Reductions | More Than an Insignificant Payment Delay | Combination Rate Reduction and Term Extension |
Private Education Loans | Reduced the weighted average contractual rate from 12.9% to 4.9% | Added an average 6 months to the remaining life of the loans | Added an average 8 years to the remaining life of the loans and reduced the weighted average contractual rate from |
54
NAVIENT CORPORATION
NOTES TO CONSOLIDATED FINANCIAL STATEMENTS
(Information at March 31, 2023 and for the three months ended
March 31, 2023 and 2022 is unaudited)
2. Allowance for Loan Losses (Continued)
The following table provides the amount of loans whose borrowers were experiencing financial difficulty, were modified during first-quarter 2023 and subsequently had a payment default in first-quarter 2023. We define payment default as 60 days past due for purposes of this disclosure. We closely monitor performance of the loans to borrowers experiencing financial difficulty that are modified to understand the effectiveness of the modification efforts.
(Dollars in millions) |
|
|
| |||||
Loan Type |
| Modified Loans |
|
| Payment Default (Par) |
| ||
Private Education Loans(1) |
| $ | 2 |
|
| $ | 2 |
|
The following table provides the performance and related loan status as of March 31, 2023 of loans that were modified in first-quarter 2023.
(Dollars in millions) |
|
|
| |||
Loan Type: |
|
|
|
|
| |
Private Education Loans(1) |
| Status |
| Payment status (Amortized Cost) |
| |
|
| Loans in School/Deferment |
| $ | 2 |
|
|
| Loans in Forbearance |
|
| 22 |
|
|
| Loans current |
|
| 891 |
|
|
| Loans delinquent 31 - 60 days |
|
| 8 |
|
|
| Loans delinquent 61 - 90 days |
|
| 2 |
|
|
| Loans delinquent greater than 90 days |
|
| 7 |
|
|
| Total Modified Loans |
| $ | 932 |
|
Prior to our adoption of ASU 2022-02 on January 1, 2023, we accounted for a modification to the contractual terms of a loan that resulted in granting a concession to a borrower experiencing financial difficulties as a TDR. Certain Private Education Loans for which we have granted either a forbearance of greater than three months, an interest rate reduction or an extended repayment plan arewere classified as TDRs. Approximately 75% of the loans granted forbearance have qualified as a TDR loan at both March 31, 2022 and December 31, 2021. The unpaid principal balance of TDR loans that were in an interest rate reduction program as of March 31, 2022 and December 31, 2021 was $838 million and $831 million, respectively.
The following table provides the amount of loans modified in the periodsperiod presented that resulted in a TDR. Additionally, the table summarizes charge-offs occurring in the TDR portfolio, as well as TDRs for which a payment default occurred in the current period within 12 months of the loan first being designated as a TDR. We define payment default as 60 days past due for this disclosure.
|
| Three Months Ended March 31, |
|
| Three Months Ended March 31, |
| ||||||
(Dollars in millions) |
| 2022 |
|
| 2021 |
|
| 2022 |
| |||
Modified loans |
| $ | 55 |
|
| $ | 40 |
|
| $ | 55 |
|
Charge-offs |
| $ | 56 |
|
| $ | 26 |
|
| $ | 56 |
|
Payment default |
| $ | 9 |
|
| $ | 5 |
|
| $ | 9 |
|
5055
NAVIENT CORPORATION
NOTES TO CONSOLIDATED FINANCIAL STATEMENTS
(Information at March 31, 20222023 and for the three months ended
March 31, 20222023 and 20212022 is unaudited)
2. Allowance for Loan Losses (Continued)
Key Credit Quality Indicators
We assess and determine the collectability of our education loan portfolios by evaluating certain risk characteristics we refer to as key credit quality indicators. Key credit quality indicators are incorporated into the allowance for loan losses calculation.
FFELP Loans
FFELP Loans are substantially insured and guaranteed as to their principal and accrued interest in the event of default. The key credit quality indicators are loan status and loan type.
|
| FFELP Loan Delinquencies |
| |||||||||||||||||||||
|
| March 31, 2022 |
|
| December 31, 2021 |
|
| March 31, 2021 |
| |||||||||||||||
(Dollars in millions) |
| Balance |
|
| % |
|
| Balance |
|
| % |
|
| Balance |
|
| % |
| ||||||
Loans in-school/grace/deferment(1) |
| $ | 2,232 |
|
|
|
|
|
| $ | 2,220 |
|
|
|
|
|
| $ | 2,781 |
|
|
|
|
|
Loans in forbearance(2) |
|
| 6,312 |
|
|
|
|
|
|
| 6,292 |
|
|
|
|
|
|
| 8,452 |
|
|
|
|
|
Loans in repayment and percentage of each status: |
|
|
|
|
|
|
|
|
|
|
|
|
|
|
|
|
|
|
|
|
|
|
|
|
Loans current |
|
| 36,948 |
|
|
| 86.5 | % |
|
| 39,679 |
|
|
| 89.4 | % |
|
| 42,127 |
|
|
| 91.7 | % |
Loans delinquent 31-60 days(3) |
|
| 1,888 |
|
|
| 4.4 |
|
|
| 1,696 |
|
|
| 3.8 |
|
|
| 1,377 |
|
|
| 3.0 |
|
Loans delinquent 61-90 days(3) |
|
| 1,148 |
|
|
| 2.7 |
|
|
| 904 |
|
|
| 2.0 |
|
|
| 813 |
|
|
| 1.8 |
|
Loans delinquent greater than 90 days(3) |
|
| 2,740 |
|
|
| 6.4 |
|
|
| 2,112 |
|
|
| 4.8 |
|
|
| 1,605 |
|
|
| 3.5 |
|
Total FFELP Loans in repayment |
|
| 42,724 |
|
|
| 100 | % |
|
| 44,391 |
|
|
| 100 | % |
|
| 45,922 |
|
|
| 100 | % |
Total FFELP Loans |
|
| 51,268 |
|
|
|
|
|
|
| 52,903 |
|
|
|
|
|
|
| 57,155 |
|
|
|
|
|
FFELP Loan allowance for losses |
|
| (255 | ) |
|
|
|
|
|
| (262 | ) |
|
|
|
|
|
| (282 | ) |
|
|
|
|
FFELP Loans, net |
| $ | 51,013 |
|
|
|
|
|
| $ | 52,641 |
|
|
|
|
|
| $ | 56,873 |
|
|
|
|
|
Percentage of FFELP Loans in repayment |
|
|
|
|
|
| 83.3 | % |
|
|
|
|
|
| 83.9 | % |
|
|
|
|
|
| 80.3 | % |
Delinquencies as a percentage of FFELP Loans in repayment |
|
|
|
|
|
| 13.5 | % |
|
|
|
|
|
| 10.6 | % |
|
|
|
|
| �� | 8.3 | % |
FFELP Loans in forbearance as a percentage of loans in repayment and forbearance |
|
|
|
|
|
| 12.9 | % |
|
|
|
|
|
| 12.4 | % |
|
|
|
|
|
| 15.5 | % |
|
|
|
|
|
|
|
Loan type:
(Dollars in millions) |
| March 31, 2022 |
|
| March 31, 2021 |
|
| Change |
| |||
Stafford Loans |
| $ | 15,975 |
|
| $ | 17,327 |
|
| $ | (1,352 | ) |
Consolidation Loans |
|
| 30,665 |
|
|
| 34,961 |
|
|
| (4,296 | ) |
Rehab Loans |
|
| 4,628 |
|
|
| 4,867 |
|
|
| (239 | ) |
Total loans, gross |
| $ | 51,268 |
|
| $ | 57,155 |
|
| $ | (5,887 | ) |
3. Borrowings
The following table summarizes our borrowings.
|
| March 31, 2023 |
|
| December 31, 2022 |
| ||||||||||||||||||
(Dollars in millions) |
| Short |
|
| Long |
|
| Total |
|
| Short |
|
| Long |
|
| Total |
| ||||||
Unsecured borrowings: |
|
|
|
|
|
|
|
|
|
|
|
|
|
|
|
|
|
| ||||||
Senior unsecured debt(1) |
| $ | 1,149 |
|
| $ | 4,864 |
|
| $ | 6,013 |
|
| $ | 1,301 |
|
| $ | 5,711 |
|
| $ | 7,012 |
|
Total unsecured borrowings |
|
| 1,149 |
|
|
| 4,864 |
|
|
| 6,013 |
|
|
| 1,301 |
|
|
| 5,711 |
|
|
| 7,012 |
|
Secured borrowings: |
|
|
|
|
|
|
|
|
|
|
|
|
|
|
|
|
|
| ||||||
FFELP Loan securitizations(2)(3) |
|
| 68 |
|
|
| 40,275 |
|
|
| 40,343 |
|
|
| 76 |
|
|
| 42,675 |
|
|
| 42,751 |
|
Private Education Loan securitizations(4) |
|
| 648 |
|
|
| 12,187 |
|
|
| 12,835 |
|
|
| 725 |
|
|
| 12,744 |
|
|
| 13,469 |
|
FFELP Loan ABCP facilities |
|
| 887 |
|
|
| 428 |
|
|
| 1,315 |
|
|
| 923 |
|
|
| 386 |
|
|
| 1,309 |
|
Private Education Loan ABCP facilities |
|
| 2,917 |
|
|
| — |
|
|
| 2,917 |
|
|
| 2,734 |
|
|
| — |
|
|
| 2,734 |
|
Other(5) |
|
| 105 |
|
|
| — |
|
|
| 105 |
|
|
| 121 |
|
|
| — |
|
|
| 121 |
|
Total secured borrowings |
|
| 4,625 |
|
|
| 52,890 |
|
|
| 57,515 |
|
|
| 4,579 |
|
|
| 55,805 |
|
|
| 60,384 |
|
Total before hedge accounting adjustments |
|
| 5,774 |
|
|
| 57,754 |
|
|
| 63,528 |
|
|
| 5,880 |
|
|
| 61,516 |
|
|
| 67,396 |
|
Hedge accounting adjustments |
|
| (21 | ) |
|
| (366 | ) |
|
| (387 | ) |
|
| (10 | ) |
|
| (490 | ) |
|
| (500 | ) |
Total |
| $ | 5,753 |
|
| $ | 57,388 |
|
| $ | 63,141 |
|
| $ | 5,870 |
|
| $ | 61,026 |
|
| $ | 66,896 |
|
51
56
NAVIENT CORPORATION
NOTES TO CONSOLIDATED FINANCIAL STATEMENTS
(Information at March 31, 20222023 and for the three months ended
March 31, 20222023 and 20212022 is unaudited)
2. Allowance for Loan Losses (Continued)
Private Education Loans
The key credit quality indicators are credit scores (FICO scores), loan status, loan seasoning, whether a loan is a TDR, the existence of a cosigner and school type. The FICO score is the higher of the borrower or co-borrower score and is updated at least every six months while school type is assessed at origination. The other Private Education Loan key quality indicators are updated quarterly.
|
| Private Education Loan Credit Quality Indicators by Origination Year |
| |||||||||||||||||||||||||||||
|
| March 31, 2022 |
| |||||||||||||||||||||||||||||
(Dollars in millions) |
| March 31, 2022 |
|
| 2021 |
|
| 2020 |
|
| 2019 |
|
| 2018 |
|
| Prior |
|
| Total |
|
| % of Total |
| ||||||||
Credit Quality Indicators |
|
|
|
|
|
|
|
|
|
|
|
|
|
|
|
|
|
|
|
|
|
|
|
|
|
|
|
|
|
|
|
|
FICO Scores: |
|
|
|
|
|
|
|
|
|
|
|
|
|
|
|
|
|
|
|
|
|
|
|
|
|
|
|
|
|
|
|
|
640 and above |
| $ | 948 |
|
| $ | 5,037 |
|
| $ | 1,783 |
|
| $ | 1,683 |
|
| $ | 626 |
|
| $ | 9,314 |
|
| $ | 19,391 |
|
|
| 92 | % |
Below 640 |
|
| 8 |
|
|
| 44 |
|
|
| 16 |
|
|
| 37 |
|
|
| 21 |
|
|
| 1,535 |
|
| $ | 1,661 |
|
|
| 8 |
|
Total |
| $ | 956 |
|
| $ | 5,081 |
|
| $ | 1,799 |
|
| $ | 1,720 |
|
| $ | 647 |
|
| $ | 10,849 |
|
| $ | 21,052 |
|
|
| 100 | % |
Loan Status: |
|
|
|
|
|
|
|
|
|
|
|
|
|
|
|
|
|
|
|
|
|
|
|
|
|
|
|
|
|
|
|
|
In-school/grace/ deferment/forbearance |
| $ | 5 |
|
| $ | 64 |
|
| $ | 25 |
|
| $ | 34 |
|
| $ | 13 |
|
| $ | 654 |
|
| $ | 795 |
|
|
| 4 | % |
Current/90 days or less delinquent |
|
| 951 |
|
|
| 5,015 |
|
|
| 1,772 |
|
|
| 1,684 |
|
|
| 632 |
|
|
| 9,889 |
|
| $ | 19,943 |
|
|
| 95 |
|
Greater than 90 days delinquent |
|
| — |
|
|
| 2 |
|
|
| 2 |
|
|
| 2 |
|
|
| 2 |
|
|
| 306 |
|
|
| 314 |
|
|
| 1 |
|
Total |
| $ | 956 |
|
| $ | 5,081 |
|
| $ | 1,799 |
|
| $ | 1,720 |
|
| $ | 647 |
|
| $ | 10,849 |
|
| $ | 21,052 |
|
|
| 100 | % |
Seasoning(1): |
|
|
|
|
|
|
|
|
|
|
|
|
|
|
|
|
|
|
|
|
|
|
|
|
|
|
|
|
|
|
|
|
1-12 payments |
| $ | 951 |
|
| $ | 4,740 |
|
| $ | 26 |
|
| $ | 17 |
|
| $ | 3 |
|
| $ | 115 |
|
| $ | 5,852 |
|
|
| 28 | % |
13-24 payments |
|
| — |
|
|
| 300 |
|
|
| 1,555 |
|
|
| 108 |
|
|
| 11 |
|
|
| 134 |
|
| $ | 2,108 |
|
| 10 |
| |
25-36 payments |
|
| — |
|
|
| — |
|
|
| 201 |
|
|
| 1,507 |
|
|
| 46 |
|
|
| 225 |
|
| $ | 1,979 |
|
|
| 9 |
|
37-48 payments |
|
| — |
|
|
| — |
|
|
| — |
|
|
| 68 |
|
|
| 545 |
|
|
| 369 |
|
| $ | 982 |
|
| 5 |
| |
More than 48 payments |
|
| — |
|
|
| — |
|
|
| — |
|
|
| — |
|
|
| 35 |
|
|
| 9,719 |
|
| $ | 9,754 |
|
|
| 46 |
|
Loans in-school/ grace/deferment |
|
| 5 |
|
|
| 41 |
|
|
| 17 |
|
|
| 20 |
|
|
| 7 |
|
|
| 287 |
|
|
| 377 |
|
| 2 |
| |
Total |
| $ | 956 |
|
| $ | 5,081 |
|
| $ | 1,799 |
|
| $ | 1,720 |
|
| $ | 647 |
|
| $ | 10,849 |
|
| $ | 21,052 |
|
|
| 100 | % |
TDR Status: |
|
|
|
|
|
|
|
|
|
|
|
|
|
|
|
|
|
|
|
|
|
|
|
|
|
|
|
|
|
|
|
|
TDR |
| $ | — |
|
| $ | 9 |
|
| $ | 15 |
|
| $ | 43 |
|
| $ | 28 |
|
| $ | 6,998 |
|
| $ | 7,093 |
|
|
| 34 | % |
Non-TDR |
|
| 956 |
|
|
| 5,072 |
|
|
| 1,784 |
|
|
| 1,677 |
|
|
| 619 |
|
|
| 3,851 |
|
|
| 13,959 |
|
|
| 66 |
|
Total |
| $ | 956 |
|
| $ | 5,081 |
|
| $ | 1,799 |
|
| $ | 1,720 |
|
| $ | 647 |
|
| $ | 10,849 |
|
| $ | 21,052 |
|
|
| 100 | % |
Cosigners: |
|
|
|
|
|
|
|
|
|
|
|
|
|
|
|
|
|
|
|
|
|
|
|
|
|
|
|
|
|
|
|
|
With cosigner(2) |
| $ | 11 |
|
| $ | 97 |
|
| $ | 31 |
|
| $ | 11 |
|
| $ | — |
|
| $ | 6,994 |
|
| $ | 7,144 |
|
|
| 34 | % |
Without cosigner |
|
| 945 |
|
|
| 4,984 |
|
|
| 1,768 |
|
|
| 1,709 |
|
|
| 647 |
|
|
| 3,855 |
|
|
| 13,908 |
|
|
| 66 |
|
Total |
| $ | 956 |
|
| $ | 5,081 |
|
| $ | 1,799 |
|
| $ | 1,720 |
|
| $ | 647 |
|
| $ | 10,849 |
|
| $ | 21,052 |
|
|
| 100 | % |
School Type: |
|
|
|
|
|
|
|
|
|
|
|
|
|
|
|
|
|
|
|
|
|
|
|
|
|
|
|
|
|
|
|
|
Not-for-profit |
| $ | 893 |
|
| $ | 4,786 |
|
| $ | 1,719 |
|
| $ | 1,602 |
|
| $ | 595 |
|
| $ | 9,048 |
|
| $ | 18,643 |
|
|
| 89 | % |
For-profit |
|
| 63 |
|
|
| 295 |
|
|
| 80 |
|
|
| 118 |
|
|
| 52 |
|
|
| 1,801 |
|
|
| 2,409 |
|
|
| 11 |
|
Total |
| $ | 956 |
|
| $ | 5,081 |
|
| $ | 1,799 |
|
| $ | 1,720 |
|
| $ | 647 |
|
| $ | 10,849 |
|
| $ | 21,052 |
|
|
| 100 | % |
Allowance for loan losses |
|
|
|
|
|
|
|
|
|
|
|
|
|
|
|
|
|
|
|
|
|
|
|
|
|
| (964 | ) |
|
|
|
|
Total loans, net |
|
|
|
|
|
|
|
|
|
|
|
|
|
|
|
|
|
|
|
|
|
|
|
|
| $ | 20,088 |
|
|
|
|
|
|
|
|
|
52
NAVIENT CORPORATION
NOTES TO CONSOLIDATED FINANCIAL STATEMENTS
(Information at March 31, 2022 and for the three months ended
March 31, 2022 and 2021 is unaudited)
2. Allowance for Loan Losses (Continued)
|
| Private Education Loan Credit Quality Indicators by Origination Year |
| |||||||||||||||||||||||||||||
|
| March 31, 2021 |
| |||||||||||||||||||||||||||||
(Dollars in millions) |
| March 31, 2021 |
|
| 2020 |
|
| 2019 |
|
| 2018 |
|
| 2017 |
|
| Prior |
|
| Total |
|
| % of Total |
| ||||||||
Credit Quality Indicators |
|
|
|
|
|
|
|
|
|
|
|
|
|
|
|
|
|
|
|
|
|
|
|
|
|
|
|
|
|
|
|
|
FICO Scores: |
|
|
|
|
|
|
|
|
|
|
|
|
|
|
|
|
|
|
|
|
|
|
|
|
|
|
|
|
|
|
|
|
640 and above |
| $ | 1,485 |
|
| $ | 2,835 |
|
| $ | 2,553 |
|
| $ | 929 |
|
| $ | 291 |
|
| $ | 10,736 |
|
| $ | 18,829 |
|
|
| 91 | % |
Below 640 |
|
| 10 |
|
|
| 12 |
|
|
| 35 |
|
|
| 24 |
|
|
| 9 |
|
|
| 1,815 |
|
| $ | 1,905 |
|
|
| 9 |
|
Total |
| $ | 1,495 |
|
| $ | 2,847 |
|
| $ | 2,588 |
|
| $ | 953 |
|
| $ | 300 |
|
| $ | 12,551 |
|
| $ | 20,734 |
|
|
| 100 | % |
Loan Status: |
|
|
|
|
|
|
|
|
|
|
|
|
|
|
|
|
|
|
|
|
|
|
|
|
|
|
|
|
|
|
|
|
In-school/grace/ deferment/forbearance |
| $ | 6 |
|
| $ | 29 |
|
| $ | 45 |
|
| $ | 23 |
|
| $ | 8 |
|
| $ | 1,143 |
|
| $ | 1,254 |
|
|
| 6 | % |
Current/90 days or less delinquent |
|
| 1,489 |
|
|
| 2,817 |
|
|
| 2,541 |
|
|
| 929 |
|
|
| 291 |
|
|
| 11,232 |
|
| $ | 19,299 |
|
|
| 93 |
|
Greater than 90 days delinquent |
|
| — |
|
|
| 1 |
|
|
| 2 |
|
|
| 1 |
|
|
| 1 |
|
|
| 176 |
|
|
| 181 |
|
|
| 1 |
|
Total |
| $ | 1,495 |
|
| $ | 2,847 |
|
| $ | 2,588 |
|
| $ | 953 |
|
| $ | 300 |
|
| $ | 12,551 |
|
| $ | 20,734 |
|
|
| 100 | % |
Seasoning(1): |
|
|
|
|
|
|
|
|
|
|
|
|
|
|
|
|
|
|
|
|
|
|
|
|
|
|
|
|
|
|
|
|
1-12 payments |
| $ | 1,491 |
|
| $ | 2,517 |
|
| $ | 131 |
|
| $ | 6 |
|
| $ | 1 |
|
| $ | 159 |
|
| $ | 4,305 |
|
|
| 21 | % |
13-24 payments |
|
| — |
|
|
| 314 |
|
|
| 2,330 |
|
|
| 54 |
|
|
| 5 |
|
|
| 198 |
|
| $ | 2,901 |
|
| 14 |
| |
25-36 payments |
|
| — |
|
|
| — |
|
|
| 105 |
|
|
| 823 |
|
|
| 28 |
|
|
| 327 |
|
| $ | 1,283 |
|
|
| 6 |
|
37-48 payments |
|
| — |
|
|
| — |
|
|
| — |
|
|
| 58 |
|
|
| 251 |
|
|
| 512 |
|
| $ | 821 |
|
| 4 |
| |
More than 48 payments |
|
| — |
|
|
| — |
|
|
| — |
|
|
| — |
|
|
| 12 |
|
|
| 10,955 |
|
| $ | 10,967 |
|
|
| 53 |
|
Loans in-school/ grace/deferment |
|
| 4 |
|
|
| 16 |
|
|
| 22 |
|
|
| 12 |
|
|
| 3 |
|
|
| 400 |
|
|
| 457 |
|
| 2 |
| |
Total |
| $ | 1,495 |
|
| $ | 2,847 |
|
| $ | 2,588 |
|
| $ | 953 |
|
| $ | 300 |
|
| $ | 12,551 |
|
| $ | 20,734 |
|
|
| 100 | % |
TDR Status: |
|
|
|
|
|
|
|
|
|
|
|
|
|
|
|
|
|
|
|
|
|
|
|
|
|
|
|
|
|
|
|
|
TDR |
| $ | — |
|
| $ | 2 |
|
| $ | 18 |
|
| $ | 25 |
|
| $ | 31 |
|
| $ | 7,742 |
|
| $ | 7,818 |
|
|
| 38 | % |
Non-TDR |
|
| 1,495 |
|
|
| 2,845 |
|
|
| 2,570 |
|
|
| 928 |
|
|
| 269 |
|
|
| 4,809 |
|
|
| 12,916 |
|
|
| 62 |
|
Total |
| $ | 1,495 |
|
| $ | 2,847 |
|
| $ | 2,588 |
|
| $ | 953 |
|
| $ | 300 |
|
| $ | 12,551 |
|
| $ | 20,734 |
|
|
| 100 | % |
Cosigners: |
|
|
|
|
|
|
|
|
|
|
|
|
|
|
|
|
|
|
|
|
|
|
|
|
|
|
|
|
|
|
|
|
With cosigner(2) |
| $ | 3 |
|
| $ | 32 |
|
| $ | 13 |
|
| $ | 1 |
|
| $ | 43 |
|
| $ | 8,249 |
|
| $ | 8,341 |
|
|
| 40 | % |
Without cosigner |
|
| 1,492 |
|
|
| 2,815 |
|
|
| 2,575 |
|
|
| 952 |
|
|
| 257 |
|
|
| 4,302 |
|
|
| 12,393 |
|
|
| 60 |
|
Total |
| $ | 1,495 |
|
| $ | 2,847 |
|
| $ | 2,588 |
|
| $ | 953 |
|
| $ | 300 |
|
| $ | 12,551 |
|
| $ | 20,734 |
|
|
| 100 | % |
School Type: |
|
|
|
|
|
|
|
|
|
|
|
|
|
|
|
|
|
|
|
|
|
|
|
|
|
|
|
|
|
|
|
|
Not-for-profit |
| $ | 1,408 |
|
| $ | 2,718 |
|
| $ | 2,416 |
|
| $ | 879 |
|
| $ | 287 |
|
| $ | 10,417 |
|
| $ | 18,125 |
|
|
| 87 | % |
For-profit |
|
| 87 |
|
|
| 129 |
|
|
| 172 |
|
|
| 74 |
|
|
| 13 |
|
|
| 2,134 |
|
|
| 2,609 |
|
|
| 13 |
|
Total |
| $ | 1,495 |
|
| $ | 2,847 |
|
| $ | 2,588 |
|
| $ | 953 |
|
| $ | 300 |
|
| $ | 12,551 |
|
| $ | 20,734 |
|
|
| 100 | % |
Allowance for loan losses |
|
|
|
|
|
|
|
|
|
|
|
|
|
|
|
|
|
|
|
|
|
|
|
|
|
| (992 | ) |
|
|
|
|
Total loans, net |
|
|
|
|
|
|
|
|
|
|
|
|
|
|
|
|
|
|
|
|
|
|
|
|
| $ | 19,742 |
|
|
|
|
|
|
|
|
|
53
NAVIENT CORPORATION
NOTES TO CONSOLIDATED FINANCIAL STATEMENTS
(Information at March 31, 2022 and for the three months ended
March 31, 2022 and 2021 is unaudited)
2. Allowance for Loan Losses (Continued)
|
| Private Education Loan Delinquencies |
| |||||||||||||||||||||
|
| TDRs |
| |||||||||||||||||||||
|
| March 31, 2022 |
|
| December 31, 2021 |
|
| March 31, 2021 |
| |||||||||||||||
(Dollars in millions) |
| Balance |
|
| % |
|
| Balance |
|
| % |
|
| Balance |
|
| % |
| ||||||
Loans in-school/grace/deferment(1) |
| $ | 191 |
|
|
|
|
|
| $ | 194 |
|
|
|
|
|
| $ | 255 |
|
|
|
|
|
Loans in forbearance(2) |
|
| 338 |
|
|
|
|
|
|
| 446 |
|
|
|
|
|
|
| 668 |
|
|
|
|
|
Loans in repayment and percentage of each status: |
|
|
|
|
|
|
|
|
|
|
|
|
|
|
|
|
|
|
|
|
|
|
|
|
Loans current |
|
| 5,823 |
|
|
| 88.7 | % |
|
| 6,023 |
|
|
| 91.0 | % |
|
| 6,477 |
|
|
| 94.0 | % |
Loans delinquent 31-60 days(3) |
|
| 259 |
|
|
| 3.9 |
|
|
| 199 |
|
|
| 3.0 |
|
|
| 160 |
|
|
| 2.3 |
|
Loans delinquent 61-90 days(3) |
|
| 189 |
|
|
| 2.9 |
|
|
| 120 |
|
|
| 1.8 |
|
|
| 92 |
|
|
| 1.3 |
|
Loans delinquent greater than 90 days(3) |
|
| 293 |
|
|
| 4.5 |
|
|
| 274 |
|
|
| 4.2 |
|
|
| 166 |
|
|
| 2.4 |
|
Total TDR loans in repayment |
|
| 6,564 |
|
|
| 100 | % |
|
| 6,616 |
|
|
| 100 | % |
|
| 6,895 |
|
|
| 100 | % |
Total TDR loans |
|
| 7,093 |
|
|
|
|
|
|
| 7,256 |
|
|
|
|
|
|
| 7,818 |
|
|
|
|
|
TDR loans allowance for losses |
|
| (785 | ) |
|
|
|
|
|
| (829 | ) |
|
|
|
|
|
| (857 | ) |
|
|
|
|
TDR loans, net |
| $ | 6,308 |
|
|
|
|
|
| $ | 6,427 |
|
|
|
|
|
| $ | 6,961 |
|
|
|
|
|
Percentage of TDR loans in repayment |
|
|
|
|
|
| 92.5 | % |
|
|
|
|
|
| 91.2 | % |
|
|
|
|
|
| 88.2 | % |
Delinquencies as a percentage of TDR loans in repayment |
|
|
|
|
|
| 11.3 | % |
|
|
|
|
|
| 9.0 | % |
|
|
|
|
|
| 6.0 | % |
Loans in forbearance as a percentage of TDR loans in repayment and forbearance |
|
|
|
|
|
| 4.9 | % |
|
|
|
|
|
| 6.3 | % |
|
|
|
|
|
| 8.8 | % |
|
|
|
|
|
|
54
NAVIENT CORPORATION
NOTES TO CONSOLIDATED FINANCIAL STATEMENTS
(Information at March 31, 2022 and for the three months ended
March 31, 2022 and 2021 is unaudited)
2. Allowance for Loan Losses (Continued)
|
| Private Education Loan Delinquencies |
| |||||||||||||||||||||
|
| Non-TDRs |
| |||||||||||||||||||||
|
| March 31, 2022 |
|
| December 31, 2021 |
|
| March 31, 2021 |
| |||||||||||||||
(Dollars in millions) |
| Balance |
|
| % |
|
| Balance |
|
| % |
|
| Balance |
|
| % |
| ||||||
Loans in-school/grace/deferment(1) |
| $ | 186 |
|
|
|
|
|
| $ | 167 |
|
|
|
|
|
| $ | 202 |
|
|
|
|
|
Loans in forbearance(2) |
|
| 80 |
|
|
|
|
|
|
| 89 |
|
|
|
|
|
|
| 129 |
|
|
|
|
|
Loans in repayment and percentage of each status: |
|
|
|
|
|
|
|
|
|
|
|
|
|
|
|
|
|
|
|
|
|
|
|
|
Loans current |
|
| 13,624 |
|
|
| 99.5 | % |
|
| 13,611 |
|
|
| 99.6 | % |
|
| 12,543 |
|
|
| 99.7 | % |
Loans delinquent 31-60 days(3) |
|
| 31 |
|
|
| .2 |
|
|
| 23 |
|
|
| .2 |
|
|
| 19 |
|
|
| .1 |
|
Loans delinquent 61-90 days(3) |
|
| 17 |
|
|
| .1 |
|
|
| 11 |
|
|
| .1 |
|
|
| 8 |
|
|
| .1 |
|
Loans delinquent greater than 90 days(3) |
|
| 21 |
|
|
| .2 |
|
|
| 23 |
|
|
| .1 |
|
|
| 15 |
|
|
| .1 |
|
Total non-TDR loans in repayment |
|
| 13,693 |
|
|
| 100 | % |
|
| 13,668 |
|
|
| 100 | % |
|
| 12,585 |
|
|
| 100 | % |
Total non-TDR loans |
|
| 13,959 |
|
|
|
|
|
|
| 13,924 |
|
|
|
|
|
|
| 12,916 |
|
|
|
|
|
Non-TDR loans allowance for losses |
|
| (179 | ) |
|
|
|
|
|
| (180 | ) |
|
|
|
|
|
| (135 | ) |
|
|
|
|
Non-TDR loans, net |
| $ | 13,780 |
|
|
|
|
|
| $ | 13,744 |
|
|
|
|
|
| $ | 12,781 |
|
|
|
|
|
Percentage of non-TDR loans in repayment |
|
|
|
|
|
| 98.1 | % |
|
|
|
|
|
| 98.2 | % |
|
|
|
|
|
| 97.4 | % |
Delinquencies as a percentage of non-TDR loans in repayment |
|
|
|
|
|
| .5 | % |
|
|
|
|
|
| .4 | % |
|
|
|
|
|
| .3 | % |
Loans in forbearance as a percentage of non-TDR loans in repayment and forbearance |
|
|
|
|
|
| .6 | % |
|
|
|
|
|
| .6 | % |
|
|
|
|
|
| 1.0 | % |
|
|
|
|
|
|
55
NAVIENT CORPORATION
NOTES TO CONSOLIDATED FINANCIAL STATEMENTS
(Information at March 31, 2022 and for the three months ended
March 31, 2022 and 2021 is unaudited)
3. Borrowings
The following table summarizes our borrowings.
|
| March 31, 2022 |
|
| December 31, 2021 |
| ||||||||||||||||||
(Dollars in millions) |
| Short Term |
|
| Long Term |
|
| Total |
|
| Short Term |
|
| Long Term |
|
| Total |
| ||||||
Unsecured borrowings: |
|
|
|
|
|
|
|
|
|
|
|
|
|
|
|
|
|
|
|
|
|
|
|
|
Senior unsecured debt(1) |
| $ | 999 |
|
| $ | 6,018 |
|
| $ | 7,017 |
|
| $ | — |
|
| $ | 7,014 |
|
| $ | 7,014 |
|
Total unsecured borrowings |
|
| 999 |
|
|
| 6,018 |
|
|
| 7,017 |
|
|
| — |
|
|
| 7,014 |
|
|
| 7,014 |
|
Secured borrowings: |
|
|
|
|
|
|
|
|
|
|
|
|
|
|
|
|
|
|
|
|
|
|
|
|
FFELP Loan securitizations(2)(3) |
|
| — |
|
|
| 49,622 |
|
|
| 49,622 |
|
|
| — |
|
|
| 51,841 |
|
|
| 51,841 |
|
Private Education Loan securitizations(4) |
|
| 515 |
|
|
| 14,038 |
|
|
| 14,553 |
|
|
| 543 |
|
|
| 14,074 |
|
|
| 14,617 |
|
FFELP Loan ABCP facilities |
|
| 619 |
|
|
| 145 |
|
|
| 764 |
|
|
| 282 |
|
|
| 150 |
|
|
| 432 |
|
Private Education Loan ABCP facilities |
|
| 1,462 |
|
|
| 1,114 |
|
|
| 2,576 |
|
|
| 1,363 |
|
|
| 1,152 |
|
|
| 2,515 |
|
Other(5) |
|
| 204 |
|
|
| — |
|
|
| 204 |
|
|
| 302 |
|
|
| — |
|
|
| 302 |
|
Total secured borrowings |
|
| 2,800 |
|
|
| 64,919 |
|
|
| 67,719 |
|
|
| 2,490 |
|
|
| 67,217 |
|
|
| 69,707 |
|
Total before hedge accounting adjustments |
|
| 3,799 |
|
|
| 70,937 |
|
|
| 74,736 |
|
|
| 2,490 |
|
|
| 74,231 |
|
|
| 76,721 |
|
Hedge accounting adjustments |
|
| 3 |
|
|
| (112 | ) |
|
| (109 | ) |
|
| — |
|
|
| 257 |
|
|
| 257 |
|
Total |
| $ | 3,802 |
|
| $ | 70,825 |
|
| $ | 74,627 |
|
| $ | 2,490 |
|
| $ | 74,488 |
|
| $ | 76,978 |
|
|
|
|
|
|
|
|
|
|
|
56
NAVIENT CORPORATION
NOTES TO CONSOLIDATED FINANCIAL STATEMENTS
(Information at March 31, 2022 and for the three months ended
March 31, 2022 and 2021 is unaudited)
3. Borrowings (Continued)
Variable Interest Entities
We consolidated the following financing VIEs as of March 31, 20222023 and December 31, 2021,2022, as we are the primary beneficiary. As a result, these VIEs are accounted for as secured borrowings.
|
| March 31, 2022 |
|
| March 31, 2023 |
| ||||||||||||||||||||||||||||||||||||||||||||||||||
|
| Debt Outstanding |
|
| Carrying Amount of Assets Securing Debt Outstanding |
|
| Debt Outstanding |
|
| Carrying Amount of Assets Securing |
| ||||||||||||||||||||||||||||||||||||||||||||
(Dollars in millions) |
| Short Term |
|
| Long Term |
|
| Total |
|
| Loans |
|
| Cash |
|
| Other Assets |
|
| Total |
|
| Short |
|
| Long |
|
| Total |
|
| Loans |
|
| Cash |
|
| Other |
|
| Total |
| ||||||||||||||
Secured Borrowings — VIEs: |
|
|
|
|
|
|
|
|
|
|
|
|
|
|
|
|
|
|
|
|
|
|
|
|
|
|
|
|
|
|
|
|
|
|
|
|
|
|
|
|
|
|
|
|
|
|
|
| ||||||||
FFELP Loan securitizations |
| $ | — |
|
| $ | 49,622 |
|
| $ | 49,622 |
|
| $ | 50,024 |
|
| $ | 1,860 |
|
| $ | 1,535 |
|
| $ | 53,419 |
|
| $ | 68 |
|
| $ | 40,275 |
|
| $ | 40,343 |
|
| $ | 40,755 |
|
| $ | 1,612 |
|
| $ | 1,578 |
|
| $ | 43,945 |
|
Private Education Loan securitizations |
|
| 515 |
|
|
| 14,038 |
|
|
| 14,553 |
|
|
| 15,467 |
|
|
| 518 |
|
|
| 138 |
|
|
| 16,123 |
|
|
| 648 |
|
|
| 12,187 |
|
|
| 12,835 |
|
|
| 13,609 |
|
|
| 396 |
|
|
| 97 |
|
|
| 14,102 |
|
FFELP Loan ABCP facilities |
|
| 619 |
|
|
| 145 |
|
|
| 764 |
|
|
| 755 |
|
|
| 14 |
|
|
| 26 |
|
|
| 795 |
|
|
| 887 |
|
|
| 428 |
|
|
| 1,315 |
|
|
| 1,331 |
|
|
| 35 |
|
|
| 46 |
|
|
| 1,412 |
|
Private Education Loan ABCP facilities |
|
| 1,462 |
|
|
| 1,114 |
|
|
| 2,576 |
|
|
| 2,757 |
|
|
| 79 |
|
|
| 30 |
|
|
| 2,866 |
|
|
| 2,917 |
|
|
| — |
|
|
| 2,917 |
|
|
| 3,213 |
|
|
| 137 |
|
|
| 40 |
|
|
| 3,390 |
|
Total before hedge accounting adjustments |
|
| 2,596 |
|
|
| 64,919 |
|
|
| 67,515 |
|
|
| 69,003 |
|
|
| 2,471 |
|
|
| 1,729 |
|
|
| 73,203 |
|
|
| 4,520 |
|
|
| 52,890 |
|
|
| 57,410 |
|
|
| 58,908 |
|
|
| 2,180 |
|
|
| 1,761 |
|
|
| 62,849 |
|
Hedge accounting adjustments |
|
| — |
|
|
| (164 | ) |
|
| (164 | ) |
|
| — |
|
|
| — |
|
|
| (229 | ) |
|
| (229 | ) |
|
| — |
|
|
| (176 | ) |
|
| (176 | ) |
|
| — |
|
|
| — |
|
|
| (227 | ) |
|
| (227 | ) |
Total |
| $ | 2,596 |
|
| $ | 64,755 |
|
| $ | 67,351 |
|
| $ | 69,003 |
|
| $ | 2,471 |
|
| $ | 1,500 |
|
| $ | 72,974 |
|
| $ | 4,520 |
|
| $ | 52,714 |
|
| $ | 57,234 |
|
| $ | 58,908 |
|
| $ | 2,180 |
|
| $ | 1,534 |
|
| $ | 62,622 |
|
|
|
|
|
|
|
|
|
|
|
|
|
|
|
|
|
|
|
|
|
|
|
|
|
|
|
|
|
|
|
|
|
|
|
|
|
|
|
|
|
|
|
|
| |||||||||||||
|
| December 31, 2022 |
| |||||||||||||||||||||||||
|
| Debt Outstanding |
|
| Carrying Amount of Assets Securing |
| ||||||||||||||||||||||
(Dollars in millions) |
| Short |
|
| Long |
|
| Total |
|
| Loans |
|
| Cash |
|
| Other |
|
| Total |
| |||||||
Secured Borrowings — VIEs: |
|
|
|
|
|
|
|
|
|
|
|
|
|
|
|
|
|
|
|
|
| |||||||
FFELP Loan securitizations |
| $ | 76 |
|
| $ | 42,675 |
|
| $ | 42,751 |
|
| $ | 42,148 |
|
| $ | 2,705 |
|
| $ | 1,544 |
|
| $ | 46,397 |
|
Private Education Loan securitizations |
|
| 725 |
|
|
| 12,744 |
|
|
| 13,469 |
|
|
| 14,168 |
|
|
| 367 |
|
|
| 105 |
|
|
| 14,640 |
|
FFELP Loan ABCP facilities |
|
| 923 |
|
|
| 386 |
|
|
| 1,309 |
|
|
| 1,317 |
|
|
| 39 |
|
|
| 44 |
|
|
| 1,400 |
|
Private Education Loan ABCP facilities |
|
| 2,734 |
|
|
| — |
|
|
| 2,734 |
|
|
| 3,039 |
|
|
| 122 |
|
|
| (81 | ) |
|
| 3,080 |
|
Total before hedge accounting |
|
| 4,458 |
|
|
| 55,805 |
|
|
| 60,263 |
|
|
| 60,672 |
|
|
| 3,233 |
|
|
| 1,612 |
|
|
| 65,517 |
|
Hedge accounting adjustments |
|
| — |
|
|
| (207 | ) |
|
| (207 | ) |
|
| — |
|
|
| — |
|
|
| (256 | ) |
|
| (256 | ) |
Total |
| $ | 4,458 |
|
| $ | 55,598 |
|
| $ | 60,056 |
|
| $ | 60,672 |
|
| $ | 3,233 |
|
| $ | 1,356 |
|
| $ | 65,261 |
|
|
| December 31, 2021 |
| |||||||||||||||||||||||||
|
| Debt Outstanding |
|
| Carrying Amount of Assets Securing Debt Outstanding |
| ||||||||||||||||||||||
(Dollars in millions) |
| Short Term |
|
| Long Term |
|
| Total |
|
| Loans |
|
| Cash |
|
| Other Assets |
|
| Total |
| |||||||
Secured Borrowings — VIEs: |
|
|
|
|
|
|
|
|
|
|
|
|
|
|
|
|
|
|
|
|
|
|
|
|
|
|
|
|
FFELP Loan securitizations |
| $ | — |
|
| $ | 51,841 |
|
| $ | 51,841 |
|
| $ | 52,066 |
|
| $ | 2,073 |
|
| $ | 1,520 |
|
| $ | 55,659 |
|
Private Education Loan securitizations |
|
| 543 |
|
|
| 14,074 |
|
|
| 14,617 |
|
|
| 15,506 |
|
|
| 505 |
|
|
| 150 |
|
|
| 16,161 |
|
FFELP Loan ABCP facilities |
|
| 282 |
|
|
| 150 |
|
|
| 432 |
|
|
| 436 |
|
|
| 8 |
|
|
| 15 |
|
|
| 459 |
|
Private Education Loan ABCP facilities |
|
| 1,363 |
|
|
| 1,152 |
|
|
| 2,515 |
|
|
| 2,641 |
|
|
| 63 |
|
|
| 32 |
|
|
| 2,736 |
|
Total before hedge accounting adjustments |
|
| 2,188 |
|
|
| 67,217 |
|
|
| 69,405 |
|
|
| 70,649 |
|
|
| 2,649 |
|
|
| 1,717 |
|
|
| 75,015 |
|
Hedge accounting adjustments |
|
| — |
|
|
| (110 | ) |
|
| (110 | ) |
|
| — |
|
|
| — |
|
|
| (195 | ) |
|
| (195 | ) |
Total |
| $ | 2,188 |
|
| $ | 67,107 |
|
| $ | 69,295 |
|
| $ | 70,649 |
|
| $ | 2,649 |
|
| $ | 1,522 |
|
| $ | 74,820 |
|
57
NAVIENT CORPORATION
NOTES TO CONSOLIDATED FINANCIAL STATEMENTS
(Information at March 31, 20222023 and for the three months ended
March 31, 20222023 and 20212022 is unaudited)
4. Derivative Financial Instruments
Summary of Derivative Financial Statement Impact
The following tables summarize the fair values and notional amounts of all derivative instruments and their impact on net income and other comprehensive income.
Impact of Derivatives on Balance Sheet
|
|
|
| Cash Flow |
|
| Fair Value(3) |
|
| Trading |
|
| Total |
| ||||||||||||||||||||
(Dollars in millions) |
| Hedged Risk |
| Mar 31, 2023 |
|
| Dec 31, 2022 |
|
| Mar 31, 2023 |
|
| Dec 31, 2022 |
|
| Mar 31, 2023 |
|
| Dec 31, 2022 |
|
| Mar 31, 2023 |
|
| Dec 31, 2022 |
| ||||||||
Fair Values(1) |
|
|
|
|
|
|
|
|
|
|
|
|
|
|
|
|
|
|
|
|
|
|
|
|
|
| ||||||||
Derivative Assets: |
|
|
|
|
|
|
|
|
|
|
|
|
|
|
|
|
|
|
|
|
|
|
|
|
|
| ||||||||
Interest rate swaps |
| Interest rate |
| $ | — |
|
| $ | — |
|
| $ | 72 |
|
| $ | 55 |
|
| $ | 1 |
|
| $ | 1 |
|
| $ | 73 |
|
| $ | 56 |
|
Cross-currency interest rate |
| Foreign currency and |
|
| — |
|
|
| — |
|
|
| — |
|
|
| — |
|
|
| — |
|
|
| — |
|
|
| — |
|
|
| — |
|
Total derivative assets(2) |
|
|
|
| — |
|
|
| — |
|
|
| 72 |
|
|
| 55 |
|
|
| 1 |
|
|
| 1 |
|
|
| 73 |
|
|
| 56 |
|
Derivative Liabilities: |
|
|
|
|
|
|
|
|
|
|
|
|
|
|
|
|
|
|
|
|
|
|
|
|
|
| ||||||||
Interest rate swaps |
| Interest rate |
|
| — |
|
|
| — |
|
|
| — |
|
|
| (2 | ) |
|
| (3 | ) |
|
| (3 | ) |
|
| (3 | ) |
|
| (5 | ) |
Floor Income Contracts |
| Interest rate |
|
| — |
|
|
| — |
|
|
| — |
|
|
| — |
|
|
| — |
|
|
| — |
|
|
| — |
|
|
| — |
|
Cross-currency interest rate |
| Foreign currency and |
|
| — |
|
|
| — |
|
|
| (224 | ) |
|
| (253 | ) |
|
| — |
|
|
| — |
|
|
| (224 | ) |
|
| (253 | ) |
Total derivative liabilities(2) |
|
|
|
| — |
|
|
| — |
|
|
| (224 | ) |
|
| (255 | ) |
|
| (3 | ) |
|
| (3 | ) |
|
| (227 | ) |
|
| (258 | ) |
Net total derivatives |
|
|
| $ | — |
|
| $ | — |
|
| $ | (152 | ) |
| $ | (200 | ) |
| $ | (2 | ) |
| $ | (2 | ) |
| $ | (154 | ) |
| $ | (202 | ) |
|
|
|
| Cash Flow |
|
| Fair Value(3) |
|
| Trading |
|
| Total |
| ||||||||||||||||||||
(Dollars in millions) |
| Hedged Risk Exposure |
| Mar 31, 2022 |
|
| Dec 31, 2021 |
|
| Mar 31, 2022 |
|
| Dec 31, 2021 |
|
| Mar 31, 2022 |
|
| Dec 31, 2021 |
|
| Mar 31, 2022 |
|
| Dec 31, 2021 |
| ||||||||
Fair Values(1) |
|
|
|
|
|
|
|
|
|
|
|
|
|
|
|
|
|
|
|
|
|
|
|
|
|
|
|
|
|
|
|
|
|
|
Derivative Assets: |
|
|
|
|
|
|
|
|
|
|
|
|
|
|
|
|
|
|
|
|
|
|
|
|
|
|
|
|
|
|
|
|
|
|
Interest rate swaps |
| Interest rate |
| $ | — |
|
| $ | — |
|
| $ | 150 |
|
| $ | 222 |
|
| $ | 1 |
|
| $ | 2 |
|
| $ | 151 |
|
| $ | 224 |
|
Cross-currency interest rate swaps |
| Foreign currency and interest rate |
|
| — |
|
|
| — |
|
|
| — |
|
|
| — |
|
|
| — |
|
|
| — |
|
|
| — |
|
|
| — |
|
Total derivative assets(2) |
|
|
|
| — |
|
|
| — |
|
|
| 150 |
|
|
| 222 |
|
|
| 1 |
|
|
| 2 |
|
|
| 151 |
|
|
| 224 |
|
Derivative Liabilities: |
|
|
|
|
|
|
|
|
|
|
|
|
|
|
|
|
|
|
|
|
|
|
|
|
|
|
|
|
|
|
|
|
|
|
Interest rate swaps |
| Interest rate |
|
| — |
|
|
| — |
|
|
| — |
|
|
| — |
|
|
| (4 | ) |
|
| (5 | ) |
|
| (4 | ) |
|
| (5 | ) |
Floor Income Contracts |
| Interest rate |
|
| — |
|
|
| — |
|
|
| — |
|
|
| — |
|
|
| (9 | ) |
|
| (65 | ) |
|
| (9 | ) |
|
| (65 | ) |
Cross-currency interest rate swaps |
| Foreign currency and interest rate |
|
| — |
|
|
| — |
|
|
| (226 | ) |
|
| (190 | ) |
|
| — |
|
|
| — |
|
|
| (226 | ) |
|
| (190 | ) |
Total derivative liabilities(2) |
|
|
|
| — |
|
|
| — |
|
|
| (226 | ) |
|
| (190 | ) |
|
| (13 | ) |
|
| (70 | ) |
|
| (239 | ) |
|
| (260 | ) |
Net total derivatives |
|
|
| $ | — |
|
| $ | — |
|
| $ | (76 | ) |
| $ | 32 |
|
| $ | (12 | ) |
| $ | (68 | ) |
| $ | (88 | ) |
| $ | (36 | ) |
|
|
|
|
|
| Other Assets |
|
| Other Liabilities |
| ||||||||||
(Dollar in millions) |
| March 31, 2023 |
|
| December 31, 2022 |
|
| March 31, 2023 |
|
| December 31, 2022 |
| ||||
Gross position |
| $ | 73 |
|
| $ | 56 |
|
| $ | (227 | ) |
| $ | (258 | ) |
Impact of master netting agreements |
|
| — |
|
|
| — |
|
|
| — |
|
|
| — |
|
Derivative values with impact of master netting |
|
| 73 |
|
|
| 56 |
|
|
| (227 | ) |
|
| (258 | ) |
Cash collateral (held) pledged |
|
| (65 | ) |
|
| (80 | ) |
|
| 51 |
|
|
| 62 |
|
Net position |
| $ | 8 |
|
| $ | (24 | ) |
| $ | (176 | ) |
| $ | (196 | ) |
|
| Other Assets |
|
| Other Liabilities |
| ||||||||||
(Dollar in millions) |
| March 31, 2022 |
|
| December 31, 2021 |
|
| March 31, 2022 |
|
| December 31, 2021 |
| ||||
Gross position |
| $ | 151 |
|
| $ | 224 |
|
| $ | (239 | ) |
| $ | (260 | ) |
Impact of master netting agreements |
|
| — |
|
|
| (6 | ) |
|
| — |
|
|
| 6 |
|
Derivative values with impact of master netting agreements (as carried on balance sheet) |
|
| 151 |
|
|
| 218 |
|
|
| (239 | ) |
|
| (254 | ) |
Cash collateral (held) pledged |
|
| (152 | ) |
|
| (244 | ) |
|
| 95 |
|
|
| 147 |
|
Net position |
| $ | (1 | ) |
| $ | (26 | ) |
| $ | (144 | ) |
| $ | (107 | ) |
|
|
|
| As of March 31, 2022 |
|
| As of December 31, 2021 |
| ||||||||||
(Dollar in millions) |
| Carrying Value |
|
| Hedge Basis Adjustments |
|
| Carrying Value |
|
| Hedge Basis Adjustments |
| ||||
Short-term borrowings |
| $ | 1,000 |
|
| $ | 3 |
|
| $ | — |
|
| $ | — |
|
Long-term borrowings |
| $ | 7,076 |
|
| $ | (116 | ) |
| $ | 8,503 |
|
| $ | 252 |
|
|
| As of March 31, 2023 |
|
| As of December 31, 2022 |
| ||||||||||
(Dollar in millions) |
| Carrying |
|
| Hedge Basis Adjustments |
|
| Carrying |
|
| Hedge Basis Adjustments |
| ||||
Short-term borrowings |
| $ | 1,126 |
|
| $ | (21 | ) |
| $ | 1,289 |
|
| $ | (10 | ) |
Long-term borrowings |
| $ | 5,374 |
|
| $ | (370 | ) |
| $ | 6,188 |
|
| $ | (494 | ) |
58
NAVIENT CORPORATION
NOTES TO CONSOLIDATED FINANCIAL STATEMENTS
(Information at March 31, 20222023 and for the three months ended
March 31, 20222023 and 20212022 is unaudited)
4. Derivative Financial Instruments (Continued)
The above fair values include adjustments when necessary for counterparty credit risk for both when we are exposed to the counterparty, net of collateral postings, and when the counterparty is exposed to us, net of collateral postings. The net adjustments decreased the asset position at March, 31, 20222023 and December 31, 20212022 by $9$5 million and $8$6 million, respectively. In addition, the above fair values reflect adjustments for illiquid derivatives as indicated by a wide bid/ask spread in the interest rate indices to which the derivatives are indexed. These adjustments decreased the overall net asset positions at March 31, 20222023 and December 31, 20212022 by $2$1 million and $2$1 million, respectively.
|
| Cash Flow |
|
| Fair Value |
|
| Trading |
|
| Total |
| ||||||||||||||||||||
(Dollars in billions) |
| Mar 31, 2023 |
|
| Dec 31, 2022 |
|
| Mar 31, 2023 |
|
| Dec 31, 2022 |
|
| Mar 31, 2023 |
|
| Dec 31, 2022 |
|
| Mar 31, 2023 |
|
| Dec 31, 2022 |
| ||||||||
Notional Values: |
|
|
|
|
|
|
|
|
|
|
|
|
|
|
|
|
|
|
|
|
|
|
|
| ||||||||
Interest rate swaps |
| $ | 6.4 |
|
| $ | 8.3 |
|
| $ | 5.2 |
|
| $ | 6.2 |
|
| $ | 13.3 |
|
| $ | 17.4 |
|
| $ | 24.9 |
|
| $ | 31.9 |
|
Floor Income Contracts |
|
| — |
|
|
| — |
|
|
| — |
|
|
| — |
|
|
| 6.0 |
|
|
| 6.0 |
|
|
| 6.0 |
|
|
| 6.0 |
|
Cross-currency interest rate swaps |
|
| — |
|
|
| — |
|
|
| 1.7 |
|
|
| 1.8 |
|
|
| — |
|
|
| — |
|
|
| 1.7 |
|
|
| 1.8 |
|
Total derivatives |
| $ | 6.4 |
|
| $ | 8.3 |
|
| $ | 6.9 |
|
| $ | 8.0 |
|
| $ | 19.3 |
|
| $ | 23.4 |
|
| $ | 32.6 |
|
| $ | 39.7 |
|
|
| Cash Flow |
|
| Fair Value |
|
| Trading |
|
| Total |
| ||||||||||||||||||||
(Dollars in billions) |
| Mar 31, 2022 |
|
| Dec 31, 2021 |
|
| Mar 31, 2022 |
|
| Dec 31, 2021 |
|
| Mar 31, 2022 |
|
| Dec 31, 2021 |
|
| Mar 31, 2022 |
|
| Dec 31, 2021 |
| ||||||||
Notional Values: |
|
|
|
|
|
|
|
|
|
|
|
|
|
|
|
|
|
|
|
|
|
|
|
|
|
|
|
|
|
|
|
|
Interest rate swaps |
| $ | 11.4 |
|
| $ | 12.1 |
|
| $ | 6.2 |
|
| $ | 6.2 |
|
| $ | 26.8 |
|
| $ | 28.4 |
|
| $ | 44.4 |
|
| $ | 46.7 |
|
Floor Income Contracts |
|
| — |
|
|
| — |
|
|
| — |
|
|
| — |
|
|
| 8.1 |
|
|
| 12.5 |
|
|
| 8.1 |
|
|
| 12.5 |
|
Cross-currency interest rate swaps |
|
| — |
|
|
| — |
|
|
| 2.0 |
|
|
| 2.1 |
|
|
| — |
|
|
| — |
|
|
| 2.0 |
|
|
| 2.1 |
|
Total derivatives |
| $ | 11.4 |
|
| $ | 12.1 |
|
| $ | 8.2 |
|
| $ | 8.3 |
|
| $ | 34.9 |
|
| $ | 40.9 |
|
| $ | 54.5 |
|
| $ | 61.3 |
|
Mark-to-Market
Mark-to-MarketImpact of Derivatives on Statements of Income
|
| Total Gains (Losses) |
| |||||
|
| Three Months Ended March 31, |
| |||||
(Dollars in millions) |
| 2023 |
|
| 2022 |
| ||
Fair Value Hedges: |
|
|
|
|
|
| ||
Interest Rate Swaps |
|
|
|
|
|
| ||
Gains (losses) recognized in net income on derivatives |
| $ | 78 |
|
| $ | (288 | ) |
Gains (losses) recognized in net income on hedged items |
|
| (82 | ) |
|
| 313 |
|
Net fair value hedge ineffectiveness gains (losses) |
|
| (4 | ) |
|
| 25 |
|
Cross currency interest rate swaps |
|
|
|
|
|
| ||
Gains (losses) recognized in net income on derivatives |
|
| 29 |
|
|
| (36 | ) |
Gains (losses) recognized in net income on hedged items |
|
| (31 | ) |
|
| 52 |
|
Net fair value hedge ineffectiveness gains (losses) |
|
| (2 | ) |
|
| 16 |
|
Total fair value hedges(1)(2) |
|
| (6 | ) |
|
| 41 |
|
Cash Flow Hedges: |
|
|
|
|
|
| ||
Total cash flow hedges(2) |
|
| — |
|
|
| — |
|
Trading: |
|
|
|
|
|
| ||
Interest rate swaps |
|
| (8 | ) |
|
| 62 |
|
Floor income contracts |
|
| — |
|
|
| 36 |
|
Cross currency interest rate swaps |
|
| — |
|
|
| — |
|
Other |
|
| — |
|
|
| — |
|
Total trading derivatives(3) |
|
| (8 | ) |
|
| 98 |
|
Mark-to-market gains (losses) recognized |
| $ | (14 | ) |
| $ | 139 |
|
|
| Total Gains (Losses) |
| |||||
|
| Three Months Ended March 31, |
| |||||
(Dollars in millions) |
| 2022 |
|
| 2021 |
| ||
Fair Value Hedges: |
|
|
|
|
|
|
|
|
Interest Rate Swaps |
|
|
|
|
|
|
|
|
Gains (losses) recognized in net income on derivatives |
| $ | (288 | ) |
| $ | (197 | ) |
Gains (losses) recognized in net income on hedged items |
|
| 313 |
|
|
| 212 |
|
Net fair value hedge ineffectiveness gains (losses) |
|
| 25 |
|
|
| 15 |
|
Cross currency interest rate swaps |
|
|
|
|
|
|
|
|
Gains (losses) recognized in net income on derivatives |
|
| (36 | ) |
|
| 70 |
|
Gains (losses) recognized in net income on hedged items |
|
| 52 |
|
|
| (40 | ) |
Net fair value hedge ineffectiveness gains (losses) |
|
| 16 |
|
|
| 30 |
|
Total fair value hedges(1)(2) |
|
| 41 |
|
|
| 45 |
|
Cash Flow Hedges: |
|
|
|
|
|
|
|
|
Total cash flow hedges(2) |
|
| — |
|
|
| — |
|
Trading: |
|
|
|
|
|
|
|
|
Interest rate swaps |
|
| 62 |
|
|
| 22 |
|
Floor income contracts |
|
| 36 |
|
|
| 14 |
|
Cross currency interest rate swaps |
|
| — |
|
|
| — |
|
Other |
|
| — |
|
|
| — |
|
Total trading derivatives(3) |
|
| 98 |
|
|
| 36 |
|
Mark-to-market gains (losses) recognized |
| $ | 139 |
|
| $ | 81 |
|
|
|
|
|
|
|
59
NAVIENT CORPORATION
NOTES TO CONSOLIDATED FINANCIAL STATEMENTS
(Information at March 31, 20222023 and for the three months ended
March 31, 20222023 and 20212022 is unaudited)
4. Derivative Financial Instruments (Continued)
Impact of Derivatives on Other Comprehensive Income (Equity)
|
| Three Months Ended March 31, |
| |||||
(Dollars in millions) |
| 2023 |
|
| 2022 |
| ||
Total gains (losses) on cash flow hedges |
| $ | (3 | ) |
| $ | 93 |
|
Reclassification adjustments for derivative (gains) losses |
|
| (18 | ) |
|
| 21 |
|
Net changes in cash flow hedges, net of tax |
| $ | (21 | ) |
| $ | 114 |
|
Collateral
|
| Three Months Ended March 31, |
| |||||
(Dollars in millions) |
| 2022 |
|
| 2021 |
| ||
Total gains (losses) on cash flow hedges |
| $ | 93 |
|
| $ | 27 |
|
Reclassification adjustments for derivative (gains) losses included in net income (interest expense)(1) |
|
| 21 |
|
|
| 21 |
|
Net changes in cash flow hedges, net of tax |
| $ | 114 |
|
| $ | 48 |
|
|
|
Collateral
The following table details collateral held and pledged related to derivative exposure between us and our derivative counterparties:
(Dollars in millions) |
| March 31, 2023 |
|
| December 31, 2022 |
| ||
Collateral held: |
|
|
|
|
|
| ||
Cash (obligation to return cash collateral is recorded in short-term borrowings) |
| $ | 65 |
|
| $ | 80 |
|
Securities at fair value — corporate derivatives (not recorded in financial |
|
| — |
|
|
| — |
|
Securities at fair value — on-balance sheet securitization derivatives (not |
|
| — |
|
|
| — |
|
Total collateral held |
| $ | 65 |
|
| $ | 80 |
|
Derivative asset at fair value including accrued interest |
| $ | 73 |
|
| $ | 85 |
|
Collateral pledged to others: |
|
|
|
|
|
| ||
Cash (right to receive return of cash collateral is recorded in investments) |
| $ | 51 |
|
| $ | 62 |
|
Total collateral pledged |
| $ | 51 |
|
| $ | 62 |
|
Derivative liability at fair value including accrued interest and premium |
| $ | 235 |
|
| $ | 266 |
|
(Dollars in millions) |
| March 31, 2022 |
|
| December 31, 2021 |
| ||
Collateral held: |
|
|
|
|
|
|
|
|
Cash (obligation to return cash collateral is recorded in short-term borrowings) |
| $ | 152 |
|
| $ | 244 |
|
Securities at fair value — corporate derivatives (not recorded in financial statements)(1) |
|
| — |
|
|
| — |
|
Securities at fair value — on-balance sheet securitization derivatives (not recorded in financial statements)(2) |
|
| — |
|
|
| 1 |
|
Total collateral held |
| $ | 152 |
|
| $ | 245 |
|
Derivative asset at fair value including accrued interest |
| $ | 159 |
|
| $ | 242 |
|
Collateral pledged to others: |
|
|
|
|
|
|
|
|
Cash (right to receive return of cash collateral is recorded in investments) |
| $ | 95 |
|
| $ | 147 |
|
Total collateral pledged |
| $ | 95 |
|
| $ | 147 |
|
Derivative liability at fair value including accrued interest and premium receivable |
| $ | 256 |
|
| $ | 271 |
|
|
|
|
|
60
NAVIENT CORPORATION
NOTES TO CONSOLIDATED FINANCIAL STATEMENTS
(Information at March 31, 2022 and for the three months ended
March 31, 2022 and 2021 is unaudited)
4. Derivative Financial Instruments (Continued)
Our corporate derivatives contain credit contingent features. At our current unsecured credit rating, we have fully collateralized our corporate derivative liability position (including accrued interest and net of premiums receivable) of $24 million$0 with our counterparties. Downgrades in our unsecured credit rating would not result in any additional collateral requirements. Trust related derivatives do not contain credit contingent features related to our or the trusts’ credit ratings. At March 31, 2022 and December 31, 2021, we had a net positive exposure (derivative gain positions to us less collateral which has been posted by counterparties to us) related to Navient Corporation derivatives of $15 million and $9 million, respectively. The trusts are not required to post collateral to the counterparties. At March 31, 2022 and December 31, 2021, the net positive exposure on swaps in securitization trusts was $0 and $0, respectively
The table below highlights credit exposure related to our derivative counterparties at March 31, 2022.2023.
(Dollars in millions) |
| Corporate |
|
| Securitization |
| ||
Exposure, net of collateral |
| $ | 13 |
|
| $ | — |
|
Percent of exposure to counterparties with credit ratings |
|
| 100 | % |
|
| — | % |
Percent of exposure to counterparties with credit ratings |
|
| — | % |
|
| — | % |
60
NAVIENT CORPORATION
NOTES TO CONSOLIDATED FINANCIAL STATEMENTS
(Information at March 31, 2023 and for the three months ended
March 31, 2023 and 2022 is unaudited)
(Dollars in millions) |
| Corporate Contracts |
|
| Securitization Trust Contracts |
| ||
Exposure, net of collateral |
| $ | 15 |
|
| $ | — |
|
Percent of exposure to counterparties with credit ratings below S&P AA- or Moody’s Aa3 |
|
| 100 | % |
|
| — | % |
Percent of exposure to counterparties with credit ratings below S&P A- or Moody’s A3 |
|
| 32 | % |
|
| — | % |
5. Other Assets
The following table provides the detail of our other assets.
(Dollars in millions) |
| March 31, 2022 |
|
| December 31, 2021 |
|
| March 31, 2023 |
|
| December 31, 2022 |
| ||||
Accrued interest receivable |
| $ | 1,834 |
|
| $ | 1,881 |
|
| $ | 2,043 |
|
| $ | 2,031 |
|
Benefit and insurance-related investments |
|
| 456 |
|
|
| 462 |
|
|
| 454 |
|
|
| 452 |
|
Income tax asset, net |
|
| 255 |
|
|
| 369 |
|
|
| 111 |
|
|
| 132 |
|
Derivatives at fair value |
|
| 151 |
|
|
| 218 |
|
|
| 73 |
|
|
| 56 |
|
Accounts receivable |
|
| 109 |
|
|
| 159 |
|
|
| 78 |
|
|
| 83 |
|
Fixed assets |
|
| 91 |
|
|
| 95 |
|
|
| 69 |
|
|
| 74 |
|
Other |
|
| 15 |
|
|
| 39 |
|
|
| 28 |
|
|
| 38 |
|
Total |
| $ | 2,911 |
|
| $ | 3,223 |
|
| $ | 2,856 |
|
| $ | 2,866 |
|
61
NAVIENT CORPORATION
NOTES TO CONSOLIDATED FINANCIAL STATEMENTS
(Information at March 31, 20222023 and for the three months ended
March 31, 20222023 and 20212022 is unaudited)
6. Stockholders’ Equity
The following table summarizes common share repurchases, issuances and dividends paid.
|
| Three Months Ended March 31, |
| |||||
(Dollars and shares in millions, except per share amounts) |
| 2023 |
|
| 2022 |
| ||
Common stock repurchased(1) |
|
| 4.9 |
|
|
| 6.2 |
|
Common stock repurchased (in dollars)(1) |
| $ | 85 |
|
| $ | 115 |
|
Average purchase price per share(1) |
| $ | 17.40 |
|
| $ | 18.41 |
|
Remaining common stock repurchase authority(1) |
| $ | 515 |
|
| $ | 885 |
|
Shares repurchased related to employee stock-based compensation plans(2) |
|
| 1.3 |
|
|
| 1.1 |
|
Average purchase price per share(2) |
| $ | 18.44 |
|
| $ | 17.92 |
|
Common shares issued(3) |
|
| 2.4 |
|
|
| 2.4 |
|
Dividends paid |
| $ | 21 |
|
| $ | 24 |
|
Dividends per share |
| $ | .16 |
|
| $ | .16 |
|
|
| Three Months Ended March 31, |
| |||||
(Dollars and shares in millions, except per share amounts) |
| 2022 |
|
| 2021 |
| ||
Common stock repurchased(1) |
|
| 6.2 |
|
|
| 8.2 |
|
Common stock repurchased (in dollars)(1) |
| $ | 115 |
|
| $ | 100 |
|
Average purchase price per share(1) |
| $ | 18.41 |
|
| $ | 12.23 |
|
Remaining common stock repurchase authority(1) |
| $ | 885 |
|
| $ | 500 |
|
Shares repurchased related to employee stock- based compensation plans(2) |
|
| 1.1 |
|
|
| 2.2 |
|
Average purchase price per share(2) |
| $ | 17.92 |
|
| $ | 11.91 |
|
Common shares issued(3) |
|
| 2.4 |
|
|
| 3.6 |
|
Dividends paid |
| $ | 24 |
|
| $ | 29 |
|
Dividends per share |
| $ | .16 |
|
| $ | .16 |
|
|
|
|
|
|
|
The closing price of our common stock on March 31, 20222023 was $17.04.
$15.99.
62
NAVIENT CORPORATION
NOTES TO CONSOLIDATED FINANCIAL STATEMENTS
(Information at March 31, 2022 and for the three months ended
March 31, 2022 and 2021 is unaudited)
7. Earnings (Loss) per Common Share
Basic earnings (loss) per common share (EPS) are calculated using the weighted average number of shares of common stock outstanding during each period. A reconciliation of the numerators and denominators of the basic and diluted EPS calculations on a GAAP basis follows.
|
| Three Months Ended March 31, |
| |||||
(In millions, except per share data) |
| 2023 |
|
| 2022 |
| ||
Numerator: |
|
|
|
|
|
| ||
Net income |
| $ | 111 |
|
| $ | 255 |
|
Denominator: |
|
|
|
|
|
| ||
Weighted average shares used to compute basic EPS |
|
| 129 |
|
|
| 151 |
|
Effect of dilutive securities: |
|
|
|
|
|
| ||
Dilutive effect of stock options, restricted stock, |
|
| 1 |
|
|
| 2 |
|
Dilutive potential common shares(2) |
|
| 1 |
|
|
| 2 |
|
Weighted average shares used to compute |
|
| 130 |
|
|
| 153 |
|
Basic earnings per common share |
| $ | .87 |
|
| $ | 1.69 |
|
Diluted earnings per common share |
| $ | .86 |
|
| $ | 1.67 |
|
|
| Three Months Ended March 31, |
| |||||
(In millions, except per share data) |
| 2022 |
|
| 2021 |
| ||
Numerator: |
|
|
|
|
|
|
|
|
Net income |
| $ | 255 |
|
| $ | 370 |
|
Denominator: |
|
|
|
|
|
|
|
|
Weighted average shares used to compute basic EPS |
|
| 151 |
|
|
| 183 |
|
Effect of dilutive securities: |
|
|
|
|
|
|
|
|
Dilutive effect of stock options, restricted stock, restricted stock units, performance stock units, and Employee Stock Purchase Plan (ESPP)(1) |
|
| 2 |
|
|
| 2 |
|
Dilutive potential common shares(2) |
|
| 2 |
|
|
| 2 |
|
Weighted average shares used to compute diluted EPS |
|
| 153 |
|
|
| 185 |
|
Basic earnings per common share |
| $ | 1.69 |
|
| $ | 2.02 |
|
Diluted earnings per common share |
| $ | 1.67 |
|
| $ | 2.00 |
|
62
NAVIENT CORPORATION
NOTES TO CONSOLIDATED FINANCIAL STATEMENTS
(Information at March 31, 2023 and for the three months ended
March 31, 2023 and 2022 is unaudited)
|
|
|
|
8. Fair Value Measurements
We use estimates of fair value in applying various accounting standards in our financial statements. We categorize our fair value estimates based on a hierarchical framework associated with three levels of price transparency utilized in measuring financial instruments at fair value. See “Note 11 – Fair Value Measurements”The fair value of the items discussed below are separately disclosed in our 2021 Form 10-K for a full discussion.this footnote.
During the three months ended March 31, 2022,2023, there were no significant transfers of financial instruments between levels, or changes in our methodology used to value our financial instruments.
63
NAVIENT CORPORATION
NOTES TO CONSOLIDATED FINANCIAL STATEMENTS
(Information at March 31, 2022 and for the three months ended
March 31, 2022 and 2021 is unaudited)
8.Fair Value Measurements (Continued)
The following table summarizes the valuation of our financial instruments that are marked-to-market on a recurring basis. During the thirdfirst quarters of 20222023 and 2021,2022, there were no significant transfers of financial instruments between levels.
|
| Fair Value Measurements on a Recurring Basis |
| |||||||||||||||||||||||||||||
|
| March 31, 2023 |
|
| December 31, 2022 |
| ||||||||||||||||||||||||||
(Dollars in millions) |
| Level 1 |
|
| Level 2 |
|
| Level 3 |
|
| Total |
|
| Level 1 |
|
| Level 2 |
|
| Level 3 |
|
| Total |
| ||||||||
Assets |
|
|
|
|
|
|
|
|
|
|
|
|
|
|
|
|
|
|
|
|
|
|
|
| ||||||||
Derivative instruments:(1) |
|
|
|
|
|
|
|
|
|
|
|
|
|
|
|
|
|
|
|
|
|
|
|
| ||||||||
Interest rate swaps |
|
| — |
|
|
| 72 |
|
|
| 1 |
|
|
| 73 |
|
|
| — |
|
|
| 55 |
|
|
| 1 |
|
|
| 56 |
|
Cross-currency interest rate swaps |
|
| — |
|
|
| — |
|
|
| — |
|
|
| — |
|
|
| — |
|
|
| — |
|
|
| — |
|
|
| — |
|
Total derivative assets(2) |
|
| — |
|
|
| 72 |
|
|
| 1 |
|
|
| 73 |
|
|
| — |
|
|
| 55 |
|
|
| 1 |
|
|
| 56 |
|
Total |
| $ | — |
|
| $ | 72 |
|
| $ | 1 |
|
| $ | 73 |
|
| $ | — |
|
| $ | 55 |
|
| $ | 1 |
|
| $ | 56 |
|
Liabilities(3) |
|
|
|
|
|
|
|
|
|
|
|
|
|
|
|
|
|
|
|
|
|
|
|
| ||||||||
Derivative instruments(1) |
|
|
|
|
|
|
|
|
|
|
|
|
|
|
|
|
|
|
|
|
|
|
|
| ||||||||
Interest rate swaps |
| $ | — |
|
| $ | — |
|
| $ | (3 | ) |
| $ | (3 | ) |
| $ | — |
|
| $ | (2 | ) |
| $ | (3 | ) |
| $ | (5 | ) |
Floor Income Contracts |
|
| — |
|
|
| — |
|
|
| — |
|
|
| — |
|
|
| — |
|
|
| — |
|
|
| — |
|
|
| — |
|
Cross-currency interest rate swaps |
|
| — |
|
|
| — |
|
|
| (224 | ) |
|
| (224 | ) |
|
| — |
|
|
| — |
|
|
| (253 | ) |
|
| (253 | ) |
Total derivative liabilities(2) |
|
| — |
|
|
| — |
|
|
| (227 | ) |
|
| (227 | ) |
|
| — |
|
|
| (2 | ) |
|
| (256 | ) |
|
| (258 | ) |
Total |
| $ | — |
|
| $ | — |
|
| $ | (227 | ) |
| $ | (227 | ) |
| $ | — |
|
| $ | (2 | ) |
| $ | (256 | ) |
| $ | (258 | ) |
|
| Fair Value Measurements on a Recurring Basis |
| |||||||||||||||||||||||||||||
|
| March 31, 2022 |
|
| December 31, 2021 |
| ||||||||||||||||||||||||||
(Dollars in millions) |
| Level 1 |
|
| Level 2 |
|
| Level 3 |
|
| Total |
|
| Level 1 |
|
| Level 2 |
|
| Level 3 |
|
| Total |
| ||||||||
Assets |
|
|
|
|
|
|
|
|
|
|
|
|
|
|
|
|
|
|
|
|
|
|
|
|
|
|
|
|
|
|
|
|
Derivative instruments:(1) |
|
|
|
|
|
|
|
|
|
|
|
|
|
|
|
|
|
|
|
|
|
|
|
|
|
|
|
|
|
|
|
|
Interest rate swaps |
|
| — |
|
|
| 150 |
|
|
| 1 |
|
|
| 151 |
|
|
| — |
|
|
| 223 |
|
|
| 1 |
|
|
| 224 |
|
Cross-currency interest rate swaps |
|
| — |
|
|
| — |
|
|
| — |
|
|
| — |
|
|
| — |
|
|
| — |
|
|
| — |
|
|
| — |
|
Total derivative assets(2) |
|
| — |
|
|
| 150 |
|
|
| 1 |
|
|
| 151 |
|
|
| — |
|
|
| 223 |
|
|
| 1 |
|
|
| 224 |
|
Total |
| $ | — |
|
| $ | 150 |
|
| $ | 1 |
|
| $ | 151 |
|
| $ | — |
|
| $ | 223 |
|
| $ | 1 |
|
| $ | 224 |
|
Liabilities(3) |
|
|
|
|
|
|
|
|
|
|
|
|
|
|
|
|
|
|
|
|
|
|
|
|
|
|
|
|
|
|
|
|
Derivative instruments(1) |
|
|
|
|
|
|
|
|
|
|
|
|
|
|
|
|
|
|
|
|
|
|
|
|
|
|
|
|
|
|
|
|
Interest rate swaps |
| $ | — |
|
| $ | — |
|
| $ | (4 | ) |
| $ | (4 | ) |
| $ | — |
|
| $ | — |
|
| $ | (5 | ) |
| $ | (5 | ) |
Floor Income Contracts |
|
| — |
|
|
| (9 | ) |
|
| — |
|
|
| (9 | ) |
|
| — |
|
|
| (65 | ) |
|
| — |
|
|
| (65 | ) |
Cross-currency interest rate swaps |
|
| — |
|
|
| — |
|
|
| (226 | ) |
|
| (226 | ) |
|
| — |
|
|
| — |
|
|
| (190 | ) |
|
| (190 | ) |
Total derivative liabilities(2) |
|
| — |
|
|
| (9 | ) |
|
| (230 | ) |
|
| (239 | ) |
|
| — |
|
|
| (65 | ) |
|
| (195 | ) |
|
| (260 | ) |
Total |
| $ | — |
|
| $ | (9 | ) |
| $ | (230 | ) |
| $ | (239 | ) |
| $ | — |
|
| $ | (65 | ) |
| $ | (195 | ) |
| $ | (260 | ) |
|
|
|
|
|
|
6463
NAVIENT CORPORATION
NOTES TO CONSOLIDATED FINANCIAL STATEMENTS
(Information at March 31, 20222023 and for the three months ended
March 31, 20222023 and 20212022 is unaudited)
8. Fair Value Measurements (Continued)
The following tables summarize the change in balance sheet carrying value associated with level 3 financial instruments carried at fair value on a recurring basis.
|
| Three Months Ended March 31, |
| |||||||||||||||||||||||||||||
|
| 2023 |
|
| 2022 |
| ||||||||||||||||||||||||||
|
| Derivative instruments |
|
| Derivative instruments |
| ||||||||||||||||||||||||||
(Dollars in millions) |
| Interest |
|
| Cross |
|
| Other |
|
| Total |
|
| Interest |
|
| Cross |
|
| Other |
|
| Total |
| ||||||||
Balance, beginning of |
| $ | (2 | ) |
| $ | (253 | ) |
| $ | — |
|
| $ | (255 | ) |
| $ | (4 | ) |
| $ | (190 | ) |
| $ | — |
|
| $ | (194 | ) |
Total gains/(losses): |
|
|
|
|
|
|
|
|
|
|
|
|
|
|
|
|
|
|
|
|
|
|
|
| ||||||||
Included in earnings(1) |
|
| — |
|
|
| 15 |
|
|
| — |
|
|
| 15 |
|
|
| 1 |
|
|
| (41 | ) |
|
| — |
|
|
| (40 | ) |
Included in other |
|
| — |
|
|
| — |
|
|
| — |
|
|
| — |
|
|
| — |
|
|
| — |
|
|
| — |
|
|
| — |
|
Settlements |
|
| — |
|
|
| 14 |
|
|
| — |
|
|
| 14 |
|
|
| — |
|
|
| 5 |
|
|
| — |
|
|
| 5 |
|
Transfers in and/or out |
|
| — |
|
|
| — |
|
|
| — |
|
|
| — |
|
|
| — |
|
|
| — |
|
|
| — |
|
|
| — |
|
Balance, end of period |
| $ | (2 | ) |
| $ | (224 | ) |
| $ | — |
|
| $ | (226 | ) |
| $ | (3 | ) |
| $ | (226 | ) |
| $ | — |
|
| $ | (229 | ) |
Change in mark-to- |
| $ | — |
|
| $ | 29 |
|
| $ | — |
|
| $ | 29 |
|
| $ | 1 |
|
| $ | (36 | ) |
| $ | — |
|
| $ | (35 | ) |
|
| Three Months Ended March 31, |
| |||||||||||||||||||||||||||||
|
| 2022 |
|
| 2021 |
| ||||||||||||||||||||||||||
|
| Derivative instruments |
|
| Derivative instruments |
| ||||||||||||||||||||||||||
(Dollars in millions) |
| Interest Rate Swaps |
|
| Cross Currency Interest Rate Swaps |
|
| Other |
|
| Total Derivative Instruments |
|
| Interest Rate Swaps |
|
| Cross Currency Interest Rate Swaps |
|
| Other |
|
| Total Derivative Instruments |
| ||||||||
Balance, beginning of period |
| $ | (4 | ) |
| $ | (190 | ) |
| $ | — |
|
| $ | (194 | ) |
| $ | (8 | ) |
| $ | (294 | ) |
| $ | — |
|
| $ | (302 | ) |
Total gains/(losses): |
|
|
|
|
|
|
|
|
|
|
|
|
|
|
|
|
|
|
|
|
|
|
|
|
|
|
|
|
|
|
|
|
Included in earnings(1) |
|
| 1 |
|
|
| (41 | ) |
|
| 0 |
|
|
| (40 | ) |
|
| 1 |
|
|
| 62 |
|
|
| — |
|
|
| 63 |
|
Included in other comprehensive income |
|
| 0 |
|
|
| 0 |
|
|
| 0 |
|
|
| 0 |
|
|
| 0 |
|
|
| 0 |
|
|
| 0 |
|
|
| 0 |
|
Settlements |
|
| 0 |
|
|
| 5 |
|
|
| 0 |
|
|
| 5 |
|
|
| — |
|
|
| 7 |
|
|
| — |
|
|
| 7 |
|
Transfers in and/or out of level 3 |
|
| 0 |
|
|
| 0 |
|
|
| 0 |
|
|
| 0 |
|
|
| 0 |
|
|
| 0 |
|
|
| 0 |
|
|
| 0 |
|
Balance, end of period |
| $ | (3 | ) |
| $ | (226 | ) |
| $ | 0 |
|
| $ | (229 | ) |
| $ | (7 | ) |
| $ | (225 | ) |
| $ | — |
|
| $ | (232 | ) |
Change in mark-to-market gains/(losses) relating to instruments still held at the reporting date(2) |
| $ | 1 |
|
| $ | (36 | ) |
| $ | 0 |
|
| $ | (35 | ) |
| $ | 1 |
|
| $ | (91 | ) |
| $ | — |
|
| $ | (90 | ) |
|
|
|
| Three Months Ended March 31, |
| |||||
(Dollars in millions) |
| 2023 |
|
| 2022 |
| ||
Gains (losses) on derivative and hedging activities, net |
| $ | — |
|
| $ | 1 |
|
Interest expense |
|
| 15 |
|
|
| (41 | ) |
Total |
| $ | 15 |
|
| $ | (40 | ) |
|
| Three Months Ended March 31, |
| |||||
(Dollars in millions) |
| 2022 |
|
| 2021 |
| ||
Gains (losses) on derivative and hedging activities, net |
| $ | 1 |
|
| $ | 1 |
|
Interest expense |
|
| (41 | ) |
|
| 62 |
|
Total |
| $ | (40 | ) |
| $ | 63 |
|
|
|
6564
NAVIENT CORPORATION
NOTES TO CONSOLIDATED FINANCIAL STATEMENTS
(Information at March 31, 20222023 and for the three months ended
March 31, 20222023 and 20212022 is unaudited)
8. Fair Value Measurements (Continued)
The following table presents the significant inputs that are unobservable or from inactive markets used in the recurring valuations of the level 3 financial instruments detailed above.
(Dollars in millions) |
| Fair Value at March 31, 2023 |
|
| Valuation |
| Input |
| Range and | |
Derivatives |
|
|
|
|
|
|
|
|
| |
Prime/LIBOR basis swaps |
| $ | (2 | ) |
| Discounted cash flow |
| Constant Prepayment Rate |
| 10% |
|
|
|
|
|
|
| Bid/ask adjustment to |
| .08% | |
Cross-currency interest rate swaps |
|
| (224 | ) |
| Discounted cash flow |
| Constant Prepayment Rate |
| 5% |
Other |
|
| — |
|
|
|
|
|
|
|
Total |
| $ | (226 | ) |
|
|
|
|
|
|
|
|
|
|
|
|
|
|
|
| |
(Dollars in millions) |
| Fair Value at March 31, 2022 |
|
| Valuation Technique |
| Input |
| Range and Weighted Average |
| ||
Derivatives |
|
|
|
|
|
|
|
|
|
|
|
|
Prime/LIBOR basis swaps |
| $ | (3 | ) |
| Discounted cash flow |
| Constant Prepayment Rate |
| 9% |
| |
|
|
|
|
|
|
|
| Bid/ask adjustment to discount rate |
| .08% |
| |
Cross-currency interest rate swaps |
|
| (226 | ) |
| Discounted cash flow |
| Constant Prepayment Rate |
| 5% |
| |
Other |
|
| — |
|
|
|
|
|
|
|
|
|
Total |
| $ | (229 | ) |
|
|
|
|
|
|
|
|
|
|
|
|
|
|
|
|
|
|
|
|
|
The following table summarizes the fair values of our financial assets and liabilities, including derivative financial instruments.
|
| March 31, 2022 |
|
| December 31, 2021 |
|
| March 31, 2023 |
|
| December 31, 2022 |
| ||||||||||||||||||||||||||||||||||||
(Dollars in millions) |
| Fair Value |
|
| Carrying Value |
|
| Difference |
|
| Fair Value |
|
| Carrying Value |
|
| Difference |
|
| Fair |
|
| Carrying |
|
| Difference |
|
| Fair |
|
| Carrying |
|
| Difference |
| ||||||||||||
Earning assets |
|
|
|
|
|
|
|
|
|
|
|
|
|
|
|
|
|
|
|
|
|
|
|
|
|
|
|
|
|
|
|
|
|
|
|
|
|
|
|
|
|
| ||||||
FFELP Loans |
| $ | 50,375 |
|
| $ | 51,013 |
|
| $ | (638 | ) |
| $ | 53,632 |
|
| $ | 52,641 |
|
| $ | 991 |
|
| $ | 39,970 |
|
| $ | 42,148 |
|
| $ | (2,178 | ) |
| $ | 41,426 |
|
| $ | 43,525 |
|
| $ | (2,099 | ) |
Private Education Loans |
|
| 20,213 |
|
|
| 20,088 |
|
|
| 125 |
|
|
| 21,140 |
|
|
| 20,171 |
|
|
| 969 |
|
|
| 17,530 |
|
|
| 18,275 |
|
|
| (745 | ) |
|
| 17,880 |
|
|
| 18,725 |
|
|
| (845 | ) |
Cash and investments |
|
| 3,424 |
|
|
| 3,424 |
|
|
| — |
|
|
| 3,845 |
|
|
| 3,845 |
|
|
| — |
|
|
| 2,931 |
|
|
| 2,931 |
|
|
| — |
|
|
| 4,974 |
|
|
| 4,974 |
|
|
| — |
|
Total earning assets |
|
| 74,012 |
|
|
| 74,525 |
|
|
| (513 | ) |
|
| 78,617 |
|
|
| 76,657 |
|
|
| 1,960 |
|
|
| 60,431 |
|
|
| 63,354 |
|
|
| (2,923 | ) |
|
| 64,280 |
|
|
| 67,224 |
|
|
| (2,944 | ) |
Interest-bearing liabilities |
|
|
|
|
|
|
|
|
|
|
|
|
|
|
|
|
|
|
|
|
|
|
|
|
|
|
|
|
|
|
|
|
|
|
|
|
|
|
|
|
|
| ||||||
Short-term borrowings |
|
| 3,813 |
|
|
| 3,802 |
|
|
| (11 | ) |
|
| 2,492 |
|
|
| 2,490 |
|
|
| (2 | ) |
|
| 5,758 |
|
|
| 5,753 |
|
|
| (5 | ) |
|
| 5,879 |
|
|
| 5,870 |
|
|
| (9 | ) |
Long-term borrowings |
|
| 69,515 |
|
|
| 70,825 |
|
|
| 1,310 |
|
|
| 74,548 |
|
|
| 74,488 |
|
|
| (60 | ) |
|
| 54,261 |
|
|
| 57,388 |
|
|
| 3,127 |
|
|
| 57,652 |
|
|
| 61,026 |
|
|
| 3,374 |
|
Total interest-bearing liabilities |
|
| 73,328 |
|
|
| 74,627 |
|
|
| 1,299 |
|
|
| 77,040 |
|
|
| 76,978 |
|
|
| (62 | ) |
|
| 60,019 |
|
|
| 63,141 |
|
|
| 3,122 |
|
|
| 63,531 |
|
|
| 66,896 |
|
|
| 3,365 |
|
Derivative financial instruments |
|
|
|
|
|
|
|
|
|
|
|
|
|
|
|
|
|
|
|
|
|
|
|
|
|
|
|
|
|
|
|
|
|
|
|
|
|
|
|
|
|
| ||||||
Floor Income Contracts |
|
| (9 | ) |
|
| (9 | ) |
|
| — |
|
|
| (65 | ) |
|
| (65 | ) |
|
| — |
|
|
| — |
|
|
| — |
|
|
| — |
|
|
| — |
|
|
| — |
|
|
| — |
|
Interest rate swaps |
|
| 147 |
|
|
| 147 |
|
|
| — |
|
|
| 219 |
|
|
| 219 |
|
|
| — |
|
|
| 70 |
|
|
| 70 |
|
|
| — |
|
|
| 51 |
|
|
| 51 |
|
|
| — |
|
Cross-currency interest rate swaps |
|
| (226 | ) |
|
| (226 | ) |
|
| — |
|
|
| (190 | ) |
|
| (190 | ) |
|
| — |
|
|
| (224 | ) |
|
| (224 | ) |
|
| — |
|
|
| (253 | ) |
|
| (253 | ) |
|
| — |
|
Other |
|
| — |
|
|
| — |
|
|
| — |
|
|
| — |
|
|
| — |
|
|
| — |
|
|
| — |
|
|
| — |
|
|
| — |
|
|
| — |
|
|
| — |
|
|
| — |
|
Excess of net asset fair value over carrying value |
|
|
|
|
|
|
|
|
| $ | 786 |
|
|
|
|
|
|
|
|
|
| $ | 1,898 |
|
|
|
|
|
|
|
| $ | 199 |
|
|
|
|
|
|
|
| $ | 421 |
| ||||
6665
NAVIENT CORPORATION
NOTES TO CONSOLIDATED FINANCIAL STATEMENTS
(Information at March 31, 20222023 and for the three months ended
March 31, 20222023 and 20212022 is unaudited)
9. Commitments, Contingencies and ContingenciesGuarantees
Legal Proceedings
We and our subsidiaries and affiliates are subject to various claims, lawsuits and other actions that arise in the normal course of business. We believe that these claims, lawsuits and other actions will not, individually or in the aggregate, have a material adverse effect on our business, financial condition or results of operations, except as otherwise disclosed. Most of these matters are claims including individual and class action lawsuits against our servicing or business processing subsidiaries alleging the violation of state or federal laws in connection with servicing or collection activities on their education loans and other debts.
In the ordinary course of our business, the Company and our subsidiaries and affiliates receive information and document requests and investigative demands from various entities including State Attorneys General, U.S. Attorneys, legislative committees, individual members of Congress and administrative agencies. These requests may be informational, regulatory or enforcement in nature and may relate to our business practices, the industries in which we operate, or companies with whom we conduct business. Generally, our practice has been and continues to be to cooperate with these bodies and to be responsive to any such requests.
The number of these inquiries and the volume of related information demands continue to increase and therefore continue to increase the time, costs and resources we must dedicate to timely respond to these requests and may, depending on their outcome, result in payments of restitution, fines and penalties.
Certain Cases
DuringIn January 2017, the Consumer Financial Protection Bureau (the CFPB) and Attorneys General for the State of Illinois and the State of Washington initiated civil actions naming Navient Corporation and several of its subsidiaries as defendants alleging violations of certain Federal and State consumer protection statutes, including the CFPA, FCRA, FDCPA and various state consumer protection laws. The Attorneys General for the States of Pennsylvania, California, Mississippi, and New Jersey also initiated actions against the Company and certain subsidiaries alleging violations of various state and federal consumer protection laws based upon similar alleged acts or failures to act. In addition to these matters, a number of lawsuits have been filed by nongovernmental parties or, in the future, may be filed by additional governmental or nongovernmental parties seeking damages or other remedies related to similar issues raised by the CFPB and the State Attorneys General. In January 2022, we entered into a series of Consent Judgment and Orders (the “Agreements”) with 40 State Attorneys General to resolve all matters in dispute related to the State Attorneys General cases as well as the related investigations, subpoenas, civil investigative demands and inquiries from various other state regulators. These Agreements do not resolve the litigation involving the Company and the CFPB.
As the Company has previously stated, we believe the allegations in the CFPB suit are false and that they improperly seek to impose penalties on Navient based on new, previously unannounced servicing standards applied retroactively against only one servicer. We therefore have denied these allegations and are vigorously defending against the allegations in that case. At this point in time, it is reasonably possible that a loss contingency exists; however, the Company is unable to anticipate the timing of a resolution or the impact that an adverse ruling in the CFPB case may have on the Company’s consolidated financial position, liquidity, results of operation or cash flows. As a result, it is not possible at this time to estimate a range of potential exposure, if any, for amounts that may be payable in connection with this matter and reserves have not been established. It is possible that an adverse ruling or rulings may have a material adverse impact on the Company.
On April 12, 2023, the Company reached an agreement in principle (“Settlement”) with certain plaintiffs for a nationwide settlement of claims raised in the following bankruptcy adversary actions: Coyle v. Navient Solutions, LLC, No. 22-80018 (Bankr. W.D. Mich.); Homaidan v. SLM Corp., No. 1:17-ap-01085 (Bankr. E.D.N.Y.); Mazloom v. Navient Solutions, LLC, No. 20-80033-6 (Bankr. N.D.N.Y.); and Woodard v. Navient Solutions, LLC, No. 08-81442 (Bankr. D. Neb.) collectively referred to as the “Bankruptcy Cases.” This settlement in principle is subject, among other things, to final documentation and final court approval. Under the Settlement, Navient will forego the collection of defined balances for borrowers or co-borrowers of certain private loans — all of which were originated prior to our company separation — who have received a discharge in bankruptcy during the periods covered by the agreements. As a result, we recorded $23 million additional private loan provision for loan losses in the first quarter of 2016, Navient Corporation, certain Navient officers and directors, and2023 related to the underwriters of certain Navient securities offerings were sued in three putative securities class action lawsuits filed on behalf of certain investors in Navient stock or Navient unsecured debt. These 3 cases, which were filedestimated future charge offs that are expected to occur. The Company has also agreed to fund settlement funds. It anticipates that any cash contribution it will be required to make to these funds will not exceed $44 million in the U.S. District Courtaggregate and will be fully covered by insurance. The net impact to operating expense for this element of the settlement for the Districtfirst quarter of Delaware, were consolidated by2023 was $0 due to the District Court, with Lord Abbett Funds appointed as Lead Plaintiff. The captionaccrual of the consolidated case is offsetting insurance reimbursements.
Lord Abbett Affiliated Fund, Inc., et al. v. Navient Corporation, et al. Additionally, two putative class actions have been filed in the U.S. District Court
66
NAVIENT CORPORATION
NOTES TO CONSOLIDATED FINANCIAL STATEMENTS
(Information at March 31, 2023 and for the District of New Jersey captioned three months endedEli Pope v. Navient Corporation, John F. Remondi, Somsak Chivavibul
March 31, 2023 and Christian Lown, 2022 is unaudited)and Melvin Gross v. Navient Corporation, John F. Remondi, Somsak Chivavibul and Christian M. Lown, both of which
allege violations of the federal securities laws under Sections 10(b)
9.Commitments, Contingencies and 20(a) of the Securities Exchange Act of 1934. The cases were consolidated by the Court in February 2018 under the caption In Re Navient Corporation Securities Litigation Guarantees (Continued)and the plaintiffs filed a consolidated amended complaint in April 2018. In the third quarter of 2021, the Company reached tentative agreements to settle both cases. The settlements, in which the Company and other defendants expressly deny any admission or concession of wrongdoing or fault, have received final court approval and are covered by insurance.
Regulatory Matters
The Company has been named as defendant in a number of putative class action cases alleging violations of various state and federal consumer protection laws including the Telephone Consumer Protection Act (TCPA), the Consumer Financial Protection Act of 2010 (CFPA), the Fair Credit Reporting Act (FCRA), the Fair Debt Collection Practices Act (FDCPA), in adversarial proceedings under the U.S. Bankruptcy Code, and various state consumer protection laws. At this point in time, the Company is unable to anticipate the timing of a resolution or the impact that these legal proceedings may have on the Company’s consolidated financial position, liquidity, results of operation or cash flows. As a result, it is not possible at this time to estimate a range of potential exposure, if any, for amounts that may be payable in connection with these matters and reserves have not been established. It is possible that an adverse ruling or rulings may have a material adverse impact on the Company.
67
NAVIENT CORPORATION
NOTES TO CONSOLIDATED FINANCIAL STATEMENTS
(Information at March 31, 2022 and for the three months ended
March 31, 2022 and 2021 is unaudited)
9.Commitments and Contingencies (Continued)
In January 2017, the Consumer Financial Protection Bureau (the CFPB) and Attorneys General for the State of Illinois and the State of Washington initiated civil actions naming Navient Corporation and several of its subsidiaries as defendants alleging violations of certain Federal and State consumer protection statutes, including the CFPA, FCRA, FDCPA and various state consumer protection laws. The Attorneys General for the States of Pennsylvania, California, Mississippi, and New Jersey also initiated actions against the Company and certain subsidiaries alleging violations of various state and federal consumer protection laws based upon similar alleged acts or failures to act. In addition to these matters, a number of lawsuits have been filed by nongovernmental parties or, in the future, may be filed by additional governmental or nongovernmental parties seeking damages or other remedies related to similar issues raised by the CFPB and the State Attorneys General. In January 2022, we entered into a series of Consent Judgment and Orders (the “Agreements”) with 40 State Attorneys General to resolve all matters in dispute related to the State Attorneys General cases as well as the related investigations, subpoenas, civil investigative demands and inquiries from various other state regulators. These Agreements do not resolve the litigation involving the Company and the CFPB. The Company will cancel the loan balance of approximately 66,000 borrowers with qualifying private education loans that were originated largely between 2002 and 2010 and later defaulted and charged off. The loans to be cancelled have aggregate outstanding balances of approximately $1.7 billion. The expense to the Company to cancel these loans is approximately $50 million which represents the amount of expected future recoveries of these charged-off loans on the balance sheet. In addition, the Company agreed to make a one-time payment of approximately $145 million to the states. In the fourth quarter of 2021 when such loss became probable, the Company recognized total regulatory expenses of approximately $205 million related to this matter.
As the Company has previously stated, we believe the allegations in the CFPB suit are false and that they improperly seek to impose penalties on Navient based on new, previously unannounced servicing standards applied retroactively against only one servicer. We therefore have denied these allegations and are vigorously defending against the allegations in that case. At this point in time, it is reasonably possible that a loss contingency exists; however, the Company is unable to anticipate the timing of a resolution or the impact that an adverse ruling in the CFPB case may have on the Company’s consolidated financial position, liquidity, results of operation or cash flows. As a result, it is not possible at this time to estimate a range of potential exposure, if any, for amounts that may be payable in connection with this matter and reserves have not been established. It is possible that an adverse ruling or rulings may have a material adverse impact on the Company.
Regulatory Matters
In addition, Navient and its subsidiaries are subject to examination or regulation by various federal regulatory, state licensing or other regulatory agencies as part of its ordinary course of business including the SEC, CFPB, FFIEC and ED. Items or matters similar to or different from those described above may arise during the course of those examinations. We also routinely receive inquiries or requests from various regulatory entities or bodies or government agencies concerning our business or our assets. Generally, the Company endeavors to cooperate with each such inquiry or request. The Company has received separate CIDs or subpoenas from multiple State Attorneys General, including for the District of Columbia, Kansas, Oregon, Colorado, New Jersey, New York and Indiana that are similar to the CIDs or subpoenas that preceded the lawsuits referenced above. Those CIDs and subpoenas have been resolved as part of the Company’s settlement with the State Attorneys General. Nevertheless, we have and, in the future, may receive additional CIDs or subpoenas and other inquiries from these or other Attorneys General with respect to similar or different matters.
Under the terms of the Separation and Distribution Agreement between the Company and SLM BankCo, Navient agreed to indemnify SLM BankCo for claims, actions, damages, losses or expenses that may arise from the conduct of activities of pre-Spin-Off SLM BankCo occurring prior to the Spin-Off other than those specifically excluded in that agreement. Also, as part of the Separation and Distribution Agreement, SLM BankCo agreed to indemnify Navient for certain claims, actions, damages, losses or expenses subject to the terms, conditions and limitations set forth in that agreement. As a result, subject to the terms, conditions and limitations set forth in that agreement, Navient agreed to indemnify and hold harmless Sallie Mae and its subsidiaries, including Sallie Mae Bank from liabilities arising out of the regulatory matters and CFPB and State Attorneys General lawsuits mentioned above. In addition, we asserted various claims for indemnification against Sallie Mae and Sallie Mae Bank for such specifically excluded items arising out of the CFPB and the State Attorneys General lawsuits if and to the extent any indemnified liabilities exist now or in the future toward conclusion.future. Navient has 0no reserves related to indemnification matters with SLM BankCo as of March 31, 2022.2023.
Contingencies
68
NAVIENT CORPORATION
NOTES TO CONSOLIDATED FINANCIAL STATEMENTS
(Information at March 31, 2022 and for the three months ended
March 31, 2022 and 2021 is unaudited)
9.Commitments and Contingencies (Continued)
OIG Audit
The Office of the Inspector General (the OIG) of ED commenced an audit regarding Special Allowance Payments (SAP) on September 10, 2007. In September 2013, we received the final audit determination of Federal Student Aid (the Final Audit Determination) on the final audit report issued by the OIG in August 2009 related to this audit. The Final Audit Determination concurred with the final audit report issued by the OIG and instructed us to make adjustment to our government billing to reflect the policy determination. In August 2016, we filed our notice of appeal to the Administrative Actions and Appeals Service Group of ED, and a hearing was held in April 2017. In March 2019, the administrative law judge hearing the appeal affirmed the audit’s findings, holding the then-existing Dear Colleague letter relied upon by the Company and other industry participants was inconsistent with the statutory framework creating the SAP rules applicable to loans funded by certain types of debt obligations at issue. We appealed the administrative law judge’s decision to the Secretary of Education given Navient’s adherence to ED-issued guidance and the potential impact on participants in any ED program student loan servicers if such guidance is deemed unreliable and may not be relied upon. In January 2021, the Acting Secretary of Education upheld the decision of the administrative law judge. In March 2021, we filed a complaint for declaratory judgment in federal court seeking to set aside the Acting Secretary’s decision. We continue to believe that our SAP billing practices were proper, considering then-existing ED guidance and lack of applicable regulations. We filed a lawsuit in federal court challenging the Acting Secretary’s decision. That case is pending. The Company first established a reserve for this matter in 2014 and increased the reserve in 2020 in response to the decision by the Acting Secretary. We do not believe, at this time, that an adverse ruling will have a material effect on the Company as a whole.
Contingencies
In the ordinary course of business, we and our subsidiaries are defendants in or parties to pending and threatened legal actions and proceedings including actions brought on behalf of various classes of claimants. These actions and proceedings may be based on alleged violations of consumer protection, securities, employment and other laws. In certain of these actions and proceedings, claims for substantial monetary damage are asserted against us and our subsidiaries. We and our subsidiaries are also subject to potential unasserted claims by third parties.
In the ordinary course of business, we and our subsidiaries are subject to regulatory examinations, information gathering requests, inquiries and investigations. In connection with formal and informal inquiries in these cases, we and our subsidiaries receive requests, subpoenas and orders for documents, testimony and information in connection with various aspects of our regulated activities.
We are required to establish reserves for litigation and regulatory matters where those matters present loss contingencies that are both probable and estimable. When loss contingencies are not both probable and estimable, we do not establish reserves.
In view of the inherent difficulty of predicting the outcome of litigation and regulatory matters, we may not be able to predict what the eventual outcome of the pending matters will be, what the timing or the ultimate resolution of these matters will be, or what the eventual loss, fines or penalties, if any, related to each pending matter may be.
Based on current knowledge, reserves have been established for certain litigation, regulatory matters, and unasserted contract claims where the loss is both probable and estimable. Based on current knowledge, management does not believe that loss contingencies, if any, arising from pending investigations, litigation or regulatory matters will have a material adverse effect on our consolidated financial position, liquidity, results of operations or cash flows, except as otherwise disclosed.disclosed.
6967
NAVIENT CORPORATION
NOTES TO CONSOLIDATED FINANCIAL STATEMENTS
(Information at March 31, 20222023 and for the three months ended
March 31, 20222023 and 20212022 is unaudited)
68
NAVIENT CORPORATION
NOTES TO CONSOLIDATED FINANCIAL STATEMENTS
(Information at March 31, 2023 and for the three months ended
March 31, 2023 and 2022 is unaudited)
10. Revenue from Contracts with Customers Accounted for in Accordance with ASC 606
The following tables illustrate the disaggregation of revenue from contracts accounted for under ASC 606 with customers according to service type and client type by reportable operating segment.
Revenue by Service Type
|
| Three Months Ended March 31, |
|
| Three Months Ended March 31, |
| ||||||||||||||||||||||||||||||||||||||||||
|
| 2022 |
|
| 2021 |
|
| 2023 |
|
| 2022 |
| ||||||||||||||||||||||||||||||||||||
(Dollars in millions) |
| Federal Education Loans |
|
| Business Processing |
|
| Total Revenue |
|
| Federal Education Loans |
|
| Business Processing |
|
| Total Revenue |
|
| Federal Education Loans |
|
| Business Processing |
|
| Total Revenue |
|
| Federal Education Loans |
|
| Business Processing |
|
| Total Revenue |
| ||||||||||||
Federal Education Loan asset recovery services |
| $ | 1 |
|
| $ | — |
|
| $ | 1 |
|
| $ | 5 |
|
| $ | — |
|
| $ | 5 |
|
| $ | — |
|
| $ | — |
|
| $ | — |
|
| $ | 1 |
|
| $ | — |
|
| $ | 1 |
|
Government services |
|
| — |
|
|
| 49 |
|
|
| 49 |
|
|
| — |
|
|
| 63 |
|
|
| 63 |
|
|
| — |
|
|
| 40 |
|
|
| 40 |
|
|
| — |
|
|
| 49 |
|
|
| 49 |
|
Healthcare services |
|
| — |
|
|
| 45 |
|
|
| 45 |
|
|
| — |
|
|
| 62 |
|
|
| 62 |
|
|
| — |
|
|
| 32 |
|
|
| 32 |
|
|
| — |
|
|
| 45 |
|
|
| 45 |
|
Total |
| $ | 1 |
|
| $ | 94 |
|
| $ | 95 |
|
| $ | 5 |
|
| $ | 125 |
|
| $ | 130 |
|
| $ | — |
|
| $ | 72 |
|
| $ | 72 |
|
| $ | 1 |
|
| $ | 94 |
|
| $ | 95 |
|
|
|
|
|
|
|
|
|
|
|
|
|
|
|
|
|
|
|
|
|
|
|
|
|
| ||||||||||||||||||||||||
Revenue by Client Type
|
| Three Months Ended March 31, |
|
| Three Months Ended March 31, |
| ||||||||||||||||||||||||||||||||||||||||||
|
| 2022 |
|
| 2021 |
|
| 2023 |
|
| 2022 |
| ||||||||||||||||||||||||||||||||||||
(Dollars in millions) |
| Federal Education Loans |
|
| Business Processing |
|
| Total Revenue |
|
| Federal Education Loans |
|
| Business Processing |
|
| Total Revenue |
|
| Federal Education Loans |
|
| Business Processing |
|
| Total Revenue |
|
| Federal Education Loans |
|
| Business Processing |
|
| Total Revenue |
| ||||||||||||
Federal government |
| $ | — |
|
| $ | 2 |
|
| $ | 2 |
|
| $ | 1 |
|
| $ | 8 |
|
| $ | 9 |
|
| $ | — |
|
| $ | 2 |
|
| $ | 2 |
|
| $ | — |
|
| $ | 2 |
|
| $ | 2 |
|
Guarantor agencies |
|
| 1 |
|
|
| — |
|
|
| 1 |
|
|
| 4 |
|
|
| — |
|
|
| 4 |
|
|
| — |
|
|
| — |
|
|
| — |
|
|
| 1 |
|
|
| — |
|
|
| 1 |
|
Other institutions |
|
| — |
|
|
| — |
|
|
| — |
|
|
| — |
|
|
| — |
|
|
| — |
|
|
| — |
|
|
| — |
|
|
| — |
|
|
| — |
|
|
| — |
|
|
| — |
|
State and local government |
|
| — |
|
|
| 33 |
|
|
| 33 |
|
|
| — |
|
|
| 42 |
|
|
| 42 |
|
|
| — |
|
|
| 22 |
|
|
| 22 |
|
|
| — |
|
|
| 33 |
|
|
| 33 |
|
Tolling authorities |
|
| — |
|
|
| 14 |
|
|
| 14 |
|
|
| — |
|
|
| 13 |
|
|
| 13 |
|
|
| — |
|
|
| 16 |
|
|
| 16 |
|
|
| — |
|
|
| 14 |
|
|
| 14 |
|
Hospitals and other healthcare providers |
|
| — |
|
|
| 45 |
|
|
| 45 |
|
|
| — |
|
|
| 62 |
|
|
| 62 |
|
|
| — |
|
|
| 32 |
|
|
| 32 |
|
|
| — |
|
|
| 45 |
|
|
| 45 |
|
Total |
| $ | 1 |
|
| $ | 94 |
|
| $ | 95 |
|
| $ | 5 |
|
| $ | 125 |
|
| $ | 130 |
|
| $ | — |
|
| $ | 72 |
|
| $ | 72 |
|
| $ | 1 |
|
| $ | 94 |
|
| $ | 95 |
|
|
|
|
|
|
|
|
|
|
|
|
|
|
|
|
|
|
|
|
|
|
|
|
|
| ||||||||||||||||||||||||
As of March 31, 20222023 and March 31, 2021,2022, there was $90$68 million and $113$90 million respectively, of net accounts receivable related to these contracts. Navient had 0no material contract assets or contract liabilities.
7069
NAVIENT CORPORATION
NOTES TO CONSOLIDATED FINANCIAL STATEMENTS
(Information at March 31, 20222023 and for the three months ended
March 31, 20222023 and 20212022 is unaudited)
11. Segment Reporting
We monitor and assess our ongoing operations and results based on the following 4four reportable operating segments: Federal Education Loans, Consumer Lending, Business Processing and Other.
These segments meet the quantitative thresholds for reportable operating segments. Accordingly, the results of operations of these reportable operating segments are presented separately. The underlying operating segments are used by the Company’s chief operating decision maker to manage the business, review operating performance and allocate resources, and qualify to be aggregated as part of the primary reportable operating segments. As discussed further below, we measure the profitability of our operating segments based on Core Earnings net income. Accordingly, information regarding our reportable operating segments net income is provided on a Core Earnings basis.
Federal Education Loans Segment
In this segment, Navient owns FFELP Loans and performs servicing and asset recovery services on this portfolio. We also service and perform asset recovery services on FFELP Loans owned by other institutions. Our servicing quality, data-driven strategies and omnichannel education about federal repayment options translate into positive results for the millions of borrowers we serve.
We generate revenue primarily through net interest income on theour FFELP Loan portfolio as well as servicingLoans and asset recovery services revenue. This segment is expected to generate significant earnings and cash flow over the remaining life of the portfolio.servicing-related fee income.
The following table includes asset information for our Federal Education Loans segment.
(Dollars in millions) |
| March 31, 2023 |
|
| December 31, 2022 |
| ||
FFELP Loans, net |
| $ | 42,148 |
|
| $ | 43,525 |
|
Cash and investments(1) |
|
| 1,650 |
|
|
| 2,746 |
|
Other |
|
| 2,133 |
|
|
| 2,229 |
|
Total assets |
| $ | 45,931 |
|
| $ | 48,500 |
|
(Dollars in millions) |
| March 31, 2022 |
|
| December 31, 2021 |
| ||
FFELP Loans, net |
| $ | 51,013 |
|
| $ | 52,641 |
|
Cash and investments(1) |
|
| 1,879 |
|
|
| 2,071 |
|
Other |
|
| 2,008 |
|
|
| 2,183 |
|
Total assets |
| $ | 54,900 |
|
| $ | 56,895 |
|
|
|
Consumer Lending Segment
In this segment, Navient owns, originates acquires and services high-qualityin-school and refinance and in-school Private Education Loans. "In-school" Private Education Loans are loans originally made to borrowers while they are attending school whereas "Refinance" Private Education Loans are loans where a borrower has refinanced their education loans. We generate revenue primarily through net interest income on our Private Education Loan portfolio.
Navient helps students and families through the going-to and paying-for-college journey. Our digital tools empower people to find grants and scholarships, compare financial aid offers and complete the FAFSA. Our Private Education Loans offer easy-to-understand payment options. After graduation, we offer student loan refinancing to help people simplify their repayment and earn a better rate. We believe our more than 4550 years of experience, product design, digital marketing strategies, and origination and servicing platform provide a unique competitive advantage. We see meaningful growth opportunities in originating Private Education Loans to financially responsible consumers, generating attractive long-term, risk-adjusted returns. We generate revenue primarily through net interest income on our Private Education Loan portfolio.
The following table includes asset information for our Consumer Lending segmentsegment.
(Dollars in millions) |
| March 31, 2023 |
|
| December 31, 2022 |
| ||
Private Education Loans, net |
| $ | 18,275 |
|
| $ | 18,725 |
|
Cash and investments(1) |
|
| 635 |
|
|
| 617 |
|
Other |
|
| 558 |
|
|
| 453 |
|
Total assets |
| $ | 19,468 |
|
| $ | 19,795 |
|
(Dollars in millions) |
| March 31, 2022 |
|
| December 31, 2021 |
| ||
Private Education Loans, net |
| $ | 20,088 |
|
| $ | 20,171 |
|
Cash and investments(1) |
|
| 774 |
|
|
| 824 |
|
Other |
|
| 720 |
|
|
| 815 |
|
Total assets |
| $ | 21,582 |
|
| $ | 21,810 |
|
|
|
7170
NAVIENT CORPORATION
NOTES TO CONSOLIDATED FINANCIAL STATEMENTS
(Information at March 31, 20222023 and for the three months ended
March 31, 20222023 and 20212022 is unaudited)
11. Segment Reporting (Continued)
Business Processing Segment
In this segment, Navient performsprovides business processing solutions such as omnichannel contact center services, workflow processing, and revenue cycle optimization. We leverage the same expertise and intelligent tools we use to deliver successful results for over 600 governmentportfolios we own. Our support enables our clients to ensure better constituent outcomes, meet rapidly changing needs, improve technology, reduce operating expenses, manage risk and optimize revenue opportunities. Our clients include:
| providers and public health departments.
|
|
|
|
At March 31, 20222023 and December 31, 2021,2022, the Business Processing segment had total assets of $402$
Other Segment
This segment consists of our corporate liquidity portfolio, gains and losses incurred on the repurchase of debt, unallocated expenses of shared services (which includes regulatory expenses) and restructuring/other reorganization expenses.
Unallocated shared services expenses are comprised of costs primarily related to information technology costs related to infrastructure and operations, stock-based compensation expense, accounting, finance, legal, compliance and risk management, regulatory-related expenses, human resources, certain executive management and the board of directors. Regulatory-related expenses include actual settlement amounts as well as third-party professional fees we incur in connection with such regulatory matters and are presented net of any insurance reimbursements for covered costs related to such matters.
At March 31, 20222023 and December 31, 2021,2022, the Other segment had total assets of $1.3$1.1 billion and $1.5$2.1 billion, respectively.
7271
NAVIENT CORPORATION
NOTES TO CONSOLIDATED FINANCIAL STATEMENTS
(Information at March 31, 20222023 and for the three months ended
March 31, 20222023 and 20212022 is unaudited)
11. Segment Reporting (Continued)
Measure of Profitability
We prepare financial statements and present financial results in accordance with GAAP. However, we also evaluate our business segments and present financial results on a basis that differs from GAAP. We refer to this different basis of presentation as Core Earnings. We provide this Core Earnings basis of presentation on a consolidated basis and for each business segment because this is what we review internally when making management decisions regarding our performance and how we allocate resources. We also refer to this information in our presentations with credit rating agencies, lenders and investors. Because our Core Earnings basis of presentation corresponds to our segment financial presentations, we are required by GAAP to provide Core Earnings disclosure in the notes to our consolidated financial statements for our business segments.
Core Earnings are not a substitute for reported results under GAAP. We use Core Earnings to manage our business segments because Core Earnings reflect adjustments to GAAP financial results for two items, discussed below, that can create significant volatility mostly due to timing factors generally beyond the control of management. Accordingly, we believe that Core Earnings provide management with a useful basis from which to better evaluate results from ongoing operations against the business plan or against results from prior periods. Consequently, we disclose this information because we believe it provides investors with additional information regarding the operational and performance indicators that are most closely assessed by management. When compared to GAAP results, the two items we remove to result in our Core Earnings presentations are:
| 1. Mark-to-market gains/losses resulting from our use of derivative instruments to hedge our economic risks that do not qualify for hedge accounting treatment or do qualify for hedge accounting treatment but result in ineffectiveness; and 2. The accounting for goodwill and acquired intangible assets.
|
|
|
|
While GAAP provides a uniform, comprehensive basis of accounting, for the reasons described above, our Core Earnings basis of presentation does not. Core Earnings are subject to certain general and specific limitations that investors should carefully consider. For example, there is no comprehensive, authoritative guidance for management reporting. Our Core Earnings are not defined terms within GAAP and may not be comparable to similarly titled measures reported by other companies. Accordingly, our Core Earnings presentation does not represent a comprehensive basis of accounting. Investors, therefore, may not be able to compare our performance with that of other financial services companies based upon Core Earnings. Core Earnings results are only meant to supplement GAAP results by providing additional information regarding the operational and performance indicators that are most closely used by management, our board of directors, credit rating agencies, lenders and investors to assess performance.
7372
NAVIENT CORPORATION
NOTES TO CONSOLIDATED FINANCIAL STATEMENTS
(Information at March 31, 20222023 and for the three months ended
March 31, 20222023 and 20212022 is unaudited)
11. Segment Reporting (Continued)
Segment Results and Reconciliations to GAAP
|
| Three Months Ended March 31, 2023 |
| |||||||||||||||||||||||||||||||||
|
|
|
|
| Adjustments |
|
|
|
|
| Reportable Segments |
| ||||||||||||||||||||||||
(Dollars in millions) |
| Total |
|
| Reclassi- |
|
| Additions/ |
|
| Total |
|
| Total |
|
| Federal Education Loans |
|
| Consumer Lending |
|
| Business Processing |
|
| Other |
| |||||||||
Interest income: |
|
|
|
|
|
|
|
|
|
|
|
|
|
|
|
|
|
|
|
|
|
|
|
|
|
|
| |||||||||
Education loans |
| $ | 1,037 |
|
|
|
|
|
|
|
|
|
|
|
|
|
| $ | 695 |
|
| $ | 344 |
|
| $ | — |
|
| $ | — |
| ||||
Cash and investments |
|
| 34 |
|
|
|
|
|
|
|
|
|
|
|
|
|
|
| 20 |
|
|
| 6 |
|
|
| — |
|
|
| 8 |
| ||||
Total interest income |
|
| 1,071 |
|
|
|
|
|
|
|
|
|
|
|
|
|
|
| 715 |
|
|
| 350 |
|
|
| — |
|
|
| 8 |
| ||||
Total interest expense |
|
| 837 |
|
|
|
|
|
|
|
|
|
|
|
|
|
|
| 590 |
|
|
| 197 |
|
|
| — |
|
|
| 33 |
| ||||
Net interest income |
|
| 234 |
|
| $ | 12 |
|
| $ | 7 |
|
| $ | 19 |
|
| $ | 253 |
|
|
| 125 |
|
|
| 153 |
|
|
| — |
|
|
| (25 | ) |
Less: provisions for loan |
|
| (14 | ) |
|
|
|
|
|
|
|
|
|
|
| (14 | ) |
|
| 10 |
|
|
| (24 | ) |
|
| — |
|
|
| — |
| |||
Net interest income |
|
| 248 |
|
|
|
|
|
|
|
|
|
|
|
|
|
|
| 115 |
|
|
| 177 |
|
|
| — |
|
|
| (25 | ) | ||||
Other income (loss): |
|
|
|
|
|
|
|
|
|
|
|
|
|
|
|
|
|
|
|
|
|
|
|
|
|
|
| |||||||||
Servicing revenue |
|
| 17 |
|
|
|
|
|
|
|
|
|
|
|
|
|
|
| 14 |
|
|
| 3 |
|
|
| — |
|
|
| — |
| ||||
Asset recovery and |
|
| 72 |
|
|
|
|
|
|
|
|
|
|
|
|
|
|
| — |
|
|
| — |
|
|
| 72 |
|
|
| — |
| ||||
Other income (loss) |
|
| (1 | ) |
|
|
|
|
|
|
|
|
|
|
|
|
|
| 5 |
|
|
| — |
|
|
| — |
|
|
| 2 |
| ||||
Total other income |
|
| 88 |
|
|
| (12 | ) |
|
| 20 |
|
|
| 8 |
|
|
| 96 |
|
|
| 19 |
|
|
| 3 |
|
|
| 72 |
|
|
| 2 |
|
Expenses: |
|
|
|
|
|
|
|
|
|
|
|
|
|
|
|
|
|
|
|
|
|
|
|
|
|
|
| |||||||||
Direct operating |
|
| 124 |
|
|
|
|
|
|
|
|
|
|
|
|
|
|
| 20 |
|
|
| 37 |
|
|
| 67 |
|
|
| — |
| ||||
Unallocated shared |
|
| 61 |
|
|
|
|
|
|
|
|
|
|
|
|
|
|
| — |
|
|
| — |
|
|
| — |
|
|
| 61 |
| ||||
Operating expenses |
|
| 185 |
|
|
| — |
|
|
| — |
|
|
| — |
|
|
| 185 |
|
|
| 20 |
|
|
| 37 |
|
|
| 67 |
|
|
| 61 |
|
Goodwill and acquired |
|
| 3 |
|
|
| — |
|
|
| (3 | ) |
|
| (3 | ) |
|
| — |
|
|
| — |
|
|
| — |
|
|
| — |
|
|
| — |
|
Restructuring/other |
|
| 4 |
|
|
| — |
|
|
| — |
|
|
| — |
|
|
| 4 |
|
|
| — |
|
|
| — |
|
|
| — |
|
|
| 4 |
|
Total expenses |
|
| 192 |
|
|
| — |
|
|
| (3 | ) |
|
| (3 | ) |
|
| 189 |
|
|
| 20 |
|
|
| 37 |
|
|
| 67 |
|
|
| 65 |
|
Income (loss) before |
|
| 144 |
|
|
| — |
|
|
| 30 |
|
|
| 30 |
|
|
| 174 |
|
|
| 114 |
|
|
| 143 |
|
|
| 5 |
|
|
| (88 | ) |
Income tax expense |
|
| 33 |
|
|
| — |
|
|
| 8 |
|
|
| 8 |
|
|
| 41 |
|
|
| 27 |
|
|
| 33 |
|
|
| 1 |
|
|
| (20 | ) |
Net income (loss) |
| $ | 111 |
|
| $ | — |
|
| $ | 22 |
|
| $ | 22 |
|
| $ | 133 |
|
| $ | 87 |
|
| $ | 110 |
|
| $ | 4 |
|
| $ | (68 | ) |
|
| Three Months Ended March 31, 2023 |
| |||||||||
(Dollars in millions) |
| Net Impact of |
|
| Net Impact of |
|
| Total |
| |||
Net interest income (loss) after provisions for loan losses |
| $ | 19 |
|
| $ | — |
|
| $ | 19 |
|
Total other income (loss) |
|
| 8 |
|
|
| — |
|
|
| 8 |
|
Goodwill and acquired intangible asset impairment and amortization |
|
| — |
|
|
| (3 | ) |
|
| (3 | ) |
Total Core Earnings adjustments to GAAP |
| $ | 27 |
|
| $ | 3 |
|
|
| 30 |
|
Income tax expense (benefit) |
|
|
|
|
|
|
|
| 8 |
| ||
Net income (loss) |
|
|
|
|
|
|
| $ | 22 |
| ||
73
NAVIENT CORPORATION
NOTES TO CONSOLIDATED FINANCIAL STATEMENTS
(Information at March 31, 2023 and for the three months ended
March 31, 2023 and 2022 is unaudited)
11. Segment Reporting (Continued)
Segment Results and Reconciliations
|
| Three Months Ended March 31, 2022 |
| |||||||||||||||||||||||||||||||||
|
|
|
|
| Adjustments |
|
|
|
|
| Reportable Segments |
| ||||||||||||||||||||||||
(Dollars in millions) |
| Total |
|
| Reclassi- |
|
| Additions/ |
|
| Total |
|
| Total |
|
| Federal Education Loans |
|
| Consumer Lending |
|
| Business Processing |
|
| Other |
| |||||||||
Interest income: |
|
|
|
|
|
|
|
|
|
|
|
|
|
|
|
|
|
|
|
|
|
|
|
|
|
|
| |||||||||
Education loans |
| $ | 625 |
|
|
|
|
|
|
|
|
|
|
|
|
|
| $ | 334 |
|
| $ | 276 |
|
| $ | — |
|
| $ | — |
| ||||
Cash and investments |
|
| 1 |
|
|
|
|
|
|
|
|
|
|
|
|
|
|
| — |
|
|
| 1 |
|
|
| — |
|
|
| — |
| ||||
Total interest income |
|
| 626 |
|
|
|
|
|
|
|
|
|
|
|
|
|
|
| 334 |
|
|
| 277 |
|
|
| — |
|
|
| — |
| ||||
Total interest expense |
|
| 289 |
|
|
|
|
|
|
|
|
|
|
|
|
|
|
| 195 |
|
|
| 125 |
|
|
| — |
|
|
| 15 |
| ||||
Net interest income (loss) |
|
| 337 |
|
| $ | (19 | ) |
| $ | (42 | ) |
| $ | (61 | ) |
| $ | 276 |
|
|
| 139 |
|
|
| 152 |
|
|
| — |
|
|
| (15 | ) |
Less: provisions for loan |
|
| 16 |
|
|
|
|
|
|
|
|
|
|
|
| 16 |
|
|
| — |
|
|
| 16 |
|
|
| — |
|
|
| — |
| |||
Net interest income (loss) |
|
| 321 |
|
|
|
|
|
|
|
|
|
|
|
|
|
|
| 139 |
|
|
| 136 |
|
|
| — |
|
|
| (15 | ) | ||||
Other income (loss): |
|
|
|
|
|
|
|
|
|
|
|
|
|
|
|
|
|
|
|
|
|
|
|
|
|
|
| |||||||||
Servicing revenue |
|
| 18 |
|
|
|
|
|
|
|
|
|
|
|
|
|
|
| 15 |
|
|
| 3 |
|
|
| — |
|
|
| — |
| ||||
Asset recovery and |
|
| 97 |
|
|
|
|
|
|
|
|
|
|
|
|
|
|
| 3 |
|
|
| — |
|
|
| 94 |
|
|
| — |
| ||||
Other income (loss) |
|
| 108 |
|
|
|
|
|
|
|
|
|
|
|
|
|
|
| 11 |
|
|
| — |
|
|
| — |
|
|
| (1 | ) | ||||
Total other income (loss) |
|
| 223 |
|
|
| 19 |
|
|
| (117 | ) |
|
| (98 | ) |
|
| 125 |
|
|
| 29 |
|
|
| 3 |
|
|
| 94 |
|
|
| (1 | ) |
Expenses: |
|
|
|
|
|
|
|
|
|
|
|
|
|
|
|
|
|
|
|
|
|
|
|
|
|
|
| |||||||||
Direct operating |
|
| 139 |
|
|
|
|
|
|
|
|
|
|
|
|
|
|
| 28 |
|
|
| 35 |
|
|
| 76 |
|
|
| — |
| ||||
Unallocated shared |
|
| 66 |
|
|
|
|
|
|
|
|
|
|
|
|
|
|
| — |
|
|
| — |
|
|
| — |
|
|
| 66 |
| ||||
Operating expenses |
|
| 205 |
|
|
| — |
|
|
| — |
|
|
| — |
|
|
| 205 |
|
|
| 28 |
|
|
| 35 |
|
|
| 76 |
|
|
| 66 |
|
Goodwill and acquired |
|
| 4 |
|
|
| — |
|
|
| (4 | ) |
|
| (4 | ) |
|
| — |
|
|
| — |
|
|
| — |
|
|
| — |
|
|
| — |
|
Restructuring/other |
|
| 3 |
|
|
| — |
|
|
| — |
|
|
| — |
|
|
| 3 |
|
|
| — |
|
|
| — |
|
|
| — |
|
|
| 3 |
|
Total expenses |
|
| 212 |
|
|
| — |
|
|
| (4 | ) |
|
| (4 | ) |
|
| 208 |
|
|
| 28 |
|
|
| 35 |
|
|
| 76 |
|
|
| 69 |
|
Income (loss) before |
|
| 332 |
|
|
| — |
|
|
| (155 | ) |
|
| (155 | ) |
|
| 177 |
|
|
| 140 |
|
|
| 104 |
|
|
| 18 |
|
|
| (85 | ) |
Income tax expense |
|
| 77 |
|
|
| — |
|
|
| (35 | ) |
|
| (35 | ) |
|
| 42 |
|
|
| 33 |
|
|
| 25 |
|
|
| 4 |
|
|
| (20 | ) |
Net income (loss) |
| $ | 255 |
|
| $ | — |
|
| $ | (120 | ) |
| $ | (120 | ) |
| $ | 135 |
|
| $ | 107 |
|
| $ | 79 |
|
| $ | 14 |
|
| $ | (65 | ) |
|
|
|
|
|
|
|
|
|
|
|
|
|
|
|
|
|
|
|
|
|
|
|
|
|
|
|
| |||||||||
|
| Three Months Ended March 31, 2022 |
| |||||||||
(Dollars in millions) |
| Net Impact of |
|
| Net Impact of |
|
| Total |
| |||
Net interest income (loss) after provisions for loan losses |
| $ | (61 | ) |
| $ | — |
|
| $ | (61 | ) |
Total other income (loss) |
|
| (98 | ) |
|
| — |
|
|
| (98 | ) |
Goodwill and acquired intangible asset impairment and amortization |
|
| — |
|
|
| (4 | ) |
|
| (4 | ) |
Total Core Earnings adjustments to GAAP |
| $ | (159 | ) |
| $ | 4 |
|
|
| (155 | ) |
Income tax expense (benefit) |
|
|
|
|
|
|
|
| (35 | ) | ||
Net income (loss) |
|
|
|
|
|
|
| $ | (120 | ) | ||
|
| Three Months Ended March 31, 2022 |
| |||||||||||||||||||||||||||||||||
|
|
|
|
|
|
|
|
|
|
|
|
|
|
|
|
|
|
|
|
|
| Adjustments |
|
|
|
|
| |||||||||
(Dollars in millions) |
| Federal Education Loans |
|
| Consumer Lending |
|
| Business Processing |
|
| Other |
|
| Total Core Earnings |
|
| Reclassi- fications |
|
| Additions/ (Subtractions) |
|
| Total Adjustments(1) |
|
| Total GAAP |
| |||||||||
Interest income: |
|
|
|
|
|
|
|
|
|
|
|
|
|
|
|
|
|
|
|
|
|
|
|
|
|
|
|
|
|
|
|
|
|
|
|
|
Education loans |
| $ | 334 |
|
| $ | 276 |
|
| $ | — |
|
| $ | — |
|
| $ | 610 |
|
| $ | 19 |
|
| $ | (4 | ) |
| $ | 15 |
|
| $ | 625 |
|
Cash and investments |
|
| — |
|
|
| 1 |
|
|
| — |
|
|
| — |
|
|
| 1 |
|
|
| — |
|
|
| — |
|
|
| — |
|
|
| 1 |
|
Total interest income |
|
| 334 |
|
|
| 277 |
|
|
| — |
|
|
| — |
|
|
| 611 |
|
|
| 19 |
|
|
| (4 | ) |
|
| 15 |
|
|
| 626 |
|
Total interest expense |
|
| 195 |
|
|
| 125 |
|
|
| — |
|
|
| 15 |
|
|
| 335 |
|
|
| — |
|
|
| (46 | ) |
|
| (46 | ) |
|
| 289 |
|
Net interest income (loss) |
|
| 139 |
|
|
| 152 |
|
|
| — |
|
|
| (15 | ) |
|
| 276 |
|
|
| 19 |
|
|
| 42 |
|
|
| 61 |
|
|
| 337 |
|
Less: provisions for loan losses |
|
| — |
|
|
| 16 |
|
|
| — |
|
|
| — |
|
|
| 16 |
|
|
| — |
|
|
| — |
|
|
| — |
|
|
| 16 |
|
Net interest income (loss) after provisions for loan losses |
|
| 139 |
|
|
| 136 |
|
|
| — |
|
|
| (15 | ) |
|
| 260 |
|
|
| 19 |
|
|
| 42 |
|
|
| 61 |
|
|
| 321 |
|
Other income (loss): |
|
|
|
|
|
|
|
|
|
|
|
|
|
|
|
|
|
|
|
|
|
|
|
|
|
|
|
|
|
|
|
|
|
|
|
|
Servicing revenue |
|
| 15 |
|
|
| 3 |
|
|
| — |
|
|
| — |
|
|
| 18 |
|
|
| — |
|
|
| — |
|
|
| — |
|
|
| 18 |
|
Asset recovery and business processing revenue |
|
| 3 |
|
|
| — |
|
|
| 94 |
|
|
| — |
|
|
| 97 |
|
|
| — |
|
|
| — |
|
|
| — |
|
|
| 97 |
|
Other income (loss) |
|
| 11 |
|
|
| — |
|
|
| — |
|
|
| (1 | ) |
|
| 10 |
|
|
| (19 | ) |
|
| 117 |
|
|
| 98 |
|
|
| 108 |
|
Total other income (loss) |
|
| 29 |
|
|
| 3 |
|
|
| 94 |
|
|
| (1 | ) |
|
| 125 |
|
|
| (19 | ) |
|
| 117 |
|
|
| 98 |
|
|
| 223 |
|
Expenses: |
|
|
|
|
|
|
|
|
|
|
|
|
|
|
|
|
|
|
|
|
|
|
|
|
|
|
|
|
|
|
|
|
|
|
|
|
Direct operating expenses |
|
| 28 |
|
|
| 35 |
|
|
| 76 |
|
|
| — |
|
|
| 139 |
|
|
| — |
|
|
| — |
|
|
| — |
|
|
| 139 |
|
Unallocated shared services expenses |
|
| — |
|
|
| — |
|
|
| — |
|
|
| 66 |
|
|
| 66 |
|
|
| — |
|
|
| — |
|
|
| — |
|
|
| 66 |
|
Operating expenses |
|
| 28 |
|
|
| 35 |
|
|
| 76 |
|
|
| 66 |
|
|
| 205 |
|
|
| — |
|
|
| — |
|
|
| — |
|
|
| 205 |
|
Goodwill and acquired intangible asset impairment and amortization |
|
| — |
|
|
| — |
|
|
| — |
|
|
| — |
|
|
| — |
|
|
| — |
|
|
| 4 |
|
|
| 4 |
|
|
| 4 |
|
Restructuring/other reorganization expenses |
|
| — |
|
|
| — |
|
|
| — |
|
|
| 3 |
|
|
| 3 |
|
|
| — |
|
|
| — |
|
|
| — |
|
|
| 3 |
|
Total expenses |
|
| 28 |
|
|
| 35 |
|
|
| 76 |
|
|
| 69 |
|
|
| 208 |
|
|
| — |
|
|
| 4 |
|
|
| 4 |
|
|
| 212 |
|
Income (loss) before income tax expense (benefit) |
|
| 140 |
|
|
| 104 |
|
|
| 18 |
|
|
| (85 | ) |
|
| 177 |
|
|
| — |
|
|
| 155 |
|
|
| 155 |
|
|
| 332 |
|
Income tax expense (benefit)(2) |
|
| 33 |
|
|
| 25 |
|
|
| 4 |
|
|
| (20 | ) |
|
| 42 |
|
|
| — |
|
|
| 35 |
|
|
| 35 |
|
|
| 77 |
|
Net income (loss) |
| $ | 107 |
|
| $ | 79 |
|
| $ | 14 |
|
| $ | (65 | ) |
| $ | 135 |
|
| $ | — |
|
| $ | 120 |
|
| $ | 120 |
|
| $ | 255 |
|
74 |
|
|
| Three Months Ended March 31, 2022 |
| |||||||||
(Dollars in millions) |
| Net Impact of Derivative Accounting |
|
| Net Impact of Goodwill and Acquired Intangibles |
|
| Total |
| |||
Net interest income (loss) after provisions for loan losses |
| $ | 61 |
|
| $ | — |
|
| $ | 61 |
|
Total other income (loss) |
|
| 98 |
|
|
| — |
|
|
| 98 |
|
Goodwill and acquired intangible asset impairment and amortization |
|
| — |
|
|
| 4 |
|
|
| 4 |
|
Total Core Earnings adjustments to GAAP |
| $ | 159 |
|
| $ | (4 | ) |
|
| 155 |
|
Income tax expense (benefit) |
|
|
|
|
|
|
|
|
|
| 35 |
|
Net income (loss) |
|
|
|
|
|
|
|
|
| $ | 120 |
|
|
|
74
NAVIENT CORPORATION
NOTES TO CONSOLIDATED FINANCIAL STATEMENTS
(Information at March 31, 20222023 and for the three months ended
March 31, 20222023 and 20212022 is unaudited)
11. Segment Reporting (Continued)
|
| Three Months Ended March 31, 2021 |
| |||||||||||||||||||||||||||||||||
|
|
|
|
|
|
|
|
|
|
|
|
|
|
|
|
|
|
|
|
|
| Adjustments |
|
|
|
|
| |||||||||
(Dollars in millions) |
| Federal Education Loans |
|
| Consumer Lending |
|
| Business Processing |
|
| Other |
|
| Total Core Earnings |
|
| Reclassi- fications |
|
| Additions/ (Subtractions) |
|
| Total Adjustments(1) |
|
| Total GAAP |
| |||||||||
Interest income: |
|
|
|
|
|
|
|
|
|
|
|
|
|
|
|
|
|
|
|
|
|
|
|
|
|
|
|
|
|
|
|
|
|
|
|
|
Education loans |
| $ | 359 |
|
| $ | 319 |
|
| $ | — |
|
| $ | — |
|
| $ | 678 |
|
| $ | 23 |
|
| $ | (9 | ) |
| $ | 14 |
|
| $ | 692 |
|
Cash and investments |
|
| — |
|
|
| — |
|
|
| — |
|
|
| — |
|
|
| — |
|
|
| — |
|
|
| — |
|
|
| — |
|
|
| — |
|
Total interest income |
|
| 359 |
|
|
| 319 |
|
|
| — |
|
|
| — |
|
|
| 678 |
|
|
| 23 |
|
|
| (9 | ) |
|
| 14 |
|
|
| 692 |
|
Total interest expense |
|
| 215 |
|
|
| 150 |
|
|
| — |
|
|
| 18 |
|
|
| 383 |
|
|
| (1 | ) |
|
| (53 | ) |
|
| (54 | ) |
|
| 329 |
|
Net interest income (loss) |
|
| 144 |
|
|
| 169 |
|
|
| — |
|
|
| (18 | ) |
|
| 295 |
|
|
| 24 |
|
|
| 44 |
|
|
| 68 |
|
|
| 363 |
|
Less: provisions for loan losses |
|
| — |
|
|
| (87 | ) |
|
| — |
|
|
| — |
|
|
| (87 | ) |
|
| — |
|
|
| — |
|
|
| — |
|
|
| (87 | ) |
Net interest income (loss) after provisions for loan losses |
|
| 144 |
|
|
| 256 |
|
|
| — |
|
|
| (18 | ) |
|
| 382 |
|
|
| 24 |
|
|
| 44 |
|
|
| 68 |
|
|
| 450 |
|
Other income (loss): |
|
|
|
|
|
|
|
|
|
|
|
|
|
|
|
|
|
|
|
|
|
|
|
|
|
|
|
|
|
|
|
|
|
|
|
|
Servicing revenue |
|
| 52 |
|
|
| 1 |
|
|
| — |
|
|
| — |
|
|
| 53 |
|
|
| — |
|
|
| — |
|
|
| — |
|
|
| 53 |
|
Asset recovery and business processing revenue |
|
| 14 |
|
|
| — |
|
|
| 125 |
|
|
| — |
|
|
| 139 |
|
|
| — |
|
|
| — |
|
|
| — |
|
|
| 139 |
|
Other income (loss) |
|
| — |
|
|
| — |
|
|
| — |
|
|
| — |
|
|
| — |
|
|
| (11 | ) |
|
| 47 |
|
|
| 36 |
|
|
| 36 |
|
Gains on sales of loans |
|
| — |
|
|
| 89 |
|
|
| — |
|
|
| — |
|
|
| 89 |
|
|
| (13 | ) |
|
| — |
|
|
| (13 | ) |
|
| 76 |
|
Total other income (loss) |
|
| 66 |
|
|
| 90 |
|
|
| 125 |
|
|
| — |
|
|
| 281 |
|
|
| (24 | ) |
|
| 47 |
|
|
| 23 |
|
|
| 304 |
|
Expenses: |
|
|
|
|
|
|
|
|
|
|
|
|
|
|
|
|
|
|
|
|
|
|
|
|
|
|
|
|
|
|
|
|
|
|
|
|
Direct operating expenses |
|
| 63 |
|
|
| 41 |
|
|
| 91 |
|
|
| — |
|
|
| 195 |
|
|
| — |
|
|
| — |
|
|
| — |
|
|
| 195 |
|
Unallocated shared services expenses |
|
| — |
|
|
| — |
|
|
| — |
|
|
| 64 |
|
|
| 64 |
|
|
| — |
|
|
| — |
|
|
| — |
|
|
| 64 |
|
Operating expenses |
|
| 63 |
|
|
| 41 |
|
|
| 91 |
|
|
| 64 |
|
|
| 259 |
|
|
| — |
|
|
| — |
|
|
| — |
|
|
| 259 |
|
Goodwill and acquired intangible asset impairment and amortization |
|
| — |
|
|
| — |
|
|
| — |
|
|
| — |
|
|
| — |
|
|
| — |
|
|
| 5 |
|
|
| 5 |
|
|
| 5 |
|
Restructuring/other reorganization expenses |
|
| — |
|
|
| — |
|
|
| — |
|
|
| 6 |
|
|
| 6 |
|
|
| — |
|
|
| — |
|
|
| — |
|
|
| 6 |
|
Total expenses |
|
| 63 |
|
|
| 41 |
|
|
| 91 |
|
|
| 70 |
|
|
| 265 |
|
|
| — |
|
|
| 5 |
|
|
| 5 |
|
|
| 270 |
|
Income (loss) before income tax expense (benefit) |
|
| 147 |
|
|
| 305 |
|
|
| 34 |
|
|
| (88 | ) |
|
| 398 |
|
|
| — |
|
|
| 86 |
|
|
| 86 |
|
|
| 484 |
|
Income tax expense (benefit)(2) |
|
| 35 |
|
|
| 71 |
|
|
| 8 |
|
|
| (21 | ) |
|
| 93 |
|
|
| — |
|
|
| 21 |
|
|
| 21 |
|
|
| 114 |
|
Net income (loss) |
| $ | 112 |
|
| $ | 234 |
|
| $ | 26 |
|
| $ | (67 | ) |
| $ | 305 |
|
| $ | — |
|
| $ | 65 |
|
| $ | 65 |
|
| $ | 370 |
|
|
|
|
| Three Months Ended March 31, 2021 |
| |||||||||
(Dollars in millions) |
| Net Impact of Derivative Accounting |
|
| Net Impact of Goodwill and Acquired Intangibles |
|
| Total |
| |||
Net interest income (loss) after provisions for loan losses |
| $ | 68 |
|
| $ | — |
|
| $ | 68 |
|
Total other income (loss) |
|
| 23 |
|
|
| — |
|
|
| 23 |
|
Goodwill and acquired intangible asset impairment and amortization |
|
| — |
|
|
| 5 |
|
|
| 5 |
|
Total Core Earnings adjustments to GAAP |
| $ | 91 |
|
| $ | (5 | ) |
|
| 86 |
|
Income tax expense (benefit) |
|
|
|
|
|
|
|
|
|
| 21 |
|
Net income (loss) |
|
|
|
|
|
|
|
|
| $ | 65 |
|
|
|
75
NAVIENT CORPORATION
NOTES TO CONSOLIDATED FINANCIAL STATEMENTS
(Information at March 31, 2022 and for the three months ended
March 31, 2022 and 2021 is unaudited)
11. Segment Reporting (Continued)
Summary of Core Earnings Adjustments to GAAP
|
| Three Months Ended March 31, |
| |||||
(Dollars in millions) |
| 2023 |
|
| 2022 |
| ||
GAAP net income |
| $ | 111 |
|
| $ | 255 |
|
Core Earnings adjustments to GAAP: |
|
|
|
|
|
| ||
Net impact of derivative accounting(1) |
|
| 27 |
|
|
| (159 | ) |
Net impact of goodwill and acquired intangible assets(2) |
|
| 3 |
|
|
| 4 |
|
Net tax effect(3) |
|
| (8 | ) |
|
| 35 |
|
Total Core Earnings adjustments to GAAP |
|
| 22 |
|
|
| (120 | ) |
Core Earnings net income |
| $ | 133 |
|
| $ | 135 |
|
|
| Three Months Ended March 31, |
| |||||
(Dollars in millions) |
| 2022 |
|
| 2021 |
| ||
Core Earnings net income |
| $ | 135 |
|
| $ | 305 |
|
Core Earnings adjustments to GAAP: |
|
|
|
|
|
|
|
|
Net impact of derivative accounting(1) |
|
| 159 |
|
|
| 91 |
|
Net impact of goodwill and acquired intangible assets(2) |
|
| (4 | ) |
|
| (5 | ) |
Net tax effect(3) |
|
| (35 | ) |
|
| (21 | ) |
Total Core Earnings adjustments to GAAP |
|
| 120 |
|
|
| 65 |
|
GAAP net income |
| $ | 255 |
|
| $ | 370 |
|
75 SIGNATURES |
|
|
|
|
|
|
SIGNATURES
Pursuant to the requirements of the Securities Exchange Act of 1934, as amended, the Registrant has duly caused this report to be signed on its behalf by the undersigned hereunto duly authorized.
NAVIENT CORPORATION (Registrant) | ||
By: |
| |
Joe Fisher | ||
Chief Financial Officer | ||
(Principal Financial and Accounting Officer) | ||
Date: April 27, 202226, 2023
76
APPENDIX A
form 10-Q cross-reference index
Page Number |
Part I. Financial Information | |||
Item 1. | |||
Item 2. | Management’s Discussion and Analysis of Financial Condition and Results of Operations | ||
Item 3. | |||
Item 4. | |||
Part II. Other Information | |||
Item 1. | |||
Item 1A. | |||
Item 2. | |||
Item 3. | Defaults Upon Senior Securities | Not Applicable | |
Item 4. | Mine Safety Disclosures | Not Applicable | |
Item 5. | Other Information | Not Applicable | |
Item 6. | |||
7877