UNITED STATES SECURITIES AND EXCHANGE COMMISSION
Washington, D.C. 20549
Form 10-Q
| | | | | |
| |
| (Mark One) | |
| ☑ | QUARTERLY REPORT PURSUANT TO SECTION 13 OR 15(d) OF THE SECURITIES EXCHANGE ACT OF 1934 |
For the quarterly period ended June 30, 2023March 31, 2024
| | | | | |
| Or |
| ☐ | TRANSITION REPORT PURSUANT TO SECTION 13 OR 15(d)
OF THE SECURITIES EXCHANGE ACT OF 1934 |
| For the transition period from to |
Commission File Number 001-36198
INTERCONTINENTAL EXCHANGE, INC.
(Exact name of registrant as specified in its charter)
| | | | | |
| Delaware | 46-2286804 |
(State or other jurisdiction of
incorporation or organization) | (IRS Employer
Identification Number) |
| | | | | |
5660 New Northside Drive, Atlanta, Georgia | 30328 |
| (Address of principal executive offices) | (Zip Code) |
(770) 857-4700
Registrant’s telephone number, including area code
Securities registered pursuant to Section 12(b) of the Act:
| | | | | | | | |
| Title of Each Class | Trading Symbol(s) | Name of Each Exchange on Which Registered |
| Common Stock, $0.01 par value per share | ICE | New York Stock Exchange |
Indicate by check mark whether the registrant: (1) has filed all reports required to be filed by Section 13 or 15(d) of the Securities Exchange Act of 1934 during the preceding 12 months (or for such shorter period that the registrant was required to file such reports); and (2) has been subject to such filing requirements for the past 90 days. Yes ☑ No ☐
Indicate by check mark whether the registrant has submitted electronically every Interactive Data File required to be submitted pursuant to Rule 405 of Regulation S-T (§232.405 of this chapter) during the preceding 12 months (or for such shorter period that the registrant was required to submit such files). Yes ☑ No ☐
Indicate by check mark whether the registrant is a large accelerated filer, an accelerated filer, a non-accelerated filer, a smaller reporting company or an emerging growth company. See definitions of “large accelerated filer,” “accelerated filer,” “smaller reporting company” and “emerging growth company” in Rule 12b-2 of the Exchange Act.
| | | | | | | | | | | | | | |
| Large accelerated filer | ☑ | | Accelerated filer | ☐ |
| Non-accelerated filer | ☐ | | Smaller reporting company | ☐ |
| | | Emerging growth company | ☐ |
If an emerging growth company, indicate by check mark if the registrant has elected not to use the extended transition period for complying with any new or revised financial accounting standards provided pursuant to Section 13(a) of the Exchange Act. ☐
Indicate by check mark whether the registrant is a shell company (as defined in Rule 12b-2 of the Exchange Act). Yes ☐ No ☑
As of August 1, 2023,April 29, 2024, the number of shares of the registrant’s Common Stock outstanding was 560,301,373573,584,580 shares.
INTERCONTINENTAL EXCHANGE, INC.
Form 10-Q
Quarterly Period Ended June 30, 2023March 31, 2024
TABLE OF CONTENTS
| | | | | | | | |
| | |
| | |
| PART I. | Financial Statements | |
| Item 1. | | |
| Consolidated Balance Sheets as of June 30, 2023March 31, 2024 and December 31, 20222023 | |
| Consolidated Statements of Income for the six months and three months ended June 30,March 31, 2024 and 2023 and 2022 | |
| Consolidated Statements of Comprehensive Income for the six months and three months ended June 30,March 31, 2024 and 2023 and 2022 | |
| Consolidated Statements of Changes in Equity and Redeemable Non-Controlling Interest for the six months and three months ended June 30,March 31, 2024 and 2023 and 2022 | |
| Consolidated Statements of Cash Flows for the sixthree months ended June 30,March 31, 2024 and 2023 and 2022 | |
| | |
| Item 2. | | |
| Item 3. | | |
| Item 4. | | |
| | |
| PART II. | Other Information | |
| Item 1. | | |
| Item 1A. | | |
| Item 2. | | |
| Item 3. | | |
| Item 4. | | |
| Item 5. | | |
| Item 6. | | |
| |
PART I. Financial Statements
Item 1. Consolidated Financial Statements
Intercontinental Exchange, Inc. and Subsidiaries
Consolidated Balance Sheets
(In millions, except per share amounts)
| | As of | | As of
December 31, 2022 |
| June 30, 2023 | |
| (Unaudited) | |
| As of | | | As of | | As of
December 31, 2023 |
| March 31, 2024 | |
| (Unaudited) | |
| (Unaudited) | |
| (Unaudited) | |
| Assets: | |
| Assets: | |
| Assets: | Assets: | | | |
| Current assets: | Current assets: | |
| Current assets: | |
| Current assets: | |
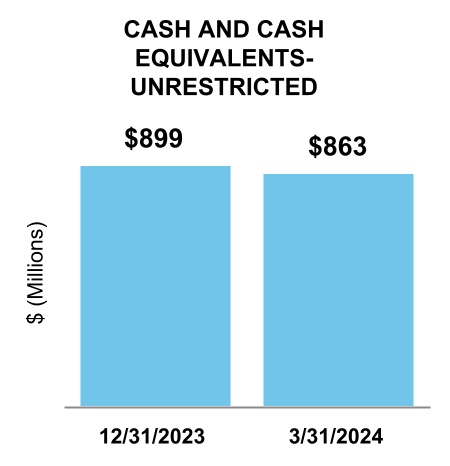
| Cash and cash equivalents | |
| Cash and cash equivalents | |
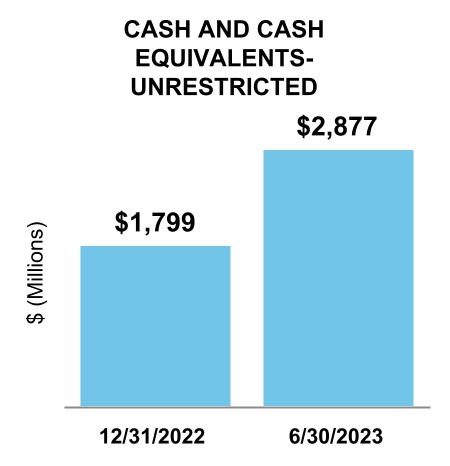
| Cash and cash equivalents | Cash and cash equivalents | $ | 2,877 | | | $ | 1,799 | |
| Short-term restricted cash and cash equivalents | Short-term restricted cash and cash equivalents | 5,413 | | | 6,149 | |
| Restricted short-term investments | 735 | | | — | |
| Short-term restricted investments | |
| Cash and cash equivalent margin deposits and guaranty funds | Cash and cash equivalent margin deposits and guaranty funds | 86,917 | | | 141,990 | |
| Invested deposits, delivery contracts receivable and unsettled variation margin | Invested deposits, delivery contracts receivable and unsettled variation margin | 1,412 | | | 5,382 | |
| Customer accounts receivable, net of allowance for doubtful accounts of $25 and $22 at June 30, 2023 and December 31, 2022, respectively | 1,313 | | | 1,169 | |
| Customer accounts receivable, net of allowance for doubtful accounts of $19 and $21 at March 31, 2024 and December 31, 2023, respectively | |
| Prepaid expenses and other current assets | Prepaid expenses and other current assets | 555 | | | 458 | |
| Total current assets | Total current assets | 99,222 | | | 156,947 | |
| Property and equipment, net | Property and equipment, net | 1,718 | | | 1,767 | |
| Other non-current assets: | Other non-current assets: | | | |
| Goodwill | |
| Goodwill | |
| Goodwill | Goodwill | 21,134 | | | 21,111 | |
| Other intangible assets, net | Other intangible assets, net | 12,814 | | | 13,090 | |
| Long-term restricted cash and cash equivalents | Long-term restricted cash and cash equivalents | 205 | | | 405 | |
| Long-term restricted investments | Long-term restricted investments | 199 | | | — | |
| Other non-current assets | Other non-current assets | 991 | | | 1,018 | |
| Total other non-current assets | Total other non-current assets | 35,343 | | | 35,624 | |
| Total assets | Total assets | $ | 136,283 | | | $ | 194,338 | |
| | Liabilities and Equity: | Liabilities and Equity: | |
| Liabilities and Equity: | |
| Liabilities and Equity: | |
| Current liabilities: | Current liabilities: | |
| Current liabilities: | |
| Current liabilities: | |
| Accounts payable and accrued liabilities | |
| Accounts payable and accrued liabilities | |
| Accounts payable and accrued liabilities | Accounts payable and accrued liabilities | $ | 919 | | | $ | 866 | |
| Section 31 fees payable | Section 31 fees payable | 173 | | | 223 | |
| Accrued salaries and benefits | Accrued salaries and benefits | 226 | | | 352 | |
| Deferred revenue | Deferred revenue | 437 | | | 170 | |
| Short-term debt | Short-term debt | — | | | 4 | |
| Margin deposits and guaranty funds | Margin deposits and guaranty funds | 86,917 | | | 141,990 | |
| Invested deposits, delivery contracts payable and unsettled variation margin | Invested deposits, delivery contracts payable and unsettled variation margin | 1,412 | | | 5,382 | |
| Other current liabilities | Other current liabilities | 120 | | | 184 | |
| Total current liabilities | Total current liabilities | 90,204 | | | 149,171 | |
| Non-current liabilities: | Non-current liabilities: | | | |
| Non-current deferred tax liability, net | Non-current deferred tax liability, net | 3,256 | | | 3,493 | |
| Non-current deferred tax liability, net | |
| Non-current deferred tax liability, net | |
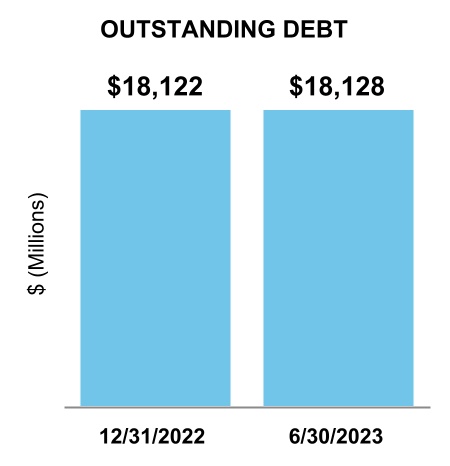
| Long-term debt | Long-term debt | 18,128 | | | 18,118 | |
| Accrued employee benefits | Accrued employee benefits | 156 | | | 160 | |
| Non-current operating lease liability | Non-current operating lease liability | 218 | | | 254 | |
| Other non-current liabilities | Other non-current liabilities | 432 | | | 381 | |
| Total non-current liabilities | Total non-current liabilities | 22,190 | | | 22,406 | |
| Total liabilities | Total liabilities | 112,394 | | | 171,577 | |
| Commitments and contingencies | Commitments and contingencies | | | | Commitments and contingencies | | | |
|
| | | Equity: | Equity: | |
| Intercontinental Exchange, Inc. stockholders’ equity: | Intercontinental Exchange, Inc. stockholders’ equity: | |
| Intercontinental Exchange, Inc. stockholders’ equity: | |
| Intercontinental Exchange, Inc. stockholders’ equity: | |
| Preferred stock, $0.01 par value; 100 shares authorized; none issued or outstanding | Preferred stock, $0.01 par value; 100 shares authorized; none issued or outstanding | — | | | — | |
| Common stock, $0.01 par value; 1,500 shares authorized; 636 and 634 issued at June 30, 2023 and December 31, 2022, respectively, and 560 and 559 shares outstanding at June 30, 2023 and December 31, 2022, respectively | 6 | | | 6 | |
| Treasury stock, at cost; 76 and 75 shares at June 30, 2023 and December 31, 2022, respectively | (6,276) | | | (6,225) | |
| Preferred stock, $0.01 par value; 100 shares authorized; none issued or outstanding | |
| Preferred stock, $0.01 par value; 100 shares authorized; none issued or outstanding | |
| Common stock, $0.01 par value; 1,500 shares authorized; 650 and 649 issued at March 31, 2024 and December 31, 2023, respectively, and 573 shares outstanding at both March 31, 2024 and December 31, 2023 | |
| Treasury stock, at cost; 77 and 76 shares at March 31, 2024 and December 31, 2023, respectively | |
| Additional paid-in capital | Additional paid-in capital | 14,449 | | | 14,313 | |
| Retained earnings | Retained earnings | 15,925 | | | 14,943 | |
| Accumulated other comprehensive loss | Accumulated other comprehensive loss | (284) | | | (331) | |
| Total Intercontinental Exchange, Inc. stockholders’ equity | Total Intercontinental Exchange, Inc. stockholders’ equity | 23,820 | | | 22,706 | |
| Non-controlling interest in consolidated subsidiaries | Non-controlling interest in consolidated subsidiaries | 69 | | | 55 | |
| Total equity | Total equity | 23,889 | | | 22,761 | |
| Total liabilities and equity | Total liabilities and equity | $ | 136,283 | | | $ | 194,338 | |
See accompanying notes.
Intercontinental Exchange, Inc. and Subsidiaries
Consolidated Statements of Income
(In millions, except per share amounts)
(Unaudited)
| | Six Months Ended June 30, | | Three Months Ended June 30, |
| 2023 | | 2022 | | 2023 | | 2022 |
| Three Months Ended March 31, | |
| Three Months Ended March 31, | |
| Three Months Ended March 31, | |
| 2024 | |
| 2024 | |
| 2024 | |
| Revenues: | |
| Revenues: | |
| Revenues: | Revenues: | | | | | | | |
| Exchanges | Exchanges | $ | 3,214 | | | $ | 3,247 | | | $ | 1,541 | | | $ | 1,604 | |
| Exchanges | |
| Exchanges | |
| Fixed income and data services | |
| Fixed income and data services | |
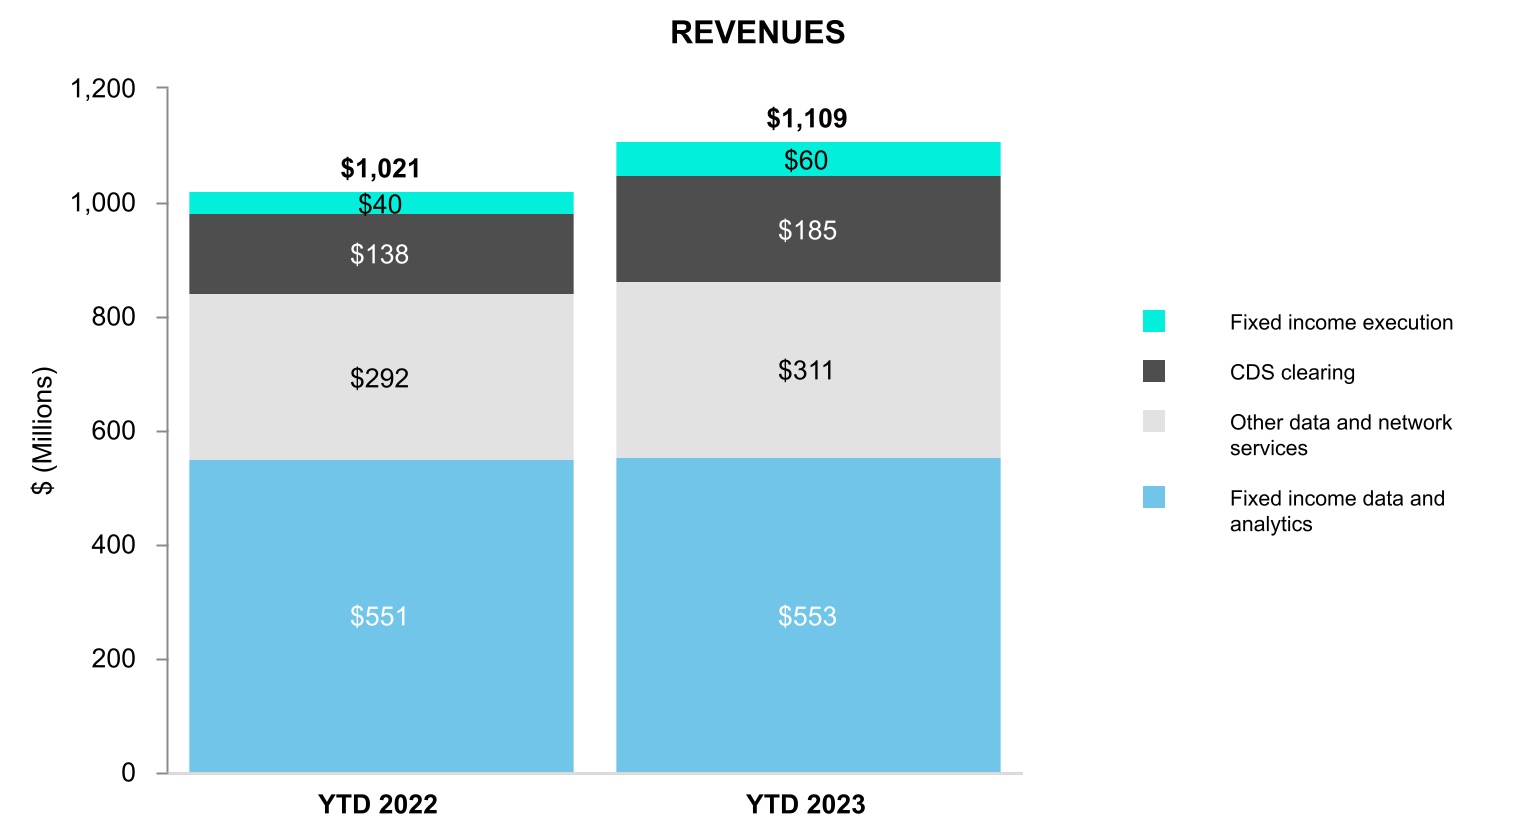
| Fixed income and data services | Fixed income and data services | 1,109 | | | 1,021 | | | 546 | | | 512 | |
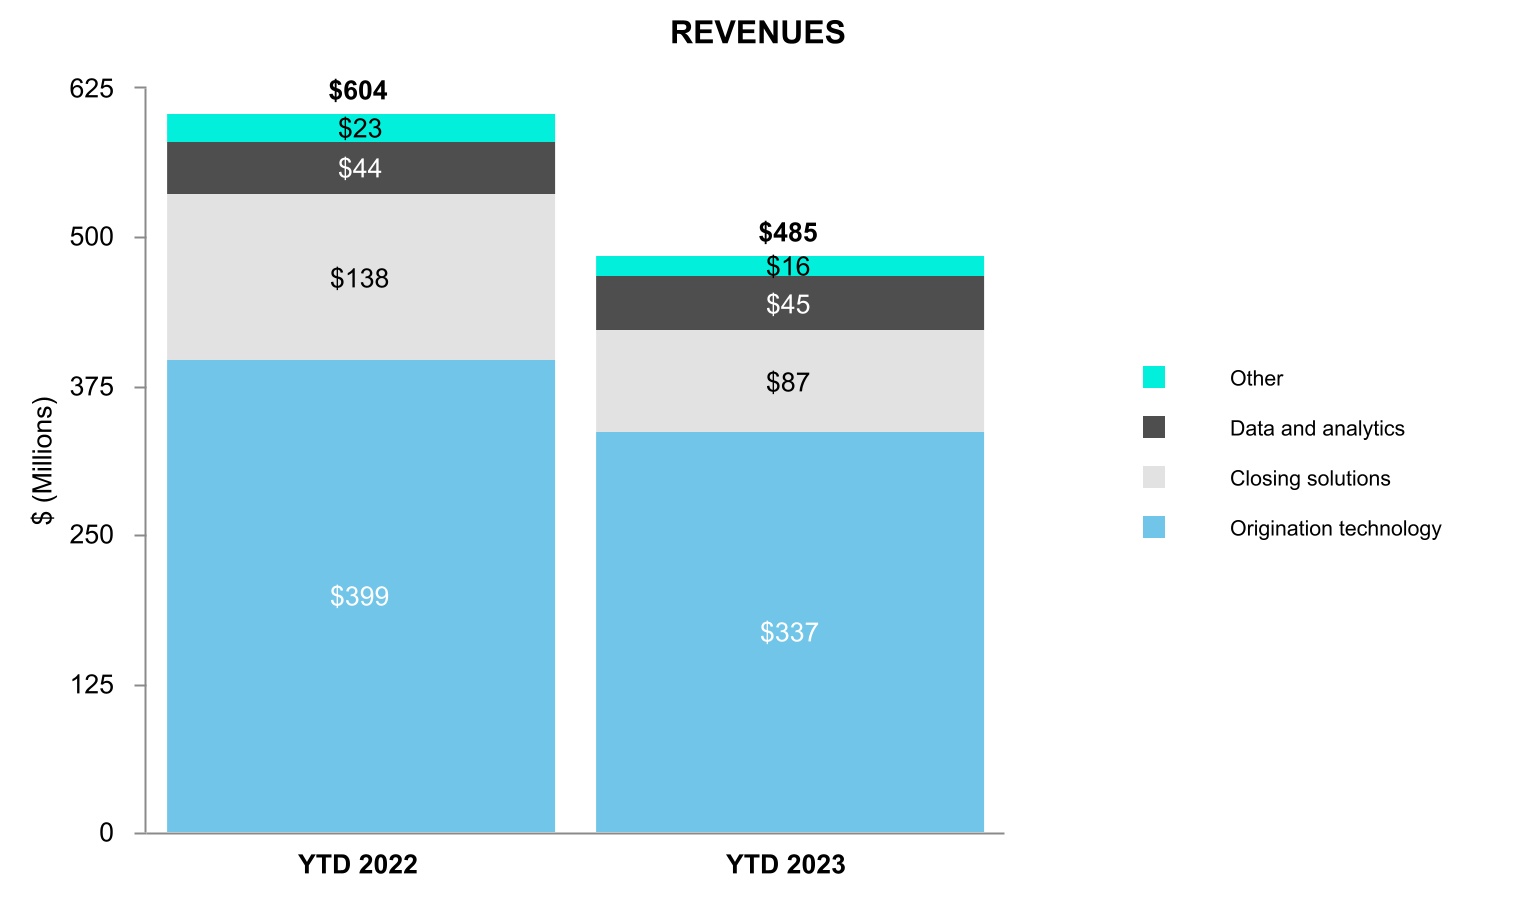
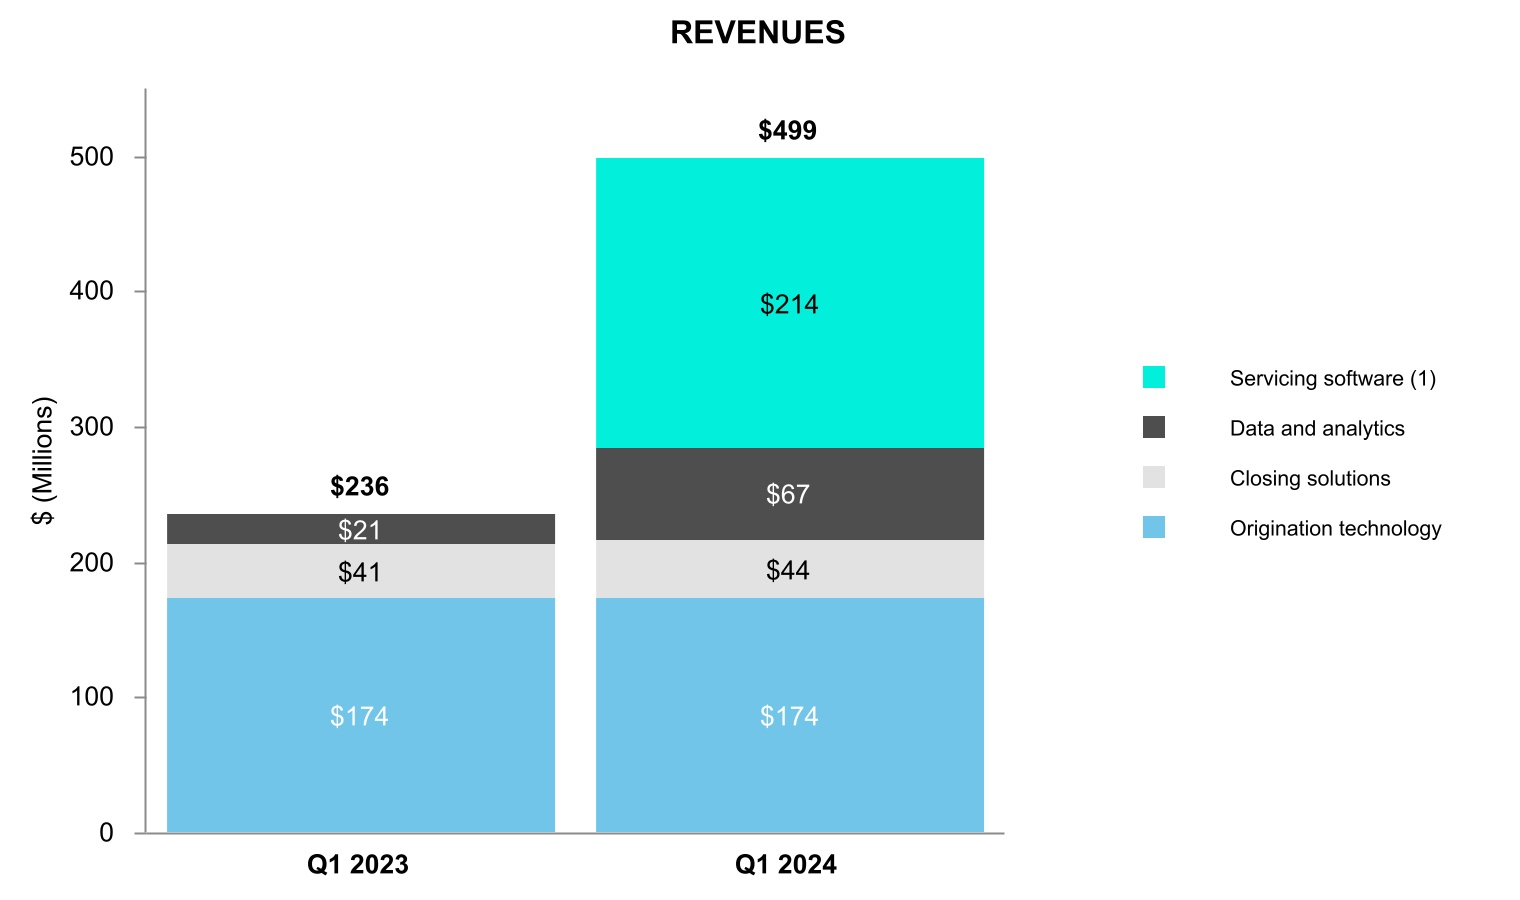
| Mortgage technology | Mortgage technology | 485 | | | 604 | | | 249 | | | 297 | |
| Mortgage technology | |
| Mortgage technology | |
| Total revenues | |
| Total revenues | |
| Total revenues | Total revenues | 4,808 | | | 4,872 | | | 2,336 | | | 2,413 | |
| Transaction-based expenses: | Transaction-based expenses: | | | | | | | |
| Transaction-based expenses: | |
| Transaction-based expenses: | |
| Section 31 fees | |
| Section 31 fees | |
| Section 31 fees | Section 31 fees | 175 | | | 174 | | | 56 | | | 123 | |
| Cash liquidity payments, routing and clearing | Cash liquidity payments, routing and clearing | 849 | | | 985 | | | 392 | | | 476 | |
| Cash liquidity payments, routing and clearing | |
| Cash liquidity payments, routing and clearing | |
| Total revenues, less transaction-based expenses | |
| Total revenues, less transaction-based expenses | |
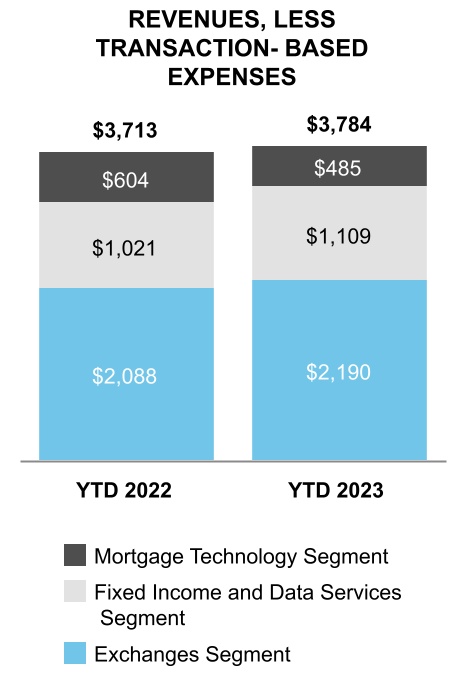
| Total revenues, less transaction-based expenses | Total revenues, less transaction-based expenses | 3,784 | | | 3,713 | | | 1,888 | | | 1,814 | |
| Operating expenses: | Operating expenses: | | | | | | | |
| Operating expenses: | |
| Operating expenses: | |
| Compensation and benefits | |
| Compensation and benefits | |
| Compensation and benefits | Compensation and benefits | 703 | | | 714 | | | 351 | | | 355 | |
| Professional services | Professional services | 57 | | | 69 | | | 29 | | | 35 | |
| Professional services | |
| Professional services | |
| Acquisition-related transaction and integration costs | |
| Acquisition-related transaction and integration costs | |
| Acquisition-related transaction and integration costs | Acquisition-related transaction and integration costs | 46 | | | 62 | | | 25 | | | 53 | |
| Technology and communication | Technology and communication | 345 | | | 344 | | | 173 | | | 169 | |
| Technology and communication | |
| Technology and communication | |
| Rent and occupancy | |
| Rent and occupancy | |
| Rent and occupancy | Rent and occupancy | 45 | | | 41 | | | 25 | | | 20 | |
| Selling, general and administrative | Selling, general and administrative | 137 | | | 112 | | | 63 | | | 57 | |
| Selling, general and administrative | |
| Selling, general and administrative | |
| Depreciation and amortization | |
| Depreciation and amortization | |
| Depreciation and amortization | Depreciation and amortization | 527 | | | 510 | | | 267 | | | 256 | |
| Total operating expenses | Total operating expenses | 1,860 | | | 1,852 | | | 933 | | | 945 | |
| Total operating expenses | |
| Total operating expenses | |
| Operating income | |
| Operating income | |
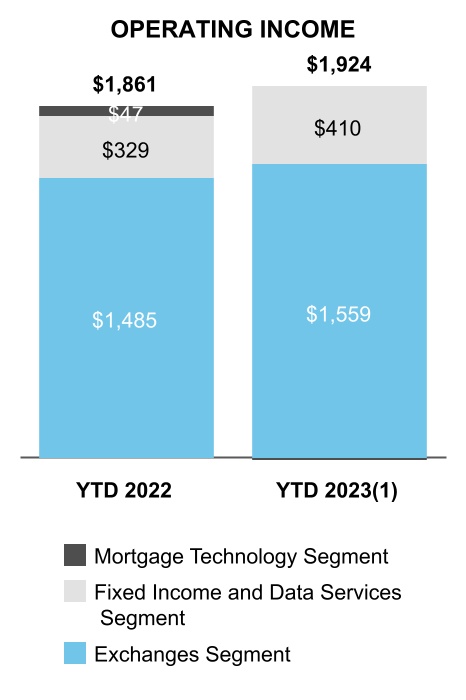
| Operating income | Operating income | 1,924 | | | 1,861 | | | 955 | | | 869 | |
| Other income/(expense): | Other income/(expense): | | | | | | | |
| Other income/(expense): | |
| Other income/(expense): | |
| Interest income | |
| Interest income | |
| Interest income | Interest income | 193 | | | 9 | | | 102 | | | 8 | |
| Interest expense | Interest expense | (351) | | | (264) | | | (175) | | | (161) | |
| Interest expense | |
| Interest expense | |
| Other income/(expense), net | |
| Other income/(expense), net | |
| Other income/(expense), net | Other income/(expense), net | (70) | | | (35) | | | (35) | | | 23 | |
| Total other income/(expense), net | Total other income/(expense), net | (228) | | | (290) | | | (108) | | | (130) | |
| Total other income/(expense), net | |
| Total other income/(expense), net | |
| Income before income tax expense | |
| Income before income tax expense | |
| Income before income tax expense | Income before income tax expense | 1,696 | | | 1,571 | | | 847 | | | 739 | |
| Income tax expense | Income tax expense | 207 | | | 338 | | | 32 | | | 173 | |
| Income tax expense | |
| Income tax expense | |
| Net income | |
| Net income | |
| Net income | Net income | $ | 1,489 | | | $ | 1,233 | | | $ | 815 | | | $ | 566 | |
| Net income attributable to non-controlling interest | Net income attributable to non-controlling interest | (35) | | | (21) | | | (16) | | | (11) | |
| Net income attributable to non-controlling interest | |
| Net income attributable to non-controlling interest | |
| Net income attributable to Intercontinental Exchange, Inc. | |
| Net income attributable to Intercontinental Exchange, Inc. | |
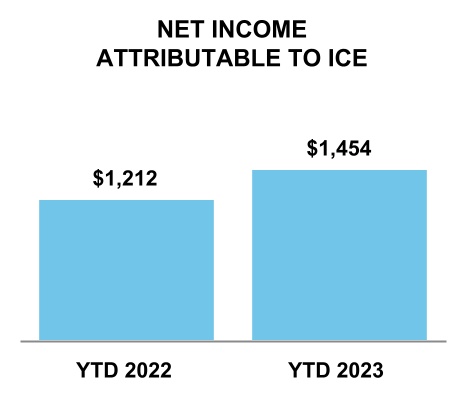
| Net income attributable to Intercontinental Exchange, Inc. | Net income attributable to Intercontinental Exchange, Inc. | $ | 1,454 | | | $ | 1,212 | | | $ | 799 | | | $ | 555 | |
| Earnings per share attributable to Intercontinental Exchange, Inc. common stockholders: | Earnings per share attributable to Intercontinental Exchange, Inc. common stockholders: | | | | | | | |
| Earnings per share attributable to Intercontinental Exchange, Inc. common stockholders: | |
| Earnings per share attributable to Intercontinental Exchange, Inc. common stockholders: | |
| Basic | |
| Basic | |
| Basic | Basic | $ | 2.60 | | | $ | 2.17 | | | $ | 1.43 | | | $ | 0.99 | |
| Diluted | Diluted | $ | 2.59 | | | $ | 2.16 | | | $ | 1.42 | | | $ | 0.99 | |
| Diluted | |
| Diluted | |
| Weighted average common shares outstanding: | |
| Weighted average common shares outstanding: | |
| Weighted average common shares outstanding: | Weighted average common shares outstanding: | | | | | | | |
| Basic | Basic | 560 | | | 560 | | | 560 | | | 558 | |
| Basic | |
| Basic | |
| Diluted | Diluted | 561 | | | 562 | | | 561 | | | 560 | |
| Diluted | |
| Diluted | |
See accompanying notes.
Intercontinental Exchange, Inc. and Subsidiaries
Consolidated Statements of Comprehensive Income
(In millions)
(Unaudited)
| | Three Months Ended March 31, | |
| Three Months Ended March 31, | |
| Three Months Ended March 31, | |
| 2024 | |
| 2024 | |
| 2024 | |
| Net income | |
| Net income | |
| Net income | |
| Other comprehensive income/(loss): | |
| Other comprehensive income/(loss): | |
| Other comprehensive income/(loss): | |
| Foreign currency translation adjustments | |
| Foreign currency translation adjustments | |
| Foreign currency translation adjustments | |
| Change in equity method investment | |
| Change in equity method investment | |
| Change in equity method investment | |
| | | Six Months Ended June 30, | | Three Months Ended June 30, |
| Other comprehensive income/(loss) | |
| | 2023 | | 2022 | | 2023 | | 2022 |
| Net income | $ | 1,489 | | | $ | 1,233 | | | $ | 815 | | | $ | 566 | |
| Other comprehensive income/(loss): | | | | | | | |
| Foreign currency translation adjustments | 47 | | | (109) | | | 31 | | | (84) | |
| | Other comprehensive income/(loss) | |
| | Other comprehensive income/(loss) | Other comprehensive income/(loss) | 47 | | | (109) | | | 31 | | | (84) | |
| Comprehensive income | Comprehensive income | $ | 1,536 | | | $ | 1,124 | | | $ | 846 | | | $ | 482 | |
| Comprehensive income | |
| Comprehensive income | |
| Comprehensive income attributable to non-controlling interest | |
| Comprehensive income attributable to non-controlling interest | |
| Comprehensive income attributable to non-controlling interest | Comprehensive income attributable to non-controlling interest | (35) | | | (21) | | | (16) | | | (11) | |
| Comprehensive income attributable to Intercontinental Exchange, Inc. | Comprehensive income attributable to Intercontinental Exchange, Inc. | $ | 1,501 | | | $ | 1,103 | | | $ | 830 | | | $ | 471 | |
| Comprehensive income attributable to Intercontinental Exchange, Inc. | |
| Comprehensive income attributable to Intercontinental Exchange, Inc. | |
See accompanying notes.
Intercontinental Exchange, Inc. and Subsidiaries
Consolidated Statements of Changes in Equity and Redeemable Non-Controlling Interest
(In millions)
(Unaudited)
| | Intercontinental Exchange, Inc. Stockholders’ Equity | |
| Intercontinental Exchange, Inc. Stockholders’ Equity | |
| Intercontinental Exchange, Inc. Stockholders’ Equity | |
| Common
Stock | |
| Common
Stock | |
| Common
Stock | |
| Shares | |
| Shares | |
| Shares | |
| Balance, as of December 31, 2023 | |
| Balance, as of December 31, 2023 | |
| Balance, as of December 31, 2023 | |
| | Intercontinental Exchange, Inc. Stockholders’ Equity | | Non-
Controlling
Interest in
Consolidated
Subsidiaries | | Total
Equity | |
| Other comprehensive loss | |
| | Common
Stock | | Treasury Stock | | Additional
Paid-in
Capital | | Retained
Earnings | | Accumulated
Other
Comprehensive
Income/(Loss) | |
| Other comprehensive loss | |
| | Shares | | Value | | Shares | | Value | | Additional
Paid-in
Capital | | Retained
Earnings | | Accumulated
Other
Comprehensive
Income/(Loss) | | Non-
Controlling
Interest in
Consolidated
Subsidiaries | | Total
Equity |
| Balance, as of December 31, 2022 | 634 | | | $ | 6 | | | (75) | | | $ | (6,225) | | | |
| Other comprehensive income | — | | | — | | | — | | | — | | | — | | | — | | | 47 | | | |
| | Other comprehensive loss | |
| Exercise of common stock options | |
| Exercise of common stock options | |
| Exercise of common stock options | Exercise of common stock options | — | | | — | | | — | | | — | | | 24 | | | — | | | — | | | — | | | 24 | | |
| | Payments relating to treasury shares | Payments relating to treasury shares | — | | | — | | | (1) | | | (51) | | | — | | | — | | | — | | | — | | | (51) | | |
| | Payments relating to treasury shares | |
| | Payments relating to treasury shares | |
| Stock-based compensation | |
| Stock-based compensation | |
| Stock-based compensation | Stock-based compensation | — | | | — | | | — | | | — | | | 94 | | | — | | | — | | | — | | | 94 | | |
| Issuance under the employee stock purchase plan | Issuance under the employee stock purchase plan | — | | | — | | | — | | | — | | | 18 | | | — | | | — | | | — | | | 18 | | |
| Contribution from equity partners | — | | | — | | | — | | | — | | | — | | | — | | | — | | | 9 | | | 9 | | |
| Issuance under the employee stock purchase plan | |
| Issuance under the employee stock purchase plan | |
| | Issuance of restricted stock | |
| | Issuance of restricted stock | |
| | Issuance of restricted stock | Issuance of restricted stock | 2 | | | — | | | — | | | — | | | — | | | — | | | — | | | — | | | — | | |
| | Distributions of profits | Distributions of profits | — | | | — | | | — | | | — | | | — | | | — | | | — | | | (30) | | | (30) | | |
| | Distributions of profits | |
| | Distributions of profits | |
| Dividends paid to stockholders | |
| Dividends paid to stockholders | |
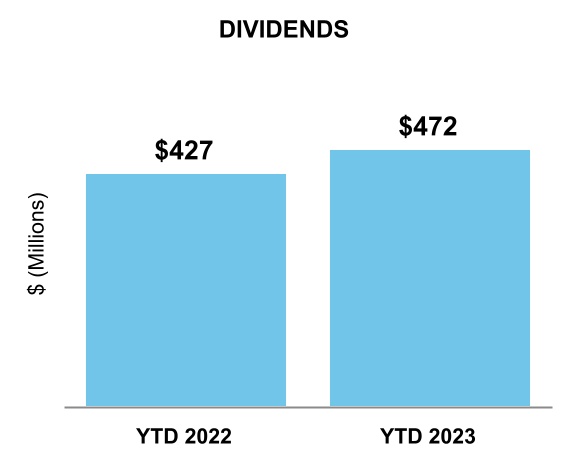
| Dividends paid to stockholders | Dividends paid to stockholders | — | | | — | | | — | | | — | | | — | | | (472) | | | — | | | — | | | (472) | | |
| | Net income/(loss) attributable to non-controlling interest | — | | | — | | | — | | | — | | | — | | | (35) | | | — | | | 35 | | | — | | |
| Net income attributable to non-controlling interest | |
| | Net income attributable to non-controlling interest | |
| | Net income attributable to non-controlling interest | |
| Net income | Net income | — | | | — | | | — | | | — | | | — | | | 1,489 | | | — | | | — | | | 1,489 | | |
| Balance, as of June 30, 2023 | 636 | | | $ | 6 | | | (76) | | | $ | (6,276) | | | $ | 14,449 | | | $ | 15,925 | | | $ | (284) | | | $ | 69 | | | $ | 23,889 | | |
| Net income | |
| Net income | |
| Balance, as of March 31, 2024 | |
| Balance, as of March 31, 2024 | |
| Balance, as of March 31, 2024 | |
| | Intercontinental Exchange, Inc. Stockholders’ Equity | | Non-
Controlling
Interest in
Consolidated
Subsidiaries | | Total
Equity | |
| Common
Stock | | Treasury Stock | | Additional
Paid-in
Capital | | Retained
Earnings | | Accumulated
Other
Comprehensive
Income/(Loss) | |
| Shares | | Value | | Shares | | Value | |
| Balance, as of March 31, 2023 | 635 | | | $ | 6 | | | (76) | | | $ | (6,274) | | | $ | 14,388 | | | $ | 15,362 | | | $ | (315) | | | $ | 44 | | | $ | 23,211 | | |
| Intercontinental Exchange, Inc. Stockholders’ Equity | | | Intercontinental Exchange, Inc. Stockholders’ Equity | | Non-
Controlling
Interest in
Consolidated
Subsidiaries | | Total
Equity |
| Common
Stock | |
| Shares | |
| Shares | |
| Shares | |
| Balance, as of December 31, 2022 | |
| Balance, as of December 31, 2022 | |
| Balance, as of December 31, 2022 | |
| Other comprehensive income | Other comprehensive income | — | | | — | | | — | | | — | | | — | | | — | | | 31 | | | — | | | 31 | | |
| | Exercise of common stock options | Exercise of common stock options | — | | | — | | | — | | | — | | | 14 | | | — | | | — | | | — | | | 14 | | |
| | Payments relating to treasury shares | |
| Payments relating to treasury shares | |
| Payments relating to treasury shares | Payments relating to treasury shares | — | | | — | | | — | | | (2) | | | — | | | — | | | — | | | — | | | (2) | | |
| Stock-based compensation | Stock-based compensation | — | | | — | | | — | | | — | | | 47 | | | — | | | — | | | — | | | 47 | | |
| | Contribution from equity partners | — | | | — | | | — | | | — | | | — | | | — | | | — | | | 9 | | | 9 | | |
| Issuance under the employee stock purchase plan | |
| Issuance of restricted stock | Issuance of restricted stock | 1 | | | — | | | — | | | — | | | — | | | — | | | — | | | — | | | — | | |
| | Distributions of profits | |
| Dividends paid to stockholders | Dividends paid to stockholders | — | | | — | | | — | | | — | | | — | | | (236) | | | — | | | — | | | (236) | | |
| | Net income/(loss) attributable to non-controlling interest | — | | | — | | | — | | | — | | | — | | | (16) | | | — | | | 16 | | | — | | |
| Net income attributable to non-controlling interest | |
| Net income attributable to non-controlling interest | |
| Net income attributable to non-controlling interest | |
| Net income | Net income | — | | | — | | | — | | | — | | | — | | | 815 | | | — | | | — | | | 815 | | |
| Balance, as of June 30, 2023 | 636 | | | $ | 6 | | | (76) | | | $ | (6,276) | | | $ | 14,449 | | | $ | 15,925 | | | $ | (284) | | | $ | 69 | | | $ | 23,889 | | |
| Balance, as of March 31, 2023 | |
Intercontinental Exchange, Inc. and Subsidiaries
Consolidated Statements of Changes in Equity and Redeemable Non-Controlling Interest - (Continued)
(In millions)
(Unaudited)
| | | | | | | | | | | | | | | | | | | | | | | | | | | | | | | | | | | | | | | | | | | | | | | | | | | | | |
| Intercontinental Exchange, Inc. Stockholders’ Equity | | Non-
Controlling
Interest in
Consolidated
Subsidiaries | | Total
Equity |
| Common
Stock | | Treasury Stock | | Additional
Paid-in
Capital | | Retained
Earnings | | Accumulated
Other
Comprehensive
Income/(Loss) | |
| Shares | | Value | | Shares | | Value | |
| Balance, as of December 31, 2021 | 631 | | | $ | 6 | | | (70) | | | $ | (5,520) | | | $ | 14,069 | | | $ | 14,350 | | | $ | (196) | | | $ | 39 | | | $ | 22,748 | |
| Other comprehensive loss | — | | | — | | | — | | | — | | | — | | | — | | | (109) | | | — | | | (109) | |
| Exercise of common stock options | — | | | — | | | — | | | — | | | 20 | | | — | | | — | | | — | | | 20 | |
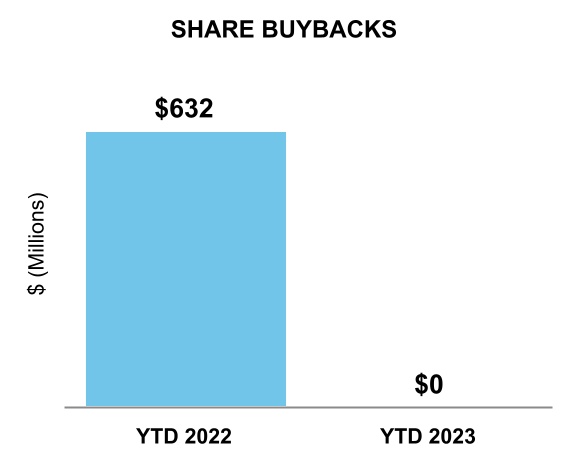
| Repurchases of common stock | — | | | — | | | (4) | | | (632) | | | — | | | — | | | — | | | — | | | (632) | |
| Payments relating to treasury shares | — | | | — | | | (1) | | | (71) | | | — | | | — | | | — | | | — | | | (71) | |
| Stock-based compensation | — | | | — | | | — | | | — | | | 88 | | | — | | | — | | | — | | | 88 | |
| Issuance under the employee stock purchase plan | — | | | — | | | — | | | — | | | 24 | | | — | | | — | | | — | | | 24 | |
| Issuance of restricted stock | 2 | | | — | | | — | | | — | | | — | | | — | | | — | | | — | | | — | |
| Distributions of profits | — | | | — | | | — | | | — | | | — | | | — | | | — | | | (13) | | | (13) | |
| Dividends paid to stockholders | — | | | — | | | — | | | — | | | — | | | (427) | | | — | | | — | | | (427) | |
| | | | | | | | | | | | | | | | | |
| Net income/(loss) attributable to non-controlling interest | — | | | — | | | — | | | — | | | — | | | (21) | | | — | | | 21 | | | — | |
| Net income | — | | | — | | | — | | | — | | | — | | | 1,233 | | | — | | | — | | | 1,233 | |
| Balance, as of June 30, 2022 | 633 | | | $ | 6 | | | (75) | | | $ | (6,223) | | | $ | 14,201 | | | $ | 15,135 | | | $ | (305) | | | $ | 47 | | | $ | 22,861 | |
| | | | | | | | | | | | | | | | | | | | | | | | | | | | | | | | | | | | | | | | | | | | | | | | | | | | | | | |
| Intercontinental Exchange, Inc. Stockholders’ Equity | | Non-
Controlling
Interest in
Consolidated
Subsidiaries | | Total
Equity | | |
| Common
Stock | | Treasury Stock | | Additional
Paid-in
Capital | | Retained
Earnings | | Accumulated
Other
Comprehensive
Income/(Loss) | |
| Shares | | Value | | Shares | | Value | |
| Balance, as of March 31, 2022 | 633 | | | $ | 6 | | | (74) | | | $ | (6,064) | | | $ | 14,153 | | | $ | 14,793 | | | $ | (221) | | | $ | 36 | | | $ | 22,703 | | | |
| Other comprehensive loss | — | | | — | | | — | | | — | | | — | | | — | | | (84) | | | — | | | (84) | | | |
| | | | | | | | | | | | | | | | | | | |
| Exercise of common stock options | — | | | — | | | — | | | — | | | 5 | | | — | | | — | | | — | | | 5 | | | |
| | | | | | | | | | | | | | | | | | | |
| Repurchases of common stock | — | | | — | | | (1) | | | (157) | | | — | | | — | | | — | | | — | | | (157) | | | |
| Payments relating to treasury shares | — | | | — | | | — | | | (2) | | | — | | | — | | | — | | | — | | | (2) | | | |
| Stock-based compensation | — | | | — | | | — | | | — | | | 43 | | | — | | | — | | | — | | | 43 | | | |
| | | | | | | | | | | | | | | | | | | |
| | | | | | | | | | | | | | | | | | | |
| | | | | | | | | | | | | | | | | | | |
| | | | | | | | | | | | | | | | | | | |
| | | | | | | | | | | | | | | | | | | |
| Dividends paid to stockholders | — | | | — | | | — | | | — | | | — | | | (213) | | | — | | | — | | | (213) | | | |
| | | | | | | | | | | | | | | | | | | |
| | | | | | | | | | | | | | | | | | | |
| Net income/(loss) attributable to non-controlling interest | — | | | — | | | — | | | — | | | — | | | (11) | | | — | | | 11 | | | — | | | |
| Net income | — | | | — | | | — | | | — | | | — | | | 566 | | | — | | | — | | | 566 | | | |
| Balance, as of June 30, 2022 | 633 | | | $ | 6 | | | (75) | | | $ | (6,223) | | | $ | 14,201 | | | $ | 15,135 | | | $ | (305) | | | $ | 47 | | | $ | 22,861 | | | |
See accompanying notes.
Intercontinental Exchange, Inc. and Subsidiaries
Consolidated Statements of Cash Flows
(In millions)
(Unaudited) | | Three Months Ended March 31, | |
| Three Months Ended March 31, | |
| Three Months Ended March 31, | |
| 2024 | |
| 2024 | |
| 2024 | |
| Operating activities: | |
| Operating activities: | |
| Operating activities: | |
| Net income | |
| Net income | |
| Net income | |
| Adjustments to reconcile net income to net cash provided by operating activities: | |
| Adjustments to reconcile net income to net cash provided by operating activities: | |
| Adjustments to reconcile net income to net cash provided by operating activities: | |
| Depreciation and amortization | |
| Depreciation and amortization | |
| Depreciation and amortization | |
| | Stock-based compensation | |
| | Stock-based compensation | |
| | Stock-based compensation | |
| Deferred taxes | |
| Deferred taxes | |
| Deferred taxes | |
| | Loss on investments | |
| | Loss on investments | |
| | Loss on investments | |
| Net losses from unconsolidated investees | |
| Net losses from unconsolidated investees | |
| Net losses from unconsolidated investees | |
| | Other | |
| | Other | |
| | Other | |
| Changes in assets and liabilities: | |
| Changes in assets and liabilities: | |
| Changes in assets and liabilities: | |
| Customer accounts receivable | |
| Customer accounts receivable | |
| Customer accounts receivable | |
| Other current and non-current assets | |
| Other current and non-current assets | |
| Other current and non-current assets | |
| Section 31 fees payable | |
| Section 31 fees payable | |
| Section 31 fees payable | |
| Deferred revenue | |
| Deferred revenue | |
| Deferred revenue | |
| Other current and non-current liabilities | |
| Other current and non-current liabilities | |
| Other current and non-current liabilities | |
| Total adjustments | |
| Total adjustments | |
| Total adjustments | |
| Net cash provided by operating activities | |
| Net cash provided by operating activities | |
| Net cash provided by operating activities | |
| | Investing activities: | |
| | Investing activities: | |
| | Investing activities: | |
| Capital expenditures | |
| Capital expenditures | |
| Capital expenditures | |
| Capitalized software development costs | |
| Capitalized software development costs | |
| Capitalized software development costs | |
| Purchases of invested margin deposits | |
| Purchases of invested margin deposits | |
| Purchases of invested margin deposits | |
| Proceeds from sales of invested margin deposits | |
| Proceeds from sales of invested margin deposits | |
| Proceeds from sales of invested margin deposits | |
| | Proceeds from sale of Promissory Note | |
| | Proceeds from sale of Promissory Note | |
| | Proceeds from sale of Promissory Note | |
| | | Six Months Ended June 30, | |
| | 2023 | | 2022 | |
| Operating activities: | | | | |
| Net income | $ | 1,489 | | | $ | 1,233 | | |
| Adjustments to reconcile net income to net cash provided by operating activities: | | | | |
| Depreciation and amortization | 527 | | | 510 | | |
| Stock-based compensation | 85 | | | 76 | | |
| Deferred taxes | (239) | | | (147) | | |
| Gain on sale of Euroclear investment | — | | | (41) | | |
| Purchases of restricted investments | |
| | Net losses from unconsolidated investees | 65 | | | 57 | | |
| | Purchases of restricted investments | |
| | Purchases of restricted investments | |
| Proceeds from sales of restricted investments | |
| Proceeds from sales of restricted investments | |
| Proceeds from sales of restricted investments | |
| Other | Other | 26 | | | 21 | | |
| Changes in assets and liabilities: | | |
| Customer accounts receivable | (181) | | | (177) | | |
| Other current and non-current assets | (66) | | | (48) | | |
| Section 31 fees payable | (50) | | | 115 | | |
| Deferred revenue | 279 | | | 292 | | |
| Other current and non-current liabilities | (130) | | | (166) | | |
| Total adjustments | 316 | | | 492 | | |
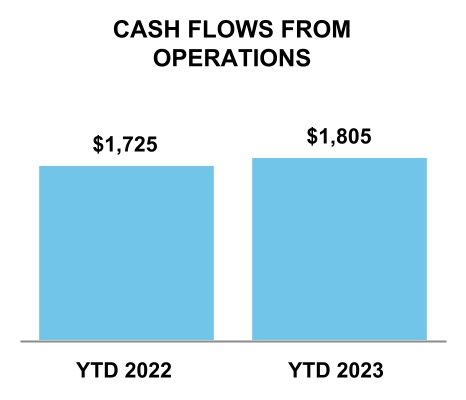
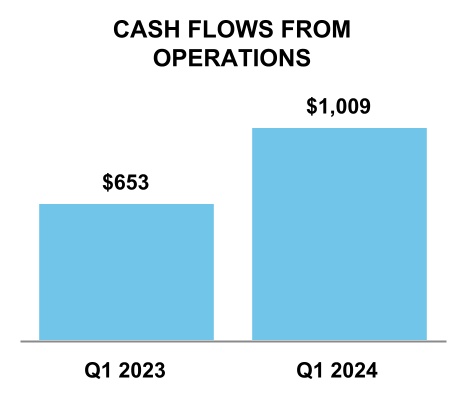
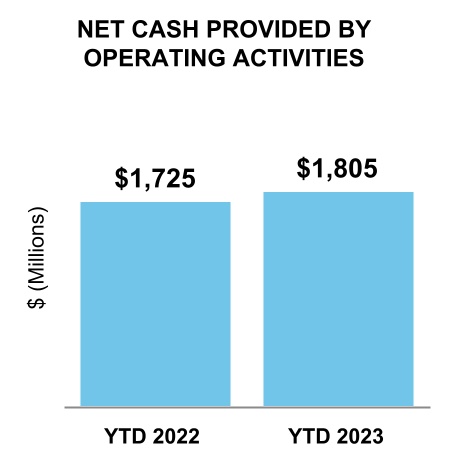
| Net cash provided by operating activities | 1,805 | | | 1,725 | | |
| Other | |
| Other | |
| | Investing activities: | | |
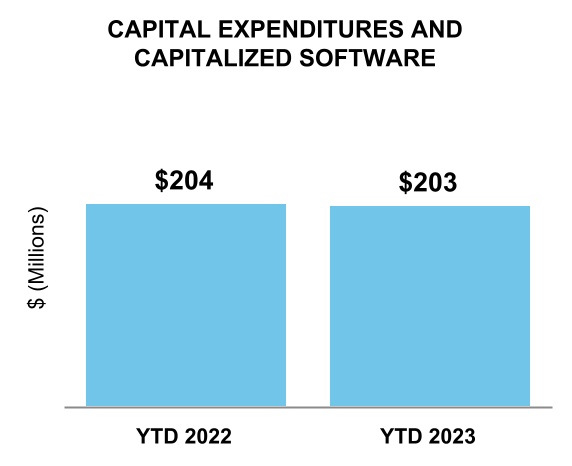
| Capital expenditures | (61) | | | (70) | | |
| Capitalized software development costs | (142) | | | (134) | | |
| Purchases of invested margin deposits | (771) | | | (1,431) | | |
| Proceeds from sales of invested margin deposits | 3,078 | | | 3,815 | | |
| Cash paid for acquisitions, net of cash acquired | (5) | | | (36) | | |
| Net cash provided by investing activities | |
| | Purchases of equity and equity method investments | (6) | | | (43) | | |
| Proceeds from sale of Euroclear investment | — | | | 741 | | |
| | Purchases of investments | (949) | | | — | | |
| | Other | — | | | 1 | | |
| Net cash provided by investing activities | |
| | Net cash provided by investing activities | Net cash provided by investing activities | 1,144 | | | 2,843 | | |
| | Financing activities: | Financing activities: | | |
| | Financing activities: | |
| | Proceeds from/(repayments of) debt facilities, net | (4) | | | 5,186 | | |
| Financing activities: | |
| | Repayments of debt | |
| | Repayments of debt | |
| | Repayments of debt | |
| | Redemption of commercial paper, net | Redemption of commercial paper, net | — | | | (1,012) | | |
| Capital contributions from non-controlling interests | 9 | | | — | | |
| Repurchases of common stock | — | | | (632) | | |
| | Redemption of commercial paper, net | |
| | Redemption of commercial paper, net | |
| | Dividends to stockholders | Dividends to stockholders | (472) | | | (427) | | |
| Change in cash and cash equivalent margin deposits and guaranty funds | (57,380) | | | 16,163 | | |
| | Dividends to stockholders | |
| | Dividends to stockholders | |
| Change in cash and cash equivalent margin deposits and guaranty funds liability | |
| Change in cash and cash equivalent margin deposits and guaranty funds liability | |
| Change in cash and cash equivalent margin deposits and guaranty funds liability | |
| Payments relating to treasury shares received for restricted stock tax payments and stock option exercises | |
| Payments relating to treasury shares received for restricted stock tax payments and stock option exercises | |
| Payments relating to treasury shares received for restricted stock tax payments and stock option exercises | Payments relating to treasury shares received for restricted stock tax payments and stock option exercises | (50) | | | (71) | | |
| | Other | Other | 11 | | | 31 | | |
| Net cash provided by/(used in) financing activities | (57,886) | | | 19,238 | | |
| | Other | |
| | Other | |
| Net cash used in financing activities | |
| Net cash used in financing activities | |
| Net cash used in financing activities | |
| Effect of exchange rate changes on cash, cash equivalents, restricted cash and cash equivalents, and cash and cash equivalent margin deposits and guaranty funds | Effect of exchange rate changes on cash, cash equivalents, restricted cash and cash equivalents, and cash and cash equivalent margin deposits and guaranty funds | 6 | | | (19) | | |
| Net increase/(decrease) in cash, cash equivalents, restricted cash and cash equivalents, and cash and cash equivalent margin deposits and guaranty funds | (54,931) | | | 23,787 | | |
| Effect of exchange rate changes on cash, cash equivalents, restricted cash and cash equivalents, and cash and cash equivalent margin deposits and guaranty funds | |
| Effect of exchange rate changes on cash, cash equivalents, restricted cash and cash equivalents, and cash and cash equivalent margin deposits and guaranty funds | |
| Net decrease in cash, cash equivalents, restricted cash and cash equivalents, and cash and cash equivalent margin deposits and guaranty funds | |
| Net decrease in cash, cash equivalents, restricted cash and cash equivalents, and cash and cash equivalent margin deposits and guaranty funds | |
| Net decrease in cash, cash equivalents, restricted cash and cash equivalents, and cash and cash equivalent margin deposits and guaranty funds | |
| Cash, cash equivalents, restricted cash and cash equivalents, and cash and cash equivalent margin deposits and guaranty funds at beginning of period | |
| Cash, cash equivalents, restricted cash and cash equivalents, and cash and cash equivalent margin deposits and guaranty funds at beginning of period | |
| Cash, cash equivalents, restricted cash and cash equivalents, and cash and cash equivalent margin deposits and guaranty funds at beginning of period | Cash, cash equivalents, restricted cash and cash equivalents, and cash and cash equivalent margin deposits and guaranty funds at beginning of period | 150,343 | | | 147,976 | | |
| Cash, cash equivalents, restricted cash and cash equivalents, and cash and cash equivalent margin deposits and guaranty funds at end of period | Cash, cash equivalents, restricted cash and cash equivalents, and cash and cash equivalent margin deposits and guaranty funds at end of period | $ | 95,412 | | | $ | 171,763 | | |
| | Cash, cash equivalents, restricted cash and cash equivalents, and cash and cash equivalent margin deposits and guaranty funds at end of period | |
| Cash, cash equivalents, restricted cash and cash equivalents, and cash and cash equivalent margin deposits and guaranty funds at end of period | |
Intercontinental Exchange, Inc. and Subsidiaries
Consolidated Statements of Cash Flows (Continued)
(In millions)
(Unaudited)
| | As of June 30, 2023 | | As of June 30, 2022 | |
| | Three Months Ended March 31, | |
| | Three Months Ended March 31, | |
| | Three Months Ended March 31, | |
| | 2024 | |
| | 2024 | |
| | 2024 | |
| Supplemental cash flow disclosure: | |
| Supplemental cash flow disclosure: | |
| Supplemental cash flow disclosure: | Supplemental cash flow disclosure: | | | | | |
| Cash paid for income taxes | Cash paid for income taxes | | $ | 536 | | | $ | 524 | | |
| Cash paid for income taxes | |
| Cash paid for income taxes | |
| Cash paid for interest | |
| Cash paid for interest | |
| Cash paid for interest | Cash paid for interest | | $ | 341 | | | $ | 226 | | |
| | Reconciliation of the components of cash, cash equivalents, restricted cash and cash equivalents, and cash and cash equivalent margin deposits and guaranty funds to the balance sheet: | | |
| Reconciliation of the components of cash, cash equivalents, restricted cash and cash equivalents, and cash and cash equivalent margin deposits and guaranty funds to the consolidated balance sheets: | |
| | Reconciliation of the components of cash, cash equivalents, restricted cash and cash equivalents, and cash and cash equivalent margin deposits and guaranty funds to the consolidated balance sheets: | |
| | Reconciliation of the components of cash, cash equivalents, restricted cash and cash equivalents, and cash and cash equivalent margin deposits and guaranty funds to the consolidated balance sheets: | |
| Cash and cash equivalents | |
| Cash and cash equivalents | |
| Cash and cash equivalents | Cash and cash equivalents | | $ | 2,877 | | | $ | 830 | | |
| Short-term restricted cash and cash equivalents | Short-term restricted cash and cash equivalents | | 5,413 | | | 6,045 | | |
| Short-term restricted cash and cash equivalents | |
| Short-term restricted cash and cash equivalents | |
| Long-term restricted cash and cash equivalents | |
| Long-term restricted cash and cash equivalents | |
| Long-term restricted cash and cash equivalents | Long-term restricted cash and cash equivalents | | 205 | | | 405 | | |
| Cash and cash equivalent margin deposits and guaranty funds | Cash and cash equivalent margin deposits and guaranty funds | | 86,917 | | | 164,483 | | |
| Cash and cash equivalent margin deposits and guaranty funds | |
| Cash and cash equivalent margin deposits and guaranty funds | |
| Total | Total | | $ | 95,412 | | | $ | 171,763 | | |
| Total | |
| Total | |
See accompanying notes.
Intercontinental Exchange, Inc. and Subsidiaries
Notes to Consolidated Financial Statements
(Unaudited)
1.Description of Business
Nature of Business and Organization
Intercontinental Exchange, Inc. is a leading global provider of market infrastructure,technology and data services and technology solutions to a broad range of customers including financial institutions, corporations and government entities. TheseOur products, which span major asset classes including futures, equities, fixed income and United States, or U.S., residential mortgages, provide our customers with access to mission critical tools that are designed to increase asset class transparency and workflow efficiency. Our business is conducted through three reportable business segments:
•Exchanges: We operate regulated marketplacesmarketplace technology for the listing, trading and clearing of a broad array of derivatives contracts and financial securities.securities as well as data and connectivity services related to our exchanges and clearing houses.
•Fixed Income and Data Services: We provide fixed income pricing, reference data, indices, analytics and execution services as well as global credit default swap, or CDS, clearing and multi-asset class data delivery solutions.technology.
•Mortgage Technology: We provide a technology platform that offers customers comprehensive, digital workflow tools that aim to address the inefficiencies and mitigate risks that exist in the U.S. residential mortgage market life cycle from application through closing, servicing and the secondary market.
We operate marketplaces, technology and provide data services in the U.S., United Kingdom, or U.K., European Union, or EU, Canada, Asia Pacific and the Middle East.
2. Summary of Significant Accounting Policies
Basis of Presentation
The accompanying unaudited consolidated financial statements have been prepared in accordance with U.S. generally accepted accounting principles, or U.S. GAAP, pursuant to the rules and regulations of the Securities and Exchange Commission, or SEC, regarding interim financial reporting. Accordingly, the unaudited consolidated financial statements do not include all of the information and footnotes required by U.S. GAAP for complete financial statements and should be read in conjunction with our audited consolidated financial statements and related notes thereto for the year ended December 31, 2022.2023. The accompanying unaudited consolidated financial statements reflect all adjustments that are, in our opinion, necessary for a fair presentation of results for the interim periods presented. We believe that these adjustments are of a normal recurring nature.
Preparing financial statements in conformity with U.S. GAAP requires us to make certain estimates and assumptions that affect the amounts that are reported in our consolidated financial statements and accompanying disclosures.notes. Actual amounts could differ from those estimates. The results of operations for the six months and three months ended June 30, 2023March 31, 2024 are not necessarily indicative of the results to be expected for any future period or the full fiscal year.
These statements include the accounts of our wholly-owned and controlled subsidiaries. All intercompany balances and transactions between us and our wholly-owned and controlled subsidiaries have been eliminated in consolidation. For consolidated subsidiaries in which our ownership is less than 100% and for which we have control over the assets and liabilities and the management of the entity, the outside stockholders’ interests are shown as non-controlling interests.
We have considered the impacts of macroeconomic conditions during the quarter, including interest rates, the inflationary environment, election outcomes, geopolitical events and military conflicts, including repercussions from the conflictconflicts in Ukraine, Israel and Gaza and the impactimpacts that any of the foregoing may have on the global economy and on our business. As of June 30, 2023,March 31, 2024, our businesses and operations, including our exchanges, clearing houses, listings venues, data services businesses and mortgage platforms, have not suffered a material negative impact as a result of these events. There continues to be uncertainty surrounding the current macroeconomic environment and the impact that it may have on the global economy and on our business.
Recently Adopted Accounting Pronouncements
During the sixthree months ended June 30, 2023,March 31, 2024, there were no significant changes to the new and recently adopted accounting pronouncements applicable to us from those disclosed in Note 2 to the consolidated financial statements in Part II, Item 8 of our Annual Report on Form 10-K for the year ended December 31, 2022,2023, or the 20222023 Form 10-K.
3. Pending AcquisitionAcquisitions and Divestitures
Pending Acquisition of Black Knight, Inc.
On May 4, 2022,September 5, 2023, we announced that we had entered into a definitive agreement to acquireacquired 100% of the equity interests in Black Knight, Inc., or Black Knight, a software, data and analytics company that serves the housing finance continuum, including real estate data, mortgage lending and servicing, as well as the secondary markets. Pursuant to that certain Agreement and Plan of Merger, dated as of May 4, 2022, among ICE, Sand Merger Sub Corporation, a wholly owned subsidiary of ICE, or Sub, and Black Knight, which we refer to as the “merger agreement,” Sub will merge with and into Black Knight, which we refer to as the “merger,” with Black Knight surviving as a wholly owned subsidiary of ICE.
On March 7, 2023, ICE and Black Knight announced that, in connection with the merger agreement, Black Knight has entered into an agreement to sell its Empower loan origination business. On March 7, 2023, ICE and Black Knight also entered into an amendment to the merger agreement to reduce the value of thefor aggregate transaction consideration toof approximately $11.7 billion as of March 7, 2023, or $75 per share of Black Knight common stock, with cash comprising 90% of the value of the aggregate transaction consideration and shares of our common stock comprising 10% of the value of the aggregate transaction consideration.$11.8 billion. The aggregate cash component of the transaction consideration is fixed atwas $10.5 billion, and the valuebillion. We issued 10.9 million shares of the aggregateICE common stock component of the transaction consideration will fluctuate withto Black Knight stockholders, which was based on the market price of our common stock and will be determined based on the average of the volume weighted averages of the trading prices of our common stock on each of the ten consecutive trading days ending three trading days prior to the closing of the merger. If consummated, weWe expect that this transaction will build on our position as a provider of end-to-end electronic workflow solutions for the rapidly evolving U.S. residential mortgage industry. We believe the Black Knight ecosystem adds value for clients of all sizes across the mortgage and real estate lifecycles by helping organizations lower costs, increase efficiencies, grow their businesses, and reduce risk.
On March 30,September 14, 2023, our amended proxy statement/prospectus on Form S-4 was declared effective byor the SEC, and on April 28, 2023, Black Knight stockholders approved the amendment toDivestiture Date, in connection with the merger agreement.
On July 17, 2023,agreement, we announced that we have agreed to sellsold Black Knight’sKnight's Optimal Blue businessand Empower loan origination system, or LOS, businesses, or the Divestitures, to subsidiaries of Constellation Software, Inc. The cash proceeds from the same purchaser as that of the Empower business for $700Divestitures were $241 million. The structure of this proposedthe Optimal Blue transaction includesalso included a paymentpromissory note with a face value of $200 million in cash, with the remainder financed by a $500 million, promissory noteor the Promissory Note, issued by the purchaser to Black Knight, as a subsidiary of ICE, at the closing of the transaction. The closingPromissory Note had a 40-year term with a maturity date of September 5, 2063, and a coupon interest rate of 7.0% per year. The Promissory Note was valued at $235 million on the proposedDivestiture Date. In accordance with Accounting Standards Codification, or ASC, 805, Business Combinations, or ASC 805, as well as ASC 360, Impairment and Disposal of Long-Lived Assets, we are required to measure an acquired long-lived asset or disposal group that is classified as held for sale at the acquisition date at fair value less cost to sell. Accordingly, there was no gain or loss recognized on the Divestitures.
For the period between the acquisition date of September 5, 2023 through the Divestiture Date, the discontinued operations of Empower and Optimal Blue divestiture transaction is subjectwere immaterial.
Pursuant to the closing of our acquisition ofAgreement Containing Consent Orders entered into between the Federal Trade Commission, or the FTC, and ICE and Black Knight, the closingPromissory Note was required to be sold within six months of the Divestiture Date. We elected the fair value option for the right to receive the net proceeds of the sale of the Promissory Note. As of December 31, 2023, we wrote down the value of the Promissory Note to $75 million based on Level 3 inputs, resulting in a fair value loss of $160 million. In February 2024, the FTC approved the buyer of the Promissory Note, and we completed the sale of the Promissory Note and received the $75 million of proceeds thereafter.
The estimated net fair value of the consideration transferred for Black Knight was approximately $11.4 billion as of the acquisition date, which consisted of Black Knight’s Empower loan origination systemthe following (in millions):
| | | | | | |
| Transaction Consideration | |
| Cash | $ | 10,542 | | |
| ICE common stock* | 1,274 | | |
| Converted vested Black Knight awards | 22 | | |
| Total preliminary purchase price | $ | 11,838 | | |
| Less: Divestitures | (476) | | |
| Total net preliminary purchase price | $ | 11,362 | | |
*Fair value of the ICE common stock is based on the ICE closing stock price on September 1, 2023, the last business andday prior to the satisfaction of other customary closing conditions.acquisition close.
The transactionpurchase price has been allocated to the net tangible and identifiable intangible assets and liabilities based on the preliminary respective estimated fair values on the date of acquisition. The excess of the purchase price over the net tangible and identifiable intangible assets has been recorded as goodwill, of which $186 million is expected to closebe deductible for tax purposes. Goodwill represents potential revenue synergies related to new product development, various expense synergies and opportunities to enter new markets, and is assigned to our Mortgage Technology business segment. The preliminary net purchase price allocation is as follows (in millions):
| | | | | | |
| Net Preliminary Purchase Price Allocation | |
| Cash and cash equivalents | $ | 108 | | |
| Property and equipment | 119 | | |
| Goodwill | 9,421 | | |
| Identifiable intangibles | 4,948 | | |
| Debt acquired | (2,397) | | |
| Other assets and liabilities, net | 78 | | |
| Deferred tax liabilities on identifiable intangibles | (1,266) | | |
| Other deferred tax assets | 351 | | |
| Net preliminary purchase price | $ | 11,362 | | |
In performing the net preliminary purchase price allocation, we considered, among other factors, the intended future use of acquired assets, analysis of historical financial performance and estimates of future performance of the Black Knight business. For the identified intangible assets, the fair values have been preliminarily determined using the income and cost approaches and are partially based on inputs that are unobservable including forecasted future cash flows, revenue and margin growth rates, customer attrition rates and discount rates that require judgement and are subject to change. We have not yet obtained all of the information related to the fair value of the acquired assets and liabilities.
The primary areas of the preliminary purchase price allocation that are not yet finalized relate to the valuation of the identifiable intangible assets, income taxes and certain other tangible assets and liabilities. The allocation of the purchase price will be finalized upon the completion of the analysis of the acquired assets and liabilities within one year of the date of acquisition.
The following table sets forth the components of the preliminary intangible assets associated with the acquisition as of March 31, 2024 (in millions, except years):
| | | | | | | | | | | | |
| Acquisition-Date Preliminary Fair Value | | Weighted average life (Years) | |
| Developed Technology | $ | 1,176 | | | 10 | |
| Trademarks/Tradenames | 159 | | | 19 | |
| Customer Relationships | 3,034 | | | 13 | |
| Data and Databases | 579 | | | 10 | |
| Total | $ | 4,948 | | | 12 | |
Black Knight revenues of $270 million, which are included in our mortgage technology revenues, and operating expenses of $288 million were recorded in our consolidated statement of income for the three months ended March 31, 2024.
The financial information in the second half oftable below combines the historical results for us and Black Knight for the three months ended March 31, 2023, followingon a pro forma basis, as though the receipt of regulatory approvals, a favorable resolutioncompanies had been combined as of the FTC litigation concerning thisbeginning of the prior period presented (in millions). The unaudited pro forma financial information is presented for informational purposes only and is not indicative of the results of operations that would have been achieved if the acquisition had taken place at the beginning of the period presented. Such unaudited pro forma financial information is based on the historical financial statements of ICE and Black Knight. This unaudited pro forma financial information is based on estimates and assumptions that have been made solely for purposes of developing such unaudited pro forma information, including, without limitation, purchase accounting adjustments, interest expense on debt issued to finance the purchase price, acquisition-related transaction costs, the removal of historical Black Knight intangible asset amortization and the satisfactionaddition of customary closing conditions. See Note 13 where additional detailsintangible asset amortization related to this acquisition. The unaudited pro forma financial information does not reflect any synergies or operating cost reductions that have been and may be achieved from the combined operations. | | | | | |
| Three months ended March 31, 2023 |
| Total revenues, less transaction-based expenses | $ | 2,175 | |
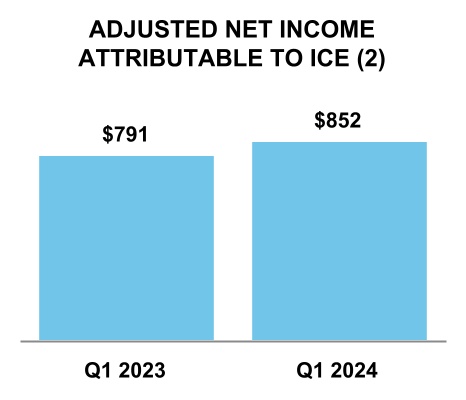
| Net income attributable to ICE | $ | 544 | |
Transaction-based expenses included within revenues, less transaction-based expenses in the table above were not impacted by pro forma adjustments and agree to the amounts presented historically in our consolidated statements of this transaction are discussed.income as they relate solely to ICE and not to Black Knight.
4. Investments
Equity Investments Subject to ASU 2016-01
Our equity investments are subject to valuation under Accounting Standards Update, or ASU, 2016-01, Financial Instruments- Overall (Subtopic 825-10): Recognition and Measurement of Financial Assets and Financial Liabilities, or ASU 2016-01. See Note 14 for a discussion of our determination of fair value of our financial instruments, which were not material as of June 30, 2023.
Investment in Euroclear
We previously owned a 9.8% stake in Euroclear, plc, or Euroclear, that we originally purchased for $631 million. We participated on the Euroclear Board of Directors, and we classified our investment in Euroclear as an equity investment.
During the three months ended June 30, 2022, we completed the sale of our 9.8% stake in Euroclear. The carrying value of our investment was $700 million at the time of the sale and was classified within other current assets on our balance sheet. We recorded a net gain on the sale of $41 million, which was included in other income, during the three months ended June 30, 2022.
Equity Method Investments
Our equity method investments include the Options Clearing Corporation, or OCC, and Bakkt Holdings, LLC, or Bakkt, among others. Our equity method investments are included in other non-current assets in the accompanying consolidated
balance sheet.sheets. We initially record our equity method investments at cost. At the end of each reporting period, we record our share of profits or losses of our equity method investments as equity earnings included in other income and adjust the carrying value of our equity method investment accordingly. In addition, if and when our equity method investments issue cash dividends to us, we deduct the amount of these dividends from the carrying amount of that investment. We assess the carrying value periodically if impairment indicators are present.
We recognized $65$42 million and $57$35 million as our share of estimated losses, net, from our equity method investments during the six months ended June 30, 2023 and 2022, respectively, and $30 million and $15 million as our share of losses, net, from our equity method investments during the three months ended June 30,March 31, 2024 and 2023, and 2022, respectively. The estimated losses during both the six months and three months ended June 30, 2023 and 2022 are primarily related to our investment in Bakkt, partially offset by our share of OCC profits. Both periods include adjustments to reflect the difference between reported prior period actual results from our original estimates.
When performing our assessment of the carrying value of our investments, we consider, among other things, the length of time and the extent to which the market value has been less than our cost basis, if applicable, the investee's financial condition and near-term prospects, the economic or technological environment in which our investees operate, weakening of the general market condition of the related industry, whether an investee can continue as a going concern, any impairment charges recorded by an investee on goodwill, intangible or long-lived assets, and our intent and ability to retain the investment for a period of time sufficient to allow for any anticipated recovery in market value.
Investment in OCC
We own a 40% interest in OCC through a direct investment by the New York Stock Exchange, or NYSE. OCC is regulated by the SEC as a registered clearing agency and by the Commodity Futures Trading Commission, or CFTC, as a derivatives clearing organization. OCC serves as a clearing house for securities options, securitysecurities futures, commodity futures and options on futures traded on various independent exchanges. OCC clears securities options traded on NYSE Arca and NYSE Amex Options, along with other non-affiliated exchanges.
Investment in Bakkt
As of June 30,March 31, 2024 and December 31, 2023, we held an approximate 55% and 64% economic interest in Bakkt.Bakkt, respectively. As a result of limitations on ICE from the Bakkt voting agreement entered into in connection with Bakkt's merger with VIH, we hold a minority voting interest in Bakkt and treat it as an equity method investment. The decrease in ownership during the three months ended March 31, 2024 is related to Bakkt's offering of shares of its Class A common stock and warrants to purchase shares of its Class A common stock, which diluted our ownership. As part of the offering, on February 29, 2024, we entered into a securities purchase agreement to purchase shares of Bakkt's Class A common stock and warrants to purchase additional shares of Bakkt's Class A common stock for a total of $10 million, of which approximately $2 million was paid as of March 31, 2024.
As of March 31, 2024, the carrying value of our investment in Bakkt was determined to be $14 million. As Bakkt is a public company with a readily available market price, the fair value of our investment using the quoted market price of Bakkt Class A common stock as of March 31, 2024 was $82 million.
5. Revenue Recognition
Substantially all of our revenues are considered to be revenues from contracts with customers. The related accounts receivable balances are recorded in our consolidated balance sheets as customer accounts receivable. We do not have obligations for warranties, returns or refunds to customers, other than rebates, which are settled each period and therefore do not result in variable consideration. We do not have significant revenue recognized from performance obligations that were satisfied in prior periods, and we do not have any transaction price allocated to unsatisfied performance obligations other than in our deferred revenue.periods. Certain judgments and estimates are used in the identification and timing of satisfaction of performance obligations and the related allocation of transaction price. We believe that these represent a faithful depiction of the transfer of services to our customers.
Deferred revenue represents our contract liabilities related to our annual, original and other listings revenues, certain data services, clearing services, mortgage technology services and other revenues. Deferred revenue is our only significant contract liability. See Note 7 for our discussion of deferred revenue balances, activity, and expected timing of recognition.
For all of our contracts with customers, except for listings and certain data, clearing and mortgage services, our performance obligations are short term in nature and there is no significant variable consideration. In addition, we have elected the practical expedient of excluding sales taxes from transaction prices. We have assessed the costs incurred to obtain or fulfill a contract with a customer, which are primarily our sales commissions.
Refer to NoteNotes 2 and 5 to the consolidated financial statements included in Part II, Item 8 of our 20222023 Form 10-K where we describe our revenue recognition accounting policies and our primary revenue contract classifications are described in detail.detail, respectively.
The following table depicts the disaggregation of our revenuerevenues according to business line and segment (in millions). Amounts here have been aggregated as they follow consistent revenue recognition patterns, and are consistent with the segment information in Note 15:
| | | | | | | | | | | | | | | | | | | | | | | |
| | Exchanges Segment | | Fixed Income and Data Services Segment | | Mortgage Technology Segment | | Total Consolidated |
| Three Months Ended March 31, 2024: | | | | | | | |
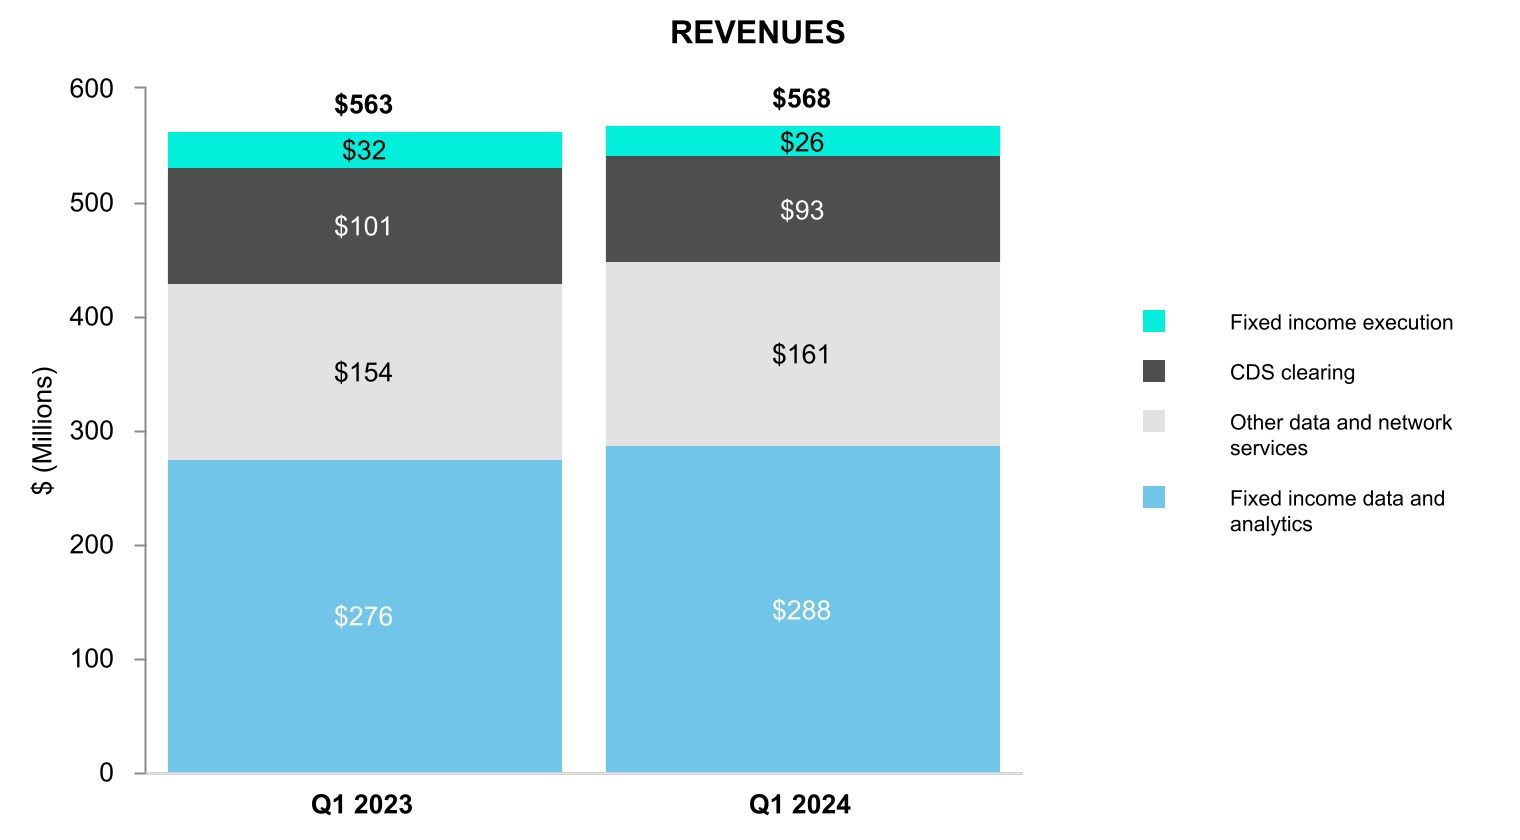
Total revenues (1) | $ | 1,734 | | | $ | 568 | | | $ | 499 | | | $ | 2,801 | |
| Transaction-based expenses | 511 | | | — | | | — | | | 511 | |
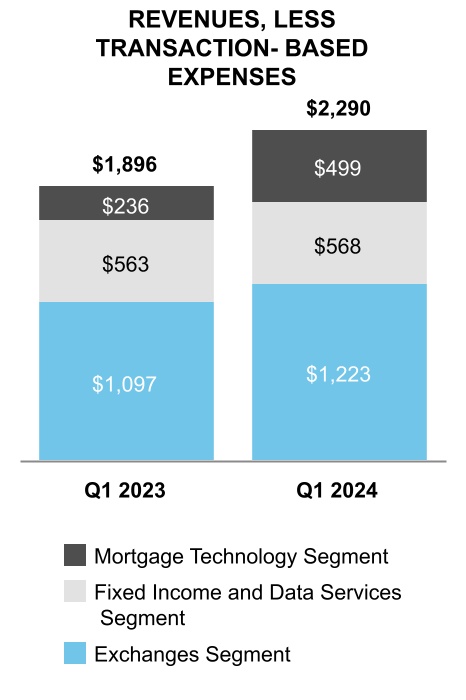
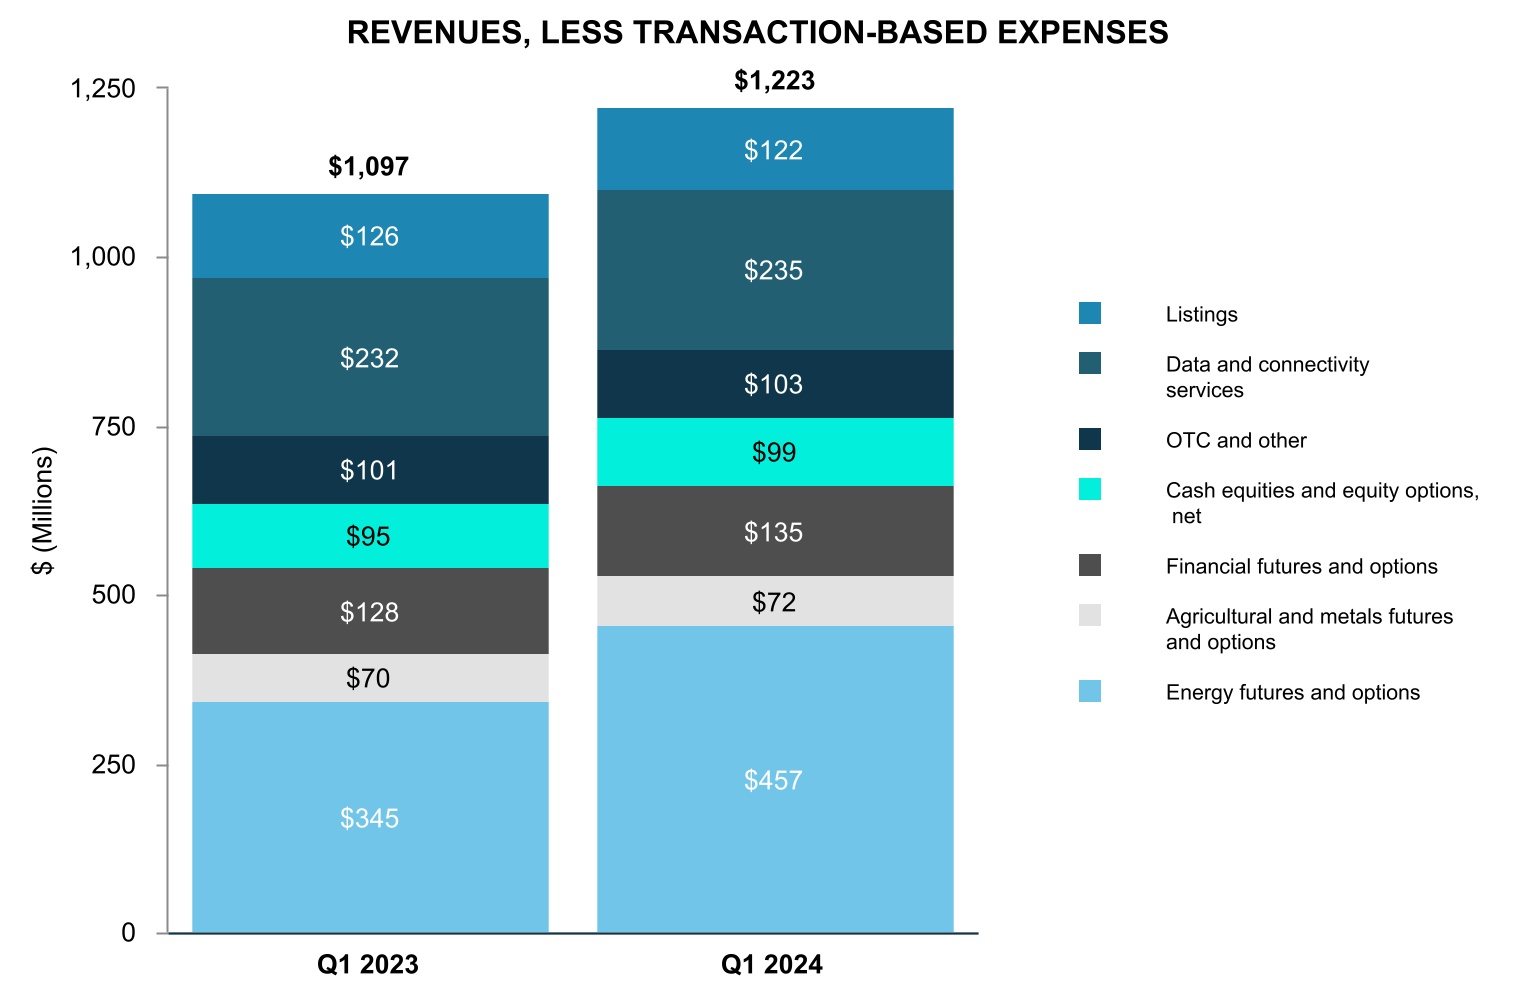
| Total revenues, less transaction-based expenses | $ | 1,223 | | | $ | 568 | | | $ | 499 | | | $ | 2,290 | |
| | | | | | | |
| Timing of Revenue Recognition | | | | | | | |
| Services transferred at a point in time | $ | 742 | | | $ | 111 | | | $ | 106 | | | $ | 959 | |
| Services transferred over time | 481 | | | 457 | | | 393 | | | 1,331 | |
| Total revenues, less transaction-based expenses | $ | 1,223 | | | $ | 568 | | | $ | 499 | | | $ | 2,290 | |
| | | | | | | | | | | | | | | | | | | | | | | |
| | Exchanges Segment | | Fixed Income and Data Services Segment | | Mortgage Technology Segment | | Total Consolidated |
| Six Months Ended June 30, 2023: | | | | | | | |
| Total revenues | $ | 3,214 | | | $ | 1,109 | | | $ | 485 | | | $ | 4,808 | |
| Transaction-based expenses | 1,024 | | | — | | | — | | | 1,024 | |
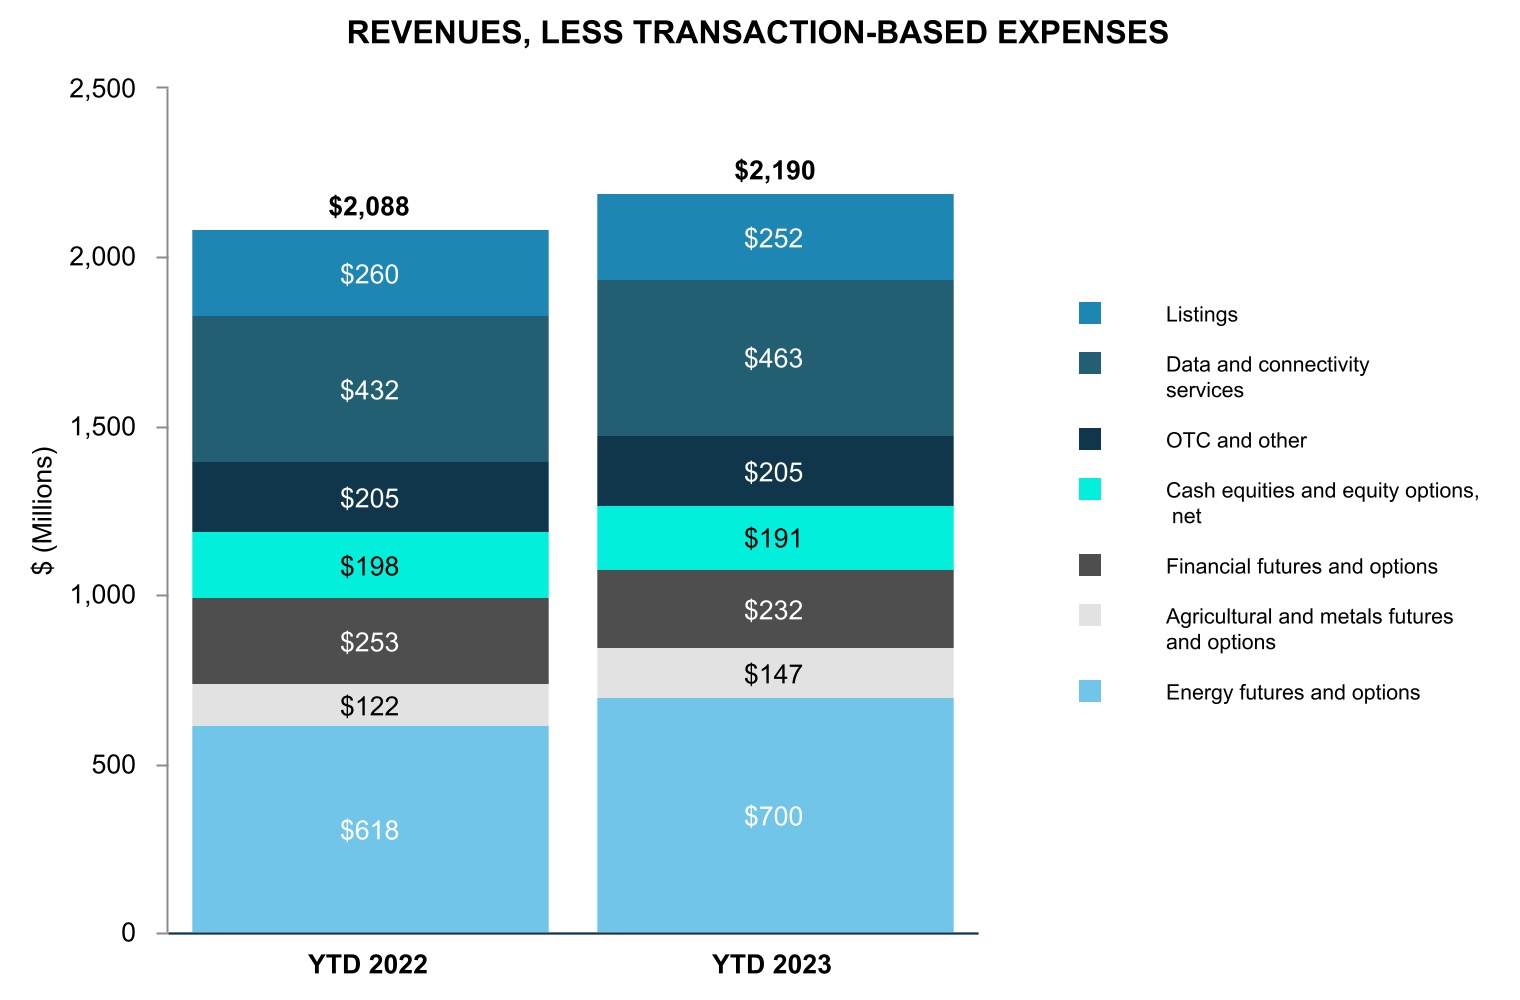
| Total revenues, less transaction-based expenses | $ | 2,190 | | | $ | 1,109 | | | $ | 485 | | | $ | 3,784 | |
| | | | | | | |
| Timing of Revenue Recognition | | | | | | | |
| Services transferred at a point in time | $ | 1,263 | | | $ | 229 | | | $ | 148 | | | $ | 1,640 | |
| Services transferred over time | 927 | | | 880 | | | 337 | | | 2,144 | |
| Total revenues, less transaction-based expenses | $ | 2,190 | | | $ | 1,109 | | | $ | 485 | | | $ | 3,784 | |
| | | | | | | | | | | | | | | | | | | | | | | |
| | Exchanges Segment | | Fixed Income and Data Services Segment | | Mortgage Technology Segment | | Total Consolidated |
| Three Months Ended March 31, 2023: | | | | | | | |
Total revenues (1) | $ | 1,673 | | | $ | 563 | | | $ | 236 | | | $ | 2,472 | |
| Transaction-based expenses | 576 | | | — | | | — | | | 576 | |
| Total revenues, less transaction-based expenses | $ | 1,097 | | | $ | 563 | | | $ | 236 | | | $ | 1,896 | |
| | | | | | | |
| Timing of Revenue Recognition | | | | | | | |
| Services transferred at a point in time | $ | 635 | | | $ | 123 | | | $ | 67 | | | $ | 825 | |
| Services transferred over time | 462 | | | 440 | | | 169 | | | 1,071 | |
| Total revenues, less transaction-based expenses | $ | 1,097 | | | $ | 563 | | | $ | 236 | | | $ | 1,896 | |
| | | | | | | | | | | | | | | | | | | | | | | |
| | Exchanges Segment | | Fixed Income and Data Services Segment | | Mortgage Technology Segment | | Total Consolidated |
| Three Months Ended June 30, 2023: | | | | | | | |
| Total revenues | $ | 1,541 | | | $ | 546 | | | $ | 249 | | | $ | 2,336 | |
| Transaction-based expenses | 448 | | | — | | | — | | | 448 | |
| Total revenues, less transaction-based expenses | $ | 1,093 | | | $ | 546 | | | $ | 249 | | | $ | 1,888 | |
| | | | | | | |
| Timing of Revenue Recognition | | | | | | | |
| Services transferred at a point in time | $ | 628 | | | $ | 106 | | | $ | 81 | | | $ | 815 | |
| Services transferred over time | 465 | | | 440 | | | 168 | | | 1,073 | |
| Total revenues, less transaction-based expenses | $ | 1,093 | | | $ | 546 | | | $ | 249 | | | $ | 1,888 | |
| | | | | | | | | | | | | | | | | | | | | | | |
| | Exchanges Segment | | Fixed Income and Data Services Segment | | Mortgage Technology Segment | | Total Consolidated |
| Six Months Ended June 30, 2022: | | | | | | | |
| Total revenues | $ | 3,247 | | | $ | 1,021 | | | $ | 604 | | | $ | 4,872 | |
| Transaction-based expenses | 1,159 | | | — | | | — | | | 1,159 | |
| Total revenues, less transaction-based expenses | $ | 2,088 | | | $ | 1,021 | | | $ | 604 | | | $ | 3,713 | |
| | | | | | | |
| Timing of Revenue Recognition | | | | | | | |
| Services transferred at a point in time | $ | 1,197 | | | $ | 159 | | | $ | 270 | | | $ | 1,626 | |
| Services transferred over time | 891 | | | 862 | | | 334 | | | 2,087 | |
| Total revenues, less transaction-based expenses | $ | 2,088 | | | $ | 1,021 | | | $ | 604 | | | $ | 3,713 | |
| | | | | | | | | | | | | | | | | | | | | | | |
| | Exchanges Segment | | Fixed Income and Data Services Segment | | Mortgage Technology Segment | | Total Consolidated |
| Three Months Ended June 30, 2022: | | | | | | | |
| Total revenues | $ | 1,604 | | | $ | 512 | | | $ | 297 | | | $ | 2,413 | |
| Transaction-based expenses | 599 | | | $ | — | | | $ | — | | | 599 | |
| Total revenues, less transaction-based expenses | $ | 1,005 | | | $ | 512 | | | $ | 297 | | | $ | 1,814 | |
| | | | | | | |
| Timing of Revenue Recognition | | | | | | | |
| Services transferred at a point in time | $ | 563 | | | $ | 83 | | | $ | 128 | | | $ | 774 | |
| Services transferred over time | 442 | | | 429 | | | 169 | | | 1,040 | |
| Total revenues, less transaction-based expenses | $ | 1,005 | | | $ | 512 | | | $ | 297 | | | $ | 1,814 | |
The Exchanges segment and the Fixed Income and Data Services segment revenues above include data services revenues. Our data services revenues are transferred over time, and a majority of those revenues are performed over a short period of time of one month or less and relate to subscription-based data services billed monthly, quarterly or annually in advance. These revenues are recognized ratably over time as our data delivery performance obligations are met consistently throughout the period.
The Exchanges segment revenues transferred over time in the tabletables above also include services related to listings, services related to risk management of open interest performance obligations and services related to regulatory fees, trading permits, and software licenses.
The Fixed Income and Data Services segment revenues transferred over time in the tabletables above also include services related to risk management of open interest performance obligations, primarily in our CDS business.
The Mortgage Technology segment revenues transferred over time in the tabletables above primarily relate to our origination technology revenue where performance obligations consist of a series of distinct services and are recognized over the
contract terms as subscription performance obligations are satisfied and, to a lesser extent, professional services revenues and revenues from certain of our data and analytics and servicing software offerings.
The components of services transferred over time for each of our segments are as follows:
| | Three Months Ended March 31, | |
| Three Months Ended March 31, | |
| Three Months Ended March 31, | |
| | | Six Months Ended June 30, | | Three Months Ended June 30, |
| | | 2023 | | 2022 | | 2023 | | 2022 |
| Exchanges Segment: | Exchanges Segment: | | | | | |
| Exchanges Segment: | |
| Exchanges Segment: | |
| Data services revenues | |
| Data services revenues | |
| Data services revenues | Data services revenues | $ | 463 | | | $ | 432 | | | $ | 231 | | | $ | 218 | |
| Services transferred over time related to risk management of open interest performance obligations | Services transferred over time related to risk management of open interest performance obligations | 151 | | | 139 | | | $ | 75 | | | $ | 63 | |
| Services transferred over time related to risk management of open interest performance obligations | |
| Services transferred over time related to risk management of open interest performance obligations | |
| Services transferred over time related to listings | |
| Services transferred over time related to listings | |
| Services transferred over time related to listings | Services transferred over time related to listings | 252 | | | 260 | | | $ | 126 | | | $ | 131 | |
| Services transferred over time related to regulatory fees, trading permits, and software licenses | Services transferred over time related to regulatory fees, trading permits, and software licenses | 61 | | | 60 | | | $ | 33 | | | $ | 30 | |
| Services transferred over time related to regulatory fees, trading permits, and software licenses | |
| Services transferred over time related to regulatory fees, trading permits, and software licenses | |
| Total | |
| Total | |
| Total | Total | $ | 927 | | | $ | 891 | | | $ | 465 | | | $ | 442 | |
| | Fixed Income Data Services Segment: | Fixed Income Data Services Segment: | |
| | Fixed Income Data Services Segment: | |
| | Fixed Income Data Services Segment: | |
| Data services revenues | |
| Data services revenues | |
| Data services revenues | Data services revenues | $ | 864 | | | $ | 843 | | | $ | 434 | | | $ | 421 | |
| Services transferred over time related to risk management of open interest performance obligations in our CDS business | Services transferred over time related to risk management of open interest performance obligations in our CDS business | 16 | | | 19 | | | $ | 6 | | | $ | 8 | |
| Services transferred over time related to risk management of open interest performance obligations in our CDS business | |
| Services transferred over time related to risk management of open interest performance obligations in our CDS business | |
| Total | |
| Total | |
| Total | Total | $ | 880 | | | $ | 862 | | | $ | 440 | | | $ | 429 | |
| | Mortgage Technology Segment: | Mortgage Technology Segment: | |
| Subscription revenues | $ | 329 | | | $ | 316 | | | $ | 164 | | | $ | 160 | |
| Professional service revenues and other | 8 | | | 18 | | | $ | 4 | | | $ | 9 | |
| | Mortgage Technology Segment: | |
| | Mortgage Technology Segment: | |
| Recurring revenues | |
| Recurring revenues | |
| Recurring revenues | |
| Other | |
| Other | |
| Other | |
| Total | |
| Total | |
| Total | Total | $ | 337 | | | $ | 334 | | | $ | 168 | | | $ | 169 | |
| | Total consolidated revenues transferred over time | Total consolidated revenues transferred over time | $ | 2,144 | | | $ | 2,087 | | | $ | 1,073 | | | $ | 1,040 | |
| | Total consolidated revenues transferred over time | |
| | Total consolidated revenues transferred over time | |
Transaction Price Allocated to Future Performance Obligations
Our disclosure of transaction price allocated to future performance obligations excludes the following:
•Volume-based fees in excess of contractual minimums and other usage-based fees to the extent they are part of a single performance obligation and meet certain variable consideration allocation criteria;
•Performance obligations that are part of a contract with an original expected duration of one year or less; and
•Transactional fees based on a fixed fee per transaction when we have the right to invoice once we have completed the performance obligation.
As of March 31, 2024, the aggregate amount of the transaction price that is allocated to our future performance obligations was approximately $4.1 billion and was primarily related to contracts with customers in the Mortgage Technology segment. We expect this amount to be recognized as revenue as follows: 26% by December 31, 2024, 75% by December 31, 2026, 95% by December 31, 2028 and the rest thereafter.
Contract Assets
A contract asset represents our expectation of receiving consideration in exchange for products or services that we have provided to our customers, but invoicing is contingent on our completion of other performance obligations or contractual milestones. Substantially all of our contract assets are related to contracts with customers in our Mortgage Technology segment. As of March 31, 2024 and December 31, 2023, the balance of our contract assets was $83 million and $80 million, respectively.
6. Goodwill and Other Intangible Assets
The following is a summary of the activity in our goodwill balance by segment for the sixthree months ended June 30, 2023March 31, 2024 (in millions): | | | | | | | | | | | | | | | | | | | | | | | |
| Exchanges Segment | | Fixed Income and Data Services Segment | | Mortgage Technology Segment | | Total Consolidated |
| | | | | | | |
| | | | | | | |
| | | | | | | |
| | | | | | | |
| | | | | | | |
| Goodwill balance at December 31, 2023 | $ | 8,155 | | | $ | 4,854 | | | $ | 17,544 | | | $ | 30,553 | |
| | | | | | | |
| | | | | | | |
| Foreign currency translation | (8) | | | — | | | — | | | (8) | |
| Other activity, net | — | | | — | | | 4 | | | 4 | |
| Goodwill balance at March 31, 2024 | $ | 8,147 | | | $ | 4,854 | | | $ | 17,548 | | | $ | 30,549 | |
| | | | | |
Goodwill balance at December 31, 2022 | $
| 21,111 | |
| |
Foreign currency translation | 22 | |
Other activity, net | 1 | |
Goodwill balance at June 30, 2023 | $ | 21,134 | |
The following is a summary of the activity in our other intangible assets balance for the sixthree months ended June 30, 2023March 31, 2024 (in millions):
| | | | | |
Other intangible assets balance at December 31, 20222023 | $ | 13,09017,317 | |
| Acquisitions | 5 |
| Foreign currency translation | 20 (7) | |
| Amortization of other intangible assets | (301)(254) | |
| |
Other intangible assets balance at June 30, 2023March 31, 2024 | $ | 12,81417,056 | |
Foreign currency translation adjustments result from a portion of our goodwill and other intangible assets being held at our U.K., EU and Canadian subsidiaries, whose functional currencies are not the U.S. dollar. The changes in other activity, net, in the table above primarily relate to adjustments to the fair value of the net tangible and intangible assets made within one year of acquisitions, with a corresponding adjustment to goodwill.
During the sixthree months ended June 30, 2023,March 31, 2024, we considered potential indicators of impairment to goodwill and other intangible assets for each of our reporting units, which included continued global inflation concerns and risingchanging interest rates, including their effect on our forecasts, among other things. As such, we performed this assessment to determine whether it was more-likely-than-not that goodwill and indefinite lived intangibles within each of our reportable business segmentsreporting units were impaired. Additionally, we evaluated whether the carrying value of the finite lived intangible assets within our reportable business segmentsreporting units may not be recoverable. After evaluating events, circumstances and factors which could affect the significant inputs used in our evaluation of cash flows and related fair value, we determined it was not more-likely-than-not that an impairment existed in our goodwill and indefinite lived intangible assets orassets. With the exception of a $3 million impairment of developed technology within our Exchanges Segment, we determined it was not more-likely-than not that the carrying amount of our finite lived intangible assets was not recoverable. We plan to perform our annual impairment testing in the fourth quarter. The $3 million impairment is included in depreciation and amortization expense within the consolidated statement of income.
7. Deferred Revenue
Our contract liabilities, or deferred revenue, represent consideration received that is yet to be recognized as revenue. Total deferred revenue was $529$700 million as of June 30, 2023,March 31, 2024, including $437$590 million in current deferred revenue and $92$110 million in other non-current liabilities.liabilities in our consolidated balance sheets. The changes in our deferred revenue during the sixthree months ended June 30, 2023March 31, 2024 are as follows (in millions):
| | | | | | | | | | | | | | | | | | | | | | | |
| Listings Revenues | | Data Services and Other Revenues | | Mortgage Technology | | Total |
| Deferred revenue balance at January 1, 2023 | $ | 115 | | | $ | 88 | | | $ | 51 | | | $ | 254 | |
| Additions | 474 | | | 236 | | | 32 | | | 742 | |
| Amortization | (252) | | | (175) | | | (40) | | | (467) | |
| Deferred revenue balance at June 30, 2023 | $ | 337 | | | $ | 149 | | | $ | 43 | | | $ | 529 | |
| | | | | | | | | | | | | | | | | | | | | | | |
| Listings Revenues | | Data Services and Other Revenues | | Mortgage Technology | | Total |
| Deferred revenue balance at January 1, 2024 | $ | 108 | | | $ | 93 | | | $ | 106 | | | $ | 307 | |
| Additions | 460 | | | 161 | | | 32 | | | 653 | |
| Amortization | (122) | | | (99) | | | (39) | | | (260) | |
| Deferred revenue balance at March 31, 2024 | $ | 446 | | | $ | 155 | | | $ | 99 | | | $ | 700 | |
The changes in our deferred revenue during the sixthree months ended June 30, 2022March 31, 2023 are as follows (in millions):
| | Listings Revenues | | Data Services and Other Revenues | | Mortgage Technology | | Total |
| Deferred revenue balance at January 1, 2022 | $ | 112 | | | $ | 93 | | | $ | 79 | | | $ | 284 | |
| Listings Revenues | | | Listings Revenues | | Data Services and Other Revenues | | Mortgage Technology | | Total |
| Deferred revenue balance at January 1, 2023 | |
| Additions | Additions | 500 | | | 283 | | | 46 | | | 829 | |
| Amortization | Amortization | (261) | | | (222) | | | (55) | | | (538) | |
| Deferred revenue balance at June 30, 2022 | $ | 351 | | | $ | 154 | | | $ | 70 | | | $ | 575 | |
| Deferred revenue balance at March 31, 2023 | |
Included in the amortization recognized during the sixthree months ended June 30,March 31, 2024 is $84 million related to the deferred revenue balance as of January 1, 2024. Included in the amortization recognized for the three months ended March 31, 2023 is $103$67 million related to the deferred revenue balance as of January 1, 2023. Included in the amortization recognized for the six months ended June 30, 2022 is $119 million related to the deferred revenue balance as of January 1, 2022. As of June 30, 2023,March 31, 2024, the remaining deferred revenue balance will be recognized over the period of time we satisfy our performance obligations as described in Note 5.
8. Debt
Our total debt, including short-term and long-term debt, consisted of the following (in millions):
| | | | | | | | | | | | |
| As of June 30, 2023 | | As of December 31, 2022 | |
| Debt: | | | | |
| Short-term debt: | | | | |
| | | | |
| | | | |
| | | | |
| Other short-term debt | $ | — | | | $ | 4 | | |
| Total short-term debt | — | | | 4 | | |
| Long-term debt: | | | | |
| | | | |
| | | | |
| | | | |
| | | | |
| 2025 Senior Notes (3.65% senior unsecured notes due May 23, 2025) | 1,245 | | | 1,243 | | |
| 2025 Senior Notes (3.75% senior unsecured notes due December 1, 2025) | 1,248 | | | 1,247 | | |
| 2027 Senior Notes (4.00% senior unsecured notes due September 15, 2027) | 1,488 | | | 1,487 | | |
| 2027 Senior Notes (3.10% senior unsecured notes due September 15, 2027) | 498 | | | 498 | | |
| 2028 Senior Notes (3.75% senior unsecured notes due September 21, 2028) | 595 | | | 594 | | |
| 2029 Senior Notes (4.35% senior unsecured notes due June 15, 2029) | 1,240 | | | 1,240 | | |
| 2030 Senior Notes (2.10% senior unsecured notes due June 15, 2030) | 1,237 | | | 1,235 | | |
| 2032 Senior Notes (1.85% senior unsecured notes due September 15, 2032) | 1,485 | | | 1,485 | | |
| 2033 Senior Notes (4.60% senior unsecured notes due March 15, 2033) | 1,488 | | | 1,488 | | |
| 2040 Senior Notes (2.65% senior unsecured notes due September 15, 2040) | 1,232 | | | 1,231 | | |
| 2048 Senior Notes (4.25% senior unsecured notes due September 21, 2048) | 1,232 | | | 1,231 | | |
| 2050 Senior Notes (3.00% senior unsecured notes due June 15, 2050) | 1,221 | | | 1,221 | | |
| 2052 Senior Notes (4.95% senior unsecured notes due June 15, 2052) | 1,465 | | | 1,464 | | |
| 2060 Senior Notes (3.00% senior unsecured notes due September 15, 2060) | 1,471 | | | 1,471 | | |
| 2062 Senior Notes (5.20% senior unsecured notes due June 15, 2062) | 983 | | | 983 | | |
| Total long-term debt | 18,128 | | | 18,118 | | |
| Total debt | $ | 18,128 | | | $ | 18,122 | | |
| | | | |
| | | | |
| | | | |
| | | | | | | | | | | | |
| As of March 31, 2024 | | As of December 31, 2023 | |
| Short-term debt: | | | | |
| Commercial Paper | $ | 1,916 | | | $ | 1,954 | | |
| | | | |
| | | | |
| | | | |
| Total short-term debt | 1,916 | | | 1,954 | | |
| Long-term debt: | | | | |
| | | | |
| | | | |
| | | | |
| | | | |
| 2025 Term Loan due August 31, 2025 | 1,000 | | | 1,600 | | |
| 2025 Senior Notes (3.65%; unsecured due May 23, 2025) | 1,247 | | | 1,246 | | |
| 2025 Senior Notes (3.75%; unsecured due December 1, 2025) | 1,248 | | | 1,248 | | |
| 2027 Senior Notes (4.00%; unsecured due September 15, 2027) | 1,490 | | | 1,489 | | |
| 2027 Senior Notes (3.10%; unsecured due September 15, 2027) | 498 | | | 498 | | |
| 2028 Senior Notes (3.625%; unsecured due September 1, 2028) | 925 | | | 920 | | |
| 2028 Senior Notes (3.75%; unsecured due September 21, 2028) | 596 | | | 596 | | |
| 2029 Senior Notes (4.35%; unsecured due June 15, 2029) | 1,242 | | | 1,241 | | |
| 2030 Senior Notes (2.10%; unsecured due June 15, 2030) | 1,238 | | | 1,238 | | |
| 2032 Senior Notes (1.85%; unsecured due September 15, 2032) | 1,487 | | | 1,486 | | |
| 2033 Senior Notes (4.60%; unsecured due March 15, 2033) | 1,489 | | | 1,489 | | |
| 2040 Senior Notes (2.65%; unsecured due September 15, 2040) | 1,232 | | | 1,232 | | |
| 2048 Senior Notes (4.25%; unsecured due September 21, 2048) | 1,232 | | | 1,232 | | |
| 2050 Senior Notes (3.00%; unsecured due June 15, 2050) | 1,222 | | | 1,222 | | |
| 2052 Senior Notes (4.95%; unsecured due June 15, 2052) | 1,466 | | | 1,466 | | |
| 2060 Senior Notes (3.00%; unsecured due September 15, 2060) | 1,472 | | | 1,472 | | |
| 2062 Senior Notes (5.20%; unsecured due June 15, 2062) | 984 | | | 984 | | |
| Total long-term debt | 20,068 | | | 20,659 | | |
| Total debt | $ | 21,984 | | | $ | 22,613 | | |
| | | | |
| | | | |
| | | | |
OurAs of March 31, 2024, our senior notes of $18.1$19.1 billion havehad a weighted average maturity of 1615 years and a weighted average cost of 3.6% per annum.
Credit Facilities
We have a $3.9 billion senior unsecured revolving credit facility, or the Credit Facility, with a maturity date of May 25, 2027, with future capacity to increase our borrowings under the Credit Facility by an additional $1.0 billion, subject to the consent of the lenders funding the increase and certain other conditions. No amounts were outstanding under the Credit Facility as of June 30, 2023.March 31, 2024.
As of June 30, 2023,March 31, 2024, of the $3.9 billion that was available for borrowing under the Credit Facility, $171 million$1.9 billion was required to support certain broker-dealer and other subsidiary commitments. We did not have any amountsback-stop the notes outstanding under our U.S. dollar commercial paper program, or the Commercial Paper Program, as of June 30, 2023. Therefore, thereand $172 million was not an amount required to backstop the Commercial Paper Program. The amount required to backstop the amountssupport certain broker-dealer and other subsidiary commitments. Amounts
required to backstop notes outstanding under the Commercial Paper Program will fluctuate as we increase or decrease our commercial paper borrowings. The remaining $3.7$1.8 billion was available for working capital and general corporate purposes including, but not limited to, acting as a backstop to future amounts outstanding under the Commercial Paper Program.
We have a $2.4 billion two-year senior unsecured delayed draw term loan facility, or the Term Loan, with a maturity date of May 25, 2024.August 31, 2025. Draws under the Term Loan bear interest on the principal amount outstanding at either (a) Term Secured Overnight Financing Rate, or Term SOFR, plus an applicable margin plus a credit spread adjustment of 108.75 basis points or (b) a "base rate" plus an applicable margin. The applicable margin ranges from 0.625% to 1.125% for Term SOFR loans and from 0.000% to 0.125% for base rate loans, in each case, based on a ratings-based pricing grid. We expect to use the proceeds from borrowings under the Term Loan to fund a portion of the purchase price for the Black Knight acquisition. We have the option to prepay outstanding amounts under the Term Loan in whole or in part at any time. No amounts wereAs of March 31, 2024, we had $1.0 billion outstanding under the Term Loan as of June 30, 2023.Loan.
Our India subsidiaries maintain $14 million of credit lines for their general corporate purposes. As of June 30, 2023,March 31, 2024, there were no amounts outstanding under these credit lines.
Commercial Paper Program
Our Commercial Paper Program is currently backed by the borrowing capacity available under the Credit Facility, as described above. The effective interest rate of commercial paper issuances does not materially differ from short-term interest rates, which fluctuate due to market conditions and as a result may impact our interest expense. We did not have any notes outstandingDuring the three months ended March 31, 2024, we had net repayments of $38 million under ourthe Commercial Paper Program funded primarily by cash flows from operations.
Commercial paper notes of $1.9 billion with original maturities ranging from 4 to 45 days were outstanding as of June 30, 2023.
March 31, 2024, with a weighted average interest rate of 5.6% per annum, and a weighted average remaining maturity of 28 days.
9. Share-Based Compensation
We currently sponsorhave employee and non-employee director incentive plans from which we grant stock option plans,options, restricted shares, and restricted stock plans and ourunits with various service, performance, and/or market conditions. We also have an Employee Stock Purchase Plan available to our employees and directors.employees. Stock options and restricted stock are granted at the discretion of the Compensation Committee of our Board of Directors, or Board, based on the estimated fair value on the date of grant. The fair value of the stock options and restricted stock on the date of grant is recognized as expense over the vesting period, net of forfeitures. The non-cash compensation expenses recognized in our consolidated statements of income for stock options, restricted stock and under our employee stock purchase plan, net of amounts classified as capitalized software, were $85$57 million and $76$40 million for the six months ended June 30, 2023 and 2022, respectively, and $45 million and $38 million during the three months ended June 30,March 31, 2024 and 2023, respectively. For the three months ended March 31, 2024, $6 million of the total non-cash compensation expense was recorded within acquisition-related transaction and 2022, respectively.integration costs in the consolidated statement of income.
Stock Option Plans
We use the Black-Scholes option pricing model to value our stock option awards. During the sixthree months ended June 30,March 31, 2024 and 2023, and 2022, we used the assumptions in the table below to compute the value:
| | Six Months Ended June 30, |
| Three Months Ended March 31, | | | Three Months Ended March 31, |
| Assumptions: | Assumptions: | 2023 | | 2022 | Assumptions: | 2024 | | 2023 |
| Risk-free interest rate | Risk-free interest rate | 3.47% | | 1.72% | Risk-free interest rate | 4.14% | | 3.47% |
| Expected life in years | Expected life in years | 6.1 | | 6.0 | Expected life in years | 6.0 | | 6.1 |
| Expected volatility | Expected volatility | 24% | | 23% | Expected volatility | 24% | | 24% |
| Expected dividend yield | Expected dividend yield | 1.56% | | 1.17% | Expected dividend yield | 1.33% | | 1.56% |
| Estimated weighted-average fair value of options granted per share | Estimated weighted-average fair value of options granted per share | $27.39 | | $28.18 | Estimated weighted-average fair value of options granted per share | $37.56 | | $27.39 |
The risk-free interest rate is based on the zero-coupon U.S. Treasury yield curve in effect at the date of grant. The expected life is derived from historical and anticipated future exercise patterns. Expected volatility is based on historical volatility data of our stock.
Restricted Stock Plans
Restricted shares are used as an incentive to attract and retain qualified employees and to align our and our stockholders' interests by linking actual performance to both short and long-term stockholder return. We issue awards that may contain a combination of time, performance and/or market conditions. The grant date fair value of each award is based on the
closing stock price of our stock at the date of grant. The grant date fair value of time-based restricted stock is recognized as expense ratably over the vesting period, which is typically three or four years, net of forfeitures.
In February 2023,2024, we reserved a maximum of 0.9 million restricted shares for potential issuance as performance-based restricted shares to certain of our employees. The number of shares ultimately granted under this award will be based on our actual financial performance as compared to financial performance targets set by our Board and the Compensation Committee for the year ending December 31, 2023, and will also be subject to a market condition reduction based on how
our 2023 total stockholder return, or TSR, compares to that of the S&P 500 Index.2024. The maximum compensation expense to be recognized under these performance-based restricted shares is $92$112 million if the maximum financial performance target is met and all 0.9 million shares vest. The compensation expense to be recognized under these performance-based restricted shares will be $46$56 million if the target financial performance is met, which would result in 0.4 million shares vesting. For these awards with performance conditions, we recognize expense on an accelerated basis over the three-year vesting period based on our quarterly assessment of the probable 20232024 actual financial performance as compared to the 20232024 financial performance targets. As of June 30, 2023,March 31, 2024, our best estimate is that the financial performance level will be aboveat target for 2023.2024. Based on this assessment, we recorded non-cash compensation expense of $14 million and $10$4 million for the six months and three months ended June 30, 2023, respectively,March 31, 2024, related to these awards and the remaining $46$52 million in non-cash compensation expense will be recorded on an accelerated basis over the remaining vesting period, including $19$30 million which will be recorded over the remainder of 2023.2024.
We also issue awards with a market condition but no performance condition. The fair value of these awards is estimated based on a simulation of various outcomes and includes inputs such as our stock price on the grant date, the valuation of historical awards with market conditions, the relatively low likelihood that the market condition will affect the number of shares granted (as the market condition only affects shares granted in excess of certain financial performance targets), and our expectation of achieving the financial performance targets.
10. Equity
Stock Repurchase Program
In December 2021, our Board approved an aggregate of $3.15 billion for future repurchases of our common stock with no fixed expiration date that became effective on January 1, 2022. The approval of our Board for the sharestock repurchases does not obligate us to acquire any particular amount of our common stock. In addition, our Board may increase or decrease the amount available for repurchases from time to time. We fund repurchases from our operating cash flow or borrowings under our debt facilities or our Commercial Paper Program. Repurchases may be made from time to time on the open market, through established trading plans, in privately-negotiated transactions or otherwise, in accordance with all applicable securities laws, rules and regulations. We may begin or discontinue stock repurchases at any time and may amend or terminate a Rule 10b5-1 trading plan at any time or enter into additional plans, subject to applicable rules.
We did not have any share repurchases during the six months or three months ended June 30, 2023. During the six months and three months ended June 30, 2022, we repurchased a total of 5.0 million and 1.3 million shares, respectively, of our outstanding common stock at a cost of $632 million and $157 million, respectively. Our repurchases during the six months ended June 30, 2022 consisted of 4.6 million shares at a cost of $582 million under our Rule 10b5-1 trading plan and 0.4 million shares at a cost of $50 million on the open market during an open trading period. All shares repurchased during the three months ended June 30, 2022 were done under our Rule 10b5-1 trading plan. As of June 30, 2023, the remaining balance of Board approved funds for future repurchases was $2.5 billion. In connection with our pending acquisition of Black Knight, on May 4, 2022 we terminated our Rule 10b5-1 trading plan and suspended share repurchases. Therefore, we did not have any share repurchases during the three months ended March 31, 2024 or 2023. As of March 31, 2024, the remaining balance of Board approved funds for future repurchases was $2.5 billion.
Dividends
During the sixthree months ended June 30,March 31, 2024 and 2023, and 2022, we declared and paid cash dividends per share of $0.84$0.45 and $0.76,$0.42, respectively, for an aggregate payout of $472$258 million and $427$236 million, respectively. During the three months ended June 30, 2023 and 2022, we declared dividends per share of $0.42 and $0.38, respectively for an aggregate payout of $236 million and $213 million, respectively. The declaration of dividends is subject to the discretion of our Board. Our Board has adopted a quarterly dividend declaration policy providing that the declaration of any dividends will be determinedapproved quarterly by the Board or the Audit Committee, taking into account such factors as our evolving business model, prevailing business conditions, our current and future planned strategic growth initiatives, our financial results and capital requirements and other considerations which our Board deems relevant, without a predetermined annual net income payout ratio.
Accumulated Other Comprehensive Income/(Loss)
The following tables present changes in the accumulated balances for each component of other comprehensive income/ (loss) (in millions):
| | | | | | | | | | | | | | | | | | | | | | | | | | |
| | Changes in Accumulated Other Comprehensive Income/(Loss) by Component |
| | Foreign currency translation adjustments | | Comprehensive income from equity method investment | | Employee benefit plans adjustments | | Total |
|
| | | | | | | | |
| | | | | | | | |
| | | | | | | | |
| | | | | | | | |
| | | | | | | | |
| | | | | | | | |
| | | | | | | | |
| | | | | | | | |
| | | | | | | | |
| | | | | | | | |
| | | | | | | | |
| | | | | | | | |
| | | | | | | | |
| | | | | | | | |
| Balance, as of December 31, 2022 | | $ | (278) | | | $ | 2 | | | $ | (55) | | | $ | (331) | |
| Other comprehensive income | | 47 | | | — | | | — | | | 47 | |
| Income tax benefit/(expense) | | — | | | — | | | — | | | — | |
| Net current period other comprehensive income | | 47 | | | — | | | — | | | 47 | |
| Balance, as of June 30, 2023 | | $ | (231) | | | $ | 2 | | | $ | (55) | | | $ | (284) | |
| | | | | | | | | | | | | | | | | | | | | | | | | | |
| | Changes in Accumulated Other Comprehensive Income/(Loss) by Component |
| | Foreign currency translation adjustments | | Comprehensive income from equity method investment | | Employee benefit plans adjustments | | Total |
|
| | | | | | | | |
| | | | | | | | |
| | | | | | | | |
| | | | | | | | |
| | | | | | | | |
| | | | | | | | |
| | | | | | | | |
| | | | | | | | |
| | | | | | | | |
| | | | | | | | |
| | | | | | | | |
| | | | | | | | |
| | | | | | | | |
| | | | | | | | |
| Balance, as of December 31, 2023 | | $ | (230) | | | $ | 2 | | | $ | (66) | | | $ | (294) | |
| Other comprehensive income/(loss) | | (18) | | | 10 | | | — | | | (8) | |
| Income tax expense | | — | | | (3) | | | — | | | (3) | |
| Net current period other comprehensive income/(loss) | | (18) | | | 7 | | | — | | | (11) | |
| Balance, as of March 31, 2024 | | $ | (248) | | | $ | 9 | | | $ | (66) | | | $ | (305) | |
| | | | | | | | | | | | | | | | | | | | | | | | | | |
| | Changes in Accumulated Other Comprehensive Income/(Loss) by Component |
| | Foreign currency translation adjustments | | Comprehensive income from equity method investment | | Employee benefit plans adjustments | | Total |
|
| | | | | | | | |
| | | | | | | | |
| | | | | | | | |
| | | | | | | | |
| | | | | | | | |
| | | | | | | | |
| | | | | | | | |
| | | | | | | | |
| | | | | | | | |
| | | | | | | | |
| | | | | | | | |
| | | | | | | | |
| | | | | | | | |
| | | | | | | | |
| Balance, as of March 31, 2023 | | $ | (262) | | | $ | 2 | | | $ | (55) | | | $ | (315) | |
| Other comprehensive income | | 31 | | | — | | | — | | | 31 | |
| Income tax benefit/(expense) | | — | | | — | | | — | | | — | |
| Net current period other comprehensive income | | 31 | | | — | | | — | | | 31 | |
| Balance, as of June 30, 2023 | | $ | (231) | | | $ | 2 | | | $ | (55) | | | $ | (284) | |
| | | | | | | | | | | | | | | | | | | | | | | | | | |
| | Changes in Accumulated Other Comprehensive Income/(Loss) by Component |
| | Foreign currency translation adjustments | | Comprehensive income from equity method investment | | Employee benefit plans adjustments | | Total |
|
| | | | | | | | |
| | | | | | | | |
| | | | | | | | |
| | | | | | | | |
| | | | | | | | |
| | | | | | | | |
| | | | | | | | |
| | | | | | | | |
| | | | | | | | |
| | | | | | | | |
| | | | | | | | |
| | | | | | | | |
| | | | | | | | |
| | | | | | | | |
| Balance, as of December 31, 2021 | | $ | (150) | | | $ | 2 | | | $ | (48) | | | $ | (196) | |
| Other comprehensive loss | | (110) | | | — | | | — | | | (110) | |
| Income tax benefit/(expense) | | 1 | | | — | | | — | | | 1 | |
| Net current period other comprehensive loss | | (109) | | | — | | | — | | | (109) | |
| Balance, as of June 30, 2022 | | $ | (259) | | | $ | 2 | | | $ | (48) | | | $ | (305) | |
| | | | | | | | | | | | | | | | | | | | | | | | | | |
| | Changes in Accumulated Other Comprehensive Income/(Loss) by Component |
| | Foreign currency translation adjustments | | Comprehensive income from equity method investment | | Employee benefit plans adjustments | | Total |
|
| | | | | | | | |
| | | | | | | | |
| | | | | | | | |
| | | | | | | | |
| | | | | | | | |
| | | | | | | | |
| | | | | | | | |
| | | | | | | | |
| | | | | | | | |
| | | | | | | | |
| | | | | | | | |
| | | | | | | | |
| | | | | | | | |
| | | | | | | | |
| Balance, as of March 31, 2022 | | $ | (175) | | | $ | 2 | | | $ | (48) | | | $ | (221) | |
| Other comprehensive loss | | (85) | | | — | | | — | | | (85) | |
| Income tax benefit/(expense) | | 1 | | | — | | | — | | | 1 | |
| Net current period other comprehensive loss | | (84) | | | — | | | — | | | (84) | |
| Balance, as of June 30, 2022 | | $ | (259) | | | $ | 2 | | | $ | (48) | | | $ | (305) | |
| | | | | | | | | | | | | | | | | | | | | | | | | | |
| | Changes in Accumulated Other Comprehensive Income/(Loss) by Component |
| | Foreign currency translation adjustments | | Comprehensive income from equity method investment | | Employee benefit plans adjustments | | Total |
|
| | | | | | | | |
| | | | | | | | |
| | | | | | | | |
| | | | | | | | |
| | | | | | | | |
| | | | | | | | |
| | | | | | | | |
| | | | | | | | |
| | | | | | | | |
| | | | | | | | |
| | | | | | | | |
| | | | | | | | |
| | | | | | | | |
| | | | | | | | |
| Balance, as of December 31, 2022 | | $ | (278) | | | $ | 2 | | | $ | (55) | | | $ | (331) | |
| Other comprehensive income | | 16 | | | — | | | — | | | 16 | |
| Income tax benefit/(expense) | | — | | | — | | | — | | | — | |
| Net current period other comprehensive income | | 16 | | | — | | | — | | | 16 | |
| Balance, as of March 31, 2023 | | $ | (262) | | | $ | 2 | | | $ | (55) | | | $ | (315) | |
11. Income Taxes
Our effective tax rate was 12%19% and 22% during the six months ended June 30, 2023 and 2022, respectively, and 4% and 23%21% during the three months ended June 30,March 31, 2024 and 2023, and 2022, respectively. The effective tax ratesrate for the six months and three months ended June 30, 2023 wereMarch 31, 2024 was lower than the effective tax ratesrate for the comparable periodsperiod in 20222023 primarily due to the tax benefits resulting from favorable audit settlements for prior years, deferred and currentincome tax benefits from state apportionment changes and the application of the high-tax exception to the Global Intangible Low-Taxed Income, or GILTI, in the current period, partially offset by the impact of the U.K. corporate income tax increase from 19% to 25% effective April 1, 2023.
In conjunction with the increase in the U.K. corporate income tax rate we intendincrease to elect25% effective for the GILTI high-tax exception electionfull year in 2023. During2024, the net effect of which was greater than the impact of favorable audit settlements for certain historical periods during the three months ended March 31, 2023.
The Organisation for Economic Cooperation and Development, or OECD, Global Anti-Base Erosion Pillar Two minimum tax rules, or Pillar Two, which generally provide for a minimum effective tax rate of 15%, are intended to apply to tax years beginning in 2024. The EU member states and many other countries, including the U.K., our most significant non-U.S. jurisdiction, have committed to implement or have already enacted legislation adopting the Pillar Two rules. In July 2023, the U.K. enacted the U.K. Finance Act 2023, effective as of January 1, 2024, which includes provisions to implement certain portions of the Pillar Two minimum tax rules and includes an election to apply a transitional safe harbor to extend certain effective dates to accounting periods ending on or before June 30, 2023, our tax provision includes the impacts of this election, which resulted in a reduction in our GILTI inclusions. Our unrecognized tax benefit as of June 30, 2023 was $240 million, a $7 million net decrease from the $247 million as of December 31, 2022. The net decrease includes a $40 million
reduction as a result of audit settlements, a $20 million increase related to current year positions, a $31 million increase related to prior year positions, and an $18 million reduction related to prior year positions.
In August 2022, the Inflation Reduction Act of 2022, or IRA, was signed into law.The IRA introduced a 15% corporation minimum tax, or CAMT, on adjusted financial statement income for corporations with profits in excess of $1 billion, effective for tax years after December 31, 2022.Based on the current guidance provided by the Internal Revenue Service and Treasury, the implementation of the CAMT does2028. These new U.K. Pillar Two rules did not have a material impact toon our financial statementsincome tax provision as of June 30, 2023.
The IRA also includes a share buyback excise tax of 1% on share repurchases, which will apply to net share repurchases after DecemberMarch 31, 2022.During the six months ended June 30, 2023, we did not repurchase any shares, therefore, we were not subject to any excise tax.The newly imposed excise tax on share repurchases is not considered an income tax.Any excise tax, as a result of future share repurchases, will be considered part of the cost of the shares repurchased and reflected in the equity section of our consolidated financial statements.2024.
12. Clearing Operations
We operate six clearing houses, each of which acts as a central counterparty that becomes the buyer to every seller and the seller to every buyer for its clearing members or participants, or Members. Through this central counterparty function, the clearing houses provide financial security for each transaction for the duration of the position by limiting counterparty credit risk.
Our clearing houses are responsible for providing clearing services to each of our futures exchanges, and in some cases to third-party execution venues, and are as follows, referred to herein collectively as "the ICE Clearing Houses":
| | | | | | | | | | | | | | | | | | | | |
| Clearing House | | Products Cleared | | Exchange where Executed | | Location |
| ICE Clear Europe | | Energy, agricultural, interest rates and equity index futures and options contracts and OTC European CDS instruments | | ICE Futures Europe, ICE Futures U.S., ICE Endex, ICE Futures Abu Dhabi and third-party venues | | U.K. |
| ICE Clear U.S. | | Agricultural, metals, foreign exchange, or FX, interest rate and equity index and digital asset futures and/or options contracts | | ICE Futures U.S. | | U.S. |
| ICE Clear Credit | | OTC North American, European, Asian-Pacific and Emerging Market CDS instruments | | Creditex and third-party venues | | U.S. |
| ICE Clear Netherlands | | Derivatives on equities and equity indices traded on regulated markets | | ICE Endex | | The Netherlands |
| ICE Clear Singapore | | Energy, metals and financial futures products and digital asset futures contracts | | ICE Futures Singapore | | Singapore |
| ICE NGX | | Physical North American natural gas, electricity and electricityenvironmental commodities | | ICE NGX | | Canada |
In 2022, we announced our decision to cease our CDS clearing service at ICE Clear Europe, our clearing house in the U.K., and thereafter our sole CDS clearing offering will be at our ICE Clear Credit clearing house in the U.S. This is expected to be completed in late 2023.
Original and Variation Margin
Each of the ICE Clearing Houses generally requires all Members to deposit collateral in cash or certain pledged assets. The collateral deposits are known as “original margin.” In addition, the ICE Clearing Houses may make intraday original margin calls in circumstances where market conditions require additional protection. The daily profits and losses to and from the ICE Clearing Houses due to the marking-to-market of open contracts is known as “variation margin.” The ICE Clearing Houses mark all outstanding contracts to market, and, with the exception of ICE NGX’s physical natural gas, physical environmental and physical power products discussed separately below, pay and collect variation margin at least once daily.
The amounts that Members are required to maintain are determined by proprietary risk models established by each ICE Clearing House and reviewed by the relevant regulators, independent model validators, risk committees and the boards of directors of the respective ICE Clearing House. The amounts required may fluctuate over time. Each of the ICE Clearing Houses is a separate legal entity and is not subject to the liabilities of the others, or the obligations of Members of the other ICE Clearing Houses.
Should a particular Member fail to deposit its original margin or fail to make a variation margin payment, when and as required, the relevant ICE Clearing House may liquidate or hedge the defaulting Member's open positions and use their original margin and guaranty fund deposits to pay any amount owed. In the event that the defaulting Member's deposits are not sufficient to pay the amount owed in full, the ICE Clearing Houses will first use their respective contributions to the
guaranty fund, often referred to as Skin In The Game, or SITG, to pay any remaining amount owed. In the event that the SITG is not sufficient, the ICE Clearing Houses may utilize the respective guaranty fund deposits and default insurance or collect limited additional funds from their respective non-defaulting Members on a pro-rata basis, to pay any remaining amount owed.
As of June 30, 2023March 31, 2024 and December 31, 2022,2023, the ICE Clearing Houses had received or had been pledged $194.0$174.1 billion and $273.3$175.9 billion, respectively, in cash and non-cash collateral in original margin and guaranty fund deposits to cover price movements of underlying contracts for both periods.
Guaranty Funds and ICE Contribution
As described above, mechanisms have been created, called guaranty funds, to provide partial protection in the event of a Member default. With the exception of ICE NGX, each of the ICE Clearing Houses requires that each Member make deposits into a guaranty fund.
In addition, we have contributed our own capital that could be used if a defaulting Member’s original margin and guaranty fund deposits are insufficient. Included in the total contribution to ICE Clear U.S., as of June 30, 2023, is $15 million from Bakkt, solely applicable to any losses associated with a default in Bitcoin contracts and other digital assets that ICE Clear U.S. may clear in the future. Such amounts are recorded as long-term restricted cash and cash equivalents orand long-term restricted investments in our balance sheets and are as follows (in millions):
| | | | | | | | | | | | | | | | | | | | | | | | | | | |
| | | ICE Portion of Guaranty Fund Contribution | | Default insurance |
| Clearing House | | | As of June 30, 2023 | | As of
December 31, 2022 | | As of June 30, 2023 | | As of
December 31, 2022 |
| ICE Clear Europe | | | $247 | | $247 | | $100 | | $100 |
| ICE Clear U.S. | | | 90 | | | 90 | | | 25 | | | 25 | |
| ICE Clear Credit | | | 50 | | | 50 | | | 75 | | | 75 | |
| ICE Clear Netherlands | | | 2 | | | 2 | | | N/A | | N/A |
| ICE Clear Singapore | | | 1 | | | 1 | | | N/A | | N/A |
| ICE NGX | | | 15 | | | 15 | | | 200 | | | 200 | |
| Total | | | $405 | | $405 | | $400 | | $400 |
| | | | | | | | | | | | | | | | | | | | | | | | | | | |
| | | ICE Portion of Guaranty Fund Contribution | | Default insurance |
| Clearing House | | | As of March 31, 2024 | | As of
December 31, 2023 | | As of March 31, 2024 | | As of
December 31, 2023 |
| ICE Clear Europe | | | $197 | | $197 | | $100 | | $100 |
| ICE Clear U.S. | | | 75 | | | 75 | | | 25 | | | 25 | |
| ICE Clear Credit | | | 50 | | | 50 | | | 75 | | | 75 | |
| ICE Clear Netherlands | | | 2 | | | 2 | | | N/A | | N/A |
| ICE Clear Singapore | | | 1 | | | 1 | | | N/A | | N/A |
| ICE NGX | | | 15 | | | 15 | | | 200 | | | 200 | |
| Total | | | $340 | | $340 | | $400 | | $400 |
We also maintain default insurance at ICE Clear Europe, ICE Clear U.S. and ICE Clear Credit as an additional layer of clearing member default protection.protection, which is reflected in the table above. The default insurance was renewed in September 2022 and has a three-year term for the following clearing houses in the following amounts: ICE Clear Europe - $100 million; ICE Clear U.S. - $25 million; and ICE Clear Credit - $75 million.term. The default insurance layer resides after and in addition to the ICE Clear Europe, ICE Clear U.S. and ICE Clear Credit SITG contributions and before the guaranty fund contributions of the non-defaulting Members.
Similar to SITG, the default insurance layer is not intended to replace or reduce the position risk-based amount of the guaranty fund. As a result, the default insurance layer is not a factor that is included in the calculation of the Members' guaranty fund contribution requirement. Instead, it serves as an additional, distinct, and separate default resource that should serve to further protect the non-defaulting Members’ guaranty fund contributions from being mutualized in the event of a default.
As of June 30, 2023,March 31, 2024, ICE NGX maintained a guaranty fund of $215 million, comprised of $15 million in cash and a $200 million letter of credit backed by a default insurance policy of the same amount, discussed below.
Below is a depiction of our Default Waterfall which summarizes the lines of defense and layers of protection we maintain for our mutualized clearing houses.
ICE Clearing House Default Waterfall
ICE Clearing House Default Waterfall
Cash and Invested Margin Deposits
We have recorded cash and invested margin and guaranty fund deposits and amounts due in our balance sheets as current assets with corresponding current liabilities to the Members. As of June 30,March 31, 2024, our cash and invested margin deposits were as follows (in millions):
| | | | | | | | | | | | | | | | | | | | | | | | | | | | | | | | | | | |
| ICE Clear Europe | | ICE Clear
Credit | | ICE Clear U.S. | | ICE NGX | | Other ICE Clearing Houses | | Total |
| Original margin | $ | 38,628 | | | $ | 24,125 | | | $ | 5,620 | | | $ | — | | | $ | 4 | | | $ | 68,377 | |
| Unsettled variation margin, net | — | | | — | | | — | | | 1,108 | | | — | | | 1,108 | |
| Guaranty fund | 2,493 | | | 3,193 | | | 591 | | | — | | | 5 | | | 6,282 | |
| Delivery contracts receivable/payable, net | — | | | — | | | — | | | 412 | | | — | | | 412 | |
| Total | $ | 41,121 | | | $ | 27,318 | | | $ | 6,211 | | | $ | 1,520 | | | $ | 9 | | | $ | 76,179 | |
As of December 31, 2023, our cash and invested margin deposits were as follows (in millions):
| | | | | | | | | | | | | | | | | | | | | | | | | | | | | | | | | | | |
| ICE Clear Europe (1) | | ICE Clear
Credit | | ICE Clear U.S. | | ICE NGX | | Other ICE Clearing Houses | | Total |
| Original margin | $ | 45,464 | | | $ | 29,056 | | | $ | 4,968 | | | $ | — | | | $ | 5 | | | $ | 79,493 | |
| Unsettled variation margin, net | — | | | — | | | — | | | 693 | | | — | | | 693 | |
| Guaranty fund | 3,886 | | | 3,197 | | | 646 | | | — | | | 4 | | | 7,733 | |
| Delivery contracts receivable/payable, net | — | | | — | | | — | | | 410 | | | — | | | 410 | |
| Total | $ | 49,350 | | | $ | 32,253 | | | $ | 5,614 | | | $ | 1,103 | | | $ | 9 | | | $ | 88,329 | |
As of December 31, 2022, our cash and invested margin deposits were as follows (in millions):
| | | | | | | | | | | | | | | | | | | | | | | | | | | | | | | | | | | |
| ICE Clear Europe (2) | | ICE Clear
Credit | | ICE Clear U.S. | | ICE NGX | | Other ICE Clearing Houses | | Total |
| Original margin | $ | 101,243 | | | $ | 31,277 | | | $ | 4,141 | | | $ | — | | | $ | 5 | | | $ | 136,666 | |
| Unsettled variation margin, net | — | | | — | | | — | | | 749 | | | — | | | 749 | |
| Guaranty fund | 4,162 | | | 3,177 | | | 597 | | | — | | | 4 | | | 7,940 | |
| Delivery contracts receivable/payable, net | — | | | — | | | — | | | 2,017 | | | — | | | 2,017 | |
| Total | $ | 105,405 | | | $ | 34,454 | | | $ | 4,738 | | | $ | 2,766 | | | $ | 9 | | | $ | 147,372 | |
(1) $44.7 billion and $4.6 billion is related to futures/options and CDS, respectively.
(2) $97.6 billion and $7.8 billion is related to futures/options and CDS, respectively. | | | | | | | | | | | | | | | | | | | | | | | | | | | | | | | | | | | |
| ICE Clear Europe | | ICE Clear
Credit | | ICE Clear U.S. | | ICE NGX | | Other ICE Clearing Houses | | Total |
| Original margin | $ | 40,170 | | | $ | 28,353 | | | $ | 4,693 | | | $ | — | | | $ | 5 | | | $ | 73,221 | |
| Unsettled variation margin, net | — | | | — | | | — | | | 984 | | | — | | | 984 | |
| Guaranty fund | 2,358 | | | 3,017 | | | 609 | | | — | | | 5 | | | 5,989 | |
| Delivery contracts receivable/payable, net | — | | | — | | | — | | | 600 | | | — | | | 600 | |
| Total | $ | 42,528 | | | $ | 31,370 | | | $ | 5,302 | | | $ | 1,584 | | | $ | 10 | | | $ | 80,794 | |
Our cash and invested margin and guaranty fund deposits are maintained in accounts with national banks and highly-rated financial institutions or secured through direct investments, primarily in U.S. Treasury and other highly-rated foreign government securities, or reverse repurchase agreements with primarily overnight maturities. Reverse repos are valued daily and are subject to collateral maintenance provisions pursuant to which the counterparty must provide additional collateral if the underlying securities lose value, in an amount sufficient to maintain collateralization of at least 102%. We primarily use Level 1
inputs when evaluating the fair value of the non-cash equivalent direct investments, as highly-rated government securities are quoted in active markets. The carrying value of these deposits is deemed to approximate fair value.
To provide a tool to address the liquidity needs of our clearing houses and manage the liquidation of margin and guaranty fund deposits held in the form of cash and high quality sovereign debt, ICE Clear Europe, ICE Clear Credit and ICE Clear U.S. have entered into Committed Repurchase Agreement Facilities, or Committed Repo. Additionally, ICE Clear Credit and ICE Clear Netherlands have entered into Committed FX Facilities to support these liquidity needs. As of June 30, 2023,March 31, 2024, the following facilities were in place:
•ICE Clear Europe: $1.0 billion in Committed Repo to financehave the ability to convert securities held as collateral into U.S. dollar, euro and pound sterling deposits.deposits with same day liquidity.
•ICE Clear Credit: $300 million in Committed Repo (U.S. dollar based) to financehave the ability to convert U.S. dollar denominated sovereign debt and euroheld as collateral into U.S. dollar deposits with same day liquidity, €250 million in Committed Repo (euro based) to finance euro andhave the ability to convert U.S. dollar denominated sovereign debt deposits held as collateral into euro denominated deposits with same day liquidity, and €1.9 billion in Committed FX Facilities to financehave the ability to convert available U.S. dollar denominated cash into euro denominated cash to meet a euro denominated payment obligations.obligation with same day liquidity.
•ICE Clear U.S.: $250 million in Committed Repo to financehave the ability to convert U.S. dollar denominated sovereign debt deposits.deposits held as collateral into U.S. dollar deposits with same day liquidity.
•ICE Clear Netherlands: €10 million in Committed FX Facilities to financehave the ability to convert available non-euro denominated cash into euro denominated cash to meet euro denominated payment obligations.obligations with same day liquidity.
Details of our deposits are as follows (in millions):
| | Cash and Cash Equivalent Margin Deposits and Guaranty Funds | |
| Cash and Cash Equivalent Margin Deposits and Guaranty Funds | |
Cash and Cash Equivalent Margin Deposits and Guaranty Funds | | Clearing House | Clearing House | | Investment Type | | | As of June 30, 2023 | | | As of
December 31, 2022 | Clearing House | | Investment Type | | | As of March 31, 2024 | | | As of
December 31, 2023 |
| ICE Clear Europe | ICE Clear Europe | | National bank account (1) | | | $ | 5,932 | | | | $ | 17,390 | |
| ICE Clear Europe | ICE Clear Europe | | Reverse repo | | | 41,300 | | | | 65,352 | |
| ICE Clear Europe | ICE Clear Europe | | Sovereign debt | | | 1,791 | | | | 19,894 | |
| ICE Clear Europe | ICE Clear Europe | | Demand deposits | | | 16 | | | | 153 | |
| ICE Clear Credit | ICE Clear Credit | | National bank account | | | 24,910 | | | | 27,145 | |
| ICE Clear Credit | ICE Clear Credit | | Reverse repo | | | 4,310 | | | | 3,916 | |
| ICE Clear Credit | ICE Clear Credit | | Demand deposits | | | 3,034 | | | | 3,393 | |
| ICE Clear U.S. | ICE Clear U.S. | | Reverse repo | | | 5,465 | | | | 4,266 | |
| ICE Clear U.S. | ICE Clear U.S. | | Sovereign Debt | | | 149 | | | | 472 | |
| Other ICE Clearing Houses | Other ICE Clearing Houses | | Demand deposits | | | 10 | | | | 9 | |
| | Total cash and cash equivalent margin deposits and guaranty funds | Total cash and cash equivalent margin deposits and guaranty funds | | | $ | 86,917 | | | | $ | 141,990 | |
| Total cash and cash equivalent margin deposits and guaranty funds | |
| Total cash and cash equivalent margin deposits and guaranty funds | |
| | Invested Deposits, Delivery Contracts Receivable and Unsettled Variation Margin | Invested Deposits, Delivery Contracts Receivable and Unsettled Variation Margin | |
| Invested Deposits, Delivery Contracts Receivable and Unsettled Variation Margin | |
| Invested Deposits, Delivery Contracts Receivable and Unsettled Variation Margin | |
| Clearing House | |
| Clearing House | |
| Clearing House | Clearing House | | Investment Type | | | As of June 30, 2023 | | | As of
December 31, 2022 | |
| ICE NGX | ICE NGX | | Unsettled variation margin and delivery contracts receivable/payable | | | 1,103 | | | | 2,766 | | |
| ICE NGX | |
| ICE NGX | |
| ICE Clear Europe | |
| ICE Clear Europe | |
| ICE Clear Europe | ICE Clear Europe | | Invested deposits - sovereign debt | | | 309 | | | | 2,616 | | |
| Total invested deposits, delivery contracts receivable and unsettled variation margin | Total invested deposits, delivery contracts receivable and unsettled variation margin | | | $ | 1,412 | | | | $ | 5,382 | | |
| Total invested deposits, delivery contracts receivable and unsettled variation margin | |
| Total invested deposits, delivery contracts receivable and unsettled variation margin | |
(1) As of June 30, 2023,March 31, 2024, ICE Clear Europe held €58€12 million ($6313 million based on the euro/U.S. dollar exchange rate of 1.09111.0795 as of June 30, 2023)March 31, 2024) at the European Central Bank, or ECB, and £4.6 billion ($5.95.8 billion based on the pound sterling/U.S. dollar exchange rate of 1.26971.2625 as of June 30, 2023)March 31, 2024) at the Bank of England, or BOE, and €10 million ($11 million based on the above exchange rate) at the BOE. As of December 31, 2022,2023, ICE Clear Europe held €11.7 billion€11 million ($12.5 billion12 million based on the euro/U.S. dollar exchange rate of 1.07041.1037 as of December 31, 2022)2023) at the ECB, £4.0£4.6 billion ($4.95.8 billion based on the pound sterling/U.S. dollar exchange rate of 1.20931.2732 as of December 31, 2022)2023) at the BOE and €10 million ($11 million based on the above exchange rate) at the BOE.
Other Deposits
Non-cash original margin and guaranty fund deposits are not reflected in the accompanying consolidated balance sheets as the risks and rewards of these assets remain with the clearing members unless the clearing houses have sold or re-pledged the assets or in the event of a clearing member default, where the clearing member is no longer entitled to redeem the assets. Any income, gain or loss accrues to the clearing members.
In addition to the cash and invested deposits above, the ICE Clearing Houses have also received other assets from Members, which include government obligations, emissions allowances, and may include other non-cash collateral such
as letters of credit at ICE NGX, European emission allowance certificates or gold on rare occasions at ICE Clear Europe, to mitigate credit risk. For certain deposits, we may impose discount or “haircut” rates to ensure adequate collateral if market values fluctuate. The value-relatedThese other deposits are not reflected in the consolidated balance sheets as the risks and rewards of these assets remain with the Members.Members unless the clearing houses have sold or re-pledged the assets or in the event of a clearing member default, where the Member is no longer entitled to redeem the assets. Any income, gain or loss accrues to the Member.Members. The ICE Clearing Houses do not, in the ordinary course, rehypothecate or re-pledge these assets. These pledged assets are not reflected in our balance sheets, and are as follows (in millions):
| | | | As of June 30, 2023 | |
| | ICE Clear
Europe | | ICE Clear
Credit | | ICE Clear U.S. | | ICE NGX | | Total | |
| | |
| ICE Clear
Europe | |
| ICE Clear
Europe | |
| ICE Clear
Europe | |
| Original margin: | |
| Original margin: | |
| Original margin: | Original margin: | | | | | | | | | | |
| Government securities at face value | Government securities at face value | $ | 53,228 | | | $ | 31,705 | | | $ | 12,920 | | | $ | — | | | $ | 97,853 | | |
| Government securities at face value | |
| Government securities at face value | |
| Letters of credit and other | Letters of credit and other | 237 | | | — | | | — | | | 4,326 | | | 4,563 | | |
| Letters of credit and other | |
| Letters of credit and other | |
| Emissions certificates at fair value | |
| Emissions certificates at fair value | |
| Emissions certificates at fair value | |
| ICE NGX cash deposits | |
| ICE NGX cash deposits | |
| ICE NGX cash deposits | ICE NGX cash deposits | — | | | — | | | — | | | 1,349 | | | 1,349 | | |
| Total | Total | $ | 53,465 | | | $ | 31,705 | | | $ | 12,920 | | | $ | 5,675 | | | $ | 103,765 | | |
| Total | |
| Total | |
| Guaranty fund: | |
| Guaranty fund: | |
| Guaranty fund: | Guaranty fund: | | | | | | | | | | |
| Government securities at face value | Government securities at face value | $ | 765 | | | $ | 846 | | | $ | 289 | | | $ | — | | | $ | 1,900 | | |
| Government securities at face value | |
| Government securities at face value | |
| | | | | | | | | | | | | | | | | | | | | | | | | | | | | | | | | |
| | As of December 31, 2022 |
| | ICE Clear
Europe | | ICE Clear
Credit | | ICE Clear U.S. | | ICE NGX | | | Total |
| Original margin: | | | | | | | | | | | |
| Government securities at face value | | $ | 74,964 | | | $ | 26,601 | | | $ | 14,855 | | | $ | — | | | | $ | 116,420 | |
| Letters of credit | | — | | | — | | | — | | | 5,434 | | | | 5,434 | |
| ICE NGX cash deposits | | — | | | — | | | — | | | 2,357 | | | | 2,357 | |
| Total | | $ | 74,964 | | | $ | 26,601 | | | $ | 14,855 | | | $ | 7,791 | | | | $ | 124,211 | |
| Guaranty fund: | | | | | | | | | | | |
| Government securities at face value | | $ | 641 | | | $ | 805 | | | $ | 269 | | | $ | — | | | | $ | 1,715 | |
The ICE Clearing Houses invest cash margin deposits, including both the guaranty fund and original margin deposits on behalf of clearing members, primarily for purposes of safeguarding customer funds. Interest earned on cash margin investments is provided back to clearing members net of certain costs and administrative fees charged and retained by ICE. The ICE Clearing Houses also charge fees for clearing members pledging non-cash margin in lieu of cash margin, these fees are fully retained by ICE. The net interest income on cash margin and fees charged for non-cash margin retained by the ICE Clearing Houses is recorded in our Exchanges segment as OTC and other revenues and in our Fixed Income and Data Services segment as CDS clearing revenues in our consolidated statement of income. We recognized a combined $191 million and $139 million as our revenues during the six months ended June 30, 2023 and 2022, respectively, and $91 million and $81 million as our revenues during the three months ended June 30, 2023 and 2022, respectively. | | | | | | | | | | | | | | | | | | | | | | | | | | | | | | | |
| | As of December 31, 2023 |
| | ICE Clear
Europe | | ICE Clear
Credit | | ICE Clear U.S. | | ICE NGX | | | Total |
| Original margin: | | | | | | | | | | | |
| Government securities at face value | | $ | 45,698 | | | $ | 26,992 | | | $ | 13,062 | | | $ | — | | | | $ | 85,752 | |
| Letters of credit and other | | — | | | — | | | — | | | 5,006 | | | | 5,006 | |
| Emissions certificates at fair value | | 904 | | | — | | | — | | | — | | | | 904 | |
| ICE NGX cash deposits | | — | | | — | | | — | | | 1,219 | | | | 1,219 | |
| Total | | $ | 46,602 | | | $ | 26,992 | | | $ | 13,062 | | | $ | 6,225 | | | | $ | 92,881 | |
| Guaranty fund: | | | | | | | | | | | |
| Government securities at face value | | $ | 765 | | | $ | 1,119 | | | $ | 345 | | | $ | — | | | | $ | 2,229 | |
ICE NGX
ICE NGX owns a clearing house which primarily administers the physical delivery of energy and environmental trading contracts. ICE NGX is the central counterparty to Members on opposite sides of its physically-settled contracts, and the balance related to delivered but unpaid contracts is recorded as a delivery contract net receivable, with an offsetting delivery contract net payable in our balance sheets. Unsettled variation margin equal to the fair value of open contracts is recorded as of each balance sheet date. There is no impact on our consolidated statements of income as an equal amount is recognized as both an asset and a liability. ICE NGX marks all of its outstanding physical natural gas, physical environmental and physical power contracts to market daily, but only collectsand requires full collateralization of net accrued variation margin when a Member's open position falls outside a specified percentage of its pledged collateral.losses. Due to the highly liquid nature and the short period of time to maturity, the fair values of our delivery contract net payable and net receivable are determined to approximate carrying value.
ICE NGX requires Members to maintain cash or letters of credit to serve as collateral in the event of default. The cash is maintained in a segregated bank account for the benefit of the Member, and remains the property of the Member and, therefore, it is not included in our consolidated balance sheets. ICE NGX maintains a committed daylight-overnight liquidity facility in the amount of $100 million with an additional $200 million uncommitted with a third-party Canadian chartered bank which provides liquidity in the event of a settlement shortfall, subject to certain conditions.
As of June 30, 2023,March 31, 2024, ICE NGX maintains a guaranty fund of $215 million funded by a $200 million letter of credit issued by a major Canadian chartered bank and backed by default insurance underwritten by Export Development Canada, or
EDC, a Crown corporation operated at arm’s length from the Canadian government, plus $15 million held as restricted cash to fund the first loss amount that ICE NGX is responsible for under the default insurance policy. In the event of a participant default where the Member’s collateral is depleted, the shortfall would be covered by a draw down on the letter of credit following which ICE NGX would file a claim under the default insurance to recover additional losses up to $200 million beyond the $15 million first-loss amount that ICE NGX is responsible for under the default insurance policy.
Clearing House Exposure
The net notional value of unsettled contracts was $2.4$2.1 trillion as of June 30, 2023.March 31, 2024. Each ICE Clearing House bears financial counterparty credit risk and provides a central counterparty guarantee, or performance guarantee, to its Members. In its guarantor role, each ICE Clearing House has equal and offsetting claims to and from Members on opposite sides of each contract, standing as an intermediary on every contract cleared. To reduce their exposure, the ICE Clearing Houses have a risk management program with both initial and ongoing membership standards. With the exception of ICE NGX, the ICE Clearing Houses mark all outstanding contracts to market and pay and collect variation margin at least once daily.
Excluding the effects of original and variation margin, guaranty fund and collateral requirements and default insurance, the ICE Clearing Houses’ maximum estimated exposure for this guarantee would be the intra-day or full day change in fair value if all Members who have open positions with unrealized losses simultaneously defaulted, which is $161.8 billionan extremely unlikely scenario. The levels of original margin are calibrated such that a portfolio the ICE Clearing House may be required to liquidate post Member default can be closed or auctioned without recourse to resources other than those deposited by the defaulting Member, assuming an appropriate risk confidence level and liquidation period. In addition to the base margin model, each ICE Clearing House, depending on its products, employs a number of margin add-ons related to position concentration, clearing member capital, volatility, spread responses, recovery rate sensitivity, jump-to-default, and wrong way risk.
We also performed calculations to determine the fair value of our counterparty performance guarantee taking into consideration factors such as daily settlement of June 30, 2023, which represents the maximumcontracts, margining and collateral requirements, other elements of our
risk management program, historical evidence of default payments, and estimated valueprobability of potential default payouts by the ICE Clearing Houses. Based on these analyses, the estimated counterparty performance guarantee liability was determined to be nominal, and no liability was recorded as of March 31, 2024. The ICE Clearing Houses have never experienced an incident of a hypothetical one-day movement in pricingclearing member default which has required the use of the underlying unsettled contracts. This value was determined using proprietary risk management software that simulates gains and losses based on historical market prices, volatility and other factors present at that point in time for those particular unsettled contracts. Future market price volatility could result inguaranty funds of non-defaulting clearing members or the exposure being significantly different than this amount.assets of the ICE Clearing Houses.
13. Legal Proceedings
In the ordinary course of our business, from time to time we are subject to legal proceedings, lawsuits, government investigations and other claims with respect to a variety of matters. In addition, we are subject to periodic reviews, inspections, examinations and investigations by regulators in the U.S. and other jurisdictions, any of which may result in claims, legal proceedings, assessments, fines, penalties, restrictions on our business or other sanctions. We record estimated expenses and reserves for legal or regulatory matters or other claims when these matters present loss contingencies that are probable and the related amount is reasonably estimable. Any such accruals may be adjusted as circumstances change. Assessments of losses are inherently subjective and involve unpredictable factors. While the outcome of legal and regulatory matters is inherently difficult to predict and/or the range of loss often cannot be reasonably estimable, we do not believe that the liabilities, other than the potential $725 million termination fee payable to Black Knight and our accruals related to potential regulatory settlements of $11 million,if any, which may ultimately result from the resolution of the various legal and regulatory matters that arise in the ordinary course of our business, including the PennyMac Arbitration matter described below and those described in Note 16 to the consolidated financial statements in Part II, Item 8 of our 20222023 Form 10-K, are likely to have a material adverse effect on our consolidated financial condition, results of operations, or liquidity. It is possible, however, that future results of operations for any particular quarterly or annual period could be materially and adversely affected by any developments relating to these legal and regulatory matters. A range of possible losses related to certain cases cannot be reasonably estimated at this time, except as otherwise disclosed below and in Note 16 to the consolidated financial statements in Part II, Item 8 of our 20222023 Form 10-K. Individual matter disclosures in this Form 10-Q are limited to new significant matters or significant updates on existing matters since the 20222023 Form 10-K.
Black Knight Transaction LitigationPennyMac Arbitration Update
On March 9, 2023, the Federal Trade Commission, or the FTC, filedIn this matter, an administrative complaint alleging that the proposed transaction between ICE and Black Knight, if consummated, would be an unfair method of competition in violation of Section 5 of the Federal Trade Commission Act, and that it would substantially lessen competition, or tend to create a monopoly, in violation of Section 7 of the Clayton Act. The complaint seeks a variety of injunctive relief, including,American Arbitration Association arbitrator found, among other things, that PennyMac, in developing its Servicing Systems Environment, or SSE, software, engaged in the unauthorized use of Black Knight’s confidential information and granted Black Knight’s breach of contract claim on this basis. The arbitrator entered a prohibitionfinal award of $157 million in favor of Black Knight on the completionJanuary 12, 2024. On February 14, 2024, PennyMac paid Black Knight $160 million in satisfaction of the transaction withoutfinal award (inclusive of applicable interest). In the FTC’s consentsame arbitration, PennyMac also brought claims under the Sherman and if the transaction is completed,Clayton Acts, seeking $65 million in damages, subject to trebling. The arbitrator awarded PennyMac zero dollars in damages on its claims. The arbitrator also found unenforceable a divestiture or reconstitution of assetslegacy provision in a mannerBlack Knight contracts preventing clients from servicing loans on multiple systems simultaneously. Black Knight never enforced that restores such separateprovision against any customer and independent businesses as the parties had operated prior to the completion of the transaction. On April 10, 2023, the FTC filed a complainthas alerted current customers that this provision will not be enforced in the United States District Court for the Northern District of California for a temporary restraining order and preliminary injunction enjoining the completion of the transaction. On April 21, 2023, the court entered a temporary restraining order enjoining the completion of the transaction until the court rules on the FTC’s motion for a preliminary injunction. In their answers to the administrative and court complaints, filed on March 20, 2023 and April 25, 2023, respectively, ICE and Black Knight denied the FTC’s substantive allegations; asserted numerous affirmative defenses; described the pro-competitive aspects and significant lender, servicer, investor, vendor and consumer benefits relating to this transaction; and denied that the combination of their respective businesses would violate any laws. Additionally, the answers to the court complaint contained counterclaims by ICE and Black Knight against the FTC seeking declaratory relief that the FTC’s administrative process is unconstitutional and should be enjoined. On July 17, 2023, the district court entered an order granting a joint motion by the parties to continue the evidentiary hearing on the FTC's motion for a preliminary injunction, and rescheduled the hearing to August 14, 2023. In continuing the hearing, the court noted that the parties are discussing a potential resolution of the matter resulting from the announcement of the planned divestiture of the Optimal
Blue business (see Note 3) and the FTC’s analysis of the implications of the divestiture for this case and the administrative complaint. On July 19, 2023, FTC counsel filed an unopposed motion with the FTC to withdraw the administrative complaint from adjudication; on July 25, 2023, the FTC granted this motion. We are vigorously defending against the FTC’s court complaint.future.
For further information on our legal and regulatory matters, please see Note 16 to the consolidated financial statements in Part II, Item 8 of our 20222023 Form 10-K.
14. Fair Value Measurements
Fair value is the price that would be received from selling an asset or paid to transfer a liability (an exit price) in the principal or most advantageous market for the asset or liability in an orderly transaction between market participants at the measurement date. Our financial instruments consist primarily of certain short-term and long-term assets and liabilities, customer accounts receivable, margin deposits and guaranty funds, equity and equity method investments, and short-term and long-term debt.
The fair value of our financial instruments is measured based on a three-level hierarchy:
•Level 1 inputs — quoted prices for identical assets or liabilities in active markets.
•Level 2 inputs — observable inputs other than Level 1 inputs such as quoted prices for similar assets and liabilities in active markets or inputs other than quoted prices that are directly observable.
•Level 3 inputs — unobservable inputs supported by little or no market activity and that are significant to the fair value of the assets or liabilities.
Financial assets and liabilities recorded or disclosed at fair value in the accompanying consolidated balance sheets as of June 30, 2023March 31, 2024 and December 31, 20222023 were classified in their entirety based on the lowest level of input that is significant to the asset or liability’s fair value measurement.
Our restricted short-term and long-term investments represent restricted regulatory funds and SITG funds, respectively, at ICE Clear Europe, invested in treasury securities with maturities of greater than 90 days.
Recurring Fair Value Measurements
Our mutual funds are equity and fixed income mutual funds held for the purpose of providing future payments for our supplemental executive savings plan and theour supplemental executive retirement plan. These mutual funds are classified as equity investments and measured at fair value using Level 1 inputs with adjustments recorded in net income.
Excluding our equity investments without a readily determinable fair value, all other financial instruments are determined to approximate carrying value due to the short period of time to their maturities.
WeAs described in Note 3, we measured the right to receive the net proceeds of the sale of the Promissory Note obtained in connection with the Optimal Blue sale using Level 3 inputs. In February 2024, the FTC approved the buyer of the Promissory Note, and we completed the sale of the Promissory Note and received the $75 million of proceeds thereafter. Subsequent to the sale and as of March 31, 2024, we did not use Level 3 inputs to determine the fair value of assets or liabilities measured at fair value on a recurring basis as of June 30, 2023 or December 31, 2022.basis.
See Note 12 for the fair value considerations related to our margin deposits, guaranty funds and delivery contracts receivable.
Non-Recurring Fair Value Measurements
We measure certain assets, such as intangible assets and equity investments, including equity method investments, at fair value on a non-recurring basis. These assets are recognized at fair value if they are deemed to be impaired. As of December 31, 2022,2023, certain equity method investments were measured at fair value on a non-recurring basis. As of June 30, 2023,March 31, 2024, with the exception of a $3 million impairment of a developed technology intangible asset within the Exchanges segment, none of our intangible assets or equity method investments were required to be recorded at fair value since no impairments were recorded.
We measure certain equity investments at fair value on a non-recurring basis using our policy election under ASU 2016-01ASC 321, .Investments - Equity Securities. During the sixthree months ended June 30, 2023,March 31, 2024, we evaluated these investments and determined that nowe had a fair value adjustments were required underloss on our accounting policy election related to these investments.investments of $3 million, which we recorded within other income/(expense), net, in the consolidated statement of income. As of March 31, 2024, the carrying amount of our investments without readily determinable fair values was $84 million.
See Note 12 for the fair value considerations related to our margin deposits, guaranty funds and delivery contracts receivable.Financial Instruments Not Measured at Fair Value
The table below displays the fair value of our debt as of June 30, 2023.March 31, 2024. The fair values of our fixed rate notes were estimated using Level 2 inputs including quoted market prices for these instruments. The fair value of other short-term debt approximates par value since the interest rates on this short-term debt approximate market rates as of June 30, 2023.March 31, 2024.
| | As of June 30, 2023 |
| (in millions) |
| As of March 31, 2024 | | | As of March 31, 2024 |
| (in millions) | | | (in millions) |
| Debt: | Debt: | Carrying Amount | | Fair value | Debt: | Carrying Amount | | Fair value |
| Commercial Paper | |
| | 2025 Term Loan due August 31, 2025 | |
| | | 2025 Term Loan due August 31, 2025 | |
| | 2025 Term Loan due August 31, 2025 | |
| 3.65% Senior Notes due May 23, 2025 | 3.65% Senior Notes due May 23, 2025 | $ | 1,245 | | | $ | 1,226 | |
| 3.75% Senior Notes due December 1, 2025 | 3.75% Senior Notes due December 1, 2025 | 1,248 | | | 1,214 | |
| 4.00% Senior Notes due September 15, 2027 | 4.00% Senior Notes due September 15, 2027 | 1,488 | | | 1,463 | |
| 3.10% Senior Notes due September 15, 2027 | 3.10% Senior Notes due September 15, 2027 | 498 | | | 468 | |
| 3.625% Senior Notes due September 1, 2028 | |
| 3.75% Senior Notes due September 21, 2028 | 3.75% Senior Notes due September 21, 2028 | 595 | | | 571 | |
| 4.35% Senior Notes due June 15, 2029 | 4.35% Senior Notes due June 15, 2029 | 1,240 | | | 1,225 | |
| 2.10% Senior Notes due June 15, 2030 | 2.10% Senior Notes due June 15, 2030 | 1,237 | | | 1,046 | |
| 1.85% Senior Notes due September 15, 2032 | 1.85% Senior Notes due September 15, 2032 | 1,485 | | | 1,157 | |
| 4.60% Senior Notes due March 15, 2033 | 4.60% Senior Notes due March 15, 2033 | 1,488 | | | 1,455 | |
| 2.65% Senior Notes due September 15, 2040 | 2.65% Senior Notes due September 15, 2040 | 1,232 | | | 892 | |
| 4.25% Senior Notes due September 21, 2048 | 4.25% Senior Notes due September 21, 2048 | 1,232 | | | 1,091 | |
| 3.00% Senior Notes due June 15, 2050 | 3.00% Senior Notes due June 15, 2050 | 1,221 | | | 871 | |
| 4.95% Senior Notes due June 15, 2052 | 4.95% Senior Notes due June 15, 2052 | 1,465 | | | 1,435 | |
| 3.00% Senior Notes due September 15, 2060 | 3.00% Senior Notes due September 15, 2060 | 1,471 | | | 985 | |
| 5.20% Senior Notes due June 15, 2062 | 5.20% Senior Notes due June 15, 2062 | 983 | | | 996 | |
| Total debt | Total debt | $ | 18,128 | | | $ | 16,095 | |
15. Segment Reporting
Our business is conducted through three reportable business segments:
•Exchanges: We operate regulated marketplacesmarketplace technology for the listing, trading and clearing of a broad array of derivatives contracts and financial securities;securities as well as data and connectivity services related to our exchanges and clearing houses;
•Fixed Income and Data Services: We provide fixed income pricing, reference data, indices, analytics and execution services as well as global CDS clearing and multi-asset class data delivery solutions;technology; and
•Mortgage Technology: We provide a technology platform that offers customers comprehensive, digital workflow tools that aim to address the inefficiencies and mitigate risks that exist in the U.S. residential mortgage market life cycle from application through closing, servicing and the secondary market.
While revenues are recorded specifically in the segment in which they are earned or to which they relate, a significant portion of our operating expenses are not solely related to a specific segment because the expenses serve functions that are necessary for the operation of more than one segment. We directly allocate expenses when reasonably possible to do so. Otherwise, we use a pro-rata revenue approach as the allocation method for the expenses that do not relate solely to one segment and serve functions that are necessary for the operation of all segments.
Our chief operating decision maker does not review total assets or statements of income below operating income by segments; therefore, such information is not presented below. Our three segments do not engage in intersegment transactions.
Beginning in the first quarter of 2023, closing solutions revenues within our Mortgage Technology segment now include membership dues that were previously included in other revenues. We believe this is a more accurate reflection of the nature of these revenues. The impact of this change was not material, and the prior year periods have been adjusted for comparability.
Financial data for our business segments is as follows for the six months and three months ended June 30,March 31, 2024 and 2023 and 2022 (in millions):
| | Six Months Ended June 30, 2023 | |
| Exchanges | | Fixed Income and Data Services | | Mortgage Technology | | Consolidated | |
| Three Months Ended March 31, 2024 | |
| Exchanges | |
| Exchanges | |
| Exchanges | |
| Revenues: | |
| Revenues: | |
| Revenues: | Revenues: | | | | | | | | |
| Energy futures and options | Energy futures and options | $ | 700 | | | $ | — | | | $ | — | | | $ | 700 | | |
| Energy futures and options | |
| Energy futures and options | |
| Agricultural and metals futures and options | |
| Agricultural and metals futures and options | |
| Agricultural and metals futures and options | Agricultural and metals futures and options | 147 | | | — | | | — | | | 147 | | |
| Financial futures and options | Financial futures and options | 232 | | | — | | | — | | | 232 | | |
| Financial futures and options | |
| Financial futures and options | |
| Cash equities and equity options | |
| Cash equities and equity options | |
| Cash equities and equity options | Cash equities and equity options | 1,215 | | | — | | | — | | | 1,215 | | |
| OTC and other | OTC and other | 205 | | | — | | | — | | | 205 | | |
| OTC and other | |
| OTC and other | |
| Data and connectivity services | |
| Data and connectivity services | |
| Data and connectivity services | Data and connectivity services | 463 | | | — | | | — | | | 463 | | |
| Listings | Listings | 252 | | | — | | | — | | | 252 | | |
| Listings | |
| Listings | |
| Fixed income execution | |
| Fixed income execution | |
| Fixed income execution | Fixed income execution | — | | | 60 | | | — | | | 60 | | |
| CDS clearing | CDS clearing | — | | | 185 | | | — | | | 185 | | |
| CDS clearing | |
| CDS clearing | |
| Fixed income data and analytics | |
| Fixed income data and analytics | |
| Fixed income data and analytics | Fixed income data and analytics | — | | | 553 | | | — | | | 553 | | |
| Other data and network services | Other data and network services | — | | | 311 | | | — | | | 311 | | |
| Other data and network services | |
| Other data and network services | |
| Origination technology | |
| Origination technology | |
| Origination technology | Origination technology | — | | | — | | | 337 | | | 337 | | |
| Closing solutions | Closing solutions | — | | | — | | | 87 | | | 87 | | |
| Closing solutions | |
| Closing solutions | |
| Servicing software | |
| Servicing software | |
| Servicing software | |
| Data and analytics | Data and analytics | — | | | — | | | 45 | | | 45 | | |
| Other | — | | | — | | | 16 | | | 16 | | |
| Data and analytics | |
| Data and analytics | |
| | Revenues | |
| | Revenues | |
| | Revenues | Revenues | 3,214 | | | 1,109 | | | 485 | | | 4,808 | | |
| Transaction-based expenses | Transaction-based expenses | 1,024 | | | — | | | — | | | 1,024 | | |
| Transaction-based expenses | |
| Transaction-based expenses | |
| Revenues, less transaction-based expenses | |
| Revenues, less transaction-based expenses | |
| Revenues, less transaction-based expenses | Revenues, less transaction-based expenses | 2,190 | | | 1,109 | | | 485 | | | 3,784 | | |
| Operating expenses | Operating expenses | 631 | | | 699 | | | 530 | | | 1,860 | | |
| Operating expenses | |
| Operating expenses | |
| Operating income/(loss) | |
| Operating income/(loss) | |
| Operating income/(loss) | Operating income/(loss) | $ | 1,559 | | | $ | 410 | | | $ | (45) | | | $ | 1,924 | | |
|
| | | | | | | | | | | | | | | | | | | | | | | | | | |
| Three Months Ended June 30, 2023 | |
| Exchanges | | Fixed Income and Data Services | | Mortgage Technology | | Consolidated | |
| Revenues: | | | | | | | | |
| Energy futures and options | $ | 355 | | | $ | — | | | $ | — | | | $ | 355 | | |
| Agricultural and metals futures and options | 77 | | | — | | | — | | | 77 | | |
| Financial futures and options | 104 | | | — | | | — | | | 104 | | |
| Cash equities and equity options | 544 | | | — | | | — | | | 544 | | |
| OTC and other | 104 | | | — | | | — | | | 104 | | |
| Data and connectivity services | 231 | | | — | | | — | | | 231 | | |
| Listings | 126 | | | — | | | — | | | 126 | | |
| Fixed income execution | — | | | 28 | | | — | | | 28 | | |
| CDS clearing | — | | | 84 | | | — | | | 84 | | |
| Fixed income data and analytics | — | | | 277 | | | — | | | 277 | | |
| Other data and network services | — | | | 157 | | | — | | | 157 | | |
| Origination technology | — | | | — | | | 170 | | | 170 | | |
| Closing solutions | — | | | — | | | 47 | | | 47 | | |
| Data and analytics | — | | | — | | | 24 | | | 24 | | |
| Other | — | | | — | | | 8 | | | 8 | | |
| Revenues | 1,541 | | | 546 | | | 249 | | | 2,336 | | |
| Transaction-based expenses | 448 | | | — | | | — | | | 448 | | |
| Revenues, less transaction-based expenses | 1,093 | | | 546 | | | 249 | | | 1,888 | | |
| Operating expenses | 311 | | | 356 | | | 266 | | | 933 | | |
| Operating income/(loss) | $ | 782 | | | $ | 190 | | | $ | (17) | | | $ | 955 | | |
| | | | | | | | |
| | Six Months Ended June 30, 2022 | |
| Exchanges | | Fixed Income and Data Services | | Mortgage Technology | | Consolidated | |
| Three Months Ended March 31, 2023 | |
| Exchanges | |
| Exchanges | |
| Exchanges | |
| Revenues: | |
| Revenues: | |
| Revenues: | Revenues: | | | | | | | | |
| Energy futures and options | Energy futures and options | $ | 618 | | | $ | — | | | $ | — | | | $ | 618 | | |
| Energy futures and options | |
| Energy futures and options | |
| Agricultural and metals futures and options | |
| Agricultural and metals futures and options | |
| Agricultural and metals futures and options | Agricultural and metals futures and options | 122 | | | — | | | — | | | 122 | | |
| Financial futures and options | Financial futures and options | 253 | | | — | | | — | | | 253 | | |
| Financial futures and options | |
| Financial futures and options | |
| Cash equities and equity options | |
| Cash equities and equity options | |
| Cash equities and equity options | Cash equities and equity options | 1,357 | | | — | | | — | | | 1,357 | | |
| OTC and other | OTC and other | 205 | | | — | | | — | | | 205 | | |
| OTC and other | |
| OTC and other | |
| Data and connectivity services | |
| Data and connectivity services | |
| Data and connectivity services | Data and connectivity services | 432 | | | — | | | — | | | 432 | | |
| Listings | Listings | 260 | | | — | | | — | | | 260 | | |
| Listings | |
| Listings | |
| Fixed income execution | |
| Fixed income execution | |
| Fixed income execution | Fixed income execution | — | | | 40 | | | — | | | 40 | | |
| CDS clearing | CDS clearing | — | | | 138 | | | — | | | 138 | | |
| CDS clearing | |
| CDS clearing | |
| Fixed income data and analytics | |
| Fixed income data and analytics | |
| Fixed income data and analytics | Fixed income data and analytics | — | | | 551 | | | — | | | 551 | | |
| Other data and network services | Other data and network services | — | | | 292 | | | — | | | 292 | | |
| Other data and network services | |
| Other data and network services | |
| Origination technology | |
| Origination technology | |
| Origination technology | Origination technology | — | | | — | | | 399 | | | 399 | | |
| Closing solutions | Closing solutions | — | | | — | | | 138 | | | 138 | | |
| Closing solutions | |
| Closing solutions | |
| | Servicing software | |
| | Servicing software | |
| | Servicing software | |
| Data and analytics | Data and analytics | — | | | — | | | 44 | | | 44 | | |
| Other | — | | | — | | | 23 | | | 23 | | |
| Data and analytics | |
| Data and analytics | |
| | Revenues | |
| | Revenues | |
| | Revenues | Revenues | 3,247 | | | 1,021 | | | 604 | | | 4,872 | | |
| Transaction-based expenses | Transaction-based expenses | 1,159 | | | — | | | — | | | 1,159 | | |
| Transaction-based expenses | |
| Transaction-based expenses | |
| Revenues, less transaction-based expenses | |
| Revenues, less transaction-based expenses | |
| Revenues, less transaction-based expenses | Revenues, less transaction-based expenses | 2,088 | | | 1,021 | | | 604 | | | 3,713 | | |
| Operating expenses | Operating expenses | 603 | | | 692 | | | 557 | | | 1,852 | | |
| Operating income | $ | 1,485 | | | $ | 329 | | | $ | 47 | | | $ | 1,861 | | |
| Operating expenses | |
| Operating expenses | |
| Operating income/(loss) | |
| Operating income/(loss) | |
| Operating income/(loss) | |
|
| | | | | | | | | | | | | | | | | | | | | | | | | | |
| Three Months Ended June 30, 2022 | |
| Exchanges | | Fixed Income and Data Services | | Mortgage Technology | | Consolidated | |
| Revenues: | | | | | | | | |
| Energy futures and options | $ | 265 | | | $ | — | | | $ | — | | | $ | 265 | | |
| Agricultural and metals futures and options | 61 | | | — | | | — | | | 61 | | |
| Financial futures and options | 123 | | | — | | | — | | | 123 | | |
| Cash equities and equity options | 698 | | | — | | | — | | | 698 | | |
| OTC and other | 108 | | | — | | | — | | | 108 | | |
| Data and connectivity services | 218 | | | — | | | — | | | 218 | | |
| Listings | 131 | | | — | | | — | | | 131 | | |
| Fixed income execution | — | | | 25 | | | — | | | 25 | | |
| CDS clearing | — | | | 66 | | | — | | | 66 | | |
| Fixed income data and analytics | — | | | 274 | | | — | | | 274 | | |
| Other data and network services | — | | | 147 | | | — | | | 147 | | |
| Origination technology | — | | | — | | | 196 | | | 196 | | |
| Closing solutions | — | | | — | | | 66 | | | 66 | | |
| Data and analytics | — | | | — | | | 24 | | | 24 | | |
| Other | — | | | — | | | 11 | | | 11 | | |
| Revenues | 1,604 | | | 512 | | | 297 | | | 2,413 | | |
| Transaction-based expenses | 599 | | | — | | | — | | | 599 | | |
| Revenues, less transaction-based expenses | 1,005 | | | 512 | | | 297 | | | 1,814 | | |
| Operating expenses | 304 | | | 338 | | | 303 | | | 945 | | |
| Operating income/(loss) | $ | 701 | | | $ | 174 | | | $ | (6) | | | $ | 869 | | |
| | | | | | | | |
RevenueRevenues from one member of the Exchanges segment comprised $254$157 million, or 12%13%, and $130$123 million, or 12%11%, of our Exchange revenues, less transaction-based expenses for the six months and three months ended June 30,March 31, 2024 and 2023, respectively. Revenue from one member of the Exchanges segment comprised $213 million, or 10%, of our Exchange
revenues, less transaction-based expenses for the six months ended June 30, 2022 and no customers or clearing members accounted for more than 10% of our Exchange revenues, less transaction-based expenses during the three months ended June 30, 2022. Clearing members are primarily intermediaries and represent a broad range of principal trading firms. If a clearing member ceased its operations, we believe that the trading firms would continue to conduct transactions and would clear those transactions through another clearing member firm. No additional customers or clearing members accounted for more than 10% of our segment revenues or consolidated revenues during the six months or three months ended June 30, 2023March 31, 2024 or 2022.2023.
16. Earnings Per Common Share
The following is a reconciliation of the numerators and denominators of the basic and diluted earnings per common share computations for the six months and three months ended June 30,March 31, 2024 and 2023 and 2022 (in millions, except per share amounts):
| | Six Months Ended June 30, | Three Months Ended June 30, |
| 2023 | | 2022 | 2023 | | 2022 |
| Three Months Ended March 31, | |
| | Three Months Ended March 31, | |
| | 2024 | |
| 2024 | |
| Basic: | |
| Basic: | |
| Basic: | Basic: | | | | | |
| Net income attributable to Intercontinental Exchange, Inc. | Net income attributable to Intercontinental Exchange, Inc. | $ | 1,454 | | | $ | 1,212 | | $ | 799 | | | $ | 555 | |
| Net income attributable to Intercontinental Exchange, Inc. | |
| Net income attributable to Intercontinental Exchange, Inc. | |
| Weighted average common shares outstanding | |
| Weighted average common shares outstanding | |
| Weighted average common shares outstanding | Weighted average common shares outstanding | 560 | | | 560 | | 560 | | | 558 | |
| Basic earnings per common share | Basic earnings per common share | $ | 2.60 | | | $ | 2.17 | | $ | 1.43 | | | $ | 0.99 | |
| Basic earnings per common share | |
| Basic earnings per common share | |
| Diluted: | |
| Diluted: | |
| Diluted: | Diluted: | | | | | |
| Weighted average common shares outstanding | Weighted average common shares outstanding | 560 | | | 560 | | 560 | | | 558 | |
| Weighted average common shares outstanding | |
| Weighted average common shares outstanding | |
| Effect of dilutive securities - stock options and restricted stock | |
| Effect of dilutive securities - stock options and restricted stock | |
| Effect of dilutive securities - stock options and restricted stock | Effect of dilutive securities - stock options and restricted stock | 1 | | | 2 | | 1 | | | 2 | |
| Diluted weighted average common shares outstanding | Diluted weighted average common shares outstanding | 561 | | | 562 | | 561 | | | 560 | |
| Diluted weighted average common shares outstanding | |
| Diluted weighted average common shares outstanding | |
| Diluted earnings per common share | Diluted earnings per common share | $ | 2.59 | | | $ | 2.16 | | $ | 1.42 | | | $ | 0.99 | |
| Diluted earnings per common share | |
| Diluted earnings per common share | |
Basic earnings per common share is calculated using the weighted average common shares outstanding during the period.
Common equivalent shares from stock options and restricted stock awards, calculated using the treasury stock method, are included in the diluted per share calculations unless the effect of their inclusion would be antidilutive. During both the six three
months ended June 30,March 31, 2024 and 2023, 0.4 million and 2022, 10.7 million outstanding stock options and restricted stock awards, respectively, were not included in the computation of diluted earnings per common share, because to do so would have had an antidilutive effect.
17. Subsequent Events
We have evaluated subsequent events and determined that no events or transactions other than those already disclosed in this Quarterly Report, met the definition of a subsequent event for purposes of recognition or disclosure in the accompanying consolidated financial statements.
ITEM 2. MANAGEMENT’S DISCUSSION AND ANALYSIS OF FINANCIAL CONDITION AND RESULTS OF OPERATIONS
In this Quarterly Report on Form 10-Q, or this Quarterly Report, and unless otherwise indicated, the terms “Intercontinental Exchange,” “ICE,” “we,” “us,” “our,” “our company” and “our business” refer to Intercontinental Exchange, Inc., together with its consolidated subsidiaries. All references to “options” or “options contracts” in the context of our futures products refer to options on futures contracts. Solely for convenience, references in this Quarterly Report to any trademarks, service marks and trade names owned by ICE are listed without the ®, ™ and © symbols, but we will assert, to the fullest extent under applicable law, our rights to these trademarks, service marks and trade names.
We also include references to third-party trademarks, trade names and service marks in this Quarterly Report. Except as otherwise expressly noted, our use or display of any such trademarks, trade names or service marks is not an endorsement or sponsorship and does not indicate any relationship between us and the parties that own such marks and names.
The following discussion should be read in conjunction with our consolidated financial statements and related notes included elsewhere in this Quarterly Report. Due to rounding, figures in tables may not sum exactly.
Forward-Looking Statements
This Quarterly Report, including the sections entitled “Notes to Consolidated Financial Statements,” “Legal Proceedings” and “Management’s Discussion and Analysis of Financial Condition and Results of Operations,” contains “forward-looking statements” as defined in the Private Securities Litigation Reform Act of 1995. Any statements contained herein that are not statements of historical fact may be forward-looking statements.
These forward-looking statements relate to future events or our future financial performance and are based on our present beliefs and assumptions as well as the information currently available to us. They involve known and unknown risks, uncertainties and other factors that may cause our results, levels of activity, performance, cash flows, financial position or achievements to differ materially from those expressed or implied by these statements.
Forward-looking statements may be introduced by or contain terminology such as “may,” “will,” “should,” “could,” “would,” “targets,” “goal,” “expect,” “intend,” “plan,” “anticipate,” “believe,” “estimate,” “predict,” “potential,” “continue,” or the antonyms of these terms or other comparable terminology. Although we believe that the expectations reflected in the forward-looking statements are reasonable, we cannot guarantee future results, levels of activity, performance, cash flows, financial position or achievements. Accordingly, we caution you not to place undue reliance on any forward-looking statements we may make.
Factors that may affect our performance and the accuracy of any forward-looking statements include, but are not limited to, those listed below:
•conditions in global financial markets and domestic and international economic and social conditions, including inflation, risk of recession, political uncertainty and discord, geopolitical events or conflicts (including the conflicts in Ukraine, Israel and Gaza), international trade policies and sanctions laws;
•global political conditions including the presidential election in the United States, or U.S., and general elections in many jurisdictions in the U.S. and the United Kingdom, or U.K.;
•the impact of the introduction of or any changes in laws, regulations, rules or government policies with respect to financial markets, climate change, increased regulatory scrutiny or enforcement actions and our ability to comply with these requirements;
•volatility in commodity prices and equity prices, and price volatility of financial benchmarks and instruments such as interest rates, credit spreads, equity indices, foreign exchange rates, and mortgage originationindustry trends;
•the impact of climate change and the transition to renewable energy;
•the business environment in which we operate and trends in our industries, including trading volumes, prevalence of clearing, demand for data services, mortgage lending and servicing activity, mortgage delinquencies, fees, changing regulations, competition and consolidation;
•our ability to minimize the risks associated with operating clearing houses in multiple jurisdictions;
•our exchanges’ and clearing houses' compliance with their respective regulatory and oversight responsibilities;
•the resilience of our electronic platforms and soundness of our business continuity and disaster recovery plans;
•our ability to realize the expected benefits of our acquisitions and our investments, including our acquisition of Black Knight, Inc., or Black Knight, and our ability to closeremain in compliance with the Federal Trade Commission consent order to resolve antitrust concerns regarding our acquisition of Black Knight acquisition on the terms and timing expected;Knight;
•our ability to execute our growth strategy, identify and effectively pursue, implement and integrate acquisitions, including that of Black Knight, and strategic alliances and realize the synergies and benefits of such transactions within the expected time frame;
•the performance and reliability of our trading, clearing and mortgage technologies and those of third-party service providers;
•our ability to keep pace with technological developments and client preferences;
•our ability to ensure that the technology we utilize is not vulnerable to cyberattacks, hacking and other cybersecurity risks or other disruptive events or to minimize the impact of any such events;
•our ability to keep information and data relating to the customers of the users of the software and services provided by our ICE Mortgage Technology business confidential;
•the impacts of a public health emergency or pandemic, including thea re-emergence of the COVID-19 pandemic, on our business, results of operations and financial condition as well as the broader business environment;
•our ability to identify trends and adjust our business to benefit from such trends, including trends in the U.S. mortgage industry such as inflation rates, interest rates, new home purchases, refinancing activity, servicing activity, delinquencies and home builder and buyer sentiment, among others;
•our ability to evolve our benchmarks and indices in a manner that maintains or enhances their reliability and relevance;
•the accuracy of our cost and other financial estimates and our belief that cash flows from operations will be sufficient to service our debt and to fund our operational and capital expenditure needs;
•our ability to incur additional debt and pay off our existing debt in a timely manner;
•our ability to maintain existing market participants and data and mortgage technology customers, and to attract new ones;
•our ability to offer additional products and services, leverage our risk management capabilities and enhance our technology in a timely and cost-effective fashion;
•our ability to attract, develop and retain key talent;
•our ability to protect our intellectual property rights and to operate our business without violating the intellectual property rights of others; and
•potential adverse results of threatened or pending litigation and regulatory actions and proceedings.
These risks and other factors include, among others, those set forth in Part 1, Item 1(A) under the caption “Risk Factors” in our 20222023 Form 10-K, as filed with the SEC on February 2, 2023.8, 2024. Due to the uncertain nature of these factors, management cannot assess the impact of each factor on the business or the extent to which any factor, or combination of factors, may cause actual results to differ materially from those contained in any forward-looking statements.
Any forward-looking statement speaks only as of the date on which such statement is made, and we undertake no obligation to update any of these statements to reflect events or circumstances occurring after the date of this Quarterly Report. New factors may emerge, and it is not possible to predict all factors that may affect our business and prospects.
Overview
We are a leading global provider of market infrastructure,technology and data services and technology solutions to a broad range of customers including financial institutions, corporations and government entities. OurThese products, which span major asset classes including futures, equities, fixed income and U.S. residential mortgages, in the U.S., provide our customers with access to mission critical tools that are designed to increase asset class transparency and workflow efficiency. Although we report our results in three reportable business segments, we operate as one business, leveraging the collective expertise, particularly in data services and technology, that exists across our platforms to inform and enhance our operations. Our segments are as follows:
•Exchanges: We operate regulated marketplacesmarketplace technology for the listing, trading and clearing of a broad array of derivatives contracts and financial securities.securities as well as data and connectivity services related to our exchanges and clearing houses.
•Fixed Income and Data Services: We provide fixed income pricing, reference data, indices, analytics and execution services as well as global CDS clearing and multi-asset class data delivery solutions.technology.
•Mortgage Technology: We provide a technology platform that offers customers comprehensive, digital workflow tools that aim to address the inefficiencies and mitigate risks that exist in the U.S. residential mortgage market life cycle from application through closing, servicing and the secondary market.
Recent Developments
Pending Acquisition of Black Knight, Inc.
On May 4, 2022, we announced that we had entered into a definitive agreement to acquire Black Knight, Inc., or Black Knight, a software, data and analytics company that serves the housing finance continuum, including real estate data,
mortgage lending and servicing, as well as the secondary markets. Pursuant to the merger agreement, Sub will merge with and into Black Knight, with Black Knight surviving as a wholly owned subsidiary of ICE.
On March 7, 2023, ICE and Black Knight announced that, in connection with the merger agreement, Black Knight has entered into an agreement to sell its Empower loan origination business. On March 7, 2023, ICE and Black Knight also entered into an amendment to the merger agreement to reduce the per share merger consideration to be paid by ICE at the effective time of the merger. As of March 7, 2023, the amended transaction was valued at approximately $11.7 billion, or $75 per share of Black Knight common stock, with cash comprising 90% of the value of the aggregate transaction consideration and shares of our common stock comprising 10% of the value of the aggregate transaction consideration. The aggregate cash component of the transaction consideration is fixed at $10.5 billion, and the value of the aggregate stock component of the transaction consideration will fluctuate with the market price of our common stock and will be determined based on the average of the volume weighted averages of the trading prices of our common stock on each of the ten consecutive trading days ending three trading days prior to the closing of the merger. If consummated, we expect that this transaction will build on our position as a provider of end-to-end electronic workflow solutions for the rapidly evolving U.S. residential mortgage industry. We believe the Black Knight ecosystem adds value for clients of all sizes across the mortgage and real estate lifecycles by helping organizations lower costs, increase efficiencies, grow their businesses, and reduce risk.
On March 9, 2023, the FTC filed an administrative complaint alleging that the proposed transaction between ICE and Black Knight, if consummated, would be an unfair method of competition in violation of Section 5 of the Federal Trade Commission Act, and that it would substantially lessen competition, or tend to create a monopoly, in violation of Section 7 of the Clayton Act. The complaint seeks a variety of injunctive relief, including, among other things, a prohibition on the completion of the transaction without the FTC’s consent and, if the transaction is completed, a divestiture or reconstitution of assets in a manner that restores such separate and independent businesses as the parties had operated prior to the completion of the transaction. On April 10, 2023, the FTC filed a complaint in the United States District Court for the Northern District of California for a temporary restraining order and preliminary injunction enjoining the completion of the transaction. On April 21, 2023, the court entered a temporary restraining order enjoining the completion of the transaction until the court rules on the FTC’s motion for a preliminary injunction. In their answers to the administrative and court complaints, filed on March 20, 2023 and April 25, 2023, respectively, ICE and Black Knight denied the FTC’s substantive allegations; asserted numerous affirmative defenses; described the pro-competitive aspects and significant lender, servicer, investor, vendor and consumer benefits relating to this transaction; and denied that the combination of their respective businesses would violate any laws. Additionally, the answers to the court complaint contained counterclaims by ICE and Black Knight against the FTC seeking declaratory relief that the FTC’s administrative process is unconstitutional and should be enjoined. We are vigorously defending against the FTC's administrative and court complaints.
On March 30, 2023, our amended proxy statement/prospectus on Form S-4 was declared effective by the SEC, and on April 28, 2023, Black Knight stockholders approved the amendment to the merger agreement.
On July 17, 2023, we announced that we have agreed to sell Black Knight’s Optimal Blue business to the same purchaser as that of the Empower business for $700 million. The structure of the proposed transaction includes a payment of $200 million in cash, with the remainder financed by a $500 million promissory note issued by the purchaser to Black Knight, as a subsidiary of ICE, at the closing of the transaction. The closing of the proposed Optimal Blue divestiture transaction is subject to the closing of our acquisition of Black Knight, the closing of the acquisition of Black Knight’s Empower loan origination system business, and the satisfaction of other customary closing conditions.
The transaction is expected to close in the second half of 2023 following the receipt of regulatory approvals, a favorable resolution of the FTC litigation concerning this transaction, and the satisfaction of customary closing conditions. See Note 13 in our consolidated financial statements in this Quarterly Report where additional details of this transaction are discussed.Recent Developments
Global Market Conditions
Our results of operations are affected by global economic conditions, including macroeconomic conditions and geopolitical events or conflicts. DuringSince 2022, and into the first half of 2023, macroeconomic conditions, including rising interest rates, inflation and significant market volatility, along with geopolitical concerns, including the conflict in Ukraine and the sanctions and other measures that have been and continue to be imposed in response to the conflict, have created ongoing uncertainty and volatility in the global economy and resulted in a dynamic operating environment.
Our business has been impacted positively and negatively by these global economic conditions. For instance, due to market volatility and rising interest rates,rate volatility, we have seen increased trading across a number of our products, such as interest rate and equity futures, credit default swaps and bonds. Conversely, increases in mortgage interest rates in 2022, 2023 and, to a lesser extent, the first halfquarter of 20232024, have resulted in reduced consumer and investor demand for mortgages and adversely impacted
the transaction-based revenues in our Mortgage Technology segment. If mortgage rates remain high or further increase, or if banks change their mortgage lending practices, our Mortgage Technology segment revenues may be further impacted.
We have continued suspension of all services in Russia except for limited offerings to non-sanctioned entities. From an operational perspective, our businesses, including our exchanges, clearing houses, listings venues, data services businesses and mortgage platforms, have not suffered a material negative impact as a result of the events in Ukraine, Israel, Gaza and the surrounding region.regions.
We expect the macroeconomic environment to remain dynamic in the near-term, and we continue to monitor macroeconomic conditions, including interest rates, the inflationary environment, geopolitical events and military conflicts, including election outcomes and repercussions from the conflictconflicts in Ukraine, Israel and Gaza and the impact that any of the foregoing may have on the global economy and on our business. During the first half of 2023, weWe have closely monitoredbeen monitoring the credit worthiness of our counterparties and investment agents during the recent banking sector events, scrutinized counterparties directly impacted and monitored for any potential contagion. We did not suffer any material negative impact from the banking sector events that occurred during the first half ofin early 2023. In light of the current and expected macroeconomic environment we will continue to closely monitor credit worthiness of our counterparties, clearing members and our financial service providers and take risk management measures in line with established risk management frameworks.
Regulation
Our activities and the markets in which we operate are subject to regulations that impact us as well as our customers, and, in turn, meaningfully influence our activities, the manner in which we operate and our strategy. We are primarily subject to the jurisdiction of regulatory agencies in the U.S., U.K., EU, Canada, Singapore and Abu Dhabi. Failure to satisfy regulatory requirements can or may give rise to sanctions by the applicable regulator.
Global policy makers have undertaken reviews of their existing legal framework governing financial markets in connection with regulatory reform, and have either passed new laws and regulations, or are in the process of debating and/or enacting new laws and regulations that apply to our business and to our customers’ businesses. Legislative and regulatory actions may impact the way in which we or our customers conduct business and may create uncertainty, which could affect trading volumes or demand for market data. See Part 1, Item 1 “Business — Regulation” and Part 1, Item 1(A) "Risk Factors" included in our 20222023 Form 10-K for a discussion of the primary regulations applicable to our business and certain risks associated with those regulations.
Domestic and foreign policy makers continue to review their legal frameworks governing financial markets, and periodically change the laws and regulations that apply to our business and to our customers’ businesses. Our key areas of focus on these evolving efforts are:
•Increased Bank Capital Requirements. The Board of Governors of the Federal Reserve, or the Federal Reserve, the Office of the Comptroller of the Currency and the Federal Deposit Insurance Corporation proposed to implement various Basel Committee standards which would increase U.S. bank capital requirements (Basel III Endgame). The Basel III Endgame would apply credit valuation adjustment risk capital requirements to bank-affiliated clearing members' exposures to their clearing clients. The Federal Reserve also proposes to revise the risk-based capital surcharge for global systemically important bank holding companies to include bank-affiliated clearing members' exposures to their clearing clients in additional aspects of the surcharge calculation. Both proposals would increase capital requirements for client clearing activities, which could increase costs for clearing services, decrease clearing members' clearing capacity, and result in a reduction of cleared volumes at ICE clearing houses. The Basel III Endgame proposal could also discourage participation in mortgage lending and servicing, resulting in a reduction of mortgage volumes at ICE Mortgage Technology, negatively impact U.S. capital markets, end users' ability to hedge and raise financing through public markets and degrade liquidity.
•EMIR 3.0. In February 2024, the European Commission, European Parliament, and Council of the EU reached agreement on the final text of the European Market Infrastructure Regulation, or EMIR, known as EMIR 3.0. EMIR 3.0 contains provisions requiring EU market participants to establish accounts for euro-denominated short-term interest rate derivatives, or STIRs, at an EU central counterparty, or CCP, and a requirement to clear a certain number of trades in an EU account. At this time, the number of trades required to be cleared in an EU account is not finalized; however, these requirements could result in a reduction of traded and cleared contracts at ICE Futures Europe and ICE Clear Europe.
•Policy intervention to address high energy prices. Various legislative proposals in the European Union, or EU have been adopted to address high energy prices and impact ICE Endex, the primary European exchange for the benchmark European gas contract, and ICE Clear Europe, which clears ICE Endex contracts. These policy interventions include price limiting mechanisms for exchange-traded gas products and a new liquifiedliquefied natural gas, or LNG, import benchmark. In December 2022,2023, the EU adopted aextended until January 31, 2025, the price cap on certain Dutch Title Transfer Facility, or TTF, derivatives traded on ICE Endex effective February 2023. In March 2023, the European Commission extended the price cap to derivatives on all other EU gas hubs effective May 2023.Endex. In December 2022, a coalition of G7 and other nations set the price of certain Russian crude oil at or below $60 a barrel, which remains in place and impacts the services we offer to clients. Global leaders continue to discuss the implementation of additional sanctions against Russia.
•Changes to EU regulation of gas and power markets. In March 2023, the European Commission published legislative proposals to amend the Regulation on Wholesale Energy Market Integrity and Transparency, or REMIT, by introducing requirements for non-EU firms trading in European gas and power markets establishing an office in the EU. These requirements could make trading on ICE Endex more difficult and could result in a reduction in volumes and liquidity. We are monitoring the impact of these proposals on ICE Endex.
•EMIR 3.0. In December 2022, the European Commission proposed amendments to the European Market Infrastructure Regulation, or EMIR, requiring certain EU market participants to clear specified derivative transactions at an EU central counterparty. The European Commission has identified three classes of derivatives as being of substantial systemic importance, including short-term interest rate derivatives, which are traded on ICE Futures Europe and cleared at ICE Clear Europe, and euro denominated credit default swaps cleared at ICE Clear Credit. If adopted, the proposal could result in a reduction of the cleared volume of these contracts at ICE Clear Europe and ICE Clear Credit. We are monitoring the impact of this proposal on ICE Clear Europe and ICE Clear Credit.
•Benchmarks Regulation. ICE Benchmark Administration, Limited, or IBA, the administrator ofMost London Interbank Offered Rate, or LIBOR, is no longer publishing any LIBOR settings using panel bank contributions afterhave ceased to be published; however, the end of June 2023. The Financial Conduct Authority, or FCA, has decided to use its legal powers underrequired ICE Benchmark Administration, or IBA, as the U.K. Benchmarks Regulation, or U.K. BMR, to require IBAadministrator of LIBOR, to continue publishing 3-month "synthetic" Sterling LIBOR until the end of March 2024 and 1-, 3- and 6- month "synthetic" U.S. Dollar LIBOR until the end of September 2024. “Synthetic”certain LIBOR settings are not based on panel bank contributions andfor a temporary period using a changed "synthetic" methodology. "Synthetic" LIBOR settings are not representative of the underlying market or economic reality the settings were previously intended to measure. All other LIBOR settings have ceased to be published. Usage of "synthetic" LIBOR settings may be restricted or prohibited in certain circumstances under applicable law.
Finally, the European Commission used its powers under the EU Benchmarks Regulation, or EU BMR, to designate replacement benchmarks forIn addition, certain Swiss franc LIBOR settings. Certain benchmarks provided by our index provider businesses may continue to be used by supervised entities in the EU under the EU BMR transitional provisions. Although these are currently scheduled to end December 31, 2023, the European Commission adopted a delegated act on July 14, 2023, to extend the transition periodBenchmarks Regulation until December 31, 2025. Also, the European Commission has published a consultation on the scope of the EU BMR and the regime for third-country benchmark administrators in preparation of the development of a legislative proposal which is not expected until late 2023. Uncertainties relating to the extension of the transition period and the scope of the EU BMR may impact our ability to provide benchmarks into the EU.
•EU Deforestation Regulation. TheEffective in December 2024, the EUDeforestation Regulation, or EUDR, aims to curb the EU market’s impact on global deforestation and forest degradation by requiring sevenrequires that certain commodities including(including cocoa and coffee,coffee) and certain specifiedtheir products be from deforestation-free land and meet other requirements before they can be placed or made from them, to be deforestation-free to be soldavailable on the EU market, or exported from it. The EUDR obligations are scheduled to be effective in December 2024. The EUDR requirements may decelerate the physical trade of cocoa and coffee, impact the useableusability of EU coffee and cocoa physical inventories, and reduce trading volumes on ICE Futures Europe of the Robusta Coffee Contract and London Cocoa Contract and on ICE Futures USU.S. of the Coffee C ® Contract (Arabica). In March, 20 EU Member States urged the EU Commission to revise the EUDR and temporarily suspend implementation. We are monitoring the impact of these developments on ICE Futures Europe and ICE Futures U.S.
•U.K. Deforestation Regulation. In December 2023, the EUDR and workingU.K. Government announced its intent to implement a regulation which would require that certain commodities (including cocoa) and their products be from deforestation-free land and meet other requirements. Legislation to implement these requirements is likely to be adopted early in 2024. We are monitoring the regulation.impact of these developments and any impact on ICE Futures Europe.
•U.K. Commodity Derivatives Reform. In December 2023, the FCA published a consultation proposing to revise the U.K. commodity derivatives framework. The Financial Services and Markets Act 2023, or FSMA 2023, reformed the U.K.’s commodity derivatives regulatory regime including revoking the Markets in Financial Instruments Directive II, or MIFID II, requirement to set position limits on all exchange traded and over-the-counter contracts and transferring the powers to set position limits from the FCA to trading venue operators. The FCA is proposing to require that trading venues set position limits for critical and related contracts including ICE's softs, agricultural and energy contracts such as Brent, WTI, gasoil and natural gas, to establish accountability thresholds and to report enhanced position data. These requirements could make trading on ICE Futures Europe more difficult and could result in a reduction in volumes and liquidity.
Tax Policy Changes
The OECD Pillar Two minimum tax rules, which generally provide for a minimum effective tax rate of 15%, are intended to apply to tax years beginning in 2024. In 2023, the OECD issued administrative guidance providing transitional safe harbor rules concerning the implementation of the Pillar Two framework, which will apply to fiscal years ending on or before December 31, 2026. The EU member states and many other countries, including the U.K., have committed to implement or have already enacted legislation adopting the Pillar Two rules. We are monitoring developments and evaluating the impacts of these new rules on our tax rate, including our ability to qualify for the safe harbor rules as implemented by each jurisdiction; however, we do not expect a material impact to our effective tax rate given our current tax profile.
Consolidated Financial Highlights
The following summarizes our results and significant changes in our consolidated financial performance for the periods presented (dollars in millions, except per share amounts).
(1) Operating loss from our Mortgage Technology segment was $45$48 million and $28 million for the sixthree months ended June 30, 2023.March 31, 2024 and 2023, respectively.
(2) The adjusted figures exclude items that are not reflective of our ongoing core operations and business performance. Adjusted net income attributable to ICE is presented net of taxes. These adjusted numbers are not calculated in accordance with U.S. GAAP. See “—Non-GAAP Financial Measures” below.
| | Six Months Ended June 30, | | Three Months Ended June 30, | |
| 2023 | | 2022 | | Change | | 2023 | | 2022 | | Change |
| Three Months Ended March 31, | |
| Three Months Ended March 31, | |
| Three Months Ended March 31, | |
| 2024 | |
| 2024 | |
| 2024 | |
| Revenues, less transaction-based expenses | |
| Revenues, less transaction-based expenses | |
| Revenues, less transaction-based expenses | Revenues, less transaction-based expenses | $ | 3,784 | | | $ | 3,713 | | | 2 % | | $ | 1,888 | | | $ | 1,814 | | | 4 % |
Recurring revenues(1) | Recurring revenues(1) | $ | 1,908 | | | $ | 1,851 | | | 3 % | | $ | 955 | | | $ | 930 | | | 2 % |
Recurring revenues(1) | |
Recurring revenues(1) | |
Transaction revenues, net(1) | |
Transaction revenues, net(1) | |
Transaction revenues, net(1) | Transaction revenues, net(1) | $ | 1,876 | | | $ | 1,862 | | | 1 % | | $ | 933 | | | $ | 884 | | | 6 % |
| Operating expenses | Operating expenses | $ | 1,860 | | | $ | 1,852 | | | — % | | $ | 933 | | | $ | 945 | | | (1) % |
| Operating expenses | |
| Operating expenses | |
Adjusted operating expenses(2) | |
Adjusted operating expenses(2) | |
Adjusted operating expenses(2) | Adjusted operating expenses(2) | $ | 1,496 | | | $ | 1,486 | | | 1 % | | $ | 756 | | | $ | 740 | | | 2 % |
| Operating income | Operating income | $ | 1,924 | | | $ | 1,861 | | | 3 % | | $ | 955 | | | $ | 869 | | | 10 % |
| Operating income | |
| Operating income | |
Adjusted operating income(2) | |
Adjusted operating income(2) | |
Adjusted operating income(2) | Adjusted operating income(2) | $ | 2,288 | | | $ | 2,227 | | | 3% | | $ | 1,132 | | | $ | 1,074 | | | 5% |
| Operating margin | Operating margin | 51 | % | | 50 | % | | 1 pt | | 51 | % | | 48 | % | | 3 pts |
| Operating margin | |
| Operating margin | |
Adjusted operating margin(2) | |
Adjusted operating margin(2) | |
Adjusted operating margin(2) | Adjusted operating margin(2) | 60 | % | | 60 | % | | — | | 60 | % | | 59 | % | | 1 pt |
| Other income/(expense), net | Other income/(expense), net | $ | (228) | | | $ | (290) | | | (21) % | | $ | (108) | | | $ | (130) | | | (16) % |
| Other income/(expense), net | |
| Other income/(expense), net | |
| Income tax expense | |
| Income tax expense | |
| Income tax expense | Income tax expense | $ | 207 | | | $ | 338 | | | (39) % | | $ | 32 | | | $ | 173 | | | (82) % |
| Effective tax rate | Effective tax rate | 12 | % | | 22 | % | | (10 pts) | | 4 | % | | 23 | % | | (19 pts) |
| Effective tax rate | |
| Effective tax rate | |
| Net income attributable to ICE | |
| Net income attributable to ICE | |
| Net income attributable to ICE | Net income attributable to ICE | $ | 1,454 | | | $ | 1,212 | | | 20 % | | $ | 799 | | | $ | 555 | | | 44 % |
Adjusted net income attributable to ICE(2) | Adjusted net income attributable to ICE(2) | $ | 1,593 | | | $ | 1,543 | | | 3 % | | $ | 802 | | | $ | 739 | | | 8 % |
Adjusted net income attributable to ICE(2) | |
Adjusted net income attributable to ICE(2) | |
| Diluted earnings per share attributable to ICE common stockholders | |
| Diluted earnings per share attributable to ICE common stockholders | |
| Diluted earnings per share attributable to ICE common stockholders | Diluted earnings per share attributable to ICE common stockholders | $ | 2.59 | | | $ | 2.16 | | | 20 % | | $ | 1.42 | | | $ | 0.99 | | | 43 % |
Adjusted diluted earnings per share attributable to ICE common stockholders(2) | Adjusted diluted earnings per share attributable to ICE common stockholders(2) | $ | 2.84 | | | $ | 2.75 | | | 3 % | | $ | 1.43 | | | $ | 1.32 | | | 8 % |
Adjusted diluted earnings per share attributable to ICE common stockholders(2) | |
Adjusted diluted earnings per share attributable to ICE common stockholders(2) | |
| Cash flows from operating activities | |
| Cash flows from operating activities | |
| Cash flows from operating activities | Cash flows from operating activities | $ | 1,805 | | | $ | 1,725 | | | 5 % | |
Free cash flow(3) | Free cash flow(3) | $ | 1,602 | | | $ | 1,521 | | | 5 % | |
Free cash flow(3) | |
Free cash flow(3) | |
Adjusted free cash flow (3) | Adjusted free cash flow (3) | $ | 1,652 | | | $ | 1,406 | | | 18 % | |
Adjusted free cash flow (3) | |
Adjusted free cash flow (3) | |
(1) We define recurring revenues as the portion of our revenues that are generally predictable, stable, and can be expected to occur at regular intervals in the future with a relatively high degree of certainty and visibility. We define transaction revenues as those associated with a more specific point-in-time service, such as a trade execution.
(2) The adjusted figures exclude items that are not reflective of our ongoing core operations and business performance. Adjusted net income attributable to ICE and adjusted diluted earnings per share attributable to ICE common stockholders are presented net of taxes. These adjusted figures are not calculated in accordance with U.S. GAAP. See “—Non-GAAP Financial Measures” below.
(3) We believe these non-GAAP liquidity measures provide useful information to management and investors to analyze cash resources generated from our operations. We believe that free cash flow is useful as one of the bases for comparing our performance with our competitors and demonstrates our ability to convert the reinvestment of capital expenditures and capitalized software development costs required to maintain and grow our business, andbusiness. We believe that adjusted free cash flow eliminates the impact of timing differences related to the payment of section 31 fees. These figures are not calculated in accordance with U.S. GAAP. See “—Non-GAAP Liquidity Measures” below.
•Revenues, less transaction-based expenses, increased $71 million and $74$394 million for the six months and three months ended June 30, 2023, respectively,March 31, 2024 from the comparable periodsperiod in 2022.2023. See "—Exchanges Segment", "—Fixed Income and Data Services Segment" and "—Mortgage Technology Segment" below for a discussion of the significant changes in our revenues. The increase in revenues during the six months ended June 30, 2023 includes $19 million in unfavorable foreign exchange effects arising from fluctuations in the U.S. dollar from the comparable period in 2022 and the increase in revenues during the three months ended June 30, 2023March 31, 2024 includes $3$9 million in favorable foreign exchange effects arising from fluctuations in the U.S. dollar from the comparable period in 2022. See Item 3 "Quantitative and Qualitative Disclosures About Market Risk-Foreign Currency Exchange Rate Risk" below for additional information on the impact of currency fluctuations.2023.
•Operating expenses increased $8 million for the six months ended June 30, 2023, and decreased $12$300 million for the three months ended June 30, 2023,March 31, 2024 from the comparable periodsperiod in 2022.2023. See "—Consolidated Operating Expenses" below for a discussion of the significant changes in our operating expenses. The increase in operating expenses during the sixthree months ended June 30, 2023March 31, 2024 includes $8$3 million in favorableunfavorable foreign exchange effects arising from fluctuations in the U.S. dollar from the comparable period in 2022 and the decrease in operating expenses during the three months ended June 30, 2023 do not include any foreign exchange effects arising from fluctuations in the U.S. dollar from the comparable period in 2022. See Item 3 "Quantitative and Qualitative Disclosures About Market Risk-Foreign Currency Exchange Rate Risk" below for additional information on the impact of currency fluctuations.2023.
Variability in Quarterly Comparisons
Our business environment has been characterized by:
•globalization of marketplaces, customers and competitors;
•growing customer demand for workflow efficiency and automation;
•commodity, interest rate, inflation rate and financial markets volatility and uncertainty;
•growing demand for data to inform customers' risk management and investment decisions;
•evolving, increasing and disparate regulation across multiple jurisdictions;
•price volatility increasing customers' demand for risk management services;
•increasing focus on capital and cost efficiencies;
•customers' preference to manage risk in markets demonstrating the greatest depth of liquidity and product diversity;
•the evolution of existing products and new product innovation to serve emerging customer needs and changing industry agreements;
•rising demand for speed, data, data capacity and connectivity by market participants, necessitating increased investment in technology; and
•consolidation and increasing competition among global markets for trading, clearing and listings.
For additional information regarding the factors that affect our results of operations, see Item 1(A) “Risk Factors” included in our 20222023 Form 10-K.
Segment Results
Our business is conducted through three reportable business segments:
•Exchanges: We operate regulated marketplacesmarketplace technology for the listing, trading and clearing of a broad array of derivatives contracts and financial securities;securities as well as data and connectivity services related to our exchanges and clearing houses;
•Fixed Income and Data Services: We provide fixed income pricing, reference data, indices, analytics and execution services as well as global CDS clearing and multi-asset class data delivery solutions;technology; and
•Mortgage Technology: We provide a technology platform that offers customers comprehensive, digital workflow tools that aim to address the inefficiencies and mitigate risks that exist in the U.S. residential mortgage market life cycle, from application through closing, servicing and the secondary market.
While revenues are recorded specifically in the segment in which they are earned or to which they relate, a significant portion of our operating expenses are not solely related to a specific segment because the expenses serve functions that are necessary for the operation of more than one segment. We directly allocate expenses when reasonably possible to do so. Otherwise, we use a pro-rata revenue approach as the allocation method for the expenses that do not relate solely to one segment and serve functions that are necessary for the operation of all segments. Our segments do not engage in intersegment transactions.
Exchanges Segment
The following presents selected statements of income data for our Exchanges segment (dollars in millions and YTD represents the six-month periods ended June 30th)millions):
(1) The adjusted figures in the charts above are calculated by excluding items that are not reflective of our cash operations and core business performance. As a result, these adjusted figures are not calculated in accordance with U.S. GAAP. See “ —Non-GAAP Financial Measures” below.
| | Six Months Ended June 30, | | | | Three Months Ended June 30, | | | | |
| 2023 | | 2022 | | | Change* | | 2023 | | 2022 | | | Change | |
| Three Months Ended March 31, | |
| Three Months Ended March 31, | |
| Three Months Ended March 31, | |
| 2024 | |
| 2024 | |
| 2024 | |
| Revenues: | |
| Revenues: | |
| Revenues: | Revenues: | | | | | | | | | | | | | | |
| Energy futures and options | Energy futures and options | $ | 700 | | | $ | 618 | | | | 13 | % | | $ | 355 | | | $ | 265 | | | | 34 | % | |
| Energy futures and options | |
| Energy futures and options | |
| Agricultural and metals futures and options | |
| Agricultural and metals futures and options | |
| Agricultural and metals futures and options | Agricultural and metals futures and options | 147 | | | 122 | | | | 20 | | | 77 | | | 61 | | | | 27 | | |
| Financial futures and options | Financial futures and options | 232 | | | 253 | | | | (8) | | | 104 | | | 123 | | | | (16) | | |
| Financial futures and options | |
| Financial futures and options | |
| Futures and options | |
| Futures and options | |
| Futures and options | Futures and options | 1,079 | | | 993 | | | | 9 | | | 536 | | | 449 | | | | 19 | | |
| Cash equities and equity options | Cash equities and equity options | 1,215 | | | 1,357 | | | | (10) | | | 544 | | | 698 | | | | (22) | | |
| Cash equities and equity options | |
| Cash equities and equity options | |
| OTC and other | |
| OTC and other | |
| OTC and other | OTC and other | 205 | | | 205 | | | | — | | | 104 | | | 108 | | | | (3) | | |
| Transaction and clearing, net | Transaction and clearing, net | 2,499 | | | 2,555 | | | | (2) | | | 1,184 | | | 1,255 | | | | (6) | | |
| Transaction and clearing, net | |
| Transaction and clearing, net | |
| Data and connectivity services | |
| Data and connectivity services | |
| Data and connectivity services | Data and connectivity services | 463 | | | 432 | | | | 7 | | | 231 | | | 218 | | | | 6 | | |
| Listings | Listings | 252 | | | 260 | | | | (3) | | | 126 | | | 131 | | | | (5) | | |
| Listings | |
| Listings | |
| Revenues | |
| Revenues | |
| Revenues | Revenues | 3,214 | | | 3,247 | | | | (1) | | | 1,541 | | | 1,604 | | | | (4) | | |
Transaction-based expenses(1) | Transaction-based expenses(1) | 1,024 | | | 1,159 | | | | (12) | | | 448 | | | 599 | | | | (25) | | |
Transaction-based expenses(1) | |
Transaction-based expenses(1) | |
| Revenues, less transaction-based expenses | |
| Revenues, less transaction-based expenses | |
| Revenues, less transaction-based expenses | Revenues, less transaction-based expenses | 2,190 | | | 2,088 | | | | 5 | | | 1,093 | | | 1,005 | | | | 9 | | |
| Other operating expenses | Other operating expenses | 508 | | | 484 | | | | 5 | | | 249 | | | 244 | | | | 3 | | |
| Other operating expenses | |
| Other operating expenses | |
| Depreciation and amortization | Depreciation and amortization | 123 | | | 118 | | | | 4 | | | 62 | | | 60 | | | | 3 | | |
| Acquisition-related transaction and integration costs | — | | | 1 | | | | n/a | | — | | | — | | | | n/a | |
| Depreciation and amortization | |
| Depreciation and amortization | |
| | Operating expenses | Operating expenses | 631 | | | 603 | | | | 5 | | | 311 | | | 304 | | | | 2 | | |
| | Operating expenses | |
| | Operating expenses | |
| Operating income | |
| Operating income | |
| Operating income | Operating income | $ | 1,559 | | | $ | 1,485 | | | | 5 | % | | $ | 782 | | | $ | 701 | | | | 12 | % | |
| | Recurring revenues | Recurring revenues | $ | 715 | | | $ | 692 | | | | 3 | % | | $ | 357 | | | $ | 349 | | | | 2 | % | |
| | Recurring revenues | |
| | Recurring revenues | |
| Transaction revenues, net | Transaction revenues, net | $ | 1,475 | | | $ | 1,396 | | | | 6 | % | | $ | 736 | | | $ | 656 | | | | 12 | % | |
| Transaction revenues, net | |
| Transaction revenues, net | |
(1)Transaction-based expenses are largely attributable to our cash equities and options business.
*Percentage changes in the table above deemed "n/a" are not meaningful.
Exchanges Revenues
Our Exchanges segment includes transaction and clearing revenues from our futures and NYSE exchanges, related data and connectivity services, and our listings business. Transaction and clearing revenues consist of fees collected from derivatives, cash equities and equity options trading and derivatives clearing, and are reported on a net basis, except for the NYSE transaction-based expenses discussed below. Rates per-contract, or RPC, are driven by the number of contracts or securities traded and the fees charged per contract, net of certain rebates. Our per-contract transaction and clearing revenues will depend upon many factors, including, but not limited to, market conditions, transaction and clearing volume, product mix, pricing, applicable revenue sharing and market making agreements, and new product introductions.
Transaction and clearing revenues are generally assessed on a per-contract basis and revenues and profitability fluctuate with changes in contract volume and product mix. We consider data and connectivity services revenues and listings revenues to be recurring revenues. Our data and connectivity services revenues are recurring subscription fees related to the various data and connectivity services that we provide which are directly attributable to our exchange venues. Our listings revenues are also recurring subscription fees that we earn for the provision of NYSE listings services for public companies and exchange-traded funds, or ETFs, and related corporate actions for listed companies.
For both the six months ended June 30, 2023 and 2022, 19% of our Exchanges segment revenues, less transaction-based expenses, were billed in pounds sterling or euros and for the three months ended June 30,March 31, 2024 and 2023, 23% and 2022, 19% and 18%20%, respectively, of our Exchanges segment revenues, less transaction-based expenses, were billed in pounds sterling or euros. Due to the fluctuations of the pound sterling and euro compared to the U.S. dollar, our Exchanges segment revenues, less transaction-based expenses, were lower by $15 million for the six months ended June 30, 2023, and higher by $2$7 million for the three months ended June 30, 2023,March 31, 2024, from the comparable periods in 2022.2023.
Our exchange transaction and clearing revenues are presented net of rebates. We recorded rebates of $488$297 million and $464 million for the six months ended June 30, 2023 and 2022, respectively, and $236 million and $201$252 million for the three months ended June 30,March 31, 2024 and 2023, and 2022, respectively. We offer rebates in certain of our markets primarily to support market liquidity and trading volume by providing qualified participants in those markets a discount to the applicable commission rate. Such rebates are calculated based on volumes traded. The increase in rebates for the six
months and three months ended June 30, 2023March 31, 2024 is primarily due to higher volumes traded as compared to the comparable periodsperiod in 2022.2023.
•Energy Futures and Options: Total energy volume increased 5%25% and revenues increased 13%33% for the sixthree months ended June 30, 2023March 31, 2024 from the comparable period in 2022 and volume increased 16% and revenues increased 34% for the three months ended June 30, 2023 from the comparable period in 2022.2023.
–Total oil futures and options volume increased 5% and 26%21% for the six months and three months ended June 30, 2023, respectively,March 31, 2024 from the comparable periodsperiod in 2022, primarily due to reduced uncertainty, normalization2023, driven, in part, by elevated levels of price levels,uncertainty related to oil supply/demand dynamics and increased focus on Brent with Midland WTI now deliverable into the Brent Basket, providing additional physical liquidity and exposure.geopolitical risk.
–Our global natural gas futures and options volume increased 6% and 3%32% for the six months and three months ended June 30, 2023, respectively,March 31, 2024 from the comparable periodsperiod in 2022, primarily2023, due to continued growth in our TTF and Asian JKM products as natural gas continues to globalize, as well as strength acrossin our Dutch TTF complex as the second quarter of 2023 benefited from reduced uncertaintyNorth American natural gas products driven by increased volatility related to shifting weather and normalization of price levels.fundamentals.
–Our environmentals and other futures and options volume decreased 5% and 6%increased 16% for the six months and three months ended June 30, 2023, respectively,March 31, 2024 from the comparable periodsperiod in 2022,2023, due in part to lowerhigher environmentals and power volumes in the second quarter of 2023 versus the year ago period.
•Agricultural and Metals Futures and Options: Total volumes in our agricultural and metals futures and options markets increased 23%9% and 27%revenues increased 3% for the six months and three months ended June 30, 2023, respectively,March 31, 2024 from the comparable periodsperiod in 2022 and revenues increased 20% and 27% for the six months and three months ended June 30, 2023, respectively, from the comparable periods in 2022. The first half of 2023 benefited fromdriven by elevated price volatility as a result of weather-related supply and demand dynamics driving an increased need to manage risk acrossimpacting our commodityCocoa and Cotton markets.
–Sugar futures and options volumes increased 30% and 37%decreased 15% for the six months and three months ended June 30, 2023, respectively,March 31, 2024 from the comparable periodsperiod in 2022.2023.
–Other agricultural and metal futures and options volume increased 17% and 19%26% for the six months and three months ended June 30, 2023, respectively,March 31, 2024 from the comparable periodsperiod in 2022.2023.
•Financial Futures and Options: Total volumes in our financial futures and options markets were flat for the six months ended June 30, 2023,increased 4% and decreased 13%revenues increased 6% for the three months ended June 30, 2023,March 31, 2024 from the comparable periodsperiod in 2022 and revenues decreased 8% and 16% for the six months and three months ended June 30, 2023, respectively, from the comparable periods in 2022, including the impacts of foreign exchange effects. The second quarter of 2022three months ended March 31, 2024 benefited from elevated interest rate volatility across global markets driven by geopolitical events,related to increased central bank activity and inflationary concerns.speculation.
–Interest rate futures and options volume increased 4% for the six months ended June 30, 2023,9% and decreased 12%revenue increased 16% for the three months ended June 30, 2023, respectively,March 31, 2024 from the comparable periodsperiod in 2022, and revenue decreased 6% and 15% for the six months and2023. The three months ended June 30, 2023, respectively, from the comparable periods in 2022. The second quarter of 2022March 31, 2024 benefited from elevated interest rate volatility related to increased speculation regarding central bank activity due to inflation concerns.speculation. Interest rate futures and options revenues were $149$97 million and $158 million for the six months ended June 30, 2023 and 2022, respectively, and $65 million and $76$84 million for the three months ended June 30,March 31, 2024 and 2023, and 2022, respectively.
–Other financial futures and options volume, which includes our MSCI®, FTSE® and NYSE FANG+ equity index products, decreased 13%21% and 21%revenue decreased 13% for the six months and three months ended June 30, 2023, respectively,March 31, 2024 from the comparable periodsperiod in 2022. Financial futures and options revenue decreased 12% and 17% for the six months and three months ended June 30, 2023, respectively, from2023. The decrease was primarily due to lower equity market volatility than during the comparable periodsperiod in 2022 as the first half of 2022 benefited from heightened volatility related to the conflict in Ukraine.2023. Other financial futures and options revenues were $83$38 million and $95 million for the six months ended June 30, 2023 and 2022, respectively, and $39 million and $47$44 million for the three months ended June 30,March 31, 2024 and 2023, and 2022, respectively.
•Cash Equities and Equity Options: Cash equities volume decreased 13% and 16%increased 2% for the six months and three months ended June 30, 2023, respectively,March 31, 2024 from the comparable periodsperiod in 2022,2023, due to lower totalincreased market volumes
share as compared to the first half of 2022 benefited from elevated volatility related to inflationary, recessionary and geopolitical concerns.same prior year period. Cash equities revenues, net of transaction-based expenses, were $134$71 million and $147 million for the six months ended June 30, 2023 and 2022, respectively, $67 million and $74 million for the three months ended June 30,March 31, 2024 and 2023, and 2022, respectively. Equity options volume increased 3% and 1%7% for the six months and three months ended June 30, 2023, respectively,March 31, 2024 from the comparable periodsperiod in 2022. The overall increase in equity options volume for the six months ended June 30, 2023, was driven by increased participation.participation and higher market share. Equity options revenues, net of transaction-based expenses, were $57 million and $51$28 million for the six months ended June 30, 2023 and 2022, respectively, and $29 million and $25 million forboth the three months ended June 30, 2023March 31, 2024 and 2022, respectively.2023.
•OTC and Other: OTC and other transactions include revenues from our OTC energy business and other trade confirmation services, as well as interest income on certain clearing margin deposits, regulatory penalties and fines, fees for use of our facilities, regulatory fees charged to member organizations of our U.S. securities exchanges, designated market maker service fees, exchange membership fees and agricultural grading and certification fees. Our OTC and other revenues were flat for the six months ended June 30, 2023 and decreased 3%increased 2% for the three months ended June 30, 2023,March 31, 2024 from the comparable periodsperiod in 2022, primarily due to a decrease in interest income on clearing margin deposits in the second quarter of 2023.
•Data and Connectivity Services: Our data and connectivity services revenues increased 7% and 6%1% for the six months and three months ended June 30, 2023, respectively,March 31, 2024 from the comparable periodsperiod in 2022.2023. The increase in revenue was driven by the strong retention rate of existing customers, the addition of new customers and increased purchases by existing customers.
•Listings Revenues: Through NYSE, NYSE American and NYSE Arca, we generate listings revenue related to the provision of listings services for public companies and ETFs, and related corporate actions for listed companies. Listings revenues decreased 3% and 5%4% for the six months and three months ended June 30, 2023, respectively,March 31, 2024, from the comparable periodsperiod in 2022, driven by2023, due to the roll off of initial listing fees from the strong IPO market volatility causing IPO delays.in 2021. All listings fees are billed upfront, and revenues are recognized over time as the identified performance obligations are satisfied.
Selected Operating Data
Volume of contracts traded, futures and options rate per contract and open interest are measures that we use in analyzing the performance of our futures and options contracts. Handled volume, matched volume and cash equities and equity options rate per contract are measures that we use in analyzing our NYSE cash equities and equity options performance. We believe each of these measures provides useful information for management and investors in understanding our performance. Management considers these metrics when making financial and operating decisions. Our calculation of these metrics may not be comparable to similarly titled measures used by other companies.
The following charts and tables present trading activity in our futures and options markets by commodity type based on the total number of contracts traded, as well as futures and options rate per contract (in millions, except for percentages and rate per contract amounts):
| | | | | | | | | | | | | | |
| Volume and Rate per Contract |
| | Six Months Ended June 30, | | Three Months Ended June 30, | |
| 2023 | | 2022 | | Change | | 2023 | | 2022 | | Change |
| Three Months Ended March 31, | |
| Three Months Ended March 31, | |
| Three Months Ended March 31, | |
| 2024 | |
| 2024 | |
| 2024 | |
| Number of contracts traded (in millions): | |
| Number of contracts traded (in millions): | |
| Number of contracts traded (in millions): | Number of contracts traded (in millions): | | | | | | | | | | | |
| Energy futures and options | Energy futures and options | 419 | | | 399 | | | 5 | % | | 206 | | | 177 | | | 16 | % |
| Energy futures and options | |
| Energy futures and options | |
| Agricultural and metals futures and options | |
| Agricultural and metals futures and options | |
| Agricultural and metals futures and options | Agricultural and metals futures and options | 63 | | | 52 | | | 23 | | | 33 | | | 26 | | | 27 | |
| Financial futures and options | Financial futures and options | 330 | | | 328 | | | — | | | 137 | | | 158 | | | (13) | |
| Financial futures and options | |
| Financial futures and options | |
| Total | |
| Total | |
| Total | Total | 812 | | | 779 | | | 4 | % | | 376 | | | 361 | | | 4 | % |
| | | Six Months Ended June 30, | | Three Months Ended June 30, | |
| | 2023 | | 2022 | | Change | | 2023 | | 2022 | | Change |
| Average daily volume of contracts traded (in thousands): | Average daily volume of contracts traded (in thousands): | | | | | | | | | | | |
| | Average daily volume of contracts traded (in thousands): | |
| | Average daily volume of contracts traded (in thousands): | |
| Energy futures and options | |
| Energy futures and options | |
| Energy futures and options | Energy futures and options | 3,377 | | | 3,221 | | | 5 | % | | 3,315 | | | 2,862 | | | 16 | % |
| Agricultural and metals futures and options | Agricultural and metals futures and options | 510 | | | 416 | | | 23 | | | 530 | | | 416 | | | 27 | |
| Agricultural and metals futures and options | |
| Agricultural and metals futures and options | |
| Financial futures and options | Financial futures and options | 2,605 | | | 2,599 | | | — | | | 2,182 | | | 2,523 | | | (14) | |
| Financial futures and options | |
| Financial futures and options | |
| Total | |
| Total | |
| Total | Total | 6,492 | | | 6,236 | | | 4 | % | | 6,027 | | | 5,801 | | | 4 | % |
| | | Six Months Ended June 30, | | Three Months Ended June 30, | |
| | 2023 | | 2022 | | Change | | 2023 | | 2022 | | Change |
| Rate per contract: | Rate per contract: | | | | | | | | | | | |
| | Rate per contract: | |
| | Rate per contract: | |
| Energy futures and options | |
| Energy futures and options | |
| Energy futures and options | Energy futures and options | $ | 1.67 | | | $ | 1.55 | | | 8 | % | | $ | 1.73 | | | $ | 1.49 | | | 16 | % |
| Agricultural and metals futures and options | Agricultural and metals futures and options | $ | 2.33 | | | $ | 2.37 | | | (2) | % | | $ | 2.36 | | | $ | 2.36 | | | — | % |
| Agricultural and metals futures and options | |
| Agricultural and metals futures and options | |
| Financial futures and options | |
| Financial futures and options | |
| Financial futures and options | Financial futures and options | $ | 0.69 | | | $ | 0.76 | | | (9) | % | | $ | 0.75 | | | $ | 0.77 | | | (3) | % |
|
Open interest is the aggregate number of contracts (long or short) that clearing members hold either for their own account or on behalf of their clients. Open interest refers to the total number of contracts that are currently “open,” in other words, contracts that have been entered into but not yet liquidated by either an offsetting trade, exercise, expiration or assignment. Open interest represents a measure that we believe is useful for management and investors in understanding future activity remaining to be closed out in terms of the number of contracts that members and their clients continue to hold in the particular contract and by the number of contracts held for each contract month listed by the exchange. The following charts and table present our quarter-end open interest for our futures and options contracts (in thousands, except for percentages):
| | | | | | | | | | | | | | | | | |
| As of March 31, | | |
| 2024 | | 2023 | | Change |
| Open interest — in thousands of contracts: | | | | | |
| Energy futures and options | 57,751 | | | 47,511 | | | 22 | % |
| Agricultural and metals futures and options | 4,696 | | | 4,394 | | | 7 | |
| Financial futures and options | 26,206 | | | 21,891 | | | 20 | |
| Total | 88,653 | | | 73,796 | | | 20 | % |
| | | | | | | | | | | | | | | | | |
| As of June 30, | | |
| 2023 | | 2022 | | Change |
| Open interest — in thousands of contracts: | | | | | |
| Energy futures and options | 49,247 | | | 43,985 | | | 12 | % |
| Agricultural and metals futures and options | 4,182 | | | 3,519 | | | 19 | |
| Financial futures and options | 20,995 | | | 28,129 | | | (25) | |
| Total | 74,424 | | | 75,633 | | | (2) | % |
The following charts and tables present selected cash and equity options trading data. All trading volume below is presented as average net daily trading volume, or ADV, and is single counted:
| | | | | | | | | | | | | | | | | | | | | | | | | | | | | | | | | | | |
| Six Months Ended June 30, | | | | Three Months Ended June 30, | | |
| 2023 | | 2022 | | Change | | 2023 | | 2022 | | Change |
| NYSE cash equities (shares in millions): | | | | | | | | | | | |
| Total cash handled volume | 2,275 | | | 2,606 | | | (13) | % | | 2,169 | | | 2,591 | | | (16) | % |
| Total cash market share matched | 19.8 | % | | 20.1 | % | | (0.3 pts) | | 19.8 | % | | 20.2 | % | | (0.4 pts) |
| | | | | | | | | | | |
| NYSE equity options (contracts in thousands): | | | | | | | | | | | |
| NYSE equity options volume | 8,204 | | | 7,937 | | | 3 | % | | 7,701 | | | 7,647 | | | 1 | % |
| Total equity options volume | 40,839 | | | 38,350 | | | 6 | % | | 39,244 | | | 36,672 | | | 7 | % |
| NYSE share of total equity options | 20.1 | % | | 20.7 | % | | (0.6 pts) | | 19.6 | % | | 20.9 | % | | (1.3 pts) |
| | | | | | | | | | | |
| Revenue capture or rate per contract: | | | | | | | | | | | |
| Cash equities rate per contract (per 100 shares) | $0.048 | | $0.046 | | 4 | % | | $0.050 | | $0.047 | | 7 | % |
| Equity options rate per contract | $0.06 | | $0.05 | | 10 | % | | $0.06 | | $0.05 | | 20 | % |
| | | | | | | | | | | | | | | | | | | | | | | |
| Three Months Ended March 31, | | | | | | |
| 2024 | | 2023 | | Change | | | | | | |
| NYSE cash equities (shares in millions): | | | | | | | | | | | |
| Total cash handled volume | 2,438 | | | 2,381 | | | 2 | % | | | | | | |
| Total cash market share matched | 20.4 | % | | 19.8 | % | | 0.6 pts | | | | | | |
| NYSE equity options (contracts in thousands): | | | | | | | | | | | |
| NYSE equity options volume | 9,325 | | | 8,708 | | | 7 | % | | | | | | |
| Total equity options volume | 43,311 | | | 42,433 | | | 2 | % | | | | | | |
| NYSE share of total equity options | 21.5 | % | | 20.5 | % | | 1 pt | | | | | | |
| Revenue capture or rate per contract: | | | | | | | | | | | |
| Cash equities rate per contract (per 100 shares) | $0.048 | | $0.045 | | 5 | % | | | | | | |
| Equity options rate per contract | $0.05 | | $0.05 | | (4) | % | | | | | | |
Handled volume represents the total number of shares of equity securities, ETFs and crossing session activity internally matched on our exchanges or routed to and executed on an external market center. Matched volume represents the total number of shares of equity securities, ETFs and crossing session activity executed on our exchanges.
Transaction-Based Expenses
Our equities and equity options markets pay fees to the SEC pursuant to Section 31 of the Exchange Act. Section 31 fees are recorded on a gross basis as a component of transaction and clearing fee revenue. These Section 31 fees are assessed to recover the government’s costs of supervising and regulating the securities markets and professionals and are subject to change. We, in turn, collect corresponding activity assessment fees from member organizations clearing or settling trades on the equities and options exchanges, and recognize these amounts in our transaction and clearing revenues when invoiced. The activity assessment fees are designed to equal the Section 31 fees. As a result, activity
assessment fees and the corresponding Section 31 fees do not have an impact on our net income, although the timing of payment by us will vary from collections. Section 31 fees were $175$67 million and $174 million for the six months ended June 30, 2023 and 2022, respectively, and $56 million and $123$119 million for the three months ended June 30,March 31, 2024 and 2023, and 2022, respectively. The decrease in Section 31 fees during the three months ended June 30, 2023March 31, 2024 was primarily due to a decrease in rates. The fees we collect are included in cash at the time of receipt and we remit the amounts to the SEC semi-annuallytwice a year as required. The total amount is included in current liabilities and was $173$66 million as of June 30, 2023.March 31, 2024.
We make liquidity payments to cash and options trading customers, as well as routing charges made to other exchanges which are included in transaction-based expenses. We incur routing charges when we do not have the best bid or offer in the market for a security that a customer is trying to buy or sell on one of our securities exchanges. In that case, we route the customer’s order to the external market center that displays the best bid or offer. The external market center charges us a fee per share (denominated in tenths of a cent per share) for routing to its system. We record routing charges on a gross basis as a component of transaction and clearing fee revenue. Cash liquidity payments, routing and clearing fees were $849$444 million and $985 million for the six months ended June 30, 2023 and 2022, respectively, and $392 million and $476$457 million for the three months ended June 30,March 31, 2024 and 2023, and 2022, respectively.
Operating Expenses, Operating Income and Operating Margin
The following chart summarizes our Exchanges segment's operating expenses, operating income and operating margin (dollars in millions). See “—Consolidated Operating Expenses” below for a discussion of the significant changes in our operating expenses.
| | | | | | | | | | | | | | | | | | | | | | | | | | | | | | | | | | | |
| Exchanges Segment: | Six Months Ended June 30, | | | | Three Months Ended June 30, | | |
| 2023 | | 2022 | | Change | | 2023 | | 2022 | | Change |
| Operating expenses | $ | 631 | | | $ | 603 | | | 5 | % | | $ | 311 | | | $ | 304 | | | 2 | % |
Adjusted operating expenses(1) | $ | 581 | | | $ | 570 | | | 2 | % | | $ | 293 | | | $ | 287 | | | 2 | % |
| Operating income | $ | 1,559 | | | $ | 1,485 | | | 5 | % | | $ | 782 | | | $ | 701 | | | 12 | % |
Adjusted operating income(1) | $ | 1,609 | | | $ | 1,518 | | | 6 | % | | $ | 800 | | | $ | 718 | | | 11 | % |
| Operating margin | 71 | % | | 71 | % | | — | | | 72 | % | | 70 | % | | 2 pts |
Adjusted operating margin(1) | 73 | % | | 73 | % | | — | | | 73 | % | | 71 | % | | 2 pts |
| | | | | | | | | | | | | | | | | | | | | | | |
| Exchanges Segment: | Three Months Ended March 31, | | | | | | |
| 2024 | | 2023 | | Change | | | | | | |
| Operating expenses | $ | 326 | | | $ | 320 | | | 2 | % | | | | | | |
Adjusted operating expenses(1) | $ | 307 | | | $ | 288 | | | 6 | % | | | | | | |
| Operating income | $ | 897 | | | $ | 777 | | | 16 | % | | | | | | |
Adjusted operating income(1) | $ | 916 | | | $ | 809 | | | 13 | % | | | | | | |
| Operating margin | 73 | % | | 71 | % | | 2 pts | | | | | | |
Adjusted operating margin(1) | 75 | % | | 74 | % | | 1 pt | | | | | | |
(1) The adjusted figures exclude items that are not reflective of our ongoing core operations and business performance. These adjusted numbers are not calculated in accordance with U.S. GAAP. See “—Non-GAAP Financial Measures” below.
Fixed Income and Data Services Segment
The following charts and table present our selected statements of income data for our Fixed Income and Data Services segment (dollars in millions):
(1) The adjusted figures in the charts above are calculated by excluding items that are not reflective of our cash operations and core business performance. As a result, these adjusted numbers are not calculated in accordance with U.S. GAAP. See “—Non-GAAP Financial Measures” below.
| | Six Months Ended June 30, | | | | Three Months Ended June 30, | | |
| 2023 | | 2022 | | | Change | | 2023 | | 2022 | | | Change |
| Three Months Ended March 31, | |
| Three Months Ended March 31, | |
| Three Months Ended March 31, | |
| 2024 | |
| 2024 | |
| 2024 | |
| Revenues: | |
| Revenues: | |
| Revenues: | Revenues: | | | | | | | | | | | | | |
| Fixed income execution | Fixed income execution | $ | 60 | | | $ | 40 | | | | 51 | % | | $ | 28 | | | $ | 25 | | | | 17 | % |
| Fixed income execution | |
| Fixed income execution | |
| CDS clearing | |
| CDS clearing | |
| CDS clearing | CDS clearing | 185 | | | 138 | | | | 34 | | | 84 | | | 66 | | | | 26 | |
| Fixed income data and analytics | Fixed income data and analytics | 553 | | | 551 | | | | — | | | 277 | | | 274 | | | | 1 | |
| Fixed income data and analytics | |
| Fixed income data and analytics | |
| Fixed income and credit | |
| Fixed income and credit | |
| Fixed income and credit | Fixed income and credit | 798 | | | 729 | | | | 9 | | | 389 | | | 365 | | | | 6 | |
| Other data and network services | Other data and network services | 311 | | | 292 | | | | 7 | | | 157 | | | 147 | | | | 7 | |
| Other data and network services | |
| Other data and network services | |
| Revenues | Revenues | 1,109 | | | 1,021 | | | | 9 | | | 546 | | | 512 | | | | 7 | |
| Revenues | |
| Revenues | |
| Other operating expenses | |
| Other operating expenses | |
| Other operating expenses | Other operating expenses | 525 | | | 516 | | | | 2 | | | 267 | | | 252 | | | | 6 | |
| | Depreciation and amortization | Depreciation and amortization | 174 | | | 176 | | | | 1 | | | 89 | | | 86 | | | | 4 | |
| | Depreciation and amortization | |
| | Depreciation and amortization | |
| | Operating expenses | Operating expenses | 699 | | | 692 | | | | 1 | | | 356 | | | 338 | | | | 5 | |
| | Operating expenses | |
| | Operating expenses | |
| Operating income | |
| Operating income | |
| Operating income | Operating income | $ | 410 | | | $ | 329 | | | | 25 | % | | $ | 190 | | | $ | 174 | | | | 9 | % |
| | Recurring revenues | Recurring revenues | $ | 864 | | | $ | 843 | | | | 2 | % | | $ | 434 | | | $ | 421 | | | | 3 | % |
| | Recurring revenues | |
| | Recurring revenues | |
| Transaction revenues | Transaction revenues | $ | 245 | | | $ | 178 | | | | 38 | % | | $ | 112 | | | $ | 91 | | | | 23 | % |
| Transaction revenues | |
| Transaction revenues | |
In the table above, we consider fixed income data and analytics revenues and other data and network services revenues to be recurring revenues.
For both the six months ended June 30, 2023 and 2022, 12% of our Fixed Income and Data Services segment revenues were billed in pounds sterling or euros and for both the three months ended June 30,March 31, 2024 and 2023, and 2022, 12%11% of our Fixed Income and Data Services segment revenues were billed in pounds sterling or euros. As the pound sterling or euro exchange rate changes, the U.S. equivalent of revenues denominated in foreign currencies changes accordingly. Due to the fluctuations of the pound sterling and euro compared to the U.S. dollar, our Fixed Income and Data Services revenues were lower by $4 million for the six months ended June 30, 2023, and higher by $1$2 million for the three months ended June 30, 2023,March 31, 2024 than in the comparable periodsperiod in 2022.2023.
Fixed Income and Data Services Revenues
Our Fixed Income and Data Services revenues increased 9% and 7%1% for the six months and three months ended June 30, 2023, respectively,March 31, 2024 from the comparable periodsperiod in 2022. The increase in revenue was2023, primarily due to strength in our fixed income execution CDS clearing businessdata and analytics products and our other data and network services.
•Fixed Income Execution: Fixed income execution includes revenues from ICE Bonds. Execution fees are reported net of rebates, which were nominal$3 million for both the six months and three months ended June 30, 2023March 31, 2024 and 2022.nominal for the three months ended March 31, 2023. Our fixed income execution revenues increased 51% and 17%decreased 15% for the six months and three months ended June 30, 2023, respectively,March 31, 2024 from the comparable periodsperiod in 2022, due to increased activity2023, as a resulthigher revenues from corporate bond trading were offset by lower levels of continued interest rate volatility.U.S. treasury activity.
•CDS Clearing: CDS clearing revenues increased 34% and 26%decreased 8% for the six months and three months ended June 30, 2023, respectively,March 31, 2024 from the comparable periodsperiod in 2022.2023. The notional value of CDS cleared was $10.2$5.0 trillion and $13.6 trillion for the six months ended June 30, 2023 and 2022, respectively, and $3.4 trillion and $5.9$6.8 trillion for the three months ended June 30,March 31, 2024 and 2023, respectively, as elevated volatility and 2022, respectively. The increase in revenues was primarily due to net interest income on collateral balances.demand for credit protection benefited the first quarter of 2023.
•Fixed Income Data and Analytics: Our fixed income data and analytics revenues were flat for the six months ended June 30, 2023, and increased 1%4% for the three months ended June 30, 2023,March 31, 2024 from the comparable periodsperiod in 20222023 due to growth in our pricing and reference data business and strength in our index business in the second quarter of 2023.business.
•Other Data and Network Services: Our other data and network services revenues increased 7%4% for both the six months and three months ended June 30, 2023,March 31, 2024 from the comparable periodsperiod in 2022.2023. The increase in revenues was driven by growth in our ICE Global Network offering, coupled with strength in our desktop,consolidated feeds and derivatives analyticsstronger desktop revenues.
Annual Subscription Value, or ASV, represents, at a point in time, the data services revenues, which includesinclude Fixed Income Data and Analytics as well as other dataOther Data and network services,Network Services, subscribed for the succeeding 12 months. ASV does not include new sales, contract terminations or price changes that may occur during that 12-month period. However,
while it is an indicative forward-looking metric, it does not provide a precise growth forecast of the next 12 months of data services revenues. Management considers ASV metrics when making financial and operating decisions and believes ASV is useful for management and investors in understanding our data services business performance.
As of June 30, 2023,March 31, 2024, ASV was $1.724$1.786 billion, which increased 3.9%4.6% compared to the ASV as of June 30, 2022.March 31, 2023. ASV represents nearly 100% of total data services revenues for this segment. This does not adjust for year-over-year foreign exchange fluctuations.
Operating Expenses, Operating Income and Operating Margin
The following chart summarizes our Fixed Income and Data Services segment's operating expenses, operating income and operating margin (dollars in millions). See “—Consolidated Operating Expenses” below for a discussion of the significant changes in our operating expenses.
| | Fixed Income and Data Services Segment: | Fixed Income and Data Services Segment: | Six Months Ended June 30, | | Three Months Ended June 30, | | | |
| 2023 | | 2022 | | Change | | 2023 | | 2022 | | | Change |
| Fixed Income and Data Services Segment: | |
| Fixed Income and Data Services Segment: | |
| 2024 | |
| 2024 | |
| 2024 | |
| Operating expenses | |
| Operating expenses | |
| Operating expenses | Operating expenses | $ | 699 | | | $ | 692 | | | 1 | % | | $ | 356 | | | $ | 338 | | | | 5 | % |
Adjusted operating expenses(1) | Adjusted operating expenses(1) | $ | 614 | | | $ | 599 | | | 3 | % | | $ | 313 | | | $ | 294 | | | | 7 | % |
Adjusted operating expenses(1) | |
Adjusted operating expenses(1) | |
| Operating income | |
| Operating income | |
| Operating income | Operating income | $ | 410 | | | $ | 329 | | | 25 | % | | $ | 190 | | | $ | 174 | | | | 9 | % |
Adjusted operating income(1) | Adjusted operating income(1) | $ | 495 | | | $ | 422 | | | 17 | % | | $ | 233 | | | $ | 218 | | | | 7 | % |
Adjusted operating income(1) | |
Adjusted operating income(1) | |
| Operating margin | |
| Operating margin | |
| Operating margin | Operating margin | 37 | % | | 32 | % | | 5 pts | | 35 | % | | 34 | % | | | 1 pt |
Adjusted operating margin(1) | Adjusted operating margin(1) | 45 | % | | 41 | % | | 4 pts | | 43 | % | | 43 | % | | | — | |
Adjusted operating margin(1) | |
Adjusted operating margin(1) | |
(1) The adjusted figures exclude items that are not reflective of our ongoing core operations and business performance. These adjusted figures are not calculated in accordance with U.S. GAAP. See “—Non-GAAP Financial Measures” below.
Mortgage Technology Segment
The following charts and table present our selected statements of income data for our Mortgage Technology segment (dollars in millions):
(1) Servicing Software is a new revenue category following completion of the Black Knight acquisition.
(2) The adjusted figures in the charts above are calculated by excluding items that are not reflective of our cash operations and core business performance. As a result, these adjusted figures are not calculated in accordance with U.S. GAAP. See “—Non-GAAP Financial Measures” below.
| | Six Months Ended June 30, | | | | Three Months Ended June 30, | | |
| 2023 | | 2022 | | | Change | | 2023 | | 2022 | | | Change |
| Three Months Ended March 31, | |
| Three Months Ended March 31, | |
| Three Months Ended March 31, | |
| 2024 | |
| 2024 | |
| 2024 | |
| Revenues: | |
| Revenues: | |
| Revenues: | Revenues: | | | | | | | | | | | | | |
| Origination technology | Origination technology | $ | 337 | | | $ | 399 | | | | (15)% | | $ | 170 | | | $ | 196 | | | | (13)% |
| Origination technology | |
| Origination technology | |
| Closing solutions | Closing solutions | 87 | | | 138 | | | | (37) | | 47 | | | 66 | | | | (28) |
| Closing solutions | |
| Closing solutions | |
| Servicing software | |
| Servicing software | |
| Servicing software | |
| Data and analytics | Data and analytics | 45 | | | 44 | | | | 2 | | 24 | | | 24 | | | | (5) |
| Other | 16 | | | 23 | | | | (31) | | 8 | | | 11 | | | | (32) |
| Data and analytics | |
| Data and analytics | |
| | Revenues | |
| | Revenues | |
| | Revenues | Revenues | 485 | | | 604 | | | | (20) | | 249 | | | 297 | | | | (16) |
| Other operating expenses | Other operating expenses | 254 | | | 280 | | | | (9) | | 125 | | | 140 | | | | (11) |
| Other operating expenses | |
| Other operating expenses | |
| Depreciation and amortization | |
| Depreciation and amortization | |
| Depreciation and amortization | Depreciation and amortization | 230 | | | 216 | | | | 6 | | 116 | | | 110 | | | | 4 |
| Acquisition-related transaction and integration costs | Acquisition-related transaction and integration costs | 46 | | | 61 | | | | (24) | | 25 | | | 53 | | | | (53) |
| Acquisition-related transaction and integration costs | |
| Acquisition-related transaction and integration costs | |
| Operating expenses | Operating expenses | 530 | | | 557 | | | | (5) | | 266 | | | 303 | | | | (13) |
| Operating income/(loss) | $ | (45) | | | $ | 47 | | | | n/a | | $ | (17) | | | $ | (6) | | | | (158)% |
| Operating expenses | |
| Operating expenses | |
| Operating loss | |
| Operating loss | |
| Operating loss | |
| | Recurring revenues | |
| | Recurring revenues | |
| | Recurring revenues | Recurring revenues | $ | 329 | | | $ | 316 | | | | 4% | | $ | 164 | | | $ | 160 | | | | 2% |
| Transaction revenues | Transaction revenues | $ | 156 | | | $ | 288 | | | | (46)% | | $ | 85 | | | $ | 137 | | | | (38)% |
| Transaction revenues | |
| Transaction revenues | |
*Percentage changes in the table above deemed "n/a" are not meaningful.
In the table above, we consider subscription fee and certain other revenuesfees to be recurring revenues. Each revenue classification, above, contains a mix of recurring and transaction revenues, based on the various service offerings described in more detail, below.
Beginning in the first quarter of 2023, closing solutions revenues within our Mortgage Technology segment now include membership dues that were previously included in other revenues. We believe this is a more accurate reflection of the nature of these revenues. The impact of this change was not material, and the prior year periods have been adjusted for comparability.
Mortgage Technology Revenues
Our mortgage technology revenues are derived from our comprehensive, end-to-end U.S. residential mortgage platform. Our mortgage technology business is intended to enable greater workflow efficiency and mitigate risks for customers focused on originating U.S. residentialthroughout the mortgage loans.life cycle. Mortgage technology revenues decreased $119 million and $48increased $263 million for the six months and three months ended June 30, 2023, respectively,March 31, 2024 from the comparable periodsperiod in 20222023, primarily due to lower mortgage origination volumes driven by rising interest rates. See Note 6 of our consolidated financial statements in this Quarterly Report where discussed further.the Black Knight acquisition.
•Origination technology: Our origination technology revenues decreased 15% and 13%were flat during the six months and three months ended June 30, 2023, respectively,March 31, 2024 from the comparable periodsperiod in 2022, due to lower transaction-based revenues as mortgage origination volumes declined.2023. Our origination technology acts as a system of record for the mortgage transaction, automating the gathering, reviewing, and verifying of mortgage-related information and enabling automated enforcement of rules and business practices designed to help ensure that each completed loan transaction is of high quality and adheres to secondary market standards. These revenues are based on recurring Software as a Service, or SaaS, subscription fees, with an additive transaction-based or success-based pricing fee as lenders exceed the number of loans closed that are included with their monthly base subscription.subscription, as well as professional services.
In addition, the ICE Mortgage Technology network provides originators connectivity to the mortgage supply chain and facilitates the secure exchange of information between our customers and a broad ecosystem of third-party service providers, as well as lenders and investors that are critical to consummating the millions of loan transactions that occur on our origination network each year. Revenue from the ICE Mortgage Technology network is largely transaction-based.
•Closing solutions: Our closing solutions revenues decreased 37% and 28%increased 9% during the six months and three months ended June 30, 2023, respectively,March 31, 2024 from the comparable periodsperiod in 2022, due to lower mortgage origination volumes.2023, driven by increased market share and continued adoption of digital solutions. Our closing solutions connect key participants, such as lenders, title and settlement agents and individual county recorders, to digitize the closing and recording process. Closing solutions also include revenues from our MERSCORP Holdings, Inc., or MERS, database, which provides a system of record for recording and tracking changes, and servicing rights and beneficial ownership interests in loans secured by U.S. residential real estate. Revenues from closing solutions are largely transaction-based and are based on the volume of loans closed.
•Servicing software: Our servicing software revenues include integrated mortgage servicing solutions, which help automate all areas of the servicing process, from loan boarding to final payment or default, to help lower costs, reduce risk and improve financial performance. Our servicing solutions support first lien mortgages, home equity loans and lines of credit on a single platform to manage all servicing processes, including loan setup and maintenance, escrow administration, investor reporting, and regulatory requirements. We also provide solutions that provide consumers with access to customized, timely information about their mortgages and allow our clients’ customer service
representatives to access the same customer information, which is key to increasing borrower retention. Another servicing solution provides clients, third-party providers and their developers access to our growing catalog of application programming interfaces, or APIs, across the mortgage life cycle.
Our default servicing solutions help simplify the complex process for loans that move into default, while supporting servicers with their compliance requirements and to facilitate more efficient loss mitigation processes.
We also offer advanced technology to support the bankruptcy and foreclosure process, and more efficiently manage claims related to properties in foreclosure, as well as tools to support loss analysis, to help servicers make the right decisions at the right time.
•Data and Analyticsanalytics: Our dataData and analyticsAnalytics revenues increased 2% for the six months ended June 30, 2023, and revenues decreased 5%210% during the three months ended June 30, 2023,March 31, 2024 from the comparable periodsperiod in 2022,2023, primarily due to lower transaction-based revenues.the revenue contribution from Black Knight during the three months ended March 31, 2024. Revenues include those related to ICE Mortgage Technology’s Data & Document Automation and Mortgage Analyzer solutions, or Analyzer, (formerly known as AIQ), which offers customers greater efficiency by streamlining data collection and validation through our automated document recognition and data extraction capabilities. Analyzer revenues can be both recurring and transaction-based in nature. In addition, our data offerings include real-time industry and peer benchmarking tools, which provide originators a granular view into the real-time trends of nearly half the U.S. residential mortgage market.market, as well as credit and prepayment models, custom and proprietary analytics, valuation, and MLS solutions. We also provide a Data as a Service, or DaaS, offering through private data clouds for lenders and industry participants to access their ownindustry data and origination information. Revenues related to our data products are largely subscription-based and recurring in nature.
•Other: Other revenues decreased 31% The data and 32% during the six monthsinsights from these solutions inform, support and three months ended June 30, 2023, respectively, from the comparable periods in 2022, dueenhance our other solutions to lower professional serviceshelp lenders and servicers make more informed decisions, improve performance, identify and predict risk and generate more qualified leads. Revenues related to fewer new customer implementations. Other revenues include professional services fees, as well as revenues from ancillary products. Other revenues can be bothour data products are largely subscription-based and recurring and transaction-based in nature.
Operating Expenses, Operating Income/(Loss) and Operating Margin
The following chart summarizes our Mortgage Technology segment's operating expenses, operating income/(loss)loss and operating margin (dollars in millions). See “—Consolidated Operating Expenses” below for a discussion of the significant changes in our operating expenses.
| | | | | | | | | | | | | | | | | | | | | | | | | | | | | | | | | | | | | |
| Mortgage Technology Segment: | Six Months Ended June 30, | | | | | Three Months Ended June 30, | | | |
| 2023 | | 2022 | | | Change* | | 2023 | | 2022 | | | Change |
| Operating expenses | $ | 530 | | | $ | 557 | | | | (5)% | | $ | 266 | | | $ | 303 | | | | (13)% |
Adjusted operating expenses(1) | $ | 301 | | | $ | 317 | | | | (5)% | | $ | 150 | | | $ | 159 | | | | (7)% |
| Operating income/(loss) | $ | (45) | | | $ | 47 | | | | n/a | | $ | (17) | | | $ | (6) | | | | (158)% |
Adjusted operating income(1) | $ | 184 | | | $ | 287 | | | | (36)% | | $ | 99 | | | $ | 138 | | | | (28)% |
| Operating margin | (9) | % | | 8 | % | | | (17 pts) | | (7) | % | | (2) | % | | | (5 pts) |
Adjusted operating margin(1) | 38 | % | | 47 | % | | | (9 pts) | | 40 | % | | 46 | % | | | (6 pts) |
| | | | | | | | | | | | | |
*Percentage changes in the table above deemed "n/a" are not meaningful.
| | | | | | | | | | | | | | | | | | | | | | | | | |
| Mortgage Technology Segment: | Three Months Ended March 31, | | | | | | | | |
| 2024 | | 2023 | | | Change | | | | | | | |
| Operating expenses | $ | 547 | | | $ | 264 | | | | 107% | | | | | | | |
Adjusted operating expenses(1) | $ | 314 | | | $ | 151 | | | | 107% | | | | | | | |
| Operating loss | $ | (48) | | | $ | (28) | | | | 71% | | | | | | | |
Adjusted operating income(1) | $ | 185 | | | $ | 85 | | | | 118% | | | | | | | |
| Operating margin | (10) | % | | (12) | % | | | 2 pts | | | | | | | |
Adjusted operating margin(1) | 37 | % | | 36 | % | | | 1 pt | | | | | | | |
| | | | | | | | | | | | | |
(1) The adjusted figures exclude items that are not reflective of our ongoing core operations and business performance. These adjusted numbers are not calculated in accordance with GAAP. See “—Non-GAAP Financial Measures”
Consolidated Operating Expenses
The following presents our consolidated operating expenses (dollars in millions):
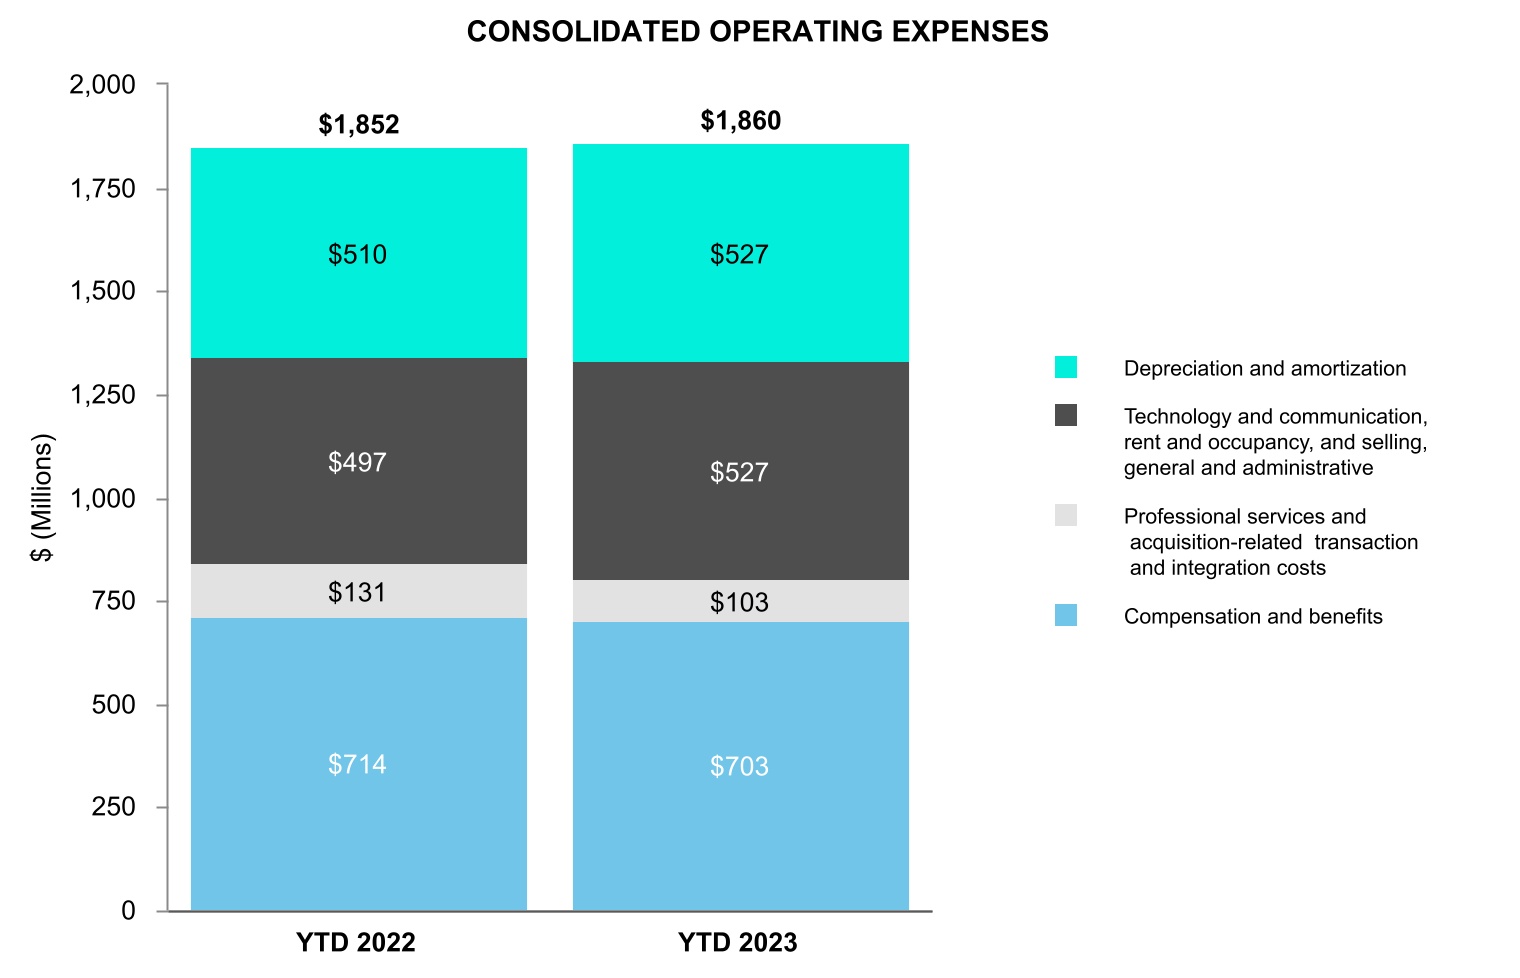
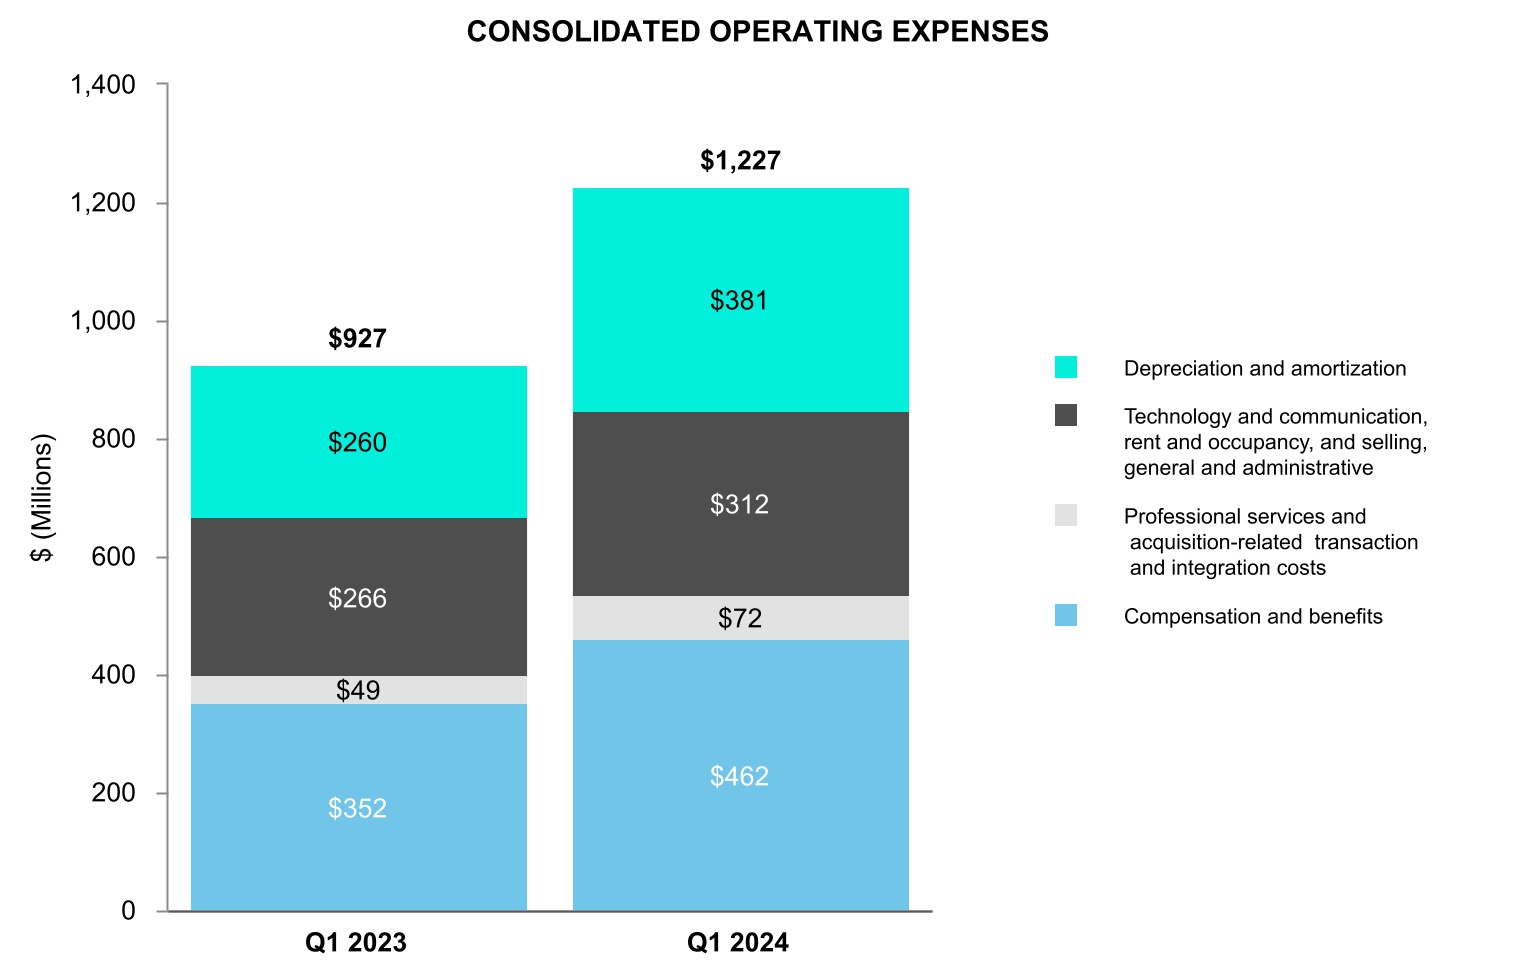
| | Six Months Ended June 30, | | | | Three Months Ended June 30, | | | |
| 2023 | | 2022 | | | Change | | 2023 | | 2022 | | | Change |
| Three Months Ended March 31, | |
| Three Months Ended March 31, | |
| Three Months Ended March 31, | |
| 2024 | |
| 2024 | |
| 2024 | |
| Compensation and benefits | |
| Compensation and benefits | |
| Compensation and benefits | Compensation and benefits | $ | 703 | | | $ | 714 | | | | (2) | % | | $ | 351 | | | $ | 355 | | | | (1) | % |
| Professional services | Professional services | 57 | | | 69 | | | | (17) | | | 29 | | | 35 | | | | (16) | |
| Professional services | |
| Professional services | |
| Acquisition-related transaction and integration costs | |
| Acquisition-related transaction and integration costs | |
| Acquisition-related transaction and integration costs | Acquisition-related transaction and integration costs | 46 | | | 62 | | | | (26) | | | 25 | | | 53 | | | | (53) | |
| Technology and communication | Technology and communication | 345 | | | 344 | | | | — | | | 173 | | | 169 | | | | 2 | |
| Technology and communication | |
| Technology and communication | |
| Rent and occupancy | |
| Rent and occupancy | |
| Rent and occupancy | Rent and occupancy | 45 | | | 41 | | | | 9 | | | 25 | | | 20 | | | | 21 | |
| Selling, general and administrative | Selling, general and administrative | 137 | | | 112 | | | | 22 | | | 63 | | | 57 | | | | 11 | |
| Selling, general and administrative | |
| Selling, general and administrative | |
| Depreciation and amortization | |
| Depreciation and amortization | |
| Depreciation and amortization | Depreciation and amortization | 527 | | | 510 | | | | 3 | | | 267 | | | 256 | | | | 4 | |
| Total operating expenses | Total operating expenses | $ | 1,860 | | | $ | 1,852 | | | | — | % | | $ | 933 | | | $ | 945 | | | | (1) | % |
| Total operating expenses | |
| Total operating expenses | |
The majority of our operating expenses do not vary directly with changes in our volume and revenues, except for certain technology and communication expenses, including data acquisition costs, licensing and other fee-related arrangements and a portion of our compensation expense that is tied directly to our data sales or overall financial performance.
We expect our operating expenses to increase in absolute terms in future periods in connection with the growth of our business, and to vary from year-to-year based on the type and level of our acquisitions, integration of acquisitions and other investments.
Included in the six months ended June 30, 2023 and 2022, 9% and 10%, respectively, of ourtotal consolidated operating expenses were billed in pounds sterling or euros, and for the three months ended June 30,March 31, 2024 was $288 million related to Black Knight.
For the three months ended March 31, 2024 and 2023, 7% and 2022, 9% and 10%, respectively, of our operating expenses were billed in pounds sterling or euros. Due to fluctuations in the U.S. dollar compared to the pound
sterling and euro, our consolidated operating expenses were lowerhigher by $8$3 million for the six months ended June 30, 2023, and were flat for the three months ended June 30, 2023,March 31, 2024 than in the comparable periodsperiod in 2022. See Item 3 “—Quantitative and Qualitative Disclosures About Market Risk —Foreign Currency Exchange Rate Risk” below for additional information.2023.
Compensation and Benefits Expenses
Compensation and benefits expense is our most significant operating expense and includes non-capitalized employee wages, bonuses, non-cash or stock compensation, certain severance costs, benefits and employer taxes. The bonus componentand stock compensation components of our compensation and benefits expense is based on both our financial performance and individual employee performance. The performance-based restricted stock compensation expense is also based on our financial performance. Therefore, our compensation and benefits expense will vary year-to-year based on our financial performance and fluctuations in our number of employees. The below chart summarizes the significant drivers of our compensation and benefits expense results for the periods presented (dollars in millions, except employee headcount).
| | Six Months Ended June 30, | | | | Three Months Ended June 30, | | | |
| 2023 | | 2022 | | | Change | | 2023 | | 2022 | | | Change |
| Three Months Ended March 31, | |
| Three Months Ended March 31, | |
| Three Months Ended March 31, | |
| 2024 | |
| 2024 | |
| 2024 | |
| Employee headcount | |
| Employee headcount | |
| Employee headcount | Employee headcount | 9,116 | | | 8,936 | | | | 2 | % | | | | | | | |
| Stock-based compensation expenses | Stock-based compensation expenses | $ | 83 | | | $ | 73 | | | | 14 | % | | $ | 43 | | | $ | 36 | | | | 18 | % |
| Stock-based compensation expenses | |
| Stock-based compensation expenses | |
Employee headcount increased during the three months ended March 31, 2024 from the comparable period in 2023 primarily due to our acquisition of Black Knight. Compensation and benefits expense decreased $11 million and $4increased $110 million for the six months and three months ended June 30, 2023, respectively,March 31, 2024 from the comparable periodsperiod in 2022,2023, primarily due to lower payroll and employee benefit expenses$108 million attributable to our acquisition of Black Knight and higher capitalized labor,payroll from the impact of prior year merit increases, partially offset by an increase in our bonus and noncash performance-based restricted stock compensation accruals and annual merit increases.higher capitalized labor. The stock-based compensation expenses in the table above relate to employee stock option and restricted stock awards and exclude stock-based compensation related to acquisition-related transaction and integration costs.
Professional Services Expenses
Professional services expense includes fees for consulting services received on strategic and technology initiatives, temporary labor, as well as regulatory, legal and accounting fees, and may fluctuate as a result of changes in our use of these services in our business.
Professional services expenses decreased $12 million and $6increased $8 million for the six months and three months ended June 30, 2023, respectively,March 31, 2024 from the comparable periodsperiod in 2022,2023, primarily due to lowerour acquisition of Black Knight combined with increases in consulting expenses related to bringing certain mortgage technology-related costs in-house.and legal expenses.
Acquisition-Related Transaction and Integration Costs
We incurred $46 million and $25$36 million in acquisition-related transaction and integration costs during the six months and three months ended June 30,March 31, 2024 primarily due to integration expenses related to Black Knight. We incurred $21 million in acquisition-related transaction costs during the three months ended March 31, 2023, respectively, primarily due to legal and consulting expenses related to our pending acquisition of Black Knight and our integration of Ellie Mae, Inc., or Ellie Mae. We incurred $62 million and $53 million in acquisition-related transaction costs during the six months and three months ended June 30, 2022, respectively, primarily due to legal and consulting expenses related to our pending acquisition of Black Knight and our integration of Ellie Mae.
We expect to continue to explore and pursue various potential acquisitions and other strategic opportunities to strengthen our competitive position and support our growth. As a result, we may incur acquisition-related transaction costs in future periods.
Technology and Communication Expenses
Technology support services consist of costs for running our wholly-owned data centers, hosting costs paid to third-party data centers and maintenance of our computer hardware and software required to support our technology and cybersecurity. These costs are driven by system capacity, functionality and redundancy requirements. Communication expenses consist of costs or network connections for our electronic platforms and telecommunications costs.
Technology and communications expense also includes fees paid for access to external market data, licensing and other fee agreement expenses. Technology and communications expenses may be impacted by growth in electronic contract volume, our capacity requirements, changes in the number of telecommunications hubs and connections with customers to access our electronic platforms directly.
Technology and communications expenses increased $1 million and $4$33 million for the six months and three months ended June 30, 2023 respectively,March 31, 2024 from the comparable periodsperiod in 2022,2023 primarily due to an increase in hardware and software support costs which was partially offset by a decrease inmainly at Black Knight and license expense.
Rent and Occupancy Expenses
Rent and occupancy expense relates to leased and owned property and includes rent, maintenance, real estate taxes, utilities and other related costs. We have significant operations located in the U.S., U.K., and India, with smaller offices located throughout the world.
Rent and occupancy expenses increased $4 million and $5$9 million for the six months and three months ended June 30, 2023, respectively,March 31, 2024 from the comparable periodsperiod in 2022,2023 primarily due to higher costs$7 million of duplicate rent expenses related to rent, lease termination charges, utilities, repairsour new London and maintenance as more employees returnedNew York leased offices and increases attributable to the office.Black Knight locations.
Selling, General and Administrative Expenses
Selling, general and administrative expenses include marketing, advertising, public relations, insurance, bank service charges, dues and subscriptions, travel and entertainment, non-income taxes and other general and administrative costs.
Selling, general and administrative expenses increased $25$4 million for the sixthree months ended June 30, 2023,March 31, 2024, from the comparable period in 20222023 primarily due to payments$10 million related to listings customer acquisition costs from higher IPO activity, $5 million related to increased marketing expenses and increases in other underlying costs, including travel and entertainment. This was partially offset by $6 million of expense for claims made following a NYSE system outage and a $10 million regulatory matter expense that both occurred in January 2023, accruals related to potential regulatory settlements of $11 million and increased bad debt expenses, partially offset by lower marketing costs.
Selling, general and administrative expenses increased $6 million forduring the three months ended June 30, 2023, from the comparable period in 2022 primarily due to an increase in bad debt expense. This was partially offset by lower travel and entertainment expenses and lower marketing costs.March 31, 2023.
Depreciation and Amortization Expenses
Depreciation and amortization expense results from depreciation of long-lived assets such as buildings, leasehold improvements, aircraft, hardware and networking equipment, purchased software, internally-developed software, furniture, fixtures and equipment over their estimated useful lives. This expense includes amortization of intangible assets obtained in our acquisitions of businesses as well as on various licensing agreements, over their estimated useful lives. Intangible assets subject to amortization consist primarily of customer relationships, trading products with finite livestechnology, data & databases and technology. This expense also includes amortization of internally-developed and purchased software over its estimated useful life.trademarks & trade names.
We recorded amortization expenses on intangible assets acquired as part of our acquisitions, as well as on other intangible assets of $301$254 million, inclusive of a $3 million impairment of a developed technology intangible asset, and $306 million for the six months ended June 30, 2023 and 2022, respectively and $151 million and $153$150 million for the three months ended June 30,March 31, 2024 and 2023, and 2022, respectively. During the three months ended March 31, 2024, $105 million of amortization expense was related to intangible assets acquired in connection with the Black Knight acquisition.
We recorded depreciation expenses on our fixed assets of $226$127 million and $204 million for the six months ended June 30, 2023 and 2022, respectively, and $116 million and $103$110 million for the three months ended June 30,March 31, 2024 and 2023, and 2022, respectively. This increase was primarily due to an increase$6 million related to Black Knight and increases in internally developed software assets in our Mortgage Technology segment.and leasehold improvements.
Consolidated Non-Operating Income/(Expense)
Income and expenses incurred through activities outside of our core operations are considered non-operating. The following tables present our non-operating income/(expenses) (dollars in millions):
| | Six Months Ended June 30, | | | | Three Months Ended June 30, | | | |
| 2023 | | 2022 | | | Change* | | 2023 | | 2022 | | | Change |
| Three Months Ended March 31, | |
| Three Months Ended March 31, | |
| Three Months Ended March 31, | |
| 2024 | |
| 2024 | |
| 2024 | |
| Other income/(expense): | |
| Other income/(expense): | |
| Other income/(expense): | Other income/(expense): | | | | | | | | | | | | | |
| Interest income | Interest income | $ | 193 | | | $ | 9 | | | | n/a | | $ | 102 | | | $ | 8 | | | | n/a |
| Interest income | |
| Interest income | |
| Interest expense | Interest expense | (351) | | | (264) | | | | 33 | | (175) | | | (161) | | | | 8 |
| Other expense, net | (70) | | | (35) | | | | 101 | | (35) | | | 23 | | | | n/a |
| Interest expense | |
| Interest expense | |
| Other income/(expense), net | |
| Other income/(expense), net | |
| Other income/(expense), net | |
| Total other income/(expense), net | |
| Total other income/(expense), net | |
| Total other income/(expense), net | Total other income/(expense), net | $ | (228) | | | $ | (290) | | | | (21)% | | $ | (108) | | | $ | (130) | | | | (16)% |
| Net income attributable to non-controlling interest | Net income attributable to non-controlling interest | $ | (35) | | | $ | (21) | | | | 65% | | $ | (16) | | | $ | (11) | | | | 53% |
| Net income attributable to non-controlling interest | |
| Net income attributable to non-controlling interest | |
*Percentage changes in the table above deemed "n/a" are not meaningful.
Interest Income
Interest income increaseddecreased during the six months and three months ended June 30, 2023March 31, 2024 from the same periodsperiod in 20222023 primarily due to an increase in short-term interest rates combined with largerdecreased investment balances. Interest income primarily represents interest income on our short-term investments, and forbalances following the six months andBlack Knight acquisition. For the three months ended June 30,March 31, 2023, included $124we earned $69 million and $62 million, respectively, in interest income recorded in connection with the short-term investments related to the $5.0 billion of senior notes issued in connection with, and the SMR Notes (as defined in "Liquidity and Capital Resources—Debt")operating cash accumulated for, the Black Knight acquisition. The remainderIn addition, our clearing houses also earned interest income of the increase primarily relates to interest on the restricted cash and restricted investment balances held within our regulated entities.
Interest Expense
We recognized interest expense of $351$23 million and $264 million during the six months ended June 30, 2023 and 2022, respectively, and $175 million and $161$19 million during the three months ended June 30,March 31, 2024 and 2023, respectively. The remainder primarily relates to interest earned on various unrestricted and 2022, respectively. restricted cash balances held within our group entities.
Interest expense for the six months and three months ended June 30, 2023 primarily represents interestExpense
Interest expense on our outstanding debt. Interest expensedebt increased during$65 million for the six months and three months ended June 30, 2023,March 31, 2024 as compared to the same period in 2023. During the three months ended March 31, 2024 we recognized $112 million and $56 million, respectively, additionalincurred an incremental increase in interest expense of $52 million on the $4.9 billionborrowings under our Commercial Paper program and Term Loan (each as defined in “—Liquidity and Capital Resources—Debt”), both of net proceeds from the SMR Notes held forwhich partially funded the Black Knight acquisition following our May 2022 debt refinancing. See "-Debt" below.acquisition. We also incurred interest expense of $13 million on the $1.0 billion of senior notes assumed as part of the Black Knight acquisition.
Other Expense,Income/(Expense), net
Our equity method investments include OCC and Bakkt, among others. We recognized $65$42 million and $57 million during the six months ended June 30, 2023 and 2022, respectively, and $30 million and $15$35 million during the three months ended June 30,March 31, 2024 and 2023, and 2022, respectively, of our share of estimated equity method investment losses, net, which is included in other expense, net. The estimated losses for both the six months and three months ended June 30,March 31, 2024 and 2023 and June 30, 2022 are primarily related to our investment in Bakkt, partially offset by our share of net profits of OCC. Both the sixthree month periods ended June 30,March 31, 2024 and 2023 and 2022 include adjustments to reflect the difference between reported prior period actual results from our original estimates.
During the six months ended June 30, 2022, we recorded $9 million for a legal settlement, which is included in other expense.
On May 20, 2022, we completed the sale of our Euroclear stake. The carrying value of our investment was $700 million at the time of the sale. We recorded a net gain of $41 million on the sale, which is included in other income during the six months and three months ended June 30, 2022.March 31, 2024, we recorded a fair value loss of $3 million on our equity investments that do not have readily determinable fair values.
During the three months ended March 31, 2024, we recorded a gain of $160 million related to the PennyMac arbitration final award payment.
We incurred foreign currency transaction losses of $5$4 million and $9$1 million for the six months ended June 30, 2023 and 2022, respectively, and $4 million for both the three months ended June 30,March 31, 2024 and 2023, and 2022,respectively, primarily attributable to the fluctuations of the pound sterling and euro relative to the U.S. dollar. Foreign currency transaction gains/(losses)gains and losses are recorded in other income/(expense), net, when the settlement of foreign currency assets, liabilities and payables occur in non-functional currencies and there is an increase or decrease in the period-end foreign currency exchange rates between periods. See Item 3 “—Quantitative and Qualitative Disclosures About Market Risk—Foreign Currency Exchange Rate Risk” included elsewhere in this Quarterly Report for more information on these items.
Non-controlling Interest
For consolidated subsidiaries in which our ownership is less than 100%, and for which we have control over the assets, liabilities and management of the entity, the outside stockholders’ interests are shown as non-controlling interests. As of June 30, 2023,March 31, 2024, our non-controlling interests included those related to the non-ICE limited partners' interest in our CDS clearing subsidiaries, and non-controlling interests in ICE Futures Abu Dhabi.
Consolidated Income Tax Provision
Consolidated income tax expense was $207$181 million and $338 million for the six months ended June 30, 2023 and 2022, respectively, and $32 million and $173$175 million for the three months ended June 30,March 31, 2024 and 2023, and June 30, 2022, respectively. The change in consolidated income tax expense between periods is primarily due to the tax impact of changes in our pre-tax income and the changes in our effective tax rate each period.
Our effective tax rate was 12%19% and 22% for the six months ended June 30, 2023 and 2022, respectively, and 4% and 23%21% for the three months ended June 30,March 31, 2024 and 2023, and June 30, 2022, respectively. The effective tax ratesrate for the six months and three months ended June 30, 2023 wereMarch 31, 2024 was lower than the effective tax ratesrate for the comparable periodsperiod in 20222023 primarily due to the tax benefits resulting from favorable audit settlements for prior years, deferred and currentincome tax benefits from state apportionment changes and the application of the high-tax exception to the Global Intangible Low-Taxed Income, or GILTI, in the current period, partially offset by the impact of the U.K. corporate income tax increase from 19% to 25% effective April 1, 2023.
In conjunction with the increase in the U.K. corporate income tax rate we intendincrease to elect25% effective for the GILTI high-tax exception electionfull year in 2023. During2024, the net effect of which was greater than the impact of favorable audit settlements for certain historical periods during the three months ended March 31, 2023.
The OECD Pillar Two minimum tax rules, which generally provide for a minimum effective tax rate of 15%, are intended to apply to tax years beginning in 2024. The European Union member states and many other countries, including the U.K., our most significant non-U.S. jurisdiction, have committed to implement or have already enacted legislation adopting the Pillar Two rules. In July 2023, the U.K. enacted the U.K. Finance Act 2023, effective as of January 1, 2024, which included provisions to implement certain portions of the Pillar Two minimum tax rules and included an election to apply a transitional safe harbor to extend certain effective dates to accounting periods ending on or before June 30, 2023, our tax provision includes the impacts of this election, which resulted in a reduction in our GILTI inclusions. Our unrecognized tax benefit as of June 30, 2023 was $240 million, a $7 million net decrease from the $247 million as of December 31, 2022. The net decrease includes a $40 million reduction as a result of audit settlements, a $20 million increase related to current year positions, a $31 million increase related to prior year positions, and an $18 million reduction related to prior year positions.
In August 2022, the Inflation Reduction Act of 2022, or IRA, was signed into law.The IRA introduced a 15% corporation minimum tax, or CAMT, on adjusted financial statement income for corporations with profits in excess of $1 billion, effective for tax years after December 31, 2022.Based on the current guidance provided by the Internal Revenue Service and Department of the Treasury, the implementation of the CAMT2028. These new U.K. Pillar Two rules did not have a material impact on our financial statementsincome tax provision as of June 30, 2023.
The IRA also includes a share buyback excise tax of 1% on share repurchases, which will apply to net share repurchases after DecemberMarch 31, 2022.During the six months ended June 30, 2023, we did not repurchase any shares, therefore, we were not subject to any excise tax.The newly imposed excise tax on share repurchases is not considered an income tax.Any excise tax, as a result of future share repurchases, will be considered part of the cost of the shares repurchased and reflected in the equity section of our consolidated financial statements.2024.
Foreign Currency Exchange Rate Impact
As an international business, our financial statements are impacted by changes in foreign currency exchange rates. Our exposure to foreign denominated earnings for the three months ended March 31, 2024 is presented by primary foreign currency in the following table (dollars in millions, except exchange rates):
| | | | | | | | | | | | | | | | | | | | | | | | | | | |
| | Three Months Ended March 31, 2024 | | | | | | | | | | |
| | Pound Sterling | | Euro | | | | | | | | | | | | | | | | |
| Average exchange rate to the U.S. dollar in the current year period | 1.2683 | | | 1.0859 | | | | | | | | | | | | | | | | | |
| Average exchange rate to the U.S. dollar in the same period in the prior year | 1.2150 | | | 1.0730 | | | | | | | | | | | | | | | | | |
| Average exchange rate increase/(decrease) | 4 | % | | 1 | % | | | | | | | | | | | | | | | | |
| Foreign denominated percentage of: | | | | | | | | | | | | | | | | | | | |
| Revenues, less transaction-based expenses | 7 | % | | 8 | % | | | | | | | | | | | | | | | | |
| Operating expenses | 6 | % | | 1 | % | | | | | | | | | | | | | | | | |
| Operating income | 9 | % | | 15 | % | | | | | | | | | | | | | | | | |
Impact of the currency fluctuations(1) on: | | | | | | | | | | | | | | | | | | | |
| Revenues, less transaction-based expenses | $ | 7 | | | $ | 2 | | | | | | | | | | | | | | | | | |
| Operating expenses | $ | 3 | | | $ | — | | | | | | | | | | | | | | | | | |
| Operating income | $ | 4 | | | $ | 2 | | | | | | | | | | | | | | | | | |
(1) Represents the impact of currency fluctuation for the three months ended March 31, 2024 compared to the same periods in the prior year.
During the three months ended March 31, 2024, 15% and 7% our consolidated revenues, less transaction-based expenses, and consolidated operating expenses were denominated in pounds sterling or euros, respectively. As the pound sterling or euro exchange rate changes, the U.S. equivalent of revenues and expenses denominated in foreign currencies changes accordingly.
Liquidity and Capital Resources
Below are charts that reflect our outstanding debt and capital allocation. The acquisition and integration costs in the chart below include cash paid for acquisitions, net of cash received for divestitures, cash paid for equity and equity method investments cash paid for non-controlling interest and redeemable non-controlling interest, and acquisition-related transaction and integration costs in each period.
We have financed our operations, growth and cash needs primarily through income from operations and borrowings under our various debt facilities. Our principal capital requirements have been to fund capital expenditures, working capital, strategic acquisitions and investments, stock repurchases, dividends and the development of our technology platforms. We believe that our cash on hand and cash flows from operations will be sufficient to repay our outstanding debt, but we
may also need to incur additional debt or issue additional equity securities in the future. See “- Future Capital Requirements” below.
See “– Cash Flow” below for a discussion of our capital expenditures and capitalized software development costs.
Consolidated cash and cash equivalents were $2.9 billion$863 million and $1.8 billion$899 million as of June 30, 2023March 31, 2024 and December 31, 2022,2023, respectively. We had $5.6$1.5 billion and $6.6 billion$871 million in short-term and long-term restricted cash and cash equivalents as of June 30, 2023March 31, 2024 and December 31, 2022,2023, respectively. We had $86.9$62 million and $680 million in restricted short-term and long-term investments as of March 31, 2024 and December 31, 2023, respectively. We had $74.1 billion and $142.0$79.0 billion of cash and cash equivalent margin deposits and guaranty funds as of June 30, 2023March 31, 2024 and December 31, 2022,2023, respectively.
As of June 30, 2023,March 31, 2024, the amount of unrestricted cash held by our non-U.S. subsidiaries was $460$427 million. Due to the application of GILTIGlobal Intangible Low-Taxed Income as of January 1, 2018, the majority of our foreign earnings as of December 31, 2022 have been subject to immediate U.S. income taxation and can be distributed to the U.S. in the future with no material additional U.S. income tax consequences. As we decidedWe intend to makeapply the GILTI high-taxhigh tax exception electionto Global Intangible Low-Taxed Income in the current period,2023 and 2024, thus the majority of our foreign earnings in 2023 and 2024 are not expected to be
subject to immediate U.S. income taxation; however, thesetaxation. These foreign earnings can also generally be distributed to the U.S. with no additional material U.S. income tax consequences.consequences, primarily due to the availability of dividend received deductions.
Our cash and cash equivalents and financial investments are managed as a global treasury portfolio of non-speculative financial instruments that are readily convertible into cash, such as overnight deposits, term deposits, money market funds, mutual funds for treasury investments, short duration fixed income investments and other money market instruments, thus ensuring high liquidity of financial assets. We may invest a portion of our cash in excess of short-term operating needs in investment-grade marketable debt securities, including government or government-sponsored agencies and corporate debt securities.
Cash Flow
The following table presents the major components of net changes in cash and cash equivalents, and restricted cash and cash equivalents (in millions):
| | Six Months Ended June 30, | |
| 2023 | | 2022 | |
| Three Months Ended March 31, | |
| | Three Months Ended March 31, | |
| | 2024 | |
| 2024 | |
| Net cash provided by/(used in): | |
| Net cash provided by/(used in): | |
| Net cash provided by/(used in): | Net cash provided by/(used in): | | | | |
| Operating activities | Operating activities | $ | 1,805 | | | $ | 1,725 | | |
| Operating activities | |
| Operating activities | |
| Investing activities | |
| Investing activities | |
| Investing activities | Investing activities | 1,144 | | | 2,843 | | |
| Financing activities | Financing activities | (57,886) | | | 19,238 | | |
| Financing activities | |
| Financing activities | |
| Effect of exchange rate changes | Effect of exchange rate changes | 6 | | | (19) | | |
| Net increase/(decrease) in cash and cash equivalents, restricted cash and cash equivalents, and cash and cash equivalent margin deposits and guaranty funds | $ | (54,931) | | | $ | 23,787 | | |
| Effect of exchange rate changes | |
| Effect of exchange rate changes | |
| Net decrease in cash and cash equivalents, restricted cash and cash equivalents, and cash and cash equivalent margin deposits and guaranty funds | |
| Net decrease in cash and cash equivalents, restricted cash and cash equivalents, and cash and cash equivalent margin deposits and guaranty funds | |
| Net decrease in cash and cash equivalents, restricted cash and cash equivalents, and cash and cash equivalent margin deposits and guaranty funds | |
Operating Activities
Net cash provided by operating activities primarily consists of net income adjusted for certain items, including depreciation and amortization, deferred taxes, stock based compensation and the effects of changes in working capital.
The $80$356 million increase in net cash provided by operating activities during the sixthree months ended June 30, 2023March 31, 2024 from the comparable period in 20222023 was primarily driven by an increase in net income, which includes the $160 million gain related to the PennyMac arbitration final award payment, adjusted for depreciation and to a lesser extent, the gain on our sale of our Euroclear investment during the six months ended June 30, 2022.amortization and an increase in working capital. The remaining fluctuations areincreases in working capital were primarily driven by increased accounts receivable collections and lower Section 31 fees payable due to the rate changes in our working capital anddetermined by the SEC, offset primarily by timing of various payments such as lower Section 31 fee payments of $165 million.and receipts.
Investing Activities
Consolidated net cash provided by investing activities for the sixthree months ended June 30, 2023March 31, 2024 primarily relates to $3.1 billion$702 million in proceeds from the sale of restricted investments, $230 million in proceeds from sales of invested margin deposits and $75 million in proceeds from the sale of the Promissory Note, partially offset by $949 million of purchases of investments, $771$536 million of purchases of invested margin deposits, $61$64 million of purchases of restricted investments, $58 million of capital expenditures and $142$87 million of capitalized software development costs.
Consolidated net cash provided by investing activities for the sixthree months ended June 30, 2022March 31, 2023 primarily relates to $3.8$2.6 billion in proceeds from the sale of invested margin deposits, and $741 million in proceeds from the sale of our Euroclear investment, partially offset by $1.4 billion$463 million of purchases of invested margin deposits, $70$21 million of capital expenditures and $134$64 million of capitalized software development costs.
The capital expenditures primarily relate to hardware and software purchases to continue the development and expansion of our electronic platforms, data services and clearing houses, and leasehold improvements. The software development
expenditures primarily relate to the development and expansion of our electronic trading platforms, data services, mortgage services and clearing houses.
Financing Activities
Consolidated net cash used in financing activities for the sixthree months ended June 30,March 31, 2024 primarily relates to a decrease in our cash and cash equivalent margin deposits and guaranty fund balances of $4.6 billion, $600 million in repayments on our debt facilities, $258 million in dividend payments to stockholders, $71 million in cash payments related to treasury shares received for restricted stock tax payments and stock option exercises and $38 million in net repayments under our Commercial Paper Program.
Consolidated net cash used in financing activities for the three months ended March 31, 2023 primarily relates to a decrease in our cash and cash equivalent margin deposits and guaranty fund balances of $57.4$42.1 billion due to lower commodity prices and reduced volatility, $472$236 million in dividend payments to stockholders and $50 million in cash payments related to treasury shares received for restricted stock tax payments and stock option exercises.
Consolidated net cash provided by financing activities for the six months ended June 30, 2022 primarily relates to an increase in our cash and cash equivalent margin deposits and guaranty fund balances of $16.2 billion due to increased volatility and $5.2 billion in net proceeds from our debt facilities, partially offset by $1.0 billion in net repayments under our Commercial Paper Program, $632 million in repurchases of our common stock, $427 million in dividend payments to stockholders and $71$49 million in cash payments related to treasury shares received for restricted stock tax payments and stock option exercises.
Debt
As of June 30, 2023,March 31, 2024, we had $18.1$22.0 billion in outstanding debt, allconsisting of which related to our$19.1 billion of unsecured senior notes, with$1.9 billion under our Commercial Paper Program and $1.0 billion under our Term Loan. Our senior notes of $19.1 billion have a weighted average maturity of 1615 years and a weighted average cost of 3.6% per annum. We did not have anyOur commercial paper notes outstandinghad original maturities ranging from 4 to 45 days as of June 30, 2023. As of DecemberMarch 31, 2022, we had $18.1 billion in outstanding debt, all of which related to our senior notes. We also had $4 million outstanding under credit lines at our ICE India subsidiaries. As of December 31, 2022, our senior notes of $18.1 billion had2024, with a weighted average maturityinterest rate of 16 years5.6% per annum and a weighted average costremaining maturity of 3.6% per annum. We did not have any commercial paper notes outstanding28 days. The Term Loan has a maturity date of August 31, 2025 and bears interest at a rate of 6.3% as of DecemberMarch 31, 2022.2024.
We have a $3.9 billion senior unsecured revolving credit facility, or the Credit Facility, with a maturity date of May 25, 2027. As of June 30, 2023,March 31, 2024, of the $3.9 billion that was available for borrowing under the Credit Facility, $171$1.9 billion was required to back-stop the amount outstanding under our U.S. dollar commercial paper program, or the Commercial Paper Program, and $172 million was required to support certain broker-dealer and other subsidiary commitments. The remaining $3.7$1.8 billion was available for working capital and general corporate purposes including, but not limited to, acting as a backstop to future increases in the amounts outstanding under the Commercial Paper Program.
We intend to use $4.9 billion net proceeds of our senior notes due in 2025, 2027, 2029 and 2062, or collectively, the SMR Notes, together with the issuance of commercial paper and/or borrowings under the Credit Facility, cash on hand or other immediately available funds and borrowings under the Term Loan, to finance the cash portion of the purchase price for Black Knight. The SMR Notes are subject to a special mandatory redemption feature pursuant to which we will be required to redeem all of the outstanding SMR Notes at a redemption price equal to 101% of the aggregate principal amount of the SMR Notes, plus accrued and unpaid interest, in the event that the Black Knight acquisition is not consummated on or prior to May 4, 2023 (subject to two automatic extensions of three months each, to August 4, 2023 and to November 4, 2023, respectively, if U.S. antitrust clearance or a related law, injunction, order or other judgment, in each case whether temporary, preliminary or permanent, that restrains, enjoins or otherwise prohibits the consummation of the Black Knight merger remains outstanding and all other conditions to closing are satisfied (or in the case of conditions that by their terms are to be satisfied at the closing, are capable of being satisfied if the closing were to occur on such date) at each extension date), or if the Black Knight merger agreement is terminated at any time prior to such date. The $4.9 billion net proceeds from the SMR Notes are separately invested and recorded as short-term restricted cash and cash equivalents in our consolidated balance sheet as of June 30, 2023. For additional information regarding this transaction, refer to Note 3 to our consolidated unaudited financial statements, included in this Quarterly Report.
We have a $2.4 billion two-year senior unsecured delayed draw term loan facility, or the Term Loan. Loan, with a maturity date of August 31, 2025. We borrowed the Term Loan in full on August 31, 2023 in connection with the Black Knight acquisition, and, through the period ended March 31, 2024, we repaid $1.4 billion, reducing the principal outstanding balance to $1.0 billion as of March 31, 2024.
Draws under the Term Loan bear interest on the principal amount outstanding at either (a) Term Secured Overnight Financing Rate, or Term SOFR, plus an applicable margin plus a credit spread adjustment of 108.75 basis points or (b) a "base rate" plus an applicable margin. The applicable margin ranges from 0.625% to 1.125% for Term SOFR loans and from 0.000% to 0.125% for base rate loans, in each case, based on a ratings-based pricing grid. We expect to use the proceeds from borrowings under the Term Loan to fund a portion of the purchase price for the Black Knight acquisition. We have the option to prepay outstanding amounts under the Term Loan in whole or in part at any time. No amounts wereAs of March 31, 2024, we had $1.0 billion outstanding under the Term Loan as of June 30, 2023.Loan.
Our Commercial Paper Program enables us to borrow efficiently at reasonable short-term interest rates and provides us with the flexibility to de-lever using our strong annual cash flows from operating activities whenever our leverage becomes elevated as a result of investment or acquisition activities. We did not have any notes outstanding under our Commercial Paper Program as of June 30, 2023.
Upon maturity of our commercial paper and to the extent old issuances are not repaid by cash on hand, we are exposed to the rollover risk of not being able to issue new commercial paper. To mitigate this risk, we maintain the Credit Facility for
an aggregate amount which meets or exceeds the amount issued under our Commercial Paper Program at any time. If we were not able to issue new commercial paper, we have the option of drawing on the backstop revolving facility. However, electing to do so would result in higher interest expense.
On February 20, 2024, we commenced a consent solicitation with respect to the outstanding notes of a subsidiary of Black Knight, or the Black Knight Notes, pursuant to which we solicited consents from eligible holders to amend the Black Knight Notes and the related indenture, under which they were issued to eliminate certain of the covenants, restrictive provisions and events of default from such indenture. The consent solicitation expired February 28, 2024, at which time the requisite majority of consents had been received. On February 29, 2024, we paid the consenting holders aggregate cash consideration of $2.5 million and the amendment to eliminate the covenant to furnish certain reports, documents and information to holders of the Black Knight notes and the trustee under the indenture governing the Black Knight Notes took effect. The remaining amendments will take effect on the date we complete a private exchange offer to exchange outstanding Black Knight Notes for new senior notes issued by us, which is required to be commenced within 90 days of the expiration of the consent solicitation.
For additional details of our debt instruments, refer to Note 8 to our unaudited consolidated unaudited financial statements, included in this Quarterly Report, and Note 10 to our consolidated financial statements included in our 20222023 Form 10-K.
Capital Return
In December 2021, our Board approved an aggregate of $3.15 billion for future repurchases of our common stock with no fixed expiration date that became effective January 1, 2022.
We did not have any share repurchases during the six months ended June 30, 2023. For the six months ended June 30, 2022, we repurchased 5.0 million shares of our outstanding common stock at a cost of $632 million, including 4.6 million shares at a cost of $582 million under our Rule 10b5-1 trading plan and 0.4 million shares at a cost of $50 million on the open market during an open trading period. For the three months ended June 30, 2022, we repurchased 1.3 million shares of our outstanding common stock at a cost of $157 million under our Rule 10b5-1 trading plan. Shares repurchased are held in treasury stock.
The remaining balance of Board approved funds for future repurchases as of June 30, 2023 is $2.5 billion. In connection with our pending acquisition of Black Knight, on May 4, 2022 we terminated our Rule 10b5-1 trading plan and suspended share repurchases. The approval of our Board for stock repurchases does not obligate us to acquire any particular amount of our common stock. In addition, our Board may increase or decrease the
amount available for repurchases from time to time. We did not have any share repurchases during the three months ended March 31, 2024 or 2023. Shares repurchased are held in treasury stock.
In December 2021, we entered into a Rule 10b5-1trading plan that became effective in February 2022. In connection with our acquisition of Black Knight, on May 4, 2022, we terminated our Rule 10b5-1 trading plan and suspended share repurchases. The remaining balance of Board approved funds for future repurchases as of March 31, 2024 was $2.5 billion.
From time to time, we enter into Rule 10b5-1 trading plans, as authorized by our Board, to govern some or all of the repurchases of our shares of common stock. We may discontinue stock repurchases at any time and may amend or terminate a Rule 10b5-1 trading plan at any time, subject to applicable rules. We expect funding for any stock repurchases to come from our operating cash flow or borrowings under our Commercial Paper Program or our debt facilities. The timing and extent of future repurchases that are not made pursuant to a Rule 10b5-1 trading plan will be at our discretion and will depend upon many conditions. In making a determination regarding any stock repurchases, management considers multiple factors, including overall stock market conditions, our common stock price performance, the remaining amount authorized for repurchases by our Board, the potential impact of a stock repurchase program on our corporate debt ratings, our expected free cash flow and working capital needs, our current and future planned strategic growth initiatives, and other potential uses of our cash and capital resources.
During the three months ended June 30, 2023,March 31, 2024, we paid a quarterly dividend of $0.42$0.45 per share of our common stock for an aggregate payout of $236$258 million, which includes the payment of dividend equivalents on unvested employee restricted stock units.
Future Capital Requirements
Our future capital requirements will depend on many factors, including the rate of growth across our segments, strategic plans and acquisitions, available sources for financing activities, required and discretionary technology and clearing initiatives, regulatory requirements, the timing and introduction of new products and enhancements to existing products, the geographic mix of our business and potential stock repurchases.
We currently expect to incur capital expenditures (including operational and real estate capital expenditures) and to incur software development costs that are eligible for capitalization ranging in the aggregate between $450$600 million and $500$650 million in 2023,2024, which we believe will support the enhancement of our technology, business integration and the continued growth of our businesses.
As of June 30, 2023,March 31, 2024, we had $2.5 billion authorized for future repurchases of our common stock. We may resume repurchases of our common stock, subject to achieving certain debt leverage ratio targets. Refer to Note 10 to our consolidated financial statements included in this Quarterly Report for additional details on our stock repurchase program.
Our Board has adopted a quarterly dividend policy providing that dividends will be approved quarterly by the Board or the Audit Committee taking into account factors such as our evolving business model, prevailing business conditions, our current and future planned strategic growth initiatives and our financial results and capital requirements, without a predetermined net income payout ratio. On August 3, 2023,May 2, 2024, we announced a $0.42$0.45 per share dividend for the thirdsecond quarter of 20232024 with the dividend payable on September 29, 2023June 28, 2024 to stockholders of record as of September 15, 2023.
Other than the facilities for the ICE Clearing Houses, our Credit Facility, our Term Loan our Bridge Facility and our Commercial Paper Program are currently the only significant agreements or arrangements that we have for liquidity and capital resources with third parties. See Notes 8 and 12 to our consolidated financial statements included in this Quarterly Report for further discussion. In the event of any strategic acquisitions, mergers or investments, or if we are required to raise capital for any reason or desire to return capital to our stockholders, we may incur additional debt, issue additional equity to raise necessary funds, repurchase additional shares of our common stock or pay a dividend. However, we cannot provide assurance that such financing or transactions will be available or successful, or that the terms of such financing or transactions will be favorable to us. See “—Debt" above.
Non-GAAP Measures
Non-GAAP Financial Measures
We use certain financial measures internally to evaluate our performance and make financial and operational decisions that are presented in a manner that adjusts from their equivalent GAAP measures or that supplement the information provided by our GAAP measures. We use these adjusted results because we believe they more clearly highlight trends in our business that may not otherwise be apparent when relying solely on GAAP financial measures, since these measures eliminate from our results specific financial items that have less bearing on our core operating performance.
We use these measures in communicating certain aspects of our results and performance, including in this Quarterly Report, and believe that these measures, when viewed in conjunction with our GAAP results and the accompanying reconciliation, can provide investors with greater transparency and a greater understanding of factors affecting our financial condition and results of operations than GAAP measures alone. In addition, we believe the presentation of these measures is useful to investors for making period-to-period comparisons of results because the adjustments to GAAP are not reflective of our core business performance.
These financial measures are not presented in accordance with, or as an alternative to, GAAP financial measures and may be different from non-GAAP measures used by other companies. We encourage investors to review the GAAP financial measures included in this Quarterly Report, including our consolidated financial statements, to aid in their analysis and understanding of our performance and in making comparisons.
The tables below outline our adjusted operating expenses, adjusted operating income, adjusted operating margin, adjusted net income attributable to ICE common stockholders, and adjusted diluted earnings per share, and adjusted free cash flow, which are non-GAAP measures that are calculated by making adjustments for items we view as not reflective of our cash operations and core business performance. These measures, including the adjustments and their related income tax effect and other tax adjustments (in millions, except for percentages and per share amounts), are as follows:
| | | | | | | | | | | | | | | | | | | | | | | | | | | | | | | | | | | | | | | | | | | | | | | | | | | | |
| Exchanges Segment | Fixed Income and Data Services Segment | | Mortgage Technology Segment | | Consolidated |
| Six Months Ended June 30, |
| Operating income adjustments: | 2023 | | 2022 | | 2023 | | 2022 | | | 2023 | | 2022 | | | 2023 | | 2022 | |
| Total revenues, less transaction-based expenses | $ | 2,190 | | | $ | 2,088 | | | $ | 1,109 | | | $ | 1,021 | | | | $ | 485 | | | $ | 604 | | | | $ | 3,784 | | | $ | 3,713 | | |
| Operating expenses | 631 | | | 603 | | | 699 | | | 692 | | | | 530 | | | 557 | | | | 1,860 | | | 1,852 | | |
| Less: Amortization of acquisition-related intangibles | 33 | | | 33 | | | 85 | | | 93 | | | | 183 | | | 180 | | | | 301 | | | 306 | | |
| Less: Transaction and integration costs | — | | | — | | | — | | | — | | | | 46 | | | 60 | | | | 46 | | | 60 | | |
| Less: Other | 17 | | | — | | | — | | | — | | | | — | | | — | | | | 17 | | | — | | |
| | | | | | | | | | | | | | | | | | |
| | | | | | | | | | | | | | | | | | |
| | | | | | | | | | | | | | | | | | |
| | | | | | | | | | | | | | | | | | |
| | | | | | | | | | | | | | | | | | |
| | | | | | | | | | | | | | | | | | |
| | | | | | | | | | | | | | | | | | |
| | | | | | | | | | | | | | | | | | |
| | | | | | | | | | | | | | | | | | |
| Adjusted operating expenses | $ | 581 | | | $ | 570 | | | $ | 614 | | | $ | 599 | | | | $ | 301 | | | $ | 317 | | | | $ | 1,496 | | | $ | 1,486 | | |
| Operating income/(loss) | $ | 1,559 | | | $ | 1,485 | | | $ | 410 | | | $ | 329 | | | | $ | (45) | | | $ | 47 | | | | $ | 1,924 | | | $ | 1,861 | | |
| Adjusted operating income | $ | 1,609 | | | $ | 1,518 | | | $ | 495 | | | $ | 422 | | | | $ | 184 | | | $ | 287 | | | | $ | 2,288 | | | $ | 2,227 | | |
| Operating margin | 71 | % | | 71 | % | | 37 | % | | 32 | % | | | (9) | % | | 8 | % | | | 51 | % | | 50 | % | |
| Adjusted operating margin | 73 | % | | 73 | % | | 45 | % | | 41 | % | | | 38 | % | | 47 | % | | | 60 | % | | 60 | % | |
| | | | | | | | | | | | | | | | | | |
| Non-operating income adjustments: | | | | | | | | | | | | | | | | | | |
| Net income attributable to ICE common stockholders | | | | | | | | | | | | | | | $ | 1,454 | | | $ | 1,212 | | |
| Add: Amortization of acquisition-related intangibles | | | | | | | | | | | | | | | 301 | | | 306 | | |
| Add: Transaction and integration costs | | | | | | | | | | | | | | | 46 | | | 60 | | |
| | | | | | | | | | | | | | | | | | |
| | | | | | | | | | | | | | | | | | |
| | | | | | | | | | | | | | | | | | |
| | | | | | | | | | | | | | | | | | |
| | | | | | | | | | | | | | | | | | |
| Add/(Less): Net interest (income)/expense on pre-acquisition-related debt and debt extinguishment | | | | | | | | | | | | | | | (12) | | | 48 | | |
| | | | | | | | | | | | | | | | | | |
| | | | | | | | | | | | | | | | | | |
| | | | | | | | | | | | | | | | | | |
| | | | | | | | | | | | | | | | | | |
| Less: Gain on sale of Euroclear equity investment and dividends received | | | | | | | | | | | | | | | — | | | (41) | | |
| | | | | | | | | | | | | | | | | | |
| | | | | | | | | | | | | | | | | | |
| | | | | | | | | | | | | | | | | | |
| Add: Net losses from unconsolidated investees | | | | | | | | | | | | | | | 65 | | | 57 | | |
| | | | | | | | | | | | | | | | | | |
| | | | | | | | | | | | | | | | | | |
| | | | | | | | | | | | | | | | | | |
| | | | | | | | | | | | | | | | | | |
| | | | | | | | | | | | | | | | | | |
| | | | | | | | | | | | | | | | | | |
| Add: Other | | | | | | | | | | | | | | | 17 | | | 9 | | |
| Less: Income tax effect for the above items | | | | | | | | | | | | | | | (112) | | | (123) | | |
| | | | | | | | | | | | | | | | | | |
| Add/(Less): Deferred tax adjustments on acquisition-related intangibles | | | | | | | | | | | | | | | (85) | | | 15 | | |
| Less: Other tax adjustments | | | | | | | | | | | | | | | (81) | | | — | | |
| Adjusted net income attributable to ICE common stockholders | | | | | | | | | | | | | | | $ | 1,593 | | | $ | 1,543 | | |
| | | | | | | | | | | | | | | | | | |
| | | | | | | | | | | | | | | | | | |
| Diluted earnings per share attributable to ICE common stockholders | | | | | | | | | | | | | | | $ | 2.59 | | | $ | 2.16 | | |
| | | | | | | | | | | | | | | | | | |
| | | | | | | | | | | | | | | | | | |
| Adjusted diluted earnings per share attributable to ICE common stockholders | | | | | | | | | | | | | | | $ | 2.84 | | | $ | 2.75 | | |
| | | | | | | | | | | | | | | | | | |
| | | | | | | | | | | | | | | | | | |
| Diluted weighted average common shares outstanding | | | | | | | | | | | | | | | 561 | | | 562 | | |
| | Exchanges Segment | Fixed Income and Data Services Segment | | Mortgage Technology Segment | | Consolidated |
| Three Months Ended June 30, |
| Exchanges Segment | |
| Exchanges Segment | |
| Exchanges Segment | | Fixed Income and Data Services Segment | | Mortgage Technology Segment | | Consolidated |
| Three Months Ended March 31, | | | Three Months Ended March 31, |
| Operating income adjustments: | Operating income adjustments: | 2023 | | 2022 | | 2023 | | 2022 | | | 2023 | | 2022 | | | 2023 | | 2022 | | Operating income adjustments: | 2024 | | 2023 | | 2024 | | 2023 | | | 2024 | | 2023 | | | 2024 | | 2023 |
| Total revenues, less transaction-based expenses | Total revenues, less transaction-based expenses | $ | 1,093 | | | $ | 1,005 | | | $ | 546 | | | $ | 512 | | | | $ | 249 | | | $ | 297 | | | | $ | 1,888 | | | $ | 1,814 | | |
| Operating expenses | Operating expenses | 311 | | | 304 | | | 356 | | | 338 | | | | 266 | | | 303 | | | | 933 | | | 945 | | |
| Less: Amortization of acquisition-related intangibles | Less: Amortization of acquisition-related intangibles | 17 | | | 17 | | | 43 | | | 44 | | | | 91 | | | 92 | | | | 151 | | | 153 | | |
| Less: Transaction and integration costs | Less: Transaction and integration costs | — | | | — | | | — | | | — | | | | 25 | | | 52 | | | | 25 | | | 52 | | |
| Less: Regulatory matter | |
| Less: Other | Less: Other | 1 | | | — | | | — | | | — | | | | — | | | — | | | | 1 | | | — | | |
| | | Adjusted operating expenses | |
| | Adjusted operating expenses | |
| | Adjusted operating expenses | Adjusted operating expenses | $ | 293 | | | $ | 287 | | | $ | 313 | | | $ | 294 | | | | $ | 150 | | | $ | 159 | | | | $ | 756 | | | $ | 740 | | |
| Operating income/(loss) | Operating income/(loss) | $ | 782 | | | $ | 701 | | | $ | 190 | | | $ | 174 | | | | $ | (17) | | | $ | (6) | | | | $ | 955 | | | $ | 869 | | |
| Adjusted operating income | Adjusted operating income | $ | 800 | | | $ | 718 | | | $ | 233 | | | $ | 218 | | | | $ | 99 | | | $ | 138 | | | | $ | 1,132 | | | $ | 1,074 | | |
| Operating margin | Operating margin | 72 | % | | 70 | % | | 35 | % | | 34 | % | | | (7) | % | | (2) | % | | | 51 | % | | 48 | % | | Operating margin | 73 | % | | 71 | % | | 38 | % | | 39 | % | | | (10) | % | | (12) | % | | | 46 | % | | 51 | % |
| Adjusted operating margin | Adjusted operating margin | 73 | % | | 71 | % | | 43 | % | | 43 | % | | | 40 | % | | 46 | % | | | 60 | % | | 59 | % | | Adjusted operating margin | 75 | % | | 74 | % | | 46 | % | | 47 | % | | | 37 | % | | 36 | % | | | 59 | % | | 61 | % |
| | Non-operating income adjustments: | Non-operating income adjustments: | | | | | |
| Non-operating income adjustments: | |
| Non-operating income adjustments: | |
| Net income attributable to ICE common stockholders | |
| Net income attributable to ICE common stockholders | |
| Net income attributable to ICE common stockholders | Net income attributable to ICE common stockholders | | | | | $ | 799 | | | $ | 555 | | |
| Add: Amortization of acquisition-related intangibles | Add: Amortization of acquisition-related intangibles | | | | | 151 | | | 153 | | |
| Add: Transaction and integration costs | Add: Transaction and integration costs | | | | | 25 | | | 52 | | |
| | Add/(Less): Net interest (income)/expense on pre-acquisition-related debt and debt extinguishment | | | | | (6) | | | 48 | | |
| | (Less)/Add: Litigation and regulatory matters | |
| | Less: Gain on sale of Euroclear equity investment and dividends received | | | | | — | | | (41) | | |
| | (Less)/Add: Litigation and regulatory matters | |
| | (Less)/Add: Litigation and regulatory matters | |
| | | Add: Net losses from unconsolidated investees | Add: Net losses from unconsolidated investees | | | | | 30 | | | 15 | | |
| | Add: Net losses from unconsolidated investees | |
| | | Add: Net losses from unconsolidated investees | |
| Add: Fair value adjustment of equity investments | |
| | Less: Net interest income on pre-acquisition-related debt | |
| | Less: Net interest income on pre-acquisition-related debt | |
| | Less: Net interest income on pre-acquisition-related debt | |
| Add: Other | Add: Other | | | | | 1 | | | — | | |
| Less: Income tax effect for the above items | Less: Income tax effect for the above items | | | | | (55) | | | (65) | | |
| | Add/(Less): Deferred tax adjustments on acquisition-related intangibles | | | | | (86) | | | 22 | | |
| (Less)/Add: Deferred tax adjustments on acquisition-related intangibles | |
| (Less)/Add: Deferred tax adjustments on acquisition-related intangibles | |
| (Less)/Add: Deferred tax adjustments on acquisition-related intangibles | |
| Less: Other tax adjustments | Less: Other tax adjustments | | | | | (57) | | | — | | |
| Adjusted net income attributable to ICE common stockholders | Adjusted net income attributable to ICE common stockholders | | | | | $ | 802 | | | $ | 739 | | |
| | Diluted earnings per share attributable to ICE common stockholders | Diluted earnings per share attributable to ICE common stockholders | | | | | $ | 1.42 | | | $ | 0.99 | | |
| | Diluted earnings per share attributable to ICE common stockholders | |
| | Diluted earnings per share attributable to ICE common stockholders | |
| | Adjusted diluted earnings per share attributable to ICE common stockholders | |
| | Adjusted diluted earnings per share attributable to ICE common stockholders | |
| | Adjusted diluted earnings per share attributable to ICE common stockholders | Adjusted diluted earnings per share attributable to ICE common stockholders | | | | | $ | 1.43 | | | $ | 1.32 | | |
| | Diluted weighted average common shares outstanding | Diluted weighted average common shares outstanding | | | | | 561 | | | 560 | | |
| | Diluted weighted average common shares outstanding | |
| | Diluted weighted average common shares outstanding | |
Amortization of acquisition-related intangibles are included in non-GAAP adjustments as excluding these non-cash expenses provides greater clarity regarding our financial strength and stability of cash operating results. For the three months ended March 31, 2024, included in amortization of acquisition-related intangibles is $3 million of impairment related to developed technology within our Exchanges Segment.
Transaction and integration costs are included as part of our core business expenses, except for those that are directly related to the announcement, closing, financing, or termination of a transaction. However, we adjust for the acquisition-related transaction and integration costs for acquisitions such as Black Knight and Ellie Mae given the magnitude of the $11.8 billion and $11.4 billion, respectively, purchase priceprices of the acquisition. We also adjusted foracquisitions.
Litigation and regulatory matters during the acquisition-related transaction coststhree months ended March 31, 2024 include the $160 million gain related to the PennyMac arbitration award resolution and payment received. Litigation and regulatory matters during the three months ended March 31, 2023 include an accrual related to a potential regulatory settlement of $10 million. We do not consider events of this type to be reflective of our pending acquisition of Black Knight.core business.
We adjust for our share of net income/gains/(losses) related to our equity method investments, which primarily include OCC and Bakkt. In addition, during the three months ended March 31, 2024, we excluded $3 million of fair value losses on our equity investments. We believe these adjustments provide greater clarity of our performance, given that equity and equity method investments are non-cash and not a part of our core operations.
During the three months ended March 31, 2023, we excluded $6 million of net interest income on interest earned on investments from the pre-acquisition debt proceeds, net of interest expense on pre-acquisition-related debt from our May 2022 debt refinancing related to the Black Knight acquisition.
Other non-GAAP adjustments during the sixthree months ended June 30,March 31, 2024 relate to $7 million of duplicate rent expense on our new London and New York leased offices. We took possession of the new London and New York leases during the fourth quarter of 2023 and first quarter 2024, respectively, and expect the spaces to be completed in the third quarter of 2024. We view these duplicate non-cash rent expenses of the new offices during the transition to be incremental, non-recurring, and not related to the normal operations of the Company. Other non-GAAP adjustments during the three months ended March 31, 2023 relate to a $6 million expense for claims made following a NYSE system outage that occurred in January 2023 and accruals related to potential regulatory settlements of $11 million. Other non-GAAP adjustments during the six months ended June 30, 2022 relate to an accrual for a legal settlement. During the three months ended June 30, 2022 we exclude the $30 million of costs associated with the May and June 2022 extinguishment of four series of senior notes that would have matured in 2022 and 2023 using proceeds from our May 2022 issuance of new senior notes as a non-GAAP adjustment. We also exclude $23 million of interest expense on pre-acquisition-related debt from our May 2022 debt refinancing related to the pending Black Knight acquisition. This adjustment is net of $5 million of interest income earned on investments from the pre-acquisition debt proceeds. Additionally, we exclude the gain on the sale of our Euroclear investment and the related historical dividends received.2023. We do not consider events of this type to be reflective of our core business.
Non-GAAP tax adjustments include the tax impacts of the pre-tax non-GAAP adjustments, deferred tax adjustments on acquisition-related intangibles, and other tax adjustments. The deferred tax adjustments of ($8551 million) and ($86 million)$1 million for the six months and three months ended June 30,March 31, 2024 and 2023, respectively, relateare primarily to U.S. state apportionment changes. The deferred tax adjustments of $15 million and $22 million for the six months and three months ended June 30, 2022, respectively, relate primarilyrelated to U.S. state apportionment changes. Other tax adjustments of ($81 million) and
($5724 million) during the six months and three months ended June 30,March 31, 2023 respectively, are primarily related to audit settlements for pre-acquisition tax matters as well as state apportionment changes in prior years.matters.
Non-GAAP Liquidity Measures
We consider free cash flow and adjusted free cash flow to be a non-GAAP liquidity measuremeasures that providesprovide useful information to management and investors to analyze cash resources generated from our operations. We believe that free cash flow isand adjusted free cash flow are also useful as one of the bases forwhen comparing our performance withto that of our competitors, and demonstrates our ability to convert the reinvestment of capital expenditures and capitalized software development costs required to maintain and grow our business, as well as adjust for timing differences related to the payment of section 31 fees. ThisThese non-GAAP liquidity measure ismeasures are not presented in accordance with, or as an alternative to, GAAP liquidity measures and may be different from non-GAAP measures used by other companies. AdjustedFree cash flow and adjusted free cash flow, including the related adjustments are as follows (in millions):
| | Six Months Ended June 30, |
| 2023 | | 2022 |
| | Three Months Ended March 31, | | | | Three Months Ended March 31, |
| | 2024 | | | | 2024 | | 2023 |
| Net cash provided by operating activities | Net cash provided by operating activities | | $ | 1,805 | | | $ | 1,725 | |
| Less: Capital expenditures | Less: Capital expenditures | | (61) | | | (70) | |
| Less: Capitalized software development costs | Less: Capitalized software development costs | | (142) | | | (134) | |
| Free cash flow | Free cash flow | | 1,602 | | | 1,521 | |
| Add/(less): Section 31 fees, net | | 50 | | | (115) | |
| Add: Section 31 fees, net | |
| Adjusted free cash flow | Adjusted free cash flow | | $ | 1,652 | | | $ | 1,406 | |
For additional information on these items, refer to our consolidated financial statements included in this Quarterly Report and “—Consolidated Operating Expenses” above.
Contractual Obligations and Commercial Commitments
During the six months ended June 30, 2023, there were no significant changes to our contractual obligations and commercial commitments from those disclosed in the section “Management’s Discussion and Analysis of Financial Condition and Results of Operations” in our 2022 Form 10-K.Off-Balance Sheet Arrangements
As described in Note 12 to our consolidated financial statements, which are included elsewhere in this Quarterly Report, certain clearing house collateral is reported off-balance sheet. We do not have any relationships with unconsolidated entities or financial partnerships, often referred to as structured finance or special purpose entities.
Contractual Obligations and Commercial Commitments
During the three months ended March 31, 2024, we entered into a 15 year lease in New York City resulting in an initial total lease liability of $88 million. Other than this lease, there were no significant changes to our contractual obligations and commercial commitments from those disclosed in the section “Management’s Discussion and Analysis of Financial Condition and Results of Operations” in our 2023 Form 10-K.
New and Recently Adopted Accounting Pronouncements
During the sixthree months ended June 30, 2023,March 31, 2024, there were no significant changes to the new and recently adopted accounting pronouncements applicable to us from those disclosed in Note 2 of our 20222023 Form 10-K.
Critical Accounting Policies
During the sixthree months ended June 30, 2023,March 31, 2024, there were no significant changes to our critical accounting policies and estimates from those disclosed in the section “Management’s Discussion and Analysis of Financial Condition and Results of Operations” in our 20222023 Form 10-K.
ITEM 3. QUANTITATIVE AND QUALITATIVE DISCLOSURES ABOUT MARKET RISK
As a result of our operating and financing activities, we are exposed to market risks such as interest rate risk, foreign currency exchange rate risk and credit risk. We have implemented policies and procedures designed to measure, manage, monitor and report risk exposures, which are regularly reviewed by the appropriate management and supervisory bodies.
Interest Rate Risk
We There have been no material changes to the Company’s exposure to market risk for changesrisks from those disclosed in interest rates relating to our cash and cash equivalents, short-term and long-term restricted cash and cash equivalents, short-term and long-term investments and indebtedness. As of June 30,
2023 and December 31, 2022, our cash and cash equivalents and short-term and long-term restricted cash and cash equivalents were $8.5 billion and $8.4 billion, respectively, of which $297 million and $346 million, respectively, were denominated in pounds sterling, euros or Canadian dollars, and the remaining amounts are denominated in U.S. dollars. We do not use our investment portfolio for trading or other speculative purposes. A hypothetical 50% decrease in short-term interest rates would decrease our annual pre-tax earnings by $201 million as of June 30, 2023, assuming no change in the amount or composition of our cash and cash equivalents and short-term and long-term restricted cash and cash equivalents.
As of June 30, 2023, we had $18.1 billion in outstanding debt, all of which related to our senior notes. See Part I, Item 2 "Management's Discussion and Analysis of Financial Condition and Results of Operations—Debt" and Note 8 to our consolidated financial statements included in this Quarterly Report.
The interest rates on our Commercial Paper Program are currently evaluated based upon current maturities and market conditions. As of June 30, 2023, we did not have any notes outstanding under our Commercial Paper Program. The effective interest rate of commercial paper issuances will fluctuate based on the movement in short-term interest rates along with shifts in supply and demand within the commercial paper market.
Foreign Currency Exchange Rate Risk
As an international business, we are subject to foreign currency exchange rate risk. We may experience gains or losses from foreign currency transactions in the future given that a significant part of our assets and liabilities are recorded in pounds sterling, Canadian dollars or euros, and a significant portion of our revenues and expenses are recorded in pounds sterling or euros. Certain assets, liabilities, revenues and expenses of foreign subsidiaries are denominated in the local functional currency of such subsidiaries. Our exposure to foreign denominated earnings for the six months and three months ended June 30, 2023 and 2022 is presented by primary foreign currency in the following table (dollars in millions, except exchange rates):
| | | | | | | | | | | | | | | | | | | | | | | | | | | | | | | | | | | | | | | | | | | | | | | | | | | |
| | Six Months Ended June 30, 2023 | | | Three Months Ended June 30, 2023 | | | Six Months Ended June 30, 2022 | | | Three Months Ended June 30, 2022 | |
| | Pound Sterling | | Euro | | | Pound Sterling | | Euro | | | Pound Sterling | | Euro | | | Pound Sterling | | Euro | |
| Average exchange rate to the U.S. dollar in the current year period | 1.2336 | | | 1.0812 | | | | 1.2522 | | | 1.0893 | | | | 1.2996 | | | 1.0939 | | | | 1.2568 | | | 1.0648 | | |
| Average exchange rate to the U.S. dollar in the same period in the prior year | 1.2996 | | | 1.0939 | | | | 1.2568 | | | 1.0648 | | | | 1.3889 | | | 1.2057 | | | | 1.3985 | | | 1.2054 | | |
| Average exchange rate increase/ (decrease) | (5) | % | | (1) | % | | | — | % | | 2 | % | | | (6) | % | | (9) | % | | | (10) | % | | (12) | % | |
| Foreign denominated percentage of: | | | | | | | | | | | | | | | | | | | |
| Revenues, less transaction-based expenses | 7 | % | | 8 | % | | | 6 | % | | 8 | % | | | 8 | % | | 7 | % | | | 8 | % | | 6 | % | |
| Operating expenses | 7 | % | | 2 | % | | | 7 | % | | 2 | % | | | 8 | % | | 2 | % | | | 8 | % | | 2 | % | |
| Operating income | 7 | % | | 13 | % | | | 5 | % | | 14 | % | | | 7 | % | | 11 | % | | | 7 | % | | 11 | % | |
Impact of the currency fluctuations (1) on: | | | | | | | | | | | | | | | | | | | |
| Revenues, less transaction-based expenses | $ | (16) | | | $ | (3) | | | | $ | (1) | | | $ | 4 | | | | $ | (20) | | | $ | (24) | | | | $ | (16) | | | $ | (14) | | |
| Operating expenses | $ | (8) | | | $ | — | | | | $ | (1) | | | $ | 1 | | | | $ | (10) | | | $ | (4) | | | | $ | (8) | | | $ | (3) | | |
| Operating income | $ | (8) | | | $ | (3) | | | | $ | — | | | $ | 3 | | | | $ | (10) | | | $ | (20) | | | | $ | (8) | | | $ | (11) | | |
(1) Represents the impact of currency fluctuation for the six months and three months ended June 30, 2023 and 2022 compared to the same periods in the prior year.
We have a significant part of our assets, liabilities, revenues and expenses recorded in pounds sterling or euros. During both the six months and three months ended June 30, 2023, 15% and 14%, respectively, of our consolidated revenues, less transaction-based expenses were denominated in pounds sterling or euros and for both the six months and three months ended June 30, 2023, 9% of our consolidated operating expenses were denominated in pounds sterling or euros. As the pound sterling or euro exchange rate changes, the U.S. equivalent of revenues and expenses denominated in foreign currencies changes accordingly.
Foreign currency transaction risk related to the settlement of foreign currency denominated assets, liabilities and payables occurs through our operations, which are received in or paid in pounds sterling, Canadian dollars, or euros, due to the increase or decrease in the foreign currency exchange rates between periods. We incurred foreign currency transaction losses of $5 million and $9 million for the six months ended June 30, 2023 and 2022, respectively, and $4 million for both
the three months ended June 30, 2023 and 2022, inclusive of the impact of foreign currency hedging transactions. The foreign currency transaction losses were primarily attributable to the fluctuations of the pound sterling and euro relative to the U.S. dollar. A 10% adverse change in the underlying foreign currency exchange rates as of June 30, 2023, assuming no change in the composition of the foreign currency denominated assets, liabilities and payables and assuming no hedging activity, would result in a foreign currency loss of $8 million.
We entered into foreign currency hedging transactions during the six months and three months ended June 30, 2023 and 2022 as economic hedges to help mitigate a portion of our foreign exchange risk exposure and may enter into additional hedging transactions in the future to help mitigate our foreign exchange risk exposure. Although we may enter into additional hedging transactions in the future, these hedging arrangements may not be effective, particularly in the event of imprecise forecasts of the levels of our non-U.S. denominated assets and liabilities.
We have foreign currency translation risk equal to our net investment in our foreign subsidiaries. The financial statements of these subsidiaries are translated into U.S. dollars using a current rate of exchange, with gains or losses included in the cumulative translation adjustment account, a component of equity. Our exposure to the net investment in foreign currencies is presented by primary foreign currencies in the table below (in millions):
| | | | | | | | | | | | | | | | | |
| | As of June 30, 2023 |
| | Position in
pounds sterling | | Position in
Canadian dollars | | Position in euros |
| Assets | £ | 697 | | | $ | 2,062 | | | € | 184 | |
| of which goodwill represents | 550 | | | 392 | | | 92 | |
| Liabilities | 95 | | | 1,578 | | | 62 | |
| | | | | |
| | | | | |
| | | | | |
| Net currency position | £ | 602 | | | $ | 484 | | | € | 122 | |
| Net currency position, in $USD | $ | 764 | | | $ | 365 | | | $ | 133 | |
| Negative impact on consolidated equity of a 10% decrease in foreign currency exchange rates | $ | 76 | | | $ | 37 | | | $ | 13 | |
Foreign currency translation adjustments are included as a component of accumulated other comprehensive income/(loss) within our balance sheet. See the table below for the portion of equity attributable to foreign currency translation adjustments as well as the activity for the six months and three months ended June 30, 2023 included within our statement of other comprehensive income. The impact of the foreign currency exchange rate differences in the tables below were primarily driven by fluctuations of the pound sterling as compared to the U.S. dollar which were 1.2697, 1.2332 and 1.2093 as of June 30, 2023, March 31, 2023 and December 31, 2022, respectively, and by fluctuations of the euro as compared to the U.S. dollar which were 1.0911, 1.0842 and 1.0704 as of June 30, 2023, March 31, 2023 and December 31, 2022, respectively.
| | | | | | | | |
| | Changes in Accumulated Other Comprehensive Loss from Foreign Currency Translation Adjustments
(in millions) |
Balance, as of December 31, 2022 | | $ | (278) | |
Other comprehensive income | | 47 | |
Income tax benefit/(expense) | | — | |
Net current period other comprehensive income | | 47 | |
Balance, as of June 30, 2023 | | $ | (231) | |
| | | | | | | | |
| | Changes in Accumulated Other Comprehensive Loss from Foreign Currency Translation Adjustments
(in millions) |
Balance, as of March 31, 2023 | | $ | (262) | |
Other comprehensive income | | 31 | |
Income tax benefit/(expense) | | — | |
Net current period other comprehensive income | | 31 | |
Balance, as of June 30, 2023 | | $ | (231) | |
The future impact on our business relating to the U.K. leaving the EU and the corresponding regulatory changes are uncertain at this time, including future impacts on currency exchange rates.
Credit Risk
We are exposed to credit risk in our operations in the event of a counterparty default. We limit our exposure to credit risk by rigorously selecting the counterparties with which we make our investments, monitoring them on an ongoing basis and executing agreements to protect our interests.
Clearing House Cash Deposit Risks
The ICE Clearing Houses hold material amounts of clearing member margin deposits which are held or invested primarily to provide security of capital while minimizing credit, market and liquidity risks. Refer to Note 12 to our consolidated financial statements for more information on the ICE Clearing Houses' cash and cash equivalent margin deposits and guaranty funds, invested deposits, delivery contracts receivable and unsettled variation margin which were $88.3 billion as of June 30, 2023. While we seek to achieve a reasonable rate of return which may generate interest income for our clearing members, we are primarily concerned with preservation of capital and managing the risks associated with these deposits. As the ICE Clearing Houses may pass on interest revenues (minus costs) to the clearing members, this could include negative or reduced yield due to market conditions. For a summary of the risks associated with these deposits and how these risks are mitigated, see Part II, Item 7(A)7A, “Quantitative and Qualitative Disclosures About Market Risk” in our 20222023 Form 10-K.
ITEM 4. CONTROLS AND PROCEDURES
(a) Evaluation of Disclosure Controls and Procedures. As of the end of the period covered by this report, an evaluation was carried out by our management, with the participation of our Chief Executive Officer and Chief Financial Officer, of the effectiveness of our disclosure controls and procedures (as defined in Rule 13a-15(e) under the Securities Exchange Act of 1934). Based upon that evaluation, our Chief Executive Officer and Chief Financial Officer concluded that these disclosure controls and procedures were effective as of the end of the period covered by this report.
(b) Changes in Internal Controls over Financial Reporting. There were no changes in our internal controls over financial reporting that occurred during our most recent fiscal quarter that have materially affected, or are reasonably likely to materially affect, our internal controls over financial reporting.
PART II. Other Information
ITEM 1. LEGAL PROCEEDINGS
See Note 13 to the consolidated financial statements and related notes, which is incorporated by reference herein.
ITEM 1(A). RISK FACTORS
During the sixthree months ended June 30, 2023,March 31, 2024, there were no significant new risk factors from those disclosed in Part I, Item 1A, "Risk Factors" in our 20222023 Form 10-K. In addition to the other information set forth in this Quarterly Report, including the information in the "—Regulation" section of Item 2 - Management’s Discussion and Analysis of Financial Condition and Results of Operations, you should carefully consider the factors discussed under “Risk Factors” and the regulation discussion under “Business—Regulation” in our 20222023 Form 10-K. These risks could materially and adversely affect our business, financial condition and results of operations. The risks and uncertainties in our 20222023 Form 10-K are not the only ones facing us. Additional risks and uncertainties not presently known to us, or that we currently believe to be immaterial, may also adversely affect our business.
ITEM 2. UNREGISTERED SALES OF EQUITY SECURITIES AND USE OF PROCEEDS
Stock Repurchases
During the sixthree months ended June 30, 2023,March 31, 2024, there were not anyno purchases made by or on behalf of ICE or any “affiliated purchaser” (as defined in Rule 10b-18(a)(3) under the Exchange Act) of our common stock.
Refer to Note 10 to our consolidated financial statements and related notes, which are included elsewhere in this Quarterly Report, for details on our stock repurchases.
ITEM 3. DEFAULTS UPON SENIOR SECURITIES
None.
ITEM 4. MINE SAFETY DISCLOSURES
Not applicable.
ITEM 5. OTHER INFORMATION
The following officers and directors adopted plans intended to satisfy the affirmative defense conditions of Rule 10b5-1(c) under the Exchange Act:
(a) On May 17, 2023, Martha A. Tirinnanzi,March 11, 2024, Sharon Y. Bowen, one of our directors, adopted a trading plan for the sale of shares of ICE common stock, which is intended to satisfy the affirmative defense conditions of Rule 10b5-1(c) under the Exchange Act. The plan expires on the earlier of (i) April 30, 2025 or (ii) upon the completion of the sale of the maximum number of shares under the plan. The aggregate number of shares to be sold under the plan is 2,036 shares.
(b) On March 6, 2024, The Rt. Hon. the Lord Hague of Richmond, one of our directors, adopted a trading plan for the sale of shares of ICE common stock, which is intended to satisfy the affirmative defense conditions of Rule 10b5-1(c) under the Exchange Act. The plan expires on the earlier of (i) December 31, 2024 or (ii) upon the completion of the sale of the maximum number of shares under the plan. The aggregate number of shares to be sold under the plan is 992680 shares.
(c) On March 4, 2024, Christopher S. Edmonds, our President, Fixed Income & Data Services, adopted a trading plan for the sale of shares of ICE common stock, which is intended to satisfy the affirmative defense conditions of Rule 10b5-1(c) under the Exchange Act. The plan expires on the earlier of (i) February 28, 2025 or (ii) upon the completion of the sale of the maximum number of shares under the plan. The aggregate number of shares to be sold under the plan is 2,805 shares plus an undetermined number of shares to be sold resulting from the vesting of restricted stock units and performance-based restricted stock units less the amount of shares that will be withheld to satisfy the payment of Mr. Edmonds' tax withholding obligations.
(d) On March 8, 2024, Mayur Kapani, our Chief Technology Officer, adopted a trading plan for the sale of shares of ICE common stock, which is intended to satisfy the affirmative defense conditions of Rule 10b5-1(c) under the Exchange Act. The plan expires on the earlier of (i) March 7, 2025 or (ii) upon the completion of the sale of the maximum number of shares under the plan. The aggregate number of shares to be sold under the plan is 2,790 shares.
(e) On March 6, 2024, James W. Namkung, our Chief Accounting Officer, adopted a trading plan for the sale of shares of ICE common stock, which is intended to satisfy the affirmative defense conditions of Rule 10b5-1(c) under the Exchange Act. The plan expires on the earlier of (i) February 28, 2025 or (ii) upon the completion of the sale of the maximum number of shares under the plan. The aggregate number of shares to be sold under the plan is 4,710 shares.
Certain of our officers or directors have made elections to participate in, and are participating in, our dividend reinvestment plan and employee stock purchase plan and have made, and may from time to time, make elections to have shares withheld to cover withholding taxes or pay the exercise price of options, which may be designed to satisfy the affirmative defense conditions of Rule 10b5-1 under the Exchange Act or may constitute non-Rule 10b5–1 trading arrangements (as defined in Item 408(c) of Regulation S-K).
ITEM 6. EXHIBITS
| | | | | | | | | | | | | | | | | |
| Exhibit Number | | Description of Document | | | |
| 3.1 | — | | | | |
| | | | | |
| 3.2 | — | |
| | |
| 4.1 | — | |
| | | | | |
| 31.1* | — | | | | |
| | | | | |
| 31.2* | — | | | | |
| | | | | |
| 32.1** | — | | | | |
| | | | | |
| 32.2** | — | | | | |
| | | | | |
| 101 | — | The following materials from Intercontinental Exchange, Inc.’s Quarterly Report on Form 10-Q for the quarter ended June 30, 2023,March 31, 2024, formatted in Inline XBRL (Extensible Business Reporting Language): (i) the Consolidated Balance Sheets, (ii) the Consolidated Statements of Income, (iii) the Consolidated Statements of Comprehensive Income, (iv) the Consolidated Statements of Changes in Equity and Redeemable Non-Controlling Interest (v) Consolidated Statements of Cash Flows and (vi) Notes to Consolidated Financial Statements, tagged as blocks of text. | | | |
| | | | | |
| 104 | — | The cover page from Intercontinental Exchange, Inc.'s Quarterly Report on Form 10-Q for the quarter ended June 30, 2023March 31, 2024 formatted in Inline XBRL. | | | |
| | | | | |
| * | Filed herewith. | | | |
| ** | Furnished herewith. These exhibits shall not be deemed “filed” for purposes of Section 18 of the Securities Exchange Act of 1934, or otherwise subject to the liability of that Section. Such exhibits shall not be deemed incorporated into any filing under the Securities Act of 1933 or the Securities Exchange Act of 1934. |
| | |
| | |
| | |
| | |
| | |
| | |
| | |
| | |
SIGNATURES
Pursuant to the requirements of Section 13 or 15(d) of the Securities Exchange Act of 1934, the Registrant has duly caused this Report to be signed on its behalf by the undersigned, thereunto duly authorized.
| | | | | | | | | | | |
| | Intercontinental Exchange, Inc.
(Registrant) |
| | | |
Date: August 3, 2023May 2, 2024 | | By: | /s/ A. Warren Gardiner |
| | | A. Warren Gardiner |
| | | Chief Financial Officer |
| | | (Principal Financial Officer) |