
| Delaware | 80-0925494 | |||||||||||||
| (State or other jurisdiction of incorporation or organization) | (IRS Employer Identification No.) | |||||||||||||
| 345 Park Avenue, | New York, | NY | 10154 | |||||||||||
| (Address of principal executive offices) | (Zip Code) | |||||||||||||
| Title of Each Class | Trading Symbol(s) | Name of Each Exchange on Which Registered | ||||||
| Class A common stock, $0.001 par value | LADR | New York Stock Exchange | ||||||
| Large accelerated filer | ☒ | Accelerated filer | ☐ | ||||||||
| Non-accelerated filer | ☐ | Smaller reporting company | ☐ | ||||||||
| Emerging growth company | ☐ | ||||||||||
| Class | Outstanding at October | |||||||
| Class A common stock, $0.001 par value | ||||||||
| Class B common stock, $0.001 par value | ||||||||
| Index | Page | |||||||||||||
| September 30, 2019(1) | December 31, 2018(1) | ||||||
| (Unaudited) | |||||||
| Assets | |||||||
| Cash and cash equivalents | $ | 83,097 | $ | 67,878 | |||
| Restricted cash | 38,656 | 30,572 | |||||
| Mortgage loan receivables held for investment, net, at amortized cost: | |||||||
| Mortgage loans held by consolidated subsidiaries | 3,231,443 | 3,318,390 | |||||
| Provision for loan losses | (18,500 | ) | (17,900 | ) | |||
| Mortgage loan receivables held for sale | 174,214 | 182,439 | |||||
| Real estate securities | 1,911,456 | 1,410,126 | |||||
| Real estate and related lease intangibles, net | 981,333 | 998,022 | |||||
| Investments in and advances to unconsolidated joint ventures | 51,419 | 40,354 | |||||
| FHLB stock | 61,619 | 57,915 | |||||
| Derivative instruments | 22 | — | |||||
| Due from brokers | 3,962 | — | |||||
| Accrued interest receivable | 22,699 | 27,214 | |||||
| Other assets | 78,454 | 157,862 | |||||
| Total assets | $ | 6,619,874 | $ | 6,272,872 | |||
| Liabilities and Equity | |||||||
| Liabilities | |||||||
| Debt obligations, net | $ | 4,860,687 | $ | 4,452,574 | |||
| Due to brokers | 7,000 | 1,301 | |||||
| Derivative instruments | 82 | 975 | |||||
| Amount payable pursuant to tax receivable agreement | 1,559 | 1,570 | |||||
| Dividends payable | 2,384 | 37,316 | |||||
| Accrued expenses | 45,761 | 82,425 | |||||
| Other liabilities | 63,151 | 53,076 | |||||
| Total liabilities | 4,980,624 | 4,629,237 | |||||
| Commitments and contingencies (Note 18) | — | — | |||||
| Equity | |||||||
| Class A common stock, par value $0.001 per share, 600,000,000 shares authorized; 110,693,832 and 106,642,335 shares issued and 107,573,820 and 103,941,173 shares outstanding | 108 | 105 | |||||
| Class B common stock, par value $0.001 per share, 100,000,000 shares authorized; 12,158,933 and 13,117,419 shares issued and outstanding | 12 | 13 | |||||
| Additional paid-in capital | 1,529,599 | 1,471,157 | |||||
| Treasury stock, 3,120,012 and 2,701,162 shares, at cost | (41,556 | ) | (32,815 | ) | |||
| Retained earnings (dividends in excess of earnings) | (39,860 | ) | 11,342 | ||||
| Accumulated other comprehensive income (loss) | 10,367 | (4,649 | ) | ||||
| Total shareholders’ equity | 1,458,670 | 1,445,153 | |||||
| Noncontrolling interest in operating partnership | 171,731 | 188,427 | |||||
| Noncontrolling interest in consolidated joint ventures | 8,849 | 10,055 | |||||
| Total equity | 1,639,250 | 1,643,635 | |||||
| Total liabilities and equity | $ | 6,619,874 | $ | 6,272,872 | |||
| September 30, 2020(1) | December 31, 2019(1) | ||||||||||
| (Unaudited) | |||||||||||
| Assets | |||||||||||
| Cash and cash equivalents | $ | 875,839 | $ | 58,171 | |||||||
| Restricted cash | 41,897 | 297,575 | |||||||||
| Mortgage loan receivables held for investment, net, at amortized cost: | |||||||||||
| Mortgage loans held by consolidated subsidiaries | 2,731,254 | 3,257,036 | |||||||||
| Allowance for credit losses | (47,084) | (20,500) | |||||||||
| Mortgage loan receivables held for sale | 30,553 | 122,325 | |||||||||
| Real estate securities | 1,447,625 | 1,721,305 | |||||||||
| Real estate and related lease intangibles, net | 990,583 | 1,048,081 | |||||||||
| Investments in and advances to unconsolidated joint ventures | 49,155 | 48,433 | |||||||||
| FHLB stock | 61,619 | 61,619 | |||||||||
| Derivative instruments | 449 | 693 | |||||||||
| Accrued interest receivable | 18,259 | 21,066 | |||||||||
| Other assets | 159,314 | 53,348 | |||||||||
| Total assets | $ | 6,359,463 | $ | 6,669,152 | |||||||
| Liabilities and Equity | |||||||||||
| Liabilities | |||||||||||
| Debt obligations, net | $ | 4,714,510 | $ | 4,859,873 | |||||||
| Dividends payable | 26,236 | 38,696 | |||||||||
| Accrued expenses | 36,179 | 72,397 | |||||||||
| Other liabilities | 60,744 | 59,209 | |||||||||
| Total liabilities | 4,837,669 | 5,030,175 | |||||||||
| Commitments and contingencies (Note 18) | 0 | 0 | |||||||||
| Equity | |||||||||||
| Class A common stock, par value $0.001 per share, 600,000,000 shares authorized; 122,852,765 and 110,693,832 shares issued and 120,267,457 and 107,509,563 shares outstanding | 120 | 108 | |||||||||
| Class B common stock, par value $0.001 per share, 100,000,000 shares authorized; 0 and 12,158,933 shares issued and outstanding | 0 | 12 | |||||||||
| Additional paid-in capital | 1,726,339 | 1,532,384 | |||||||||
| Treasury stock, 2,585,308 and 3,184,269 shares, at cost | (54,543) | (42,699) | |||||||||
| Retained earnings (dividends in excess of earnings) | (126,965) | (35,746) | |||||||||
| Accumulated other comprehensive income (loss) | (28,448) | 4,218 | |||||||||
| Total shareholders’ equity | 1,516,503 | 1,458,277 | |||||||||
| Noncontrolling interest in operating partnership | 0 | 172,054 | |||||||||
| Noncontrolling interest in consolidated joint ventures | 5,291 | 8,646 | |||||||||
| Total equity | 1,521,794 | 1,638,977 | |||||||||
| Total liabilities and equity | $ | 6,359,463 | $ | 6,669,152 | |||||||
(1)Includes amounts relating to consolidated variable interest entities. See Note 1 and Note 10. |
| Three Months Ended September 30, | Nine Months Ended September 30, | ||||||||||||||||||||||||||||
| 2020 | 2019 | 2020 | 2019 | ||||||||||||||||||||||||||
| Net interest income | |||||||||||||||||||||||||||||
| Interest income | $ | 54,621 | $ | 82,251 | $ | 189,306 | $ | 254,040 | |||||||||||||||||||||
| Interest expense | 56,398 | 51,397 | 176,225 | 155,015 | |||||||||||||||||||||||||
| Net interest income | (1,777) | 30,854 | 13,081 | 99,025 | |||||||||||||||||||||||||
| Provision for/(release of) loan loss reserves | (2,512) | 0 | 23,340 | 600 | |||||||||||||||||||||||||
| Net interest income (expense) after provision for/(release of) loan losses | 735 | 30,854 | (10,259) | 98,425 | |||||||||||||||||||||||||
| Other income (loss) | |||||||||||||||||||||||||||||
| Operating lease income | 25,464 | 24,405 | 75,565 | 81,106 | |||||||||||||||||||||||||
| Sale of loans, net | 1,127 | 11,247 | 1,387 | 38,589 | |||||||||||||||||||||||||
| Realized gain (loss) on securities | (303) | 3,396 | (12,089) | 10,726 | |||||||||||||||||||||||||
| Unrealized gain (loss) on equity securities | 0 | 254 | (132) | 1,341 | |||||||||||||||||||||||||
| Unrealized gain (loss) on Agency interest-only securities | 9 | 16 | 183 | 38 | |||||||||||||||||||||||||
| Realized gain (loss) on sale of real estate, net | 21,588 | 2,082 | 32,116 | 963 | |||||||||||||||||||||||||
| Impairment of real estate | 0 | 0 | 0 | (1,350) | |||||||||||||||||||||||||
| Fee and other income | 3,051 | 5,166 | 8,075 | 17,047 | |||||||||||||||||||||||||
| Net result from derivative transactions | 260 | (9,465) | (15,988) | (35,956) | |||||||||||||||||||||||||
| Earnings (loss) from investment in unconsolidated joint ventures | 447 | 1,094 | 1,359 | 3,617 | |||||||||||||||||||||||||
| Gain (loss) on extinguishment/defeasance of debt | 1,167 | 0 | 22,244 | (1,070) | |||||||||||||||||||||||||
| Total other income (loss) | 52,810 | 38,195 | 112,720 | 115,051 | |||||||||||||||||||||||||
| Costs and expenses | |||||||||||||||||||||||||||||
| Salaries and employee benefits | 7,858 | 14,319 | 31,880 | 52,800 | |||||||||||||||||||||||||
| Operating expenses | 3,938 | 5,314 | 15,957 | 16,727 | |||||||||||||||||||||||||
| Real estate operating expenses | 8,060 | 6,270 | 22,041 | 17,776 | |||||||||||||||||||||||||
| Fee expense | 2,476 | 2,056 | 5,892 | 4,951 | |||||||||||||||||||||||||
| Depreciation and amortization | 9,817 | 9,030 | 29,642 | 29,192 | |||||||||||||||||||||||||
| Total costs and expenses | 32,149 | 36,989 | 105,412 | 121,446 | |||||||||||||||||||||||||
| Income (loss) before taxes | 21,396 | 32,060 | (2,951) | 92,030 | |||||||||||||||||||||||||
| Income tax expense (benefit) | 14 | 1,112 | (5,078) | 478 | |||||||||||||||||||||||||
| Net income (loss) | 21,382 | 30,948 | 2,127 | 91,552 | |||||||||||||||||||||||||
| Net (income) loss attributable to noncontrolling interest in consolidated joint ventures | (4,149) | (64) | (5,417) | 691 | |||||||||||||||||||||||||
| Net (income) loss attributable to noncontrolling interest in operating partnership | (45) | (3,308) | 561 | (10,247) | |||||||||||||||||||||||||
| Net income (loss) attributable to Class A common shareholders | $ | 17,188 | $ | 27,576 | $ | (2,729) | $ | 81,996 | |||||||||||||||||||||
| The accompanying notes are an integral part of these consolidated financial statements. | |||||||||||||||||||||||||||||
| Three Months Ended September 30, | Nine Months Ended September 30, | ||||||||||||||
| 2019 | 2018 | 2019 | 2018 | ||||||||||||
| Net interest income | |||||||||||||||
| Interest income | $ | 82,251 | $ | 90,386 | $ | 254,040 | $ | 253,822 | |||||||
| Interest expense | 51,397 | 51,476 | 155,015 | 144,606 | |||||||||||
| Net interest income | 30,854 | 38,910 | 99,025 | 109,216 | |||||||||||
| Provision for loan losses | — | 10,300 | 600 | 13,600 | |||||||||||
| Net interest income after provision for loan losses | 30,854 | 28,610 | 98,425 | 95,616 | |||||||||||
| Other income (loss) | |||||||||||||||
| Operating lease income | 24,405 | 24,997 | 81,106 | 79,306 | |||||||||||
| Sale of loans, net | 11,247 | 1,861 | 38,589 | 12,893 | |||||||||||
| Realized gain (loss) on securities | 3,396 | (2,554 | ) | 10,726 | (4,896 | ) | |||||||||
| Unrealized gain (loss) on equity securities | 254 | — | 1,341 | — | |||||||||||
| Unrealized gain (loss) on Agency interest-only securities | 16 | 142 | 38 | 456 | |||||||||||
| Realized gain (loss) on sale of real estate, net | 2,082 | 63,704 | 963 | 96,341 | |||||||||||
| Impairment of real estate | — | — | (1,350 | ) | — | ||||||||||
| Fee and other income | 5,166 | 4,851 | 17,047 | 17,579 | |||||||||||
| Net result from derivative transactions | (9,465 | ) | 7,115 | (35,956 | ) | 29,156 | |||||||||
| Earnings (loss) from investment in unconsolidated joint ventures | 1,094 | 401 | 3,617 | 466 | |||||||||||
| Gain (loss) on extinguishment/defeasance of debt | — | (4,323 | ) | (1,070 | ) | (4,392 | ) | ||||||||
| Total other income (loss) | 38,195 | 96,194 | 115,051 | 226,909 | |||||||||||
| Costs and expenses | |||||||||||||||
| Salaries and employee benefits | 14,319 | 15,792 | 52,800 | 46,754 | |||||||||||
| Operating expenses | 5,314 | 5,464 | 16,727 | 16,608 | |||||||||||
| Real estate operating expenses | 6,270 | 7,152 | 17,776 | 23,806 | |||||||||||
| Fee expense | 2,056 | 1,311 | 4,951 | 2,953 | |||||||||||
| Depreciation and amortization | 9,030 | 10,417 | 29,192 | 31,896 | |||||||||||
| Total costs and expenses | 36,989 | 40,136 | 121,446 | 122,017 | |||||||||||
| Income (loss) before taxes | 32,060 | 84,668 | 92,030 | 200,508 | |||||||||||
| Income tax expense (benefit) | 1,112 | 1,204 | 478 | 5,679 | |||||||||||
| Net income (loss) | 30,948 | 83,464 | 91,552 | 194,829 | |||||||||||
| Net (income) loss attributable to noncontrolling interest in consolidated joint ventures | (64 | ) | (7,843 | ) | 691 | (16,132 | ) | ||||||||
| Net (income) loss attributable to noncontrolling interest in operating partnership | (3,308 | ) | (8,991 | ) | (10,247 | ) | (22,786 | ) | |||||||
| Net income (loss) attributable to Class A common shareholders | $ | 27,576 | $ | 66,630 | $ | 81,996 | $ | 155,911 | |||||||
| The accompanying notes are an integral part of these consolidated financial statements. | |||||||||||||||
| Three Months Ended September 30, | Nine Months Ended September 30, | ||||||||||||||||||||||||||||
| 2020 | 2019 | 2020 | 2019 | ||||||||||||||||||||||||||
| Earnings per share: | |||||||||||||||||||||||||||||
| Basic | $ | 0.15 | $ | 0.26 | $ | (0.02) | $ | 0.78 | |||||||||||||||||||||
| Diluted | $ | 0.14 | $ | 0.26 | $ | (0.02) | $ | 0.77 | |||||||||||||||||||||
| Weighted average shares outstanding: | |||||||||||||||||||||||||||||
| Basic | 117,481,812 | 106,004,152 | 110,233,748 | 105,264,752 | |||||||||||||||||||||||||
| Diluted | 118,791,927 | 106,603,713 | 110,233,748 | 106,232,581 | |||||||||||||||||||||||||
| Dividends per share of Class A common stock | $ | 0.200 | $ | 0.340 | $ | 0.740 | $ | 1.020 | |||||||||||||||||||||
| Three Months Ended September 30, | Nine Months Ended September 30, | ||||||||||||||
| 2019 | 2018 | 2019 | 2018 | ||||||||||||
| Earnings per share: | |||||||||||||||
| Basic | $ | 0.26 | $ | 0.69 | $ | 0.78 | $ | 1.62 | |||||||
| Diluted | $ | 0.26 | $ | 0.67 | $ | 0.77 | $ | 1.61 | |||||||
| Weighted average shares outstanding: | |||||||||||||||
| Basic | 106,004,152 | 96,935,986 | 105,264,752 | 96,317,513 | |||||||||||
| Diluted | 106,603,713 | 110,650,253 | 106,232,581 | 110,482,991 | |||||||||||
| Dividends per share of Class A common stock (Note 11) | $ | 0.340 | $ | 0.325 | $ | 1.020 | $ | 0.965 | |||||||
| Three Months Ended September 30, | Nine Months Ended September 30, | ||||||||||||||||||||||||||||
| 2020 | 2019 | 2020 | 2019 | ||||||||||||||||||||||||||
| Net income (loss) | $ | 21,382 | $ | 30,948 | $ | 2,127 | $ | 91,552 | |||||||||||||||||||||
| Other comprehensive income (loss) | |||||||||||||||||||||||||||||
| Unrealized gain (loss) on securities, net of tax: | |||||||||||||||||||||||||||||
| Unrealized gain (loss) on real estate securities, available for sale | 18,439 | 1,389 | (46,282) | 27,414 | |||||||||||||||||||||||||
| Reclassification adjustment for (gain) loss included in net income (loss) | 302 | (3,398) | 13,139 | (10,639) | |||||||||||||||||||||||||
| Total other comprehensive income (loss) | 18,741 | (2,009) | (33,143) | 16,775 | |||||||||||||||||||||||||
| Comprehensive income (loss) | 40,123 | 28,939 | (31,016) | 108,327 | |||||||||||||||||||||||||
| Comprehensive (income) loss attributable to noncontrolling interest in consolidated joint ventures | (4,149) | (64) | (5,417) | 691 | |||||||||||||||||||||||||
| Comprehensive income (loss) of combined Class A common shareholders and Operating Partnership unitholders | 35,974 | 28,875 | (36,433) | 109,018 | |||||||||||||||||||||||||
| Comprehensive (income) loss attributable to noncontrolling interest in operating partnership | (190) | (3,104) | 5,769 | (12,087) | |||||||||||||||||||||||||
| Comprehensive income (loss) attributable to Class A common shareholders | $ | 35,784 | $ | 25,771 | $ | (30,664) | $ | 96,931 | |||||||||||||||||||||
| Three Months Ended September 30, | Nine Months Ended September 30, | ||||||||||||||
| 2019 | 2018 | 2019 | 2018 | ||||||||||||
| Net income (loss) | $ | 30,948 | $ | 83,464 | $ | 91,552 | $ | 194,829 | |||||||
| Other comprehensive income (loss) | |||||||||||||||
| Unrealized gain (loss) on securities, net of tax: | |||||||||||||||
| Unrealized gain (loss) on real estate securities, available for sale | 1,389 | (1,109 | ) | 27,414 | (14,554 | ) | |||||||||
| Reclassification adjustment for (gain) loss included in net income (loss) | (3,398 | ) | 2,554 | (10,639 | ) | 4,896 | |||||||||
| Total other comprehensive income (loss) | (2,009 | ) | 1,445 | 16,775 | (9,658 | ) | |||||||||
| Comprehensive income (loss) | 28,939 | 84,909 | 108,327 | 185,171 | |||||||||||
| Comprehensive (income) loss attributable to noncontrolling interest in consolidated joint ventures | (64 | ) | (7,843 | ) | 691 | (16,132 | ) | ||||||||
| Comprehensive income (loss) of combined Class A common shareholders and Operating Partnership unitholders | 28,875 | 77,066 | 109,018 | 169,039 | |||||||||||
| Comprehensive (income) loss attributable to noncontrolling interest in operating partnership | (3,104 | ) | (9,160 | ) | (12,087 | ) | (21,358 | ) | |||||||
| Comprehensive income (loss) attributable to Class A common shareholders | $ | 25,771 | $ | 67,906 | $ | 96,931 | $ | 147,681 | |||||||
| Shareholders’ Equity | |||||||||||||||||||||||||||||||||||||||||||||||||||||||||||||||||
| Class A Common Stock | Class B Common Stock | Additional Paid- in-Capital | Treasury Stock | Retained Earnings (Dividends in Excess of Earnings) | Accumulated Other Comprehensive Income (Loss) | Noncontrolling Interests | Total Equity | ||||||||||||||||||||||||||||||||||||||||||||||||||||||||||
| Shares | Par | Shares | Par | Operating Partnership | Consolidated Joint Ventures | ||||||||||||||||||||||||||||||||||||||||||||||||||||||||||||
| Balance, June 30, 2020 | 115,015 | $ | 116 | 5,381 | $ | 5 | $ | 1,649,170 | $ | (53,619) | $ | (120,082) | $ | (45,080) | $ | 70,968 | $ | 6,902 | $ | 1,508,380 | |||||||||||||||||||||||||||||||||||||||||||||
| Contributions | — | — | — | — | — | — | — | — | — | 208 | 208 | ||||||||||||||||||||||||||||||||||||||||||||||||||||||
| Distributions | — | — | — | — | — | — | — | — | (332) | (5,968) | (6,300) | ||||||||||||||||||||||||||||||||||||||||||||||||||||||
| Amortization of equity based compensation | — | — | — | — | 4,219 | — | — | — | — | — | 4,219 | ||||||||||||||||||||||||||||||||||||||||||||||||||||||
| Purchase of treasury stock | (124) | — | — | — | — | (895) | — | — | — | — | (895) | ||||||||||||||||||||||||||||||||||||||||||||||||||||||
| Shares acquired to satisfy minimum required federal and state tax withholding on vesting restricted stock and units | (4) | — | — | — | — | (29) | — | — | — | — | (29) | ||||||||||||||||||||||||||||||||||||||||||||||||||||||
| Dividends declared | — | — | — | — | — | — | (24,071) | — | — | — | (24,071) | ||||||||||||||||||||||||||||||||||||||||||||||||||||||
| Exchange of noncontrolling interest for common stock | 5,381 | 4 | (5,381) | (5) | 73,247 | — | — | (2,037) | (71,050) | — | 159 | ||||||||||||||||||||||||||||||||||||||||||||||||||||||
| Net income (loss) | — | — | — | — | — | — | 17,188 | — | 45 | 4,149 | 21,382 | ||||||||||||||||||||||||||||||||||||||||||||||||||||||
| Other comprehensive income (loss) | — | — | — | — | — | — | — | 18,595 | 146 | — | 18,741 | ||||||||||||||||||||||||||||||||||||||||||||||||||||||
| Rebalancing of ownership percentage between Company and Operating Partnership | — | — | — | — | (297) | — | — | 74 | 223 | — | 0 | ||||||||||||||||||||||||||||||||||||||||||||||||||||||
| Balance, September 30, 2020 | 120,268 | $ | 120 | 0 | $ | 0 | $ | 1,726,339 | $ | (54,543) | $ | (126,965) | $ | (28,448) | $ | 0 | $ | 5,291 | $ | 1,521,794 | |||||||||||||||||||||||||||||||||||||||||||||
| Shareholders’ Equity | |||||||||||||||||||||||||||||||||||||||||
Class A Common Stock | Class B Common Stock | Additional Paid- in-Capital | Treasury Stock | Retained Earnings (Dividends in Excess of Earnings) | Accumulated Other Comprehensive Income (Loss) | Noncontrolling Interests | Total Equity | ||||||||||||||||||||||||||||||||||
Shares | Par | Shares | Par | Operating Partnership | Consolidated Joint Ventures | ||||||||||||||||||||||||||||||||||||
| Balance, June 30, 2019 | 107,551 | $ | 108 | 12,159 | $ | 12 | $ | 1,526,469 | $ | (41,535 | ) | $ | (30,847 | ) | $ | 12,171 | $ | 172,466 | $ | 9,230 | $ | 1,648,074 | |||||||||||||||||||
| Contributions | — | — | — | — | — | — | — | — | — | 306 | 306 | ||||||||||||||||||||||||||||||
| Distributions | — | — | — | — | — | — | — | — | (4,283 | ) | (751 | ) | (5,034 | ) | |||||||||||||||||||||||||||
| Amortization of equity based compensation | — | — | — | — | 3,575 | — | — | — | — | — | 3,575 | ||||||||||||||||||||||||||||||
| Re-issuance of treasury stock | 24 | — | — | — | — | — | — | — | — | — | — | ||||||||||||||||||||||||||||||
| Shares acquired to satisfy minimum required federal and state tax withholding on vesting restricted stock and units | (1 | ) | — | — | — | — | (21 | ) | — | — | — | — | (21 | ) | |||||||||||||||||||||||||||
| Dividends declared | — | — | — | — | — | — | (36,589 | ) | — | — | — | (36,589 | ) | ||||||||||||||||||||||||||||
| Net income (loss) | — | — | — | — | — | — | 27,576 | — | 3,308 | 64 | 30,948 | ||||||||||||||||||||||||||||||
| Other comprehensive income (loss) | — | — | — | — | — | — | — | (1,804 | ) | (205 | ) | — | (2,009 | ) | |||||||||||||||||||||||||||
| Rebalancing of ownership percentage between Company and Operating Partnership | — | — | — | — | (445 | ) | — | — | — | 445 | — | — | |||||||||||||||||||||||||||||
| Balance, September 30, 2019 | 107,574 | $ | 108 | 12,159 | $ | 12 | $ | 1,529,599 | $ | (41,556 | ) | $ | (39,860 | ) | $ | 10,367 | $ | 171,731 | $ | 8,849 | $ | 1,639,250 | |||||||||||||||||||
| Shareholders’ Equity | |||||||||||||||||||||||||||||||||||||||||||||||||||||||||||||||||
| Class A Common Stock | Class B Common Stock | Additional Paid- in-Capital | Treasury Stock | Retained Earnings (Dividends in Excess of Earnings) | Accumulated Other Comprehensive Income (Loss) | Noncontrolling Interests | Total Equity | ||||||||||||||||||||||||||||||||||||||||||||||||||||||||||
| Shares | Par | Shares | Par | Operating Partnership | Consolidated Joint Ventures | ||||||||||||||||||||||||||||||||||||||||||||||||||||||||||||
| Balance, June 30, 2019 | 107,551 | $ | 108 | 12,159 | $ | 12 | $ | 1,526,469 | $ | (41,535) | $ | (30,847) | $ | 12,171 | $ | 172,466 | $ | 9,230 | $ | 1,648,074 | |||||||||||||||||||||||||||||||||||||||||||||
| Contributions | — | — | — | — | — | — | — | — | — | 306 | 306 | ||||||||||||||||||||||||||||||||||||||||||||||||||||||
| Distributions | — | — | — | — | — | — | — | — | (4,283) | (751) | (5,034) | ||||||||||||||||||||||||||||||||||||||||||||||||||||||
| Amortization of equity based compensation | — | — | — | — | 3,575 | — | — | — | — | — | 3,575 | ||||||||||||||||||||||||||||||||||||||||||||||||||||||
| Re-issuance of treasury stock | 24 | — | — | — | — | — | — | — | — | — | — | ||||||||||||||||||||||||||||||||||||||||||||||||||||||
| Shares acquired to satisfy minimum required federal and state tax withholding on vesting restricted stock and units | (1) | — | — | — | — | (21) | — | — | — | — | (21) | ||||||||||||||||||||||||||||||||||||||||||||||||||||||
| Dividends declared | — | — | — | — | — | — | (36,589) | — | — | — | (36,589) | ||||||||||||||||||||||||||||||||||||||||||||||||||||||
| Net income (loss) | — | — | — | — | — | — | 27,576 | — | 3,308 | 64 | 30,948 | ||||||||||||||||||||||||||||||||||||||||||||||||||||||
| Other comprehensive income (loss) | — | — | — | — | — | — | — | (1,804) | (205) | — | (2,009) | ||||||||||||||||||||||||||||||||||||||||||||||||||||||
| Rebalancing of ownership percentage between Company and Operating Partnership | — | — | — | — | (445) | — | — | 0 | 445 | — | — | ||||||||||||||||||||||||||||||||||||||||||||||||||||||
| Balance, September 30, 2019 | 107,574 | $ | 108 | 12,159 | $ | 12 | $ | 1,529,599 | $ | (41,556) | $ | (39,860) | $ | 10,367 | $ | 171,731 | $ | 8,849 | $ | 1,639,250 | |||||||||||||||||||||||||||||||||||||||||||||
| Shareholders’ Equity | |||||||||||||||||||||||||||||||||||||||||
Class A Common Stock | Class B Common Stock | Additional Paid- in-Capital | Treasury Stock | Retained Earnings (Dividends in Excess of Earnings) | Accumulated Other Comprehensive Income (Loss) | Noncontrolling Interests | Total Equity | ||||||||||||||||||||||||||||||||||
Shares | Par | Shares | Par | Operating Partnership | Consolidated Joint Ventures | ||||||||||||||||||||||||||||||||||||
| Balance, June 30, 2018 | 97,938 | $ | 99 | 13,318 | $ | 13 | $ | 1,370,092 | $ | (32,793 | ) | $ | (12,106 | ) | $ | (9,855 | ) | $ | 185,158 | $ | 11,854 | $ | 1,512,462 | ||||||||||||||||||
| Contributions | — | — | — | — | — | — | — | — | — | 739 | 739 | ||||||||||||||||||||||||||||||
| Distributions | — | — | — | — | — | — | — | — | (4,292 | ) | (10,608 | ) | (14,900 | ) | |||||||||||||||||||||||||||
| Amortization of equity based compensation | — | — | — | — | 2,162 | — | — | — | — | — | 2,162 | ||||||||||||||||||||||||||||||
| Grants of restricted stock | 5 | — | — | — | — | — | — | — | — | — | — | ||||||||||||||||||||||||||||||
| Dividends declared | — | — | — | — | — | — | (31,931 | ) | — | — | — | (31,931 | ) | ||||||||||||||||||||||||||||
| Exchange of noncontrolling interest for common stock | 200 | — | (200 | ) | — | 3,000 | — | — | (24 | ) | (2,774 | ) | — | 202 | |||||||||||||||||||||||||||
| Net income (loss) | — | — | — | — | — | — | 66,630 | — | 8,991 | 7,843 | 83,464 | ||||||||||||||||||||||||||||||
| Other comprehensive income (loss) | — | — | — | — | — | — | — | 1,276 | 169 | — | 1,445 | ||||||||||||||||||||||||||||||
| Rebalancing of ownership percentage between Company and Operating Partnership | — | — | — | — | (238 | ) | — | — | 21 | 217 | — | — | |||||||||||||||||||||||||||||
| Balance, September 30, 2018 | 98,143 | $ | 99 | 13,118 | $ | 13 | $ | 1,375,016 | $ | (32,793 | ) | $ | 22,593 | $ | (8,582 | ) | $ | 187,469 | $ | 9,828 | $ | 1,553,643 | |||||||||||||||||||
| Shareholders’ Equity | |||||||||||||||||||||||||||||||||||||||||||||||||||||||||||||||||
| Class A Common Stock | Class B Common Stock | Additional Paid- in-Capital | Treasury Stock | Retained Earnings (Dividends in Excess of Earnings) | Accumulated Other Comprehensive Income (Loss) | Noncontrolling Interests | Total Equity | ||||||||||||||||||||||||||||||||||||||||||||||||||||||||||
| Shares | Par | Shares | Par | Operating Partnership | Consolidated Joint Ventures | ||||||||||||||||||||||||||||||||||||||||||||||||||||||||||||
| Balance, December 31, 2019 | 107,509 | $ | 108 | 12,160 | $ | 12 | $ | 1,532,384 | $ | (42,699) | $ | (35,746) | $ | 4,218 | $ | 172,054 | $ | 8,646 | $ | 1,638,977 | |||||||||||||||||||||||||||||||||||||||||||||
| Contributions | — | — | — | — | — | — | — | — | — | 860 | 860 | ||||||||||||||||||||||||||||||||||||||||||||||||||||||
| Distributions | — | — | — | — | — | — | — | — | (6,664) | (9,632) | (16,296) | ||||||||||||||||||||||||||||||||||||||||||||||||||||||
| Amortization of equity based compensation | — | — | — | — | 20,957 | — | — | — | — | — | 20,957 | ||||||||||||||||||||||||||||||||||||||||||||||||||||||
| Issuance of Purchase Right | — | — | — | — | 8,425 | — | — | — | — | — | 8,425 | ||||||||||||||||||||||||||||||||||||||||||||||||||||||
| Purchase of treasury stock | (334) | — | — | — | — | (2,583) | — | — | — | — | (2,583) | ||||||||||||||||||||||||||||||||||||||||||||||||||||||
| Re-issuance of treasury stock | 1,466 | 1 | — | — | (1) | — | — | — | — | — | — | ||||||||||||||||||||||||||||||||||||||||||||||||||||||
| Shares acquired to satisfy minimum required federal and state tax withholding on vesting restricted stock and units | (509) | (1) | — | — | — | (9,261) | — | — | — | — | (9,262) | ||||||||||||||||||||||||||||||||||||||||||||||||||||||
| Forfeitures | (24) | — | — | — | — | — | — | — | — | — | — | ||||||||||||||||||||||||||||||||||||||||||||||||||||||
| Dividends declared | — | — | — | — | — | — | (82,693) | — | — | — | (82,693) | ||||||||||||||||||||||||||||||||||||||||||||||||||||||
| Exchange of noncontrolling interest for common stock | 12,160 | 12 | (12,160) | (12) | 165,788 | — | — | (6,953) | (158,613) | — | 222 | ||||||||||||||||||||||||||||||||||||||||||||||||||||||
CECL Adoption | — | — | — | — | — | — | (5,797) | — | — | — | (5,797) | ||||||||||||||||||||||||||||||||||||||||||||||||||||||
| Net income (loss) | — | — | — | — | — | — | (2,729) | — | (561) | 5,417 | 2,127 | ||||||||||||||||||||||||||||||||||||||||||||||||||||||
| Other comprehensive income (loss) | — | — | — | — | — | — | — | (27,935) | (5,208) | — | (33,143) | ||||||||||||||||||||||||||||||||||||||||||||||||||||||
| Rebalancing of ownership percentage between Company and Operating Partnership | — | — | — | — | (1,214) | — | — | 2,222 | (1,008) | — | — | ||||||||||||||||||||||||||||||||||||||||||||||||||||||
| Balance, September 30, 2020 | 120,268 | $ | 120 | 0 | $ | 0 | $ | 1,726,339 | $ | (54,543) | $ | (126,965) | $ | (28,448) | $ | 0 | $ | 5,291 | $ | 1,521,794 | |||||||||||||||||||||||||||||||||||||||||||||
| Shareholders’ Equity | |||||||||||||||||||||||||||||||||||||||||
Class A Common Stock | Class B Common Stock | Additional Paid- in-Capital | Treasury Stock | Retained Earnings (Dividends in Excess of Earnings) | Accumulated Other Comprehensive Income (Loss) | Noncontrolling Interests | Total Equity | ||||||||||||||||||||||||||||||||||
Shares | Par | Shares | Par | Operating Partnership | Consolidated Joint Ventures | ||||||||||||||||||||||||||||||||||||
| Balance, December 31, 2018 | 103,941 | $ | 105 | 13,118 | $ | 13 | $ | 1,471,157 | $ | (32,815 | ) | $ | 11,342 | $ | (4,649 | ) | $ | 188,427 | $ | 10,055 | $ | 1,643,635 | |||||||||||||||||||
| Contributions | — | — | — | — | — | — | — | — | — | 498 | 498 | ||||||||||||||||||||||||||||||
| Distributions | — | — | — | — | — | — | — | — | (12,821 | ) | (1,013 | ) | (13,834 | ) | |||||||||||||||||||||||||||
| Amortization of equity based compensation | — | — | — | — | 18,336 | — | — | — | — | — | 18,336 | ||||||||||||||||||||||||||||||
| Grants of restricted stock | 1,478 | 1 | — | — | (1 | ) | — | — | — | — | — | — | |||||||||||||||||||||||||||||
| Purchase of treasury stock | (40 | ) | — | — | — | — | (637 | ) | — | — | — | — | (637 | ) | |||||||||||||||||||||||||||
| Re-issuance of treasury stock | 92 | — | — | — | — | — | — | — | — | — | — | ||||||||||||||||||||||||||||||
| Shares acquired to satisfy minimum required federal and state tax withholding on vesting restricted stock and units | (462 | ) | — | — | — | — | (8,104 | ) | — | — | — | — | (8,104 | ) | |||||||||||||||||||||||||||
| Forfeitures | (9 | ) | — | — | — | — | — | — | — | — | — | — | |||||||||||||||||||||||||||||
| Dividends declared | — | — | — | — | — | — | (109,375 | ) | — | — | — | (109,375 | ) | ||||||||||||||||||||||||||||
| Stock dividends | 1,434 | 1 | 181 | — | 23,822 | — | (23,823 | ) | — | — | — | — | |||||||||||||||||||||||||||||
| Exchange of noncontrolling interest for common stock | 1,140 | 1 | (1,140 | ) | (1 | ) | 16,449 | — | — | 64 | (16,109 | ) | — | 404 | |||||||||||||||||||||||||||
| Net income (loss) | — | — | — | — | — | — | 81,996 | — | 10,247 | (691 | ) | 91,552 | |||||||||||||||||||||||||||||
| Other comprehensive income (loss) | — | — | — | — | — | — | — | 14,935 | 1,840 | — | 16,775 | ||||||||||||||||||||||||||||||
| Rebalancing of ownership percentage between Company and Operating Partnership | — | — | — | — | (164 | ) | — | — | 17 | 147 | — | — | |||||||||||||||||||||||||||||
| Balance, September 30, 2019 | 107,574 | $ | 108 | 12,159 | $ | 12 | $ | 1,529,599 | $ | (41,556 | ) | $ | (39,860 | ) | $ | 10,367 | $ | 171,731 | $ | 8,849 | $ | 1,639,250 | |||||||||||||||||||
| Shareholders’ Equity | |||||||||||||||||||||||||||||||||||||||||||||||||||||||||||||||||
| Class A Common Stock | Class B Common Stock | Additional Paid- in-Capital | Treasury Stock | Retained Earnings (Dividends in Excess of Earnings) | Accumulated Other Comprehensive Income (Loss) | Noncontrolling Interests | Total Equity | ||||||||||||||||||||||||||||||||||||||||||||||||||||||||||
| Shares | Par | Shares | Par | Operating Partnership | Consolidated Joint Ventures | ||||||||||||||||||||||||||||||||||||||||||||||||||||||||||||
| Balance, December 31, 2018 | 103,941 | $ | 105 | 13,118 | $ | 13 | $ | 1,471,157 | $ | (32,815) | $ | 11,342 | $ | (4,649) | $ | 188,427 | $ | 10,055 | $ | 1,643,635 | |||||||||||||||||||||||||||||||||||||||||||||
| Contributions | — | — | — | — | — | — | — | — | — | 498 | 498 | ||||||||||||||||||||||||||||||||||||||||||||||||||||||
| Distributions | — | — | — | — | — | — | — | — | (12,821) | (1,013) | (13,834) | ||||||||||||||||||||||||||||||||||||||||||||||||||||||
| Amortization of equity based compensation | — | — | — | — | 18,336 | — | — | — | — | — | 18,336 | ||||||||||||||||||||||||||||||||||||||||||||||||||||||
| Grants of restricted stock | 1,478 | 1 | — | — | (1) | — | — | — | — | — | — | ||||||||||||||||||||||||||||||||||||||||||||||||||||||
| Purchase of treasury stock | (40) | — | — | — | — | (637) | — | — | — | — | (637) | ||||||||||||||||||||||||||||||||||||||||||||||||||||||
| Re-issuance of treasury stock | 92 | — | — | — | — | — | — | — | — | — | — | ||||||||||||||||||||||||||||||||||||||||||||||||||||||
| Shares acquired to satisfy minimum required federal and state tax withholding on vesting restricted stock and units | (462) | — | — | — | — | (8,104) | — | — | — | — | (8,104) | ||||||||||||||||||||||||||||||||||||||||||||||||||||||
| Forfeitures | (9) | — | — | — | — | — | — | — | — | — | — | ||||||||||||||||||||||||||||||||||||||||||||||||||||||
| Dividends declared | — | — | — | — | — | — | (109,375) | — | — | — | (109,375) | ||||||||||||||||||||||||||||||||||||||||||||||||||||||
| Stock dividends | 1,434 | 1 | 181 | — | 23,822 | — | (23,823) | — | — | — | — | ||||||||||||||||||||||||||||||||||||||||||||||||||||||
| Exchange of noncontrolling interest for common stock | 1,140 | 1 | (1,140) | (1) | 16,449 | — | — | 64 | (16,109) | — | 404 | ||||||||||||||||||||||||||||||||||||||||||||||||||||||
| Net income (loss) | — | — | — | — | — | — | 81,996 | — | 10,247 | (691) | 91,552 | ||||||||||||||||||||||||||||||||||||||||||||||||||||||
| Other comprehensive income (loss) | — | — | — | — | — | — | — | 14,935 | 1,840 | — | 16,775 | ||||||||||||||||||||||||||||||||||||||||||||||||||||||
| Rebalancing of ownership percentage between Company and Operating Partnership | — | — | — | — | (164) | — | — | 17 | 147 | — | — | ||||||||||||||||||||||||||||||||||||||||||||||||||||||
| Balance, September 30, 2019 | 107,574 | $ | 108 | 12,159 | $ | 12 | $ | 1,529,599 | $ | (41,556) | $ | (39,860) | $ | 10,367 | $ | 171,731 | $ | 8,849 | $ | 1,639,250 | |||||||||||||||||||||||||||||||||||||||||||||
| Shareholders’ Equity | |||||||||||||||||||||||||||||||||||||||||
Class A Common Stock | Class B Common Stock | Additional Paid- in-Capital | Treasury Stock | Retained Earnings (Dividends in Excess of Earnings) | Accumulated Other Comprehensive Income (Loss) | Noncontrolling Interests | Total Equity | ||||||||||||||||||||||||||||||||||
Shares | Par | Shares | Par | Operating Partnership | Consolidated Joint Ventures | ||||||||||||||||||||||||||||||||||||
| Balance, December 31, 2017 | 93,641 | $ | 94 | 17,668 | $ | 18 | $ | 1,306,136 | $ | (31,956 | ) | $ | (39,112 | ) | $ | (212 | ) | $ | 240,861 | $ | 12,317 | $ | 1,488,146 | ||||||||||||||||||
| Contributions | — | — | — | — | — | — | — | — | — | 5,779 | 5,779 | ||||||||||||||||||||||||||||||
| Distributions | — | — | — | — | — | — | — | — | (13,191 | ) | (24,400 | ) | (37,591 | ) | |||||||||||||||||||||||||||
| Amortization of equity based compensation | — | — | — | — | 6,667 | — | — | — | — | — | 6,667 | ||||||||||||||||||||||||||||||
| Grants of restricted stock | 34 | — | — | — | — | — | — | — | — | — | — | ||||||||||||||||||||||||||||||
| Shares acquired to satisfy minimum required federal and state tax withholding on vesting restricted stock and units | (56 | ) | — | — | — | — | (837 | ) | — | — | — | — | (837 | ) | |||||||||||||||||||||||||||
| Forfeitures | (26 | ) | — | — | — | — | — | — | — | — | — | — | |||||||||||||||||||||||||||||
| Dividends declared | — | — | — | — | — | — | (94,206 | ) | — | — | — | (94,206 | ) | ||||||||||||||||||||||||||||
| Exchange of noncontrolling interest for common stock | 4,550 | 5 | (4,550 | ) | (5 | ) | 63,109 | — | — | (167 | ) | (62,428 | ) | — | 514 | ||||||||||||||||||||||||||
| Net income (loss) | — | — | — | — | — | — | 155,911 | — | 22,786 | 16,132 | 194,829 | ||||||||||||||||||||||||||||||
| Other comprehensive income (loss) | — | — | — | — | — | — | — | (8,230 | ) | (1,428 | ) | — | (9,658 | ) | |||||||||||||||||||||||||||
| Rebalancing of ownership percentage between Company and Operating Partnership | — | — | — | — | (896 | ) | — | — | 27 | 869 | — | — | |||||||||||||||||||||||||||||
| Balance, September 30, 2018 | 98,143 | $ | 99 | 13,118 | $ | 13 | $ | 1,375,016 | $ | (32,793 | ) | $ | 22,593 | $ | (8,582 | ) | $ | 187,469 | $ | 9,828 | $ | 1,553,643 | |||||||||||||||||||
| Nine Months Ended September 30, | |||||||||||||||||
| 2020 | 2019 | ||||||||||||||||
| Cash flows from operating activities: | |||||||||||||||||
| Net income (loss) | $ | 2,127 | $ | 91,552 | |||||||||||||
| Adjustments to reconcile net income (loss) to net cash provided by (used in) operating activities: | |||||||||||||||||
| (Gain) loss on extinguishment/defeasance of debt | (22,244) | 1,070 | |||||||||||||||
| Depreciation and amortization | 29,642 | 29,192 | |||||||||||||||
| Unrealized (gain) loss on derivative instruments | 119 | (889) | |||||||||||||||
| Unrealized (gain) loss on equity securities | 132 | (1,341) | |||||||||||||||
| Unrealized (gain) loss on Agency interest-only securities | (183) | (38) | |||||||||||||||
| Unrealized (gain) loss on investment in mutual fund | (95) | (308) | |||||||||||||||
| Provision for (release of) loan loss reserves | 23,340 | 600 | |||||||||||||||
| Impairment of real estate | 0 | 1,350 | |||||||||||||||
| Amortization of equity based compensation | 20,957 | 18,336 | |||||||||||||||
| Amortization of deferred financing costs included in interest expense | 13,451 | 8,460 | |||||||||||||||
| Amortization of premium on mortgage loan financing | (866) | (1,300) | |||||||||||||||
| Amortization of above- and below-market lease intangibles | (1,720) | (867) | |||||||||||||||
| Amortization of premium/(accretion) of discount and other fees on loans | (12,467) | (14,405) | |||||||||||||||
| Amortization of premium/(accretion) of discount and other fees on securities | 472 | 82 | |||||||||||||||
| Realized (gain) loss on sale of mortgage loan receivables held for sale | (8,052) | (38,589) | |||||||||||||||
| Realized (gain) loss on sale of mortgage loan receivables held for investment | 6,665 | 0 | |||||||||||||||
| Realized (gain) loss on disposition of loan | 51 | 0 | |||||||||||||||
| Realized (gain) loss on securities | 12,815 | (10,726) | |||||||||||||||
| Realized (gain) loss on sale of real estate, net | (32,116) | (963) | |||||||||||||||
| Realized gain on sale of derivative instruments | (211) | 84 | |||||||||||||||
| Origination of mortgage loan receivables held for sale | (212,845) | (554,115) | |||||||||||||||
| Repayment of mortgage loan receivables held for sale | 369 | 492 | |||||||||||||||
| Proceeds from sales of mortgage loan receivables held for sale | 312,300 | 574,303 | |||||||||||||||
| (Income) loss from investments in unconsolidated joint ventures in excess of distributions received | (1,359) | (3,617) | |||||||||||||||
| Distributions from operations of investment in unconsolidated joint ventures | 0 | 3,067 | |||||||||||||||
| Deferred tax asset (liability) | 6,822 | 7,405 | |||||||||||||||
| Changes in operating assets and liabilities: | |||||||||||||||||
| Accrued interest receivable | 2,807 | 4,275 | |||||||||||||||
| Other assets | (12,503) | (5,921) | |||||||||||||||
| Accrued expenses and other liabilities | (39,399) | (33,010) | |||||||||||||||
| Net cash provided by (used in) operating activities | 88,009 | 64,245 | |||||||||||||||
| Nine Months Ended September 30, | |||||||
| 2019 | 2018 | ||||||
| Cash flows from operating activities: | |||||||
| Net income (loss) | $ | 91,552 | $ | 194,829 | |||
| Adjustments to reconcile net income (loss) to net cash provided by (used in) operating activities: | |||||||
| (Gain) loss on extinguishment/defeasance of debt | 1,070 | 4,392 | |||||
| Depreciation and amortization | 29,192 | 31,896 | |||||
| Unrealized (gain) loss on derivative instruments | (889 | ) | (1,356 | ) | |||
| Unrealized (gain) loss on equity securities | (1,341 | ) | — | ||||
| Unrealized (gain) loss on Agency interest-only securities | (38 | ) | (456 | ) | |||
| Unrealized (gain) loss on investment in mutual fund | (308 | ) | (204 | ) | |||
| Provision for loan losses | 600 | 13,600 | |||||
| Impairment of real estate | 1,350 | — | |||||
| Amortization of equity based compensation | 18,336 | 6,667 | |||||
| Amortization of deferred financing costs included in interest expense | 8,460 | 8,020 | |||||
| Amortization of premium on mortgage loan financing | (1,300 | ) | (762 | ) | |||
| Amortization of above- and below-market lease intangibles | (867 | ) | (1,286 | ) | |||
| Amortization of premium/(accretion) of discount and other fees on loans | (14,405 | ) | (13,795 | ) | |||
| Amortization of premium/(accretion) of discount and other fees on securities | 82 | 2,944 | |||||
| Realized (gain) loss on sale of mortgage loan receivables held for sale | (38,589 | ) | (12,893 | ) | |||
| Realized (gain) loss on securities | (10,726 | ) | 4,896 | ||||
| Realized (gain) loss on sale of real estate, net | (963 | ) | (96,341 | ) | |||
| Realized gain on sale of derivative instruments | 84 | 192 | |||||
| Origination of mortgage loan receivables held for sale | (554,115 | ) | (1,115,218 | ) | |||
| Purchases of mortgage loan receivables held for sale | (9,934 | ) | — | ||||
| Repayment of mortgage loan receivables held for sale | 492 | 1,324 | |||||
| Proceeds from sales of mortgage loan receivables held for sale | 574,303 | 926,889 | |||||
| (Income) loss from investments in unconsolidated joint ventures in excess of distributions received | (3,617 | ) | (466 | ) | |||
| Distributions from operations of investment in unconsolidated joint ventures | 3,067 | — | |||||
| Deferred tax asset (liability) | 7,405 | (4,484 | ) | ||||
| Changes in operating assets and liabilities: | |||||||
| Accrued interest receivable | 4,275 | (1,968 | ) | ||||
| Other assets | (5,921 | ) | 7,503 | ||||
| Accrued expenses and other liabilities | (33,010 | ) | (5,262 | ) | |||
| Net cash provided by (used in) operating activities | 64,245 | (51,339 | ) | ||||
| Nine Months Ended September 30, | |||||||||||||||||
| 2020 | 2019 | ||||||||||||||||
| Cash flows from investing activities: | |||||||||||||||||
| Origination of mortgage loan receivables held for investment | (343,216) | (985,825) | |||||||||||||||
| Repayment of mortgage loan receivables held for investment | 568,151 | 1,191,908 | |||||||||||||||
| Proceeds from sale of mortgage loan receivables held for investment, at amortized cost | 172,412 | 0 | |||||||||||||||
| Purchases of real estate securities | (439,584) | (1,192,852) | |||||||||||||||
| Repayment of real estate securities | 105,446 | 178,468 | |||||||||||||||
| Basis recovery of Agency interest-only securities | 5,976 | 9,339 | |||||||||||||||
| Proceeds from sales of real estate securities | 566,452 | 534,249 | |||||||||||||||
| Purchases of real estate | (6,239) | (13,905) | |||||||||||||||
| Capital improvements of real estate | (2,489) | (3,606) | |||||||||||||||
| Proceeds from sale of real estate | 62,596 | 10,794 | |||||||||||||||
| Capital contributions and advances to investment in unconsolidated joint ventures | 0 | (56,393) | |||||||||||||||
| Capital distribution from investment in unconsolidated joint ventures | 636 | 46,019 | |||||||||||||||
| Capitalization of interest on investment in unconsolidated joint ventures | 0 | (142) | |||||||||||||||
| Purchase of FHLB stock | 0 | (3,704) | |||||||||||||||
| Purchase of derivative instruments | (110) | (210) | |||||||||||||||
| Sale of derivative instruments | 447 | 101 | |||||||||||||||
| Net cash provided by (used in) investing activities | 690,478 | (285,759) | |||||||||||||||
| Cash flows from financing activities: | |||||||||||||||||
| Deferred financing costs paid | (17,515) | (4,453) | |||||||||||||||
| Proceeds from borrowings under debt obligations | 9,132,914 | 10,186,669 | |||||||||||||||
| Repayment of borrowings under debt obligations | (9,217,889) | (9,771,014) | |||||||||||||||
| Cash dividends paid to Class A common shareholders | (95,152) | (144,306) | |||||||||||||||
| Capital distributed to noncontrolling interests in operating partnership | (6,664) | (12,821) | |||||||||||||||
| Capital contributed by noncontrolling interests in consolidated joint ventures | 860 | 498 | |||||||||||||||
| Capital distributed to noncontrolling interests in consolidated joint ventures | (9,632) | (1,013) | |||||||||||||||
| Payment of liability assumed in exchange for shares for the minimum withholding taxes on vesting restricted stock | (9,261) | (8,106) | |||||||||||||||
| Purchase of treasury stock | (2,583) | (637) | |||||||||||||||
| Issuance of Purchase Right | 8,425 | 0 | |||||||||||||||
| Net cash provided by (used in) financing activities | (216,497) | 244,817 | |||||||||||||||
| Net increase (decrease) in cash, cash equivalents and restricted cash | 561,990 | 23,303 | |||||||||||||||
| Cash, cash equivalents and restricted cash at beginning of period | 355,746 | 98,450 | |||||||||||||||
| Cash, cash equivalents and restricted cash at end of period | $ | 917,736 | $ | 121,753 | |||||||||||||
| Nine Months Ended September 30, | |||||||||||||||||
| 2020 | 2019 | ||||||||||||||||
| Supplemental information: | |||||||||||||||||
| Cash paid for interest, net of amounts capitalized | $ | 164,722 | $ | 164,429 | |||||||||||||
| Cash paid (received) for income taxes | 3,044 | 4,817 | |||||||||||||||
| Non-cash investing and financing activities: | |||||||||||||||||
| Securities and derivatives purchased, not settled | 0 | 7,000 | |||||||||||||||
| Securities and derivatives sold, not settled | 21 | 3,962 | |||||||||||||||
| Repayment in transit of mortgage loans receivable held for investment (other assets) | 107,652 | 6,120 | |||||||||||||||
| Repayment of mortgage loans receivable held for sale | 0 | 128 | |||||||||||||||
| Settlement of mortgage loan receivable held for investment by real estate, net | (25,177) | (17,851) | |||||||||||||||
| Transfer from mortgage loans receivable held for sale to mortgage loans receivable held for investment, net, at amortized cost | 0 | 35,940 | |||||||||||||||
| Real estate acquired in settlement of mortgage loan receivable held for investment, net | 25,435 | 17,851 | |||||||||||||||
| Net settlement of sale of real estate, subject to debt - real estate | (31,768) | (11,943) | |||||||||||||||
| Net settlement of sale of real estate, subject to debt - debt obligations | 31,768 | 11,943 | |||||||||||||||
| Exchange of noncontrolling interest for common stock | 158,625 | 16,110 | |||||||||||||||
| Change in deferred tax asset related to exchanges of noncontrolling interest for common stock | 223 | 0 | |||||||||||||||
| Increase in amount payable pursuant to tax receivable agreement | 0 | (11) | |||||||||||||||
| Rebalancing of ownership percentage between Company and Operating Partnership | (1,008) | 147 | |||||||||||||||
| Dividends declared, not paid | 26,236 | 2,384 | |||||||||||||||
| Stock dividends | 0 | 23,824 | |||||||||||||||
| Nine Months Ended September 30, | |||||||
| 2019 | 2018 | ||||||
| Cash flows from investing activities: | |||||||
| Origination of mortgage loan receivables held for investment | (985,825 | ) | (1,240,894 | ) | |||
| Repayment of mortgage loan receivables held for investment | 1,191,908 | 755,404 | |||||
| Purchases of real estate securities | (1,192,852 | ) | (303,021 | ) | |||
| Repayment of real estate securities | 178,468 | 93,185 | |||||
| Basis recovery of Agency interest-only securities | 9,339 | 14,898 | |||||
| Proceeds from sales of real estate securities | 534,249 | 306,109 | |||||
| Purchases of real estate | (13,905 | ) | (113,903 | ) | |||
| Capital improvements of real estate | (3,606 | ) | (4,822 | ) | |||
| Proceeds from sale of real estate | 10,794 | 153,398 | |||||
| Capital contributions and advances to investment in unconsolidated joint ventures | (56,393 | ) | (370 | ) | |||
| Capital distribution from investment in unconsolidated joint ventures | 46,019 | 1,250 | |||||
| Capitalization of interest on investment in unconsolidated joint ventures | (142 | ) | (1,074 | ) | |||
| Purchase of FHLB stock | (3,704 | ) | — | ||||
| Proceeds from sale of FHLB stock | — | 20,000 | |||||
| Purchase of derivative instruments | (210 | ) | (305 | ) | |||
| Sale of derivative instruments | 101 | 114 | |||||
| Net cash provided by (used in) investing activities | (285,759 | ) | (320,031 | ) | |||
| Cash flows from financing activities: | |||||||
| Deferred financing costs paid | (4,453 | ) | (2,975 | ) | |||
| Proceeds from borrowings under debt obligations | 10,186,669 | 4,401,648 | |||||
| Repayment of borrowings under debt obligations | (9,771,014 | ) | (3,969,654 | ) | |||
| Cash dividends paid to Class A common shareholders | (144,306 | ) | (122,770 | ) | |||
| Capital distributed to noncontrolling interests in operating partnership | (12,821 | ) | (13,191 | ) | |||
| Capital contributed by noncontrolling interests in consolidated joint ventures | 498 | 5,779 | |||||
| Capital distributed to noncontrolling interests in consolidated joint ventures | (1,013 | ) | (24,400 | ) | |||
| Payment of liability assumed in exchange for shares for the minimum withholding taxes on vesting restricted stock | (8,106 | ) | (837 | ) | |||
| Purchase of treasury stock | (637 | ) | — | ||||
| Net cash provided by (used in) financing activities | 244,817 | 273,600 | |||||
| Net increase (decrease) in cash, cash equivalents and restricted cash | 23,303 | (97,770 | ) | ||||
| Cash, cash equivalents and restricted cash at beginning of period | 98,450 | 182,683 | |||||
| Cash, cash equivalents and restricted cash at end of period | $ | 121,753 | $ | 84,913 | |||
| Nine Months Ended September 30, | |||||||
| 2019 | 2018 | ||||||
| Supplemental information: | |||||||
| Cash paid for interest, net of amounts capitalized | $ | 164,429 | $ | 151,868 | |||
| Cash paid (received) for income taxes | 4,817 | 5,718 | |||||
| Non-cash investing and financing activities: | |||||||
| Securities and derivatives purchased, not settled | 7,000 | 14 | |||||
| Securities and derivatives sold, not settled | 3,962 | — | |||||
| Repayment in transit of mortgage loans receivable held for investment (other assets) | 6,120 | 31,764 | |||||
| Repayment of mortgage loans receivable held for sale | 128 | — | |||||
| Settlement of mortgage loan receivable held for investment by real estate, net | (17,851 | ) | — | ||||
| Transfer from mortgage loans receivable held for sale to mortgage loans receivable held for investment, net, at amortized cost | 35,940 | 55,403 | |||||
| Proceeds from sale of real estate | — | 1,421 | |||||
| Real estate acquired in settlement of mortgage loan receivable held for investment, net | 17,851 | — | |||||
| Net settlement of sale of real estate, subject to debt - real estate | (11,943 | ) | — | ||||
| Net settlement of sale of real estate, subject to debt - debt obligations | 11,943 | — | |||||
| Reduction in proceeds from sales of real estate | — | 62,417 | |||||
| Assumption of debt obligations by real estate buyer/defeasance of debt and related costs | — | (62,417 | ) | ||||
| Exchange of noncontrolling interest for common stock | 16,110 | 62,433 | |||||
| Change in deferred tax asset related to exchanges of noncontrolling interest for common stock | — | 428 | |||||
| Increase in amount payable pursuant to tax receivable agreement | (11 | ) | (86 | ) | |||
| Rebalancing of ownership percentage between Company and Operating Partnership | 147 | 869 | |||||
| Dividends declared, not paid | 2,384 | 1,964 | |||||
| Stock dividends | 23,824 | — | |||||
| September 30, 2020 | September 30, 2019 | December 31, 2019 | ||||||||||||||||||
| Cash and cash equivalents | $ | 875,839 | $ | 83,097 | $ | 58,171 | ||||||||||||||
| Restricted cash | 41,897 | 38,656 | 297,575 | |||||||||||||||||
| Total cash, cash equivalents and restricted cash shown in the consolidated statement of cash flows | $ | 917,736 | $ | 121,753 | $ | 355,746 | ||||||||||||||
| September 30, 2019 | September 30, 2018 | December 31, 2018 | |||||||||
| Cash and cash equivalents | $ | 83,097 | $ | 49,625 | $ | 67,878 | |||||
| Restricted cash | 38,656 | 35,288 | 30,572 | ||||||||
| Total cash, cash equivalents and restricted cash shown in the consolidated statement of cash flows | $ | 121,753 | $ | 84,913 | $ | 98,450 | |||||
Outstanding Face Amount | Carrying Value | Weighted Average Yield (1) | Remaining Maturity (years) | |||||||||
| Mortgage loan receivables held for investment, net, at amortized cost: | ||||||||||||
| Mortgage loans held by consolidated subsidiaries: | ||||||||||||
| First mortgage loans(2) | $ | 3,116,050 | $ | 3,098,241 | 7.14 | % | 1.27 | |||||
| Mezzanine loans | 133,661 | 133,202 | 10.87 | % | 3.76 | |||||||
| Total mortgage loans held by consolidated subsidiaries | 3,249,711 | 3,231,443 | 7.29 | % | 1.37 | |||||||
| Provision for loan losses | N/A | (18,500 | ) | |||||||||
| Total mortgage loan receivables held for investment, net, at amortized cost | 3,249,711 | 3,212,943 | ||||||||||
| Mortgage loan receivables held for sale: | ||||||||||||
| First mortgage loans | 173,957 | 174,214 | 4.59 | % | 9.68 | |||||||
| Total | $ | 3,423,668 | $ | 3,387,157 | 7.19 | % | 1.81 | |||||
| Outstanding Face Amount | Carrying Value | Weighted Average Yield (1) | Remaining Maturity (years) | ||||||||||||||||||||
| Mortgage loan receivables held for investment, net, at amortized cost: | |||||||||||||||||||||||
| Mortgage loans held by consolidated subsidiaries: | |||||||||||||||||||||||
| First mortgage loans | $ | 2,622,120 | $ | 2,608,933 | 6.59 | % | 1.03 | ||||||||||||||||
| Mezzanine loans | 122,604 | 122,321 | 10.90 | % | 2.65 | ||||||||||||||||||
| Total mortgage loans held by consolidated subsidiaries | 2,744,724 | 2,731,254 | 6.81 | % | 1.10 | ||||||||||||||||||
| Allowance for credit losses | N/A | (47,084) | |||||||||||||||||||||
| Total mortgage loan receivables held for investment, net, at amortized cost | 2,744,724 | 2,684,170 | |||||||||||||||||||||
| Mortgage loan receivables held for sale: | |||||||||||||||||||||||
| First mortgage loans | 30,513 | 30,553 | 4.05 | % | 9.43 | ||||||||||||||||||
| Total | $ | 2,775,237 | $ | 2,714,723 | 6.99 | % | 1.22 | ||||||||||||||||
(1)September 30, 2020 LIBOR rates are used to calculate weighted average yield for floating rate loans. |
Outstanding Face Amount | Carrying Value | Weighted Average Yield (1) | Remaining Maturity (years) | |||||||||
| Mortgage loan receivables held for investment, net, at amortized cost: | ||||||||||||
| Mortgage loans held by consolidated subsidiaries: | ||||||||||||
| First mortgage loans(2) | $ | 3,192,160 | $ | 3,170,788 | 7.70 | % | 1.18 | |||||
| Mezzanine loans | 148,221 | 147,602 | 10.89 | % | 4.35 | |||||||
| Total mortgage loans held by consolidated subsidiaries | 3,340,381 | 3,318,390 | 7.84 | % | 1.32 | |||||||
| Provision for loan losses | N/A | (17,900 | ) | |||||||||
| Total mortgage loan receivables held for investment, net, at amortized cost | 3,340,381 | 3,300,490 | ||||||||||
| Mortgage loan receivables held for sale: | ||||||||||||
| First mortgage loans | 181,905 | 182,439 | 5.46 | % | 9.75 | |||||||
| Total | $ | 3,522,286 | $ | 3,482,929 | 7.76 | % | 1.77 | |||||
| Outstanding Face Amount | Carrying Value | Weighted Average Yield (1) | Remaining Maturity (years) | ||||||||||||||||||||
| Mortgage loan receivables held for investment, net, at amortized cost: | |||||||||||||||||||||||
| Mortgage loans held by consolidated subsidiaries: | |||||||||||||||||||||||
| First mortgage loans | $ | 3,147,275 | $ | 3,127,173 | 6.77 | % | 1.35 | ||||||||||||||||
| Mezzanine loans | 130,322 | 129,863 | 10.97 | % | 3.26 | ||||||||||||||||||
| Total mortgage loans held by consolidated subsidiaries | 3,277,597 | 3,257,036 | 6.94 | % | 1.43 | ||||||||||||||||||
| Allowance for credit losses | N/A | (20,500) | |||||||||||||||||||||
| Total mortgage loan receivables held for investment, net, at amortized cost | 3,277,597 | 3,236,536 | |||||||||||||||||||||
| Mortgage loan receivables held for sale: | |||||||||||||||||||||||
| First mortgage loans | 122,748 | 122,325 | 4.20 | % | 9.99 | ||||||||||||||||||
| Total | $ | 3,400,345 | $ | 3,358,861 | 6.88 | % | 1.75 | ||||||||||||||||
22 |
| Mortgage loan receivables held for investment, net, at amortized cost: | |||||||||||||||
| Mortgage loans held by consolidated subsidiaries | Mortgage loans transferred but not considered sold | Provision for loan losses | Mortgage loan receivables held for sale | ||||||||||||
| Balance, December 31, 2018 | $ | 3,318,390 | $ | — | $ | (17,900 | ) | $ | 182,439 | ||||||
| Origination of mortgage loan receivables | 985,825 | — | — | 554,115 | |||||||||||
| Purchases of mortgage loan receivables | — | — | — | 9,934 | |||||||||||
| Repayment of mortgage loan receivables | (1,105,506 | ) | — | — | (620 | ) | |||||||||
| Proceeds from sales of mortgage loan receivables(1) | — | (15,504 | ) | — | (558,799 | ) | |||||||||
| Non-cash disposition of loans via foreclosure(2) | (17,611 | ) | — | — | — | ||||||||||
| Sale of loans, net | — | — | — | 38,589 | |||||||||||
| Transfer between held for investment and held for sale(1) | 35,940 | 15,504 | — | (51,444 | ) | ||||||||||
| Accretion/amortization of discount, premium and other fees | 14,405 | — | — | — | |||||||||||
| Provision for loan losses | — | — | (600 | ) | — | ||||||||||
| Balance, September 30, 2019 | $ | 3,231,443 | $ | — | $ | (18,500 | ) | $ | 174,214 | ||||||
| Mortgage loan receivables held for investment, net, at amortized cost: | |||||||||||||||||||||||
| Mortgage loans held by consolidated subsidiaries | Provision for current expected credit loss | Mortgage loan receivables held for sale | |||||||||||||||||||||
| Balance, December 31, 2019 | $ | 3,257,036 | $ | (20,500) | $ | 122,325 | |||||||||||||||||
| Origination of mortgage loan receivables | 343,216 | — | 212,845 | ||||||||||||||||||||
| Repayment of mortgage loan receivables | (675,281) | — | (369) | ||||||||||||||||||||
| Proceeds from sales of mortgage loan receivables | (172,412) | — | (312,300) | ||||||||||||||||||||
| Non-cash disposition of loans via foreclosure(1) | (27,107) | — | — | ||||||||||||||||||||
| Sale of loans, net | (6,665) | — | 8,052 | ||||||||||||||||||||
| Accretion/amortization of discount, premium and other fees | 12,467 | — | — | ||||||||||||||||||||
| Release of asset-specific loan loss provision via foreclosure(1) | — | 2,000 | — | ||||||||||||||||||||
| Provision for current expected credit loss (implementation impact)(2) | — | (4,964) | — | ||||||||||||||||||||
| Provision for current expected credit loss, net (impact to earnings)(2) | — | (15,620) | — | ||||||||||||||||||||
| Asset-specific provision for loan loss reserve | — | (8,000) | — | ||||||||||||||||||||
| Balance, September 30, 2020 | $ | 2,731,254 | $ | (47,084) | $ | 30,553 | |||||||||||||||||
(1)Refer to Note 5 Real Estate and Related Lease Intangibles, Net for further detail on foreclosure of real estate. |
| Mortgage loan receivables held for investment, net, at amortized cost: | |||||||||||
| Mortgage loans held by consolidated subsidiaries | Provision for loan losses | Mortgage loan receivables held for sale | |||||||||
| Balance, December 31, 2017 | $ | 3,282,462 | $ | (4,000 | ) | $ | 230,180 | ||||
| Origination of mortgage loan receivables | 1,240,894 | — | 1,115,218 | ||||||||
| Repayment of mortgage loan receivables | (787,167 | ) | — | (1,324 | ) | ||||||
| Proceeds from sales of mortgage loan receivables | — | — | (926,402 | ) | |||||||
| Sale of loans, net(1) | — | — | 12,893 | ||||||||
| Transfer between held for investment and held for sale(2) | 55,403 | — | (55,403 | ) | |||||||
| Accretion/amortization of discount, premium and other fees | 13,795 | — | — | ||||||||
| Provision for loan losses(3) | — | (13,600 | ) | — | |||||||
| Balance, September 30, 2018 | $ | 3,805,387 | $ | (17,600 | ) | $ | 375,162 | ||||
| Mortgage loan receivables held for investment, net, at amortized cost: | |||||||||||||||||||||||
| Mortgage loans held by consolidated subsidiaries | Mortgage loans transferred but not considered sold | Provision for loan losses | Mortgage loan receivables held for sale | ||||||||||||||||||||
| Balance, December 31, 2018 | $ | 3,318,390 | $ | — | $ | (17,900) | $ | 182,439 | |||||||||||||||
| Origination of mortgage loan receivables | 985,825 | — | — | 554,115 | |||||||||||||||||||
| Purchases of mortgage loan receivables | — | — | — | 9,934 | |||||||||||||||||||
| Repayment of mortgage loan receivables | (1,105,506) | — | — | (620) | |||||||||||||||||||
| Proceeds from sales of mortgage loan receivables(1) | — | (15,504) | — | (558,799) | |||||||||||||||||||
| Non-cash disposition of loan via foreclosure(2) | (17,611) | — | — | — | |||||||||||||||||||
| Sale of loans, net | — | — | — | 38,589 | |||||||||||||||||||
| Transfer between held for investment and held for sale(1) | 35,940 | 15,504 | — | (51,444) | |||||||||||||||||||
| Accretion/amortization of discount, premium and other fees | 14,405 | — | — | — | |||||||||||||||||||
| Provision for/(release of) loan loss reserves | — | — | (600) | — | |||||||||||||||||||
| Balance, September 30, 2019 | $ | 3,231,443 | $ | 0 | $ | (18,500) | $ | 174,214 | |||||||||||||||
| Three Months Ended September 30, | Nine Months Ended September 30, | ||||||||||||||
| 2019 | 2018 | 2019 | 2018 | ||||||||||||
| Allowance for loan losses at beginning of period | $ | 18,500 | $ | 7,300 | $ | 17,900 | $ | 4,000 | |||||||
| Provision for loan losses | — | 10,300 | 600 | 13,600 | |||||||||||
| Allowance for loan losses at end of period | $ | 18,500 | $ | 17,600 | $ | 18,500 | $ | 17,600 | |||||||
| September 30, 2019 | December 31, 2018 | ||||||||||||||
| Principal balance of loans on non-accrual status(1) | $ | 37,161 | $ | 36,850 | |||||||||||
| Three Months Ended September 30, | Nine Months Ended September 30, | |||||||||||||||||||||||||||||||
| 2020 | 2019 | 2020 | 2019 | |||||||||||||||||||||||||||||
| Allowance for credit losses at beginning of period | $ | 49,102 | $ | 18,500 | $ | 20,500 | $ | 17,900 | ||||||||||||||||||||||||
| Provision for current expected credit loss (implementation impact) | 0 | 0 | 4,964 | 0 | ||||||||||||||||||||||||||||
| Provision for current expected credit loss, net (impact to earnings) | (2,018) | 0 | 15,620 | 600 | ||||||||||||||||||||||||||||
| Additional asset-specific reserve | 0 | 0 | 8,000 | 0 | ||||||||||||||||||||||||||||
| Foreclosure of loans subject to asset-specific reserve | 0 | 0 | (2,000) | 0 | ||||||||||||||||||||||||||||
| Allowance for credit losses at end of period | $ | 47,084 | $ | 18,500 | $ | 47,084 | $ | 18,500 | ||||||||||||||||||||||||
| September 30, 2020 | December 31, 2019 | |||||||||||||||||||||||||||||||
| Carrying value of loans on non-accrual status, net of asset-specific reserve | $ | 201,517 | (1) | $ | 86,025 | (2) | ||||||||||||||||||||||||||
| Amortized Cost | ||||||||||||||||||||||||||||||||
| Geographic Region | ||||||||||||||||||||||||||||||||
| Northeast | $ | 779,956 | ||||||||||||||||||||||||||||||
| Southwest | 575,969 | |||||||||||||||||||||||||||||||
| South | 485,643 | |||||||||||||||||||||||||||||||
| Midwest | 469,497 | |||||||||||||||||||||||||||||||
| West | 343,909 | |||||||||||||||||||||||||||||||
| Subtotal loans | 2,654,974 | |||||||||||||||||||||||||||||||
| Individually impaired loans(1) | 76,280 | |||||||||||||||||||||||||||||||
| Total loans | $ | 2,731,254 | ||||||||||||||||||||||||||||||
| Vintage | ||||||||||||||||||||||||||||||||||||||||||||||||||||||||||||||
| Property Type | 2020 | 2019 | 2018 | 2017 | 2016 and Earlier | Total | ||||||||||||||||||||||||||||||||||||||||||||||||||||||||
| Multifamily | $ | 65,380 | $ | 299,648 | $ | 66,006 | $ | 24,562 | $ | 0 | $ | 455,596 | ||||||||||||||||||||||||||||||||||||||||||||||||||
| Office | 0 | 67,317 | 137,530 | 67,378 | 123,639 | 395,864 | ||||||||||||||||||||||||||||||||||||||||||||||||||||||||
| Hospitality | 52,971 | 203,285 | 389,172 | 150,585 | 51,935 | 847,948 | ||||||||||||||||||||||||||||||||||||||||||||||||||||||||
| Mixed Use | 52,572 | 101,571 | 0 | 14,367 | 0 | 168,510 | ||||||||||||||||||||||||||||||||||||||||||||||||||||||||
| Retail | 0 | 134,826 | 19,786 | 0 | 65,784 | 220,396 | ||||||||||||||||||||||||||||||||||||||||||||||||||||||||
| Other | 52,030 | 131,087 | 79,813 | 0 | 0 | 262,930 | ||||||||||||||||||||||||||||||||||||||||||||||||||||||||
| Industrial | 52,046 | 116,579 | 0 | 0 | 6,470 | 175,095 | ||||||||||||||||||||||||||||||||||||||||||||||||||||||||
| Manufactured Housing | 4,549 | 57,261 | 11,710 | 0 | 3,966 | 77,486 | ||||||||||||||||||||||||||||||||||||||||||||||||||||||||
| Self-Storage | 0 | 35,960 | 15,189 | 0 | 0 | 51,149 | ||||||||||||||||||||||||||||||||||||||||||||||||||||||||
| Subtotal loans | 279,548 | 1,147,534 | 719,206 | 256,892 | 251,794 | 2,654,974 | ||||||||||||||||||||||||||||||||||||||||||||||||||||||||
| Individually Impaired loans (1) | 0 | 0 | 4,143 | 0 | 72,137 | 76,280 | ||||||||||||||||||||||||||||||||||||||||||||||||||||||||
| Total loans | $ | 279,548 | $ | 1,147,534 | $ | 723,349 | $ | 256,892 | $ | 323,931 | $ | 2,731,254 | ||||||||||||||||||||||||||||||||||||||||||||||||||
| Gross Unrealized | Weighted Average | |||||||||||||||||||||||||||||||||||||||||||||||||||||||||||||
| Asset Type | Outstanding Face Amount | Amortized Cost Basis/Purchase Price | Gains | Losses | Carrying Value | # of Securities | Rating (1) | Coupon % | Yield % | Remaining Duration (years) | ||||||||||||||||||||||||||||||||||||||||||||||||||||
| CMBS(2) | $ | 1,420,752 | $ | 1,420,537 | $ | 1,018 | $ | (30,993) | $ | 1,390,562 | (3) | 102 | AAA | 1.49 | % | 1.54 | % | 2.10 | ||||||||||||||||||||||||||||||||||||||||||||
| CMBS interest-only(2)(4) | 1,506,152 | 23,063 | 723 | (45) | 23,741 | (5) | 13 | AAA | 0.44 | % | 3.32 | % | 2.28 | |||||||||||||||||||||||||||||||||||||||||||||||||
| GNMA interest-only(4)(6) | 87,917 | 1,175 | 216 | (163) | 1,228 | 11 | AA+ | 0.44 | % | 3.90 | % | 3.27 | ||||||||||||||||||||||||||||||||||||||||||||||||||
| Agency securities(2) | 595 | 603 | 16 | 0 | 619 | 2 | AA+ | 2.57 | % | 1.66 | % | 1.40 | ||||||||||||||||||||||||||||||||||||||||||||||||||
| GNMA permanent securities(2) | 30,542 | 30,662 | 832 | 0 | 31,494 | 6 | AA+ | 3.88 | % | 3.49 | % | 2.20 | ||||||||||||||||||||||||||||||||||||||||||||||||||
| Total debt securities | $ | 3,045,958 | $ | 1,476,040 | $ | 2,805 | $ | (31,201) | $ | 1,447,644 | 134 | 0.96 | % | 1.62 | % | 2.11 | ||||||||||||||||||||||||||||||||||||||||||||||
| Provision for current expected credit losses | N/A | — | — | (19) | (19) | |||||||||||||||||||||||||||||||||||||||||||||||||||||||||
| Total real estate securities | $ | 3,045,958 | $ | 1,476,040 | $ | 2,805 | $ | (31,220) | $ | 1,447,625 | 134 | |||||||||||||||||||||||||||||||||||||||||||||||||||
| Gross Unrealized | Weighted Average | ||||||||||||||||||||||||||||||||
| Asset Type | Outstanding Face Amount | Amortized Cost Basis/Purchase Price | Gains | Losses | Carrying Value | # of Securities | Rating (1) | Coupon % | Yield % | Remaining Duration (years) | |||||||||||||||||||||||
| CMBS(2) | $ | 1,779,458 | $ | 1,780,233 | $ | 9,012 | $ | (533 | ) | $ | 1,788,712 | (3) | 139 | AAA | 3.27 | % | 3.14 | % | 2.38 | ||||||||||||||
| CMBS interest-only(2)(4) | 2,139,357 | 39,961 | 1,491 | (12 | ) | 41,440 | (5) | 18 | AAA | 0.49 | % | 3.65 | % | 2.61 | |||||||||||||||||||
| GNMA interest-only(4)(6) | 113,096 | 2,202 | 119 | (295 | ) | 2,026 | 12 | AA+ | 0.51 | % | 9.65 | % | 2.73 | ||||||||||||||||||||
| Agency securities(2) | 641 | 652 | 2 | — | 654 | 2 | AA+ | 2.67 | % | 1.74 | % | 1.97 | |||||||||||||||||||||
| GNMA permanent securities(2) | 31,760 | 31,984 | 811 | — | 32,795 | 6 | AA+ | 3.92 | % | 3.27 | % | 4.55 | |||||||||||||||||||||
| Corporate bonds(2) | 32,088 | 31,604 | 768 | — | 32,372 | 1 | BB- | 3.63 | % | 4.81 | % | 1.31 | |||||||||||||||||||||
| Total debt securities | $ | 4,096,400 | $ | 1,886,636 | $ | 12,203 | $ | (840 | ) | $ | 1,897,999 | 178 | 1.75 | % | 3.17 | % | 2.39 | ||||||||||||||||
| Equity securities(7) | N/A | 13,720 | 125 | (388 | ) | 13,457 | 3 | N/A | N/A | N/A | N/A | ||||||||||||||||||||||
| Total real estate securities | $ | 4,096,400 | $ | 1,900,356 | $ | 12,328 | $ | (1,228 | ) | $ | 1,911,456 | 181 | |||||||||||||||||||||
| Gross Unrealized | Weighted Average | |||||||||||||||||||||||||||||||||||||||||||||||||||||||||||||
| Asset Type | Outstanding Face Amount | Amortized Cost Basis | Gains | Losses | Carrying Value | # of Securities | Rating (1) | Coupon % | Yield % | Remaining Duration (years) | ||||||||||||||||||||||||||||||||||||||||||||||||||||
| CMBS(2) | $ | 1,640,597 | $ | 1,640,905 | $ | 4,337 | $ | (920) | $ | 1,644,322 | (3) | 125 | AAA | 3.06 | % | 3.08 | % | 2.41 | ||||||||||||||||||||||||||||||||||||||||||||
| CMBS interest-only(2)(4) | 1,559,160 | 28,553 | 630 | (37) | 29,146 | (5) | 15 | AAA | 0.60 | % | 3.04 | % | 2.53 | |||||||||||||||||||||||||||||||||||||||||||||||||
| GNMA interest-only(4)(6) | 109,783 | 1,982 | 123 | (254) | 1,851 | 11 | AA+ | 0.49 | % | 4.59 | % | 2.77 | ||||||||||||||||||||||||||||||||||||||||||||||||||
| Agency securities(2) | 629 | 640 | 1 | (4) | 637 | 2 | AA+ | 2.65 | % | 1.73 | % | 1.83 | ||||||||||||||||||||||||||||||||||||||||||||||||||
| GNMA permanent securities(2) | 31,461 | 31,681 | 688 | 0 | 32,369 | 6 | AA+ | 3.91 | % | 3.17 | % | 1.93 | ||||||||||||||||||||||||||||||||||||||||||||||||||
| Total debt securities | $ | 3,341,630 | $ | 1,703,761 | $ | 5,779 | $ | (1,215) | $ | 1,708,325 | 159 | 1.84 | % | 3.06 | % | 2.39 | ||||||||||||||||||||||||||||||||||||||||||||||
| Equity securities(7) | N/A | 12,848 | 292 | (160) | 12,980 | 2 | N/A | N/A | N/A | N/A | ||||||||||||||||||||||||||||||||||||||||||||||||||||
| Total real estate securities | $ | 3,341,630 | $ | 1,716,609 | $ | 6,071 | $ | (1,375) | $ | 1,721,305 | 161 | |||||||||||||||||||||||||||||||||||||||||||||||||||
(1)Represents the weighted average of the ratings of all securities in each asset type, expressed as an S&P equivalent rating. For each security rated by multiple rating agencies, the highest rating is used. Ratings provided were determined by third-party rating agencies as of a particular date, may not be current and are subject to change (including the assignment of a “negative outlook” or “credit watch”) at any time. (2)CMBS, CMBS interest-only securities, Agency securities, GNMA permanent securities and corporate bonds are classified as available-for-sale and reported at fair value with changes in fair value recorded in the current period in other comprehensive income. (3)Includes $11.6 million of restricted securities which are designated as risk retention securities under the Dodd-Frank Act and are therefore subject to transfer restrictions over the term of the securitization trust and are classified as held-to-maturity and reported at amortized cost. (4)The amounts presented represent the principal amount of the mortgage loans outstanding in the pool in which the interest-only securities participate. (5)Includes $0.8 million of restricted securities which are designated as risk retention securities under the Dodd-Frank Act and are therefore subject to transfer restrictions over the term of the securitization trust and are classified as held-to-maturity and reported at amortized cost. (6)Agency interest-only securities are recorded at fair value with changes in fair value recorded in current period earnings. The Company’s Agency interest-only securities are considered to be hybrid financial instruments that contain embedded derivatives. As a result, the Company accounts for them as hybrid instruments in their entirety at fair value with changes in fair value recognized in unrealized gain (loss) on Agency interest-only securities in the consolidated statements of income in accordance with ASC 815. (7)The Company has elected to account for equity securities at fair value with changes in fair value recorded in current period earnings. |
| Gross Unrealized | Weighted Average | ||||||||||||||||||||||||||||||||
| Asset Type | Outstanding Face Amount | Amortized Cost Basis | Gains | Losses | Carrying Value | # of Securities | Rating (1) | Coupon % | Yield % | Remaining Duration (years) | |||||||||||||||||||||||
| CMBS(2) | $ | 1,258,819 | $ | 1,257,801 | $ | 2,477 | $ | (7,638 | ) | $ | 1,252,640 | (3) | 138 | AAA | 3.32 | % | 3.14 | % | 2.33 | ||||||||||||||
| CMBS interest-only(2)(4) | 2,373,936 | 55,534 | 428 | (271 | ) | 55,691 | (5) | 19 | AAA | 0.57 | % | 2.80 | % | 2.69 | |||||||||||||||||||
| GNMA interest-only(4)(6) | 135,932 | 2,862 | 93 | (307 | ) | 2,648 | 12 | AA+ | 0.51 | % | 6.30 | % | 4.11 | ||||||||||||||||||||
| Agency securities(2) | 668 | 682 | — | (20 | ) | 662 | 2 | AA+ | 2.73 | % | 1.83 | % | 2.36 | ||||||||||||||||||||
| GNMA permanent securities(2) | 32,633 | 32,889 | 420 | (245 | ) | 33,064 | 6 | AA+ | 3.94 | % | 3.76 | % | 5.03 | ||||||||||||||||||||
| Corporate bonds(2) | 55,305 | 54,257 | — | (386 | ) | 53,871 | 2 | BB | 4.08 | % | 5.04 | % | 2.51 | ||||||||||||||||||||
| Total debt securities | $ | 3,857,293 | $ | 1,404,025 | $ | 3,418 | $ | (8,867 | ) | $ | 1,398,576 | 179 | 1.54 | % | 3.19 | % | 2.40 | ||||||||||||||||
| Equity securities(7) | N/A | 13,154 | — | (1,604 | ) | 11,550 | 3 | N/A | N/A | N/A | N/A | ||||||||||||||||||||||
| Total real estate securities | $ | 3,857,293 | $ | 1,417,179 | $ | 3,418 | $ | (10,471 | ) | $ | 1,410,126 | 182 | |||||||||||||||||||||
| Asset Type | Within 1 year | 1-5 years | 5-10 years | After 10 years | Total | |||||||||||||||||||||||||||
| CMBS | $ | 289,889 | $ | 1,052,832 | $ | 47,841 | $ | 0 | $ | 1,390,562 | ||||||||||||||||||||||
| CMBS interest-only | 1,889 | 21,852 | 0 | 0 | 23,741 | |||||||||||||||||||||||||||
| GNMA interest-only | 64 | 886 | 278 | 0 | 1,228 | |||||||||||||||||||||||||||
| Agency securities | 0 | 619 | 0 | 0 | 619 | |||||||||||||||||||||||||||
| GNMA permanent securities | 137 | 31,357 | 0 | 0 | 31,494 | |||||||||||||||||||||||||||
| Total debt securities | $ | 291,979 | $ | 1,107,546 | $ | 48,119 | $ | 0 | $ | 1,447,644 | ||||||||||||||||||||||
| Asset Type | Within 1 year | 1-5 years | 5-10 years | After 10 years | Total | |||||||||||||||
| CMBS(1) | $ | 395,377 | $ | 1,212,074 | $ | 181,261 | $ | — | $ | 1,788,712 | ||||||||||
| CMBS interest-only(1) | 645 | 40,795 | — | — | 41,440 | |||||||||||||||
| GNMA interest-only(2) | 250 | 1,515 | 261 | — | 2,026 | |||||||||||||||
| Agency securities(1) | — | 654 | — | — | 654 | |||||||||||||||
| GNMA permanent securities(1) | 344 | 32,451 | — | — | 32,795 | |||||||||||||||
| Corporate bonds(1) | — | 32,372 | — | — | 32,372 | |||||||||||||||
| Total debt securities | $ | 396,616 | $ | 1,319,861 | $ | 181,522 | $ | — | $ | 1,897,999 | ||||||||||
| Asset Type | Within 1 year | 1-5 years | 5-10 years | After 10 years | Total | |||||||||||||||||||||||||||
| CMBS | $ | 177,193 | $ | 1,389,392 | $ | 77,737 | $ | 0 | $ | 1,644,322 | ||||||||||||||||||||||
| CMBS interest-only | 1,439 | 27,707 | 0 | 0 | 29,146 | |||||||||||||||||||||||||||
| GNMA interest-only | 91 | 1,504 | 256 | 0 | 1,851 | |||||||||||||||||||||||||||
| Agency securities | 0 | 637 | 0 | 0 | 637 | |||||||||||||||||||||||||||
| GNMA permanent securities | 416 | 31,953 | 0 | 0 | 32,369 | |||||||||||||||||||||||||||
| Total debt securities | $ | 179,139 | $ | 1,451,193 | $ | 77,993 | $ | 0 | $ | 1,708,325 | ||||||||||||||||||||||
| Asset Type | Within 1 year | 1-5 years | 5-10 years | After 10 years | Total | |||||||||||||||
| CMBS(1) | $ | 342,121 | $ | 772,594 | $ | 137,925 | $ | — | $ | 1,252,640 | ||||||||||
| CMBS interest-only(1) | 1,145 | 54,546 | — | — | 55,691 | |||||||||||||||
| GNMA interest-only(2) | 17 | 2,276 | 353 | 2 | 2,648 | |||||||||||||||
| Agency securities(1) | — | 662 | — | — | 662 | |||||||||||||||
| GNMA permanent securities(1) | 551 | 1,048 | 31,465 | — | 33,064 | |||||||||||||||
| Corporate bonds(1) | — | 53,871 | — | — | 53,871 | |||||||||||||||
| Total debt securities | $ | 343,834 | $ | 884,997 | $ | 169,743 | $ | 2 | $ | 1,398,576 | ||||||||||
| September 30, 2020 | December 31, 2019 | ||||||||||
| Land | $ | 220,465 | $ | 209,955 | |||||||
| Building | 834,630 | 883,005 | |||||||||
| In-place leases and other intangibles | 157,011 | 161,203 | |||||||||
| Less: Accumulated depreciation and amortization | (221,523) | (206,082) | |||||||||
| Real estate and related lease intangibles, net | $ | 990,583 | $ | 1,048,081 | |||||||
| Below market lease intangibles, net (other liabilities) | $ | (37,500) | $ | (39,067) | |||||||
| September 30, 2019 | December 31, 2018 | ||||||
| Land | $ | 197,682 | $ | 195,644 | |||
| Building | 820,783 | 814,314 | |||||
| In-place leases and other intangibles | 159,721 | 162,002 | |||||
| Less: Accumulated depreciation and amortization | (196,853 | ) | (173,938 | ) | |||
| Real estate and related lease intangibles, net | $ | 981,333 | $ | 998,022 | |||
| Below market lease intangibles, net (other liabilities) | $ | (39,087 | ) | $ | (40,367 | ) | |
| Three Months Ended September 30, | Nine Months Ended September 30, | ||||||||||||||
| 2019 | 2018 | 2019 | 2018 | ||||||||||||
| Depreciation expense(1) | $ | 7,394 | $ | 8,063 | $ | 22,776 | $ | 24,058 | |||||||
| Amortization expense | 1,612 | 2,336 | 6,342 | 7,782 | |||||||||||
| Total real estate depreciation and amortization expense | $ | 9,006 | $ | 10,399 | $ | 29,118 | $ | 31,840 | |||||||
| Three Months Ended September 30, | Nine Months Ended September 30, | ||||||||||||||||||||||||||||
| 2020 | 2019 | 2020 | 2019 | ||||||||||||||||||||||||||
| Depreciation expense(1) | $ | 8,138 | $ | 7,394 | $ | 24,571 | $ | 22,776 | |||||||||||||||||||||
| Amortization expense | 1,679 | 1,612 | 5,071 | 6,342 | |||||||||||||||||||||||||
| Total real estate depreciation and amortization expense | $ | 9,817 | $ | 9,006 | $ | 29,642 | $ | 29,118 | |||||||||||||||||||||
| September 30, 2019 | December 31, 2018 | ||||||
| Gross intangible assets(1) | $ | 159,721 | $ | 162,002 | |||
| Accumulated amortization | 61,056 | 57,712 | |||||
| Net intangible assets | $ | 98,665 | $ | 104,290 | |||
| September 30, 2020 | December 31, 2019 | ||||||||||
| Gross intangible assets(1) | $ | 157,010 | $ | 161,203 | |||||||
| Accumulated amortization | 64,260 | 62,773 | |||||||||
| Net intangible assets | $ | 92,750 | $ | 98,430 | |||||||
| Three Months Ended September 30, | Nine Months Ended September 30, | ||||||||||||||
| 2019 | 2018 | 2019 | 2018 | ||||||||||||
| Reduction in operating lease income for amortization of above market lease intangibles acquired | $ | (94 | ) | $ | (155 | ) | $ | (727 | ) | $ | (535 | ) | |||
| Increase in operating lease income for amortization of below market lease intangibles acquired | 564 | 500 | 1,594 | 1,821 | |||||||||||
| Three Months Ended September 30, | Nine Months Ended September 30, | ||||||||||||||||||||||||||||
| 2020 | 2019 | 2020 | 2019 | ||||||||||||||||||||||||||
| Reduction in operating lease income for amortization of above market lease intangibles acquired | $ | (92) | $ | (94) | $ | (275) | $ | (727) | |||||||||||||||||||||
| Increase in operating lease income for amortization of below market lease intangibles acquired | 624 | 564 | 1,995 | 1,594 | |||||||||||||||||||||||||
| Period Ending December 31, | Adjustment to Operating Lease Income | Amortization Expense | ||||||||||||
| 2020 (last 3 months) | $ | 268 | $ | 1,491 | ||||||||||
| 2021 | 1,070 | 5,504 | ||||||||||||
| 2022 | 1,070 | 5,504 | ||||||||||||
| 2023 | 1,070 | 5,504 | ||||||||||||
| 2024 | 1,070 | 5,504 | ||||||||||||
| Thereafter | 28,692 | 64,932 | ||||||||||||
| Total | $ | 33,240 | $ | 88,439 | ||||||||||
| Period Ending December 31, | Adjustment to Operating Lease Income | Amortization Expense | ||||||
| 2019 (last 3 months) | $ | 263 | $ | 1,601 | ||||
| 2020 | 1,054 | 6,403 | ||||||
| 2021 | 1,054 | 6,232 | ||||||
| 2022 | 1,054 | 6,232 | ||||||
| 2023 | 1,054 | 6,232 | ||||||
| Thereafter | 29,981 | 67,233 | ||||||
| Total | $ | 34,460 | $ | 93,933 | ||||
| Period Ending December 31, | Amount | Period Ending December 31, | Amount | |||||||||
| 2019 (last 3 months) | $ | 21,347 | ||||||||||
| 2020 | 80,401 | |||||||||||
| 2020 (last 3 months) | 2020 (last 3 months) | $ | 31,209 | |||||||||
| 2021 | 69,055 | 2021 | 72,872 | |||||||||
| 2022 | 65,936 | 2022 | 64,975 | |||||||||
| 2023 | 64,106 | 2023 | 64,206 | |||||||||
| 2024 | 2024 | 63,220 | ||||||||||
| Thereafter | 520,897 | Thereafter | 495,607 | |||||||||
| Total | $ | 821,742 | Total | $ | 792,089 | |||||||
| Acquisition Date | Type | Primary Location(s) | Purchase Price/Fair Value on the Date of Foreclosure | Ownership Interest (1) | |||||||||||||||||||||||||||||||
| Purchases of real estate | |||||||||||||||||||||||||||||||||||
| Aggregate purchases of net leased real estate | $ | 6,239 | 100.0% | ||||||||||||||||||||||||||||||||
| Real estate acquired via foreclosure | |||||||||||||||||||||||||||||||||||
| March 2020 | Diversified | Los Angeles, CA | 21,535 | 100.0% | |||||||||||||||||||||||||||||||
| June 2020 | Diversified | Winston Salem, NC | 3,900 | 100.0% | |||||||||||||||||||||||||||||||
| Total real estate acquired via foreclosure | 25,435 | ||||||||||||||||||||||||||||||||||
| Total real estate acquisitions | $ | 31,674 | |||||||||||||||||||||||||||||||||
| Purchase Price Allocation | ||||||||
| Land | $ | 23,524 | ||||||
| Building | 7,244 | |||||||
| Intangibles | 1,201 | |||||||
| Below Market Lease Intangibles | (295) | |||||||
| Total purchase price | $ | 31,674 | ||||||
| Acquisition Date | Type | Primary Location(s) | Purchase Price/Fair Value on the Date of Foreclosure | Ownership Interest (1) | ||||||
| Purchases of real estate | ||||||||||
| February 2019 | Net Lease | Houghton Lake, MI | $ | 1,242 | 100.0% | |||||
| February 2019 | Net Lease | Trenton, MO | 1,164 | 100.0% | ||||||
| April 2019 | Net Lease | Centralia, IL | 1,242 | 100.0% | ||||||
| June 2019 | Net Lease | Fayette, MO | 1,423 | 100.0% | ||||||
| July 2019 | Net Lease | Dexter, MO | 1,150 | 100.0% | ||||||
| July 2019 | Net Lease | Caledonia, MI | 1,199 | 100.0% | ||||||
| August 2019 | Net Lease | Poseyville, IN | 1,220 | 100.0% | ||||||
| September 2019 | Net Lease | Chillicothe, IL | 1,445 | 100.0% | ||||||
| September 2019 | Net Lease | Sullivan, IL | 1,496 | 100.0% | ||||||
| September 2019 | Net Lease | Becker, MN | 1,185 | 100.0% | ||||||
| September 2019 | Net Lease | Adrian, MO | 1,138 | 100.0% | ||||||
| Total purchases of real estate | 13,904 | |||||||||
| Real estate acquired via foreclosure | ||||||||||
| February 2019 | Diversified | Omaha, NE | 18,200 | 100.0% | ||||||
| Total real estate acquired via foreclosure | 18,200 | |||||||||
| Total real estate acquisitions | $ | 32,104 | ||||||||
| Acquisition Date | Type | Primary Location(s) | Purchase Price/Fair Value on the Date of Foreclosure | Ownership Interest (1) | |||||||||||||||||||||||||||||||
| Purchases of real estate | |||||||||||||||||||||||||||||||||||
| Aggregate purchases of net leased real estate | $ | 13,904 | 100.0% | ||||||||||||||||||||||||||||||||
| Real estate acquired via foreclosure | |||||||||||||||||||||||||||||||||||
| February 2019 | Diversified | Omaha, NE | 18,200 | 100.0% | |||||||||||||||||||||||||||||||
| Total real estate acquired via foreclosure | 18,200 | ||||||||||||||||||||||||||||||||||
| Total real estate acquisitions | $ | 32,104 | |||||||||||||||||||||||||||||||||
| Purchase Price Allocation | ||||||||
| Land | $ | 4,969 | ||||||
| Building | 25,571 | |||||||
| Intangibles | 2,309 | |||||||
| Below Market Lease Intangibles | (745) | |||||||
| Total purchase price | $ | 32,104 | ||||||
| Purchase Price Allocation | ||||
| Land | $ | 4,969 | ||
| Building | 25,571 | |||
| Intangibles | 2,309 | |||
| Below Market Lease Intangibles | (745 | ) | ||
| Total purchase price | $ | 32,104 | ||
| Acquisition Date | Type | Primary Location(s) | Purchase Price | Ownership Interest (1) | ||||||
| March 2018 | Diversified(2) | Lithia Springs, GA | $ | 24,466 | 70.6% | |||||
| April 2018 | Net Lease | Kirbyville, MO | 1,156 | 100.0% | ||||||
| April 2018 | Net Lease | Gladwin, MI | 1,171 | 100.0% | ||||||
| April 2018 | Net Lease | Foley, MN | 1,176 | 100.0% | ||||||
| April 2018 | Net Lease | Moscow Mills, MO | 1,237 | 100.0% | ||||||
| April 2018 | Net Lease | Wonder Lake, IL | 1,255 | 100.0% | ||||||
| May 2018 | Diversified(3) | Isla Vista, CA | 85,087 | 75.0% | ||||||
| Total real estate acquisitions | $ | 115,548 | ||||||||
| Purchase Price Allocation | ||||
| Land | $ | 40,019 | ||
| Building | 73,794 | |||
| Intangibles | 2,065 | |||
| Below Market Lease Intangibles | (330 | ) | ||
| Total purchase price | $ | 115,548 | ||
| Sales Date | Type | Primary Location(s) | Net Sales Proceeds | Net Book Value | Realized Gain/(Loss)(1) | Properties | Units Sold | Units Remaining | ||||||||||||||||||||||||||||||||||||||||||||||||
| Various | Condominium | Miami, FL | $ | 1,199 | $ | 1,174 | $ | 25 | 0 | 4 | 2 | |||||||||||||||||||||||||||||||||||||||||||||
| March 2020 | Diversified | Richmond, VA | 22,527 | 14,829 | 7,698 | 7 | 0 | 0 | ||||||||||||||||||||||||||||||||||||||||||||||||
| March 2020 | Diversified | Richmond, VA | 6,932 | 4,109 | 2,823 | 1 | 0 | 0 | ||||||||||||||||||||||||||||||||||||||||||||||||
| August 2020 | Net Lease | Bellport, NY | 19,434 | 15,012 | 4,422 | 1 | — | — | ||||||||||||||||||||||||||||||||||||||||||||||||
| September 2020 | Diversified | Lithia Springs, GA | 39,491 | 23,187 | 16,304 | 1 | — | — | ||||||||||||||||||||||||||||||||||||||||||||||||
| September 2020 | Diversified | Winston Salem, NC | 4,647 | 3,803 | 844 | 1 | — | — | ||||||||||||||||||||||||||||||||||||||||||||||||
| Totals | $ | 94,230 | $ | 62,114 | $ | 32,116 | ||||||||||||||||||||||||||||||||||||||||||||||||||
| Sales Date | Type | Primary Location(s) | Net Sales Proceeds | Net Book Value | Realized Gain/(Loss) | Properties | Units Sold | Units Remaining | ||||||||||||||||||||||||||||||||||||||||||||||||
| N/A | Condominium | Las Vegas, NV | $ | 0 | $ | 0 | $ | 0 | 0 | 0 | 1 | |||||||||||||||||||||||||||||||||||||||||||||
| Various | Condominium | Miami, FL | 4,195 | 3,796 | 399 | 0 | 14 | 8 | ||||||||||||||||||||||||||||||||||||||||||||||||
| April 2019 | Diversified | Wayne, NJ | 1,729 | 4,799 | (3,070) | 1 | 0 | 0 | ||||||||||||||||||||||||||||||||||||||||||||||||
| May 2019 | Diversified | Grand Rapids, MI | 10,019 | 8,254 | 1,765 | 1 | 0 | 0 | ||||||||||||||||||||||||||||||||||||||||||||||||
| August 2019 | Diversified | Grand Rapids, MI | 6,970 | 4,920 | 2,050 | 1 | — | — | ||||||||||||||||||||||||||||||||||||||||||||||||
| Totals | $ | 22,913 | $ | 21,769 | $ | 1,144 | ||||||||||||||||||||||||||||||||||||||||||||||||||
| Sales Date | Type | Primary Location(s) | Net Sales Proceeds | Net Book Value | Realized Gain/(Loss) | Properties | Units Sold | Units Remaining | |||||||||||||||||
| N/A | Condominium | Las Vegas, NV | $ | — | $ | — | $ | — | — | — | 1 | ||||||||||||||
| Various | Condominium | Miami, FL | 4,195 | 3,796 | 399 | — | 14 | 8 | |||||||||||||||||
| April 2019 | Diversified | Wayne, NJ | 1,729 | 4,799 | (3,070 | ) | 1 | — | — | ||||||||||||||||
| May 2019 | Diversified | Grand Rapids, MI | 10,019 | 8,254 | 1,765 | 1 | — | — | |||||||||||||||||
| August 2019 | Diversified | Grand Rapids, MI | 6,970 | 4,920 | 2,050 | 1 | — | — | |||||||||||||||||
| Totals | $ | 22,913 | $ | 21,769 | $ | 1,144 | |||||||||||||||||||
| Sales Date | Type | Primary Location(s) | Net Sales Proceeds | Net Book Value | Realized Gain/(Loss) | Properties | Units Sold | Units Remaining | |||||||||||||||||
| Various | Condominium | Las Vegas, NV | $ | 6,228 | $ | 3,116 | $ | 3,112 | — | 8 | 5 | ||||||||||||||
| Various | Condominium | Miami, FL | 4,844 | 3,987 | 857 | — | 18 | 30 | |||||||||||||||||
| March 2018 | Diversified | El Monte, CA | 71,807 | 52,610 | 19,197 | (1) | 1 | — | — | ||||||||||||||||
| March 2018 | Diversified | Richmond, VA | 20,966 | 11,370 | 9,596 | (2) | 1 | — | — | ||||||||||||||||
| September 2018 | Diversified | St. Paul, MN | 109,275 | 47,627 | 61,648 | (3) | 4 | — | — | ||||||||||||||||
| Totals | $ | 213,120 | $ | 118,710 | $ | 94,410 | |||||||||||||||||||
| Entity | September 30, 2019 | December 31, 2018 | ||||||
| Grace Lake JV, LLC | $ | 3,799 | $ | 5,316 | ||||
| 24 Second Avenue Holdings LLC | 47,620 | 35,038 | ||||||
| Investment in unconsolidated joint ventures | $ | 51,419 | $ | 40,354 | ||||
| Entity | September 30, 2020 | December 31, 2019 | ||||||||||||
| Grace Lake JV, LLC | $ | 3,732 | $ | 3,047 | ||||||||||
| 24 Second Avenue Holdings LLC | 45,423 | 45,386 | ||||||||||||
| Investment in unconsolidated joint ventures | $ | 49,155 | $ | 48,433 | ||||||||||
| Three Months Ended September 30, | Nine Months Ended September 30, | |||||||||||||||||||||||||||||||
| Entity | 2020 | 2019 | 2020 | 2019 | ||||||||||||||||||||||||||||
| Grace Lake JV, LLC | $ | 236 | $ | 517 | $ | 685 | $ | 1,549 | ||||||||||||||||||||||||
| 24 Second Avenue Holdings LLC | 211 | 577 | 674 | 2,068 | ||||||||||||||||||||||||||||
| Earnings (loss) from investment in unconsolidated joint ventures | $ | 447 | $ | 1,094 | $ | 1,359 | $ | 3,617 | ||||||||||||||||||||||||
| Three Months Ended September 30, | Nine Months Ended September 30, | |||||||||||||||
| Entity | 2019 | 2018 | 2019 | 2018 | ||||||||||||
| Grace Lake JV, LLC | $ | 517 | $ | 605 | $ | 1,549 | $ | 1,138 | ||||||||
| 24 Second Avenue Holdings LLC | 577 | (204 | ) | 2,068 | (672 | ) | ||||||||||
| Earnings (loss) from investment in unconsolidated joint ventures | $ | 1,094 | $ | 401 | $ | 3,617 | $ | 466 | ||||||||
| September 30, 2020 | December 31, 2019 | |||||||||||||
| Total assets | $ | 114,110 | $ | 118,727 | ||||||||||
| Total liabilities | 76,477 | 78,762 | ||||||||||||
| Partners’/members’ capital | $ | 37,633 | $ | 39,965 | ||||||||||
| September 30, 2019 | December 31, 2018 | |||||||
| Total assets | $ | 123,871 | $ | 167,837 | ||||
| Total liabilities | 80,333 | 116,667 | ||||||
| Partners’/members’ capital | $ | 43,538 | $ | 51,170 | ||||
| Three Months Ended September 30, | Nine Months Ended September 30, | |||||||||||||||||||||||||||||||
| 2020 | 2019 | 2020 | 2019 | |||||||||||||||||||||||||||||
| Total revenues | $ | 4,339 | $ | 3,915 | $ | 13,109 | $ | 14,945 | ||||||||||||||||||||||||
| Total expenses | 3,458 | 4,595 | 10,882 | 12,029 | ||||||||||||||||||||||||||||
| Net income (loss) | $ | 881 | $ | (680) | $ | 2,227 | $ | 2,916 | ||||||||||||||||||||||||
| Three Months Ended September 30, | Nine Months Ended September 30, | |||||||||||||||
| 2019 | 2018 | 2019 | 2018 | |||||||||||||
| Total revenues | $ | 3,915 | $ | 4,351 | $ | 14,945 | $ | 13,671 | ||||||||
| Total expenses | 4,595 | 3,415 | 12,029 | 9,788 | ||||||||||||
| Net income (loss) | $ | (680 | ) | $ | 936 | $ | 2,916 | $ | 3,883 | |||||||
| Debt Obligations | Committed Financing | Debt Obligations Outstanding | Committed but Unfunded | Interest Rate at September 30, 2019(1) | Current Term Maturity | Remaining Extension Options | Eligible Collateral | Carrying Amount of Collateral | Fair Value of Collateral | ||||||||||||||||||||
| Committed Loan Repurchase Facility | $ | 600,000 | $ | 191,031 | $ | 408,969 | 3.78% - 4.28% | 2/24/2022 | (2) | (3) | $ | 283,517 | $ | 283,746 | |||||||||||||||
| Committed Loan Repurchase Facility | 350,000 | 63,996 | 286,004 | 4.25% - 4.60% | 5/24/2020 | (4) | (5) | 100,354 | 102,616 | ||||||||||||||||||||
| Committed Loan Repurchase Facility | 300,000 | 211,350 | 88,650 | 4.00% - 4.53% | 4/10/2020 | (6) | (7) | 343,448 | 343,448 | ||||||||||||||||||||
| Committed Loan Repurchase Facility | 300,000 | 116,043 | 183,957 | 3.81% - 4.06% | 5/6/2021 | (8) | (3) | 174,001 | 174,353 | ||||||||||||||||||||
| Committed Loan Repurchase Facility | 100,000 | 87,174 | 12,826 | 4.02% - 4.28% | 7/20/2021 | (9) | (3) | 135,373 | 135,606 | ||||||||||||||||||||
| Committed Loan Repurchase Facility | 100,000 | 90,927 | 9,073 | 4.03% | 3/26/2020 | (10) | (11) | 121,899 | 121,899 | ||||||||||||||||||||
| Total Committed Loan Repurchase Facilities | 1,750,000 | 760,521 | 989,479 | 1,158,592 | 1,161,668 | ||||||||||||||||||||||||
| Committed Securities Repurchase Facility | 400,000 | 85,457 | 314,543 | 2.38% - 2.87% | 3/4/2021 | N/A | (12) | 103,547 | 103,547 | ||||||||||||||||||||
| Uncommitted Securities Repurchase Facility | N/A (12) | 940,070 | N/A (13) | 2.45% - 3.78% | 10/2019 - 12/2019 | N/A | (12) | 1,047,663 | 1,047,663 | (14) | |||||||||||||||||||
| Total Repurchase Facilities | 2,150,000 | 1,786,048 | 1,304,022 | 2,309,802 | 2,312,878 | ||||||||||||||||||||||||
| Revolving Credit Facility | 266,430 | — | 266,430 | NA | 2/11/2020 | (15) | N/A (16) | N/A (16) | N/A (16) | ||||||||||||||||||||
| Mortgage Loan Financing | 723,313 | 723,313 | — | 4.25% - 6.75% | 2020 - 2029(17) | N/A | (18) | 902,656 | 1,093,952 | (19) | |||||||||||||||||||
| CLO Debt | 117,760 | 117,760 | (20) | — | 3.40% - 5.62% | 2021-2034 | N/A | (21) | 274,149 | 274,523 | |||||||||||||||||||
| Borrowings from the FHLB | 1,945,795 | 1,076,449 | 869,346 | 1.47% - 2.95% | 2019 - 2024 | N/A | (22) | 1,411,022 | 1,422,246 | (23) | |||||||||||||||||||
| Senior Unsecured Notes | 1,166,201 | 1,157,117 | (24) | — | 5.250% - 5.875% | 2021 - 2025 | N/A | N/A (25) | N/A (25) | N/A (25) | |||||||||||||||||||
| Total Debt Obligations, Net | $ | 6,369,499 | $ | 4,860,687 | $ | 2,439,798 | $ | 4,897,629 | $ | 5,103,599 | |||||||||||||||||||
| Debt Obligations | Committed Financing | Debt Obligations Outstanding | Committed but Unfunded | Interest Rate at September 30, 2020(1) | Current Term Maturity | Remaining Extension Options | Eligible Collateral | Carrying Amount of Collateral | Fair Value of Collateral | ||||||||||||||||||||||||||||||||||||||||||||||||||||||||
| Committed Loan Repurchase Facility(2) | $ | 500,000 | $ | 114,679 | $ | 385,321 | 1.9% | — | 2.15% | 12/19/2022 | (3) | (4) | $ | 179,523 | $ | 179,523 | |||||||||||||||||||||||||||||||||||||||||||||||||
| Committed Loan Repurchase Facility | 250,000 | 0 | 250,000 | 0% | — | 0% | 2/26/2021 | (5) | (6) | 0 | 0 | ||||||||||||||||||||||||||||||||||||||||||||||||||||||
| Committed Loan Repurchase Facility | 300,000 | 141,750 | 158,250 | 1.9% | — | 2.9% | 12/19/2020 | (7) | (8) | 183,851 | 183,851 | ||||||||||||||||||||||||||||||||||||||||||||||||||||||
| Committed Loan Repurchase Facility | 300,000 | 41,292 | 258,708 | 1.94% | — | 2.19% | 11/6/2022 | (9) | (4) | 76,193 | 76,193 | ||||||||||||||||||||||||||||||||||||||||||||||||||||||
| Committed Loan Repurchase Facility | 100,000 | 38,158 | 61,842 | 2.28% | — | 2.4% | 12/31/2022 | (10) | (4) | 64,711 | 64,752 | ||||||||||||||||||||||||||||||||||||||||||||||||||||||
| Committed Loan Repurchase Facility | 100,000 | 17,901 | 82,099 | 3.5% | — | 3.5% | 3/24/2021 | (11) | (12) | 30,600 | 30,600 | ||||||||||||||||||||||||||||||||||||||||||||||||||||||
| Total Committed Loan Repurchase Facilities | 1,550,000 | 353,780 | 1,196,220 | 534,878 | 534,919 | ||||||||||||||||||||||||||||||||||||||||||||||||||||||||||||
| Committed Securities Repurchase Facility(2) | 785,321 | 352,197 | 433,124 | 0.86% | — | 2.41% | 12/23/2021 | N/A | (13) | 418,604 | 418,604 | ||||||||||||||||||||||||||||||||||||||||||||||||||||||
| Uncommitted Securities Repurchase Facility | N/A (13) | 470,989 | N/A (14) | 0.91% | — | 3.5% | 10/2020 - 12/2020 | N/A | (13) | 583,353 | 583,353 | (15) | |||||||||||||||||||||||||||||||||||||||||||||||||||||
| Total Repurchase Facilities | 1,950,000 | 1,176,966 | 1,244,023 | 1,536,835 | 1,536,876 | ||||||||||||||||||||||||||||||||||||||||||||||||||||||||||||
| Revolving Credit Facility | 266,430 | 266,430 | 0 | 3.15% | — | 3.16% | 2/11/2021 | (16) | N/A (17) | N/A (17) | N/A (17) | ||||||||||||||||||||||||||||||||||||||||||||||||||||||
| Mortgage Loan Financing | 769,968 | 769,968 | 0 | 3.75% | — | 6.75% | 2020 - 2030(17) | N/A | (19) | 919,286 | 1,136,208 | (20) | |||||||||||||||||||||||||||||||||||||||||||||||||||||
| Secured Financing Facility | 206,350 | 190,582 | (21) | 0 | 10.75% | — | 10.75% | 5/6/2023 | N/A | (22) | 335,674 | 336,055 | |||||||||||||||||||||||||||||||||||||||||||||||||||||
| CLO Debt | 285,040 | 281,625 | (23) | — | 5.5% | — | 5.5% | 5/16/2024 | N/A | (24) | 434,519 | 434,519 | |||||||||||||||||||||||||||||||||||||||||||||||||||||
| Borrowings from the FHLB | 1,500,000 | 326,000 | 1,174,000 | 0.41% | — | 3% | 2020 - 2024 | N/A | (24) | 473,556 | 477,407 | (25) | |||||||||||||||||||||||||||||||||||||||||||||||||||||
| Senior Unsecured Notes | 1,716,994 | 1,702,939 | (26) | 0 | 4.25% | — | 5.88% | 2021 - 2027 | N/A | N/A (27) | N/A (27) | N/A (27) | |||||||||||||||||||||||||||||||||||||||||||||||||||||
| Total Debt Obligations, Net | $ | 6,694,782 | $ | 4,714,510 | $ | 2,418,023 | $ | 3,699,870 | $ | 3,921,065 | |||||||||||||||||||||||||||||||||||||||||||||||||||||||
(1)September 2020 LIBOR rates are used to calculate interest rates for floating rate debt. (2)The combined committed amounts for the loan repurchase facility and the securities repurchase facility total $900.0 million, with maximum capacity on the loan repurchase facility of $500.0 million, and maximum capacity on the securities repurchase facility of $900.0 million less outstanding commitments on the loan repurchase facility. (3)NaN additional 12-month periods at Company’s option. No new advances are permitted after the initial maturity date. (4)First mortgage commercial real estate loans and senior and pari passu interests therein. It does not include the real estate collateralizing such loans. (5)NaN additional 12-month periods at Company’s option. (6)First mortgage commercial real estate loans. It does not include the real estate collateralizing such loans. (7)NaN additional 364-day periods. (8)First mortgage and mezzanine commercial real estate loans and senior and pari passu interests therein. It does not include the real estate collateralizing such loans. (9)NaN additional 12-month extension period and 2 additional 6-month extension periods at Company’s option. (10)NaN additional 12-month extension periods at Company’s option. No new advances are permitted after the initial maturity date. (11)The Company may extend periodically with lender’s consent. At no time can the maturity |
| Debt Obligations | Committed Financing | Debt Obligations Outstanding | Committed but Unfunded | Interest Rate at December 31, 2018(1) | Current Term Maturity | Remaining Extension Options | Eligible Collateral | Carrying Amount of Collateral | Fair Value of Collateral | |||||||||||||||||||||
| Committed Loan Repurchase Facility | $ | 600,000 | $ | 180,597 | $ | 419,403 | 4.21% - 4.96% | 10/1/2020 | (2) | (3) | $ | 262,642 | $ | 261,602 | ||||||||||||||||
| Committed Loan Repurchase Facility | 350,000 | 63,679 | 286,321 | 4.68% - 4.98% | 5/24/2019 | (4) | (5) | 87,385 | 88,762 | |||||||||||||||||||||
| Committed Loan Repurchase Facility | 300,000 | 120,631 | 179,369 | 4.46% - 4.96% | 4/7/2019 | (6) | (7) | 204,747 | 205,219 | |||||||||||||||||||||
| Committed Loan Repurchase Facility | 300,000 | 79,886 | 220,114 | 4.44% - 4.94% | 5/6/2021 | (8) | (3) | 117,382 | 117,366 | |||||||||||||||||||||
| Committed Loan Repurchase Facility | 100,000 | 52,738 | 47,262 | 4.58% - 4.96% | 7/20/2021 | (9) | (3) | 72,154 | 72,154 | |||||||||||||||||||||
| Committed Loan Repurchase Facility | 100,000 | — | 100,000 | NA | 12/26/2019 | (10) | (11) | — | — | |||||||||||||||||||||
| Total Committed Loan Repurchase Facilities | 1,750,000 | 497,531 | 1,252,469 | 744,310 | 745,103 | |||||||||||||||||||||||||
| Committed Securities Repurchase Facility | 400,000 | — | 400,000 | NA | 9/30/2019 | N/A | (12) | — | — | |||||||||||||||||||||
| Uncommitted Securities Repurchase Facility | N/A (12) | 166,154 | N/A (13) | 2.99% - 4.55% | 1/2019 - 3/2019 | N/A | (12) | 187,803 | 187,803 | (14)(15) | ||||||||||||||||||||
| Total Repurchase Facilities | 2,150,000 | 663,685 | 1,652,469 | 932,113 | 932,906 | |||||||||||||||||||||||||
| Revolving Credit Facility | 266,430 | — | 266,430 | NA | 2/11/2019 | (16) | N/A (17) | N/A (17) | N/A (17) | |||||||||||||||||||||
| Mortgage Loan Financing | 743,902 | 743,902 | — | 4.25% - 7.00% | 2020 - 2028(18) | N/A | (19) | 939,362 | 1,108,968 | (20) | ||||||||||||||||||||
| CLO Debt | 601,543 | 601,543 | (21 | ) | — | 3.34% - 6.06% | 2021-2034 | N/A | (22) | 710,502 | 710,737 | |||||||||||||||||||
| Participation Financing - Mortgage Loan Receivable | 2,453 | 2,453 | — | 17.00% | 6/6/2019 | N/A | (3) | 2,453 | 2,453 | |||||||||||||||||||||
| Borrowings from the FHLB | 1,933,522 | 1,286,000 | 647,522 | 1.18% - 3.01% | 2019 - 2024 | N/A | (23) | 1,652,952 | 1,655,150 | (24) | ||||||||||||||||||||
| Senior Unsecured Notes | 1,166,201 | 1,154,991 | (25) | — | 5.250% - 5.875% | 2021 - 2025 | N/A | N/A (26) | N/A (26) | N/A (26) | ||||||||||||||||||||
| Total Debt Obligations | $ | 6,864,051 | $ | 4,452,574 | $ | 2,566,421 | $ | 4,237,382 | $ | 4,410,214 | ||||||||||||||||||||
| Debt Obligations | Committed Financing | Debt Obligations Outstanding | Committed but Unfunded | Interest Rate at December 31, 2019(1) | Current Term Maturity | Remaining Extension Options | Eligible Collateral | Carrying Amount of Collateral | Fair Value of Collateral | ||||||||||||||||||||||||||||||||||||||||||||||||||||||||
| Committed Loan Repurchase Facility | $ | 600,000 | $ | 183,828 | $ | 416,172 | 3.24% | — | 3.74% | 12/19/2022 | (2) | (3) | $ | 287,974 | $ | 288,210 | |||||||||||||||||||||||||||||||||||||||||||||||||
| Committed Loan Repurchase Facility | 350,000 | 70,697 | 279,303 | 3.71% | — | 3.81% | 5/24/2020 | (4) | (5) | 101,590 | 103,868 | ||||||||||||||||||||||||||||||||||||||||||||||||||||||
| Committed Loan Repurchase Facility | 300,000 | 248,182 | 51,818 | 3.49% | — | 3.74% | 12/19/2020 | (6) | (7) | 382,778 | 382,778 | ||||||||||||||||||||||||||||||||||||||||||||||||||||||
| Committed Loan Repurchase Facility | 300,000 | 98,678 | 201,322 | 3.50% | — | 3.75% | 11/6/2022 | (8) | (3) | 175,000 | 175,270 | ||||||||||||||||||||||||||||||||||||||||||||||||||||||
| Committed Loan Repurchase Facility | 100,000 | 9,952 | 90,048 | 3.96% | — | 3.99% | 1/3/2023 | (9) | (3) | 75,628 | 75,813 | ||||||||||||||||||||||||||||||||||||||||||||||||||||||
| Committed Loan Repurchase Facility | 100,000 | 90,927 | 9,073 | 3.74% | — | 3.80% | 12/24/2020 | (10) | (11) | 126,311 | 126,311 | ||||||||||||||||||||||||||||||||||||||||||||||||||||||
| Total Committed Loan Repurchase Facilities | 1,750,000 | 702,264 | 1,047,736 | 1,149,281 | 1,152,250 | ||||||||||||||||||||||||||||||||||||||||||||||||||||||||||||
| Committed Securities Repurchase Facility | 400,000 | 42,751 | 357,249 | 2.50% | — | 2.56% | 12/23/2021 | N/A | (12) | 52,691 | 52,691 | ||||||||||||||||||||||||||||||||||||||||||||||||||||||
| Uncommitted Securities Repurchase Facility | N/A (12) | 1,070,919 | N/A (13) | 2.17% | — | 3.54% | 1/2020 - 3/2020 | N/A | (12) | 1,188,440 | 1,188,440 | (14) | |||||||||||||||||||||||||||||||||||||||||||||||||||||
| Total Repurchase Facilities | 2,150,000 | 1,815,934 | 1,404,985 | 2,390,412 | 2,393,381 | ||||||||||||||||||||||||||||||||||||||||||||||||||||||||||||
| Revolving Credit Facility | 266,430 | 0 | 266,430 | NA | 2/11/2020 | (15) | N/A (16) | N/A (16) | N/A (16) | ||||||||||||||||||||||||||||||||||||||||||||||||||||||||
| Mortgage Loan Financing | 812,606 | 812,606 | 0 | 3.75% | — | 6.75% | 2020 - 2029(17) | N/A | (18) | 988,857 | 1,192,106 | (19) | |||||||||||||||||||||||||||||||||||||||||||||||||||||
| Borrowings from the FHLB | 1,945,795 | 1,073,500 | 872,295 | 1.47% | — | 2.95% | 2020 - 2024 | N/A | (20) | 1,107,188 | 1,113,811 | (21) | |||||||||||||||||||||||||||||||||||||||||||||||||||||
| Senior Unsecured Notes | 1,166,201 | 1,157,833 | (22) | 0 | 5.25% | — | 5.88% | 2021 - 2025 | N/A | N/A (23) | N/A (23) | N/A (23) | |||||||||||||||||||||||||||||||||||||||||||||||||||||
| Total Debt Obligations | $ | 6,341,032 | $ | 4,859,873 | $ | 2,543,710 | $ | 4,486,457 | $ | 4,699,298 | |||||||||||||||||||||||||||||||||||||||||||||||||||||||
| Period ending December 31, | Borrowings by Maturity(1) | |||||||
| 2020 (last 3 months) | $ | 919,876 | ||||||
| 2021 | 914,964 | |||||||
| 2022 | 622,297 | |||||||
| 2023 | 351,620 | |||||||
| 2024 | 580,986 | |||||||
| Thereafter | 1,353,554 | |||||||
| Subtotal | 4,743,297 | |||||||
| Debt issuance costs included in senior unsecured notes | (14,055) | |||||||
| Debt issuance costs included in secured financing facility | (8,514) | |||||||
| Discount on secured financing facility related to Purchase Right | (7,254) | |||||||
| Debt issuance costs included in CLO debt | (3,416) | |||||||
| Debt issuance costs included in mortgage loan financing | (393) | |||||||
| Premiums included in mortgage loan financing(2) | 4,845 | |||||||
| Total | $ | 4,714,510 | ||||||
| Period ending December 31, | Borrowings by Maturity(1) | |||
| 2019 (last 3 months) | $ | 1,039,597 | ||
| 2020 | 1,052,894 | |||
| 2021 | 876,649 | |||
| 2022 | 655,706 | |||
| 2023 | 559,422 | |||
| Thereafter | 680,935 | |||
| Subtotal | 4,865,203 | |||
| Debt issuance costs included in senior unsecured notes | (9,084 | ) | ||
| Debt issuance costs included in CLO debt | (394 | ) | ||
| Debt issuance costs included in mortgage loan financing | (380 | ) | ||
| Premiums included in mortgage loan financing(2) | 5,342 | |||
| Total | $ | 4,860,687 | ||
| Fair Value | Remaining Maturity (years) | |||||||||||||
| Contract Type | Notional | Asset(1) | Liability(1) | |||||||||||
| Caps | ||||||||||||||
| 1 Month LIBOR | $ | 69,571 | $ | — | $ | — | 0.61 | |||||||
| Futures | ||||||||||||||
| 5-year Swap | 49,200 | — | 20 | 0.25 | ||||||||||
| 10-year Swap | 149,500 | — | 61 | 0.25 | ||||||||||
| 5-year U.S. Treasury Note | 2,200 | — | 1 | 0.25 | ||||||||||
| Total futures | 200,900 | — | 82 | |||||||||||
| Credit derivatives | ||||||||||||||
| S&P 500 Put Options | 6,000 | 22 | — | 0.30 | ||||||||||
| Total credit derivatives | 6,000 | 22 | — | |||||||||||
| Total derivatives | $ | 276,471 | $ | 22 | $ | 82 | ||||||||
| Fair Value | Remaining Maturity (years) | |||||||||||||||||||||||||
| Contract Type | Notional | Asset(1) | Liability(1) | |||||||||||||||||||||||
| Caps | ||||||||||||||||||||||||||
| 1 Month LIBOR | $ | 69,571 | $ | 0 | $ | 0 | 0.61 | |||||||||||||||||||
| Futures | ||||||||||||||||||||||||||
| 5-year Swap | 24,400 | 164 | 0 | 0.25 | ||||||||||||||||||||||
| 10-year Swap | 42,400 | 285 | 0�� | 0.25 | ||||||||||||||||||||||
| Total futures | 66,800 | 449 | 0 | |||||||||||||||||||||||
| Total derivatives | $ | 136,371 | $ | 449 | $ | 0 | ||||||||||||||||||||
| Fair Value | Remaining Maturity (years) | |||||||||||||
| Contract Type | Notional | Asset(1) | Liability(1) | |||||||||||
| Caps | ||||||||||||||
| 1MO LIBOR | $ | 69,571 | $ | — | $ | — | 1.35 | |||||||
| Futures | �� | |||||||||||||
| 5-year Swap | $ | 274,900 | $ | — | $ | 526 | 0.25 | |||||||
| 10-year Swap | 227,700 | — | 436 | 0.25 | ||||||||||
| 5-year U.S. Treasury Note | 6,800 | — | 13 | 0.25 | ||||||||||
| Total futures | 509,400 | — | 975 | |||||||||||
| Total derivatives | $ | 578,971 | $ | — | $ | 975 | ||||||||
| Fair Value | Remaining Maturity (years) | |||||||||||||||||||||||||
| Contract Type | Notional | Asset(1) | Liability(1) | |||||||||||||||||||||||
| Caps | ||||||||||||||||||||||||||
| 1Month LIBOR | $ | 69,571 | $ | 0 | $ | 0 | 0.36 | |||||||||||||||||||
| Futures | ||||||||||||||||||||||||||
| 5-year Swap | 46,000 | 158 | 0 | 0.25 | ||||||||||||||||||||||
| 10-year Swap | 149,800 | 516 | 0 | 0.25 | ||||||||||||||||||||||
| 5-year U.S. Treasury Note | 1,100 | 4 | 0 | 0.25 | ||||||||||||||||||||||
| Total futures | 196,900 | 678 | 0 | |||||||||||||||||||||||
| Credit Derivatives | ||||||||||||||||||||||||||
| S&P 500 Put Options | 143,300 | 15 | 0 | 0.05 | ||||||||||||||||||||||
| Total credit derivatives | 143,300 | 15 | 0 | |||||||||||||||||||||||
| Total derivatives | $ | 409,771 | $ | 693 | $ | 0 | ||||||||||||||||||||
| Three Months Ended September 30, 2019 | Nine Months Ended September 30, 2019 | Three Months Ended September 30, 2020 | Nine Months Ended September 30, 2020 | |||||||||||||||||||||||||||||||||||||||||||||||||||||||
Unrealized Gain/(Loss) | Realized Gain/(Loss) | Net Result from Derivative Transactions | Unrealized Gain/(Loss) | Realized Gain/(Loss) | Net Result from Derivative Transactions | Unrealized Gain/(Loss) | Realized Gain/(Loss) | Net Result from Derivative Transactions | Unrealized Gain/(Loss) | Realized Gain/(Loss) | Net Result from Derivative Transactions | |||||||||||||||||||||||||||||||||||||||||||||||
| Contract Type | Contract Type | |||||||||||||||||||||||||||||||||||||||||||||||||||||||||
| Futures | $ | (618 | ) | $ | (8,868 | ) | $ | (9,486 | ) | $ | 892 | $ | (36,761 | ) | $ | (35,869 | ) | Futures | $ | 69 | $ | 191 | $ | 260 | $ | (229) | $ | (16,081) | $ | (16,310) | ||||||||||||||||||||||||||||
| Credit Derivatives | (3 | ) | 24 | 21 | (3 | ) | (84 | ) | (87 | ) | Credit Derivatives | 0 | 0 | 0 | 111 | 211 | 322 | |||||||||||||||||||||||||||||||||||||||||
| Total | $ | (621 | ) | $ | (8,844 | ) | $ | (9,465 | ) | $ | 889 | $ | (36,845 | ) | $ | (35,956 | ) | Total | $ | 69 | $ | 191 | $ | 260 | $ | (118) | $ | (15,870) | $ | (15,988) | ||||||||||||||||||||||||||||
| Three Months Ended September 30, 2019 | Nine Months Ended September 30, 2019 | ||||||||||||||||||||||||||||||||||
| Unrealized Gain/(Loss) | Realized Gain/(Loss) | Net Result from Derivative Transactions | Unrealized Gain/(Loss) | Realized Gain/(Loss) | Net Result from Derivative Transactions | ||||||||||||||||||||||||||||||
| Contract Type | |||||||||||||||||||||||||||||||||||
| Futures | $ | (618) | $ | (8,868) | $ | (9,486) | $ | 892 | $ | (36,761) | $ | (35,869) | |||||||||||||||||||||||
| Credit Derivatives | (3) | 24 | 21 | (3) | (84) | (87) | |||||||||||||||||||||||||||||
| Total | $ | (621) | $ | (8,844) | $ | (9,465) | $ | 889 | $ | (36,845) | $ | (35,956) | |||||||||||||||||||||||
| Three Months Ended September 30, 2018 | Nine Months Ended September 30, 2018 | ||||||||||||||||||||||
Unrealized Gain/(Loss) | Realized Gain/(Loss) | Net Result from Derivative Transactions | Unrealized Gain/(Loss) | Realized Gain/(Loss) | Net Result from Derivative Transactions | ||||||||||||||||||
| Contract Type | |||||||||||||||||||||||
| Futures | $ | (940 | ) | $ | 8,099 | $ | 7,159 | $ | (52 | ) | $ | 28,985 | $ | 28,933 | |||||||||
| Swaps | — | — | — | 1,403 | (848 | ) | 555 | ||||||||||||||||
| Credit Derivatives | (44 | ) | — | (44 | ) | 5 | (337 | ) | (332 | ) | |||||||||||||
| Total | $ | (984 | ) | $ | 8,099 | $ | 7,115 | $ | 1,356 | $ | 27,800 | $ | 29,156 | ||||||||||
| Description | Gross amounts of recognized assets | Gross amounts offset in the balance sheet | Net amounts of assets presented in the balance sheet | Gross amounts not offset in the balance sheet | Net amount | |||||||||||||||||||
Financial instruments | Cash collateral received/(posted)(1) | |||||||||||||||||||||||
| Derivatives | $ | 22 | $ | — | $ | 22 | $ | — | $ | — | $ | 22 | ||||||||||||
| Total | $ | 22 | $ | — | $ | 22 | $ | — | $ | — | $ | 22 | ||||||||||||
| Description | Gross amounts of recognized assets | Gross amounts offset in the balance sheet | Net amounts of assets presented in the balance sheet | Gross amounts not offset in the balance sheet | Net amount | |||||||||||||||||||||||||||||||||
| Financial instruments | Cash collateral received/(posted)(1) | |||||||||||||||||||||||||||||||||||||
| Derivatives | $ | 449 | $ | 0 | $ | 449 | $ | 0 | $ | 0 | $ | 449 | ||||||||||||||||||||||||||
| Total | $ | 449 | $ | 0 | $ | 449 | $ | 0 | $ | 0 | $ | 449 | ||||||||||||||||||||||||||
| Description | Gross amounts of recognized liabilities | Gross amounts offset in the balance sheet | Net amounts of liabilities presented in the balance sheet | Gross amounts not offset in the balance sheet | Net amount | Description | Gross amounts of recognized liabilities | Gross amounts offset in the balance sheet | Net amounts of liabilities presented in the balance sheet | Gross amounts not offset in the balance sheet | Net amount | |||||||||||||||||||||||||||||||||||||||||||||||||||
Financial instruments collateral | Cash collateral posted/(received)(1) | Financial instruments collateral | Cash collateral posted/(received)(1) | |||||||||||||||||||||||||||||||||||||||||||||||||||||||||||
| Derivatives | $ | 82 | $ | — | $ | 82 | $ | — | $ | 82 | $ | — | ||||||||||||||||||||||||||||||||||||||||||||||||||
| Repurchase agreements | $ | 1,786,048 | $ | — | $ | 1,786,048 | $ | 1,786,048 | $ | — | $ | — | Repurchase agreements | $ | 1,176,966 | $ | 0 | $ | 1,176,966 | $ | 1,176,966 | $ | 0 | $ | 0 | |||||||||||||||||||||||||||||||||||||
| Total | $ | 1,786,130 | $ | — | $ | 1,786,130 | $ | 1,786,048 | $ | 82 | $ | — | Total | $ | 1,176,966 | $ | 0 | $ | 1,176,966 | $ | 1,176,966 | $ | 0 | $ | 0 | |||||||||||||||||||||||||||||||||||||
| Description | Gross amounts of recognized assets | Gross amounts offset in the balance sheet | Net amounts of assets presented in the balance sheet | Gross amounts not offset in the balance sheet | Net amount | |||||||||||||||||||||||||||||||||
| Financial instruments | Cash collateral received/(posted)(1) | |||||||||||||||||||||||||||||||||||||
| Derivatives | $ | 693 | $ | 0 | $ | 693 | $ | 0 | $ | 0 | $ | 693 | ||||||||||||||||||||||||||
| Total | $ | 693 | $ | 0 | $ | 693 | $ | 0 | $ | 0 | $ | 693 | ||||||||||||||||||||||||||
| Description | Gross amounts of recognized liabilities | Gross amounts offset in the balance sheet | Net amounts of liabilities presented in the balance sheet | Gross amounts not offset in the balance sheet | Net amount | |||||||||||||||||||
Financial instruments collateral | Cash collateral posted/(received) | |||||||||||||||||||||||
| Derivatives | $ | 975 | $ | — | $ | 975 | $ | — | $ | 975 | $ | — | ||||||||||||
| Repurchase agreements | 663,685 | — | 663,685 | 663,685 | — | — | ||||||||||||||||||
| Total | $ | 664,660 | $ | — | $ | 664,660 | $ | 663,685 | $ | 975 | $ | — | ||||||||||||
| Description | Gross amounts of recognized liabilities | Gross amounts offset in the balance sheet | Net amounts of liabilities presented in the balance sheet | Gross amounts not offset in the balance sheet | Net amount | |||||||||||||||||||||||||||||||||
| Financial instruments collateral | Cash collateral posted/(received) | |||||||||||||||||||||||||||||||||||||
| Repurchase agreements | $ | 1,815,934 | $ | 0 | $ | 1,815,934 | $ | 1,815,934 | $ | 0 | $ | 0 | ||||||||||||||||||||||||||
| Total | $ | 1,815,934 | $ | 0 | $ | 1,815,934 | $ | 1,815,934 | $ | 0 | $ | 0 | ||||||||||||||||||||||||||
| September 30, 2019 | December 31, 2018 | ||||||
| Notes 3 & 7 | Notes 3 & 7 | ||||||
| Mortgage loan receivables held for investment, net, at amortized cost | $ | 274,149 | $ | 710,502 | |||
| Accrued interest receivable | 1,363 | 3,921 | |||||
| Other assets(1) | — | 81,390 | |||||
| Total assets | $ | 275,512 | $ | 795,813 | |||
| Senior and unsecured debt obligations | $ | 117,760 | $ | 607,440 | |||
| Accrued expenses | 306 | 1,471 | |||||
| Other liabilities | 2 | 2 | |||||
| Total liabilities | 118,068 | 608,913 | |||||
| Net equity in VIEs (eliminated in consolidation) | 157,444 | 186,900 | |||||
| Total equity | 157,444 | 186,900 | |||||
| Total liabilities and equity | $ | 275,512 | $ | 795,813 | |||
| September 30, 2020 | |||||
| Notes 3 & 7 | |||||
| Restricted cash | $ | 8,649 | |||
| Mortgage loan | 434,519 | ||||
| Accrued interest receivable | 1,620 | ||||
| Other assets | 5,451 | ||||
| Total assets | $ | 450,239 | |||
| Debt obligations, net | $ | 281,625 | |||
| Accrued expenses | 653 | ||||
| Total liabilities | 282,278 | ||||
| Net equity in | 167,961 | ||||
| Total equity | 167,961 | ||||
| Total liabilities and equity | $ | 450,239 | |||
| Shares | Amount(1) | |||||||||||||
| Authorizations remaining as of December 31, 2019 | $ | 41,132 | ||||||||||||
| Additional authorizations | 0 | |||||||||||||
| Repurchases paid | 334,251 | (2,578) | ||||||||||||
| Repurchases unsettled | 0 | |||||||||||||
| Authorizations remaining as of September 30, 2020 | $ | 38,554 | ||||||||||||
| Shares | Amount(1) | |||||||||||||
| Authorizations remaining as of December 31, 2018 | $ | 41,769 | ||||||||||||
| Additional authorizations | 0 | |||||||||||||
| Repurchases paid | 40,065 | (637) | ||||||||||||
| Repurchases unsettled | 0 | |||||||||||||
| Authorizations remaining as of September 30, 2019 | $ | 41,132 | ||||||||||||
| Declaration Date | Dividend per Share | ||||||||||
| February 27, 2020 | $ | 0.340 | |||||||||
| May 28, 2020 | 0.200 | ||||||||||
| August 31, 2020 | 0.200 | ||||||||||
| Total | $ | 0.740 | |||||||||
| February 27, 2019 | $ | 0.340 | |||||||||
| May 30, 2019 | 0.340 | ||||||||||
| August 22, 2019 | 0.340 | ||||||||||
| Total | $ | 1.020 | |||||||||
| Accumulated Other Comprehensive Income (Loss) | Accumulated Other Comprehensive Income (Loss) of Noncontrolling Interests | Total Accumulated Other Comprehensive Income (Loss) | ||||||||||||||||||
| December 31, 2019 | $ | 4,218 | $ | 477 | $ | 4,695 | ||||||||||||||
| Other comprehensive income (loss) | (27,935) | (5,208) | (33,143) | |||||||||||||||||
| Exchange of noncontrolling interest for common stock | (6,953) | 6,953 | 0 | |||||||||||||||||
| Rebalancing of ownership percentage between Company and Operating Partnership | 2,222 | (2,222) | 0 | |||||||||||||||||
| September 30, 2020 | $ | (28,448) | $ | 0 | $ | (28,448) | ||||||||||||||
| Accumulated Other Comprehensive Income (Loss) | Accumulated Other Comprehensive Income (Loss) of Noncontrolling Interests | Total Accumulated Other Comprehensive Income (Loss) | ||||||||||||||||||
| December 31, 2018 | $ | (4,649) | $ | (588) | $ | (5,237) | ||||||||||||||
| Other comprehensive income (loss) | 14,935 | 1,840 | 16,775 | |||||||||||||||||
| Exchange of noncontrolling interest for common stock | 64 | (64) | 0 | |||||||||||||||||
| Rebalancing of ownership percentage between Company and Operating Partnership | 17 | (17) | 0 | |||||||||||||||||
| September 30, 2019 | $ | 10,367 | $ | 1,171 | $ | 11,538 | ||||||||||||||
| Shares | Amount(1) | ||||||
| Authorizations remaining as of December 31, 2018 | $ | 41,769 | |||||
| Additional authorizations | — | ||||||
| Repurchases paid | 40,065 | (637 | ) | ||||
| Repurchases unsettled | — | ||||||
| Authorizations remaining as of September 30, 2019 | $ | 41,132 | |||||
| Shares | Amount(1) | ||||||
| Authorizations remaining as of December 31, 2017 | $ | 41,769 | |||||
| Additional authorizations | — | ||||||
| Repurchases paid | — | — | |||||
| Repurchases unsettled | — | ||||||
| Authorizations remaining as of September 30, 2018 | $ | 41,769 | |||||
| Declaration Date | Dividend per Share | |||
| February 27, 2019 | $ | 0.340 | ||
| May 30, 2019 | 0.340 | |||
| August 22, 2019 | 0.340 | |||
| Total | $ | 1.020 | ||
| February 27, 2018 | $ | 0.315 | ||
| May 30, 2018 | 0.325 | |||
| September 5, 2018 | 0.325 | |||
| Total | $ | 0.965 | ||
| Accumulated Other Comprehensive Income (Loss) | Accumulated Other Comprehensive Income (Loss) of Noncontrolling Interests | Total Accumulated Other Comprehensive Income (Loss) | ||||||||||
| December 31, 2018 | $ | (4,649 | ) | $ | (588 | ) | $ | (5,237 | ) | |||
| Other comprehensive income (loss) | 14,935 | 1,840 | 16,775 | |||||||||
| Exchange of noncontrolling interest for common stock | 64 | (64 | ) | — | ||||||||
| Rebalancing of ownership percentage between Company and Operating Partnership | 17 | (17 | ) | — | ||||||||
| September 30, 2019 | $ | 10,367 | $ | 1,171 | $ | 11,538 | ||||||
| Accumulated Other Comprehensive Income (Loss) | Accumulated Other Comprehensive Income (Loss) of Noncontrolling Interests | Total Accumulated Other Comprehensive Income (Loss) | ||||||||||
| December 31, 2017 | $ | (212 | ) | $ | 116 | $ | (96 | ) | ||||
| Other comprehensive income (loss) | (8,230 | ) | (1,428 | ) | (9,658 | ) | ||||||
| Exchange of noncontrolling interest for common stock | (167 | ) | 167 | — | ||||||||
| Rebalancing of ownership percentage between Company and Operating Partnership | 27 | (27 | ) | — | ||||||||
| September 30, 2018 | $ | (8,582 | ) | $ | (1,172 | ) | $ | (9,754 | ) | |||
| Three Months Ended September 30, | Nine Months Ended September 30, | |||||||||||||||
| ($ in thousands except share amounts) | 2019 | 2018 | 2019 | 2018 | ||||||||||||
| Basic Net income (loss) available for Class A common shareholders | $ | 27,576 | $ | 66,630 | $ | 81,996 | $ | 155,911 | ||||||||
| Diluted Net income (loss) available for Class A common shareholders | $ | 27,576 | $ | 74,038 | $ | 81,996 | $ | 177,875 | ||||||||
| Weighted average shares outstanding | ||||||||||||||||
| Basic | 106,004,152 | 96,935,986 | 105,264,752 | 96,317,513 | ||||||||||||
| Diluted | 106,603,713 | 110,650,253 | 106,232,581 | 110,482,991 | ||||||||||||
| Three Months Ended September 30, | Nine Months Ended September 30, | |||||||||||||||||||||||||||||||
| ($ in thousands except share amounts) | 2020 | 2019 | 2020 | 2019 | ||||||||||||||||||||||||||||
| Basic Net income (loss) available for Class A common shareholders | $ | 17,188 | $ | 27,576 | $ | (2,729) | $ | 81,996 | ||||||||||||||||||||||||
| Diluted Net income (loss) available for Class A common shareholders | $ | 17,188 | $ | 27,576 | $ | (2,729) | $ | 81,996 | ||||||||||||||||||||||||
| Weighted average shares outstanding | ||||||||||||||||||||||||||||||||
| Basic | 117,481,812 | 106,004,152 | 110,233,748 | 105,264,752 | ||||||||||||||||||||||||||||
| Diluted | 118,791,927 | 106,603,713 | 110,233,748 | 106,232,581 | ||||||||||||||||||||||||||||
| Three Months Ended September 30, | Nine Months Ended September 30, | |||||||||||||||||||||||||||||||
| (In thousands except share amounts) | 2020 | 2019(1) | 2020(1) | 2019(1) | ||||||||||||||||||||||||||||
| Basic Net Income (Loss) Per Share of Class A Common Stock | ||||||||||||||||||||||||||||||||
| Numerator: | ||||||||||||||||||||||||||||||||
| Net income (loss) attributable to Class A common shareholders | $ | 17,188 | $ | 27,576 | $ | (2,729) | $ | 81,996 | ||||||||||||||||||||||||
| Denominator: | ||||||||||||||||||||||||||||||||
| Weighted average number of shares of Class A common stock outstanding | 117,481,812 | 106,004,152 | 110,233,748 | 105,264,752 | ||||||||||||||||||||||||||||
| Basic net income (loss) per share of Class A common stock | $ | 0.15 | $ | 0.26 | $ | (0.02) | $ | 0.78 | ||||||||||||||||||||||||
| Diluted Net Income (Loss) Per Share of Class A Common Stock | ||||||||||||||||||||||||||||||||
| Numerator: | ||||||||||||||||||||||||||||||||
| Net income (loss) attributable to Class A common shareholders | $ | 17,188 | $ | 27,576 | $ | (2,729) | $ | 81,996 | ||||||||||||||||||||||||
| Add (deduct) - dilutive effect of: | ||||||||||||||||||||||||||||||||
| Amounts attributable to operating partnership’s share of Ladder Capital Corp net income (loss)(2) | 0 | 0 | 0 | 0 | ||||||||||||||||||||||||||||
| Additional corporate tax (expense) benefit(2) | 0 | 0 | 0 | 0 | ||||||||||||||||||||||||||||
| Diluted net income (loss) attributable to Class A common shareholders | 17,188 | 27,576 | (2,729) | 81,996 | ||||||||||||||||||||||||||||
| Denominator: | ||||||||||||||||||||||||||||||||
| Basic weighted average number of shares of Class A common stock outstanding | 117,481,812 | 106,004,152 | 110,233,748 | 105,264,752 | ||||||||||||||||||||||||||||
| Add - dilutive effect of: | ||||||||||||||||||||||||||||||||
| Shares issuable relating to converted Class B common shareholders(3) | 1,217,761 | 0 | 0 | 0 | ||||||||||||||||||||||||||||
| Incremental shares of unvested Class A restricted stock(3) | 92,354 | 599,561 | 0 | 967,829 | ||||||||||||||||||||||||||||
| Incremental shares of unvested stock options | 0 | 0 | 0 | 0 | ||||||||||||||||||||||||||||
| Diluted weighted average number of shares of Class A common stock outstanding | 118,791,927 | 106,603,713 | 110,233,748 | 106,232,581 | ||||||||||||||||||||||||||||
| Diluted net income (loss) per share of Class A common stock | $ | 0.14 | $ | 0.26 | $ | (0.02) | $ | 0.77 | ||||||||||||||||||||||||
| Three Months Ended September 30, | Nine Months Ended September 30, | |||||||||||||||
| (In thousands except share amounts) | 2019 | 2018 | 2019 | 2018 | ||||||||||||
| Basic Net Income (Loss) Per Share of Class A Common Stock | ||||||||||||||||
| Numerator: | ||||||||||||||||
| Net income (loss) attributable to Class A common shareholders | $ | 27,576 | $ | 66,630 | $ | 81,996 | $ | 155,911 | ||||||||
| Denominator: | ||||||||||||||||
| Weighted average number of shares of Class A common stock outstanding | 106,004,152 | 96,935,986 | 105,264,752 | 96,317,513 | ||||||||||||
| Basic net income (loss) per share of Class A common stock | $ | 0.26 | $ | 0.69 | $ | 0.78 | $ | 1.62 | ||||||||
| Diluted Net Income (Loss) Per Share of Class A Common Stock | ||||||||||||||||
| Numerator: | ||||||||||||||||
| Net income (loss) attributable to Class A common shareholders | $ | 27,576 | $ | 66,630 | $ | 81,996 | $ | 155,911 | ||||||||
| Add (deduct) - dilutive effect of: | ||||||||||||||||
| Amounts attributable to operating partnership’s share of Ladder Capital Corp net income (loss) | — | 8,991 | — | 22,786 | ||||||||||||
| Additional corporate tax (expense) benefit | — | (1,583 | ) | — | (822 | ) | ||||||||||
| Diluted net income (loss) attributable to Class A common shareholders | 27,576 | 74,038 | 81,996 | 177,875 | ||||||||||||
| Denominator: | ||||||||||||||||
| Basic weighted average number of shares of Class A common stock outstanding | 106,004,152 | 96,935,986 | 105,264,752 | 96,317,513 | ||||||||||||
| Add - dilutive effect of: | ||||||||||||||||
| Shares issuable relating to converted Class B common shareholders | — | 13,202,202 | — | 13,800,597 | ||||||||||||
| Incremental shares of unvested Class A restricted stock | 599,561 | 512,065 | 967,829 | 364,881 | ||||||||||||
| Diluted weighted average number of shares of Class A common stock outstanding | 106,603,713 | 110,650,253 | 106,232,581 | 110,482,991 | ||||||||||||
| Diluted net income (loss) per share of Class A common stock | $ | 0.26 | $ | 0.67 | $ | 0.77 | $ | 1.61 | ||||||||
| Three Months Ended September 30, | Nine Months Ended September 30, | ||||||||||||||||||||||||||||
| 2020 | 2019 | 2020 | 2019 | ||||||||||||||||||||||||||
| Stock Based Compensation Expense | $ | 4,219 | $ | 3,575 | $ | 20,957 | $ | 18,336 | |||||||||||||||||||||
| Phantom Equity Investment Plan | (94) | 343 | (1,671) | 1,047 | |||||||||||||||||||||||||
| Stock Options Exercised | — | — | 270 | — | |||||||||||||||||||||||||
| Bonus Expense | 517 | 6,533 | 487 | 21,035 | |||||||||||||||||||||||||
| Total | $ | 4,642 | $ | 10,451 | $ | 20,043 | $ | 40,418 | |||||||||||||||||||||
| Three Months Ended September 30, | Nine Months Ended September 30, | ||||||||||||||
| 2019 | 2018 | 2019 | 2018 | ||||||||||||
| Stock Based Compensation Expense: | |||||||||||||||
| Annual Incentive Awards Granted in 2015 with Respect to 2014 Performance | $ | — | $ | — | $ | — | $ | 172 | |||||||
| Annual Incentive Awards Granted in 2016 with Respect to 2015 Performance | — | 323 | 131 | 971 | |||||||||||
| Annual Incentive Awards Granted in 2017 with Respect to 2016 Performance(1) | 280 | 524 | 955 | 1,655 | |||||||||||
| Other 2017 Restricted Stock Awards(1) | 25 | 76 | 102 | 257 | |||||||||||
| Annual Incentive Awards Granted in 2017 with Respect to 2017 Performance(1) | 596 | 1,122 | 1,961 | 3,325 | |||||||||||
| 2018 Restricted Stock Awards | — | 95 | 32 | 230 | |||||||||||
| Other 2018 Restricted Stock Awards(1) | 11 | 9 | 31 | 12 | |||||||||||
| Annual Incentive Awards Granted in 2019 with Respect to 2018 Performance(1) | 2,509 | — | 14,804 | — | |||||||||||
| 2019 Restricted Stock Awards | 148 | — | 297 | — | |||||||||||
| Other Employee/Director Awards | 6 | 13 | 23 | 45 | |||||||||||
| Total Stock Based Compensation Expense | $ | 3,575 | $ | 2,162 | $ | 18,336 | $ | 6,667 | |||||||
| Phantom Equity Investment Plan | $ | 343 | $ | — | $ | 1,047 | $ | — | |||||||
| Ladder Capital Corp Deferred Compensation Plan | $ | — | $ | 601 | $ | — | $ | 1,519 | |||||||
| Bonus Expense | $ | 6,533 | $ | 9,210 | $ | 21,035 | $ | 26,772 | |||||||
| Three Months Ended September 30, | Nine Months Ended September 30, | ||||||||||||||||||||||||||||||||||||||||||||||||||||||||||
| 2020 | 2019 | 2020 | 2019 | ||||||||||||||||||||||||||||||||||||||||||||||||||||||||
| Number of Shares/Options | Weighted Average Fair Value Per Share | Number of Shares | Weighted Average Fair Value Per Share | Number of Shares/Options | Weighted Average Fair Value Per Share | Number of Shares/Options | Weighted Average Fair Value Per Share | ||||||||||||||||||||||||||||||||||||||||||||||||||||
| Grants - Class A Common Stock | 0 | $ | 0 | 24,125 | $ | 16.58 | 1,466,337 | $ | 18.72 | 1,569,694 | $ | 17.54 | |||||||||||||||||||||||||||||||||||||||||||||||
| Grants - Class A Common Stock dividends | 0 | 0 | 0 | 0 | 0 | 0 | 11,113 | 16.61 | |||||||||||||||||||||||||||||||||||||||||||||||||||
| Stock Options | 0 | — | 0 | — | 0 | — | 12,073 | — | |||||||||||||||||||||||||||||||||||||||||||||||||||
| Three Months Ended September 30, | Nine Months Ended September 30, | ||||||||||||||||||||||||||
| 2019 | 2018 | 2019 | 2018 | ||||||||||||||||||||||||
| Number of Shares/Options | Weighted Average Fair Value Per Share | Number of Shares | Weighted Average Fair Value Per Share | Number of Shares/Options | Weighted Average Fair Value Per Share | Number of Shares/Options | Weighted Average Fair Value Per Share | ||||||||||||||||||||
| Grants - Class A Common Stock (restricted) | 23,443 | $ | 16.58 | 4,720 | $ | 15.89 | 1,569,694 | $ | 17.54 | 33,656 | $ | 14.86 | |||||||||||||||
| Grants - Class A Common Stock (restricted) dividends | — | — | — | — | 11,113 | 16.61 | — | — | |||||||||||||||||||
| Stock Options | — | — | — | — | 12,073 | — | — | — | |||||||||||||||||||
| Restricted Stock | Stock Options | ||||
| Nonvested/Outstanding at December 31, 2018 | 1,118,194 | 982,135 | |||
| Granted | 1,580,807 | 12,073 | |||
| Exercised | — | ||||
| Vested | (1,122,107 | ) | |||
| Forfeited | (8,702 | ) | — | ||
| Expired | — | ||||
| Nonvested/Outstanding at September 30, 2019 | 1,568,192 | 994,208 | |||
| Exercisable at September 30, 2019 | 994,208 | ||||
| Restricted Stock | Stock Options | ||||||||||||||||
| Nonvested/Outstanding at December 31, 2019 | 1,436,683 | 994,208 | |||||||||||||||
| Granted | 1,466,337 | 0 | |||||||||||||||
| Exercised | (83,845) | ||||||||||||||||
| Vested | (1,221,279) | ||||||||||||||||
| Forfeited | (24,266) | 0 | |||||||||||||||
| Expired | 0 | ||||||||||||||||
| Nonvested/Outstanding at September 30, 2020 | 1,657,475 | 910,363 | |||||||||||||||
| Exercisable at September 30, 2020 | 910,363 | ||||||||||||||||
| Restricted Stock | Stock Options | ||||
| Nonvested/Outstanding at December 31, 2017 | 1,252,365 | 982,135 | |||
| Granted | 33,656 | — | |||
| Exercised | — | ||||
| Vested | (138,216 | ) | |||
| Forfeited | (26,061 | ) | — | ||
| Expired | — | ||||
| Nonvested/Outstanding at September 30, 2018 | 1,121,744 | 982,135 | |||
| Exercisable at September 30, 2018 | 929,701 | ||||
| Weighted Average | ||||||||||||||||||
Outstanding Face Amount | Amortized Cost Basis/Purchase Price | Fair Value | Fair Value Method | Yield % | Remaining Maturity/Duration (years) | |||||||||||||
| Assets: | ||||||||||||||||||
| CMBS(1) | $ | 1,779,458 | $ | 1,780,233 | $ | 1,788,712 | Internal model, third-party inputs | 3.14 | % | 2.38 | ||||||||
| CMBS interest-only(1) | 2,139,357 | (2) | 39,961 | 41,440 | Internal model, third-party inputs | 3.65 | % | 2.61 | ||||||||||
| GNMA interest-only(3) | 113,096 | (2) | 2,202 | 2,026 | Internal model, third-party inputs | 9.65 | % | 2.73 | ||||||||||
| Agency securities(1) | 641 | 652 | 654 | Internal model, third-party inputs | 1.74 | % | 1.97 | |||||||||||
| GNMA permanent securities(1) | 31,760 | 31,984 | 32,795 | Internal model, third-party inputs | 3.27 | % | 4.55 | |||||||||||
| Corporate bonds(1) | 32,088 | 31,604 | 32,372 | Internal model, third-party inputs | 4.81 | % | 1.31 | |||||||||||
| Equity securities(3) | N/A | 13,720 | 13,457 | Observable market prices | N/A | N/A | ||||||||||||
| Mortgage loan receivables held for investment, net, at amortized cost: | ||||||||||||||||||
| Mortgage loan receivables held for investment, net, at amortized cost | 3,249,711 | 3,231,443 | 3,249,383 | Discounted Cash Flow(4) | 7.29 | % | 1.37 | |||||||||||
| Provision for loan losses | N/A | (18,500 | ) | (18,500 | ) | (5) | N/A | N/A | ||||||||||
| Mortgage loan receivables held for sale | 173,957 | 174,214 | 182,716 | Internal model, third-party inputs(6) | 4.59 | % | 9.68 | |||||||||||
| FHLB stock(7) | 61,619 | 61,619 | 61,619 | (7) | 5.50 | % | N/A | |||||||||||
| Nonhedge derivatives(1)(8) | 6,000 | N/A | 22 | Counterparty quotations | N/A | 0.30 | ||||||||||||
| Liabilities: | ||||||||||||||||||
| Repurchase agreements - short-term | 1,486,049 | 1,486,049 | 1,486,049 | Discounted Cash Flow(9) | 2.65 | % | 0.18 | |||||||||||
| Repurchase agreements - long-term | 299,999 | 299,999 | 299,999 | Discounted Cash Flow(10) | 3.20 | % | 1.28 | |||||||||||
| Mortgage loan financing | 718,351 | 723,313 | 748,489 | Discounted Cash Flow(10) | 4.96 | % | 1.51 | |||||||||||
| CLO debt | 117,760 | 117,760 | 117,760 | Discounted Cash Flow(9) | 4.97 | % | 5.91 | |||||||||||
| Borrowings from the FHLB | 1,076,449 | 1,076,449 | 1,084,876 | Discounted Cash Flow | 2.50 | % | 2.32 | |||||||||||
| Senior unsecured notes | 1,166,201 | 1,157,117 | 1,201,973 | Broker quotations, pricing services | 5.39 | % | 3.53 | |||||||||||
| Nonhedge derivatives(1)(8) | 270,471 | N/A | 82 | Counterparty quotations | N/A | 0.25 | ||||||||||||
| Weighted Average | |||||||||||||||||||||||||||||||||||
| Outstanding Face Amount | Amortized Cost Basis/Purchase Price | Fair Value | Fair Value Method | Yield % | Remaining Maturity/Duration (years) | ||||||||||||||||||||||||||||||
| Assets: | |||||||||||||||||||||||||||||||||||
| CMBS(1) | $ | 1,420,752 | $ | 1,420,537 | $ | 1,390,562 | Internal model, third-party inputs | 1.54 | % | 2.10 | |||||||||||||||||||||||||
| CMBS interest-only(1) | 1,506,152 | (2) | 23,063 | 23,741 | Internal model, third-party inputs | 3.32 | % | 2.28 | |||||||||||||||||||||||||||
| GNMA interest-only(3) | 87,917 | (2) | 1,175 | 1,228 | Internal model, third-party inputs | 3.90 | % | 3.27 | |||||||||||||||||||||||||||
| Agency securities(1) | 595 | 603 | 619 | Internal model, third-party inputs | 1.66 | % | 1.40 | ||||||||||||||||||||||||||||
| GNMA permanent securities(1) | 30,542 | 30,662 | 31,494 | Internal model, third-party inputs | 3.49 | % | 2.20 | ||||||||||||||||||||||||||||
| Provision for current expected credit reserves | N/A | (19) | (19) | (5) | N/A | N/A | |||||||||||||||||||||||||||||
| Mortgage loan receivables held for investment, net, at amortized cost: | |||||||||||||||||||||||||||||||||||
| Mortgage loan receivables held for investment, net, at amortized cost | 2,744,724 | 2,731,254 | 2,743,359 | Discounted Cash Flow(4) | 6.81 | % | 1.10 | ||||||||||||||||||||||||||||
| Provision for current expected credit reserves | N/A | (47,084) | (47,084) | (5) | N/A | N/A | |||||||||||||||||||||||||||||
| Mortgage loan receivables held for sale | 30,513 | 30,553 | 32,016 | Internal model, third-party inputs(6) | 4.05 | % | 9.43 | ||||||||||||||||||||||||||||
| FHLB stock(7) | 61,619 | 61,619 | 61,619 | (7) | 3.50 | % | N/A | ||||||||||||||||||||||||||||
| Nonhedge derivatives(1)(8) | 66,800 | N/A | 449 | Counterparty quotations | N/A | 0.25 | |||||||||||||||||||||||||||||
| Liabilities: | |||||||||||||||||||||||||||||||||||
| Repurchase agreements - short-term | 1,140,350 | 1,140,350 | 1,140,350 | Discounted Cash Flow(9) | 1.55 | % | 0.24 | ||||||||||||||||||||||||||||
| Repurchase agreements - long-term | 36,616 | 36,616 | 36,616 | Discounted Cash Flow(10) | 0.64 | % | 1.23 | ||||||||||||||||||||||||||||
| Revolving credit facility | 266,430 | 266,430 | 266,430 | Discounted Cash Flow(9) | 3.16 | % | 0.06 | ||||||||||||||||||||||||||||
| Mortgage loan financing | 765,516 | 769,968 | 791,391 | Discounted Cash Flow(10) | 4.98 | % | 4.75 | ||||||||||||||||||||||||||||
| Secured financing facility | 190,582 | 190,582 | 190,582 | Discounted Cash Flow(9) | 10.75 | % | 2.60 | ||||||||||||||||||||||||||||
| CLO debt | 281,625 | 281,625 | 281,625 | Discounted Cash Flow(9) | 5.50 | % | 3.63 | ||||||||||||||||||||||||||||
| Borrowings from the FHLB | 326,000 | 326,000 | 327,418 | Discounted Cash Flow | 1.33 | % | 2.68 | ||||||||||||||||||||||||||||
| Senior unsecured notes | 1,716,994 | 1,702,939 | 1,031,999 | Internal model, third-party inputs | 4.96 | % | 3.94 | ||||||||||||||||||||||||||||
| Weighted Average | |||||||||||||||||||||||||||||||||||
| Outstanding Face Amount | Amortized Cost Basis | Fair Value | Fair Value Method | Yield % | Remaining Maturity/Duration (years) | ||||||||||||||||||||||||||||||
| Assets: | |||||||||||||||||||||||||||||||||||
| CMBS(1) | $ | 1,640,597 | $ | 1,640,905 | $ | 1,644,322 | Internal model, third-party inputs | 3.08 | % | 2.41 | |||||||||||||||||||||||||
| CMBS interest-only(1) | 1,559,160 | (2) | 28,553 | 29,146 | Internal model, third-party inputs | 3.04 | % | 2.53 | |||||||||||||||||||||||||||
| GNMA interest-only(3) | 109,783 | (2) | 1,982 | 1,851 | Internal model, third-party inputs | 4.59 | % | 2.77 | |||||||||||||||||||||||||||
| Agency securities(1) | 629 | 640 | 637 | Internal model, third-party inputs | 1.73 | % | 1.83 | ||||||||||||||||||||||||||||
| GNMA permanent securities(1) | 31,461 | 31,681 | 32,369 | Internal model, third-party inputs | 3.17 | % | 1.93 | ||||||||||||||||||||||||||||
| Equity securities(3) | N/A | 12,848 | 12,980 | Observable market prices | N/A | N/A | |||||||||||||||||||||||||||||
| Mortgage loan receivables held for investment, net, at amortized cost: | |||||||||||||||||||||||||||||||||||
| Mortgage loan receivables held for investment, net, at amortized cost | 3,277,596 | 3,257,036 | 3,273,219 | Discounted Cash Flow(4) | 6.94 | % | 1.43 | ||||||||||||||||||||||||||||
| Provision for loan losses | N/A | (20,500) | (20,500) | (5) | N/A | N/A | |||||||||||||||||||||||||||||
| Mortgage loan receivables held for sale | 122,748 | 122,325 | 124,989 | Internal model, third-party inputs(6) | 4.20 | % | 9.99 | ||||||||||||||||||||||||||||
| FHLB stock(7) | 61,619 | 61,619 | 61,619 | (7) | 4.75 | % | N/A | ||||||||||||||||||||||||||||
| Nonhedge derivatives(1)(8) | 340,200 | N/A | 693 | Counterparty quotations | N/A | 0.25 | |||||||||||||||||||||||||||||
| Liabilities: | |||||||||||||||||||||||||||||||||||
| Repurchase agreements - short-term | 1,781,253 | 1,781,253 | 1,781,253 | Discounted Cash Flow(9) | 2.50 | % | 0.19 | ||||||||||||||||||||||||||||
| Repurchase agreements - long-term | 34,681 | 34,681 | 34,681 | Discounted Cash Flow(10) | 2.81 | % | 1.41 | ||||||||||||||||||||||||||||
| Mortgage loan financing | 807,854 | 812,606 | 838,766 | Discounted Cash Flow(10) | 4.91 | % | 5.65 | ||||||||||||||||||||||||||||
| Borrowings from the FHLB | 1,073,500 | 1,073,500 | 1,080,354 | Discounted Cash Flow | 2.33 | % | 2.08 | ||||||||||||||||||||||||||||
| Senior unsecured notes | 1,166,201 | 1,157,833 | 1,208,860 | Internal model, third-party inputs | 5.39 | % | 3.28 | ||||||||||||||||||||||||||||
| Nonhedge derivatives(1)(8) | 69,571 | N/A | 0 | Counterparty quotations | N/A | 0.36 | |||||||||||||||||||||||||||||
| Weighted Average | ||||||||||||||||||
Outstanding Face Amount | Amortized Cost Basis | Fair Value | Fair Value Method | Yield % | Remaining Maturity/Duration (years) | |||||||||||||
| Assets: | ||||||||||||||||||
| CMBS(1) | $ | 1,258,819 | $ | 1,257,801 | $ | 1,252,640 | Internal model, third-party inputs | 3.14 | % | 2.33 | ||||||||
| CMBS interest-only(1) | 2,373,936 | (2) | 55,534 | 55,691 | Internal model, third-party inputs | 2.80 | % | 2.69 | ||||||||||
| GNMA interest-only(3) | 135,932 | (2) | 2,862 | 2,648 | Internal model, third-party inputs | 6.30 | % | 4.11 | ||||||||||
| Agency securities(1) | 668 | 682 | 662 | Internal model, third-party inputs | 1.83 | % | 2.36 | |||||||||||
| GNMA permanent securities(1) | 32,633 | 32,889 | 33,064 | Internal model, third-party inputs | 3.76 | % | 5.03 | |||||||||||
| Corporate bonds(1) | 55,305 | 54,257 | 53,871 | Internal model, third-party inputs | 5.04 | % | 2.51 | |||||||||||
| Equity securities(3) | N/A | 13,154 | 11,550 | Observable market prices | N/A | N/A | ||||||||||||
| Mortgage loan receivables held for investment, net, at amortized cost: | ||||||||||||||||||
| Mortgage loan receivables held for investment, net, at amortized cost | 3,340,381 | 3,318,390 | 3,324,588 | Discounted Cash Flow(4) | 7.84 | % | 1.32 | |||||||||||
| Provision for loan losses | N/A | (17,900 | ) | (17,900 | ) | (5) | N/A | N/A | ||||||||||
| Mortgage loan receivables held for sale | 181,905 | 182,439 | 187,870 | Internal model, third-party inputs(6) | 5.46 | % | 9.75 | |||||||||||
| FHLB stock(7) | 57,915 | 57,915 | 57,915 | (7) | 4.50 | % | N/A | |||||||||||
| Nonhedge derivatives(1)(8) | — | N/A | — | Counterparty quotations | N/A | 0.00 | ||||||||||||
| Liabilities: | ||||||||||||||||||
| Repurchase agreements - short-term | 436,957 | 436,957 | 436,957 | Discounted Cash Flow(9) | 3.42 | % | 0.23 | |||||||||||
| Repurchase agreements - long-term | 226,728 | 226,728 | 226,728 | Discounted Cash Flow(10) | 3.47 | % | 1.73 | |||||||||||
| Mortgage loan financing | 738,825 | 743,902 | 735,662 | Discounted Cash Flow(10) | 5.09 | % | 2.61 | |||||||||||
| CLO debt | 601,543 | 601,543 | 601,543 | Discounted Cash Flow(9) | 4.41 | % | 9.40 | |||||||||||
| Participation Financing - Mortgage Loan Receivable | 2,453 | 2,453 | 2,453 | Discounted Cash Flow(11) | 17.00 | % | 0.43 | |||||||||||
| Borrowings from the FHLB | 1,286,000 | 1,286,000 | 1,286,664 | Discounted Cash Flow | 2.55 | % | 2.46 | |||||||||||
| Senior unsecured notes | 1,166,201 | 1,154,991 | 1,111,288 | Broker quotations, pricing services | 5.39 | % | 4.28 | |||||||||||
| Nonhedge derivatives(1)(8) | 578,971 | N/A | 975 | Counterparty quotations | N/A | 0.25 | ||||||||||||
| Financial Instruments Reported at Fair Value on Consolidated Statements of Financial Condition | Outstanding Face Amount | Fair Value | ||||||||||||||||||
| Level 1 | Level 2 | Level 3 | Total | |||||||||||||||||
| Assets: | ||||||||||||||||||||
| CMBS(1) | $ | 1,767,314 | $ | — | $ | — | $ | 1,777,085 | $ | 1,777,085 | ||||||||||
| CMBS interest-only(1) | 2,128,234 | (2) | — | — | 40,601 | 40,601 | ||||||||||||||
| GNMA interest-only(3) | 113,096 | (2) | — | — | 2,026 | 2,026 | ||||||||||||||
| Agency securities(1) | 641 | — | — | 654 | 654 | |||||||||||||||
| GNMA permanent securities(1) | 31,760 | — | — | 32,795 | 32,795 | |||||||||||||||
| Corporate bonds(1) | 32,088 | — | — | 32,372 | 32,372 | |||||||||||||||
| Equity securities | N/A | 13,457 | — | — | 13,457 | |||||||||||||||
| Nonhedge derivatives(4) | 6,000 | — | 22 | — | 22 | |||||||||||||||
| $ | 13,457 | $ | 22 | $ | 1,885,533 | $ | 1,899,012 | |||||||||||||
| Liabilities: | ||||||||||||||||||||
| Nonhedge derivatives(4) | 270,471 | $ | — | $ | 82 | $ | — | $ | 82 | |||||||||||
| Financial Instruments Not Reported at Fair Value on Consolidated Statements of Financial Condition | Outstanding Face Amount | Fair Value | ||||||||||||||||||
| Level 1 | Level 2 | Level 3 | Total | |||||||||||||||||
| Assets: | ||||||||||||||||||||
| Mortgage loan receivable held for investment, net, at amortized cost: | ||||||||||||||||||||
| Mortgage loans held by consolidated subsidiaries | $ | 3,249,711 | $ | — | $ | — | $ | 3,249,383 | $ | 3,249,383 | ||||||||||
| Provision for loan losses | N/A | — | — | (18,500 | ) | (18,500 | ) | |||||||||||||
| Mortgage loan receivable held for sale | 173,957 | — | — | 182,716 | 182,716 | |||||||||||||||
| CMBS(5) | 12,144 | — | — | 11,627 | 11,627 | |||||||||||||||
| CMBS interest-only(5) | 11,123 | (2) | — | — | 839 | 839 | ||||||||||||||
| FHLB stock | 61,619 | — | — | 61,619 | 61,619 | |||||||||||||||
| $ | — | $ | — | $ | 3,487,684 | $ | 3,487,684 | |||||||||||||
| Liabilities: | ||||||||||||||||||||
| Repurchase agreements - short-term | 1,486,049 | $ | — | $ | — | $ | 1,486,049 | $ | 1,486,049 | |||||||||||
| Repurchase agreements - long-term | 299,999 | — | — | 299,999 | 299,999 | |||||||||||||||
| Mortgage loan financing | 718,351 | — | — | 748,489 | 748,489 | |||||||||||||||
| CLO debt | 117,760 | — | — | 117,760 | 117,760 | |||||||||||||||
| Borrowings from the FHLB | 1,076,449 | — | — | 1,084,876 | 1,084,876 | |||||||||||||||
| Senior unsecured notes | 1,166,201 | — | — | 1,201,973 | 1,201,973 | |||||||||||||||
| $ | — | $ | — | $ | 4,939,146 | $ | 4,939,146 | |||||||||||||
| Financial Instruments Reported at Fair Value on Consolidated Statements of Financial Condition | Outstanding Face Amount | Fair Value | ||||||||||||||||||||||||||||||
| Level 1 | Level 2 | Level 3 | Total | |||||||||||||||||||||||||||||
| Assets: | ||||||||||||||||||||||||||||||||
| CMBS(1) | $ | 1,409,202 | $ | 0 | $ | 0 | $ | 1,379,469 | $ | 1,379,469 | ||||||||||||||||||||||
| CMBS interest-only(1) | 1,495,559 | (2) | 0 | 0 | 23,035 | 23,035 | ||||||||||||||||||||||||||
| GNMA interest-only(3) | 87,917 | (2) | 0 | 0 | 1,228 | 1,228 | ||||||||||||||||||||||||||
| Agency securities(1) | 595 | 0 | 0 | 619 | 619 | |||||||||||||||||||||||||||
| GNMA permanent securities(1) | 30,542 | 0 | 0 | 31,494 | 31,494 | |||||||||||||||||||||||||||
| Nonhedge derivatives(4) | 66,800 | 0 | 449 | 0 | 449 | |||||||||||||||||||||||||||
| $ | 0 | $ | 449 | $ | 1,435,845 | $ | 1,436,294 | |||||||||||||||||||||||||
| Financial Instruments Not Reported at Fair Value on Consolidated Statements of Financial Condition | Outstanding Face Amount | Fair Value | ||||||||||||||||||||||||||||||
| Level 1 | Level 2 | Level 3 | Total | |||||||||||||||||||||||||||||
| Assets: | ||||||||||||||||||||||||||||||||
| Mortgage loan receivable held for investment, net, at amortized cost: | ||||||||||||||||||||||||||||||||
| Mortgage loans held by consolidated subsidiaries | $ | 2,744,724 | $ | 0 | $ | 0 | $ | 2,743,359 | $ | 2,743,359 | ||||||||||||||||||||||
| Provision for current expected credit losses | N/A | 0 | 0 | (47,084) | (47,084) | |||||||||||||||||||||||||||
| Mortgage loan receivable held for sale | 30,513 | 0 | 0 | 32,016 | 32,016 | |||||||||||||||||||||||||||
| CMBS(5) | 11,550 | 0 | 0 | 11,093 | 11,093 | |||||||||||||||||||||||||||
| CMBS interest-only(5) | 10,593 | (2) | 0 | 0 | 706 | 706 | ||||||||||||||||||||||||||
| Provision for current expected credit losses | N/A | (19) | (19) | |||||||||||||||||||||||||||||
| FHLB stock | 61,619 | 0 | 0 | 61,619 | 61,619 | |||||||||||||||||||||||||||
| $ | 0 | $ | 0 | $ | 2,801,690 | $ | 2,801,690 | |||||||||||||||||||||||||
| Liabilities: | ||||||||||||||||||||||||||||||||
| Repurchase agreements - short-term | 1,140,350 | $ | 0 | $ | 0 | $ | 1,140,350 | $ | 1,140,350 | |||||||||||||||||||||||
| Repurchase agreements - long-term | 36,616 | 0 | 0 | 36,616 | 36,616 | |||||||||||||||||||||||||||
| Revolving credit facility | 266,430 | 0 | 0 | 266,430 | 266,430 | |||||||||||||||||||||||||||
| Mortgage loan financing | 765,516 | 0 | 0 | 791,391 | 791,391 | |||||||||||||||||||||||||||
| Secured financing facility | 190,582 | 0 | 0 | 190,582 | 190,582 | |||||||||||||||||||||||||||
| CLO debt | 281,625 | 0 | 0 | 281,625 | 281,625 | |||||||||||||||||||||||||||
| Borrowings from the FHLB | 326,000 | 0 | 0 | 327,418 | 327,418 | |||||||||||||||||||||||||||
| Senior unsecured notes | 1,716,994 | 0 | 0 | 1,031,999 | 1,031,999 | |||||||||||||||||||||||||||
| $ | 0 | $ | 0 | $ | 4,066,411 | $ | 4,066,411 | |||||||||||||||||||||||||
| Financial Instruments Reported at Fair Value on Consolidated Statements of Financial Condition | Outstanding Face Amount | Fair Value | ||||||||||||||||||||||||||||||
| Level 1 | Level 2 | Level 3 | Total | |||||||||||||||||||||||||||||
| Assets: | ||||||||||||||||||||||||||||||||
| CMBS(1) | $ | 1,628,476 | $ | 0 | $ | 0 | $ | 1,632,714 | $ | 1,632,714 | ||||||||||||||||||||||
| CMBS interest-only(1) | 1,548,061 | (2) | 0 | 0 | 28,342 | 28,342 | ||||||||||||||||||||||||||
| GNMA interest-only(3) | 109,783 | (2) | 0 | 0 | 1,851 | 1,851 | ||||||||||||||||||||||||||
| Agency securities(1) | 629 | 0 | 0 | 637 | 637 | |||||||||||||||||||||||||||
| GNMA permanent securities(1) | 31,461 | 0 | 0 | 32,369 | 32,369 | |||||||||||||||||||||||||||
| Equity securities | N/A | 12,980 | — | — | 12,980 | |||||||||||||||||||||||||||
| Nonhedge derivatives(4) | 340,200 | 0 | 693 | 0 | 693 | |||||||||||||||||||||||||||
| $ | 12,980 | $ | 693 | $ | 1,695,913 | $ | 1,709,586 | |||||||||||||||||||||||||
| Liabilities: | ||||||||||||||||||||||||||||||||
| Nonhedge derivatives(4) | $ | 69,571 | $ | 0 | $ | 0 | $ | 0 | $ | 0 | ||||||||||||||||||||||
| Financial Instruments Not Reported at Fair Value on Consolidated Statements of Financial Condition | Outstanding Face Amount | Fair Value | ||||||||||||||||||||||||||||||
| Level 1 | Level 2 | Level 3 | Total | |||||||||||||||||||||||||||||
| Assets: | ||||||||||||||||||||||||||||||||
| Mortgage loan receivable held for investment, net, at amortized cost: | ||||||||||||||||||||||||||||||||
| Mortgage loans held by consolidated subsidiaries | $ | 3,277,597 | $ | 0 | $ | 0 | $ | 3,273,219 | $ | 3,273,219 | ||||||||||||||||||||||
| Provision for loan losses | N/A | 0 | 0 | (20,500) | (20,500) | |||||||||||||||||||||||||||
| Mortgage loan receivables held for sale | 122,748 | 0 | 0 | 124,989 | 124,989 | |||||||||||||||||||||||||||
| CMBS(5) | 12,121 | 0 | 0 | 11,608 | 11,608 | |||||||||||||||||||||||||||
| CMBS interest-only(5) | 11,099 | (2) | 0 | 0 | 804 | 804 | ||||||||||||||||||||||||||
| FHLB stock | 61,619 | 0 | 0 | 61,619 | 61,619 | |||||||||||||||||||||||||||
| $ | 0 | $ | 0 | $ | 3,451,739 | $ | 3,451,739 | |||||||||||||||||||||||||
| Liabilities: | ||||||||||||||||||||||||||||||||
| Repurchase agreements - short-term | 1,781,253 | $ | 0 | $ | 0 | $ | 1,781,253 | $ | 1,781,253 | |||||||||||||||||||||||
| Repurchase agreements - long-term | 34,681 | 0 | 0 | 34,681 | 34,681 | |||||||||||||||||||||||||||
| Mortgage loan financing | 807,854 | 0 | 0 | 838,766 | 838,766 | |||||||||||||||||||||||||||
| Borrowings from the FHLB | 1,073,500 | 0 | 0 | 1,080,354 | 1,080,354 | |||||||||||||||||||||||||||
| Senior unsecured notes | 1,166,201 | 0 | 0 | 1,208,860 | 1,208,860 | |||||||||||||||||||||||||||
| $ | 0 | $ | 0 | $ | 4,943,914 | $ | 4,943,914 | |||||||||||||||||||||||||
| Financial Instruments Reported at Fair Value on Consolidated Statements of Financial Condition | Outstanding Face Amount | Fair Value | ||||||||||||||||||
| Level 1 | Level 2 | Level 3 | Total | |||||||||||||||||
| Assets: | ||||||||||||||||||||
| CMBS(1) | $ | 1,246,609 | $ | — | $ | — | $ | 1,241,334 | $ | 1,241,334 | ||||||||||
| CMBS interest-only(1) | 2,362,747 | (2) | — | — | 54,789 | 54,789 | ||||||||||||||
| GNMA interest-only(3) | 135,932 | (2) | — | — | 2,648 | 2,648 | ||||||||||||||
| Agency securities(1) | 668 | — | — | 662 | 662 | |||||||||||||||
| GNMA permanent securities(1) | 32,633 | — | — | 33,064 | 33,064 | |||||||||||||||
| Corporate bonds(1) | 55,305 | — | — | 53,871 | 53,871 | |||||||||||||||
| Equity securities | N/A | 11,550 | — | — | 11,550 | |||||||||||||||
| $ | 11,550 | $ | — | $ | 1,386,368 | $ | 1,397,918 | |||||||||||||
| Liabilities: | ||||||||||||||||||||
| Nonhedge derivatives(4) | $ | 605,871 | $ | — | $ | 975 | $ | — | $ | 975 | ||||||||||
| Financial Instruments Not Reported at Fair Value on Consolidated Statements of Financial Condition | Outstanding Face Amount | Fair Value | ||||||||||||||||||
| Level 1 | Level 2 | Level 3 | Total | |||||||||||||||||
| Assets: | ||||||||||||||||||||
| Mortgage loan receivable held for investment, net, at amortized cost: | ||||||||||||||||||||
| Mortgage loans held by consolidated subsidiaries | $ | 3,340,381 | $ | — | $ | — | $ | 3,324,588 | $ | 3,324,588 | ||||||||||
| Provision for loan losses | N/A | — | — | (17,900 | ) | (17,900 | ) | |||||||||||||
| Mortgage loan receivables held for sale | 181,905 | — | — | 187,870 | 187,870 | |||||||||||||||
| CMBS(5) | 12,210 | — | — | 11,306 | 11,306 | |||||||||||||||
| CMBS interest-only(5) | 11,189 | (2) | — | — | 902 | 902 | ||||||||||||||
| FHLB stock | 57,915 | — | — | 57,915 | 57,915 | |||||||||||||||
| $ | — | $ | — | $ | 3,564,681 | $ | 3,564,681 | |||||||||||||
| Liabilities: | ||||||||||||||||||||
| Repurchase agreements - short-term | 436,957 | $ | — | $ | — | $ | 436,957 | $ | 436,957 | |||||||||||
| Repurchase agreements - long-term | 226,728 | — | — | 226,728 | 226,728 | |||||||||||||||
| Mortgage loan financing | 738,825 | — | — | 735,662 | 735,662 | |||||||||||||||
| CLO debt | 601,543 | — | — | 601,543 | 601,543 | |||||||||||||||
| Participation Financing - Mortgage Loan Receivable | 2,453 | — | — | 2,453 | 2,453 | |||||||||||||||
| Borrowings from the FHLB | 1,286,000 | — | — | 1,286,664 | 1,286,664 | |||||||||||||||
| Senior unsecured notes | 1,166,201 | — | — | 1,111,288 | 1,111,288 | |||||||||||||||
| $ | — | $ | — | $ | 4,401,295 | $ | 4,401,295 | |||||||||||||
| Nine Months Ended September 30, | ||||||||
| Level 3 | 2019 | 2018 | ||||||
| Balance at January 1, | $ | 1,385,957 | $ | 1,106,517 | ||||
| Transfer from level 2 | — | — | ||||||
| Purchases | 1,193,671 | 303,007 | ||||||
| Sales | (533,811 | ) | (306,109 | ) | ||||
| Paydowns/maturities | (178,402 | ) | (93,185 | ) | ||||
| Amortization of premium/discount | (9,333 | ) | (17,842 | ) | ||||
| Unrealized gain/(loss) | 16,813 | (9,203 | ) | |||||
| Realized gain/(loss) on sale(1) | 10,639 | (4,896 | ) | |||||
| Balance at September 30, | $ | 1,885,534 | $ | 978,289 | ||||
| Nine Months Ended September 30, | ||||||||||||||||||||
| Level 3 | 2020 | 2019 | ||||||||||||||||||
| Balance at January 1, | $ | 1,695,913 | $ | 1,385,957 | ||||||||||||||||
| Transfer from level 2 | 0 | 0 | ||||||||||||||||||
| Purchases | 438,707 | 1,193,671 | ||||||||||||||||||
| Sales | (551,676) | (533,811) | ||||||||||||||||||
| Paydowns/maturities | (94,659) | (178,402) | ||||||||||||||||||
| Amortization of premium/discount | (6,406) | (9,333) | ||||||||||||||||||
| Unrealized gain/(loss) | (32,959) | 16,813 | ||||||||||||||||||
| Realized gain/(loss) on sale(1) | (13,075) | 10,639 | ||||||||||||||||||
| Balance at September 30, | $ | 1,435,845 | $ | 1,885,534 | ||||||||||||||||
| Financial Instrument | Carrying Value | Valuation Technique | Unobservable Input | Minimum | Weighted Average | Maximum | |||||||||||
| CMBS(1) | $ | 1,788,712 | Discounted cash flow | Yield (4) | 1.68 | % | 3.1 | % | 20.55 | % | |||||||
| Duration (years)(5) | 0.00 | 1.54 | 7.10 | ||||||||||||||
| CMBS interest-only(1) | 41,440 | (2) | Discounted cash flow | Yield (4) | 1.79 | % | 3.73 | % | 6.35 | % | |||||||
| Duration (years)(5) | 0.08 | 2.61 | 3.85 | ||||||||||||||
| Prepayment speed (CPY)(5) | 100.00 | 100.00 | 100.00 | ||||||||||||||
| GNMA interest-only(3) | 2,026 | (2) | Discounted cash flow | Yield (4) | (7.19 | )% | 14.44 | % | 44.47 | % | |||||||
| Duration (years)(5) | 0.00 | 2.78 | 8.61 | ||||||||||||||
| Prepayment speed (CPJ)(5) | 5.00 | 11.57 | 15.00 | ||||||||||||||
| Agency securities(1) | 654 | Discounted cash flow | Yield (4) | — | % | 1.43 | % | 1.85 | % | ||||||||
| Duration (years)(5) | 0.00 | 2.46 | 3.17 | ||||||||||||||
| GNMA permanent securities(1) | 32,795 | Discounted cash flow | Yield (4) | 3.43 | % | 18.72 | % | 84.30 | % | ||||||||
| Duration (years)(5) | 1.15 | 7.76 | 13.99 | ||||||||||||||
| Corporate bonds(1) | 32,372 | Discounted cash flow | Yield (4) | 2.79 | % | 2.79 | % | 2.79 | % | ||||||||
| Duration (years)(5) | 1.05 | 1.05 | 1.05 | ||||||||||||||
| Total | $ | 1,897,999 | |||||||||||||||
| Financial Instrument | Carrying Value | Valuation Technique | Unobservable Input | Minimum | Weighted Average | Maximum | ||||||||||||||||||||||||||||||||
| CMBS(1) | $ | 1,379,469 | Discounted cash flow | Yield (4) | 0.59 | % | 2.46 | % | 31.64 | % | ||||||||||||||||||||||||||||
| Duration (years)(5) | 0.00 | 2.56 | 6.05 | |||||||||||||||||||||||||||||||||||
| CMBS interest-only(1) | 23,035 | (2) | Discounted cash flow | Yield (4) | 0.87 | % | 2.57 | % | 9.94 | % | ||||||||||||||||||||||||||||
| Duration (years)(5) | 0.33 | 2.29 | 3.21 | |||||||||||||||||||||||||||||||||||
| Prepayment speed (CPY)(5) | 100.00 | 99.60 | 100.00 | |||||||||||||||||||||||||||||||||||
| GNMA interest-only(3) | 1,228 | (2) | Discounted cash flow | Yield (4) | 0 | % | 3.61 | % | 9.05 | % | ||||||||||||||||||||||||||||
| Duration (years)(5) | 0.45 | 2.51 | 6.37 | |||||||||||||||||||||||||||||||||||
| Prepayment speed (CPJ)(5) | 5.00 | 14.41 | 35.00 | |||||||||||||||||||||||||||||||||||
| Agency securities(1) | 619 | Discounted cash flow | Yield (4) | 0.78 | % | 0.89 | % | 1.48 | % | |||||||||||||||||||||||||||||
| Duration (years)(5) | 0.00 | 1.87 | 2.24 | |||||||||||||||||||||||||||||||||||
| GNMA permanent securities(1) | 31,494 | Discounted cash flow | Yield (4) | 2.47 | % | 3.56 | % | 6.39 | % | |||||||||||||||||||||||||||||
| Duration (years)(5) | 1.15 | 9.81 | 14.66 | |||||||||||||||||||||||||||||||||||
| Total | $ | 1,435,845 | ||||||||||||||||||||||||||||||||||||
| Financial Instrument | Carrying Value | Valuation Technique | Unobservable Input | Minimum | Weighted Average | Maximum | ||||||||||||||||||||||||||||||||
| CMBS(1) | $ | 1,632,714 | Discounted cash flow | Yield (3) | 0 | % | 3.11 | % | 19.92 | % | ||||||||||||||||||||||||||||
| Duration (years)(4) | 0.00 | 1.63 | 6.87 | |||||||||||||||||||||||||||||||||||
| CMBS interest-only(1) | 28,342 | (2) | Discounted cash flow | Yield (3) | 1.57 | % | 3.93 | % | 7.62 | % | ||||||||||||||||||||||||||||
| Duration (years)(4) | 0.26 | 2.47 | 3.51 | |||||||||||||||||||||||||||||||||||
| Prepayment speed (CPY)(4) | 100.00 | 97.24 | 100.00 | |||||||||||||||||||||||||||||||||||
| GNMA interest-only(3) | 1,851 | (2) | Discounted cash flow | Yield (4) | (4.82) | % | 15.13 | % | 44.5 | % | ||||||||||||||||||||||||||||
| Duration (years)(5) | 0.85 | 2.90 | 13.69 | |||||||||||||||||||||||||||||||||||
| Prepayment speed (CPJ)(5) | 5.00 | 12.36 | 35.00 | |||||||||||||||||||||||||||||||||||
| Agency securities(1) | 637 | Discounted cash flow | Yield (4) | 0 | % | 1.7 | % | 2.16 | % | |||||||||||||||||||||||||||||
| Duration (years)(5) | 0.00 | 2.30 | 2.92 | |||||||||||||||||||||||||||||||||||
| GNMA permanent securities(1) | 32,369 | Discounted cash flow | Yield (4) | 56.56 | % | 166.79 | % | 410 | % | |||||||||||||||||||||||||||||
| Duration (years)(5) | 2.60 | 3.61 | 6.49 | |||||||||||||||||||||||||||||||||||
| Total | $ | 1,695,913 | ||||||||||||||||||||||||||||||||||||
| Financial Instrument | Carrying Value | Valuation Technique | Unobservable Input | Minimum | Weighted Average | Maximum | |||||||||||
| CMBS(1) | $ | 1,252,640 | Discounted cash flow | Yield (3) | — | % | 3.54 | % | 21.67 | % | |||||||
| Duration (years)(4) | 0.00 | 2.50 | 7.78 | ||||||||||||||
| CMBS interest-only(1) | 55,691 | (2) | Discounted cash flow | Yield (3) | 0.87 | % | 4.71 | % | 8.11 | % | |||||||
| Duration (years)(4) | 0.14 | 2.96 | 6.86 | ||||||||||||||
| Prepayment speed (CPY)(4) | 100.00 | 100.00 | 100.00 | ||||||||||||||
| GNMA interest-only(3) | 2,648 | (2) | Discounted cash flow | Yield (4) | 1.21 | % | 5.54 | % | 10.21 | % | |||||||
| Duration (years)(5) | 0.04 | 3.13 | 4.77 | ||||||||||||||
| Prepayment speed (CPJ)(5) | 5.00 | 6.58 | 15.00 | ||||||||||||||
| Agency securities(1) | 662 | Discounted cash flow | Yield (4) | — | % | 2.1 | % | 2.84 | % | ||||||||
| Duration (years)(5) | 0.00 | 2.83 | 3.82 | ||||||||||||||
| GNMA permanent securities(1) | 33,064 | Discounted cash flow | Yield (4) | — | % | 3.51 | % | 4 | % | ||||||||
| Duration (years)(5) | 0.00 | 5.62 | 5.88 | ||||||||||||||
| Corporate bonds(1) | 53,871 | Discounted cash flow | Yield (4) | 5.3 | % | 5.35 | % | 5.46 | % | ||||||||
| Duration (years)(5) | 1.94 | 2.19 | 2.70 | ||||||||||||||
| Total | $ | 1,398,576 | |||||||||||||||
| Three Months Ended September 30, | Nine Months Ended September 30, | ||||||||||||||
| 2019 | 2018 | 2019 | 2018 | ||||||||||||
| Impairment of real estate | |||||||||||||||
| Real estate, net(1)(2) | $ | — | $ | — | $ | 1,350 | $ | — | |||||||
| Loans | Securities | Real Estate(1) | Corporate/Other(2) | Company Total | |||||||||||||||||||||||||
| Three months ended September 30, 2020 | |||||||||||||||||||||||||||||
| Interest income | $ | 48,349 | $ | 6,189 | $ | 1 | $ | 82 | $ | 54,621 | |||||||||||||||||||
| Interest expense | (16,319) | (4,535) | (10,221) | (25,323) | (56,398) | ||||||||||||||||||||||||
| Net interest income (expense) | 32,030 | 1,654 | (10,220) | (25,241) | (1,777) | ||||||||||||||||||||||||
| (Provision) benefit for loan losses | 2,512 | 0 | 0 | 0 | 2,512 | ||||||||||||||||||||||||
| Net interest income (expense) after provision for loan losses | 34,542 | 1,654 | (10,220) | (25,241) | 735 | ||||||||||||||||||||||||
| Operating lease income | 0 | 0 | 25,464 | 0 | 25,464 | ||||||||||||||||||||||||
| Sale of loans, net | 1,127 | 0 | 0 | 0 | 1,127 | ||||||||||||||||||||||||
| Realized gain (loss) on securities | 0 | (303) | 0 | 0 | (303) | ||||||||||||||||||||||||
| Unrealized gain (loss) on Agency interest-only securities | 0 | 9 | 0 | 0 | 9 | ||||||||||||||||||||||||
| Realized gain on sale of real estate, net | 0 | 0 | 21,588 | 0 | 21,588 | ||||||||||||||||||||||||
| Fee and other income | 2,515 | 0 | 0 | 536 | 3,051 | ||||||||||||||||||||||||
| Net result from derivative transactions | 165 | 95 | 0 | 0 | 260 | ||||||||||||||||||||||||
| Earnings (loss) from investment in unconsolidated joint ventures | 0 | 0 | 447 | 0 | 447 | ||||||||||||||||||||||||
| Gain (loss) on extinguishment of debt | 0 | 0 | 0 | 1,167 | 1,167 | ||||||||||||||||||||||||
| Total other income (loss) | 3,807 | (199) | 47,499 | 1,703 | 52,810 | ||||||||||||||||||||||||
| Salaries and employee benefits | 0 | 0 | 0 | (7,858) | (7,858) | ||||||||||||||||||||||||
| Operating expenses(3) | 0 | 0 | 0 | (3,938) | (3,938) | ||||||||||||||||||||||||
| Real estate operating expenses | 0 | 0 | (8,060) | 0 | (8,060) | ||||||||||||||||||||||||
| Fee expense | (2,465) | (50) | 39 | 0 | (2,476) | ||||||||||||||||||||||||
| Depreciation and amortization | 0 | 0 | (9,792) | (25) | (9,817) | ||||||||||||||||||||||||
| Total costs and expenses | (2,465) | (50) | (17,813) | (11,821) | (32,149) | ||||||||||||||||||||||||
| Income tax (expense) benefit | 0 | 0 | 0 | (14) | (14) | ||||||||||||||||||||||||
| Segment profit (loss) | $ | 35,884 | $ | 1,405 | $ | 19,466 | $ | (35,373) | $ | 21,382 | |||||||||||||||||||
| Total assets as of September 30, 2020 | $ | 2,714,723 | $ | 1,447,625 | $ | 1,039,738 | $ | 1,157,377 | $ | 6,359,463 | |||||||||||||||||||
| Loans | Securities | Real Estate(1) | Corporate/Other(2) | Company Total | Loans | Securities | Real Estate(1) | Corporate/Other(2) | Company Total | |||||||||||||||||||||||||||||||||||||||
| Three months ended September 30, 2019 | Three months ended September 30, 2019 | |||||||||||||||||||||||||||||||||||||||||||||||
| Interest income | $ | 66,422 | $ | 15,515 | $ | 7 | $ | 307 | $ | 82,251 | Interest income | $ | 66,422 | $ | 15,515 | $ | 7 | $ | 307 | $ | 82,251 | |||||||||||||||||||||||||||
| Interest expense | (12,063 | ) | (5,632 | ) | (9,646 | ) | (24,056 | ) | (51,397 | ) | Interest expense | (12,063) | (5,632) | (9,646) | (24,056) | (51,397) | ||||||||||||||||||||||||||||||||
| Net interest income (expense) | 54,359 | 9,883 | (9,639 | ) | (23,749 | ) | 30,854 | Net interest income (expense) | 54,359 | 9,883 | (9,639) | (23,749) | 30,854 | |||||||||||||||||||||||||||||||||||
| Provision for loan losses | — | — | — | — | — | |||||||||||||||||||||||||||||||||||||||||||
| (Provision) benefit for loan losses | (Provision) benefit for loan losses | 0 | 0 | 0 | 0 | 0 | ||||||||||||||||||||||||||||||||||||||||||
| Net interest income (expense) after provision for loan losses | 54,359 | 9,883 | (9,639 | ) | (23,749 | ) | 30,854 | Net interest income (expense) after provision for loan losses | 54,359 | 9,883 | (9,639) | (23,749) | 30,854 | |||||||||||||||||||||||||||||||||||
| Operating lease income | — | — | 24,405 | — | 24,405 | Operating lease income | 0 | 0 | 24,405 | 0 | 24,405 | |||||||||||||||||||||||||||||||||||||
| Sale of loans, net | 11,247 | — | — | — | 11,247 | Sale of loans, net | 11,247 | 0 | 0 | 0 | 11,247 | |||||||||||||||||||||||||||||||||||||
| Realized gain (loss) on securities | — | 3,396 | — | — | 3,396 | Realized gain (loss) on securities | 0 | 3,396 | 0 | 0 | 3,396 | |||||||||||||||||||||||||||||||||||||
| Unrealized gain (loss) on equity securities | — | 254 | — | — | 254 | Unrealized gain (loss) on equity securities | 0 | 254 | 0 | 0 | 254 | |||||||||||||||||||||||||||||||||||||
| Unrealized gain (loss) on Agency interest-only securities | — | 16 | — | — | 16 | Unrealized gain (loss) on Agency interest-only securities | 0 | 16 | 0 | 0 | 16 | |||||||||||||||||||||||||||||||||||||
| Realized gain on sale of real estate, net | — | — | 2,082 | — | 2,082 | Realized gain on sale of real estate, net | 0 | 0 | 2,082 | 0 | 2,082 | |||||||||||||||||||||||||||||||||||||
| Fee and other income | 3,839 | 428 | — | 899 | 5,166 | Fee and other income | 3,839 | 428 | 0 | 899 | 5,166 | |||||||||||||||||||||||||||||||||||||
| Net result from derivative transactions | (6,557 | ) | (2,908 | ) | — | — | (9,465 | ) | Net result from derivative transactions | (6,557) | (2,908) | 0 | 0 | (9,465) | ||||||||||||||||||||||||||||||||||
| Earnings (loss) from investment in unconsolidated joint ventures | — | — | 1,094 | — | 1,094 | Earnings (loss) from investment in unconsolidated joint ventures | 0 | 0 | 1,094 | 0 | 1,094 | |||||||||||||||||||||||||||||||||||||
| Total other income (loss) | 8,529 | 1,186 | 27,581 | 899 | 38,195 | Total other income (loss) | 8,529 | 1,186 | 27,581 | 899 | 38,195 | |||||||||||||||||||||||||||||||||||||
| Salaries and employee benefits | — | — | — | (14,319 | ) | (14,319 | ) | Salaries and employee benefits | 0 | 0 | 0 | (14,319) | (14,319) | |||||||||||||||||||||||||||||||||||
| Operating expenses | — | — | — | (5,314 | ) | (3) | (5,314 | ) | ||||||||||||||||||||||||||||||||||||||||
| Operating expenses(3) | Operating expenses(3) | 0 | 0 | 0 | (5,314) | (5,314) | ||||||||||||||||||||||||||||||||||||||||||
| Real estate operating expenses | — | — | (6,270 | ) | — | (6,270 | ) | Real estate operating expenses | 0 | 0 | (6,270) | 0 | (6,270) | |||||||||||||||||||||||||||||||||||
| Fee expense | (1,264 | ) | (92 | ) | (700 | ) | — | (2,056 | ) | Fee expense | (1,264) | (92) | (700) | 0 | (2,056) | |||||||||||||||||||||||||||||||||
| Depreciation and amortization | — | — | (9,005 | ) | (25 | ) | (9,030 | ) | Depreciation and amortization | 0 | 0 | (9,005) | (25) | (9,030) | ||||||||||||||||||||||||||||||||||
| Total costs and expenses | (1,264 | ) | (92 | ) | (15,975 | ) | (19,658 | ) | (36,989 | ) | Total costs and expenses | (1,264) | (92) | (15,975) | (19,658) | (36,989) | ||||||||||||||||||||||||||||||||
| Income tax (expense) benefit | — | — | — | (1,112 | ) | (1,112 | ) | Income tax (expense) benefit | 0 | 0 | 0 | (1,112) | (1,112) | |||||||||||||||||||||||||||||||||||
| Segment profit (loss) | $ | 61,624 | $ | 10,977 | $ | 1,967 | $ | (43,620 | ) | $ | 30,948 | Segment profit (loss) | $ | 61,624 | $ | 10,977 | $ | 1,967 | $ | (43,620) | $ | 30,948 | ||||||||||||||||||||||||||
| Total assets as of September 30, 2019 | $ | 3,387,157 | $ | 1,911,456 | $ | 1,032,752 | $ | 288,509 | $ | 6,619,874 | ||||||||||||||||||||||||||||||||||||||
| Total assets as of December 31, 2019 | Total assets as of December 31, 2019 | $ | 3,358,861 | $ | 1,721,305 | $ | 1,096,514 | $ | 492,472 | $ | 6,669,152 | |||||||||||||||||||||||||||||||||||||
| Loans | Securities | Real Estate(1) | Corporate/Other(2) | Company Total | ||||||||||||||||||||||||||||||||||||||||||||
| Loans | Securities | Real Estate(1) | Corporate/Other(2) | Company Total | ||||||||||||||||||||||||||||||||||||||||||||
| Three months ended September 30, 2018 | ||||||||||||||||||||||||||||||||||||||||||||||||
| Nine months ended September 30, 2020 | Nine months ended September 30, 2020 | |||||||||||||||||||||||||||||||||||||||||||||||
| Interest income | $ | 81,779 | $ | 8,541 | $ | 6 | $ | 60 | $ | 90,386 | Interest income | $ | 160,896 | $ | 27,228 | $ | 11 | $ | 1,171 | $ | 189,306 | |||||||||||||||||||||||||||
| Interest expense | (17,232 | ) | (1,482 | ) | (9,213 | ) | (23,549 | ) | (51,476 | ) | Interest expense | (32,921) | (19,090) | (30,213) | (94,001) | (176,225) | ||||||||||||||||||||||||||||||||
| Net interest income (expense) | 64,547 | 7,059 | (9,207 | ) | (23,489 | ) | 38,910 | Net interest income (expense) | 127,975 | 8,138 | (30,202) | (92,830) | 13,081 | |||||||||||||||||||||||||||||||||||
| Provision for loan losses | (10,300 | ) | — | — | — | (10,300 | ) | |||||||||||||||||||||||||||||||||||||||||
| (Provision) benefit for loan losses | (Provision) benefit for loan losses | (23,343) | 3 | 0 | 0 | (23,340) | ||||||||||||||||||||||||||||||||||||||||||
| Net interest income (expense) after provision for loan losses | 54,247 | 7,059 | (9,207 | ) | (23,489 | ) | 28,610 | Net interest income (expense) after provision for loan losses | 104,632 | 8,141 | (30,202) | (92,830) | (10,259) | |||||||||||||||||||||||||||||||||||
| Operating lease income | — | — | 24,997 | — | 24,997 | Operating lease income | 0 | 0 | 75,565 | 0 | 75,565 | |||||||||||||||||||||||||||||||||||||
| Sale of loans, net | 1,861 | — | — | — | 1,861 | Sale of loans, net | 1,387 | 0 | 0 | 0 | 1,387 | |||||||||||||||||||||||||||||||||||||
| Realized gain (loss) on securities | — | (2,554 | ) | — | — | (2,554 | ) | Realized gain (loss) on securities | 0 | (12,089) | 0 | 0 | (12,089) | |||||||||||||||||||||||||||||||||||
| Unrealized gain (loss) on equity securities | Unrealized gain (loss) on equity securities | 0 | (132) | 0 | 0 | (132) | ||||||||||||||||||||||||||||||||||||||||||
| Unrealized gain (loss) on Agency interest-only securities | — | 142 | — | — | 142 | Unrealized gain (loss) on Agency interest-only securities | 0 | 183 | 0 | 0 | 183 | |||||||||||||||||||||||||||||||||||||
| Realized gain on sale of real estate, net | — | — | 63,704 | — | 63,704 | Realized gain on sale of real estate, net | 0 | 0 | 32,116 | 0 | 32,116 | |||||||||||||||||||||||||||||||||||||
| Fee and other income | 3,895 | — | — | 956 | 4,851 | Fee and other income | 6,368 | 403 | 25 | 1,279 | 8,075 | |||||||||||||||||||||||||||||||||||||
| Net result from derivative transactions | 3,741 | 3,374 | — | — | 7,115 | Net result from derivative transactions | (11,774) | (4,214) | 0 | 0 | (15,988) | |||||||||||||||||||||||||||||||||||||
| Earnings (loss) from investment in unconsolidated joint ventures | — | — | 401 | — | 401 | Earnings (loss) from investment in unconsolidated joint ventures | 0 | 0 | 1,359 | 0 | 1,359 | |||||||||||||||||||||||||||||||||||||
| Gain (loss) on extinguishment/defeasance of debt | — | — | (4,323 | ) | — | (4,323 | ) | |||||||||||||||||||||||||||||||||||||||||
| Gain (loss) on extinguishment of debt | Gain (loss) on extinguishment of debt | 0 | 0 | 0 | 22,244 | 22,244 | ||||||||||||||||||||||||||||||||||||||||||
| Total other income (loss) | 9,497 | 962 | 84,779 | 956 | 96,194 | Total other income (loss) | (4,019) | (15,849) | 109,065 | 23,523 | 112,720 | |||||||||||||||||||||||||||||||||||||
| Salaries and employee benefits | — | — | — | (15,792 | ) | (15,792 | ) | Salaries and employee benefits | 0 | 0 | 0 | (31,880) | (31,880) | |||||||||||||||||||||||||||||||||||
| Operating expenses | 61 | — | — | (5,525 | ) | (3) | (5,464 | ) | ||||||||||||||||||||||||||||||||||||||||
| Operating expenses(3) | Operating expenses(3) | 0 | 0 | 0 | (15,957) | (15,957) | ||||||||||||||||||||||||||||||||||||||||||
| Real estate operating expenses | — | — | (7,152 | ) | — | (7,152 | ) | Real estate operating expenses | 0 | 0 | (22,041) | (22,041) | ||||||||||||||||||||||||||||||||||||
| Fee expense | (928 | ) | (91 | ) | (292 | ) | — | (1,311 | ) | Fee expense | (5,129) | (183) | (580) | 0 | (5,892) | |||||||||||||||||||||||||||||||||
| Depreciation and amortization | — | — | (10,398 | ) | (19 | ) | (10,417 | ) | Depreciation and amortization | 0 | 0 | (29,568) | (74) | (29,642) | ||||||||||||||||||||||||||||||||||
| Total costs and expenses | (867 | ) | (91 | ) | (17,842 | ) | (21,336 | ) | (40,136 | ) | Total costs and expenses | (5,129) | (183) | (52,189) | (47,911) | (105,412) | ||||||||||||||||||||||||||||||||
| Income tax (expense) benefit | — | — | — | (1,204 | ) | (1,204 | ) | Income tax (expense) benefit | 0 | 0 | 0 | 5,078 | 5,078 | |||||||||||||||||||||||||||||||||||
| Segment profit (loss) | $ | 62,877 | $ | 7,930 | $ | 57,730 | $ | (45,073 | ) | $ | 83,464 | Segment profit (loss) | $ | 95,484 | $ | (7,891) | $ | 26,674 | $ | (112,140) | $ | 2,127 | ||||||||||||||||||||||||||
| Total assets as of December 31, 2018 | $ | 3,482,929 | $ | 1,410,126 | $ | 1,038,376 | $ | 341,441 | $ | 6,272,872 | ||||||||||||||||||||||||||||||||||||||
| Total assets as of September 30, 2020 | Total assets as of September 30, 2020 | $ | 2,714,723 | $ | 1,447,625 | $ | 1,039,738 | $ | 1,157,377 | $ | 6,359,463 | |||||||||||||||||||||||||||||||||||||
| Loans | Securities | Real Estate(1) | Corporate/Other(2) | Company Total | |||||||||||||||
| Nine months ended September 30, 2019 | |||||||||||||||||||
| Interest income | $ | 209,369 | $ | 43,844 | $ | 21 | $ | 806 | $ | 254,040 | |||||||||
| Interest expense | (41,043 | ) | (12,250 | ) | (27,620 | ) | (74,102 | ) | (155,015 | ) | |||||||||
| Net interest income (expense) | 168,326 | 31,594 | (27,599 | ) | (73,296 | ) | 99,025 | ||||||||||||
| Provision for loan losses | (600 | ) | — | — | — | (600 | ) | ||||||||||||
| Net interest income (expense) after provision for loan losses | 167,726 | 31,594 | (27,599 | ) | (73,296 | ) | 98,425 | ||||||||||||
| Operating lease income | — | — | 81,106 | — | 81,106 | ||||||||||||||
| Sale of loans, net | 38,589 | — | — | — | 38,589 | ||||||||||||||
| Realized gain (loss) on securities | — | 10,726 | — | — | 10,726 | ||||||||||||||
| Unrealized gain (loss) on equity securities | — | 1,341 | — | — | 1,341 | ||||||||||||||
| Unrealized gain (loss) on Agency interest-only securities | — | 38 | — | — | 38 | ||||||||||||||
| Realized gain on sale of real estate, net | — | — | 963 | — | 963 | ||||||||||||||
| Impairment of real estate | — | — | (1,350 | ) | — | (1,350 | ) | ||||||||||||
| Fee and other income | 13,095 | 1,165 | 7 | 2,780 | 17,047 | ||||||||||||||
| Net result from derivative transactions | (20,273 | ) | (15,683 | ) | — | — | (35,956 | ) | |||||||||||
| Earnings (loss) from investment in unconsolidated joint ventures | — | — | 3,617 | — | 3,617 | ||||||||||||||
| Gain (loss) on extinguishment of debt | — | — | (1,070 | ) | — | (1,070 | ) | ||||||||||||
| Total other income (loss) | 31,411 | (2,413 | ) | 83,273 | 2,780 | 115,051 | |||||||||||||
| Salaries and employee benefits | — | — | — | (52,800 | ) | (52,800 | ) | ||||||||||||
| Operating expenses | — | — | — | (16,727 | ) | (3) | (16,727 | ) | |||||||||||
| Real estate operating expenses | — | — | (17,776 | ) | (17,776 | ) | |||||||||||||
| Fee expense | (3,516 | ) | (280 | ) | (1,155 | ) | — | (4,951 | ) | ||||||||||
| Depreciation and amortization | — | — | (29,118 | ) | (74 | ) | (29,192 | ) | |||||||||||
| Total costs and expenses | (3,516 | ) | (280 | ) | (48,049 | ) | (69,601 | ) | (121,446 | ) | |||||||||
| Income tax (expense) benefit | — | — | — | (478 | ) | (478 | ) | ||||||||||||
| Segment profit (loss) | $ | 195,621 | $ | 28,901 | $ | 7,625 | $ | (140,595 | ) | $ | 91,552 | ||||||||
| Total assets as of September 30, 2019 | $ | 3,387,157 | $ | 1,911,456 | $ | 1,032,752 | $ | 288,509 | $ | 6,619,874 | |||||||||
| Loans | Securities | Real Estate(1) | Corporate/Other(2) | Company Total | |||||||||||||||
| Nine months ended September 30, 2018 | |||||||||||||||||||
| Interest income | $ | 228,273 | $ | 25,217 | $ | 16 | $ | 316 | $ | 253,822 | |||||||||
| Interest expense | (46,286 | ) | (3,423 | ) | (25,799 | ) | (69,098 | ) | (144,606 | ) | |||||||||
| Net interest income (expense) | 181,987 | 21,794 | (25,783 | ) | (68,782 | ) | 109,216 | ||||||||||||
| Provision for loan losses | (13,600 | ) | — | — | — | (13,600 | ) | ||||||||||||
| Net interest income (expense) after provision for loan losses | 168,387 | 21,794 | (25,783 | ) | (68,782 | ) | 95,616 | ||||||||||||
| Operating lease income | — | — | 79,306 | — | 79,306 | ||||||||||||||
| Sale of loans, net | 12,893 | — | — | — | 12,893 | ||||||||||||||
| Realized gain (loss) on securities | — | (4,896 | ) | — | — | (4,896 | ) | ||||||||||||
| Unrealized gain (loss) on Agency interest-only securities | — | 456 | — | — | 456 | ||||||||||||||
| Realized gain on sale of real estate, net | — | — | 96,341 | — | 96,341 | ||||||||||||||
| Fee and other income | 10,823 | 72 | 3,416 | 3,268 | 17,579 | ||||||||||||||
| Net result from derivative transactions | 14,516 | 14,640 | — | — | 29,156 | ||||||||||||||
| Earnings (loss) from investment in unconsolidated joint ventures | — | — | 466 | — | 466 | ||||||||||||||
| Gain (loss) on extinguishment of debt | (69 | ) | — | (4,323 | ) | — | (4,392 | ) | |||||||||||
| Total other income (loss) | 38,163 | 10,272 | 175,206 | 3,268 | 226,909 | ||||||||||||||
| Salaries and employee benefits | — | — | — | (46,754 | ) | (46,754 | ) | ||||||||||||
| Operating expenses | 61 | — | — | (16,669 | ) | (3) | (16,608 | ) | |||||||||||
| Real estate operating expenses | — | — | (23,806 | ) | (23,806 | ) | |||||||||||||
| Fee expense | (2,160 | ) | (297 | ) | (496 | ) | — | (2,953 | ) | ||||||||||
| Depreciation and amortization | — | — | (31,840 | ) | (56 | ) | (31,896 | ) | |||||||||||
| Total costs and expenses | (2,099 | ) | (297 | ) | (56,142 | ) | (63,479 | ) | (122,017 | ) | |||||||||
| Income tax (expense) benefit | — | — | — | (5,679 | ) | (5,679 | ) | ||||||||||||
| Segment profit (loss) | $ | 204,451 | $ | 31,769 | $ | 93,281 | $ | (134,672 | ) | $ | 194,829 | ||||||||
| Total assets as of December 31, 2018 | $ | 3,482,929 | $ | 1,410,126 | $ | 1,038,376 | $ | 341,441 | $ | 6,272,872 | |||||||||
| Loans | Securities | Real Estate(1) | Corporate/Other(2) | Company Total | |||||||||||||||||||||||||
| Nine months ended September 30, 2019 | |||||||||||||||||||||||||||||
| Interest income | $ | 209,369 | $ | 43,844 | $ | 21 | $ | 806 | $ | 254,040 | |||||||||||||||||||
| Interest expense | (41,043) | (12,250) | (27,620) | (74,102) | (155,015) | ||||||||||||||||||||||||
| Net interest income (expense) | 168,326 | 31,594 | (27,599) | (73,296) | 99,025 | ||||||||||||||||||||||||
| (Provision) benefit for loan losses | (600) | 0 | 0 | 0 | (600) | ||||||||||||||||||||||||
| Net interest income (expense) after provision for loan losses | 167,726 | 31,594 | (27,599) | (73,296) | 98,425 | ||||||||||||||||||||||||
| Operating lease income | 0 | 0 | 81,106 | 0 | 81,106 | ||||||||||||||||||||||||
| Sale of loans, net | 38,589 | 0 | 0 | 0 | 38,589 | ||||||||||||||||||||||||
| Realized gain (loss) on securities | 0 | 10,726 | 0 | 0 | 10,726 | ||||||||||||||||||||||||
| Unrealized gain (loss) on equity securities | 0 | 1,341 | 0 | 0 | 1,341 | ||||||||||||||||||||||||
| Unrealized gain (loss) on Agency interest-only securities | 0 | 38 | 0 | 0 | 38 | ||||||||||||||||||||||||
| Realized gain on sale of real estate, net | 0 | 0 | 963 | 0 | 963 | ||||||||||||||||||||||||
| Impairment of real estate | 0 | 0 | (1,350) | 0 | (1,350) | ||||||||||||||||||||||||
| Fee and other income | 13,095 | 1,165 | 7 | 2,780 | 17,047 | ||||||||||||||||||||||||
| Net result from derivative transactions | (20,273) | (15,683) | 0 | 0 | (35,956) | ||||||||||||||||||||||||
| Earnings (loss) from investment in unconsolidated joint ventures | 0 | 0 | 3,617 | 0 | 3,617 | ||||||||||||||||||||||||
| Gain (loss) on extinguishment of debt | 0 | 0 | (1,070) | 0 | (1,070) | ||||||||||||||||||||||||
| Total other income (loss) | 31,411 | (2,413) | 83,273 | 2,780 | 115,051 | ||||||||||||||||||||||||
| Salaries and employee benefits | 0 | 0 | 0 | (52,800) | (52,800) | ||||||||||||||||||||||||
| Operating expenses(3) | 0 | 0 | 0 | (16,727) | (16,727) | ||||||||||||||||||||||||
| Real estate operating expenses | 0 | 0 | (17,776) | 0 | (17,776) | ||||||||||||||||||||||||
| Fee expense | (3,516) | (280) | (1,155) | 0 | (4,951) | ||||||||||||||||||||||||
| Depreciation and amortization | 0 | 0 | (29,118) | (74) | (29,192) | ||||||||||||||||||||||||
| Total costs and expenses | (3,516) | (280) | (48,049) | (69,601) | (121,446) | ||||||||||||||||||||||||
| Income tax (expense) benefit | 0 | 0 | 0 | (478) | (478) | ||||||||||||||||||||||||
| Segment profit (loss) | $ | 195,621 | $ | 28,901 | $ | 7,625 | $ | (140,595) | $ | 91,552 | |||||||||||||||||||
| Total assets as of December 31, 2019 | $ | 3,358,861 | $ | 1,721,305 | $ | 1,096,514 | $ | 492,472 | $ | 6,669,152 | |||||||||||||||||||
| September 30, 2020 | December 31, 2019 | ||||||||||||||||||||||
| Loans | |||||||||||||||||||||||
| Balance sheet loans: | |||||||||||||||||||||||
| Balance sheet first mortgage loans | $ | 2,608,933 | 41.0 | % | $ | 3,127,173 | 46.9 | % | |||||||||||||||
| Other commercial real estate-related loans | 122,321 | 1.9 | % | 129,863 | 1.9 | % | |||||||||||||||||
| Provision for current expected credit losses | (47,084) | (0.7) | % | (20,500) | (0.3) | % | |||||||||||||||||
| Total balance sheet loans | 2,684,170 | 42.2 | % | 3,236,536 | 48.5 | % | |||||||||||||||||
| Conduit first mortgage loans | 30,553 | 0.5 | % | 122,325 | 1.8 | % | |||||||||||||||||
| Total loans | 2,714,723 | 42.7 | % | 3,358,861 | 50.3 | % | |||||||||||||||||
| Securities | |||||||||||||||||||||||
| CMBS investments | 1,414,303 | 22.2 | % | 1,673,468 | 25.3 | % | |||||||||||||||||
| U.S. Agency Securities investments | 33,341 | 0.5 | % | 34,857 | 0.5 | % | |||||||||||||||||
| Equity securities | — | — | % | 12,980 | 0.2 | % | |||||||||||||||||
| Provision for current expected credit losses | (19) | — | % | — | — | % | |||||||||||||||||
| Total securities | 1,447,625 | 22.7 | % | 1,721,305 | 26.0 | % | |||||||||||||||||
| Real Estate | |||||||||||||||||||||||
| Real estate and related lease intangibles, net | 990,583 | 15.6 | % | 1,048,081 | 15.7 | % | |||||||||||||||||
| Total real estate | 990,583 | 15.6 | % | 1,048,081 | 15.7 | % | |||||||||||||||||
| Other Investments | |||||||||||||||||||||||
| Investments in and advances to unconsolidated joint ventures | 49,155 | 0.8 | % | 48,433 | 0.7 | % | |||||||||||||||||
| FHLB stock | 61,619 | 1.0 | % | 61,619 | 0.9 | % | |||||||||||||||||
| Total other investments | 110,774 | 1.8 | % | 110,052 | 1.6 | % | |||||||||||||||||
| Total investments | 5,263,705 | 82.8 | % | 6,238,299 | 93.6 | % | |||||||||||||||||
| Cash, cash equivalents and restricted cash | 917,736 | 14.4 | % | 355,746 | 5.3 | % | |||||||||||||||||
| Other assets | 178,022 | 2.8 | % | 75,107 | 1.1 | % | |||||||||||||||||
| Total assets | $ | 6,359,463 | 100.0 | % | $ | 6,669,152 | 100.0 | % | |||||||||||||||
| September 30, 2019 | December 31, 2018 | ||||||||||||
| Loans | |||||||||||||
| Balance sheet loans: | |||||||||||||
| Balance sheet first mortgage loans | $ | 3,098,241 | 46.8 | % | $ | 3,170,788 | 50.5 | % | |||||
| Other commercial real estate-related loans | 133,202 | 2.0 | % | 147,602 | 2.4 | % | |||||||
| Provision for loan losses | (18,500 | ) | (0.3 | )% | (17,900 | ) | (0.3 | )% | |||||
| Total balance sheet loans | 3,212,943 | 48.5 | % | 3,300,490 | 52.6 | % | |||||||
| Conduit first mortgage loans | 174,214 | 2.6 | % | 182,439 | 2.9 | % | |||||||
| Total loans | 3,387,157 | 51.1 | % | 3,482,929 | 55.5 | % | |||||||
| Securities | |||||||||||||
| CMBS investments | 1,830,152 | 27.8 | % | 1,308,331 | 20.8 | % | |||||||
| U.S. Agency Securities investments | 35,475 | 0.5 | % | 36,374 | 0.6 | % | |||||||
| Corporate bonds | 32,372 | 0.5 | % | 53,871 | 0.9 | % | |||||||
| Equity securities | 13,457 | 0.2 | % | 11,550 | 0.2 | % | |||||||
| Total securities | 1,911,456 | 29.0 | % | 1,410,126 | 22.5 | % | |||||||
| Real Estate | |||||||||||||
| Real estate and related lease intangibles, net | 981,333 | 14.8 | % | 998,022 | 15.9 | % | |||||||
| Total real estate | 981,333 | 14.8 | % | 998,022 | 15.9 | % | |||||||
| Other Investments | |||||||||||||
| Investments in and advances to unconsolidated joint ventures | 51,419 | 0.8 | % | 40,354 | 0.6 | % | |||||||
| FHLB stock | 61,619 | 0.9 | % | 57,915 | 0.9 | % | |||||||
| Total other investments | 113,038 | 1.7 | % | 98,269 | 1.5 | % | |||||||
| Total investments | 6,392,984 | 96.6 | % | 5,989,346 | 95.4 | % | |||||||
| Cash, cash equivalents and restricted cash | 121,753 | 1.8 | % | 98,450 | 1.6 | % | |||||||
| Other assets | 105,137 | 1.6 | % | 185,076 | 3.0 | % | |||||||
| Total assets | $ | 6,619,874 | 100.0 | % | $ | 6,272,872 | 100.0 | % | |||||
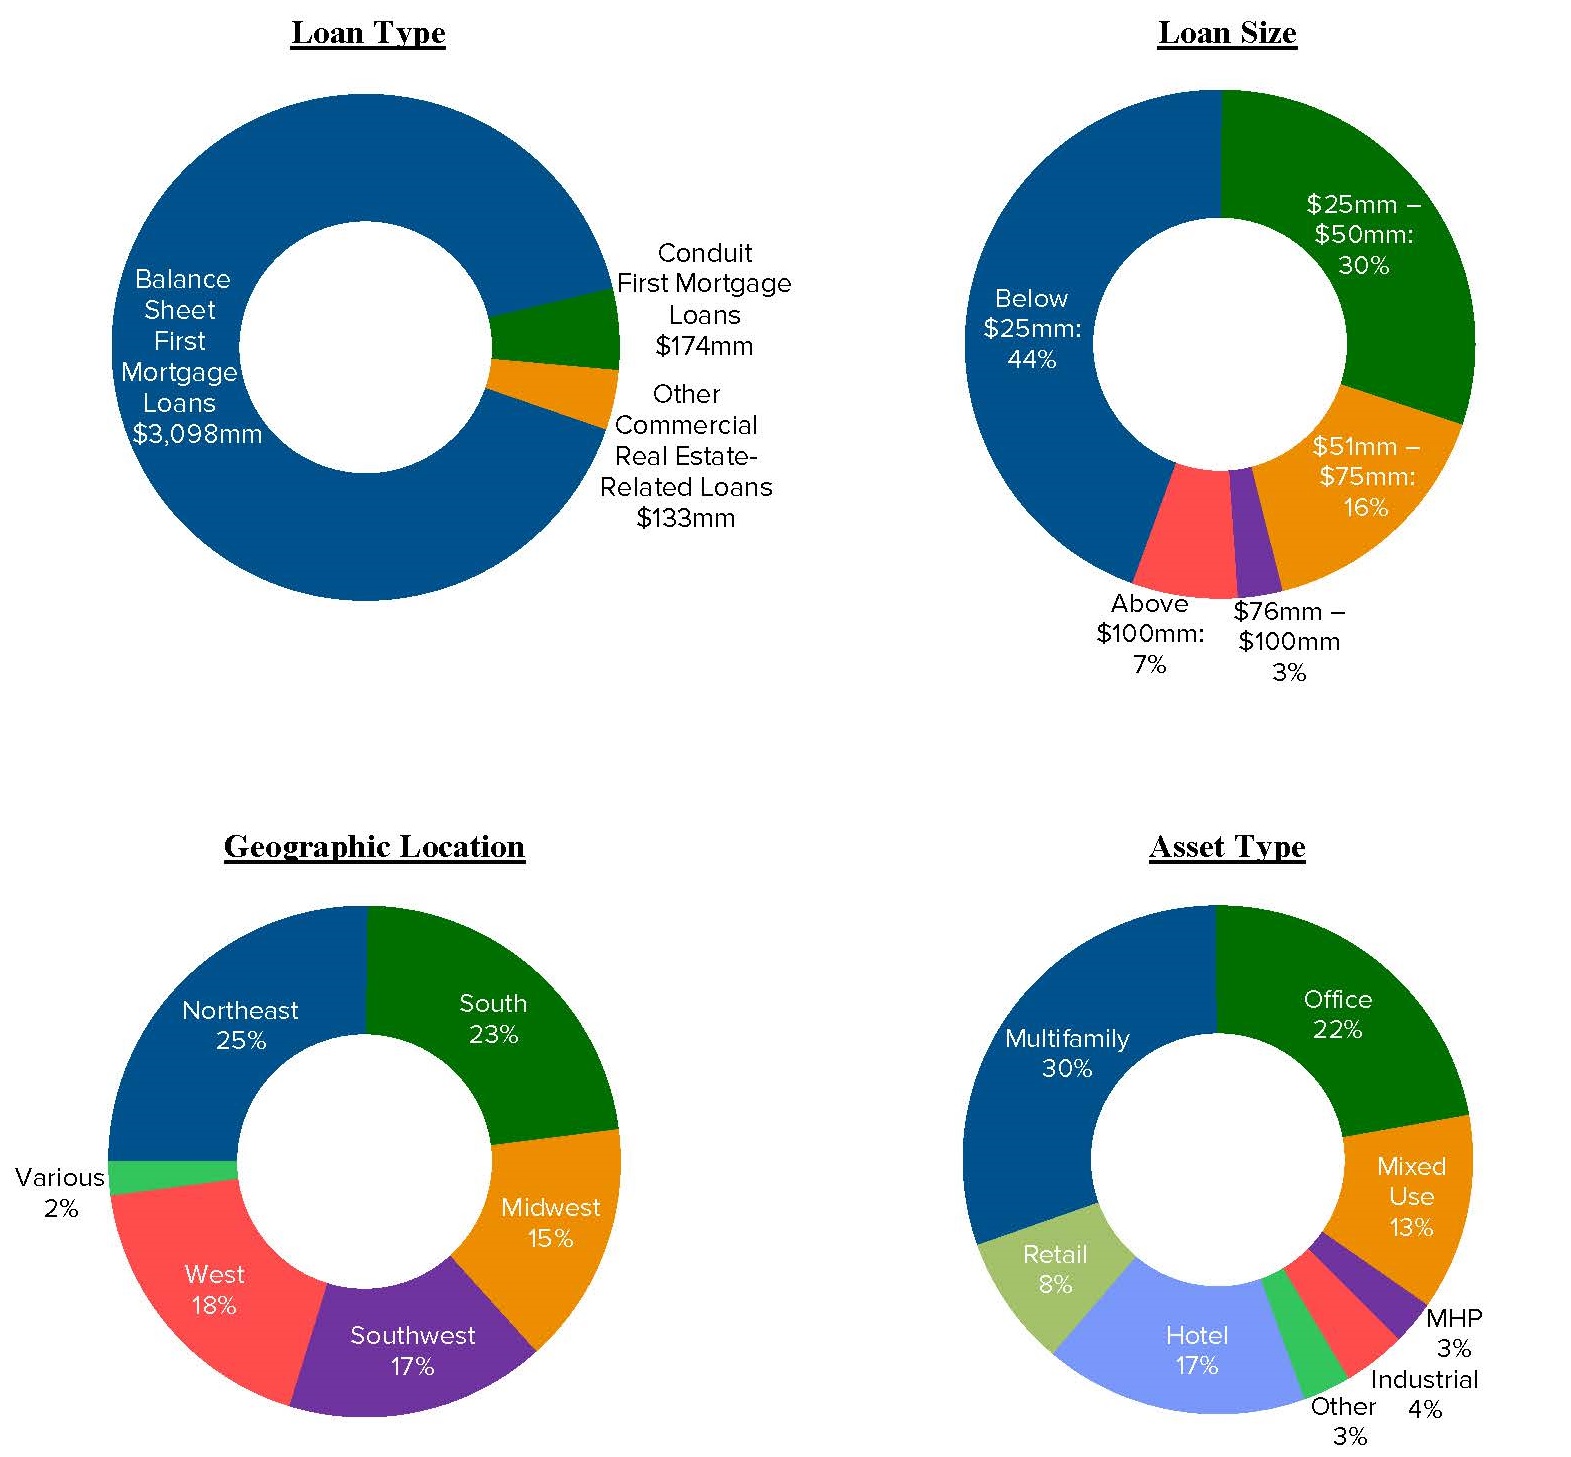
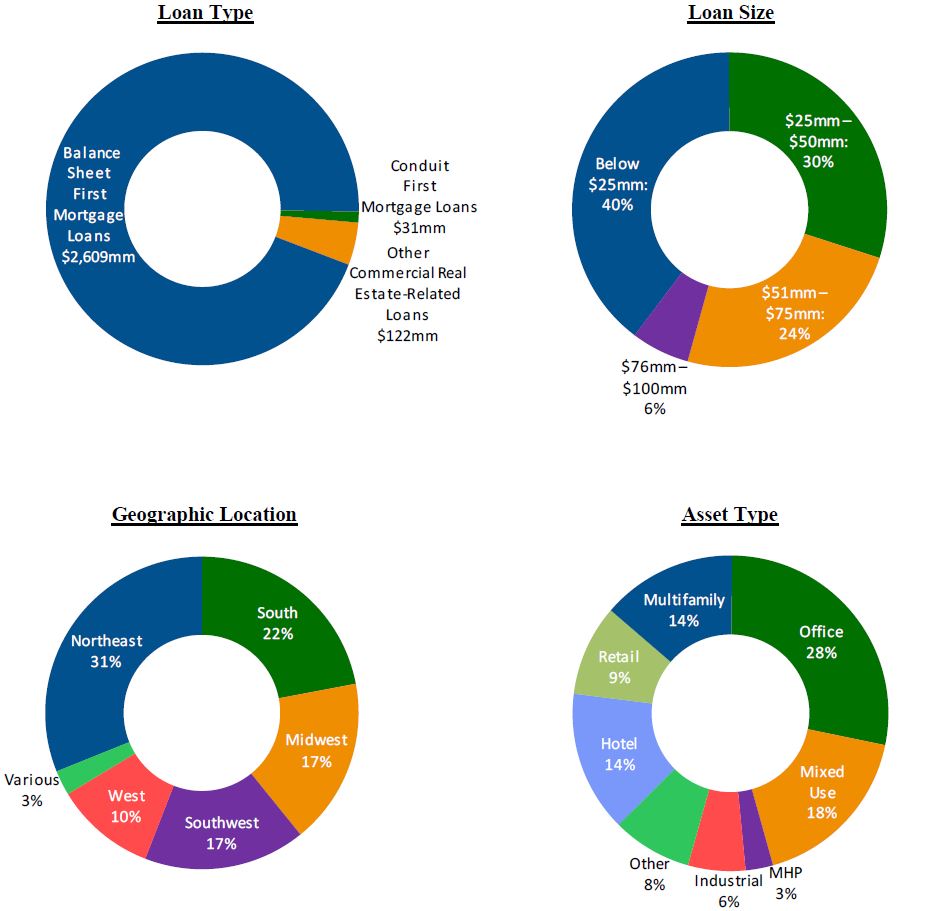
| Location | Acquisition date | Acquisition price/basis | Year built/reno. | Lease expiration (1) | Approx. square footage | Carrying value of asset | Mortgage loan outstanding (2) | Asset net of mortgage loan outstanding | Annual rental income (3) | Ownership Percentage (4) | |||||||||||||||||||||||
| Net Leased | |||||||||||||||||||||||||||||||||
| Sullivan, IL | 09/13/19 | $ | 1,496 | 2019 | 5/31/34 | 10,566 | $ | 1,577 | $ | — | $ | 1,577 | $ | 65 | 100.0 | % | |||||||||||||||||
| Becker, MN | 09/13/19 | 1,185 | 2019 | 7/31/34 | 9,002 | 1,244 | — | 1,244 | 52 | 100.0 | % | ||||||||||||||||||||||
| Adrian, MO | 09/13/19 | 1,138 | 2019 | 7/31/34 | 9,026 | 1,209 | — | 1,209 | 49 | 100.0 | % | ||||||||||||||||||||||
| Chillicothe, IL | 09/05/19 | 1,445 | 2019 | 6/30/34 | 10,640 | 1,516 | — | 1,516 | 91 | 100.0 | % | ||||||||||||||||||||||
| Poseyville, IN | 08/13/19 | 1,220 | 2019 | 5/31/34 | 10,566 | 1,297 | — | 1,297 | 88 | 100.0 | % | ||||||||||||||||||||||
| Dexter, MO | 07/09/19 | 1,150 | 2019 | 4/30/34 | 9,002 | 1,201 | — | 1,201 | 83 | 100.0 | % | ||||||||||||||||||||||
| Hubbard Lake, MI | 07/09/19 | 1,199 | 2019 | 4/30/34 | 9,026 | 1,252 | — | 1,252 | 87 | 100.0 | % | ||||||||||||||||||||||
| Fayette, MO | 06/26/19 | 1,423 | 2019 | 1/31/34 | 10,566 | 1,483 | — | 1,483 | 103 | 100.0 | % | ||||||||||||||||||||||
| Centralia, IL | 04/25/19 | 1,242 | 2019 | 2/28/34 | 9,002 | 1,290 | — | 1,290 | 90 | 100.0 | % | ||||||||||||||||||||||
| Trenton, MO | 02/26/19 | 1,164 | 2019 | 12/31/33 | 9,100 | 1,206 | — | 1,206 | 84 | 100.0 | % | ||||||||||||||||||||||
| Houghton Lake, MI | 02/26/19 | 1,242 | 2018 | 12/31/33 | 9,100 | 1,283 | 970 | 313 | 90 | 100.0 | % | ||||||||||||||||||||||
| Location | Acquisition date | Acquisition price/basis | Year built/reno. | Lease expiration (1) | Approx. square footage | Carrying value of asset | Mortgage loan outstanding (2) | Asset net of mortgage loan outstanding | Annual rental income (3) | Ownership Percentage (4) | |||||||||||||||||||||||
| Pelican Rapids, MN | 12/26/18 | 1,195 | 2018 | 10/31/33 | 9,100 | 1,229 | 920 | 309 | 87 | 100.0 | % | ||||||||||||||||||||||
| Carthage, MO | 12/26/18 | 1,099 | 2018 | 10/31/33 | 7,489 | 1,146 | 848 | 298 | 80 | 100.0 | % | ||||||||||||||||||||||
| Bolivar, MO | 12/26/18 | 1,175 | 2018 | 10/31/33 | 9,026 | 1,219 | 897 | 322 | 85 | 100.0 | % | ||||||||||||||||||||||
| Pinconning, MI | 12/06/18 | 1,235 | 2018 | 9/30/33 | 9,026 | 1,269 | 952 | 317 | 90 | 100.0 | % | ||||||||||||||||||||||
| New Hampton, IA | 11/30/18 | 1,317 | 2018 | 9/30/33 | 9,002 | 1,438 | 1,016 | 422 | 96 | 100.0 | % | ||||||||||||||||||||||
| Ogden, IA | 10/03/18 | 1,137 | 2018 | 7/31/33 | 7,489 | 1,154 | 857 | 297 | 82 | 100.0 | % | ||||||||||||||||||||||
| Moscow Mills, MO | 04/12/18 | 1,237 | 2018 | 1/31/33 | 9,026 | 1,259 | 991 | 268 | 90 | 100.0 | % | ||||||||||||||||||||||
| Foley, MN | 04/12/18 | 1,176 | 2018 | 1/1/33 | 7,489 | 1,181 | 883 | 298 | 85 | 100.0 | % | ||||||||||||||||||||||
| Wonder Lake, IL | 04/12/18 | 1,256 | 2017 | 7/31/32 | 9,100 | 1,272 | 943 | 329 | 91 | 100.0 | % | ||||||||||||||||||||||
| Kirbyville, MO | 04/02/18 | 1,156 | 2018 | 1/31/33 | 9,026 | 1,168 | 870 | 298 | 84 | 100.0 | % | ||||||||||||||||||||||
| Gladwin, MI | 04/02/18 | 1,171 | 2017 | 1/31/33 | 9,026 | 1,194 | 883 | 311 | 85 | 100.0 | % | ||||||||||||||||||||||
| Rockford, MN | 12/08/17 | 1,195 | 2017 | 10/31/32 | 9,002 | 1,166 | 886 | 280 | 87 | 100.0 | % | ||||||||||||||||||||||
| Winterset, IA | 12/08/17 | 1,258 | 2017 | 8/31/32 | 9,026 | 1,240 | 934 | 306 | 91 | 100.0 | % | ||||||||||||||||||||||
| Kawkawlin, MI | 10/05/17 | 1,234 | 2017 | 7/31/32 | 9,100 | 1,217 | 917 | 300 | 89 | 100.0 | % | ||||||||||||||||||||||
| Aroma Park, IL | 10/05/17 | 1,218 | 2017 | 7/31/32 | 9,002 | 1,192 | 949 | 243 | 88 | 100.0 | % | ||||||||||||||||||||||
| East Peoria, IL | 10/05/17 | 1,350 | 2017 | 7/31/32 | 9,100 | 1,320 | 1,019 | 301 | 98 | 100.0 | % | ||||||||||||||||||||||
| Milford, IA | 09/08/17 | 1,298 | 2017 | 6/1/32 | 9,100 | 1,284 | 987 | 297 | 94 | 100.0 | % | ||||||||||||||||||||||
| Jefferson City, MO | 06/02/17 | 1,241 | 2016 | 2/28/32 | 9,002 | 1,255 | 949 | 306 | 90 | 100.0 | % | ||||||||||||||||||||||
| Denver, IA | 05/31/17 | 1,183 | 2017 | 3/31/31 | 9,026 | 1,150 | 903 | 247 | 86 | 100.0 | % | ||||||||||||||||||||||
| Port O'Connor, TX | 05/25/17 | 1,255 | 2017 | 3/31/30 | 9,100 | 1,216 | 955 | 261 | 91 | 100.0 | % | ||||||||||||||||||||||
| Wabasha, MN | 05/25/17 | 1,280 | 2016 | 3/31/31 | 9,026 | 1,270 | 970 | 300 | 92 | 100.0 | % | ||||||||||||||||||||||
| Jacksonville, FL | 05/23/17 | 115,641 | 1989 | 9/30/31 | 822,540 | 131,816 | 83,281 | 48,535 | 7,403 | 100.0 | % | ||||||||||||||||||||||
| Shelbyville, IL | 05/23/17 | 1,132 | 2016 | 1/31/31 | 9,026 | 1,161 | 868 | 293 | 82 | 100.0 | % | ||||||||||||||||||||||
| Jesup, IA | 05/05/17 | 1,163 | 2017 | 3/31/30 | 9,026 | 1,116 | 889 | 227 | 84 | 100.0 | % | ||||||||||||||||||||||
| Hanna City, IL | 04/11/17 | 1,141 | 2016 | 6/30/31 | 9,100 | 1,147 | 870 | 277 | 83 | 100.0 | % | ||||||||||||||||||||||
| Ridgedale, MO | 03/09/17 | 1,298 | 2016 | 6/30/31 | 9,002 | 1,278 | 997 | 281 | 94 | 100.0 | % | ||||||||||||||||||||||
| Peoria, IL | 02/06/17 | 1,183 | 2016 | 8/31/31 | 7,489 | 1,181 | 909 | 272 | 86 | 100.0 | % | ||||||||||||||||||||||
| Carmi, IL | 02/03/17 | 1,411 | 2016 | 10/31/31 | 9,100 | 1,351 | 1,106 | 245 | 102 | 100.0 | % | ||||||||||||||||||||||
| Springfield, IL | 11/16/16 | 1,308 | 2016 | 6/30/31 | 9,026 | 1,320 | 1,007 | 313 | 96 | 100.0 | % | ||||||||||||||||||||||
| Fayetteville, NC | 11/15/16 | 6,971 | 2008 | 10/31/34 | 14,820 | 6,286 | 4,909 | 1,377 | 450 | 100.0 | % | ||||||||||||||||||||||
| Dryden Township, MI | 10/26/16 | 1,190 | 2016 | 8/31/31 | 9,100 | 1,186 | 916 | 270 | 87 | 100.0 | % | ||||||||||||||||||||||
| Lamar, MO | 07/22/16 | 1,175 | 2016 | 5/31/31 | 9,100 | 1,137 | 906 | 231 | 86 | 100.0 | % | ||||||||||||||||||||||
| Union, MO | 07/01/16 | 1,227 | 2016 | 5/31/31 | 9,100 | 1,232 | 949 | 283 | 90 | 100.0 | % | ||||||||||||||||||||||
| Pawnee, IL | 07/01/16 | 1,201 | 2016 | 5/31/31 | 9,002 | 1,131 | 949 | 182 | 88 | 100.0 | % | ||||||||||||||||||||||
| Decatur, IL | 06/30/16 | 1,365 | 2016 | 5/31/31 | 9,002 | 1,368 | 1,056 | 312 | 100 | 100.0 | % | ||||||||||||||||||||||
| Cape Girardeau, MO | 06/30/16 | 1,281 | 2016 | 5/31/31 | 9,100 | 1,280 | 1,023 | 257 | 94 | 100.0 | % | ||||||||||||||||||||||
| Linn, MO | 06/30/16 | 1,122 | 2016 | 5/31/31 | 9,002 | 1,086 | 864 | 222 | 82 | 100.0 | % | ||||||||||||||||||||||
| Rantoul, IL | 06/21/16 | 1,204 | 2016 | 4/30/31 | 9,100 | 1,191 | 928 | 263 | 88 | 100.0 | % | ||||||||||||||||||||||
| Flora Vista, NM | 06/06/16 | 1,305 | 2016 | 4/30/31 | 9,002 | 1,203 | 1,006 | 197 | 95 | 100.0 | % | ||||||||||||||||||||||
| Champaign, IL | 06/03/16 | 1,324 | 2016 | 4/30/31 | 9,002 | 1,328 | 1,021 | 307 | 97 | 100.0 | % | ||||||||||||||||||||||
| Mountain Grove, MO | 06/03/16 | 1,279 | 2016 | 4/30/31 | 10,566 | 1,278 | 985 | 293 | 93 | 100.0 | % | ||||||||||||||||||||||
| Decatur, IL | 06/03/16 | 1,181 | 2016 | 4/30/31 | 9,002 | 1,166 | 949 | 217 | 86 | 100.0 | % | ||||||||||||||||||||||
| San Antonio, TX | 05/06/16 | 1,096 | 2015 | 3/31/31 | 9,100 | 1,044 | 890 | 154 | 80 | 100.0 | % | ||||||||||||||||||||||
| Borger, TX | 05/06/16 | 978 | 2016 | 3/31/31 | 9,100 | 944 | 786 | 158 | 71 | 100.0 | % | ||||||||||||||||||||||
| St.Charles, MN | 04/26/16 | 1,198 | 2016 | 3/31/31 | 9,026 | 1,134 | 964 | 170 | 87 | 100.0 | % | ||||||||||||||||||||||
| Philo, IL | 04/26/16 | 1,156 | 2016 | 3/31/31 | 9,026 | 1,135 | 927 | 208 | 84 | 100.0 | % | ||||||||||||||||||||||
| Dimmitt, TX | 04/26/16 | 1,319 | 2016 | 3/31/31 | 10,566 | 1,260 | 1,053 | 207 | 96 | 100.0 | % | ||||||||||||||||||||||
| Radford, VA | 12/23/15 | 1,564 | 2015 | 9/30/30 | 8,360 | 1,406 | 1,133 | 273 | 104 | 100.0 | % | ||||||||||||||||||||||
| Albion, PA | 12/23/15 | 1,525 | 2015 | 9/30/30 | 8,184 | 1,294 | 1,122 | 172 | 101 | 100.0 | % | ||||||||||||||||||||||
| Location | Acquisition date | Acquisition price/basis | Year built/reno. | Lease expiration (1) | Approx. square footage | Carrying value of asset | Mortgage loan outstanding (2) | Asset net of mortgage loan outstanding | Annual rental income (3) | Ownership Percentage (4) | |||||||||||||||||||||||
| Rural Retreat, VA | 12/23/15 | 1,399 | 2015 | 9/30/30 | 8,305 | 1,262 | 1,035 | 227 | 93 | 100.0 | % | ||||||||||||||||||||||
| Mount Vernon, AL | 12/23/15 | 1,224 | 2015 | 6/30/30 | 8,323 | 1,105 | 941 | 164 | 84 | 100.0 | % | ||||||||||||||||||||||
| Malone, NY | 12/16/15 | 1,474 | 2015 | 6/30/30 | 8,320 | 1,321 | 1,084 | 237 | 99 | 100.0 | % | ||||||||||||||||||||||
| Mercedes, TX | 12/16/15 | 1,263 | 2015 | 11/30/30 | 9,100 | 1,153 | 835 | 318 | 86 | 100.0 | % | ||||||||||||||||||||||
| Gordonville, MO | 11/10/15 | 1,207 | 2015 | 9/30/30 | 9,026 | 1,095 | 773 | 322 | 80 | 100.0 | % | ||||||||||||||||||||||
| Rice, MN | 10/28/15 | 1,242 | 2015 | 9/30/30 | 9,002 | 1,079 | 818 | 261 | 85 | 100.0 | % | ||||||||||||||||||||||
| Bixby, OK | 10/27/15 | 12,151 | 2012 | 12/31/32 | 75,996 | 11,010 | 7,967 | 3,043 | 769 | 100.0 | % | ||||||||||||||||||||||
| Farmington, IL | 10/23/15 | 1,408 | 2015 | 8/31/30 | 9,100 | 1,261 | 897 | 364 | 93 | 100.0 | % | ||||||||||||||||||||||
| Grove, OK | 10/20/15 | 5,583 | 2012 | 8/31/32 | 31,500 | 4,910 | 3,631 | 1,279 | 364 | 100.0 | % | ||||||||||||||||||||||
| Jenks, OK | 10/19/15 | 13,418 | 2009 | 9/24/33 | 80,932 | 12,063 | 8,815 | 3,248 | 912 | 100.0 | % | ||||||||||||||||||||||
| Bloomington, IL | 10/14/15 | 1,294 | 2015 | 8/31/30 | 9,026 | 1,164 | 818 | 346 | 85 | 100.0 | % | ||||||||||||||||||||||
| Montrose, MN | 10/14/15 | 1,193 | 2015 | 8/31/30 | 9,100 | 1,028 | 782 | 246 | 83 | 100.0 | % | ||||||||||||||||||||||
| Lincoln County , MO | 10/14/15 | 1,137 | 2015 | 8/31/30 | 9,002 | 1,021 | 740 | 281 | 76 | 100.0 | % | ||||||||||||||||||||||
| Wilmington, IL | 10/07/15 | 1,399 | 2015 | 8/31/30 | 9,002 | 1,256 | 904 | 352 | 93 | 100.0 | % | ||||||||||||||||||||||
| Danville, IL | 10/07/15 | 1,160 | 2015 | 8/31/30 | 9,100 | 1,051 | 740 | 311 | 76 | 100.0 | % | ||||||||||||||||||||||
| Moultrie, GA | 09/22/15 | 1,305 | 2014 | 6/30/29 | 8,225 | 1,127 | 932 | 195 | 85 | 100.0 | % | ||||||||||||||||||||||
| Rose Hill, NC | 09/22/15 | 1,420 | 2014 | 6/30/29 | 8,320 | 1,248 | 1,002 | 246 | 93 | 100.0 | % | ||||||||||||||||||||||
| Rockingham, NC | 09/22/15 | 1,158 | 2014 | 6/30/29 | 8,320 | 1,004 | 823 | 181 | 76 | 100.0 | % | ||||||||||||||||||||||
| Biscoe, NC | 09/22/15 | 1,216 | 2014 | 6/30/29 | 8,320 | 1,059 | 862 | 197 | 80 | 100.0 | % | ||||||||||||||||||||||
| De Soto, IL | 09/08/15 | 1,111 | 2015 | 7/31/30 | 9,100 | 986 | 705 | 281 | 76 | 100.0 | % | ||||||||||||||||||||||
| Kerrville, TX | 08/28/15 | 1,236 | 2015 | 7/31/30 | 9,100 | 1,079 | 768 | 311 | 84 | 100.0 | % | ||||||||||||||||||||||
| Floresville, TX | 08/28/15 | 1,312 | 2015 | 7/31/30 | 9,100 | 1,153 | 815 | 338 | 89 | 100.0 | % | ||||||||||||||||||||||
| Minot, ND | 08/19/15 | 6,946 | 2012 | 1/31/34 | 55,440 | 6,323 | 4,699 | 1,624 | 419 | 100.0 | % | ||||||||||||||||||||||
| Lebanon, MI | 08/14/15 | 1,261 | 2015 | 7/31/30 | 9,050 | 1,149 | 821 | 328 | 85 | 100.0 | % | ||||||||||||||||||||||
| Effingham County, IL | 08/10/15 | 1,252 | 2015 | 6/30/30 | 9,002 | 1,123 | 821 | 302 | 85 | 100.0 | % | ||||||||||||||||||||||
| Ponce, PR | 08/03/15 | 9,345 | 2012 | 8/31/37 | 15,660 | 8,396 | 6,522 | 1,874 | 560 | 100.0 | % | ||||||||||||||||||||||
| Tremont, IL | 06/25/15 | 1,192 | 2015 | 5/31/30 | 9,026 | 1,053 | 788 | 265 | 82 | 100.0 | % | ||||||||||||||||||||||
| Pleasanton, TX | 06/24/15 | 1,377 | 2015 | 5/31/30 | 9,026 | 1,215 | 865 | 350 | 93 | 100.0 | % | ||||||||||||||||||||||
| Peoria, IL | 06/24/15 | 1,293 | 2015 | 5/31/30 | 9,002 | 1,141 | 854 | 287 | 87 | 100.0 | % | ||||||||||||||||||||||
| Bridgeport, IL | 06/24/15 | 1,241 | 2015 | 5/31/30 | 9,100 | 1,100 | 821 | 279 | 84 | 100.0 | % | ||||||||||||||||||||||
| Warren, MN | 06/24/15 | 1,090 | 2015 | 4/30/30 | 9,100 | 928 | 697 | 231 | 75 | 100.0 | % | ||||||||||||||||||||||
| Canyon Lake, TX | 06/18/15 | 1,443 | 2015 | 3/31/30 | 9,100 | 1,274 | 907 | 367 | 98 | 100.0 | % | ||||||||||||||||||||||
| Wheeler, TX | 06/18/15 | 1,127 | 2015 | 3/31/30 | 9,002 | 968 | 716 | 252 | 76 | 100.0 | % | ||||||||||||||||||||||
| Aurora, MN | 06/18/15 | 993 | 2015 | 3/31/30 | 9,100 | 877 | 628 | 249 | 68 | 100.0 | % | ||||||||||||||||||||||
| Red Oak, IA | 05/07/15 | 1,208 | 2014 | 10/31/29 | 9,026 | 1,040 | 779 | 261 | 84 | 100.0 | % | ||||||||||||||||||||||
| Zapata, TX | 05/07/15 | 1,204 | 2015 | 3/31/30 | 9,100 | 995 | 746 | 249 | 82 | 100.0 | % | ||||||||||||||||||||||
| St. Francis, MN | 03/26/15 | 1,180 | 2014 | 1/31/30 | 9,002 | 973 | 733 | 240 | 79 | 100.0 | % | ||||||||||||||||||||||
| Yorktown, TX | 03/25/15 | 1,301 | 2015 | 2/28/30 | 10,566 | 1,078 | 785 | 293 | 86 | 100.0 | % | ||||||||||||||||||||||
| Battle Lake, MN | 03/25/15 | 1,168 | 2014 | 2/28/30 | 9,100 | 953 | 720 | 233 | 78 | 100.0 | % | ||||||||||||||||||||||
| Paynesville, MN | 03/05/15 | 1,254 | 2015 | 11/30/26 | 9,100 | 1,075 | 804 | 271 | 89 | 100.0 | % | ||||||||||||||||||||||
| Wheaton, MO | 03/05/15 | 970 | 2015 | 11/30/29 | 9,100 | 818 | 648 | 170 | 69 | 100.0 | % | ||||||||||||||||||||||
| Rotterdam, NY | 03/03/15 | 12,619 | 1996 | 8/31/32 | 115,660 | 9,713 | 8,930 | 783 | 940 | 100.0 | % | ||||||||||||||||||||||
| Hilliard, OH | 03/02/15 | 6,384 | 2007 | 8/31/32 | 14,820 | 5,554 | 4,555 | 999 | 399 | 100.0 | % | ||||||||||||||||||||||
| Niles, OH | 03/02/15 | 5,200 | 2007 | 11/30/32 | 14,820 | 4,510 | 3,701 | 809 | 325 | 100.0 | % | ||||||||||||||||||||||
| Youngstown, OH | 02/20/15 | 5,400 | 2005 | 9/30/30 | 14,820 | 4,645 | 3,826 | 819 | 336 | 100.0 | % | ||||||||||||||||||||||
| Kings Mountain, NC | 01/29/15 | 24,167 | 1995 | 9/30/30 | 467,781 | 23,804 | 18,574 | 5,230 | 1,534 | 100.0 | % | ||||||||||||||||||||||
| Iberia, MO | 01/23/15 | 1,328 | 2015 | 12/31/29 | 10,542 | 1,126 | 892 | 234 | 94 | 100.0 | % | ||||||||||||||||||||||
| Pine Island, MN | 01/23/15 | 1,142 | 2014 | 4/30/27 | 9,100 | 947 | 767 | 180 | 81 | 100.0 | % | ||||||||||||||||||||||
| Isle, MN | 01/23/15 | 1,077 | 2014 | 1/31/30 | 9,100 | 890 | 721 | 169 | 77 | 100.0 | % | ||||||||||||||||||||||
| Location | Acquisition date | Acquisition price/basis | Year built/reno. | Lease expiration (1) | Approx. square footage | Carrying value of asset | Mortgage loan outstanding (2) | Asset net of mortgage loan outstanding | Annual rental income (3) | Ownership Percentage (4) | |||||||||||||||||||||||
| Jacksonville, NC | 01/22/15 | 8,632 | 2014 | 12/31/29 | 55,000 | 7,563 | 5,658 | 1,905 | 517 | 100.0 | % | ||||||||||||||||||||||
| Evansville, IN | 11/26/14 | 9,000 | 2014 | 12/31/35 | 71,680 | 7,736 | 6,402 | 1,334 | 540 | 100.0 | % | ||||||||||||||||||||||
| Woodland Park, CO | 11/14/14 | 3,969 | 2014 | 8/31/29 | 22,141 | 3,293 | 2,794 | 499 | 258 | 100.0 | % | ||||||||||||||||||||||
| Bellport, NY | 11/13/14 | 18,100 | 2014 | 8/16/34 | 87,788 | 15,463 | 12,803 | 2,660 | 1,119 | 100.0 | % | ||||||||||||||||||||||
| Ankeny, IA | 11/04/14 | 16,510 | 2013 | 10/30/34 | 94,872 | 14,210 | 11,678 | 2,532 | 991 | 100.0 | % | ||||||||||||||||||||||
| Springfield, MO | 11/04/14 | 11,675 | 2011 | 10/30/34 | 88,793 | 10,304 | 8,321 | 1,983 | 701 | 100.0 | % | ||||||||||||||||||||||
| Cedar Rapids, IA | 11/04/14 | 11,000 | 2012 | 10/30/34 | 79,389 | 9,039 | 7,780 | 1,259 | 660 | 100.0 | % | ||||||||||||||||||||||
| Fairfield, IA | 11/04/14 | 10,695 | 2011 | 10/30/34 | 69,280 | 9,015 | 7,568 | 1,447 | 642 | 100.0 | % | ||||||||||||||||||||||
| Owatonna, MN | 11/04/14 | 9,970 | 2010 | 10/30/34 | 70,825 | 8,463 | 7,091 | 1,372 | 598 | 100.0 | % | ||||||||||||||||||||||
| Muscatine, IA | 11/04/14 | 7,150 | 2013 | 10/30/34 | 78,218 | 7,391 | 5,085 | 2,306 | 429 | 100.0 | % | ||||||||||||||||||||||
| Sheldon, IA | 11/04/14 | 4,300 | 2011 | 10/30/34 | 35,385 | 3,700 | 3,058 | 642 | 258 | 100.0 | % | ||||||||||||||||||||||
| Memphis, TN | 10/24/14 | 5,310 | 1962 | 12/31/29 | 68,761 | 4,197 | 3,908 | 289 | 358 | 100.0 | % | ||||||||||||||||||||||
| Bennett, CO | 10/02/14 | 3,522 | 2014 | 8/31/29 | 21,930 | 2,883 | 2,483 | 400 | 229 | 100.0 | % | ||||||||||||||||||||||
| Conyers, GA | 08/28/14 | 32,530 | 2014 | 4/30/29 | 499,668 | 27,432 | 22,820 | 4,612 | 1,956 | 100.0 | % | ||||||||||||||||||||||
| O'Fallon, IL | 08/08/14 | 8,000 | 1984 | 1/31/28 | 141,436 | 6,324 | 5,682 | 642 | 460 | 100.0 | % | ||||||||||||||||||||||
| El Centro, CA | 08/08/14 | 4,277 | 2014 | 6/30/29 | 19,168 | 3,646 | 2,981 | 665 | 278 | 100.0 | % | ||||||||||||||||||||||
| Durant, OK | 01/28/13 | 4,991 | 2007 | 2/28/33 | 14,550 | 4,118 | 3,239 | 879 | 323 | 100.0 | % | ||||||||||||||||||||||
| Gallatin, TN | 12/28/12 | 5,062 | 2007 | 9/30/32 | 14,820 | 4,279 | 3,311 | 968 | 329 | 100.0 | % | ||||||||||||||||||||||
| Mt. Airy, NC | 12/27/12 | 4,492 | 2007 | 6/30/32 | 14,820 | 3,809 | 2,940 | 869 | 292 | 100.0 | % | ||||||||||||||||||||||
| Aiken, SC | 12/21/12 | 5,926 | 2008 | 2/28/33 | 14,550 | 4,972 | 3,872 | 1,100 | 384 | 100.0 | % | ||||||||||||||||||||||
| Johnson City, TN | 12/21/12 | 5,262 | 2007 | 3/30/32 | 14,550 | 4,301 | 3,441 | 860 | 341 | 100.0 | % | ||||||||||||||||||||||
| Palmview, TX | 12/19/12 | 6,820 | 2012 | 8/31/37 | 14,820 | 5,718 | 4,529 | 1,189 | 437 | 100.0 | % | ||||||||||||||||||||||
| Ooltewah, TN | 12/18/12 | 5,703 | 2008 | 1/31/33 | 14,550 | 4,674 | 3,793 | 881 | 365 | 100.0 | % | ||||||||||||||||||||||
| Abingdon, VA | 12/18/12 | 4,688 | 2006 | 6/30/31 | 15,371 | 4,100 | 3,045 | 1,055 | 300 | 100.0 | % | ||||||||||||||||||||||
| Wichita, KS | 12/14/12 | 7,200 | 2012 | 12/31/32 | 73,322 | 5,542 | 4,746 | 796 | 536 | 100.0 | % | ||||||||||||||||||||||
| North Dartmouth, MA | 09/21/12 | 29,965 | 1989 | 8/31/32 | 103,680 | 21,379 | 18,775 | 2,604 | 2,256 | 100.0 | % | ||||||||||||||||||||||
| Vineland, NJ | 09/21/12 | 22,507 | 2003 | 8/31/32 | 115,368 | 16,502 | 13,801 | 2,701 | 1,695 | 100.0 | % | ||||||||||||||||||||||
| Saratoga Springs, NY | 09/21/12 | 20,222 | 1994 | 8/31/32 | 116,620 | 14,598 | 12,400 | 2,198 | 1,523 | 100.0 | % | ||||||||||||||||||||||
| Waldorf, MD | 09/21/12 | 18,803 | 1999 | 8/31/32 | 115,660 | 14,700 | 11,530 | 3,170 | 1,416 | 100.0 | % | ||||||||||||||||||||||
| Mooresville, NC | 09/21/12 | 17,644 | 2000 | 8/31/32 | 108,528 | 12,583 | 10,819 | 1,764 | 1,329 | 100.0 | % | ||||||||||||||||||||||
| Sennett, NY | 09/21/12 | 7,476 | 1996 | 8/31/32 | 68,160 | 5,242 | 4,684 | 558 | 641 | 100.0 | % | ||||||||||||||||||||||
| DeLeon Springs, FL | 08/13/12 | 1,242 | 2011 | 1/31/27 | 9,100 | 890 | 811 | 79 | 98 | 100.0 | % | ||||||||||||||||||||||
| Orange City, FL | 05/23/12 | 1,317 | 2011 | 4/30/27 | 9,026 | 949 | 798 | 151 | 103 | 100.0 | % | ||||||||||||||||||||||
| Satsuma, FL | 04/19/12 | 1,092 | 2011 | 11/30/26 | 9,026 | 737 | 719 | 18 | 86 | 100.0 | % | ||||||||||||||||||||||
| Greenwood, AR | 04/12/12 | 5,147 | 2009 | 6/30/34 | 13,650 | 4,181 | 3,383 | 798 | 332 | 100.0 | % | ||||||||||||||||||||||
| Snellville, GA | 04/04/12 | 8,000 | 2011 | 4/30/32 | 67,375 | 6,048 | 5,300 | 748 | 626 | 100.0 | % | ||||||||||||||||||||||
| Columbia, SC | 04/04/12 | 7,800 | 2001 | 4/30/32 | 71,744 | 6,151 | 5,156 | 995 | 610 | 100.0 | % | ||||||||||||||||||||||
| Millbrook, AL | 03/28/12 | 6,941 | 2008 | 3/22/32 | 14,820 | 5,529 | 4,561 | 968 | 448 | 100.0 | % | ||||||||||||||||||||||
| Pittsfield, MA | 02/17/12 | 14,700 | 2011 | 10/29/31 | 85,188 | 11,366 | 11,063 | 303 | 1,118 | 100.0 | % | ||||||||||||||||||||||
| Spartanburg, SC | 01/14/11 | 3,870 | 2007 | 8/31/32 | 14,820 | 3,167 | 3,386 | (219 | ) | 291 | 100.0 | % | |||||||||||||||||||||
| Tupelo, MS | 08/13/10 | 5,128 | 2007 | 1/31/33 | 14,691 | 3,974 | — | 3,974 | 400 | 100.0 | % | ||||||||||||||||||||||
| Lilburn, GA | 08/12/10 | 5,791 | 2007 | 10/31/32 | 14,752 | 4,458 | 3,514 | 944 | 443 | 100.0 | % | ||||||||||||||||||||||
| Douglasville, GA | 08/12/10 | 5,409 | 2008 | 10/31/33 | 13,434 | 4,357 | — | 4,357 | 417 | 100.0 | % | ||||||||||||||||||||||
| Elkton, MD | 07/27/10 | 4,872 | 2008 | 10/31/33 | 13,706 | 3,758 | 4,428 | (670 | ) | 380 | 100.0 | % | |||||||||||||||||||||
| Lexington, SC | 06/28/10 | 4,732 | 2009 | 9/30/33 | 14,820 | 3,783 | — | 3,783 | 362 | 100.0 | % | ||||||||||||||||||||||
| Total Net Leased | 751,422 | 5,291,867 | 669,483 | 500,925 | 168,558 | 50,633 | |||||||||||||||||||||||||||
| Location | Acquisition date | Acquisition price/basis | Year built/reno. | Lease expiration (1) | Approx. square footage | Carrying value of asset | Mortgage loan outstanding (2) | Asset net of mortgage loan outstanding | Annual rental income (3) | Ownership Percentage (4) | |||||||||||||||||||||||
| Diversified | |||||||||||||||||||||||||||||||||
| Omaha, NE | 02/27/19 | 18,200 | 1969 | 108,555 | 17,733 | — | 17,733 | — | 100.0 | % | |||||||||||||||||||||||
| Isla Vista, CA | 05/01/18 | 83,442 | 2005 | 7/2/19(6) | 117,324 | 82,912 | 69,227 | 13,685 | 7,486 | 75.0 | % | (8) | |||||||||||||||||||||
| Lithia Springs, GA | 03/08/18 | 24,466 | 2005 | 617,969 | 23,780 | 18,464 | 5,316 | — | 70.6 | % | (8) | ||||||||||||||||||||||
| Crum Lynne, PA | 09/29/17 | 9,196 | 1999 | 9/30/32 | 56,320 | 9,977 | 6,028 | 3,949 | 675 | 100.0 | % | ||||||||||||||||||||||
| Miami, FL | 08/31/17 | 38,145 | 1987 | 9/30/18(8) | 166,176 | 35,523 | — | 35,523 | 3,946 | 80.0 | % | (8) | |||||||||||||||||||||
| Peoria, IL | 10/21/16 | 2,760 | 1926 | 7/31/30 | 252,940 | 3,198 | — | 3,198 | 1,663 | 100.0 | % | ||||||||||||||||||||||
| Ewing, NJ | 08/04/16 | 30,640 | 2009 | 7/31/30 | 110,765 | 27,231 | 21,751 | 5,480 | 2,040 | 100.0 | % | ||||||||||||||||||||||
| Carmel, NY | 10/14/15 | 6,706 | 1985 | 1/31/39 | 50,121 | 6,120 | — | 6,120 | 462 | 100.0 | % | ||||||||||||||||||||||
| Richmond, VA | 08/14/14 | 19,850 | 1986 | 4/30/21 | 195,881 | 15,074 | 15,556 | (482 | ) | 2,731 | 77.5 | % | (8) | ||||||||||||||||||||
| Richmond, VA | 06/07/13 | 118,406 | 1984 | 4/30/21 | 994,040 | 77,093 | 73,299 | 3,794 | 12,117 | 77.5 | % | (8) | |||||||||||||||||||||
| Oakland County, MI | 02/01/13 | 18,000 | 1989 | 12/31/21 | 240,900 | 10,380 | 18,063 | (7,683 | ) | 4,506 | 90.0 | % | (8) | ||||||||||||||||||||
| Total Diversified | 369,811 | 2,910,991 | 309,021 | 222,388 | 86,633 | 35,626 | |||||||||||||||||||||||||||
| Condominium | |||||||||||||||||||||||||||||||||
| Miami, FL | 11/21/13 | 80,000 | 2010 | (10) | 2,363 | — | 2,363 | 88 | 100.0 | % | (11) | ||||||||||||||||||||||
| Las Vegas, NV | 12/20/12 | 119,000 | 2006 | (12) | 466 | — | 466 | — | 98.8 | % | (8)(13) | ||||||||||||||||||||||
| Total Condominium | 199,000 | — | 2,829 | — | 2,829 | 88 | |||||||||||||||||||||||||||
| Total | $ | 1,320,233 | 8,202,858 | $ | 981,333 | $ | 723,313 | $ | 258,020 | $ | 86,347 | ||||||||||||||||||||||
| Three Months Ended September 30, | 2019 vs | ||||||||||
| 2019 | 2018 | 2018 | |||||||||
| Net interest income | |||||||||||
| Interest income | $ | 82,251 | $ | 90,386 | $ | (8,135 | ) | ||||
| Interest expense | 51,397 | 51,476 | (79 | ) | |||||||
| Net interest income | 30,854 | 38,910 | (8,056 | ) | |||||||
| Provision for loan losses | — | 10,300 | (10,300 | ) | |||||||
| Net interest income after provision for loan losses | 30,854 | 28,610 | 2,244 | ||||||||
| Other income (loss) | |||||||||||
| Operating lease income | 24,405 | 24,997 | (592 | ) | |||||||
| Sale of loans, net | 11,247 | 1,861 | 9,386 | ||||||||
| Realized gain (loss) on securities | 3,396 | (2,554 | ) | 5,950 | |||||||
| Unrealized gain (loss) on equity securities | 254 | — | 254 | ||||||||
| Unrealized gain (loss) on Agency interest-only securities | 16 | 142 | (126 | ) | |||||||
| Realized gain (loss) on sale of real estate, net | 2,082 | 63,704 | (61,622 | ) | |||||||
| Fee and other income | 5,166 | 4,851 | 315 | ||||||||
| Net result from derivative transactions | (9,465 | ) | 7,115 | (16,580 | ) | ||||||
| Earnings (loss) from investment in unconsolidated joint ventures | 1,094 | 401 | 693 | ||||||||
| Gain (loss) on extinguishment/defeasance of debt | — | (4,323 | ) | 4,323 | |||||||
| Total other income (loss) | 38,195 | 96,194 | (57,999 | ) | |||||||
| Costs and expenses | |||||||||||
| Salaries and employee benefits | 14,319 | 15,792 | (1,473 | ) | |||||||
| Operating expenses | 5,314 | 5,464 | (150 | ) | |||||||
| Real estate operating expenses | 6,270 | 7,152 | (882 | ) | |||||||
| Fee expense | 2,056 | 1,311 | 745 | ||||||||
| Depreciation and amortization | 9,030 | 10,417 | (1,387 | ) | |||||||
| Total costs and expenses | 36,989 | 40,136 | (3,147 | ) | |||||||
| Income (loss) before taxes | 32,060 | 84,668 | (52,608 | ) | |||||||
| Income tax expense (benefit) | 1,112 | 1,204 | (92 | ) | |||||||
| Net income (loss) | 30,948 | 83,464 | (52,516 | ) | |||||||
| Three Months Ended September 30, | 2020 vs | ||||||||||||||||||||||||||||||||||
| 2020 | 2019 | 2019 | |||||||||||||||||||||||||||||||||
| Net interest income | |||||||||||||||||||||||||||||||||||
| Interest income | $ | 54,621 | $ | 82,251 | $ | (27,630) | |||||||||||||||||||||||||||||
| Interest expense | 56,398 | 51,397 | 5,001 | ||||||||||||||||||||||||||||||||
| Net interest income | (1,777) | 30,854 | (32,631) | ||||||||||||||||||||||||||||||||
| Provision for/(release of) loan loss reserves | (2,512) | — | (2,512) | ||||||||||||||||||||||||||||||||
| Net interest income (expense) after provision for/(release of) loan losses | 735 | 30,854 | (30,119) | ||||||||||||||||||||||||||||||||
| Other income (loss) | |||||||||||||||||||||||||||||||||||
| Operating lease income | 25,464 | 24,405 | 1,059 | ||||||||||||||||||||||||||||||||
| Sale of loans, net | 1,127 | 11,247 | (10,120) | ||||||||||||||||||||||||||||||||
| Realized gain (loss) on securities | (303) | 3,396 | (3,699) | ||||||||||||||||||||||||||||||||
| Unrealized gain (loss) on equity securities | — | 254 | (254) | ||||||||||||||||||||||||||||||||
| Unrealized gain (loss) on Agency interest-only securities | 9 | 16 | (7) | ||||||||||||||||||||||||||||||||
| Realized gain (loss) on sale of real estate, net | 21,588 | 2,082 | 19,506 | ||||||||||||||||||||||||||||||||
| Fee and other income | 3,051 | 5,166 | (2,115) | ||||||||||||||||||||||||||||||||
| Net result from derivative transactions | 260 | (9,465) | 9,725 | ||||||||||||||||||||||||||||||||
| Earnings (loss) from investment in unconsolidated joint ventures | 447 | 1,094 | (647) | ||||||||||||||||||||||||||||||||
| Gain (loss) on extinguishment/defeasance of debt | 1,167 | — | 1,167 | ||||||||||||||||||||||||||||||||
| Total other income (loss) | 52,810 | 38,195 | 14,615 | ||||||||||||||||||||||||||||||||
| Costs and expenses | |||||||||||||||||||||||||||||||||||
| Salaries and employee benefits | 7,858 | 14,319 | (6,461) | ||||||||||||||||||||||||||||||||
| Operating expenses | 3,938 | 5,314 | (1,376) | ||||||||||||||||||||||||||||||||
| Real estate operating expenses | 8,060 | 6,270 | 1,790 | ||||||||||||||||||||||||||||||||
| Fee expense | 2,476 | 2,056 | 420 | ||||||||||||||||||||||||||||||||
| Depreciation and amortization | 9,817 | 9,030 | 787 | ||||||||||||||||||||||||||||||||
| Total costs and expenses | 32,149 | 36,989 | (4,840) | ||||||||||||||||||||||||||||||||
| Income (loss) before taxes | 21,396 | 32,060 | (10,664) | ||||||||||||||||||||||||||||||||
| Income tax expense (benefit) | 14 | 1,112 | (1,098) | ||||||||||||||||||||||||||||||||
| Net income (loss) | $ | 21,382 | $ | 30,948 | $ | (9,566) | |||||||||||||||||||||||||||||
• |
| Nine Months Ended September 30, | 2019 vs | Nine Months Ended September 30, | 2020 vs | |||||||||||||||||||||||||||||||||||||||||||
| 2019 | 2018 | 2018 | 2020 | 2019 | 2019 | |||||||||||||||||||||||||||||||||||||||||
| Net interest income | Net interest income | |||||||||||||||||||||||||||||||||||||||||||||
| Interest income | $ | 254,040 | $ | 253,822 | $ | 218 | Interest income | $ | 189,306 | $ | 254,040 | $ | (64,734) | |||||||||||||||||||||||||||||||||
| Interest expense | 155,015 | 144,606 | 10,409 | Interest expense | 176,225 | 155,015 | 21,210 | |||||||||||||||||||||||||||||||||||||||
| Net interest income | 99,025 | 109,216 | (10,191 | ) | Net interest income | 13,081 | 99,025 | (85,944) | ||||||||||||||||||||||||||||||||||||||
| Provision for loan losses | 600 | 13,600 | (13,000 | ) | ||||||||||||||||||||||||||||||||||||||||||
| Net interest income after provision for loan losses | 98,425 | 95,616 | 2,809 | |||||||||||||||||||||||||||||||||||||||||||
| Provision for/(release of) loan loss reserves | Provision for/(release of) loan loss reserves | 23,340 | 600 | 22,740 | ||||||||||||||||||||||||||||||||||||||||||
| Net interest income (expense) after provision for/(release of) loan losses | Net interest income (expense) after provision for/(release of) loan losses | (10,259) | 98,425 | (108,684) | ||||||||||||||||||||||||||||||||||||||||||
| Other income (loss) | Other income (loss) | |||||||||||||||||||||||||||||||||||||||||||||
| Operating lease income | 81,106 | 79,306 | 1,800 | Operating lease income | 75,565 | 81,106 | (5,541) | |||||||||||||||||||||||||||||||||||||||
| Sale of loans, net | 38,589 | 12,893 | 25,696 | Sale of loans, net | 1,387 | 38,589 | (37,202) | |||||||||||||||||||||||||||||||||||||||
| Realized gain (loss) on securities | 10,726 | (4,896 | ) | 15,622 | Realized gain (loss) on securities | (12,089) | 10,726 | (22,815) | ||||||||||||||||||||||||||||||||||||||
| Unrealized gain (loss) on equity securities | 1,341 | — | 1,341 | Unrealized gain (loss) on equity securities | (132) | 1,341 | (1,473) | |||||||||||||||||||||||||||||||||||||||
| Unrealized gain (loss) on Agency interest-only securities | 38 | 456 | (418 | ) | Unrealized gain (loss) on Agency interest-only securities | 183 | 38 | 145 | ||||||||||||||||||||||||||||||||||||||
| Realized gain (loss) on sale of real estate, net | 963 | 96,341 | (95,378 | ) | Realized gain (loss) on sale of real estate, net | 32,116 | 963 | 31,153 | ||||||||||||||||||||||||||||||||||||||
| Impairment of real estate | (1,350 | ) | — | (1,350 | ) | Impairment of real estate | — | (1,350) | 1,350 | |||||||||||||||||||||||||||||||||||||
| Fee and other income | 17,047 | 17,579 | (532 | ) | Fee and other income | 8,075 | 17,047 | (8,972) | ||||||||||||||||||||||||||||||||||||||
| Net result from derivative transactions | (35,956 | ) | 29,156 | (65,112 | ) | Net result from derivative transactions | (15,988) | (35,956) | 19,968 | |||||||||||||||||||||||||||||||||||||
| Earnings (loss) from investment in unconsolidated joint ventures | 3,617 | 466 | 3,151 | Earnings (loss) from investment in unconsolidated joint ventures | 1,359 | 3,617 | (2,258) | |||||||||||||||||||||||||||||||||||||||
| Gain (loss) on extinguishment/defeasance of debt | (1,070 | ) | (4,392 | ) | 3,322 | Gain (loss) on extinguishment/defeasance of debt | 22,244 | (1,070) | 23,314 | |||||||||||||||||||||||||||||||||||||
| Total other income (loss) | 115,051 | 226,909 | (111,858 | ) | Total other income (loss) | 112,720 | 115,051 | (2,331) | ||||||||||||||||||||||||||||||||||||||
| Costs and expenses | Costs and expenses | |||||||||||||||||||||||||||||||||||||||||||||
| Salaries and employee benefits | 52,800 | 46,754 | 6,046 | Salaries and employee benefits | 31,880 | 52,800 | (20,920) | |||||||||||||||||||||||||||||||||||||||
| Operating expenses | 16,727 | 16,608 | 119 | Operating expenses | 15,957 | 16,727 | (770) | |||||||||||||||||||||||||||||||||||||||
| Real estate operating expenses | 17,776 | 23,806 | (6,030 | ) | Real estate operating expenses | 22,041 | 17,776 | 4,265 | ||||||||||||||||||||||||||||||||||||||
| Fee expense | 4,951 | 2,953 | 1,998 | Fee expense | 5,892 | 4,951 | 941 | |||||||||||||||||||||||||||||||||||||||
| Depreciation and amortization | 29,192 | 31,896 | (2,704 | ) | Depreciation and amortization | 29,642 | 29,192 | 450 | ||||||||||||||||||||||||||||||||||||||
| Total costs and expenses | 121,446 | 122,017 | (571 | ) | Total costs and expenses | 105,412 | 121,446 | (16,034) | ||||||||||||||||||||||||||||||||||||||
| Income (loss) before taxes | 92,030 | 200,508 | (108,478 | ) | Income (loss) before taxes | (2,951) | 92,030 | (94,981) | ||||||||||||||||||||||||||||||||||||||
| Income tax expense (benefit) | 478 | 5,679 | (5,201 | ) | Income tax expense (benefit) | (5,078) | 478 | (5,556) | ||||||||||||||||||||||||||||||||||||||
| Net income (loss) | 91,552 | 194,829 | (103,277 | ) | Net income (loss) | $ | 2,127 | $ | 91,552 | $ | (89,425) | |||||||||||||||||||||||||||||||||||
•A ($5.6 million) increase in income tax expense (benefit) compared to the prior year, primarily attributable to a decrease in forecasted GAAP income in our TRSs. |
| Nine Months Ended September 30, | |||||||
| 2019 | 2018 | ||||||
| Net cash provided by (used in) operating activities | $ | 64,245 | $ | (51,339 | ) | ||
| Net cash provided by (used in) investing activities | (285,759 | ) | (320,031 | ) | |||
| Net cash provided by (used in) financing activities | 244,817 | 273,600 | |||||
| Net increase (decrease) in cash and cash equivalents | $ | 23,303 | $ | (97,770 | ) | ||
| September 30, 2019 | December 31, 2018 | ||||||
| Committed loan repurchase facilities | $ | 760,521 | $ | 497,531 | |||
| Committed securities repurchase facility | 85,457 | — | |||||
| Uncommitted securities repurchase facilities | 940,070 | 166,154 | |||||
| Total repurchase facilities | 1,786,048 | 663,685 | |||||
| Revolving credit facility | — | — | |||||
| Mortgage loan financing(1) | 723,313 | 743,902 | |||||
| CLO debt(2) | 117,760 | 601,543 | |||||
| Participation financing - mortgage loan receivable | — | 2,453 | |||||
| Borrowings from the FHLB | 1,076,449 | 1,286,000 | |||||
| Senior unsecured notes(3) | 1,157,117 | 1,154,991 | |||||
| Total debt obligations, net | $ | 4,860,687 | $ | 4,452,574 | |||
| Three Months Ended September 30, | 2020 vs | ||||||||||||||||||||||||||||||||||
| 2020 | 2019 | 2019 | |||||||||||||||||||||||||||||||||
| Net interest income | |||||||||||||||||||||||||||||||||||
| Interest income | $ | 54,621 | $ | 82,251 | $ | (27,630) | |||||||||||||||||||||||||||||
| Interest expense | 56,398 | 51,397 | 5,001 | ||||||||||||||||||||||||||||||||
| Net interest income | (1,777) | 30,854 | (32,631) | ||||||||||||||||||||||||||||||||
| Provision for/(release of) loan loss reserves | (2,512) | — | (2,512) | ||||||||||||||||||||||||||||||||
| Net interest income (expense) after provision for/(release of) loan losses | 735 | 30,854 | (30,119) | ||||||||||||||||||||||||||||||||
| Other income (loss) | |||||||||||||||||||||||||||||||||||
| Operating lease income | 25,464 | 24,405 | 1,059 | ||||||||||||||||||||||||||||||||
| Sale of loans, net | 1,127 | 11,247 | (10,120) | ||||||||||||||||||||||||||||||||
| Realized gain (loss) on securities | (303) | 3,396 | (3,699) | ||||||||||||||||||||||||||||||||
| Unrealized gain (loss) on equity securities | — | 254 | (254) | ||||||||||||||||||||||||||||||||
| Unrealized gain (loss) on Agency interest-only securities | 9 | 16 | (7) | ||||||||||||||||||||||||||||||||
| Realized gain (loss) on sale of real estate, net | 21,588 | 2,082 | 19,506 | ||||||||||||||||||||||||||||||||
| Fee and other income | 3,051 | 5,166 | (2,115) | ||||||||||||||||||||||||||||||||
| Net result from derivative transactions | 260 | (9,465) | 9,725 | ||||||||||||||||||||||||||||||||
| Earnings (loss) from investment in unconsolidated joint ventures | 447 | 1,094 | (647) | ||||||||||||||||||||||||||||||||
| Gain (loss) on extinguishment/defeasance of debt | 1,167 | — | 1,167 | ||||||||||||||||||||||||||||||||
| Total other income (loss) | 52,810 | 38,195 | 14,615 | ||||||||||||||||||||||||||||||||
| Costs and expenses | |||||||||||||||||||||||||||||||||||
| Salaries and employee benefits | 7,858 | 14,319 | (6,461) | ||||||||||||||||||||||||||||||||
| Operating expenses | 3,938 | 5,314 | (1,376) | ||||||||||||||||||||||||||||||||
| Real estate operating expenses | 8,060 | 6,270 | 1,790 | ||||||||||||||||||||||||||||||||
| Fee expense | 2,476 | 2,056 | 420 | ||||||||||||||||||||||||||||||||
| Depreciation and amortization | 9,817 | 9,030 | 787 | ||||||||||||||||||||||||||||||||
| Total costs and expenses | 32,149 | 36,989 | (4,840) | ||||||||||||||||||||||||||||||||
| Income (loss) before taxes | 21,396 | 32,060 | (10,664) | ||||||||||||||||||||||||||||||||
| Income tax expense (benefit) | 14 | 1,112 | (1,098) | ||||||||||||||||||||||||||||||||
| Net income (loss) | $ | 21,382 | $ | 30,948 | $ | (9,566) | |||||||||||||||||||||||||||||
| Nine Months Ended September 30, | 2020 vs | ||||||||||||||||||||||||||||||||||
| 2020 | 2019 | 2019 | |||||||||||||||||||||||||||||||||
| Net interest income | |||||||||||||||||||||||||||||||||||
| Interest income | $ | 189,306 | $ | 254,040 | $ | (64,734) | |||||||||||||||||||||||||||||
| Interest expense | 176,225 | 155,015 | 21,210 | ||||||||||||||||||||||||||||||||
| Net interest income | 13,081 | 99,025 | (85,944) | ||||||||||||||||||||||||||||||||
| Provision for/(release of) loan loss reserves | 23,340 | 600 | 22,740 | ||||||||||||||||||||||||||||||||
| Net interest income (expense) after provision for/(release of) loan losses | (10,259) | 98,425 | (108,684) | ||||||||||||||||||||||||||||||||
| Other income (loss) | |||||||||||||||||||||||||||||||||||
| Operating lease income | 75,565 | 81,106 | (5,541) | ||||||||||||||||||||||||||||||||
| Sale of loans, net | 1,387 | 38,589 | (37,202) | ||||||||||||||||||||||||||||||||
| Realized gain (loss) on securities | (12,089) | 10,726 | (22,815) | ||||||||||||||||||||||||||||||||
| Unrealized gain (loss) on equity securities | (132) | 1,341 | (1,473) | ||||||||||||||||||||||||||||||||
| Unrealized gain (loss) on Agency interest-only securities | 183 | 38 | 145 | ||||||||||||||||||||||||||||||||
| Realized gain (loss) on sale of real estate, net | 32,116 | 963 | 31,153 | ||||||||||||||||||||||||||||||||
| Impairment of real estate | — | (1,350) | 1,350 | ||||||||||||||||||||||||||||||||
| Fee and other income | 8,075 | 17,047 | (8,972) | ||||||||||||||||||||||||||||||||
| Net result from derivative transactions | (15,988) | (35,956) | 19,968 | ||||||||||||||||||||||||||||||||
| Earnings (loss) from investment in unconsolidated joint ventures | 1,359 | 3,617 | (2,258) | ||||||||||||||||||||||||||||||||
| Gain (loss) on extinguishment/defeasance of debt | 22,244 | (1,070) | 23,314 | ||||||||||||||||||||||||||||||||
| Total other income (loss) | 112,720 | 115,051 | (2,331) | ||||||||||||||||||||||||||||||||
| Costs and expenses | |||||||||||||||||||||||||||||||||||
| Salaries and employee benefits | 31,880 | 52,800 | (20,920) | ||||||||||||||||||||||||||||||||
| Operating expenses | 15,957 | 16,727 | (770) | ||||||||||||||||||||||||||||||||
| Real estate operating expenses | 22,041 | 17,776 | 4,265 | ||||||||||||||||||||||||||||||||
| Fee expense | 5,892 | 4,951 | 941 | ||||||||||||||||||||||||||||||||
| Depreciation and amortization | 29,642 | 29,192 | 450 | ||||||||||||||||||||||||||||||||
| Total costs and expenses | 105,412 | 121,446 | (16,034) | ||||||||||||||||||||||||||||||||
| Income (loss) before taxes | (2,951) | 92,030 | (94,981) | ||||||||||||||||||||||||||||||||
| Income tax expense (benefit) | (5,078) | 478 | (5,556) | ||||||||||||||||||||||||||||||||
| Net income (loss) | $ | 2,127 | $ | 91,552 | $ | (89,425) | |||||||||||||||||||||||||||||
| Collateralized Borrowings Under Repurchase Agreements (1) | ||||||||||||
| Quarter Ended | Quarter-end balance | Average quarterly balance | Maximum balance of any month-end | |||||||||
| September 30, 2016 | $ | 1,458,327 | $ | 1,393,122 | $ | 1,468,013 | ||||||
| December 31, 2016 | 1,107,185 | 1,397,061 | 1,555,941 | |||||||||
| March 31, 2017 | 1,039,356 | 1,073,893 | 1,119,863 | |||||||||
| June 30, 2017 | 1,149,605 | 1,264,948 | 1,373,953 | |||||||||
| September 30, 2017 | 913,137 | 1,126,201 | 1,301,334 | |||||||||
| December 31, 2017 | 473,410 | 739,721 | 892,081 | |||||||||
| March 31, 2018 | 754,377 | 721,139 | 773,383 | |||||||||
| June 30, 2018 | 819,962 | 787,568 | 819,962 | |||||||||
| September 30, 2018 | 973,616 | 934,554 | 973,616 | |||||||||
| December 31, 2018 | 663,686 | 735,350 | 820,080 | |||||||||
| March 31, 2019 | 1,030,082 | 968,984 | 1,030,082 | |||||||||
| June 30, 2019 | 1,267,371 | 1,221,388 | 1,300,175 | |||||||||
| September 30, 2019 | 1,786,048 | 1,599,183 | 1,786,048 | |||||||||
| Three Months Ended September 30, | 2020 vs | ||||||||||||||||||||||||||||||||||
| 2020 | 2019 | 2019 | |||||||||||||||||||||||||||||||||
| Net interest income | |||||||||||||||||||||||||||||||||||
| Interest income | $ | 54,621 | $ | 82,251 | $ | (27,630) | |||||||||||||||||||||||||||||
| Interest expense | 56,398 | 51,397 | 5,001 | ||||||||||||||||||||||||||||||||
| Net interest income | (1,777) | 30,854 | (32,631) | ||||||||||||||||||||||||||||||||
| Provision for/(release of) loan loss reserves | (2,512) | — | (2,512) | ||||||||||||||||||||||||||||||||
| Net interest income (expense) after provision for/(release of) loan losses | 735 | 30,854 | (30,119) | ||||||||||||||||||||||||||||||||
| Other income (loss) | |||||||||||||||||||||||||||||||||||
| Operating lease income | 25,464 | 24,405 | 1,059 | ||||||||||||||||||||||||||||||||
| Sale of loans, net | 1,127 | 11,247 | (10,120) | ||||||||||||||||||||||||||||||||
| Realized gain (loss) on securities | (303) | 3,396 | (3,699) | ||||||||||||||||||||||||||||||||
| Unrealized gain (loss) on equity securities | — | 254 | (254) | ||||||||||||||||||||||||||||||||
| Unrealized gain (loss) on Agency interest-only securities | 9 | 16 | (7) | ||||||||||||||||||||||||||||||||
| Realized gain (loss) on sale of real estate, net | 21,588 | 2,082 | 19,506 | ||||||||||||||||||||||||||||||||
| Fee and other income | 3,051 | 5,166 | (2,115) | ||||||||||||||||||||||||||||||||
| Net result from derivative transactions | 260 | (9,465) | 9,725 | ||||||||||||||||||||||||||||||||
| Earnings (loss) from investment in unconsolidated joint ventures | 447 | 1,094 | (647) | ||||||||||||||||||||||||||||||||
| Gain (loss) on extinguishment/defeasance of debt | 1,167 | — | 1,167 | ||||||||||||||||||||||||||||||||
| Total other income (loss) | 52,810 | 38,195 | 14,615 | ||||||||||||||||||||||||||||||||
| Costs and expenses | |||||||||||||||||||||||||||||||||||
| Salaries and employee benefits | 7,858 | 14,319 | (6,461) | ||||||||||||||||||||||||||||||||
| Operating expenses | 3,938 | 5,314 | (1,376) | ||||||||||||||||||||||||||||||||
| Real estate operating expenses | 8,060 | 6,270 | 1,790 | ||||||||||||||||||||||||||||||||
| Fee expense | 2,476 | 2,056 | 420 | ||||||||||||||||||||||||||||||||
| Depreciation and amortization | 9,817 | 9,030 | 787 | ||||||||||||||||||||||||||||||||
| Total costs and expenses | 32,149 | 36,989 | (4,840) | ||||||||||||||||||||||||||||||||
| Income (loss) before taxes | 21,396 | 32,060 | (10,664) | ||||||||||||||||||||||||||||||||
| Income tax expense (benefit) | 14 | 1,112 | (1,098) | ||||||||||||||||||||||||||||||||
| Net income (loss) | $ | 21,382 | $ | 30,948 | $ | (9,566) | |||||||||||||||||||||||||||||
| Nine Months Ended September 30, | 2020 vs | ||||||||||||||||||||||||||||||||||
| 2020 | 2019 | 2019 | |||||||||||||||||||||||||||||||||
| Net interest income | |||||||||||||||||||||||||||||||||||
| Interest income | $ | 189,306 | $ | 254,040 | $ | (64,734) | |||||||||||||||||||||||||||||
| Interest expense | 176,225 | 155,015 | 21,210 | ||||||||||||||||||||||||||||||||
| Net interest income | 13,081 | 99,025 | (85,944) | ||||||||||||||||||||||||||||||||
| Provision for/(release of) loan loss reserves | 23,340 | 600 | 22,740 | ||||||||||||||||||||||||||||||||
| Net interest income (expense) after provision for/(release of) loan losses | (10,259) | 98,425 | (108,684) | ||||||||||||||||||||||||||||||||
| Other income (loss) | |||||||||||||||||||||||||||||||||||
| Operating lease income | 75,565 | 81,106 | (5,541) | ||||||||||||||||||||||||||||||||
| Sale of loans, net | 1,387 | 38,589 | (37,202) | ||||||||||||||||||||||||||||||||
| Realized gain (loss) on securities | (12,089) | 10,726 | (22,815) | ||||||||||||||||||||||||||||||||
| Unrealized gain (loss) on equity securities | (132) | 1,341 | (1,473) | ||||||||||||||||||||||||||||||||
| Unrealized gain (loss) on Agency interest-only securities | 183 | 38 | 145 | ||||||||||||||||||||||||||||||||
| Realized gain (loss) on sale of real estate, net | 32,116 | 963 | 31,153 | ||||||||||||||||||||||||||||||||
| Impairment of real estate | — | (1,350) | 1,350 | ||||||||||||||||||||||||||||||||
| Fee and other income | 8,075 | 17,047 | (8,972) | ||||||||||||||||||||||||||||||||
| Net result from derivative transactions | (15,988) | (35,956) | 19,968 | ||||||||||||||||||||||||||||||||
| Earnings (loss) from investment in unconsolidated joint ventures | 1,359 | 3,617 | (2,258) | ||||||||||||||||||||||||||||||||
| Gain (loss) on extinguishment/defeasance of debt | 22,244 | (1,070) | 23,314 | ||||||||||||||||||||||||||||||||
| Total other income (loss) | 112,720 | 115,051 | (2,331) | ||||||||||||||||||||||||||||||||
| Costs and expenses | |||||||||||||||||||||||||||||||||||
| Salaries and employee benefits | 31,880 | 52,800 | (20,920) | ||||||||||||||||||||||||||||||||
| Operating expenses | 15,957 | 16,727 | (770) | ||||||||||||||||||||||||||||||||
| Real estate operating expenses | 22,041 | 17,776 | 4,265 | ||||||||||||||||||||||||||||||||
| Fee expense | 5,892 | 4,951 | 941 | ||||||||||||||||||||||||||||||||
| Depreciation and amortization | 29,642 | 29,192 | 450 | ||||||||||||||||||||||||||||||||
| Total costs and expenses | 105,412 | 121,446 | (16,034) | ||||||||||||||||||||||||||||||||
| Income (loss) before taxes | (2,951) | 92,030 | (94,981) | ||||||||||||||||||||||||||||||||
| Income tax expense (benefit) | (5,078) | 478 | (5,556) | ||||||||||||||||||||||||||||||||
| Net income (loss) | $ | 2,127 | $ | 91,552 | $ | (89,425) | |||||||||||||||||||||||||||||
| Nine Months Ended September 30, | |||||||||||||||||
| 2020 | 2019 | ||||||||||||||||
| Net cash provided by (used in) operating activities | $ | 88,009 | $ | 64,245 | |||||||||||||
| Net cash provided by (used in) investing activities | 690,478 | (285,759) | |||||||||||||||
| Net cash provided by (used in) financing activities | (216,497) | 244,817 | |||||||||||||||
| Net increase (decrease) in cash, cash equivalents and restricted cash | $ | 561,990 | $ | 23,303 | |||||||||||||
| Shares | Amount(1) | ||||||
| Authorizations remaining as of December 31, 2018 | $ | 41,769 | |||||
| Additional authorizations | — | ||||||
| Repurchases paid | 40,065 | (637 | ) | ||||
| Repurchases unsettled | — | ||||||
| Authorizations remaining as of September 30, 2019 | $ | 41,132 | |||||
| Shares | Amount(1) | ||||||
| Authorizations remaining as of December 31, 2017 | $ | 41,769 | |||||
| Additional authorizations | — | ||||||
| Repurchases paid | — | — | |||||
| Repurchases unsettled | — | ||||||
| Authorizations remaining as of September 30, 2018 | $ | 41,769 | |||||
| Declaration Date | Dividend per Share | |||
| February 27, 2019 | $ | 0.340 | ||
| May 30, 2019 | 0.340 | |||
| August 22, 2019 | 0.340 | |||
| Total | $ | 1.020 | ||
| February 27, 2018 | $ | 0.315 | ||
| May 30, 2018 | 0.325 | |||
| September 5, 2018 | 0.325 | |||
| Total | $ | 0.965 | ||
| Contractual Obligations | |||||||||||||||||||
| Less than 1 Year | 1-3 Years | 3-5 Years | More than 5 Years | Total | |||||||||||||||
| Secured financings | $ | 1,586,058 | (1) | $ | 1,223,774 | $ | 519,246 | $ | 369,924 | $ | 3,699,002 | ||||||||
| Senior unsecured notes | — | 766,201 | — | 400,000 | 1,166,201 | ||||||||||||||
| Interest payable(2) | 123,167 | 158,852 | 44,805 | 31,500 | 358,324 | ||||||||||||||
| Other funding obligations(3) | 257,725 | — | — | — | 257,725 | ||||||||||||||
| Payments pursuant to tax receivable agreement | 104 | 208 | 208 | 1,039 | 1,559 | ||||||||||||||
| Operating lease obligations | 604 | 2,361 | 98 | — | 3,063 | ||||||||||||||
| Total | $ | 1,967,658 | $ | 2,151,396 | $ | 564,357 | $ | 802,463 | $ | 5,485,874 | |||||||||
| Contractual Obligations | |||||||||||||||||||||||||||||
| Less than 1 Year | 1-3 Years | 3-5 Years | More than 5 Years | Total | |||||||||||||||||||||||||
| Secured financings | $ | 1,279,571 | (1) | $ | 545,113 | $ | 671,292 | $ | 263,895 | $ | 2,759,871 | ||||||||||||||||||
| Unsecured revolving credit facility | 266,430 | (1) | — | — | — | 266,430 | |||||||||||||||||||||||
| Senior unsecured notes | — | 717,200 | — | 999,794 | 1,716,994 | ||||||||||||||||||||||||
| Interest payable(2) | 131,649 | 133,590 | 91,977 | 50,689 | 407,905 | ||||||||||||||||||||||||
| Other funding obligations(3) | 227,019 | — | — | — | 227,019 | ||||||||||||||||||||||||
| Payments pursuant to tax receivable agreement | 104 | 208 | 208 | 1,039 | 1,559 | ||||||||||||||||||||||||
| Operating lease obligations | 295 | 1,279 | — | — | 1,574 | ||||||||||||||||||||||||
| Total | $ | 1,905,068 | $ | 1,397,390 | $ | 763,477 | $ | 1,315,417 | $ | 5,381,352 | |||||||||||||||||||
| Three Months Ended September 30, | Nine Months Ended September 30, | ||||||||||||||||||||||||||||||||||
| 2020 | 2019 | 2020 | 2019 | ||||||||||||||||||||||||||||||||
| Income (loss) before taxes | $ | 21,396 | $ | 32,060 | $ | (2,951) | $ | 92,030 | |||||||||||||||||||||||||||
| Net (income) loss attributable to noncontrolling interest in consolidated joint ventures (GAAP)(1) | (4,153) | (71) | (5,429) | 667 | |||||||||||||||||||||||||||||||
| Our share of real estate depreciation, amortization and gain adjustments(2)(3) | 4,534 | 6,741 | 14,782 | 18,999 | |||||||||||||||||||||||||||||||
| Adjustments for unrecognized derivative results(4) | (4,222) | 1,889 | 4,737 | 13,191 | |||||||||||||||||||||||||||||||
| Unrealized (gain) loss on fair value securities | (9) | (248) | (146) | (1,475) | |||||||||||||||||||||||||||||||
| Adjustment for economic gain on loan sales not recognized under GAAP for which risk has been substantially transferred, net of reversal/amortization | 547 | (168) | 502 | (817) | |||||||||||||||||||||||||||||||
| Adjustment for CECL reserves | (2,512) | — | 15,340 | — | |||||||||||||||||||||||||||||||
| Non-cash stock-based compensation | 4,125 | 3,918 | 19,557 | 19,383 | |||||||||||||||||||||||||||||||
| Transactional adjustments (response to COVID-19)(5) | — | — | 16,939 | — | |||||||||||||||||||||||||||||||
| Core earnings | $ | 19,706 | $ | 44,121 | $ | 63,331 | $ | 141,978 | |||||||||||||||||||||||||||
| Three Months Ended September 30, | Nine Months Ended September 30, | |||||||||||||||
| 2019 | 2018 | 2019 | 2018 | |||||||||||||
| Income (loss) before taxes | $ | 32,060 | $ | 84,668 | $ | 92,030 | $ | 200,508 | ||||||||
| Net (income) loss attributable to noncontrolling interest in consolidated joint ventures and operating partnership (GAAP)(1) | (71 | ) | (7,851 | ) | 667 | (16,155 | ) | |||||||||
| Our share of real estate depreciation, amortization and gain adjustments(2)(3) | 6,741 | (12,435 | ) | 18,999 | 2,398 | |||||||||||
| Adjustments for unrecognized derivative results(4) | 1,889 | (3,614 | ) | 13,191 | (16,320 | ) | ||||||||||
| Unrealized (gain) loss on fair value securities | (248 | ) | (142 | ) | (1,475 | ) | (456 | ) | ||||||||
| Adjustment for economic gain on securitization transactions not recognized under GAAP for which risk has been substantially transferred, net of reversal/amortization | (168 | ) | 7 | (817 | ) | (530 | ) | |||||||||
| Non-cash stock-based compensation | 3,918 | 2,763 | 19,383 | 8,186 | ||||||||||||
| Core earnings | $ | 44,121 | $ | 63,396 | $ | 141,978 | $ | 177,631 | ||||||||
| (2) | The following is a reconciliation of GAAP depreciation and amortization to our share of real estate depreciation, amortization and gain adjustments presented in the computation of core earnings in the preceding table ($ in thousands): | ||||||||||||||||||||||||||||||||||
| Three Months Ended September 30, | Nine Months Ended September 30, | ||||||||||||||||||||||||||||||||||
| 2020 | 2019 | 2020 | 2019 | ||||||||||||||||||||||||||||||||
| Total GAAP depreciation and amortization | $ | 9,817 | $ | 9,030 | $ | 29,642 | $ | 29,192 | |||||||||||||||||||||||||||
| Less: Depreciation and amortization related to non-rental property fixed assets | (25) | (25) | (74) | (74) | |||||||||||||||||||||||||||||||
| Less: Non-controlling interest in consolidated joint ventures’ share of accumulated depreciation and amortization and unrecognized passive interest in unconsolidated joint ventures | (348) | (417) | (1,290) | (2,392) | |||||||||||||||||||||||||||||||
| Our share of real estate depreciation and amortization | 9,444 | 8,588 | 28,278 | 26,726 | |||||||||||||||||||||||||||||||
| Realized gain from accumulated depreciation and amortization on real estate sold (see below) | (4,897) | (1,418) | (14,576) | (6,839) | |||||||||||||||||||||||||||||||
| Less: Non-controlling interest in consolidated joint ventures’ share of accumulated depreciation and amortization on real estate sold | 520 | 41 | 2,667 | 83 | |||||||||||||||||||||||||||||||
| Our share of accumulated depreciation and amortization on real estate sold | (4,377) | (1,377) | (11,909) | (6,756) | |||||||||||||||||||||||||||||||
| Less: Operating lease income on above/below market lease intangible amortization | (533) | (470) | (1,587) | (971) | |||||||||||||||||||||||||||||||
| Our share of real estate depreciation, amortization and gain adjustments | $ | 4,534 | $ | 6,741 | $ | 14,782 | $ | 18,999 | |||||||||||||||||||||||||||
| GAAP gains/losses on sales of real estate include the effects of previously recognized real estate depreciation and amortization. For purposes of core earnings, our share of real estate depreciation and amortization is eliminated and, accordingly, the resultant gain/losses also must be adjusted. Following is a reconciliation of the related consolidated GAAP amounts to the amounts reflected in core earnings ($ in thousands): | |||||||||||||||||||||||||||||||||||
| Three Months Ended September 30, | Nine Months Ended September 30, | ||||||||||||||||||||||||||||||||||
| 2020 | 2019 | 2020 | 2019 | ||||||||||||||||||||||||||||||||
| GAAP realized gain (loss) on sale of real estate, net | $ | 21,588 | $ | 2,082 | $ | 32,116 | $ | 963 | |||||||||||||||||||||||||||
| Adjusted gain/loss on sale of real estate for purposes of core earnings | (17,211) | $ | (705) | (20,207) | 5,793 | ||||||||||||||||||||||||||||||
| Our share of accumulated depreciation and amortization on real estate sold | $ | 4,377 | $ | 1,377 | $ | 11,909 | $ | 6,756 | |||||||||||||||||||||||||||
| (3) | As more fully discussed in Note 5, Real Estate and Related Intangibles, Net, Note 7, Debt Obligations, Net and Note 15, Fair Value of Financial Instruments to the Company’s Consolidated Financial Statements for the three months ended March 31, 2019, the Company recognized $5.7 million of operating lease income from prepayment of a lease, a $1.1 million loss on extinguishment of debt and a $1.4 million impairment of real estate related to a single-tenant two-story office building in Wayne, NJ. This property was sold on May 1, 2019. For core earnings, the Company recognizes the net impact of these events in the period the sale was realized. Accordingly, the $3.3 million net impact of the income and losses discussed above were excluded from core earnings for the three months ended March 31, 2019 and have been included in core earnings for the nine months ended September 30, 2019. | ||||||||||||||||||||||||||||||||||
| The following is a reconciliation of GAAP net results from derivative transactions to our unrecognized derivative result presented in the computation of core earnings in the preceding table ($ in thousands): | |||||||||||||||||||||||||||||||||||||||||||||||||||
| (2) | The following is a reconciliation of GAAP depreciation and amortization to our share of real estate depreciation, amortization and gain adjustments presented in the computation of core earnings in the preceding table ($ in thousands): | ||||||||||||||||||||||||||||||||||||||||||||||||||
| Three Months Ended September 30, | Nine Months Ended September 30, | Three Months Ended September 30, | Nine Months Ended September 30, | ||||||||||||||||||||||||||||||||||||||||||||||||
| 2019 | 2018 | 2019 | 2018 | 2020 | 2019 | 2020 | 2019 | ||||||||||||||||||||||||||||||||||||||||||||
| Total GAAP depreciation and amortization | $ | 9,030 | $ | 10,417 | $ | 29,192 | $ | 31,896 | Net results from derivative transactions | $ | 260 | $ | (9,465) | $ | (15,988) | $ | (35,956) | ||||||||||||||||||||||||||||||||||
| Less: Depreciation and amortization related to non-rental property fixed assets | (25 | ) | (18 | ) | (74 | ) | (56 | ) | Hedging interest expense | 1,346 | 436 | 1,028 | 1,927 | ||||||||||||||||||||||||||||||||||||||
| Less: Non-controlling interest in consolidated joint ventures’ share of accumulated depreciation and amortization and unrecognized passive interest in unconsolidated joint ventures | (417 | ) | (1,076 | ) | (2,392 | ) | (2,447 | ) | Hedging realized result | 2,616 | 7,140 | 10,223 | 20,838 | ||||||||||||||||||||||||||||||||||||||
| Our share of real estate depreciation and amortization | 8,588 | 9,323 | 26,726 | 29,393 | Adjustments for unrecognized derivative results | $ | 4,222 | $ | (1,889) | $ | (4,737) | $ | (13,191) | ||||||||||||||||||||||||||||||||||||||
| (5) | (5) | The impact from COVID-19 included adjustments related to the unusual market conditions and actions taken by management including: (a) $6.7 million of losses from sales of performing first mortgage loans included in sale of loans, net, (b) $15.4 million of losses from sales of CMBS, (c) $3.7 million of loss from conduit loan sales, (d) $6.5 million of prepayment penalties related to pay downs of mark-to-market debt included in interest expense, (e) $2.1 million of professional fee expenses included in operating expenses and (f) $0.2 million of severance costs included in salaries and employee benefits. The $34.5 million total of the preceding amounts was partially offset by (g) $19.0 million of gains from the repurchase of and extinguishment of unsecured corporate bond debt at a discount from par, net of (h) $1.5 million of accelerated premium amortization included in interest expense. | |||||||||||||||||||||||||||||||||||||||||||||||||
| Realized gain from accumulated depreciation and amortization on real estate sold (see below) | (1,418 | ) | (22,066 | ) | (6,839 | ) | (27,553 | ) | |||||||||||||||||||||||||||||||||||||||||||
| Less: Non-controlling interest in consolidated joint ventures’ share of accumulated depreciation and amortization on real estate sold | 41 | 653 | 83 | 1,844 | |||||||||||||||||||||||||||||||||||||||||||||||
| Our share of accumulated depreciation and amortization on real estate sold | (1,377 | ) | (21,413 | ) | (6,756 | ) | (25,709 | ) | |||||||||||||||||||||||||||||||||||||||||||
| Less: Operating lease income on above/below market lease intangible amortization | (470 | ) | (345 | ) | (971 | ) | (1,286 | ) | |||||||||||||||||||||||||||||||||||||||||||
| Our share of real estate depreciation, amortization and gain adjustments | $ | 6,741 | $ | (12,435 | ) | $ | 18,999 | $ | 2,398 | ||||||||||||||||||||||||||||||||||||||||||
| GAAP gains/losses on sales of real estate include the effects of previously recognized real estate depreciation and amortization. For purposes of core earnings, our share of real estate depreciation and amortization is eliminated and, accordingly, the resultant gain/losses also must be adjusted. Following is a reconciliation of the related consolidated GAAP amounts to the amounts reflected in core earnings ($ in thousands): | ||||||||||||||||
| Three Months Ended September 30, | Nine Months Ended September 30, | |||||||||||||||
| 2019 | 2018 | 2019 | 2018 | |||||||||||||
| GAAP realized gain (loss) on sale of real estate, net | $ | 2,082 | $ | 63,704 | $ | 963 | $ | 96,341 | ||||||||
| Adjusted gain/loss on sale of real estate for purposes of core earnings | (705 | ) | $ | (42,291 | ) | 5,793 | (70,632 | ) | ||||||||
| Our share of accumulated depreciation and amortization on real estate sold | $ | 1,377 | $ | 21,413 | $ | 6,756 | $ | 25,709 | ||||||||
| (3) | As more fully discussed in Note 5, Real Estate and Related Intangibles, Net, Note 7, Debt Obligations, Net and Note 15, Fair Value of Financial Instruments to the Company’s Consolidated Financial Statements for the three months ended March 31, 2019, the Company recognized $5.7 million of operating lease income from prepayment of a lease, a $1.1 million loss on extinguishment of debt and a $1.4 million impairment of real estate related to a single-tenant two-story office building in Wayne, NJ. This property was sold on May 1, 2019. For core earnings, the Company recognizes the net impact of these events in the period the sale was realized. Accordingly, the $3.3 million net impact of the income and losses discussed above were excluded from core earnings for the three months ended March 31, 2019 and have been included in core earnings for the nine months ended September 30, 2019. | |||||||||||||||
| (4) | The following is a reconciliation of GAAP net results from derivative transactions to our unrecognized derivative result presented in the computation of core earnings in the preceding table ($ in thousands): | |||||||||||||||
| Three Months Ended September 30, | Nine Months Ended September 30, | |||||||||||||||
| 2019 | 2018 | 2019 | 2018 | |||||||||||||
| Net results from derivative transactions | $ | (9,465 | ) | $ | 7,115 | $ | (35,956 | ) | $ | 29,156 | ||||||
| Hedging interest expense | 436 | 1,365 | 1,927 | 5,789 | ||||||||||||
| Hedging realized result | 7,140 | (4,866 | ) | 20,838 | (18,625 | ) | ||||||||||
| Adjustments for unrecognized derivative results | $ | (1,889 | ) | $ | 3,614 | $ | (13,191 | ) | $ | 16,320 | ||||||
| Three Months Ended September 30, | Nine Months Ended September 30, | |||||||||||||||||||||||||||||||
| 2020 | 2019 | 2020 | 2019 | |||||||||||||||||||||||||||||
| Loss on sale of securities - COVID-19 related | $ | — | $ | — | $ | (14,670) | $ | — | ||||||||||||||||||||||||
| Hedge (loss) related to sale of securities, included in net results from derivative transactions | — | — | (698) | — | ||||||||||||||||||||||||||||
| Losses from sales of CMBS | $ | — | $ | — | $ | (15,368) | $ | — | ||||||||||||||||||||||||
| Three Months Ended September 30, | Nine Months Ended September 30, | |||||||||||||||||||||||||||||||
| 2020 | 2019 | 2020 | 2019 | |||||||||||||||||||||||||||||
| Income from sales of loans, net - COVID-19 related | $ | — | $ | — | $ | (1,680) | $ | — | ||||||||||||||||||||||||
| Hedge (loss) related to sales of loans, included in net results from derivative transactions | — | — | (1,994) | — | ||||||||||||||||||||||||||||
| Losses from conduit loan sales | $ | — | $ | — | $ | (3,674) | $ | — | ||||||||||||||||||||||||
| Three Months Ended September 30, | Nine Months Ended September 30, | |||||||||||||||
| 2019 | 2018 | 2019 | 2018 | |||||||||||||
| Number of loans | 10 | 13 | 46 | 80 | ||||||||||||
| Face amount of loans sold into securitizations | $ | 140,673 | $ | 101,978 | $ | 548,125 | $ | 939,314 | ||||||||
| Number of securitizations | 1 | 1 | 4 | 6 | ||||||||||||
| Income from sales of loans, net | $ | 11,247 | $ | 1,861 | $ | 38,589 | $ | 12,893 | ||||||||
| Realized losses on loans related to lower of cost or market adjustments | — | — | — | 463 | ||||||||||||
| Hedge gain/(loss) related to loans securitized(1) | (5,039 | ) | 453 | (15,371 | ) | 9,329 | ||||||||||
| Income from sales of securitized loans, net of hedging | 6,208 | 2,314 | 23,218 | 22,685 | ||||||||||||
| Adjustment for economic gain on securitization transactions not recognized under GAAP for which risk has been substantially transferred | 357 | 265 | 483 | 232 | ||||||||||||
| Core gain on sale of securitized loans | $ | 6,565 | $ | 2,579 | $ | 23,701 | $ | 22,917 | ||||||||
| Three Months Ended September 30, | Nine Months Ended September 30, | |||||||||||||||
| 2019 | 2018 | 2019 | 2018 | |||||||||||||
| Net results from derivative transactions | $ | (9,465 | ) | $ | 7,115 | $ | (35,956 | ) | $ | 29,156 | ||||||
| Hedge gain/(loss) related to lending and securities positions | 4,426 | (6,662 | ) | 20,585 | (19,827 | ) | ||||||||||
| Hedge gain/(loss) related to loans securitized | $ | (5,039 | ) | $ | 453 | $ | (15,371 | ) | $ | 9,329 | ||||||
| September 30, 2020 | December 31, 2019 | ||||||||||
| Debt obligations, net | $ | 4,714,510 | $ | 4,859,873 | |||||||
| Less: CLO debt | (281,625) | — | |||||||||
| Adjusted debt obligations | 4,432,885 | 4,859,873 | |||||||||
| Total equity | 1,521,794 | 1,638,977 | |||||||||
| Adjusted leverage | 2.9 | 3.0 | |||||||||
| September 30, 2019 | December 31, 2018 | ||||||
| Debt obligations, net | $ | 4,860,687 | $ | 4,452,574 | |||
| Less: CLO debt(1) | (117,760 | ) | (601,543 | ) | |||
| Adjusted debt obligations | 4,742,927 | 3,851,031 | |||||
| Total equity | 1,639,250 | 1,643,635 | |||||
| Adjusted leverage | 2.9 | 2.3 | |||||
| Three Months Ended September 30, | Nine Months Ended September 30, | |||||||||||||||
| 2019 | 2018 | 2019 | 2018 | |||||||||||||
| Interest expense | $ | (51,397 | ) | $ | (51,476 | ) | $ | (155,015 | ) | $ | (144,606 | ) | ||||
| Interest expense related to liability for transfers not considered sales(1) | — | — | 92 | — | ||||||||||||
| Net interest expense component of hedging activities(2) | (436 | ) | (1,365 | ) | (1,927 | ) | (5,789 | ) | ||||||||
| Cost of funds | $ | (51,833 | ) | $ | (52,841 | ) | $ | (156,850 | ) | $ | (150,395 | ) | ||||
| Interest income | $ | 82,251 | $ | 90,386 | $ | 254,040 | $ | 253,822 | ||||||||
| Interest income related to mortgage loans transferred but not considered sold(1) | — | — | (92 | ) | — | |||||||||||
| Cost of funds | (51,833 | ) | (52,841 | ) | (156,850 | ) | (150,395 | ) | ||||||||
| Interest income, net of cost of funds | $ | 30,418 | $ | 37,545 | $ | 97,098 | $ | 103,427 | ||||||||
| (1) | As more fully discussed in Note 4 to our consolidated financial statements, during the three months ended March 31, 2019, we sold a non-controlling loan interest in a first mortgage loan receivable to a third party. The sales proceeds were considered non-recourse secured borrowings, which were included in liability for transfers not considered sales in debt obligations, and the asset remained on the Company’s consolidated balance sheets as mortgage loans transferred but not considered sold. During the three months ended June 30, 2019, the controlling loan interest was sold, and as a result, the loan previously sold during the three months ended March 30, 2019 was accounted for as a sale during the six months ended June 30, 2019. The interest income and expense related to this asset and liability are included on our consolidated statements of income but should be excluded from the calculation of cost of funds. | |||||||||||||||
| Three Months Ended September 30, | Nine Months Ended September 30, | |||||||||||||||
| 2019 | 2018 | 2019 | 2018 | |||||||||||||
| (2) | Net result from derivative transactions | $ | (9,465 | ) | $ | 7,115 | $ | (35,956 | ) | $ | 29,156 | |||||
| Hedging realized result | 7,140 | (4,866 | ) | 20,838 | (18,625 | ) | ||||||||||
| Hedging unrecognized result | 1,889 | (3,614 | ) | 13,191 | (16,320 | ) | ||||||||||
| Net interest expense component of hedging activities | $ | (436 | ) | $ | (1,365 | ) | $ | (1,927 | ) | $ | (5,789 | ) | ||||
Projected change in net income(1) | Projected change in portfolio value | ||||||
| Change in interest rate: | |||||||
| Decrease by 1.00% | $ | (3,656 | ) | $ | 15,800 | ||
| Increase by 1.00% | 13,311 | (15,565 | ) | ||||
| Projected change in net income(1) | Projected change in portfolio value | ||||||||||
| Change in interest rate: | |||||||||||
| Decrease by 1.00% | $ | (3,124) | $ | 8,558 | |||||||
| Increase by 1.00% | 12,087 | (9,002) | |||||||||
| ISSUER PURCHASE OF EQUITY SECURITIES | ||||||||||||||
| Period | Total Number of Shares Purchased | Average Price Paid per Share | Total Number of Shares Purchased as Part of Publicly Announced Plans or Programs(1) | Approximate Dollar Value of Shares that May Yet Be Purchased Under the Plans or Programs | ||||||||||
| July 1, 2019 - July 31, 2019 | — | $ | — | — | $ | 41,132 | ||||||||
| August 1, 2019 - August 31, 2019 | — | — | — | 41,132 | ||||||||||
| September 1, 2019 - September 30, 2019 | — | — | — | 41,132 | ||||||||||
| Total | — | $ | — | — | $ | 41,132 | ||||||||
| ISSUER PURCHASE OF EQUITY SECURITIES | ||||||||||||||||||||||||||
| (a) | (b) | (c) | (d) | |||||||||||||||||||||||
| Period | Total Number of Shares Purchased | Average Price Paid per Share | Total Number of Shares Purchased as Part of Publicly Announced Plans or Programs(1) | Approximate Dollar Value of Shares that May Yet Be Purchased Under the Plans or Programs | ||||||||||||||||||||||
| July 1, 2020 - July 31, 2020 | — | — | — | 39,450 | ||||||||||||||||||||||
| August 1, 2020 - August 31, 2020 | 37,100 | 7.29 | 37,100 | 39,180 | ||||||||||||||||||||||
| September 1, 2020 - September 30, 2020 | 87,000 | 7.18 | 87,000 | 38,555 | ||||||||||||||||||||||
| Total | 124,100 | $ | 7.21 | 124,100 | $ | 38,555 | ||||||||||||||||||||
| EXHIBIT INDEX | ||||||||
| EXHIBIT NO. | DESCRIPTION | |||||||
32.1* | ||||||||
32.2* | ||||||||
| Cover Page Interactive Data File | ||||||||
| LADDER CAPITAL CORP | |||||||||||
| (Registrant) | |||||||||||
| Date: | By: | /s/ BRIAN HARRIS | |||||||||
| Brian Harris | |||||||||||
| Chief Executive Officer | |||||||||||
| Date: | By: | /s/ MARC FOX | |||||||||
| Marc Fox | |||||||||||
| Chief Financial Officer | |||||||||||