000157767012/312020Q2FALSE115,015,7385,379,708us-gaap:AccountingStandardsUpdate201613Member1,7751,7751,7751,7751,7751,7751.61.615.01.37.412.02.12.19.93.56.79.90001577670ladr:GovernmentNationalMortgageAssociationPermanentSecuritiesMemberus-gaap:FairValueInputsLevel3Membersrt:MinimumMemberus-gaap:MeasurementInputDiscountRateMember2019-12-310001577670us-gaap:CorporateNonSegmentMember2021-01-012021-06-30
UNITED STATES
SECURITIES AND EXCHANGE COMMISSION
Washington, D.C. 20549
Form 10-Q
(Mark One)
☒ QUARTERLY REPORT PURSUANT TO SECTION 13 OR 15(d) OF THE SECURITIES EXCHANGE ACT OF 1934
For the quarterly period ended June 30, 20202021
Or
☐ TRANSITION REPORT PURSUANT TO SECTION 13 OR 15(d) OF THE SECURITIES EXCHANGE ACT OF 1934
For the transition period from to
Commission file number:
001-36299
Ladder Capital Corp
(Exact name of registrant as specified in its charter)
| | | | | | | | | | | | | | |
| Delaware | | | | 80-0925494 |
(State or other jurisdiction of
incorporation or organization) | | | | (IRS Employer
Identification No.) |
| | | | |
| 345 Park Avenue, | New York, | NY | | 10154 |
| (Address of principal executive offices) | | | | (Zip Code) |
(212) 715-3170
(Registrant’s telephone number, including area code)
Securities registered pursuant to Section 12(b) of the Act:
| | | | | | | | |
| Title of Each Class | Trading Symbol(s) | Name of Each Exchange on Which Registered |
| Class A common stock, $0.001 par value | LADR | New York Stock Exchange |
Indicate by check mark whether the registrant (1) has filed all reports required to be filed by Section 13 or 15(d) of the Securities Exchange Act of 1934 during the preceding 12 months (or for such shorter period that the registrant was required to file such reports), and (2) has been subject to such filing requirements for the past 90 days. Yes ☒ No ☐
Indicate by check mark whether the registrant has submitted electronically every Interactive Data File required to be submitted pursuant to Rule 405 of Regulation S-T (§ 232.405 of this chapter) during the preceding 12 months (or for such shorter period that the registrant was required to submit such files). Yes ☒ No ☐
Indicate by check mark whether the registrant is a large accelerated filer, an accelerated filer, a non-accelerated filer, a smaller reporting company, or an emerging growth company. See the definitions of “large accelerated filer,” “accelerated filer,” “smaller reporting company” and “emerging growth company” in Rule 12b-2 of the Exchange Act:
| | | | | | | | | | | |
| Large accelerated filer | ☒ | Accelerated filer | ☐ |
| | | | |
| Non-accelerated filer | ☐ | Smaller reporting company | ☐ |
| | | |
| | Emerging growth company | ☐ |
If an emerging growth company, indicate by check mark if the registrant has elected not to use the extended transition period for complying with any new or revised financial accounting standards provided pursuant to Section 13(a) of the Exchange Act. ☐
Indicate by check mark whether the registrant is a shell company (as defined in Rule 12b-2 of the Exchange Act):
Yes ☐ No ☒
Indicate the number of shares outstanding of each of the registrant’s classes of common stock, as of the latest practicable date.
| | | | | | | | |
| Class | | Outstanding at July 15, 202023, 2021 |
| Class A common stock, $0.001 par value | | 115,015,738126,238,843 |
| Class B common stock, $0.001 par value | | 5,379,7080 |
LADDER CAPITAL CORP
FORM 10-Q
June 30, 20202021
CAUTIONARY STATEMENT REGARDING FORWARD-LOOKING STATEMENTS
This Quarterly Report on Form 10-Q (this “Quarterly Report”) includes forward-looking statements within the meaning of Section 27A of the Securities Act of 1933, as amended (the “Securities Act”), and Section 21E of the Securities Exchange Act of 1934, as amended (the “Exchange Act”). All statements other than statements of historical fact contained in this Quarterly Report, including statements regarding our future results of operations and financial position, strategy and plans, and our expectations for future operations, are forward-looking statements. The words “anticipate,” “estimate,” “expect,” “project,” “plan,” “intend,” “believe,” “may,” “might,” “will,” “should,” “can have,” “likely,” “continue,” “design,” and other words and terms of similar expressions are intended to identify forward-looking statements.
We have based these forward-looking statements largely on our current expectations and projections about future events and trends that we believe may affect our financial condition, results of operations, strategy, short-term and long-term business operations and objectives and financial needs. Although we believe that the expectations reflected in our forward-looking statements are reasonable, actual results could differ from those expressed in our forward-looking statements. Our future financial position and results of operations, as well as any forward-looking statements are subject to change and inherent risks and uncertainties. You should consider our forward-looking statements in light of a number of factors that may cause actual results to vary from our forward-looking statements including, but not limited to:
•risks discussed under the heading “Risk Factors” herein and in our Annual Report on Form 10-K for the year ended December 31, 20192020 (“Annual Report”), as well as our consolidated financial statements, related notes, and the other financial information appearing elsewhere in this Quarterly Report and our other filings with the United States Securities and Exchange Commission (“SEC”);
•the ongoing impact of the COVID-19 pandemic and of responsive measures implemented by various governmental authorities, businesses and other third parties;
•the impact of the current U.S. presidential administration and congressional majority on the regulatory landscape, capital markets, and the response to, and management of, the COVID-19 pandemic;
•changes in general economic conditions, in our industry and in the commercial finance and the real estate markets;
•changes to our business and investment strategy;
•our ability to obtain and maintain financing arrangements;
•the financing and advance rates for our assets;assets, including the potential effects of LIBOR replacement rates;
•our actual and expected leverage and liquidity;
•the adequacy of collateral securing our loan portfolio and a decline in the fair value of our assets;
•interest rate mismatches between our assets and our borrowings used to fund such investments;
•changes in interest rates and the market value of our assets;
•changes in prepayment rates on our mortgages and the loans underlying our mortgage-backed and other asset-backed securities;
•the effects of hedging instruments and the degree to which our hedging strategies may or may not protect us from interest rate and credit risk volatility;
•the increased rate of default or decreased recovery rates on our assets;
•the adequacy of our policies, procedures and systems for managing risk effectively;
•a potential downgrade in the credit ratings assigned to Ladder or our investments;
•our compliance with, and the impact of and changes in laws, governmental regulations, tax laws and rates, accounting guidance and similar matters;
•our ability to maintain our qualification as a real estate investment trust (“REIT”) for U.S. federal income tax purposes and our ability and the ability of our subsidiaries to operate in compliance with REIT requirements;
•our ability and the ability of our subsidiaries to maintain our and their exemptions from registration under the Investment Company Act of 1940, as amended (the “Investment Company Act”);
•potential liability relating to environmental matters that impact the value of properties we may acquire or the properties underlying our investments;
•the inability of insurance covering real estate underlying our loans and investments to cover all losses;
•the availability of investment opportunities in mortgage-related and real estate-related instruments and other securities;
•fraud by potential borrowers;
•the availability of qualified personnel;
•the impact of any tax legislation or IRS guidance;
•the degree and nature of our competition; and
•the market trends in our industry, interest rates, real estate values and the debt securities markets or the general economy.markets.
You should not rely upon forward-looking statements as predictions of future events. In addition, neither we nor any other person assumes responsibility for the accuracy and completeness of any of these forward-looking statements. The forward-looking statements contained in this Quarterly Report are made as of the date hereof, and the Company assumes no obligation to update or supplement any forward-looking statements.
REFERENCES TO LADDER CAPITAL CORP
Ladder Capital Corp is a holding company, and its primary assets are a controlling equity interest in Ladder Capital Finance Holdings LLLP (“LCFH” or the “Operating Partnership”) and in each series thereof, directly or indirectly. Unless the context suggests otherwise, references in this report to “Ladder,” “Ladder Capital,” the “Company,” “we,” “us” and “our” refer (1) prior to the February 2014 initial public offering (“IPO”) of the Class A common stock of Ladder Capital Corp and related transactions, to LCFH (“Predecessor”) and its consolidated subsidiaries and (2) after our IPO and related transactions, to Ladder Capital Corp and its consolidated subsidiaries.
Part I - Financial Information
Item 1. Financial Statements (Unaudited)
The consolidated financial statements of Ladder Capital Corp and the notes related to the foregoing consolidated financial statements are included in this Item.
Index to Consolidated Financial Statements (Unaudited)
Ladder Capital Corp
Consolidated Balance Sheets
(Dollars in Thousands)
| | | | June 30, 2020(1) | | December 31, 2019(1) | | June 30, 2021(1) | | December 31, 2020(1) |
| | (Unaudited) | | | | (Unaudited) | | |
| Assets | Assets | | | | Assets | | | |
| Cash and cash equivalents | Cash and cash equivalents | $ | 826,059 | | | $ | 58,171 | | Cash and cash equivalents | $ | 1,169,843 | | | $ | 1,254,432 | |
| Restricted cash | Restricted cash | 47,945 | | | 297,575 | | Restricted cash | 115,844 | | | 29,852 | |
| Mortgage loan receivables held for investment, net, at amortized cost: | Mortgage loan receivables held for investment, net, at amortized cost: | | | | Mortgage loan receivables held for investment, net, at amortized cost: | |
| Mortgage loans held by consolidated subsidiaries | 2,955,084 | | | 3,257,036 | | |
| Mortgage loans receivable | | Mortgage loans receivable | 2,531,048 | | | 2,354,059 | |
| | Allowance for loan losses | (49,102) | | | (20,500) | | |
| Allowance for credit losses | | Allowance for credit losses | (35,891) | | | (41,507) | |
| Mortgage loan receivables held for sale | Mortgage loan receivables held for sale | 85,977 | | | 122,325 | | Mortgage loan receivables held for sale | 59,182 | | | 30,518 | |
| Real estate securities | Real estate securities | 1,506,713 | | | 1,721,305 | | Real estate securities | 719,183 | | | 1,058,298 | |
| | Real estate and related lease intangibles, net | Real estate and related lease intangibles, net | 1,042,210 | | | 1,048,081 | | Real estate and related lease intangibles, net | 948,448 | | | 985,304 | |
| Investments in and advances to unconsolidated joint ventures | Investments in and advances to unconsolidated joint ventures | 48,919 | | | 48,433 | | Investments in and advances to unconsolidated joint ventures | 37,819 | | | 46,253 | |
| FHLB stock | 61,619 | | | 61,619 | | |
| | Derivative instruments | Derivative instruments | 380 | | | 693 | | Derivative instruments | 0 | | | 299 | |
| | Accrued interest receivable | Accrued interest receivable | 18,783 | | | 21,066 | | Accrued interest receivable | 12,767 | | | 16,088 | |
| Other assets | Other assets | 64,963 | | | 53,348 | | Other assets | 58,566 | | | 147,633 | |
| Total assets | Total assets | $ | 6,609,550 | | | $ | 6,669,152 | | Total assets | $ | 5,616,809 | | | $ | 5,881,229 | |
| Liabilities and Equity | Liabilities and Equity | | | | Liabilities and Equity | | | |
| Liabilities | Liabilities | | | | Liabilities | | | |
| | Debt obligations, net | Debt obligations, net | $ | 4,953,514 | | | $ | 4,859,873 | | Debt obligations, net | $ | 3,975,715 | | | $ | 4,209,864 | |
| | Derivative instruments | | Derivative instruments | 368 | | | 0 | |
| | Dividends payable | Dividends payable | 23,583 | | | 38,696 | | Dividends payable | 26,955 | | | 27,537 | |
| Accrued expenses | Accrued expenses | 55,616 | | | 72,397 | | Accrued expenses | 38,220 | | | 43,876 | |
| Other liabilities | Other liabilities | 68,457 | | | 59,209 | | Other liabilities | 55,686 | | | 51,527 | |
| Total liabilities | Total liabilities | 5,101,170 | | | 5,030,175 | | Total liabilities | 4,096,944 | | | 4,332,804 | |
| Commitments and contingencies (Note 18) | Commitments and contingencies (Note 18) | — | | | — | | Commitments and contingencies (Note 18) | 0 | | | 0 | |
| Equity | Equity | | | | Equity | | | |
| | Class A common stock, par value $0.001 per share, 600,000,000 shares authorized; 117,473,057 and 110,693,832 shares issued and 115,015,738 and 107,509,563 shares outstanding | 116 | | | 108 | | |
| Class B common stock, par value $0.001 per share, 100,000,000 shares authorized; 5,379,708 and 12,158,933 shares issued and outstanding | 5 | | | 12 | | |
| Class A common stock, par value $0.001 per share, 600,000,000 shares authorized; 126,852,765 and 126,852,765 shares issued and 126,241,917 and 126,378,715 shares outstanding | | Class A common stock, par value $0.001 per share, 600,000,000 shares authorized; 126,852,765 and 126,852,765 shares issued and 126,241,917 and 126,378,715 shares outstanding | 127 | | | 127 | |
| | Additional paid-in capital | Additional paid-in capital | 1,649,170 | | | 1,532,384 | | Additional paid-in capital | 1,788,875 | | | 1,780,074 | |
| Treasury stock, 2,457,319 and 3,184,269 shares, at cost | (53,619) | | | (42,699) | | |
| Treasury stock, 610,848 and 474,050 shares, at cost | | Treasury stock, 610,848 and 474,050 shares, at cost | (68,593) | | | (62,859) | |
| Retained earnings (dividends in excess of earnings) | Retained earnings (dividends in excess of earnings) | (120,082) | | | (35,746) | | Retained earnings (dividends in excess of earnings) | (203,714) | | | (163,717) | |
| Accumulated other comprehensive income (loss) | Accumulated other comprehensive income (loss) | (45,080) | | | 4,218 | | Accumulated other comprehensive income (loss) | (2,211) | | | (10,463) | |
| Total shareholders’ equity | Total shareholders’ equity | 1,430,510 | | | 1,458,277 | | Total shareholders’ equity | 1,514,484 | | | 1,543,162 | |
| Noncontrolling interest in operating partnership | 70,968 | | | 172,054 | | |
| Noncontrolling interest in consolidated joint ventures | 6,902 | | | 8,646 | | |
| | Noncontrolling interests in consolidated joint ventures | | Noncontrolling interests in consolidated joint ventures | 5,381 | | | 5,263 | |
| Total equity | Total equity | 1,508,380 | | | 1,638,977 | | Total equity | 1,519,865 | | | 1,548,425 | |
| | Total liabilities and equity | Total liabilities and equity | $ | 6,609,550 | | | $ | 6,669,152 | | Total liabilities and equity | $ | 5,616,809 | | | $ | 5,881,229 | |
(1)Includes amounts relating to consolidated variable interest entities. SeeRefer to Note 1 and Note 10.
The
Refer to the accompanying notes are an integral part of theseto consolidated financial statements.
Ladder Capital Corp
Consolidated Statements of Income
(Dollars in Thousands, Except Per Share and Dividend Data)
(Unaudited)
| | | | | | | | | | | | | | | | | | | | | | | | | |
| | Three Months Ended June 30, | | | | Six Months Ended June 30, | | | | |
| | 2020 | | 2019 | | 2020 | | 2019 | | |
| | | | | | | | | |
| Net interest income | | | | | | | | | |
| Interest income | $ | 62,096 | | | $ | 85,322 | | | $ | 134,686 | | | $ | 171,789 | | | |
| Interest expense | 68,425 | | | 52,369 | | | 119,827 | | | 103,618 | | | |
| Net interest income | (6,329) | | | 32,953 | | | 14,859 | | | 68,171 | | | |
| Provision for/(release of) loan loss reserves | (729) | | | 300 | | | 25,852 | | | 600 | | | |
| Net interest income (expense) after provision for loan losses | (5,600) | | | 32,653 | | | (10,993) | | | 67,571 | | | |
| | | | | | | | | |
| Other income (loss) | | | | | | | | | |
| Operating lease income | 23,773 | | | 27,780 | | | 50,101 | | | 56,701 | | | |
| | | | | | | | | |
| | | | | | | | | |
| Sale of loans, net | (744) | | | 20,264 | | | 261 | | | 27,342 | | | |
| Realized gain (loss) on securities | (14,798) | | | 4,464 | | | (11,787) | | | 7,329 | | | |
| Unrealized gain (loss) on equity securities | 401 | | | (990) | | | (132) | | | 1,088 | | | |
| Unrealized gain (loss) on Agency interest-only securities | 98 | | | 11 | | | 174 | | | 22 | | | |
| Realized gain (loss) on sale of real estate, net | (1) | | | (1,124) | | | 10,528 | | | (1,119) | | | |
| Impairment of real estate | — | | | — | | | — | | | (1,350) | | | |
| Fee and other income | 3,505 | | | 7,196 | | | 5,024 | | | 11,882 | | | |
| Net result from derivative transactions | (813) | | | (15,457) | | | (16,248) | | | (26,491) | | | |
| Earnings (loss) from investment in unconsolidated joint ventures | 471 | | | 1,564 | | | 912 | | | 2,522 | | | |
| | | | | | | | | |
| Gain (loss) on extinguishment/defeasance of debt | 19,017 | | | — | | | 21,077 | | | (1,070) | | | |
| Total other income (loss) | 30,909 | | | 43,708 | | | 59,910 | | | 76,856 | | | |
| Costs and expenses | | | | | | | | | |
| Salaries and employee benefits | 7,001 | | | 14,907 | | | 24,023 | | | 38,481 | | | |
| Operating expenses | 6,224 | | | 6,012 | | | 12,018 | | | 11,413 | | | |
| Real estate operating expenses | 6,034 | | | 6,032 | | | 13,981 | | | 11,506 | | | |
| Fee expense | 1,977 | | | 1,183 | | | 3,415 | | | 2,895 | | | |
| Depreciation and amortization | 9,816 | | | 9,935 | | | 19,825 | | | 20,162 | | | |
| Total costs and expenses | 31,052 | | | 38,069 | | | 73,262 | | | 84,457 | | | |
| Income (loss) before taxes | (5,743) | | | 38,292 | | | (24,345) | | | 59,970 | | | |
| Income tax expense (benefit) | (550) | | | 2,219 | | | (5,091) | | | (634) | | | |
| Net income (loss) | (5,193) | | | 36,073 | | | (19,254) | | | 60,604 | | | |
| Net (income) loss attributable to noncontrolling interest in consolidated joint ventures | 250 | | | 307 | | | (1,269) | | | 754 | | | |
| | | | | | | | | |
| Net (income) loss attributable to noncontrolling interest in operating partnership | 754 | | | (4,136) | | | 605 | | | (6,939) | | | |
| Net income (loss) attributable to Class A common shareholders | $ | (4,189) | | | $ | 32,244 | | | $ | (19,918) | | | $ | 54,419 | | | |
| | | | | | | | | |
| The accompanying notes are an integral part of these consolidated financial statements. | | | | | | | | | |
| | | | | | | | | |
| | | | | | | | | | | | | | | | | | | | | | | | | | | | | |
| | | | Three Months Ended June 30, | | Six Months Ended June 30, | | |
| | | | | | 2021 | | 2020 | | 2021 | | 2020 | | |
| | | | | | | | | | | | | |
| Net interest income | | | | | | | | | | | | | |
| Interest income | | | | | $ | 37,577 | | | $ | 62,096 | | | $ | 76,865 | | | $ | 134,686 | | | |
| Interest expense | | | | | 45,226 | | | 68,425 | | | 91,199 | | | 119,827 | | | |
| Net interest income | | | | | (7,649) | | | (6,329) | | | (14,334) | | | 14,859 | | | |
| Provision for (release of) loan loss reserves | | | | | (335) | | | (729) | | | (4,586) | | | 25,852 | | | |
| Net interest income (expense) after provision for (release of) loan losses | | | | | (7,314) | | | (5,600) | | | (9,748) | | | (10,993) | | | |
| Other income (loss) | | | | | | | | | | | | | |
| Real estate operating income | | | | | 26,558 | | | 23,773 | | | 50,718 | | | 50,101 | | | |
| | | | | | | | | | | | | |
| | | | | | | | | | | | | |
| Sale of loans, net | | | | | 3,392 | | | (744) | | | 3,392 | | | 261 | | | |
| Realized gain (loss) on securities | | | | | 15 | | | (14,798) | | | 594 | | | (11,787) | | | |
| Unrealized gain (loss) on equity securities | | | | | 0 | | | 401 | | | 0 | | | (132) | | | |
| Unrealized gain (loss) on Agency interest-only securities | | | | | (48) | | | 98 | | | (68) | | | 174 | | | |
| Realized gain (loss) on sale of real estate, net | | | | | 19,389 | | | (1) | | | 19,389 | | | 10,528 | | | |
| | | | | | | | | | | | | |
| Fee and other income | | | | | 2,451 | | | 3,505 | | | 5,735 | | | 5,024 | | | |
| Net result from derivative transactions | | | | | (3,844) | | | (813) | | | 927 | | | (16,248) | | | |
| Earnings (loss) from investment in unconsolidated joint ventures | | | | | 237 | | | 471 | | | 673 | | | 912 | | | |
| | | | | | | | | | | | | |
| Gain (loss) on extinguishment of debt | | | | | 0 | | | 19,017 | | | 0 | | | 21,077 | | | |
| Total other income (loss) | | | | | 48,150 | | | 30,909 | | | 81,360 | | | 59,910 | | | |
| Costs and expenses | | | | | | | | | | | | | |
| Salaries and employee benefits | | | | | 8,477 | | | 7,001 | | | 18,011 | | | 24,023 | | | |
| Operating expenses | | | | | 4,216 | | | 6,224 | | | 8,457 | | | 12,018 | | | |
| Real estate operating expenses | | | | | 6,345 | | | 6,034 | | | 12,555 | | | 13,981 | | | |
| Fee expense | | | | | 2,195 | | | 1,977 | | | 3,793 | | | 3,415 | | | |
| Depreciation and amortization | | | | | 9,464 | | | 9,816 | | | 19,000 | | | 19,825 | | | |
| Total costs and expenses | | | | | 30,697 | | | 31,052 | | | 61,816 | | | 73,262 | | | |
| Income (loss) before taxes | | | | | 10,139 | | | (5,743) | | | 9,796 | | | (24,345) | | | |
| Income tax expense (benefit) | | | | | (318) | | | (550) | | | (1,096) | | | (5,091) | | | |
| Net income (loss) | | | | | 10,457 | | | (5,193) | | | 10,892 | | | (19,254) | | | |
| Net (income) loss attributable to noncontrolling interests in consolidated joint ventures | | | | | (163) | | | 250 | | | (403) | | | (1,269) | | | |
| | | | | | | | | | | | | |
| Net (income) loss attributable to noncontrolling interests in Operating Partnership | | | | | 0 | | | 754 | | | 0 | | | 605 | | | |
| Net income (loss) attributable to Class A common shareholders | | | | | $ | 10,294 | | | $ | (4,189) | | | $ | 10,489 | | | $ | (19,918) | | | |
| | | | | | | | | | | | | |
| Refer to the accompanying notes to consolidated financial statements. | | |
| | | | | | | | | | | | | |
| | | | | | | | | | | | | |
| | | | Three Months Ended June 30, | | | Six Months Ended June 30, | | | | Three Months Ended June 30, | | Six Months Ended June 30, | |
| | | 2020 | | 2019 | | 2020 | | 2019 | | | | 2021 | | 2020 | | 2021 | | 2020 | |
| | Earnings per share: | Earnings per share: | | | | | | | | | Earnings per share: | | | | | | |
| Basic | Basic | $ | (0.04) | | | $ | 0.31 | | | $ | (0.19) | | | $ | 0.52 | | | Basic | | $ | 0.08 | | | $ | (0.04) | | | $ | 0.08 | | | $ | (0.19) | | |
| Diluted | Diluted | $ | (0.04) | | | $ | 0.30 | | | $ | (0.19) | | | $ | 0.51 | | | Diluted | | $ | 0.08 | | | $ | (0.04) | | | $ | 0.08 | | | $ | (0.19) | | |
| | Weighted average shares outstanding: | Weighted average shares outstanding: | | | | | | | | | Weighted average shares outstanding: | | | | | | |
| Basic | Basic | 106,809,987 | | | 105,511,385 | | | 106,569,892 | | | 104,888,925 | | | Basic | | 124,048,999 | | | 106,809,987 | | | 124,012,683 | | | 106,569,892 | | |
| Diluted | Diluted | 106,809,987 | | | 105,892,420 | | | 106,569,892 | | | 105,742,589 | | | Diluted | | 124,480,487 | | | 106,809,987 | | | 124,353,202 | | | 106,569,892 | | |
| | Dividends per share of Class A common stock | Dividends per share of Class A common stock | $ | 0.200 | | | $ | 0.340 | | | $ | 0.540 | | | $ | 0.680 | | | Dividends per share of Class A common stock | | $ | 0.20 | | | $ | 0.20 | | | $ | 0.40 | | | $ | 0.54 | | |
TheRefer to the accompanying notes are an integral part of theseto consolidated financial statements.
Ladder Capital Corp
Consolidated Statements of Comprehensive Income
(Dollars in Thousands)
(Unaudited)
| | | | | | | | | | | | | | | | | | | | | | | | | |
| | Three Months Ended June 30, | | | | Six Months Ended June 30, | | | | |
| | 2020 | | 2019 | | 2020 | | 2019 | | |
| | | | | | | | | |
| Net income (loss) | $ | (5,193) | | | $ | 36,073 | | | $ | (19,254) | | | $ | 60,604 | | | |
| | | | | | | | | |
| Other comprehensive income (loss) | | | | | | | | | |
| Unrealized gain (loss) on securities, net of tax: | | | | | | | | | |
| Unrealized gain (loss) on real estate securities, available for sale | 11,532 | | | 10,053 | | | (64,721) | | | 26,024 | | | |
| Reclassification adjustment for (gain) loss included in net income (loss) | 14,591 | | | (4,464) | | | 12,837 | | | (7,242) | | | |
| | | | | | | | | |
| Total other comprehensive income (loss) | 26,123 | | | 5,589 | | | (51,884) | | | 18,782 | | | |
| | | | | | | | | |
| Comprehensive income (loss) | 20,930 | | | 41,662 | | | (71,138) | | | 79,386 | | | |
| Comprehensive (income) loss attributable to noncontrolling interest in consolidated joint ventures | 250 | | | 307 | | | (1,269) | | | 754 | | | |
| Comprehensive income (loss) of combined Class A common shareholders and Operating Partnership unitholders | 21,180 | | | 41,969 | | | (72,407) | | | 80,140 | | | |
| | | | | | | | | |
| Comprehensive (income) loss attributable to noncontrolling interest in operating partnership | (1,757) | | | (4,718) | | | 5,959 | | | (8,983) | | | |
| Comprehensive income (loss) attributable to Class A common shareholders | $ | 19,423 | | | $ | 37,251 | | | $ | (66,448) | | | $ | 71,157 | | | |
| | | | | | | | | | | | | | | | | | | | | | | | | | | | | | | |
| | | | Three Months Ended June 30, | | Six Months Ended June 30, |
| | | | | | 2021 | | 2020 | | 2021 | | 2020 | | |
| | | | | | | | | | | | | |
| Net income (loss) | | | | | $ | 10,457 | | | $ | (5,193) | | | $ | 10,892 | | | $ | (19,254) | | | |
| | | | | | | | | | | | | |
| Other comprehensive income (loss) | | | | | | | | | | | | | |
| Unrealized gain (loss) on securities, net of tax: | | | | | | | | | | | | | |
| Unrealized gain (loss) on real estate securities, available for sale | | | | | 1,418 | | | 11,532 | | | 8,846 | | | (64,721) | | | |
| Reclassification adjustment for (gain) loss included in net income (loss) | | | | | (15) | | | 14,591 | | | (594) | | | 12,837 | | | |
| | | | | | | | | | | | | |
| Total other comprehensive income (loss) | | | | | 1,403 | | | 26,123 | | | 8,252 | | | (51,884) | | | |
| | | | | | | | | | | | | |
| Comprehensive income (loss) | | | | | 11,860 | | | 20,930 | | | 19,144 | | | (71,138) | | | |
| Comprehensive (income) loss attributable to noncontrolling interest in consolidated joint ventures | | | | | (163) | | | 250 | | | (403) | | | (1,269) | | | |
| Comprehensive income (loss) of combined Class A common shareholders and Operating Partnership unitholders | | | | | 11,697 | | | 21,180 | | | 18,741 | | | (72,407) | | | |
| | | | | | | | | | | | | |
| Comprehensive (income) loss attributable to noncontrolling interests in operating partnership | | | | | 0 | | | (1,757) | | | 0 | | | 5,959 | | | |
| Comprehensive income (loss) attributable to Class A common shareholders | | | | | $ | 11,697 | | | $ | 19,423 | | | $ | 18,741 | | | $ | (66,448) | | | |
TheRefer to the accompanying notes are an integral part of theseto consolidated financial statements.
Ladder Capital Corp
Consolidated Statements of Changes in Equity
(Dollars and Shares in Thousands)
(Unaudited)
| | | | | | | | | | | | | | | | | | | | | | | | | | | | | | | | | | | | | | | | | | | | | | | | | | | | | | | | | | | | | | | | | |
| | Shareholders’ Equity | | | | | | | | | | | | | | | | | | | | |
| | Class A Common Stock | | | | Class B Common Stock | | | | Additional Paid- in-Capital | | Treasury Stock | | Retained Earnings (Dividends in Excess of Earnings) | | Accumulated Other Comprehensive Income (Loss) | | Noncontrolling Interests | | | | Total Equity |
| Shares | | Par | | Shares | | Par | | | | | | | | | | Operating Partnership | | Consolidated Joint Ventures | | |
| | | | | | | | | | | | | | | | | | | | | | |
| Balance, March 31, 2020 | 108,337 | | | $ | 109 | | | 12,160 | | | $ | 12 | | | $ | 1,546,143 | | | $ | (52,983) | | | $ | (94,171) | | | $ | (65,920) | | | $ | 160,466 | | | $ | 7,171 | | | $ | 1,500,827 | |
| Contributions | — | | | — | | | — | | | — | | | — | | | — | | | — | | | — | | | — | | | 349 | | | 349 | |
| Distributions | — | | | — | | | — | | | — | | | — | | | — | | | — | | | — | | | (2,198) | | | (368) | | | (2,566) | |
| | | | | | | | | | | | | | | | | | | | | |
| Amortization of equity based compensation | — | | | — | | | — | | | — | | | 2,712 | | | — | | | — | | | — | | | — | | | — | | | 2,712 | |
| | | | | | | | | | | | | | | | | | | | | |
| | | | | | | | | | | | | | | | | | | | | |
| Issuance of purchase right | — | | | — | | | — | | | — | | | 8,425 | | | — | | | — | | | — | | | — | | | — | | | 8,425 | |
| Purchase of treasury stock | (64) | | | — | | | — | | | — | | | — | | | (482) | | | — | | | — | | | — | | | — | | | (482) | |
| | | | | | | | | | | | | | | | | | | | | |
| Shares acquired to satisfy minimum required federal and state tax withholding on vesting restricted stock and units | (19) | | | — | | | — | | | — | | | — | | | (154) | | | — | | | — | | | — | | | — | | | (154) | |
| Forfeitures | (18) | | | — | | | — | | | — | | | — | | | — | | | — | | | — | | | — | | | — | | | — | |
| Dividends declared | — | | | — | | | — | | | — | | | — | | | — | | | (21,722) | | | — | | | — | | | — | | | (21,722) | |
| | | | | | | | | | | | | | | | | | | | | |
| | | | | | | | | | | | | | | | | | | | | |
| Exchange of noncontrolling interest for common stock | 6,779 | | | 7 | | | (6,779) | | | (7) | | | 92,540 | | | — | | | — | | | (4,915) | | | (87,564) | | | — | | | 61 | |
| | | | | | | | | | | | | | | | | | | | | |
| | | | | | | | | | | | | | | | | | | | | |
| Net income (loss) | — | | | — | | | — | | | — | | | — | | | — | | | (4,189) | | | — | | | (754) | | | (250) | | | (5,193) | |
| Other comprehensive income (loss) | — | | | — | | | — | | | — | | | — | | | — | | | — | | | 23,612 | | | 2,511 | | | — | | | 26,123 | |
| Rebalancing of ownership percentage between Company and Operating Partnership | — | | | — | | | — | | | — | | | (650) | | | — | | | — | | | 2,143 | | | (1,493) | | | — | | | — | |
| Balance, June 30, 2020 | 115,015 | | | $ | 116 | | | 5,381 | | | $ | 5 | | | $ | 1,649,170 | | | $ | (53,619) | | | $ | (120,082) | | | $ | (45,080) | | | $ | 70,968 | | | $ | 6,902 | | | $ | 1,508,380 | |
| | | | | | | | | | | | | | | | | | | | | | | | | | | | | | | | | | | | | | | | | | | | | | | |
| | Shareholders’ Equity | | | | |
| | Class A Common Stock | | Additional Paid- in-Capital | | Treasury Stock | | Retained Earnings (Dividends in Excess of Earnings) | | Accumulated Other Comprehensive Income (Loss) | | Noncontrolling Interests | | Total Equity |
| Shares | | Par | | | | | | Consolidated Joint Ventures | |
| Balance, March 31, 2021 | 126,342 | | | $ | 127 | | | $ | 1,785,350 | | | $ | (67,495) | | | $ | (188,763) | | | $ | (3,614) | | | $ | 5,234 | | | $ | 1,530,839 | |
| | | | | | | | | | | | | | | |
| Distributions | — | | | — | | | — | | | — | | | — | | | — | | | (16) | | | (16) | |
| | | | | | | | | | | | | | | |
| Amortization of equity based compensation | — | | | — | | | 3,525 | | | — | | | — | | | — | | | — | | | 3,525 | |
| | | | | | | | | | | | | | | |
| | | | | | | | | | | | | | | |
| Purchase of treasury stock | (100) | | | — | | | — | | | (1,098) | | | — | | | — | | | — | | | (1,098) | |
| | | | | | | | | | | | | | | |
| | | | | | | | | | | | | | | |
| | | | | | | | | | | | | | | |
| Dividends declared | — | | | — | | | — | | | — | | | (25,245) | | | — | | | — | | | (25,245) | |
| | | | | | | | | | | | | | | |
| | | | | | | | | | | | | | | |
| | | | | | | | | | | | | | | |
| | | | | | | | | | | | | | | |
| Net income (loss) | — | | | — | | | — | | | — | | | 10,294 | | | — | | | 163 | | | 10,457 | |
| Other comprehensive income (loss) | — | | | — | | | — | | | — | | | — | | | 1,403 | | | — | | | 1,403 | |
| | | | | | | | | | | | | | | |
| Balance, June 30, 2021 | 126,242 | | | $ | 127 | | | $ | 1,788,875 | | | $ | (68,593) | | | $ | (203,714) | | | $ | (2,211) | | | $ | 5,381 | | | $ | 1,519,865 | |
The
Refer to the accompanying notes are an integral part of theseto consolidated financial statements.
Ladder Capital Corp
Consolidated Statements of Changes in Equity
(Dollars and Shares in Thousands)
(Unaudited)
| | | | Shareholders’ Equity | | | | Shareholders’ Equity | |
| | | Class A Common Stock | | | Class B Common Stock | | | Additional Paid- in-Capital | | Treasury Stock | | Retained Earnings (Dividends in Excess of Earnings) | | Accumulated Other Comprehensive Income (Loss) | | Noncontrolling Interests | | | Total Equity | | Class A Common Stock | | Class B Common Stock | | Additional Paid- in-Capital | | Treasury Stock | | Retained Earnings (Dividends in Excess of Earnings) | | Accumulated Other Comprehensive Income (Loss) | | Noncontrolling Interests | | Total Equity |
| Shares | | Par | | Shares | | Par | | | | | | | | | | Operating Partnership | | Consolidated Joint Ventures | | | Shares | | Par | | Shares | | Par | | | | Operating Partnership | | Consolidated Joint Ventures | |
| | | | | | | | | | | | | | | | | | | | | | | |
| Balance, March 31, 2019 | 106,562 | | | $ | 107 | | | 13,198 | | | $ | 13 | | | $ | 1,508,452 | | | $ | (40,799) | | | $ | (26,549) | | | $ | 7,080 | | | $ | 186,310 | | | $ | 9,629 | | | $ | 1,644,243 | | |
| Balance, March 31, 2020 | | Balance, March 31, 2020 | 108,337 | | | $ | 109 | | | $ | 12,160 | | | $ | 12 | | | $ | 1,546,143 | | | $ | (52,983) | | | $ | (94,171) | | | $ | (65,920) | | | $ | 160,466 | | | $ | 7,171 | | | $ | 1,500,827 | |
| Contributions | Contributions | — | | | — | | | — | | | — | | | — | | | — | | | — | | | — | | | — | | | 114 | | | 114 | | Contributions | — | | | — | | | — | | | — | | | — | | | — | | | — | | | — | | | — | | | 349 | | | 349 | |
| Distributions | Distributions | — | | | — | | | — | | | — | | | — | | | — | | | — | | | — | | | (4,284) | | | (206) | | | (4,490) | | Distributions | — | | | — | | | — | | | — | | | — | | | — | | | — | | | — | | | (2,198) | | | (368) | | | (2,566) | |
| | Amortization of equity based compensation | Amortization of equity based compensation | — | | | — | | | — | | | — | | | 3,469 | | | — | | | — | | | — | | | — | | | — | | | 3,469 | | Amortization of equity based compensation | — | | | — | | | — | | | — | | | 2,712 | | | — | | | — | | | — | | | — | | | — | | | 2,712 | |
| | Issuance of purchase right | | Issuance of purchase right | — | | | — | | | — | | | — | | | 8,425 | | | — | | | — | | | — | | | — | | | — | | | 8,425 | |
| Purchase of treasury stock | Purchase of treasury stock | (40) | | | — | | | — | | | — | | | — | | | (637) | | | — | | | — | | | — | | | — | | | (637) | | Purchase of treasury stock | (64) | | | — | | | — | | | — | | | — | | | (482) | | | — | | | — | | | — | | | — | | | (482) | |
| Re-issuance of treasury stock | 5 | | | — | | | — | | | — | | | — | | | — | | | — | | | — | | | — | | | — | | | — | | |
| | Shares acquired to satisfy minimum required federal and state tax withholding on vesting restricted stock and units | Shares acquired to satisfy minimum required federal and state tax withholding on vesting restricted stock and units | (6) | | | — | | | — | | | — | | | — | | | (99) | | | — | | | — | | | — | | | — | | | (99) | | Shares acquired to satisfy minimum required federal and state tax withholding on vesting restricted stock and units | (19) | | | — | | | — | | | — | | | — | | | (154) | | | — | | | — | | | — | | | — | | | (154) | |
| Forfeitures | Forfeitures | (9) | | | — | | | — | | | — | | | — | | | — | | | — | | | — | | | — | | | — | | | — | | Forfeitures | (18) | | | — | | | — | | | — | | | — | | | — | | | — | | | — | | | — | | | — | | | — | |
| Dividends declared | Dividends declared | — | | | — | | | — | | | — | | | — | | | — | | | (36,542) | | | — | | | — | | | — | | | (36,542) | | Dividends declared | — | | | — | | | — | | | — | | | — | | | — | | | (21,722) | | | — | | | — | | | — | | | (21,722) | |
| | Exchange of noncontrolling interest for common stock | Exchange of noncontrolling interest for common stock | 1,039 | | | 1 | | | (1,039) | | | (1) | | | 14,956 | | | — | | | — | | | 70 | | | (14,672) | | | — | | | 354 | | Exchange of noncontrolling interest for common stock | 6,779 | | | 7 | | | (6,779) | | | (7) | | | 92,540 | | | — | | | — | | | (4,915) | | | (87,564) | | | — | | | 61 | |
| | | Net income (loss) | Net income (loss) | — | | | — | | | — | | | — | | | — | | | — | | | 32,244 | | | — | | | 4,136 | | | (307) | | | 36,073 | | Net income (loss) | — | | | — | | | — | | | — | | | — | | | — | | | (4,189) | | | — | | | (754) | | | (250) | | | (5,193) | |
| Other comprehensive income (loss) | Other comprehensive income (loss) | — | | | — | | | — | | | — | | | — | | | — | | | — | | | 5,007 | | | 582 | | | — | | | 5,589 | | Other comprehensive income (loss) | — | | | — | | | — | | | — | | | — | | | — | | | — | | | 23,612 | | | 2,511 | | | — | | | 26,123 | |
| Rebalancing of ownership percentage between Company and Operating Partnership | Rebalancing of ownership percentage between Company and Operating Partnership | — | | | — | | | — | | | — | | | (408) | | | — | | | — | | | 14 | | | 394 | | | — | | | — | | Rebalancing of ownership percentage between Company and Operating Partnership | — | | | — | | | — | | | — | | | (650) | | | — | | | — | | | 2,143 | | | (1,493) | | | — | | | — | |
| Balance, June 30, 2019 | 107,551 | | | $ | 108 | | | 12,159 | | | $ | 12 | | | $ | 1,526,469 | | | $ | (41,535) | | | $ | (30,847) | | | $ | 12,171 | | | $ | 172,466 | | | $ | 9,230 | | | $ | 1,648,074 | | |
| Balance, June 30, 2020 | | Balance, June 30, 2020 | 115,015 | | | $ | 116 | | | 5,381 | | | $ | 5 | | | $ | 1,649,170 | | | $ | (53,619) | | | $ | (120,082) | | | $ | (45,080) | | | $ | 70,968 | | | $ | 6,902 | | | $ | 1,508,380 | |
TheRefer to the accompanying notes are an integral part of theseto consolidated financial statements.
Ladder Capital Corp
Consolidated Statements of Changes in Equity
(Dollars and Shares in Thousands)
(Unaudited)
| | | | Shareholders’ Equity | | | | Shareholders’ Equity | | | |
| | | Class A Common Stock | | | Class B Common Stock | | | Additional Paid- in-Capital | | Treasury Stock | | Retained Earnings (Dividends in Excess of Earnings) | | Accumulated Other Comprehensive Income (Loss) | | Noncontrolling Interests | | | Total Equity | | Class A Common Stock | | | Additional Paid- in-Capital | | Treasury Stock | | Retained Earnings (Dividends in Excess of Earnings) | | Accumulated Other Comprehensive Income (Loss) | | | Noncontrolling Interests | | Total Equity |
| Shares | | Par | | Shares | | Par | | | | | | | | | | Operating Partnership | | Consolidated Joint Ventures | | | Shares | | Par | | | | | Consolidated Joint Ventures | |
| | | | | | | | | | | | | | | | | | | | | | | | |
| Balance, December 31, 2019 | 107,509 | | | $ | 108 | | | 12,160 | | | $ | 12 | | | $ | 1,532,384 | | | $ | (42,699) | | | $ | (35,746) | | | $ | 4,218 | | | $ | 172,054 | | | $ | 8,646 | | | $ | 1,638,977 | | |
| Contributions | — | | | — | | | — | | | — | | | — | | | — | | | — | | | — | | | — | | | 651 | | | 651 | | |
| Balance, December 31, 2020 | | Balance, December 31, 2020 | 126,378 | | | $ | 127 | | | | $ | 1,780,074 | | | $ | (62,859) | | | $ | (163,717) | | | $ | (10,463) | | | | $ | 5,263 | | | $ | 1,548,425 | |
| | Distributions | Distributions | — | | | — | | | — | | | — | | | — | | | — | | | — | | | — | | | (6,332) | | | (3,664) | | | (9,996) | | Distributions | — | | | — | | | | — | | | — | | | — | | | — | | | | (285) | | | (285) | |
| | Amortization of equity based compensation | Amortization of equity based compensation | — | | | — | | | — | | | — | | | 16,738 | | | — | | | — | | | — | | | — | | | — | | | 16,738 | | Amortization of equity based compensation | — | | | — | | | | 8,801 | | | — | | | — | | | — | | | | — | | | 8,801 | |
| | Issuance of purchase right | — | | | — | | | — | | | — | | | 8,425 | | | — | | | — | | | — | | | — | | | — | | | 8,425 | | |
| | Purchase of treasury stock | Purchase of treasury stock | (210) | | | — | | | — | | | — | | | — | | | (1,688) | | | — | | | — | | | — | | | — | | | (1,688) | | Purchase of treasury stock | (120) | | | — | | | | — | | | (1,312) | | | — | | | — | | | | — | | | (1,312) | |
| Re-issuance of treasury stock | Re-issuance of treasury stock | 1,466 | | | 1 | | | — | | | — | | | (1) | | | — | | | — | | | — | | | — | | | — | | | — | | Re-issuance of treasury stock | 748 | | | — | | | | — | | | (1) | | | — | | | — | | | | — | | | (1) | |
| Shares acquired to satisfy minimum required federal and state tax withholding on vesting restricted stock and units | Shares acquired to satisfy minimum required federal and state tax withholding on vesting restricted stock and units | (505) | | | — | | | — | | | — | | | — | | | (9,232) | | | — | | | — | | | — | | | — | | | (9,232) | | Shares acquired to satisfy minimum required federal and state tax withholding on vesting restricted stock and units | (437) | | | — | | | | — | | | (4,421) | | | — | | | — | | | | — | | | (4,421) | |
| Forfeitures | Forfeitures | (24) | | | — | | | — | | | — | | | — | | | — | | | — | | | — | | | — | | | — | | | — | | Forfeitures | (327) | | | — | | | | — | | | — | | | — | | | — | | | | — | | | — | |
| Dividends declared | Dividends declared | — | | | — | | | — | | | — | | | — | | | — | | | (58,621) | | | — | | | — | | | — | | | (58,621) | | Dividends declared | — | | | — | | | | — | | | — | | | (50,486) | | | — | | | | — | | | (50,486) | |
| | Exchange of noncontrolling interest for common stock | 6,779 | | | 7 | | | (6,779) | | | (7) | | | 92,540 | | | — | | | — | | | (4,915) | | | (87,564) | | | — | | | 61 | | |
| | CECL Adoption | — | | | — | | | — | | | — | | | — | | | — | | | (5,797) | | | — | | | — | | | — | | | (5,797) | | |
| | Net income (loss) | Net income (loss) | — | | | — | | | — | | | — | | | — | | | — | | | (19,918) | | | — | | | (605) | | | 1,269 | | | (19,254) | | Net income (loss) | — | | | — | | | | — | | | — | | | 10,489 | | | — | | | | 403 | | | 10,892 | |
| Other comprehensive income (loss) | Other comprehensive income (loss) | — | | | — | | | — | | | — | | | — | | | — | | | — | | | (46,530) | | | (5,354) | | | — | | | (51,884) | | Other comprehensive income (loss) | — | | | — | | | | — | | | — | | | — | | | 8,252 | | | | — | | | 8,252 | |
| Rebalancing of ownership percentage between Company and Operating Partnership | — | | | — | | | — | | | — | | | (916) | | | — | | | — | | | 2,147 | | | (1,231) | | | — | | | — | | |
| Balance, June 30, 2020 | 115,015 | | | $ | 116 | | | 5,381 | | | $ | 5 | | | $ | 1,649,170 | | | $ | (53,619) | | | $ | (120,082) | | | $ | (45,080) | | | $ | 70,968 | | | $ | 6,902 | | | $ | 1,508,380 | | |
| | Balance, June 30, 2021 | | Balance, June 30, 2021 | 126,242 | | | $ | 127 | | | | $ | 1,788,875 | | | $ | (68,593) | | | $ | (203,714) | | | $ | (2,211) | | | | $ | 5,381 | | | $ | 1,519,865 | |
TheRefer to the accompanying notes are an integral part of theseto consolidated financial statements.
Ladder Capital Corp
Consolidated Statements of Changes in Equity
(Dollars and Shares in Thousands)
(Unaudited)
| | | | Shareholders’ Equity | | | | Shareholders’ Equity | | |
| | | Class A Common Stock | | | Class B Common Stock | | | Additional Paid- in-Capital | | Treasury Stock | | Retained Earnings (Dividends in Excess of Earnings) | | Accumulated Other Comprehensive Income (Loss) | | Noncontrolling Interests | | | Total Equity | | Class A Common Stock | | Class B Common Stock | | Additional Paid- in-Capital | | Treasury Stock | | Retained Earnings (Dividends in Excess of Earnings) | | Accumulated Other Comprehensive Income (Loss) | | Noncontrolling Interests | | Total Equity | |
| Shares | | Par | | Shares | | Par | | | | | | | | | | Operating Partnership | | Consolidated Joint Ventures | | | Shares | | Par | | Shares | | Par | | Operating Partnership | | Consolidated Joint Ventures | | |
| | | | | | | | | | | | | | | | | | | | | | | | |
| Balance, December 31, 2018 | 103,941 | | | $ | 105 | | | 13,118 | | | $ | 13 | | | $ | 1,471,157 | | | $ | (32,815) | | | $ | 11,342 | | | $ | (4,649) | | | $ | 188,427 | | | $ | 10,055 | | | $ | 1,643,635 | | |
| Balance, December 31, 2019 | | Balance, December 31, 2019 | 107,509 | | | $ | 108 | | | 12,160 | | | $ | 12 | | | $ | 1,532,384 | | | $ | (42,699) | | | $ | (35,746) | | | $ | 4,218 | | | $ | 172,054 | | | $ | 8,646 | | | $ | 1,638,977 | | |
| Contributions | Contributions | — | | | — | | | — | | | — | | | — | | | — | | | — | | | — | | | — | | | 191 | | | 191 | | Contributions | — | | | — | | | — | | | — | | | — | | | — | | | — | | | — | | | — | | | 651 | | | 651 | | |
| Distributions | Distributions | — | | | — | | | — | | | — | | | — | | | — | | | — | | | — | | | (8,537) | | | (262) | | | (8,799) | | Distributions | — | | | — | | | — | | | — | | | — | | | — | | | — | | | — | | | (6,332) | | | (3,664) | | | (9,996) | | |
| | Amortization of equity based compensation | Amortization of equity based compensation | — | | | — | | | — | | | — | | | 14,761 | | | — | | | — | | | — | | | — | | | — | | | 14,761 | | Amortization of equity based compensation | — | | | — | | | — | | | — | | | 16,738 | | | — | | | — | | | — | | | — | | | — | | | 16,738 | | |
| Issuance of purchase right | | Issuance of purchase right | — | | | — | | | — | | | — | | | 8,425 | | | — | | | — | | | — | | | — | | | — | | | 8,425 | | |
| | Grants of restricted stock | 1,478 | | | 1 | | | — | | | — | | | (1) | | | — | | | — | | | — | | | — | | | — | | | — | | |
| | Purchase of treasury stock | Purchase of treasury stock | (40) | | | — | | | — | | | — | | | — | | | (637) | | | — | | | — | | | — | | | — | | | (637) | | Purchase of treasury stock | (210) | | | — | | | — | | | — | | | — | | | (1,688) | | | — | | | — | | | — | | | — | | | (1,688) | | |
| Re-issuance of treasury stock | Re-issuance of treasury stock | 68 | | | — | | | — | | | — | | | — | | | — | | | — | | | — | | | — | | | — | | | — | | Re-issuance of treasury stock | 1,466 | | | 1 | | | — | | | — | | | (1) | | | — | | | — | | | — | | | — | | | — | | | — | | |
| Shares acquired to satisfy minimum required federal and state tax withholding on vesting restricted stock and units | Shares acquired to satisfy minimum required federal and state tax withholding on vesting restricted stock and units | (461) | | | — | | | — | | | — | | | — | | | (8,083) | | | — | | | — | | | — | | | — | | | (8,083) | | Shares acquired to satisfy minimum required federal and state tax withholding on vesting restricted stock and units | (505) | | | — | | | — | | | — | | | — | | | (9,232) | | | — | | | — | | | — | | | — | | | (9,232) | | |
| Forfeitures | Forfeitures | (9) | | | — | | | — | | | — | | | — | | | — | | | — | | | — | | | — | | | — | | | — | | Forfeitures | (24) | | | — | | | — | | | — | | | — | | | — | | | — | | | — | | | — | | | — | | | — | | |
| Dividends declared | Dividends declared | — | | | — | | | — | | | — | | | — | | | — | | | (72,785) | | | — | | | — | | | — | | | (72,785) | | Dividends declared | | (58,621) | | | (58,621) | | |
| Stock dividends | 1,435 | | | 1 | | | 180 | | | — | | | 23,822 | | | — | | | (23,823) | | | — | | | — | | | — | | | — | | |
| | | Exchange of noncontrolling interest for common stock | Exchange of noncontrolling interest for common stock | 1,139 | | | 1 | | | (1,139) | | | (1) | | | 16,449 | | | — | | | — | | | 65 | | | (16,109) | | | — | | | 405 | | Exchange of noncontrolling interest for common stock | 6,779 | | | 7 | | | (6,779) | | | (7) | | | 92,540 | | | — | | | — | | | (4,915) | | | (87,564) | | | — | | | 61 | | |
| | CECL Adoption | | CECL Adoption | — | | | — | | | — | | | — | | | — | | | — | | | (5,797) | | | — | | | — | | | — | | | (5,797) | | |
| Net income (loss) | Net income (loss) | — | | | — | | | — | | | — | | | — | | | — | | | 54,419 | | | — | | | 6,939 | | | (754) | | | 60,604 | | Net income (loss) | — | | | — | | | — | | | — | | | — | | | — | | | (19,918) | | | — | | | (605) | | | 1,269 | | | (19,254) | | |
| Other comprehensive income (loss) | Other comprehensive income (loss) | — | | | — | | | — | | | — | | | — | | | — | | | — | | | 16,738 | | | 2,044 | | | — | | | 18,782 | | Other comprehensive income (loss) | — | | | — | | | — | | | — | | | — | | | — | | | — | | | (46,530) | | | (5,354) | | | — | | | (51,884) | | |
| Rebalancing of ownership percentage between Company and Operating Partnership | Rebalancing of ownership percentage between Company and Operating Partnership | — | | | — | | | — | | | — | | | 281 | | | — | | | — | | | 17 | | | (298) | | | — | | | — | | Rebalancing of ownership percentage between Company and Operating Partnership | — | | | — | | | — | | | — | | | (916) | | | — | | | — | | | 2,147 | | | (1,231) | | | — | | | — | | |
| Balance, June 30, 2019 | 107,551 | | | $ | 108 | | | 12,159 | | | $ | 12 | | | $ | 1,526,469 | | | $ | (41,535) | | | $ | (30,847) | | | $ | 12,171 | | | $ | 172,466 | | | $ | 9,230 | | | $ | 1,648,074 | | |
| Balance, June 30, 2020 | | Balance, June 30, 2020 | 115,015 | | | $ | 116 | | | 5,381 | | | $ | 5 | | | $ | 1,649,170 | | | $ | (53,619) | | | $ | (120,082) | | | $ | (45,080) | | | $ | 70,968 | | | $ | 6,902 | | | $ | 1,508,380 | | |
TheRefer to the accompanying notes are an integral part of theseto consolidated financial statements.
Ladder Capital Corp
Consolidated Statements of Cash Flows
(Dollars in Thousands)
(Unaudited)
| | | | Six Months Ended June 30, | | | | | | | | | | | | |
| | | 2020 | | 2019 | | | Six Months Ended June 30, |
| | | | | | | 2021 | | 2020 | |
| Cash flows from operating activities: | Cash flows from operating activities: | | | | | Cash flows from operating activities: | | | | |
| Net income (loss) | Net income (loss) | $ | (19,254) | | | $ | 60,604 | | | Net income (loss) | $ | 10,892 | | | $ | (19,254) | | |
| Adjustments to reconcile net income (loss) to net cash provided by (used in) operating activities: | Adjustments to reconcile net income (loss) to net cash provided by (used in) operating activities: | | | | Adjustments to reconcile net income (loss) to net cash provided by (used in) operating activities: | | | |
| (Gain) loss on extinguishment/defeasance of debt | (21,077) | | | 1,070 | | | |
| (Gain) loss on extinguishment of debt | | (Gain) loss on extinguishment of debt | 0 | | | (21,077) | | |
| Depreciation and amortization | Depreciation and amortization | 19,825 | | | 20,162 | | | Depreciation and amortization | 19,000 | | | 19,825 | | |
| Unrealized (gain) loss on derivative instruments | Unrealized (gain) loss on derivative instruments | 187 | | | (1,511) | | | Unrealized (gain) loss on derivative instruments | 667 | | | 187 | | |
| Unrealized (gain) loss on equity securities | Unrealized (gain) loss on equity securities | 132 | | | (1,088) | | | Unrealized (gain) loss on equity securities | 0 | | | 132 | | |
| Unrealized (gain) loss on Agency interest-only securities | Unrealized (gain) loss on Agency interest-only securities | (174) | | | (22) | | | Unrealized (gain) loss on Agency interest-only securities | 68 | | | (174) | | |
| Unrealized (gain) loss on investment in mutual fund | Unrealized (gain) loss on investment in mutual fund | (95) | | | (254) | | | Unrealized (gain) loss on investment in mutual fund | 0 | | | (95) | | |
| Provision for loan losses | 25,852 | | | 600 | | | |
| Impairment of real estate | — | | | 1,350 | | | |
| Provision for (release of) loan loss reserves | | Provision for (release of) loan loss reserves | (4,586) | | | 25,852 | | |
| | Amortization of equity based compensation | Amortization of equity based compensation | 16,738 | | | 14,761 | | | Amortization of equity based compensation | 8,801 | | | 16,738 | | |
| Amortization of deferred financing costs included in interest expense | Amortization of deferred financing costs included in interest expense | 7,705 | | | 5,721 | | | Amortization of deferred financing costs included in interest expense | 10,044 | | | 7,705 | | |
| Amortization of premium on mortgage loan financing | Amortization of premium on mortgage loan financing | (587) | | | (774) | | | Amortization of premium on mortgage loan financing | (662) | | | (587) | | |
| Amortization of above- and below-market lease intangibles | Amortization of above- and below-market lease intangibles | (1,187) | | | (397) | | | Amortization of above- and below-market lease intangibles | (963) | | | (1,187) | | |
| | Amortization of premium/(accretion) of discount and other fees on loans | Amortization of premium/(accretion) of discount and other fees on loans | (8,917) | | | (10,294) | | | Amortization of premium/(accretion) of discount and other fees on loans | (5,707) | | | (8,917) | | |
| Amortization of premium/(accretion) of discount and other fees on securities | Amortization of premium/(accretion) of discount and other fees on securities | 443 | | | (87) | | | Amortization of premium/(accretion) of discount and other fees on securities | 83 | | | 443 | | |
| Realized (gain) loss on sale of mortgage loan receivables held for sale | Realized (gain) loss on sale of mortgage loan receivables held for sale | (6,926) | | | (27,342) | | | Realized (gain) loss on sale of mortgage loan receivables held for sale | (3,392) | | | (6,926) | | |
| Realized (gain) loss on sale of mortgage loan receivables held for investment | Realized (gain) loss on sale of mortgage loan receivables held for investment | 6,665 | | | — | | | Realized (gain) loss on sale of mortgage loan receivables held for investment | 0 | | | 6,665 | | |
| Realized (gain) loss on disposition of loan | 51 | | | — | | | |
| Realized (gain) loss on disposition of loan via foreclosure | | Realized (gain) loss on disposition of loan via foreclosure | 26 | | | 51 | | |
| Realized (gain) loss on securities | Realized (gain) loss on securities | 12,512 | | | (7,329) | | | Realized (gain) loss on securities | (594) | | | 12,512 | | |
| Realized (gain) loss on sale of real estate, net | Realized (gain) loss on sale of real estate, net | (10,528) | | | 1,119 | | | Realized (gain) loss on sale of real estate, net | (19,389) | | | (10,528) | | |
| | Realized gain on sale of derivative instruments | Realized gain on sale of derivative instruments | (211) | | | 108 | | | Realized gain on sale of derivative instruments | 0 | | | (211) | | |
| (Income) loss from investments in unconsolidated joint ventures in excess of distributions received | | (Income) loss from investments in unconsolidated joint ventures in excess of distributions received | (673) | | | (912) | | |
| Insurance proceeds for remediation work due to property damage | | Insurance proceeds for remediation work due to property damage | 1,345 | | | 0 | | |
| Insurance proceeds used for remediation work due to property damage | | Insurance proceeds used for remediation work due to property damage | (628) | | | 0 | | |
| Origination of mortgage loan receivables held for sale | Origination of mortgage loan receivables held for sale | (212,845) | | | (333,342) | | | Origination of mortgage loan receivables held for sale | (76,404) | | | (212,845) | | |
| | Repayment of mortgage loan receivables held for sale | Repayment of mortgage loan receivables held for sale | 292 | | | 370 | | | Repayment of mortgage loan receivables held for sale | 80 | | | 292 | | |
| Proceeds from sales of mortgage loan receivables held for sale | Proceeds from sales of mortgage loan receivables held for sale | 255,827 | | | 430,649 | | | Proceeds from sales of mortgage loan receivables held for sale | 51,052 | | | 255,827 | | |
| (Income) loss from investments in unconsolidated joint ventures in excess of distributions received | (912) | | | (2,522) | | | |
| Distributions from operations of investment in unconsolidated joint ventures | — | | | 3,067 | | | |
| | Deferred tax asset (liability) | Deferred tax asset (liability) | 9,914 | | | 6,336 | | | Deferred tax asset (liability) | (8) | | | 9,914 | | |
| | Changes in operating assets and liabilities: | Changes in operating assets and liabilities: | | | | | Changes in operating assets and liabilities: | | | | |
| | Accrued interest receivable | Accrued interest receivable | 2,284 | | | 2,705 | | | Accrued interest receivable | 3,148 | | | 2,284 | | |
| Other assets | Other assets | (15,361) | | | (6,310) | | | Other assets | (314) | | | (15,361) | | |
| Accrued expenses and other liabilities | (16,900) | | | (24,805) | | | |
| Net cash provided by (used in) operating activities | 43,453 | | | 132,545 | | | |
| | | | Six Months Ended June 30, | | | Six Months Ended June 30, |
| | | 2020 | | 2019 | | | 2021 | | 2020 | |
| | Accrued expenses and other liabilities | | Accrued expenses and other liabilities | (1,634) | | | (16,900) | | |
| Net cash provided by (used in) operating activities | | Net cash provided by (used in) operating activities | (9,748) | | | 43,453 | | |
| | Cash flows from investing activities: | Cash flows from investing activities: | | | | | Cash flows from investing activities: | | | | |
| | Origination of mortgage loan receivables held for investment | Origination of mortgage loan receivables held for investment | (334,347) | | | (484,496) | | | Origination of mortgage loan receivables held for investment | (795,716) | | | (334,347) | | |
| | Purchases of mortgage loan receivables held for investment | | Purchases of mortgage loan receivables held for investment | 0 | | | 0 | | |
| Repayment of mortgage loan receivables held for investment | Repayment of mortgage loan receivables held for investment | 437,525 | | | 781,916 | | | Repayment of mortgage loan receivables held for investment | 603,006 | | | 437,525 | | |
| Proceeds from sale of mortgage loan receivables held for investment, at amortized cost | Proceeds from sale of mortgage loan receivables held for investment, at amortized cost | 165,364 | | | — | | | Proceeds from sale of mortgage loan receivables held for investment, at amortized cost | 46,557 | | | 165,364 | | |
| Purchases of real estate securities | Purchases of real estate securities | (438,546) | | | (827,999) | | | Purchases of real estate securities | (101,358) | | | (438,546) | | |
| Repayment of real estate securities | Repayment of real estate securities | 63,032 | | | 110,443 | | | Repayment of real estate securities | 106,253 | | | 63,032 | | |
| Basis recovery of Agency interest-only securities | Basis recovery of Agency interest-only securities | 3,853 | | | 6,413 | | | Basis recovery of Agency interest-only securities | 3,678 | | | 3,853 | | |
| Proceeds from sales of real estate securities | Proceeds from sales of real estate securities | 532,460 | | | 384,356 | | | Proceeds from sales of real estate securities | 339,238 | | | 532,460 | | |
| Purchases of real estate | Purchases of real estate | (6,239) | | | (5,071) | | | Purchases of real estate | 0 | | | (6,239) | | |
| Capital improvements of real estate | Capital improvements of real estate | (1,980) | | | (1,707) | | | Capital improvements of real estate | (1,619) | | | (1,980) | | |
| Proceeds from sale of real estate | Proceeds from sale of real estate | 11,426 | | | 8,521 | | | Proceeds from sale of real estate | 82,482 | | | 11,426 | | |
| Capital contributions and advances to investment in unconsolidated joint ventures | — | | | (56,424) | | | |
| | Capital distribution from investment in unconsolidated joint ventures | Capital distribution from investment in unconsolidated joint ventures | 426 | | | 38,625 | | | Capital distribution from investment in unconsolidated joint ventures | 9,107 | | | 426 | | |
| | Capitalization of interest on investment in unconsolidated joint ventures | — | | | (142) | | | |
| Purchase of FHLB stock | — | | | (3,704) | | | |
| | | Proceeds from sale of FHLB stock | | Proceeds from sale of FHLB stock | 18,040 | | | 0 | | |
| Purchase of derivative instruments | Purchase of derivative instruments | (111) | | | (159) | | | Purchase of derivative instruments | 0 | | | (111) | | |
| Sale of derivative instruments | Sale of derivative instruments | 446 | | | 50 | | | Sale of derivative instruments | 0 | | | 446 | | |
| Property insurance proceeds | | Property insurance proceeds | 634 | | | 0 | | |
| | Net cash provided by (used in) investing activities | Net cash provided by (used in) investing activities | 433,309 | | | (49,378) | | | Net cash provided by (used in) investing activities | 310,302 | | | 433,309 | | |
| Cash flows from financing activities: | Cash flows from financing activities: | | | | | Cash flows from financing activities: | | | | |
| Deferred financing costs paid | Deferred financing costs paid | (17,370) | | | (4,453) | | | Deferred financing costs paid | (10,107) | | | (17,370) | | |
| Proceeds from borrowings under debt obligations | Proceeds from borrowings under debt obligations | 8,046,797 | | | 6,377,515 | | | Proceeds from borrowings under debt obligations | 3,153,332 | | | 8,046,797 | | |
| Repayment of borrowings under debt obligations | Repayment of borrowings under debt obligations | (7,902,356) | | | (6,213,678) | | | Repayment of borrowings under debt obligations | (3,385,290) | | | (7,902,356) | | |
| Cash dividends paid to Class A common shareholders | (73,735) | | | (108,240) | | | |
| | Capital distributed to noncontrolling interests in operating partnership | (6,332) | | | (8,537) | | | |
| Capital contributed by noncontrolling interests in consolidated joint ventures | 651 | | | 191 | | | |
| Capital distributed to noncontrolling interests in consolidated joint ventures | (3,664) | | | (262) | | | |
| | Payment of liability assumed in exchange for shares for the minimum withholding taxes on vesting restricted stock | (9,232) | | | (8,083) | | | |
| Purchase of treasury stock | (1,688) | | | (637) | | | |
| | Issuance of purchase right | 8,425 | | | — | | | |
| Net cash provided by (used in) financing activities | 41,496 | | | 33,816 | | | |
| Net increase (decrease) in cash, cash equivalents and restricted cash | 518,258 | | | 116,983 | | | |
| Cash, cash equivalents and restricted cash at beginning of period | 355,746 | | | 98,450 | | | |
| Cash, cash equivalents and restricted cash at end of period | $ | 874,004 | | | $ | 215,433 | | | |
|
| | | | | Six Months Ended June 30, |
| | | | 2021 | | 2020 | |
| Cash dividends paid to Class A common shareholders | | Cash dividends paid to Class A common shareholders | (51,068) | | | (73,735) | | |
| | | | Six Months Ended June 30, | | |
| | | 2020 | | 2019 | | |
| | Capital distributed to noncontrolling interests in operating partnership | | Capital distributed to noncontrolling interests in operating partnership | 0 | | | (6,332) | | |
| Capital contributed by noncontrolling interests in consolidated joint ventures | | Capital contributed by noncontrolling interests in consolidated joint ventures | 0 | | | 651 | | |
| Capital distributed to noncontrolling interests in consolidated joint ventures | | Capital distributed to noncontrolling interests in consolidated joint ventures | (285) | | | (3,664) | | |
| | Payment of liability assumed in exchange for shares for the minimum withholding taxes on vesting restricted stock | | Payment of liability assumed in exchange for shares for the minimum withholding taxes on vesting restricted stock | (4,421) | | | (9,232) | | |
| Purchase of treasury stock | | Purchase of treasury stock | (1,312) | | | (1,688) | | |
| | Issuance of Purchase Right | | Issuance of Purchase Right | 0 | | | 8,425 | | |
| Net cash provided by (used in) financing activities | | Net cash provided by (used in) financing activities | (299,151) | | | 41,496 | | |
| Net increase (decrease) in cash, cash equivalents and restricted cash | | Net increase (decrease) in cash, cash equivalents and restricted cash | 1,403 | | | 518,258 | | |
| Cash, cash equivalents and restricted cash at beginning of period | | Cash, cash equivalents and restricted cash at beginning of period | 1,284,284 | | | 355,746 | | |
| Cash, cash equivalents and restricted cash at end of period | | Cash, cash equivalents and restricted cash at end of period | $ | 1,285,687 | | | $ | 874,004 | | |
| | Supplemental information: | Supplemental information: | | | | | Supplemental information: | | | | |
| Cash paid for interest, net of amounts capitalized | Cash paid for interest, net of amounts capitalized | $ | 98,220 | | | $ | 98,832 | | | Cash paid for interest, net of amounts capitalized | $ | 86,254 | | | $ | 98,220 | | |
| Cash paid (received) for income taxes | Cash paid (received) for income taxes | (38) | | | 3,591 | | | Cash paid (received) for income taxes | 235 | | | (38) | | |
| | Non-cash investing and financing activities: | Non-cash investing and financing activities: | | | | | Non-cash investing and financing activities: | | | | |
| | Securities and derivatives sold, not settled | | Securities and derivatives sold, not settled | 10 | | | 5 | | |
| | Repayment in transit of mortgage loans receivable held for investment (other assets) | Repayment in transit of mortgage loans receivable held for investment (other assets) | 9,078 | | | — | | | Repayment in transit of mortgage loans receivable held for investment (other assets) | 414 | | | 9,078 | | |
| Repayment of mortgage loans receivable held for sale | — | | | 127 | | | |
| | Settlement of mortgage loan receivable held for investment by real estate, net | Settlement of mortgage loan receivable held for investment by real estate, net | (25,177) | | | (17,851) | | | Settlement of mortgage loan receivable held for investment by real estate, net | (43,129) | | | (25,177) | | |
| Transfer from mortgage loans receivable held for sale to mortgage loans receivable held for investment, net, at amortized cost | — | | | 15,504 | | | |
| | | Real estate acquired in settlement of mortgage loan receivable held for investment, net | Real estate acquired in settlement of mortgage loan receivable held for investment, net | 25,435 | | | 17,851 | | | Real estate acquired in settlement of mortgage loan receivable held for investment, net | 43,750 | | | 25,435 | | |
| Net settlement of sale of real estate, subject to debt - real estate | Net settlement of sale of real estate, subject to debt - real estate | (19,098) | | | (7,144) | | | Net settlement of sale of real estate, subject to debt - real estate | 0 | | | (19,098) | | |
| Net settlement of sale of real estate, subject to debt - debt obligations | Net settlement of sale of real estate, subject to debt - debt obligations | 19,098 | | | 7,144 | | | Net settlement of sale of real estate, subject to debt - debt obligations | 0 | | | 19,098 | | |
| | Exchange of noncontrolling interest for common stock | Exchange of noncontrolling interest for common stock | 87,571 | | | 16,109 | | | Exchange of noncontrolling interest for common stock | 0 | | | 87,571 | | |
| | Change in deferred tax asset related to exchanges of noncontrolling interest for common stock | Change in deferred tax asset related to exchanges of noncontrolling interest for common stock | 61 | | | — | | | Change in deferred tax asset related to exchanges of noncontrolling interest for common stock | 0 | | | 61 | | |
| Increase in amount payable pursuant to tax receivable agreement | — | | | (11) | | | |
| | Rebalancing of ownership percentage between Company and Operating Partnership | Rebalancing of ownership percentage between Company and Operating Partnership | (1,231) | | | (298) | | | Rebalancing of ownership percentage between Company and Operating Partnership | 0 | | | (1,231) | | |
| Dividends declared, not paid | Dividends declared, not paid | 23,583 | | | 1,860 | | | Dividends declared, not paid | 26,955 | | | 23,583 | | |
| Stock dividends | — | | | 23,823 | | | |
| |
The following table provides a reconciliation of cash, cash equivalents and restricted cash reported within the consolidated balance sheets that sum to the total of the same such amounts shown in the consolidated statement of cash flows ($ in thousands):
| | | June 30, 2020 | | June 30, 2019 | | December 31, 2019 | | | June 30, 2021 | | June 30, 2020 | | December 31, 2020 | |
| | Cash and cash equivalents | Cash and cash equivalents | $ | 826,059 | | | $ | 126,529 | | | $ | 58,171 | | | Cash and cash equivalents | $ | 1,169,843 | | | $ | 826,059 | | | $ | 1,254,432 | | |
| Restricted cash | Restricted cash | 47,945 | | | 88,904 | | | 297,575 | | | Restricted cash | 115,844 | | | 47,945 | | | 29,852 | | |
| Total cash, cash equivalents and restricted cash shown in the consolidated statement of cash flows | Total cash, cash equivalents and restricted cash shown in the consolidated statement of cash flows | $ | 874,004 | | | $ | 215,433 | | | $ | 355,746 | | | Total cash, cash equivalents and restricted cash shown in the consolidated statement of cash flows | $ | 1,285,687 | | | $ | 874,004 | | | $ | 1,284,284 | | |
TheRefer to the accompanying notes are an integral part of theseto consolidated financial statements.
Ladder Capital Corp
Notes to Consolidated Financial Statements
(Unaudited)
1. ORGANIZATION AND OPERATIONS
Ladder Capital Corp is an internally-managed real estate investment trust (“REIT”) that is a leader in commercial real estate finance. Ladder originatesWe originate and investsinvest in a diverse portfolio of commercial real estate and real estate-related assets, focusing on senior secured assets. Ladder’sOur investment activities include: (i) direct originationour primary business of originating senior first mortgage fixed and floating rate loans collateralized by commercial real estate first mortgage loans;with flexible loan structures; (ii) investmentsinvesting in investment grade securities secured by first mortgage loans on commercial real estate; and (iii) investments in net leasedowning and otheroperating commercial real estate, equity.including net leased commercial properties. Ladder Capital Corp, as the general partner of Ladder Capital Finance Holdings LLLP (“LCFH,” “Predecessor”LCFH” or the “Operating Partnership”), operates the Ladder Capital business through LCFH and its subsidiaries. As of June 30, 2020,2021, Ladder Capital Corp has a 95.5%100.0% economic interest in LCFH and controls the management of LCFH as a result of its ability to appoint its board members. Accordingly, Ladder Capital Corp consolidates the financial results of LCFH and its subsidiaries and records a noncontrolling interest for the economic interest in LCFH held by certain existing owners of LCFH, who were limited partners of LCFH prior to Ladder Capital Corp’s initial public offering (“IPO”) and continue to hold an economic interest in LCFH and voting shares of Ladder Capital Corp Class B common stock (the “Continuing LCFH Limited Partners”). LCFH is a Variable Interest Entity (“VIE”) and, as such, substantially all of the consolidated balance sheet is a consolidated VIE.subsidiaries. In addition, Ladder Capital Corp, through certain subsidiaries which are treated as taxable REIT subsidiaries (each a “TRS”), is indirectly subject to U.S. federal, state and local income taxes. Other than the noncontrolling interest in the Operating Partnership and such indirect U.S. federal, state and local income taxes, there are no material differences between Ladder Capital Corp’s consolidated financial statements and LCFH’s consolidated financial statements.
Ladder Capital Corp was formed as a Delaware corporation on May 21, 2013. The Company conducted its IPOinitial public offering (“IPO”) which closed on February 11, 2014. The Company used the net proceeds from the IPO to purchase newly issued limited partnership units (“LP Units”) from LCFH. In connection with the IPO, Ladder Capital Corp also became a holding corporation and the general partner of, and obtained a controlling interest in, LCFH. Ladder Capital Corp’s only business is to act as the general partner of LCFH, and, as such, Ladder Capital Corp indirectly operates and controls all of the business and affairs of LCFH and its subsidiaries. The IPO transactions described herein are referred to as the “IPO Transactions.”
Pursuant to LCFH’s Third Amended and Restated LLLP Agreement, dated as of December 31, 2014 and as amended, and subject to the applicable minimum retained ownership requirements and certain other restrictions, including notice requirements, Continuing LCFH Limited Partners (or certain transferees thereof) may, subject to certain conditions, receive one share of the Company’s Class A common stock in exchange for (i) one share of the Company’s Class B common stock, (ii) one Series REIT LP Unit and (iii) either one Series TRS LP Unit or one TRS Share, subject to equitable adjustments for stock splits, stock dividends and reclassifications. However, such exchange for shares of Ladder Capital Corp Class A common stock will not affect the exchanging owners’ voting power since the votes represented by the canceled shares of Ladder Capital Corp Class B common stock will be replaced with the votes represented by the shares of Class A common stock for which such Series Units, including TRS Shares as applicable, will be exchanged.
As a result of the Company’s ownership interest in LCFH and LCFH’s election under Section 754 of the Code, the Company expects to benefit from depreciation and other tax deductions reflecting LCFH’s tax basis for its assets. Those deductions will be allocated to the Company and will be taken into account in reporting the Company’s taxable income.
COVID-19 Impact on the Organization
On March 11, 2020, the World Health Organization declared the novel strain of coronavirus (“COVID-19”) a global pandemic and recommended containment and mitigation measures worldwide. As of the date of this filing, the majority of our employees continue to work remotely. We continue to actively manage the liquidity and operations of the Company in light of the market disruption caused by,conditions and the overall financial impact of the COVID-19 pandemic across most industries in the United States. Due toIn view of the ongoing uncertainty related to the severity and duration of the pandemic, its ultimate impact on our revenues, profitability and financial position isremains difficult to assess at this time. Refer to the Notes to the Consolidated Financial Statements for further disclosure on the current and potential impact of the COVID-19 global pandemic on our business.
2. SIGNIFICANT ACCOUNTING POLICIES
Basis of Presentation
The Company conducted a more extensive going concern analysis as a result of market conditions at June 30, 2020.
As the COVID-19 crisis evolved, management implemented a plan to increase liquidity resources and pay down debt. The Company maintained an unrestricted cash position of $826.1 million as of June 30, 2020 to mitigate uncertainty in liquidity needs in light of market conditions and, during the three months ended June 30, 2020, the Company paid down over $1.0 billion of mark-to-market debt. As of March 31, 2020, partly as a result of maintaining higher levels of cash, the Company was not in compliance with its 3.5x covenant ratio with certain of its lenders; however, the Company cured such non-compliance through pay downs of debt with various counterparties during the cure period. The Company was in compliance with all financial covenants as of June 30, 2020 (refer to Note 7, Debt Obligations, Net). Management has evaluated current market conditions and expects that the Company’s current cash resources, operating cash flows and ability to obtain financing will be sufficient to sustain operations for a period greater than one year from the issuance date of this Quarterly Report. The Company incurred $2.1 million of professional fees, included in operating expenses, and $0.2 million of severance costs, included in salaries and employee benefits, due to measures implemented to date in direct response to the COVID-19 pandemic.
Basis of Accounting and Principles of Consolidation
The accompanying consolidated financial statements of the Company have been prepared in accordance with accounting principles generally accepted in the United States (“GAAP”). In the opinion of management, the unaudited financial information for the interim periods presented in this report reflects all normal and recurring adjustments necessary for a fair statement of results of operations, financial position and cash flows. The interim consolidated financial statements should be read in conjunction with the audited consolidated financial statements for the year ended December 31, 2019,2020, which are included in the Annual Report, as certain disclosures that would substantially duplicate those contained in the audited consolidated financial statements have not been included in this interim report. Operating results for interim periods are not necessarily indicative of operating results for an entire fiscal year.
The consolidated financial statements include the Company’s accounts and those of its subsidiaries which are majority-owned and/or controlled by the Company and variable interest entities for which the Company has determined itself to be the primary beneficiary, if any. All significant intercompany transactions and balances have been eliminated.
Financial Accounting Standards Board (“FASB”) Accounting Standards Codification (“ASC”) Topic 810 — Consolidation (“ASC 810”), provides guidance on the identification of entities for which control is achieved through means other than voting rights (“variable interest entities” or “VIEs”) and the determination of which business enterprise, if any, should consolidate the VIEs. Generally, the consideration of whether an entity is a VIE applies when either: (1) the equity investors (if any) lack one or more of the essential characteristics of a controlling financial interest; (2) the equity investment at risk is insufficient to finance that entity’s activities without additional subordinated financial support; or (3) the equity investors have voting rights that are not proportionate to their economic interests and the activities of the entity involve or are conducted on behalf of an investor with a disproportionately small voting interest. The Company consolidates VIEs in which it is considered to be the primary beneficiary. The primary beneficiary is the entity that has both of the following characteristics: (1) the power to direct the activities that, when taken together, most significantly impact the VIE’s performance; and (2) the obligation to absorb losses and right to receive the returns from the VIE that would be significant to the VIE. See Note 10, Consolidated Variable Interest Entities, for further information on the Company’s consolidated variable interest entities.
Provision for Loan Losses
The Company uses a current expected credit loss model (“CECL”) for estimating the provision for loan losses reflectson its loan portfolio. The CECL model requires the Company’s estimateconsideration of loanpossible credit losses inherent inover the loan portfolio aslife of the balance sheet date. The provision for loan lossesan instrument and includes a portfolio-based current expected credit loss (“CECL”) component and an asset-specific component. In compliance with the new CECL reporting requirements, the Company has supplemented theits existing credit monitoring and management processes with additional processes to support the calculation of the CECL reserves. As part of that effort, the Company has engaged a third-party service provider to provide market data and a credit loss model. The credit loss model is a forward-looking, econometric, commercial real estate (“CRE”) loss forecasting tool. It is comprised of a probability of default (“PD”) model and a loss given default (“LGD”) model that, layered together with user’s loan-level data, selected forward-looking macroeconomic variables, and pool-level mean loss rates, produces life of loan expected losses (“EL”) at the loan and portfolio level. Where management has determined that the credit loss model does not fully capture certain external factors, including portfolio trends or loan-specific factors, a qualitative adjustment to the reserve, is recorded. The CECL model was implemented in 2020.
The asset-specific reserve component relates to reserves for losses on individually impaired loans. The Company evaluates each loan for impairment at least quarterly. Impairment occurs when it is deemed probable that the Company will not be able to collect all amounts due according to the contractual terms of the loan. If the loan is considered to be impaired, an allowance is recorded to reduce the carrying value of the loan to the present value of the expected future cash flows discounted at the loan’s effective rate or the fair value of the collateral, less the estimated costs to sell, if recovery of the Company’s investment is expected solely from the collateral. The Company generally willmay use the direct capitalization rate valuation methodology or the sales comparison approach to estimate the fair value of the collateral for such loans and in certain cases will obtain external appraisals.appraisals and take into account potential sale bids. Determining fair value of the collateral may take into account a number of assumptions including, but not limited to, cash flow projections, market capitalization rates, discount rates and data regarding recent comparable sales of similar properties. Such assumptions are generally based on current market conditions and are subject to economic and market uncertainties.
The Company’s loans are typically collateralized by real estate directly or indirectly. As a result, the Company regularly evaluates the extent and impact of any credit deterioration associated with the performance and/or value of the underlying collateral property as well as the financial and operating capability of the borrower/sponsor on a loan-by-loan basis. Specifically, a property’s operating results and any cash reserves are analyzed and used to assess (i) whether cash flow from operations is sufficient to cover the debt service requirements currently and into the future, (ii) the ability of the borrower to refinance the loan at maturity, and/or (iii) the property’s liquidation value. The Company also evaluates the financial wherewithal of any loan guarantors as well as the borrower’s competency in managing and operating the properties. In addition, the Company considers the overall economic environment, real estate sector, and geographic submarket in which the collateral property is located. Such impairment analyses are completed and reviewed by asset management and underwriting personnel, who utilize various data sources, including (i) periodic financial data such as property occupancy, tenant profile, rental rates, operating expenses, the borrowers’ business plan, and capitalization and discount rates, (ii) site inspections, and (iii) current credit spreads and other market data and ultimately presented to management for approval.
A loan is also considered impaired if its terms are modified in a troubled debt restructuring (“TDR”). A TDR occurs when a concession is granted and the debtor is experiencing financial difficulties. Impairments on TDR loans are generally measured based on the present value of expected future cash flows discounted at the effective interest rate of the original loans. Generally, when granting concessions, the Company will seek to protect its position by requiring incremental pay downs, additional collateral or guarantees and, in some cases, lookback features or equity interests to offset concessions granted should conditions impacting the loan improve. The Company’s determination of credit losses is impacted by TDRs whereby loans that have gone through TDRs are considered impaired and are assessed for specific reserves, and are not included in the Company’s assessment of the CECL reserve.reserves. Loans previously restructured under TDRs that subsequently default are reassessed to incorporate the Company’s current assumptions on expected cash flows and additional provision expense is recorded to the extent necessary.
The Company designates non-accrual loans at such time asgenerally when (i) the principal or coupon interest components of loan payments become 90-days past due or (ii) in the opinion of the Company, it is probabledoubtful the Company will be unableable to collect all amounts due according to the contractual terms of the loan. IncomeInterest income on non-accrual loans in which the Company reasonably expects a full recovery of the loan’s outstanding principal balance is recognized when received in cash. Otherwise, income recognition will be suspended when a loan is designated non-accrual and resumed only when the suspended loan becomes contractually current and performance is demonstrated to have resumed. Any interestany cash received for loans on non-accrual status will be applied as a reduction to the unpaidamortized cost. A non-accrual loan is returned to accrual status at such time as the loan becomes contractually current and future principal balance.and coupon interest are reasonably assured to be received in accordance with the contractual loan terms. A loan will be written off when management has determined it is no longer realizable and legally discharged.deemed non-recoverable.
Reclassifications
The Company reclassified its FHLB (as defined below) stock into other assets as of January 1, 2021, as such, the amount of $31.0 million from December 31, 2020 was reclassified into other assets on the Consolidated Balance Sheet. As of June 30, 2021, the book value of our investment in FHLB Stock was $13.0 million.
Recently Adopted Accounting Pronouncements
In June 2016, the Financial Accounting Standards Board (“FASB”) issued Accounting Standards Update (“ASU”) 2016-13Financial Instruments - Credit Losses - Measurement of Credit Losses on Financial Instruments (Topic 326) (“ASU 2016-13”) and in April 2019, the FASB issued ASU 2019-04 Codification Improvements to Topic 326, Financial Instruments-Credit Losses, Topic 815, Derivatives and Hedging, and Topic 825, Financial Instruments (“ASU 2019-04”), collectively, the “CECL Standard.” These updates change how entities measure potential credit losses for most financial assets and certain other instruments that are not measured at fair value. The CECL Standard replaced the “incurred loss” approach under previous guidance with an “expected loss” model for instruments measured at amortized cost. The net carrying value of an asset under the CECL Standard is intended to represent the amount expected to be collected on such asset and requires entities to deduct allowances for potential losses on held-to-maturity debt securities. The Company will continue to record asset-specific reserves consistent with our existing accounting policy. In addition, the Company will now record a general reserve in accordance with the CECL Standard on the remainder of the loan portfolio (“CECL Reserve”). At adoption, on January 1, 2020, the Company recorded a CECL Reserve of $11.6 million, which equated to 0.36% of $3.2 billion carrying value of its held for investment loan portfolio. This reserve excluded 3 loans that previously had an aggregate of $14.7 million of asset-specific reserves and a carrying value of $39.8 million as of January 1, 2020. Upon adoption, the aggregated CECL Reserve reduced total shareholder’s equity by $5.8 million (or approximately $0.05 of book value per share of common stock).
In August 2018, the FASB issued ASU 2018-13, Fair Value Measurement, (Topic 820): Disclosure Framework—Changes to the Disclosure Requirements for Fair Value Measurement, (“ASU 2018-13”). ASU 2018-13 eliminates, adds and modifies certain disclosure requirements for fair value measurements as part of its disclosure framework project. The standard is effective for all entities for financial statements issued for fiscal years beginning after December 15, 2019, and interim periods within those fiscal years. The adoption of ASU 2018-13 had no material impact on the Company’s consolidated financial statements.
In October 2018, the FASB issued ASU 2018-17, Consolidation (Topic 810): Targeted Improvements to Related Party Guidance for Variable Interest Entities, (“ASU 2018-17”). ASU 2018-17 requires reporting entities to consider indirect interests held through related parties under common control on a proportional basis rather than as the equivalent of a direct interest in its entirety for determining whether a decision-making fee is a variable interest. The standard is effective for all entities for financial statements issued for fiscal years beginning after December 15, 2019, and interim periods within those fiscal years. Early adoption is permitted. Entities are required to apply the amendments in ASU 2018-17 retrospectively with a cumulative-effect adjustment to retained earnings at the beginning of the earliest period presented. The adoption of ASU 2018-17 had no material impact on the Company’s consolidated financial statements.
In April 2019, the FASB issued ASU 2019-04, Codification Improvements to Topic 326, Financial Instruments—Credit Losses, Topic 815, Derivatives and Hedging, and Topic 825, Financial Instruments, (“ASU 2019-04”). ASU 2019-04 clarifies and improves areas of guidance related to the recently issued standards on credit losses (ASU 2016-13), hedging (ASU 2017-12), and recognition and measurement of financial instruments (ASU 2016-01). The amendments generally have the same effective dates as their related standards. If already adopted, the amendments of ASU 2016-01 and ASU 2016-13 are effective for fiscal years beginning after December 15, 2019 and the amendments of ASU 2017-12 are effective as of the beginning of the Company’s next annual reporting period; early adoption is permitted. The Company previously adopted ASU 2016-01. The adoption of ASU 2019-04 had no material impact on the Company’s consolidated financial statements.
In March 2020, the FASB issued ASU 2020-03, Codification Improvements to Financial Instruments, (“ASU 2020-03”). ASU 2020-03 improves various financial instruments topics, including the CECL Standard. ASU 2020-03 includes seven different issues that describe the areas of improvement and the related amendments to GAAP, intended to make the standards easier to understand and apply by eliminating inconsistencies and providing clarifications. The amendments related to Issue 1, Issue 2, Issue 4 and Issue 5 were effective upon issuance of ASU 2020-03. The amendments related to Issue 3, Issue 6 and Issue 7 were effective for the Company beginning on January 1, 2020. The adoption of ASU 2020-03 had no material impact on the Company’s consolidated financial statements.
In March 2020, the FASB issued ASU 2020-04, Reference Rate Reform (Topic 848): Facilitation of the Effects of Reference Rate Reform on Financial Reporting, (“ASU 2020-04”). ASU 2020-04 provides optional expedients and exceptions for applying GAAP to contracts, hedging relationships and other transactions that reference the London Interbank Offered Rate (“LIBOR”) or another reference rate expected to be discontinued because of reference rate reform. ASU 2020-04 is effective upon issuance of ASU 2020-04 for contract modifications and hedging relationships on a prospective basis. While the Company is currently assessing the impact of ASU 2020-04, the Company does not expect the adoption to have a material impact on itsthe Company’s consolidated financial statements.
In December 2019, the FASB issued ASU 2019-12, Income Taxes (Topic 815), (“ASU 2019-12”). ASU 2019-12 simplifies the accounting for income taxes by removing certain exceptions to the general principles in Topic 740. ASU 2019-12 also improves the consistent application of, and simplifies, GAAP for other areas of Topic 740 by clarifying and amending existing guidance. The standard is effective for all entities for financial statements issued for fiscal years beginning after December 15, 2020, and interim periods within those fiscal years. The adoption of ASU 2019-12 did not have a material impact on the Company’s consolidated financial statements.
In October 2020, the FASB issued ASU 2020-08, Codification Improvements to Subtopic 310-20, Receivables–Nonrefundable Fees and Other Costs, (“ASU 2020-08”). This ASU clarifies that an entity should reevaluate whether a callable debt security is within the scope of ASC paragraph 310-20-35-33 for each reporting period. The guidance is effective for public business entities for fiscal years, and interim periods within those fiscal years, beginning after December 15, 2020. All entities should apply ASU 2020-08 on a prospective basis as of the beginning of the period of adoption for existing or newly purchased callable debt securities. The adoption of ASU 2020-08 did not have a material impact on the consolidated financial statements.
Recent Accounting Pronouncements Pending Adoption
In December 2019, the FASB issued ASU 2019-12, Income Taxes (Topic 815), (“ASU 2019-12”). ASU 2019-12 simplifies the accounting for income taxes by removing certain exceptions to the general principles in Topic 740. ASU 2019-12 also improves the consistent application of, and simplifies, GAAP for other areas of Topic 740 by clarifying and amending existing guidance. The standard is effective for all entities for financial statements issued for fiscal years beginning after December 15, 2020, and interim periods within those fiscal years. Early adoption is permitted. The Company does not expect the adoption of ASU 2019-12 to have a material impact on its consolidated financial statements.
Any new accounting standards not disclosed above that have been issued or proposed by FASB and that do not require adoption until a future date are not expected to have a material impact on the consolidated financial statements upon adoption.
3. MORTGAGE LOAN RECEIVABLES
June 30, 20202021 ($ in thousands)
| | | Outstanding
Face Amount | | Carrying
Value | | Weighted
Average
Yield (1) | | Remaining
Maturity
(years) | | Outstanding
Face Amount | | Carrying
Value | | Weighted
Average
Yield (1)(2) | | Remaining
Maturity
(years) |
| | Mortgage loan receivables held for investment, net, at amortized cost: | Mortgage loan receivables held for investment, net, at amortized cost: | | Mortgage loan receivables held for investment, net, at amortized cost: | | | | | | | |
| Mortgage loans held by consolidated subsidiaries: | | |
| First mortgage loans | First mortgage loans | $ | 2,848,829 | | | $ | 2,832,610 | | | 6.65 | % | | 1.15 | First mortgage loans | $ | 2,430,910 | | | $ | 2,414,167 | | | 5.94 | % | | 1.83 |
| Mezzanine loans | Mezzanine loans | 122,793 | | | 122,474 | | | 10.84 | % | | 2.91 | Mezzanine loans | 117,103 | | | 116,881 | | | 10.91 | % | | 2.56 |
| Total mortgage loans held by consolidated subsidiaries | 2,971,622 | | | 2,955,084 | | | 6.82 | % | | 1.22 | |
| Total mortgage loans | | Total mortgage loans | 2,548,013 | | | 2,531,048 | | | 6.17 | % | | 1.86 |
| | Allowance for loan losses | N/A | | (49,102) | | | |
| Allowance for credit losses | | Allowance for credit losses | N/A | | (35,891) | | |
| Total mortgage loan receivables held for investment, net, at amortized cost | Total mortgage loan receivables held for investment, net, at amortized cost | 2,971,622 | | | 2,905,982 | | | Total mortgage loan receivables held for investment, net, at amortized cost | 2,548,013 | | | 2,495,157 | | |
| Mortgage loan receivables held for sale: | Mortgage loan receivables held for sale: | | Mortgage loan receivables held for sale: | |
| First mortgage loans | First mortgage loans | 86,456 | | | 85,977 | | | 3.94 | % | | 9.70 | First mortgage loans | 59,198 | | | 59,182 | | | 4.25 % | | 9.81 |
| Total | Total | $ | 3,058,078 | | | $ | 2,991,959 | | | 6.85 | % | | 1.48 | Total | $ | 2,607,211 | | | $ | 2,554,339 | | | 6.12 | % | | 2.04 |
(1)Includes the impact from interest rate floors. June 30, 20202021 LIBOR rates are used to calculate weighted average yield for floating rate loans.
(2)Excludes non-accrual loans of $129.5 million. Refer to “Non-Accrual Status” below for further details.
As of June 30, 2020, $2.42021, $2.1 billion, or 80.8%84.3%, of the outstanding face amount of our mortgage loan receivables held for investment, net, at amortized cost, were at variable interest rates, linked to LIBOR. Of this $2.4$2.1 billion, 100% of these variable interest rate mortgage loan receivables were subject to interest rate floors. As of June 30, 2020, $86.52021, $59.2 million, or 100%, of the outstanding face amount of our mortgage loan receivables held for sale were at fixed interest rates.
December 31, 20192020 ($ in thousands)
| | | Outstanding
Face Amount | | Carrying
Value | | Weighted
Average
Yield (1) | | Remaining
Maturity
(years) | | Outstanding
Face Amount | | Carrying
Value | | Weighted
Average
Yield (1)(2) | | Remaining
Maturity
(years) |
| | Mortgage loan receivables held for investment, net, at amortized cost: | Mortgage loan receivables held for investment, net, at amortized cost: | | Mortgage loan receivables held for investment, net, at amortized cost: | | | | | | | |
| Mortgage loans held by consolidated subsidiaries: | | |
| First mortgage loans | First mortgage loans | $ | 3,147,275 | | | $ | 3,127,173 | | | 6.77 | % | | 1.35 | First mortgage loans | $ | 2,243,639 | | | $ | 2,232,749 | | | 6.50 % | | 1.00 |
| Mezzanine loans | Mezzanine loans | 130,322 | | | 129,863 | | | 10.97 | % | | 3.26 | Mezzanine loans | 121,565 | | | 121,310 | | | 10.83 % | | 2.42 |
| Total mortgage loans held by consolidated subsidiaries | 3,277,597 | | | 3,257,036 | | | 6.94 | % | | 1.43 | |
| Total mortgage loans | | Total mortgage loans | 2,365,204 | | | 2,354,059 | | | 6.65 % | | 1.07 |
| | Allowance for loan losses | N/A | | (20,500) | | | |
| Allowance for credit losses | | Allowance for credit losses | N/A | | (41,507) | | |
| Total mortgage loan receivables held for investment, net, at amortized cost | Total mortgage loan receivables held for investment, net, at amortized cost | 3,277,597 | | | 3,236,536 | | | Total mortgage loan receivables held for investment, net, at amortized cost | 2,365,204 | | | 2,312,552 | | |
| Mortgage loan receivables held for sale: | Mortgage loan receivables held for sale: | | Mortgage loan receivables held for sale: | |
| First mortgage loans | First mortgage loans | 122,748 | | | 122,325 | | | 4.20 | % | | 9.99 | First mortgage loans | 30,478 | | | 30,518 | | | 4.05 % | | 9.18 |
| Total | Total | $ | 3,400,345 | | | $ | 3,358,861 | | | 6.88 | % | | 1.75 | Total | $ | 2,395,682 | | | $ | 2,343,070 | | | 6.74 % | | 1.23 |
(1)Includes the impact from interest rate floors. December 31, 20192020 LIBOR rates are used to calculate weighted average yield for floating rate loans.
As of December 31, 2019, $2.52020, $1.9 billion, or 77.2%82.0%, of the outstanding principalface amount of our mortgage loan receivables held for investment, net, at amortized cost, were at variable interest rates, linked to LIBOR or a replacement index generally determined in our discretion.LIBOR. Of this $2.5$1.9 billion, 100% of these variable rate mortgage loan receivables were subject to interest rate floors. As of December 31, 2019, $122.72020, $30.5 million, or 100%, of the carrying valueoutstanding face amount of our mortgage loan receivables held for sale were at fixed interest rates.
For the six months ended June 30, 20202021 and 2019,2020, the activity in our loan portfolio was as follows ($ in thousands):
| | | Mortgage loan receivables held for investment, net, at amortized cost: | | | | Mortgage loan receivables held for investment, net, at amortized cost: | |
| | | Mortgage loans held by consolidated subsidiaries | | | Provision expense for current expected credit loss | | Mortgage loan
receivables held
for sale | | Mortgage loans receivable | | | Allowance for credit losses | | Mortgage loan
receivables held
for sale |
| | Balance, December 31, 2019 | $ | 3,257,036 | | | | $ | (20,500) | | | $ | 122,325 | | |
| Balance, December 31, 2020 | | Balance, December 31, 2020 | $ | 2,354,059 | | | | $ | (41,507) | | | $ | 30,518 | |
| Origination of mortgage loan receivables | Origination of mortgage loan receivables | 334,347 | | | | — | | | 212,845 | | Origination of mortgage loan receivables | 795,717 | | | | — | | | 76,404 | |
| | Repayment of mortgage loan receivables | Repayment of mortgage loan receivables | (446,080) | | | | — | | | (292) | | Repayment of mortgage loan receivables | (532,878) | | | | — | | | (80) | |
| Proceeds (losses) from sales of mortgage loan receivables | (165,364) | | | | — | | | (255,827) | | |
| Proceeds from sales of mortgage loan receivables | | Proceeds from sales of mortgage loan receivables | (46,557) | | | | — | | | (51,052) | |
| Non-cash disposition of loans via foreclosure(1) | Non-cash disposition of loans via foreclosure(1) | (27,107) | | | | — | | | — | | Non-cash disposition of loans via foreclosure(1) | (45,000) | | | | — | | | 0 | |
| Sale of loans, net | Sale of loans, net | (6,665) | | | | — | | | 6,926 | | Sale of loans, net | 0 | | | | — | | | 3,392 | |
| | Accretion/amortization of discount, premium and other fees | Accretion/amortization of discount, premium and other fees | 8,917 | | | | — | | | — | | Accretion/amortization of discount, premium and other fees | 5,707 | | | | — | | | 0 | |
| | Release of asset-specific loan loss provision via foreclosure(1) | Release of asset-specific loan loss provision via foreclosure(1) | — | | | | 2,000 | | | | Release of asset-specific loan loss provision via foreclosure(1) | — | | | | 1,150 | | | — | |
| Provision expense for current expected credit loss (implementation impact)(2) | — | | | | (4,964) | | | | |
| Provision expense for current expected credit loss, net (impact to earnings)(2) | — | | | | (17,638) | | | | |
| Additional asset-specific reserve | — | | | | (8,000) | | | — | | |
| Balance, June 30, 2020 | $ | 2,955,084 | | | | $ | (49,102) | | | $ | 85,977 | | |
| Provision for current expected credit loss, net (impact to earnings) | | Provision for current expected credit loss, net (impact to earnings) | — | | | | 4,466 | | | — | |
| | Balance, June 30, 2021 | | Balance, June 30, 2021 | $ | 2,531,048 | | | | $ | (35,891) | | | $ | 59,182 | |
(1)Refer to Note 5 Real Estate and Related Lease Intangibles, Net for further detail on foreclosure of real estate.
| | | | | | | | | | | | | | | | | | | |
| Mortgage loan receivables held for investment, net, at amortized cost: | | |
| | Mortgage loans receivable | | | | Allowance for credit losses | | Mortgage loan
receivables held
for sale |
| Balance, December 31, 2019 | $ | 3,257,036 | | | | | $ | (20,500) | | | $ | 122,325 | |
| Origination of mortgage loan receivables | 334,347 | | | | | — | | | 212,845 | |
| | | | | | | |
| Repayment of mortgage loan receivables | (446,080) | | | | | — | | | (292) | |
| Proceeds from sales of mortgage loan receivables | (165,364) | | | | | — | | | (255,827) | |
| Non-cash disposition of loan via foreclosure(1) | (27,107) | | | | | — | | | 0 | |
| Sale of loans, net | (6,665) | | | | | — | | | 6,926 | |
| | | | | | | |
| Accretion/amortization of discount, premium and other fees | 8,917 | | | | | — | | | 0 | |
| | | | | | | |
| Release of asset-specific loan loss provision via foreclosure(1) | — | | | | | 2,000 | | | — | |
| Provision expense for current expected credit loss(implementation impact)(2) | — | | | | | (4,964) | | | — | |
| Provision expense for current expected credit loss (impact to earnings)(2) | — | | | | | (17,638) | | | — | |
| Additional asset-specific reserve | — | | | | | (8,000) | | | — | |
| Balance, June 30, 2020 | $ | 2,955,084 | | | | | $ | (49,102) | | | $ | 85,977 | |
(1)Refer to Note 5, Real Estate and Related Lease Intangibles, Net for further detail on real estate acquired via foreclosure.
(2)During the sixthree months ended June 30,March 31, 2020, the initial impact of the implementation of the CECL accounting standard as of January 1, 2020 is recorded against retained earnings. Subsequent remeasurement thereafter, including the period to date change for the six months ended June 30, 2020, is accounted for as provision expense for current expected credit loss in the consolidated statements of income.
| | | | | | | | | | | | | | | | | | | | | | | |
| Mortgage loan receivables held for investment, net, at amortized cost: | | | | | | |
| | Mortgage loans held by consolidated subsidiaries | | Mortgage loans transferred but not considered sold | | Provision for loan losses | | Mortgage loan
receivables held
for sale |
| | | | | | | |
| Balance, December 31, 2018 | $ | 3,318,390 | | | $ | — | | | $ | (17,900) | | | $ | 182,439 | |
| Origination of mortgage loan receivables | 484,496 | | | — | | | — | | | 333,342 | |
| | | | | | | |
| Repayment of mortgage loan receivables | (693,323) | | | — | | | — | | | (497) | |
| Proceeds from sales of mortgage loan receivables | — | | | (15,504) | | | — | | | (415,145) | |
| | | | | | | |
| Sale of loans, net | — | | | — | | | — | | | 27,342 | |
| Transfer between held for investment and held for sale(1) | — | | | 15,504 | | | — | | | (15,504) | |
| Accretion/amortization of discount, premium and other fees | 10,294 | | | — | | | — | | | — | |
| Provision for/(release of) loan loss reserves | — | | | — | | | (600) | | | — | |
| Balance, June 30, 2019 | $ | 3,119,857 | | | $ | — | | | $ | (18,500) | | | $ | 111,977 | |
(1)We sell certain loans into securitizations; however, for a transfer of financial assets to be considered a sale, the transfer must meet the sale criteria of ASC 860 under which the Company must surrender control over the transferred assets which must qualify as recognized financial assets at the time of transfer. The assets must be isolated from the Company, even in bankruptcy or other receivership, the purchaser must have the right to pledge or sell the assets transferred and the Company may not have an option or obligation to reacquire the assets. If the sale criteria are not met, the transfer is considered to be a secured borrowing, the assets remain on the Company’s consolidated balance sheets and the sale proceeds are recognized as a liability. During the three months ended March 31, 2019, the Company reclassified from mortgage loan receivables held for sale to mortgage loans transferred but not considered sold, at amortized cost, one loan with an outstanding face amount of $15.4 million, a book value of $15.5 million (fair value at the date of reclassification) and a remaining maturity of 9.8 years, which was sold to the WFCM 2019-C49 securitization trust. Subsequent to March 31, 2019, the controlling loan interest was sold to the UBS 2019-C16 securitization trust, and as a result, the loan previously sold during the three months ended March 31, 2019 was accounted for as a sale during the six months ended June 30, 2019.
During the three and six months ended June 30, 2020, the transfers of financial assets via sales of loans were treated as sales under ASC Topic 860 — Transfers and Servicing. During the three and six months ended June 30, 2019, the transfers of financial assets via sales of loans were treated as sales under ASC Topic 860 — Transfers and Servicing, except for the one loan discussed above.
As of June 30, 20202021 and December 31, 2019,2020, there was $0.4were $0.5 million of unamortized discounts included in our mortgage loan receivables held for investment, net, at amortized cost, on our consolidated balance sheets.
Allowance for LoanCredit Losses and Non-Accrual Status ($ in thousands)
| | | | | | | | | | | | | | | | | | | | | | | | | | |
| Three Months Ended June 30, | | | | Six Months Ended June 30, | | | | | |
| | 2020 | | 2019 | | 2020 | | 2019 | | | |
| | | | | | | | | | |
| Allowance for loan losses at beginning of period | $ | 49,457 | | | $ | 18,200 | | | $ | 20,500 | | | $ | 17,900 | | | | |
| Provision expense for current expected credit loss (implementation impact) | — | | | — | | | 4,964 | | | — | | | | |
| Provision expense for current expected credit loss, net (impact to earnings) | (355) | | | 300 | | | 17,638 | | | 600 | | | | |
| Additional asset-specific reserve | — | | | — | | | 8,000 | | | — | | | | |
| Foreclosure of loans subject to asset-specific reserve | — | | | — | | | (2,000) | | | — | | | | |
| | | | | | | | | | |
| | | | | | | | | | |
| Allowance for loan losses at end of period | $ | 49,102 | | | $ | 18,500 | | | $ | 49,102 | | | $ | 18,500 | | | | |
| | | | | | | | | | |
| June 30, 2020 | | December 31, 2019 | | | | | | | |
| | | | | | | | | | |
| Principal balance of loans on non-accrual status | $ | 185,896 | | (1) | $ | 98,725 | | (2) | | | | | | |
| | | | | | | | | | | | | | | | | | | | | | | | | | | | | | | | | | | |
| | | | Three Months Ended June 30, | | Six Months Ended June 30, | | | |
| Allowance for Credit Losses | | | | | | 2021 | | 2020 | | 2021 | | 2020 | | | |
| | | | | | | | | | | | | | | |
| Allowance for credit losses at beginning of period | | | | | | $ | 36,241 | | | $ | 49,457 | | | $ | 41,507 | | | $ | 20,500 | | | | |
| Provision for current expected credit loss (implementation impact) | | | | | | 0 | | | 0 | | | 0 | | | 4,964 | | (1) | | |
| Provision for current expected credit loss, net (impact to earnings)(2) | | | | | | (350) | | | (355) | | | (4,466) | | | 25,638 | | | | |
| | | | | | | | | | | | | | | |
| | | | | | | | | | | | | | | |
| Foreclosure of loans subject to asset-specific reserve | | | | | | 0 | | | 0 | | | (1,150) | | | (2,000) | | | | |
| | | | | | | | | | | | | | | |
| | | | | | | | | | | | | | | |
| Allowance for credit losses at end of period | | | | | | $ | 35,891 | | | $ | 49,102 | | | $ | 35,891 | | | $ | 49,102 | | | | |
| | | | | | | | | | | | | | | |
| | | | | | | | | | | | | | | |
(1)Additional provisions for current expected credit losses related to implementation of $0.8 million and $22.0 thousand related to unfunded commitments and held-to-maturity securities, respectively, were recorded on January 1, 2020 at implementation of CECL. (2)For the three months ended June 30, 2021 and 2020 the total provision release consisted of $0.4 million in general reserves and no asset-specific reserves. | | | |
| | | |
| | | | | | | | | | | | | | | |
| Non-Accrual Status | | | | | | | | | | June 30, 2021 | | December 31, 2020 | | | |
| Carrying value of loans on non-accrual status, net of asset-specific reserve | | | | | | | | | | $ | 129,468 | | (1)(2) | $ | 175,022 | | (3) | | |
| | | | | | | | | | | | | | | |
| | | | | | | | | | | | | | | |
| | | | | | | | | | | | | | | |
(1)Represents 2 of the Company’s loans, which were originated simultaneously as part of a single transaction and had a combined carrying value of $26.9$24.2 million, 2 loans with a combined carrying value of $45.9$26.3 million, 1 loan with a carrying value of $61.5$36.4 million, 1 loan with a carrying value of $4.1 million, 1 loan with a carrying value of $8.0$12.1 million, and 1 loan with a carrying value of $39.5 million, as further discussed below.$30.5 million.
(2) Subsequent to June 30, 2021, the Company resolved 1 of its non-accrual loans with a carrying value of $12.1 million. The Company received a full pay-off which included all accrued interest and fees.
(3) Represents 2 of the Company’s loans, which were originated simultaneously as part of a single transaction and had a combined carrying value of $26.9$24.2 million, 2 loans with a combined carrying value of $27.1 million, 1 loan with a carrying value of $10.4$36.4 million, 1 loan with a carrying value of $13.0 million, 1 loan with a carrying value of $30.6 million and 1 loan with a carrying value of $61.5$43.8 million as further discussed below.which was foreclosed on and sold in 2021.
Current Expected Credit Loss (“CECL”)
In compliance with the new CECL reporting requirements, the Company has supplemented the existing credit monitoring and management processes with additional processes to support the calculation of the CECL reserves. Based on the Company’s process, at adoption, onOn January 1, 2020, the Company recorded a CECL Reserve of $11.6 million, which equated to 0.36% of $3.2 billion carrying value of its held for investment loan portfolio. This reserve excluded 3 loans that previously had an aggregate of $14.7 million of asset-specific reserves and a carrying value of $39.8 million as of January 1, 2020. Upon adoption, the aggregated CECL Reserve reduced total shareholder’s equity by $5.8 million (or approximately $0.05 of book value per share of common stock). million.
As of June 30, 2020,2021, the Company released CECL reserveshas a $36.3 million allowance for current expected credit losses, of $(0.7)which $35.9 million for a total CECL reserve of $29.4 million.pertains to mortgage loan receivables. This excludes fiveallowance includes 3 loans that previously hadhave an aggregate of $20.7$20.2 million of asset-specific reserves andagainst a carrying value of $76.9$70.7 million as of June 30, 2020. 2021.
The total change in reserve for provision for the six months ended June 30, 2021 was a release of $(0.7) million$4.6 million. The release represents a decline in the current quarter is reflected as a decrease ongeneral reserve provision expense of $(0.3)loans held for investment of $4.5 million and a decrease in reservethe release on unfunded loan commitments of $(0.4)$0.1 million. These decreases areThe release during the year is primarily due to the decreasean improvement in the size of our loan portfolio, partially offset by an update of the macro economic assumptions usedassumptions. For additional information, refer to “Allowance for Credit Losses and Non-Accrual Status” in Note 3, Mortgage Loan Receivables, to the Company’s CECL evaluation in the current quarter.consolidated financial statements.
The Company has concluded that none of its loans, other than the 43 loans discussed below, are individually impaired as of June 30, 2020.2021.
Loan Portfolio by Geographic Region, Property Type and Vintage ($(amortized cost $ in thousands)
| | | | | | | | | | | | | | | | | | | | | | |
| | June 30, | | December 31, | | | | | | | | |
| Geographic Region | | 2021 | | 2020 | | | | | | | | |
| | | | | | | | |
| | | | | | | | | | | | |
| Northeast | | $ | 688,885 | | | $ | 707,485 | | | | | | | | | |
| Southwest | | 435,247 | | | 437,153 | | | | | | | | | |
| South | | 584,708 | | | 313,759 | | | | | | | | | |
| Midwest | | 336,273 | | | 462,602 | | | | | | | | | |
| West | | 415,284 | | | 316,620 | | | | | | | | | |
| Subtotal loans | | 2,460,397 | | | 2,237,619 | | | | | | | | | |
| Individually impaired loans(1) | | 70,651 | | | 116,440 | | | | | | | | | |
| Total loans | | $ | 2,531,048 | | | $ | 2,354,059 | | | | | | | | | |
| | | | | | | | | | | | | | | | |
| | Amortized Cost | | | | | | | | |
Geographic Region | | | | | | | | | | |
| | | | | | | | | | |
Northeast | | $ | 785,000 | | | | | | | | | |
Southwest | | 588,046 | | | | | | | | | |
Midwest | | 585,505 | | | | | | | | | |
South | | 512,314 | | | | | | | | | |
West | | 407,286 | | | | | | | | | |
Subtotal loans | | 2,878,151 | | | | | | | | | |
Individually impaired loans(1) | | 76,933 | | | | | | | | | |
Total loans | | $ | 2,955,084 | | | | | | | | | |
Management’s method for monitoring credit is the performance of a loan. A loan is impaired or not impaired based on the expectation that all amounts contractually due under a loan will be collected when due. The primary credit quality indicator management utilizes to assess its current expected credit loss reserve is by viewing Ladder’s loan portfolio by collateral type. The following table summarizestables as of June 30, 2021 and December 31, 2020, summarize the assessed amortized cost of the loan portfolio by property type ($ in thousands).:
| | | Vintage | | | | | Amortized Cost Basis by Origination Year as of June 30, 2021 | | |
| Property Type | Property Type | | 2020 | | 2019 | | 2018 | | 2017 | | 2016 and Earlier | | Total | | Property Type | | 2021 | | 2020 | | 2019 | | 2018 | | 2017 and Earlier | | Total | |
| | Office | | Office | | $ | 261,182 | | | $ | 29,548 | | | $ | 187,005 | | | $ | 206,888 | | | $ | 118,911 | | | $ | 803,534 | | |
| Multifamily | Multifamily | | $ | 65,228 | | | $ | 323,178 | | | $ | 147,460 | | | $ | 31,872 | | | $ | 11,772 | | | $ | 579,510 | | | Multifamily | | 175,376 | | | 15,083 | | | 196,426 | | | 13,451 | | | 21,085 | | | 421,421 | | |
| Office | | 51,658 | | | 216,946 | | | 388,721 | | | 160,288 | | | 52,086 | | | 869,699 | | | |
| Mixed Use | | Mixed Use | | 193,744 | | | 79,254 | | | 147,437 | | | 0 | | | 0 | | | 420,435 | | |
| Hospitality | Hospitality | | — | | | 83,018 | | | 143,681 | | | 67,446 | | | 123,630 | | | 417,775 | | | Hospitality | | 0 | | | 0 | | | 43,621 | | | 139,777 | | | 111,089 | | | 294,487 | | |
| Mixed Use | | 52,515 | | | 101,436 | | | 5,092 | | | 47,849 | | | — | | | 206,892 | | | |
| Retail | Retail | | — | | | 141,842 | | | 25,029 | | | — | | | 65,823 | | | 232,694 | | | Retail | | 29,395 | | | 0 | | | 85,268 | | | 0 | | | 36,514 | | | 151,177 | | |
| Manufactured Housing | | Manufactured Housing | | 59,641 | | | 0 | | | 43,383 | | | 11,741 | | | 3,951 | | | 118,716 | | |
| Industrial | | Industrial | | 0 | | | 0 | | | 105,283 | | | 0 | | | 6,453 | | | 111,736 | | |
| Other | Other | | 57,528 | | | 130,025 | | | 82,353 | | | — | | | — | | | 269,906 | | | Other | | 20,802 | | | 0 | | | 44,842 | | | 30,033 | | | 0 | | | 95,677 | | |
| Industrial | | 51,964 | | | 114,987 | | | — | | | — | | | 6,476 | | | 173,427 | | | |
| Manufactured Housing | | 4,545 | | | 56,918 | | | 11,702 | | | — | | | 3,970 | | | 77,135 | | | |
| Self-Storage | Self-Storage | | — | | | 35,936 | | | 15,177 | | | — | | | — | | | 51,113 | | | Self-Storage | | 43,214 | | | 0 | | | 0 | | | 0 | | | 0 | | | 43,214 | | |
| | Subtotal loans | Subtotal loans | | 283,438 | | | 1,204,286 | | | 819,215 | | | 307,455 | | | 263,757 | | | 2,878,151 | | | Subtotal loans | | 783,354 | | | 123,885 | | | 853,265 | | | 401,890 | | | 298,003 | | | 2,460,397 | | |
| Individually Impaired loans (1) | Individually Impaired loans (1) | | — | | | — | | | 4,143 | | | | | 72,790 | | | 76,933 | | | Individually Impaired loans (1) | | 0 | | | 0 | | | 0 | | | 0 | | | 70,651 | | | 70,651 | | |
| Total loans | | $ | 283,438 | | | $ | 1,204,286 | | | $ | 823,358 | | | $ | 307,455 | | | $ | 336,547 | | | $ | 2,955,084 | | | |
| Total loans (2) | | Total loans (2) | | $ | 783,354 | | | $ | 123,885 | | | $ | 853,265 | | | $ | 401,890 | | | $ | 368,654 | | | $ | 2,531,048 | | |
| | | | | | | | | | | | | | | | | | | | | | | | | | | | | | | | | | | | | | | | | | | | | | |
| | Amortized Cost Basis by Origination Year as of December 31, 2020 | | | | | | |
| Property Type | | 2020 | | 2019 | | 2018 | | 2017 | | 2016 and Earlier | | Total | | | | | | | |
| | | | | | | | | | | | | | | | | | | | |
| Office | | $ | 0 | | | $ | 196,610 | | | $ | 249,330 | | | $ | 83,673 | | | $ | 50,935 | | | $ | 580,548 | | | | | | | | | |
| Multifamily | | 65,537 | | | 260,254 | | | 44,665 | | | 24,406 | | | 0 | | | 394,862 | | | | | | | | | |
| Hospitality | | 0 | | | 43,000 | | | 139,394 | | | 67,307 | | | 78,694 | | | 328,395 | | | | | | | | | |
| Other | | 31,217 | | | 131,434 | | | 77,484 | | | 0 | | | 0 | | | 240,135 | | | | | | | | | |
| Mixed Use | | 106,537 | | | 101,704 | | | 0 | | | 13,268 | | | 0 | | | 221,509 | | | | | | | | | |
| Retail | | 0 | | | 110,492 | | | 0 | | | 0 | | | 65,734 | | | 176,226 | | | | | | | | | |
| Industrial | | 46,130 | | | 114,630 | | | 0 | | | 0 | | | 6,461 | | | 167,221 | | | | | | | | | |
| Manufactured Housing | | 4,553 | | | 57,305 | | | 11,718 | | | 0 | | | 3,961 | | | 77,537 | | | | | | | | | |
| Self-Storage | | 0 | | | 35,986 | | | 15,200 | | | 0 | | | 0 | | | 51,186 | | | | | | | | | |
| Subtotal loans | | 253,974 | | | 1,051,415 | | | 537,791 | | | 188,654 | | | 205,785 | | | 2,237,619 | | | | | | | | | |
| Individually Impaired loans (1) | | 0 | | | 0 | | | 44,952 | | | 0 | | | 71,488 | | | 116,440 | | | | | | | | | |
| Total loans (3) | | $ | 253,974 | | | $ | 1,051,415 | | | $ | 582,743 | | | $ | 188,654 | | | $ | 277,273 | | | $ | 2,354,059 | | | | | | | | | |
(1)Included in individually impairedRefer to “Individually Impaired Loans” below for further detail.
(2)Not included above is $11.9 million of accrued interest receivable on all loans are 2at June 30, 2021.
(3)Not included above is $14.5 million of accrued interest receivable on all loans which were originated in 2016 simultaneously as part of a single transaction with a combined amortized cost of $26.9 million, collateralized by a mixed use property located in the Northeast region, 1 loan, which was originated in 2016 and subsequently restructured into 2 loans in 2018, with a combined amortized cost of $45.9 million, collateralized by a mixed use property located in the Northeast region, and 1 loan, originated in 2018, with a amortized cost of $4.1 million, collateralized by a hotel located in the Midwest region. The above individually impaired loans’ amortized cost basis excludes asset-specific provisions totaling $20.7 million.at December 31, 2020.
Individually Impaired Loans
As of June 30, 2020,2021, 2 loans with an amortized cost basis of the Company’s$26.9 million and a combined carrying value of $24.2 million were impaired and on non-accrual status. The loans are collateralized by a mixed use property in the Northeast region, which were originated simultaneously as part of a single transaction and had a carrying value of $26.9 million, were in default. These loans are directly and indirectly secured by the same property. The Company placed these loans on non-accrual status in July 2017. In assessing these collateral-dependent loans for impairment, the most significant consideration is the fair value of the underlying real estate collateral, which includes an in-place long-dated retail lease. The value of such property is most significantly affected by the contractual lease terms and the appropriate market capitalization rates, which are driven by the property’s market strength, the general interest rate environment and the retail tenant’s creditworthiness. In view of these considerations, the Company uses a direct capitalization rate valuation methodology to calculate the fair value of the underlying real estate collateral. During the three months ended March 31, 2018, management believed these loans to be impaired, reflecting a decline in collateral value attributable to: (i) on-going bankruptcy proceedings; (ii) rising interest rates; and (iii) the retail tenant’s creditworthiness. As a result, on March 31, 2018, theThe Company previously recorded an asset-specific provision for loss in 2018 on 1 of these loans, with a carrying value of $5.9 million, of $2.7 million to reduce the carrying value of thesethe 2 loans collectively to the fair value of the property less the cost to foreclose and sell the property utilizing direct capitalization rates of 4.70% to 5.00%. As of June 30, 2020,2021, the Company believed no additional loss provisiondetermined the loan was necessaryadequately provisioned based on the application of direct capitalization rates of 4.60%4.75% to 4.90%5.20%.
During the year ended December 31,In 2018, management identified a loan secured by a mixed-use office and hospitality property in the Northeast region, with a carrying value of $45.0 million, aswas determined to be impaired reflectingand a decline in collateral value attributable to: (i) recent and near term tenant vacancies at the property; (ii) new information available during the three months ended September 30, 2018 regarding the addition of supply that will increase the local submarket vacancy rate; and (iii) declining market conditions. A reserve of $10.0 million was recorded for this impaired loan in the three months ended September 30, 2018 to reduce the carrying value of the loan to the estimated fair value of the collateral, less the estimated costs to sell. The Company has placed this loan on non-accrual status as of September 30, 2018. DuringIn 2018, the quarter ended December 31, 2018, this loan experienced a maturity default and its terms were modified in a Troubled Debt Restructuringtroubled debt restructuring (“TDR”) on October 17, 2018. The terms of the TDR, which provided for, among other things, the restructuring of the Company’s existing $45.0 million first mortgage loan into a $35.0 million A-Note and a $10.0 million B-Note and a 19.0% equity interest which is not subject to dilution and that can be increased to 25% under certain conditions. Under certain conditions, the B-Note may be forgiven or reduced.B-Note. The reserve of $10.0 million was applied to the B-Note and the B-Note was placed on non-accrual status on October 17, 2018. Duringstatus. For the quarterthree months ended March 31, 2020, management identifieddetermined that the A-Note was impaired, reflecting a decline in collateral value due to: (i) new information available during the three months ended March 31, 2020 regarding two recent non-distressedcomparable sales of office buildings in the Wilmington, DE central business district;and (ii) a change in market conditions driven by COVID-19 as capital flow to the tertiary markets shifted given increased opportunities in primary markets; and (iii) the closure of the corporate housing component of the property.shifted. As a result, on March 31, 2020, the Company recorded an asset-specific provision for loss on the A-Note of $7.5 million to reduce the carrying value of this loan to the fair value of the property less the cost to foreclose and sell the property utilizing direct capitalization rates of 7.50% to 8.75%8.60%. The Company placed the A-Note on non-accrual status as of March 31, 2020. As of June 30, 2020,2021, the combined carrying valueamortized cost basis was $43.8 million, and after impairment of the A-Note and the B-Note of $17.5 million, the carrying value was $45.9$26.3 million. As of June 30, 2021, the Company determined the loan was adequately provisioned based on the application of direct capitalization rates of 8.25% to 8.75%.
As of June 30, 2020, one of the Company’s loans, collateralized by a hotel property, with a carrying value of $4.1 million, was in default. The Company placed this loan on non-accrual status in March 2020. The Company filed for foreclosure in December 2019 and did not believe there was an impairment at that time. In assessing this collateral-dependent loan for impairment, the most significant consideration is the fair value of the underlying real estate collateral. During the quarter ended March 31, 2020, management identified that the loan was impaired, reflecting a decline in collateral value due to indications of value from market participants with knowledge of the asset and the temporary closure of the nearby university and local businesses due to COVID-19. As a result, on March 31, 2020, the Company recorded an asset-specific provision for loss of $0.5 million to reduce the carrying value of this loan to the fair value of the property less the cost to foreclose and sell the property. As of June 30, 2020, the Company believed no additional loss provision was necessary based on the current value of the underlying collateral.
As of June 30, 2020,2021, there were no unfunded commitments associated with modified loans considered TDRs.
These non-recurring fair values are considered Level 3 measurements in the fair value hierarchy.
Other Loans on Non-Accrual Status
During the three months ended December 31, 2019, 1As of the Company’sJune 30, 2021, 3 other loans which hadwere on non-accrual status, with a combined carrying value of $61.5 million, was placed$79.0 million. The Company put such loans on non-accrual status. The Companystatus in the fourth quarter of 2020 and performed a review of the loan collateral.collateral for the loans. The review consisted of conversations with market participants familiar with the property locationlocations as well as reviewing market data and comparables. Based on this review, the Company determined that no asset-specific impairment was required for this loan. The Company will continue to monitor for impairment.
During the three months ended June 30, 2020, 1 of the Company’s loans, which had a carrying value of $8.0 million, was placed on non-accrual status. The Company performed a review of the loan collateral. The review consisted of conversations with market participants familiar with the property location as well as reviewing market data and comparables. Based on this review, the Company determined that no asset-specific impairment was required for this loan. The Company will continue to monitor for impairment.
During the three months ended June 30, 2020, 1 of the Company’s loans, which had a carrying value of $39.5 million, was placed on non-accrual status. The Company performed a review of the loan collateral. The review consisted of conversations with market participants familiar with the property location as well as reviewing market data and comparables. Based on this review, the Company determined that no asset-specific impairment was required for this loan. The Company will continue to monitor for impairment.comparable properties.
There are 0 other loans on non-accrual status other than those discussed in Individually Impaired Loans and Other Loans on Non-Accrual Status above as of June 30, 2020.2021.
Subsequent to June 30, 2021, the Company resolved 1 of its non-accrual loans with a carrying value of $12.1 million. The Company received a full pay-off which included all accrued interest and fees.
4. REAL ESTATE SECURITIES
Since the onset of the COVID-19 pandemic, there has been a decrease in liquidity and trading activity for the real estate securities we own. The Company invests in primarily AAA-rated real estate securities, typically front pay securities, with
relatively short duration and significant subordination. The hyperamortization features included in many of the securities positions we own help mitigate potential credit losses even in the current market conditions. During the three months ended June 30, 2020, liquidity and trading activity began to returnMarket conditions due to the marketCOVID-19 pandemic and the valueresulting economic disruption have broadly impacted the commercial real estate sector, including real estate securities. We continue to actively monitor the impacts of COVID-19 on our securities portfolio as of June 30, 2020 had an unrealized mark-to-market gain of $11.8 million. During the six months ended June 30, 2020, the market and the value of our securities portfolio were down. As of June 30, 2020 there was an unrealized mark-to-market loss of $63.6 million related to the six months ended June 30, 2020.portfolio.
CMBS,Commercial mortgage-backed securities (“CMBS”), CMBS interest-only securities, Agency securities, Government National Mortgage Association (“GNMA”) construction securities, GNMA permanent securities and corporate bonds are classified as available-for-sale and reported at fair value with changes in fair value recorded in the current period in other comprehensive income. GNMA and Federal Home Loan Mortgage Corp (“FHLMC”) securities (collectively, “Agency interest-only securities”) are recorded at fair value with changes in fair value recorded in current period earnings. Equity securities are reported at fair value with changes in fair value recorded in current period earnings. The following is a summary of the Company’s securities at June 30, 20202021 and December 31, 20192020 ($ in thousands):
June 30, 2021
| | | | | | | | | | | | | | | | | | | | | | | | | | | | | | | | | | | | | | | | | | | | | | | | | | | | | | | | | | | | | | |
| | | | | | | Gross Unrealized | | | | | | Weighted Average |
| Asset Type | | Outstanding
Face Amount | | Amortized Cost Basis | | Gains | | Losses | | Carrying
Value | | # of
Securities | | Rating (1) | | Coupon % | | Yield % | | Remaining
Duration
(years) |
| | | | | | | | | | | | | | | | | | | | |
| CMBS(2) | | $ | 677,025 | | | $ | 677,901 | | | $ | 1,726 | | | $ | (5,069) | | | $ | 674,558 | | | 72 | | | AAA | | 1.68 | % | | 1.65 % | | 2.07 |
| CMBS interest-only(2)(4) | | 1,399,645 | | | 18,072 | | | 748 | | | 0 | | | 18,820 | | | 14 | | | AAA | | 0.43 | % | | 2.00 % | | 2.01 |
| GNMA interest-only(4)(6) | | 63,305 | | | 635 | | | 145 | | | (81) | | | 699 | | | 14 | | | AA+ | | 0.40 | % | | 4.79 % | | 3.39 |
| Agency securities(2) | | 568 | | | 572 | | | 7 | | | 0 | | | 579 | | | 2 | | | AA+ | | 2.50 | % | | 1.60 % | | 0.97 |
| GNMA permanent securities(2) | | 24,040 | | | 24,171 | | | 376 | | | 0 | | | 24,547 | | | 3 | | | AA+ | | 4.12 | % | | 3.54 % | | 1.18 |
| Total debt securities | | $ | 2,164,583 | | | $ | 721,351 | | | $ | 3,002 | | | $ | (5,150) | | | $ | 719,203 | | | 105 | | | | | 0.86 | % | | 1.72 | % | | 2.04 |
| | | | | | | | | | | | | | | | | | | | |
| Provision for current expected credit losses | | N/A | | — | | | — | | | (20) | | | (20) | | | | | | | | | | | |
| Total real estate securities | | $ | 2,164,583 | | | $ | 721,351 | | | $ | 3,002 | | | $ | (5,170) | | | $ | 719,183 | | | 105 | | | | | | | | | |
December 31, 2020
| | | | | | | | | Gross Unrealized | | | | | | | Weighted Average | | | | | | | | Gross Unrealized | | | | | | Weighted Average |
| Asset Type | Asset Type | | Outstanding
Face Amount | | Amortized Cost Basis/Purchase Price
| | Gains | | Losses | | Carrying
Value | | # of
Securities | | Rating (1) | | Coupon % | | Yield % | | Remaining
Duration
(years) | Asset Type | | Outstanding
Face Amount | | Amortized
Cost Basis | | Gains | | Losses | | Carrying
Value | | # of
Securities | | Rating (1) | | Coupon % | | Yield % | | Remaining
Duration
(years) |
| | CMBS(2) | CMBS(2) | | $ | 1,496,090 | | | $ | 1,495,892 | | | $ | 212 | | | $ | (48,766) | | | $ | 1,447,338 | | (3) | 49 | | | AAA | | 1.51 | % | | 1.57 | % | | 2.27 | CMBS(2) | | $ | 1,015,520 | | | $ | 1,015,282 | | | $ | 1,382 | | | $ | (13,363) | | | $ | 1,003,301 | | (3) | 90 | | | AAA | | 1.56 | % | | 1.56 % | | 2.01 |
| CMBS interest-only(2)(4) | CMBS interest-only(2)(4) | | 1,535,739 | | | 25,026 | | | 488 | | | (4) | | | 25,510 | | (5) | 15 | | | AAA | | 0.45 | % | | 2.83 | % | | 2.34 | CMBS interest-only(2)(4) | | 1,498,181 | | | 21,567 | | | 672 | | | (26) | | | 22,213 | | (5) | 15 | | | AAA | | 0.44 | % | | 3.53 % | | 2.19 |
| GNMA interest-only(4)(6) | GNMA interest-only(4)(6) | | 93,464 | | | 1,335 | | | 204 | | | (161) | | | 1,378 | | | 14 | | | AA+ | | 0.45 | % | | 4.21 | % | | 3.18 | GNMA interest-only(4)(6) | | 75,350 | | | 868 | | | 232 | | | (100) | | | 1,000 | | | 11 | | | AA+ | | 0.43 | % | | 5.06 % | | 3.59 |
| Agency securities(2) | Agency securities(2) | | 610 | | | 619 | | | 17 | | | — | | | 636 | | | 2 | | | AA+ | | 2.61 | % | | 1.68 | % | | 1.56 | Agency securities(2) | | 586 | | | 593 | | | 12 | | | 0 | | | 605 | | | 2 | | | AA+ | | 2.55 | % | | 1.64 % | | 1.26 |
| GNMA permanent securities(2) | GNMA permanent securities(2) | | 30,853 | | | 31,006 | | | 864 | | | — | | | 31,870 | | | 6 | | | AA+ | | 3.89 | % | | 3.50 | % | | 2.41 | GNMA permanent securities(2) | | 30,254 | | | 30,340 | | | 859 | | | 0 | | | 31,199 | | | 5 | | | AA+ | | 3.87 | % | | 3.49 % | | 1.98 |
| | Total debt securities | Total debt securities | | $ | 3,156,756 | | | $ | 1,553,878 | | | $ | 1,785 | | | $ | (48,931) | | | $ | 1,506,732 | | | 86 | | | 0.98 | % | | 1.63 | % | | 2.27 | Total debt securities | | $ | 2,619,891 | | | $ | 1,068,650 | | | $ | 3,157 | | | $ | (13,489) | | | $ | 1,058,318 | | | 123 | | | 0.91 | % | | 1.66 | % | | 2.01 |
| Provision for current expected credit losses | | Provision for current expected credit losses | | N/A | | — | | | — | | | (20) | | | (20) | | |
| | Provision for current expected credit losses | | N/A | | — | | | — | | | (19) | | | (19) | | | |
| Total real estate securities | Total real estate securities | | $ | 3,156,756 | | | $ | 1,553,878 | | | $ | 1,785 | | | $ | (48,950) | | | $ | 1,506,713 | | | 86 | | | | | Total real estate securities | | $ | 2,619,891 | | | $ | 1,068,650 | | | $ | 3,157 | | | $ | (13,509) | | | $ | 1,058,298 | | | 123 | | | | |
(1)Represents the weighted average of the ratings of all securities in each asset type, expressed as an S&P equivalent rating. For each security rated by multiple rating agencies, the highest rating is used. Ratings provided were determined by third-party rating agencies as of a particular date, may not be current and are subject to change (including the assignment of a “negative outlook” or “credit watch”) at any time.
(2)CMBS, CMBS interest-only securities, Agency securities, GNMA permanent securities and corporate bonds are classified as available-for-sale and reported at fair value with changes in fair value recorded in the current period in other comprehensive income.
(3)IncludesAs of June 30, 2021 and December 31, 2020, respectively, includes $11.0 million and $11.1 million of restricted securities which are designated as risk retention securities under the Dodd-Frank Wall Street Reform and Consumer Protection Act of 2010 (the “Dodd-Frank Act”) and are therefore subject to transfer restrictions over the term of the securitization trust and are classified as held-to-maturity and reported at amortized cost.
(4)The amounts presented represent the principal amount of the mortgage loans outstanding in the pool in which the interest-only securities participate.
(5)IncludesAs of June 30, 2021 and December 31, 2020, respectively, includes $0.6 million and $0.7 million of restricted securities which are designated as risk retention securities under the Dodd-Frank Act and are therefore subject to transfer restrictions over the term of the securitization trust and are classified as held-to-maturity and reported at amortized cost.
(6)Agency interest-only securities are recorded at fair value with changes in fair value recorded in current period earnings. The Company’s Agency interest-only securities are considered to be hybrid financial instruments that contain embedded derivatives. As a result, the Company has elected to account for them as hybrid instruments in their entirety at fair value with changes in fair value recognized in unrealized gain (loss) on Agency interest-only securities in the consolidated statements of income in accordance with ASC 815.
(7)The Company has elected to account for equity securities at fair value with changes in fair value recorded in current period earnings.
December 31, 2019
| | | | | | | | | | | | | | | | | | | | | | | | | | | | | | | | | | | | | | | | | | | | | | | | | | | | | | | | | | | | | | |
| | | | | | | Gross Unrealized | | | | | | | | Weighted Average | | | | | | |
| Asset Type | | Outstanding
Face Amount | | Amortized
Cost Basis | | Gains | | Losses | | Carrying
Value | | # of
Securities | | Rating (1) | | Coupon % | | Yield % | | Remaining
Duration
(years) |
| | | | | | | | | | | | | | | | | | | | |
| CMBS(2) | | $ | 1,640,597 | | | $ | 1,640,905 | | | $ | 4,337 | | | $ | (920) | | | $ | 1,644,322 | | (3) | 125 | | | AAA | | 3.06 | % | | 3.08 | % | | 2.41 |
| CMBS interest-only(2)(4) | | 1,559,160 | | | 28,553 | | | 630 | | | (37) | | | 29,146 | | (5) | 15 | | | AAA | | 0.60 | % | | 3.04 | % | | 2.53 |
| GNMA interest-only(4)(6) | | 109,783 | | | 1,982 | | | 123 | | | (254) | | | 1,851 | | | 11 | | | AA+ | | 0.49 | % | | 4.59 | % | | 2.77 |
| Agency securities(2) | | 629 | | | 640 | | | 1 | | | (4) | | | 637 | | | 2 | | | AA+ | | 2.65 | % | | 1.73 | % | | 1.83 |
| GNMA permanent securities(2) | | 31,461 | | | 31,681 | | | 688 | | | — | | | 32,369 | | | 6 | | | AA+ | | 3.91 | % | | 3.17 | % | | 1.93 |
| | | | | | | | | | | | | | | | | | | | |
| Total debt securities | | $ | 3,341,630 | | | $ | 1,703,761 | | | $ | 5,779 | | | $ | (1,215) | | | $ | 1,708,325 | | | 159 | | | | | 1.84 | % | | 3.06 | % | | 2.39 |
| Equity securities(7) | | N/A | | 12,848 | | | 292 | | | (160) | | | 12,980 | | | 2 | | | N/A | | N/A | | N/A | | N/A |
| Total real estate securities | | $ | 3,341,630 | | | $ | 1,716,609 | | | $ | 6,071 | | | $ | (1,375) | | | $ | 1,721,305 | | | 161 | | | | | | | | | |
(1)Represents the weighted average of the ratings of all securities in each asset type, expressed as an S&P equivalent rating. For each security rated by multiple rating agencies, the highest rating is used. Ratings provided were determined by third-party rating agencies as of a particular date, may not be current and are subject to change (including the assignment of a “negative outlook” or “credit watch”) at any time.
(2)CMBS, CMBS interest-only securities, Agency securities, GNMA permanent securities and corporate bonds are classified as available-for-sale and reported at fair value with changes in fair value recorded in the current period in other comprehensive income.
(3)Includes $11.6 million of restricted securities which are designated as risk retention securities under the Dodd-Frank Act and are therefore subject to transfer restrictions over the term of the securitization trust and are classified as held-to-maturity and reported at amortized cost.
(4)The amounts presented represent the principal amount of the mortgage loans outstanding in the pool in which the interest-only securities participate.
(5)Includes $0.8 million of restricted securities which are designated as risk retention securities under the Dodd-Frank Act and are therefore subject to transfer restrictions over the term of the securitization trust and are classified as held-to-maturity and reported at amortized cost.
(6)Agency interest-only securities are recorded at fair value with changes in fair value recorded in current period earnings. The Company’s Agency interest-only securities are considered to be hybrid financial instruments that contain embedded derivatives. As a result, the Company accounts for them as hybrid instruments in their entirety at fair value with changes in fair value recognized in unrealized gain (loss) on Agency interest-only securities in the consolidated statements of income in accordance with ASC 815.
(7)The Company has elected to account for equity securities at fair value with changes in fair value recorded in current period earnings.
The following is a breakdown of the carrying value of the Company’s debt securities by remaining maturity based upon expected cash flows at June 30, 20202021 and December 31, 20192020 ($ in thousands):
June 30, 2021
| | | | | | | | | | | | | | | | | | | | | | | | | | | | | | | | |
| Asset Type | | Within 1 year | | 1-5 years | | 5-10 years | | After 10 years | | Total |
| | | | | | | | | | |
| CMBS | | $ | 296,214 | | | $ | 315,343 | | | $ | 54,231 | | | $ | 8,770 | | | $ | 674,558 | |
| CMBS interest-only | | 947 | | | 17,873 | | | 0 | | | 0 | | | 18,820 | |
| GNMA interest-only | | 67 | | | 433 | | | 199 | | | 0 | | | 699 | |
| Agency securities | | 508 | | | 71 | | | 0 | | | 0 | | | 579 | |
| GNMA permanent securities | | 0 | | | 24,547 | | | 0 | | | 0 | | | 24,547 | |
| | | | | | | | | | |
| Provision for current expected credit losses | | 0 | | | 0 | | | 0 | | | 0 | | | (20) | |
| Total debt securities | | $ | 297,736 | | | $ | 358,267 | | | $ | 54,430 | | | $ | 8,770 | | | $ | 719,183 | |
December 31, 2020
| | | | | | | | | | | | | | | | | | | | | | | | | | | | | | | | |
| Asset Type | | Within 1 year | | 1-5 years | | 5-10 years | | After 10 years | | Total |
| | | | | | | | | | |
| CMBS | | $ | 185,672 | | | $ | 1,212,532 | | | $ | 49,134 | | | $ | — | | | $ | 1,447,338 | |
| CMBS interest-only | | 920 | | | 24,590 | | | — | | | — | | | 25,510 | |
| GNMA interest-only | | 70 | | | 1,028 | | | 276 | | | 4 | | | 1,378 | |
| Agency securities | | — | | | 636 | | | — | | | — | | | 636 | |
| GNMA permanent securities | | 231 | | | 31,639 | | | — | | | — | | | 31,870 | |
| | | | | | | | | | |
| | | | | | | | | | |
| Total debt securities | | $ | 186,893 | | | $ | 1,270,425 | | | $ | 49,410 | | | $ | 4 | | | $ | 1,506,732 | |
December 31, 2019
| | Asset Type | Asset Type | | Within 1 year | | 1-5 years | | 5-10 years | | After 10 years | | Total | Asset Type | | Within 1 year | | 1-5 years | | 5-10 years | | After 10 years | | Total |
| | CMBS | CMBS | | $ | 177,193 | | | $ | 1,389,392 | | | $ | 77,737 | | | $ | — | | | $ | 1,644,322 | | CMBS | | $ | 230,977 | | | $ | 748,953 | | | $ | 23,371 | | | $ | 0 | | | $ | 1,003,301 | |
| CMBS interest-only | CMBS interest-only | | 1,439 | | | 27,707 | | | — | | | — | | | 29,146 | | CMBS interest-only | | 1,572 | | | 20,641 | | | 0 | | | 0 | | | 22,213 | |
| GNMA interest-only | GNMA interest-only | | 91 | | | 1,504 | | | 256 | | | — | | | 1,851 | | GNMA interest-only | | 65 | | | 647 | | | 288 | | | 0 | | | 1,000 | |
| Agency securities | Agency securities | | — | | | 637 | | | — | | | — | | | 637 | | Agency securities | | 0 | | | 605 | | | 0 | | | 0 | | | 605 | |
| GNMA permanent securities | GNMA permanent securities | | 416 | | | 31,953 | | | — | | | — | | | 32,369 | | GNMA permanent securities | | 67 | | | 31,132 | | | 0 | | | 0 | | | 31,199 | |
| | Provision for current expected credit losses | | Provision for current expected credit losses | | 0 | | | 0 | | | 0 | | | 0 | | | (20) | |
| Total debt securities | Total debt securities | | $ | 179,139 | | | $ | 1,451,193 | | | $ | 77,993 | | | $ | — | | | $ | 1,708,325 | | Total debt securities | | $ | 232,681 | | | $ | 801,978 | | | $ | 23,659 | | | $ | 0 | | | $ | 1,058,298 | |
During the three and six months ended June 30, 2020,2021, the Company realized a gain (loss)losses on the salesecurities recorded as other than temporary impairments of equity securities of $(0.2) million0 and $1.1$0.1 million respectively, which isare included in realized gain (loss) on securities on the Company’s consolidated statements of income. During the three and six months ended June 30, 2019, the Company realized a gain (loss) on the sale of equity securities of 0 and $0.1 million, respectively, which is included in realized gain (loss) on securities on the Company’s consolidated statements of income.
During the three and six months ended June 30, 2020, the Company realized losses on securities recorded as other than temporary impairments of $0.1 million and $0.3 million, respectively, which are included in realized gain (loss) on securities on the Company’s consolidated statements of income. During the three and six months ended June 30, 2019 the Company realized 0 losses on securities recorded as other than temporary impairments.
5. REAL ESTATE AND RELATED LEASE INTANGIBLES, NET
The recent market volatilityconditions due to the COVID-19 pandemic has brought illiquidity in most asset classes, includingand the resulting economic disruption have broadly impacted the commercial real estate. The Company expectsestate sector. As expected, the net leased commercial real estate properties, which comprise the majority of our portfolio, to behave remained minimally impacted as the majority of the net leased properties in our real estate portfolio are necessity-based businesses and have remained open and stable during the COVID-19 pandemic. We continue to actively monitor the diversified commercial real estate properties for both the immediate and long term impact of the pandemic on the buildings, the tenants, the business plans and the ability to execute those business plans.
The following tables present additional detail related to our real estate portfolio, net, including foreclosed properties ($ in thousands):
| | | | June 30, 2020 | | December 31, 2019 | | June 30, 2021 | | December 31, 2020 |
| | Land | Land | $ | 228,111 | | | $ | 209,955 | | Land | $ | 213,477 | | | $ | 220,511 | |
| Building | Building | 871,585 | | | 883,005 | | Building | 820,417 | | | 838,542 | |
| In-place leases and other intangibles | In-place leases and other intangibles | 159,049 | | | 161,203 | | In-place leases and other intangibles | 153,989 | | | 157,176 | |
| Undepreciated real estate and related lease intangibles | | Undepreciated real estate and related lease intangibles | 1,187,883 | | | 1,216,229 | |
| Less: Accumulated depreciation and amortization | Less: Accumulated depreciation and amortization | (216,535) | | | (206,082) | | Less: Accumulated depreciation and amortization | (239,435) | | | (230,925) | |
| | Real estate and related lease intangibles, net | Real estate and related lease intangibles, net | $ | 1,042,210 | | | $ | 1,048,081 | | Real estate and related lease intangibles, net | $ | 948,448 | | | $ | 985,304 | |
| | Below market lease intangibles, net (other liabilities) | Below market lease intangibles, net (other liabilities) | $ | (38,125) | | | $ | (39,067) | | Below market lease intangibles, net (other liabilities) | $ | (35,807) | | | $ | (36,952) | |
At June 30, 20202021 and December 31, 2019,2020, the Company held foreclosed properties included in real estate and related lease intangibles, net with a carrying value of $112.7$104.8 million and $89.5$106.8 million, respectively.
The following table presents depreciation and amortization expense on real estate recorded by the Company ($ in thousands):
| | | | Three Months Ended June 30, | | | Six Months Ended June 30, | | | | Three Months Ended June 30, | | Six Months Ended June 30, |
| | | 2020 | | 2019 | | 2020 | | 2019 | | | | 2021 | | 2020 | | 2021 | | 2020 | |
| | Depreciation expense(1) | Depreciation expense(1) | $ | 8,110 | | | $ | 7,697 | | | $ | 16,383 | | | $ | 15,382 | | | Depreciation expense(1) | | $ | 7,825 | | | $ | 8,110 | | | $ | 15,815 | | | $ | 16,383 | | |
| Amortization expense | Amortization expense | 1,681 | | | 2,213 | | | 3,392 | | | 4,730 | | | Amortization expense | | 1,639 | | | 1,681 | | | 3,185 | | | 3,392 | | |
| Total real estate depreciation and amortization expense | Total real estate depreciation and amortization expense | $ | 9,791 | | | $ | 9,910 | | | $ | 19,775 | | | $ | 20,112 | | | Total real estate depreciation and amortization expense | | $ | 9,464 | | | $ | 9,791 | | | $ | 19,000 | | | $ | 19,775 | | |
(1)Depreciation expense on the consolidated statements of income also includes $25 thousand and $50 thousand of depreciation on corporate fixed assets for the three and six months ended June 30, 2020, respectively. Depreciation expense on the consolidated statements of income also includes $25 thousand2021 and $50 thousand for the three and six months ended June 30, 2019, respectively.2020.
The Company’s intangible assets are comprised of in-place leases, above market leases and other intangibles. The following tables present additional detail related to our intangible assets ($ in thousands):
| | | | June 30, 2020 | | December 31, 2019 | | June 30, 2021 | | December 31, 2020 |
| | Gross intangible assets(1) | Gross intangible assets(1) | $ | 159,049 | | | $ | 161,203 | | Gross intangible assets(1) | $ | 153,989 | | | $ | 157,176 | |
| Accumulated amortization | Accumulated amortization | 63,089 | | | 62,773 | | Accumulated amortization | 67,996 | | | 66,014 | |
| Net intangible assets | Net intangible assets | $ | 95,960 | | | $ | 98,430 | | Net intangible assets | $ | 85,993 | | | $ | 91,162 | |
(1)Includes $4.4$4.0 million and $4.5$4.2 million of unamortized above market lease intangibles which are included in real estate and related lease intangibles, net on the consolidated balance sheets as of June 30, 20202021 and December 31, 2019,2020, respectively.
The following table presents increases/reductions in operating lease income related to the amortization of above or below market leases recorded by the Company ($ in thousands):
| | | | Three Months Ended June 30, | | | Six Months Ended June 30, | | | | Three Months Ended June 30, | | Six Months Ended June 30, |
| | | 2020 | | 2019 | | 2020 | | 2019 | | | | 2021 | | 2020 | | 2021 | | 2020 | |
| | Reduction in operating lease income for amortization of above market lease intangibles acquired | Reduction in operating lease income for amortization of above market lease intangibles acquired | $ | (92) | | | $ | (208) | | | $ | (183) | | | $ | (633) | | | Reduction in operating lease income for amortization of above market lease intangibles acquired | | $ | (92) | | | $ | (92) | | | $ | (183) | | | $ | (183) | | |
| Increase in operating lease income for amortization of below market lease intangibles acquired | Increase in operating lease income for amortization of below market lease intangibles acquired | 619 | | | 461 | | | 1,371 | | | 1,030 | | | Increase in operating lease income for amortization of below market lease intangibles acquired | | 576 | | | 619 | | | 1,146 | | | 1,371 | | |
The following table presents expected adjustment to operating lease income and expected amortization expense during the next five years and thereafter related to the above and below market leases and acquired in-place lease and other intangibles for property owned as of June 30, 20202021 ($ in thousands):
| | Period Ending December 31, | Period Ending December 31, | | Adjustment to Operating Lease Income | | Amortization Expense | Period Ending December 31, | | Adjustment to Operating Lease Income | | Amortization Expense |
| | 2020 (last 6 months) | | $ | 625 | | | $ | 2,956 | | |
| 2021 | | 1,070 | | | 5,504 | | |
| 2021 (last 6 months) | | 2021 (last 6 months) | | $ | 536 | | | $ | 2,620 | |
| 2022 | 2022 | | 1,070 | | | 5,504 | | 2022 | | 1,071 | | | 5,241 | |
| 2023 | 2023 | | 1,070 | | | 5,504 | | 2023 | | 1,071 | | | 5,241 | |
| 2024 | 2024 | | 1,070 | | | 5,504 | | 2024 | | 1,071 | | | 5,241 | |
| 2025 | | 2025 | | 1,071 | | | 5,241 | |
| Thereafter | Thereafter | | 28,867 | | | 66,590 | | Thereafter | | 27,000 | | | 58,423 | |
| Total | Total | | $ | 33,772 | | | $ | 91,562 | | Total | | $ | 31,820 | | | $ | 82,007 | |
Lease Prepayment by Lessor, Retirement of Related Mortgage Loan Financing and Impairment ofRent Receivables, Unencumbered Real Estate,
On January 10, 2019, the Company received $10.0 million prepayment of a lease on a single-tenant two-story office building in Wayne, NJ. As of March 31, 2019, this property had a book value of $5.6 million, which is net of accumulated depreciation and amortization of $2.7 million. The Company recognized the $10.0 million of operating lease income on a straight-line basis over the revised lease term. On February 6, 2019, the Company paid off $6.6 million of mortgage loan financing related to the property, recognizing a loss on extinguishment of debt of $1.1 million. During the three months ended March 31, 2019, the Company recorded a $1.4 million impairment of real estate to reduce the carrying value of the real estate to the estimated fair value of the real estate. On May 1, 2019, the Company completed the sale of the property recognizing $3.9 million of operating lease income, $3.5 million realized loss on sale of real estate, net and $0.4 million of depreciation and amortization expense, resulting in a net loss of $20 thousand. See Note 15, Fair Value of Financial Instruments for further detail.Operating Lease Income
There were $0.7$0.1 million and $0.9$0.5 million of rent receivables included in other assets on the consolidated balance sheets as of June 30, 20202021 and December 31, 2019,2020, respectively.
There was unencumbered real estate of $82.4$74.8 million and $59.2$75.9 million as of June 30, 20202021 and December 31, 2019,2020, respectively.
During the three and six months ended June 30, 2021 and 2020, the Company recorded $0.6$2.8 million and $2.5$0.6 million, respectively, of real estate operating income, which is included in operating lease income in the consolidated statements of income. During the three and six months ended 2019,June 30, 2021 and 2020, the Company recorded $0.8$3.8 million and $1.0$2.5 million, respectively, of real estate operating income, which is included in operating lease income in the consolidated statements of income.respectively.
The following is a schedule of non-cancellable, contractual, future minimum rent under leases (excluding property operating expenses paid directly by tenant under net leases) at June 30, 20202021 ($ in thousands):
| | Period Ending December 31, | Period Ending December 31, | | Amount | Period Ending December 31, | | Amount |
| | 2020 (last 6 months) | | $ | 43,163 | | |
| 2021 | | 73,091 | | |
| 2021 (last 6 months) | | 2021 (last 6 months) | | $ | 46,824 | |
| 2022 | 2022 | | 66,145 | | 2022 | | 70,156 | |
| 2023 | 2023 | | 65,377 | | 2023 | | 62,414 | |
| 2024 | 2024 | | 64,412 | | 2024 | | 61,450 | |
| 2025 | | 2025 | | 60,173 | |
| Thereafter | Thereafter | | 507,659 | | Thereafter | | 448,700 | |
| Total | Total | | $ | 819,847 | | Total | | $ | 749,717 | |
Acquisitions
During the six months ended June 30, 2021, the Company acquired the following properties ($ in thousands):
| | | | | | | | | | | | | | | | | | | | | | | | | | | | | |
| Acquisition Date | | Type | | Primary Location(s) | | Purchase Price/Fair Value on the Date of Foreclosure | | | | | Ownership Interest (1) |
| | | | | | | | | | | |
| | | | | | | | | |
| | | | | | | | | | | |
| | | | | | | | | | | |
| | | | | | | | | | | |
| | | | | | | | | | | |
| | | | | | | | | | | |
| | | | | | | | | | | |
| | | | | | | | | | | |
| | | | | | | | | | | |
| | | | | | | | | | | |
| | | | | | | | | | | |
| | | | | | | | | | | |
| | | | | | | | | | | |
| | | | | | | | | | | |
| | | | | | | | | | | |
| | | | | | | | | | | |
| | | | | | | | | | | |
| | | | | | | | | | | |
| | | | | | | | | | | |
| | | | | | | | | | | |
| | | | | | | |
| | | | | | | | | | | |
| Real estate acquired via foreclosure | | | | | | | |
| February 2021 | | Hotel | | Miami, FL | | $ | 43,750 | | | | | | 100.0% |
| | | | | | | | | | | |
| | | | | | | | | | | |
| | | | | | | | | | | |
| Total real estate acquired via foreclosure | | 43,750 | | | | | | |
| | | | | | | | | | | |
| Total real estate acquisitions | | | | $ | 43,750 | | | | | | |
(1)Properties were consolidated as of acquisition date.
In February 2021, the Company acquired a hotel in Miami, FL via foreclosure recognizing a $25.8 thousand loss which is included in its consolidated statements of income. The property previously served as collateral for a mortgage loan receivable held for investment with a basis of $45.1 million, net of an asset-specific loan loss provision of $1.2 million recorded in the three months ended December 31, 2020. In February 2021, the foreclosed property was sold without any gain or loss. The Company recorded no revenues from its 2021 acquisitions for the six months ended June 30, 2021.
During the six months ended June 30, 2020, the Company acquired the following properties ($ in thousands):
| | Acquisition Date | Acquisition Date | | Type | | Primary Location(s) | | Purchase Price/Fair Value on the Date of Foreclosure | | Ownership Interest (1) | Acquisition Date | | Type | | Primary Location(s) | | Purchase Price/Fair Value on the Date of Foreclosure | | | Ownership Interest (1) |
| | Purchases of real estate | | | | | |
| | | | Aggregate purchases of net leased real estate | Aggregate purchases of net leased real estate | | | $ | 6,239 | | | 100.0% | Aggregate purchases of net leased real estate | | $ | 6,239 | | | | 100.0% |
| | Real estate acquired via foreclosure | Real estate acquired via foreclosure | | | | | Real estate acquired via foreclosure | | | | |
| | March 2020 | March 2020 | | Diversified | | Los Angeles, CA | | 21,535 | | | 100.0% | March 2020 | | Diversified | | Los Angeles, CA | | 21,535 | | | | 100.0% |
| June 2020 | June 2020 | | Diversified | | Winston Salem, NC | | 3,900 | | | 100.0% | June 2020 | | Diversified | | Winston Salem, NC | | 3,900 | | | | 100.0% |
| | Total real estate acquired via foreclosure | Total real estate acquired via foreclosure | | | 25,435 | | | | Total real estate acquired via foreclosure | | 25,435 | | | |
| | Total real estate acquisitions | Total real estate acquisitions | | | $ | 31,674 | | | | Total real estate acquisitions | | $ | 31,674 | | | |
(1)Properties were consolidated as of acquisition date.
The Company allocates purchase consideration based on relative fair values, and real estate acquisition costs are capitalized as a component of the cost of the assets acquired for asset acquisitions. During the six months ended June 30, 2020, all acquisitions were determined to be asset acquisitions.
The purchase prices were allocated to the asset acquisitions during the six months ended June 30, 2020, as follows ($ in thousands):
| | | | | | | | |
| | Purchase Price Allocation
|
| | |
Land | | $ | 23,524 | |
Building | | 7,244 | |
Intangibles | | 1,201 | |
Below Market Lease Intangibles | | (295) | |
Total purchase price | | $ | 31,674 | |
Sales
The weighted average amortization period for intangible assets acquiredCompany sold the following properties during the six months ended June 30, 2020 was 39.8 years. The Company recorded $0.1 million and $0.2 million in revenues from its 2020 acquisitions for the three and six months ended June 30, 2020, respectively, which is included in its consolidated statements of income. The Company recorded $0.1 million and $47.6 thousand in earnings (losses) from its 2020 acquisitions for the three and six months ended June 30, 2020, respectively, which is included in its consolidated statements of income.
During the six months ended June 30, 2019, the Company acquired the following properties2021 ($ in thousands):
| | | | | | | | | | | | | | | | | | | | | | | | | | |
| Acquisition Date | | Type | | Primary Location(s) | | Purchase Price/Fair Value on the Date of Foreclosure | | | | Ownership Interest (1) |
| | | | | | | | | | |
| Purchases of real estate | | | | | | | | | | |
| | | | | | | | | | |
| | | | | | | | | | |
| | | | | | | | | | |
| | | | | | | | | | |
| | | | | | | | | | |
| | | | | | | | | | |
| | | | | | | | | | |
| | | | | | | | | | |
| | | | | | | | | | |
| | | | | | | | | | |
| | | | | | | | | | |
| | | | | | | | | | |
| | | | | | | | | | |
| | | | | | | | | | |
| | | | | | | | | | |
| | | | | | | | | | |
| | | | | | | | | | |
| | | | | | | | | | |
| | | | | | | | | | |
| Aggregate purchases of net leased real estate | | | | | | $ | 5,071 | | | | | 100.0% |
| | | | | | | | | | |
| Real estate acquired via foreclosure | | | | | | | | | | |
| February 2019 | | Diversified | | Omaha, NE | | 18,200 | | | | | 100.0% |
| | | | | | | | | | |
| | | | | | | | | | |
| Total real estate acquired via foreclosure | | | | | | 18,200 | | | | | |
| | | | | | | | | | |
| Total real estate acquisitions | | | | | | $ | 23,271 | | | | | |
(1)Properties were consolidated as of acquisition date.
The purchase prices were allocated to the asset acquisitions during the six months ended June 30, 2019, as follows ($ in thousands):
| | | | | | | | |
| | Purchase Price Allocation |
| | |
Land | | $ | 3,789 | |
Building | | 18,885 | |
Intangibles | | 854 | |
Below Market Lease Intangibles | | (257) | |
Total purchase price | | $ | 23,271 | |
The weighted average amortization period for intangible assets acquired during the six months ended June 30, 2019 was 37.0 years. The Company recorded $62.5 thousand and $78.9 thousand in revenues from its 2019 acquisitions for the three and six months ended June 30, 2019, respectively, which is included in its consolidated statements of income. The Company recorded $(1.2) million and $(1.5) million in earnings (losses) from its 2019 acquisitions for the three and six months ended June 30, 2019, respectively, which is included in its consolidated statements of income.
Acquisitions via Foreclosure
In June 2020, the Company acquired a hotel in Winston Salem, NC via foreclosure. This property previously served as collateral for a mortgage loan receivable held for investment with a net basis of $3.8 million. The Company obtained a third-party appraisal of the property. The $3.9 million fair value was determined using the ground lease approach and the income approach to value. The appraiser utilized a terminal capitalization rate of 9.50% and a discount rate of 13.50%. There was 0 gain or loss resulting from the foreclosure of the loan.
In March 2020, the Company acquired a development property in Los Angeles, CA, via foreclosure. This property previously served as collateral for a mortgage loan receivable held for investment with a basis of $21.6 million, net of an asset-specific loan loss provision of $2.0 million. The Company obtained a third-party appraisal of the property. Substantially all of the fair value was attributed to land. The $21.5 million fair value was determined using the sales comparison approach to value. Using this approach, the appraiser developed an opinion of the fee simple value of the underlying land by comparing the property to similar, recently sold properties in the surrounding or competing area. The Company recorded a $0.1 million loss resulting from the foreclosure of the loan.
In February 2019, the Company acquired a hotel in Omaha, NE, via foreclosure. This property previously served as collateral for a mortgage loan receivable held for investment with a net basis of $17.9 million. The Company obtained a third-party appraisal of the property. The $18.2 million fair value was determined using the income approach to value. The appraiser utilized a terminal capitalization rate of 8.75% and a discount rate of 10.25%. There was 0 gain or loss resulting from the foreclosure of the loan.
These non-recurring fair values are considered Level 3 measurements in the fair value hierarchy.
Sales
| | | | | | | | | | | | | | | | | | | | | | | | | | | | | | | | | | | | | | | | | | | | | | | | | | | | | | | | | | |
| Sales Date | | Type | | | | Primary Location(s) | | Net Sales Proceeds | | Net Book Value | | Realized Gain/(Loss) | | Properties | | Units Sold | | Units Remaining | | |
| | | | | | | | | | | | | | | | | | | | |
| February 2021 | | Hotel | | | | Miami, FL | | $ | 43,750 | | | $ | 43,750 | | | $ | 0 | | | 1 | | | 0 | | | 0 | | | |
| June 2021 | | Retail | | | | North Dartmouth, MA | | 38,732 | | | 19,343 | | | 19,389 | | | 1 | | | 0 | | | 0 | | | |
| | | | | | | | | | | | | | | | | | | | |
| | | | | | | | | | | | | | | | | | | | |
| | | | | | | | | | | | | | | | | | | | |
| | | | | | | | | | | | | | | | | | | | |
| | | | | | | | | | | | | | | | | | | | |
| Totals | | | | | | | | $ | 82,482 | | | $ | 63,093 | | | $ | 19,389 | | | | | | | | | |
| | | | | | | | | | | | | | | | | | | | |
The Company sold the following properties during the six months ended June 30, 2020 ($ in thousands):
| | Sales Date | Sales Date | | Type | | | Primary Location(s) | | Net Sales Proceeds | | Net Book Value | | Realized Gain/(Loss) | | Properties | | Units Sold | | Units Remaining | Sales Date | | Type | | | Primary Location(s) | | Net Sales Proceeds | | Net Book Value | | Realized Gain/(Loss) | | Properties | | Units Sold | | Units Remaining |
| | | Various | Various | | Condominium | | | Miami, FL | | $ | 931 | | | $ | 924 | | | $ | 7 | | | — | | | 3 | | | 3 | | Various | | Condominium | | | Miami, FL | | $ | 931 | | | $ | 924 | | | $ | 7 | | | 0 | | | 3 | | | 3 | |
| March 2020 | March 2020 | | Diversified | | | Richmond, VA | | 22,526 | | | 14,829 | | | 7,697 | | | 7 | | | — | | | — | | March 2020 | | Diversified | | | Richmond, VA | | 22,526 | | | 14,829 | | | 7,697 | | | 7 | | | 0 | | | 0 | |
| March 2020 | March 2020 | | Diversified | | | Richmond, VA | | 6,933 | | | 4,109 | | | 2,824 | | | 1 | | | — | | | — | | March 2020 | | Diversified | | | Richmond, VA | | 6,933 | | | 4,109 | | | 2,824 | | | 1 | | | 0 | | | 0 | |
| | Totals | Totals | | | | $ | 30,390 | | | $ | 19,862 | | | $ | 10,528 | | | Totals | | | | $ | 30,390 | | | $ | 19,862 | | | $ | 10,528 | | |
(1)Realized gain (loss) on the sale of real estate, net on the consolidated statements of income also includes $0.1 million of realized loss on the disposal of fixed assets for the six months ended June 30, 2020
The Company sold the following properties during the six months ended June 30, 2019 ($ in thousands):
| | | | | | | | | | | | | | | | | | | | | | | | | | | | | | | | | | | | | | | | | | | | | | | | | | | | |
| Sales Date | | Type | | | | Primary Location(s) | | Net Sales Proceeds | | Net Book Value | | Realized Gain/(Loss) | | Properties | | Units Sold | | Units Remaining |
| | | | | | | | | | | | | | | | | | |
| N/A | | Condominium | | | | Las Vegas, NV | | $ | — | | | $ | — | | | $ | — | | | — | | | — | | | 1 | |
| Various | | Condominium | | | | Miami, FL | | 3,917 | | | 3,550 | | | 367 | | | — | | | 13 | | | 9 | |
| April 2019 | | Diversified | | | | Wayne, NJ | | 1,729 | | | 4,799 | | | (3,070) | | | 1 | | | — | | | — | |
| May 2019 | | Diversified | | | | Grand Rapids, MI | | 10,019 | | | 8,254 | | | 1,765 | | | 1 | | | — | | | — | |
| | | | | | | | | | | | | | | | | | |
| | | | | | | | | | | | | | | | | | |
| Totals | | | | | | | | $ | 15,665 | | | $ | 16,603 | | | $ | (938) | | | | | | | |
6. INVESTMENT IN AND ADVANCES TO UNCONSOLIDATED JOINT VENTURES
The following is a summary of the Company’s investments in and advances to unconsolidated joint ventures, which we account for using the equity method, as of June 30, 20202021 and December 31, 20192020 ($ in thousands):
| | Entity | Entity | | June 30, 2020 | | December 31, 2019 | Entity | | June 30, 2021 | | December 31, 2020 |
| | | Grace Lake JV, LLC | Grace Lake JV, LLC | | $ | 3,496 | | | $ | 3,047 | | Grace Lake JV, LLC | | $ | 4,645 | | | $ | 4,023 | |
| 24 Second Avenue Holdings LLC | 24 Second Avenue Holdings LLC | | 45,423 | | | 45,386 | | 24 Second Avenue Holdings LLC | | 33,174 | | | 42,230 | |
| Investment in unconsolidated joint ventures | Investment in unconsolidated joint ventures | | $ | 48,919 | | | $ | 48,433 | | Investment in unconsolidated joint ventures | | $ | 37,819 | | | $ | 46,253 | |
The following is a summary of the Company’s allocated earnings (losses) based on its ownership interests from investment in unconsolidated joint ventures for the three and six months ended June 30, 20202021 and 20192020 ($ in thousands):
| | | | | Three Months Ended June 30, | | | Six Months Ended June 30, | | | | Three Months Ended June 30, | | Six Months Ended June 30, |
| Entity | Entity | | 2020 | | 2019 | | 2020 | | 2019 | | Entity | | 2021 | | 2020 | | 2021 | | 2020 | |
| | | Grace Lake JV, LLC | Grace Lake JV, LLC | | $ | 263 | | | $ | 618 | | | $ | 449 | | | $ | 1,032 | | | Grace Lake JV, LLC | | $ | 325 | | | $ | 263 | | | $ | 622 | | | $ | 449 | | |
| 24 Second Avenue Holdings LLC | 24 Second Avenue Holdings LLC | | 208 | | | 946 | | | 463 | | | 1,490 | | | 24 Second Avenue Holdings LLC | | (88) | | | 208 | | | 51 | | | 463 | | |
| Earnings (loss) from investment in unconsolidated joint ventures | Earnings (loss) from investment in unconsolidated joint ventures | | $ | 471 | | | $ | 1,564 | | | $ | 912 | | | $ | 2,522 | | | Earnings (loss) from investment in unconsolidated joint ventures | | $ | 237 | | | $ | 471 | | | $ | 673 | | | $ | 912 | | |
Grace Lake JV, LLC
In connection with the origination of a loan in April 2012, the Company received a 25% equity interest with the right to convert upon a capital event. On March 22, 2013, the loan was refinanced, and the Company converted its interest into a 19% limited liability company membership interest in Grace Lake JV, LLC (“Grace Lake LLC”), which holds an investment in an office building complex. After taking into account the preferred return of 8.25% and the return of all equity remaining in the property to the Company’s operating partner, the Company is entitled to 25% of the distribution of all excess cash flows and all disposition proceeds upon any sale. The Company is not legally required to provide any future funding to Grace Lake LLC. The Company accounts for its interest in Grace Lake LLC using the equity method of accounting, as it has a 19% investment, compared to the 81% investment of its operating partner and does not control the entity.
The Company’s investment in Grace Lake LLC is an unconsolidated joint venture, which is a VIEvariable interest entity (“VIE”) for which the Company is not the primary beneficiary. This joint venture was deemed to be a VIE primarily based on the fact there are disproportionate voting and economic rights within the joint venture. The Company determined that it was not the primary beneficiary of this VIE based on the fact that the Company has a passive investment and no control of this entity and therefore does not have controlling financial interests in this VIE. The Company’s maximum exposure to loss is limited to its investment in the VIE. The Company has not provided financial support to this VIE that it was not previously contractually required to provide.
During the six months ended June 30, 2021, and June 30, 2020, the Company received 0 distributions from its investment in Grace Lake LLC. During the six months ended June 30, 2019, the Company had received $3.1 million of distributions from its investment in Grace Lake LLC.
The Company holds its investment in Grace Lake LLC in a TRS.
24 Second Avenue Holdings LLC
On August 7, 2015, the Company entered into a joint venture, 24 Second Avenue Holdings LLC (“24 Second Avenue”), with an operating partner (the “Operating Partner”) to invest in a ground-up residential/retail condominium development and construction project located at 24 Second Avenue, New York, NY. The Company accounted for its interest in 24 Second Avenue using the equity method of accounting as its joint venture partner was the managing member of 24 Second Avenue and had substantive management rights.
During the three months ended March 31, 2019, the Company converted its existing $35.0 million common equity interest into a $35.0 million priority preferred equity position. The Company also provided $50.4 million in first mortgage financing in order to refinance the existing $48.1 million first mortgage construction loan which was made by another lending institution. In addition to the new $50.4 million first mortgage loan, the Company also funded a $6.5 million mezzanine loan for use in completing the project. The Operating Partner must fully fund any and all additional capital for necessary expenses.
Due to the Company’s non-controlling equity interest in 24 Second Avenue, the Company accounts for the new loans as additional investments in the joint venture.
During the three and six months ended June 30, 2020,2021 the Company recorded $0.2$(0.1) million and $0.5$0.1 million, respectively, in income (expenses), each of which is recorded in earnings (loss) from investment in unconsolidated joint ventures in the consolidated statements of income. During the three and six months ended June 30, 2019,2020 the Company recorded $0.9$0.2 million and $1.5$0.5 million, respectively, in income (expenses), each. The Company received $6.9 million and $9.1 million of which is recorded in earnings (loss) from investment in unconsolidated joint ventures indistributions during the consolidated statements of income. During 2019, the Company capitalized interest related to the cost of its investment in 24 Second Avenue, as 24 Second Avenue had activities in progress necessary to constructthree and ultimately sell condominium units. During the six months ended June 30, 2019, the Company capitalized $0.1 million of interest expense, using a weighted average interest rate. The capitalized interest expense was recorded in investment in unconsolidated joint ventures in the consolidated balance sheets. As a result of the transactions described above, subsequent to the three months ended March 31, 2019, the Company no longer capitalizes interest related to this investment, and income generated from the new loans is accounted for as earnings from investment in unconsolidated joint ventures.2021, respectively.
As of June 30, 2020,The 24 Second Avenue had $11.3 million of loans payable to a third-party lender. 24 Second Avenueinvestment consists of 30 residential condominium units and 1 commercial condominium unit. 24 Second Avenue started closing on the existing sales contracts during the quarter ended March 31, 2019, upon receipt of New York City Building Department approvals and a temporary certificate of occupancy for a portion of the project. As of June 30, 2020,2021, 24 Second Avenue sold 1924 residential condominium units for $49.6$62.7 million in total gross sale proceeds.proceeds, and 2 residential condominium units were under contract for sale for $10.2 million in gross sales proceeds with a 10% deposit down on the sales contracts. As of June 30, 2020,2021, the Company had 0 additional remaining capital commitment to 24 Second Avenue.
The Company’s non-controlling investment in 24 Second Avenue is an unconsolidated joint venture, which is a VIE for which the Company is not the primary beneficiary. This joint venture was deemed to be a VIE primarily based on (i) the fact that the total equity investment at risk (inclusive of the additional financing the Company provided through the first mortgage and mezzanine loans) is sufficient to permit the entities to finance activities without additional subordinated financial support provided by any parties, including equity holders; and (ii) the voting and economic rights are not disproportionate within the joint venture. The Company determined that it was not the primary beneficiary of this VIE because it does not have a controlling financial interest.
The Company holds its investment in 24 Second Avenue in a TRS.
Combined Summary Financial Information for Unconsolidated Joint Ventures
The following is a summary of the combined financial position of the unconsolidated joint ventures in which the Company had investment interests as of June 30, 20202021 and December 31, 20192020 ($ in thousands):
| | | | | June 30, 2020 | | December 31, 2019 | | | June 30, 2021 | | December 31, 2020 |
| | Total assets | Total assets | | $ | 113,414 | | | $ | 118,727 | | Total assets | | $ | 117,970 | | | $ | 114,916 | |
| Total liabilities | Total liabilities | | 77,277 | | | 78,762 | | Total liabilities | | 69,848 | | | 75,775 | |
| Partners’/members’ capital | Partners’/members’ capital | | $ | 36,137 | | | $ | 39,965 | | Partners’/members’ capital | | $ | 48,122 | | | $ | 39,141 | |
The following is a summary of the combined results from operations of the unconsolidated joint ventures for the period in which the Company had investment interests during the three and six months ended June 30, 20202021 and 20192020 ($ in thousands):
| | | | | Three Months Ended June 30, | | | Six Months Ended June 30, | | | | | Three Months Ended June 30, | | Six Months Ended June 30, |
| | | | 2020 | | 2019 | | 2020 | | 2019 | | | | | 2021 | | 2020 | | 2021 | | 2020 | |
| | Total revenues | Total revenues | | $ | 4,294 | | | $ | 6,330 | | | $ | 8,770 | | | $ | 11,030 | | | Total revenues | | | $ | 4,543 | | | $ | 4,294 | | | $ | 9,057 | | | $ | 8,770 | | |
| Total expenses | Total expenses | | 3,450 | | | 3,571 | | | 7,424 | | | 7,434 | | | Total expenses | | | 3,242 | | | 3,450 | | | 6,565 | | | 7,424 | | |
| Net income (loss) | Net income (loss) | | $ | 844 | | | $ | 2,759 | | | $ | 1,346 | | | $ | 3,596 | | | Net income (loss) | | | $ | 1,301 | | | $ | 844 | | | $ | 2,492 | | | $ | 1,346 | | |
7. DEBT OBLIGATIONS, NET
The details of the Company’s debt obligations at June 30, 20202021 and December 31, 20192020 are as follows ($ in thousands):
June 30, 2020
| | | | | | | | | | | | | | | | | | | | | | | | | | | | | | | | | | | | | | | | | | | | | | | | | | | | | | | | | | | | | | | | | |
| Debt Obligations | | Committed Financing | | Debt Obligations Outstanding | | Committed but Unfunded | | Interest Rate at June 30, 2020(1) | | | | Current Term Maturity | | Remaining Extension Options | | Eligible Collateral | | Carrying Amount of Collateral | | Fair Value of Collateral | |
| | | | | | | | | | | | | | | | | | | | | |
| Committed Loan Repurchase Facility(2) | | $ | 500,000 | | | $ | 114,679 | | | $ | 385,321 | | | 1.93% | — | 2.18% | | 12/19/2022 | | (3) | | (4) | | $ | 179,332 | | | $ | 179,332 | | |
| Committed Loan Repurchase Facility | | 250,000 | | | — | | | 250,000 | | | —% | — | —% | | 2/26/2021 | | (5) | | (6) | | — | | | — | | |
| Committed Loan Repurchase Facility | | 300,000 | | | 144,565 | | | 155,435 | | | 1.94% | — | 2.94% | | 12/19/2020 | | (7) | | (8) | | 251,788 | | | 251,788 | | |
| Committed Loan Repurchase Facility | | 300,000 | | | 65,702 | | | 234,298 | | | 1.94% | — | 2.19% | | 11/6/2022 | | (9) | | (4) | | 100,597 | | | 100,704 | | |
| Committed Loan Repurchase Facility | | 100,000 | | | 38,228 | | | 61,772 | | | 2.31% | — | 2.43% | | 12/31/2022 | | (10) | | (4) | | 64,721 | | | 64,807 | | |
| Committed Loan Repurchase Facility | | 100,000 | | | 17,901 | | | 82,099 | | | 2.68% | — | 2.68% | | 3/24/2021 | | (11) | | (12) | | 30,600 | | | 30,600 | | |
| Total Committed Loan Repurchase Facilities | | 1,550,000 | | | 381,075 | | | 1,168,925 | | | | | | | | | | | | | 627,038 | | | 627,231 | | |
| Committed Securities Repurchase Facility(2) | | 785,321 | | | 451,342 | | | 333,979 | | | 0.89% | — | 2.44% | | 12/23/2021 | | N/A | | (13) | | 576,924 | | | 576,924 | | |
| Uncommitted Securities Repurchase Facility | | N/A (13) | | 462,612 | | | N/A (14) | | 1.42% | — | 4.81% | | 7/2020 - 9/2020 | | N/A | | (13) | | 596,230 | | | 596,230 | | (15) |
| Total Repurchase Facilities | | 1,950,000 | | | 1,295,029 | | | 1,502,904 | | | | | | | | | | | | | 1,800,192 | | | 1,800,385 | | |
| Revolving Credit Facility | | 266,430 | | | 266,430 | | | — | | | 3% | — | 3% | | 2/11/2021 | | (16) | | N/A (17) | | N/A (17) | | N/A (17) | |
| Mortgage Loan Financing | | 805,431 | | | 805,431 | | | — | | | 3.75% | — | 6.75% | | 2020 - 2030(18) | | N/A | | (19) | | 959,766 | | | 1,172,268 | | (20) |
| Secured Financing Facility | | 206,350 | | | 188,687 | | (21) | — | | | 10.75% | — | 10.75% | | 5/6/2023 | | N/A | | (22) | | 335,237 | | | 335,675 | | |
| CLO Debt | | 304,413 | | | 299,605 | | (23) | — | | | 5.50% | — | 5.50% | | 5/16/2024 | | N/A | | (24) | | 469,505 | | | 469,587 | | |
| | | | | | | | | | | | | | | | | | | | | |
| Borrowings from the FHLB | | 1,500,000 | | | 360,790 | | | 1,139,210 | | | 0.44% | — | 2.95% | | 2020 - 2024 | | N/A | | (24) | | 526,151 | | | 528,650 | | (25) |
| Senior Unsecured Notes | | 1,752,817 | | | 1,737,542 | | (26) | — | | | 4.25% | — | 5.88% | | 2021 - 2027 | | N/A | | N/A (27) | | N/A (27) | | N/A (27) | |
| | | | | | | | | | | | | | | | | | | | | |
| | | | | | | | | | | | | | | | | | | | | |
| Total Debt Obligations, Net | | $ | 6,785,441 | | | $ | 4,953,514 | | | $ | 2,642,114 | | | | | | | | | | | | | $ | 4,090,851 | | | $ | 4,306,565 | | |
| | | | | | | | | | | | | | | | | | | | | | | | | | | | | | | | | | | | | | | | | | | | | | | | | | | | | | | | | | | | | | | | | |
| Debt Obligations | | Committed Financing | | Debt Obligations Outstanding | | Committed but Unfunded | | Interest Rate at June 30, 2021(1) | | Current Term Maturity | | Remaining Extension Options | | Eligible Collateral | | Carrying Amount of Collateral | | Fair Value of Collateral | |
| | | | | | | | | | | | | | | | | | | | | |
| Committed Loan Repurchase Facility(2) | | $ | 500,000 | | | $ | 109,300 | | | $ | 390,700 | | | 1.82% | — | 2.07% | | 12/19/2022 | | (3) | | (4) | | $ | 178,903 | | | $ | 178,903 | | |
| Committed Loan Repurchase Facility | | 100,000 | | | 0 | | | 100,000 | | | 0% | — | 0% | | 2/26/2022 | | (5) | | (6) | | 0 | | | 0 | | |
| Committed Loan Repurchase Facility | | 300,000 | | | 82,873 | | | 217,127 | | | 1.82% | — | 2.82% | | 12/16/2021 | | (7) | | (8) | | 142,515 | | | 142,515 | | |
| Committed Loan Repurchase Facility | | 100,000 | | | 0 | | | 100,000 | | | 0% | — | 0% | | 4/30/2024 | | (9) | | (4) | | 0 | | | 0 | | |
| Committed Loan Repurchase Facility | | 100,000 | | | 26,183 | | | 73,817 | | | 2.2% | — | 2.2% | | 12/31/2022 | | (3) | | (4) | | 45,053 | | | 45,053 | | |
| Committed Loan Repurchase Facility | | 100,000 | | | 0 | | | 100,000 | | | 0% | — | 0% | | 10/24/2021 | | (10) | | (11) | | 0 | | | 0 | | |
| Total Committed Loan Repurchase Facilities | | 1,200,000 | | | 218,356 | | | 981,644 | | | | | | | | | | | | | 366,471 | | | 366,471 | | |
| Committed Securities Repurchase Facility(2) | | 790,700 | | | 62,914 | | | 727,786 | | | 0.63% | — | 1.03% | | 5/27/2023 | | N/A | | (12) | | 75,064 | | | 75,064 | | |
| Uncommitted Securities Repurchase Facility | | N/A (13) | | 244,430 | | | N/A (13) | | 0.55% | — | 2.14% | | 7/2021-11/2021 | | N/A | | (12) | | 279,661 | | | 279,661 | | (14) |
| Total Repurchase Facilities | | 1,600,000 | | | 525,700 | | | 1,318,730 | | | | | | | | | | | | | 721,196 | | | 721,196 | | |
| Revolving Credit Facility | | 266,430 | | | 0 | | | 266,430 | | | 0% | — | 0% | | 2/11/2022 | | (15) | | N/A (16) | | N/A (16) | | N/A (16) | |
| Mortgage Loan Financing | | 745,971 | | | 745,971 | | | 0 | | | 3.75% | — | 6.16% | | 2021 - 2030(17) | | N/A | | (18) | | 874,924 | | | 1,106,518 | | (19) |
| Secured Financing Facility | | 161,369 | | | 152,142 | | (20) | 0 | | | 10.75% | — | 10.75% | | 5/6/2023 | | N/A | | (21) | | 246,288 | | | 246,512 | | |
| CLO Debt | | 169,783 | | | 168,843 | | (22) | — | | | 5.5% | — | 5.5% | | 5/16/2024 | | N/A | | (4) | | 296,992 | | | 296,992 | | |
| | | | | | | | | | | | | | | | | | | | | |
| Borrowings from the FHLB | | 288,000 | | | 288,000 | | | 0 | | | 0.36% | — | 2.74% | | 2021 - 2024 | | N/A | | (23) | | 319,565 | | | 319,565 | | (24) |
| Senior Unsecured Notes | | 2,115,644 | | | 2,095,059 | | (25) | 0 | | | 4.25% | — | 5.25% | | 2022 - 2029 | | N/A | | N/A (26) | | N/A (26) | | N/A (26) | |
| | | | | | | | | | | | | | | | | | | | | |
| | | | | | | | | | | | | | | | | | | | | |
| Total Debt Obligations, Net | | $ | 5,347,197 | | | $ | 3,975,715 | | | $ | 1,585,160 | | | | | | | | | | | | | $ | 2,458,965 | | | $ | 2,690,783 | | |
(1)June 2021 LIBOR rates are used to calculate interest rates for floating rate debt.
(2)The combined committed amounts for the loan repurchase facility and the securities repurchase facility total $900.0 million, with maximum capacity on the loan repurchase facility of $500.0 million, and maximum capacity on the securities repurchase facility of $900.0 million less outstanding commitments on the loan repurchase facility.
(3)NaN 12-month extension periods at Company’s option. No new advances are permitted after the initial maturity date.
(4)First mortgage commercial real estate loans and senior and pari passu interests therein. It does not include the real estate collateralizing such loans.
(5)NaN additional 12-month periods at Company’s option.
(6)First mortgage commercial real estate loans. It does not include the real estate collateralizing such loans.
(7)NaN additional 364-day periods at Company’s option.
(8)First mortgage and mezzanine commercial real estate loans and senior and pari passu interests therein. It does not include the real estate collateralizing such loans.
(9)NaN additional 12-month extension period and 2 additional 6-month extension periods at Company’s option.
(10)The Company may extend periodically with lender’s consent. At no time can the maturity of the facility exceed 364 days from the date of determination.
(11)First mortgage, junior and mezzanine commercial real estate loans, and certain senior and/or pari passu interests therein.
(12)Commercial real estate securities. It does not include the first mortgage commercial real estate loans collateralizing such securities.
(13)Represents uncommitted securities repurchase facilities for which there is no committed amount subject to future advances.
(14)Includes $2.1 million of restricted securities under the risk retention rules of the Dodd-Frank Act. These securities are accounted for as held-to-maturity and recorded at amortized cost basis.
(15)NaN additional 12-month periods at Company’s option.
(16)The obligations under the revolving credit facility (“Revolving Credit Facility”) are guaranteed by the Company and certain of its subsidiaries and secured by equity pledges in certain Company subsidiaries.
(17)Anticipated repayment dates.
(18)Certain of our real estate investments serve as collateral for our mortgage loan financing.
(19)Using undepreciated carrying value of commercial real estate to approximate fair value.
(20)Presented net of unamortized debt issuance costs of $4.5 million and an unamortized discount of $4.7 million related to the Purchase Right (described in detail under Secured Financing Facility below) at June 30, 2021.
(21)First mortgage commercial real estate loans. Substitution of collateral and conversion of loan collateral to mortgage collateral are permitted with Lender’s approval. Pending substitution of acceptable collateral, $19.8 million of the obligations are unsecured and guaranteed by the Company.
(22)Presented net of unamortized debt issuance costs of $0.9 million at June 30, 2021.
(23)Investment grade commercial real estate securities and cash. It does not include the first mortgage commercial real estate loans collateralizing such securities.
(24)Includes $8.7 million of restricted securities under the risk retention rules of the Dodd-Frank Act. These securities are accounted for as held-to-maturity and recorded at amortized cost basis.
(25)Presented net of unamortized debt issuance costs of $20.6 million at June 30, 2021.
(26)The obligations under the senior unsecured notes are guaranteed by the Company and certain of its subsidiaries.
December 31, 2020 | | | | | | | | | | | | | | | | | | | | | | | | | | | | | | | | | | | | | | | | | | | | | | | | | | | | | | | | | | | | | | | | | |
| Debt Obligations | | Committed Financing | | Debt Obligations Outstanding | | Committed but Unfunded | | Interest Rate at December 31, 2020(1) | | Current Term Maturity | | Remaining Extension Options | | Eligible Collateral | | Carrying Amount of Collateral | | Fair Value of Collateral | |
| | | | | | | | | | | | | | | | | | | | | |
| Committed Loan Repurchase Facility(2) | | $ | 500,000 | | | $ | 112,004 | | | $ | 387,996 | | | 1.91% | — | 2.16% | | 12/19/2022 | | (3) | | (4) | | $ | 180,416 | | | $ | 180,416 | | |
| Committed Loan Repurchase Facility | | 250,000 | | | 0 | | | 250,000 | | | 0% | — | 0% | | 2/26/2021 | | (5) | | (6) | | 0 | | | 0 | | |
| Committed Loan Repurchase Facility | | 300,000 | | | 90,197 | | | 209,803 | | | 1.91% | — | 2.91% | | 12/16/2021 | | (7) | | (8) | | 154,850 | | | 154,850 | | |
| Committed Loan Repurchase Facility | | 300,000 | | | 11,312 | | | 288,688 | | | 2.19% | — | 2.19% | | 11/6/2022 | | (9) | | (4) | | 28,285 | | | 28,285 | | |
| Committed Loan Repurchase Facility | | 100,000 | | | 26,183 | | | 73,817 | | | 2.28% | — | 2.28% | | 12/31/2022 | | (10) | | (4) | | 45,235 | | | 45,235 | | |
| Committed Loan Repurchase Facility | | 100,000 | | | 15,672 | | | 84,328 | | | 2.66% | — | 3.50% | | 10/24/2021 | | (11) | | (12) | | 30,600 | | | 30,600 | | |
| Total Committed Loan Repurchase Facilities | | 1,550,000 | | | 255,368 | | | 1,294,632 | | | | | | | | | | | | | 439,386 | | | 439,386 | | |
| Committed Securities Repurchase Facility(2) | | 787,996 | | | 149,633 | | | 638,363 | | | 0.86% | — | 1.11% | | 12/23/2021 | | N/A | | (13) | | 226,008 | | | 226,008 | | |
| Uncommitted Securities Repurchase Facility | | N/A (14) | | 415,836 | | | N/A (14) | | 0.73% | — | 2.84% | | 1/2021-3/2021 | | N/A | | (13) | | 502,476 | | | 502,476 | | (15) |
| Total Repurchase Facilities | | 1,950,000 | | | 820,837 | | | 1,544,999 | | | | | | | | | | | | | 1,167,870 | | | 1,167,870 | | |
| Revolving Credit Facility | | 266,430 | | | 266,430 | | | 0 | | | 3.15% | | | | 2/11/2022 | | (16) | | N/A (17) | | N/A (17) | | N/A (17) | |
| Mortgage Loan Financing | | 766,064 | | | 766,064 | | | 0 | | | 3.75% | — | 6.16% | | 2021 - 2030(18) | | N/A | | (19) | | 909,406 | | | 1,133,703 | | (20) |
| Secured Financing Facility | | 206,350 | | | 192,646 | | (21) | 0 | | | 10.75% | — | 10.75% | | 5/6/2023 | | N/A | | (22) | | 327,769 | | | 328,097 | | |
| CLO Debt | | 279,156 | | | 276,516 | | (23) | 0 | | | 5.50% | — | 5.50% | | 5/16/2024 | | N/A | | (4) | | 362,600 | | | 362,600 | | |
| | | | | | | | | | | | | | | | | | | | | |
| Borrowings from the FHLB | | 1,500,000 | | | 288,000 | | | 1,212,000 | | | 0.41% | — | 2.74% | | 2021 - 2024 | | N/A | | (24) | | 388,400 | | | 392,212 | | (25) |
| Senior Unsecured Notes | | 1,612,299 | | | 1,599,371 | | (26) | 0 | | | 4.25% | — | 5.88% | | 2021 - 2027 | | N/A | | N/A (27) | | N/A (27) | | N/A (27) | |
| | | | | | | | | | | | | | | | | | | | | |
| | | | | | | | | | | | | | | | | | | | | |
| Total Debt Obligations | | $ | 6,580,299 | | | $ | 4,209,864 | | | $ | 2,756,999 | | | | | | | | | | | | | $ | 3,156,045 | | | $ | 3,384,482 | | |
(1)December 31, 2020 LIBOR rates are used to calculate interest rates for floating rate debt.
(2)The combined committed amounts for the loan repurchase facility and the securities repurchase facility total $900.0 million, with maximum capacity on the loan repurchase facility of $500.0 million, and maximum capacity on the securities repurchase facility of $900.0 million less outstanding commitments on the loan repurchase facility.
(3)NaN additional 12-month periods at Company’s option. No new advances are permitted after the initial maturity date.
(4)First mortgage commercial real estate loans and senior and pari passu interests therein. It does not include the real estate collateralizing such loans.
(5)NaN additional 12-month periods at Company’s option.
(6)First mortgage commercial real estate loans. It does not include the real estate collateralizing such loans.
(7)NaN additional 364-day periods.periods at Company’s option.
(8)First mortgage and mezzanine commercial real estate loans and senior and pari passu interests therein. It does not include the real estate collateralizing such loans.
(9)NaN additional 12-month extension period and 2 additional 6-month extension periods at Company’s option.
(10)NaN additional 12-month extension periods at Company’s option. No new advances are permitted after the initial maturity date.
(11)The Company may extend periodically with lender’s consent. At no time can the maturity of the facility exceed 364 days from the date of determination.
(12)First mortgage, junior and mezzanine commercial real estate loans, and certain senior and/or pari passu interests therein.
(13)Commercial real estate securities. It does not include the first mortgage commercial real estate loans collateralizing such securities.
(14)Represents uncommitted securities repurchase facilities for which there is no committed amount subject to future advances.
(15)Includes $2.2$2.1 million of restricted securities under the risk retention rules of the Dodd-Frank Act. These securities are accounted for as held-to-maturity and recorded at amortized cost basis.
(16)NaN additional 12-month periods at Company’s option.
(17)The obligations under the Revolving Credit Facility are guaranteed by the Company and certain of its subsidiaries and secured by equity pledges in certain Company subsidiaries.
(18)Anticipated repayment dates.
(19)Certain of our real estate investments serve as collateral for our mortgage loan financing.
(20)Using undepreciated carrying value of commercial real estate to approximate fair value.
(21)Presented net of unamortized debt issuance costs of $9.7$7.2 million and an unamortized discount of $8.0$6.6 million related to the Purchase Right (described in detail under Secured Financing Facility below) at June 30,December 31, 2020.
(22)First mortgage commercial real estate loans. Substitution of collateral and conversion of loan collateral to mortgage collateral are permitted with Lender’s approval.
(23)Presented net of unamortized debt issuance costs of $4.8$2.6 million at June 30,December 31, 2020.
(24)First mortgage commercial real estate loans and investment grade commercial real estate securities. It does not include the real estate collateralizing such loans and securities.
(25)Includes $9.4 million of restricted securities under the risk retention rules of the Dodd-Frank Act. These securities are accounted for as held-to-maturity and recorded at amortized cost basis.
(26)Presented net of unamortized debt issuance costs of $15.3$12.9 million at June 30,December 31, 2020.
(27)The obligations under the senior unsecured notes are guaranteed by the Company and certain of its subsidiaries.
December 31, 2019
| | | | | | | | | | | | | | | | | | | | | | | | | | | | | | | | | | | | | | | | | | | | | | | | | | | | | | | | | | | | | | | | | |
| Debt Obligations | | Committed Financing | | Debt Obligations Outstanding | | Committed but Unfunded | | Interest Rate at December 31, 2019(1) | | | | Current Term Maturity | | Remaining Extension Options | | Eligible Collateral | | Carrying Amount of Collateral | | Fair Value of Collateral | |
| | | | | | | | | | | | | | | | | | | | | |
| Committed Loan Repurchase Facility | | $ | 600,000 | | | $ | 183,828 | | | $ | 416,172 | | | 3.24% | — | 3.74% | | 12/19/2022 | | (2) | | (3) | | $ | 287,974 | | | $ | 288,210 | | |
| Committed Loan Repurchase Facility | | 350,000 | | | 70,697 | | | 279,303 | | | 3.71% | — | 3.81% | | 5/24/2020 | | (4) | | (5) | | 101,590 | | | 103,868 | | |
| Committed Loan Repurchase Facility | | 300,000 | | | 248,182 | | | 51,818 | | | 3.49% | — | 3.74% | | 12/19/2020 | | (6) | | (7) | | 382,778 | | | 382,778 | | |
| Committed Loan Repurchase Facility | | 300,000 | | | 98,678 | | | 201,322 | | | 3.50% | — | 3.75% | | 11/6/2022 | | (8) | | (3) | | 175,000 | | | 175,270 | | |
| Committed Loan Repurchase Facility | | 100,000 | | | 9,952 | | | 90,048 | | | 3.96% | — | 3.99% | | 1/3/2023 | | (9) | | (3) | | 75,628 | | | 75,813 | | |
| Committed Loan Repurchase Facility | | 100,000 | | | 90,927 | | | 9,073 | | | 3.74% | — | 3.80% | | 12/24/2020 | | (10) | | (11) | | 126,311 | | | 126,311 | | |
| Total Committed Loan Repurchase Facilities | | 1,750,000 | | | 702,264 | | | 1,047,736 | | | | | | | | | | | | | 1,149,281 | | | 1,152,250 | | |
| Committed Securities Repurchase Facility | | 400,000 | | | 42,751 | | | 357,249 | | | 2.50% | — | 2.56% | | 12/23/2021 | | N/A | | (12) | | 52,691 | | | 52,691 | | |
| Uncommitted Securities Repurchase Facility | | N/A (12) | | 1,070,919 | | | N/A (13) | | 2.17% | — | 3.54% | | 1/2020 - 3/2020 | | N/A | | (12) | | 1,188,440 | | | 1,188,440 | | (14) |
| Total Repurchase Facilities | | 2,150,000 | | | 1,815,934 | | | 1,404,985 | | | | | | | | | | | | | 2,390,412 | | | 2,393,381 | | |
| Revolving Credit Facility | | 266,430 | | | — | | | 266,430 | | | NA | | | | 2/11/2020 | | (15) | | N/A (16) | | N/A (16) | | N/A (16) | |
| Mortgage Loan Financing | | 812,606 | | | 812,606 | | | — | | | 3.75% | — | 6.75% | | 2020 - 2029(17) | | N/A | | (18) | | 988,857 | | | 1,192,106 | | (19) |
| | | | | | | | | | | | | | | | | | | | | |
| | | | | | | | | | | | | | | | | | | | | |
| Borrowings from the FHLB | | 1,945,795 | | | 1,073,500 | | | 872,295 | | | 1.47% | — | 2.95% | | 2020 - 2024 | | N/A | | (20) | | 1,107,188 | | | 1,113,811 | | (21) |
| Senior Unsecured Notes | | 1,166,201 | | | 1,157,833 | | (22) | — | | | 5.25% | — | 5.88% | | 2021 - 2025 | | N/A | | N/A (23) | | N/A (23) | | N/A (23) | |
| | | | | | | | | | | | | | | | | | | | | |
| | | | | | | | | | | | | | | | | | | | | |
| Total Debt Obligations | | $ | 6,341,032 | | | $ | 4,859,873 | | | $ | 2,543,710 | | | | | | | | | | | | | $ | 4,486,457 | | | $ | 4,699,298 | | |
(1)December 31, 2019 LIBOR rates are used to calculate interest rates for floating rate debt.
(2)NaN additional 12-month periods at Company’s option. No new advances are permitted after the initial maturity date.
(3)First mortgage commercial real estate loans and senior and pari passu interests therein. It does not include the real estate collateralizing such loans.
(4)NaN additional 12-month period at Company’s option.
(5)First mortgage commercial real estate loans. It does not include the real estate collateralizing such loans.
(6)NaN additional 364-day periods.
(7)First mortgage and mezzanine commercial real estate loans and senior pari passu interests therein. It does not include the real estate collateralizing such loans.
(8)NaN additional 12-month extension period and 2 additional 6-month extension periods at Company’s option.
(9)NaN additional 12-month extension periods at Company’s option. No new advances are permitted after the initial maturity date.
(10)The Company may extend periodically with lender’s consent. At no time can the maturity of the facility exceed 364 days from the date of determination.
(11)First mortgage, junior and mezzanine commercial real estate loans, and certain senior and/or pari passu interests therein.
(12)Commercial real estate securities. It does not include the real estate collateralizing such securities.
(13)Represents uncommitted securities repurchase facilities for which there is no committed amount subject to future advances.
(14)Includes $2.2 million of restricted securities under the risk retention rules of the Dodd-Frank Act. These securities are accounted for as held-to-maturity and recorded at amortized cost basis.
(15)NaN additional 12-month periods at Company’s option.
(16)The obligations under the Revolving Credit Facility are guaranteed by the Company and certain of its subsidiaries and secured by equity pledges in certain Company subsidiaries.
(17)Anticipated repayment dates.
(18)Certain of our real estate investments serve as collateral for our mortgage loan financing.
(19)Using undepreciated carrying value of commercial real estate to approximate fair value.
(20)First mortgage commercial real estate loans and pari passu interests therein. It does not include the real estate collateralizing such loans.
(21)First mortgage commercial real estate loans and investment grade commercial real estate securities. It does not include the real estate collateralizing such loans and securities.
(22)Includes $9.9 million of restricted securities under the risk retention rules of the Dodd-Frank Act. These securities are accounted for as held-to-maturity and recorded at amortized cost basis.
(23)Presented net of unamortized debt issuance costs of $8.4 million at December 31, 2019.
(24)The obligations under the senior unsecured notes are guaranteed by the Company and certain of its subsidiaries.
Combined Maturity of Debt Obligations
The following schedule reflects the Company’s contractual payments under all borrowings by maturity ($ in thousands):
| | Period ending December 31, | Period ending December 31, | | Borrowings by
Maturity(1) | Period ending December 31, | | Borrowings by
Maturity(1) |
| | | | | |
| 2020 (last 6 months) | | $ | 1,494,949 | | |
| 2021 | | 527,569 | | |
| 2021 (last 6 months) | | 2021 (last 6 months) | | $ | 631,068 | |
| 2022 | 2022 | | 642,014 | | 2022 | | 925,858 | |
| 2023 | 2023 | | 351,436 | | 2023 | | 146,112 | |
| 2024 | 2024 | | 612,695 | | 2024 | | 296,315 | |
| 2025 | | 2025 | | 468,876 | |
| Thereafter | Thereafter | | 1,358,119 | | Thereafter | | 1,534,678 | |
| Subtotal | Subtotal | | 4,986,782 | | Subtotal | | 4,002,907 | |
| Debt issuance costs included in senior unsecured notes | Debt issuance costs included in senior unsecured notes | | (15,275) | | Debt issuance costs included in senior unsecured notes | | (20,585) | |
| | Debt issuance costs included in secured financing facility | Debt issuance costs included in secured financing facility | | (9,705) | | Debt issuance costs included in secured financing facility | | (4,535) | |
| Discount on secured financing facility related to purchase right | | (7,958) | | |
| Discount on secured financing facility related to Purchase Right | | Discount on secured financing facility related to Purchase Right | | (4,692) | |
| Debt issuance costs included in CLO debt | Debt issuance costs included in CLO debt | | (4,808) | | Debt issuance costs included in CLO debt | | (941) | |
| Debt issuance costs included in mortgage loan financing | Debt issuance costs included in mortgage loan financing | | (524) | | Debt issuance costs included in mortgage loan financing | | (329) | |
| Premiums included in mortgage loan financing(2) | Premiums included in mortgage loan financing(2) | | 5,002 | | Premiums included in mortgage loan financing(2) | | 3,890 | |
| Total | Total | | $ | 4,953,514 | | Total | | $ | 3,975,715 | |
(1)Contractual payments under current maturities, some of which are subject to extensions. The maturities listed above for 2020 (last 6 months)2021 relate to debt obligations that are subject to existing Company controlled extension options for one or more additional one yearone-year periods or could be refinanced by other existing facilities as of June 30, 2020.2021.
(2)Deferred gains on intercompany loans, secured by our own real estate, sold into securitizations. These premiums are amortized as a reduction to interest expense.
Financial Covenants
The Company’s debt facilities are subject to covenants which require the Company to maintain a minimum level of total equity. Largely as a result of this restriction, approximately $849.0$871.4 million of the total equity is restricted from payment as a dividend by the Company at June 30, 2020.2021.
We were in compliance with all covenants described in the Company’s Annual Report, as of June 30, 2021.
Committed Loan and Securities Repurchase Facilities
On February 14, 2020, the Company amended one of its committed loan repurchase facilities with a major U.S. bank to reduce the maximum capacity of the facility from $600.0 million to $500.0 million.
On February 26, 2020, the Company amended one of its committed loan repurchase facilities with a major U.S. bank, extending the term of the facility. The current maturity date is now February 26, 2021, and the Company has 3 one-year extension options for a final maturity dateentered into 6 committed master repurchase agreements, as outlined in the June 30, 2021 table above, totaling $1.2 billion of February 26, 2024. The Company also reduced the maximum size of the facility from $350.0 millioncredit capacity in order to $250.0 million.
On March 23, 2020, theproperties and mezzanine debt. The Company amended one of its committed loan and securitiesalso has a term master repurchase facilitiesagreement with a major U.S. bank to allow for an increase in the capacity on the securities repurchase facility, to the extent the Company has excess capacity on the loan repurchase facility. Prior to the amendment, the committed amounts on the facility were $500.0 million and $400.0 million on the loan and securitiesfinance CMBS totaling $790.7 million. The Company’s repurchase facilities respectively. After the amendment, the committed amounts continue to total $900.0 million, withinclude covenants covering net worth requirements, minimum liquidity levels, maximum capacity on the loan repurchase facility of $500.0 million,leverage ratios, and maximum capacity on the securities repurchase facility of $900.0 million less outstanding commitments on the loan repurchase facility.
Effective June 16, 2020, the Company amended the pricing side letter related to one of its committed loan repurchase facility with a major U.S. bank to extend the current maturity date to March 24, 2021.minimum fixed charge coverage ratios. The Company also temporarily increased the leverage covenant to 4.0x throughbelieves it was in compliance with all covenants as of June 30, 2021 and including December 31, 2020.
The Company has the option to extend some of the current facilities subject to a number of conditions, including satisfaction of certain notice requirements, no event of default exists, and no margin deficit exists, all as defined in the repurchase facility agreements. The lenders have sole discretion with respect to the inclusion of collateral in these facilities, to determine the market value of the collateral on a daily basis, to be exercised on a good faith basis, and have the right in certain cases to require additional collateral, a full and/or partial repayment of the facilities (margin call), or a reduction in unused availability under the facilities, sufficient to rebalance the facilities if the estimated market value of the included collateral declines.
On May 19, 2021, the Company amended a credit facility with a major U.S. banking institution to, among other things, reduce the maximum facility amount from $300 million to $100 million and extend the initial term thereof from November 6, 2022 to April 30, 2024.
On May 25, 2021, the Company amended a credit facility with a major banking institution to, among other things, reduce the maximum facility amount from $250 million to $100 million.
Revolving Credit Facility
During the three months ended June 30, 2021, the Company paid down the full amount of the Revolving Credit Facility. As of June 30, 2021, the Company had 0 outstanding borrowings on the Revolving Credit Facility but still maintains the ability to draw $266.4 million.
Debt Issuance Costs
As discussed in Note 2, Significant Accounting Policies in the Annual Report, the Company considers its committed loan master repurchase facilities and Revolving Credit Facility to be revolving debt arrangements. As such, the Company continues to defer and present costs associated with these facilities as an asset, subsequently amortizing those costs ratably over the term of each revolving debt arrangement. As of June 30, 2021 and December 31, 2020, the amount of unamortized costs relating to such facilities were $4.4 million and $8.0 million, respectively, and are included in other assets in the consolidated balance sheets.
Mortgage Loan Financing
These non-recourse debt agreements provide for fixed rate financing at rates ranging from 3.75% to 6.16%, with anticipated maturity dates between 2021-2030 as of June 30, 2021. These loans have carrying amounts of $746.0 million and $766.1 million, net of unamortized premiums of $3.9 million and $4.6 million as of June 30, 2021 and December 31, 2020, respectively, representing proceeds received upon financing greater than the contractual amounts due under these agreements. The premiums are being amortized over the remaining life of the respective debt instruments using the effective interest method. The Company recorded $0.4 million and $0.3 million for the three months ended June 30, 2021 and June 30, 2020, respectively and $0.7 million and $0.6 million of premium amortization, which decreased interest expense, for the six months ended June 30, 2021 and 2020, respectively. The mortgage loans are collateralized by real estate and related lease intangibles, net, of $874.9 million and $909.4 million as of June 30, 2021 and December 31, 2020, respectively.
Secured Financing Facility
On April 30, 2020, the Company entered into a strategic financing arrangement (the “Agreement”) with an American multinational corporation (the “Lender”), under which the Lender will provideprovided the Company with approximately $206.4 million in senior secured financing (the “Secured Financing Facility”) to fund transitional and land loans. The Secured Financing Facility will beis secured on a first lien basis on a portfolio of certain of the Company’s loans and will mature on May 6, 2023, and borrowings thereunder will bear interest at LIBOR (or a minimum of 0.75% if greater) plus 10.0%, with a minimum interest premium clause, of which approximately $39.2$13.9 million minus the aggregate sum of all interest payments made under the Secured Financing Facility prior to the date of payment of the minimum interest premium, which is payable upon the earlier of maturity or repayment in full of the loan.remains. The Senior Financing Facility is non-recourse, subject to limited exceptions, and does not contain mark-to-market provisions. Additionally, the Senior Financing Facility provides the Company optionality to modify or restructure loans or forbear in exercising remedies, which maximizes the Company’s financial flexibility. During the three months ended June 30, 2021, the facility was partially paid down by $45.0 million, which resulted in an ending balance as of June 30, 2021 of $152.1 million.
As part of the strategic financing, the Lender also hashad the ability to make an equity investment in the Company of up to 4.0 million Class A common shares at $8.00 which amount and price may be proportionally adjusted in the event of equity distributions, stock splits, reclassifications and other similar eventsper share, subject to certain adjustments (the “Purchase Right”). The Purchase Right will expirewas exercised in full at $8.00 per share on December 31,29, 2020. The Company expects that any such investment would additionally benefit its liquidity position.
The Purchase Right was classified as equity. The $200.9 million of net proceeds from the original issuance were allocated $192.5 million to the originally issued debt obligation and $8.4 million to the Purchase Right using the relative fair value method. The commitment to issue shares will not be subsequently remeasured. The $8.4 million allocated to the Purchase Right is being treated as a discount to the debt and amortized over the life of the Purchase Right to interest expense.
Pursuant to the Purchase Right, the Lender has agreed to a customary standstill until December 31, 2020 or the date on which the Lender has exercised the Purchase Right in full, if earlier. In addition, the Lender has agreed not to sell, transfer, assign, pledge, hypothecate, mortgage, dispose of or in any way encumber the shares acquired as a result of exercising the Purchase Right for a period of time following the exercise date. In connection with the issuance of the Purchase Right, the Company and the Lender entered into a registration rights agreement, pursuant to which the Company has agreed to provide customary demand and piggyback registration rights to the Lender.
The Purchase Right was classified as equity and the $200.9 million of net proceeds from the original issuance were allocated $192.5 million to the originally issued debt obligation and $8.4 million to the Purchase Right using the relative fair value method. The commitment to issue shares will not be subsequently remeasured. The $8.4 million allocated to the Purchase Right is being treated as a discount to the debt and amortized over the life of the Purchase Right to interest expense.
As of June 30, 2020,2021, the Company had $188.7$152.1 million of borrowings outstanding under the secured financing facility included in debt obligations on its consolidated balance sheets, net of unamortized debt issuance costs of $9.7$4.5 million and an $8.0a $4.7 million unamortized discount related to the Purchase Right.
Collateralized Loan Obligation (“CLO”) Debt
On April 27, 2020, a consolidated subsidiary of the Company completed a private CLO transaction with a major U.S. bank which generated $310.2 million of gross proceeds to Ladder, financing $481.3 million of loans (“Contributed Loans”) at a 64.5% advance rate on a matched term, non-mark-to-market and non-recourse basis. A consolidated subsidiary of the Company retained a 35.5% subordinate and controlling interest in the CLO. The Company retained control over major decisions made with respect to the administration of the Contributed Loans, including broad discretion in managing these loans, in light of the COVID-19 pandemic, and has the ability to appoint the special servicer under the CLO. The Company retained control over major decisions made with respect to the administration of the Contributed Loans and has the ability to appoint the special servicer under the CLO. The CLO is a VIE and the Company was the primary beneficiary and, therefore, consolidated the VIE - See Note 10, Consolidated Variable Interest Entities. Proceeds from the transaction were used to pay off other secured debt including bank and FHLB financing that was subject to mark-to-market provisions.
As of June 30, 2020,2021, the Company had $299.6$168.8 million of matched term, non-mark-to-market and non-recourse basis CLO debt included in debt obligations on its consolidated balance sheets. Unamortized debt issuance costs
Borrowings from the Federal Home Loan Bank (“FHLB”)
On July 11, 2012, Tuebor, a consolidated subsidiary of $4.8 million were includedthe Company, became a member of the FHLB and subsequently drew its first secured funding advances from the FHLB. As of February 19, 2021, pursuant to a final rule adopted by the Federal Housing Finance Agency (the “FHFA”) regarding the eligibility of captive insurance companies, Tuebor’s membership in CLO debt asthe FHLB has been terminated, although outstanding advances may remain outstanding until their scheduled maturity dates. Funding for future advance paydowns is expected to be obtained from the natural amortization and/or sales of securities collateral, or from other financing sources. There is no assurance that the FHFA or the FHLB will not take actions that could adversely impact Tuebor’s existing advances.
As of June 30, 2020.2021, Tuebor had $288.0 million of borrowings outstanding, with terms of overnight to 3.25 years (with a weighted average of 2.26 years), interest rates of 0.36% to 2.74% (with a weighted average of 1.07%), and advance rates of 71.7% to 95.7% on eligible collateral. As of June 30, 2021, collateral for the borrowings was comprised of $236.1 millionof CMBS and U.S. Agency securities and $83.5 million of cash.
Tuebor is subject to state regulations which require that dividends (including dividends to the Company as its parent) may only be made with regulatory approval. However, there can be no assurance that we would obtain such approval if sought. Largely as a result of this restriction, approximately $2.1 billion of the member’s capital was restricted from transfer via dividend to Tuebor’s parent without prior approval of state insurance regulators at June 30, 2021. To facilitate intercompany cash funding of operations and investments, Tuebor and its parent maintain regulator-approved intercompany borrowing/lending agreements.
Senior Unsecured Notes
As of June 30, 2020,2021, the Company had $1.7$2.1 billion of unsecured corporate bonds outstanding. These unsecured financings were comprised of $258.5 million in aggregate principal amount of 5.875% senior notes due 2021 (the “2021 Notes”), $485.6$465.9 million in aggregate principal amount of 5.25% senior notes due 2022 (the “2022 Notes”), $350.8$348.0 million in aggregate principal amount of 5.25% senior notes due 2025 (the “2025 Notes”) and $658.0, $651.8 million in aggregate principal amount of 4.25% senior notes due 2027 (the “2027 Notes”) and $650.0 million in aggregate principal of 4.75% senior notes due 2029 (the “2029 Notes,” collectively with the 2022 Notes, the 2025 Notes, and the 2027 Notes, the “Notes”).
On January 27, 2021, the Company redeemed in full its 5.875% Senior Notes due 2021 (the “2021 Notes”) for $150.9 million. The 2021 Notes were redeemed at par, plus accrued and unpaid interest to the redemption date, pursuant to the optional redemption provisions of the indenture governing the 2021 Notes. The redemption of a portion of the 2021 Notes that were redeemed was subject to the condition that the Company’s subsidiary issuers of the 2021 Notes complete a notes offering of not less than $400 million. The issuers waived the condition prior to redeeming the 2021 Notes in full.
LCFH issued the Notes with Ladder Capital Finance Corporation (“LCFC”), as co-issuers on a joint and several basis. LCFC is a 100% owned finance subsidiary of LCFH with no assets, operations, revenues or cash flows other than those related to the issuance, administration and repayment of the Notes. The Company and certain subsidiaries of LCFH currently guarantee the obligations under the Notes and the indenture. The Company is the general partner of LCFH and, through LCFH and its subsidiaries, operates the Ladder Capital business. As of June 30, 2021, the Company has a 100% economic and voting interest in LCFH and controls the management of LCFH as a result of its ability to appoint board members. Accordingly, the Company consolidates the financial results of LCFH. In addition, the Company, through certain subsidiaries which are treated as TRSs, is indirectly subject to U.S. federal, state and local income taxes. Other than federal, state and local income taxes, there are no material differences between the Company’s consolidated financial statements and LCFH’s consolidated financial statements. The Company believes it was in compliance with all covenants of the Notes as of June 30, 2021 and 2020. Unamortized debt issuance costs of $20.6 million and $12.9 million are included in senior unsecured notes as of June 30, 2021 and December 31, 2020, respectively, in accordance with GAAP.
2022 Notes
On March 16, 2017, LCFH issued $500.0 million in aggregate principal amount of 5.250% senior notes due March 15, 2022 (the “2022 Notes”). The 2022 Notes require interest payments semi-annually in cash in arrears on March 15 and September 15 of each year, beginning on September 15, 2017. The 2022 Notes are unsecured and are subject to an unencumbered assets to unsecured debt covenant. At any time on or after September 15, 2021, the 2022 Notes are redeemable at the option of the Company, in whole or in part, upon not less than 15 nor more than 60 days’ notice, without penalty. On May 2, 2018, the board of the directors authorized the Company to repurchase any or all of the 2022 Notes from time to time without further approval. As of June 30, 2021, the remaining $465.9 million in aggregate principal amount of the 2022 Notes is due March 15, 2022.
2025 Notes
On September 25, 2017, LCFH issued $400.0 million in aggregate principal amount of 5.250% senior notes due October 1, 2025 (the “2025 Notes”). The 2025 Notes require interest payments semi-annually in cash in arrears on April 1 and October 1 of each year, beginning on April 1, 2018. The 2025 Notes are unsecured and are subject to an unencumbered assets to unsecured debt covenant. The Company may redeem the 2025 Notes, in whole or in part, at any time, or from time to time, prior to their stated maturity upon not less than 15 nor more than 60 days’ notice, at a redemption price as specified in the “Notes”). As a resultindenture governing the 2025 Notes, plus accrued and unpaid interest, if any, to the redemption date. On May 2, 2018, the board of the Company’s financing and liquidity measures implementeddirectors authorized the Company to date as a direct responserepurchase any or all of the 2025 Notes from time to time without further approval. As of June 30, 2021, the COVID-19 pandemic, Ladder repurchased anremaining $348.0 million in aggregate principal amount of the 2025 Notes of $139.1 million, recognizing a gain on extinguishment of debt of $19.0 million, offset by accelerated deferred financing cost amortization of $1.5 million during the three months ended June 30, 2020.is due October 1, 2025.
2027 Notes
On January 30, 2020, LCFH and Ladder Capital Finance Corporation (“LCFC”), a wholly-owned subsidiary of LCFH issued $750.0 million in aggregate principal amount of 4.25% senior notes due February 1, 2027. The 2027 Notes require interest payments semi-annually in cash in arrears on August 1 and February 1 of each year, beginning on August 1, 2020. The 2027 Notes will mature on February 1, 2027. The 2027 Notes are unsecured and are subject to an unencumbered assets to unsecured debt covenant. The Company may redeem the 2027 Notes, in whole, at any time, or from time to time, prior to their stated maturity. At any time on or after February 1, 2023, the Company may redeem the 2027 Notes in whole or in part, upon not less than 15 nor more than 60 days’ notice, at a redemption price defined in the indenture governing the 2027 Notes, plus accrued and unpaid interest, if any, to the redemption date. Net proceeds of the offering were used to repay secured indebtedness. During the six months ended June 30, 2020, the Company retired $92.0 million of principal of the 2027 Notes for a repurchase price of $78.4 million, recognizing a $12.3 million net gain on extinguishment of debt after recognizing $(1.3) million of unamortized debt issuance costs associated with the retired debt. As of June 30, 2020,2021, the remaining $658.0$651.8 million in aggregate principal amount of the 2027 Notes is due February 1, 2027.
20252029 Notes
On September 25, 2017,June 23, 2021, LCFH and LCFC issued $400.0$650.0 million in aggregate principal amount of 5.25%4.75% senior notes due October 1, 2025. DuringJune 15, 2029. The 2029 Notes require interest payments semi-annually in cash in arrears on June 15 and December 15 of each year, beginning December 15, 2021. The 2029 Notes are unsecured and are subject to an unencumbered asset to unsecured debt covenant. The Company may redeem the six months ended2029 Notes, in whole, at any time, or from time to time, prior to their stated maturity. At any time on or after June 30, 2020,15, 2024, the Company retired $49.2 million of principal ofmay redeem the 20252029 Notes for a repurchase price of $42.6 million, recognizing a $6.2 million net gain on extinguishment of debt after recognizing $(0.5) million of unamortized debt issuance costs associated with the retired debt. As of June 30, 2020, the remaining $350.8 million in aggregate principal amount of the 2025 Notes is due October 1, 2025.
2022 Notes
On March 16, 2017, LCFH issued $500.0 millionwhole or in aggregate principal amount of 5.250% senior notes due March 15, 2022. During the six months ended June 30, 2020, the Company retired $14.4 million of principal of the 2022 Notes for a repurchase price of $13.8 million, recognizing a $0.6 million net gain on extinguishment of debt after recognizing $(0.1) million of unamortized debt issuance costs associated with the retired debt. As of June 30, 2020, the remaining $485.6 million in aggregate principal amount of the 2022 Notes is due March 15, 2022.
2021 Notes
On August 1, 2014, LCFH and LCFC issued $300.0 million in aggregate principal amount of 5.875% senior notes due August 1, 2021. During the six months ended June 30, 2020, the Company retired $7.7 million of principal of the 2021 Notes for a repurchase price of $7.5 million, recognizing a $0.2 million net gain on extinguishment of debt after recognizing $(20.0) thousand of unamortized debt issuance costs associated with the retired debt. As of June 30, 2020, the remaining $258.5 million in aggregate principal amount of the 2021 Notes is due August 1, 2021.
Financing Strategydays’ notice, at a redemption price defined in Current Market Conditions
In March 2020, as the COVID-19 health crisis rapidly transformed into a financial crisis, management took swift actionindenture governing the 2029 Notes, plus accrued and unpaid interest, if any, to increase liquidity resources and actively manage its financing arrangements with its bank partners. In an abundancethe redemption date. Net proceeds of caution, the Company first drew down on its $266.4 million unsecured revolving credit facility, which continues to be fully-drawn, and the proceeds continue to be held as unrestricted cash onoffering were used for general corporate purposes, including funding the Company’s balance sheet aspipeline of July 30, 2020.
Securities Repurchase Facilities: The Company investsnew loans, investments in AAA-rated CRE CLO securities, typically front pay securities, with relatively short durationits core business lines and significant subordination. These securities have historically been financed with short-term maturity repurchase agreements with various bank counterparties. The Company has been able to continue to access securities repurchase funding and the pricingrepayment of such borrowings has improved during the three months ended June 30, 2020 as liquidity returned to the market and pricing for the securities that serve as collateral improved. Furthermore, during the three months ended June 30, 2020, the Company paid down $275.8 million of securities repurchase financing, primarily through sales of securities.indebtedness. As of July 27, 2020, the Company had $834.4 million outstanding of securities repurchase financing with maturities ranging from 3 days to 17 months.
Federal Home Loan Bank (“FHLB”) Financing: As discussed in the Company’s Annual Report, in 2016, the FHFA adopted a final rule that limited our captive insurance subsidiary’s membership in the FHLB, requiring us to significantly reduce the amounts of FHLB borrowings outstanding by February of 2021.
During the three months ended June 30, 2020, the Company paid down FHLB borrowings of $646.8 million, with $360.8 million outstanding as of July 27, 2020. The remaining maturities are staggered out through 2024. Funding for future advance paydowns would be obtained from the natural amortization of securities over time, loan pay offs and/or sales of loan and securities collateral. The Company incurred $6.5 million in prepayment penalties related to this paydown of FHLB borrowings.
Loan Repurchase Financing: The Company has maintained a consistent dialogue with its loan financing counterparties since the COVID-19 crisis unfolded in late March 2020. In addition to using proceeds from the Company’s 2027 Notes offering in January to reduce secured debt, during the three months ended June 30, 2020, the Company paid down over $155.9 million on such loan repurchase financing through loan collateral pay offs and loans securitized through a CLO financing transaction (see above).
As of July 27, 2020, the Company had $374.9 million of loan repurchase debt outstanding with 5 separate bank counterparties. The Company continues to maintain an active dialogue with its bank counterparties as it expects loan collateral on each of their lines to experience some measure of forbearance.
Secured Financing Facility: On April 30, 2020, the Company entered into a strategic financing arrangement (the “Agreement”) with an American multinational corporation (the “Lender”), under which the Lender will provide the Company with approximately $206.4 million in senior secured financing (the “Secured Financing Facility”) to fund transitional and land loans (see above).
Completion of Private CLO: On April 27, 2020, the Company completed a private CLO financing transaction with a major U.S. bank which generated $310.2 million of gross proceeds, financing $481.3 million of loans at a 64.5% advance rate on a matched term, non-mark-to-market and non-recourse basis (see above).
As a result of our financing and liquidity measures implemented to date in direct response to the COVID-19 pandemic, as of July 27, 2020, Ladder had over $750.0 million of unrestricted cash on hand. Based on the financing actions described above, the Company has significantly decreased its exposure to mark-to-market financing.
Financial Covenants
We were in compliance with all covenants described in the Company’s Annual Report, as of June 30, 2020.2021, the remaining $650.0 million in aggregate principal amount of the 2029 Notes is due June 15, 2029.
8. DERIVATIVE INSTRUMENTS
The Company uses derivative instruments primarily to economically manage the fair value variability of fixed rate assets caused by interest rate fluctuations and overall portfolio market risk. The following is a breakdown of the derivatives outstanding as of June 30, 20202021 and December 31, 20192020 ($ in thousands):
June 30, 20202021
| | | | | | | Fair Value | | | Remaining
Maturity
(years) | | | | | Fair Value | | Remaining
Maturity
(years) |
| Contract Type | Contract Type | | Notional | | Asset(1) | | Liability(1) | | | Remaining
Maturity
(years) | | Notional | | Asset(1) | | Liability(1) | | Remaining
Maturity
(years) |
| | Caps | Caps | | | | | | | | | Caps | | | | | | | | |
| 1 Month LIBOR | 1 Month LIBOR | | $ | 69,571 | | | $ | — | | | $ | — | | | 0.86 | 1 Month LIBOR | | $ | 69,571 | | | $ | 0 | | | $ | 0 | | | 0.36 |
| Futures | Futures | | | | | | | | | Futures | | | | | | | | |
| 5-year Swap | 5-year Swap | | 24,400 | | | 103 | | | — | | | 0.25 | 5-year Swap | | 25,300 | | | 0 | | | 70 | | | 0.25 |
| 10-year Swap | 10-year Swap | | 61,000 | | | 258 | | | — | | | 0.25 | 10-year Swap | | 107,700 | | | 0 | | | 298 | | | 0.25 |
| 5-year U.S. Treasury Note | | 4,500 | | | 19 | | | — | | | 0.25 | |
| | | Total futures | Total futures | | 89,900 | | | 380 | | | — | | | | Total futures | | 133,000 | | | 0 | | | 368 | | | |
| | Total derivatives | Total derivatives | | $ | 159,471 | | | $ | 380 | | | $ | — | | | | Total derivatives | | $ | 202,571 | | | $ | 0 | | | $ | 368 | | | |
(1)Shown as derivative instruments, at fair value, in the accompanying consolidated balance sheets.
December 31, 20192020
| | | | | | | Fair Value | | | Remaining
Maturity
(years) | | | | | Fair Value | | Remaining
Maturity
(years) |
| Contract Type | Contract Type | | Notional | | Asset(1) | | Liability(1) | | | Remaining
Maturity
(years) | | Notional | | Asset(1) | | Liability(1) | | Remaining
Maturity
(years) |
| | Caps | Caps | | | | | | | | | Caps | | | | | | | | |
| 1Month LIBOR | 1Month LIBOR | | $ | 69,571 | | | $ | — | | | $ | — | | | 0.36 | 1Month LIBOR | | $ | 69,571 | | | $ | 0 | | | $ | 0 | | | 0.35 |
| Futures | Futures | | | | | | | | | Futures | | | | | | | | |
| 5-year Swap | 5-year Swap | | 46,000 | | | 158 | | | — | | | 0.25 | 5-year Swap | | 23,800 | | | 108 | | | 0 | | | 0.25 |
| 10-year Swap | 10-year Swap | | 149,800 | | | 516 | | | — | | | 0.25 | 10-year Swap | | 41,800 | | | 191 | | | 0 | | | 0.25 |
| 5-year U.S. Treasury Note | | 1,100 | | | 4 | | | — | | | 0.25 | |
| | | Total futures | Total futures | | 196,900 | | | 678 | | | — | | | | Total futures | | 65,600 | | | 299 | | | 0 | | | |
| | Credit Derivatives | | | | | | | | | |
| | S&P 500 Put Options | | 143,300 | | | 15 | | | — | | | 0.05 | |
| | Total credit derivatives | | 143,300 | | | 15 | | | — | | | | |
| | Total derivatives | Total derivatives | | $ | 409,771 | | | $ | 693 | | | $ | — | | | | Total derivatives | | $ | 135,171 | | | $ | 299 | | | $ | 0 | | | |
(1)Shown as derivative instruments, at fair value, in the accompanying consolidated balance sheets.
The following table indicates the net realized gains (losses) and unrealized appreciation (depreciation) on derivatives, by primary underlying risk exposure, as included in net result from derivatives transactions in the consolidated statements of operations for the three and six months ended June 30, 20202021 and 20192020 ($ in thousands):
| | | Three Months Ended June 30, 2020 | | | Six Months Ended June 30, 2020 | | |
| | | Unrealized
Gain/(Loss) | | Realized
Gain/(Loss) | | Net Result
from
Derivative
Transactions | | Unrealized
Gain/(Loss) | | Realized
Gain/(Loss) | | Net Result
from
Derivative
Transactions | | | | | | | | | | | | | | | | | | | | | | | | | | | | | | | |
| | | | | | | | | | | | | | | Three Months Ended June 30, 2021 | | Six Months Ended June 30, 2021 |
| Contract Type | Contract Type | | Contract Type | | Unrealized
Gain/(Loss) | | Realized
Gain/(Loss) | | Net Result
from
Derivative
Transactions | | Unrealized
Gain/(Loss) | | Realized
Gain/(Loss) | | Net Result
from
Derivative
Transactions |
| | | Futures | Futures | $ | (570) | | | $ | (326) | | | $ | (896) | | | $ | (298) | | | $ | (16,272) | | | $ | (16,570) | | Futures | | $ | (669) | | | $ | (3,175) | | | $ | (3,844) | | | $ | (667) | | | $ | 1,594 | | | $ | 927 | |
| | Credit Derivatives | — | | | 83 | | | 83 | | | 111 | | | 211 | | | 322 | | |
| | Total | Total | $ | (570) | | | $ | (243) | | | $ | (813) | | | $ | (187) | | | $ | (16,061) | | | $ | (16,248) | | Total | | $ | (669) | | | $ | (3,175) | | | $ | (3,844) | | | $ | (667) | | | $ | 1,594 | | | $ | 927 | |
| | | Three Months Ended June 30, 2019 | | | Six Months Ended June 30, 2019 | | |
| | | Unrealized
Gain/(Loss) | | Realized
Gain/(Loss) | | Net Result
from
Derivative
Transactions | | Unrealized
Gain/(Loss) | | Realized
Gain/(Loss) | | Net Result
from
Derivative
Transactions | | | | | | | | | | | | | | | | | | | | | | | | | | | | | | | |
| | | | | | | | | | | | | | | Three Months Ended June 30, 2020 | | Six Months Ended June 30, 2020 |
| Contract Type | Contract Type | | Contract Type | | Unrealized
Gain/(Loss) | | Realized
Gain/(Loss) | | Net Result
from
Derivative
Transactions | | Unrealized
Gain/(Loss) | | Realized
Gain/(Loss) | | Net Result
from
Derivative
Transactions |
| | | Futures | Futures | $ | (1,046) | | | $ | (14,361) | | | $ | (15,407) | | | $ | 1,511 | | | $ | (27,894) | | | $ | (26,383) | | Futures | | $ | (570) | | | $ | (326) | | | $ | (896) | | | $ | (298) | | | $ | (16,272) | | | $ | (16,570) | |
| | Credit Derivatives | Credit Derivatives | 66 | | | (116) | | | (50) | | | — | | | (108) | | | (108) | | Credit Derivatives | | 0 | | | 83 | | | 83 | | | 111 | | | 211 | | | 322 | |
| Total | Total | $ | (980) | | | $ | (14,477) | | | $ | (15,457) | | | $ | 1,511 | | | $ | (28,002) | | | $ | (26,491) | | Total | | $ | (570) | | | $ | (243) | | | $ | (813) | | | $ | (187) | | | $ | (16,061) | | | $ | (16,248) | |
The Company’s counterparties held $1.7$1.9 million and $3.5$0.8 million of cash margin as collateral for derivatives as of June 30, 20202021 and December 31, 2019,2020, respectively, which is included in restricted cash in the consolidated balance sheets.
Futures
Collateral posted with our futures counterparties is segregated in the Company’s books and records. Interest rate futures are centrally cleared by the Chicago Mercantile Exchange (“CME”) through a futures commission merchant. Interest rate futures that are governed by an ISDAInternational Swaps and Derivatives Association (“ISDA”) agreement provide for bilateral collateral pledging based on the counterparties’ market value. The counterparties have the right to re-pledge the collateral posted but have the obligation to return the pledged collateral, or substantially the same collateral, if agreed to by us, as the market value of the interest rate futures change.
The Company is required to post initial margin and daily variation margin for our interest rate futures that are centrally cleared by CME. CME determines the fair value of our centrally cleared futures, including daily variation margin. Effective January 3, 2017, CME amended their rulebooks to legally characterize daily variation margin payments for centrally cleared interest rate futures as settlement rather than collateral. As a result of this rule change, variation margin pledged on the Company’s centrally cleared interest rate futures is settled against the realized results of these futures.
9. OFFSETTING ASSETS AND LIABILITIES
The following tables present both gross information and net information about derivatives and other instruments eligible for offset in the statement of financial position as of June 30, 20202021 and December 31, 2019.2020. The Company’s accounting policy is to record derivative asset and liability positions on a gross basis; therefore, the following tables present the gross derivative asset and liability positions recorded on the balance sheets, while also disclosing the eligible amounts of financial instruments and cash collateral to the extent those amounts could offset the gross amount of derivative asset and liability positions. The actual amounts of collateral posted by or received from counterparties may be in excess of the amounts disclosed in the following tables as the following only disclose amounts eligible to be offset to the extent of the recorded gross derivative positions.
AsThere were no offsetting of financial assets and derivative assets at as of June 30, 20202021.
Offsetting
The following table represents offsetting of Financial Assetsfinancial liabilities and Derivative Assets
($derivative liabilities as of June 30, 2021 ($ in thousands):
| | Description | Description | | Gross amounts of
recognized assets | | Gross amounts
offset in the
balance sheet | | Net amounts of
assets presented
in the balance
sheet | | Gross amounts not offset in the
balance sheet | | | Net amount | Description | | Gross amounts of
recognized
liabilities | | Gross amounts
offset in the
balance sheet | | Net amounts of
liabilities
presented in the
balance sheet | | Gross amounts not offset in the
balance sheet | | Net amount |
| | | | | | | | Financial
instruments | | Cash collateral
received/(posted)(1) | | | Description | Gross amounts of
recognized
liabilities | Gross amounts
offset in the
balance sheet | | Net amounts of
liabilities
presented in the
balance sheet | | Financial
instruments
collateral | Cash collateral
posted/(received)(1) | | Net amount |
| | Derivatives | Derivatives | | $ | 380 | | | $ | — | | | $ | 380 | | | $ | — | | | $ | — | | | $ | 380 | | Derivatives | | $ | 368 | | | $ | 0 | | | $ | 368 | | | $ | 0 | | | $ | 368 | | | $ | 0 | |
| Repurchase agreements | | Repurchase agreements | | $ | 525,700 | | | $ | 0 | | | $ | 525,700 | | | $ | 525,700 | | | $ | 0 | | | $ | 0 | |
| Total | Total | | $ | 380 | | | $ | — | | | $ | 380 | | | $ | — | | | $ | — | | | $ | 380 | | Total | | $ | 526,068 | | | $ | 0 | | | $ | 526,068 | | | $ | 525,700 | | | $ | 368 | | | $ | 0 | |
(1)Included in restricted cash on consolidated balance sheets.
AsThe following table represents offsetting of June 30,financial assets and derivative assets as of December 31, 2020
Offsetting of Financial Liabilities and Derivative Liabilities
($ in thousands):
| | Description | Description | | Gross amounts of
recognized
liabilities | | Gross amounts
offset in the
balance sheet | | Net amounts of
liabilities
presented in the
balance sheet | | Gross amounts not offset in the
balance sheet | | | Net amount | Description | | Gross amounts of
recognized assets | | Gross amounts
offset in the
balance sheet | | Net amounts of
assets presented
in the balance
sheet | | Gross amounts not offset in the
balance sheet | | Net amount |
| | | | | | | | Financial
instruments
collateral | | Cash collateral
posted/(received)(1) | | | Description | Gross amounts of
recognized assets | Gross amounts
offset in the
balance sheet | | Net amounts of
assets presented
in the balance
sheet | | Financial
instruments | Cash collateral
received/(posted)(1) | | Net amount |
| | | Repurchase agreements | | $ | 1,295,029 | | | $ | — | | | $ | 1,295,029 | | | $ | 1,295,029 | | | $ | — | | | $ | — | | |
| Derivatives | | Derivatives | | $ | 299 | | | $ | 0 | | | $ | 299 | | | $ | 0 | | | $ | 0 | | | $ | 299 | |
| Total | Total | | $ | 1,295,029 | | | $ | — | | | $ | 1,295,029 | | | $ | 1,295,029 | | | $ | — | | | $ | — | | Total | | $ | 299 | | | $ | 0 | | | $ | 299 | | | $ | 0 | | | $ | 0 | | | $ | 299 | |
(1)Included in restricted cash on consolidated balance sheets.
AsThe following table represents offsetting of financial liabilities and derivative liabilities as of December 31, 2019
Offsetting of Financial Assets and Derivative Assets
($2020 ($ in thousands):
| | | | | | | | | | | | | | | | | | | | | | | | | | | | | | | | | | | | | | |
| Description | | Gross amounts of
recognized assets | | Gross amounts
offset in the
balance sheet | | Net amounts of
assets presented
in the balance
sheet | | Gross amounts not offset in the
balance sheet | | | | Net amount |
| | | | | | | | Financial
instruments | | Cash collateral
received/(posted)(1) | | |
| | | | | | | | | | | | |
| Derivatives | | $ | 693 | | | $ | — | | | $ | 693 | | | $ | — | | | $ | — | | | $ | 693 | |
| Total | | $ | 693 | | | $ | — | | | $ | 693 | | | $ | — | | | $ | — | | | $ | 693 | |
(1)Included in restricted cash on consolidated balance sheets.
As of December 31, 2019
Offsetting of Financial Liabilities and Derivative Liabilities
($ in thousands)
| | Description | Description | | Gross amounts of
recognized
liabilities | | Gross amounts
offset in the
balance sheet | | Net amounts of
liabilities
presented in the
balance sheet | | Gross amounts not offset in the
balance sheet | | | Net amount | Description | | Gross amounts of
recognized
liabilities | | Gross amounts
offset in the
balance sheet | | Net amounts of
liabilities
presented in the
balance sheet | | Gross amounts not offset in the
balance sheet | | Net amount |
| | | | | | | | Financial
instruments
collateral | | Cash collateral
posted/(received) | | | Description | Gross amounts of
recognized
liabilities | Gross amounts
offset in the
balance sheet | | Net amounts of
liabilities
presented in the
balance sheet | | Financial
instruments
collateral | Cash collateral
posted/(received)(1) | | Net amount |
| | | Repurchase agreements | Repurchase agreements | | $ | 1,815,934 | | | $ | — | | | $ | 1,815,934 | | | $ | 1,815,934 | | | $ | — | | | $ | — | | Repurchase agreements | | $ | 820,837 | | | $ | 0 | | | $ | 820,837 | | | $ | 820,837 | | | $ | 0 | | | $ | 0 | |
| Total | Total | | $ | 1,815,934 | | | $ | — | | | $ | 1,815,934 | | | $ | 1,815,934 | | | $ | — | | | $ | — | | Total | | $ | 820,837 | | | $ | 0 | | | $ | 820,837 | | | $ | 820,837 | | | $ | 0 | | | $ | 0 | |
(1)Included in restricted cash on consolidated balance sheets.
Master netting agreements that the Company has entered into with its derivative and repurchase agreement counterparties allow for netting of the same transaction, in the same currency, on the same date. Assets, liabilities, and collateral subject to master netting agreements as of June 30, 20202021 and December 31, 20192020 are disclosed in the tables above. The Company does not present its derivative and repurchase agreements net on the consolidated financial statements as it has elected gross presentation.
10. CONSOLIDATED VARIABLE INTEREST ENTITIES
FASB ASC Topic 810 — Consolidation (“ASC 810”), provides guidance on the identification of entities for which control is achieved through means other than voting rights (“variable interest entities” or “VIEs”) and the determination of which business enterprise, if any, should consolidate the VIEs. Generally, the consideration of whether an entity is a VIE applies when either: (1) the equity investors (if any) lack one or more of the essential characteristics of a controlling financial interest; (2) the equity investment at risk is insufficient to finance that entity’s activities without additional subordinated financial support; or (3) the equity investors have voting rights that are not proportionate to their economic interests and the activities of the entity involve or are conducted on behalf of an investor with a disproportionately small voting interest. The Company consolidates VIEs in which it is considered to be the primary beneficiary. The primary beneficiary is the entity that has both of the following characteristics: (1) the power to direct the activities that, when taken together, most significantly impact the VIE’s performance; and (2) the obligation to absorb losses and right to receive the returns from the VIE that would be significant to the VIE. The Operating Partnership is a VIE and as such, substantially all of the consolidated balance sheet is a consolidated VIE. In addition, the Operating Partnership consolidates one collateralized loan obligation (“CLO”) VIE with the following balance sheetsheets ($ in thousands):
| | | | | |
| June 30, 2020 |
| Notes 3 & 7 |
| |
| |
Restricted cash | $ | 8,649,072 | |
Mortgage loan receivables held for investment, net, at amortized cost | 469,505,178 | |
| |
Accrued interest receivable | 1,769,859 | |
| |
Total assets | $ | 479,924,109 | |
| |
Senior and unsecured debt obligations | $ | 299,604,861 | |
| |
Accrued expenses | 697,612 | |
| |
Total liabilities | 300,302,473 | |
| |
Net equity in VIEs (eliminated in consolidation) | 179,621,636 | |
| |
Total equity | 179,621,636 | |
| |
Total liabilities and equity | $ | 479,924,109 | |
| | | | | | | | | | | |
| June 30, 2021 | | December 31, 2020 |
| Notes 3 & 7 |
| | | |
| | | |
| Restricted cash | $ | 0 | | | $ | 3,925 | |
| Mortgage loan receivables held for investment, net, at amortized cost | 296,992 | | | 362,600 | |
| | | |
| Accrued interest receivable | 1,050 | | | 1,382 | |
| Other assets | 22 | | | 69,649 | |
| Total assets | $ | 298,064 | | | $ | 437,556 | |
| Debt obligations, net | $ | 168,843 | | | $ | 276,516 | |
| | | |
| Accrued expenses | 389 | | | 682 | |
| | | |
| Total liabilities | 169,232 | | | 277,198 | |
| Net equity in VIEs (eliminated in consolidation) | 128,832 | | | 160,358 | |
| | | |
| Total equity | 128,832 | | | 160,358 | |
| Total liabilities and equity | $ | 298,064 | | | $ | 437,556 | |
11. EQUITY STRUCTURE AND ACCOUNTS
Exchange for Class A Common Stock
We are a holding company and have no material assets other than our direct and indirect ownership of Series REIT limited partnership units (“Series REIT LP Units”) and Series TRS limited partnership units (“Series TRS LP Units,” and, collectively with Series REIT LP Units, “Series Units”) of LCFH. Series TRS LP Units are exchangeable for the same number of limited liability company interests of LC TRS I LLC (“LC TRS I Shares”), which is a limited liability company that is a TRS as well as a general partner of Series TRS. Pursuant to the Third Amended and Restated LLLP Agreement of LCFH, the Continuing LCFH Limited Partners may from time to time, subject to certain conditions, receive one share of the Company’s Class A common stock in exchange for (i) one share of the Company’s Class B common stock, (ii) one Series REIT LP Unit and (iii) either one Series TRS LP Unit or one TRS I LLC Share, subject to equitable adjustments for stock splits, stock dividends and reclassifications.
During the six months ended June As of September 30, 2020, 6,779,225all shares of Class B common stock, Series REIT LP Units and 6,779,225 Series TRS LP Units were collectivelyhave been exchanged for 6,779,225 shares of Class A common stock and 6,779,225 shares ofno Class B common stock were canceled. We received no other consideration in connection with these exchanges.is outstanding as of June 30, 2021. As of June 30, 2020,2021, the Company held a 95.5% interest in LCFH.
During the six months ended June 30, 2019, 1,139,411 Series REIT LP Units and 1,139,411 Series TRS LP Units were collectively exchanged for 1,139,411 shares of Class A common stock; and 1,139,411 shares of Class B common stock were canceled. We received no other consideration in connection with these exchanges. As of June 30, 2019, the Company held a 89.8%100% interest in LCFH.
Stock Repurchases
On October 30, 2014, the board of directors authorized the Company to repurchase up to $50.0 million of the Company’s Class A common stock from time to time without further approval. Stock repurchases by the Company are generally made for cash in open market transactions at prevailing market prices but may also be made in privately negotiated transactions or otherwise. The timing and amount of purchases are determined based upon prevailing market conditions, our liquidity requirements, contractual restrictions and other factors. As of June 30, 2020,2021, the Company has a remaining amount available for repurchase of $39.5$36.8 million, which represents 4.2%2.5% in the aggregate of its outstanding Class A common stock, based on the closing price of $8.10$11.54 per share on such date.
The following table is a summary of the Company’s repurchase activity of its Class A common stock during the six months ended June 30, 20202021 and 20192020 ($ in thousands):
| | | Shares | | Amount(1) | | Shares | | Amount(1) |
| | Authorizations remaining as of December 31, 2019 | | $ | 41,132 | | |
| Authorizations remaining as of December 31, 2020 | | Authorizations remaining as of December 31, 2020 | | | | $ | 38,102 | |
| Additional authorizations | Additional authorizations | | — | | Additional authorizations | | 0 | |
| Repurchases paid | Repurchases paid | | 210,151 | | | (1,682) | | Repurchases paid | | 120,000 | | | (1,312) | |
| Repurchases unsettled | Repurchases unsettled | | — | | Repurchases unsettled | | 0 | |
| Authorizations remaining as of June 30, 2020 | | $ | 39,450 | | |
| Authorizations remaining as of June 30, 2021 | | Authorizations remaining as of June 30, 2021 | | $ | 36,790 | |
(1)Amount excludes commissions paid associated with share repurchases.
| | | Shares | | Amount(1) | | Shares | | Amount(1) |
| | Authorizations remaining as of December 31, 2018 | | $ | 41,769 | | |
| Authorizations remaining as of December 31, 2019 | | Authorizations remaining as of December 31, 2019 | | | | $ | 41,132 | |
| Additional authorizations | Additional authorizations | | — | | Additional authorizations | | 0 | |
| Repurchases paid | Repurchases paid | | 40,065 | | | (637) | | Repurchases paid | | 210,151 | | | (1,682) | |
| Repurchases unsettled | Repurchases unsettled | | — | | Repurchases unsettled | | 0 | |
| Authorizations remaining as of June 30, 2019 | | $ | 41,132 | | |
| Authorizations remaining as of June 30, 2020 | | Authorizations remaining as of June 30, 2020 | | $ | 39,450 | |
(1)Amount excludes commissions paid associated with share repurchases.
Dividends
The following table presents dividends declared (on a per share basis) of Class A common stock for the six months ended June 30, 20202021 and 2019:2020:
| | | | | | | | | |
| Declaration Date | | Dividend per Share | |
| | | |
| | | |
February 27, 2020March 15, 2021 | | $ | 0.3400.20 | | |
May 28, 2020 | | 0.200 | | |
| | | |
| | | |
| | $ | 0.540 | | |
| | | |
February 27, 2019June 15, 2021 | | $ | 0.3400.20 | | |
May 30, 2019 | | 0.340 | | |
| | | |
| | | |
| Total | | $ | 0.6800.40 | | |
| | | |
| February 27, 2020 | | $ | 0.34 | | |
| May 28, 2020 | | $ | 0.20 | | |
| | | |
| | | |
| | | |
| Total | | $ | 0.54 | | |
| | | |
| | | |
| | | |
| | | |
| | | |
| | | |
| | | |
| | | |
| | | |
| | | |
| | | |
| | | |
| | | |
| | | |
| | | |
| | | |
| | | |
| | | |
| | | |
| | | |
| | | |
| | | |
| | | |
| | | |
Changes in Accumulated Other Comprehensive Income
The following table presents changes in accumulated other comprehensive income related to the cumulative difference between the fair market value and the amortized cost basis of securities classified as available for sale for the six months ended June 30, 20202021 and 20192020 ($ in thousands):
| | | | | | | | | | | | | | | | | | | | |
| | Accumulated Other Comprehensive Income (Loss) | | Accumulated Other Comprehensive Income (Loss) of Noncontrolling Interests | | Total Accumulated Other Comprehensive Income (Loss) |
| | | | | | |
| December 31, 2019 | | $ | 4,218 | | | $ | 477 | | | $ | 4,695 | |
| Other comprehensive income (loss) | | (46,530) | | | (5,354) | | | (51,884) | |
| Exchange of noncontrolling interest for common stock | | (4,915) | | | 4,915 | | | — | |
| Rebalancing of ownership percentage between Company and Operating Partnership | | 2,147 | | | (2,147) | | | — | |
| June 30, 2020 | | $ | (45,080) | | | $ | (2,109) | | | $ | (47,189) | |
| | | | | | | | | | | | | | | | | | | | |
| | Accumulated Other Comprehensive Income (Loss) | | Accumulated Other Comprehensive Income (Loss) of Noncontrolling Interests | | Total Accumulated Other Comprehensive Income (Loss) |
| | | | | | |
| December 31, 2020 | | $ | (10,463) | | | $ | (2) | | | $ | (10,465) | |
| Other comprehensive income (loss) | | 8,252 | | | 0 | | | 8,252 | |
| | | | | | |
| | | | | | |
| June 30, 2021 | | $ | (2,211) | | | $ | (2) | | | $ | (2,213) | |
| | | Accumulated Other Comprehensive Income (Loss) | | Accumulated Other Comprehensive Income (Loss) of Noncontrolling Interests | | Total Accumulated Other Comprehensive Income (Loss) | | Accumulated Other Comprehensive Income (Loss) | | Accumulated Other Comprehensive Income (Loss) of Noncontrolling Interests | | Total Accumulated Other Comprehensive Income (Loss) |
| | December 31, 2018 | | $ | (4,649) | | | $ | (588) | | | $ | (5,237) | | |
| December 31, 2019 | | December 31, 2019 | | $ | 4,218 | | | $ | 477 | | | $ | 4,695 | |
| Other comprehensive income (loss) | Other comprehensive income (loss) | | 16,738 | | | 2,044 | | | 18,782 | | Other comprehensive income (loss) | | (46,530) | | | (5,354) | | | (51,884) | |
| Exchange of noncontrolling interest for common stock | Exchange of noncontrolling interest for common stock | | 65 | | | (65) | | | — | | Exchange of noncontrolling interest for common stock | | (4,915) | | | 4,915 | | | 0 | |
| Rebalancing of ownership percentage between Company and Operating Partnership | Rebalancing of ownership percentage between Company and Operating Partnership | | 17 | | | (17) | | | — | | Rebalancing of ownership percentage between Company and Operating Partnership | | 2,147 | | | (2,147) | | | 0 | |
| June 30, 2019 | | $ | 12,171 | | | $ | 1,374 | | | $ | 13,545 | | |
| June 30, 2020 | | June 30, 2020 | | $ | (45,080) | | | $ | (2,109) | | | $ | (47,189) | |
12. NONCONTROLLING INTERESTS
There are two main types of noncontrolling interest reflected in the Company’s consolidated financial statements (i) noncontrolling interest in the operating partnership and (ii) noncontrolling interestinterests in consolidated joint ventures.
Noncontrolling Interest in the Operating Partnership
As more fully described in Note 1, certain of the predecessor equity owners continue to ownheld interests in the Operating Partnership as modified by the IPO Transactions. These interests were subsequently further modified by the REIT Structuring Transactions (also described in Note 1). These interests, along with the Class B sharescommon stock held by these investors, arewere exchangeable for Class A sharescommon stock of the Company. The roll-forward of the Operating Partnership’s LP Units followfollowed the Class B common stock of the Company as disclosed in the consolidated statements of changes in equity. As of September 30, 2020, all shares of Class B common stock have been exchanged for shares of Class A common stock, and the Company held a 100% interest in LCFH.
Pursuant to ASC 810, Consolidation, on the accounting and reporting for noncontrolling interests and changes in ownership interests of a subsidiary, changes in a parent’s ownership interest (and transactions with noncontrolling interest unitholders in the subsidiary), while the parent retains its controlling interest in its subsidiary, should be accounted for as equity transactions. The carrying amount of the noncontrolling interest shall be adjusted to reflect the change in its ownership interest in the subsidiary, with the offset to equity attributable to the parent. Accordingly, as a result of Continuing LCFH Limited Partners exchanges which causedThere were no changes in ownership percentages betweeninterest for the Company’s Class A shareholders and the noncontrolling interests in the Operating Partnership that occurred during the sixthree months ended June 30, 2020, the Company has decreased noncontrolling interests in the Operating Partnership and accumulated other comprehensive income and increased additional paid-in capital in the Company’s shareholders’ equity by $1.2 million as of June 30, 2020.2021.
Distributions to Noncontrolling Interest in the Operating Partnership
Notwithstanding the foregoing, subject to any restrictions in applicable debt financing agreements and available liquidity as determined by the board of directors of each of Series REIT of LCFH and Series TRS of LCFH, each Series must use commercially reasonable efforts to make quarterly distributions to each of its partners (including the Company) at least equal to such partner’s “Quarterly Estimated Tax Amount,” which shall be computed (as more fully described in LCFH’s Third Amended and Restated LLLP Agreement) for each partner as the product of (x) the U.S. federal taxable income (or alternative minimum taxable income, if higher) allocated by such Series to such partner in respect of the Series REIT LP Units and Series TRS LP Units held by such partner and (y) the highest marginal blended U.S. federal, state and local income tax rate (or alternative minimum taxable rate, as applicable) applicable to an individual residing in New York, NY, taking into account, for U.S. federal income tax purposes, the deductibility of state and local taxes; provided that Series TRS of LCFH may take into account, in determining the amount of tax distributions to holders of Series TRS LP Units, the amount of any distributions each such holder received from Series REIT of LCFH in excess of tax distributions. In addition, to the extent the Company requires an additional distribution from the Series of LCFH in excess of its quarterly tax distribution in order to pay its quarterly cash dividend, the Series of LCFH will be required to make a corresponding distribution of cash to each of their partners (other than the Company) on a pro-rata basis.
Allocation of Income and Loss
Income and losses and comprehensive income are allocated among the partners in a manner to reflect as closely as possible the amount each partner would be distributed under the Third Amended and Restated LLLP Agreement of LCFH upon liquidation of the Operating Partnership’s assets.
Noncontrolling InterestInterests in Consolidated Joint Ventures
As of June 30, 2020,2021, the Company consolidates 54 ventures in which there are other noncontrolling investors, which own between 10%10.0% - 29.4%25.0% of such ventures. These ventures hold investments in a 40-building student housing portfolio in Isla Vista, CA with a book value of $82.1$81.2 million, 11 office buildings in Richmond, VA with a book value of $72.4$71.4 million, a single-tenant office building in Ewing, NJOakland County, MI with a book value of $26.3 million, an industrial building in Lithia Springs, GA with an aggregate book value of $23.3$8.7 million and an apartment complex in Miami, FL with a book value of $37.3$36.8 million. The Company makes distributions and allocates income from these ventures to the noncontrolling interests in accordance with the terms of the respective governing agreements.
13. EARNINGS PER SHARE
The Company’s net income (loss) and weighted average shares outstanding for the three and six months ended June 30, 20202021 and 20192020 consist of the following:
| | | Three Months Ended June 30, | | | Six Months Ended June 30, | | | | | Three Months Ended June 30, | | Six Months Ended June 30, |
| ($ in thousands except share amounts) | ($ in thousands except share amounts) | | 2020 | | 2019 | | 2020 | | 2019 | | ($ in thousands except share amounts) | | | 2021 | | 2020 | | 2021 | | 2020 | |
| | Basic Net income (loss) available for Class A common shareholders | Basic Net income (loss) available for Class A common shareholders | | $ | (4,189) | | | $ | 32,244 | | | $ | (19,918) | | | $ | 54,419 | | | Basic Net income (loss) available for Class A common shareholders | | | $ | 10,294 | | | $ | (4,189) | | | $ | 10,489 | | | $ | (19,918) | | |
| Diluted Net income (loss) available for Class A common shareholders | Diluted Net income (loss) available for Class A common shareholders | | $ | (4,189) | | | $ | 32,244 | | | $ | (19,918) | | | $ | 54,419 | | | Diluted Net income (loss) available for Class A common shareholders | | | $ | 10,294 | | | $ | (4,189) | | | $ | 10,489 | | | $ | (19,918) | | |
| Weighted average shares outstanding | Weighted average shares outstanding | | | | | | | | | | Weighted average shares outstanding | | | | | | |
| Basic | Basic | | 106,809,987 | | | 105,511,385 | | | 106,569,892 | | | 104,888,925 | | | Basic | | | 124,048,999 | | | 106,809,987 | | | 124,012,683 | | | 106,569,892 | | |
| Diluted | Diluted | | 106,809,987 | | | 105,892,420 | | | 106,569,892 | | | 105,742,589 | | | Diluted | | | 124,480,487 | | | 106,809,987 | | | 124,353,202 | | | 106,569,892 | | |
The calculation of basic and diluted net income (loss) per share amounts for the three and six months ended June 30, 20202021 and 20192020 consist of the following:
| | | Three Months Ended June 30, | | | Six Months Ended June 30, | | | | | Three Months Ended June 30, | | Six Months Ended June 30, |
| (In thousands except share amounts) | | 2020 | | 2019 | | 2020(1) | | 2019(1) | | |
| (In thousands except share and per share amounts) | | (In thousands except share and per share amounts) | | | 2021 | | 2020 | | 2021(1) | | 2020(1) | |
| | Basic Net Income (Loss) Per Share of Class A Common Stock | Basic Net Income (Loss) Per Share of Class A Common Stock | | | | | | | | | | Basic Net Income (Loss) Per Share of Class A Common Stock | | | | | | |
| Numerator: | | | | | | | | | | |
Numerator: | | Numerator: | | | | | | |
| Net income (loss) attributable to Class A common shareholders | Net income (loss) attributable to Class A common shareholders | | $ | (4,189) | | | $ | 32,244 | | | $ | (19,918) | | | $ | 54,419 | | | Net income (loss) attributable to Class A common shareholders | | | $ | 10,294 | | | $ | (4,189) | | | $ | 10,489 | | | $ | (19,918) | | |
| Denominator: | | | | | | | | | | |
Denominator: | | Denominator: | | | | | | | | | | |
| Weighted average number of shares of Class A common stock outstanding | Weighted average number of shares of Class A common stock outstanding | | 106,809,987 | | | 105,511,385 | | | 106,569,892 | | | 104,888,925 | | | Weighted average number of shares of Class A common stock outstanding | | | 124,048,999 | | | 106,809,987 | | | 124,012,683 | | | 106,569,892 | | |
| Basic net income (loss) per share of Class A common stock | Basic net income (loss) per share of Class A common stock | | $ | (0.04) | | | $ | 0.31 | | | $ | (0.19) | | | $ | 0.52 | | | Basic net income (loss) per share of Class A common stock | | | $ | 0.08 | | | $ | (0.04) | | | $ | 0.08 | | | $ | (0.19) | | |
| | Diluted Net Income (Loss) Per Share of Class A Common Stock | Diluted Net Income (Loss) Per Share of Class A Common Stock | | | | | | Diluted Net Income (Loss) Per Share of Class A Common Stock | | | | | | |
| Numerator: | Numerator: | | | | | | Numerator: | | | | | | |
| Net income (loss) attributable to Class A common shareholders | Net income (loss) attributable to Class A common shareholders | | $ | (4,189) | | | $ | 32,244 | | | $ | (19,918) | | | $ | 54,419 | | | Net income (loss) attributable to Class A common shareholders | | | $ | 10,294 | | | $ | (4,189) | | | $ | 10,489 | | | $ | (19,918) | | |
| Add (deduct) - dilutive effect of: | | | | | | | | | | |
| Amounts attributable to operating partnership’s share of Ladder Capital Corp net income (loss)(2) | | — | | | — | | | — | | | — | | | |
| Additional corporate tax (expense) benefit(2) | | — | | | — | | | — | | | — | | | |
| | Diluted net income (loss) attributable to Class A common shareholders | Diluted net income (loss) attributable to Class A common shareholders | | (4,189) | | | 32,244 | | | (19,918) | | | 54,419 | | | Diluted net income (loss) attributable to Class A common shareholders | | | 10,294 | | | (4,189) | | | 10,489 | | | (19,918) | | |
| Denominator: | Denominator: | | | | | | | | | | Denominator: | | | | | | | | | | |
| Basic weighted average number of shares of Class A common stock outstanding | Basic weighted average number of shares of Class A common stock outstanding | | 106,809,987 | | | 105,511,385 | | | 106,569,892 | | | 104,888,925 | | | Basic weighted average number of shares of Class A common stock outstanding | | | 124,048,999 | | | 106,809,987 | | | 124,012,683 | | | 106,569,892 | | |
| Add - dilutive effect of: | Add - dilutive effect of: | | | | | | | | | | Add - dilutive effect of: | | | | | | |
| Shares issuable relating to converted Class B common shareholders(3) | | — | | | — | | | — | | | — | | | |
| Incremental shares of unvested Class A restricted stock(3)(2) | Incremental shares of unvested Class A restricted stock(3)(2) | | — | | | 381,035 | | | — | | | 853,664 | | | Incremental shares of unvested Class A restricted stock(3)(2) | | | 431,488 | | | 0 | | | 340,519 | | | 0 | | |
| Incremental shares of unvested stock options | Incremental shares of unvested stock options | | — | | | — | | | — | | | — | | | Incremental shares of unvested stock options | | | 0 | | | 0 | | | 0 | | | 0 | | |
| Diluted weighted average number of shares of Class A common stock outstanding | Diluted weighted average number of shares of Class A common stock outstanding | | 106,809,987 | | | 105,892,420 | | | 106,569,892 | | | 105,742,589 | | | Diluted weighted average number of shares of Class A common stock outstanding | | | 124,480,487 | | | 106,809,987 | | | 124,353,202 | | | 106,569,892 | | |
| Diluted net income (loss) per share of Class A common stock | Diluted net income (loss) per share of Class A common stock | | $ | (0.04) | | | $ | 0.30 | | | $ | (0.19) | | | $ | 0.51 | | | Diluted net income (loss) per share of Class A common stock | | | $ | 0.08 | | | $ | (0.04) | | | $ | 0.08 | | | $ | (0.19) | | |
(1)For the three and six months ended June 30, 2020, and 2019, shares issuable relating to converted Class B common shareholders are excluded from the calculation of diluted EPS as the inclusion of such potential common shares in the calculation would be anti-dilutive.
(2)The Company is using the as-if converted method for the Class B common shareholders while adjusting for additional corporate income tax expense (benefit) for the described net income (loss) add-back.
(3)The Company is using the treasury stock method.
The shares of Class B common stock do not share in the earnings of Ladder Capital Corp and are, therefore, not participating securities. Accordingly, basic and diluted net income (loss) per share of Class B common stock has not been presented, although the assumed conversion of Class B common stock has been included in the presented diluted net income (loss) per share of Class A common stock.stock for the period of time that Class B common stock was outstanding.
14. STOCK BASED AND OTHER COMPENSATION PLANS
The following table summarizes the impact on the consolidated statement of operations of the various stock based and other compensation plans described in Note 14, Stock Based and Other Compensation Plans included within the Company’s Annual Report ($ in thousands):
| | | Three Months Ended June 30, | | | Six Months Ended June 30, | | | | Three Months Ended June 30, | | Six Months Ended June 30, |
| | 2020 | | 2019 | | 2020 | | 2019 | | | | 2021 | | 2020 | | 2021 | | 2020 | |
| | | Stock Based Compensation Expense | Stock Based Compensation Expense | $ | 2,712 | | | $ | 3,469 | | | $ | 16,738 | | | $ | 14,761 | | | Stock Based Compensation Expense | | $ | 3,524 | | | $ | 2,712 | | | $ | 8,801 | | | $ | 16,738 | | |
| | Phantom Equity Investment Plan | Phantom Equity Investment Plan | 561 | | | (98) | | | (1,577) | | | 704 | | | Phantom Equity Investment Plan | | 0 | | | 561 | | | 22 | | | (1,577) | | |
| Stock Options Exercised | Stock Options Exercised | — | | | — | | | 270 | | | — | | | Stock Options Exercised | | 0 | | | 0 | | | 0 | | | 270 | | |
| | Bonus Expense | Bonus Expense | — | | | 7,717 | | | (30) | | | 14,501 | | | Bonus Expense | | 1,850 | | | 0 | | | 2,300 | | | (30) | | |
| Total | Total | $ | 3,273 | | | $ | 11,088 | | | $ | 15,401 | | | $ | 29,966 | | | Total | | $ | 5,374 | | | $ | 3,273 | | | $ | 11,123 | | | $ | 15,401 | | |
Summary of Stock and Shares/OptionsShares Nonvested/Outstanding
A summary of the grants is presented below:
| | | | | | | | | | | | | | | | | | | | | | | | | | | | | | | | | | | | | | | | | | | | | | | | | | | |
| | Three Months Ended June 30, | | | | | | | | Six Months Ended June 30, | | | | | | | | | | |
| | 2020 | | | | 2019 | | | | 2020 | | | | 2019 | | | | | | |
| Number
of Shares/Options | | Weighted
Average
Fair Value
Per Share | | Number
of Shares | | Weighted
Average
Fair Value
Per Share | | Number
of Shares/Options | | Weighted
Average
Fair Value
Per Share | | Number
of Shares/Options | | Weighted
Average
Fair Value
Per Share | | | | |
| | | | | | | | | | | | | | | | | | | |
| Grants - Class A Common Stock | — | | | $ | — | | | 4,568 | | | $ | 16.42 | | | 1,466,337 | | | $ | 18.72 | | | 1,545,569 | | | $ | 17.56 | | | | | |
| Grants - Class A Common Stock dividends | — | | | — | | | — | | | — | | | — | | | — | | | 11,113 | | | 16.61 | | | | | |
| Stock Options | — | | | — | | | — | | | — | | | — | | | — | | | 12,073 | | | — | | | | | |
| | | | | | | | | | | | | | | | | | | | | | | | | | | | | | | | | | | | | | | | | | | | | | | | | | | | | | | | | | | |
| | | | Three Months Ended June 30, | | Six Months Ended June 30, |
| | | | | | 2021 | | 2020 | | 2021 | | 2020 | | |
| | | | | | | | | Number
of Shares | | Weighted
Average
Fair Value
Per Share | | Number
of Shares | | Weighted
Average
Fair Value
Per Share | | Number
of Shares | | Weighted
Average
Fair Value
Per Share | | Number
of Shares | | Weighted
Average
Fair Value
Per Share | | | | |
| | | | | | | | | | | | | | | | | | | | | | | | | | | |
| Grants - Class A Common Stock | | | | | | | | | 0 | | | 0 | | | 0 | | | 0 | | | 747,713 | | | $ | 9.81 | | | 1,466,337 | | | $ | 18.72 | | | | | |
| | | | | | | | | | | | | | | | | | | | | | | | | | | |
| | | | | | | | | | | | | | | | | | | | | | | | | | | |
The table below presents the number of unvested shares and outstanding stock options at June 30, 20202021 and changes during 20202021 of the Class A Commoncommon stock and Stock Optionsstock options of Ladder Capital Corp granted under the 2014 Omnibus Incentive Plan:
| | | Restricted Stock | | Stock Options | | | Restricted Stock | | Stock Options | |
| | Nonvested/Outstanding at December 31, 2019 | 1,436,683 | | | 994,208 | | | |
| Nonvested/Outstanding at December 31, 2020 | | Nonvested/Outstanding at December 31, 2020 | 2,800,824 | | | 681,102 | | |
| Granted | Granted | 1,466,337 | | | — | | | Granted | 747,713 | | | 0 | | |
| Exercised | Exercised | | (83,845) | | | Exercised | — | | | 0 | | |
| Vested | Vested | (1,209,771) | | | | Vested | (982,998) | | | — | | |
| Forfeited | Forfeited | (24,089) | | | — | | | Forfeited | (327,143) | | | 0 | | |
| Expired | Expired | | — | | | Expired | — | | | 0 | | |
| Nonvested/Outstanding at June 30, 2020 | 1,669,160 | | | 910,363 | | | |
| Nonvested/Outstanding at June 30, 2021 | | Nonvested/Outstanding at June 30, 2021 | 2,238,396 | | | 681,102 | | |
| | Exercisable at June 30, 2020 | | 910,363 | | | |
| Exercisable at June 30, 2021 | | Exercisable at June 30, 2021 | | 681,102 | | |
At June 30, 20202021 there was $21.0$18.6 million of total unrecognized compensation cost related to certain share-based compensation awards that is expected to be recognized over a period of up to 26.824.6 months, with a weighted-average remaining vesting period of 3231 months.
2014 Omnibus Incentive Plan
In connection with the IPO Transactions, the 2014 Ladder Capital Corp Omnibus Incentive Equity Plan (the “2014 Omnibus Incentive Plan”) was adopted by the board of directors on February 11, 2014, and provides certain members of management, employees and directors of the Company or its affiliates with additional incentives including grants of stock options, stock appreciation rights, restricted stock, other stock-based awards and other cash-based awards.
Annual Incentive Awards Granted in 20202021 with Respectrespect to 20192020 Performance
For 2019 performance, certainOn January 1, 2021, in connection with 2020 compensation, annual stock awards were granted to non-management employees received stock-based incentive equity. (“Non-Management Grantees”) with an aggregate fair value of $7.0 million, which represents 711,653 shares of Class A common stock. Approximately one-third of the awards to Non-Management Grantees were unrestricted, with another one-third of the awards subject to time-based vesting criteria, and the remaining one-third subject to attainment of the Performance Target for the applicable years. The one-third of awards subject to attainment of the Performance Target is also subject to the Performance Waiver and Catch-Up Provision, each described below. The time-vesting restricted stock will vest in three installments on February 18 of each of 2022, 2023 and 2024, subject to continued employment on the applicable vesting dates.
Fair value for all restricted and unrestricted stock grants was calculated using the most recent closing stock price prior to the grant date (due to markets being closed on the grant date.date). Compensation expense for unrestricted stock grants will bewas expensed immediately. The Company has elected to recognize the compensation expense related to the time-based vesting of the annual restricted stock awards for the entire award on a straight-line basis over the requisite service period for the entire award. Restricted stock subject to performance criteria is eligible to vest in 3three equal installments upon the compensation committee’s confirmation that the Company achieves a return on equity, based on coredistributable earnings divided by the Company’s average book value of equity, equal to or greater than 8% for such year (the “Performance Target”) for the years ended December 31, 2020, 2021, 2022 and 2022,2023, respectively. If the Company misses the Performance Target during either the first or second calendar year but meets the Performance Target for a subsequent year during the three year performance period and the Company’s return on equity for such subsequent year and any years for which it missed its Performance Target equals or exceeds the compounded return on equity of 8%, based on coredistributable earnings divided by the Company’s average book value of equity, the performance-vesting restricted stock which failed to vest because the Company previously missed its Performance Target will vest subject to continued employment on the applicable vesting date (the “Catch-Up Provision”). Accruals of compensation cost for an award with a performance condition shall be based on the probable outcome of that performance condition. Therefore, compensation cost shall be accrued if it is probable that the performance condition will be achieved and shall not be accrued if it is not probable that the performance condition will be achieved. In view of the adverse impacts of COVID-19 on the Company’s operations and investments and the resulting intensified corporate focus on defensive actions, including maintaining high levels of unrestricted cash liquidity and refinancing debt with more expensive non-mark-to-market funding sources, the Company is no longer classifying the 2020 Performance Target as probable as of June 30, 2020 and has reversed $1.0 million of previous compensation expense relating to grants of restricted stock with a December 2020 performance hurdle as their last vesting date (not available to take advantage of the Catch-Up Provision). However, recognizing that Ladder’s employees took these actions that, while in the best interests of the Company and its shareholders, would not produce earnings consistent with the Performance Target in their deferred compensation arrangements, onOn May 27, 2020, the compensation committee of the board of directors used its discretion to waive the Performance Target for shares eligible to vest based on the Company’s performance in 2020 and 2021, subject to continued employment on the applicable vesting dates.dates (the “Performance Waiver”). The Performance Waiver was made in recognition of the actions taken by Ladder’s employees in response to COVID-19 that, while in the best interests of the Company recorded $0.1 millionand its shareholders, would not produce earnings consistent with the Performance Target in their deferred compensation arrangements. Such actions included maintaining high levels of incremental compensation cost during the threeunrestricted cash liquidity and six months endedrefinancing debt with more expensive non-mark-to-market funding sources. As of June 30, 2020 as a result of this modification. There are currently 482021, there were 42 Ladder employees and one1 consultant eligible for such waiver.the 2021 Performance Waiver.
On February 18, 2020, in connection with 2019 compensation, annual stock and restricted stock awards were granted to management grantees, other than Ms. Porcella, with an aggregate fair value of $12.5 million which represents 667,201 shares of restricted Class A common stock. The grant to Ms. Porcella is subject to the same time-based and performance-based vesting described below for non-management grantees and her shares are included in that total. The grant to Mr. Harris, and 50% of the grants to Mr. Fox, Ms. McCormack and Mr. Perelman, were unrestricted. The other 50% of incentive equity granted to Mr. Fox, Ms. McCormack and Mr. Perelman is restricted stock subject to performance criteria as described above.
On February 18, 2020, in connection with 2019 compensation, stock awards were granted to Ms. Porcella and non-management employees (“Non-Management Grantees”) with an aggregate value of $14.5 million which represents 775,100 shares of mostly restricted Class A common stock. Fifty percent of most stock awards is subject to time-based vesting criteria, and the remaining 50% of these stock awards is subject to attainment of the Performance Target for the applicable years. The time-vesting restricted stock will vest in 3 installments on February 18 of each ofOther 2021 2022 and 2023 subject to continued employment on the applicable vesting dates. The performance-vesting restricted stock will vest in 3 equal installments upon the compensation committee’s confirmation that the Company achieves the Performance Target for the years ended December 31, 2020, 2021 and 2022, respectively. The Catch-Up Provision applies to the performance vesting portion of this award. The compensation expense related to the performance-based restricted stock granted on February 18, 2020 shall be recognized 1/3 for the period February 18, 2020 through February 18, 2021, 1/3 for the period February 19, 2021 through February 18, 2022 and 1/3 for the period February 19, 2022 through February 18, 2023.
In the event Ms. Porcella or a Non-Management Grantee is terminated by the Company without cause within six months of certain changes in control, all unvested time shares shall vest on the termination date and all unvested performance shares shall remain outstanding and be eligible to vest (and be forfeited) in accordance with the performance conditions.
Upon a change in control (as defined in the respective award agreements), restricted stock awards to Mr. Fox, Ms. McCormack and Mr. Perelman will become fully vested if (1) such management grantee continues to be employed through the closing of the change in control or (2) after the signing of definitive documentation related to the change in control, but prior to its closing, such management grantee’s employment is terminated without cause or due to death or disability or the management grantee resigns for Good Reason, as described in the Company’s definitive proxy statement filed with the SEC on April 28, 2020. The compensation committee retains the right, in its sole discretion, to provide for the accelerated vesting (in whole or in part) of the restricted stock and option awards granted.
2020 Restricted Stock Awards
On February 18, 2020,2021, certain members of the board of directors each received Annual Restricted Stock Awardsannual restricted stock awards with a grant date fair value of $0.4 million, representing 24,03636,060 shares of restricted Class A common stock, which will vest in full on the first anniversary of the date of grant, subject to continued service on the board of directors. Compensation expense related to the time-based vesting criteria of the award shall be recognized on a straight-line basis over the one yearone-year vesting period. On March 26, 2020, 5,803 shares of restricted Class A common stock were forfeited when a member resigned from the board of directors.
Change in Control
In the event a Non-Management Grantee is terminated by the Company without cause within six months of certain changes in control (as defined in the respective award agreements), all unvested time shares shall vest on the termination date and all unvested performance shares shall remain outstanding and be eligible to vest (or be forfeited) in accordance with the performance conditions. The compensation committee retains the right, in its sole discretion, to provide for the accelerated vesting (in whole or in part) of the restricted stock awards granted.
Ladder Capital Corp Deferred Compensation Plan
As of December 31, 2020, there were 165,735 phantom units outstanding in the 2014 Deferred Compensation Plan, of which 0 were unvested, resulting in a liability of $1.6 million, which is included in accrued expenses on the consolidated balance sheets. As of June 30, 2021, the deferred compensation plan ended as the liability had been fully paid.
Bonus Payments
On February 6,December 16, 2020, the board of directors of Ladder Capital Corp approved the 20192020 bonus payments to employees, including officers, totaling $55.2$36.8 million of which included $27.0$35.7 million consisted of equity based compensation. Of the total approved amount, there was $29.4 million of equity based compensation. The bonuses were accrued for as of December 31, 2019 and paid to employeescompensation granted in full on February 14, 2020. On February 7, 2019,During the board of directors of Ladder Capital Corp approvedsix months ended June 30, 2021, the 2018 bonus payments to employees, including officers, totaling $61.4 million, which included $26.6Company recorded $2.3 million of equity based compensation. The bonuses were accrued for as of December 31, 2018 and paidcompensation expense related to employees in full on February 15, 2019. Duringbonuses. For the three and six months ended June 30, 2020, the Company recorded 0did 0t record any bonus expense. For the six months ended June 30, 2021, the Company paid $2.3 million compensation expense related to bonuses due toaccrued during the significant market disruption caused by the COVID-19 pandemic and the substantial economic uncertainty present in the commercial real estate market and overall economy. During the three and six monthsyear ended June 30, 2019, the Company recorded compensation expense of $7.7 million and $14.5 million, respectively, related to bonuses.December 31, 2020.
15. FAIR VALUE OF FINANCIAL INSTRUMENTS
Fair value is based upon internal models, using market quotations, broker quotations, counterparty quotations or pricing services quotations, which provide valuation estimates based upon reasonable market order indications and are subject to significant variability based on market conditions, such as interest rates, credit spreads and market liquidity. The fair value of the mortgage loan receivables held for sale is based upon a securitization model utilizing market data from recent securitization spreads and pricing.
Fair Value Summary Table
The carrying values and estimated fair values of the Company’s financial instruments, which are both reported at fair value on a recurring basis (as indicated) or amortized cost/par, at June 30, 20202021 and December 31, 20192020 are as follows ($ in thousands):
June 30, 20202021
| | | | | | | | | | | | Weighted Average | | | | | | | | | | | Weighted Average |
| | | Outstanding
Face Amount | | Amortized Cost Basis/Purchase Price | | Fair Value | | Fair Value Method | | Yield
% | | Remaining
Maturity/Duration (years) | | Outstanding
Face Amount | | Amortized Cost Basis/Purchase Price | | Fair Value | | Fair Value Method | | Yield
% | | Remaining
Maturity/Duration (years) |
| Assets: | Assets: | | | | | | | | | | | | Assets: | | | | | | | | | | | |
| CMBS(1) | CMBS(1) | $ | 1,496,090 | | | $ | 1,495,892 | | | $ | 1,447,338 | | | Internal model, third-party inputs | | 1.57 | % | | 2.27 | CMBS(1) | $ | 677,025 | | | $ | 677,901 | | | $ | 674,558 | | | Internal model, third-party inputs | | 1.65 % | | 2.07 |
| CMBS interest-only(1) | CMBS interest-only(1) | 1,535,739 | | (2) | 25,026 | | | 25,510 | | | Internal model, third-party inputs | | 2.83 | % | | 2.34 | CMBS interest-only(1) | 1,399,645 | | (2) | 18,072 | | | 18,820 | | | Internal model, third-party inputs | | 2.00 % | | 2.01 |
| GNMA interest-only(3) | GNMA interest-only(3) | 93,464 | | (2) | 1,335 | | | 1,379 | | | Internal model, third-party inputs | | 4.21 | % | | 3.18 | GNMA interest-only(3) | 63,305 | | (2) | 635 | | | 699 | | | Internal model, third-party inputs | | 4.79 % | | 3.39 |
| Agency securities(1) | Agency securities(1) | 610 | | | 619 | | | 636 | | | Internal model, third-party inputs | | 1.68 | % | | 1.56 | Agency securities(1) | 568 | | | 572 | | | 580 | | | Internal model, third-party inputs | | 1.60 % | | 0.97 |
| GNMA permanent securities(1) | GNMA permanent securities(1) | 30,853 | | | 31,006 | | | 31,870 | | | Internal model, third-party inputs | | 3.50 | % | | 2.41 | GNMA permanent securities(1) | 24,040 | | | 24,171 | | | 24,547 | | | Internal model, third-party inputs | | 3.54 % | | 1.18 |
| | Provision for current expected credit reserves | Provision for current expected credit reserves | N/A | | (19) | | | (19) | | | (5) | | N/A | | N/A | Provision for current expected credit reserves | N/A | | (20) | | | (20) | | | (5) | | N/A | | N/A |
| Mortgage loan receivables held for investment, net, at amortized cost: | Mortgage loan receivables held for investment, net, at amortized cost: | | Mortgage loan receivables held for investment, net, at amortized cost: | |
| Mortgage loan receivables held for investment, net, at amortized cost | Mortgage loan receivables held for investment, net, at amortized cost | 2,971,622 | | | 2,955,084 | | | 2,928,796 | | | Discounted Cash Flow(4) | | 6.82 | % | | 1.22 | Mortgage loan receivables held for investment, net, at amortized cost | 2,548,013 | | | 2,531,048 | | | 2,424,602 | | | Discounted Cash Flow(4) | | 5.80 % | | 1.81 |
| | Provision for current expected credit reserves | N/A | | (49,102) | | | (49,102) | | | (5) | | N/A | | N/A | |
| Allowance for current expected credit reserves | | Allowance for current expected credit reserves | N/A | | (35,891) | | | (35,891) | | | (5) | | N/A | | N/A |
| Mortgage loan receivables held for sale | Mortgage loan receivables held for sale | 86,456 | | | 85,977 | | | 87,960 | | | Internal model, third-party inputs(6) | | 3.94 | % | | 9.70 | Mortgage loan receivables held for sale | 59,198 | | | 59,182 | | | 62,295 | | | Internal model, third-party inputs(6) | | 4.25 % | | 9.81 |
| FHLB stock(7) | FHLB stock(7) | 61,619 | | | 61,619 | | | 61,619 | | | (7) | | 4.00 | % | | N/A | FHLB stock(7) | 12,960 | | | 12,960 | | | 12,960 | | | (7) | | 3.00 % | | N/A |
| Nonhedge derivatives(1)(8) | 89,900 | | | N/A | | 380 | | | Counterparty quotations | | N/A | | 0.25 | |
| | | Liabilities: | Liabilities: | | | | | | | | | | | | Liabilities: | | | | | | | | | | | |
| Repurchase agreements - short-term | Repurchase agreements - short-term | 1,217,013 | | | 1,217,013 | | | 1,217,013 | | | Discounted Cash Flow(9) | | 2.64 | % | | 0.22 | Repurchase agreements - short-term | 390,217 | | | 390,217 | | | 390,217 | | | Discounted Cash Flow(9) | | 0.98 % | | 0.23 |
| Repurchase agreements - long-term | Repurchase agreements - long-term | 78,016 | | | 78,016 | | | 78,016 | | | Discounted Cash Flow(10) | | 1.56 | % | | 1.27 | Repurchase agreements - long-term | 135,483 | | | 135,483 | | | 135,483 | | | Discounted Cash Flow(10) | | 1.89 % | | 1.48 |
| Revolving credit facility | 266,430 | | | 266,430 | | | 266,430 | | | Discounted Cash Flow(9) | | 3.00 | % | | 0.05 | |
| | Mortgage loan financing | Mortgage loan financing | 800,952 | | | 805,431 | | | 828,693 | | | Discounted Cash Flow(10) | | 4.97 | % | | 4.88 | Mortgage loan financing | 742,410 | | | 745,971 | | | 764,159 | | | Discounted Cash Flow(10) | | 4.84 | % | | 3.7 |
| Secured financing facility | Secured financing facility | 188,687 | | | 188,687 | | | 188,687 | | | Discounted Cash Flow(9) | | 10.75 | % | | 2.85 | Secured financing facility | 152,143 | | | 152,143 | | | 152,143 | | | Discounted Cash Flow(9) | | 10.75 % | | 1.85 |
| CLO debt | CLO debt | 299,605 | | | 299,605 | | | 299,605 | | | Discounted Cash Flow(9) | | 5.50 | % | | 3.88 | CLO debt | 168,843 | | | 168,843 | | | 168,843 | | | Discounted Cash Flow(10) | | 5.50 % | | 2.88 |
| | Borrowings from the FHLB | Borrowings from the FHLB | 360,790 | | | 360,790 | | | 362,559 | | | Discounted Cash Flow | | 1.39 | % | | 2.67 | Borrowings from the FHLB | 288,000 | | | 288,000 | | | 288,712 | | | Discounted Cash Flow | | 1.07 | % | | 2.26 |
| Senior unsecured notes | Senior unsecured notes | 1,752,817 | | | 1,737,542 | | | 1,025,236 | | | Internal model, third-party inputs | | 4.97 | % | | 4.16 | Senior unsecured notes | 2,115,644 | | | 2,095,059 | | | 2,123,832 | | | Internal model, third-party inputs | | 4.81 % | | 4.22 |
| | Nonhedge derivatives(1)(8) | Nonhedge derivatives(1)(8) | 69,571 | | | N/A | | — | | | Counterparty quotations | | N/A | | 0.86 | Nonhedge derivatives(1)(8) | 202,571 | | | N/A | | 368 | | | Counterparty quotations | | N/A | | 0.25 |
(1)Measured at fair value on a recurring basis with the net unrealized gains or losses recorded as a component of other comprehensive income (loss) in equity.
(2)Represents notional outstanding balance of underlying collateral.
(3)Measured at fair value on a recurring basis with the net unrealized gains or losses recorded in current period earnings.
(4)Fair value for floating rate mortgage loan receivables, held for investment is estimated to approximate the outstanding face amount given the short interest rate reset risk (30 days) and no significant change in credit risk. Fair value for fixed rate mortgage loan receivables, held for investment is measured using a discounted cash flow model.
(5)Fair value is estimated to equal par value.
(6)Fair value for mortgage loan receivables, held for sale is measured using a hypothetical securitization model utilizing market data from recent securitization spreads and pricing.
(7)Fair value of the FHLB stock approximates outstanding face amount as the Company’s captive insurance subsidiary is restricted from trading the stock and can only put the stock back to the FHLB, at the FHLB’s discretion, at par.
(8)The outstanding face amount of the nonhedge derivatives represents the notional amount of the underlying contracts.
(9)Fair value for repurchase agreement liabilities - short term borrowings under the Secured Financing Facility and borrowings under the Revolving Credit Facility is estimated to approximate carrying amount primarily due to the short interest rate reset risk (30 days) of the financings and the high credit quality of the assets collateralizing these positions. If the collateral is determined to be impaired, the related financing would be revalued accordingly. There are no impairments on any positions.
(10)For repurchase agreements - long term, mortgage loan financing, and CLO debt, the carrying value approximates the fair value discounting the expected cash flows at current market rates. If the collateral is determined to be impaired, the related financing would be revalued accordingly. There are no impairments on any positions.
December 31, 2020
| | | | | | | | | | | | | | | | | | | | | | | | | | | | | | | | | | | |
| | | | | | | | | | Weighted Average |
| | Outstanding
Face Amount | | Amortized
Cost Basis | | Fair Value | | Fair Value Method | | Yield
% | | Remaining
Maturity/Duration (years) |
| Assets: | | | | | | | | | | | |
| CMBS(1) | $ | 1,015,520 | | | $ | 1,015,282 | | | $ | 1,003,301 | | | Internal model, third-party inputs | | 1.56 % | | 2.01 |
| CMBS interest-only(1) | 1,498,181 | | (2) | 21,567 | | | 22,213 | | | Internal model, third-party inputs | | 3.53 % | | 2.19 |
| GNMA interest-only(3) | 75,350 | | (2) | 868 | | | 1,001 | | | Internal model, third-party inputs | | 5.06 % | | 3.59 |
| Agency securities(1) | 586 | | | 593 | | | 605 | | | Internal model, third-party inputs | | 1.64 % | | 1.26 |
| GNMA permanent securities(1) | 30,254 | | | 30,340 | | | 31,199 | | | Internal model, third-party inputs | | 3.49 % | | 1.98 |
| Provision for current expected credit losses | N/A | | (20) | | | (20) | | | (5) | | N/A | | N/A |
| | | | | | | | | | | |
| | | | | | | | | | | |
| Mortgage loan receivables held for investment, net, at amortized cost: | | | | | | | | | | | |
| Mortgage loan receivables held for investment, net, at amortized cost | 2,365,204 | | | 2,354,059 | | | 2,328,441 | | | Discounted Cash Flow(4) | | 6.67 % | | 1.07 |
| | | | | | | | | | | |
| Allowance for current expected credit losses | N/A | | (41,507) | | | (41,507) | | | (5) | | N/A | | N/A |
| Mortgage loan receivables held for sale | 30,478 | | | 30,518 | | | 32,082 | | | Internal model, third-party inputs(6) | | 4.05 % | | 9.18 |
| FHLB stock(7) | 31,000 | | | 31,000 | | | 31,000 | | | (7) | | 3.00 % | | N/A |
| Nonhedge derivatives(1)(8) | 65,600 | | | N/A | | 299 | | | Counterparty quotations | | N/A | | 0.25 |
| | | | | | | | | | | |
| Liabilities: | | | | | | | | | | | |
| Repurchase agreements - short-term | 708,833 | | | 708,833 | | | 708,833 | | | Discounted Cash Flow(9) | | 1.16 % | | 0.34 |
| Repurchase agreements - long-term | 112,004 | | | 112,004 | | | 112,004 | | | Discounted Cash Flow(10) | | 9.47 % | | 2.21 |
| Revolving credit facility | 266,430 | | | 266,430 | | | 266,430 | | | Discounted Cash Flow(9) | | 3.15 % | | 0.07 |
| Mortgage loan financing | 761,793 | | | 766,064 | | | 786,405 | | | Discounted Cash Flow(10) | | 4.84 | % | | 4.04 |
| Secured financing facility | 192,646 | | | 192,646 | | | 192,646 | | | Discounted Cash Flow(9) | | 10.75 % | | 2.35 |
| CLO debt | 276,516 | | | 276,516 | | | 276,516 | | | Discounted Cash Flow(10) | | 5.50 % | | 3.38 |
| | | | | | | | | | | |
| Borrowings from the FHLB | 288,000 | | | 288,000 | | | 289,091 | | | Discounted Cash Flow | | 1.12 | % | | 2.76 |
| Senior unsecured notes | 1,612,299 | | | 1,599,371 | | | 1,607,930 | | | Internal model, third-party inputs | | 4.90 % | | 3.89 |
| | | | | | | | | | | |
| | | | | | | | | | | |
(1)Measured at fair value on a recurring basis with the net unrealized gains or losses recorded as a component of other comprehensive income (loss) in equity.
(2)Represents notional outstanding balance of underlying collateral.
(3)Measured at fair value on a recurring basis with the net unrealized gains or losses recorded in current period earnings.
(4)Fair value for floating rate mortgage loan receivables, held for investment is estimated to approximate the outstanding face amount given the short interest rate reset risk (30 days) and no significant change in credit risk. Fair value for fixed rate mortgage loan receivables, held for investment is measured using a discounted cash flow model.
(5)Fair value is estimated to equal par value.
(6)Fair value for mortgage loan receivables, held for sale is measured using a hypothetical securitization model utilizing market data from recent securitization spreads and pricing.
(7)Fair value of the FHLB stock approximates outstanding face amount as the Company’s captive insurance subsidiary is restricted from trading the stock and can only put the stock back to the FHLB, at the FHLB’s discretion, at par.
(8)The outstanding face amount of the nonhedge derivatives represents the notional amount of the underlying contracts.
(9)Fair value for repurchase agreement liabilities - short term borrowings under the secured financing facility and borrowings under the revolving credit facility is estimated to approximate carrying amount primarily due to the short interest rate reset risk (30 days) of the financings and the high credit quality of the assets collateralizing these positions. If the collateral is determined to be impaired, the related financing would be revalued accordingly. There are no impairments on any positions.
(10)For repurchase agreements - long term, mortgage loan financing, and CLO debt the carrying value approximates the fair value discounting the expected cash flows at current market rates. If the collateral is determined to be impaired, the related financing would be revalued accordingly. There are no impairments on any positions.
December 31, 2019
| | | | | | | | | | | | | | | | | | | | | | | | | | | | | | | | | | | |
| | | | | | | | | | Weighted Average | | |
| | Outstanding
Face Amount | | Amortized
Cost Basis | | Fair Value | | Fair Value Method | | Yield
% | | Remaining
Maturity/Duration (years) |
| Assets: | | | | | | | | | | | |
| CMBS(1) | $ | 1,640,597 | | | $ | 1,640,905 | | | $ | 1,644,322 | | | Internal model, third-party inputs | | 3.08 | % | | 2.41 |
| CMBS interest-only(1) | 1,559,160 | | (2) | 28,553 | | | 29,146 | | | Internal model, third-party inputs | | 3.04 | % | | 2.53 |
| GNMA interest-only(3) | 109,783 | | (2) | 1,982 | | | 1,851 | | | Internal model, third-party inputs | | 4.59 | % | | 2.77 |
| Agency securities(1) | 629 | | | 640 | | | 637 | | | Internal model, third-party inputs | | 1.73 | % | | 1.83 |
| GNMA permanent securities(1) | 31,461 | | | 31,681 | | | 32,369 | | | Internal model, third-party inputs | | 3.17 | % | | 1.93 |
| | | | | | | | | | | |
| Equity securities(3) | N/A | | 12,848 | | | 12,980 | | | Observable market prices | | N/A | | N/A |
| Mortgage loan receivables held for investment, net, at amortized cost: | | | | | | | | | | | |
| Mortgage loan receivables held for investment, net, at amortized cost | 3,277,596 | | | 3,257,036 | | | 3,273,219 | | | Discounted Cash Flow(4) | | 6.94 | % | | 1.43 |
| | | | | | | | | | | |
| Provision for loan losses | N/A | | (20,500) | | | (20,500) | | | (5) | | N/A | | N/A |
| Mortgage loan receivables held for sale | 122,748 | | | 122,325 | | | 124,989 | | | Internal model, third-party inputs(6) | | 4.20 | % | | 9.99 |
| FHLB stock(7) | 61,619 | | | 61,619 | | | 61,619 | | | (7) | | 4.75 | % | | N/A |
| Nonhedge derivatives(1)(8) | 340,200 | | | N/A | | 693 | | | Counterparty quotations | | N/A | | 0.25 |
| | | | | | | | | | | |
| Liabilities: | | | | | | | | | | | |
| Repurchase agreements - short-term | 1,781,253 | | | 1,781,253 | | | 1,781,253 | | | Discounted Cash Flow(9) | | 2.50 | % | | 0.19 |
| Repurchase agreements - long-term | 34,681 | | | 34,681 | | | 34,681 | | | Discounted Cash Flow(10) | | 2.81 | % | | 1.41 |
| | | | | | | | | | | |
| Mortgage loan financing | 807,854 | | | 812,606 | | | 838,766 | | | Discounted Cash Flow(10) | | 4.91 | % | | 5.65 |
| | | | | | | | | | | |
| | | | | | | | | | | |
| Borrowings from the FHLB | 1,073,500 | | | 1,073,500 | | | 1,080,354 | | | Discounted Cash Flow | | 2.33 | % | | 2.08 |
| Senior unsecured notes | 1,166,201 | | | 1,157,833 | | | 1,208,860 | | | Internal model, third-party inputs | | 5.39 | % | | 3.28 |
| | | | | | | | | | | |
| Nonhedge derivatives(1)(8) | 69,571 | | | N/A | | — | | | Counterparty quotations | | N/A | | 0.36 |
(1)Measured at fair value on a recurring basis with the net unrealized gains or losses recorded as a component of other comprehensive income (loss) in equity.
(2)Represents notional outstanding balance of underlying collateral.
(3)Measured at fair value on a recurring basis with the net unrealized gains or losses recorded in current period earnings.
(4)Fair value for floating rate mortgage loan receivables, held for investment is estimated to approximate the outstanding face amount given the short interest rate reset risk (30 days) and no significant change in credit risk. Fair value for fixed rate mortgage loan receivables, held for investment is measured using a discounted cash flow.
(5)Fair value is estimated to equal par value.
(6)Fair value for mortgage loan receivables, held for sale is measured using a hypothetical securitization model utilizing market data from recent securitization spreads and pricing.
(7)Fair value of the FHLB stock approximates outstanding face amount as the Company’s captive insurance subsidiary is restricted from trading the stock and can only put the stock back to the FHLB, at the FHLB’s discretion, at par.
(8)The outstanding face amount of the nonhedge derivatives represents the notional amount of the underlying contracts.
(9)Fair value for repurchase agreement liabilities is estimated to approximate carrying amount primarily due to the short interest rate reset risk (30 days) of the financings and the high credit quality of the assets collateralizing these positions. If the collateral is determined to be impaired, the related financing would be revalued accordingly. There are no impairments on any positions.
(10)For repurchase agreements - long term and mortgage loan financing, the carrying value approximates the fair value discounting the expected cash flows at current market rates. If the collateral is determined to be impaired, the related financing would be revalued accordingly. There are no impairments on any positions.
The following table summarizes the Company’s financial assets and liabilities, which are both reported at fair value on a recurring basis (as indicated) or amortized cost/par, at June 30, 20202021 and December 31, 20192020 ($ in thousands):
June 30, 20202021
| | Financial Instruments Reported at Fair Value on Consolidated Statements of Financial Condition | Financial Instruments Reported at Fair Value on Consolidated Statements of Financial Condition | | Outstanding Face
Amount | | Fair Value | | Financial Instruments Reported at Fair Value on Consolidated Statements of Financial Condition | | Outstanding Face
Amount | | Fair Value |
| | Level 1 | | Level 2 | | Level 3 | | Total | Financial Instruments Reported at Fair Value on Consolidated Statements of Financial Condition | | Outstanding Face
Amount | | Level 2 | | Level 3 | | Total |
| | Assets: | Assets: | | | | | | | | | | | Assets: | | | | | | | | | | |
| CMBS(1) | CMBS(1) | | $ | 1,484,514 | | | $ | — | | | $ | — | | | $ | 1,436,227 | | | $ | 1,436,227 | | CMBS(1) | | $ | 665,558 | | | $ | 0 | | | $ | 0 | | | $ | 663,528 | | | $ | 663,528 | |
| CMBS interest-only(1) | CMBS interest-only(1) | | 1,525,120 | | (2) | — | | | — | | | 24,772 | | | 24,772 | | CMBS interest-only(1) | | 1,389,135 | | (2) | 0 | | | 0 | | | 18,215 | | | 18,215 | |
| GNMA interest-only(3) | GNMA interest-only(3) | | 93,464 | | (2) | — | | | — | | | 1,379 | | | 1,379 | | GNMA interest-only(3) | | 63,305 | | (2) | 0 | | | 0 | | | 699 | | | 699 | |
| Agency securities(1) | Agency securities(1) | | 610 | | | — | | | — | | | 636 | | | 636 | | Agency securities(1) | | 568 | | | 0 | | | 0 | | | 580 | | | 580 | |
| GNMA permanent securities(1) | GNMA permanent securities(1) | | 30,853 | | | — | | | — | | | 31,870 | | | 31,870 | | GNMA permanent securities(1) | | 24,040 | | | 0 | | | 0 | | | 24,547 | | | 24,547 | |
| | Nonhedge derivatives(4) | | 89,900 | | | — | | | 380 | | | — | | | 380 | | |
| | | $ | — | | | $ | 380 | | | $ | 1,494,884 | | | $ | 1,495,264 | | | $ | 0 | | | $ | 0 | | | $ | 707,569 | | | $ | 707,569 | |
| Liabilities: | Liabilities: | | | | | | | | | Liabilities: | | | | | | | | |
| Nonhedge derivatives(4) | Nonhedge derivatives(4) | | 69,571 | | | $ | — | | | $ | — | | | $ | — | | | $ | — | | Nonhedge derivatives(4) | | 202,571 | | | $ | 0 | | | $ | 368 | | | $ | 0 | | | $ | 368 | |
| | Financial Instruments Not Reported at Fair Value on Consolidated Statements of Financial Condition | Financial Instruments Not Reported at Fair Value on Consolidated Statements of Financial Condition | | Outstanding Face
Amount | | Fair Value | | Financial Instruments Not Reported at Fair Value on Consolidated Statements of Financial Condition | | Outstanding Face
Amount | | Fair Value |
| | Level 1 | | Level 2 | | Level 3 | | Total | Financial Instruments Not Reported at Fair Value on Consolidated Statements of Financial Condition | | Outstanding Face
Amount | | Level 2 | | Level 3 | | Total |
| | Assets: | Assets: | | Assets: | | | | | | | | | | |
| Mortgage loan receivable held for investment, net, at amortized cost: | Mortgage loan receivable held for investment, net, at amortized cost: | | Mortgage loan receivable held for investment, net, at amortized cost: | |
| Mortgage loans held by consolidated subsidiaries | | $ | 2,971,622 | | | $ | — | | | $ | — | | | $ | 2,928,796 | | | $ | 2,928,796 | | |
| Mortgage loan receivables held for investment, net, at amortized cost | | Mortgage loan receivables held for investment, net, at amortized cost | | $ | 2,548,013 | | | $ | 0 | | | $ | 0 | | | $ | 2,424,602 | | | $ | 2,424,602 | |
| | Provision for current expected credit losses | | N/A | | — | | | — | | | (49,102) | | | (49,102) | | |
| Allowance for current expected credit losses | | Allowance for current expected credit losses | | N/A | | 0 | | | 0 | | | (35,891) | | | (35,891) | |
| Mortgage loan receivable held for sale | Mortgage loan receivable held for sale | | 86,456 | | | — | | | — | | | 87,960 | | | 87,960 | | Mortgage loan receivable held for sale | | 59,198 | | | 0 | | | 0 | | | 62,295 | | | 62,295 | |
| CMBS(5) | CMBS(5) | | 11,576 | | | — | | | — | | | 11,111 | | | 11,111 | | CMBS(5) | | 11,467 | | | 0 | | | 0 | | | 11,030 | | | 11,030 | |
| CMBS interest-only(5) | CMBS interest-only(5) | | 10,619 | | (2) | — | | | — | | | 738 | | | 738 | | CMBS interest-only(5) | | 10,510 | | | 0 | | | 0 | | | 605 | | | 605 | |
| Provision for current expected credit losses | | N/A | | | | | | (19) | | | (19) | | |
| Allowance for current expected credit losses | | Allowance for current expected credit losses | | N/A | | 0 | | | 0 | | | (20) | | | (20) | |
| | FHLB stock | FHLB stock | | 61,619 | | | — | | | — | | | 61,619 | | | 61,619 | | FHLB stock | | 12,960 | | | 0 | | | 0 | | | 12,960 | | | 12,960 | |
| | $ | — | | | $ | — | | | $ | 3,041,103 | | | $ | 3,041,103 | | | $ | 0 | | | $ | 0 | | | $ | 2,475,581 | | | $ | 2,475,581 | |
| Liabilities: | Liabilities: | | | | | | | | | | | Liabilities: | | | | | | | | | | |
| Repurchase agreements - short-term | Repurchase agreements - short-term | | 1,217,013 | | | $ | — | | | $ | — | | | $ | 1,217,013 | | | $ | 1,217,013 | | Repurchase agreements - short-term | | 390,217 | | | $ | 0 | | | $ | 0 | | | $ | 390,217 | | | $ | 390,217 | |
| Repurchase agreements - long-term | Repurchase agreements - long-term | | 78,016 | | | — | | | — | | | 78,016 | | | 78,016 | | Repurchase agreements - long-term | | 135,483 | | | 0 | | | 0 | | | 135,483 | | | 135,483 | |
| Revolving credit facility | Revolving credit facility | | 266,430 | | | — | | | — | | | 266,430 | | | 266,430 | | Revolving credit facility | | 0 | | | 0 | | | 0 | | | 0 | | | 0 | |
| Mortgage loan financing | Mortgage loan financing | | 800,952 | | | — | | | — | | | 828,693 | | | 828,693 | | Mortgage loan financing | | 742,410 | | | 0 | | | 0 | | | 764,159 | | | 764,159 | |
| Secured financing facility | Secured financing facility | | 188,687 | | | — | | | — | | | 188,687 | | | 188,687 | | Secured financing facility | | 152,143 | | | 0 | | | 0 | | | 152,143 | | | 152,143 | |
| CLO debt | CLO debt | | 299,605 | | | — | | | — | | | 299,605 | | | 299,605 | | CLO debt | | 168,843 | | | 0 | | | 0 | | | 168,843 | | | 168,843 | |
| | Borrowings from the FHLB | Borrowings from the FHLB | | 360,790 | | | — | | | — | | | 362,559 | | | 362,559 | | Borrowings from the FHLB | | 288,000 | | | 0 | | | 0 | | | 288,712 | | | 288,712 | |
| Senior unsecured notes | Senior unsecured notes | | 1,752,817 | | | — | | | — | | | 1,025,236 | | | 1,025,236 | | Senior unsecured notes | | 2,115,644 | | | 0 | | | 0 | | | 2,123,832 | | | 2,123,832 | |
| | | $ | — | | | $ | — | | | $ | 4,266,239 | | | $ | 4,266,239 | | |
| | | $ | 0 | | | $ | 0 | | | $ | 4,023,389 | | | $ | 4,023,389 | |
(1)Measured at fair value on a recurring basis with the net unrealized gains or losses recorded as a component of other comprehensive income (loss) in equity.
(2)Represents notional outstanding balance of underlying collateral.
(3)Measured at fair value on a recurring basis with the net unrealized gains or losses recorded in current period earnings.
(4)Measured at fair value on a recurring basis with the net unrealized gains or losses recorded in current period earnings. The outstanding face amount of the nonhedge derivatives represents the notional amount of the underlying contracts.
(5)Restricted securities which are designated as risk retention securities under the Dodd-Frank Act and are therefore subject to transfer restrictions over the term of the securitization trust, which are classified as held-to-maturity and reported at amortized cost.
December 31, 20192020
| | Financial Instruments Reported at Fair Value on Consolidated Statements of Financial Condition | Financial Instruments Reported at Fair Value on Consolidated Statements of Financial Condition | | Outstanding Face
Amount | | Fair Value | | Financial Instruments Reported at Fair Value on Consolidated Statements of Financial Condition | | Outstanding Face
Amount | | Fair Value |
| | | | Level 1 | | Level 2 | | Level 3 | | Total | Financial Instruments Reported at Fair Value on Consolidated Statements of Financial Condition | | Outstanding Face
Amount | | Level 1 | | Level 3 | | Total |
| | Assets: | Assets: | | | | | | | | | | | Assets: | | | | | | | | | | |
| CMBS(1) | CMBS(1) | | $ | 1,628,476 | | | $ | — | | | $ | — | | | $ | 1,632,714 | | | $ | 1,632,714 | | CMBS(1) | | $ | 1,003,998 | | | $ | 0 | | | $ | 0 | | | $ | 992,227 | | | $ | 992,227 | |
| CMBS interest-only(1) | CMBS interest-only(1) | | 1,548,061 | | (2) | — | | | — | | | 28,342 | | | 28,342 | | CMBS interest-only(1) | | 1,487,616 | | (2) | 0 | | | 0 | | | 21,538 | | | 21,538 | |
| GNMA interest-only(3) | GNMA interest-only(3) | | 109,783 | | (2) | — | | | — | | | 1,851 | | | 1,851 | | GNMA interest-only(3) | | 75,350 | | (2) | 0 | | | 0 | | | 1,001 | | | 1,001 | |
| Agency securities(1) | Agency securities(1) | | 629 | | | — | | | — | | | 637 | | | 637 | | Agency securities(1) | | 586 | | | 0 | | | 0 | | | 605 | | | 605 | |
| GNMA permanent securities(1) | GNMA permanent securities(1) | | 31,461 | | | — | | | — | | | 32,369 | | | 32,369 | | GNMA permanent securities(1) | | 30,254 | | | 0 | | | 0 | | | 31,199 | | | 31,199 | |
| | Equity securities | Equity securities | | N/A | | 12,980 | | | — | | | — | | | 12,980 | | Equity securities | | N/A | | 0 | | | 0 | | | 0 | | | 0 | |
| Nonhedge derivatives(4) | Nonhedge derivatives(4) | | 340,200 | | | — | | | 693 | | | — | | | 693 | | Nonhedge derivatives(4) | | 65,600 | | | 0 | | | 299 | | | 0 | | | 299 | |
| | $ | 12,980 | | | $ | 693 | | | $ | 1,695,913 | | | $ | 1,709,586 | | | $ | 0 | | | $ | 299 | | | $ | 1,046,570 | | | $ | 1,046,869 | |
| Liabilities: | | | | | | | | | |
| Nonhedge derivatives(4) | | $ | 69,571 | | | $ | — | | | $ | — | | | $ | — | | | $ | — | | |
| | | | Financial Instruments Not Reported at Fair Value on Consolidated Statements of Financial Condition | Financial Instruments Not Reported at Fair Value on Consolidated Statements of Financial Condition | | Outstanding Face
Amount | | Fair Value | | Financial Instruments Not Reported at Fair Value on Consolidated Statements of Financial Condition | | Outstanding Face
Amount | | Fair Value |
| | Level 1 | | Level 2 | | Level 3 | | Total | Financial Instruments Not Reported at Fair Value on Consolidated Statements of Financial Condition | | Outstanding Face
Amount | | Level 2 | | Level 3 | | Total |
| | Assets: | Assets: | | Assets: | | | | | | | | | | |
| Mortgage loan receivable held for investment, net, at amortized cost: | Mortgage loan receivable held for investment, net, at amortized cost: | | Mortgage loan receivable held for investment, net, at amortized cost: | |
| Mortgage loans held by consolidated subsidiaries | | $ | 3,277,597 | | | $ | — | | | $ | — | | | $ | 3,273,219 | | | $ | 3,273,219 | | |
| Mortgage loan receivables held for investment, net, at amortized cost | | Mortgage loan receivables held for investment, net, at amortized cost | | $ | 2,365,204 | | | $ | 0 | | | $ | 0 | | | $ | 2,328,441 | | | $ | 2,328,441 | |
| | Provision for loan losses | | N/A | | — | | | — | | | (20,500) | | | (20,500) | | |
| Allowance for loan losses | | Allowance for loan losses | | N/A | | 0 | | | 0 | | | (41,507) | | | (41,507) | |
| Mortgage loan receivables held for sale | Mortgage loan receivables held for sale | | 122,748 | | | — | | | — | | | 124,989 | | | 124,989 | | Mortgage loan receivables held for sale | | 30,478 | | | 0 | | | 0 | | | 32,082 | | | 32,082 | |
| CMBS(5) | CMBS(5) | | 12,121 | | | — | | | — | | | 11,608 | | | 11,608 | | CMBS(5) | | 11,523 | | | 0 | | | 0 | | | 11,074 | | | 11,074 | |
| CMBS interest-only(5) | CMBS interest-only(5) | | 11,099 | | (2) | — | | | — | | | 804 | | | 804 | | CMBS interest-only(5) | | 10,566 | | (2) | 0 | | | 0 | | | 675 | | | 675 | |
| Allowance for current expected credit losses | | Allowance for current expected credit losses | | N/A | | 0 | | | 0 | | | (20) | | | (20) | |
| FHLB stock | FHLB stock | | 61,619 | | | — | | | — | | | 61,619 | | | 61,619 | | FHLB stock | | 31,000 | | | 0 | | | 0 | | | 31,000 | | | 31,000 | |
| | $ | — | | | $ | — | | | $ | 3,451,739 | | | $ | 3,451,739 | | | $ | 0 | | | $ | 0 | | | $ | 2,361,745 | | | $ | 2,361,745 | |
| Liabilities: | Liabilities: | | | | | | | | | | | Liabilities: | | | | | | | | | | |
| Repurchase agreements - short-term | Repurchase agreements - short-term | | 1,781,253 | | | $ | — | | | $ | — | | | $ | 1,781,253 | | | $ | 1,781,253 | | Repurchase agreements - short-term | | 708,833 | | | $ | — | | | $ | 0 | | | $ | 708,833 | | | $ | 708,833 | |
| Repurchase agreements - long-term | Repurchase agreements - long-term | | 34,681 | | | — | | | — | | | 34,681 | | | 34,681 | | Repurchase agreements - long-term | | 112,004 | | | 0 | | | 0 | | | 112,004 | | | 112,004 | |
| | Revolving credit facility | | Revolving credit facility | | 266,430 | | | 0 | | | 0 | | | 266,430 | | | 266,430 | |
| Mortgage loan financing | Mortgage loan financing | | 807,854 | | | — | | | — | | | 838,766 | | | 838,766 | | Mortgage loan financing | | 761,793 | | | 0 | | | 0 | | | 786,405 | | | 786,405 | |
| | Secured financing facility | | Secured financing facility | | 192,646 | | | 0 | | | 0 | | | 192,646 | | | 192,646 | |
| CLO debt | | CLO debt | | 276,516 | | | 0 | | | 0 | | | 276,516 | | | 276,516 | |
| | Borrowings from the FHLB | Borrowings from the FHLB | | 1,073,500 | | | — | | | — | | | 1,080,354 | | | 1,080,354 | | Borrowings from the FHLB | | 288,000 | | | 0 | | | 0 | | | 289,091 | | | 289,091 | |
| Senior unsecured notes | Senior unsecured notes | | 1,166,201 | | | — | | | — | | | 1,208,860 | | | 1,208,860 | | Senior unsecured notes | | 1,612,299 | | | 0 | | | 0 | | | 1,607,930 | | | 1,607,930 | |
| | | $ | — | | | $ | — | | | $ | 4,943,914 | | | $ | 4,943,914 | | | $ | 0 | | | $ | 0 | | | $ | 4,239,855 | | | $ | 4,239,855 | |
(1)Measured at fair value on a recurring basis with the net unrealized gains or losses recorded as a component of other comprehensive income (loss) in equity.
(2)Represents notional outstanding balance of underlying collateral.
(3)Measured at fair value on a recurring basis with the net unrealized gains or losses recorded in current period earnings.
(4)Measured at fair value on a recurring basis with the net unrealized gains or losses recorded in current period earnings. The outstanding face amount of the nonhedge derivatives represents the notional amount of the underlying contracts.
(5)Restricted securities which are designated as risk retention securities under the Dodd-Frank Act and are therefore subject to transfer restrictions over the term of the securitization trust, which are classified as held-to-maturity and reported at amortized cost.
The following table summarizes changes in Level 3 financial instruments reported at fair value on the consolidated statements of financial condition for the six months ended June 30, 20202021 and December 31, 20192020 ($ in thousands):
| | | Six Months Ended June 30, | | | Six Months Ended June 30, |
| Level 3 | Level 3 | | 2020 | | 2019 | | Level 3 | | 2021 | | 2020 | |
| | Balance at January 1, | Balance at January 1, | | $ | 1,695,913 | | | $ | 1,385,957 | | | Balance at January 1, | | $ | 1,046,569 | | | $ | 1,695,913 | | |
| Transfer from level 2 | Transfer from level 2 | | — | | | — | | | Transfer from level 2 | | 0 | | | 0 | | |
| Purchases | Purchases | | 437,536 | | | 847,318 | | | Purchases | | 101,358 | | | 437,536 | | |
| Sales | Sales | | (517,535) | | | (379,961) | | | Sales | | (339,238) | | | (517,535) | | |
| Paydowns/maturities | Paydowns/maturities | | (52,271) | | | (110,400) | | | Paydowns/maturities | | (106,197) | | | (52,271) | | |
| Amortization of premium/discount | Amortization of premium/discount | | (4,278) | | | (6,267) | | | Amortization of premium/discount | | (3,702) | | | (4,278) | | |
| Unrealized gain/(loss) | Unrealized gain/(loss) | | (51,709) | | | 18,804 | | | Unrealized gain/(loss) | | 8,184 | | | (51,709) | | |
| Realized gain/(loss) on sale(1) | Realized gain/(loss) on sale(1) | | (12,773) | | | 7,242 | | | Realized gain/(loss) on sale(1) | | 595 | | | (12,773) | | |
| Balance at June 30, | Balance at June 30, | | $ | 1,494,883 | | | $ | 1,762,693 | | | Balance at June 30, | | $ | 707,569 | | | $ | 1,494,883 | | |
(1)Includes realized losses on securities recorded as other than temporary impairments.
The following is quantitative information about significant unobservable inputs in our Level 3 measurements for those assets and liabilities measured at fair value on a recurring basis ($ in thousands):
June 30, 20202021
| | Financial Instrument | Financial Instrument | | Carrying Value | | Valuation Technique | | Unobservable Input | | Minimum | | Weighted Average | | Maximum | Financial Instrument | | Carrying Value | | Valuation Technique | | Unobservable Input | | Minimum | | Weighted Average | | Maximum |
| | CMBS(1) | CMBS(1) | | $ | 1,436,227 | | | Discounted cash flow | | Yield (4) | | 1.42 | % | | 3.54 | % | | 10 | % | CMBS(1) | | $ | 663,528 | | | Discounted cash flow | | Yield (4) | | (0.13) | % | | 1.88 | % | | 11.47 | % |
| | Duration (years)(5) | | 0.00 | | 2.72 | | 6.26 | | Duration (years)(5) | | 0 | | 1.93 | | 8.79 |
| CMBS interest-only(1) | CMBS interest-only(1) | | 24,772 | | (2) | Discounted cash flow | | Yield (4) | | — | % | | 2.33 | % | | 10 | % | CMBS interest-only(1) | | 18,215 | | (2) | Discounted cash flow | | Yield (4) | | 0.50 | % | | 2.94 | % | | 5.09 | % |
| | Duration (years)(5) | | 0.10 | | 2.34 | | 3.28 | | Duration (years)(5) | | 0.15 | | 1.93 | | 2.82 |
| | Prepayment speed (CPY)(5) | | 100.00 | | 100.00 | | 100.00 | | Prepayment speed (CPY)(5) | | 100.00 | | 100.00 | | 100.00 |
| GNMA interest-only(3) | GNMA interest-only(3) | | 1,379 | | (2) | Discounted cash flow | | Yield (4) | | — | % | | 3.26 | % | | 10 | % | GNMA interest-only(3) | | 699 | | (2) | Discounted cash flow | | Yield (4) | | 0 | % | | 9.36 | % | | 40.60 | % |
| | Duration (years)(5) | | 0.00 | | 2.45 | | 6.57 | | Duration (years)(5) | | 0 | | 2.56 | | 5.81 |
| | Prepayment speed (CPJ)(5) | | 5.00 | | 15.42 | | 35.00 | | Prepayment speed (CPJ)(5) | | 5.00 | | 18.60 | | 35.00 |
| Agency securities(1) | Agency securities(1) | | 636 | | | Discounted cash flow | | Yield (4) | | — | % | | 0.32 | % | | 1.72 | % | Agency securities(1) | | 580 | | | Discounted cash flow | | Yield (4) | | 0.58 | % | | 0.65 | % | | 1.16 | % |
| | Duration (years)(5) | | 0.00 | | 2.02 | | 2.48 | | Duration (years)(5) | | 0 | | 0.84 | | 0.96 |
| GNMA permanent securities(1) | GNMA permanent securities(1) | | 31,870 | | | Discounted cash flow | | Yield (4) | | 1.42 | % | | 2.44 | % | | 6.44 | % | GNMA permanent securities(1) | | 24,547 | | | Discounted cash flow | | Yield (4) | | 2.67 | % | | 3.48 | % | | 3.79 | % |
| | Duration (years)(5) | | 1.15 | | 9.89 | | 14.81 | | Duration (years)(5) | | 1.8 | | 3.37 | | 3.42 |
| | Total | Total | | $ | 1,494,884 | | | Total | | $ | 707,569 | | |
(1)CMBS, CMBS interest-only securities, Agency securities, GNMA construction securities, GNMA permanent securities and corporate bonds are classified as available-for-sale and reported at fair value with changes in fair value recorded in the current period in other comprehensive income.
(2)The amounts presented represent the principal amount of the mortgage loans outstanding in the pool in which the interest-only securities participate.
(3)Agency interest-only securities are recorded at fair value with changes in fair value recorded in current period earnings.
Sensitivity of the Fair Value to Changes in the Unobservable Inputs
(4)Significant increase (decrease) in the unobservable input in isolation would result in significantly lower (higher) fair value measurement.
(5)Significant increase (decrease) in the unobservable input in isolation would result in either a significantly lower or higher (lower or higher) fair value measurement depending on the structural features of the security in question.
December 31, 20192020
| | Financial Instrument | Financial Instrument | | Carrying Value | | Valuation Technique | | Unobservable Input | | Minimum | | Weighted Average | | Maximum | Financial Instrument | | Carrying Value | | Valuation Technique | | Unobservable Input | | Minimum | | Weighted Average | | Maximum |
| | CMBS(1) | CMBS(1) | | $ | 1,632,714 | | | Discounted cash flow | | Yield (3) | | — | % | | 3.11 | % | | 19.92 | % | CMBS(1) | | $ | 992,226 | | | Discounted cash flow | | Yield (3) | | 0 | % | | 2.09 | % | | 23.85 | % |
| | Duration (years)(4) | | 0.00 | | 1.63 | | 6.87 | | Duration (years)(4) | | 0.00 | | 2.68 | | 5.82 |
| CMBS interest-only(1) | CMBS interest-only(1) | | 28,342 | | (2) | Discounted cash flow | | Yield (3) | | 1.57 | % | | 3.93 | % | | 7.62 | % | CMBS interest-only(1) | | 21,537 | | (2) | Discounted cash flow | | Yield (3) | | 0.56 | % | | 2.51 | % | | 9.94 | % |
| | Duration (years)(4) | | 0.26 | | 2.47 | | 3.51 | | Duration (years)(4) | | 0.12 | | 2.23 | | 3.15 |
| | Prepayment speed (CPY)(4) | | 100.00 | | 97.24 | | 100.00 | | Prepayment speed (CPY)(4) | | 100.00 | | 100.00 | | 100.00 |
| GNMA interest-only(3) | GNMA interest-only(3) | | 1,851 | | (2) | Discounted cash flow | | Yield (4) | | (4.82) | % | | 15.13 | % | | 44.5 | % | GNMA interest-only(3) | | 1,001 | | (2) | Discounted cash flow | | Yield (4) | | 0 | % | | 7.93 | % | | 35.82 | % |
| | Duration (years)(5) | | 0.85 | | 2.90 | | 13.69 | | Duration (years)(5) | | 0.00 | | 2.80 | | 6.79 |
| | Prepayment speed (CPJ)(5) | | 5.00 | | 12.36 | | 35.00 | | Prepayment speed (CPJ)(5) | | 5.00 | | 17.78 | | 35.00 |
| Agency securities(1) | Agency securities(1) | | 637 | | | Discounted cash flow | | Yield (4) | | — | % | | 1.7 | % | | 2.16 | % | Agency securities(1) | | 605 | | | Discounted cash flow | | Yield (4) | | 0.44 | % | | 11.31 | % | | 72.00 | % |
| | Duration (years)(5) | | 0.00 | | 2.30 | | 2.92 | | Duration (years)(5) | | 0.00 | | 1.23 | | 1.44 |
| GNMA permanent securities(1) | GNMA permanent securities(1) | | 32,369 | | | Discounted cash flow | | Yield (4) | | 56.56 | % | | 166.79 | % | | 410 | % | GNMA permanent securities(1) | | 31,199 | | | Discounted cash flow | | Yield (4) | | 0 | % | | 2.99 | % | | 3.47 | % |
| | Duration (years)(5) | | 2.60 | | 3.61 | | 6.49 | | Duration (years)(5) | | 1.57 | | 9.74 | | 14.57 |
| | Total | Total | | $ | 1,695,913 | | | Total | | $ | 1,046,568 | | |
(1)CMBS, CMBS interest-only securities, Agency securities, GNMA construction securities, GNMA permanent securities and corporate bonds are classified as available-for-sale and reported at fair value with changes in fair value recorded in the current period in other comprehensive income.
(2)The amounts presented represent the principal amount of the mortgage loans outstanding in the pool in which the interest-only securities participate.
(3)Agency interest-only securities are recorded at fair value with changes in fair value recorded in current period earnings.
Sensitivity of the Fair Value to Changes in the Unobservable Inputs
(4)Significant increase (decrease) in the unobservable input in isolation would result in significantly lower (higher) fair value measurement.
(5)Significant increase (decrease) in the unobservable input in isolation would result in either a significantly lower or higher (lower or higher) fair value measurement depending on the structural features of the security in question.
Nonrecurring Fair Values
The Company measures fair value of certain assets on a nonrecurring basis when events or changes in circumstances indicate that the carrying value of the assets may not be recoverable.impaired. Adjustments to fair value generally result from the application of lower of amortized cost or fair value accounting for assets held for sale or write-down of assets value due to impairment. Refer to Note 3, Mortgage Loan Receivables and Note 5, Real Estate and Related Lease Intangibles, Net for disclosure of level 3 inputs.
16. INCOME TAXES
The Company elected to be taxed as a REIT under Sections 856 through 860 of the Internal Revenue Code of 1986, as amended (the “Code”), commencing with the taxable year ended December 31, 2015 (the REIT Election”). As such, the Company’s income is generally not subject to U.S. federal, state and local corporate income taxes other than as described below.
Certain of the Company’s subsidiaries have elected to be treated as TRSs. TRSs permit the Company to participate in certain activities from which REITs are generally precluded, as long as these activities meet specific criteria, are conducted within the parameters of certain limitations established by the Code, and are conducted in entities which elect to be treated as taxable subsidiaries under the Code. To the extent these criteria are met, the Company will continue to maintain its qualification as a REIT. The Company’s TRSs are not consolidated for U.S. federal income tax purposes, but are instead taxed as corporations. For financial reporting purposes, a provision for current and deferred taxes is established for the portion of earnings recognized by the Company with respect to its interest in TRSs. Current income tax expense (benefit) was $0.9 million and $(1.1) million for the three and six months ended June 30, 2021, respectively. Current income tax expense (benefit) was $1.6 million and $(15.0) million for the three and six months ended June 30, 2020, respectively. Current income tax expense (benefit) was $(1.3) million and $(7.4) million for the three and six months ended June 30, 2019, respectively.
As of June 30, 20202021 and December 31, 2019,2020, the Company’s net deferred tax assets (liabilities) were $(12.0)$(2.0) million and $(2.1)$(2.0) million, respectively, and are included in other assets (other liabilities) in the Company’s consolidated balance sheets. Deferred income tax expense (benefit) included within the provision for income taxes was $(1.2) million and $(2.1) million for the three months ended June 30, 2021, and June 30, 2020 respectively. There was 0 deferred income tax expense (benefit) for the six months ended June 30, 2021, and $9.9 million for the three and six months ended June 30, 2020, respectively. Deferred income tax expense (benefit) included within the provision for income taxes was $3.5 million and $6.7 million for the three and six months ended June 30, 2019, respectively.2020. The Company’s net deferred tax liability is comprised of deferred tax assets and deferred tax liabilities. The Company believes it is more likely than not that the deferred tax assets (aside from the exception noted below) will be realized in the future. Realization of the deferred tax assets is dependent upon our generation of sufficient taxable income in future years in appropriate tax jurisdictions to obtain benefit from the reversal of temporary differences. The amount of deferred tax assets considered realizable is subject to adjustment in future periods if estimates of future taxable income change.
As of June 30, 2020,2021, the Company hashad a deferred tax asset of $9.9$4.9 million relating to capital losses which it may only use to offset capital gains. These tax attributes will begin to expire if unused in 2021.2022. As the realization of these assets are not more likely than not before their expiration, the Company provided a full valuation allowance against this deferred tax asset. Additionally, as of June 30, 2020,2021, the Company had a$1.5 million of deferred tax asset of $1.1 million related to Code Section 163(j) interest expense limitation. As the Company is uncertain if this asset will be realized in the future, the Company provided a full valuation allowance against this deferred tax asset.
The Company has historically calculated its tax provision during quarterly reporting periods by applying an annual effective tax rate (“AETR”) for the full year to the income for the reporting period; however, for the three and six months ended June 30, 2020, the Company used a discrete effective tax rate method to calculate taxes, for the three and six months ended June 30, 2020. Basedgiven that, based on the current projections of income at the time, the Company iswas unable to determine a reliable AETR. As such, a discrete-period approach was usedThe Company has returned to using an AETR for the three and six months ended June 30, 2020.full year to income for the current reporting period.
The Company’s tax returns are subject to audit by taxing authorities. Generally, as of June 30, 2020,2021, the tax years 2016-20192017-2020 remain open to examination by the major taxing jurisdictions in which the Company is subject to taxes. The IRS recently completed its audit of the 2014 tax year and did not recommend any changes to the Company’s tax return. The Company is currently under New York City audit for tax years 2012-2014.2012-2013. Several of the Company’s subsidiary entities are under New York State audit for tax years 2015-2018. The Company does not expect these audits to result in any material changes to the Company’s financial position. The Company does not expect tax expense to have an impact on either short, or long-term liquidity or capital needs.
The Company acquired certain corporate entities at the time of its IPO. The related acquisition agreements provided an indemnification to the Company by each transferor of any amounts due for any potential tax liabilities owed by these entities for tax years prior to their acquisition. In connection with a New York State audit settlement, the Company collected $2.5 million of indemnities under the acquisition agreements during 2019.
Under U.S. GAAP, a tax benefit related to an income tax position may be recognized when it is more likely than not that the position will be sustained upon examination by the tax authorities based on the technical merits of the position. In addition, the Company does not believe that it has any tax positions for which it is reasonably possible that it will be required to record a significant liability for unrecognized tax benefits within the next twelve months.
Tax Receivable Agreement
Upon consummation of the IPO, the Company entered into a Tax Receivable Agreement with the Continuing LCFH Limited Partners. Under the Tax Receivable Agreement the Company generally is required to pay to those Continuing LCFH Limited Partners that exchange their interests in LCFH and Class B shares of the Company for Class A shares of the Company, 85% of the applicable cash savings, if any, in U.S. federal, state and local income tax that the Company realizes (or is deemed to realize in certain circumstances) as a result of (i) the increase in tax basis in its proportionate share of LCFH’s assets that is attributable to the Company as a result of the exchanges and (ii) payments under the Tax Receivable Agreement, including any tax benefits related to imputed interest deemed to be paid by the Company as a result of such agreement. The Company may make future payments under the Tax Receivable Agreement if the tax benefits are realized. The Company would then benefit from the remaining 15% of cash savings in income tax that we realize. For purposes of the Tax Receivable Agreement, cash savings in income tax will be computed by comparing our actual income tax liability to the amount of such taxes that we would have been required to pay had there been no increase to the tax basis of the assets of LCFH as a result of the exchanges and had we not entered into the Tax Receivable Agreement. As of June 30, 2020 and December 31, 2019, pursuant to the Tax Receivable Agreement, the Company recorded a liability of $1.6 million, included in other liabilities in the consolidated balance sheets for Continuing LCFH Limited Partners.
17. RELATED PARTY TRANSACTIONS
Ladder Select Bond FundThe Company has no material related party relationships to disclose.
On October 18, 2016, Ladder Capital Asset Management LLC (“LCAM”), a subsidiary of the Company and a registered investment adviser, launched the Ladder Select Bond Fund (the “Fund”), a mutual fund. In addition, on October 18, 2016, the Company made a $10.0 million investment in the Fund, which was included in other assets in the consolidated balance sheets. On June 22, 2020, the Fund was liquidated and LCAM deregistered with the Securities and Exchange Commission (“SEC”). The Company recognized a realized loss of $0.7 million upon liquidation of the Fund which is included in fee and other income on the consolidated statements of income.
Commercial Real Estate Loans
From time to time, the Company may provide commercial real estate loans to entities affiliated with certain of our directors, officers or large shareholders who are, as part of their ordinary course of business, commercial real estate investors. These loans are made in the ordinary course of the Company’s business on the same terms and conditions as would be offered to any other borrower of similar type and standing on a similar property.
18. COMMITMENTS AND CONTINGENCIES
Leases
The Company adopted ASC Topic 842 on January 1, 2019. The primary impact of applying ASC Topic 842 was the initial recognition of a $3.5 million lease liability and a $3.3 million right of use asset (including previously accrued straight line rent) on the Company’s consolidated financial statements, for leases classified as operating leases under ASC Topic 840, primarily for the Company’s corporate headquarters and other identified leases. As of June 30, 2020,2021, the Company had a $1.9$0.8 million lease liability and a $1.9$0.8 million right-of-use asset on its consolidated balance sheets.sheets found within other liabilities and other assets, respectively. Tenant reimbursements, which consist of real estate taxes and other municipal charges paid by us which were reimbursable by our tenants pursuant to the terms of triple-net lease agreements, were $1.1 million and $2.2 million for the three and six months ended June 30, 2021 and $1.1 million and $2.3 million for the three and six months ended June 30, 2020, respectively, and are included in operating lease income on the Company’s consolidated statements of income. Tenant reimbursements were $1.7 million and $3.3 million for the three and six months ended June 30, 2019, respectively, and are included in operating lease income on the Company’s consolidated statements of income.
Investments in Unconsolidated Joint Ventures
We have made investments in various unconsolidated joint ventures. See Note 6, Investment in and Advances to Unconsolidated Joint Ventures, for further details of our unconsolidated investments. Our maximum exposure to loss from these investments is limited to the carrying value of our investments.
Unfunded Loan Commitments
As of June 30, 2020,2021, the Company’s off-balance sheet arrangements consisted of $249.2$245.1 million of unfunded commitments on mortgage loan receivables held for investment to provide additional first mortgage loan financing over the next three years at rates to be determined at the time of funding, 62%59% of which additional funds relate to the occurrence of certain “good news” events, such as the owner concluding a lease agreement with a major tenant in the building or reaching some pre-determined net operating income. As of December 31, 2019,2020, the Company’s off-balance sheet arrangements consisted of $286.5$148.8 million of unfunded commitments on mortgage loan receivables held for investment to provide additional first mortgage loan financing. Commitments are subject to our loan borrowers’ satisfaction of certain financial and nonfinancial covenants and may or may not be funded depending on a variety of circumstances including timing, credit metric hurdles, and other nonfinancial events occurring. The COVID-19 pandemic has impacted the progress of work generally and, depending on specific property locations, the progress of capital expenditures, construction, and leasing, which have been delayed and/or slower paced than originally anticipated. The progress of those particular projects located in Statesstates or local municipalities with continuing restrictions on such activities is anticipated to remain slower to complete than otherwise expected, and the pace of future funding relating to these capital needs has been, and may continue to be, commensurately slower. These commitments are not reflected on the consolidated balance sheets.
19. SEGMENT REPORTING
The Company has determined that it has 3 reportable segments based on how the chief operating decision maker reviews and manages the business. These reportable segments include loans, securities, and real estate. The loans segment includes mortgage loan receivables held for investment (balance sheet loans) and mortgage loan receivables held for sale (conduit loans). The securities segment is composed of all of the Company’s activities related to commercial real estate securities, which include investments in CMBS, U.S. Agency Securities,securities, corporate bonds and equity securities. The real estate segment includes net leased properties, office buildings, a student housing portfolio,portfolios, hotels, industrial buildings, a shopping center and condominium units. Corporate/other includes the Company’s investments in joint ventures, other asset management activities and operating expenses.
The Company evaluates performance based on the following financial measures for each segment ($ in thousands):
| | | Loans | | Securities | | Real
Estate(1) | | Corporate/Other(2) | | Company
Total | |
| | Three months ended June 30, 2020 | | | | | | | | | | |
| Three months ended June 30, 2021 | | Three months ended June 30, 2021 | Loans | | Securities | | Real Estate (1) | | Corporate/Other(2) | | Company
Total |
| Interest income | Interest income | $ | 53,641 | | | $ | 8,177 | | | $ | 2 | | | $ | 276 | | | $ | 62,096 | | Interest income | $ | 34,253 | | | $ | 3,216 | | | $ | 0 | | | $ | 108 | | | $ | 37,577 | |
| Interest expense | Interest expense | (11,732) | | | (7,795) | | | (9,758) | | | (39,140) | | | (68,425) | | Interest expense | (13,681) | | | (556) | | | (9,944) | | | (21,045) | | | (45,226) | |
| Net interest income (expense) | Net interest income (expense) | 41,909 | | | 382 | | | (9,756) | | | (38,864) | | | (6,329) | | Net interest income (expense) | 20,572 | | | 2,660 | | | (9,944) | | | (20,937) | | | (7,649) | |
| (Provision) benefit for loan losses | 726 | | | 3 | | | — | | | — | | | 729 | | |
| Net interest income (expense) after provision for loan losses | 42,635 | | | 385 | | | (9,756) | | | (38,864) | | | (5,600) | | |
| Provision for (release of) loan loss reserves | | Provision for (release of) loan loss reserves | 335 | | | 0 | | 0 | | | 0 | | | 335 | |
| Net interest income (expense) after provision for (release of) loan reserves | | Net interest income (expense) after provision for (release of) loan reserves | 20,907 | | | 2,660 | | | (9,944) | | | (20,937) | | | (7,314) | |
| | Operating lease income | — | | | — | | | 23,773 | | | — | | | 23,773 | | |
| Real estate operating income | | Real estate operating income | 0 | | | 0 | | | 26,558 | | | 0 | | | 26,558 | |
| | Sale of loans, net | Sale of loans, net | (744) | | | — | | | — | | | — | | | (744) | | Sale of loans, net | 3,392 | | | 0 | | | 0 | | | 0 | | | 3,392 | |
| Realized gain (loss) on securities | Realized gain (loss) on securities | — | | | (14,798) | | | — | | | — | | | (14,798) | | Realized gain (loss) on securities | 0 | | | 15 | | | 0 | | | 0 | | | 15 | |
| Unrealized gain (loss) on equity securities | — | | | 401 | | | — | | | — | | | 401 | | |
| | Unrealized gain (loss) on Agency interest-only securities | Unrealized gain (loss) on Agency interest-only securities | — | | | 98 | | | — | | | — | | | 98 | | Unrealized gain (loss) on Agency interest-only securities | 0 | | | (48) | | | 0 | | | 0 | | | (48) | |
| Realized gain on sale of real estate, net | Realized gain on sale of real estate, net | — | | | — | | | (1) | | | — | | | (1) | | Realized gain on sale of real estate, net | 0 | | | 0 | | 19,389 | | | 0 | | | 19,389 | |
| | Impairment of real estate | | Impairment of real estate | 0 | | | 0 | | | 0 | | | 0 | | | 0 | |
| Fee and other income | Fee and other income | 2,429 | | | 2 | | | — | | | 1,074 | | | 3,505 | | Fee and other income | 2,295 | | | 0 | | | 14 | | | 142 | | | 2,451 | |
| Net result from derivative transactions | Net result from derivative transactions | (588) | | | (225) | | | — | | | — | | | (813) | | Net result from derivative transactions | (2,792) | | | (1,052) | | | 0 | | | 0 | | | (3,844) | |
| Earnings (loss) from investment in unconsolidated joint ventures | Earnings (loss) from investment in unconsolidated joint ventures | — | | | — | | | 471 | | | — | | | 471 | | Earnings (loss) from investment in unconsolidated joint ventures | 78 | | | 0 | | | 159 | | | 0 | | | 237 | |
| | Gain (loss) on extinguishment of debt | — | | | — | | | — | | | 19,017 | | | 19,017 | | |
| | Total other income (loss) | Total other income (loss) | 1,097 | | | (14,522) | | | 24,243 | | | 20,091 | | | 30,909 | | Total other income (loss) | 2,973 | | | (1,085) | | | 46,120 | | | 142 | | | 48,150 | |
| | Salaries and employee benefits | Salaries and employee benefits | — | | | — | | | — | | | (7,001) | | | (7,001) | | Salaries and employee benefits | 0 | | | 0 | | | 0 | | | (8,477) | | | (8,477) | |
| Operating expenses(3) | Operating expenses(3) | — | | | — | | | — | | | (6,224) | | | (6,224) | | Operating expenses(3) | 29 | | | 0 | | | 0 | | | (4,245) | | | (4,216) | |
| Real estate operating expenses | Real estate operating expenses | — | | | — | | | (6,034) | | | — | | | (6,034) | | Real estate operating expenses | 0 | | | 0 | | | (6,345) | | | 0 | | | (6,345) | |
| | Fee expense | Fee expense | (1,474) | | | (61) | | | (442) | | | — | | | (1,977) | | Fee expense | (944) | | | (61) | | | (1,018) | | | (172) | | | (2,195) | |
| Depreciation and amortization | Depreciation and amortization | — | | | — | | | (9,791) | | | (25) | | | (9,816) | | Depreciation and amortization | 0 | | | 0 | | | (9,440) | | | (24) | | | (9,464) | |
| Total costs and expenses | Total costs and expenses | (1,474) | | | (61) | | | (16,267) | | | (13,250) | | | (31,052) | | Total costs and expenses | (915) | | | (61) | | | (16,803) | | | (12,918) | | | (30,697) | |
| | Income tax (expense) benefit | Income tax (expense) benefit | — | | | — | | | — | | | 550 | | | 550 | | Income tax (expense) benefit | 0 | | | 0 | | | 0 | | | 318 | | | 318 | |
| Segment profit (loss) | Segment profit (loss) | $ | 42,258 | | | $ | (14,198) | | | $ | (1,780) | | | $ | (31,473) | | | $ | (5,193) | | Segment profit (loss) | $ | 22,965 | | | $ | 1,514 | | | $ | 19,373 | | | $ | (33,395) | | | $ | 10,457 | |
| | Total assets as of June 30, 2020 | $ | 2,991,959 | | | $ | 1,506,713 | | | $ | 1,091,129 | | | $ | 1,019,749 | | | $ | 6,609,550 | | |
| Total assets as of June 30, 2021 | | Total assets as of June 30, 2021 | $ | 2,554,339 | | | $ | 719,183 | | | $ | 986,267 | | | $ | 1,357,020 | | | $ | 5,616,809 | |
| | | Loans | | Securities | | Real
Estate(1) | | Corporate/Other(2) | | Company
Total | |
| | Three months ended June 30, 2019 | | | | | | | | | | |
| Three months ended June 30, 2020 | | Three months ended June 30, 2020 | Loans | | Securities | | Real Estate (1) | | Corporate/Other(2) | | Company
Total |
| Interest income | Interest income | $ | 69,794 | | | $ | 15,210 | | | $ | 7 | | | $ | 311 | | | $ | 85,322 | | Interest income | $ | 53,641 | | | $ | 8,177 | | | $ | 2 | | | $ | 276 | | | $ | 62,096 | |
| Interest expense | Interest expense | (14,224) | | | (4,130) | | | (9,091) | | | (24,924) | | | (52,369) | | Interest expense | (11,732) | | | (7,795) | | | (9,758) | | | (39,140) | | | (68,425) | |
| Net interest income (expense) | Net interest income (expense) | 55,570 | | | 11,080 | | | (9,084) | | | (24,613) | | | 32,953 | | Net interest income (expense) | 41,909 | | | 382 | | | (9,756) | | | (38,864) | | | (6,329) | |
| (Provision) benefit for loan losses | (300) | | | — | | | — | | | — | | | (300) | | |
| Net interest income (expense) after provision for loan losses | 55,270 | | | 11,080 | | | (9,084) | | | (24,613) | | | 32,653 | | |
| Provision for (release of) loan loss reserves | | Provision for (release of) loan loss reserves | 726 | | | 3 | | | 0 | | | 0 | | | 729 | |
| Net interest income (expense) after provision for (release of) loan reserves | | Net interest income (expense) after provision for (release of) loan reserves | 42,635 | | | 385 | | | (9,756) | | | (38,864) | | | (5,600) | |
| | Operating lease income | — | | | — | | | 27,780 | | | — | | | 27,780 | | |
| Real estate operating income | | Real estate operating income | 0 | | | 0 | | | 23,773 | | | 0 | | | 23,773 | |
| | Sale of loans, net | Sale of loans, net | 20,264 | | | — | | | — | | | — | | | 20,264 | | Sale of loans, net | (744) | | | 0 | | | 0 | | | 0 | | | (744) | |
| Realized gain (loss) on securities | Realized gain (loss) on securities | — | | | 4,464 | | | — | | | — | | | 4,464 | | Realized gain (loss) on securities | 0 | | | (14,798) | | | 0 | | | 0 | | | (14,798) | |
| Unrealized gain (loss) on equity securities | Unrealized gain (loss) on equity securities | — | | | (990) | | | — | | | — | | | (990) | | Unrealized gain (loss) on equity securities | 0 | | | 401 | | | 0 | | | 0 | | | 401 | |
| Unrealized gain (loss) on Agency interest-only securities | Unrealized gain (loss) on Agency interest-only securities | — | | | 11 | | | — | | | — | | | 11 | | Unrealized gain (loss) on Agency interest-only securities | 0 | | | 98 | | | 0 | | | 0 | | | 98 | |
| Realized gain on sale of real estate, net | Realized gain on sale of real estate, net | — | | | — | | | (1,124) | | | — | | | (1,124) | | Realized gain on sale of real estate, net | 0 | | | 0 | | | (1) | | | 0 | | | (1) | |
| | Fee and other income | Fee and other income | 5,947 | | | 333 | | | — | | | 916 | | | 7,196 | | Fee and other income | 2,429 | | | 2 | | | 0 | | | 1,074 | | | 3,505 | |
| Net result from derivative transactions | Net result from derivative transactions | (8,518) | | | (6,939) | | | — | | | — | | | (15,457) | | Net result from derivative transactions | (588) | | | (225) | | | 0 | | | 0 | | | (813) | |
| Earnings (loss) from investment in unconsolidated joint ventures | Earnings (loss) from investment in unconsolidated joint ventures | — | | | — | | | 1,564 | | | — | | | 1,564 | | Earnings (loss) from investment in unconsolidated joint ventures | 0 | | | 0 | | | 471 | | | 0 | | | 471 | |
| | Gain (loss) on extinguishment of debt | | Gain (loss) on extinguishment of debt | 0 | | | 0 | | | 0 | | | 19,017 | | | 19,017 | |
| Total other income (loss) | Total other income (loss) | 17,693 | | | (3,121) | | | 28,220 | | | 916 | | | 43,708 | | Total other income (loss) | 1,097 | | | (14,522) | | | 24,243 | | | 20,091 | | | 30,909 | |
| | Salaries and employee benefits | Salaries and employee benefits | — | | | — | | | — | | | (14,907) | | | (14,907) | | Salaries and employee benefits | 0 | | | 0 | | | 0 | | | (7,001) | | | (7,001) | |
| Operating expenses(3) | Operating expenses(3) | — | | | — | | | — | | | (6,012) | | | (6,012) | | Operating expenses(3) | 0 | | | 0 | | | 0 | | | (6,224) | | | (6,224) | |
| Real estate operating expenses | Real estate operating expenses | — | | | — | | | (6,032) | | | — | | | (6,032) | | Real estate operating expenses | 0 | | | 0 | | | (6,034) | | | 0 | | | (6,034) | |
| | Fee expense | Fee expense | (1,058) | | | (87) | | | (38) | | | — | | | (1,183) | | Fee expense | (1,474) | | | (61) | | | (442) | | | 0 | | | (1,977) | |
| Depreciation and amortization | Depreciation and amortization | — | | | — | | | (9,910) | | | (25) | | | (9,935) | | Depreciation and amortization | 0 | | | 0 | | | (9,791) | | | (25) | | | (9,816) | |
| Total costs and expenses | Total costs and expenses | (1,058) | | | (87) | | | (15,980) | | | (20,944) | | | (38,069) | | Total costs and expenses | (1,474) | | | (61) | | | (16,267) | | | (13,250) | | | (31,052) | |
| | Income tax (expense) benefit | Income tax (expense) benefit | — | | | — | | | — | | | (2,219) | | | (2,219) | | Income tax (expense) benefit | 0 | | | 0 | | | 0 | | | 550 | | | 550 | |
| Segment profit (loss) | Segment profit (loss) | $ | 71,905 | | | $ | 7,872 | | | $ | 3,156 | | | $ | (46,860) | | | $ | 36,073 | | Segment profit (loss) | $ | 42,258 | | | $ | (14,198) | | | $ | (1,780) | | | $ | (31,473) | | | $ | (5,193) | |
| | Total assets as of December 31, 2019 | $ | 3,358,861 | | | $ | 1,721,305 | | | $ | 1,096,514 | | | $ | 492,472 | | | $ | 6,669,152 | | |
| Total assets as of December 31, 2020 | | Total assets as of December 31, 2020 | $ | 2,343,070 | | | $ | 1,058,298 | | | $ | 1,031,557 | | | $ | 1,448,303 | | | $ | 5,881,229 | |
| | | | Loans | | Securities | | Real
Estate(1) | | Corporate/Other(2) | | Company
Total | |
| | Six months ended June 30, 2020 | | | | | | | | | | |
| Six months ended June 30, 2021 | | Six months ended June 30, 2021 | Loans | | Securities | | Real Estate (1) | | Corporate/Other(2) | | Company
Total |
| Interest income | Interest income | $ | 112,546 | | | $ | 21,040 | | | $ | 10 | | | $ | 1,090 | | | $ | 134,686 | | Interest income | $ | 70,145 | | | $ | 6,450 | | | $ | 0 | | | $ | 270 | | | 76,865 | |
| Interest expense | Interest expense | (16,602) | | | (14,554) | | | (19,993) | | | (68,678) | | | (119,827) | | Interest expense | (27,757) | | | (1,388) | | | (18,729) | | | (43,325) | | | (91,199) | |
| Net interest income (expense) | Net interest income (expense) | 95,944 | | | 6,486 | | | (19,983) | | | (67,588) | | | 14,859 | | Net interest income (expense) | 42,388 | | | 5,061 | | | (18,729) | | | (43,056) | | | (14,334) | |
| (Provision) benefit for loan losses | (25,855) | | | 3 | | | — | | | — | | | (25,852) | | |
| Net interest income (expense) after provision for loan losses | 70,089 | | | 6,489 | | | (19,983) | | | (67,588) | | | (10,993) | | |
| Provision for (release of) loan loss reserves | | Provision for (release of) loan loss reserves | 4,586 | | | 0 | | | 0 | | | 0 | | | 4,586 | |
| Net interest income (expense) after provision for (release of) loan reserves | | Net interest income (expense) after provision for (release of) loan reserves | 46,974 | | | 5,061 | | | (18,729) | | | (43,056) | | | (9,748) | |
| | Operating lease income | — | | | — | | | 50,101 | | | — | | | 50,101 | | |
| Real estate operating income | | Real estate operating income | 0 | | | 0 | | | 50,718 | | | 0 | | | 50,718 | |
| | Sale of loans, net | Sale of loans, net | 261 | | | — | | | — | | | — | | | 261 | | Sale of loans, net | 3,392 | | | 0 | | | 0 | | | 0 | | | 3,392 | |
| Realized gain (loss) on securities | Realized gain (loss) on securities | — | | | (11,787) | | | — | | | — | | | (11,787) | | Realized gain (loss) on securities | 0 | | | 594 | | | 0 | | | 0 | | | 594 | |
| Unrealized gain (loss) on equity securities | — | | | (132) | | | — | | | — | | | (132) | | |
| | Unrealized gain (loss) on Agency interest-only securities | Unrealized gain (loss) on Agency interest-only securities | — | | | 174 | | | — | | | — | | | 174 | | Unrealized gain (loss) on Agency interest-only securities | 0 | | | (68) | | | 0 | | | 0 | | | (68) | |
| Realized gain on sale of real estate, net | Realized gain on sale of real estate, net | — | | | — | | | 10,528 | | | — | | | 10,528 | | Realized gain on sale of real estate, net | 0 | | | 0 | | | 19,389 | | | 0 | | | 19,389 | |
| | Fee and other income | Fee and other income | 3,854 | | | 403 | | | 25 | | | 742 | | | 5,024 | | Fee and other income | 5,264 | | | 0 | | | 47 | | | 424 | | | 5,735 | |
| Net result from derivative transactions | Net result from derivative transactions | (11,939) | | | (4,309) | | | — | | | — | | | (16,248) | | Net result from derivative transactions | 251 | | | 676 | | | 0 | | | 0 | | | 927 | |
| Earnings (loss) from investment in unconsolidated joint ventures | Earnings (loss) from investment in unconsolidated joint ventures | — | | | — | | | 912 | | | — | | | 912 | | Earnings (loss) from investment in unconsolidated joint ventures | 218 | | | 0 | | | 455 | | | 0 | | | 673 | |
| | Gain (loss) on extinguishment of debt | — | | | — | | | — | | | 21,077 | | | 21,077 | | |
| | Total other income (loss) | Total other income (loss) | (7,824) | | | (15,651) | | | 61,566 | | | 21,819 | | | 59,910 | | Total other income (loss) | 9,125 | | | 1,202 | | | 70,609 | | | 424 | | | 81,360 | |
| | Salaries and employee benefits | Salaries and employee benefits | — | | | — | | | — | | | (24,023) | | | (24,023) | | Salaries and employee benefits | 0 | | | 0 | | | 0 | | | (18,011) | | | (18,011) | |
| Operating expenses(3) | Operating expenses(3) | — | | | — | | | — | | | (12,018) | | | (12,018) | | Operating expenses(3) | 38 | | | 0 | | | 0 | | | (8,495) | | | (8,457) | |
| Real estate operating expenses | Real estate operating expenses | — | | | — | | | (13,981) | | | (13,981) | | Real estate operating expenses | 0 | | | 0 | | | (12,555) | | | 0 | | | (12,555) | |
| | Fee expense | Fee expense | (2,664) | | | (133) | | | (618) | | | — | | | (3,415) | | Fee expense | (2,252) | | | (111) | | | (1,140) | | | (290) | | | (3,793) | |
| Depreciation and amortization | Depreciation and amortization | — | | | — | | | (19,775) | | | (50) | | | (19,825) | | Depreciation and amortization | 0 | | | 0 | | | (18,950) | | | (50) | | | (19,000) | |
| Total costs and expenses | Total costs and expenses | (2,664) | | | (133) | | | (34,374) | | | (36,091) | | | (73,262) | | Total costs and expenses | (2,214) | | | (111) | | | (32,645) | | | (26,846) | | | (61,816) | |
| | Income tax (expense) benefit | Income tax (expense) benefit | — | | | — | | | — | | | 5,091 | | | 5,091 | | Income tax (expense) benefit | 0 | | | 0 | | | 0 | | | 1,096 | | | 1,096 | |
| Segment profit (loss) | Segment profit (loss) | $ | 59,601 | | | $ | (9,295) | | | $ | 7,209 | | | $ | (76,769) | | | $ | (19,254) | | Segment profit (loss) | $ | 53,885 | | | $ | 6,152 | | | $ | 19,235 | | | $ | (68,382) | | | $ | 10,892 | |
| | Total assets as of June 30, 2020 | $ | 2,991,959 | | | $ | 1,506,713 | | | $ | 1,091,129 | | | $ | 1,019,749 | | | $ | 6,609,550 | | |
| Total assets as of June 30, 2021 | | Total assets as of June 30, 2021 | $ | 2,554,339 | | | $ | 719,183 | | | $ | 986,267 | | | $ | 1,357,020 | | | $ | 5,616,809 | |
| | | | Loans | | Securities | | Real
Estate(1) | | Corporate/Other(2) | | Company
Total | |
| | Six months ended June 30, 2019 | | | | | | | | | | |
| Six months ended June 30, 2020 | | Six months ended June 30, 2020 | Loans | | Securities | | Real Estate (1) | | Corporate/Other(2) | | Company
Total |
| Interest income | Interest income | $ | 142,947 | | | $ | 28,329 | | | $ | 15 | | | $ | 498 | | | $ | 171,789 | | Interest income | $ | 112,546 | | | $ | 21,040 | | | $ | 10 | | | $ | 1,090 | | | $ | 134,686 | |
| Interest expense | Interest expense | (28,981) | | | (6,618) | | | (17,973) | | | (50,046) | | | (103,618) | | Interest expense | (16,602) | | | (14,554) | | | (19,993) | | | (68,678) | | | (119,827) | |
| Net interest income (expense) | Net interest income (expense) | 113,966 | | | 21,711 | | | (17,958) | | | (49,548) | | | 68,171 | | Net interest income (expense) | 95,944 | | | 6,486 | | | (19,983) | | | (67,588) | | | 14,859 | |
| (Provision) benefit for loan losses | (600) | | | — | | | — | | | — | | | (600) | | |
| Net interest income (expense) after provision for loan losses | 113,366 | | | 21,711 | | | (17,958) | | | (49,548) | | | 67,571 | | |
| Provision for (release of) loan loss reserves | | Provision for (release of) loan loss reserves | (25,855) | | | 3 | | | 0 | | | 0 | | | (25,852) | |
| Net interest income (expense) after provision for (release of) loan reserves | | Net interest income (expense) after provision for (release of) loan reserves | 70,089 | | | 6,489 | | | (19,983) | | | (67,588) | | | (10,993) | |
| | Operating lease income | Operating lease income | — | | | — | | | 56,701 | | | — | | | 56,701 | | Operating lease income | 0 | | | 0 | | | 50,101 | | | 0 | | | 50,101 | |
| | Sale of loans, net | Sale of loans, net | 27,342 | | | — | | | — | | | — | | | 27,342 | | Sale of loans, net | 261 | | | 0 | | | 0 | | | 0 | | | 261 | |
| Realized gain (loss) on securities | Realized gain (loss) on securities | — | | | 7,329 | | | — | | | — | | | 7,329 | | Realized gain (loss) on securities | 0 | | | (11,787) | | | 0 | | | 0 | | | (11,787) | |
| Unrealized gain (loss) on equity securities | Unrealized gain (loss) on equity securities | — | | | 1,088 | | | — | | | — | | | 1,088 | | Unrealized gain (loss) on equity securities | 0 | | | (132) | | | 0 | | | 0 | | | (132) | |
| Unrealized gain (loss) on Agency interest-only securities | Unrealized gain (loss) on Agency interest-only securities | — | | | 22 | | | — | | | — | | | 22 | | Unrealized gain (loss) on Agency interest-only securities | 0 | | | 174 | | | 0 | | | 0 | | | 174 | |
| Realized gain on sale of real estate, net | Realized gain on sale of real estate, net | — | | | — | | | (1,119) | | | — | | | (1,119) | | Realized gain on sale of real estate, net | 0 | | | 0 | | | 10,528 | | | 0 | | | 10,528 | |
| Impairment of real estate | Impairment of real estate | — | | | — | | | (1,350) | | | — | | | (1,350) | | Impairment of real estate | 0 | | | 0 | | | 0 | | | 0 | | | 0 | |
| Fee and other income | Fee and other income | 9,257 | | | 737 | | | 7 | | | 1,881 | | | 11,882 | | Fee and other income | 3,854 | | | 403 | | | 25 | | | 742 | | | 5,024 | |
| Net result from derivative transactions | Net result from derivative transactions | (13,716) | | | (12,775) | | | — | | | — | | | (26,491) | | Net result from derivative transactions | (11,939) | | | (4,309) | | | 0 | | | 0 | | | (16,248) | |
| Earnings (loss) from investment in unconsolidated joint ventures | Earnings (loss) from investment in unconsolidated joint ventures | — | | | — | | | 2,522 | | | — | | | 2,522 | | Earnings (loss) from investment in unconsolidated joint ventures | 0 | | | 0 | | | 912 | | | 0 | | | 912 | |
| | Gain (loss) on extinguishment of debt | Gain (loss) on extinguishment of debt | — | | | — | | | (1,070) | | | — | | | (1,070) | | Gain (loss) on extinguishment of debt | 0 | | | 0 | | | 0 | | | 21,077 | | | 21,077 | |
| Total other income (loss) | Total other income (loss) | 22,883 | | | (3,599) | | | 55,691 | | | 1,881 | | | 76,856 | | Total other income (loss) | (7,824) | | | (15,651) | | | 61,566 | | | 21,819 | | | 59,910 | |
| | Salaries and employee benefits | Salaries and employee benefits | — | | | — | | | — | | | (38,481) | | | (38,481) | | Salaries and employee benefits | 0 | | | 0 | | | 0 | | | (24,023) | | | (24,023) | |
| Operating expenses(3) | Operating expenses(3) | — | | | — | | | — | | | (11,413) | | | (11,413) | | Operating expenses(3) | 0 | | | 0 | | | 0 | | | (12,018) | | | (12,018) | |
| Real estate operating expenses | Real estate operating expenses | — | | | — | | | (11,506) | | | — | | | (11,506) | | Real estate operating expenses | 0 | | | 0 | | | (13,981) | | | 0 | | | (13,981) | |
| | Fee expense | Fee expense | (2,252) | | | (187) | | | (456) | | | — | | | (2,895) | | Fee expense | (2,664) | | | (133) | | | (618) | | | 0 | | | (3,415) | |
| Depreciation and amortization | Depreciation and amortization | — | | | — | | | (20,112) | | | (50) | | | (20,162) | | Depreciation and amortization | 0 | | | 0 | | | (19,775) | | | (50) | | | (19,825) | |
| Total costs and expenses | Total costs and expenses | (2,252) | | | (187) | | | (32,074) | | | (49,944) | | | (84,457) | | Total costs and expenses | (2,664) | | | (133) | | | (34,374) | | | (36,091) | | | (73,262) | |
| | Income tax (expense) benefit | Income tax (expense) benefit | — | | | — | | | — | | | 634 | | | 634 | | Income tax (expense) benefit | 0 | | | 0 | | | 0 | | | 5,091 | | | 5,091 | |
| Segment profit (loss) | Segment profit (loss) | $ | 133,997 | | | $ | 17,925 | | | $ | 5,659 | | | $ | (96,977) | | | $ | 60,604 | | Segment profit (loss) | $ | 59,601 | | | $ | (9,295) | | | $ | 7,209 | | | $ | (76,769) | | | $ | (19,254) | |
| | Total assets as of December 31, 2019 | $ | 3,358,861 | | | $ | 1,721,305 | | | $ | 1,096,514 | | | $ | 492,472 | | | $ | 6,669,152 | | |
| Total assets as of December 31, 2020 | | Total assets as of December 31, 2020 | $ | 2,343,070 | | | $ | 1,058,298 | | | $ | 1,031,557 | | | $ | 1,448,303 | | | $ | 5,881,229 | |
|
(1)Includes the Company’s investment in unconsolidated joint ventures that held real estate of $48.9$37.8 million and $48.4$46.3 million as of June 30, 20202021 and December 31, 2019,2020, respectively.
(2)Corporate/Other represents all corporate level and unallocated items including any intercompany eliminations necessary to reconcile to consolidated Company totals. This segment also includes the Company’s investment in unconsolidated joint ventures and strategic investments that are not related to the other reportable segments above, including the Company’s investment in FHLB stock of $61.6$13.0 million and $61.6$31.0 million as of June 30, 20202021 and December 31, 2019, respectively, the Company’s deferred tax asset (liability) of $(12.0) million and $(2.1) million as of June 30, 2020, and December 31, 2019, respectively, and the Company’s senior unsecured notes of $1.7$2.1 billion and $1.2$1.6 billion as of June 30, 20202021 and December 31, 2019,2020, respectively.
(3)Includes $4.0 million and $7.1 million of professional fees for the three and six months ended June 30, 2020, respectively. Includes $3.6 million and $6.1 million of professional fees for the three and six months ended June 30, 2019, respectively.
20. SUBSEQUENT EVENTS
The Company has evaluated subsequent events through the issuance date of the financial statements and determined that no additional disclosure is necessary.
Item 2. Management’s Discussion and Analysis of Financial Condition and Results of Operations
The following discussion and analysis of financial condition and results of operations should be read in conjunction with the consolidated financial statements and the related notes of Ladder Capital Corp included within this report and the Annual Report. This Management’s Discussion and Analysis of Financial Condition and Results of Operations contains forward-looking statements. See “Cautionary Statement Regarding Forward-Looking Statements” within this Quarterly Report and “Risk Factors” within the Annual Report for a discussion of the uncertainties, risks and assumptions associated with these statements. Actual results may differ materially from those contained in any forward-looking statements as a result of various factors, including but not limited to, those in “Risk Factors” set forth within the Annual Report.
References to “Ladder,” the “Company,” and “we,” “our” and “us” refer to Ladder Capital Corp, a Delaware corporation incorporated in 2013, and its consolidated subsidiaries.
Ladder Capital Corp is the sole general partner of Ladder Capital Finance Holdings LLLP (“LCFH”) and, as a result of the serialization of LCFH on December 31, 2014, became the sole general partner of Series REIT of LCFH. LC TRS I LLC, a wholly-owned subsidiary of Series REIT of LCFH, is the general partner of Series TRS of LCFH. Ladder Capital Corp has a controlling interest in Series REIT of LCFH, and through such controlling interest, also has a controlling interest in Series TRS of LCFH. Ladder Capital Corp’s only business is to act as the sole general partner of LCFH and Series REIT of LCFH, and, as a result of the foregoing, Ladder Capital Corp directly and indirectly operates and controls all of the business and affairs of LCFH, and each Series thereof, and consolidates the financial results of LCFH, and each Series thereof, into Ladder Capital Corp’s consolidated financial statements.
Overview
We areLadder Capital is an internally-managed real estate investment trust (“REIT”) that is a leader in commercial real estate finance. We originate and invest in a diverse portfolio of commercial real estate and real estate-related assets, focusing on senior secured assets. Our investment activities include: (i) direct originationour primary business of originating senior first mortgage fixed and floating rate loans collateralized by commercial real estate first mortgage loans;with flexible loan structures; (ii) investmentsinvesting in investment grade securities secured by first mortgage loans on commercial real estate; and (iii) investments in net leasedowning and otheroperating commercial real estate, equity.including net leased commercial properties. We believe that our in-house origination platform, ability to flexibly allocate capital among complementary product lines, credit-centric underwriting approach, access to diversified financing sources, and experienced management team position us well to deliver attractive returns on equity to our shareholders through economic and credit cycles.
Our businesses, including balance sheet lending, conduit lending, securities investments, and real estate investments, provide for a stable base of net interest and rental income. We have originated $25.8$26.7 billion of commercial real estate loans from our inception through June 30, 2020.2021. During this timeframe, we also acquired $12.7$12.8 billion of predominantly investment grade-rated securities secured by first mortgage loans on commercial real estate and $1.8$1.9 billion of selected net leased and other real estate assets.
As part of our commercial mortgage lending operations, we originate conduit loans, which are first mortgage loans on stabilized, income producing commercial real estate properties that we intend to make available for sale in commercial mortgage-backed securities (“CMBS”) securitizations. From our inception in October 2008 through June 30, 2020,2021, we originated $16.6$16.7 billion of conduit loans, $16.5 billion of which were$16.6 billion was sold into 6869 CMBS securitizations, making us, by volume, the second largest non-bank contributor of loans to CMBS securitizations in the United States in such period. Our sales of loans into securitizations are generally accounted for as true sales, not financings, and we generally retain no ongoing interest in loans which we securitize unless we are required to do so as issuer pursuant to the risk retention requirements of the Dodd-Frank Wall Street Reform and Consumer Protection Act of 2010, (the “Dodd-Frank Act”). The securitization of conduit loans enables us to reinvest our equity capital into new loan originations or allocate it to other investments.
As of June 30, 2020,2021, we had $6.6$5.6 billion in total assets and $1.5 billion of total equity. Our assets primarily included $3.0$2.6 billion of loans, $1.5$0.7 billion of securities, and $1.0$0.9 billion of real estate.estate, and $1.2 billion of unrestricted cash.
We maintain a diversified and flexible financing strategy supporting our investment strategy and overall business operations, including the use of unsecured debt, non-recourse, non-mark-to-market securitizations and significant committed term financing from leading financial institutions. Refer to “Our Financing Strategies” and “Liquidity and Capital Resources” for further information.
Ladder was founded in October 2008 and we completed our IPOinitial public offering (“IPO”) in February 2014. We are led by a disciplined and highly aligned management team. As of June 30, 2020,2021, our management team and directors held interests in our Company comprising 10.7%10.3% of our total equity. On average, our management team members have 2725 years of experience in the industry. Our management team includes Brian Harris, Chief Executive Officer; Pamela McCormack, President; Marc Fox,Paul J. Miceli, Chief Financial Officer; Robert Perelman, Head of Asset Management; and Kelly Porcella, Chief Administrative Officer & General Counsel. Kevin Moclair, Chief Accounting Officer, is an additional officer of Ladder. As of June 30, 2020,2021, we employed 6359 full-time industry professionals.
COVID-19 Impact on the Organization
On March 11, 2020, the World Health Organization declared the novel strain of coronavirus (“COVID-19”) a global pandemic and recommended containment and mitigation measures worldwide. As of the date of this filing, the majority of our employees continue to work remotely in compliance with state guidelines. We continue to actively manage the liquidity and operations of the Company in light of the market disruption and overall financial impact caused by the COVID-19 pandemic across most industries in the United States. In view of the ongoing uncertainty related to the severity and duration of the pandemic, its ultimate impact on our revenues, profitability and financial position is difficult to assess at this time. The Company has disclosed the current and potential impact of the COVID-19 global pandemic on our business throughout this Quarterly Report.
Recent Developments
None
Our Businesses
We invest primarily in loans, securities and other interests in U.S. commercial real estate, with a focus on senior secured assets. Our complementary business segments are designed to provide us with the flexibility to opportunistically allocate capital in order to generate attractive risk-adjusted returns under varying market conditions. The following table summarizes the carrying value of our investment portfolio as reported in our consolidated financial statements as of the dates indicated below ($ in thousands):
| | | | June 30, 2020 | | | December 31, 2019 | | | June 30, 2021 | | December 31, 2020 |
| Loans | Loans | | | | | | Loans | | | | | |
| Balance sheet loans: | Balance sheet loans: | | Balance sheet loans: | |
| Balance sheet first mortgage loans | Balance sheet first mortgage loans | $ | 2,832,610 | | | 42.8 | % | | $ | 3,127,173 | | | 46.9 | % | Balance sheet first mortgage loans | $ | 2,414,167 | | | 42.9 | % | | $ | 2,232,749 | | | 37.9 | % |
| Other commercial real estate-related loans | Other commercial real estate-related loans | 122,474 | | | 1.9 | % | | 129,863 | | | 1.9 | % | Other commercial real estate-related loans | 116,881 | | | 2.1 | % | | 121,310 | | | 2.1 | % |
| | Provision for current expected credit losses | (49,102) | | | (0.7) | % | | (20,500) | | | (0.3) | % | |
| Allowance for credit losses | | Allowance for credit losses | (35,891) | | | (0.6) | % | | (41,507) | | | (0.7) | % |
| Total balance sheet loans | Total balance sheet loans | 2,905,982 | | | 44.0 | % | | 3,236,536 | | | 48.5 | % | Total balance sheet loans | 2,495,157 | | | 44.4 | % | | 2,312,552 | | | 39.3 | % |
| Conduit first mortgage loans | Conduit first mortgage loans | 85,977 | | | 1.3 | % | | 122,325 | | | 1.8 | % | Conduit first mortgage loans | 59,182 | | | 1.1 | % | | 30,518 | | | 0.5 | % |
| Total loans | Total loans | 2,991,959 | | | 45.3 | % | | 3,358,861 | | | 50.3 | % | Total loans | 2,554,339 | | | 45.5 | % | | 2,343,070 | | | 39.8 | % |
| Securities | Securities | | | | | | | Securities | | | | | |
| CMBS investments | CMBS investments | 1,472,848 | | | 22.3 | % | | 1,673,468 | | | 25.3 | % | CMBS investments | 693,378 | | | 12.3 | % | | 1,025,514 | | | 17.4 | % |
| U.S. Agency Securities investments | 33,884 | | | 0.5 | % | | 34,857 | | | 0.5 | % | |
| U.S. Agency securities investments | | U.S. Agency securities investments | 25,826 | | | 0.5 | % | | 32,804 | | | 0.6 | % |
| | Equity securities | — | | | — | % | | 12,980 | | | 0.2 | % | |
| Provision for current expected credit losses | (19) | | | — | % | | — | | | — | % | |
| | Allowance for current expected credit losses | | Allowance for current expected credit losses | (20) | | | — | % | | (20) | | | — | % |
| Total securities | Total securities | 1,506,713 | | | 22.8 | % | | 1,721,305 | | | 26.0 | % | Total securities | 719,184 | | | 12.8 | % | | 1,058,298 | | | 18.0 | % |
| Real Estate | Real Estate | | | | | | | Real Estate | | | | | |
| Real estate and related lease intangibles, net | Real estate and related lease intangibles, net | 1,042,210 | | | 15.8 | % | | 1,048,081 | | | 15.7 | % | Real estate and related lease intangibles, net | 948,448 | | | 16.9 | % | | 985,304 | | | 16.8 | % |
| | Total real estate | Total real estate | 1,042,210 | | | 15.8 | % | | 1,048,081 | | | 15.7 | % | Total real estate | 948,448 | | | 16.9 | % | | 985,304 | | | 16.8 | % |
| Other Investments | Other Investments | | | | | | | Other Investments | | | | | |
| Investments in and advances to unconsolidated joint ventures | Investments in and advances to unconsolidated joint ventures | 48,919 | | | 0.7 | % | | 48,433 | | | 0.7 | % | Investments in and advances to unconsolidated joint ventures | 37,819 | | | 0.7 | % | | 46,253 | | | 0.8 | % |
| FHLB stock | 61,619 | | | 0.9 | % | | 61,619 | | | 0.9 | % | |
| | Total other investments | Total other investments | 110,538 | | | 1.6 | % | | 110,052 | | | 1.6 | % | Total other investments | 37,819 | | | 0.7 | % | | 46,253 | | | 0.8 | % |
| Total investments | Total investments | 5,651,420 | | | 85.5 | % | | 6,238,299 | | | 93.6 | % | Total investments | 4,259,790 | | | 76.0 | % | | 4,432,925 | | | 75.9 | % |
| Cash, cash equivalents and restricted cash | Cash, cash equivalents and restricted cash | 874,004 | | | 13.2 | % | | 355,746 | | | 5.3 | % | Cash, cash equivalents and restricted cash | 1,285,687 | | | 22.9 | % | | 1,284,284 | | | 21.8 | % |
| Other assets | Other assets | 84,126 | | | 1.3 | % | | 75,107 | | | 1.1 | % | Other assets | 71,332 | | | 1.3 | % | | 164,020 | | | 2.8 | % |
| Total assets | Total assets | $ | 6,609,550 | | | 100.0 | % | | $ | 6,669,152 | | | 100.0 | % | Total assets | $ | 5,616,809 | | | 100 | % | | $ | 5,881,229 | | | 100 | % |
While theThe unique nature of COVID-19 limits our normal visibility into expected underlying property operating results, we are in regular communication with our borrowers and are closely monitoring property performance. We expect our investments in loans andhas had a broad impact on commercial real estate, inspecifically the hotelshotel and retail sectors to be the most directly impacted by COVID-19.sectors. Loans on hotel and retail properties comprised approximately13.6%approximately 11.6% and 8.8%7.7%, respectively, of our loan portfolio at June 30, 2020.2021. Hotel and retail properties comprised approximately 5.9%6.0% and 47.2%46.0%, respectively, of our real estate portfolio at June 30, 2020. The majority of the net leased properties in our real estate portfolio, which comprise2020; however, the majority of the 47.2%,our retail properties are necessity-based businesses and have remained open and stable during the COVID-19 pandemic.
We are in regular communication with our borrowers and tenants and are closely monitoring property performance.
Loans
Balance Sheet First Mortgage Loans. We originate and invest in balance sheet first mortgage loans secured by commercial real estate properties that are typically undergoing transition, including lease-up, sell-out, and renovation or repositioning. These mortgage loans are structured to fit the needs and business plans of the property owners, and generally have LIBOR basedLIBOR-based floating rates and terms (including extension options) ranging from one to five years. Our loans are directly originated by an internal team that has longstanding and strong relationships with borrowers and mortgage brokers throughout the United States. We follow a rigorous investment process, which begins with an initial due diligence review; continues through a comprehensive legal and underwriting process incorporating multiple internal and external checks and balances; and culminates in approval or disapproval of each prospective investment by our Investment Committee. Balance sheet first mortgage loans in excess of $50.0 million also require the approval of our board of directors’ Risk and Underwriting Committee.
We generally seek to hold our balance sheet first mortgage loans for investment although we also maintain the flexibility to contribute such loans into a collateralized loan obligation (“CLO”) or similar structure, sell participation interests or “b-notes” in our mortgage loans or sell such mortgage loans as whole loans. Our balance sheet first mortgage loans have been typically repaid at or prior to maturity (including by being refinanced by us into a new conduit first mortgage loan upon property stabilization). As of June 30, 2020,2021, we held a portfolio of 13393 balance sheet first mortgage loans with an aggregate book value of $2.8$2.4 billion. Based on the loan balances and the “as-is” third-party Financial Institutions Reform, Recovery and Enforcement Act of 1989 (“FIRREA”) appraised values at origination, the weighted average loan-to-value ratio of this portfolio was 70.8%68.2% at June 30, 2020.2021.
We continue to actively manage and monitor the credit and liquidity risk associated with the balance sheet first mortgage loan portfolio. Due to the nationwide restrictionslimitations initially placed on mostmany businesses in response to the COVID-19 pandemic, significant cash flow disruptions are expectedhave occurred across the economy, which have impacted and likely will likelycontinue to impact certain of our borrowersborrowers. We have used, and their ability to stay current with their debt obligations in the near term. We expectcontinue to use, a variety of legal and structural options to manage that risk effectively, including through possible forbearance and default provisions, as is generally being consideredutilized throughout the credit lending industries.
Other Commercial Real Estate-Related Loans. We selectively invest in note purchase financings, subordinated debt, mezzanine debt and other structured finance products related to commercial real estate that are generally held for investment. As of June 30, 2020,2021, we held a portfolio of 2423 other commercial real estate-related loans with an aggregate book value of $122.5$116.9 million. Based on the loan balance and the “as-is” third-party FIRREA appraised values at origination, the weighted average loan-to-value ratio of the portfolio was 67.2%67.6% at June 30, 2020.2021.
Conduit First Mortgage Loans. We also originate conduit loans, which are first mortgage loans that are secured by cash-flowing commercial real estate and are available for sale to securitizations. These first mortgage loans are typically structured with fixed interest rates and generally have five- to ten-year terms. Conduit first mortgage loans are originated, underwritten, approved and funded using the same comprehensive legal and underwriting approach, process and personnel used to originate our balance sheet first mortgage loans. Conduit first mortgage loans in excess of $50.0 million also require approval of our board of directors’ Risk and Underwriting Committee.
Although our primary intent is to sell our conduit first mortgage loans to CMBS trusts, we generally seek to maintain the flexibility to keep them on our balance sheet, sell participation interests or “b-notes” in such loans or sell the loans as whole loans. As of June 30, 2020,2021, we held sevensix first mortgage loans that were available for contribution into a securitization with an aggregate book value of $86.0$59.2 million. Based on the loan balances and the “as-is” third-party FIRREA appraised values at origination, the weighted average loan- to-value ratio of this portfolio was 61.5%64.4% at June 30, 2020.2021. The Company holds these conduit loans in its taxable REIT subsidiary (“TRS”).
The following charts set forth our total outstanding balance sheet first mortgage loans, other commercial real estate-related loans, mortgage loans transferred but not considered sold and conduit first mortgage loans as of June 30, 20202021 and a breakdown of our loan portfolio by loan size and geographic location and asset type of the underlying real estate.
Securities
CMBS Investments. We invest in CMBS, including CRE CLOs, secured by first mortgage loans on commercial real estate and own predominantly AAA-rated securities. These investments provide a stable and attractive base of net interest income and help us manage our liquidity. We have significant in-house expertise in the evaluation and trading of CMBS,these securities, due in part to our experience in originating and underwriting mortgage loans that comprise assets within CMBS trusts, as well as our experience in structuring CMBS transactions. AAA-rated CMBS or U.S. Agency securities investments in excess of $76.0 million and all other investment grade CMBS or U.S. Agency securities investments in excess of $51.0 million, each in any single class of any single issuance, require the approval of our board of directors’ Risk and Underwriting Committee. The Risk and Underwriting Committee also must approve any investments in non-rated or sub-investment grade CMBS or U.S. Agency Securitiessecurities in any single class of any single issuance in excess of the lesser of (x) $21,000,000$21.0 million and (y) 10% of the total net asset value of the respective Ladder investment company.
As of June 30, 2020, the estimated fair value of our portfolio of CMBS investments totaled $1.5 billion in 126 CUSIPs ($11.7 million average investment per CUSIP). As of June 30, 2020, included in the $1.5 billion of CMBS securities are $11.8 million of CMBS securities designated as risk retention securities under the Dodd-Frank Act which are subject to transfer restrictions over the term of the securitization trust. As of that date, 99.8% of our CMBS investments were rated investment grade by Standard & Poor’s Ratings Group, Moody’s Investors Service, Inc. or Fitch Ratings Inc., consisting of 81% AAA/Aaa-rated securities and 18.8% of other investment grade-rated securities, including 14.1% rated AA/Aa, 2.7% rated A/A and 2.0% rated BBB/Baa. In the future, we may invest in CMBS securities or other securities that are unrated. As of June 30, 2020, our CMBS investments had a weighted average duration of 2.3 years. The commercial real estate collateral underlying our CMBS investment portfolio is located throughout the United States. As of June 30, 2020, by property count and market value, respectively, 52.3% and 72.8% of the collateral underlying our CMBS investment portfolio was distributed throughout the top 25 metropolitan statistical areas (“MSAs”) in the United States, with 7.6% and 34.9%, by property count and market value, respectively, of the collateral located in the New York-Newark-Edison MSA, and the concentrations in each of the remaining top 24 MSAs ranging from 0.2% to 4.9% by property count and 0.2% to 9.7% by market value.
U.S. Agency Securities Investments. Our U.S. Agency Securities portfolio consists of securities for which the principal and interest payments are guaranteed by a U.S. government agency, such as the Government National Mortgage Association (“GNMA”), or by a government-sponsored enterprise (“GSE”), such as the Federal National Mortgage Association (“Fannie Mae”) or the Federal Home Loan Mortgage Corporation (“Freddie Mac”). In addition, these securities are secured by first mortgage loans on commercial real estate. Investments in U.S. Agency Securities are subject to the same Risk and Underwriting Committee approval requirements as CMBS investments, as described above. As of June 30, 2020, the estimated fair value of our portfolio of U.S. Agency Securities was $33.9 million in 22 CUSIPs ($1.5 million average investment per CUSIP), with a weighted average duration of 2.4 years. The commercial real estate collateral underlying our U.S. Agency Securities portfolio is located throughout the United States. As of June 30, 2020, by market value, 76% and 20.4% of the collateral underlying our U.S. Agency Securities, excluding the collateral underlying our Agency interest-only securities, was located in New York and California, respectively, with no other state having a concentration greater than 10.0%. By property count, California represented 75.9% and New York represented 3.4% of such collateral. While the specific geographic concentration of our Agency interest-only securities portfolio as of June 30, 2020 is not obtainable, risk relating to any such possible concentration is mitigated by the interest payments of these securities being guaranteed by a U.S. government agency or a GSE.
Corporate Bonds. In addition to CMBS and U.S. Agency Securities, we invest in other debt securities, including, but not limited to, debt securities issued by REITs and real estate companies. Approval of our board of directors’ Risk and Underwriting Committee is required for the aggregate investments in such debt securities made and owned by all Ladder investment companies to exceed $80.0 million. As of June 30, 2020, we had no investments in debt securities.
Equity Securities. We invest in real estate related equity investments. Approval of our board of directors’ Risk and Underwriting Committee is required for the aggregate real estate related equity investments made and owned by all Ladder investment companies to exceed $20.0 million. As of June 30, 2020, we had no investments in debt securities.
Since the onset of the COVID-19 pandemic, there has been a decrease in liquidity and trading activity for the real estate securities we own. The Company invests in primarily AAA-rated real estate securities, typically front pay securities, with relatively short duration and significant subordination. The hyperamortization features included in many of the securities positions we own help mitigate potential credit losses even in the current market conditions. At the onset of the COVID-19 pandemic in March 2020, there was a significant decrease in liquidity and trading activity for the real estate securities we own. During the three months ended June 30, 2020,2021, liquidity and trading activity begancontinued to return to the market and the value of our securities portfolio as of June 30, 20202021 had an unrealized mark-to-market gain of $11.8$8.2 million.
As of June 30, 2021, the estimated fair value of our portfolio of CMBS investments totaled $693.4 million in 86 CUSIPs ($8.1 million average investment per CUSIP). As of June 30, 2021, included in the $693.4 million of CMBS securities are $11.6 million of CMBS securities designated as risk retention securities under the Dodd-Frank Act which are subject to transfer restrictions over the term of the securitization trust. The following chart summarizes our securities investments, 99.5% of which were rated investment grade by Standard & Poor’s Ratings Group, Moody’s Investors Service, Inc. or Fitch Ratings Inc. as of June 30, 2021:
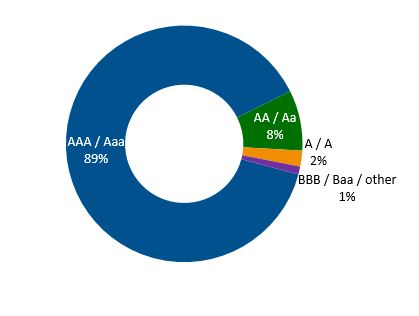
In the future, we may invest in CMBS securities or other securities that are unrated. As of June 30, 2021, our CMBS investments had a weighted average duration of 2.1 years. The commercial real estate collateral underlying our CMBS investment portfolio is located throughout the United States. As of June 30, 2021, by property count and market value, respectively, 59.4% and 76.3% of the collateral underlying our CMBS investment portfolio was distributed throughout the top 25 metropolitan statistical areas (“MSAs”) in the United States, with 11.7% and 44.5%, by property count and market value, respectively, of the collateral located in the New York-Newark-Edison MSA, and the concentrations in each of the remaining top 24 MSAs ranging from 0.2% to 6.1% by property count and 0.1% to 8.8% by market value.
Real Estate
Net Leased Commercial Real Estate Properties. As of June 30, 2020,2021, we owned 164165 single tenant net leased properties with an aggregate book value of $664.6$642.5 million. These properties are fully leased on a net basis where the tenant is generally responsible for payment of real estate taxes, property, building and general liability insurance and property and building maintenance expenses. As of June 30, 2020,2021, our net leased properties comprised a total of 5.4 million square feet, 100% leased with an average age since construction of 15.516.2 years and a weighted average remaining lease term of 11.910.8 years. Commercial real estate investments in excess of $20.0 million require the approval of our board of directors’ Risk and Underwriting Committee. The majority of the net leased properties in our real estate portfolio are necessity-based businesses and have remained open and stable during the COVID-19 pandemic. During the three months ended June 30, 2020,2021, we collected 100% of rent on these properties.
Diversified Commercial Real Estate Properties. In addition, asAs of June 30, 2020,2021, we owned 6462 diversified commercial real estate properties with an aggregate book value of $376.7 million. Through separate joint ventures, we own a 40 property student housing portfolio in Isla Vista, CA with a book value of $82.1 million and an occupancy rate of 100.0%, a portfolio of 11 office buildings in Richmond, VA with a book value of $72.4 million with a 82.6% occupancy rate, an apartment complex in Miami, FL with a book value of $37.3 million and an occupancy rate of 91.3%, an unleased industrial building in Lithia Springs, GA with an aggregate book value of $23.3 million, a portfolio of two student housing properties in Fort Worth and Arlington, TX with an aggregate book value of $23.3 million and a 70.2% occupancy rate, one hotel in San Diego, CA with a book value of $40.9 million and a 40.9% occupancy rate, and a 13-story office building in Oakland County, MI with a book value of $9.6 million and an 68.9% occupancy rate. We also own a single-tenant office building in Ewing, NJ with a book value of $26.3 million, a development property in Los Angeles, CA with a book value of $21.5 million, a hotel in Omaha, NE with a book value of $17.1 million, a single-tenant office building in Crum Lynne, PA with a book value of $9.7 million, a shopping center in Carmel, NY with a book value of $5.9 million and a 44.4% occupancy rate, a hotel in Winston Salem, NC with a book value of $3.9 million and a 36.4% occupancy rate and an office building in Peoria, IL with a book value of $3.4 million and a 45.6% occupancy rate.throughout the U.S. During the three months ended June 30, 2020,2021, we collected approximately 95%97.2% of rent on these properties.
Residential Real Estate. We sold three condominium units at Terrazas River Park Village in Miami, FL, duringThe following charts summarize the six months ended June 30, 2020, generating aggregate gains on salecomposition of $7 thousand. Asour real estate investments as of June 30, 2020, we own three residential condominium units at Terrazas River Park Village in Miami, FL with a book value of $0.9 million, and we intend to sell these remaining units in less than 18 months. The Company holds these residential condominium units in a TRS.2021:
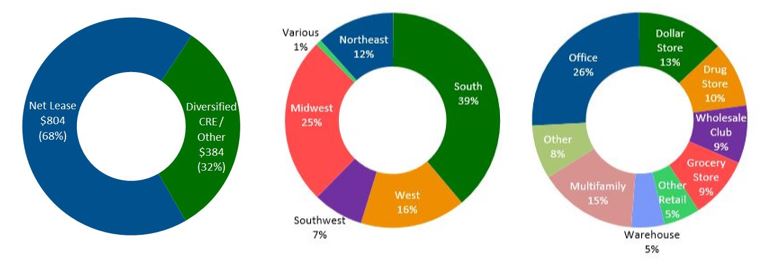
The recent market volatilityconditions due to the COVID-19 pandemic has brought illiquidity in most asset classes, includingand the resulting economic disruption have broadly impacted the commercial real estate. The Company expectsestate sector. As expected, the net leased commercial real estate properties, which comprise the majority of our portfolio, to remainhave remained minimally impacted as the majority of the net leased properties in our real estate portfolio are necessity-based businesses and have remained open and stable during the COVID-19 pandemic. We continue to actively monitor our diversified commercial real estate properties as well to determine the immediate and long termlong-term impacts on the buildings, tenants, business plans and the ability to execute those business plans.
Other Investments
Unconsolidated Joint Venture. In connection with the origination of a loan in April 2012, we received a 25% equity interest with the right to convert upon a capital event. On March 22, 2013, we refinanced the loan, and we converted our equity interest into a 19% limited liability company membership interest in Grace Lake JV, LLC (“Grace Lake LLC”). As of June 30, 2020,2021, Grace Lake LLC owned an office building campus with a carrying value of $51.2$49.9 million, which is net of accumulated depreciation of $34.1$38.9 million, that is financed by $62.9$60.2 million of long-term debt. Debt of Grace Lake LLC is non-recourse to the limited liability company members, except for customary non-recourse carve-outs for certain actions and environmental liability. As of June 30, 2020,2021, the book value of our investment in Grace Lake LLC was $3.5$4.6 million.
Unconsolidated Joint Venture. On August 7, 2015, the Company entered into a joint venture, 24 Second Avenue Holdings LLC (“24 Second Avenue”), with an Operating Partneroperating partner (the “Operating Partner”) to invest in a ground-up residential/retail condominium development and construction project located at 24 Second Avenue, New York, NY.
During the three months ended March 31, 2019, the Company converted its existing $35.0 million common equity interest into a $35.0 million priority preferred equity position. The Company also provided $50.4 million in first mortgage financing in order to refinance the existing $48.1 million first mortgage construction loan which was made by another lending institution. In addition to the new $50.4 million first mortgage loan, the Company also funded a $6.5 million mezzanine loan for use in completing the project. The Operating Partner must fully fund any and all additional capital for necessary expenses.
Due to the Company’s non-controlling equity interest in 24 Second Avenue, the Company accounts for the new loans as additional investments in the joint venture.
24 Second Avenue consists of 30 residential condominium units and one commercial condominium unit. 24 Second Avenue started closing on the existing sales contracts during the quarter ended March 31, 2019, upon receipt of New York City Building Department approvals and a temporary certificate of occupancy for a portion of the project. As of June 30, 2020,2021, 24 Second Avenue had sold 1924 residential condominium units for $49.6$62.7 million in sales proceeds. As of June 30, 2020,2021, the Company had no remaining additional capital commitment to 24 Second Avenue. As of June 30, 2020,Avenue and the book value of the Company’s investment in 24 Second Avenue was $45.4$33.2 million.
Our Financing Strategies
Our financing strategies are critical to the success and growth of our business. We manage our financing to complement our asset composition and to diversify our exposure across multiple capital markets and counterparties. In addition to cash flow from operations, we fund our operations and investment strategy through a diverse array of funding sources, including:
•Unsecured corporate bonds
•Secured loan and securities repurchase facilities
•Loan sales and securitizations
•Secured financing facility
•CLO transactions
•Non-recourse mortgage debt
•Revolving credit facility
•FHLB financing
•Revolving credit facilityLoan sales and securitizations
•Unencumbered assets available for financing
•Equity
From time to time, we may add financing counterparties that we believe will complement our business, although the agreements governing our indebtedness may limit our ability and the ability of our present and future subsidiaries to incur additional indebtedness. Our amended and restated charter and by-laws do not impose any threshold limits on our ability to use leverage. Refer to “Management’s Discussion and Analysis of Financial Condition and Results of Operations—Liquidity and Capital Resources” and Note 7 Debt Obligations, Net in our consolidated financial statements included elsewhere in this Quarterly Report for more information about our financing arrangements.
Unsecured Corporate Bonds
As of June 30, 2020,2021, we had $1.7$2.1 billion of unsecured corporate bonds outstanding. These unsecured financings were comprised of $258.5 million in aggregate principal amount of 5.875% senior notes due 2021 (the “2021 Notes”), $485.6$465.9 million in aggregate principal amount of 5.25% senior notes due 2022 (the “2022 Notes”), $350.8$348.0 million in aggregate principal amount of 5.25% senior notes due 2025 (the “2025 Notes”) and $658.0$651.8 million in aggregate principal amount of 4.25% senior notes due 2027 (the “2027 Notes”) and $650.0 million in aggregate principal amount of 4.75% senior notes due 2029 (the “2029 Notes,” collectively with the 2021 Notes, the 2022 Notes, the 2025 Notes, and the 20252027 Notes, the “Notes”). During the six months ended June 30, 2020, we repurchased an aggregate principal of2021, the Company redeemed in full its remaining $146.7 million 5.875% Senior Notes of $163.4 million, recognizing an aggregate gain on extinguishment of debt of $19.3 million. Refer to Note 7 to the Consolidated Financial Statements for further detail.due 2021.
Due in large part to devoting such a large portion of the Company’s capital structure to equity and unsecured corporate bond debt, Ladder maintains a $2.7$3.3 billion pool of unencumbered assets, comprised primarily of first mortgage loans and unrestricted cash as of June 30, 2020.2021.
Committed Loan Financing Facilities
We are parties to multiple committed loan repurchase agreement facilities, totaling $1.6$1.2 billion of credit capacity. As of June 30, 2020,2021, the Company had $381.1$218.4 million of borrowings outstanding, with an additional $1.2 billion$981.6 million of committed financing available. Assets pledged as collateral under these facilities are generally limited to first mortgage whole mortgage loans, mezzanine loans and certain interests in such first mortgage and mezzanine loans. Our repurchase facilities include covenants covering net worth requirements, minimum liquidity levels, and maximum debt/equity ratios.
We have the option to extend some of our existing facilities subject to a number of customary conditions. The lenders have sole discretion with respect to the inclusion ofinclude collateral in these facilities and to determine the market value of the collateral on a daily basis, and, if the estimated market value of the included collateral declines, the lenders have the right to require additional collateral or a full and/or partial repayment of the facilities (margin call), sufficient to rebalance the facilities. Typically, the lender establishes a maximum percentage of the collateral asset’s market value that can be borrowed. We often borrow at a lower percentage of the collateral asset’s value than the maximum, leaving us with excess borrowing capacity that can be drawn upon at a later date and/or applied against future margin calls so that they can be satisfied on a cashless basis.
Collateralized Loan Obligation (“CLO”) Debt
On April 27, 2020, a consolidated subsidiary of the Company completed a private CLO transaction with a major U.S. bank which generated $310.2 million of gross proceeds to Ladder, financing $481.3 million of loans (“Contributed Loans”) at a 64.5% advance rate on a matched term, non-mark-to-market and non-recourse basis. A consolidated subsidiary of the Company retained a 35.5% subordinate and controlling interest in the CLO. The Company retained control over major decisions made with respect to the administration of the Contributed Loans, including broad discretion in managing these loans, and has the ability to appoint the special servicer under the CLO. The CLO is a Variable Interest Entity (“VIE”) and the Company was the primary beneficiary and, therefore, consolidated the VIE - See Note 10, Consolidated Variable Interest Entities.
As of June 30, 2021, the Company had $168.8 million of matched term, non-mark-to-market and non-recourse basis CLO debt included in debt obligations on its consolidated balance sheets. Unamortized debt issuance costs of $0.9 million were included in CLO debt as of June 30, 2021.
On July 13, 2021, a consolidated subsidiary of the Company completed a public CLO transaction with a major U.S. bank, which generated $498.2 million of gross proceeds to Ladder, financing $607.5 million of loans (“Contributed Loans”) at an 82% advance rate on a matched term, non-mark-to-market and non-recourse basis. A consolidated subsidiary of the Company retained an 18% subordinate and controlling interest in the CLO. The Company retained control over major decisions made with respect to the administration of the Contributed Loans, including broad discretion in managing these loans, and has the ability to appoint the special servicer under the CLO.
Securities Repurchase Facilities
We are a party to a committed term master repurchase agreement with a major U.S. banking institution for CMBS, totaling $400.0 million of credit capacity, or more depending on our utilization of a loan repurchase facility with the same lender. As we do in the case of borrowings under committed loan facilities, we often borrow at a lower percentage of the collateral asset’s value than the maximum, leaving us with excess borrowing capacity that can be drawn upon at a later date and/or applied against future margin calls so that they can be satisfied on a cashless basis. As of June 30, 2020,2021, the Company had $451.3$62.9 million borrowings outstanding, with an additional $334.0$727.8 million of committed financing available.
Additionally, we are a party to multiple uncommitted master repurchase agreements with several counterparties to finance our investments in CMBS and U.S. Agency Securities.securities. The securities that served as collateral for these borrowings are typically AAA-rated CMBS with relatively short duration and significant subordination. The lenders have sole discretion to determine the market value of the collateral on a daily basis, and, if the estimated market value of the collateral declines, the lenders have the right to require additional cash collateral, and ifcollateral. If the estimated market value of the collateral subsequently increases, we have the right to call back excess cash collateral.
Revolving Credit Facility
The Company’s revolving credit facility (the “Revolving Credit Facility”) provides for an aggregate maximum borrowing amount of $266.4 million, including a $25.0 million sublimit for the issuance of letters of credit. The Revolving Credit Facility is available on a revolving basis to finance the Company’s working capital needs and for general corporate purposes. On November 25, 2019, the Company amended theThe Revolving Credit Facility to add two additional one-year extension options, extending thehas a final maturity date, includingassuming all extension options toare exercised, of February 2025. The amendment also provided for a reduction in the interest rate to one-month LIBOR plus 3.00% on Eurodollar advances upon the upgrade of the Company’s credit ratings, which occurred in January 2020. As of June 30, 2021, the Company had no outstanding borrowings on the Revolving Credit Facility.
The obligations under the Revolving Credit Facility are guaranteed by the Company and certain of its subsidiaries. The Revolving Credit Facility is secured by a pledge of the shares of (or other ownership or equity interests in) certain subsidiaries to the extent the pledge is not restricted under existing regulations, law or contractual obligations.
LCFH is subject to customary affirmative covenants and negative covenants, including limitations on the incurrence of additional debt, liens, restricted payments, sales of assets and affiliate transactions under the Revolving Credit Facility. In addition, under the Revolving Credit Facility, LCFH is required to comply with financial covenants relating to minimum net worth, maximum leverage, minimum liquidity, and minimum fixed charge coverage, consistent with our other credit facilities.
FHLB Financing
We have maintained membership in the FHLB since 2012 through our subsidiary, Tuebor Captive Insurance Company LLC (“Tuebor”). In 2016, the FHFA adopted a final rule that limited our captive insurance subsidiary’s membership in the FHLB, requiring us to significantly reduce the amounts of FHLB borrowings outstanding by February 2021. The Company has complied with such targeted paydowns. Refer to “Management’s Discussion and Analysis of Financial Condition and Results of Operations - Liquidity and Capital Resources - FHLB financing” for further information. As of June 30, 2020,2021, Tuebor had $360.8$288.0 million of borrowings outstanding from the FHLB, (with an additional $1.1 billion of committed term financing available), with terms of overnight to 4.33.3 years, interest rates of 0.44%0.36% to 2.95%2.74%, and advance rates of 45.0%71.7% to 100%95.7% on eligible collateral, including cash collateral. As of June 30, 2020,2021, collateral for the borrowings was comprised of $315.4$236.1 million of CMBS and U.S. Agency Securities. $0.1securities, and $83.5 million of cash and $210.7 million of first mortgage commercial real estate loans. The weighted-average borrowings outstanding were $828.0 million for the six months ended June 30, 2020. FHLB advances amounted to 7.3% of the Company’s outstanding debt obligations as of June 30, 2020.collateral.
Mortgage Loan Financing
We generally finance our real estate using long-term non-recourse mortgage financing. During the six months ended June 30, 2020,2021, we executed fivedid not execute any term debt agreements to finance real estate. All of our mortgage loan financings have fixed rates ranging from 3.75% to 6.75%6.16%, mature between 2020 - 20302021-2030 and total $805.4$746.0 million atas of June 30, 2020.2021. These long-term non-recourse mortgages include net unamortized premiums of $5.0$3.9 million at June 30, 2020,2021, representing proceeds received upon financing greater than the contractual amounts due under the agreements. The premiums are being amortized over the remaining life of the respective debt instruments using the effective interest method. We recorded $0.6$0.7 million of premium amortization, which decreased interest expense, for the six months ended June 30, 2020.2021. The loans are collateralized by real estate and related lease intangibles, net, of $959.8$874.9 million as of June 30, 2020.2021.
Secured Financing Facility
On April 30, 2020, the Company entered into a strategic financing arrangement (the “Agreement”) with an American multinational corporation (the “Lender”), under which the Lender will provideprovided the Company with approximately $206.4 million in senior secured financing (the “Secured Financing Facility”) to fund transitional and land loans. The Secured Financing Facility will beis secured on a first lien basis on a portfolio of certain of the Company’s loans and will mature on May 6, 2023, and borrowings thereunder will bear interest at LIBOR (or a minimum of 0.75% if greater) plus 10.0%, with a minimum interest premium clause, of which approximately $39.2$13.9 million minus the aggregate sum of all interest payments made under the Secured Financing Facility prior to the date of payment of the minimum interest premium, which is payable upon the earlier of maturity or repayment in full of the loan.remains. The Senior Financing Facility is non-recourse, subject to limited exceptions, and does not contain mark-to-market provisions. Additionally, the Senior Financing Facility provides the Company optionality to modify or restructure loans or forbear in exercising remedies, which maximizes the Company’s financial flexibility.
As part of the strategic financing, the Lender also hashad the ability to make an equity investment in the Company of up to 4.0 million Class A common shares at $8.00 which amount and price may be proportionally adjusted in the event of equity distributions, stock splits, reclassifications and other similar eventsper share, subject to certain adjustments (the “Purchase Right”). The Purchase Right will expirewas exercised in full at $8.00 per share on December 31,27, 2020. The Company expects that any such investment would additionally benefit its liquidity position.
Pursuant to the Purchase Right, the Lender has agreed to a customary standstill until December 31, 2020 or the date on which the Lender has exercised the Purchase Right in full, if earlier. In addition, theThe Lender has agreed not to sell, transfer, assign, pledge, hypothecate, mortgage, dispose of or in any way encumber the shares acquired as a result of exercising the Purchase Right for a period of time following the exercise date. In connection with the issuance of the Purchase Right, the Company and the Lender entered into a registration rights agreement, pursuant to which the Company has agreed to provide customary demand and piggyback registration rights to the Lender.
As of June 30, 2020,2021, the Company had $188.7$152.1 million of borrowings outstanding under the secured financing facilitySecured Financing Facility included in debt obligations on its consolidated balance sheets. Unamortizedsheets, net unamortized debt issuance costs of $9.7$4.5 million were included in secured financing facility as of June 30, 2020.and a $4.7 million unamortized discount related to the Purchase Right.
Collateralized Loan Obligation (“CLO”) Debt
On April 27, 2020, a consolidated subsidiary of the Company completed a private CLO transaction with a major U.S. bank which generated $310.2 million of gross proceeds to Ladder, financing $481.3 million of loans (“Contributed Loans”) at a 64.5% advance rate on a matched term, non-mark-to-market and non-recourse basis. A consolidated subsidiary of the Company will retained a 35.5% subordinate and controlling interest in the CLO. The Company retained control over major decisions made with respect to the administration of the Contributed Loans, including broad discretion in managing these loans in light of the COVID-19 pandemic, and has the ability to appoint the special servicer under the CLO. The Company retained control over major decisions made with respect to the administration of the Contributed Loans and has the ability to appoint the special servicer under the CLO. The CLO is a VIE and the Company was the primary beneficiary and, therefore, consolidated the VIE - See Note 10, Consolidated Variable Interest Entities. Proceeds from the transaction were used to pay off other secured debt including bank and FHLB financing that was subject to mark-to-market provisions.
As of June 30, 2020, the Company had $299.6 million of matched term, non-mark-to-market and non-recourse basis CLO debt included in debt obligations on its consolidated balance sheets. Unamortized debt issuance costs of $4.8 million were included in CLO debt as of June 30, 2020.
Hedging Strategies
We enter into interest rate and credit spread derivative contracts to mitigate our exposure to changes in interest rates and credit spreads. We generally seek to hedge the interest rate risk on the financing of assets that have a duration longer than five years, including newly-originated conduit first mortgage loans, securities in our CMBS portfolio if long enough in duration, and most of our U.S. Agency Securitiessecurities portfolio. We monitor our asset profile and our hedge positions to manage our interest rate and credit spread exposures, and we seek to match fund our assets according to the liquidity characteristics and expected holding periods of our assets.
Financing Strategy in Current Market Conditions
In March 2020, as the COVID-19 health crisis rapidly transformed into a financial crisis, management took swift action to increase liquidity resources and actively manage its financing arrangements with its bank partners. In an abundance of caution, the Company first drew down on its $266.4 million unsecured revolving credit facility, which continues to be fully-drawn, and the proceeds continue to be held as unrestricted cash on the Company’s balance sheet as of July 30, 2020.
Securities Repurchase Facilities: The Company invests in AAA-rated CRE CLO securities, typically front pay securities, with relatively short duration and significant subordination. These securities have historically been financed with short-term maturity, repurchase agreements with various bank counterparties. The Company has been able to continue to access securities repurchase funding and the pricing of such borrowings has improved during the three months ended June 30, 2020 as liquidity returned to the market and pricing for the securities that serve as collateral improved. Furthermore, during the three months ended June 30, 2020, the Company paid down $275.8 million of securities repurchase financing, primarily through sales of securities. As of July 27, 2020, the Company has $834.4 million outstanding of securities repurchase financing with maturities ranging from 3 days to 17 months.
Federal Home Loan Bank (“FHLB”) Financing: As discussed in the Company’s Annual Report, in 2016, the FHFA adopted a final rule that limited our captive insurance subsidiary’s membership in the FHLB, requiring us to significantly reduce the amounts of FHLB borrowings outstanding by February of 2021.
During the three months ended June 30, 2020, the Company paid down FHLB borrowings of $646.8 million, with $360.8 million outstanding as of July 27, 2020. The remaining maturities are staggered out through 2024. Funding for future advance paydowns would be obtained from the natural amortization of securities over time, loan pay offs and/or sales of loan and securities collateral. The Company incurred $6.5 million in prepayment penalties related to this paydown of FHLB borrowings.
Loan Repurchase Financing: The Company has maintained a consistent dialogue with its loan financing counterparties since the COVID-19 crisis began to unfold in late March 2020. In addition to using proceeds from the Company’s 2027 Notes offering in January to reduce secured debt, during the three months ended June 30, 2020, the Company paid down over $155.9 million on such loan repurchase financing through loan collateral pay offs and loans securitized through a CLO financing transaction (see above).
As of July 27, 2020, the Company had $374.9 million of loan repurchase debt outstanding with five separate bank counterparties. The Company continues to maintain an active dialogue with its bank counterparties as it expects loan collateral on each of their lines to experience some measure of forbearance.
Secured Financing Facility: On April 30, 2020, the Company entered into a strategic financing arrangement (the “Agreement”) with an American multinational corporation (the “Lender”), under which the Lender will provide the Company with approximately $206.4 million in senior secured financing (the “Secured Financing Facility”) to fund transitional and land loans (see above).
Completion of Private CLO: On April 27, 2020, the Company completed a private CLO financing transaction with a major U.S. bank which generated $310.2 million of gross proceeds, financing $481.3 million of loans at a 64.5% advance rate on a matched term, non-mark-to-market and non-recourse basis (see above).
As a result of our financing and liquidity measures implemented to date in direct response to the COVID-19 pandemic, as of July 27, 2020, Ladder had over $750.0 million of unrestricted cash on hand and based on the financing actions described above, the Company has significantly decreased its exposure to mark-to-market financing.
Financial Covenants
We generally seek to maintain a debt-to-equity ratio of approximately 3.0:1.0 or below. We expect this ratio to fluctuate during the course of a fiscal year due to the normal course of business in our conduit lending operations, in which we generally
securitize our inventory of conduit loans at intervals, and also because of changes in our asset mix, due in part to such securitizations. We generally seek to match fund our assets according to their liquidity characteristics and expected hold period. We believe that the defensive positioning of our predominantly senior secured assets and our financing strategy has allowed us to maintain financial flexibility to capitalize on an attractive range of market opportunities as they have arisen.
We and our subsidiaries may incur substantial additional debt in the future. However, we are subject to certain restrictions on our ability to incur additional debt in the indentures governing the Notes (the “Indentures”) and our other debt agreements. Under the Indentures, we may not incur certain types of indebtedness unless our consolidated non-funding debt to equity ratio (as defined in the Indentures) is less than or equal to 1.75 to 1.00 or if the unencumbered assets of the Company and its subsidiaries is less than 120% of their unsecured indebtedness, although our subsidiaries are permitted to incur indebtedness where recourse is limited to the assets and/or the general credit of such subsidiary.
Our borrowings under certain financing agreements and our committed repurchase facilities are subject to maximum consolidated leverage ratio limits (either a fixed ratio ranging from 3.50 to 1.00 to 4.00 to 1.00, or a maximum ratio based on our asset composition at the time of determination), minimum net worth requirements (ranging from $300.0$400.0 million to $849.0$871.4 million), maximum reductions in net worth over stated time periods, minimum liquidity levels (typically $30.0 million of cash or a higher standard that often allows for the inclusion of different percentages of liquid securities in the determination of compliance with the requirement), and a fixed charge coverage ratio of 1.25x, and, in the instance of one lender, an interest coverage ratio of 1.50x, in each case, if certain liquidity thresholds are not satisfied. These restrictions, which would permit us to incur substantial additional debt, are subject to significant qualifications and exceptions.
Further, certain of our financing arrangements and loans on our real property are secured by the assets of the Company, including pledges of the equity of certain subsidiaries or the assets of certain subsidiaries. From time to time, certain of these financing arrangements and loans may prohibit certain of our subsidiaries from paying dividends to the Company, from making distributions on such subsidiary’s capital stock, from repaying to the Company any loans or advances to such subsidiary from the Company or from transferring any of such subsidiary’s property or other assets to the Company or other subsidiaries of the Company.
We wereare in compliance with all covenants as described in the Company’s Annual Report as of June 30, 2020.
Net of the $826.1 million of unrestricted cash heldDecember 31, 2020 and as of June 30, 2020, our adjusted leverage ratio would be significantly below 3.0x. In late March 2020, as the COVID-19 crisis evolved, management began executing on a plan to mitigate uncertainty in financial markets by increasing liquidity and obtaining additional non-recourse and non-mark-to-market financing. Partly as a result of maintaining conservative cash levels as of March 31, 2020, the Company was not in compliance with its 3.5x maximum leverage covenant with certain of its lenders but had the benefit of a contractually provided 30-day cure period during which the Company cured such non-compliance by paying down debt (as defined in the relevant borrowing agreements). Refer to Financing Strategy in Current Market Conditions for further disclosures surrounding deleveraging actions completed during the second quarter 2020.
Results of Operations
A discussion regarding our results of operations for the three months ended June 30, 20202021 compared to the three months ended June 30, 20192020 is presented below.
Three months ended June 30, 20202021 compared to the three months ended June 30, 20192020
The following table sets forth information regarding our consolidated results of operations ($ in thousands):
| | | | Three Months Ended June 30, | | | 2020 vs | | | | | | | | | | | | | | | | | |
| | | 2020 | | 2019 | | 2019 | | | Three Months Ended June 30, | | 2021 vs | |
| | | | | | | | | 2021 | | 2020 | | 2020 | |
| Net interest income | Net interest income | | | | | | Net interest income | | | | | | |
| Interest income | Interest income | $ | 62,096 | | | $ | 85,322 | | | $ | (23,226) | | | Interest income | $ | 37,577 | | | $ | 62,096 | | | $ | (24,519) | | |
| Interest expense | Interest expense | 68,425 | | | 52,369 | | | 16,056 | | | Interest expense | 45,226 | | | 68,425 | | | (23,199) | | |
| Net interest income | Net interest income | (6,329) | | | 32,953 | | | (39,282) | | | Net interest income | (7,649) | | | (6,329) | | | (1,320) | | |
| Provision for/(release of) loan loss reserves | (729) | | | 300 | | | (1,029) | | | |
| Net interest income (expense) after provision for loan losses | (5,600) | | | 32,653 | | | (38,253) | | | |
| | Provision for (release of) loan loss reserves | | Provision for (release of) loan loss reserves | (335) | | | (729) | | | 394 | | |
| Net interest income (expense) after provision for (release of) loan losses | | Net interest income (expense) after provision for (release of) loan losses | (7,314) | | | (5,600) | | | (1,714) | | |
| Other income (loss) | Other income (loss) | | | | | | Other income (loss) | | | | | |
| Operating lease income | 23,773 | | | 27,780 | | | (4,007) | | | |
| Real estate operating income | | Real estate operating income | 26,558 | | | 23,773 | | | 2,785 | | |
| | Sale of loans, net | Sale of loans, net | (744) | | | 20,264 | | | (21,008) | | | Sale of loans, net | 3,392 | | | (744) | | | 4,136 | | |
| Realized gain (loss) on securities | Realized gain (loss) on securities | (14,798) | | | 4,464 | | | (19,262) | | | Realized gain (loss) on securities | 15 | | | (14,798) | | | 14,813 | | |
| Unrealized gain (loss) on equity securities | Unrealized gain (loss) on equity securities | 401 | | | (990) | | | 1,391 | | | Unrealized gain (loss) on equity securities | — | | | 401 | | | (401) | | |
| Unrealized gain (loss) on Agency interest-only securities | Unrealized gain (loss) on Agency interest-only securities | 98 | | | 11 | | | 87 | | | Unrealized gain (loss) on Agency interest-only securities | (48) | | | 98 | | | (146) | | |
| Realized gain (loss) on sale of real estate, net | Realized gain (loss) on sale of real estate, net | (1) | | | (1,124) | | | 1,123 | | | Realized gain (loss) on sale of real estate, net | 19,389 | | | (1) | | | 19,390 | | |
| | Fee and other income | Fee and other income | 3,505 | | | 7,196 | | | (3,691) | | | Fee and other income | 2,451 | | | 3,505 | | | (1,054) | | |
| Net result from derivative transactions | Net result from derivative transactions | (813) | | | (15,457) | | | 14,644 | | | Net result from derivative transactions | (3,844) | | | (813) | | | (3,031) | | |
| Earnings (loss) from investment in unconsolidated joint ventures | Earnings (loss) from investment in unconsolidated joint ventures | 471 | | | 1,564 | | | (1,093) | | | Earnings (loss) from investment in unconsolidated joint ventures | 237 | | | 471 | | | (234) | | |
| | Gain (loss) on extinguishment/defeasance of debt | 19,017 | | | — | | | 19,017 | | | |
| Gain (loss) on extinguishment of debt | | Gain (loss) on extinguishment of debt | — | | | 19,017 | | | (19,017) | | |
| Total other income (loss) | Total other income (loss) | 30,909 | | | 43,708 | | | (12,799) | | | Total other income (loss) | 48,150 | | | 30,909 | | | 17,241 | | |
| Costs and expenses | Costs and expenses | | | | | | | Costs and expenses | | | | | | |
| Salaries and employee benefits | Salaries and employee benefits | 7,001 | | | 14,907 | | | (7,906) | | | Salaries and employee benefits | 8,477 | | | 7,001 | | | 1,476 | | |
| Operating expenses | Operating expenses | 6,224 | | | 6,012 | | | 212 | | | Operating expenses | 4,216 | | | 6,224 | | | (2,008) | | |
| Real estate operating expenses | Real estate operating expenses | 6,034 | | | 6,032 | | | 2 | | | Real estate operating expenses | 6,345 | | | 6,034 | | | 311 | | |
| Fee expense | Fee expense | 1,977 | | | 1,183 | | | 794 | | | Fee expense | 2,195 | | | 1,977 | | | 218 | | |
| Depreciation and amortization | Depreciation and amortization | 9,816 | | | 9,935 | | | (119) | | | Depreciation and amortization | 9,464 | | | 9,816 | | | (352) | | |
| Total costs and expenses | Total costs and expenses | 31,052 | | | 38,069 | | | (7,017) | | | Total costs and expenses | 30,697 | | | 31,052 | | | (355) | | |
| Income (loss) before taxes | Income (loss) before taxes | (5,743) | | | 38,292 | | | (44,035) | | | Income (loss) before taxes | 10,139 | | | (5,743) | | | 15,882 | | |
| Income tax expense (benefit) | Income tax expense (benefit) | (550) | | | 2,219 | | | (2,769) | | | Income tax expense (benefit) | (318) | | | (550) | | | 232 | | |
| Net income (loss) | Net income (loss) | $ | (5,193) | | | $ | 36,073 | | | $ | (41,266) | | | Net income (loss) | $ | 10,457 | | | $ | (5,193) | | | $ | 15,650 | | |
| | |
Investment Overview
Investment activityActivity for the three months ended June 30, 2021 included funding of $714.6 million in principal value of commercial mortgage loans, which was offset by $51.1 million of sales and $158.2 million of principal repayments in the three months ended June 30, 2020 focused on loan, security2021. We purchased $61.3 million of securities, sold $10.2 million and had $95.7 million of amortization in the portfolio, which contributed to a net decrease in our securities portfolio of $44.9 million during the three months ended June 30, 2021. We also received proceeds from the sale of real estate activities. We originatedof $38.7 million during the three months ended June 30, 2021.
Activity for the three months ended June 30, 2020 included originating and fundedfunding of $20.5 million in principal value of commercial mortgage loans, which was partially offset by $231.8 million of sales and $327.8 million of principal repayments in the three months ended June 30, 2020. We sold $424.7 million of securities and had $9.1 million of amortization in the portfolio, which partially contributed to a net decrease in our securities portfolio of $423.9 million during the three months ended June 30, 2020. We also invested $3.9 million in real estate, which includes $3.9 million of real estate acquired via foreclosure, and received proceeds from the sale of real estate of $0.3 million.
Investment activity in the three months ended June 30, 2019 focused on loan, security and real estate activities. We originated and funded $418.2 million in principal value of commercial mortgage loans, which was offset by $271.2 million of sales and $448.1 million of principal repayments in the three months ended June 30, 2019. We acquired $419.3 million of new securities, which was partially offset by $169.7 million of sales and $86.3 million of amortization in the portfolio, which partially contributed to a net increase in our securities portfolio of $169.3 million during the three months ended June 30, 2019. We also invested $2.7 million in real estate and received proceeds from the sale of real estate of $14.0 million.
Operating Overview
Net income (loss) totaled $10.5 million for the three months ended June 30, 2021, compared to $(5.2) million for the three months ended June 30, 2020, compared to $36.1 million for the three months ended June 30, 2019.2020. The most significant drivers of the $41.3$15.7 million increase are as follows:
•an increase in total other income (loss) of $17.2 million, primarily as a result of a $19.4 million increase in realized gain on sale of real estate, net, $14.8 million increase in realized gain on sale of securities, net, $4.1 million increase in sale of loans, net, partially offset by $3.0 million decrease are as follows:in net results from derivative transactions, and a $19.0 million decrease in gain (loss) on extinguishment of debt;
•a decrease in net interest income after provision for loan losses of $38.3$1.7 million, primarily as a result of the $23.2$24.5 million decrease in interest income and the $16.1$23.2 million increasedecrease in interest expense;
•a decrease in total other income (loss) of $12.8 million, primarily as a result of a decrease of $21.0 million in sale of loans, net, a $19.3 million decrease in realized gain (loss) on securities and a decrease of $3.7 million in fee and other income, partially offset by an increase of $19.0 million in gain (loss) on extinguishment of debt and an increase of $14.6 million in net results from derivative transactions;
•a decrease in total costs and expenses of $7.0$0.4 million compared to the prior year, primarily as a result of a $7.9$2.0 million decrease in operating expenses and a $1.5 million increase in salaries and employee benefits; and
•an increase in income tax expense (benefit) of ($2.8 million)$0.2 million compared to the prior year, primarily attributable to a decreasean increase in forecasted GAAP income in our TRSs.
Income (Loss) Before Taxes
Income (loss) before taxes totaled $10.1 million for the three months ended June 30, 2021, compared to $(5.7) million for the three months ended June 30, 2020, compared to $38.3 million for the three months ended June 30, 2019.2020. The significant components of the $44.0$15.8 million decreaseincrease in income (loss) before taxes are described in the first four bullet points under operating overview above.
CoreDistributable Earnings
CoreDistributable earnings, a non-GAAP financial measure, totaled $13.4 million for the three months ended June 30, 2021, compared to $12.8 million for the three months ended June 30, 2020, compared to $51.0 million for the three months ended June 30, 2019. The2020. A significant componentscomponent of the $38.2$0.6 million increase in distributable earnings is the $14.8 million increase on gain of securities, $8.1 million increase in gain on sale of real estate, net, $7.4 million increase in net result from derivative transactions, partially offset by a $19.0 million decrease in core earnings are the $32.8gain (loss) on extinguishment/defeasance of debt, $1.3 million decrease in net interest income, which includes a $23.2$24.5 million decrease in interest income and a $9.5 million increase in interest expense. Also contributing to the decrease is a $16.3$23.2 million decrease in total other income, which includes a decrease of $9.8 million in sale of loans, net, a $4.0interest expense and $1.1 million decrease in operating lease income, a decrease of $3.9 million in gain (loss) on securities and a decrease of $3.7 million in fee and other income, partially offset by an increase of $3.8 million in net results from derivative transactions and a decrease of $8.0 million in salaries and employee benefits.
Our results of operations were significantly impacted by the actions we took to generate liquidity and pay down mark-to-market debt in direct response to the unfavorable market conditions that occurred near the onset of the COVID-19 pandemic. The actions taken by management had multiple impacts on core earnings for the three months ended June 30, 2020. Management believes the actions taken were prompted by the unusual market conditions and therefore outside of Ladder’s core operations. Management believes adjusting for certain transactional charges/gains related to the impact of COVID-19 on its performance measures provides a more useful guide to assess the ongoing core operations of the Company.
The impact from COVID-19 included adjustments related to the unusual market conditions and actions taken by management including: (a) $6.7 million of losses from sales of performing first mortgage loans included in sale of loans, net, (b) $15.4 million of losses from sales of CMBS, (c) $3.7 million of loss from conduit loan sales, (d) $6.5 million of prepayment penalties related to pay downs of mark-to-market debt included in interest expense, (e) $2.1 million of professional fee expenses included in operating expenses and (f) $0.2 million of severance costs included in salaries and employee benefits. The $34.5 million total of the preceding amounts was partially offset by (g) $19.0 million of gains from the repurchase of and extinguishment of unsecured corporate bond debt at a discount from par, net of (h) $1.5 million of accelerated premium amortization included in interest expense.income.
See “—Reconciliation of Non-GAAP Financial Measures” for our definition of coredistributable earnings and a reconciliation to income (loss) before taxes.
Net Interest Income
The $23.2$24.5 million decrease in interest income was primarily attributable to lower prevailing LIBOR rates during 2020 and a decrease in our securities and loan portfolios. For the three months ended June 30, 2021, securities investments averaged $0.7 billion and loan investments averaged $2.2 billion. For the three months ended June 30, 2020, securities investments averaged $1.1 billion and loan investments averaged $3.2 billion. For the three months ended June 30, 2019, securities investments averaged $1.8 billion and loan investments averaged $3.4 billion. There was a $144.9 million$0.4 billion decrease in loanaverage securities investments, and a $688.9 million$1.0 billion decrease in securitiesaverage loan investments.
The $16.1$23.2 million increasedecrease in interest expense was primarily attributable to an increasethe overall reduction in interest expense on corporate bonds issuedour loan and security repurchase line debt outstanding, given the reduction related to collateral and liquidity needs. The decrease was also driven by a decrease in 2020, prepayment penalties on repayment of mark-to-market borrowings and hyper amortization of deferred issuance costsFHLB interest as a result of the retirement of corporate bondsprepayment fees incurred in the three months ended June 30, 2020. The increase is also driven by2020 and a full quarter of interest expense on the fully drawn revolver and the addition of the CLO and secured financing facility, partially offset by a decreaselower debt balance in interest expense on FHLB debt.2021.
The $38.3$1.7 million decrease in net interest income after provision for loan losses was primarily attributable to the decrease in net interest income discussed above, and the increasedecrease in interest expense discussed above and the $1.0$0.4 million decreaseincrease in provision for loan losses discussed below.
As of June 30, 2020,2021, the weighted average yield on our mortgage loan receivables was 6.7%5.8%, compared to 7.9%6.7% as of June 30, 20192020 as the weighted average yield on new loans originated or funded was lower than the weighted average yield on loans that were securitized or paid off. As of June 30, 2020,2021, the weighted average interest rate on borrowings against our mortgage loan receivables was 4.8%5.6%, compared to 3.9%4.8% as of June 30, 2019.2020. The increase in the rate on borrowings against our mortgage loan receivables from June 30, 20192020 to June 30, 20202021 was primarily due to higher borrowing rates on new sources of financing obtained during the three months ended June 30, 2020.2021. As of June 30, 2020,2021, we had outstanding borrowings secured by our mortgage loan receivables equal to 32.9%21.1% of the carrying value of our mortgage loan receivables, compared to 43.6%32.9% as of June 30, 2019.2020.
As of June 30, 2020,2021, the weighted average yield on our real estate securities was 1.6%1.7%, compared to 3.3%1.6% as of June 30, 2019 as the weighted average yield on securities purchased was lower than the weighted average yield on securities that were sold or paid off,2020, primarily due to lower prevailing market rates during the three months endedinvestment in floating rate CRE CLO securities as of June 30, 2021 compared to June 30, 2020. As of June 30, 2020,2021, the weighted average interest rate on borrowings against our real estate securities was 2.6%0.9%, compared to 3.0%2.6% as of June 30, 2019.2020. The decrease in the rate on borrowings against our real estate securities from June 30, 20192020 to June 30, 20202021 was primarily due to lower prevailing market borrowing rates as of June 30, 20202021 compared to June 30, 2019.2020. As of June 30, 2020,2021, we had outstanding borrowings secured by our real estate securities equal to 76.9%82.8% of the carrying value of our real estate securities, compared to 73.8%76.9% as of June 30, 2019.2020.
Our real estate is comprised of non-interest bearing assets; however, interest incurred on mortgage financing collateralized by such real estate is included in interest expense. As of June 30, 2020,2021, the weighted average interest rate on mortgage borrowings against our real estate was 5.0%4.8%, compared to 5.1%5.0% as of June 30, 2019.2020. As of June 30, 2020,2021, we had outstanding borrowings secured by our real estate equal to 77.3%78.7% of the carrying value of our real estate, compared to 74.6%77.3% as of June 30, 2019.2020.
Provision for Loan Losses
In compliance with the new CECL reporting requirements, adopted on January 1, 2020, the Company has supplemented the existing credit monitoring and management processes with additional processes to support the calculation of the CECL reserves. Based on the Company’s process, at adoption, onOn January 1, 2020, the Company recorded a CECL Reservereserve of $11.6 million, which equated to 0.36% of $3.2 billion carrying value of its held for investment loan portfolio. This reserve excluded three loans that previously had an aggregate of $14.7 million of asset-specific reserves and a carrying value of $39.8 million as of January 1, 2020. Upon adoption, the aggregated CECL Reservereserve reduced total shareholder’s equity by $5.8 million (or approximately $0.05million.
The change of book value per share$335.0 thousand during the three months ended June 30, 2021 is reflected as a decrease to provision for (release of) loan loss reserves of common stock). $350.0 thousand, and a decrease in reserve on unfunded commitments of $15.0 thousand during the three months ended June 30, 2021. These decreases are primarily due to the update of the macroeconomic assumptions used in the Company’s CECL evaluation in the current quarter. For additional information, refer to “Allowance for Credit Losses and Non-Accrual Status” in Note 3, Mortgage Loan Receivables to the consolidated financial statements.
As of June 30, 2020, the Company released CECL reserves of $(0.7) million for a total CECL reserve of $29.4 million. This excludes five loans that previously had an aggregate of $20.7 million of asset-specific reserves and a carrying value of $76.9 million as of June 30, 2020. The change of $(0.7) million induring the quarter is reflected as a decrease of reserve to provision expense of $(0.3) million, and a decrease in reserve on unfunded commitments of $(0.4) million. These decreases are primarily due to the decrease in the size of our loan portfolio, offset by an update of the macro economicmacroeconomic assumptions used in the Company’s CECL evaluation in the current quarter. For additional information, refer to “Allowance for Loan Losses and Non-Accrual Status” in Note 3, Mortgage Loan Receivables to the consolidated financial statements.
We determined that a provision expense for loan losses of $0.3 million was required for the three months ended June 30, 2019. The provision consisted of a portfolio-based, general reserve of $0.3 million for the expected losses over the remaining portfolio of mortgage loan receivables held for investment, and no asset-specific reserve.
Real Estate Operating Lease Income
The decreaseincrease of $4.0$2.8 million in real estate operating lease income was primarily attributable to income relatedan increase in operations as a result of the easing of restrictions in place due to a one time lease termination payment received in 2019. This decrease was partially offset by income on properties acquired in 2020 and a full period of operations on properties acquired in 2019. Tenant recoveries are included in operating lease income.COVID-19.
Sales of Loans, Net
Income (loss) from sales of loans, net, includes all loan sales, whether by securitization, whole loan sales or other means. Income from sales of loans, net also includes realized losses on loans related to lower of cost or market adjustments. During the three months ended June 30, 2020,2021, we sold/transferredsold two mortgage loan receivables held for saleinvestment, net, at amortized cost, with an aggregate outstanding principal balance of $47.7 million. In the three months ended June 30, 2020, we sold/transferred two loans with an aggregate outstanding principal balance of $68.1 million. We also sold five mortgage loan receivables held for investment, net, at amortized cost, with an aggregate outstanding principal balance of $172.0 million during the three months ended June 30, 2020. In the three months ended June 30, 2019, we sold /transferred 22 loans with an aggregate outstanding principal balance of $237.8 million. During the three months ended June 30, 2020,2021, we released $7.6 million ofrecorded no realized losses on loans related to lower of cost or market adjustments. During the three months ended June 30, 20192020, we recorded noreleased $7.6 million of realized losses on loans related to lower of cost or market adjustments. Income from sales of loans, net is subject to market conditions impacting timing, size and pricing and as such may vary significantly quarter to quarter. The $21.0 million decrease was predominantly a result of our financing and liquidity measures implemented to date in direct response to the COVID-19 pandemic.
Realized Gain (Loss) on Securities
We sold $10.2 million of securities for the three months ended June 30, 2021. We sold $424.7 million of securities for the three months ended June 30, 2020. We sold $169.7 millionThe increase of securities for the three months ended June 30, 2019. The decrease of $19.3$14.8 million in realized gain (loss) on securities is a result of our financing and liquidity measures implemented to date in direct responsemore favorable security prices upon exit existing during the three months ended June 30, 2021 security sales as compared to the three months ended June 30, 2020 security sales during the height of the COVID-19 pandemic. Included in realized gain (loss) on securities are $(0.1) million other than temporary impairments on securities for the three months ended June 30, 2020. There were no other than temporary impairments on securities recorded for the three months ended June 30, 2021.
Unrealized Gain (Loss) on Equity Securities
UnrealizedThere was no unrealized gain (loss) on equity securities represented a gainas of June 30, 2021, compared to $0.4 million for the three months endedas of June 30, 2020, compared to $1.0 million for the three months ended June 30, 2019.2020. The Company has elected the fair market value option for accounting for these equity securities and changes in fair value are recorded in current period earnings.
Unrealized Gain (Loss) on Agency Interest-Only Securities
The positivenegative change of $0.1 million$146.2 thousand in unrealized gain (loss) on Agency interest-only securities was due to changechanges in the fair value of the securities.
Realized Gain (Loss) on Sale of Real Estate, Net
The increase of $1.1$19.4 million in realized gain (loss) on sale of real estate, net was primarily a result of the commercial real estate and residential condominium sales discussed below.
During the three months ended June 30, 2020 and 2019, we sold no single-tenant net leased properties.
During the three months ended June 30, 2020, we sold no diversified commercial real estate properties. During the three months ended June 30, 2019, we sold two diversified commercial real estate properties resulting in a net gain (loss) on sale of $(1.3) million.
During the three months ended June 30, 2020, we sold one residential condominium units from Terrazas River Park Villageour retail property in Miami, FL, resulting in a net gain on sale of $55. During the three months ended June 30, 2019, we sold seven residential condominium units from Terrazas River Park Village in Miami, FL, resulting in a net gain on sale of $0.2 million.
Impairment of Real Estate
There was no impairment of real estate for the three months ended June 30, 2020 and June 30, 2019.North Dartmouth, MA.
Fee and Other Income
We generate fee and other income from origination fees, exit fees and other fees on the loans we originate and in which we invest unrealized gains (losses) on our investment in mutual fund and dividend income on our investment in FHLB stock and equity securities. The $3.7$1.1 million decrease in fee and other income year-over-year was primarily due to a decrease in exit fees, origination fees and a realized loss on our investment in the Ladder Select Bond Fund (the “Fund”), a mutual fund.dividend income.
Net Result from Derivative Transactions
Net result from derivative transactions represented a loss of $3.8 million for the three months ended June 30, 2021, which was comprised of an unrealized loss of $0.6 million and a realized loss of $3.2 million, compared to a loss of $0.8 million for the three months ended June 30, 2020, which was comprised of an unrealized loss of $0.6 million and a realized loss of $0.2 million, compared to a loss of $15.5 million for the three months ended June 30, 2019, which was comprised of an unrealized loss of $1.0 million and a realized loss of $14.5 million, resulting in a positivenegative change of $14.6$3.0 million. The hedge positions were related to fixed rate conduit loans and securities investments. The derivative positions that generated these results were a combination of interest rate futures that we employed in an effort to hedge the interest rate risk on the financing of our fixed rate assets and the net interest income we earnearned against the impact of changes in interest rates. The loss in 20202021 was primarily related to movement in interest rates during the three months ended June 30, 2020.2021. The total net result from derivative transactions is composed of hedging interest expense, realized gains/losses related to hedge terminations and unrealized gains/losses related to changes in the fair value of asset hedges.
Earnings (Loss) from Investment in Unconsolidated Joint Ventures
Earnings (loss) from our investment in Grace Lake JVLLC totaled $0.3 million and $0.6$0.3 million for the three months ended June 30, 20202021 and 2019,2020, respectively. Earnings (loss) from our investment in 24 Second Avenue totaled $0.2$(0.1) million and $0.9$0.2 million for the three months ended June 30, 20202021 and 2019,2020, respectively. See Note 6, Investment in and Advances to Unconsolidated Joint Ventures for further detail.
Gain (Loss) on Extinguishment/Defeasance of Debt
There was no gain (loss) on extinguishment/defeasance of debt for the three months ended June 30, 2021, and there was a $19.0 million gain (loss) on extinguishment/defeasance of debt totaled for the three months ended June 30, 2020. During the three months ended June 30, 2020, the Company retired $72.8 million of principal of the 2027 Notes for a repurchase price of $61.2 million, recognizing a $10.6 million net gain on extinguishment of debt after recognizing $(1.0) million of unamortized debt issuance costs associated with the retired debt,debt; the Company retired $45.2 million of principal of the 2025 Notes for a repurchase price of $38.5 million, recognizing a $6.2 million net gain on extinguishment of debt after recognizing $(0.4) million of unamortized debt issuance costs associated with the retired debt,debt; the Company retired $14.4 million of principal of the 2022 Notes for a repurchase price of $13.8 million, recognizing a $0.6 million net gain on extinguishment of debt after recognizing $(0.1) million of unamortized debt issuance costs associated with the retired debtdebt; and the Company retired $6.7 million of principal of the 2021 Notes for a repurchase price of $6.5 million, recognizing a $0.2 million net gain on extinguishment of debt after recognizing $(16.9) thousand of unamortized debt issuance costs associated with the retired debt. There was no gain (loss) on extinguishment/defeasance of debt for the three months ended June 30, 2019.
Salaries and Employee Benefits
Salaries and employee benefits totaled $8.5 million for the three months ended June 30, 2021, compared to $7.0 million for the three months ended June 30, 2020, compared to $14.9 million for the three months ended June 30, 2019.2020. Salaries and employee benefits are comprised primarily of salaries, bonuses, equity based compensation and other employee benefits. The decreaseincrease of $7.9$1.5 million in compensation expense was primarily attributable to the fact that the Company recorded no compensation expense relatedan increase in bonus accrual attributed to bonuses dueincreased employee head count as compared to the significant market disruption caused by the COVID-19 pandemic and the substantial economic uncertainty present in the commercial real estate market and overall economy during the three months ended June 30, 2020.
Operating Expenses
Operating expenses are primarily comprised of professional fees, lease expense and technology expenses. The increasedecrease of $0.2$2.0 million was primarily related to an increasea decrease in professional fees partially offset by a decrease in other operating expenses during the three months ended June 30, 2020.2021.
Real Estate Operating Expenses
The increase of $2.0 thousand$0.3 million in real estate operating expenses primarily relates to the acquisition of real estate in 2019,2020 and 2021, partially offset by the sale of real estate sales in 2020 and a decrease in operating expenses for condominium properties.2021.
Fee Expense
Fee expense is comprised primarily of custodian fees, financing costs and servicing fees related to loans. The increase of $0.8$0.2 million in fee expense was primarily attributable to an increase in other professional fees, partially offset by a decrease in financing cost fees, legal fees paid for loan and real estate assets, and dead deal costs in the three months ended June 30, 2020.2021.
Depreciation and Amortization
The $0.1$0.4 million decrease in depreciation and amortization was primarily attributable to the timing thesale of real estate sales during each quarter.in 2020 and 2021.
Income Tax (Benefit) Expense
Most of our consolidated income tax provision related to the business units held in our TRSs. The increase in income tax expense (benefit) of ($2.8 million)$0.2 million is primarily attributable to a reduction in net interest incometaxable gains related primarily to loan sales in our TRSs as well as the decrease in income from sale of loans.
Results of Operations
A discussion regarding our results of operations for the sixSix months ended June 30, 20202021 compared to the six months ended June 30, 2019 is presented below.
Six months ended June 30, 2020 compared to the six months ended June 30, 2019
The following table sets forth information regarding our consolidated results of operations ($ in thousands):
| | | | | Six Months Ended June 30, | | | 2020 vs | | | | Six Months Ended June 30, 2021 | | 2021 vs | |
| | | | 2020 | | 2019 | | 2019 | | | | 2021 | | 2020 | | 2020 | |
| | Net interest income | Net interest income | | | | | | | Net interest income | | | | | | | |
| Interest income | Interest income | | $ | 134,686 | | | $ | 171,789 | | | $ | (37,103) | | | Interest income | | $ | 76,865 | | | $ | 134,686 | | | $ | (57,821) | | |
| Interest expense | Interest expense | | 119,827 | | | 103,618 | | | 16,209 | | | Interest expense | | 91,199 | | | 119,827 | | | (28,628) | | |
| Net interest income | Net interest income | | 14,859 | | | 68,171 | | | (53,312) | | | Net interest income | | (14,334) | | | 14,859 | | | (29,193) | | |
| Provision for/(release of) loan loss reserves | | 25,852 | | | 600 | | | 25,252 | | | |
| Net interest income (expense) after provision for loan losses | | (10,993) | | | 67,571 | | | (78,564) | | | |
| | Provision for (release of) loan loss reserves | | Provision for (release of) loan loss reserves | | (4,586) | | | 25,852 | | | (30,438) | | |
| Net interest income (expense) after provision for (release of) loan losses | | Net interest income (expense) after provision for (release of) loan losses | | (9,748) | | | (10,993) | | | 1,245 | | |
| Other income (loss) | Other income (loss) | | | | | | | Other income (loss) | | | | | | |
| Operating lease income | | 50,101 | | | 56,701 | | | (6,600) | | | |
| Real estate operating income | | Real estate operating income | | 50,718 | | | 50,101 | | | 617 | | |
| | Sale of loans, net | Sale of loans, net | | 261 | | | 27,342 | | | (27,081) | | | Sale of loans, net | | 3,392 | | | 261 | | | 3,131 | | |
| Realized gain (loss) on securities | Realized gain (loss) on securities | | (11,787) | | | 7,329 | | | (19,116) | | | Realized gain (loss) on securities | | 594 | | | (11,787) | | | 12,381 | | |
| Unrealized gain (loss) on equity securities | Unrealized gain (loss) on equity securities | | (132) | | | 1,088 | | | (1,220) | | | Unrealized gain (loss) on equity securities | | — | | | (132) | | | 132 | | |
| Unrealized gain (loss) on Agency interest-only securities | Unrealized gain (loss) on Agency interest-only securities | | 174 | | | 22 | | | 152 | | | Unrealized gain (loss) on Agency interest-only securities | | (68) | | | 174 | | | (242) | | |
| Realized gain (loss) on sale of real estate, net | Realized gain (loss) on sale of real estate, net | | 10,528 | | | (1,119) | | | 11,647 | | | Realized gain (loss) on sale of real estate, net | | 19,389 | | | 10,528 | | | 8,861 | | |
| Impairment of real estate | | — | | | (1,350) | | | 1,350 | | | |
| | Fee and other income | Fee and other income | | 5,024 | | | 11,882 | | | (6,858) | | | Fee and other income | | 5,735 | | | 5,024 | | | 711 | | |
| Net result from derivative transactions | Net result from derivative transactions | | (16,248) | | | (26,491) | | | 10,243 | | | Net result from derivative transactions | | 927 | | | (16,248) | | | 17,175 | | |
| Earnings (loss) from investment in unconsolidated joint ventures | Earnings (loss) from investment in unconsolidated joint ventures | | 912 | | | 2,522 | | | (1,610) | | | Earnings (loss) from investment in unconsolidated joint ventures | | 673 | | | 912 | | | (239) | | |
| | Gain (loss) on extinguishment/defeasance of debt | | 21,077 | | | (1,070) | | | 22,147 | | | |
| Gain (loss) on extinguishment of debt | | Gain (loss) on extinguishment of debt | | — | | | 21,077 | | | (21,077) | | |
| Total other income (loss) | Total other income (loss) | | 59,910 | | | 76,856 | | | (16,946) | | | Total other income (loss) | | 81,360 | | | 59,910 | | | 21,450 | | |
| Costs and expenses | Costs and expenses | | | | | | | | Costs and expenses | | | | | | | |
| Salaries and employee benefits | Salaries and employee benefits | | 24,023 | | | 38,481 | | | (14,458) | | | Salaries and employee benefits | | 18,011 | | | 24,023 | | | (6,012) | | |
| Operating expenses | Operating expenses | | 12,018 | | | 11,413 | | | 605 | | | Operating expenses | | 8,457 | | | 12,018 | | | (3,561) | | |
| Real estate operating expenses | Real estate operating expenses | | 13,981 | | | 11,506 | | | 2,475 | | | Real estate operating expenses | | 12,555 | | | 13,981 | | | (1,426) | | |
| Fee expense | Fee expense | | 3,415 | | | 2,895 | | | 520 | | | Fee expense | | 3,793 | | | 3,415 | | | 378 | | |
| Depreciation and amortization | Depreciation and amortization | | 19,825 | | | 20,162 | | | (337) | | | Depreciation and amortization | | 19,000 | | | 19,825 | | | (825) | | |
| Total costs and expenses | Total costs and expenses | | 73,262 | | | 84,457 | | | (11,195) | | | Total costs and expenses | | 61,816 | | | 73,262 | | | (11,446) | | |
| Income (loss) before taxes | Income (loss) before taxes | | (24,345) | | | 59,970 | | | (84,315) | | | Income (loss) before taxes | | 9,796 | | | (24,345) | | | 34,141 | | |
| Income tax expense (benefit) | Income tax expense (benefit) | | (5,091) | | | (634) | | | (4,457) | | | Income tax expense (benefit) | | (1,096) | | | (5,091) | | | 3,995 | | |
| Net income (loss) | Net income (loss) | | $ | (19,254) | | | $ | 60,604 | | | $ | (79,858) | | | Net income (loss) | | $ | 10,892 | | | $ | (19,254) | | | $ | 30,146 | | |
|
Investment Overview
Investment activityActivity for the six months ended June 30, 2021 included originating and funding $872.1 million in principal value of commercial mortgage loans, which was offset by $97.6 million of sales and $533.0 million of principal repayments in the six months ended June 30, 2020 focused on loan, security2021. We acquired $101.4 million of new securities, which was offset by $339.2 million of sales and $106.3 million of amortization in the portfolio, which partially contributed to a net decrease in our securities portfolio of $339.1 million during the six months ended June 30, 2021. We also invested $43.8 million in real estate, activities. We originatedwhich included $43.8 million of real estate acquired via foreclosure, and fundedreceived proceeds from the sale of real estate of $82.5 million.
Activity for the six months ended June 30, 2020 included originating and funding $547.2 million in principal value of commercial mortgage loans, which was offset by $421.2 million of sales and $446.4 million of principal repayments in the six months ended June 30, 2020. We acquired $438.3 million of new securities, which was partially offset by $532.2 million of sales and $52.8 million of amortization in the portfolio, which partially contributed to a net decrease in our securities portfolio of $214.6 million during the six months ended June 30, 2020. We also invested $31.7 million in real estate, which includesincluded $25.4 million of real estate acquired via foreclosure, and received proceeds from the sale of real estate of $30.4 million.
Investment activity in the six months ended June 30, 2019 focused on loan, security and real estate activities. We originated and funded $817.8 million in principal value of commercial mortgage loans, which was offset by $430.6 million of sales and $693.8 million of principal repayments in the six months ended June 30, 2019. We acquired $852.2 million of new securities, which was partially offset by $384.4 million of sales and $110.4 million of amortization in the portfolio, which partially contributed to a net increase in our securities portfolio of $378.3 million during the six months ended June 30, 2019. We also invested $23.3 million in real estate and received proceeds from the sale of real estate of $15.7 million.
Operating Overview
Net income (loss) totaled $10.9 million for the six months ended June 30, 2021, compared to $(19.3) million for the six months ended June 30, 2020, compared to $60.6 million for the six months ended June 30, 2019. Net income (loss) for the six months ended June 30, 2020 were significantly impacted by management’s actions to generate liquidity and pay down mark-to-market financing in direct response to the COVID-19 pandemic.2020. The most significant drivers of the $79.9$30.1 million decreaseincrease are as follows:
•a decreasean increase in net interest income after provision for loan losses of $53.3$1.2 million, primarily as a result of the $25.3 million increase in provision for loan losses related to the adoption of CECL. Also contributing was a $37.1$57.8 million decrease in interest income and a $16.2$28.6 million increasedecrease in interest expense;expense. Also contributing was a $30.4 million decrease in provision for loan loss reserves as a result of a release of provision as compared to the initial adoption of and recording of provision expense in connection with CECL for the six months ended June 30, 2020;
•a decreasean increase in total other income (loss) of $16.9$21.4 million, primarily as a result of a decrease of $27.1 million in sales of loans, a decrease of $19.1 million in realized gains (losses) on securities, a decrease of $6.9 million on fee and other income, a decrease of $6.6 million on operating lease income, partially offset by a $11.6 million increase in profits on sales of real estate and a $10.3$17.2 million increase in net results from derivative transactions;transactions, $12.4 million increase as a result of realized gain on securities, $8.9 million increase in realized gain on sale of real estate, net, and an increase of $3.1 million in sales of loans, partially offset by an increase of $21.1 million of loss on extinguishment of debt;
•a decrease in total costs and expenses of $11.2$11.4 million compared to the prior year, primarily attributable to a $14.5$6.0 million decrease in salaries and employee benefit, partially offset by a $2.5$1.4 million increasedecrease in real estate operating expenses, and a $3.6 million decrease in operating expenses; and
•Aa ($4.54.0 million) increasedecrease in income tax expense (benefit) compared to the prior year, primarily attributable to a decrease in forecasted GAAP income in our TRSs.
Income (Loss) Before Taxes
Income (loss) before taxes totaled $9.8 million for the six months ended June 30, 2021, compared to $(24.3) million for the six months ended June 30, 2020, compared to $60.0 million for the six months ended June 30, 2019.2020. The significant components of the $84.3$34.1 million decrease in income (loss) before taxes are described in the first threefour bullet points under operating overview above.
CoreDistributable Earnings
CoreDistributable earnings, a non-GAAP financial measure, totaled $16.6 million for the six months ended June 30, 2021, compared to $43.6 million for the six months ended June 30, 2020, compared to $97.9 million for the six months ended June 30, 2019. Core earnings for the six months ended June 30, 2020 were significantly impacted by management’s actions to generate liquidity and pay down mark-to-market financing in direct response to the COVID-19 pandemic.2020. The significant components of the $54.3$27.0 million decrease in coredistributable earnings are a decrease of $21.2 million in net interest income after provision for loan losses, a decreasean increase in total other income (loss) of $12.9$5.4 million, primarily as a result of a decreasean increase of $16.1$4.4 million in sale of loans, net, a decreasean increase of $6.9$0.7 million in fee and other income, a decreasean increase of $6.6$0.6 million in operating lease income and a decreasean increase of $3.7$12.4 million in gain (loss) on securities, and an increase of $3.1 million in gain (loss) on extinguishment of debt, partially offset by an increase of $9.6$4.6 million in sale of real estate, net, an increase of $7.9$3.9 million in net results from derivative transactions, and a decrease of $14.6$21.1 million in gain (loss) on extinguishment of debt and an increase of $0.6 million in salaries and employee benefits.
Our results of operations were significantly impacted by the actions we took to generate liquidity and pay down mark-to-market debt in direct response to the unfavorable market conditions that occurred near the onset of the COVID-19 pandemic. The actions taken by management had multiple impacts on core earnings for the three months ended June 30, 2020. Management believes the actions taken were prompted by the unusual market conditions and therefore outside of Ladder’s core operations. Management believes adjusting for certain transactional charges/gains related to the impact of COVID-19 on its performance measures provides a more useful guide to assess the ongoing core operations of the Company.
The impact from COVID-19 included adjustments related to the unusual market conditions and actions taken by management including: (a) $6.7 million of losses from sales of performing first mortgage loans included in sale of loans, net, (b) $15.4 million of losses from sales of CMBS, (c) $3.7 million of loss from conduit loan sales, (d) $6.5 million of prepayment penalties related to pay downs of mark-to-market debt included in interest expense, (e) $2.1 million of professional fee expenses included in operating expenses and (f) $0.2 million of severance costs included in salaries and employee benefits. The $34.5 million total of the preceding amounts was partially offset by (g) $19.0 million of gains from the repurchase of and extinguishment of unsecured corporate bond debt at a discount from par, net of (h) $1.5 million of accelerated premium amortization included in interest expense.
See “—Reconciliation of Non-GAAP Financial Measures” for our definition of coredistributable earnings and a reconciliation to income (loss) before taxes.
Net Interest Income
The $37.1$57.8 million decrease in interest income was primarily attributable to lower prevailing LIBOR rates during 2020 and a decrease in our securitiessecurity and loan portfolios.portfolio due to paydowns and sales with lower prevailing LIBOR rates. For the six months ended June 30, 2021, securities investments averaged $0.8 billion and loan investments averaged $2.2 billion. For the six months ended June 30, 2020, securities investments averaged $1.4 billion and loan investments averaged $3.3 billion. For the six months ended June 30, 2019, securities investments averaged $1.6 billion and loan investments averaged $3.5 billion. There was a $180.6 million$0.6 billion decrease in average securities, and a $1.1 billion decrease in average loan investments, and a $237.5 million decrease in average securities investments.
The $16.2$28.6 million increasedecrease in interest expense was primarily attributableis due to an increasethe decrease in interest expense on corporate bonds issued in 2020, prepayment penalties on repayment of mark-to-market borrowingsrepurchase facility financing and hyper amortization of deferred issuance costsFHLB financing as a result of the retirement of corporate bonds in the six months ended June 30, 2020. The increase was also driven by a full quarter of interest expense on the fully drawn revolver and the addition of the CLO and secured financing facility, partially offset by a decrease in the debt outstanding and a reduction in mortgage loan financing interest expense on FHLB debt.as a result of paydowns.
The $78.6 million decrease in net interest income afterbefore provision for loan losses was primarily attributable toof $29.2 million is explained in the decrease in net interest income and the increase in interest expense discussedparagraphs above.
As of June 30, 2020,2021, the weighted average yield on our mortgage loan receivables was 6.7%5.8%, compared to 7.9%6.7% as of June 30, 20192020 as the weighted average yield on new loans originated was lower than the weighted average yield on loans that were securitized or paid off. As of June 30, 2020,2021, the weighted average interest rate on borrowings against our mortgage loan receivables was 4.8%5.6%, compared to 3.9%4.8% as of June 30, 2019.2020. The increase in the rate on borrowings against our mortgage loan receivables from June 30, 20192020 to June 30, 20202021 was primarily due to higher borrowing rates on new sources of financing obtained and held during the three months ended June 30, 2020.2021. As of June 30, 2020,2021, we had outstanding borrowings secured by our mortgage loan receivables equal to 32.9%21.1% of the carrying value of our mortgage loan receivables, compared to 43.6%32.9% as of June 30, 2019.2020.
As of June 30, 2020,2021, the weighted average yield on our real estate securities was 1.6%1.7%, compared to 3.3%1.6% as of June 30, 2019 as the weighted average yield on securities purchased was lower than the weighted average yield on securities that were sold or paid off,2020, primarily due to lower prevailing market rates during the three months endeda reduced position in floating rate CRE CLO securities as of June 30, 2021 compared to June 30, 2020. As of June 30, 2020,2021, the weighted average interest rate on borrowings against our real estate securities was 2.6%0.9%, compared to 3.0%2.6% as of June 30, 2019.2020. The decrease in the rate on borrowings against our real estate securities from June 30, 20192020 to June 30, 20202021 was primarily due to lower prevailing market borrowing rates as of June 30, 20202021 compared to June 30, 2019.2020. As of June 30, 2020,2021, we had outstanding borrowings secured by our real estate securities equal to 76.9%82.8% of the carrying value of our real estate securities, compared to 73.8%76.9% as of June 30, 2019.2020.
Our real estate is comprised of non-interest bearing assets; however, interest incurred on mortgage financing collateralized by such real estate is included in interest expense. As of June 30, 2020,2021, the weighted average interest rate on mortgage borrowings against our real estate was 5.0%4.8%, compared to 5.1%5.0% as of June 30, 2019.2020. As of June 30, 2020,2021, we had outstanding borrowings secured by our real estate equal to 77.3%78.7% of the carrying value of our real estate, compared to 74.6%77.3% as of June 30, 2019.2020.
Provision for (release of) Loan LossesLoss Reserves
In compliance with the new CECL reporting requirements, adopted on January 1, 2020, the Company has supplemented the existing credit monitoring and management processes with additional processes to support the calculation of the CECL reserves. Based on the Company’s process, at adoption, onOn January 1, 2020, the Company recorded a CECL Reservereserve of $11.6 million, which equated to 0.36% of $3.2 billion carrying value of its held for investment loan portfolio. This reserve excluded three loans that previously had an aggregate of $14.7 million of asset-specific reserves and a carrying value of $39.8 million as of January 1, 2020. Upon adoption, the aggregated CECL Reservereserve reduced total shareholder’s equity by $5.8 million (or approximately $0.05 of book value per share of common stock). As of June 30, 2020, the Company recorded additional CECL reserves of $(0.7) million for amillion.
The total CECL reserve of $29.4 million. This excludes five loans that previously had an aggregate of $20.7 million of asset-specific reserves and a carrying value of $76.9 million as of June 30, 2020. The change of $17.9 million in the six months ended June 30, 2020 is reflected as an increase of reserve to provision expense of $17.6 million, and an increase in reserve on unfunded commitments of $0.2 million. These increases are primarily due to the update of the macro economic assumptions used in the Company’s CECL evaluation to reflect a recessionary macro economic scenario instead of the more stable “Baseline” scenario from the Federal Reserve that was utilized in the January 1, 2020 CECL reserve analysis. In addition to the CECL reserve, the Company determined that an asset-specific reserve of $8.0 million was required relating to two of the Company’s loansfor provision for the six months ended June 30, 2020.2021 was a release of $4.6 million. The release represents a decline in the general reserve of loans held for investment of $4.5 million and the release on unfunded loan commitments of $0.1 million. The release during the year is primarily due to an improvement in macroeconomic assumptions. For additional information, refer to “Allowance for LoanCredit Losses and Non-Accrual Status” in Note 3, Mortgage Loan Receivables, to the consolidated financial statements.
We determined that a The total change in reserve for provision expense for loan losses of $0.6 million was required for the six months ended June 30, 2019.2020 was an addition of $17.9 million. The provision consisted of a portfolio-based,increase represents an increase in the general reserve of $0.6 million for the expected losses over the remaining portfolio of mortgage loan receivablesloans held for investment of $17.6 million and no asset-specific reserve.an addition of reserve of $0.2 million for unfunded loan commitments primarily as a result of the use of a recessionary macroeconomic scenario.
Real Estate Operating Lease Income
The decreaseincrease of $6.6$0.6 million in real estate operating lease income was primarily attributable to salesan increase in operations as a result of real estatethe easing of restrictions in 2019, partially offset by income on properties acquired in 2020 and a full period of operations on properties acquired in 2019. Tenant recoveries are included in operating lease income.place due to COVID-19.
Sale of Loans, Net
Income (loss) from sale of loans, net, includes all loan sales, whether by securitization, whole loan sales or other means. Income (loss) from sale of loans, net also includes realized losses on loans related to lower of cost or market adjustments. During the six months ended June 30, 2021, we sold/transferred three loans with an aggregate outstanding principal balance of $94.2 million resulting in a gain of $3.4 million. During the six months ended June 30, 2021, we recorded no realized losses on loans related to lower of cost or market adjustments. During the six months ended June 30, 2020, we sold/transferred 22 loans with an aggregate outstanding principal balance of $253.5 million. During the six months ended June 30, 2020, we recorded $2.0 thousand realized losses on loans related to lower of cost or market adjustments. We also sold five mortgage loan receivables held for investment, net, at amortized cost, with an aggregate outstanding principal balance of $172.0 million during the six months ended June 30, 2020. During the six months ended June 30, 2019, we sold/transferred 36 loans with an aggregate outstanding principal balance of $407.5 million. During the six months ended June 30, 2019, we recorded no realized losses on loans related to lower of cost or market adjustments. Income from sales of loans, net is subject to market conditions impacting timing, size and pricing and as such may vary significantly quarter to quarter. The $27.1 million decrease was predominantly a result
Realized Gain (Loss) on Securities
The change in realized gain (loss) for the six months ended June 30, 2021 compared to June 30, 2020 resulted in an increase of $12.4 million. For the six months ended June 30, 2021, we sold $339.2 million of securities, comprised of $333.3 million of CMBS and $5.9 million of Agency securities. For the six months ended June 30, 2020, we sold $532.2 million of securities, comprised of $513.5 million of CMBS, no U.S. Agency Securities, $4.0 million of corporate bonds and $14.7 million of equity securities. For the six months ended June 30, 2019, we sold $384.4 million of securities, comprised of $357.3 million of CMBS, no U.S. Agency Securities, $22.7 million of corporate bonds and $4.4 million of equity securities. The decrease of $19.1 million is a result of our financing and liquidity measures implemented to date in direct response to the COVID-19 pandemic. Other than temporary impairments on securities of $(0.3)$(0.1) million are included in realized gain (loss) on securities for the six months ended June 30, 2020,2021, compared to zero$(0.3) million for the six months ended June 30, 2019, an increase of $(0.3) million.2020.
Unrealized Gain (Loss) on Equity Securities
UnrealizedThe Company had no equity security activity during the six months ended June 30, 2021, compared to unrealized gain (loss) on equity securities representedof $(0.1) million for the six months ended June 30, 2020, compared to $1.1 million for the six months ended June 30, 2019.2020. The Company has elected the fair market value option for accounting for these equity securities and changes in fair value are recorded in current period earnings.
Unrealized Gain (Loss) on Agency Interest-Only Securities
The positive change of $0.2 million in unrealized gain (loss) on Agency interest-only securities was due to the mark-to-market adjustments on our securities portfolio.
Realized Gain (Loss) on Sale of Real Estate, Net
We had sold one retail property which resulted in a $19.4 million gain (loss) for the six months ended June 30, 2021. The increase of $11.6$8.9 million in realized gain (loss) on the sale of real estate, net was primarily a result of the commercial real estate and residential condominium sales discussed below.
During the six months ended June 30, 2020 and 2019, we sold no single-tenant net leased properties.
During the six months ended June 30, 2020, we soldsale of eight diversified commercial real estate properties resulting in a net gain (loss) on sale of $10.5 million. During the six months ended June 30, 2019, we sold two diversified commercial real estate properties resulting in a net gain (loss) on sale of $(1.3) million.
During the six months ended June 30, 2020, we sold three residential condominium units from Terrazas River Park Village in Miami, FL, resulting in a net gain on sale of $7.1 thousand. During the six months ended June 30, 2019, income from sales of residential condominiums totaled $0.4 million. We sold no residential condominium units from Veer Towers in Las Vegas, NV, but sold 13 residential condominium units from Terrazas River Park Village in Miami, FL, resulting in a net gain on sale of $0.4 million.
Impairment of Real Estate
There was no impairment of real estatemillion for the six months ended June 30, 2020. Impairment of real estate of $1.4 million was recorded for the six months ended June 30, 2019, attributable to the receipt of a lease termination payment on a single-tenant two-story office building in Wayne, NJ. See Note 5, Real Estate and Related Lease Intangibles, Net for further detail.
Fee and Other Income
We generated fee income from origination fees, exit fees and other fees on the loans we originate and in which we invest, unrealized gains (losses) on our investment in a mutual fund and dividend income on our investment in FHLB stock and equity securities. The $6.9$0.7 million decreaseincrease in fee and other income year-over-year was primarily due to a decreaseincrease in exit fees, offset by a decrease in origination fees and a realized loss on our investment in the Ladder Select Bond Fund (the “Fund”), a mutual fund.dividend income.
Net Result from Derivative Transactions
Net result from derivative transactions representedof $0.9 million is composed of a realized gain of $1.6 million and an unrealized loss of $0.7 million for the six months ended June 30, 2021, compared to a loss of $16.2 million, for the six months ended June 30, 2020, which was comprised of an unrealized loss of $0.2 million and a realized loss of $16.0 million, compared to a loss of $26.5 million, for the six months ended June 30, 2019, which was comprised of an unrealized gain of $1.5 million and a realized loss of $28.0 million, resulting in a positive change of $10.3$17.2 million. The hedge positions were related to fixed rate conduit loans and securities investments. The derivative positions that generated these results were a combination of interest rate futures that we employed in an effort to hedge the interest rate risk on the financing of our fixed rate assets and the net interest income we earn against the impact of changes in interest rates. The lossgain in 20202021 was primarily related to movement in interest rates during the six months ended June 30, 2020.2021. The total net result from derivative transactions is comprised of hedging interest expense, realized gains/losses related to hedge terminations and unrealized gains/losses related to changes in the fair value of asset hedges.
Earnings (Loss) from Investment in Unconsolidated Joint Ventures
Earnings from our investment in Grace Lake LLC totaled $0.4$0.6 million, and $1.0$0.3 million for the six months ended June 30, 20202021 and 2019,2020, respectively. Earnings (loss) from our investment in 24 Second Avenue totaled $0.5$0.1 million and $1.5$0.5 million for the six months ended June 30, 2021 and 2020, and 2019, respectively. The gain in the six months ended June 30, 2019 is due to a recapitalization of our investment in 24 Second Avenue. See Note 6, Investment in and Advances to Unconsolidated Joint Ventures, for further detail. The gain in the six months ended June 30, 2020 is attributable to equity and earnings on our investments.
Gain (Loss) on Extinguishment/Defeasance of DebtExtinguishment
We had no gain (loss) on extinguishment/defeasance of debt for the six months ended June 30, 2021. During the six months ended June 30, 2021, the Company redeemed $146.7 million of principal of the 2021 Notes at par. Gain (loss) on extinguishment/defeasance of debt totaled $21.1 million for the six months ended June 30, 2020. During the six months ended June 30, 2020, the Company retired $92.0 million of principal of the 2027 Notes for a repurchase price of $78.4 million, recognizing a $12.3 million net gain on extinguishment of debt after recognizing $(1.3) million of unamortized debt issuance costs associated with the retired debt,debt; the Company retired $49.2 million of principal of the 2025 Notes for a repurchase price of $42.6 million, recognizing a $6.2 million net gain on extinguishment of debt after recognizing $(0.5) million of unamortized debt issuance costs associated with the retired debt,debt; the Company retired $14.4 million of principal of the 2022 Notes for a repurchase price of $13.8 million, recognizing a $0.6 million net gain on extinguishment of debt after recognizing $(0.1) million of unamortized debt issuance costs associated with the retired debt and,and; the Company retired $7.7 million of principal of the 2021 Notes for a repurchase price of $7.5 million, recognizing a $0.2 million net gain on extinguishment of debt after recognizing $(20.0) thousand of unamortized debt issuance costs associated with the retired debt..
Gain (loss) on extinguishment/defeasance of debt totaled $(1.1) million for the six months ended June 30, 2019. During the six months ended June 30, 2019, the Company paid off $6.6 million of mortgage loan financing, recognizing a loss on extinguishment of debt of $(1.1) million.debt.
Salaries and Employee Benefits
Salaries and employee benefits are comprised primarily of salaries, bonuses, equity based compensation and other employee benefits. The decrease of $14.5$6.0 million in compensation expense was primarily attributable to the fact that the Company recorded noa reduction in compensation expense related to bonuses due toresulting from the significant market disruption caused bytiming of the COVID-19 pandemic and the substantial economic uncertainty present in the commercial real estate market and overall economy duringpayment of equity based compensation for the six months ended June 30, 2021 compared to the six months ended June 30, 2020 along with a reduction in head count for June 30, 2021 as compared to June 30, 2020.
Operating Expenses
Operating expenses are primarily composed of professional fees, lease expense and technology expenses. The increasedecrease of $0.6$3.6 million was primarily related to an increase in professional fees, partially offset by a decrease in other operating expenses.professional fees.
Real Estate Operating Expenses
The increasedecrease of $2.5$1.4 million in real estate operating expenseis primarily relates to the saleresult of real estate in 2019 andsales throughout 2020.
Fee Expense
Fee expense is comprised primarily of custodian fees, financing costs and servicing fees related to loans. The increase of $0.5$0.4 million in fee expense was primarily attributable to an increase in legal fees onrelated to mortgage loan receivables and real estate.
Depreciation and Amortization
The $0.3$0.8 million decrease in depreciation and amortization is primarily attributable to the timing of the real estate sales or acquisitions during each quarter.
Income Tax (Benefit) Expense
Most of our consolidated income tax provision relates to the business units held in our TRSs. The increasedecrease in benefit of ($4.5 million) in income tax (benefit) expense$4.0 million is primarily a result of a reduction in net interest incometaxable gains in our TRSs as well as the release of an uncertain tax position, partially offset by a limitation on losses from derivative activity and interest expense deductions.TRSs.
Liquidity and Capital Resources
The management of our liquidity and capital diversity and allocation strategies is critical to the success and growth of our business. We manage our sources of liquidity to complement our asset composition and to diversify our exposure across multiple capital markets and counterparties.
We require substantial amounts of capital to support our business. The management team, in consultation with our board of directors, establishes our overall liquidity and capital allocation strategies. A key objective of those strategies is to support the execution of our business strategy while maintaining sufficient ongoing liquidity throughout the business cycle to service our financial obligations as they become due. When making funding and capital allocation decisions, members of our senior management consider business performance; the availability of, and costs and benefits associated with, different funding sources; current and expected capital markets and general economic conditions; our asset composition and capital structure; and our targeted liquidity profile and risks relating to our funding needs.
To ensure that Ladder Capital can effectively address the funding needs of the Company on a timely basis, we maintain a diverse array of liquidity sources including (1) cash and cash equivalents; (2) cash generated from operations; (3) proceeds from the issuance of the unsecured bonds; (4) borrowings under repurchase agreements; (5) principal repayments on investments including mortgage loans and securities; (6) borrowings under our revolving credit facility; (7) proceeds from securitizations and sales of loans; (8) proceeds from the sale of securities; (9) proceeds from the sale of real estate; (10) proceeds from the issuance of CLO debt and other non-mark-to-market loan financing; (11) a significant and financeable unencumbered asset base; and (12) proceeds from the issuance of equity capital. We use these funding sources to meet our obligations on a timely basis.
Our primary uses of liquidity are for (1) the funding of loan and real estate-related investments; (2) the repayment of short-term and long-term borrowings and related interest; (3) the funding of our operating expenses; and (4) distributions to our equity investors to comply with the REIT distribution requirements and the terms of LCFH’s LLLP Agreement.requirements. We require short-term liquidity to fund loans that we originate and hold on our consolidated balance sheet pending sale, including through whole loan sale, participation, or securitization. We generally require longer-term funding to finance the loans and real estate-related investments that we hold for investment. We have historically used the aforementioned funding sources to meet the operating and investment needs as they have arisen and have been able to do so by applying a rigorous approach to long and short-term cash and debt forecasting.
In addition, as a REIT, we are also required to make sufficient dividend payments to our shareholders (and equivalent distributions to the Continuing LCFH Limited Partners) in amounts at least sufficient to maintain outour REIT status. Under IRS guidance, we may elect to pay a portion of our dividends in stock, subject to a cash/stock election by our shareholders, to optimize our level of capital retention. Accordingly, our cash requirement to pay dividends to maintain REIT status could be substantially reduced at the discretion of the board.
Our principal debt financing sources include: (1) long-term senior unsecured notes in the form of corporate bonds,bonds; (2) borrowings on both a short- and long-term committed basis, made by Tuebor from the FHLB,FHLB; (3) long term non-recourse mortgage financing,financing; (4) committed secured funding provided by banks and other lenders,lenders; and (5) uncommitted secured funding sources, including asset repurchase agreements with a number of banks.
In the future, we may also use other sources of financing to fund the acquisition of our assets, including credit facilities, warehouse facilities, repurchase facilities and other secured and unsecured forms of borrowing. These financings may be collateralized or non-collateralized, may involve one or more lenders and may accrue interest at either fixed or floating rates. We may also seek to raise further equity capital or issue debt securities in order to fund our future investments.
Refer to our “Financing Strategy in the Current Market Conditions” and “Financial Covenants” for further disclosure surrounding management’s actions under the current market conditions related to the COVID-19 pandemic. Refer toand “Our Financing Strategies” for further disclosure of our diverse financing sources and, for a summary of our financial obligations, refer to the Contractual Obligations table below. All of our existing financial obligations due within the following year can be extended for one or more additional years at our discretion, refinanced or repaid at maturity or are incurred in the normal course of business (i.e., interest payments/loan funding obligations).
Cash, Cash Equivalents and Restricted Cash
We held cash, cash equivalents and restricted cash of $874.0 million$1.3 billion at June 30, 2020,2021, of which $826.1 million$1.2 billion was unrestricted cash and cash equivalents and $47.9$115.8 million was restricted cash. We held cash and cash equivalents of $1.3 billion and restricted cash of $355.7$29.9 million atas of December 31, 2019, of which $58.2 million was unrestricted cash and cash equivalents and $297.6 million was restricted cash.2020. As the COVID-19 crisis evolved, management implemented a plan to mitigate the uncertainty in financial markets by increasing liquidity and obtaining additional non-recourse and non-mark-to-market financing.
Cash Flows
The following table provides a breakdown of the net change in our cash, cash equivalents, and restricted cash ($ in thousands):
| | | | Six Months Ended June 30, | | | | | | | | | | | | |
| | | 2020 | | 2019 | | | Six Months Ended June 30, |
| | | | | | | 2021 | | 2020 | |
| Net cash provided by (used in) operating activities | Net cash provided by (used in) operating activities | $ | 43,453 | | | $ | 132,545 | | | Net cash provided by (used in) operating activities | $ | (9,748) | | | $ | 43,453 | | |
| Net cash provided by (used in) investing activities | Net cash provided by (used in) investing activities | 433,309 | | | (49,378) | | | Net cash provided by (used in) investing activities | 310,302 | | | 433,309 | | |
| Net cash provided by (used in) financing activities | Net cash provided by (used in) financing activities | 41,496 | | | 33,816 | | | Net cash provided by (used in) financing activities | (299,151) | | | 41,496 | | |
| Net increase (decrease) in cash, cash equivalents and restricted cash | Net increase (decrease) in cash, cash equivalents and restricted cash | $ | 518,258 | | | $ | 116,983 | | | Net increase (decrease) in cash, cash equivalents and restricted cash | $ | 1,403 | | | $ | 518,258 | | |
We experienced a net increase in cash, cash equivalents and restricted cash of $1.4 million for the six months ended June 30, 2021 reflecting cash used in operating activities of $(9.7) million, cash provided by investing activities of $310.3 million and cash used in finance activities of $(299.2) million.
Net cash used in operating activities of $(9.7) million was primarily driven by $(76.4) million of originations of mortgage loans held for sale, partially offset by $51.1 million of proceeds from sales of mortgage loans held for sale and depreciation $19.0 million.
Net cash provided by investing activities of $310.3 million was driven by $603.0 million of repayment from mortgage loan receivables, $339.2 million of proceeds from sale of real estate securities, $46.6 million of proceeds from the sale of mortgage loan receivables held for investment and $82.5 million proceeds from the sale of real estate, partially offset by $(101.4) million in purchases of real estate securities and $(795.7) million of origination of mortgage loans held for investment.
Net cash used in financing activities of $(299.2) million was primarily as a result of net borrowings of $(232.0) million, $(51.1) million of dividends payments, $(4.4) million of shares acquired to satisfy minimum federal and state tax withholdings on restricted stock and $(10.1) million in deferred financing costs.
We experienced a net increase in cash, cash equivalents and restricted cash of $518.3 million for the six months ended June 30, 2020, compared to a net increase in cash, cash equivalents and restricted cash of $117.0 million for the six months ended June 30, 2019.2020. During the six months ended June 30, 2020, we received (i) $437.8 million of proceeds from repayment of mortgage loans receivable, (ii) $421.2 million of proceeds from the sales of loans, (iii) $532.5 million of proceeds from the sales of real estate securities, (iv) $63.0 million of repayment of real estate securities and (v) $144.4 million net borrowings under debt obligations.
Unencumbered Assets
As of June 30, 2020,2021, we held unencumbered cash of $826.1 million,$1.2 billion, unencumbered loans of $1.4$1.7 billion, unencumbered securities of $18.2$128.4 million, unencumbered real estate of $82.4$74.8 million and $372.5$236.9 million of other assets not secured by any portion of secured indebtedness.
Stock Repurchases
On October 30, 2014, the board of directors authorized the Company to makerepurchase up to $50.0 million in repurchases of the Company’s Class A common stock from time to time without further approval. Stock repurchases by the Company are generally made for cash in open market transactions at prevailing market prices but may also be made in privately negotiated transactions or otherwise. The timing and amount of purchases are determined based upon prevailing market conditions, our liquidity requirements, contractual restrictions and other factors. As of June 30, 2020,2021, the Company has a remaining amount available for repurchase of $39.5$36.8 million, which represents 4.2%2.5% in the aggregate of its outstanding Class A common stock, based on the closing price of $8.10$11.54 per share on such date. Refer to Item 1—“Financial Statements—Note 11, Equity Structure and Accounts” for disclosure
The following table is a summary of the Company’s repurchase activity.activity of its Class A common stock during the six months ended June 30, 2021 ($ in thousands):
| | | | | | | | | | | | | | |
| | Shares | | Amount(1) |
| Authorizations remaining as of December 31, 2020 | | | | $ | 38,102 | |
| Additional authorizations | | | | — | |
| Repurchases paid | | 120,000 | | | (1,312) | |
| Repurchases unsettled | | | | — | |
| Authorizations remaining as of June 30, 2021 | | | | $ | 36,790 | |
(1)Amount excludes commissions paid associated with share repurchases.
Dividends
ToIn order for the Company to maintain ourits qualification as a REIT under the Code, weit must annually distribute at least 90% of ourits taxable income. Consistent withThe Company has paid and in the guidance provided in Revenue Procedure 2017-45, we have paid several of our past dividends in a combination of cash and stock and may pay future distributions in such a manner; however, the REIT distribution requirements limit our abilityintends to retain earnings and thereby replenish or increase capital for operations. We believe that our significant capital resources and access to financing will provide us with financial flexibility at levels sufficient to meet current and anticipated capital requirements, including funding new investment opportunities, payingdeclare regular quarterly distributions to ourits shareholders and servicing our debt obligations.in aggregating to an amount approximating at least 90% of the REIT’s annual net taxable income. Refer to Item 1—“1 —“Financial Statements—Statements and Supplemental Data—Note 11, Equity Structure and Accounts” for disclosure of dividends declared.
Principal repayments on investments
97
Consistent with IRS guidance we may, subject to a cash/stock election by our shareholders, pay a portionthe normal course of our dividends in stock,business. Repayment of mortgage loan receivables provided net cash of $603.1 million for the six months ended June 30, 2021 and $437.8 million for the six months ended June 30, 2020. Repayment of real estate securities provided net cash of $106.3 million for the six months ended June 30, 2021 and $63.0 million for the six months ended June 30, 2020.
Proceeds from securitizations and sales of loans
We sell our conduit mortgage loans to provide for meaningful capital retention; however, the REIT distribution requirements limit our abilitysecuritization trusts and to retain earnings and thereby replenish or increase capital for operations. The timing and amount of future distributions is based on a number of factors, including, among other things, our future operations and earnings, capital requirements and surplus, general financial condition and contractual restrictions. All dividend declarations are subject to the approvalthird parties as part of our boardnormal course of directors. Generally, we expectbusiness. There were $97.6 million of proceeds from sales of mortgage loans for the distributions to be taxable as ordinary dividends to our shareholders, whether paid in cash or a combinationsix months ended June 30, 2021 and $421.2 million of cash and common stock, and not as a tax-free returnsales of capital. Refer to Item 1—“Financial Statements—Note 11, Equity Structure and Accounts”mortgage loans for tax treatment of dividends. We believe that our significant capital resources and access to financing will provide the financial flexibility at levels sufficient to meet current and anticipated capital requirements, including funding new investment opportunities, paying distributions to our shareholders and servicing our debt obligations.six months ended June 30, 2020.
Our captive insurance company subsidiary, Tuebor, is subject to state regulations which require that dividends may only be made with regulatory approval. LargelyProceeds from the sale of securities
We sell our investments in CMBS, U.S. Agency securities, corporate bonds and equity securities as a resultpart of this restriction, $2.0 billionour normal course of Tuebor’s member’s capital was restrictedbusiness. Proceeds from transfer via dividend to Tuebor’s parent without prior approvalsales of state insurance regulators atsecurities provided net cash of $339.2 million for the six months ended June 30, 2020. To facilitate intercompany cash funding of operations2021 and investments, Tuebor and its parent maintain regulator-approved intercompany borrowing/lending agreements.
The Company established a broker-dealer subsidiary, Ladder Capital Securities LLC (“LCS”), which was initially licensed and capitalized to do business in July 2010. LCS is required to be compliant with Financial Industry Regulatory Authority (“FINRA”) and SEC regulations, which require that dividends may only be made with regulatory approval. Largely as a result of this restriction, $1.1$532.5 million of LCS’s member’s capital was restricted from transfer to LCS’s parent without prior approval of regulators atfor the six months ended June 30, 2020. LCS deregistered with
Proceeds from the SEC effective May 28, 2020. On May 29, 2020, LCS filed a broker-dealer withdrawal form with FINRA, which became effective on July 28,sale of real estate
Proceeds from sales of real estate provided net cash of $82.5 million for the six months ended June 30, 2021 and $11.4 million for the six months ended June 30, 2020.
Other Potential Sourcespotential sources of Financingfinancing
In the future, we may also use other sources of financing to fund the acquisition of our assets, including credit facilities, warehouse facilities, repurchase facilities and other secured and unsecured forms of borrowing. These financings may be collateralized or non-collateralized, may involve one or more lenders and may accrue interest at either fixed or floating rates. We may also seek to raise further equity capital or issue debt securities in order to fund our future investments.
Contractual Obligationsobligations
Contractual obligations as of June 30, 20202021 were as follows ($ in thousands):
| | | Contractual Obligations | | | | | | | | | | | | | | | | | | | | | | | | | | | |
| | Less than 1 Year | | 1-3 Years | | 3-5 Years | | More than 5 Years | | Total | | Contractual Obligations |
| | | | | | | | | | | | Less than 1 Year | | 1-3 Years | | 3-5 Years | | More than 5 Years | | Total |
| Secured financings | Secured financings | $ | 1,392,879 | | (1) | $ | 715,476 | | | $ | 579,603 | | | $ | 279,578 | | | $ | 2,967,536 | | Secured financings | $ | 631,068 | | (1) | $ | 606,120 | | | $ | 417,234 | | | $ | 232,840 | | | $ | 1,887,262 | |
| Unsecured revolving credit facility | 266,430 | | (1) | — | | | — | | | — | | | 266,430 | | |
| | Senior unsecured notes | Senior unsecured notes | — | | | 744,060 | | | — | | | 1,008,757 | | | 1,752,817 | | Senior unsecured notes | 465,850 | | | 347,956 | | | 1,301,838 | | | 2,115,644 | |
| Interest payable(2) | Interest payable(2) | 134,961 | | | 155,370 | | | 92,759 | | | 65,138 | | | 448,228 | | Interest payable(2) | 136,698 | | | 208,037 | | | 176,845 | | | 137,078 | | | 658,658 | |
| Other funding obligations(3) | Other funding obligations(3) | 249,240 | | | — | | | — | | | — | | | 249,240 | | Other funding obligations(3) | 15,539 | | | — | | | — | | | — | | | 15,539 | |
| Payments pursuant to tax receivable agreement | 104 | | | 208 | | | 208 | | | 1,039 | | | 1,559 | | |
| | Operating lease obligations | Operating lease obligations | 590 | | | 1,279 | | | — | | | — | | | 1,869 | | Operating lease obligations | 590 | | | 98 | | | — | | | — | | | 688 | |
| Total | Total | $ | 2,044,204 | | | $ | 1,616,393 | | | $ | 672,570 | | | $ | 1,354,512 | | | $ | 5,687,679 | | Total | $ | 1,249,745 | | | $ | 814,255 | | | $ | 942,035 | | | $ | 1,671,756 | | | $ | 4,677,791 | |
(1) As more fully disclosed in Note 7, Debt Obligations, Net, these obligations are subject to existing Company controlled extension options for one or more additional one-year periods or could be refinanced by other existing facilities.
(2) Composed of interest on secured financings and on senior unsecured notes. For borrowings with variable interest rates, we used the rates in effect as of June 30, 20202021 to determine the future interest payment obligations. Represents amounts payable through contractual maturity, including short-term securities repurchase agreements.
(3) Comprised primarily of our off-balance sheet unfunded commitment to provide additional first mortgage loan financing as of June 30, 2020.
The table above does not include amounts due under our derivative agreements as those contracts do not have fixed and determinable payments. Our contractual obligations will be refinanced and/or repaid from earnings as well as amortization and sales of our liquid collateral.
Off-Balance Sheet Arrangements
We have made investments in various unconsolidated joint ventures. See Note 6, Investment in and Advances to Unconsolidated Joint Ventures, for further details ofabout our unconsolidated investments. Our maximum exposure to loss from these investments is limited to the carrying value of our investments.
Unfunded Loan Commitments
We may be a party to financial instruments with off-balance sheet risk in the normal course of business to meet the financial needs of our borrowers. These commitments are not reflected on the consolidated balance sheets. As of June 30, 2020,2021, our off-balance sheet arrangements consisted of $249.2$245.1 million of unfunded commitments of mortgage loan receivables held for investment, 62%59% of which additional funds relate to the occurrence of certain “good news” events, such as the owner concluding a lease agreement with a major tenant in the building or reaching some pre-determined net operating income. As of December 31, 2019,2020, our off-balance sheet arrangements consisted of $286.5$148.8 million of unfunded commitments of mortgage loan receivables held for investment to provide additional first mortgage loan financing. Such commitments are subject to our borrowers’ satisfaction of certain financial and nonfinancial covenants and involve, to varying degrees, elements of credit risk in excess of the amount recognized in the consolidated balance sheets. Commitments are subject to our loan borrowers’ satisfaction of certain financial and nonfinancial covenants and may or may not be funded depending on a variety of circumstances including timing, credit metric hurdles, and other nonfinancial events occurring. The COVID-19 pandemic has impacted the progress of work generally and, depending on specific property locations, the progress of capital expenditures, construction, and leasing, which have been delayed and/or slower paced than originally anticipated. The progress of those particular projects located in Statesstates or local municipalities with continuing restrictions on such activities is anticipated to remain slower to complete than otherwise expected, and the pace of future funding relating to these capital needs has been, and may continue to be, commensurately slower.
Critical Accounting Policies
See “Management’s Discussion and Analysis of Financial Condition and Results of Operations—Critical Accounting Estimates” within the Annual Report for a full discussion of our critical accounting policies. Other than as disclosed in Note 2, Significant Accounting Policies, our critical accounting policies have not materially changed since December 31, 2019.2020.
Recently Adopted Accounting Pronouncements and Recent Accounting Pronouncements Pending Adoption
Our recently adopted accounting pronouncements and recent accounting pronouncements pending adoption are described in Item 1—“Financial Statements—Statements and Supplemental Data—Note 2,2. Significant Accounting Policies.”
Reconciliation of Non-GAAP Financial Measures
Core EarningsDistributable earnings
We present coreFor the fourth quarter of 2020, the Company began utilizing distributable earnings, which is a non-GAAP financial measure, as a supplemental measure of our operating performance. We believe coredistributable earnings assists investors in comparing our operating performance and our ability to pay dividends across reporting periods on a more relevant and consistent basis by excluding from GAAP measures certain non-cash expenses and unrecognizedunrealized results as well as eliminating timing differences related to securitization gains and changes in the values of assets and derivatives. In addition, we use coredistributable earnings: (i) to evaluate our earnings from operations and (ii) because management believes that it may be a useful performance measure for us. Coreus and (ii) because our board of directors considers distributable earnings is also used as a factor in determining the annual incentive compensationamount of quarterly dividends. Distributable earnings replaced our senior managersprior presentation of core earnings, and other employees.core earnings presentations from prior reporting periods have been recast as distributable earnings.
We consider the Class A common shareholders of the Company and Continuing LCFH Limited Partners to have fundamentally equivalent interests in our pre-tax earnings. Accordingly, for purposes of computing core earnings we start with pre-tax earnings and adjust for other noncontrolling interest in consolidated joint ventures but we do not adjust for amounts attributable to noncontrolling interest held by Continuing LCFH Limited Partners.
We define coredistributable earnings as income before taxes adjusted for: (i) real estate depreciation and amortization; (ii) the impact of derivative gains and losses related to the hedging of assets on our balance sheet as of the end of the specified accounting period; (iii) unrealized gains/(losses) related to our investments in fair value securities and passive interest in unconsolidated joint ventures; (iv) economic gains on loan sales not recognized under GAAP accounting for which risk has substantially transferred during the period and the exclusion of resultant GAAP recognition of the related economics during the subsequent periods; (v) adjustmentunrealized provision for CECL reserves;loan losses and unrealized real estate impairment; (vi) realized provisions for loan losses and realized real estate impairment; (vii) non-cash stock-based compensation; and (vii)(viii) certain transactional items. For the purpose of computing distributable earnings, management recognizes loan and real estate losses as being realized generally in the period in which the asset is sold or the Company determines a decline in value to be non-recoverable and the loss to be nearly certain.
For coredistributable earnings, we include adjustments for economic gains on loan sales not recognized under GAAP accounting for which risk has substantially transferred during the period and exclusion ofexclude the resultant GAAP recognition of the related economics during the subsequent periods. This adjustment is reflected in coredistributable earnings when there is a true risk transfer on the mortgage loan transfer and settlement. Historically, this adjustment has represented the impact of economic gains/(discounts) on intercompany loans secured by our own real estate which we had not previously recognized because such gains were eliminated in consolidation. Conversely, if the economic risk was not substantially transferred, no adjustments to net income would be made relating to those transactions for coredistributable earnings purposes. Management believes recognizing these amounts for coredistributable earnings purposes in the period of transfer of economic risk is a reasonable supplemental measure of our performance.
As discussed in Note 2 to the consolidated financial statements included elsewhere in this Quarterly Report, we do not designate derivatives as hedges to qualify for hedge accounting and therefore any net payments under, or fluctuations in the fair value of, our derivatives are recognized currently in our GAAP income statement. However, fluctuations in the fair value of the related assets are not included in our income statement. We consider the gain or loss on our hedging positions related to assets that we still own as of the reporting date to be “open hedging positions.” While recognized for GAAP purposes, we exclude the results on the hedges from coredistributable earnings until the related asset is sold and the hedge position is considered “closed,” whereupon they would then be included in coredistributable earnings in that period. These are reflected as “Adjustments for unrecognized derivative results” for purposes of computing coredistributable earnings for the period. We believe that excluding these specifically identified gains and losses associated with the open hedging positions adjusts for timing differences between when we recognize changes in the fair values of our assets and changes in the fair value of the derivatives used to hedge such assets.
As more fully discussed in Note 2 to the consolidated financial statements included elsewhere in this Quarterly Report, our investments in Agency interest-only securities and equity securities are recorded at fair value with changes in fair value recorded in current period earnings. We believe that excluding these specifically identified gains and losses associated with the fair value securities adjusts for timing differences between when we recognize changes in the fair values of our assets.
Our results of operations were significantly impacted by With regard to securities valuation, distributable earnings includes a decline in fair value deemed to be an other-than-temporary impairment for GAAP purposes only if the actions we tookdecline is determined to generate liquidity and pay down mark-to-market debtbe nearly certain to be eventually realized. In those cases, an impairment is included in direct response to the unfavorable market conditions that occurred near the onset of the COVID-19 pandemic. The actions taken by management had multiple impacts on coredistributable earnings for the three months ended June 30, 2020. Management believes the actions taken were prompted by the unusual market conditions and therefore outside of Ladder’s core operations. Management believes adjusting for certain transactional charges/gains related to the impact of COVID-19 on its performance measures provides a more useful guide to assess the ongoing core operations of the Company.period in which such determination was made.
Set forth below is a reconciliation of income (loss) before taxes to core earnings ($ in thousands):
| | | | | | | | | | | | | | | | | | | | | | | | | | | | | |
| | Three Months Ended June 30, | | | | Six Months Ended June 30, | | | | | |
| | 2020 | | 2019 | | 2020 | | 2019 | | | |
| | | | | | | | | | | |
| Income (loss) before taxes | | $ | (5,743) | | | $ | 38,292 | | | $ | (24,345) | | | $ | 59,970 | | | | |
| Net (income) loss attributable to noncontrolling interest in consolidated joint ventures (GAAP)(1) | | 246 | | | 299 | | | (1,276) | | | 738 | | | | |
| Our share of real estate depreciation, amortization and gain adjustments(2)(3) | | 8,875 | | | 6,590 | | | 10,248 | | | 12,257 | | | | |
| Adjustments for unrecognized derivative results(4) | | (8,630) | | | 2,187 | | | 8,959 | | | 11,302 | | | | |
| Unrealized (gain) loss on fair value securities | | (1,649) | | | 861 | | | (137) | | | (1,227) | | | | |
| Adjustment for economic gain on loan sales not recognized under GAAP for which risk has been substantially transferred, net of reversal/amortization | | 189 | | | (645) | | | (45) | | | (648) | | | | |
| Adjustment for CECL reserves | | (729) | | | — | | | 17,852 | | | — | | | | |
| Non-cash stock-based compensation | | 3,272 | | | 3,371 | | | 15,431 | | | 15,465 | | | | |
| Transactional adjustments (response to COVID-19)(5) | | 16,939 | | | — | | | 16,939 | | | — | | | | |
| Core earnings | | $ | 12,770 | | | $ | 50,955 | | | $ | 43,626 | | | $ | 97,857 | | | | |
Set forth below is an unaudited reconciliation of income (loss) before taxes to distributable earnings ($ in thousands):
| | | | | | | | | | | | | | | | | | | | | | | | | | | | | | |
| | | | Three Months Ended June 30, | | Six Months Ended June 30, |
| | | | | | 2021 | | 2020 | | 2021 | | 2020 |
| Income (loss) before taxes | | | | | $ | 10,139 | | | $ | (5,743) | | | $ | 9,796 | | | $ | (24,345) | |
| Net (income) loss attributable to noncontrolling interests in consolidated joint ventures (GAAP)(1) | | | | | (163) | | | 246 | | | (403) | | | (1,276) | |
| Our share of real estate depreciation, amortization and gain adjustments (2) | | | | | (2,430) | | | 8,875 | | | 5,994 | | | 10,248 | |
| Adjustments for unrecognized derivative results (3) | | | | | 1,800 | | | (8,630) | | | (4,296) | | | 8,959 | |
| Unrealized (gain) loss on fair value securities | | | | | 48 | | | (1,649) | | | 68 | | | (137) | |
| Adjustment for economic gain on loan sales not recognized under GAAP for which risk has been substantially transferred, net of reversal/amortization | | | | | 781 | | | 189 | | | 1,197 | | | (45) | |
| Adjustment for impairment (4) | | | | | (335) | | | (729) | | | (4,586) | | | 17,852 | |
| Non-cash stock-based compensation | | | | | 3,524 | | | 3,272 | | | 8,823 | | | 15,431 | |
| Transactional adjustments (response to COVID-19) (5) | | | | | — | | — | | 16,939 | | | — | | | 16,939 | |
| Distributable earnings | | | | | $ | 13,364 | | | $ | 12,770 | | | $ | 16,593 | | | $ | 43,626 | |
(1) Includes $4Prior to the final exchanges of the Continuing LCFH Limited Partners into Class A shares in the third quarter of 2020, we considered the Class A common shareholders of the Company and Continuing LCFH Limited Partners to have had fundamentally equivalent interests in our pre-tax earnings. Accordingly, for purposes of computing distributable earnings we start with pre-tax earnings and adjust for other noncontrolling interests in consolidated joint ventures, but we did not adjust for amounts attributable to noncontrolling interest held by Continuing LCFH Limited Partners. As of June 30, 2021, there are no remaining Continuing LCFH Limited Partners. For the three and six months ended June 30, 2021, $3.9 thousand and $7$7.8 thousand of net income which arewas included inwithin net (income) loss attributable to noncontrolling interestinterests in operating partnershipconsolidated joint ventures on the consolidated statements of income, forrespectively. For the three and six months endedJune 30, 2020, respectively. Includes $8$3.9 thousand and $16$7.0 thousand of net income which arewas included inwithin net (income) loss attributable to noncontrolling interestinterests in operating partnershipOperating Partnership on the consolidated statements of income, for the three and six months endedJune 30, 2019, respectively.
| | | | | | | | | | | | | | | | | | | | | | | | | | | | | |
| (2) | The following is a reconciliation of GAAP depreciation and amortization to our share of real estate depreciation, amortization and gain adjustments presented in the computation of core earnings in the preceding table ($ in thousands): | | | | | | | | | | |
| | | | | | | | | | | |
| | Three Months Ended June 30, | | | | Six Months Ended June 30, | | | | | |
| | 2020 | | 2019 | | 2020 | | 2019 | | | |
| | | | | | | | | | | |
| Total GAAP depreciation and amortization | $ | 9,816 | | | $ | 9,935 | | | $ | 19,825 | | | $ | 20,162 | | | | |
| Less: Depreciation and amortization related to non-rental property fixed assets | (25) | | | (25) | | | (50) | | | (49) | | | | |
| Less: Non-controlling interest in consolidated joint ventures’ share of accumulated depreciation and amortization and unrecognized passive interest in unconsolidated joint ventures | (349) | | | (1,070) | | | (941) | | | (1,976) | | | | |
| Our share of real estate depreciation and amortization | 9,442 | | | 8,840 | | | 18,834 | | | 18,137 | | | | |
| | | | | | | | | | | |
| Realized gain from accumulated depreciation and amortization on real estate sold (see below) | (40) | | | (1,935) | | | (9,679) | | | (5,421) | | | | |
| Less: Non-controlling interest in consolidated joint ventures’ share of accumulated depreciation and amortization on real estate sold | — | | | 42 | | | 2,147 | | | 42 | | | | |
| Our share of accumulated depreciation and amortization on real estate sold | (40) | | | (1,893) | | | (7,532) | | | (5,379) | | | | |
| | | | | | | | | | | |
| Less: Operating lease income on above/below market lease intangible amortization | (527) | | | (357) | | | (1,054) | | | (501) | | | | |
| | | | | | | | | | | |
| Our share of real estate depreciation, amortization and gain adjustments | $ | 8,875 | | | $ | 6,590 | | | $ | 10,248 | | | $ | 12,257 | | | | |
| | | | | | | | | | | |
| GAAP gains/losses on sales of real estate include the effects of previously recognized real estate depreciation and amortization. For purposes of core earnings, our share of real estate depreciation and amortization is eliminated and, accordingly, the resultant gain/losses also must be adjusted. Following is a reconciliation of the related consolidated GAAP amounts to the amounts reflected in core earnings ($ in thousands): | | | | | | | | | | |
| | | | | | | | | | | |
| | Three Months Ended June 30, | | | | Six Months Ended June 30, | | | | | |
| | 2020 | | 2019 | | 2020 | | 2019 | | | |
| | | | | | | | | | | |
| GAAP realized gain (loss) on sale of real estate, net | $ | (1) | | | $ | (1,124) | | | $ | 10,528 | | | $ | (1,119) | | | | |
| Adjusted gain/loss on sale of real estate for purposes of core earnings | 41 | | | $ | 3,017 | | | (2,996) | | | 6,498 | | | | |
| Our share of accumulated depreciation and amortization on real estate sold | $ | 40 | | | $ | 1,893 | | | $ | 7,532 | | | $ | 5,379 | | | | |
| | | | | | | | | | | |
| (3) | As more fully discussed in Note 5, Real Estate and Related Intangibles, Net, Note 7, Debt Obligations, Net and Note 15, Fair Value of Financial Instruments to the Company’s Consolidated Financial Statements for the three months ended March 31, 2019, the Company recognized $5.7 million of operating lease income from prepayment of a lease, a $1.1 million loss on extinguishment of debt and a $1.4 million impairment of real estate related to a single-tenant two-story office building in Wayne, NJ. This property was sold on May 1, 2019. For core earnings, the Company recognizes the net impact of these events in the period the sale was realized. Accordingly, the $3.3 million net impact of the income and losses discussed above were excluded from core earnings for the three months ended March 31, 2019 and have been included in core earnings for the three and six months ended June 30, 2019. | | | | | | | | | | |
| | | | | | | | | | | |
| | | | | | | | | | | | | | | | | | | | | | | | | | | | | | | |
| | |
| | | | | | | | | | | | | |
| | | | Three Months Ended June 30, | | Six Months Ended June 30, | |
| | | | | | 2021 | | 2020 | | 2021 | | 2020 | |
| Total GAAP depreciation and amortization | | | | | $ | 9,464 | | | $ | 9,816 | | | $ | 19,000 | | | $ | 19,825 | | |
| Less: Depreciation and amortization related to non-rental property fixed assets | | | | | (25) | | | (25) | | | (50) | | | (50) | | |
| Less: Non-controlling interests in consolidated joint ventures’ share of accumulated depreciation and amortization and unrecognized passive interest in unconsolidated joint ventures | | | | | (633) | | | (349) | | | (1,241) | | | (941) | | |
| Our share of real estate depreciation and amortization | | | | | 8,806 | | | 9,442 | | | 17,709 | | | 18,834 | | |
| Realized gain from accumulated depreciation and amortization on real estate sold (refer to below) | | | | | (10,752) | | | (40) | | | (10,752) | | | (9,679) | | |
| Less: Non-controlling interests in consolidated joint ventures’ share of accumulated depreciation and amortization on real estate sold | | | | | — | | | — | | | — | | | 2,147 | | |
| Our share of accumulated depreciation and amortization on real estate sold (a) | | | | | (10,752) | | | (40) | | | (10,752) | | | (7,532) | | |
| Less: Operating lease income on above/below market lease intangible amortization | | | | | (484) | | | (527) | | | (963) | | | (1,054) | | |
| Our share of real estate depreciation, amortization and gain adjustments | | | | | $ | (2,430) | | | $ | 8,875 | | | $ | 5,994 | | | $ | 10,248 | | |
| | | | | | | | | | | | | |
| | (4) | The following is a reconciliation of GAAP net results from derivative transactions to our unrecognized derivative result presented in the computation of core earnings in the preceding table ($ in thousands): | | |
| | | (a) GAAP gains/losses on sales of real estate include the effects of previously recognized real estate depreciation and amortization. For purposes of distributable earnings, our share of real estate depreciation and amortization is eliminated and, accordingly, the resultant gain/losses also must be adjusted. Following is a reconciliation of the related consolidated GAAP amounts to the amounts reflected in distributable earnings ($ in thousands): | |
| | | Three Months Ended June 30, | | | Six Months Ended June 30, | | | | | Three Months Ended June 30, | | Six Months Ended June 30, | |
| | 2020 | | 2019 | | 2020 | | 2019 | | | | 2021 | | 2020 | | 2021 | | 2020 | |
| | | | | | | | | | | | GAAP realized gain (loss) on sale of real estate, net | | $ | 19,389 | | | $ | (1) | | | $ | 19,389 | | | $ | 10,528 | | |
| | Net results from derivative transactions | $ | (813) | | | $ | (15,457) | | | $ | (16,248) | | | $ | (26,491) | | | | Adjusted gain/loss on sale of real estate for purposes of distributable earnings | | (8,637) | | | 41 | | | (8,637) | | | (2,996) | | |
| | Hedging interest expense | (843) | | | 1,640 | | | (311) | | | 1,491 | | | | Our share of accumulated depreciation and amortization on real estate sold | | $ | 10,752 | | | $ | 40 | | | $ | 10,752 | | | $ | 7,532 | | |
| | Hedging realized result | 10,286 | | | 11,630 | | | 7,600 | | | 13,698 | | | | | | | | | | | | |
| | Adjustments for unrecognized derivative results | $ | 8,630 | | | $ | (2,187) | | | $ | (8,959) | | | $ | (11,302) | | | |
| (5)(3) | (5)(3) | The impact from COVID-19 included adjustments related to the unusual market conditions and actions taken by management including: (a) $6.7 million of losses from sales of performing first mortgage loans included in sale of loans, net, (b) $15.4 million of losses from sales of CMBS, (c) $3.7 million of loss from conduit loan sales, (d) $6.5 million of prepayment penalties related to pay downs of mark-to-market debt included in interest expense, (e) $2.1 million of professional fee expenses included in operating expenses and (f) $0.2 million of severance costs included in salaries and employee benefits. The $34.5 million total of the preceding amounts was partially offset by (g) $19.0 million of gains from the repurchase of and extinguishment of unsecured corporate bond debt at a discount from par, net of (h) $1.5 million of accelerated premium amortization included in interest expense. | | (5)(3) | The following is a reconciliation of GAAP net results from derivative transactions to our unrecognized derivative result presented in the computation of distributable earnings in the preceding table ($ in thousands): | |
| | | | | Three Months Ended June 30, | | Six Months Ended June 30, | |
| | | | 2021 | | 2020 | | 2021 | | 2020 | |
| | | Net results from derivative transactions | | $ | (3,844) | | | $ | (813) | | | $ | 927 | | | $ | (16,248) | | |
| | | Hedging interest expense | | 1,289 | | | (843) | | | 2,287 | | | (311) | | |
| | | Hedging realized result | | 755 | | | 10,286 | | | 1,082 | | | 7,600 | | |
| | | Adjustments for unrecognized derivative results | | $ | (1,800) | | | $ | 8,630 | | | $ | 4,296 | | | $ | (8,959) | | |
| | (4) | | (4) | For the six months ended June 30, 2020, the Company recorded CECL provision for loan loss of $25.9 million of which $8.0 million was determined to be non-recoverable. The adjustments reflect the portion of such loan loss provision that management has determined to be recoverable, and therefore both additional provisions and releases of those provisions are excluded from distributable earnings. | |
| (5) | | (5) | The impact from COVID-19 included adjustments related to the unusual market conditions and actions taken by management in the second quarter of 2020 including: (i) $6.7 million of losses from sales of performing first mortgage loans included in sale of loans, net; (ii) $15.4 million of losses from sales of CMBS; (iii) $3.7 million of loss from conduit loan sales; (iv) $6.5 million of prepayment penalties related to pay downs of mark-to-market debt included in interest expense; (v) $2.1 million of professional fee expenses included in operating expenses and (vi) $0.2 million of severance costs included in salaries and employee benefits. The $34.5 million total of the preceding amounts was partially offset by (vii) $19.0 million of gains from the repurchase of, and extinguishment of, unsecured corporate bond debt at a discount from par, net of (viii) $1.5 million of accelerated premium amortization included in interest expense. | |
|
(b)Set forth below is a reconciliation of the COVID-19 losses from sales of highly rated, relatively short duration CMBS in the second quarter of 2020 as referenced in (5) above ($ in thousands):
| | | | | | | | | | | | | | | | | | | | | | | | | | |
| Three Months Ended June 30, | | | | Six Months Ended June 30, | | | | | |
| 2020 | | 2019 | | 2020 | | 2019 | | | |
| | | | | | | | | | |
| Loss on sale of securities - COVID-19 related | $ | (14,670) | | | $ | — | | | $ | (14,670) | | | $ | — | | | | |
| Hedge (loss) related to sale of securities, included in net results from derivative transactions | (698) | | | — | | | (698) | | | — | | | | |
| Losses from sales of CMBS | $ | (15,368) | | | $ | — | | | $ | (15,368) | | | $ | — | | | | |
| | | | | | | | | | |
| | | Three and Six Months Ended June 30, | |
| | | | | 2020 | |
| Loss on sale of securities - COVID-19 related | | | | | $ | (14,670) | | |
| Hedge (loss) related to sale of securities, included in net results from derivative transactions | | | | | (698) | | |
| Losses from sales of CMBS | | | | | $ | (15,368) | | |
(c)Set forth below is a reconciliation of the COVID-19 loss from conduit loan sales in the second quarter of 2020 as referenced in (5) above ($ in thousands):
| | | | | | | | | | | | | | | | | | | | | | | | | | |
| Three Months Ended June 30, | | | | Six Months Ended June 30, | | | | | |
| 2020 | | 2019 | | 2020 | | 2019 | | | |
| | | | | | | | | | |
| Income from sales of loans, net - COVID-19 related | $ | (1,680) | | | $ | — | | | $ | (1,680) | | | $ | — | | | | |
| Hedge (loss) related to sales of loans, included in net results from derivative transactions | (1,994) | | | — | | | (1,994) | | | — | | | | |
| Losses from conduit loan sales | $ | (3,674) | | | $ | — | | | $ | (3,674) | | | $ | — | | | | |
| | | | | | | | | | |
| | | Three and Six Months Ended June 30, | |
| | | | | 2020 | |
| Income from sales of loans, net - COVID-19 related | | | | | $ | (1,680) | | |
| Hedge (loss) related to sales of loans, included in net results from derivative transactions | | | | | (1,994) | | |
| Losses from conduit loan sales | | | | | $ | (3,674) | | |
| | | | | | |
Core
Distributable earnings has limitations as an analytical tool. Some of these limitations are:
•CoreDistributable earnings does not reflect the impact of certain cash charges resulting from matters we consider not to be indicative of our ongoing operations and is not necessarily indicative of cash necessary to fund cash needs; and
•otherOther companies in our industry may calculate coredistributable earnings differently than we do, limiting its usefulness as a comparative measure.
Because of these limitations, coredistributable earnings should not be considered in isolation or as a substitute for net income (loss) attributable to shareholders or any other performance measures calculated in accordance with GAAP, or as an alternative to cash flows from operations as a measure of our liquidity.
In the future we may incur gains and losses that are the same as or similar to some of the adjustments in this presentation. Our presentation of coredistributable earnings should not be construed as an inference that our future results will be unaffected by unusual or non-recurring items.
Adjusted Leverage
We present adjusted leverage, which is a non-GAAP financial measure, as a supplemental measure of our performance. We define adjusted leverage as the ratio of (i) debt obligations, net of deferred financing costs, adjusted for non-recourse indebtedness related to securitizations that is consolidated on our GAAP balance sheet and liability for transfers not considered sales to (ii) GAAP total equity. We believe adjusted leverage assists investors in comparing our leverage across reporting periods on a consistent basis by excluding non-recourse debt related to securitized loans. In addition, adjusted leverage is used to determine compliance with financial covenants. (Refer to “Financing Strategy in Current Market Conditions” and “Financial Covenants” for further discussion about our compliance with covenants.)
Set forth below is an unaudited computation of adjusted leverage ($ in thousands):
| | | June 30, 2020 | | December 31, 2019 | | June 30, 2021 | | December 31, 2020 |
| | Debt obligations, net | Debt obligations, net | $ | 4,953,514 | | | $ | 4,859,873 | | Debt obligations, net | $ | 3,975,715 | | | $ | 4,209,864 | |
| Less: CLO debt | Less: CLO debt | (299,605) | | | — | | Less: CLO debt | (168,843) | | | (276,516) | |
| | Adjusted debt obligations | Adjusted debt obligations | 4,653,909 | | | 4,859,873 | | Adjusted debt obligations | 3,806,872 | | | 3,933,348 | |
| Total equity | Total equity | 1,508,380 | | | 1,638,977 | | Total equity | 1,519,865 | | | 1,548,425 | |
| Adjusted leverage | Adjusted leverage | 3.1 | | | 3.0 | | Adjusted leverage | 2.5 | | | 2.5 | |
(1)As more fully discussed in Note 7 to our consolidated financial statements, we contributed $481.3 million of balance sheet loans into one CLO securitization that remains on our balance sheet for accounting purposes but is excluded from debt obligations for adjusted leverage calculation purposes.
Item 3. Quantitative and Qualitative Disclosures about Market Risk
For a discussion of current market conditions resulting from the COVID-19 pandemic, refer to Part I, Item 2. “Management’s Discussion and Analysis of Financial Condition and Results of Operations” and to Part II, Item 1A. “Risk Factors”.Factors.”
Interest Rate Risk
The nature of the Company’s business exposes it to market risk arising from changes in interest rates. Changes, both increases and decreases, in the rates the Company is able to charge its borrowers, the yields the Company is able to achieve in its securities investments, and the Company’s cost of borrowing directly impacts its net income. The Company’s net interest income includes interest from both fixed and floating-rate debt. The percentage of the Company’s assets and liabilities bearing interest at fixed and floating rates may change over time, and asset composition may differ materially from debt composition. Another component of interest rate risk is the effect changes in interest rates will have on the market value of the assets the Company acquires. The Company faces the risk that the market value of its assets will increase or decrease at different rates than that of its liabilities, including its hedging instruments. The Company mitigates interest rate risk through utilization of hedging instruments, primarily interest rate swap and futures agreements. Interest rate swap and futures agreements are utilized to hedge against future interest rate increases on the Company’s borrowings and potential adverse changes in the value of certain assets that result from interest rate changes. The Company generally seeks to hedge assets that have a duration longer than five years, including newly originated conduit first mortgage loans, securities in the Company’s CMBS portfolio if long enough in duration, and most of its U.S. Agency Securitiessecurities portfolio.
The following table summarizes the change in net income for a 12-month period commencing June 30, 20202021 and the change in fair value of our investments and indebtedness assuming an increase or decrease of 100 basis points in the LIBOR interest rate on June 30, 2020,2021, both adjusted for the effects of our interest rate hedging activities ($ in thousands):
| | | Projected change
in net income(1) | | Projected change
in portfolio
value | | Projected change
in net income(1) | | Projected change
in portfolio
value |
| | Change in interest rate: | Change in interest rate: | | Change in interest rate: | | | |
| Decrease by 1.00% | Decrease by 1.00% | $ | (7,340) | | | $ | 10,608 | | Decrease by 1.00% | (1,896) | | | $ | 4,513 | |
| Increase by 1.00% | Increase by 1.00% | 9,533 | | | (10,483) | | Increase by 1.00% | 18,782 | | | (3,533) | |
(1) Subject to limits for floors on our floating rate investments and indebtedness.
Market Value Risk
As market volatility increases or liquidity decreases, the market value of the Company’s assets may be adversely impacted.
The Company’s securities investments are reflected at their estimated fair value. The change in estimated fair value of securities available-for-sale is reflected in accumulated other comprehensive income. The change in estimated fair value of Agency interest-only securities is recorded in current period earnings. The estimated fair value of these securities fluctuates primarily due to changes in interest rates and other factors. Generally, in a rising interest rate environment, the estimated fair value of these securities would be expected to decrease; conversely, in a decreasing interest rate environment, the estimated fair value of these securities would be expected to increase. As market volatility increases or liquidity decreases,We continue to actively monitor the market valueimpacts of the Company’s assets may be adversely impacted. COVID-19 on our securities portfolio.
The Company’s fixed rate mortgage loan portfolio is subject to the same risks. However, to the extent those loans are classified as held for sale, they are reflected at the lower of cost or market. Otherwise, held for investment mortgage loans are reflected at values equal to the unpaid principal balances net of certain fees, costs and loan loss allowances.
Concentrations of market risk may exist with respect to the Company’s investments. Market risk is a potential loss the Company may incur as a result of change in the fair values of its investments. The Company may also be subject to risk associated with concentrations of investments in geographic regions and industries.
Liquidity Risk
Market disruptions may lead to a significant decline in transaction activity in all or a significant portion of the asset classes in which the Company invests and may at the same time lead to a significant contraction in short-term and long-term debt and equity funding sources. A decline in liquidity of real estate and real estate-related investments, as well as a lack of availability of observable transaction data and inputs, may make it more difficult to sell the Company’s investments or determine their fair values. As a result, the Company may be unable to sell its investments, or only be able to sell its investments at a price that may be materially different from the fair values presented. Also, in such conditions, there is no guarantee that the Company’s borrowing arrangements or other arrangements for obtaining leverage will continue to be available or, if available, will be available on terms and conditions acceptable to the Company. In addition, a decline in market value of the Company’s assets may have particular adverse consequences in instances where it borrowed money based on the fair value of its assets. A decrease in the market value of the Company’s assets may result in the lender requiring it to post additional collateral or otherwise sell assets at a time when it may not be in the Company’s best interest to do so. The Company’s captive insurance company subsidiary, Tuebor, is subject to state regulations which require that dividends may only be made with regulatory approval. Theapproval, limiting the Company’s broker-dealer subsidiary, LCS, is also requiredability to be compliant with FINRA and SEC regulations which require that dividends may only be made with regulatory approval. LCS deregistered with the SEC effective May 28, 2020. On May 29, 2020, LCS filed a broker-dealer withdrawal form with FINRA, which became effective on July 28, 2020.utilize cash held by Tuebor.
Credit Risk
The Company is subject to varying degrees of credit risk in connection with its investments. The Company seeks to manage credit risk by performing deep credit fundamental analyses of potential assets and through ongoing asset management. The Company’s investment guidelines do not limit the amount of its equity that may be invested in any type of its assets; however, investments greater than a certain size are subject to approval by the Risk and Underwriting Committee of the board of directors.
The continuing COVID-19 pandemic has significantly impacted the commercial real estate markets, causing reduced occupancy, requests from tenants for rent deferral or abatement, and delays in property renovations currently planned or underway. These negative conditions, which have subsided recently, may persist intooccur again in the future as a result of COVID-19 variants and the governmental responses thereto, and impair borrowers’ ability to pay principal and interest due under our loan agreements. We maintain robust asset management relationships with our borrowers and have utilized these relationships to address the potentialongoing impacts of the COVID-19 pandemic on our loans secured by properties experiencing cash flow pressure, most significantly hospitality assets. Some of our borrowers have indicated that due to the impact of the COVID-19 pandemic, they will be unable to timely execute their business plans, have had to temporarily close their businesses, or have experienced other negative business consequences and have requested temporary interest deferral or forbearance, or other modifications of their loans. Accordingly, we have discussed with our borrowers potential near-term defensive loan modifications, which could include repurposing of reserves, temporary deferrals of interest, or performance test or covenant waivers on loans collateralized by assets directly impacted by the COVID-19 pandemic, and which would typically be coupled with an additional equity commitment and/or guaranty from sponsors.
Based on the limited loan modifications completed to date, we are encouraged by the tone of these conversations and our borrowers’ initial response to the COVID-19 pandemic’s impacts on their properties. We believe our loan sponsors are generally committed to supporting assets collateralizing our loans through additional equity investments. Our portfolio’s low weighted-average LTV of 70.4%68.1% as of June 30, 20202021 reflects significant equity value that our sponsors are motivated to protect through periods of cyclical disruption. While we believe the principal amounts of our loans are generally adequately protected by underlying collateral value, there is a risk that we will not realize the entire principal value of certain investments.
Credit Spread Risk
Credit spread risk is the risk that interest rate spreads between two different financial instruments will change. In general, fixed-rate commercial mortgages and CMBS are priced based on a spread to Treasury or interest rate swaps. The Company generally benefits if credit spreads narrow during the time that it holds a portfolio of mortgage loans or CMBS investments, and the Company may experience losses if credit spreads widen during the time that it holds a portfolio of mortgage loans or CMBS investments. The Company actively monitors its exposure to changes in credit spreads and the Company may enter into credit total return swaps or take positions in other credit related derivative instruments to moderate its exposure against losses associated with a widening of credit spreads.
Risks Related to Real Estate
Real estate and real estate-related assets, including loans and commercial real estate-related securities, are subject to volatility and may be affected adversely by a number of factors, including, but not limited to, national, regional and local economic conditions (which may be adversely affected by industry slowdowns and other factors); local real estate conditions; changes or continued weakness in specific industry segments; construction quality, age and design; demographic factors; environmental conditions; competition from comparable property types or properties; changes in tenant mix or performance and retroactive changes to building or similar codes and rent regulations. In addition, decreases in property values reduce the value of the collateral and the potential proceeds available to a borrower to repay the underlying loans, which could also cause the Company to suffer losses.
Covenant Risk
In the normal course of business, the Company enters into loan and securities repurchase agreements and credit facilities with certain lenders to finance its real estate investment transactions. These agreements contain, among other conditions, events of default and various covenants and representations. If such events are not cured by the Company or waived by the lenders, the lenders may decide to curtail or limit extension of credit, and the Company may be forced to repay its advances or loans. In addition, the Company’s Notes are subject to covenants, including maintenance of unencumbered assets, limitations on the incurrence of additional debt, restricted payments, liens, sales of assets, affiliate transactions and other covenants typical for financings of this type. The Company’s failure to comply with these covenants could result in an event of default, which could result in the Company being required to repay these borrowings before their due date.
We were in compliance with all covenants as described in the Company’s Annualthis Quarterly Report as of June 30, 2020.
Net of the $826.1 million of unrestricted cash held as of June 30, 2020, our adjusted leverage ratio would be significantly below 3.0x. In late March 2020, as the COVID-19 crisis evolved, management began executing on a plan to mitigate uncertainty in financial markets by increasing liquidity and obtaining additional non-recourse and non-mark-to-market financing. Partly as a result of maintaining conservative cash levels as of March 31, 2020, the Company was not in compliance with its 3.5x maximum leverage covenant with certain of its lenders but had the benefit of a contractually provided 30-day cure period during which the Company cured such non-compliance by paying down debt (as defined in the relevant borrowing agreements). Refer to Financing Strategy in Current Market Conditions for further disclosures surrounding deleveraging actions completed during the second quarter of 2020. 2021.
Diversification Risk
The assets of the Company are concentrated in the commercial real estate sector. Accordingly, the investment portfolio of the Company may be subject to more rapid change in value than would be the case if the Company were to maintain a wide diversification among investments or industry sectors. Furthermore, even within the commercial real estate sector, the investment portfolio may be relatively concentrated in terms of geography and type of real estate investment. This lack of diversification may subject the investments of the Company to more rapid change in value than would be the case if the assets of the Company were more widely diversified.
Concentrations of Market Risk
Concentrations of market risk may exist with respect to the Company’s investments. Market risk is a potential loss the Company may incur as a result of change in the fair values of its investments. The Company may also be subject to risk associated with concentrations of investments in geographic regions and industries.
Regulatory Risk
The Company established a broker-dealer subsidiary, LCS, which was initially licensed and capitalized to do business in July 2010. LCS is required to be compliant with FINRA and SEC requirements on an ongoing basis and is subject to multiple operating and reporting requirements to which all broker-dealer entities are subject. LCS deregistered with the SEC effective May 28, 2020. On May 29, 2020, LCS filed a broker-dealer withdrawal form with FINRA, which became effective on July 28, 2020. Ladder Capital Asset Management LLC (“LCAM”) is a registered investor. LCAM is required to be compliant with SEC requirements on an ongoing and is subject to multiple operating and reporting requirements to which all registered investment advisors are subject. On June 22, 2020, LCAM deregistered with the SEC. Additionally, Tuebor is subject to state regulation as a captive insurance company. If LCS, or Tuebor failfails to comply with regulatory requirements, theyit could be subject to loss of theirits licenses and registration and/or economic penalties.
Capital Market Risks
The COVID-19 pandemic has resulted in extreme volatility in a variety of global markets, including the real estate-related debt markets. U.S. financial markets, in particular, are experiencing limited liquidity, and forced selling by certain market participants to meet current obligations has put further downward pressure on asset prices. In reaction to these volatile and unpredictable market conditions, banks and other lenders have generally restricted lending activity and requested margin posting or repayments where applicable for secured loans collateralized by assets with depressed valuations. Ladder has satisfied all margin calls on a timely basis.
Item 4. Controls and Procedures
Disclosure Controls and Procedures
The Company’s management, with the participation of the Chief Executive Officer and the Chief Financial Officer, conducted an evaluation of the effectiveness of the design and operation of our disclosure controls and procedures as required by Rules 13a-15 and 15d-15 under the Exchange Act as of June 30, 2020.2021. Based upon that evaluation, the Chief Executive Officer and Chief Financial Officer have concluded that our disclosure controls and procedures were effective, as of June 30, 2020,2021, to provide reasonable assurance that information required to be disclosed by us in reports that we file or submit under the Exchange Act is recorded, processed, summarized and reported within the time periods specified in the applicable rules and forms, and that it is accumulated and communicated to our management, including our Chief Executive Officer and Chief Financial Officer, as appropriate to allow timely decisions regarding required disclosure. A control system, no matter how well conceived and operated, can provide only reasonable, not absolute, assurance that the objectives of the control system are met. Further, the design of a control system must reflect the fact that there are resource constraints and the benefits of controls must be considered relative to their costs. Due to the inherent limitations in all control systems, no evaluation of controls can provide absolute assurance that all control issues and instances of fraud, if any, have been detected.
Changes in Internal Control Over Financial Reporting
There were no changes in our internal control over financial reporting (as defined in Rule 13a-15(f) under the Exchange Act) during the quarter ended June 30, 20202021 that have materially affected, or are reasonably likely to materially affect, our internal control over financial reporting.
Part II - Other Information
Item 1. Legal Proceedings
From time to time, we may be involved in litigation and claims incidental to the conduct of our business in the ordinary course. Further, certain of our subsidiaries, includingsuch as our registered broker-dealer, registered investment advisers and captive insurance company, are subject to scrutiny by government regulators, which could result in enforcement proceedings or litigation related to regulatory compliance matters. LCS deregistered with the SEC effective May 28, 2020. On May 29, 2020, LCS filed a broker-dealer withdrawal form with FINRA, which became effective on July 28, 2020. On June 22, 2020, LCAM deregistered with the SEC. We are not presently a party to any material enforcement proceedings, litigation related to regulatory compliance matters or any other type of material litigation matters. We maintain insurance policies in amounts and with the coverage and deductibles we believe are adequate, based on the nature and risks of our business, historical experience and industry standards.
Item 1A. Risk Factors
There have been no material changes during the sixthree months ended June 30, 20202021 to the risk factors in Item 1A. in our Annual Report, except as set forth below:Report.
The outbreak of the novel coronavirus (COVID-19) has had, and will continue to have for the foreseeable future, an adverse effect on our business, financial condition and results of operations, and we are unable to predict the full extent or nature of these impacts at this time.
In December 2019, a novel strain of coronavirus (“COVID-19”) was reported in Wuhan, China. The World Health Organization has declared the COVID-19 outbreak a pandemic and public health emergency of international concern. Public health officials have recommended and mandated precautions to mitigate the spread of COVID-19, including the closing of non-essential businesses, prohibitions on congregating in heavily populated areas and shelter-in-place orders or similar measures. As the COVID-19 pandemic develops, governments, businesses and other third parties will likely continue to implement restrictions or policies that adversely impact consumer spending, global capital markets, the global economy and stock prices.
The continued spread of COVID-19 globally has had, and is likely to continue to have for the foreseeable future, a material adverse effect on the global and U.S. economies as a whole, as well as on the states and cities where we own properties or have properties as collateral. A prolonged economic downturn could adversely and materially affect our business, results of operations and financial condition.
The COVID-19 outbreak is negatively impacting almost every industry, whether directly or indirectly. Businesses have been, continue to be or may periodically be, required by the local, state or federal authorities to cease or reduce operations, thereby preventing them from generating revenue. The extent of the effects will depend, in part, upon the breadth and duration of these economic shutdowns. The effects on commercial real estate have varied by sector and market. Some properties securing our loans to borrowers or owned by us, including hotels and certain retail properties, have experienced, or are likely to experience, material disruptions to their businesses from the end consumer and underlying property tenants. These disruptions could lead to or continue to cause a material decline in operating cash flows from these assets, and could impact our borrowers’ ability to pay debt service or property expenses or repay our loans to them at maturity or affect our ability to service our own borrowings secured by these loans or properties. Further, long-term structural changes may affect the value of certain businesses and properties. For example, restaurants have been required to reduce capacity and other businesses have moved to, and may continue, remote work arrangements, which may reduce the demand for certain types of office space. Without the requirement to be close to the office, many cities have experienced a flight to local suburbs that has led to reduced multifamily rental occupancy.
In addition, it is possible that there could be a return of volatility to the credit markets, which may impact our ability to access capital on favorable terms, or at all. Our ability to execute on one or more of our business models, such as the origination of loans for securitization, may be adversely affected by the underlying economic and credit market disruptions. In addition, the effects of the outbreak on credit markets, tenants and borrowers negatively affected, and may in the future negatively affect, the prices of securities that we hold, which resulted in, and may in the future result in, margin calls under our repurchase agreements. To the extent we are not able to satisfy such margin calls, it would result in a default under such repurchase agreements and could result in a default under our other debt instruments, including our senior secured credit agreement or the indentures governing our notes.
The COVID-19 crisis has created uncertainty regarding the valuation of commercial properties. Continuing uncertainty or a significant drop in prices may affect the ability of our borrowers to refinance loans we have extended to them and/or may impact the value of real estate we own. In addition, if loans we have extended become impaired, we may be required to establish reserves against losses, which can impact our earnings and/or our liquidity.
The ultimate extent of the COVID-19 outbreak and its impact on our business, global markets and overall economic activity are unknown and impossible to predict with certainty at this time.
Item 2. Unregistered Sales of Equity Securities and Use of Proceeds
During the three months ended June 30, 2020, 6,779,225 Series REIT LP Units and 6,779,225 Series TRS LP Units were collectively exchanged for 6,779,225 shares of Class A common stock and 6,779,225 shares of Class B common stock were canceled. We received no other consideration in connection with these exchanges, which were effected in reliance on Section 4(a)(2) of the Securities Act.
Stock Repurchases
On October 30, 2014, the board of directors authorized the Company to repurchase up to $50.0 million of the Company’s Class A common stock from time to time without further approval. Stock repurchases by the Company are generally made for cash in open market transactions at prevailing market prices but may also be made in privately negotiated transactions or otherwise. The timing and amount of purchases are determined based upon prevailing market conditions, our liquidity requirements, contractual restrictions and other factors.
The following table is a summary of the Company’s repurchase activity of its Class A common stock during the three months ended June 30, 2020 ($ in thousands, except per share data and average price paid per share):
| | | | | | | | | | | | | | | | | | | | | | | | | | |
| ISSUER PURCHASE OF EQUITY SECURITIES | | | | | | | | |
| | | | | | | | |
| Period | | Total Number of Shares Purchased | | Average Price Paid per Share | | Total Number of Shares Purchased as Part of Publicly Announced Plans or Programs(1) | | Approximate Dollar Value of Shares that May Yet Be Purchased Under the Plans or Programs |
| | | | | | | | |
| | | | | | | | |
| | | | | | | | |
| | | | | | | | |
| | | | | | | | |
| | | | | | | | |
| | | | | | | | |
| | | | | | | | |
| | | | | | | | |
| | | | | | | | |
| | | | | | | | |
| | | | | | | | |
| | | | | | | | |
| | | | | | | | |
| | | | | | | | |
| | | | | | | | |
| April 1, 2020 - April 30, 2020 | | — | | | $ | — | | | — | | | $ | 39,931 | |
| May 1, 2020 - May 31, 2020 | | — | | | — | | | — | | | 39,931 | |
| June 1, 2020 - June 30, 2020 | | 63,998 | | | 7.52 | | | 63,998 | | | 39,450 | |
| | | | | | | | |
| | | | | | | | |
| | | | | | | | |
| | | | | | | | |
| | | | | | | | |
| | | | | | | | |
| | | | | | | | |
| Total | | 63,998 | | | $ | 7.52 | | | 63,998 | | | $ | 39,450 | |
(1)In August 2015, we publicly disclosed that our board of directors had authorized the Company to repurchase up to $50.0 million of the Company’s Class A common stock from time to time.None.
Item 3. Defaults Upon Senior Securities
None.
Item 4. Mine Safety Disclosures
Not applicable.
Item 5. Other Information
None.
Item 6. Exhibits
| | | | | | | | |
| EXHIBIT INDEX | | |
| | |
EXHIBIT
NO. | | DESCRIPTION |
| | |
| | |
| | |
| | |
| | |
| | Purchase Right,Indenture, dated as of April 30, 2020, by andJune 23, 2021, among Ladder Capital CorpFinance Holdings LLLP, Ladder Capital Finance Corporation, the guarantors party thereto and Beaverhead Capital, LLCWilmington Trust, National Association, as trustee (incorporated by reference to Exhibit 4.1 to the Company’sCompany's Current Report on Form 8-K, filed on May 4, 2020)June 23, 2021). |
| | |
| | |
| | |
| | |
| | |
| | |
| | |
| 101 | | Interactive Data Files Pursuant to Rule 405 of Regulation S-T: (i) the Consolidated Balance Sheets as of June 30, 20202021 and December 31, 2019;2020; (ii) the Consolidated Statements of Income for the three and six months ended June 30, 20202021 and 2019;2020; (iii) the Consolidated Statements of Comprehensive Income for the three and six months ended June 30, 20202021 and 2019;2020; (iv) the Consolidated Statement of Changes in Equity for the three and six months ended June 30, 20202021 and 2019;2020; (v) the Consolidated Statements of Cash Flows for the three and six months ended June 30, 20202021 and 2019;2020; and (vi) the Notes to the Consolidated Financial Statements. |
| 104 | | Cover Page Interactive Data File (formatted in inline XBRL and contained in Exhibit 101) |
* The certifications attached hereto as Exhibits 32.1 and 32.2 are furnished to the SEC pursuant to Section 906 of the Sarbanes-Oxley Act of 2002 and shall not be deemed “filed” for purposes of Section 18 of the Exchange Act, nor shall they be deemed incorporated by reference in any filing under the Securities Act, except as shall be expressly set forth by specific reference in such filing.
SIGNATURES
Pursuant to the requirements of the Securities Exchange Act of 1934, the Registrant has duly caused this report to be signed on its behalf by the undersigned, thereunto duly authorized.
| | | | | | | | | | | |
| | | LADDER CAPITAL CORP | |
| | | (Registrant) | |
| | | |
| | | |
Date: July 30, 20202021 | | By: | /s/ BRIAN HARRIS |
| | | | Brian Harris |
| | | | Chief Executive Officer |
| | | |
Date: July 30, 20202021 | | By: | /s/ MARC FOXPAUL J. MICELI |
| | | | Marc FoxPaul J. Miceli |
| | | | Chief Financial Officer |