SECURITIES AND EXCHANGE COMMISSION
WASHINGTON, DC 20549
FORM 10-Q10-Q/A
| QUARTERLY REPORT PURSUANT TO SECTION 13 OR 15(d) OF THE SECURITIES EXCHANGE ACT OF 1934 |
For the Period Ended March 31,September 30, 2018
OR
| TRANSITION REPORT PURSUANT TO SECTION 13 OR 15(d) OF THE SECURITIES EXCHANGE ACT OF 1934 |
Commission File Number 000-51274
FRONTIER FUNDS
FRONTIER DIVERSIFIED FUND;
FRONTIER MASTERS FUND;
FRONTIER LONG/SHORT COMMODITY FUND;
FRONTIER BALANCED FUND;
FRONTIER SELECT FUND;
FRONTIER WINTON FUND;
FRONTIER HERITAGE FUND
(Exact Name of Registrant as specified in its Charter)
| Delaware | 36-6815533 |
(State of Organization) | (IRS Employer |
Identification No.) |
c/o Frontier Fund Management LLC
25568 Genesee Trail Road
Golden, Colorado 80401
(Address of Principal Executive Offices)
(303) 454-5500
(Registrant’s Telephone Number)
Securities to be registered pursuant to Section 12(b) of the Act: None
Securities registered pursuant to Section 12(g) of the Act:
Frontier Diversified Fund Class 1, Class 2 and Class 3 Units;
Frontier Long/Short Commodity Fund Class 2, Class 3, Class 1a, Class 2a and Class 3a Units;
Frontier Masters Fund Class 1, Class 2 and Class 3 Units;
Frontier Balanced Fund Class 1, Class 1AP, Class 2, Class 2a and Class 3a Units;
Frontier Select Fund Class 1, Class 1AP and Class 2 Units;
Frontier Winton Fund Class 1, Class 1AP and Class 2 Units;
Frontier Heritage Fund Class 1, Class 1AP and Class 2 Units
Indicate by check mark whether the registrant: (1) has filed all reports required to be filed by Section 13 or 15(d) of the Securities Exchange Act of 1934 during the preceding 12 months (or for such shorter period that the registrant was required to file such reports), and (2) has been subject to such filing requirements for the past 90 days. Yes x☒ No o☐
Indicate by check mark whether the registrant has submitted electronically and posted on its corporate Web site, if any, every Interactive Data File required to be submitted and posted pursuant to Rule 405 of Regulation S-T (§232.405 of this chapter) during the preceding 12 months (or for such shorter period that the registrant was required to submit and post such files) Yes x☒ No o☐
Indicate by check mark whether the registrant is a large accelerated filer, an accelerated filer, a non-accelerated filer, or a smaller reporting company. See the definitions of “large accelerated filer,” “accelerated filer” and “smaller reporting company” in Rule 12b-2 of the Exchange Act.
| Large Accelerated Filer | Accelerated Filer | ||
| Non-Accelerated Filer | Smaller reporting company |
Indicate by check mark whether the registrant is a shell company (as defined in Rule 12b-2 of the Exchange Act). Yes o☐ Nox ☒
EXPLANATORY NOTE
The purpose of this amendment to the form 10-Q for the quarter ended September 30, 2018 of Frontier Funds, as filed with the Securities and Exchange Commission on November 19, 2018, is to furnish corrections regarding the presentation within the Statement of Financial Condition for the Trust. Net Assets of the Trust did not change as a result of this correction.
PART I – FINANCIAL INFORMATION
| (1) | These financial statements represent the consolidated financial statements of the Series of the Trust. |
23
Special Note About Forward-Looking Statements
THIS REPORT CONTAINS STATEMENTS WHICH CONSTITUTE FORWARD-LOOKING STATEMENTS WITHIN THE MEANING OF THE PRIVATE SECURITIES LITIGATION REFORM ACT OF 1995 AND OTHER FEDERAL SECURITIES LAWS. THESE FORWARD-LOOKING STATEMENTS REFLECT THE MANAGING OWNER’S CURRENT EXPECTATIONS ABOUT THE FUTURE RESULTS, PERFORMANCE, PROSPECTS AND OPPORTUNITIES OF THE TRUST. THE MANAGING OWNER HAS TRIED TO IDENTIFY THESE FORWARD-LOOKING STATEMENTS BY USING WORDS SUCH AS “MAY,” “WILL,” “EXPECT,” “ANTICIPATE,” “BELIEVE,” “INTEND,” “SHOULD,” “ESTIMATE” OR THE NEGATIVE OF THOSE TERMS OR SIMILAR EXPRESSIONS. THESE FORWARD-LOOKING STATEMENTS ARE BASED ON INFORMATION CURRENTLY AVAILABLE TO THE MANAGING OWNER AND ARE SUBJECT TO A NUMBER OF RISKS, UNCERTAINTIES AND OTHER FACTORS, BOTH KNOWN, SUCH AS THOSE DESCRIBED IN THE “RISK FACTORS” SECTION UNDER PART II ITEM 1A AND ELSEWHERE IN THIS REPORT AND UNKNOWN, THAT COULD CAUSE THE TRUST’S ACTUAL RESULTS, PERFORMANCE, PROSPECTS OR OPPORTUNITIES TO DIFFER MATERIALLY FROM THOSE EXPRESSED IN, OR IMPLIED BY, THESE FORWARD-LOOKING STATEMENTS.
YOU SHOULD NOT PLACE UNDUE RELIANCE ON ANY FORWARD-LOOKING STATEMENTS. EXCEPT AS EXPRESSLY REQUIRED BY THE FEDERAL SECURITIES LAWS, THE MANAGING OWNER UNDERTAKES NO OBLIGATION TO PUBLICLY UPDATE OR REVISE ANY FORWARD-LOOKING STATEMENTS OR THE RISKS, UNCERTAINTIES OR OTHER FACTORS DESCRIBED HEREIN, AS A RESULT OF NEW INFORMATION, FUTURE EVENTS OR CHANGED CIRCUMSTANCES OR FOR ANY OTHER REASON AFTER THE DATE OF THIS REPORT.
UNLESS EXPRESSLY STATED OTHERWISE, ALL INFORMATION IN THIS REPORT IS AS OF MARCH 31,SEPTEMBER 30, 2018, AND THE MANAGING OWNER UNDERTAKES NO OBLIGATION TO UPDATE THIS INFORMATION.
34
| ITEM 1. | Series Financial Statements |
| The Series of Frontier Funds |
| Statements of Financial Condition |
| Frontier | Frontier | Frontier | ||||||||||||||||||||||
| Diversified Fund | Masters Fund | Long/Short Commodity Fund | ||||||||||||||||||||||
| 31-03-18 | 31-12-17 | 31-03-18 | 31-12-17 | 31-03-18 | 31-12-17 | |||||||||||||||||||
| ASSETS | ||||||||||||||||||||||||
| Cash and cash equivalents | $ | 814,242 | $ | 189,890 | $ | 1,174,917 | $ | 411,695 | $ | 537,675 | $ | 152,200 | ||||||||||||
| U.S. Treasury securities, at fair value | 498,331 | 767,049 | 719,071 | 1,663,014 | 329,067 | 614,803 | ||||||||||||||||||
| Incentive fees receivable | — | — | — | — | 57,082 | 57,082 | ||||||||||||||||||
| Swap contracts, at fair value | 5,728,465 | 6,376,472 | — | — | 482,309 | 397,039 | ||||||||||||||||||
| Investments in private investment companies, at fair value | 12,752,564 | 14,501,510 | 6,757,265 | 8,407,168 | 2,469,005 | 3,018,571 | ||||||||||||||||||
| Investments in unconsolidated trading companies, at fair value | 1,501,319 | 2,225,210 | 529,514 | 1,501,142 | 62,698 | 121,510 | ||||||||||||||||||
| Interest receivable | 3,326 | 15,127 | 4,798 | 32,798 | 2,196 | 12,125 | ||||||||||||||||||
| Other assets | — | — | 32,555 | 2,973 | 22,031 | 5,122 | ||||||||||||||||||
| Total Assets | $ | 21,298,247 | $ | 24,075,258 | $ | 9,218,120 | $ | 12,018,790 | $ | 3,962,063 | $ | 4,378,452 | ||||||||||||
| LIABILITIES & CAPITAL | ||||||||||||||||||||||||
| LIABILITIES | ||||||||||||||||||||||||
| Owner redemptions payable | $ | 13,445 | $ | — | $ | 28,106 | $ | — | $ | 1,922 | $ | — | ||||||||||||
| Incentive fees payable to Managing Owner | 1,881 | 12,847 | — | — | — | — | ||||||||||||||||||
| Management fees payable to Managing Owner | 8,056 | 4,049 | 20,841 | 8,949 | — | — | ||||||||||||||||||
| Interest payable to Managing Owner | — | — | — | — | 135 | 103 | ||||||||||||||||||
| Service fees payable to Managing Owner | 2,972 | 3,614 | 2,955 | 3,570 | 96 | 172 | ||||||||||||||||||
| Trading fees payable to Managing Owner | 52,807 | 61,188 | 40,213 | 49,131 | 8,309 | 9,125 | ||||||||||||||||||
| Advance on unrealized Swap Appreciation | 2,500,000 | 2,500,000 | — | — | 115,000 | 115,000 | ||||||||||||||||||
| Other liabilities | 385 | 26,873 | — | — | — | — | ||||||||||||||||||
| Total Liabilities | 2,579,546 | 2,608,571 | 92,115 | 61,650 | 125,462 | 124,400 | ||||||||||||||||||
| CAPITAL | ||||||||||||||||||||||||
| Managing Owner - Class 2 | 3,089 | 3,361 | 75,155 | 87,344 | 11,651 | 11,999 | ||||||||||||||||||
| Managing Owner - Class 2a | — | — | — | — | 32,785 | 34,112 | ||||||||||||||||||
| Managing Owner - Class 3 | 196,052 | 213,164 | 29,454 | 34,209 | — | — | ||||||||||||||||||
| Managing Owner - Class 3a | — | — | — | — | 1,691 | 1,759 | ||||||||||||||||||
| Limited Owner - Class 1 | 1,919,307 | 2,332,222 | 2,422,157 | 2,913,542 | — | — | ||||||||||||||||||
| Limited Owner - Class 1a | — | — | — | — | 48,403 | 107,619 | ||||||||||||||||||
| Limited Owner - Class 2 | 8,347,298 | 9,629,385 | 2,499,445 | 3,451,256 | 179,696 | 246,901 | ||||||||||||||||||
| Limited Owner - Class 2a | — | — | — | — | 309,182 | 408,532 | ||||||||||||||||||
| Limited Owner - Class 3 | 8,252,955 | 9,288,555 | 4,099,794 | 5,470,789 | 2,344,659 | 2,472,994 | ||||||||||||||||||
| Limited Owner - Class 3a | — | — | — | — | 908,534 | 970,136 | ||||||||||||||||||
| Total Owners’ Capital | 18,718,701 | 21,466,687 | 9,126,005 | 11,957,140 | 3,836,601 | 4,254,052 | ||||||||||||||||||
| Non-Controlling Interests | — | — | — | — | — | — | ||||||||||||||||||
| Total Capital | 18,718,701 | 21,466,687 | 9,126,005 | 11,957,140 | 3,836,601 | 4,254,052 | ||||||||||||||||||
| Total Liabilities and Capital | $ | 21,298,247 | $ | 24,075,258 | $ | 9,218,120 | $ | 12,018,790 | $ | 3,962,063 | $ | 4,378,452 | ||||||||||||
| Units Outstanding | ||||||||||||||||||||||||
| Class 1 | 18,016 | 20,035 | 24,640 | 25,393 | N/A | N/A | ||||||||||||||||||
| Class 1a | N/A | N/A | N/A | N/A | 622 | 1,323 | ||||||||||||||||||
| Class 2 | 67,201 | 71,254 | 22,452 | 26,553 | 1,702 | 2,236 | ||||||||||||||||||
| Class 2a | N/A | N/A | N/A | N/A | 3,802 | 4,730 | ||||||||||||||||||
| Class 3 | 73,093 | 75,601 | 38,553 | 44,254 | 19,876 | 20,354 | ||||||||||||||||||
| Class 3a | N/A | N/A | N/A | N/A | 9,659 | 9,918 | ||||||||||||||||||
| Net Asset Value per Unit | ||||||||||||||||||||||||
| Class 1 | $ | 106.53 | $ | 116.41 | $ | 98.30 | $ | 114.74 | N/A | N/A | ||||||||||||||
| Class 1a | N/A | N/A | N/A | N/A | $ | 77.86 | $ | 81.35 | ||||||||||||||||
| Class 2 | $ | 124.26 | $ | 135.19 | $ | 114.67 | $ | 133.27 | $ | 112.44 | $ | 115.81 | ||||||||||||
| Class 2a | N/A | N/A | N/A | N/A | $ | 89.95 | $ | 93.59 | ||||||||||||||||
| Class 3 | $ | 115.59 | $ | 125.68 | $ | 107.10 | $ | 124.40 | $ | 117.97 | $ | 121.50 | ||||||||||||
| Class 3a | N/A | N/A | N/A | N/A | $ | 94.24 | $ | 97.99 | ||||||||||||||||
The accompanying notes are an integral part of these financial statements.
4
| Frontier | Frontier | Frontier | ||||||||||||||||||||||||||||||||||||||
| Frontier Balanced Fund | Frontier Select Fund | Diversified Fund | Masters Fund | Long/Short Commodity Fund | ||||||||||||||||||||||||||||||||||||
| 31-03-18 | 31-12-17 | 31-03-18 | 31-12-17 | 9/30/2018 | 12/31/2017 | 9/30/2018 | 12/31/2017 | 9/30/2018 | 12/31/2017 | |||||||||||||||||||||||||||||||
| ASSETS | ||||||||||||||||||||||||||||||||||||||||
| Cash and cash equivalents | $ | 2,359,539 | $ | 164,332 | $ | 348,711 | $ | 114,973 | $ | 65,101 | $ | 189,890 | $ | 35,548 | $ | 411,695 | $ | 32,954 | $ | 152,200 | ||||||||||||||||||||
| U.S. Treasury securities, at fair value | 1,444,081 | 663,808 | 213,418 | 464,427 | 938,408 | 767,049 | 512,411 | 1,663,014 | 475,024 | 614,803 | ||||||||||||||||||||||||||||||
| Receivable from futures commission merchants | 2,896,451 | 7,458,096 | — | — | ||||||||||||||||||||||||||||||||||||
| Open trade equity, at fair value | 288,817 | 178,552 | — | — | ||||||||||||||||||||||||||||||||||||
| Incentive fees receivable | — | — | — | — | 57,082 | 57,082 | ||||||||||||||||||||||||||||||||||
| Swap contracts, at fair value | 10,340,801 | 11,340,959 | — | — | 5,575,997 | 6,376,472 | — | — | 471,942 | 397,039 | ||||||||||||||||||||||||||||||
| Investments in private investment companies, at fair value | 27,302,323 | 30,501,895 | 4,313,220 | 5,579,229 | 11,859,099 | 14,501,510 | 5,466,265 | 8,407,168 | 1,948,076 | 3,018,571 | ||||||||||||||||||||||||||||||
| Investments in unconsolidated trading companies, at fair value | 2,119,077 | 3,178,176 | 617,411 | 670,863 | 1,146,091 | 2,225,210 | 969,945 | 1,501,142 | 99,860 | 121,510 | ||||||||||||||||||||||||||||||
| Interest receivable | 9,637 | 13,092 | 1,424 | 9,160 | 8,786 | 15,127 | 5,212 | 32,798 | 3,364 | 12,125 | ||||||||||||||||||||||||||||||
| Due from Managing Owner | 183,947 | 184,106 | — | — | ||||||||||||||||||||||||||||||||||||
| Receivable from related parties | — | — | — | — | ||||||||||||||||||||||||||||||||||||
| Other assets | — | — | 3,472 | — | — | — | — | 2,973 | 48,679 | 5,122 | ||||||||||||||||||||||||||||||
| Total Assets | $ | 46,944,673 | $ | 53,683,016 | $ | 5,497,656 | $ | 6,838,652 | $ | 19,593,482 | $ | 24,075,258 | $ | 6,989,381 | $ | 12,018,790 | $ | 3,136,981 | $ | 4,378,452 | ||||||||||||||||||||
| LIABILITIES & CAPITAL | ||||||||||||||||||||||||||||||||||||||||
| LIABILITIES | ||||||||||||||||||||||||||||||||||||||||
| Owner redemptions payable | $ | 9,698 | $ | 76,772 | $ | — | $ | — | $ | 73,079 | $ | — | $ | 114,816 | $ | — | $ | 6,185 | $ | — | ||||||||||||||||||||
| Incentive fees payable to Managing Owner | 145,134 | 40,189 | — | — | 10,897 | 12,847 | — | — | — | — | ||||||||||||||||||||||||||||||
| Management fees payable to Managing Owner | 18,079 | 11,465 | — | — | 8,244 | 4,049 | 7,494 | 8,949 | — | — | ||||||||||||||||||||||||||||||
| Interest payable to Managing Owner | 5,960 | 2,528 | 243 | 1,358 | — | — | — | — | 44 | 103 | ||||||||||||||||||||||||||||||
| Service fees payable to Managing Owner | 75,541 | 88,149 | 11,782 | 14,743 | 4,552 | 3,614 | 2,625 | 3,570 | 66 | 172 | ||||||||||||||||||||||||||||||
| Trading fees payable to Managing Owner | 122,667 | 140,868 | 11,479 | 14,898 | 47,283 | 61,188 | 32,173 | 49,131 | 6,259 | 9,125 | ||||||||||||||||||||||||||||||
| Risk analysis fees payable | 9,394 | 8,886 | — | — | ||||||||||||||||||||||||||||||||||||
| Advance on unrealized Swap Appreciation | 4,926,555 | 4,926,555 | — | — | ||||||||||||||||||||||||||||||||||||
| Advance on unrealized swap appreciation | 2,500,000 | 2,500,000 | — | — | 115,000 | 115,000 | ||||||||||||||||||||||||||||||||||
| Other liabilities | 105,532 | 155,425 | — | 5,725 | 4,966 | 26,873 | 39,602 | — | — | — | ||||||||||||||||||||||||||||||
| Total Liabilities | 5,418,560 | 5,450,837 | 23,504 | 36,724 | 2,649,021 | 2,608,571 | 196,710 | 61,650 | 127,554 | 124,400 | ||||||||||||||||||||||||||||||
| CAPITAL | ||||||||||||||||||||||||||||||||||||||||
| Managing Owner - Class 2 | 136,943 | 147,888 | 59,991 | 70,295 | 3,056 | 3,361 | 54,571 | 87,344 | 6,284 | 11,999 | ||||||||||||||||||||||||||||||
| Managing Owner - Class 2a | 313,422 | 338,655 | — | — | — | — | — | — | 23,759 | 34,112 | ||||||||||||||||||||||||||||||
| Managing Owner - Class 3 | 175,263 | 213,164 | 21,255 | 34,209 | — | — | ||||||||||||||||||||||||||||||||||
| Managing Owner - Class 3a | — | — | — | — | 1,453 | 1,759 | ||||||||||||||||||||||||||||||||||
| Limited Owner - Class 1 | 33,417,322 | 38,744,003 | 4,741,199 | 5,912,980 | 1,740,332 | 2,332,222 | 2,102,479 | 2,913,542 | — | — | ||||||||||||||||||||||||||||||
| Limited Owner - Class 1AP | 556,803 | 601,247 | 21,163 | 23,354 | ||||||||||||||||||||||||||||||||||||
| Limited Owner - Class 1a | — | — | — | — | 23,320 | 107,619 | ||||||||||||||||||||||||||||||||||
| Limited Owner - Class 2 | 5,786,198 | 6,829,139 | 651,799 | 795,299 | 7,858,881 | 9,629,385 | 1,477,956 | 3,451,256 | 121,413 | 246,901 | ||||||||||||||||||||||||||||||
| Limited Owner - Class 2a | 117,217 | 191,276 | — | — | — | — | — | — | 259,051 | 408,532 | ||||||||||||||||||||||||||||||
| Limited Owner - Class 3 | 7,166,929 | 9,288,555 | 3,136,410 | 5,470,789 | 2,010,934 | 2,472,994 | ||||||||||||||||||||||||||||||||||
| Limited Owner - Class 3a | 1,198,208 | 1,379,971 | — | — | — | — | — | — | 563,213 | 970,136 | ||||||||||||||||||||||||||||||
| Total Owners’ Capital | 41,526,113 | 48,232,179 | 5,474,152 | 6,801,928 | 16,944,461 | 21,466,687 | 6,792,671 | 11,957,140 | 3,009,427 | 4,254,052 | ||||||||||||||||||||||||||||||
| Non-Controlling Interests | — | — | — | — | — | — | — | — | — | — | ||||||||||||||||||||||||||||||
| Total Capital | 41,526,113 | 48,232,179 | 5,474,152 | 6,801,928 | 16,944,461 | 21,466,687 | 6,792,671 | 11,957,140 | 3,009,427 | 4,254,052 | ||||||||||||||||||||||||||||||
| Total Liabilities and Capital | $ | 46,944,673 | $ | 53,683,016 | $ | 5,497,656 | $ | 6,838,652 | $ | 19,593,482 | $ | 24,075,258 | $ | 6,989,381 | $ | 12,018,790 | $ | 3,136,981 | $ | 4,378,452 | ||||||||||||||||||||
| Units Outstanding | ||||||||||||||||||||||||||||||||||||||||
| Class 1 | 267,471 | 284,956 | 61,999 | 65,502 | 16,661 | 20,035 | 21,629 | 25,393 | N/A | N/A | ||||||||||||||||||||||||||||||
| Class 1AP | 3,996 | 3,993 | 248 | 233 | ||||||||||||||||||||||||||||||||||||
| Class 1a | N/A | N/A | N/A | N/A | 353 | 1,323 | ||||||||||||||||||||||||||||||||||
| Class 2 | 31,525 | 34,386 | 6,283 | 6,521 | 63,966 | 71,254 | 13,397 | 26,553 | 1,233 | 2,236 | ||||||||||||||||||||||||||||||
| Class 2a | 2,647 | 3,015 | N/A | N/A | N/A | N/A | N/A | N/A | 3,666 | 4,730 | ||||||||||||||||||||||||||||||
| Class 3 | 64,138 | 75,601 | 29,515 | 44,254 | 18,512 | 20,354 | ||||||||||||||||||||||||||||||||||
| Class 3a | 7,391 | 7,877 | N/A | N/A | N/A | N/A | N/A | N/A | 6,978 | 9,918 | ||||||||||||||||||||||||||||||
| Net Asset Value per Unit | ||||||||||||||||||||||||||||||||||||||||
| Class 1 | $ | 124.94 | $ | 135.96 | $ | 76.47 | $ | 90.27 | $ | 104.46 | $ | 116.41 | $ | 97.20 | $ | 114.74 | N/A | N/A | ||||||||||||||||||||||
| Class 1AP | $ | 139.33 | $ | 150.56 | $ | 85.36 | $ | 100.02 | ||||||||||||||||||||||||||||||||
| Class 1a | N/A | N/A | N/A | N/A | $ | 66.19 | $ | 81.35 | ||||||||||||||||||||||||||||||||
| Class 2 | $ | 187.88 | $ | 202.90 | $ | 113.28 | $ | 132.73 | $ | 122.91 | $ | 135.19 | $ | 114.39 | $ | 133.27 | $ | 103.54 | $ | 115.81 | ||||||||||||||||||||
| Class 2a | $ | 162.67 | $ | 175.77 | N/A | N/A | N/A | N/A | N/A | N/A | $ | 77.15 | $ | 93.59 | ||||||||||||||||||||||||||
| Class 3 | $ | 114.47 | $ | 125.68 | $ | 106.99 | $ | 124.40 | $ | 108.62 | $ | 121.50 | ||||||||||||||||||||||||||||
| Class 3a | $ | 162.12 | $ | 175.18 | N/A | N/A | N/A | N/A | N/A | N/A | $ | 80.94 | $ | 97.99 | ||||||||||||||||||||||||||
The accompanying notes are an integral part of these financial statements.
5
| The Series of Frontier Funds |
| Statements of Financial Condition |
| Frontier Winton Fund | Frontier Heritage Fund | Frontier Balanced Fund | Frontier Select Fund | |||||||||||||||||||||||||||||
| 31-03-18 | 31-12-17 | 31-03-18 | 31-12-17 | 9/30/2018 | 12/31/2017 | 9/30/2018 | 12/31/2017 | |||||||||||||||||||||||||
| ASSETS | ||||||||||||||||||||||||||||||||
| Cash and cash equivalents | $ | 5,489,764 | $ | 1,403,125 | $ | 651,692 | $ | 259,161 | $ | 105,108 | $ | 164,332 | $ | 22,923 | $ | 114,973 | ||||||||||||||||
| U.S. Treasury securities, at fair value | 3,359,837 | 5,667,825 | 398,847 | 1,046,861 | 1,515,106 | 663,808 | 330,422 | 464,427 | ||||||||||||||||||||||||
| Open trade equity, at fair value | — | 178,552 | — | — | ||||||||||||||||||||||||||||
| Receivable from futures commission merchants | — | — | — | — | 2,731,030 | 7,458,096 | — | — | ||||||||||||||||||||||||
| Open trade equity, at fair value | — | — | — | — | ||||||||||||||||||||||||||||
| Swap contracts, at fair value | 9,850,185 | 11,340,959 | — | — | ||||||||||||||||||||||||||||
| Investments in private investment companies, at fair value | — | — | 2,686,969 | 2,772,993 | 24,170,470 | 30,501,895 | 3,443,015 | 5,579,229 | ||||||||||||||||||||||||
| Investments in unconsolidated trading companies, at fair value | 4,484,890 | 7,987,575 | 806,701 | 1,546,974 | 2,144,814 | 3,178,176 | 607,771 | 670,863 | ||||||||||||||||||||||||
| Swap contracts, at fair value | — | — | 3,089,571 | 3,094,367 | ||||||||||||||||||||||||||||
| Interest receivable | 22,422 | 111,781 | 2,662 | 20,647 | 10,731 | 13,092 | 2,340 | 9,160 | ||||||||||||||||||||||||
| Receivable from related parties | 69,781 | 58,146 | — | — | ||||||||||||||||||||||||||||
| Due from Managing Owner | — | 184,106 | — | — | ||||||||||||||||||||||||||||
| Other assets | 74,529 | — | — | — | — | — | 17,218 | — | ||||||||||||||||||||||||
| — | — | |||||||||||||||||||||||||||||||
| Total Assets | $ | 13,501,223 | $ | 15,228,452 | $ | 7,636,442 | $ | 8,741,003 | $ | 40,527,444 | $ | 53,683,016 | $ | 4,423,689 | $ | 6,838,652 | ||||||||||||||||
| LIABILITIES & CAPITAL | ||||||||||||||||||||||||||||||||
| LIABILITIES | ||||||||||||||||||||||||||||||||
| Open trade deficit, at fair value | $ | 23,444 | $ | — | $ | — | $ | — | ||||||||||||||||||||||||
| Owner redemptions payable | 108,038 | 76,772 | 10,437 | — | ||||||||||||||||||||||||||||
| Incentive fees payable to Managing Owner | $ | — | $ | — | $ | 1,394 | $ | — | — | 40,189 | — | — | ||||||||||||||||||||
| Management fees payable to Managing Owner | 87,508 | 53,039 | 25,192 | 13,471 | 23,019 | 11,465 | — | — | ||||||||||||||||||||||||
| Interest payable to Managing Owner | 9,915 | 20,992 | 1,149 | 2,608 | 3,591 | 2,528 | 765 | 1,358 | ||||||||||||||||||||||||
| Service fees payable to Managing Owner | 25,269 | 26,714 | 9,573 | 11,483 | 61,951 | 88,149 | 7,750 | 14,743 | ||||||||||||||||||||||||
| Trading fees payable to Managing Owner | 26,536 | 43,573 | 13,995 | 15,703 | 108,152 | 140,868 | 8,530 | 14,898 | ||||||||||||||||||||||||
| Risk analysis fees payable | — | — | — | — | 9,188 | 8,886 | — | — | ||||||||||||||||||||||||
| Advance on unrealized Swap Appreciation | — | — | 1,900,000 | 1,900,000 | ||||||||||||||||||||||||||||
| Due to Managing Owner | 152,535 | 152,219 | — | — | ||||||||||||||||||||||||||||
| Advance on unrealized swap appreciation | 4,926,555 | 4,926,555 | — | — | ||||||||||||||||||||||||||||
| Other liabilities | — | 82,265 | 8,491 | 16,038 | 280,621 | 155,425 | — | 5,725 | ||||||||||||||||||||||||
| Total Liabilities | 301,763 | 378,802 | 1,959,794 | 1,959,303 | 5,544,559 | 5,450,837 | 27,482 | 36,724 | ||||||||||||||||||||||||
| CAPITAL | ||||||||||||||||||||||||||||||||
| Managing Owner - Class 2 | 139,618 | 153,552 | 55,291 | 63,646 | 126,379 | 147,888 | 48,594 | 70,295 | ||||||||||||||||||||||||
| Managing Owner - Class 2a | 253,793 | 338,655 | — | — | ||||||||||||||||||||||||||||
| Limited Owner - Class 1 | 11,785,547 | 13,102,614 | 4,433,799 | 5,435,871 | 28,460,992 | 38,744,003 | 4,179,762 | 5,912,980 | ||||||||||||||||||||||||
| Limited Owner - Class 1AP | 34,603 | 37,761 | 5,284 | 6,083 | 431,663 | 601,247 | 17,905 | 23,354 | ||||||||||||||||||||||||
| Limited Owner - Class 2 | 1,239,692 | 1,555,723 | 605,526 | 697,026 | 4,689,023 | 6,829,139 | 149,946 | 795,299 | ||||||||||||||||||||||||
| Limited Owner - Class 2a | 114,354 | 191,276 | — | — | ||||||||||||||||||||||||||||
| Limited Owner - Class 3a | 906,681 | 1,379,971 | — | — | ||||||||||||||||||||||||||||
| Total Owners’ Capital | 13,199,460 | 14,849,650 | 5,099,900 | 6,202,626 | 34,982,885 | 48,232,179 | 4,396,207 | 6,801,928 | ||||||||||||||||||||||||
| Non-Controlling Interests | — | — | 576,748 | 579,074 | — | — | — | — | ||||||||||||||||||||||||
| Total Capital | 13,199,460 | 14,849,650 | 5,676,648 | 6,781,700 | 34,982,885 | 48,232,179 | 4,396,207 | 6,801,928 | ||||||||||||||||||||||||
| Total Liabilities and Capital | $ | 13,501,223 | $ | 15,228,452 | $ | 7,636,442 | $ | 8,741,003 | $ | 40,527,444 | $ | 53,683,016 | $ | 4,423,689 | $ | 6,838,652 | ||||||||||||||||
| Units Outstanding | ||||||||||||||||||||||||||||||||
| Class 1 | 81,507 | 82,367 | 42,427 | 44,855 | 237,546 | 284,956 | 55,426 | 65,502 | ||||||||||||||||||||||||
| Class 1AP | 214 | 214 | 45 | 45 | 3,183 | 3,993 | 210 | 233 | ||||||||||||||||||||||||
| Class 2 | 7,007 | 7,895 | 4,233 | 4,233 | 26,326 | 34,386 | 1,751 | 6,521 | ||||||||||||||||||||||||
| Class 2a | 2,323 | 3,015 | N/A | N/A | ||||||||||||||||||||||||||||
| Class 3a | 5,741 | 7,877 | N/A | N/A | ||||||||||||||||||||||||||||
| Net Asset Value per Unit | ||||||||||||||||||||||||||||||||
| Class 1 | $ | 144.60 | $ | 159.08 | $ | 104.50 | $ | 121.19 | $ | 119.81 | $ | 135.96 | $ | 75.41 | $ | 90.27 | ||||||||||||||||
| Class 1AP | $ | 161.60 | $ | 176.44 | $ | 116.64 | $ | 134.28 | $ | 135.63 | $ | 150.56 | $ | 85.45 | $ | 100.02 | ||||||||||||||||
| Class 2 | $ | 196.85 | $ | 216.50 | $ | 156.11 | $ | 179.70 | $ | 182.90 | $ | 202.90 | $ | 113.40 | $ | 132.73 | ||||||||||||||||
| Class 2a | $ | 158.48 | $ | 175.77 | N/A | N/A | ||||||||||||||||||||||||||
| Class 3a | $ | 157.94 | $ | 175.18 | N/A | N/A | ||||||||||||||||||||||||||
The accompanying notes are an integral part of these financial statements.
6
| The Series of Frontier Funds |
| Statements of Financial Condition |
| September 30, 2018 (unaudited) and December 31, 2017 |
| Frontier Winton Fund | Frontier Heritage Fund | |||||||||||||||
| 9/30/2018 | 12/31/2017 | 9/30/2018 | 12/31/2017 | |||||||||||||
| ASSETS | ||||||||||||||||
| Cash and cash equivalents | $ | 344,707 | $ | 1,403,125 | $ | 59,065 | $ | 259,161 | ||||||||
| U.S. Treasury securities, at fair value | 4,968,843 | 5,667,825 | 851,399 | 1,046,861 | ||||||||||||
| Swap contracts, at fair value | — | — | 3,010,288 | 3,094,367 | ||||||||||||
| Investments in private investment companies, at fair value | — | — | 2,095,258 | 2,772,993 | ||||||||||||
| Investments in unconsolidated trading companies, at fair value | 5,010,792 | 7,987,575 | 910,059 | 1,546,974 | ||||||||||||
| Interest receivable | 35,193 | 111,781 | 6,030 | 20,647 | ||||||||||||
| Receivable from related parties | — | 58,146 | — | — | ||||||||||||
| Other assets | 18,359 | — | — | — | ||||||||||||
| Total Assets | $ | 10,377,894 | $ | 15,228,452 | $ | 6,932,099 | $ | 8,741,003 | ||||||||
| LIABILITIES & CAPITAL | ||||||||||||||||
| LIABILITIES | ||||||||||||||||
| Owner redemptions payable | $ | 7,649 | $ | — | $ | 924 | $ | — | ||||||||
| Incentive fees payable to Managing Owner | — | — | — | — | ||||||||||||
| Management fees payable to Managing Owner | 34,474 | 53,039 | 6,370 | 13,471 | ||||||||||||
| Interest payable to Managing Owner | 15,770 | 20,992 | 1,918 | 2,608 | ||||||||||||
| Service fees payable to Managing Owner | 20,813 | 26,714 | 10,001 | 11,483 | ||||||||||||
| Trading fees payable to Managing Owner | 23,696 | 43,573 | 11,980 | 15,703 | ||||||||||||
| Due to Managing Owner | — | 152,219 | — | — | ||||||||||||
| Advance on unrealized swap appreciation | — | — | 1,900,000 | 1,900,000 | ||||||||||||
| Other liabilities | — | 82,265 | 14,563 | 16,038 | ||||||||||||
| Total Liabilities | 102,402 | 378,802 | 1,945,756 | 1,959,303 | ||||||||||||
| CAPITAL | ||||||||||||||||
| Managing Owner - Class 2 | 118,515 | 153,552 | 47,202 | 63,646 | ||||||||||||
| Limited Owner - Class 1 | 9,745,132 | 13,102,614 | 3,805,123 | 5,435,871 | ||||||||||||
| Limited Owner - Class 1AP | 35,337 | 37,761 | 1,011 | 6,083 | ||||||||||||
| Limited Owner - Class 2 | 376,508 | 1,555,723 | 594,698 | 697,026 | ||||||||||||
| Total Owners’ Capital | 10,275,492 | 14,849,650 | 4,448,034 | 6,202,626 | ||||||||||||
| Non-Controlling Interests | — | — | 538,309 | 579,074 | ||||||||||||
| Total Capital | 10,275,492 | 14,849,650 | 4,986,343 | 6,781,700 | ||||||||||||
| Total Liabilities and Capital | $ | 10,377,894 | $ | 15,228,452 | $ | 6,932,099 | $ | 8,741,003 | ||||||||
| Units Outstanding | ||||||||||||||||
| Class 1 | 66,740 | 82,367 | 37,636 | 44,855 | ||||||||||||
| Class 1AP | 214 | 214 | 9 | 45 | ||||||||||||
| Class 2 | 2,401 | 7,895 | 4,187 | 4,233 | ||||||||||||
| Net Asset Value per Unit | ||||||||||||||||
| Class 1 | $ | 146.02 | $ | 159.08 | $ | 101.10 | $ | 121.19 | ||||||||
| Class 1AP | $ | 165.51 | $ | 176.44 | $ | 114.58 | $ | 134.28 | ||||||||
| Class 2 | $ | 206.20 | $ | 216.50 | $ | 153.31 | $ | 179.70 | ||||||||
The accompanying notes are an integral part of these financial statements.
7
| The Series of Frontier Funds |
| Condensed Schedule of Investments |
| Frontier | Frontier | Frontier | ||||||||||||||||||||||||||
| Diversified Fund | Masters Fund | Long/Short Commodity Fund | ||||||||||||||||||||||||||
| Fair | % of Total Capital | Fair | % of Total Capital | Fair | % of Total Capital | |||||||||||||||||||||||
| Description | Value | (Net Asset Value) | Value | (Net Asset Value) | Value | (Net Asset Value) | ||||||||||||||||||||||
| SWAPS (1) | ||||||||||||||||||||||||||||
| Frontier XXXV Diversified select swap (U.S.) | $ | 5,728,465 | 30.60 | % | $ | — | — | $ | — | — | ||||||||||||||||||
| Frontier XXXVII L/S select swap (U.S.) | — | — | — | — | 482,309 | 12.57 | % | |||||||||||||||||||||
| Total Swaps | $ | 5,728,465 | 30.60 | % | $ | — | — | $ | 482,309 | 12.57 | % | |||||||||||||||||
| PRIVATE INVESTMENT COMPANIES (3) | ||||||||||||||||||||||||||||
| Galaxy Plus Fund - Chesapeake Feeder Fund (518) | $ | — | 0.00 | % | $ | — | 0.00 | % | $ | — | 0.00 | % | ||||||||||||||||
| Galaxy Plus Fund - EvE STP Feeder Fund (516) LLC | 1,368,910 | 7.31 | % | 1,704,338 | 18.68 | % | 612,072 | 15.95 | % | |||||||||||||||||||
| Galaxy Plus Fund - Doherty Feeder Fund (528) LLC | 1,284,191 | 6.86 | % | — | — | — | — | |||||||||||||||||||||
| Galaxy Plus Fund - Fort Contrarian Feeder Fund (510) LLC | 1,688,521 | 9.02 | % | — | — | — | — | |||||||||||||||||||||
| Galaxy Plus Fund - QIM Feeder Fund (526) LLC | 1,571,434 | 8.39 | % | — | — | — | — | |||||||||||||||||||||
| Galaxy Plus Fund - Quantmetrics Feeder Fund (527) LLC | 2,550,484 | 13.63 | % | — | — | — | — | |||||||||||||||||||||
| Galaxy Plus Fund - Quest Feeder Fund (517) LLC | 360,720 | 1.93 | % | — | — | — | — | |||||||||||||||||||||
| Galaxy Plus Fund - Aspect Feeder Fund (532) LLC | 369,845 | 1.98 | % | — | — | — | — | |||||||||||||||||||||
| Galaxy Plus Fund - Welton GDP Feeder Fund (538) LLC | 3,430,085 | 18.32 | % | 3,056,003 | 33.49 | % | 1,098,642 | 28.64 | % | |||||||||||||||||||
| Galaxy Plus Fund - TT Feeder Fund (531) LLC | 0.00 | % | 1,996,924 | 21.88 | % | — | — | |||||||||||||||||||||
| Galaxy Plus Fund - LRR Feeder Fund (522) LLC | 128,374 | 0.69 | % | — | — | 758,291 | 19.76 | % | ||||||||||||||||||||
| Total Private Investment Companies | $ | 12,752,564 | 68.12 | % | $ | 6,757,265 | 74.04 | % | $ | 2,469,005 | 64.35 | % | ||||||||||||||||
| INVESTMENT IN UNCONSOLIDATED TRADING COMPANIES (3) | ||||||||||||||||||||||||||||
| Frontier Trading Company XXXVIII, LLC | $ | 94,948 | 0.51 | % | $ | 137,006 | 1.50 | % | $ | 62,698 | 1.63 | % | ||||||||||||||||
| Frontier Trading Company II, LLC | 1,406,371 | 7.51 | % | 392,508 | 4.30 | % | — | — | ||||||||||||||||||||
| Total Investment in Unconsolidated Trading Companies | $ | 1,501,319 | 8.02 | % | $ | 529,514 | 5.80 | % | $ | 62,698 | 1.63 | % | ||||||||||||||||
| Fair Value | Fair Value | Fair Value | ||||||||||||||||||||||||||
| U.S. TREASURY SECURITIES (2) | ||||||||||||||||||||||||||||
| FACE VALUE | ||||||||||||||||||||||||||||
| $ | 9,000,000 | US Treasury Note 6.875% due 08/15/2025 (Cost $12,218,715) | $ | 498,331 | 2.66 | % | $ | 719,071 | 7.88 | % | $ | 329,067 | 8.58 | % | ||||||||||||||
| $ | 498,331 | 2.66 | % | $ | 719,071 | 7.88 | % | $ | 329,067 | 8.58 | % | |||||||||||||||||
| Face Value | Face Value | Face Value | ||||||||||||||||||||||||||
| Additional Disclosure on U.S. Treasury Securities | ||||||||||||||||||||||||||||
| US Treasury Note 6.875% due 08/15/2025 (2) | $ | 389,137 | $ | 561,508 | $ | 256,962 | ||||||||||||||||||||||
| $ | 389,137 | $ | 561,508 | $ | 256,962 | |||||||||||||||||||||||
| Cost | Cost | Cost | ||||||||||||||||||||||||||
| Additional Disclosure on U.S. Treasury Securities | ||||||||||||||||||||||||||||
| US Treasury Note 6.875% due 08/15/2025 (2) | $ | 505,641 | $ | 729,618 | $ | 333,894 | ||||||||||||||||||||||
| $ | 505,641 | $ | 729,618 | $ | 333,894 | |||||||||||||||||||||||
| Frontier | Frontier | Frontier | |||||||||||||||||||||||||
| Diversified Fund | Masters Fund | Long/Short Commodity Fund | |||||||||||||||||||||||||
| Fair | % of Total Capital | Fair | % of Total Capital | Fair | % of Total Capital | ||||||||||||||||||||||
| Description | Value | (Net Asset Value) | Value | (Net Asset Value) | Value | (Net Asset Value) | |||||||||||||||||||||
| SWAPS (1) | |||||||||||||||||||||||||||
| Frontier XXXV Diversified select swap (U.S.) | $ | 5,575,997 | 32.91 | % | $ | — | — | $ | — | — | |||||||||||||||||
| Frontier XXXVII L/S select swap (U.S.) | — | — | — | — | 471,942 | 15.68 | % | ||||||||||||||||||||
| Total Swaps | $ | 5,575,997 | 32.91 | % | $ | — | — | $ | 471,942 | 15.68 | % | ||||||||||||||||
| PRIVATE INVESTMENT COMPANIES (3) | |||||||||||||||||||||||||||
| Galaxy Plus Fund - EvE STP Feeder Fund (516) LLC | $ | 1,476,849 | 8.72 | % | $ | 1,337,703 | 19.69 | % | $ | 427,126 | 14.19 | % | |||||||||||||||
| Galaxy Plus Fund - Doherty Feeder Fund (528) LLC | 1,252,158 | 7.39 | % | — | — | — | — | ||||||||||||||||||||
| Galaxy Plus Fund - Fort Contrarian Feeder Fund (510) LLC | 1,815,491 | 10.71 | % | — | — | — | — | ||||||||||||||||||||
| Galaxy Plus Fund - QIM Feeder Fund (526) LLC | 1,502,795 | 8.87 | % | — | — | — | — | ||||||||||||||||||||
| Galaxy Plus Fund - Quantmetrics Feeder Fund (527) LLC | 2,014,288 | 11.89 | % | — | — | — | — | ||||||||||||||||||||
| Galaxy Plus Fund - Quest Feeder Fund (517) LLC | 343,205 | 2.03 | % | — | — | — | — | ||||||||||||||||||||
| Galaxy Plus Fund - Aspect Feeder Fund (532) LLC | 381,970 | 2.25 | % | — | — | — | — | ||||||||||||||||||||
| Galaxy Plus Fund - Welton GDP Feeder Fund (538) LLC | 2,966,027 | 17.50 | % | 2,466,918 | 36.32 | % | 788,388 | 26.20 | % | ||||||||||||||||||
| Galaxy Plus Fund - TT Feeder Fund (531) LLC | — | 0.00 | % | 1,661,644 | 24.46 | % | — | — | |||||||||||||||||||
| Galaxy Plus Fund - LRR Feeder Fund (522) LLC | 106,316 | 0.63 | % | — | — | 732,562 | 24.34 | % | |||||||||||||||||||
| Total Private Investment Companies | $ | 11,859,099 | 69.99 | % | $ | 5,466,265 | 80.47 | % | $ | 1,948,076 | 64.73 | % | |||||||||||||||
| INVESTMENT IN UNCONSOLIDATED TRADING COMPANIES (3) | |||||||||||||||||||||||||||
| Frontier Trading Company XXXVIII, LLC | $ | 197,274 | 1.16 | % | $ | 107,720 | 1.59 | % | $ | 99,860 | 3.32 | % | |||||||||||||||
| Frontier Trading Company II, LLC | 948,817 | 5.60 | % | 862,225 | 12.69 | % | — | — | |||||||||||||||||||
| Total Investment in Unconsolidated Trading Companies | $ | 1,146,091 | 6.76 | % | $ | 969,945 | 14.28 | % | $ | 99,860 | 3.32 | % | |||||||||||||||
| U.S. TREASURY SECURITIES (2) | |||||||||||||||||||||||||||
FACE VALUE | Fair Value | Fair Value | Fair Value | ||||||||||||||||||||||||
| $ | 7,737,000 | US Treasury Note 6.875% due 08/15/2025 (Cost $9,813,689) | $ | 938,408 | 5.54 | % | $ | 512,411 | 7.54 | % | $ | 475,024 | 15.78 | % | |||||||||||||
| $ | 938,408 | 5.54 | % | $ | 512,411 | 7.54 | % | $ | 475,024 | 15.78 | % | ||||||||||||||||
| Additional Disclosure on U.S. Treasury Securities | Face Value | Face Value | Face Value | ||||||||||||||||||||||||
| US Treasury Note 6.875% due 08/15/2025 (2) | $ | 756,959 | $ | 413,332 | $ | 383,175 | |||||||||||||||||||||
| $ | 756,959 | $ | 413,332 | $ | 383,175 | ||||||||||||||||||||||
| Additional Disclosure on U.S. Treasury Securities | Cost | Cost | Cost | ||||||||||||||||||||||||
| US Treasury Note 6.875% due 08/15/2025 (2) | $ | 960,135 | $ | 524,275 | $ | 486,023 | |||||||||||||||||||||
| $ | 960,135 | $ | 524,275 | $ | 486,023 | ||||||||||||||||||||||
| (1) | See Note 4 to the Financial Statements. |
| (2) | See Note 2 to the Financial Statements. |
| (3) | See Note 5 to the Financial Statements. |
The accompanying notes are an integral part of these financial statements.
78
| The Series of Frontier Funds |
| Condensed Schedule of Investments |
| Frontier | Frontier | Frontier | Frontier | ||||||||||||||||||||||||||||||||||||
| Balanced Fund | Select Fund | Balanced Fund | Select Fund | ||||||||||||||||||||||||||||||||||||
| Fair | % of Total Capital | Fair | % of Total Capital | Fair | % of Total Capital | Fair | % of Total Capital | ||||||||||||||||||||||||||||||||
| Description | Description | Value | (Net Asset Value) | Value | (Net Asset Value) | Description | Value | (Net Asset Value) | Value | (Net Asset Value) | |||||||||||||||||||||||||||||
| LONG FUTURES CONTRACTS* | LONG FUTURES CONTRACTS* | LONG FUTURES CONTRACTS* | |||||||||||||||||||||||||||||||||||||
| Various agriculture futures contracts (U.S.) | $ | 20,140 | 0.05 | % | $ | — | 0.00 | % | Various agriculture futures contracts (Canada) | $ | — | 0.00 | % | $ | — | 0.00 | % | ||||||||||||||||||||||
| Various base metals futures contracts (U.S.) | (32,163 | ) | -0.08 | % | — | 0.00 | % | Various agriculture futures contracts (Europe) | (2,512 | ) | -0.01 | % | — | 0.00 | % | ||||||||||||||||||||||||
| Various energy futures contracts (U.S.) | 23,712 | 0.06 | % | — | 0.00 | % | Various agriculture futures contracts (U.S.) | 1,580 | 0.00 | % | — | 0.00 | % | ||||||||||||||||||||||||||
| Various interest rates futures contracts (Europe) | 138,389 | 0.33 | % | — | 0.00 | % | Various base metals futures contracts (U.S.) | 3,613 | 0.01 | % | — | 0.00 | % | ||||||||||||||||||||||||||
| Various interest rates futures contracts (Far East) | 2,166 | 0.01 | % | — | 0.00 | % | Various energy futures contracts (U.S.) | 22,560 | 0.06 | % | — | 0.00 | % | ||||||||||||||||||||||||||
| Various interest rates futures contracts (Oceanic) | (826 | ) | 0.00 | % | — | 0.00 | % | Various interest rates futures contracts (Europe) | 40,355 | 0.12 | % | — | 0.00 | % | |||||||||||||||||||||||||
| Various soft futures contracts (U.S.) | 15,664 | 0.04 | % | — | 0.00 | % | Various stock index futures contracts (Europe) | (1,774 | ) | -0.01 | % | — | 0.00 | % | |||||||||||||||||||||||||
| Total Long Futures Contracts | $ | 167,082 | 0.41 | % | $ | — | 0.00 | % | Various stock index futures contracts (Far East) | 3,607 | 0.01 | % | — | 0.00 | % | ||||||||||||||||||||||||
| Total Long Futures Contracts | $ | 67,429 | 0.20 | % | $ | — | 0.00 | % | |||||||||||||||||||||||||||||||
| SHORT FUTURES CONTRACTS* | SHORT FUTURES CONTRACTS* | SHORT FUTURES CONTRACTS* | |||||||||||||||||||||||||||||||||||||
| Various agriculture futures contracts (U.S.) | $ | 42,323 | 0.10 | % | $ | — | — | ||||||||||||||||||||||||||||||||
| Various base metals futures contracts (U.S.) | 12,831 | 0.03 | % | — | 0.00 | % | Various agriculture futures contracts (Canada) | $ | 22,220 | 0.06 | % | $ | — | — | |||||||||||||||||||||||||
| Various energy futures contracts (U.S.) | (2,160 | ) | -0.01 | % | — | 0.00 | % | Various base metals futures contracts (U.S.) | (13,238 | ) | -0.04 | % | — | 0.00 | % | ||||||||||||||||||||||||
| Various interest rates futures contracts (Canada) | (5,195 | ) | -0.01 | % | — | 0.00 | % | Various interest rates futures contracts (Canada) | 7,731 | 0.02 | % | — | 0.00 | % | |||||||||||||||||||||||||
| Various interest rates futures contracts (U.S.) | (3,219 | ) | -0.01 | % | — | 0.00 | % | Various interest rates futures contracts (Far East) | 1,761 | 0.01 | % | — | 0.00 | % | |||||||||||||||||||||||||
| Various precious metal futures contracts (U.S.) | 15,060 | 0.04 | % | — | 0.00 | % | Various interest rates futures contracts (U.S.) | 20,016 | 0.06 | % | — | 0.00 | % | ||||||||||||||||||||||||||
| Various soft futures contracts (Far East) | 7,326 | 0.02 | % | — | 0.00 | % | Various precious metal futures contracts (U.S.) | 3,945 | 0.01 | % | — | 0.00 | % | ||||||||||||||||||||||||||
| Various soft futures contracts (U.S.) | 18,580 | 0.04 | % | — | 0.00 | % | Various soft futures contracts (Far East) | 1,101 | 0.00 | % | — | 0.00 | % | ||||||||||||||||||||||||||
| Various stock index futures contracts (Africa) | (834 | ) | 0.00 | % | — | 0.00 | % | Various soft futures contracts (U.S.) | 35,385 | 0.10 | % | — | 0.00 | % | |||||||||||||||||||||||||
| Various stock index futures contracts (Europe) | 2,329 | 0.01 | % | — | 0.00 | % | Various stock index futures contracts (Africa) | 1,590 | 0.00 | % | — | 0.00 | % | ||||||||||||||||||||||||||
| Total Short Futures Contracts | $ | 87,041 | 0.20 | % | $ | — | 0.00 | % | Total Short Futures Contracts | $ | 80,511 | 0.22 | % | $ | — | 0.00 | % | ||||||||||||||||||||||
| CURRENCY FORWARDS* | CURRENCY FORWARDS* | CURRENCY FORWARDS* | |||||||||||||||||||||||||||||||||||||
| Various currency forwards contracts (NA) | $ | 34,694 | 0.08 | % | $ | — | 0.00 | % | Various currency forwards contracts (NA) | $ | (171,384 | ) | -0.49 | % | $ | — | 0.00 | % | |||||||||||||||||||||
| Total Currency Forwards | $ | 34,694 | 0.08 | % | $ | — | 0.00 | % | Total Currency Forwards | $ | (171,384 | ) | -0.49 | % | $ | — | 0.00 | % | |||||||||||||||||||||
| Total Open Trade Equity (Deficit) | $ | 288,817 | 0.70 | % | $ | — | 0.00 | % | Total Open Trade Equity (Deficit) | $ | (23,444 | ) | -0.07 | % | $ | — | 0.00 | % | |||||||||||||||||||||
| SWAP (1) | SWAP (1) | SWAP (1) | |||||||||||||||||||||||||||||||||||||
| Frontier XXXIV Balanced select swap (U.S.) | $ | 10,340,801 | 24.90 | % | $ | — | — | Frontier XXXIV Balanced select swap (U.S.) | $ | 9,850,185 | 28.16 | % | $ | — | — | ||||||||||||||||||||||||
| Total Swap | $ | 10,340,801 | 24.90 | % | $ | — | — | Total Swap | $ | 9,850,185 | 28.16 | % | $ | — | — | ||||||||||||||||||||||||
| PRIVATE INVESTMENT COMPANIES (3) | PRIVATE INVESTMENT COMPANIES (3) | PRIVATE INVESTMENT COMPANIES (3) | |||||||||||||||||||||||||||||||||||||
| Galaxy Plus Fund - EvE STP Feeder Fund (516) LLC | $ | 2,739,995 | 6.60 | % | $ | — | — | Galaxy Plus Fund - EvE STP Feeder Fund (516) LLC | $ | 2,821,492 | 8.07 | % | — | — | |||||||||||||||||||||||||
| Galaxy Plus Fund - Aspect Feeder Fund (532) LLC | 1,110,489 | 2.67 | % | — | — | Galaxy Plus Fund - Doherty Feeder Fund (528) LLC | 2,104,433 | 6.02 | % | — | — | ||||||||||||||||||||||||||||
| Galaxy Plus Fund - Doherty Feeder Fund (528) LLC | 2,312,512 | 5.57 | % | — | — | Galaxy Plus Fund - Fort Contrarian Feeder Fund (510) LLC | 3,469,606 | 9.92 | % | — | — | ||||||||||||||||||||||||||||
| Galaxy Plus Fund - Fort Contrarian Feeder Fund (510) LLC | 4,392,928 | 10.58 | % | — | — | Galaxy Plus Fund - QIM Feeder Fund (526) LLC | 3,321,217 | 9.49 | % | — | — | ||||||||||||||||||||||||||||
| Galaxy Plus Fund - QIM Feeder Fund (526) LLC | 3,669,689 | 8.84 | % | — | — | Galaxy Plus Fund - Quantmetrics Feeder Fund (527) LLC | 4,232,025 | 12.10 | % | — | — | ||||||||||||||||||||||||||||
| Galaxy Plus Fund - Quantmetrics Feeder Fund (527) LLC | 5,105,367 | 12.29 | % | — | — | Galaxy Plus Fund - Quest Feeder Fund (517) LLC | 343,487 | 0.98 | % | — | — | ||||||||||||||||||||||||||||
| Galaxy Plus Fund - LRR Feeder Fund (522) LLC | 256,963 | 0.62 | % | — | — | Galaxy Plus Fund - Aspect Feeder Fund (532) LLC | 1,070,327 | 3.06 | % | — | — | ||||||||||||||||||||||||||||
| Galaxy Plus Fund - Welton GDP Feeder Fund (538) LLC | 7,353,342 | 17.71 | % | 2,442,699 | 44.62 | % | Galaxy Plus Fund - Welton GDP Feeder Fund (538) LLC | 6,552,503 | 18.73 | % | 1,848,757 | 42.05 | % | ||||||||||||||||||||||||||
| Galaxy Plus Fund - TT Feeder Fund (531) LLC | — | 0.00 | % | 1,870,521 | 34.17 | % | Galaxy Plus Fund - TT Feeder Fund (531) LLC | — | 0.00 | % | 1,594,258 | 36.26 | % | ||||||||||||||||||||||||||
| Galaxy Plus Fund - Quest Feeder Fund (517) LLC | 361,038 | 0.87 | % | — | — | Galaxy Plus Fund - LRR Feeder Fund (522) LLC | 255,381 | 0.73 | % | — | — | ||||||||||||||||||||||||||||
| Total Private Investment Companies | $ | 27,302,323 | 65.74 | % | $ | 4,313,220 | 78.79 | % | Total Private Investment Companies | $ | 24,170,471 | 69.09 | % | $ | 3,443,015 | 78.32 | % | ||||||||||||||||||||||
| INVESTMENT IN UNCONSOLIDATED COMPANIES (3) | INVESTMENT IN UNCONSOLIDATED COMPANIES (3) | INVESTMENT IN UNCONSOLIDATED COMPANIES (3) | |||||||||||||||||||||||||||||||||||||
| Frontier Trading Company II, LLC | $ | 1,843,934 | 4.44 | % | $ | — | — | Frontier Trading Company II, LLC | $ | 1,826,306 | 5.22 | % | $ | — | — | ||||||||||||||||||||||||
| Frontier Trading Company XXXVIII, LLC | 275,143 | 0.66 | % | 40,663 | 0.74 | % | Frontier Trading Company XXXVIII, LLC | 318,508 | 0.91 | % | 69,462 | 1.58 | % | ||||||||||||||||||||||||||
| Frontier Trading Company XXXIX, LLC | — | — | 576,748 | 10.54 | % | Frontier Trading Company XXXIX, LLC | — | — | 538,309 | 12.24 | % | ||||||||||||||||||||||||||||
| Total Investment in Unconsolidated Trading Companies | $ | 2,119,077 | 5.10 | % | $ | 617,411 | 11.28 | % | Total Investment in Unconsolidated Trading Companies | $ | 2,144,814 | 6.13 | % | $ | 607,771 | 13.82 | % | ||||||||||||||||||||||
| Fair Value | Fair Value | ||||||||||||||||||||||||||||||||||||||
| U.S. TREASURY SECURITIES (2) | U.S. TREASURY SECURITIES (2) | U.S. TREASURY SECURITIES (2) | |||||||||||||||||||||||||||||||||||||
| FACE VALUE | FACE VALUE | FACE VALUE | Fair Value | Fair Value | |||||||||||||||||||||||||||||||||||
| $ | 9,000,000 | US Treasury Note 6.875% due 08/15/2025 (Cost $12,218,715) | 1,444,081 | 3.48 | % | 213,418 | 3.90 | % | 7,737,000 | US Treasury Note 6.875% due 08/15/2025 (Cost $9,813,689) | 1,515,106 | 4.33 | % | 330,422 | 7.52 | % | |||||||||||||||||||||||
| $ | 1,515,106 | 4.33 | % | $ | 330,422 | 7.52 | % | ||||||||||||||||||||||||||||||||
| Additional Disclosure on U.S. Treasury Securities | Additional Disclosure on U.S. Treasury Securities | Face Value | Face Value | ||||||||||||||||||||||||||||||||||||
| $ | 1,444,081 | 3.48 | % | $ | 213,418 | 3.90 | % | US Treasury Note 6.875% due 08/15/2025 (2) | $ | 1,222,149 | $ | 266,532 | |||||||||||||||||||||||||||
| $ | 1,222,149 | $ | 266,532 | ||||||||||||||||||||||||||||||||||||
| Face Value | Face Value | ||||||||||||||||||||||||||||||||||||||
| Additional Disclosure on U.S. Treasury Securities | Additional Disclosure on U.S. Treasury Securities | Additional Disclosure on U.S. Treasury Securities | Cost | Cost | |||||||||||||||||||||||||||||||||||
| US Treasury Note 6.875% due 08/15/2025 (2) | $ | 1,127,655 | $ | 166,654 | US Treasury Note 6.875% due 08/15/2025 (2) | $ | 1,550,186 | $ | 338,072 | ||||||||||||||||||||||||||||||
| $ | 1,127,655 | $ | 166,654 | $ | 1,550,186 | $ | 338,072 | ||||||||||||||||||||||||||||||||
| Cost | Cost | ||||||||||||||||||||||||||||||||||||||
| Additional Disclosure on U.S. Treasury Securities | |||||||||||||||||||||||||||||||||||||||
| US Treasury Note 6.875% due 08/15/2025 (2) | $ | 1,465,264 | $ | 216,548 | |||||||||||||||||||||||||||||||||||
| $ | 1,465,264 | $ | 216,548 | ||||||||||||||||||||||||||||||||||||
| * | Except for those items disclosed, no individual futures, or forwards position constituted greater than 1 percent of Net Asset Value. Accordingly, the number of contracts and expiration dates are not presented. |
| (1) | See Note 4 to the Financial Statements. |
| (2) | See Note 2 to the Financial Statements. |
| (3) | See Note 5 to the Financial Statements. |
The accompanying notes are an integral part of these financial statements.
89
| The Series of Frontier Funds |
| Condensed Schedule of Investments |
| Frontier | Frontier | Frontier | Frontier | ||||||||||||||||||||||||||||||||||||
| Winton Fund | Heritage Fund | Winton Fund | Heritage Fund | ||||||||||||||||||||||||||||||||||||
| Fair | % of Total Capital | Fair | % of Total Capital | Fair | % of Total Capital | Fair | % of Total Capital | ||||||||||||||||||||||||||||||||
| Description | Description | Value | (Net Asset Value) | Value | (Net Asset Value) | Description | Value | (Net Asset Value) | Value | (Net Asset Value) | |||||||||||||||||||||||||||||
| SWAP (1) | SWAP (1) | SWAP (1) | |||||||||||||||||||||||||||||||||||||
| Frontier Brevan Howard swap (U.S.) | $ | — | — | $ | 3,089,571 | 54.43 | % | Frontier Brevan Howard swap (U.S.) | $ | — | — | $ | 3,010,288 | 60.37 | % | ||||||||||||||||||||||||
| Total Swap | $ | — | — | $ | 3,089,571 | 54.43 | % | Total Swap | $ | — | — | $ | 3,010,288 | 60.37 | % | ||||||||||||||||||||||||
| PRIVATE INVESTMENT COMPANIES (3) | PRIVATE INVESTMENT COMPANIES (3) | PRIVATE INVESTMENT COMPANIES (3) | |||||||||||||||||||||||||||||||||||||
| Galaxy Plus Fund - Welton GDP Feeder Fund (538) LLC | $ | — | — | $ | 2,686,969 | 47.33 | % | Galaxy Plus Fund - Welton GDP Feeder Fund (538) LLC | $ | — | — | $ | 2,095,258 | 42.02 | % | ||||||||||||||||||||||||
| Total Private Investment Companies | $ | — | — | $ | 2,686,969 | 47.33 | % | Total Private Investment Companies | $ | — | — | $ | 2,095,258 | 42.02 | % | ||||||||||||||||||||||||
| INVESTMENT IN UNCONSOLIDATED COMPANIES (3) | INVESTMENT IN UNCONSOLIDATED COMPANIES (3) | INVESTMENT IN UNCONSOLIDATED COMPANIES (3) | |||||||||||||||||||||||||||||||||||||
| Frontier Trading Company II, LLC | $ | 3,844,735 | 29.13 | % | $ | 730,708 | 12.87 | % | Frontier Trading Company II, LLC | $ | 3,966,234 | 38.60 | % | $ | 731,077 | 14.66 | % | ||||||||||||||||||||||
| Frontier Trading Company XXXVIII, LLC | 640,155 | 4.85 | % | 75,993 | 1.34 | % | Frontier Trading Company XXXVIII, LLC | 1,044,558 | 10.17 | % | 178,982 | 3.59 | % | ||||||||||||||||||||||||||
| Total Investment in Unconsolidated Trading Companies | $ | 4,484,890 | 33.98 | % | $ | 806,701 | 14.21 | % | Total Investment in Unconsolidated Trading Companies | $ | 5,010,792 | 48.77 | % | $ | 910,059 | 18.25 | % | ||||||||||||||||||||||
| Fair Value | Fair Value | ||||||||||||||||||||||||||||||||||||||
| U.S. TREASURY SECURITIES (2) | U.S. TREASURY SECURITIES (2) | U.S. TREASURY SECURITIES (2) | |||||||||||||||||||||||||||||||||||||
| FACE VALUE | FACE VALUE | FACE VALUE | Fair Value | Fair Value | |||||||||||||||||||||||||||||||||||
| $ | 9,000,000 | US Treasury Note 6.875% due 08/15/2025 (Cost $12,218,715) | $ | 3,359,837 | 25.45 | % | $ | 398,847 | 7.03 | % | 7,737,000 | US Treasury Note 6.875% due 08/15/2025 (Cost $9,813,689) | $ | 4,968,843 | 48.36 | % | $ | 851,399 | 17.07 | % | |||||||||||||||||||
| $ | 4,968,843 | 48.36 | % | $ | 851,399 | 17.07 | % | ||||||||||||||||||||||||||||||||
| Additional Disclosure on U.S. Treasury Securities | Additional Disclosure on U.S. Treasury Securities | Face Value | Face Value | ||||||||||||||||||||||||||||||||||||
| $ | 3,359,837 | 25.45 | % | $ | 398,847 | 7.03 | % | US Treasury Note 6.875% due 08/15/2025 (2) | $ | 4,008,078 | $ | 686,775 | |||||||||||||||||||||||||||
| $ | 4,008,078 | $ | 686,775 | ||||||||||||||||||||||||||||||||||||
| Face Value | Face Value | ||||||||||||||||||||||||||||||||||||||
| Additional Disclosure on U.S. Treasury Securities | Additional Disclosure on U.S. Treasury Securities | Additional Disclosure on U.S. Treasury Securities | Cost | Cost | |||||||||||||||||||||||||||||||||||
| US Treasury Note 6.875% due 08/15/2025 (2) | $ | 2,623,631 | $ | 311,452 | US Treasury Note 6.875% due 08/15/2025 (2) | $ | 5,083,887 | $ | 871,112 | ||||||||||||||||||||||||||||||
| $ | 2,623,631 | $ | 311,452 | $ | 5,083,887 | $ | 871,112 | ||||||||||||||||||||||||||||||||
| Cost | Cost | ||||||||||||||||||||||||||||||||||||||
| Additional Disclosure on U.S. Treasury Securities | |||||||||||||||||||||||||||||||||||||||
| US Treasury Note 6.875% due 08/15/2025 (2) | $ | 3,409,120 | $ | 404,698 | |||||||||||||||||||||||||||||||||||
| $ | 3,409,120 | $ | 404,698 | ||||||||||||||||||||||||||||||||||||
| * | Except for those items disclosed, no individual futures, or forwards contract position constituted greater than 1 percent of Net Asset Value. Accordingly, the number of contracts and expiration dates are not presented. |
The accompanying notes are an integral part of these financial statements.
9
| Frontier | Frontier | Frontier | ||||||||||||||||||||||||||
| Diversified Fund | Masters Fund | Long/Short Commodity Fund | ||||||||||||||||||||||||||
| Fair | % of Total Capital | Fair | % of Total Capital | Fair | % of Total Capital | |||||||||||||||||||||||
| Description | Value | (Net Asset Value) | Value | (Net Asset Value) | Value | (Net Asset Value) | ||||||||||||||||||||||
| SWAPS (1) | ||||||||||||||||||||||||||||
| Frontier XXXV Diversified select swap (U.S.) | $ | 6,376,472 | 29.70 | % | $ | — | — | $ | — | — | ||||||||||||||||||
| Frontier XXXVII L/S select swap (U.S.) | — | — | — | — | 397,039 | 9.33 | % | |||||||||||||||||||||
| Total Swaps | $ | 6,376,472 | 29.70 | % | $ | — | — | $ | 397,039 | 9.33 | % | |||||||||||||||||
| PRIVATE INVESTMENT COMPANIES (3) | ||||||||||||||||||||||||||||
| Galaxy Plus Fund - Chesapeake Feeder Fund (518) | $ | 484,742 | 2.26 | % | $ | 967,528 | 8.09 | % | $ | 322,105 | 7.57 | % | ||||||||||||||||
| Galaxy Plus Fund - EvE STP Feeder Fund (516) LLC | 1,447,461 | 6.74 | % | 1,588,149 | 13.28 | % | 576,154 | 13.54 | % | |||||||||||||||||||
| Galaxy Plus Fund - Doherty Feeder Fund (528) LLC | 1,253,230 | 5.84 | % | — | — | — | — | |||||||||||||||||||||
| Galaxy Plus Fund - Fort Contrarian Feeder Fund (510) LLC | 1,713,788 | 7.98 | % | — | — | — | — | |||||||||||||||||||||
| Galaxy Plus Fund - QIM Feeder Fund (526) LLC | 2,203,960 | 10.27 | % | — | — | — | — | |||||||||||||||||||||
| Galaxy Plus Fund - Quantmetrics Feeder Fund (527) LLC | 2,067,025 | 9.63 | % | — | — | — | — | |||||||||||||||||||||
| Galaxy Plus Fund - Quest Feeder Fund (517) LLC | 379,664 | 1.77 | % | — | — | — | — | |||||||||||||||||||||
| Galaxy Plus Fund - Aspect Feeder Fund (532) LLC | 479,522 | 2.23 | % | — | — | — | — | |||||||||||||||||||||
| Galaxy Plus Fund - Welton GDP Feeder Fund (538) LLC | 4,343,060 | 20.23 | % | 3,203,382 | 26.79 | % | 1,024,222 | 24.08 | % | |||||||||||||||||||
| Galaxy Plus Fund - TT Feeder Fund (531) LLC | — | 0.00 | % | 2,648,109 | 22.15 | % | — | — | ||||||||||||||||||||
| Galaxy Plus Fund - LRR Feeder Fund (522) LLC | 129,058 | 0.60 | % | — | — | 1,096,090 | 25.77 | % | ||||||||||||||||||||
| Total Private Investment Companies | $ | 14,501,510 | 67.54 | % | $ | 8,407,168 | 70.31 | % | $ | 3,018,571 | 70.96 | % | ||||||||||||||||
| INVESTMENT IN UNCONSOLIDATED TRADING COMPANIES (3) | ||||||||||||||||||||||||||||
| Frontier Trading Company XXXVIII, LLC | $ | 151,600 | 0.71 | % | $ | 328,679 | 2.75 | % | $ | 121,510 | 2.86 | % | ||||||||||||||||
| Frontier Trading Company II, LLC | 2,073,610 | 9.66 | % | 1,172,463 | 9.81 | % | — | — | ||||||||||||||||||||
| Total Investment in Unconsolidated Trading Companies | $ | 2,225,210 | 10.37 | % | $ | 1,501,142 | 12.55 | % | $ | 121,510 | 2.86 | % | ||||||||||||||||
| Fair Value | Fair Value | Fair Value | ||||||||||||||||||||||||||
| U.S. TREASURY SECURITIES (2) | ||||||||||||||||||||||||||||
| FACE VALUE | ||||||||||||||||||||||||||||
| $ | 9,000,000 | US Treasury Note 6.875% due 08/15/2025 (Cost $12,218,715) | $ | 767,049 | 3.57 | % | $ | 1,663,014 | 13.91 | % | $ | 614,803 | 14.45 | % | ||||||||||||||
| $ | 767,049 | 3.57 | % | $ | 1,663,014 | 13.91 | % | $ | 614,803 | 14.45 | % | |||||||||||||||||
| Face Value | Face Value | Face Value | ||||||||||||||||||||||||||
| Additional Disclosure on U.S. Treasury Securities | ||||||||||||||||||||||||||||
| US Treasury Note 6.875% due 08/15/2025 (2) | $ | 582,555 | $ | 1,263,017 | $ | 466,927 | ||||||||||||||||||||||
| $ | 582,555 | $ | 1,263,017 | $ | 466,927 | |||||||||||||||||||||||
| Cost | Cost | Cost | ||||||||||||||||||||||||||
| Additional Disclosure on U.S. Treasury Securities | ||||||||||||||||||||||||||||
| US Treasury Note 6.875% due 08/15/2025 (2) | $ | 774,221 | $ | 1,678,562 | $ | 620,551 | ||||||||||||||||||||||
| $ | 774,221 | $ | 1,678,562 | $ | 620,551 | |||||||||||||||||||||||
| (1) | See Note 4 to the Financial Statements. |
| (2) | See Note 2 to the Financial Statements. |
| (3) | See Note 5 to the Financial Statements. |
The accompanying notes are an integral part of these financial statements.
10
The Series of ContentsFrontier Funds
Condensed Schedule of Investments
December 31, 2017
| Frontier | Frontier | Frontier | Frontier | Frontier | ||||||||||||||||||||||||||||||||||||||||||||
| Balanced Fund | Select Fund | Diversified Fund | Masters Fund | Long/Short Commodity Fund | ||||||||||||||||||||||||||||||||||||||||||||
| Fair | % of Total Capital | Fair | % of Total Capital | Fair | % of Total Capital | Fair | % of Total Capital | Fair | % of Total Capital | |||||||||||||||||||||||||||||||||||||||
| Description | Description | Value | (Net Asset Value) | Value | (Net Asset Value) | Description | Value | (Net Asset Value) | Value | (Net Asset Value) | Value | (Net Asset Value) | ||||||||||||||||||||||||||||||||||||
| LONG FUTURES CONTRACTS* | ||||||||||||||||||||||||||||||||||||||||||||||||
| SWAPS (1) | SWAPS (1) | |||||||||||||||||||||||||||||||||||||||||||||||
| Various base metals futures contracts (U.S.) | $ | 61,371 | 0.13 | % | $ | — | 0.00 | % | Frontier XXXV Diversified select swap (U.S.) | $ | 6,376,472 | 29.70 | % | $ | — | — | $ | — | — | |||||||||||||||||||||||||||||
| Various energy futures contracts (U.S.) | 96,294 | 0.20 | % | — | 0.00 | % | ||||||||||||||||||||||||||||||||||||||||||
| Various interest rates futures contracts (Europe) | 3,733 | 0.01 | % | — | 0.00 | % | ||||||||||||||||||||||||||||||||||||||||||
| Various interest rates futures contracts (Far East) | (1,776 | ) | 0.00 | % | — | 0.00 | % | |||||||||||||||||||||||||||||||||||||||||
| Various interest rates futures contracts (Oceanic) | (15,653 | ) | -0.03 | % | — | 0.00 | % | |||||||||||||||||||||||||||||||||||||||||
| Various soft futures contract (U.S.) | 31,613 | 0.07 | % | — | 0.00 | % | ||||||||||||||||||||||||||||||||||||||||||
| Various stock index futures contracts (Canada) | 4,274 | 0.01 | % | — | 0.00 | % | ||||||||||||||||||||||||||||||||||||||||||
| Various stock index futures contracts (Europe) | (237 | ) | 0.00 | % | — | 0.00 | % | |||||||||||||||||||||||||||||||||||||||||
| Various stock index futures contracts (Far East) | 5,757 | 0.01 | % | — | 0.00 | % | ||||||||||||||||||||||||||||||||||||||||||
| Various stock index futures contracts (Oceanic) | (1,525 | ) | 0.00 | % | — | 0.00 | % | |||||||||||||||||||||||||||||||||||||||||
| Various stock index futures contracts (U.S.) | 604 | 0.00 | % | — | 0.00 | % | ||||||||||||||||||||||||||||||||||||||||||
| Total Long Futures Contracts | $ | 184,455 | 0.39 | % | $ | — | 0.00 | % | ||||||||||||||||||||||||||||||||||||||||
| SHORT FUTURES CONTRACTS* | ||||||||||||||||||||||||||||||||||||||||||||||||
| Various base metals futures contracts (U.S.) | $ | (66,901 | ) | -0.14 | % | $ | — | — | ||||||||||||||||||||||||||||||||||||||||
| Various currency futures contracts (U.S.) | 40,897 | 0.08 | % | — | 0.00 | % | ||||||||||||||||||||||||||||||||||||||||||
| Various energy futures contracts (U.S.) | (28,561 | ) | -0.06 | % | — | 0.00 | % | |||||||||||||||||||||||||||||||||||||||||
| Various interest rates futures contracts (Canada) | (5,167 | ) | -0.01 | % | — | 0.00 | % | |||||||||||||||||||||||||||||||||||||||||
| Various interest rates futures contracts (Oceanic) | 1,509 | 0.00 | % | — | 0.00 | % | ||||||||||||||||||||||||||||||||||||||||||
| Various precious metal futures contracts (U.S.) | (12,435 | ) | -0.03 | % | — | 0.00 | % | |||||||||||||||||||||||||||||||||||||||||
| Various soft futures contract (U.S.) | 18,277 | 0.04 | % | — | 0.00 | % | ||||||||||||||||||||||||||||||||||||||||||
| Various soft futures contracts (Europe) | 12,909 | 0.03 | % | — | 0.00 | % | ||||||||||||||||||||||||||||||||||||||||||
| Total Short Futures Contracts | $ | (39,472 | ) | -0.09 | % | $ | — | 0.00 | % | |||||||||||||||||||||||||||||||||||||||
| CURRENCY FORWARDS* | ||||||||||||||||||||||||||||||||||||||||||||||||
| Various currency forwards contracts (NA) | $ | 33,569 | 0.07 | % | $ | — | 0.00 | % | ||||||||||||||||||||||||||||||||||||||||
| Total Currency Forwards | $ | 33,569 | 0.07 | % | $ | — | 0.00 | % | ||||||||||||||||||||||||||||||||||||||||
| Total Open Trade Equity (Deficit) | $ | 178,552 | 0.37 | % | $ | — | 0.00 | % | ||||||||||||||||||||||||||||||||||||||||
| SWAP (1) | ||||||||||||||||||||||||||||||||||||||||||||||||
| Frontier XXXIV Balanced select swap (U.S.) | $ | 11,340,959 | 23.51 | % | $ | — | — | Frontier XXXVII L/S select swap (U.S.) | — | — | — | — | 397,039 | 9.33 | % | |||||||||||||||||||||||||||||||||
| Total Swap | $ | 11,340,959 | 23.51 | % | $ | — | — | Total Swaps | $ | 6,376,472 | 29.70 | % | $ | — | — | $ | 397,039 | 9.33 | % | |||||||||||||||||||||||||||||
| PRIVATE INVESTMENT COMPANIES (3) | PRIVATE INVESTMENT COMPANIES (3) | PRIVATE INVESTMENT COMPANIES (3) | ||||||||||||||||||||||||||||||||||||||||||||||
| Galaxy Plus Fund - EvE STP Feeder Fund (516) LLC | $ | 2,896,099 | 6.00 | % | $ | — | — | Galaxy Plus Fund - Chesapeake Feeder Fund (518) | $ | 484,742 | 2.26 | % | $ | 967,528 | 8.09 | % | $ | 322,105 | 7.57 | % | ||||||||||||||||||||||||||||
| Galaxy Plus Fund - Aspect Feeder Fund (532) LLC | 1,439,828 | 2.99 | % | — | — | Galaxy Plus Fund - EvE STP Feeder Fund (516) LLC | 1,447,461 | 6.74 | % | 1,588,149 | 13.28 | % | 576,154 | 13.54 | % | |||||||||||||||||||||||||||||||||
| Galaxy Plus Fund - Doherty Feeder Fund (528) LLC | 2,506,740 | 5.20 | % | — | — | Galaxy Plus Fund - Doherty Feeder Fund (528) LLC | 1,253,230 | 5.84 | % | — | — | — | — | |||||||||||||||||||||||||||||||||||
| Galaxy Plus Fund - Fort Contrarian Feeder Fund (510) LLC | 5,809,539 | 12.04 | % | — | — | Galaxy Plus Fund - Fort Contrarian Feeder Fund (510) LLC | 1,713,788 | 7.98 | % | — | — | — | — | |||||||||||||||||||||||||||||||||||
| Galaxy Plus Fund - QIM Feeder Fund (526) LLC | 4,403,708 | 9.13 | % | — | — | Galaxy Plus Fund - QIM Feeder Fund (526) LLC | 2,203,960 | 10.27 | % | — | — | — | — | |||||||||||||||||||||||||||||||||||
| Galaxy Plus Fund - Quantmetrics Feeder Fund (527) LLC | 4,137,638 | 8.58 | % | — | — | Galaxy Plus Fund - Quantmetrics Feeder Fund (527) LLC | 2,067,025 | 9.63 | % | — | — | — | — | |||||||||||||||||||||||||||||||||||
| Galaxy Plus Fund - LRR Feeder Fund (522) LLC | 258,329 | 0.54 | % | — | — | Galaxy Plus Fund - Quest Feeder Fund (517) LLC | 379,664 | 1.77 | % | — | — | — | — | |||||||||||||||||||||||||||||||||||
| Galaxy Plus Fund - Welton GDP Feeder Fund (538) LLC | 8,670,031 | 17.98 | % | 3,032,072 | 44.58 | % | Galaxy Plus Fund - Aspect Feeder Fund (532) LLC | 479,522 | 2.23 | % | — | — | — | — | ||||||||||||||||||||||||||||||||||
| Galaxy Plus Fund - TT Feeder Fund (531) LLC | — | 0.00 | % | 2,547,157 | 37.45 | % | Galaxy Plus Fund - Welton GDP Feeder Fund (538) LLC | 4,343,060 | 20.23 | % | 3,203,382 | 26.79 | % | 1,024,222 | 24.08 | % | ||||||||||||||||||||||||||||||||
| Galaxy Plus Fund - Quest Feeder Fund (517) LLC | 379,983 | 0.79 | % | — | — | Galaxy Plus Fund - TT Feeder Fund (531) LLC | — | 0.00 | % | 2,648,109 | 22.15 | % | — | — | ||||||||||||||||||||||||||||||||||
| Total Private Investment Companies | $ | 30,501,895 | 63.23 | % | $ | 5,579,229 | 82.02 | % | Galaxy Plus Fund - LRR Feeder Fund (522) LLC | 129,058 | 0.60 | % | — | — | 1,096,090 | 25.77 | % | |||||||||||||||||||||||||||||||
| Total Private Investment Companies | $ | 14,501,510 | 67.54 | % | $ | 8,407,168 | 70.31 | % | $ | 3,018,571 | 70.96 | % | ||||||||||||||||||||||||||||||||||||
| INVESTMENT IN UNCONSOLIDATED COMPANIES (3) | ||||||||||||||||||||||||||||||||||||||||||||||||
| Frontier Trading Company II, LLC | $ | 3,046,981 | 6.32 | % | $ | — | — | |||||||||||||||||||||||||||||||||||||||||
| Frontier Trading Company XXXVIII, LLC | 131,195 | 0.27 | % | 91,790 | 1.35 | % | ||||||||||||||||||||||||||||||||||||||||||
| INVESTMENT IN UNCONSOLIDATED TRADING COMPANIES (3) | INVESTMENT IN UNCONSOLIDATED TRADING COMPANIES (3) | |||||||||||||||||||||||||||||||||||||||||||||||
| Frontier Trading Company XXXIX, LLC | — | — | 579,073 | 8.51 | % | Frontier Trading Company XXXVIII, LLC | $ | 151,600 | 0.71 | % | $ | 328,679 | 2.75 | % | $ | 121,510 | 2.86 | % | ||||||||||||||||||||||||||||||
| Total Investment in Unconsolidated Trading Companies | $ | 3,178,176 | 6.60 | % | $ | 670,863 | 9.87 | % | Frontier Trading Company II, LLC | 2,073,610 | 9.66 | % | 1,172,463 | 9.81 | % | — | — | |||||||||||||||||||||||||||||||
| Total Investment in Unconsolidated Trading Companies | $ | 2,225,210 | 10.37 | % | $ | 1,501,142 | 12.55 | % | $ | 121,510 | 2.86 | % | ||||||||||||||||||||||||||||||||||||
| Fair Value | Fair Value | |||||||||||||||||||||||||||||||||||||||||||||||
| U.S. TREASURY SECURITIES (2) | U.S. TREASURY SECURITIES (2) | U.S. TREASURY SECURITIES (2) | ||||||||||||||||||||||||||||||||||||||||||||||
| FACE VALUE | FACE VALUE | FACE VALUE | Fair Value | Fair Value | Fair Value | |||||||||||||||||||||||||||||||||||||||||||
| $ | 9,000,000 | US Treasury Note 6.875% due 08/15/2025 (Cost $12,218,715) | 663,808 | 1.38 | % | 464,427 | 6.83 | % | 9,000,000 | US Treasury Note 6.875% due 08/15/2025 (Cost $12,218,715) | $ | 767,049 | 3.57 | % | $ | 1,663,014 | 13.91 | % | $ | 614,803 | 14.45 | % | ||||||||||||||||||||||||||
| $ | 663,808 | 1.38 | % | $ | 464,427 | 6.83 | % | $ | 767,049 | 3.57 | % | $ | 1,663,014 | 13.91 | % | $ | 614,803 | 14.45 | % | |||||||||||||||||||||||||||||
| Face Value | Face Value | |||||||||||||||||||||||||||||||||||||||||||||||
| Additional Disclosure on U.S. Treasury Securities | Additional Disclosure on U.S. Treasury Securities | Additional Disclosure on U.S. Treasury Securities | Face Value | Face Value | Face Value | |||||||||||||||||||||||||||||||||||||||||||
| US Treasury Note 6.875% due 08/15/2025 (2) | $ | 504,145 | $ | 352,721 | ||||||||||||||||||||||||||||||||||||||||||||
| $ | 504,145 | $ | 352,721 | US Treasury Note 6.875% due 08/15/2025 (2) | $ | 582,555 | $ | 1,263,017 | $ | 466,927 | ||||||||||||||||||||||||||||||||||||||
| $ | 582,555 | $ | 1,263,017 | $ | 466,927 | |||||||||||||||||||||||||||||||||||||||||||
| Cost | Cost | |||||||||||||||||||||||||||||||||||||||||||||||
| Additional Disclosure on U.S. Treasury Securities | Additional Disclosure on U.S. Treasury Securities | Additional Disclosure on U.S. Treasury Securities | Cost | Cost | Cost | |||||||||||||||||||||||||||||||||||||||||||
| US Treasury Note 6.875% due 08/15/2025 (2) | $ | 670,014 | $ | 468,769 | US Treasury Note 6.875% due 08/15/2025 (2) | $ | 774,221 | $ | 1,678,562 | $ | 620,551 | |||||||||||||||||||||||||||||||||||||
| $ | 670,014 | $ | 468,769 | $ | 774,221 | $ | 1,678,562 | $ | 620,551 | |||||||||||||||||||||||||||||||||||||||
| (1) | See Note 4 to the Financial Statements. |
| (2) | See Note 2 to the Financial Statements. |
| (3) | See Note 5 to the Financial Statements. |
The accompanying notes are an integral part of these financial statements.
11
The Series of ContentsFrontier Funds
Condensed Schedule of Investments
December 31, 2017
| Frontier | Frontier | Frontier | Frontier | |||||||||||||||||||||||||||||||||||||
| Winton Fund | Heritage Fund | Balanced Fund | Select Fund | |||||||||||||||||||||||||||||||||||||
| Fair | % of Total Capital | Fair | % of Total Capital | Fair | % of Total Capital | Fair | % of Total Capital | |||||||||||||||||||||||||||||||||
| Description | Description | Value | (Net Asset Value) | Value | (Net Asset Value) | Description | Value | (Net Asset Value) | Value | (Net Asset Value) | ||||||||||||||||||||||||||||||
| LONG FUTURES CONTRACTS* | LONG FUTURES CONTRACTS* | |||||||||||||||||||||||||||||||||||||||
| Various base metals futures contracts (U.S.) | $ | 61,371 | 0.13 | % | $ | — | 0.00 | % | ||||||||||||||||||||||||||||||||
| Various energy futures contracts (U.S.) | 96,294 | 0.20 | % | — | 0.00 | % | ||||||||||||||||||||||||||||||||||
| Various interest rates futures contracts (Europe) | 3,733 | 0.01 | % | — | 0.00 | % | ||||||||||||||||||||||||||||||||||
| Various interest rates futures contracts (Far East) | (1,776 | ) | 0.00 | % | — | 0.00 | % | |||||||||||||||||||||||||||||||||
| Various interest rates futures contracts (Oceanic) | (15,653 | ) | -0.03 | % | — | 0.00 | % | |||||||||||||||||||||||||||||||||
| Various soft futures contract (U.S.) | 31,613 | 0.07 | % | — | 0.00 | % | ||||||||||||||||||||||||||||||||||
| Various stock index futures contracts (Canada) | 4,274 | 0.01 | % | — | 0.00 | % | ||||||||||||||||||||||||||||||||||
| Various stock index futures contracts (Europe) | (237 | ) | 0.00 | % | — | 0.00 | % | |||||||||||||||||||||||||||||||||
| Various stock index futures contracts (Far East) | 5,757 | 0.01 | % | — | 0.00 | % | ||||||||||||||||||||||||||||||||||
| Various stock index futures contracts (Oceanic) | (1,525 | ) | 0.00 | % | — | 0.00 | % | |||||||||||||||||||||||||||||||||
| Various stock index futures contracts (U.S.) | 604 | 0.00 | % | — | 0.00 | % | ||||||||||||||||||||||||||||||||||
| Total Long Futures Contracts | $ | 184,455 | 0.39 | % | $ | — | 0.00 | % | ||||||||||||||||||||||||||||||||
| SHORT FUTURES CONTRACTS* | SHORT FUTURES CONTRACTS* | |||||||||||||||||||||||||||||||||||||||
| Various base metals futures contracts (U.S.) | $ | (66,901 | ) | -0.14 | % | $ | — | — | ||||||||||||||||||||||||||||||||
| Various currency futures contracts (U.S.) | 40,897 | 0.08 | % | — | 0.00 | % | ||||||||||||||||||||||||||||||||||
| Various energy futures contracts (U.S.) | (28,561 | ) | -0.06 | % | — | 0.00 | % | |||||||||||||||||||||||||||||||||
| Various interest rates futures contracts (Canada) | (5,167 | ) | -0.01 | % | — | 0.00 | % | |||||||||||||||||||||||||||||||||
| Various interest rates futures contracts (Oceanic) | 1,509 | 0.00 | % | — | 0.00 | % | ||||||||||||||||||||||||||||||||||
| Various precious metal futures contracts (U.S.) | (12,435 | ) | -0.03 | % | — | 0.00 | % | |||||||||||||||||||||||||||||||||
| Various soft futures contract (U.S.) | 18,277 | 0.04 | % | — | 0.00 | % | ||||||||||||||||||||||||||||||||||
| Various soft futures contracts (Europe) | 12,909 | 0.03 | % | — | 0.00 | % | ||||||||||||||||||||||||||||||||||
| Total Short Futures Contracts | $ | (39,472 | ) | -0.09 | % | $ | — | 0.00 | % | |||||||||||||||||||||||||||||||
| CURRENCY FORWARDS* | CURRENCY FORWARDS* | |||||||||||||||||||||||||||||||||||||||
| Various currency forwards contracts (NA) | $ | 33,569 | 0.07 | % | $ | — | 0.00 | % | ||||||||||||||||||||||||||||||||
| Total Currency Forwards | $ | 33,569 | 0.07 | % | $ | — | 0.00 | % | ||||||||||||||||||||||||||||||||
| Total Open Trade Equity (Deficit) | $ | 178,552 | 0.37 | % | $ | — | 0.00 | % | ||||||||||||||||||||||||||||||||
| SWAP (1) | SWAP (1) | SWAP (1) | ||||||||||||||||||||||||||||||||||||||
| Frontier Brevan Howard swap (U.S.) | $ | — | — | $ | 3,094,367 | 45.63 | % | Frontier XXXIV Balanced select swap (U.S.) | $ | 11,340,959 | 23.51 | % | $ | — | — | |||||||||||||||||||||||||
| Total Swap | $ | — | — | $ | 3,094,367 | 45.63 | % | Total Swap | $ | 11,340,959 | 23.51 | % | $ | — | — | |||||||||||||||||||||||||
| PRIVATE INVESTMENT COMPANIES (3) | PRIVATE INVESTMENT COMPANIES (3) | PRIVATE INVESTMENT COMPANIES (3) | ||||||||||||||||||||||||||||||||||||||
| Galaxy Plus Fund - EvE STP Feeder Fund (516) LLC | $ | 2,896,099 | 6.00 | % | $ | — | — | |||||||||||||||||||||||||||||||||
| Galaxy Plus Fund - Aspect Feeder Fund (532) LLC | 1,439,828 | 2.99 | % | — | — | |||||||||||||||||||||||||||||||||||
| Galaxy Plus Fund - Doherty Feeder Fund (528) LLC | 2,506,740 | 5.20 | % | — | — | |||||||||||||||||||||||||||||||||||
| Galaxy Plus Fund - Fort Contrarian Feeder Fund (510) LLC | 5,809,539 | 12.04 | % | — | — | |||||||||||||||||||||||||||||||||||
| Galaxy Plus Fund - QIM Feeder Fund (526) LLC | 4,403,708 | 9.13 | % | — | — | |||||||||||||||||||||||||||||||||||
| Galaxy Plus Fund - Quantmetrics Feeder Fund (527) LLC | 4,137,638 | 8.58 | % | — | — | |||||||||||||||||||||||||||||||||||
| Galaxy Plus Fund - LRR Feeder Fund (522) LLC | 258,329 | 0.54 | % | — | — | |||||||||||||||||||||||||||||||||||
| Galaxy Plus Fund - Welton GDP Feeder Fund (538) LLC | 8,670,031 | 17.98 | % | 3,032,072 | 44.58 | % | ||||||||||||||||||||||||||||||||||
| Galaxy Plus Fund - TT Feeder Fund (531) LLC | — | 0.00 | % | 2,547,157 | 37.45 | % | ||||||||||||||||||||||||||||||||||
| Galaxy Plus Fund - Welton GDP Feeder Fund (538) LLC | $ | — | — | $ | 2,772,993 | 40.89 | % | Galaxy Plus Fund - Quest Feeder Fund (517) LLC | 379,983 | 0.79 | % | — | — | |||||||||||||||||||||||||||
| Total Private Investment Companies | $ | — | — | $ | 2,772,993 | 40.89 | % | Total Private Investment Companies | $ | 30,501,895 | 63.23 | % | $ | 5,579,229 | 82.02 | % | ||||||||||||||||||||||||
| INVESTMENT IN UNCONSOLIDATED COMPANIES (3) | INVESTMENT IN UNCONSOLIDATED COMPANIES (3) | INVESTMENT IN UNCONSOLIDATED COMPANIES (3) | ||||||||||||||||||||||||||||||||||||||
| Frontier Trading Company II, LLC | $ | 6,867,383 | 46.25 | % | $ | 1,340,071 | 19.76 | % | Frontier Trading Company II, LLC | $ | 3,046,981 | 6.32 | % | $ | — | — | ||||||||||||||||||||||||
| Frontier Trading Company XXXVIII, LLC | 1,120,192 | 7.54 | % | 206,903 | 3.05 | % | Frontier Trading Company XXXVIII, LLC | 131,195 | 0.27 | % | 91,790 | 1.35 | % | |||||||||||||||||||||||||||
| Total Investment in Unconsolidated Trading Companies | $ | 7,987,575 | 53.79 | % | $ | 1,546,974 | 22.81 | % | Frontier Trading Company XXXIX, LLC | — | — | 579,073 | 8.51 | % | ||||||||||||||||||||||||||
| Total Investment in Unconsolidated Trading Companies | $ | 3,178,176 | 6.60 | % | $ | 670,863 | 9.87 | % | ||||||||||||||||||||||||||||||||
| Fair Value | Fair Value | |||||||||||||||||||||||||||||||||||||||
| U.S. TREASURY SECURITIES (2) | U.S. TREASURY SECURITIES (2) | U.S. TREASURY SECURITIES (2) | ||||||||||||||||||||||||||||||||||||||
| FACE VALUE | FACE VALUE | FACE VALUE | Fair Value | Fair Value | ||||||||||||||||||||||||||||||||||||
| $ | 9,000,000 | US Treasury Note 6.875% due 08/15/2025 (Cost $12,218,715) | $ | 5,667,825 | 38.17 | % | $ | 1,046,861 | 15.44 | % | 9,000,000 | US Treasury Note 6.875% due 08/15/2025 (Cost $12,218,715) | 663,808 | 1.38 | % | 464,427 | 6.83 | % | ||||||||||||||||||||||
| $ | 5,667,825 | 38.17 | % | $ | 1,046,861 | 15.44 | % | $ | 663,808 | 1.38 | % | $ | 464,427 | 6.83 | % | |||||||||||||||||||||||||
| Face Value | Face Value | |||||||||||||||||||||||||||||||||||||||
| Additional Disclosure on U.S. Treasury Securities | Additional Disclosure on U.S. Treasury Securities | Additional Disclosure on U.S. Treasury Securities | Face Value | Face Value | ||||||||||||||||||||||||||||||||||||
| US Treasury Note 6.875% due 08/15/2025 (2) | $ | 4,304,570 | $ | 795,065 | �� | |||||||||||||||||||||||||||||||||||
| $ | 4,304,570 | $ | 795,065 | US Treasury Note 6.875% due 08/15/2025 (2) | $ | 504,145 | $ | 352,721 | ||||||||||||||||||||||||||||||||
| $ | 504,145 | $ | 352,721 | |||||||||||||||||||||||||||||||||||||
| Cost | Cost | |||||||||||||||||||||||||||||||||||||||
| Additional Disclosure on U.S. Treasury Securities | Additional Disclosure on U.S. Treasury Securities | Additional Disclosure on U.S. Treasury Securities | Cost | Cost | ||||||||||||||||||||||||||||||||||||
| US Treasury Note 6.875% due 08/15/2025 (2) | $ | 5,720,817 | $ | 1,056,649 | US Treasury Note 6.875% due 08/15/2025 (2) | $ | 670,014 | $ | 468,769 | |||||||||||||||||||||||||||||||
| $ | 5,720,817 | $ | 1,056,649 | $ | 670,014 | $ | 468,769 | |||||||||||||||||||||||||||||||||
| * | Except for those items disclosed, no individual futures, or forwards |
| (1) | See Note 4 to the Financial Statements. |
| (2) | See Note 2 to the Financial Statements. |
| (3) | See Note 5 to the Financial Statements. |
The accompanying notes are an integral part of these financial statements.
12
The Series of ContentsFrontier Funds
Condensed Schedule of Investments
December 31, 2017
| Frontier | Frontier | |||||||||||||||||||
| Winton Fund | Heritage Fund | |||||||||||||||||||
| Fair | % of Total Capital | Fair | % of Total Capital | |||||||||||||||||
| Description | Value | (Net Asset Value) | Value | (Net Asset Value) | ||||||||||||||||
| SWAP (1) | ||||||||||||||||||||
| Frontier Brevan Howard swap (U.S.) | $ | — | — | $ | 3,094,367 | 45.63 | % | |||||||||||||
| Total Swap | $ | — | — | $ | 3,094,367 | 45.63 | % | |||||||||||||
| PRIVATE INVESTMENT COMPANIES (3) | ||||||||||||||||||||
| Galaxy Plus Fund - Welton GDP Feeder Fund (538) LLC | $ | — | — | $ | 2,772,993 | 40.89 | % | |||||||||||||
| Total Private Investment Companies | $ | — | — | $ | 2,772,993 | 40.89 | % | |||||||||||||
| INVESTMENT IN UNCONSOLIDATED COMPANIES (3) | ||||||||||||||||||||
| Frontier Trading Company II, LLC | $ | 6,867,383 | 46.25 | % | $ | 1,340,071 | 19.76 | % | ||||||||||||
| Frontier Trading Company XXXVIII, LLC | 1,120,192 | 7.54 | % | 206,903 | 3.05 | % | ||||||||||||||
| Total Investment in Unconsolidated Trading Companies | $ | 7,987,575 | 53.79 | % | $ | 1,546,974 | 22.81 | % | ||||||||||||
| U.S. TREASURY SECURITIES (2) | ||||||||||||||||||||
| FACE VALUE | Fair Value | Fair Value | ||||||||||||||||||
| $ | 9,000,000 | US Treasury Note 6.875% due 08/15/2025 (Cost $12,218,715) | $ | 5,667,825 | 38.17 | % | $ | 1,046,861 | 15.44 | % | ||||||||||
| $ | 5,667,825 | 38.17 | % | $ | 1,046,861 | 15.44 | % | |||||||||||||
| Additional Disclosure on U.S. Treasury Securities | Face Value | Face Value | ||||||||||||||||||
| US Treasury Note 6.875% due 08/15/2025 (2) | $ | 4,304,570 | $ | 795,065 | ||||||||||||||||
| $ | 4,304,570 | $ | 795,065 | |||||||||||||||||
| Additional Disclosure on U.S. Treasury Securities | Cost | Cost | ||||||||||||||||||
| US Treasury Note 6.875% due 08/15/2025 (2) | $ | 5,720,817 | $ | 1,056,649 | ||||||||||||||||
| $ | 5,720,817 | $ | 1,056,649 | |||||||||||||||||
| Frontier Diversified Fund | Frontier Masters Fund | Frontier Long/Short Commodity Fund | ||||||||||||||||||||||
| 31-03-18 | 31-03-17 | 31-03-18 | 31-03-17 | 31-03-18 | 31-03-17 | |||||||||||||||||||
| Investment income: | ||||||||||||||||||||||||
| Interest - net | $ | 7,617 | $ | 73,263 | $ | 8,419 | $ | 40,095 | $ | 4,035 | $ | — | ||||||||||||
| Total Income | 7,617 | 73,263 | 8,419 | 40,095 | 4,035 | — | ||||||||||||||||||
| Expenses: | ||||||||||||||||||||||||
| Incentive Fees (rebate) | 1,881 | (63,508 | ) | — | — | — | ||||||||||||||||||
| Management Fees | 11,563 | 27,958 | 32,349 | 85,229 | — | — | ||||||||||||||||||
| Service Fees - Class 1 | 16,115 | 44,833 | 14,969 | 28,774 | 657 | 7,461 | ||||||||||||||||||
| Trading Fees | 165,150 | 466,674 | 134,048 | 190,175 | 24,693 | 76,785 | ||||||||||||||||||
| Total Expenses | 194,709 | 475,957 | 181,366 | 304,178 | 25,350 | 84,246 | ||||||||||||||||||
| Investment (loss) - net | (187,092 | ) | (402,694 | ) | (172,947 | ) | (264,083 | ) | (21,315 | ) | (84,246 | ) | ||||||||||||
| Realized and unrealized gain/(loss) on investments: | ||||||||||||||||||||||||
| Net unrealized gain/(loss) on private investment companies | (1,946,997 | ) | 1,800,760 | (1,342,127 | ) | 302,978 | (84,865 | ) | 211,534 | |||||||||||||||
| Net realized gain/(loss) on private investment companies | 159,265 | 479,093 | 158,432 | 130,706 | (81,438 | ) | 161,511 | |||||||||||||||||
| Net change in open trade equity/(deficit) | — | — | — | — | — | — | ||||||||||||||||||
| Net unrealized gain/(loss) on swap contracts | 451,993 | (297,851 | ) | — | — | 85,270 | 61,988 | |||||||||||||||||
| Net realized gain/(loss) on U.S. Treasury securities | (23,575 | ) | (175,480 | ) | (29,226 | ) | (109,189 | ) | (24,986 | ) | — | |||||||||||||
| Net unrealized gain/(loss) on U.S. Treasury securities | (5,937 | ) | 211,292 | (16,571 | ) | 126,735 | 2,568 | — | ||||||||||||||||
| Trading commissions | — | — | — | — | — | — | ||||||||||||||||||
| Change in fair value of investments in unconsolidated trading companies | (149,643 | ) | (10,291 | ) | (233,355 | ) | (62,391 | ) | 58 | — | ||||||||||||||
| Net gain/(loss) on investments | (1,514,894 | ) | 2,007,523 | (1,462,847 | ) | 388,839 | (103,393 | ) | 435,033 | |||||||||||||||
| NET INCREASE/(DECREASE) IN CAPITAL RESULTING FROM OPERATIONS | (1,701,986 | ) | 1,604,829 | (1,635,794 | ) | 124,756 | (124,708 | ) | 350,787 | |||||||||||||||
| Less: Operations attributable to non-controlling interests | — | — | — | — | — | |||||||||||||||||||
| NET INCREASE/(DECREASE) IN CAPITAL RESULTING FROM OPERATIONS ATTRIBUTABLE TO CONTROLLING INTERESTS | (1,701,986 | ) | $ | 1,604,829 | $ | (1,635,794 | ) | $ | 124,756 | (124,708 | ) | $ | 350,787 | |||||||||||
| NET INCREASE/(DECREASE) IN CAPITAL RESULTING FROM OPERATIONS ATTRIBUTABLE TO CONTROLLING INTERESTS PER UNIT | ||||||||||||||||||||||||
| Class 1 | $ | (9.88 | ) | $ | 2.88 | $ | (16.44 | ) | $ | 0.30 | N/A | N/A | ||||||||||||
| Class 1a | N/A | N/A | N/A | N/A | $ | (3.49 | ) | $ | 2.22 | |||||||||||||||
| Class 2 | $ | (10.93 | ) | $ | 3.80 | $ | (18.60 | ) | $ | 0.87 | $ | (3.37 | ) | $ | 3.61 | |||||||||
| Class 2a | N/A | N/A | N/A | N/A | $ | (3.64 | ) | $ | 3.81 | |||||||||||||||
| Class 3 | $ | (10.09 | ) | $ | 3.61 | $ | (17.29 | ) | $ | 0.89 | $ | (3.53 | ) | $ | 4.07 | |||||||||
| Class 3a | N/A | N/A | N/A | N/A | $ | (3.75 | ) | $ | 4.48 | |||||||||||||||
| (1) | See Note 4 to the Financial Statements. |
| (2) | See Note 2 to the Financial Statements. |
| (3) | See Note 5 to the Financial Statements. |
The accompanying notes are an integral part of these financial statements.
13
The Series of ContentsFrontier Funds
For the Three Months Ended September 30, 2018 and 2017
(Unaudited)
| Frontier Long/Short Commodity | ||||||||||||||||||||||||||||||||||||||||
| Frontier Balanced Fund | Frontier Select Fund | Frontier Diversified Fund | Frontier Masters Fund | Fund | ||||||||||||||||||||||||||||||||||||
| 31-03-18 | 31-03-17 | 31-03-18 | 31-03-17 | 9/30/2018 | 9/30/2017 | 9/30/2018 | 9/30/2017 | 9/30/2018 | 9/30/2017 | |||||||||||||||||||||||||||||||
| Investment income: | ||||||||||||||||||||||||||||||||||||||||
| Interest - net | $ | 16,516 | $ | 1,161 | $ | — | $ | — | $ | 9,370 | $ | 1,825 | $ | 4,707 | $ | 13,174 | $ | 3,176 | $ | — | ||||||||||||||||||||
| Total Income/(loss) | 16,516 | 1,161 | — | — | ||||||||||||||||||||||||||||||||||||
| Total Income | 9,370 | 1,825 | 4,707 | 13,174 | 3,176 | — | ||||||||||||||||||||||||||||||||||
| Expenses: | ||||||||||||||||||||||||||||||||||||||||
| Incentive Fees (rebate) | 145,134 | — | — | — | 10,897 | — | — | — | — | — | ||||||||||||||||||||||||||||||
| Management Fees | 20,336 | 38,479 | — | 56,175 | 13,113 | 13,509 | 22,605 | 26,862 | — | — | ||||||||||||||||||||||||||||||
| Risk analysis Fees | 1,837 | 4,424 | — | 6,829 | ||||||||||||||||||||||||||||||||||||
| Service Fees - Class 1 | 262,981 | 398,860 | 39,689 | 69,331 | 14,432 | 24,584 | 11,605 | 19,585 | 334 | 1,867 | ||||||||||||||||||||||||||||||
| Trading Fees | 384,176 | 539,715 | 37,594 | 49,044 | 145,750 | 221,452 | 95,225 | 151,229 | 19,318 | 40,897 | ||||||||||||||||||||||||||||||
| Other Fees | — | — | — | — | — | (2,428 | ) | |||||||||||||||||||||||||||||||||
| Total Expenses | 814,464 | 981,478 | 77,283 | 181,379 | 184,192 | 259,545 | 129,435 | 197,676 | 19,652 | 40,336 | ||||||||||||||||||||||||||||||
| Investment (loss) - net | (797,948 | ) | (980,317 | ) | (77,283 | ) | (181,379 | ) | (174,822 | ) | (257,720 | ) | (124,728 | ) | (184,502 | ) | (16,476 | ) | (40,336 | ) | ||||||||||||||||||||
| Realized and unrealized gain/(loss) on investments: | ||||||||||||||||||||||||||||||||||||||||
| Net realized gain/(loss) on futures, forwards and options | (25,675 | ) | (376,111 | ) | — | 172,961 | ||||||||||||||||||||||||||||||||||
| Net unrealized gain/(loss) on private investment companies | (4,007,917 | ) | 2,665,330 | (1,018,761 | ) | — | (191,468 | ) | (581,919 | ) | (43,433 | ) | (284,393 | ) | (110,281 | ) | 2,553 | |||||||||||||||||||||||
| Net realized gain/(loss) on private investment companies | 297,238 | 1,120,852 | 138,136 | — | (25,826 | ) | 475,572 | 11,891 | 152,190 | (34,683 | ) | 22,256 | ||||||||||||||||||||||||||||
| Net change in open trade equity/(deficit) | 110,265 | (69,103 | ) | — | (271,738 | ) | ||||||||||||||||||||||||||||||||||
| Net unrealized gain/(loss) on swap contracts | 999,842 | (449,564 | ) | — | — | (213,803 | ) | 145,433 | — | — | 39,017 | 50,384 | ||||||||||||||||||||||||||||
| Net realized gain/(loss) on U.S. Treasury securities | (23,857 | ) | (147,316 | ) | (7,655 | ) | (64,076 | ) | (11,658 | ) | — | (5,337 | ) | — | (4,663 | ) | — | |||||||||||||||||||||||
| Net unrealized gain/(loss) on U.S. Treasury securities | (9,963 | ) | 191,825 | (12,143 | ) | 77,777 | 3,255 | (3,031 | ) | 27,844 | (5,333 | ) | (2,297 | ) | (1,069 | ) | ||||||||||||||||||||||||
| Trading commissions | (7,625 | ) | (23,765 | ) | — | (33,530 | ) | |||||||||||||||||||||||||||||||||
| Change in fair value of investments in unconsolidated trading companies | (239,565 | ) | 14,644 | 5,578 | (247,759 | ) | 36,144 | 32,229 | (1,603 | ) | 31,473 | 1,511 | (1,334 | ) | ||||||||||||||||||||||||||
| Net gain/(loss) on investments | (2,907,257 | ) | 2,926,792 | (894,845 | ) | (366,365 | ) | (403,356 | ) | 68,284 | (10,638 | ) | (106,063 | ) | (111,396 | ) | 72,790 | |||||||||||||||||||||||
| NET INCREASE/(DECREASE) IN CAPITAL RESULTING FROM OPERATIONS | (3,705,205 | ) | 1,946,475 | (972,128 | ) | (547,744 | ) | (578,178 | ) | (189,436 | ) | (135,366 | ) | (290,565 | ) | (127,872 | ) | 32,454 | ||||||||||||||||||||||
| Less: Operations attributable to non-controlling interests | — | — | (54,310 | ) | — | — | — | — | — | — | ||||||||||||||||||||||||||||||
| NET INCREASE/(DECREASE) IN CAPITAL RESULTING FROM OPERATIONS ATTRIBUTABLE TO CONTROLLING INTERESTS | (3,705,205 | ) | $ | 1,946,475 | (972,128 | ) | $ | (493,434 | ) | $ | (578,178 | ) | $ | (189,436 | ) | $ | (135,366 | ) | $ | (290,565 | ) | $ | (127,872 | ) | $ | 32,454 | ||||||||||||||
| NET INCREASE/(DECREASE) IN CAPITAL RESULTING FROM OPERATIONS ATTRIBUTABLE TO CONTROLLING INTERESTS PER UNIT | ||||||||||||||||||||||||||||||||||||||||
| Class 1 | $ | (11.03 | ) | $ | 3.01 | $ | (13.80 | ) | $ | (4.18 | ) | $ | (3.84 | ) | $ | (1.63 | ) | $ | (2.13 | ) | $ | (2.98 | ) | N/A | N/A | |||||||||||||||
| Class 1AP | $ | (11.24 | ) | $ | 4.32 | $ | (14.66 | ) | $ | (3.89 | ) | |||||||||||||||||||||||||||||
| Class 1a | N/A | N/A | N/A | N/A | $ | (4.59 | ) | $ | (0.37 | ) | ||||||||||||||||||||||||||||||
| Class 2 | $ | (15.02 | ) | $ | 5.82 | $ | (19.45 | ) | $ | (5.05 | ) | $ | (3.96 | ) | $ | (1.32 | ) | $ | (1.99 | ) | $ | (2.95 | ) | $ | (2.98 | ) | $ | (0.03 | ) | |||||||||||
| Class 2a | $ | (13.10 | ) | $ | 5.12 | N/A | N/A | N/A | N/A | N/A | N/A | $ | (4.98 | ) | $ | (0.03 | ) | |||||||||||||||||||||||
| Class 3 | $ | (3.62 | ) | $ | (1.15 | ) | $ | (1.78 | ) | $ | (2.67 | ) | $ | (3.13 | ) | $ | (0.02 | ) | ||||||||||||||||||||||
| Class 3a | $ | (13.06 | ) | $ | 5.10 | N/A | N/A | N/A | N/A | N/A | N/A | $ | (5.17 | ) | $ | 0.03 | ||||||||||||||||||||||||
The accompanying notes are an integral part of these financial statements.
14
The Series of Contentsthe Frontier Funds
Statements of Operations
For the Three Months Ended September 30, 2018 and 2017
(Unaudited)
| Frontier Winton Fund | Frontier Heritage Fund | Frontier Balanced Fund | Frontier Select Fund | |||||||||||||||||||||||||||||
| 31-03-18 | 31-03-17 | 31-03-18 | 31-03-17 | 9/30/2018 | 9/30/2017 | 9/30/2018 | 9/30/2017 | |||||||||||||||||||||||||
| Investment income: | ||||||||||||||||||||||||||||||||
| Interest - net | $ | — | $ | — | $ | 10,592 | $ | 8,254 | $ | — | $ | — | ||||||||||||||||||||
| Total Income | — | — | — | — | ||||||||||||||||||||||||||||
| Total Income/(loss) | 10,592 | 8,254 | — | — | ||||||||||||||||||||||||||||
| Expenses: | ||||||||||||||||||||||||||||||||
| Incentive Fees (rebate) | — | (49,790 | ) | 1,394 | (4,603 | ) | ||||||||||||||||||||||||||
| Management Fees | 130,660 | 261,955 | 35,981 | 58,992 | 26,643 | 25,760 | — | — | ||||||||||||||||||||||||
| Risk analysis Fees | — | 35,428 | — | — | 1,612 | 5,009 | — | — | ||||||||||||||||||||||||
| Service Fees - Class 1 | 94,260 | 142,629 | 37,108 | 52,095 | 222,302 | 323,572 | 32,149 | 46,479 | ||||||||||||||||||||||||
| Trading Fees | 82,575 | 149,338 | 42,292 | 59,674 | 339,537 | 462,275 | 27,076 | 39,673 | ||||||||||||||||||||||||
| Total Expenses | 307,495 | 539,560 | 116,775 | 166,158 | 590,094 | 816,616 | 59,225 | 86,152 | ||||||||||||||||||||||||
| Investment (loss) - net | (307,495 | ) | (539,560 | ) | (116,775 | ) | (166,158 | ) | (579,502 | ) | (808,362 | ) | (59,225 | ) | (86,152 | ) | ||||||||||||||||
| Realized and unrealized gain/(loss) on investments: | ||||||||||||||||||||||||||||||||
| Net realized gain/(loss) on futures, forwards and options | — | 2,307,335 | — | 13,124 | 82,008 | — | — | |||||||||||||||||||||||||
| Net change in open trade equity/(deficit) | — | (1,397,146 | ) | — | ||||||||||||||||||||||||||||
| Net unrealized gain/(loss) on private investment companies | — | — | (542,177 | ) | (373,146 | ) | (727,964 | ) | 163,993 | (246,067 | ) | |||||||||||||||||||||
| Net realized gain/(loss) on private investment companies | — | — | 1,707 | 8,097 | 689,463 | (61,092 | ) | (47,803 | ) | |||||||||||||||||||||||
| Net change in open trade equity/(deficit) | (63,530 | ) | (84,039 | ) | — | — | ||||||||||||||||||||||||||
| Net unrealized gain/(loss) on swap contracts | — | — | (4,796 | ) | (411,272 | ) | (620,424 | ) | 356,572 | — | — | |||||||||||||||||||||
| Net realized gain/(loss) on U.S. Treasury securities | (155,025 | ) | (359,934 | ) | (24,499 | ) | (78,653 | ) | (18,391 | ) | — | (1,918 | ) | — | ||||||||||||||||||
| Net unrealized gain/(loss) on U.S. Treasury securities | 27,490 | 434,549 | 945 | 94,476 | 421 | (3,909 | ) | �� | 13,357 | 1,751 | ||||||||||||||||||||||
| Trading commissions | — | (16,737 | ) | — | — | (12,466 | ) | (8,224 | ) | — | — | |||||||||||||||||||||
| Change in fair value of investments in unconsolidated trading companies | (899,018 | ) | (281,256 | ) | (123,502 | ) | 22,047 | 49,118 | 63,498 | (16,945 | ) | 45,390 | ||||||||||||||||||||
| Net gain/(loss) on investments | (1,026,553 | ) | 686,811 | (692,322 | ) | (373,402 | ) | (1,017,197 | ) | 367,405 | 97,395 | (246,729 | ) | |||||||||||||||||||
| NET INCREASE/(DECREASE) IN CAPITAL RESULTING FROM OPERATIONS | (1,334,048 | ) | 147,251 | (809,097 | ) | (539,560 | ) | (1,596,699 | ) | (440,957 | ) | 38,170 | (332,881 | ) | ||||||||||||||||||
| Less: Operations attributable to non-controlling interests | — | 395,538 | (2,326 | ) | (199,400 | ) | — | — | — | — | ||||||||||||||||||||||
| NET INCREASE/(DECREASE) IN CAPITAL RESULTING FROM OPERATIONS ATTRIBUTABLE TO CONTROLLING INTERESTS | (1,334,048 | ) | $ | (248,287 | ) | (806,771 | ) | $ | (340,160 | ) | $ | (1,596,699 | ) | $ | (440,957 | ) | $ | 38,170 | $ | (332,881 | ) | |||||||||||
| NET INCREASE/(DECREASE) IN CAPITAL RESULTING FROM OPERATIONS ATTRIBUTABLE TO CONTROLLING INTERESTS PER UNIT | ||||||||||||||||||||||||||||||||
| Class 1 | $ | (14.48 | ) | $ | (1.58 | ) | $ | (16.69 | ) | $ | (4.36 | ) | $ | (5.40 | ) | $ | (1.64 | ) | $ | 0.66 | $ | (4.33 | ) | |||||||||
| Class 1AP | $ | (14.83 | ) | $ | (0.91 | ) | $ | (17.64 | ) | $ | (2.96 | ) | $ | (5.05 | ) | $ | (0.73 | ) | $ | 1.38 | $ | (4.02 | ) | |||||||||
| Class 2 | $ | (19.65 | ) | $ | (0.68 | ) | $ | (23.59 | ) | $ | (5.08 | ) | $ | (6.82 | ) | $ | (0.98 | ) | $ | 1.84 | $ | (5.45 | ) | |||||||||
| Class 2a | $ | (5.85 | ) | $ | (0.79 | ) | N/A | N/A | ||||||||||||||||||||||||
| Class 3a | $ | (5.83 | ) | $ | (0.80 | ) | N/A | N/A | ||||||||||||||||||||||||
The accompanying notes are an integral part of these financial statements.
15
The Series of Contentsthe Frontier Funds
Statements of Operations
For the Three Months Ended September 30, 2018 and 2017
(Unaudited)
| Frontier Diversified Fund | Frontier Masters Fund | |||||||||||||||||||||||||||||||||||||||||||||||||||||||||||
| Class 1 | Class 1 | Class 2 | Class 2 | Class 3 | Class 3 | Class 1 | Class 2 | Class 2 | Class 3 | Class 3 | ||||||||||||||||||||||||||||||||||||||||||||||||||
| Managing Owner | Limited Owners | Managing Owner | Limited Owners | Managing Owner | Limited Owners | Non- Controlling Interests | Total | Limited Owners | Managing Owner | Limited Owners | Managing Owner | Limited Owners | Non- Controlling Interests | Total | ||||||||||||||||||||||||||||||||||||||||||||||
| Owners’ Capital, December 31, 2017 | — | 2,332,222 | 3,361 | 9,629,385 | 213,164 | 9,288,555 | — | 21,466,687 | 2,913,542 | 87,344 | 3,451,256 | 34,209 | 5,470,789 | — | 11,957,140 | |||||||||||||||||||||||||||||||||||||||||||||
| Sale of Units | — | — | — | — | — | — | — | — | — | — | — | — | — | — | — | |||||||||||||||||||||||||||||||||||||||||||||
| Redemption of Units | — | (213,456 | ) | — | (529,912 | ) | — | (302,632 | ) | — | (1,046,000 | ) | (87,730 | ) | — | (461,827 | ) | — | (645,784 | ) | — | (1,195,341 | ) | |||||||||||||||||||||||||||||||||||||
| Transfer of Units In(Out) | — | — | — | — | — | — | — | — | — | — | — | — | — | — | — | |||||||||||||||||||||||||||||||||||||||||||||
| Net increase/(decrease) in Owners’ Capital resulting from operations attributable to controlling interests | — | (199,459 | ) | (272 | ) | (752,175 | ) | (17,112 | ) | (732,968 | ) | — | (1,701,986 | ) | (403,655 | ) | (12,189 | ) | (489,984 | ) | (4,755 | ) | (725,211 | ) | — | (1,635,794 | ) | |||||||||||||||||||||||||||||||||
| Owners’ Capital, March 31, 2018 | $ | — | $ | 1,919,307 | $ | 3,089 | $ | 8,347,298 | $ | 196,052 | $ | 8,252,955 | $ | — | $ | 18,718,701 | $ | 2,422,157 | $ | 75,155 | $ | 2,499,445 | $ | 29,454 | $ | 4,099,794 | $ | — | $ | 9,126,005 | ||||||||||||||||||||||||||||||
| Owners’ Capital - Units, December 31, 2017 | — | 20,035 | 25 | 71,229 | 1,696 | 73,905 | 25,393 | 655 | 25,898 | 275 | 43,979 | |||||||||||||||||||||||||||||||||||||||||||||||||
| Sale of Units (including transfers) | — | — | — | — | — | — | — | — | — | — | — | |||||||||||||||||||||||||||||||||||||||||||||||||
| Redemption of Units (including transfers) | — | (2,019 | ) | — | (4,053 | ) | — | (2,508 | ) | (753 | ) | — | (4,100 | ) | — | (5,700 | ) | |||||||||||||||||||||||||||||||||||||||||||
| Owners’ Capital - Units, March 31, 2018 | — | 18,016 | 25 | 67,176 | 1,696 | 71,397 | 24,639 | 655 | 21,798 | 275 | 38,279 | |||||||||||||||||||||||||||||||||||||||||||||||||
| (1) | (1) | (1) | (1) | |||||||||||||||||||||||||||||||||||||||||||||||||||||||||
| Net asset value per unit at December 31, 2017 | 116.41 | 135.19 | 125.68 | $ | 114.74 | $ | 133.27 | $ | 124.40 | |||||||||||||||||||||||||||||||||||||||||||||||||||
| Change in net asset value per unit for the Three months ended March 31, 2018 | (9.88 | ) | (10.93 | ) | (10.09 | ) | (16.44 | ) | (18.60 | ) | (17.29 | ) | ||||||||||||||||||||||||||||||||||||||||||||||||
| Net asset value per unit at March 31, 2018 | $ | 106.53 | $ | 124.26 | $ | 115.59 | $ | 98.30 | $ | 114.67 | $ | 107.10 | ||||||||||||||||||||||||||||||||||||||||||||||||
| Frontier Winton Fund | Frontier Heritage Fund | |||||||||||||||
| 9/30/2018 | 9/30/2017 | 9/30/2018 | 9/30/2017 | |||||||||||||
| Investment income: | ||||||||||||||||
| Interest - net | $ | — | $ | 19,732 | $ | — | $ | — | ||||||||
| Total Income | — | 19,732 | — | — | ||||||||||||
| Expenses: | ||||||||||||||||
| Management Fees | 104,062 | 188,835 | 22,635 | 43,021 | ||||||||||||
| Risk analysis Fees | — | 26,057 | — | — | ||||||||||||
| Service Fees - Class 1 | 76,839 | 99,725 | 29,343 | 40,954 | ||||||||||||
| Trading Fees | 73,379 | 127,661 | 33,624 | 36,907 | ||||||||||||
| Total Expenses | 254,280 | 442,278 | 85,602 | 120,882 | ||||||||||||
| Investment (loss) - net | (254,280 | ) | (422,546 | ) | (85,602 | ) | (120,882 | ) | ||||||||
| Realized and unrealized gain/(loss) on investments: | ||||||||||||||||
| Net realized gain/(loss) on futures, forwards and options | — | (276,209 | ) | — | — | |||||||||||
| Net unrealized gain/(loss) on private investment companies | — | — | 21,582 | (120,769 | ) | |||||||||||
| Net realized gain/(loss) on private investment companies | — | — | (17,465 | ) | — | |||||||||||
| Net change in open trade equity/(deficit) | — | 775,332 | — | — | ||||||||||||
| Net unrealized gain/(loss) on swap contracts | — | — | 6,454 | 110,814 | ||||||||||||
| Net realized gain/(loss) on U.S. Treasury securities | (48,714 | ) | — | (7,717 | ) | — | ||||||||||
| Net unrealized gain/(loss) on U.S. Treasury securities | (41,503 | ) | (11,591 | ) | (1,094 | ) | 238 | |||||||||
| Trading commissions | — | (15,820 | ) | — | — | |||||||||||
| Change in fair value of investments in unconsolidated trading companies | 156,865 | (31,155 | ) | 20,832 | 36,791 | |||||||||||
| Net gain/(loss) on investments | 66,648 | 440,557 | 22,592 | 27,074 | ||||||||||||
| NET INCREASE/(DECREASE) IN CAPITAL RESULTING FROM OPERATIONS | (187,632 | ) | 18,011 | (63,010 | ) | (93,808 | ) | |||||||||
| Less: Operations attributable to non-controlling interests | — | 214,425 | 3,130 | 53,727 | ||||||||||||
| NET INCREASE/(DECREASE) IN CAPITAL RESULTING FROM OPERATIONS ATTRIBUTABLE TO CONTROLLING INTERESTS | $ | (187,632 | ) | $ | (196,414 | ) | $ | (66,140 | ) | $ | (147,535 | ) | ||||
| NET INCREASE/(DECREASE) IN CAPITAL RESULTING FROM OPERATIONS ATTRIBUTABLE TO CONTROLLING INTERESTS PER UNIT | ||||||||||||||||
| Class 1 | $ | (2.64 | ) | $ | (1.79 | ) | $ | (1.58 | ) | $ | (2.99 | ) | ||||
| Class 1AP | $ | (1.68 | ) | $ | (0.76 | ) | $ | (0.88 | ) | $ | (2.39 | ) | ||||
| Class 2 | $ | 2.73 | $ | (0.96 | ) | $ | (1.23 | ) | $ | (3.21 | ) | |||||
The accompanying notes are an integral part of these financial statements.
16
The Series of Frontier Funds
Statements of Operations
For the Nine Months Ended September 30, 2018 and 2017
(Unaudited)
| Frontier Long/Short Commodity | ||||||||||||||||||||||||
| Frontier Diversified Fund | Frontier Masters Fund | Fund | ||||||||||||||||||||||
| 9/30/2018 | 9/30/2017 | 9/30/2018 | 9/30/2017 | 9/30/2018 | 9/30/2017 | |||||||||||||||||||
| Investment income: | ||||||||||||||||||||||||
| Interest - net | $ | 27,408 | $ | 99,222 | $ | 21,441 | $ | 72,591 | $ | 10,635 | $ | — | ||||||||||||
| Total Income | 27,408 | 99,222 | 21,441 | 72,591 | 10,635 | — | ||||||||||||||||||
| Expenses: | ||||||||||||||||||||||||
| Incentive Fees (rebate) | 12,778 | (63,508 | ) | — | — | — | (87,670 | ) | ||||||||||||||||
| Management Fees | 37,905 | 69,251 | 83,816 | 150,767 | — | — | ||||||||||||||||||
| Service Fees - Class 1 | 45,236 | 110,769 | 39,503 | 72,519 | 1,398 | 12,838 | ||||||||||||||||||
| Trading Fees | 454,513 | 1,154,233 | 335,271 | 527,813 | 65,530 | 183,990 | ||||||||||||||||||
| Other Fees | — | 1,766 | — | 1,792 | — | 22,548 | ||||||||||||||||||
| Total Expenses | 550,432 | 1,272,511 | 458,590 | 752,891 | 66,928 | 131,706 | ||||||||||||||||||
| Investment (loss) - net | (523,024 | ) | (1,173,289 | ) | (437,149 | ) | (680,300 | ) | (56,293 | ) | (131,706 | ) | ||||||||||||
| Realized and unrealized gain/(loss) on investments: | ||||||||||||||||||||||||
| Net unrealized gain/(loss) on private investment companies | (1,717,819 | ) | (207,161 | ) | (1,253,590 | ) | (977,064 | ) | (274,347 | ) | (329,330 | ) | ||||||||||||
| Net realized gain/(loss) on private investment companies | 45,769 | 1,567,660 | 96,298 | 429,868 | (186,723 | ) | (4,741 | ) | ||||||||||||||||
| Net unrealized gain/(loss) on swap contracts | 299,525 | 147,788 | — | — | 74,903 | 39,954 | ||||||||||||||||||
| Net realized gain/(loss) on U.S. Treasury securities | (48,013 | ) | (354,609 | ) | (45,508 | ) | (286,742 | ) | (34,564 | ) | 227,895 | |||||||||||||
| Net unrealized gain/(loss) on U.S. Treasury securities | (609 | ) | 569,536 | 10,785 | 328,820 | 1,715 | (212,189 | ) | ||||||||||||||||
| Change in fair value of investments in unconsolidated trading companies | 40,546 | (311,775 | ) | (78,937 | ) | (366,569 | ) | (301 | ) | 47,097 | ||||||||||||||
| Net gain/(loss) on investments | (1,380,601 | ) | 1,411,439 | (1,270,952 | ) | (871,687 | ) | (419,317 | ) | (231,314 | ) | |||||||||||||
| NET INCREASE/(DECREASE) IN CAPITAL RESULTING FROM OPERATIONS | (1,903,625 | ) | 238,150 | (1,708,101 | ) | (1,551,987 | ) | (475,610 | ) | (363,020 | ) | |||||||||||||
| Less: Operations attributable to non-controlling interests | — | — | — | — | — | — | ||||||||||||||||||
| NET INCREASE/(DECREASE) IN CAPITAL RESULTING FROM OPERATIONS ATTRIBUTABLE TO CONTROLLING INTERESTS | $ | (1,903,625 | ) | $ | 238,150 | $ | (1,708,101 | ) | $ | (1,551,987 | ) | $ | (475,610 | ) | $ | (363,020 | ) | |||||||
| NET INCREASE/(DECREASE) IN CAPITAL RESULTING FROM OPERATIONS ATTRIBUTABLE TO CONTROLLING INTERESTS PER UNIT | ||||||||||||||||||||||||
| Class 1 | $ | (11.95 | ) | $ | (6.33 | ) | $ | (17.54 | ) | $ | (13.39 | ) | N/A | N/A | ||||||||||
| Class 1a | N/A | N/A | N/A | N/A | $ | (15.16 | ) | $ | (9.52 | ) | ||||||||||||||
| Class 2 | $ | (12.28 | ) | $ | (5.64 | ) | $ | (18.88 | ) | $ | (13.83 | ) | $ | (12.27 | ) | $ | (13.24 | ) | ||||||
| Class 2a | N/A | N/A | N/A | N/A | $ | (16.44 | ) | $ | (10.31 | ) | ||||||||||||||
| Class 3 | $ | (11.21 | ) | $ | (5.00 | ) | $ | (17.41 | ) | $ | (12.66 | ) | $ | (12.88 | ) | $ | (8.76 | ) | ||||||
| Class 3a | N/A | N/A | N/A | N/A | $ | (17.05 | ) | $ | (7.71 | ) | ||||||||||||||
The accompanying notes are an integral part of these financial statements.
17
The Series of the Frontier Funds
Statements of Operations
For the Nine Months Ended September 30, 2018 and 2017
(Unaudited)
| Frontier Balanced Fund | Frontier Select Fund | |||||||||||||||
| 9/30/2018 | 9/30/2017 | 9/30/2018 | 9/30/2017 | |||||||||||||
| Investment income: | ||||||||||||||||
| Interest - net | $ | 35,536 | $ | 9,415 | $ | — | $ | — | ||||||||
| Total Income/(loss) | 35,536 | 9,415 | — | — | ||||||||||||
| Expenses: | ||||||||||||||||
| Incentive Fees (rebate) | 145,134 | — | — | — | ||||||||||||
| Management Fees | 69,545 | 102,297 | — | 102,047 | ||||||||||||
| Risk analysis Fees | 5,141 | 12,566 | — | 6,829 | ||||||||||||
| Service Fees - Class 1 | 723,093 | 1,106,847 | 105,111 | 176,247 | ||||||||||||
| Trading Fees | 1,068,482 | 1,625,446 | 92,779 | 137,940 | ||||||||||||
| Other Fees | — | 190,804 | — | (5,094 | ) | |||||||||||
| Total Expenses | 2,011,395 | 3,037,960 | 197,890 | 417,969 | ||||||||||||
| Investment (loss) - net | (1,975,859 | ) | (3,028,545 | ) | (197,890 | ) | (417,969 | ) | ||||||||
| Realized and unrealized gain/(loss) on investments: | ||||||||||||||||
| Net realized gain/(loss) on futures, forwards and options | (270,212 | ) | (569,161 | ) | — | (695,436 | ) | |||||||||
| Net unrealized gain/(loss) on private investment companies | (3,522,386 | ) | (1,919,200 | ) | (797,340 | ) | (779,294 | ) | ||||||||
| Net realized gain/(loss) on private investment companies | 244,703 | 3,954,532 | (1,526 | ) | (45,798 | ) | ||||||||||
| Net change in open trade equity/(deficit) | (141,192 | ) | (403,237 | ) | — | (145,848 | ) | |||||||||
| Net unrealized gain/(loss) on swap contracts | 509,226 | 420,488 | — | — | ||||||||||||
| Net realized gain/(loss) on U.S. Treasury securities | (63,298 | ) | (228,904 | ) | (14,456 | ) | (170,783 | ) | ||||||||
| Net unrealized gain/(loss) on U.S. Treasury securities | (6,119 | ) | 483,160 | 1,522 | 202,502 | |||||||||||
| Trading commissions | (41,403 | ) | (51,477 | ) | — | (46,591 | ) | |||||||||
| Change in fair value of investments in unconsolidated trading companies | 105,602 | (373,803 | ) | (53,962 | ) | (319,255 | ) | |||||||||
| Net gain/(loss) on investments | (3,185,079 | ) | 1,312,398 | (865,762 | ) | (2,000,503 | ) | |||||||||
| NET INCREASE/(DECREASE) IN CAPITAL RESULTING FROM OPERATIONS | (5,160,938 | ) | (1,716,147 | ) | (1,063,652 | ) | (2,418,472 | ) | ||||||||
| Less: Operations attributable to non-controlling interests | — | — | — | (432,628 | ) | |||||||||||
| NET INCREASE/(DECREASE) IN CAPITAL RESULTING FROM OPERATIONS ATTRIBUTABLE TO CONTROLLING INTERESTS | $ | (5,160,938 | ) | $ | (1,716,147 | ) | $ | (1,063,652 | ) | $ | (1,985,844 | ) | ||||
| NET INCREASE/(DECREASE) IN CAPITAL RESULTING FROM OPERATIONS ATTRIBUTABLE TO CONTROLLING INTERESTS PER UNIT | ||||||||||||||||
| Class 1 | $ | (16.15 | ) | $ | (6.60 | ) | $ | (14.86 | ) | $ | (19.60 | ) | ||||
| Class 1AP | $ | (14.93 | ) | $ | (3.99 | ) | $ | (14.57 | ) | $ | (19.28 | ) | ||||
| Class 2 | $ | (20.00 | ) | $ | (5.35 | ) | $ | (19.32 | ) | $ | (25.59 | ) | ||||
| Class 2a | $ | (17.29 | ) | $ | (4.07 | ) | N/A | N/A | ||||||||
| Class 3a | $ | (17.24 | ) | $ | (4.07 | ) | N/A | N/A | ||||||||
The accompanying notes are an integral part of these financial statements.
18
The Series of the Frontier Funds
Statements of Operations
For the Nine Months Ended September 30, 2018 and 2017
(Unaudited)
| Frontier Winton Fund | Frontier Heritage Fund | |||||||||||||||
| 9/30/2018 | 9/30/2017 | 9/30/2018 | 9/30/2017 | |||||||||||||
| Investment income: | ||||||||||||||||
| Interest - net | $ | — | $ | 19,732 | $ | — | $ | — | ||||||||
| Total Income | — | 19,732 | — | — | ||||||||||||
| Expenses: | ||||||||||||||||
| Incentive Fees (rebate) | — | (49,790 | ) | 1,394 | (4,603 | ) | ||||||||||
| Management Fees | 366,404 | 677,921 | 92,509 | 160,879 | ||||||||||||
| Risk analysis Fees | — | 96,830 | — | — | ||||||||||||
| Service Fees - Class 1 | 252,006 | 368,816 | 97,753 | 141,741 | ||||||||||||
| Trading Fees | 236,657 | 431,025 | 112,771 | 146,164 | ||||||||||||
| Other | — | 7,074 | — | 1,732 | ||||||||||||
| Total Expenses | 855,067 | 1,531,876 | 304,427 | 445,913 | ||||||||||||
| Investment (loss) - net | (855,067 | ) | (1,512,144 | ) | (304,427 | ) | (445,913 | ) | ||||||||
| Realized and unrealized gain/(loss) on investments: | ||||||||||||||||
| Net realized gain/(loss) on futures, forwards and options | — | 1,053,217 | — | — | ||||||||||||
| Net unrealized gain/(loss) on private investment companies | — | — | (498,155 | ) | (120,769 | ) | ||||||||||
| Net realized gain/(loss) on private investment companies | — | — | (98,763 | ) | — | |||||||||||
| Net change in open trade equity/(deficit) | — | (1,630,449 | ) | — | — | |||||||||||
| Net unrealized gain/(loss) on swap contracts | — | — | (84,079 | ) | (513,913 | ) | ||||||||||
| Net realized gain/(loss) on U.S. Treasury securities | (253,908 | ) | (1,104,301 | ) | (40,316 | ) | (211,694 | ) | ||||||||
| Net unrealized gain/(loss) on U.S. Treasury securities | 11,126 | 1,194,837 | 2,583 | 291,328 | ||||||||||||
| Trading commissions | — | (44,385 | ) | — | — | |||||||||||
| Change in fair value of investments in unconsolidated trading companies | (95,896 | ) | (334,372 | ) | 22,800 | (170,930 | ) | |||||||||
| Net gain/(loss) on investments | (338,678 | ) | (865,453 | ) | (695,930 | ) | (725,978 | ) | ||||||||
| NET INCREASE/(DECREASE) IN CAPITAL RESULTING FROM OPERATIONS | (1,193,745 | ) | (2,377,597 | ) | (1,000,357 | ) | (1,171,891 | ) | ||||||||
| Less: Operations attributable to non-controlling interests | — | (352,116 | ) | (40,765 | ) | (249,164 | ) | |||||||||
| NET INCREASE/(DECREASE) IN CAPITAL RESULTING FROM OPERATIONS ATTRIBUTABLE TO CONTROLLING INTERESTS | $ | (1,193,745 | ) | $ | (2,025,481 | ) | $ | (959,592 | ) | $ | (922,727 | ) | ||||
| NET INCREASE/(DECREASE) IN CAPITAL RESULTING FROM OPERATIONS ATTRIBUTABLE TO CONTROLLING INTERESTS PER UNIT | ||||||||||||||||
| Class 1 | $ | (13.06 | ) | $ | (12.21 | ) | $ | (20.10 | ) | $ | (13.59 | ) | ||||
| Class 1AP | $ | (10.93 | ) | $ | (9.67 | ) | $ | (19.70 | ) | $ | (12.05 | ) | ||||
| Class 2 | $ | (10.30 | ) | $ | (12.28 | ) | $ | (26.39 | ) | $ | (16.13 | ) | ||||
The accompanying notes are an integral part of these financial statements.
19
The Series of Frontier Funds
Statements of Changes in Owners’ Capital
For the Nine Months Ended September 30, 2018 (unaudited)
| Frontier Diversified Fund | Frontier Masters Fund | |||||||||||||||||||||||||||||||||||||||||||||||||||||||
| Class 1 | Class 2 | Class 2 | Class 3 | Class 3 | Class 1 | Class 2 | Class 2 | Class 3 | Class 3 | |||||||||||||||||||||||||||||||||||||||||||||||
| Limited Owners | Managing Owner | Limited Owners | Managing Owner | Limited Owners | Non- Controlling Interests | Total | Limited Owners | Managing Owner | Limited Owners | Managing Owner | Limited Owners | Non- Controlling Interests | Total | |||||||||||||||||||||||||||||||||||||||||||
| Owners’ Capital, December 31, 2017 | $ | 2,332,222 | $ | 3,361 | $ | 9,629,385 | $ | 213,164 | $ | 9,288,555 | $ | — | $ | 21,466,687 | $ | 2,913,542 | $ | 87,344 | $ | 3,451,256 | $ | 34,209 | $ | 5,470,789 | — | $ | 11,957,140 | |||||||||||||||||||||||||||||
| Sale of Units | — | — | — | — | — | — | — | — | — | — | — | — | — | — | ||||||||||||||||||||||||||||||||||||||||||
| Redemption of Units | (354,495 | ) | — | (933,695 | ) | (19,000 | ) | (1,311,411 | ) | — | (2,618,601 | ) | (299,860 | ) | (20,000 | ) | (1,457,163 | ) | (8,000 | ) | (1,671,345 | ) | — | (3,456,368 | ) | |||||||||||||||||||||||||||||||
| Transfer of Units In(Out) | — | — | — | — | — | — | — | (80,257 | ) | — | — | — | 80,257 | — | — | |||||||||||||||||||||||||||||||||||||||||
| Capital resulting from operations attributable to controlling interests | (237,395 | ) | (305 | ) | (836,809 | ) | (18,901 | ) | (810,215 | ) | — | (1,903,625 | ) | (430,946 | ) | (12,773 | ) | (516,137 | ) | (4,954 | ) | (743,291 | ) | — | (1,708,101 | ) | ||||||||||||||||||||||||||||||
| Owners’ Capital, September 30, 2018 | $ | 1,740,332 | $ | 3,056 | $ | 7,858,881 | $ | 175,263 | $ | 7,166,929 | $ | — | $ | 16,944,461 | $ | 2,102,479 | $ | 54,571 | $ | 1,477,956 | $ | 21,255 | $ | 3,136,410 | $ | — | $ | 6,792,671 | ||||||||||||||||||||||||||||
| Owners’ Capital - Units, December 31, 2017 | 20,035 | 25 | 71,229 | 1,696 | 73,905 | 25,393 | 655 | 25,898 | 275 | 43,979 | ||||||||||||||||||||||||||||||||||||||||||||||
| Sale of Units (including transfers) | — | — | — | — | — | — | — | — | — | — | ||||||||||||||||||||||||||||||||||||||||||||||
| Redemption of Units (including transfers) | (3,373 | ) | — | (7,287 | ) | (165 | ) | (11,299 | ) | (3,762 | ) | (178 | ) | (12,977 | ) | (76 | ) | (14,664 | ) | |||||||||||||||||||||||||||||||||||||
| Owners’ Capital - Units, September 30, 2018 | 16,662 | 25 | 63,942 | 1,531 | 62,606 | 21,631 | 477 | 12,921 | 199 | 29,315 | ||||||||||||||||||||||||||||||||||||||||||||||
| (1 | ) | (1 | ) | (1 | ) | (1 | ) | |||||||||||||||||||||||||||||||||||||||||||||||||
| Net asset value per unit at December 31, 2017 | 116.41 | 135.19 | 125.68 | $ | 114.74 | $ | 133.27 | $ | 124.40 | |||||||||||||||||||||||||||||||||||||||||||||||
| Change in net asset value per unit for the Nine months ended September 30, 2018 | (11.95 | ) | (12.28 | ) | (11.21 | ) | (17.54 | ) | (18.88 | ) | (17.41 | ) | ||||||||||||||||||||||||||||||||||||||||||||
| Net asset value per unit at September 30, 2018 | $ | 104.46 | $ | 122.91 | $ | 114.47 | $ | 97.20 | $ | 114.39 | $ | 106.99 | ||||||||||||||||||||||||||||||||||||||||||||
| (1) | Values are for both the Managing Owner and Limited Owners. |
The accompanying notes are an integral part of these financial statements.
1620
The Series of ContentsFrontier Funds
Statements of Changes in Owners’ Capital
For the Nine Months Ended September 30, 2018 (unaudited)
| Frontier Long/Short Commodity Fund | ||||||||||||||||||||||||||||||||||||||||||||||||||||||||||||||||||||||||||||||||
| Class 2 | Class 3 | Class 1a | Class 2a | Class 3a | ||||||||||||||||||||||||||||||||||||||||||||||||||||||||||||||||||||||||||||
| Frontier Long/Short Commodity Fund | ||||||||||||||||||||||||||||||||||||||||||||||||||||||||||||||||||||||||||||||||
| Managing Owner | Limited Owners | Limited Owners | Limited Owners | Managing Owner | Limited Owners | Managing Owner | Limited Owners | Non- Controlling Interests | Total | Class 2 | Class 3 | Class 1a | Class 2a | Class 3a | ||||||||||||||||||||||||||||||||||||||||||||||||||||||||||||||||||
| Managing Owner | Limited Owners | Limited Owners | Limited Owners | Managing Owner | Limited Owners | Managing Owner | Limited Owners | Non-Controlling Interests | Total | |||||||||||||||||||||||||||||||||||||||||||||||||||||||||||||||||||||||
| Owners’ Capital, December 31, 2017 | 11,999 | 246,901 | 2,472,994 | 107,619 | 34,112 | 408,532 | 1,759 | 970,136 | — | 4,254,052 | $ | 11,999 | $ | 246,901 | $ | 2,472,994 | $ | 107,619 | $ | 34,112 | $ | 408,532 | $ | 1,759 | $ | 970,136 | — | $ | 4,254,052 | |||||||||||||||||||||||||||||||||||||||||||||||||||
| Sale of Units | — | — | — | — | — | — | — | — | — | — | ||||||||||||||||||||||||||||||||||||||||||||||||||||||||||||||||||||||
| Redemption of Units | — | (63,154 | ) | (58,209 | ) | (60,185 | ) | — | (85,871 | ) | — | (25,324 | ) | — | (292,743 | ) | (4,500 | ) | (109,612 | ) | (215,389 | ) | (79,178 | ) | (4,501 | ) | (92,090 | ) | — | (263,745 | ) | — | (769,015 | ) | ||||||||||||||||||||||||||||||||||||||||||||||
| Transfer of Units In(Out) | — | — | — | — | — | — | — | — | — | — | — | — | — | — | — | — | — | — | — | — | ||||||||||||||||||||||||||||||||||||||||||||||||||||||||||||
| Net increase/(decrease) in Owners’ Capital resulting from operations attributable to controlling interests | (348 | ) | (4,051 | ) | (70,126 | ) | 969 | (1,327 | ) | (13,479 | ) | (68 | ) | (36,278 | ) | — | (124,708 | ) | ||||||||||||||||||||||||||||||||||||||||||||||||||||||||||||||
| Capital resulting from operations attributable to controlling interests | (1,215 | ) | (15,876 | ) | (246,671 | ) | (5,121 | ) | (5,852 | ) | (57,391 | ) | (306 | ) | (143,178 | ) | — | (475,610 | ) | |||||||||||||||||||||||||||||||||||||||||||||||||||||||||||||
| Owners’ Capital, March 31, 2018 | $ | 11,651 | $ | 179,696 | $ | 2,344,659 | $ | 48,403 | $ | 32,785 | $ | 309,182 | $ | 1,691 | $ | 908,534 | $ | — | $ | 3,836,601 | ||||||||||||||||||||||||||||||||||||||||||||||||||||||||||||
| Owners’ Capital, September 30, 2018 | $ | 6,284 | $ | 121,413 | $ | 2,010,934 | $ | 23,320 | $ | 23,759 | $ | 259,051 | $ | 1,453 | $ | 563,213 | $ | — | $ | 3,009,427 | ||||||||||||||||||||||||||||||||||||||||||||||||||||||||||||
| Owners’ Capital - Units, December 31, 2017 | 104 | 2,131 | 20,355 | 1,323 | 364 | 4,366 | 18 | 9,900 | 104 | 2,131 | 20,355 | 1,323 | 364 | 4,366 | 18 | 9,900 | ||||||||||||||||||||||||||||||||||||||||||||||||||||||||||||||||
| Sale of Units (including transfers) | — | — | — | — | — | — | — | — | — | — | — | — | — | — | — | — | ||||||||||||||||||||||||||||||||||||||||||||||||||||||||||||||||
| Redemption of Units (including transfers) | — | (534 | ) | (479 | ) | (702 | ) | — | (928 | ) | — | (260 | ) | (43 | ) | (959 | ) | (1,842 | ) | (970 | ) | (57 | ) | (1,007 | ) | — | (2,944 | ) | ||||||||||||||||||||||||||||||||||||||||||||||||||||
| Owners’ Capital - Units, March 31, 2018 | 104 | 1,597 | 19,876 | 621 | 364 | 3,438 | 18 | 9,640 | ||||||||||||||||||||||||||||||||||||||||||||||||||||||||||||||||||||||||
| Owners’ Capital - Units, September 30, 2018 | 61 | 1,172 | 18,513 | 353 | 307 | 3,359 | 18 | 6,956 | ||||||||||||||||||||||||||||||||||||||||||||||||||||||||||||||||||||||||
| (1) | (1) | (1) | (1 | ) | (1 | ) | (1 | ) | ||||||||||||||||||||||||||||||||||||||||||||||||||||||||||||||||||||||||
| Net asset value per unit at December 31, 2017 | 115.81 | 121.50 | 81.35 | 93.59 | 97.99 | 115.81 | 121.50 | 81.35 | 93.59 | 97.99 | ||||||||||||||||||||||||||||||||||||||||||||||||||||||||||||||||||||||
| Change in net asset value per unit for the Three months ended March 31, 2018 | (3.37 | ) | (3.53 | ) | (3.49 | ) | (3.64 | ) | (3.75 | ) | ||||||||||||||||||||||||||||||||||||||||||||||||||||||||||||||||||||||
| Change in net asset value per unit for the Nine months ended September 30, 2018 | (12.27 | ) | (12.88 | ) | (15.16 | ) | (16.44 | ) | (17.05 | ) | ||||||||||||||||||||||||||||||||||||||||||||||||||||||||||||||||||||||
| Net asset value per unit at March 31, 2018 | $ | 112.44 | $ | 117.97 | $ | 77.86 | $ | 89.95 | $ | 94.24 | ||||||||||||||||||||||||||||||||||||||||||||||||||||||||||||||||||||||
| Net asset value per unit at September 30, 2018 | $ | 103.54 | $ | 108.62 | $ | 66.19 | $ | 77.15 | $ | 80.94 | ||||||||||||||||||||||||||||||||||||||||||||||||||||||||||||||||||||||
| (1) | Values are for both the Managing Owner and Limited Owners. |
The accompanying notes are an integral part of these financial statements.
1721
The Series of ContentsFrontier Funds
Statements of Changes in Owners’ Capital
For the Nine Months Ended September 30, 2018 (unaudited)
| Frontier Balanced Fund | ||||||||||||||||||||||||||||||||||||||||||||||||||||||||||||||||||||||||
| Class 1 | Class 1AP | Class 2 | Class 2a | Class 3a | ||||||||||||||||||||||||||||||||||||||||||||||||||||||||||||||||||||
| Frontier Balanced Fund | ||||||||||||||||||||||||||||||||||||||||||||||||||||||||||||||||||||||||
| Limited Owners | Limited Owners | Managing Owner | Limited Owners | Managing Owner | Limited Owners | Limited Owners | Non- Controlling Interests | Total | Class 1 | Class 1AP | Class 2 | Class 2a | Class 3a | |||||||||||||||||||||||||||||||||||||||||||||||||||||||||||
| Limited Owners | Limited Owners | Managing Owner | Limited Owners | Managing Owner | Limited Owners | Limited Owners | Non-Controlling Interests | Total | ||||||||||||||||||||||||||||||||||||||||||||||||||||||||||||||||
| Owners’ Capital, December 31, 2017 | 38,744,003 | 601,247 | 147,888 | 6,829,139 | 338,655 | 191,276 | 1,379,971 | — | 48,232,179 | $ | 38,744,003 | $ | 601,247 | $ | 147,888 | $ | 6,829,139 | $ | 338,655 | $ | 191,276 | $ | 1,379,971 | — | $ | 48,232,179 | ||||||||||||||||||||||||||||||||||||||||||||||
| Sale of Units (including transfers) | — | — | — | — | — | — | — | — | — | — | — | — | — | — | — | — | ||||||||||||||||||||||||||||||||||||||||||||||||||||||||
| Redemption of Units (including transfers) | (2,307,060 | ) | 433 | — | (541,233 | ) | — | (65,879 | ) | (87,122 | ) | — | (3,000,861 | ) | (6,038,368 | ) | (111,300 | ) | (7,000 | ) | (1,507,640 | ) | (10,000 | ) | (65,968 | ) | (348,080 | ) | — | (8,088,356 | ) | |||||||||||||||||||||||||||||||||||||||||
| Net increase/(decrease) in Owners’ Capital resulting from operations attributable to controlling interests | (3,019,621 | ) | (44,877 | ) | (10,945 | ) | (501,708 | ) | (25,233 | ) | (8,180 | ) | (94,641 | ) | — | (3,705,205 | ) | (4,244,643 | ) | (58,284 | ) | (14,509 | ) | (632,476 | ) | (74,862 | ) | (10,954 | ) | (125,210 | ) | — | (5,160,938 | ) | ||||||||||||||||||||||||||||||||||||||
| Owners’ Capital, March 31, 2018 | $ | 33,417,322 | $ | 556,803 | $ | 136,943 | $ | 5,786,198 | $ | 313,422 | $ | 117,217 | $ | 1,198,208 | $ | — | $ | 41,526,113 | ||||||||||||||||||||||||||||||||||||||||||||||||||||||
| Owners’ Capital, September 30, 2018 | $ | 28,460,992 | $ | 431,663 | $ | 126,379 | $ | 4,689,023 | $ | 253,793 | $ | 114,354 | $ | 906,681 | $ | — | $ | 34,982,885 | ||||||||||||||||||||||||||||||||||||||||||||||||||||||
| Owners’ Capital - Units, December 31, 2017 | 284,956 | 3,993 | 729 | 33,657 | 1,926 | 1,089 | 7,877 | 284,956 | 3,993 | 729 | 33,657 | 1,926 | 1,089 | 7,877 | ||||||||||||||||||||||||||||||||||||||||||||||||||||||||||
| Sale of Units (including transfers) | — | — | — | — | — | — | — | — | — | — | — | — | — | — | ||||||||||||||||||||||||||||||||||||||||||||||||||||||||||
| Redemption of Units (including transfers) | (17,485 | ) | 3 | — | (2,861 | ) | — | (368 | ) | (486 | ) | (47,409 | ) | (810 | ) | (38 | ) | (8,022 | ) | (325 | ) | (367 | ) | (2,137 | ) | |||||||||||||||||||||||||||||||||||||||||||||||
| Owners’ Capital - Units, March 31, 2018 | 267,471 | 3,996 | 729 | 30,796 | 1,926 | 721 | 7,391 | |||||||||||||||||||||||||||||||||||||||||||||||||||||||||||||||||
| Owners’ Capital - Units, September 30, 2018 | 237,547 | 3,183 | 691 | 25,635 | 1,601 | 722 | 5,740 | |||||||||||||||||||||||||||||||||||||||||||||||||||||||||||||||||
| (1) | (1) | (1 | ) | (1 | ) | |||||||||||||||||||||||||||||||||||||||||||||||||||||||||||||||||||
| Net asset value per unit at December 31, 2017 | 135.96 | 150.56 | 202.90 | 175.77 | 175.18 | 135.96 | 150.56 | 202.90 | 175.77 | 175.18 | ||||||||||||||||||||||||||||||||||||||||||||||||||||||||||||||
| Change in net asset value per unit for the Three months ended March 31, 2018 | (11.03 | ) | (11.24 | ) | (15.02 | ) | (13.10 | ) | (13.06 | ) | ||||||||||||||||||||||||||||||||||||||||||||||||||||||||||||||
| Change in net asset value per unit for the Nine months ended September 30, 2018 | (16.15 | ) | (14.93 | ) | (20.00 | ) | (17.29 | ) | (17.24 | ) | ||||||||||||||||||||||||||||||||||||||||||||||||||||||||||||||
| Net asset value per unit at March 31, 2018 | $ | 124.94 | $ | 139.33 | $ | 187.88 | $ | 162.67 | $ | 162.12 | ||||||||||||||||||||||||||||||||||||||||||||||||||||||||||||||
| Net asset value per unit at September 30, 2018 | $ | 119.81 | $ | 135.63 | $ | 182.90 | $ | 158.48 | $ | 157.94 | ||||||||||||||||||||||||||||||||||||||||||||||||||||||||||||||
| (1) | Values are for both the Managing Owner and Limited Owners. |
The accompanying notes are an integral part of these financial statements.
1822
The Series of ContentsFrontier Funds
Statements of Changes in Owners’ Capital
For the Nine Months Ended September 30, 2018 (unaudited)
| Frontier Select Fund | Frontier Winton Fund | Frontier Heritage Fund | ||||||||||||||||||||||||||||||||||||||||||||||||||||||||||||||||||||||||||||||||||||||||||||||||||||||||||||||||||||||||||||||||||||||||||||||
| Class 1 | Class 1AP | Class 2 | Class 1 | Class 1AP | Class 2 | Class 1 | Class 1AP | Class 2 | ||||||||||||||||||||||||||||||||||||||||||||||||||||||||||||||||||||||||||||||||||||||||||||||||||||||||||||||||||||||||||||||||||||||||
| Frontier Select Fund | Frontier Winton Fund | Frontier Heritage Fund | ||||||||||||||||||||||||||||||||||||||||||||||||||||||||||||||||||||||||||||||||||||||||||||||||||||||||||||||||||||||||||||||||||||||||||||||
| Limited Owners | Limited Owners | Managing Owner | Limited Owners | Non- Controlling Interests | Total | Limited Owners | Limited Owners | Managing Owner | Limited Owners | Non- Controlling Interests | Total | Limited Owners | Limited Owners | Managing Owner | Limited Owners | Non- Controlling Interests | Total | Class 1 | Class 1AP | Class 2 | Class 1 | Class 1AP | Class 2 | Class 1 | Class 1AP | Class 2 | ||||||||||||||||||||||||||||||||||||||||||||||||||||||||||||||||||||||||||||||||||||||||||||||||||||||||||||||||||||||
| Limited Owners | Limited Owners | Managing Owner | Limited Owners | Non-Controlling Interests | Total | Limited Owners | Limited Owners | Managing Owner | Limited Owners | Non- Controlling Interests | Total | Limited Owners | Limited Owners | Managing Owner | Limited Owners | Non-Controlling Interests | Total | |||||||||||||||||||||||||||||||||||||||||||||||||||||||||||||||||||||||||||||||||||||||||||||||||||||||||||||||||||||||||||||||
| Owners’ Capital, December 31, 2017 | 5,912,980 | 23,354 | 70,295 | 795,299 | — | 6,801,928 | 13,102,614 | 37,761 | 153,552 | 1,555,723 | — | 14,849,650 | $ | 5,435,871 | $ | 6,083 | $ | 63,646 | $ | 697,026 | $ | 579,074 | $ | 6,781,700 | $ | 5,912,980 | $ | 23,354 | $ | 70,295 | $ | 795,299 | $ | — | $ | 6,801,928 | $ | 13,102,614 | $ | 37,761 | $ | 153,552 | $ | 1,555,723 | $ | — | $ | 14,849,650 | $ | 5,435,871 | $ | 6,083 | $ | 63,646 | $ | 697,026 | $ | 579,074 | $ | 6,781,700 | ||||||||||||||||||||||||||||||||||||||||||||||||||||||||||||||||||||||||||||||||||||
| Sale of Units | — | — | — | — | — | — | — | — | — | — | — | — | — | — | — | — | — | — | — | — | — | — | — | — | — | — | — | — | — | — | — | — | — | — | — | — | ||||||||||||||||||||||||||||||||||||||||||||||||||||||||||||||||||||||||||||||||||||||||||||||||||||||||||||
| Redemption of Units | (324,691 | ) | — | — | (30,957 | ) | — | (355,648 | ) | (163,674 | ) | (61 | ) | — | (152,407 | ) | — | (316,142 | ) | (295,955 | ) | — | — | — | — | (295,955 | ) | (813,081 | ) | (3,144 | ) | (11,000 | ) | (514,844 | ) | — | (1,342,069 | ) | (2,251,329 | ) | — | (29,000 | ) | (1,100,084 | ) | — | (3,380,413 | ) | (783,919 | ) | (4,081 | ) | (7,000 | ) | — | — | (795,000 | ) | ||||||||||||||||||||||||||||||||||||||||||||||||||||||||||||||||||||||||||||||||||||||
| Change in control of ownership - Trading Companies | — | — | — | — | — | — | — | — | — | — | — | — | — | — | — | — | — | — | ||||||||||||||||||||||||||||||||||||||||||||||||||||||||||||||||||||||||||||||||||||||||||||||||||||||||||||||||||||||||||||||
| Operations attributable to non-controlling interests | — | — | — | — | — | — | — | — | — | — | — | — | — | — | — | — | (2,326 | ) | (2,326 | ) | — | — | — | — | — | — | — | — | — | — | — | — | — | — | — | — | (40,765 | ) | (40,765 | ) | ||||||||||||||||||||||||||||||||||||||||||||||||||||||||||||||||||||||||||||||||||||||||||||||||||||||||
| Transfer of Units In(Out) | (1,232 | ) | 1,232 | — | — | — | — | — | — | — | — | — | (1,232 | ) | 1,232 | — | — | — | — | — | — | — | — | — | ||||||||||||||||||||||||||||||||||||||||||||||||||||||||||||||||||||||||||||||||||||||||||||||||||||||||||||||||||||||||
| Net increase/(decrease) in Owners’ Capital resulting from operations attributable to controlling interests | (845,858 | ) | (3,423 | ) | (10,304 | ) | (112,543 | ) | — | (972,128 | ) | (1,153,393 | ) | (3,097 | ) | (13,934 | ) | (163,624 | ) | — | (1,334,048 | ) | (706,117 | ) | (799 | ) | (8,355 | ) | (91,500 | ) | — | (806,771 | ) | (918,905 | ) | (3,537 | ) | (10,701 | ) | (130,509 | ) | — | (1,063,652 | ) | (1,106,153 | ) | (2,424 | ) | (6,037 | ) | (79,131 | ) | — | (1,193,745 | ) | (846,829 | ) | (991 | ) | (9,444 | ) | (102,328 | ) | — | (959,592 | ) | ||||||||||||||||||||||||||||||||||||||||||||||||||||||||||||||||||||||||||||||
| Owners’ Capital, March 31, 2018 | $ | 4,741,199 | $ | 21,163 | $ | 59,991 | $ | 651,799 | $ | — | $ | 5,474,152 | $ | 11,785,547 | $ | 34,603 | 139,618 | $ | 1,239,692 | $ | — | $ | 13,199,460 | $ | 4,433,799 | $ | 5,284 | $ | 55,291 | $ | 605,526 | $ | 576,748 | $ | 5,676,648 | |||||||||||||||||||||||||||||||||||||||||||||||||||||||||||||||||||||||||||||||||||||||||||||||||||||||||||||
| Owners’ Capital, September 30, 2018 | $ | 4,179,762 | $ | 17,905 | $ | 48,594 | $ | 149,946 | $ | — | $ | 4,396,207 | $ | 9,745,132 | $ | 35,337 | 118,515 | $ | 376,508 | $ | — | $ | 10,275,492 | $ | 3,805,123 | $ | 1,011 | $ | 47,202 | $ | 594,698 | $ | 538,309 | $ | 4,986,343 | |||||||||||||||||||||||||||||||||||||||||||||||||||||||||||||||||||||||||||||||||||||||||||||||||||||||||||||
| Owners’ Capital - Units, December 31, 2017 | 65,502 | 234 | 530 | 5,992 | 82,367 | 214 | 709 | 7,186 | 44,855 | 45 | 377 | 3,856 | 65,502 | 234 | 530 | 5,992 | 82,367 | 214 | 709 | 7,186 | 44,855 | 45 | 377 | 3,856 | ||||||||||||||||||||||||||||||||||||||||||||||||||||||||||||||||||||||||||||||||||||||||||||||||||||||||||||||||||||||||
| Sale of Units (including transfers) | — | 14 | — | — | — | — | — | — | — | — | — | — | — | — | — | — | — | — | — | — | — | — | — | — | ||||||||||||||||||||||||||||||||||||||||||||||||||||||||||||||||||||||||||||||||||||||||||||||||||||||||||||||||||||||||
| Redemption of Units (including transfers) | (3,503 | ) | — | — | (239 | ) | (860 | ) | — | — | (888 | ) | (2,428 | ) | — | — | — | (10,075 | ) | (24 | ) | (101 | ) | (4,670 | ) | (15,627 | ) | — | (145 | ) | (5,360 | ) | (7,219 | ) | (36 | ) | (46 | ) | — | |||||||||||||||||||||||||||||||||||||||||||||||||||||||||||||||||||||||||||||||||||||||||||||||||||||||||
| Owners’ Capital - Units, March 31, 2018 | 61,999 | 248 | 530 | 5,753 | 81,507 | 214 | 709 | 6,298 | 42,427 | 45 | 377 | 3,856 | ||||||||||||||||||||||||||||||||||||||||||||||||||||||||||||||||||||||||||||||||||||||||||||||||||||||||||||||||||||||||||||||||||||
| Owners’ Capital - Units, September 30, 2018 | 55,427 | 210 | 429 | 1,322 | 66,740 | 214 | 564 | 1,826 | 37,636 | 9 | 331 | 3,856 | ||||||||||||||||||||||||||||||||||||||||||||||||||||||||||||||||||||||||||||||||||||||||||||||||||||||||||||||||||||||||||||||||||||
| (1) | (1) | (1) | (1 | ) | (1 | ) | (1 | ) | ||||||||||||||||||||||||||||||||||||||||||||||||||||||||||||||||||||||||||||||||||||||||||||||||||||||||||||||||||||||||||||||||||||||||
| Net asset value per unit at December 31, 2017 | 90.27 | 100.02 | 132.73 | 159.08 | 176.44 | 216.50 | $ | 121.19 | $ | 134.28 | $ | 179.70 | 90.27 | 100.02 | 132.73 | 159.08 | 176.44 | 216.50 | $ | 121.19 | $ | 134.28 | $ | 179.70 | ||||||||||||||||||||||||||||||||||||||||||||||||||||||||||||||||||||||||||||||||||||||||||||||||||||||||||||||||||||||||
| Change in net asset value per unit for the Three months ended March 31, 2018 | (13.80 | ) | (14.66 | ) | (19.45 | ) | (14.48 | ) | (14.83 | ) | (19.65 | ) | (16.69 | ) | (17.64 | ) | (23.59 | ) | ||||||||||||||||||||||||||||||||||||||||||||||||||||||||||||||||||||||||||||||||||||||||||||||||||||||||||||||||||||||||||||||
| Change in net asset value per unit for the Nine months ended September 30, 2018 | (14.86 | ) | (14.57 | ) | (19.32 | ) | (13.06 | ) | (10.93 | ) | (10.30 | ) | (20.10 | ) | (19.70 | ) | (26.39 | ) | ||||||||||||||||||||||||||||||||||||||||||||||||||||||||||||||||||||||||||||||||||||||||||||||||||||||||||||||||||||||||||||||
| Net asset value per unit at March 31, 2018 | $ | 76.47 | $ | 85.36 | $ | 113.28 | $ | 144.60 | $ | 161.60 | $ | 196.85 | $ | 104.50 | $ | 116.64 | $ | 156.11 | ||||||||||||||||||||||||||||||||||||||||||||||||||||||||||||||||||||||||||||||||||||||||||||||||||||||||||||||||||||||||||||||
| Net asset value per unit at September 30, 2018 | $ | 75.41 | $ | 85.45 | $ | 113.40 | $ | 146.02 | $ | 165.51 | $ | 206.20 | $ | 101.10 | $ | 114.58 | $ | 153.31 | ||||||||||||||||||||||||||||||||||||||||||||||||||||||||||||||||||||||||||||||||||||||||||||||||||||||||||||||||||||||||||||||
| (1) | Values are for both the Managing Owner and Limited Owners. |
The accompanying notes are an integral part of these financial statements.
1923
The Series of ContentsFrontier Funds
For the Nine Months Ended September 30, 2018 and 2017
(Unaudited)
| Frontier Diversified Fund | Frontier Masters Fund | Frontier Long/Short Commodity Fund | Frontier Diversified Fund | Frontier Masters Fund | Frontier Long/Short Commodity Fund | |||||||||||||||||||||||||||||||||||||||||||
| 31-03-18 | 31-03-17 | 31-03-18 | 31-03-17 | 31-03-18 | 31-03-17 | 9/30/2018 | 9/30/2017 | 9/30/2018 | 9/30/2017 | 9/30/2018 | 9/30/2017 | |||||||||||||||||||||||||||||||||||||
| Cash Flows from Operating Activities: | ||||||||||||||||||||||||||||||||||||||||||||||||
| Net increase/(decrease) in capital resulting from operations | $ | (1,701,986 | ) | $ | 1,604,829 | $ | (1,635,794 | ) | $ | 124,756 | $ | (124,708 | ) | $ | 350,787 | $ | (1,903,625 | ) | $ | 238,150 | $ | (1,708,101 | ) | $ | (1,551,987 | ) | $ | (475,610 | ) | $ | (363,020 | ) | ||||||||||||||||
| Adjustments to reconcile net increase/(decrease) in capital resulting from operations to net cash provided by (used in) operating activities: | ||||||||||||||||||||||||||||||||||||||||||||||||
| Change in: | ||||||||||||||||||||||||||||||||||||||||||||||||
| Net change in ownership allocation of U.S. Treasury securities | 54,273 | (1,453,071 | ) | 834,551 | (721,980 | ) | (168,492 | ) | (3,640 | ) | (69,880 | ) | 3,813,934 | 1,589,162 | (317,619 | ) | (208,272 | ) | 2,332,067 | |||||||||||||||||||||||||||||
| Net unrealized (gain)/loss on swap contracts | (451,993 | ) | 297,851 | — | — | (85,270 | ) | (61,988 | ) | (299,525 | ) | (147,788 | ) | — | (74,903 | ) | (39,954 | ) | ||||||||||||||||||||||||||||||
| Net unrealized (gain)/loss on U.S. Treasury securities | 5,937 | (211,292 | ) | 16,571 | (126,735 | ) | (2,568 | ) | 49,442 | 609 | (569,536 | ) | (10,785 | ) | (328,820 | ) | (1,715 | ) | 212,189 | |||||||||||||||||||||||||||||
| Net realized (gain)/loss on U.S. Treasury securities | 23,575 | 175,480 | 29,226 | 109,189 | 24,986 | (38,832 | ) | 48,013 | 354,609 | 45,508 | 286,742 | 34,564 | (227,895 | ) | ||||||||||||||||||||||||||||||||||
| Net unrealized (gain)/loss on private investment companies | 1,946,997 | (1,800,760 | ) | 1,342,127 | (302,978 | ) | 84,865 | (211,534 | ) | 1,717,819 | 207,161 | 1,253,590 | 977,064 | 274,347 | 329,330 | |||||||||||||||||||||||||||||||||
| Net realized (gain)/loss on private investment companies | (159,265 | ) | (479,093 | ) | (158,432 | ) | (130,706 | ) | 81,438 | (161,511 | ) | (45,769 | ) | (1,567,660 | ) | (96,298 | ) | (429,868 | ) | 186,723 | 4,741 | |||||||||||||||||||||||||||
| (Purchases) sales of: | ||||||||||||||||||||||||||||||||||||||||||||||||
| Sales of U.S. Treasury securities | 794,756 | 1,892,340 | 985,558 | 1,177,476 | 844,232 | — | 1,665,387 | 2,785,190 | 1,553,660 | 3,016,330 | 1,189,411 | (2,713,824 | ) | |||||||||||||||||||||||||||||||||||
| Purchase of U.S. Treasury securities | (617,497 | ) | — | (930,341 | ) | — | (416,842 | ) | — | (1,841,423 | ) | — | (2,041,104 | ) | — | (887,337 | ) | — | ||||||||||||||||||||||||||||||
| U.S. Treasury interest and premium paid/amortized | 7,674 | 50,995 | 8,378 | 30,204 | 4,420 | (6,970 | ) | 25,935 | 27,016 | 14,162 | 29,147 | 13,128 | (10,182 | ) | ||||||||||||||||||||||||||||||||||
| Purchase of Private Investment Companies | (2,267,929 | ) | (5,000,000 | ) | (2,355,780 | ) | — | (612,567 | ) | — | (3,430,348 | ) | (13,705,362 | ) | (2,928,656 | ) | (7,857,452 | ) | (1,081,849 | ) | (2,634,827 | ) | ||||||||||||||||||||||||||
| Reduction of collateral in Swap contracts | 1,100,000 | — | — | — | — | — | 1,100,000 | 2,214,000 | — | — | 3,850,050 | |||||||||||||||||||||||||||||||||||||
| Sale of Private Investment Companies | 2,229,143 | 8,464,767 | 2,821,988 | 626,003 | 995,830 | 1,166,513 | 4,400,709 | 37,197,835 | 4,712,267 | 5,461,344 | 1,691,274 | 5,356,545 | ||||||||||||||||||||||||||||||||||||
| Increase and/or decrease in: | ||||||||||||||||||||||||||||||||||||||||||||||||
| Investments in unconsolidated trading companies, at fair value | 723,891 | 192,735 | 971,628 | 1,003,323 | 58,812 | — | 1,079,119 | 2,378,351 | 531,197 | 5,386,133 | 21,650 | (82,293 | ) | |||||||||||||||||||||||||||||||||||
| Prepaid service fees - Class 1 | — | — | — | — | — | — | ||||||||||||||||||||||||||||||||||||||||||
| Interest receivable | 11,801 | 79,006 | 28,000 | 55,210 | 9,929 | — | 6,341 | 121,045 | 27,586 | 69,848 | 8,761 | (2,671 | ) | |||||||||||||||||||||||||||||||||||
| Receivable from related parties | — | (180,648 | ) | — | (108,035 | ) | — | 87,670 | — | 231,671 | — | 153,157 | — | 87,670 | ||||||||||||||||||||||||||||||||||
| Other assets | — | (44,935 | ) | (29,580 | ) | (21,739 | ) | (16,909 | ) | (5,969 | ) | — | (36,188 | ) | 2,973 | — | (43,557 | ) | — | |||||||||||||||||||||||||||||
| Incentive fees payable to Managing Owner | (10,966 | ) | — | — | — | — | — | (1,950 | ) | — | — | — | — | — | ||||||||||||||||||||||||||||||||||
| Management fees payable to Managing Owner | 4,007 | (23,496 | ) | 11,892 | (50,174 | ) | — | — | 4,195 | (23,496 | ) | (1,455 | ) | (50,174 | ) | — | — | |||||||||||||||||||||||||||||||
| Interest payable to Managing Owner | — | — | — | — | 32 | — | — | — | — | — | (59 | ) | 9 | |||||||||||||||||||||||||||||||||||
| Trading fees payable to Managing Owner | (8,381 | ) | 175,667 | (8,918 | ) | 74,231 | (816 | ) | 31,681 | (13,905 | ) | (77,010 | ) | (16,958 | ) | (7,511 | ) | (2,866 | ) | (10,716 | ) | |||||||||||||||||||||||||||
| Service fees payable to Managing Owner | (641 | ) | 19,581 | (616 | ) | 237 | (76 | ) | (1,186 | ) | 938 | 55,703 | (945 | ) | 9,598 | (106 | ) | (1,970 | ) | |||||||||||||||||||||||||||||
| Payables to related parties | — | — | — | — | — | 738,945 | — | — | — | — | — | (1,603,124 | ) | |||||||||||||||||||||||||||||||||||
| Other liabilities | (26,489 | ) | 33,054 | — | 23,407 | — | (6,872 | ) | (21,907 | ) | (19,674 | ) | 39,602 | (5,776 | ) | (0 | ) | (5,481 | ) | |||||||||||||||||||||||||||||
| Net cash provided by (used in) operating activities | 1,656,907 | 3,793,010 | 1,930,458 | 1,761,689 | 676,296 | 1,926,536 | 2,420,733 | 33,477,951 | 2,965,405 | 4,840,156 | 643,584 | 4,476,644 | ||||||||||||||||||||||||||||||||||||
| Cash Flows from Financing Activities: | ||||||||||||||||||||||||||||||||||||||||||||||||
| Proceeds from sale of units | — | 1,536,758 | — | 431,879 | — | 704,623 | — | 785,006 | — | 67,610 | — | — | ||||||||||||||||||||||||||||||||||||
| Payment for redemption of units | (1,046,000 | ) | (3,849,141 | ) | (1,195,341 | ) | (1,282,147 | ) | (292,743 | ) | (2,625,421 | ) | (2,618,601 | ) | (34,998,790 | ) | (3,456,368 | ) | (3,779,383 | ) | (769,015 | ) | (4,157,575 | ) | ||||||||||||||||||||||||
| Owner redemptions payable | 13,445 | (61,482 | ) | 28,105 | (131,841 | ) | 1,922 | (5,738 | ) | |||||||||||||||||||||||||||||||||||||||
| Change in owner redemptions payable | 73,079 | 169,716 | 114,816 | (131,842 | ) | 6,185 | 67,290 | |||||||||||||||||||||||||||||||||||||||||
| Net cash provided by (used in) financing activities | (1,032,555 | ) | (2,373,865 | ) | (1,167,236 | ) | (982,109 | ) | (290,821 | ) | (1,926,536 | ) | (2,545,522 | ) | (34,044,068 | ) | (3,341,552 | ) | (3,843,615 | ) | (762,830 | ) | (4,090,285 | ) | ||||||||||||||||||||||||
| Net increase (decrease) in cash and cash equivalents | 624,352 | 1,419,145 | 763,222 | 779,580 | 385,475 | — | (124,789 | ) | (566,117 | ) | (376,147 | ) | 996,541 | (119,246 | ) | 386,359 | ||||||||||||||||||||||||||||||||
| Cash and cash equivalents, beginning of period | 189,890 | 674,227 | 411,695 | 546,509 | 152,200 | — | 189,890 | 674,227 | 411,695 | 546,509 | 152,200 | — | ||||||||||||||||||||||||||||||||||||
| Cash and cash equivalents, end of period | $ | 814,242 | $ | 2,093,372 | $ | 1,174,917 | $ | 1,326,089 | $ | 537,675 | $ | — | $ | 65,101 | $ | 108,110 | $ | 35,548 | $ | 1,543,050 | $ | 32,954 | $ | 386,359 | ||||||||||||||||||||||||
The accompanying notes are an integral part of these financial statements.
2024
The Series of ContentsFrontier Funds
Statements of Cash Flows
For the Nine Months Ended September 30, 2018 and 2017
(Unaudited)
| Frontier Balanced Fund | Frontier Select Fund | Frontier Balanced Fund | Frontier Select Fund | |||||||||||||||||||||||||||||
| 31-03-18 | 31-03-17 | 31-03-18 | 31-03-17 | 9/30/2018 | 9/30/2017 | 9/30/2018 | 9/30/2017 | |||||||||||||||||||||||||
| Cash Flows from Operating Activities: | ||||||||||||||||||||||||||||||||
| Net increase/(decrease) in capital resulting from operations | $ | (3,705,205 | ) | $ | 1,946,475 | $ | (972,128 | ) | $ | (547,744 | ) | $ | (5,160,938 | ) | $ | (1,716,147 | ) | $ | (1,063,652 | ) | $ | (2,418,472 | ) | |||||||||
| Adjustments to reconcile net increase/(decrease) in capital resulting from operations to net cash provided by (used in) operating activities: | ||||||||||||||||||||||||||||||||
| Change in: | ||||||||||||||||||||||||||||||||
| Net change in open trade equity, at fair value | (110,265 | ) | 69,103 | — | 271,738 | 201,996 | 397,395 | — | 686,022 | |||||||||||||||||||||||
| Due from Managing Owner | 184,106 | — | — | — | ||||||||||||||||||||||||||||
| Net change in ownership allocation of U.S. Treasury securities | (680,881 | ) | 3,146,236 | 378,992 | (34,784 | ) | 53,128 | 7,943,201 | 509,154 | 821,516 | ||||||||||||||||||||||
| Net unrealized (gain)/loss on swap contracts | (999,842 | ) | 449,564 | — | — | (509,226 | ) | (420,488 | ) | — | — | |||||||||||||||||||||
| Net unrealized (gain)/loss on U.S. Treasury securities | 9,963 | (191,825 | ) | 12,143 | (77,777 | ) | 6,119 | (483,160 | ) | (1,522 | ) | (202,502 | ) | |||||||||||||||||||
| Net realized (gain)/loss on U.S. Treasury securities | 23,857 | 147,316 | 7,655 | 64,076 | 63,298 | 228,904 | 14,456 | 170,783 | ||||||||||||||||||||||||
| Net unrealized (gain)/loss on private investment companies | 4,007,917 | (2,665,330 | ) | 1,018,761 | — | 3,522,386 | 1,919,200 | 797,340 | 779,294 | |||||||||||||||||||||||
| Net realized (gain)/loss on private investment companies | (297,238 | ) | (1,120,852 | ) | (138,136 | ) | — | (244,703 | ) | (3,954,532 | ) | 1,526 | 45,798 | |||||||||||||||||||
| (Purchases) sales of: | ||||||||||||||||||||||||||||||||
| Sales of U.S. Treasury securities | 804,315 | 1,588,622 | 258,615 | 690,980 | 2,213,107 | 887,884 | 501,919 | 1,731,714 | ||||||||||||||||||||||||
| Purchases of U.S. Treasury securities | (951,075 | ) | — | (409,224 | ) | — | (3,228,823 | ) | — | (899,134 | ) | — | ||||||||||||||||||||
| U.S. Treasury interest and premium paid/amortized | 13,548 | 60,405 | 2,829 | 17,936 | 41,873 | 24,870 | 9,132 | 15,979 | ||||||||||||||||||||||||
| Purchase of Private Investment Companies | (4,583,751 | ) | (7,500,000 | ) | (1,982,381 | ) | — | (6,751,508 | ) | (15,315,922 | ) | (2,471,707 | ) | (6,800,023 | ) | |||||||||||||||||
| Sale of Private Investment Companies | 4,072,643 | 9,751,257 | 2,367,765 | — | 9,805,250 | 30,906,344 | 3,809,055 | 1,034,717 | ||||||||||||||||||||||||
| Reduction of collateral in Swap contracts | 2,000,000 | 2,000,000 | 7,514,000 | — | ||||||||||||||||||||||||||||
| Increase and/or decrease in: | ||||||||||||||||||||||||||||||||
| Receivable from futures commission merchants | 4,561,645 | (1,432,803 | ) | — | 1,342,785 | 4,727,066 | 492,880 | — | 8,208,218 | |||||||||||||||||||||||
| Change in control of ownership - trading companies | — | — | — | (729,500 | ) | — | — | — | (3,675,188 | ) | ||||||||||||||||||||||
| Investments in unconsolidated trading companies, at fair value | 1,059,099 | 1,234,971 | 53,452 | 434,392 | 1,033,362 | 3,213,364 | 63,092 | 3,361,211 | ||||||||||||||||||||||||
| Interest receivable | 3,454 | 131,800 | 7,735 | 39,325 | 2,361 | 174,699 | 6,820 | 51,905 | ||||||||||||||||||||||||
| Receivable from related parties | — | 5,968 | — | (49,556 | ) | (0 | ) | 346,875 | — | 103,407 | ||||||||||||||||||||||
| Other assets | — | (361 | ) | (3,472 | ) | (144 | ) | (40,189 | ) | (85,207 | ) | (17,218 | ) | — | ||||||||||||||||||
| Incentive fees payable to Managing Owner | 104,945 | — | — | — | 11,554 | — | — | — | ||||||||||||||||||||||||
| Management fees payable to Managing Owner | 6,614 | (14,311 | ) | — | 46,800 | 1,063 | (12,438 | ) | — | (21,219 | ) | |||||||||||||||||||||
| Interest payable to Managing Owner | 3,432 | 12,663 | (1,115 | ) | 6,400 | (32,716 | ) | (18,335 | ) | (593 | ) | (2,644 | ) | |||||||||||||||||||
| Trading fees payable to Managing Owner | (18,201 | ) | 147,164 | (3,419 | ) | 14,793 | (26,198 | ) | (53,625 | ) | (6,368 | ) | (2,558 | ) | ||||||||||||||||||
| Service fees payable to Managing Owner | (12,608 | ) | (43,815 | ) | (2,961 | ) | (6,618 | ) | 302 | 9,837 | (6,993 | ) | (9,316 | ) | ||||||||||||||||||
| Risk analysis fees payable | 508 | 3,269 | — | 4,526 | — | 8,276 | — | (2,303 | ) | |||||||||||||||||||||||
| Due from Managing Owner | 159 | — | — | — | ||||||||||||||||||||||||||||
| Other liabilities | (49,891 | ) | 28,163 | (5,725 | ) | 4,464 | 125,196 | (89,587 | ) | (5,725 | ) | (5,863 | ) | |||||||||||||||||||
| Net cash provided by (used in) operating activities | 5,263,142 | 5,753,679 | 589,386 | 1,492,092 | 7,997,866 | 31,918,288 | 1,239,582 | 3,870,476 | ||||||||||||||||||||||||
| Cash Flows from Financing Activities: | ||||||||||||||||||||||||||||||||
| Proceeds from sale of units | — | 162,847 | — | 99,812 | — | 162,799 | — | 99,812 | ||||||||||||||||||||||||
| Payment for redemption of units | (3,000,861 | ) | (4,548,234 | ) | (355,648 | ) | (1,112,739 | ) | (8,088,356 | ) | (31,560,889 | ) | (1,342,069 | ) | (3,914,340 | ) | ||||||||||||||||
| Pending owner additions | — | — | — | — | ||||||||||||||||||||||||||||
| Owner redemptions payable | (67,074 | ) | (721,071 | ) | — | (134,579 | ) | |||||||||||||||||||||||||
| Change in owner redemptions payable | 31,266 | (496,370 | ) | 10,437 | (132,437 | ) | ||||||||||||||||||||||||||
| Net cash provided by (used in) financing activities | (3,067,935 | ) | (5,106,458 | ) | (355,648 | ) | (1,147,506 | ) | (8,057,090 | ) | (31,894,460 | ) | (1,335,704 | ) | (3,946,965 | ) | ||||||||||||||||
| Net increase (decrease) in cash and cash equivalents | 2,195,207 | 647,221 | 233,738 | 344,586 | (59,224 | ) | 23,828 | (92,050 | ) | (76,489 | ) | |||||||||||||||||||||
| Cash and cash equivalents, beginning of period | 164,332 | 1,083,579 | 114,973 | 432,021 | 164,332 | 1,083,579 | 114,973 | 432,021 | ||||||||||||||||||||||||
| Cash and cash equivalents, end of period | $ | 2,359,539 | $ | 1,730,800 | $ | 348,711 | $ | 776,607 | $ | 105,108 | $ | 1,107,407 | $ | 22,923 | $ | 355,532 | ||||||||||||||||
The accompanying notes are an integral part of these financial statements.
2125
The Series of ContentsFrontier Funds
Statements of Cash Flows
For the Nine Months Ended September 30, 2018 and 2017
(Unaudited)
| Frontier Winton Fund | Frontier Heritage Fund | Frontier Winton Fund | Frontier Heritage Fund | |||||||||||||||||||||||||||||
| 31-03-18 | 31-03-17 | 31-03-18 | 31-03-17 | 9/30/2018 | 9/30/2017 | 9/30/2018 | 9/30/2017 | |||||||||||||||||||||||||
| Cash Flows from Operating Activities: | ||||||||||||||||||||||||||||||||
| Net increase/(decrease) in capital resulting from operations | $ | (1,334,048 | ) | $ | 147,251 | $ | (809,097 | ) | $ | (539,560 | ) | $ | (1,193,745 | ) | $ | (2,377,597 | ) | $ | (1,000,357 | ) | $ | (1,171,891 | ) | |||||||||
| Adjustments to reconcile net increase/(decrease) in capital resulting from operations to net cash provided by (used in) operating activities: | ||||||||||||||||||||||||||||||||
| Change in: | ||||||||||||||||||||||||||||||||
| Net change in open trade equity, at fair value | — | 1,397,146 | — | — | — | 1,682,758 | — | — | ||||||||||||||||||||||||
| Net change in ownership allocation of U.S. Treasury securities | (664,565 | ) | (1,015,270 | ) | 246,124 | 82,507 | (1,817,543 | ) | (4,622,172 | ) | (54,774 | ) | 635,669 | |||||||||||||||||||
| Net unrealized (gain)/loss on swap contracts | — | — | 4,796 | 411,272 | — | — | 84,079 | 513,913 | ||||||||||||||||||||||||
| Net unrealized (gain) loss on U.S. Treasury securities, at fair value | (27,490 | ) | (434,549 | ) | (945 | ) | (94,476 | ) | (11,126 | ) | (1,194,837 | ) | (2,583 | ) | (291,328 | ) | ||||||||||||||||
| Net realized (gain) loss on U.S. Treasury securities, at fair value | 155,025 | 359,934 | 24,499 | 78,653 | 253,908 | 1,104,301 | 40,316 | 211,694 | ||||||||||||||||||||||||
| Net unrealized (gain)/loss on private investment companies | — | — | 542,177 | — | ||||||||||||||||||||||||||||
| Net realized (gain)/loss on private investment companies | — | — | (1,707 | ) | — | |||||||||||||||||||||||||||
| Net unrealized gain/(loss) on private investment companies | — | 498,155 | 120,769 | |||||||||||||||||||||||||||||
| Net realized gain/(loss) on private investment companies | — | 98,763 | — | |||||||||||||||||||||||||||||
| (Purchases) sale of: | ||||||||||||||||||||||||||||||||
| Sales of U.S. Treasury Securities | 5,234,675 | 3,881,462 | 827,151 | 848,182 | 8,763,298 | 12,652,125 | 1,393,371 | 2,231,740 | ||||||||||||||||||||||||
| Purchases of U.S. Treasury Securities | (2,418,631 | ) | — | (453,470 | ) | — | (6,626,880 | ) | — | (1,204,398 | ) | — | ||||||||||||||||||||
| U.S. Treasury interest and premium paid/amortized | 28,974 | 96,568 | 4,655 | 22,163 | 137,325 | 119,303 | 23,530 | 22,396 | ||||||||||||||||||||||||
| Purchase of Private Investment Companies | — | — | (477,416 | ) | — | — | (683,033 | ) | (2,306,940 | ) | ||||||||||||||||||||||
| Sale of Private Investment Companies | — | — | 22,971 | — | — | 763,850 | 5,000,000 | |||||||||||||||||||||||||
| Increase and/or decrease in: | ||||||||||||||||||||||||||||||||
| Receivable from futures commission merchants | — | (1,959,638 | ) | — | — | — | 4,110,059 | — | — | |||||||||||||||||||||||
| Change in control of ownership of trading companies | — | (156,729 | ) | — | — | — | (2,330,730 | ) | — | (2,424,186 | ) | |||||||||||||||||||||
| Investments in unconsolidated trading companies, at fair value | 3,502,685 | 1,104,448 | 740,272 | 333,090 | 2,976,783 | 2,563,419 | 636,915 | 1,418,793 | ||||||||||||||||||||||||
| Interest receivable | 89,359 | 209,120 | 17,984 | 50,560 | 76,588 | 240,952 | 14,617 | 63,252 | ||||||||||||||||||||||||
| Receivable from related parties | (11,319 | ) | (307,366 | ) | — | (56,354 | ) | 58,146 | 551,508 | — | 131,430 | |||||||||||||||||||||
| Other assets | (74,529 | ) | — | (1 | ) | (178 | ) | (18,359 | ) | — | 0 | (10,159 | ) | |||||||||||||||||||
| Incentive fees payable to Managing Owner | — | — | 1,394 | — | ||||||||||||||||||||||||||||
| Management fees payable to Managing Owner | 34,469 | (6,149 | ) | 11,721 | (56,501 | ) | (18,565 | ) | (162,168 | ) | (7,101 | ) | (56,501 | ) | ||||||||||||||||||
| Interest payable to Managing Owner | (11,077 | ) | 21,509 | (1,459 | ) | 4,397 | (5,222 | ) | (30,730 | ) | (690 | ) | (5,244 | ) | ||||||||||||||||||
| Trading fees payable to Managing Owner | (17,037 | ) | 44,630 | (1,708 | ) | 18,930 | (19,877 | ) | (13,939 | ) | (3,723 | ) | (3,472 | ) | ||||||||||||||||||
| Service fees payable to Managing Owner | (1,445 | ) | (21,992 | ) | (1,910 | ) | (12,523 | ) | (5,901 | ) | 9,638 | (1,482 | ) | (2,721 | ) | |||||||||||||||||
| Risk analysis fees payable | — | 23,213 | — | — | 13,842 | — | — | |||||||||||||||||||||||||
| Payables to related parties | — | — | — | — | (152,219 | ) | — | — | — | |||||||||||||||||||||||
| Other liabilities | (82,265 | ) | 20,492 | (7,542 | ) | 5,629 | (82,266 | ) | 110,418 | (1,475 | ) | (18,085 | ) | |||||||||||||||||||
| Net cash provided by (used in) operating activities | 4,402,781 | 3,404,080 | 688,489 | 1,095,791 | 2,314,346 | 12,426,150 | 593,981 | 4,059,129 | ||||||||||||||||||||||||
| Cash Flows from Financing Activities: | ||||||||||||||||||||||||||||||||
| Proceeds from sale of units | — | 297,931 | — | 34,437 | — | 283,970 | — | 34,436 | ||||||||||||||||||||||||
| Payment for redemption of units | (316,142 | ) | (974,009 | ) | (295,955 | ) | (559,335 | ) | (3,380,413 | ) | (7,243,617 | ) | (795,000 | ) | (3,664,806 | ) | ||||||||||||||||
| Pending owner additions | — | — | — | — | — | — | ||||||||||||||||||||||||||
| Owner redemptions payable | — | 4,346 | (3 | ) | — | |||||||||||||||||||||||||||
| Change in owner redemptions payable | 7,649 | (9,900 | ) | 924 | 33,898 | |||||||||||||||||||||||||||
| Net cash provided by (used in) financing activities | (316,142 | ) | (671,732 | ) | (295,958 | ) | (524,898 | ) | (3,372,764 | ) | (6,969,547 | ) | (794,076 | ) | (3,596,472 | ) | ||||||||||||||||
| Net increase (decrease) in cash and cash equivalents | 4,086,639 | 2,732,348 | 392,531 | 570,893 | (1,058,418 | ) | 5,456,603 | (200,096 | ) | 462,657 | ||||||||||||||||||||||
| Cash and cash equivalents, beginning of period | 1,403,125 | 1,628,208 | 259,161 | 382,499 | 1,403,125 | 1,628,208 | 259,161 | 382,499 | ||||||||||||||||||||||||
| Cash and cash equivalents, end of period | $ | 5,489,764 | $ | 4,360,556 | $ | 651,692 | $ | 953,392 | $ | 344,707 | $ | 7,084,811 | $ | 59,065 | $ | 845,156 | ||||||||||||||||
The accompanying notes are an integral part of these financial statements.
2226
The Series of Contentsthe Frontier Funds
Notes to Financial Statements (Unaudited)
1. Organization and Purpose
Frontier Funds (formerly Equinox Frontier Funds), which is referred to in this report as “the Trust”, was formed on August 8, 2003, as a Delaware statutory trust. The Trust is a multi-advisor commodity pool, as described in Commodity Futures Trading Commission (the “CFTC”) Regulation § 4.10(d)(2). The Trust has authority to issue separate series, or each, a Series, of units of beneficial interest (the “Units”) pursuant to the requirements of the Delaware Statutory Trust Act, as amended (the “Trust Act”). The assets of each Series are valued and accounted for separately from the assets of other Series. The Trust is not registered as an investment company under the Investment Company Act of 1940, as amended (the “Investment Company Act”). The Trust is managed by Frontier Fund Management LLC (the “Managing Owner”). The Managing Owner was incorporated in Delaware in November, 2016. The Managing Owner has delegated its commodity pool operator (“CPO”) responsibilities to Wakefield Advisors LLC pursuant to the Commodity Pool Operator Delegation Agreement between the Managing Owner and Wakefield Advisors LLC, which has been registered with the CFTC as a commodity pool operator since January 7, 2013, and has been a member of the NFA since that date. Under the Commodity Pool Operator Delegation Agreement, Wakefield does not receive any fees or remuneration from the Managing Owner in connection with the performance of its obligations thereunder. The Commodity Pool Operator Delegation Agreement is effective until terminated by either the Managing Owner or Wakefield, or until Wakefield is no longer registered as a CPO (unless excluded or exempt from CPO registration under the Commodity Exchange Act, as amended (the “Commodity Exchange Act”)). The Managing Owner remains jointly and severally liable with Wakefield Advisors LLC for violations of the Commodity Exchange Act and CPO Regulations. However, Wakefield Advisors LLC will indemnify the Managing Owner from and against any and all loss, liability, damage, penalty, fine, cost and expense (including attorneys’, accountants’, experts’, and other professionals’ fees and expenses incurred in investigation or defense of any and all demands, claims, actions, suits, or arbitrations) actually and reasonably incurred by the Managing Owner, based upon, arising out of or from, or in any way in connection with, any act, activity, conduct, performance, omission, or non-performance by the Wakefield Advisors LLC of any of its functions as CPO or which violates the Commodity Exchange Act or CPO Regulations in connection with its functions as CPO.
Purchasers of Units are limited owners of the Trust (“Limited Owners”) with respect to beneficial interests of the Series’ Units purchased. The Trust Act provides that, except as otherwise provided in the second amended and restated declaration of trust and trust agreement dated December 9, 2013, as further amended, by and among the Managing Owner, Wilmington Trust Company as trustee and the unitholders, as amended from time to time (the “Trust Agreement”), unitholders in a Delaware statutory trust will have the same limitation of liability as do stockholders of private corporations organized under the General Corporation Law of the State of Delaware. The Trust Agreement confers substantially the same limited liability, and contains the same limited exceptions thereto, as would a limited partnership agreement for a Delaware limited partnership engaged in like transactions as the Trust. In addition, pursuant to the Trust Agreement, the Managing Owner of the Trust is liable for obligations of a Series in excess of that Series’ assets. Limited Owners do not have any such liability. The Managing Owner will make contributions to Series of the Trust necessary to maintain at least a 1% interest in the aggregate capital, profits and losses of the combined Series of the Trust.
The Trust has been organized to pool investor funds to trading in the United States (“U.S.”) and international markets for currencies, interest rates, stock indices, agricultural and energy products, precious and base metals and other commodities. The Trust may also engage in futures contracts, forwards, option contracts and other interest in derivative instruments, including swap contracts.
The Trust has seven (7) separate and distinct series of Units issued and outstanding: Frontier Diversified Fund, Frontier Masters Fund, Frontier Long/Short Commodity Fund, Frontier Balanced Fund, Frontier Select Fund, Frontier Winton Fund and Frontier Heritage Fund, (each a “Series” and collectively, the “Series”). The Trust financial statements are comprised of unitized Series which are consolidated into the Trust financial statements. However, the consolidated Trust does not issue units.
27
The Trust, with respect to each Series:
| ● | engages in the speculative trading of a diversified portfolio of futures, forwards (including interbank foreign |
| ● | allocates funds to a limited liability trading company or companies affiliated with the Managing Owner (“Trading Company” or “Trading Companies” or to an unaffiliated series limited liability company (“Galaxy Plus entities” or “Galaxy Plus entity”), each of which has one-year renewable contracts with its own independent trading advisor(s) (each a “Trading Advisor”) that will manage all or a portion of the applicable Trading Company’s or Galaxy Plus entity’s assets, and make the trading decisions for the assets of each Series vested in such Trading Company of Galaxy Plus entity. The assets of each Trading Company and Galaxy Plus entity will be segregated from the assets of the other Trading Companies and Galaxy Plus entities. |
| ● | maintains separate, distinct records for each Series, and accounts for the assets of each Series separately from the other Series; |
| ● | calculates the Net Asset Value (“NAV”) of its Units for each Series separately from the other Series; |
| ● | has an investment objective of increasing the value of each Series’ Units over the long term (capital appreciation), while managing risk and volatility; further, to offer exposure to the investment programs of individual Trading Advisors and to specific instruments; |
| ● | maintains each Series of Units in three to seven sub-classes—Class 1, Class 1AP, Class 1a, Class 2, Class 2a, Class 3, and Class 3a. Investors who have purchased Class 1 or Class 1a Units of Frontier Diversified Fund, Frontier Masters Fund, and Frontier Long/Short Commodity Fund are charged a service fee of up to two percent (2.0%) annually of the NAV (or the purchase price, in case of the initial service fee) of each Unit purchased, for the benefit of selling agents selling such Class 1 or Class 1a Units. The initial service fee, which is amortized monthly at an annual rate of up to two percent (2.0%) of the average daily NAV of Class 1 or Class 1a of such Series, is prepaid to the Managing Owner by each Series, and paid to the selling agents by the Managing Owner in the month following sale; provided, however, that investors who redeem all or a portion of their Class 1 or Class 1a Units of any Series during the first twelve (12) months following the effective date of their purchase are subject to a redemption fee of up to two percent (2.0%) of the purchase price at which such investor redeemed to reimburse the Managing Owner for the then-unamortized balance of the prepaid initial service fee. Investors who have purchased Class 1 or Class 1a Units of Frontier Balanced Fund, Frontier Heritage Fund, Frontier Select Fund, and Frontier Winton Fund are charged a service fee of up to three percent (3.0%) annually of the NAV (of the purchase price, in case of the initial service fee) of each Unit purchased, for the benefit of selling agents selling such Class 1 or Class 1a Units. The initial service fee, which is amortized monthly at an annual rate of up to three percent (3.0%) of the average daily NAV of Class 1 or Class 1a of such Series, is prepaid to the Managing Owner by each Series, and paid to the selling agents by the Managing Owner in the month following sale. With respect to Class 2 and Class 2a Units of any Series, the Managing Owner pays an ongoing service fee to selling agents of up to one half percent (0.5%) annually of the NAV of each Class 2 or Class 2a Unit (of which 0.25% will be charged to Limited Owners holding Class 2 Units of the Frontier Diversified Fund, and Frontier Masters Fund or Class 2a Units of the Frontier Long/Short Commodity Fund sold until such Class 2 or Class 2a Units which are subject to the fee limitation are reclassified as Class 3 or Class 3a Units of the applicable Series. Class 1AP was created as a sub-class of Class 1 and it has been presented separately because the fees applicable to it are different from those applicable to Class 1. Currently the service fee is not charged to Class 1AP investors. The Managing Owner may also pay selling agents certain additional fees and expenses for administrative and other services rendered and expenses incurred by such selling agents; and |
23
| ● | all payments made to selling agents who are members of the Financial Industry Regulatory Authority, Inc. (“FINRA”) and their associated persons that constitute underwriting compensation will be subject to the limitations set forth in Rule 2310(b)(4)(B)(ii) (formerly Rule 2810(b)(4)(B)(ii)) of the Conduct Rules of FINRA (“Rule 2310”). An investor’s Class 1 Units or Class 2 Units of any Series, or Class 1a Units or Class 2a Units of the Frontier Long/Short Commodity Fund or Frontier Balanced Fund will be classified as Class 3 or Class 3a Units of such Series, as applicable, when the Managing Owner determines that the fee limitation with respect to such Units has been reached or will be reached. The service fee limit applicable to each unit sold is reached upon the earlier of when (I) the aggregate initial and ongoing service fees received by the selling agent with respect to such unit equals 9% of the purchase price of such unit or (ii) the aggregate underwriting compensation (determined in accordance with FINRA Rule 2310) paid in respect of such unit totals 10% of the purchase price of such unit. No service fees are paid with respect to Class 3 or Class 3a Units. Units of any Class in a Series may be redeemed, in whole or in part, on a daily basis, at the then current NAV per Unit for such Series on the day of the week after the date the Managing Owner is in receipt of a redemption request for at least one (1) Business Day to be received by the Managing Owner prior to 4:00 PM in New York. |
28
The assets of any particular Series include only those funds and other assets that are paid to, held by or distributed to the Trust on account of and for the benefit of that Series. Under the “Inter-Series Limitation on Liability” expressly provided for under Section 3804(a) of the Trust Act, separate and distinct records of the cash and equivalents, although pooled for maximizing returns, are maintained in the books and records of each Series.
As of March 31,September 30, 2018, the total Units outstanding were 158,310144,766 for the Frontier Diversified Fund, 35,65864,542 for the Frontier Masters Fund, 30,739 for the Frontier Long/Short Commodity Fund, 85,647 for the Frontier Masters Fund, 312,030275,120 for the Frontier Balanced Fund, 68,53157,387 for the Frontier Select Fund, 88,72869,343 for the Frontier Winton Fund and 46,705,41,833 for the Frontier Heritage Fund.
As of March 31,September 30, 2018, the Trust, with respect to the Frontier Diversified Fund and Frontier Masters Fund, separates Units into three separate Classes—Class 1, Class 2, and Class 3. The Trust, with respect to the Frontier Select Fund, Frontier Winton Fund, and Frontier Heritage separates Units into a maximum of three separate Classes—Class 1, Class 2 and Class 1AP. The Trust, with respect to the Frontier Balanced Fund separates Units into a maximum of five separate Classes— Class 1, Class 1AP, Class 2, Class 2A and Class 3A. The Trust, with respect to the Frontier Long/Short Commodity Fund separates Units into a maximum of five separate Classes—Class 1A, Class 2A, Class 2, Class 3A and Class 3. On May 10, 2017, the interests Frontier Trading Company XV, LLC, which included exposure to Transtrend B.V.’s TT Enhanced Risk (USD) Program, were transferred to an individual Delaware limited liability company (“Master Fund”) in Galaxy Plus. The Master Fund is sponsored and operated by Gemini Alternative Funds, LLC (“Sponsor”). The Sponsor has contracted with the Trading Advisors to manage the portfolios of the Master Funds pursuant to the advisors’ respective program. For those Series that invest in Galaxy Plus, approximately 30-70% of those Series assets are used to support the margin requirements of the Master Funds. The remaining assets of the Series are split between investments in Trading Companies and a pooled cash management account that invests primarily in U.S. Treasury securities. For those Series that do not invest in Galaxy Plus, their assets are split between investments in Trading Companies and investments in the pooled cash management account.
As of March 31,September 30, 2018, Frontier Winton Fund has invested a portion of its assets in a singleinto two Trading Company,Companies, and a single Trading Advisor manages 100% of the assets invested in sucheach of these Trading Company.Companies. Each of the remaining Series has invested a portion of its assets in several different Trading Companies or Galaxy Plus entities and one or more Trading Advisors may manage the assets invested in such Trading Companies or Galaxy Plus entities.
24
Table of Contents2. Significant Accounting Policies
The following are the significant accounting policies of the Series of the Trust.
Basis of Presentation—The Series of the Trust follow U.S. Generally Accepted Accounting Principles (“GAAP”), as established by the Financial Accounting Standards Board (the “FASB”), to ensure consistent reporting of financial condition, condensed schedules of investments, results of operations, changes in capital and cash flows. The Trust is an investment company following accounting and reporting guidance in Accounting Standards Codification (“ASC”) 946.
Consolidation—The Series, through investing in the Trading Companies and Galaxy Plus, authorize certain Trading Advisors to place trades and manage assets at pre-determined investment levels. The Trading Companies were organized by the Managing Owner for the purpose of investing in commodities interests and derivative instruments, and have no operating income or expenses, except for trading income and expenses and a risk analysis fee (for closed Series only), all of which is allocated to the Series, if consolidated by a Series. Galaxy Plus is a series of Delaware limited liability companies, sponsored by Gemini Alternative Funds, LLC, that create exposure to a variety of third party professional managed futures and foreign exchange advisors. Galaxy Plus is available to qualified high-net-worth individuals and institutional investors. Trading Companies in which a Series has a controlling and majority interest as calculated on that Series’ pro-rata net asset value in the Trading Company are consolidated by such Series. Investment interests in Galaxy Plus entities are accounted for using net asset value as the practical expedient, which approximates fair value. Fair value represents the proportionate share of the Trust’s interest in the net asset value in the Galaxy Plus entities. The equity interest held by Trust is shown as investments in private investment companies in the statements of financial condition. The income or is shown in the statements of operations as net unrealized gain/(loss) on private investment companies. The Trading Companies and Series of the Trust are consolidated by the Trust.
29
Galaxy Plus entities are co-mingled investment vehicles. In addition to the Trust, there are other non-affiliated investors in Galaxy Plus. Subscriptions and redemptions by these non-affiliated investors will have a direct impact on the Trust ownership percentage in Galaxy Plus. It is expected that ownership percentage will fluctuate (sometimes significantly) on a week by week basis which could also result in frequent changes in the consolidating Series. Such fluctuations make consolidating the financial statements of the Galaxy Plus entities both impractical and misleading. Non-consolidation of these Galaxy Plus entities presents a more useful financial statement for the readers. As such, management has decided that presenting Galaxy Plus entities on a non-consolidated basis as investments in other investments companies (a “fund of funds” approach) is appropriate and preferable to the users of these financial statements. Refer to Note 5 for additional disclosures related to these private investment companies.
Use of Estimates—The preparation of financial statements in conformity with GAAP may require the Managing Owner to make estimates and assumptions that affect the reported amounts of assets and liabilities and disclosure of contingent assets and liabilities at the date of the financial statements and the reported amounts of revenue and expenses during the reporting period. The valuation of swap contracts requires significant estimates as well as the valuation of certain other investments. Please refer to Note 3 for discussion of valuation methodology. Actual results could differ from these estimates, and such differences could be material.
Cash and Cash Equivalents—Cash and cash equivalents include cash and overnight investments in interest-bearing demand deposits held at banks with original maturities of three months or less. This cash is not restricted.
Interest Income— U.S. Treasury Securities are pooled for purposes of maximizing returns on these assets to investors of all Series. Interest income from pooled cash management assets is recognized on the accrual basis and allocated daily to each Series based upon its daily proportion of ownership of the pool.
Aggregate interest income from all sources, including U.S. Treasury Securities assets net of premiums and cash held at clearing brokers, of up to the first 2% (annualized) is paid to the Managing Owner by the Frontier Balanced Fund (Class 1 and Class 2), Frontier Winton Fund, Frontier Select Fund, and Frontier Heritage Fund. For the Frontier Diversified Fund, Frontier Long/Short Commodity Fund (Class 1a, Class 2a, Class 3a only), Frontier Masters Fund, and Frontier Balanced Fund (Class 1AP, Class 2a and Class 3a) 100% of the interest is retained by the respective Series. All interest not paid to the Managing Owner is interest income to the Series, and shown net on the statement of operations.
U.S. Treasury Securities—U.S. Treasury Securities are allocated to all Series of the Trust based on each Series’ percentage ownership in the pooled cash management assets as of the reporting date. They are reported at fair value as Level 1 inputs under ASC 820,Fair Value Measurements and Disclosures (“ASC 820”). The Series of the Trust valued U.S. Treasury Securities at fair value and recorded the daily change in value in the statements of operations as net unrealized gain/(loss) on U.S. Treasury securities. Accrued interest is reported on the statements of financial condition as interest receivable.
25
Receivable from Futures Commission Merchants—The Trust deposits assets with a FCM subject to CFTC regulations and various exchange and broker requirements. Margin requirements are satisfied by the deposit of cash with such FCM. The Trust earns interest income on its assets deposited with the FCM. A portion of the receivable is restricted cash required to meet maintenance margin requirements. Cash with the clearing broker as of March 31,September 30, 2018 included restricted cash for margin requirements of $1,838,199$1,450,731 for Frontier Trading Company I LLC and $3,693,894$4,306,571 for Frontier Trading Company II LLC.
Investment Transactions—Futures, options on futures, forward and swap contracts are recorded on a trade date basis and realized gains or losses are recognized when contracts are settled. Unrealized gains or losses on open contracts (the difference between contract trade price and market price) are reported in the consolidated statements of financial condition as a net unrealized gain or loss, as there exists a right of offset of unrealized gains or losses in accordance with FASB ASC 210,Balance Sheet (“ASC 210”) and Accounting Standards Update (ASU) 2013-01,Balance Sheet (Topic 210).
30
Any change in net unrealized gain or loss from the preceding period is reported in the consolidated statements of operations. Fair value of exchange-traded contracts is based upon exchange settlement prices. Fair value of non-exchange-traded contracts is based on third party quoted dealer values on the interbank market. For U.S. Treasury securities, interest was recognized in the period earned and the instruments were marked-to-market daily based on third party information. Transaction costs are recognized as incurred and reflected separately in the consolidated statements of operations.
Purchase and Sales of Private Investment Companies – The Trust is able to subscribe into and redeem from the Galaxy Plus entities on a weekly basis. The value of the private investment companies is determined by the Sponsor and reported on a daily basis. The change in value is calculated as the difference between the total purchase proceeds and the fair value calculated by the Sponsor and is recorded as net unrealized gain/(loss) on private investment companies on the statements of operations.
Foreign Currency Transactions—The Series functional currency is the U.S. dollar; however, they transact business in currencies other than the U.S. dollar. The Series of the Trust do not isolate that portion of the results of operations resulting from changes in foreign exchange rates on investments from fluctuations arising from changes in market prices of securities held. Such fluctuations are included with the net realized or unrealized gain or loss from investments.
Allocation of Earnings—Each Series of the Trust may maintain three to seven classes of Units—Class 1, Class 2, Class 3, Class 1a, Class 2a Class 3a and Class 1AP. All classes have identical voting, dividend, liquidation and other rights and the same terms and conditions, except that fees charged to a Class or Series differ as described below. Revenues, expenses (other than expenses attributable to a specific class), and realized and unrealized trading gains and losses of each Series are allocated daily to Class 1, Class 1a, Class 2, Class 2a, Class 3, Class 3a and Class 1AP Units based on each Class’ respective owners’ capital balances as applicable to the classes maintained by the Series.
Each Series allocates funds to an affiliated Trading Company, or Companies, of the Trust, or unaffiliated Galaxy Plus entity. Each Trading Company allocates all of its daily trading gains or losses to the Series in proportion to each Series’ ownership trading level interest in the Trading Company, adjusted on a daily basis (except for Trading Advisors and other investments such as swaps that are directly allocated to a specific Series). Likewise, trading gains and losses earned and incurred by the Series through their investments in Galaxy Plus entities are allocated to those Series on a daily basis. The allocation of gains and losses in Galaxy Plus entities are based on each Series pro-rata shares of the trading level of that entity which is updated at the beginning of each month or more frequently if there is a subscription or redemption activity in the entity. The value of all open contracts and cash held at clearing brokers is similarly allocated to the Series in proportion to each Series’ funds allocated to the Trading Companies or Galaxy Plus entities.
Investments and Swaps— The Trust records investment transactions on a trade date basis and all investments are recorded at fair value, with changes in fair value reported as a component of realized and unrealized gains/(losses) on investments in the statements of operations. Investments in private investment companies are valued utilizing the net asset values as a practical expedient. Certain Series of the Trust strategically invest a portion or all of their assets in total return swaps, selected at the discretion of the Managing Owner. Swaps are privately negotiated contracts designed to provide investment returns linked to those produced by one or more underlying investment products or indices. In a typical swap, two parties agree to exchange the returns (or differentials in rates of return) earned or realized on one or more particular predetermined investments or instruments. The gross returns to be exchanged or “swapped” between the parties are calculated with respect to a “notional amount” (i.e., the amount of value of the underlying asset used in computing the particular interest rate, return, or other amount to be exchanged) in a particular investment, or in a “basket” of securities. The valuation of swap contracts requires significant estimates. Swap contracts are reported at fair value based upon daily reports from the counterparty. The Managing Owner reviews and approves current day pricing of the CTA positions, as received from the counterparty which includes intra-day volatility and volume and daily index performance, that is used to determine a daily fair value NAV for the swap contracts.
2631
Income Taxes—The Trust, with respect to the Series, applies the provisions of ASC 740Income Taxes (“ASC 740”), which provides guidance for how uncertain tax positions should be recognized, measured, presented and disclosed in the financial statements. This interpretation also provides guidance on derecognition, classification, interest and penalties, accounting in interim periods and disclosure. ASC 740 requires the evaluation of tax positions taken or expected to be taken in the course of preparing the Trust, with respect to the Series’, financial statements to determine whether the tax positions are “more-likely-than-not” of being sustained by the applicable tax authority. Tax positions with respect to tax at the Trust’s level not deemed to meet the “more-likely-than-not” threshold would be recorded as a tax benefit or expense in the current year. The Managing Owner has concluded there is no tax expense, interest or penalties to be recorded by the Trust, with respect to the Series. The 2014 through 2017 tax years generally remain subject to examination by U.S. federal and most state tax authorities.
In the opinion of the Managing Owner, (i) the Trust, with respect to the Series, is treated as a partnership for federal income tax purposes and, assuming that at least 90% of the gross income of the Trust constitutes “qualifying income” within the meaning of Section 7704(d) of the Code, (ii) the Trust is not a publicly traded partnership treated as a corporation, and (iii) the discussion set forth in the Prospectus under the heading “U.S. Federal Income Tax Consequences” correctly summarizes the material federal income tax consequences as of the date of the Prospectus to potential U.S. Limited Owners of the purchase, ownership and disposition of Units of the Trust.
Fees and Expenses—All management fees, incentive fees, service fees risk analysis fee (for closed Series only) and trading fees of the Trust, with respect to the Series, are paid to the Managing Owner. It is the responsibility of the Managing Owner to pay all Trading Advisor management and incentive fees, selling agent service fees and all other operating expenses and continuing offering costs of the Trust, with respect to the Series. Only management fees and incentive fees related to assets allocated through Trading Companies are included in expense on the Statement of Operations. The Series are all charged management and incentive fees on the asset allocated through the Galaxy Plus entities. Those fees are included in unrealized gain/(loss) on private investment companies on the Statements of Operations. The Series are also charged management and incentive fees on assets allocated to swaps. Such fees are embedded in the fair value of the swap and are included in net unrealized gain (loss) on swap contracts on the Statements of Operations. Certain Series are also changed a risk analysis fee (for closed Series only) based on a percentage of nominal assets. Such fee is paid to a third party.
Incentive Fee (rebate)—The Managing Owner is allowed to share in the incentive fees earned by the Trading Advisors up to 10% of New Net Profits (as defined in the prospectus). If the Managing Owner’s share of the incentive fee exceeds 10% of new net profits during the period, then the Managing Owner is obligated to return any amount in excess. The returned amounts are recorded as Incentive Fee (Rebate) on the Statements of Operations.
Service Fees—The Trust may maintain each Series of Units in three to seven sub-classes—Class 1, Class 1AP, Class 1a, Class 2, Class 2a, Class 3, and Class 3a. Investors who have purchased Class 1 or Class 1a Units of Frontier Diversified Fund, Frontier Masters Fund, and Frontier Long/Short Commodity Fund are charged a service fee of up to two percent (2.0%) annually of the NAV (of the purchase price, in case of the initial service fee) of each Unit purchased, for the benefit of selling agents selling such Class 1 or Class 1a Units. The initial service fee, which is amortized monthly at an annual rate of up to two percent (2.0%) of the average daily NAV of Class 1 or Class 1a of such Series, is prepaid to the Managing Owner by each Series, and paid to the selling agents by the Managing Owner in the month following sale; provided, however, that investors who redeem all or a portion of their Class 1 and Class 1a Units of any Series during the first twelve (12) months following the effective date of their purchase are subject to a redemption fee of up to two percent (2.0%) of the purchase price at which such investor redeemed to reimburse the Managing Owner for the then-unamortized balance of the prepaid initial service fee. Investors who have purchased Class 1 or Class 1a Units of Frontier Balanced Fund, Frontier Heritage Fund, Frontier Select Fund, and Frontier Winton Fund are charged a service fee of up to three percent (3.0%) annually of the NAV (of the purchase price, in case of the initial service fee) of each Unit purchased, for the benefit of selling agents selling such Class 1 or Class 1a Units. The initial service fee, which is amortized monthly at an annual rate of up to three percent (3.0%) of the average daily NAV of Class 1 or Class 1a of such Series, is prepaid to the Managing Owner by each Series, and paid to the selling agents by the Managing Owner in the month following sale; provided, however, that investors who redeem all or a portion of their Class 1 and Class 1a Units of any Series during the first twelve (12) months following the effective date of their purchase are subject to a redemption fee of up to three percent (3.0%) of the purchase price at which such investor redeemed to reimburse the Managing Owner for the then-unamortized balance of the prepaid initial service fee. With respect to Class 2 and Class 2a Units of any Series, the Managing Owner pays an ongoing service fee to selling agents of up to one half percent (0.5%) annually of the NAV of each Class 2 or Class 2a Unit (of which 0.25% will be charged to Limited Owners holding Class 2 Units of the Frontier Diversified Fund and Frontier Masters Fund or Class 2a Units of the Frontier Long/Short Commodity Fund sold) until such Class 2 or Class 2a Units which are subject to the fee limitation are reclassified as Class 3 or Class 3a Units of the applicable Series for administrative purposes. Currently the service fee is not charged to Class 1AP investors. The Managing Owner may also pay selling agents certain additional fees and expenses for administrative and other services rendered and expenses incurred by such selling agents.
2732
These service fees are part of the offering costs of the Trust, which include registration and filing fees, legal and blue sky expenses, accounting and audit, printing, marketing support and other offering costs which are borne by the Managing Owner. With respect to the service fees, the initial service fee (for the first 12 months) relating to a purchase of Class 1 and Class 1a Units by an investor is prepaid by the Managing Owner to the relevant selling agent in the month following such purchase and is reimbursed for such payment by the Series monthly in arrears in an amount based upon a corresponding percentage of NAV, calculated daily. Consequently, the Managing Owner bears the risk of the downside and enjoys the benefit of the upside potential of any difference between the amount of the initial service fee prepaid by it and the amount of the reimbursement thereof, which may result from variations in NAV over the following 12 months.
Pending Owner Additions—Funds received for new subscriptions and for additions to existing owner interests are recorded as capital additions at the NAV per unit of the second business day following receipt.
Owner redemptions payable—Funds payable for existing owner redemption requests are recorded as capital subtractions at the NAV per unit on the second business day following receipt or request.
Subsequent Events—The Series, follow the provisions of ASC 855, Subsequent Events, which establishes general standards of accounting for and disclosure of events that occur after the balance sheet date and up through the date the financial statements are issued.
3. Fair Value Measurements
In connection with the valuation of investments the Series apply ASC 820. ASC 820 provides clarification that when a quoted price in an active market for the identical asset or liability is not available, a reporting entity is required to measure fair value using certain techniques. ASC 820 also clarifies that when estimating the fair value of an asset or liability, a reporting entity is not required to include a separate input or adjustment to other inputs relating to the existence of a restriction that prevents the transfer of an asset or liability. ASC 820 also clarifies that both a quoted price in an active market for the identical asset or liability at the measurement date and the quoted price for the identical asset or liability when traded as an asset in an active market when no adjustments to the quoted price of the asset are required are Level 1 fair value measurements.
Level 1 Inputs
Unadjusted quoted prices in active markets for identical financial assets that the reporting entity has the ability to access at the measurement date.
Level 2 Inputs
Inputs other than quoted prices included in Level 1 that are observable for the financial assets or liabilities, either directly or indirectly. These might include quoted prices for similar financial assets in active markets, quoted prices for identical or similar financial assets in markets that are not active, inputs other than quoted prices that are observable for the financial assets or inputs that are derived principally from or corroborated by market data by correlation or other means.
33
Level 3 Inputs
Unobservable inputs for determining the fair value of financial assets that reflect an entity’s own assumptions about the assumptions that market participants would use in pricing the financial asset.
The Trust, with respect to the Series, uses the following methodologies to value instruments within its financial asset portfolio at fair value:
Trading Securities. These instruments include U.S. Treasury securities and open trade equity positions (futures contracts) that are actively traded on public markets with quoted pricing for corroboration. U.S. Treasury securities and futures contracts, are reported at fair value using Level 1 inputs. Trading securities instruments further include open trade equity positions (trading options and currency forwards) that are quoted prices for identical or similar assets that are not traded on active markets. Trading options and currency forwards are reported at fair value using Level 2 inputs.
28
Swap Contracts.Certain Series of the Trust strategically invest a portion or all of their assets in total return swaps, selected at the direction of the Managing Owner. Swaps are privately negotiated contracts designed to provide investment returns linked to those produced by one or more investment products or indices. In a typical swap, two parties agree to exchange the returns (or differentials in rates of return) earned or realized on one or more particular predetermined investments or instruments. The gross returns to be exchanged or “swapped” between parties are calculated with respect to a “notional amount” (i.e., the amount of value of the underlying asset used in computing the particular interest rate, return, or other amount to be exchanged) in a particular investment, or in a “basket” of securities. Swap contracts are reported at fair value upon daily reports from the counterparty. In addition, a third party takes the inputs from the counterparty, makes certain adjustments, and runs it through their pricing model to come up with their daily price. The fair value measurements of the swap contracts are valued using unadjusted inputs that were not internally developed. The Managing Owner reviews and compares approves current day pricing of the CTA positions, as received from the counterparty which includes intra-day volatility and volume and daily index performance, as well as from the third party. Differences in prices exceeding 5% are investigated. Unexplainable differences are escalated to the Managing Owner’s Valuation Committee for evaluation and resolution.
Investment in Unconsolidated Trading Companies. This investment represents the fair value of the allocation of cash, futures, forwards, options and swaps to each respective Series relative to its trading allocations from unconsolidated Trading Companies. A Series may redeem its investment in any of the Trading Companies on a daily basis at the Trading Company’s stated net asset value. Each of the Series, all of which are under the same management as the Trading Companies, has access to the underlying positions of the Trading Companies, and as such, the level determination is reflected on that look-through basis. Any redemption of an investment in a Trading Company classified as Level 3 will reflect that classification of the underlying investment owned by the Trading Company. As such, the Series report investments in unconsolidated Trading Companies at fair value using the corresponding inputs of the underlying securities of the Trading Companies which results in the Series reporting the corresponding level determination from the inputs of the Trading Company.
Investments in Private Investment Companies. Investments in private investment companies are valued utilizing the net asset values provided by the underlying private investment companies as a practical expedient. The Series applies the practical expedient to its investments in private investment companies on an investment-by-investment basis, and consistently with the Series’ entire position in a particular investment, unless it is probable that the Series will sell a portion of an investment at an amount different from the net asset value of the investment.
2934
The following table summarizes the instruments that comprise the Trust, with respect to the Series, financial asset portfolio, by Series, measured at fair value on a recurring basis as of March 31,September 30, 2018 and December 31, 2017 segregated by the level of valuation inputs within the fair value hierarchy utilized to measure fair value. Investments in private investment companies are valued utilizing the net asset values provided by the underlying private investment companies as a practical expedient. Each Series applies the practical expedient to its investments in private investment companies on an investment-by-investment basis, and consistently with the Series entire position in a particular investment, unless it is probable that the Series will sell a portion of an investment at an amount different from the net asset value of the investment.
| Total | Level 1 | Level 2 | Level 3 | Total | ||||||||||||||||||||||||||||
| March 31, 2018 | Level 1 Inputs | Level 2 Inputs | Level 3 Inputs | Fair Value | ||||||||||||||||||||||||||||
| September 30, 2018 | Inputs | Inputs | Inputs | Fair Value | ||||||||||||||||||||||||||||
| Frontier Diversified Fund | ||||||||||||||||||||||||||||||||
| Investment in Unconsolidated Trading Companies | $ | 1,471,992 | $ | 29,327 | $ | — | $ | 1,501,319 | $ | 1,169,987 | $ | (23,896 | ) | $ | — | $ | 1,146,091 | |||||||||||||||
| Swap Contracts | — | — | 5,728,465 | 5,728,465 | — | — | 5,575,997 | 5,575,997 | ||||||||||||||||||||||||
| U.S. Treasury Securities | 498,331 | — | — | 498,331 | 938,408 | — | — | 938,408 | ||||||||||||||||||||||||
| Frontier Masters Fund | ||||||||||||||||||||||||||||||||
| Investment in Unconsolidated Trading Companies | 521,709 | 7,805 | — | 529,514 | 991,679 | (21,734 | ) | — | 969,945 | |||||||||||||||||||||||
| U.S. Treasury Securities | 719,071 | — | — | 719,071 | 512,411 | — | — | 512,411 | ||||||||||||||||||||||||
| Frontier Long/Short Commodity Fund | ||||||||||||||||||||||||||||||||
| Investment in Unconsolidated Trading Companies | 62,698 | — | — | 62,698 | 99,860 | — | — | 99,860 | ||||||||||||||||||||||||
| Swap Contracts | — | — | 482,309 | 482,309 | — | — | 471,942 | 471,942 | ||||||||||||||||||||||||
| U.S. Treasury Securities | 329,067 | — | — | 329,067 | 475,024 | — | — | 475,024 | ||||||||||||||||||||||||
| Frontier Balanced Fund | ||||||||||||||||||||||||||||||||
| Investment in Unconsolidated Trading Companies | 2,083,608 | 35,469 | — | 2,119,077 | 2,190,822 | (46,008 | ) | — | 2,144,814 | |||||||||||||||||||||||
| Open Trade Equity (Deficit) | 254,123 | 34,694 | — | 288,817 | (23,444 | ) | — | — | (23,444 | ) | ||||||||||||||||||||||
| Swap Contracts | — | — | 10,340,801 | 10,340,801 | — | — | 9,850,185 | 9,850,185 | ||||||||||||||||||||||||
| U.S. Treasury Securities | 1,444,081 | — | — | 1,444,081 | 1,515,106 | — | — | 1,515,106 | ||||||||||||||||||||||||
| Frontier Select Fund | ||||||||||||||||||||||||||||||||
| Investment in Unconsolidated Trading Companies | 40,663 | — | 576,748 | 617,411 | 69,462 | — | 538,309 | 607,771 | ||||||||||||||||||||||||
| U.S. Treasury Securities | 213,418 | — | — | 213,418 | 330,422 | — | — | 330,422 | ||||||||||||||||||||||||
| Frontier Winton Fund | ||||||||||||||||||||||||||||||||
| Investment in Unconsolidated Trading Companies | 4,405,984 | 78,906 | — | 4,484,890 | 5,110,724 | (99,932 | ) | — | 5,010,792 | |||||||||||||||||||||||
| U.S. Treasury Securities | 3,359,837 | — | — | 3,359,837 | 4,968,843 | — | — | 4,968,843 | ||||||||||||||||||||||||
| Frontier Heritage Fund | ||||||||||||||||||||||||||||||||
| Investment in Unconsolidated Trading Companies | 791,914 | 14,787 | — | 806,701 | 928,475 | (18,416 | ) | — | 910,059 | |||||||||||||||||||||||
| Swap Contracts | — | — | 3,089,571 | 3,089,571 | — | — | 3,010,288 | 3,010,288 | ||||||||||||||||||||||||
| U.S. Treasury Securities | 398,847 | — | — | 398,847 | 851,399 | — | — | 851,399 | ||||||||||||||||||||||||
3035
| Total | ||||||||||||||||
| December 31, 2017 | Level 1 Inputs | Level 2 Inputs | Level 3 Inputs | Fair Value | ||||||||||||
| Frontier Diversified Fund | ||||||||||||||||
| Investment in Unconsolidated Trading Companies | $ | 2,152,721 | $ | 55,593 | $ | — | $ | 2,208,314 | ||||||||
| Swap Contracts | — | — | 6,376,472 | 6,376,472 | ||||||||||||
| U.S. Treasury Securities | 767,049 | — | — | 767,049 | ||||||||||||
| Frontier Masters Fund | ||||||||||||||||
| Investment in Unconsolidated Trading Companies | 1,460,743 | 31,450 | — | 1,492,193 | ||||||||||||
| U.S. Treasury Securities | 1,663,014 | — | — | 1,663,014 | ||||||||||||
| Frontier Long/Short Commodity Fund | ||||||||||||||||
| Investment in Unconsolidated Trading Companies | 121,510 | — | — | 121,510 | ||||||||||||
| Swap Contracts | — | — | 397,039 | 397,039 | ||||||||||||
| U.S. Treasury Securities | 614,803 | — | — | 614,803 | ||||||||||||
| Frontier Balanced Fund | ||||||||||||||||
| Investment in Unconsolidated Trading Companies | 3,072,933 | 81,725 | — | 3,154,658 | ||||||||||||
| Open Trade Equity (Deficit) | 144,983 | 33,569 | — | 178,552 | ||||||||||||
| Swap Contracts | — | — | 11,340,959 | 11,340,959 | ||||||||||||
| U.S. Treasury Securities | 663,808 | — | — | 663,808 | ||||||||||||
| Frontier Select Fund | ||||||||||||||||
| Investment in Unconsolidated Trading Companies | 91,790 | — | 579,073 | 670,863 | ||||||||||||
| U.S. Treasury Securities | 464,427 | — | — | 464,427 | ||||||||||||
| Frontier Winton Fund | ||||||||||||||||
| Investment in Unconsolidated Trading Companies | 7,750,343 | 184,193 | — | 7,934,536 | ||||||||||||
| U.S. Treasury Securities | 5,667,825 | — | — | 5,667,825 | ||||||||||||
| Frontier Heritage Fund | ||||||||||||||||
| Investment in Unconsolidated Trading Companies | 1,500,688 | 35,943 | — | 1,536,631 | ||||||||||||
| Swap Contracts | — | — | 3,094,367 | 3,094,367 | ||||||||||||
| U.S. Treasury Securities | 1,046,861 | — | — | 1,046,861 | ||||||||||||
31
The changes in Level 3 assets measured at fair value on a recurring basis are summarized in the following tables. Swap contract asset gains and losses (realized/unrealized) included in earnings are classified in “realized and unrealized gain (loss) on investments – net unrealized gain/(loss) on swap contracts” on the statements of operations. Investment in unconsolidated trading company asset gains and losses (realized/unrealized) included in earnings are classified in “Change in fair value of investments in unconsolidated trading companies.” During the threenine months ended March 31,September 30, 2018, all identified Level 3 assets were components of the Frontier Diversified Fund, Frontier Long/Short Commodity Fund, Frontier Balanced Fund, Frontier Select Fund, and Frontier Heritage Fund.
36
For the ThreeNine Months Ended March 31,September 30, 2018
Swaps
| Frontier Long/Short | Frontier Long/Short | |||||||||||||||
| Frontier Balanced Fund | Commodity Fund | Frontier Balanced Fund | Commodity Fund | |||||||||||||
| Balance of recurring Level 3 assets as of January 1, 2018 | $ | 11,340,959 | $ | 397,039 | $ | 11,340,959 | $ | 397,039 | ||||||||
| Total gains or losses (realized/unrealized): | ||||||||||||||||
| Included in earnings-realized | — | — | — | — | ||||||||||||
| Included in earnings-unrealized | 999,842 | 85,270 | 509,226 | 74,903 | ||||||||||||
| Proceeds from collateral reduction | (2,000,000 | ) | — | (2,000,000 | ) | — | ||||||||||
| Change in ownership allocation | — | — | — | — | ||||||||||||
| Transfers in and/or out of Level 3 | — | — | — | — | ||||||||||||
| Balance of recurring Level 3 assets as of March 31, 2018 | $ | 10,340,801 | $ | 482,309 | ||||||||||||
| Balance of recurring Level 3 assets as of September 30, 2018 | $ | 9,850,185 | $ | 471,942 | ||||||||||||
| Frontier Diversified | ||||||||||||||||
| Frontier Diversified Fund | Frontier Heritage Fund | Fund | Frontier Heritage Fund | |||||||||||||
| Balance of recurring Level 3 assets as of January 1, 2018 | $ | 6,376,472 | $ | 3,094,367 | $ | 6,376,472 | $ | 3,094,367 | ||||||||
| Total gains or losses (realized/unrealized): | ||||||||||||||||
| Included in earnings-realized | — | — | — | — | ||||||||||||
| Included in earnings-unrealized | 451,993 | (4,796 | ) | 299,525 | (84,079 | ) | ||||||||||
| Proceeds from collateral reduction | (1,100,000 | ) | — | (1,100,000 | ) | — | ||||||||||
| Change in ownership allocation | — | — | — | — | ||||||||||||
| Transfers in and/or out of Level 3 | — | — | — | — | ||||||||||||
| Balance of recurring Level 3 assets as of March 31, 2018 | $ | 5,728,465 | $ | 3,089,571 | ||||||||||||
| Balance of recurring Level 3 assets as of September 30, 2018 | $ | 5,575,997 | $ | 3,010,288 | ||||||||||||
37
For the Year Ended December 31, 2017
Swaps
| Frontier Long/Short | Frontier Long/Short | |||||||||||||||
| Frontier Balanced Fund | Commodity Fund | Frontier Balanced Fund | Commodity Fund | |||||||||||||
| Balance of recurring Level 3 assets as of January 1, 2017 | $ | 18,939,450 | $ | 4,220,468 | $ | 18,939,450 | $ | 4,220,468 | ||||||||
| Total gains or losses (realized/unrealized): | ||||||||||||||||
| Included in earnings-realized | — | — | — | — | ||||||||||||
| Included in earnings-unrealized | (84,491 | ) | 26,621 | (84,491 | ) | 26,621 | ||||||||||
| Proceeds from collateral reduction | (7,514,000 | ) | (3,850,050 | ) | (7,514,000 | ) | (3,850,050 | ) | ||||||||
| Change in ownership allocation | — | — | — | — | ||||||||||||
| Transfers in and/or out of Level 3 | — | — | — | — | ||||||||||||
| Balance of recurring Level 3 assets as of December 31, 2017 | $ | 11,340,959 | $ | 397,039 | $ | 11,340,959 | $ | 397,039 | ||||||||
| Frontier Diversified Fund | Frontier Heritage Fund | Frontier Diversified Fund | Frontier Heritage Fund | |||||||||||||
| Balance of recurring Level 3 assets as of January 1, 2017 | $ | 8,637,847 | $ | 8,391,414 | $ | 8,637,847 | $ | 8,391,414 | ||||||||
| Total gains or losses (realized/unrealized): | ||||||||||||||||
| Included in earnings-realized | — | — | — | — | ||||||||||||
| Included in earnings-unrealized | (47,375 | ) | (297,047 | ) | (47,375 | ) | (297,047 | ) | ||||||||
| Proceeds from collateral reduction | (2,214,000 | ) | (5,000,000 | ) | (2,214,000 | ) | (5,000,000 | ) | ||||||||
| Change in ownership allocation | — | — | — | — | ||||||||||||
| Transfers in and/or out of Level 3 | — | — | — | — | ||||||||||||
| Balance of recurring Level 3 assets as of December 31, 2017 | $ | 6,376,472 | $ | 3,094,367 | $ | 6,376,472 | $ | 3,094,367 | ||||||||
| For the Nine Months Ended September 30, 2018 | For the Nine Months Ended September 30, 2018 | |||||||||||||||
| Investments in Unconsolidated Trading Companies: | Investments in Unconsolidated Trading Companies: | |||||||||||||||
| Frontier | ||||||||||||||||
| Select | ||||||||||||||||
| Fund | ||||||||||||||||
| Balance of recurring Level 3 assets as of January 1, 2018 | $ | 579,074 | ||||||||||||||
| Change in fair value of investments in unconsolidated trading companies | (40,765 | ) | ||||||||||||||
| Purchases of investments of unconsolidated trading companies | — | |||||||||||||||
| Change in ownership allocation | — | |||||||||||||||
| Transfers in and/or out of Level 3 | — | |||||||||||||||
| Balance of recurring Level 3 assets as of September 30, 2018 | $ | 538,309 | ||||||||||||||
3238
Investments in Unconsolidated Trading Companies:
| Frontier Select Fund | ||||
| Balance of recurring Level 3 assets as of January 1, 2018 | $ | 579,073 | ||
| Change in fair value of investments in unconsolidated trading companies | (2,325 | ) | ||
| Change in ownership allocation | — | |||
| Transfers in and/or out of Level 3 | — | |||
| Balance of recurring Level 3 assets as of March 31, 2018 | $ | 576,748 | ||
Investments in Unconsolidated Trading Companies:
| Frontier Select Fund | ||||
| Balance of recurring Level 3 assets as of January 1, 2017 | $ | 3,147,279 | ||
| Change in fair value of investments in unconsolidated trading companies | (144,019 | ) | ||
| Change in ownership allocation | (2,424,187 | ) | ||
| Transfers in and/or out of Level 3 | — | |||
| Balance of recurring Level 3 assets as of December 31, 2017 | $ | 579,073 | ||
The Series of the Trust assess the levels of the investments at each measurement date, and transfers between levels are recognized on the actual date of the event or change in circumstances that caused the transfer in accordance with the Series’ accounting policy regarding the recognition of transfers between levels of the fair value hierarchy. During the threenine months ended March 31,September 30, 2018, the Trust did not transfer any assets between Levels 1, 2 or 3.
The amounts reflected in the change in ownership allocation result from changes in ownership in the underlying Trading Companies at the Series level, which have resulted in changes in consolidation or de-consolidation by the Series. The ownership in the Trading Companies is accounted for under the equity method, which approximates fair value.
The total change in unrealized appreciation (depreciation) included in the statements of operations for the three months ended March 31, 2018 attributable to level 3 investments still held at March 31,September 30, 2018:
| Frontier Long/Short | Frontier Balanced | Frontier Heritage | ||||||||||||||
| Frontier Diversified Fund | Commodity Fund | Fund | Fund | |||||||||||||
| Swap Contracts | $ | 451,993 | $ | 85,270 | $ | 999,842 | $ | (4,796 | ) | |||||||
| Frontier Diversified | Frontier Long/Short | Frontier Balanced | ||||||||||||||
| Fund | Commodity Fund | Fund | Frontier Heritage Fund | |||||||||||||
| Swap Contracts | $ | 299,525 | $ | 74,903 | $ | 509,226 | $ | (84,079 | ) | |||||||
| Frontier Select Fund | ||||
| Investments in Unconsolidated Trading Companies | $ | 7,925 | ||
| Frontier Select Fund | ||||
| Investments in Unconsolidated Trading Companies | $ | (40,765 | ) | |
3339
The total change in unrealized appreciation (depreciation) included in the statements of operations attributable to level 3 investments still held at December 31, 2017:
| Frontier Long/Short | Frontier Balanced | Frontier Heritage | ||||||||||||||
| Frontier Diversified Fund | Commodity Fund | Fund | Fund | |||||||||||||
| Swap Contracts | $ | (47,375 | ) | $ | 26,621 | $ | (84,491 | ) | $ | (297,047 | ) | |||||
| Frontier Select Fund | ||||
| Investments in Unconsolidated Trading Companies | $ | (372,982 | ) | |
| Frontier Select Fund | ||||
| Investments in Unconsolidated Trading Companies | $ | (144,019 | ) | |
4. Swap Contracts
In addition to authorizing Trading Advisors to manage pre-determined investment levels of futures, options on futures and forward contracts, certain Series of the Trust will strategically invest a portion or all of their assets in total return swaps, selected at the direction of the Managing Owner. Total return swaps are privately negotiated contracts designed to provide investment returns linked to those produced by one or more investment products or indices. In a typical total return swap, two parties agree to exchange the returns (or differentials in rates of return) earned or realized on one or more particular predetermined investments or instruments. The gross returns to be exchanged or “swapped” between the parties are calculated with respect to a “notional amount” (i.e., the amount or value of the underlying asset used in computing the particular interest rate, return, or other amount to be exchanged) in a particular investment, or in a “basket” of securities.
Each Series’ investment in swaps will likely differ substantially over time due to cash flows, portfolio management decisions and market movements. The swaps serve to diversify the investment holdings of each Series and to provide access to programs and advisors that would not be otherwise available to the Series, and are not used for hedging purposes.
The Managing Owner follows a procedure in selecting well-established financial institutions which the Managing Owner, in its sole discretion, considers to be reputable, reliable, financially responsible and well established to act as swap counterparties. The procedure includes due diligence review of documentation on all new and existing financial institution counterparties prior to initiation of the relationship, and quarterly ongoing review during the relationship, to ensure that counterparties meet the Managing Owner’s minimum credit requirements, the counterparty average rating being no less than an investment grade rating as defined by the rating agencies. As of March 31,September 30, 2018, and December 31, 2017, approximately 4.0%10.8% and 10 .2%10.2%, respectively, of the Trust’s assets were deposited with over-the-counter counterparties in order to initiate and maintain swaps and is recorded as collateral within the swap fair value within the statement of financial condition. The cash held with the counterparty is not restricted.
The Series may strategically invest assets in one or more swaps linked to certain underlying investments or indices at the direction of the Managing Owner. The Trading Company in which the assets of these Series will be invested will not own any of the investments or indices referenced by any swap entered into by these Series. In addition, neither the swap counterparty to the Trading Company of these Series nor any advisor referenced by any such swap is a Trading Advisor to these Series.
To help to reduce counterparty risk on the Series, the Managing Owner has the right to reduce the Series’ exposure and remove cash from the Series’ total return swaps with Deutsche Bank AG. This cash holding shall be in excess of $250,000, and may not exceed 40% of the Index exposure in total. Index exposure is defined as the total notional amount plus any profit. The Series are charged interest on this cash holding and any amount removed will be offset against the final settlement value of the swap. As of March 31,September 30, 2018, the Frontier Balanced Fund, the Frontier Diversified Fund, the Frontier Long/Short Commodity Fund and Frontier Heritage Fund, have received from the swap counterparty $4,926,555, $2,500,000, $115,000 and $1,900,000, respectively. These amounts are shown on the Statements of Financial Conditions of the respective Series under advance on unrealized swap appreciation, which relates to the Trading Companies’ total return swaps with Deutsche Bank AG.
3440
The Series have invested in the following swaps as of and for the threenine months ended March 31,September 30, 2018:
| Frontier Long/Short Commodity | Frontier Long/Short | Frontier Heritage | ||||||||||||||
| Frontier Balanced Fund | Frontier Diversified Fund | Fund | Frontier Heritage Fund | Frontier Balanced Fund | Frontier Diversified Fund | Commodity Fund | Fund | |||||||||
| Total Return Swap | Total Return Swap | Total Return Swap | Total Return Swap | Total Return Swap | Total Return Swap | Total Return Swap | Total Return Swap | |||||||||
| Counterparty | DeutscheBank AG | DeutscheBank AG | DeutscheBank AG | DeutscheBank AG | DeutscheBank AG | DeutscheBank AG | DeutscheBank AG | DeutscheBank AG | ||||||||
| Notional Amount | $13,373,629 | $4,651,155 | $653,610 | $2,072,056 | $11,735,292 | $3,054,369 | $653,610 | $2,072,056 | ||||||||
| Termination Date | 8/2/2018 | 8/2/2018 | 8/7/2018 | 4/18/2018 | 7/31/2023 | 7/31/2023 | 7/31/2023 | 3/27/2023 | ||||||||
| Cash Collateral | $86,000 | $86,000 | $29,950 | $982,500 | $86,000 | $86,000 | $29,950 | $978,950 | ||||||||
| Swap Value | $10,254,801 | $5,642,465 | $452,359 | $2,107,071 | $9,764,185 | $5,489,997 | $441,992 | $2,031,338 | ||||||||
| Investee Returns | Total Returns | Total Returns | Total Returns | Total Returns | Total Returns | Total Returns | Total Returns | Total Returns | ||||||||
| Realized Gain/(Loss) | $0 | $0 | $0 | $0 | $0 | $0 | $0 | $0 | ||||||||
| Change in Unrealized Gain/(Loss) | $999,842 | $451,993 | $85,270 | ($4,796) | $509,226 | $299,525 | $74,903 | ($84,079) | ||||||||
| Fair Value as of 3/31/2018 | $10,340,801 | $5,728,465 | $482,309 | $3,089,571 | ||||||||||||
| Fair Value as of September 30, 2018 | $9,850,185 | $5,575,997 | $471,942 | $3,010,288 | ||||||||||||
| Advance on swap appreciation | ($4,926,555) | ($2,500,000) | ($115,000) | ($1,900,000) | ($4,926,555) | ($2,500,000) | ($115,000) | ($1,900,000) | ||||||||
The Series have invested in the following swaps as of and for the year ended December 31, 2017:
| Frontier Long/Short Commodity | ||||||||
| Frontier Balanced Fund | Frontier Diversified Fund | Fund | Frontier Heritage Fund | |||||
| Total Return Swap | Total Return Swap | Total Return Swap | Total Return Swap | |||||
| Counterparty | DeutscheBank AG | DeutscheBank AG | DeutscheBank AG | DeutscheBank AG | ||||
| Notional Amount | $13,373,629 | $4,651,155 | $653,610 | $2,072,056 | ||||
| Termination Date | 8/2/2018 | 8/2/2018 | 8/7/2018 | 3/26/2018 | ||||
| Cash Collateral | $2,086,000 | $1,186,000 | $29,950 | $982,500 | ||||
| Swap Value | $9,254,959 | $5,190,472 | $367,089 | $2,111,867 | ||||
| Investee Returns | Total Returns | Total Returns | Total Returns | Total Returns | ||||
| Realized Gain/(Loss) | $0 | $0 | $0 | $0 | ||||
| Change in Unrealized Gain/(Loss) | ($84,491) | ($47,375) | $26,621 | ($297,047) | ||||
| Fair Value as of 12/31/2017 | $11,340,959 | $6,376,472 | $397,039 | $3,094,367 | ||||
| Advance on swap appreciation | ($4,926,555) | ($2,500,000) | ($115,000) | ($1,900,000) |
5. Investments in Unconsolidated Trading Companies and Private Investment Companies
Investments in unconsolidated Trading Companies and private investment companies represent cash invested in the Trading and private investment companies as well as by each Series and cumulative trading profits or losses allocated to each Series by the Trading Companies and Private Investment Companies. Trading Companies and private investment companies allocate trading profits or losses on the basis of the proportion of each Series’ capital allocated for trading to each respective Trading Company, which bears no relationship to the amount of cash invested by a Series in the Trading Company and Private Investment Companies. The Trading Companies are valued using the equity method of accounting, which approximates fair value. Investments in private investment companies are valued using the NAV provided by the underlying private investment.
3541
The following table summarizes each of the Series’ investments in unconsolidated Trading and private investment companies as of March 31,September 30, 2018 and December 31, 2017:
| As of September 30, 2018 | As of December 31, 2017 | |||||||||||||||||||||||||||||||
| As March 31, 2018 | As of December 31, 2017 | Percentage of | Percentage of | |||||||||||||||||||||||||||||
| Percentage of | Percentage of | Series Net | Series Net | |||||||||||||||||||||||||||||
| Series Total | Series Total | Assets Invested | Assets Invested | |||||||||||||||||||||||||||||
| Capital Invested | Capital Invested | in Unconsolidated | in Unconsolidated | |||||||||||||||||||||||||||||
| in Unconsolidated Trading | Fair Value | in Unconsolidated Trading | Fair Value | Net assets | Trading Companies | Fair Value | Trading Companies | Fair Value | ||||||||||||||||||||||||
| Series | ||||||||||||||||||||||||||||||||
| Equinox Frontier Diversified Fund — | ||||||||||||||||||||||||||||||||
| Frontier Diversified Series — | ||||||||||||||||||||||||||||||||
| Frontier Trading Companies II and XXXVIII | 8.02 | % | $ | 1,501,319 | 10.37 | % | $ | 2,225,210 | 18,718,701 | 6.76% | $ | 1,146,091 | 10.37% | $ | 2,225,210 | |||||||||||||||||
| Equinox Frontier Masters Fund — | ||||||||||||||||||||||||||||||||
| Frontier Masters Series — | ||||||||||||||||||||||||||||||||
| Frontier Trading Companies II and XXXVIII | 5.80 | % | $ | 529,514 | 12.55 | % | $ | 1,501,142 | 9,126,005 | 14.28% | $ | 969,945 | 12.55% | $ | 1,501,142 | |||||||||||||||||
| Equinox Frontier Long/Short Commodity Fund — | ||||||||||||||||||||||||||||||||
| Frontier Long/Short Commodity Series — | ||||||||||||||||||||||||||||||||
| Frontier Trading Company XXXVIII | 1.63 | % | $ | 62,698 | 2.86 | % | $ | 121,510 | 3,836,601 | 3.32% | $ | 99,860 | 2.86% | $ | 121,510 | |||||||||||||||||
| Equinox Frontier Balanced Fund — | ||||||||||||||||||||||||||||||||
| Frontier Balanced Series — | ||||||||||||||||||||||||||||||||
| Frontier Trading Companies II and XXXVIII | 5.11 | % | $ | 2,119,077 | 6.59 | % | $ | 3,178,176 | 41,526,113 | 6.13% | $ | 2,144,814 | 6.59% | $ | 3,178,176 | |||||||||||||||||
| Equinox Frontier Select Fund — | ||||||||||||||||||||||||||||||||
| Frontier Select Series — | ||||||||||||||||||||||||||||||||
| Frontier Trading Companies XXXVIII and XXXIX | 11.29 | % | $ | 617,411 | 9.86 | % | $ | 670,863 | 5,474,152 | 13.82% | $ | 607,771 | 9.86% | $ | 670,863 | |||||||||||||||||
| Equinox Frontier Winton Fund — | ||||||||||||||||||||||||||||||||
| Frontier Winton Fund | ||||||||||||||||||||||||||||||||
| Frontier Trading Companies II and XXXVIII | 34.01 | % | $ | 4,484,890 | 53.79 | % | $ | 7,987,575 | 13,188,141 | 48.77% | $ | 5,010,792 | 53.79% | $ | 7,987,575 | |||||||||||||||||
| Equinox Frontier Heritage Fund — | ||||||||||||||||||||||||||||||||
| Frontier Heritage Series — | ||||||||||||||||||||||||||||||||
| Frontier Trading Companies II and XXXVIII | 14.21 | % | $ | 806,701 | 22.66 | % | $ | 1,536,631 | 5,676,648 | 18.25% | $ | 910,059 | 22.66% | $ | 1,536,631 | |||||||||||||||||
3642
The following tables summarize each of the Series; equity in earnings from unconsolidated Trading and private investment companies for the three and threenine months ended March 31,September 30, 2018 and 2017.
| Three Months Ended March 31, 2018 | Three Months Ended March 31, 2017 | Three Months Ended September 30, 2018 | Three Months Ended September 2017 | |||||||||||||||||||||||||||||||||||||||||||||||||||||||||||||
| Trading Commissions | Realized Gain/(Loss) | Change in Unrealized Gain/(Loss) | Net Income (Loss) | Trading Commissions | Realized Gain/(Loss) | Change in Unrealized Gain/(Loss) | Net Income (Loss) | Change in | Change in | |||||||||||||||||||||||||||||||||||||||||||||||||||||||
| Frontier Balanced Fund — | ||||||||||||||||||||||||||||||||||||||||||||||||||||||||||||||||
| Trading | Realized | Unrealized | Net Income | Trading | Realized | Unrealized | Net Income | |||||||||||||||||||||||||||||||||||||||||||||||||||||||||
| Commissions | Gain/(Loss) | Gain/(Loss) | (Loss) | Commissions | Gain/(Loss) | Gain/(Loss) | (Loss) | |||||||||||||||||||||||||||||||||||||||||||||||||||||||||
| Frontier Balanced Fund | ||||||||||||||||||||||||||||||||||||||||||||||||||||||||||||||||
| Frontier Trading Company II, LLC | $ | — | — | (303,227 | ) | (303,227 | ) | $ | (3,013 | ) | 393,079 | (229,677 | ) | 160,389 | $ | — | $ | — | $ | 46,550 | $ | 46,550 | $ | — | $ | — | $ | 72,519 | $ | 72,519 | ||||||||||||||||||||||||||||||||||
| Frontier Trading Company XXXVIII, LLC | — | — | (4,595 | ) | (4,595 | ) | — | — | (145,745 | ) | (145,745 | ) | — | — | 2,568 | 2,568 | — | — | (9,021 | ) | (9,021 | ) | ||||||||||||||||||||||||||||||||||||||||||
| Galaxy Plus Fund - Aspect Feeder Fund (532) LLC | (33,442 | ) | (53,706 | ) | (65,693 | ) | (152,841 | ) | (21,400 | ) | (165,958 | ) | 139,284 | (48,074 | ) | (9,291 | ) | (65,905 | ) | 96,559 | 21,363 | (19,245 | ) | (56,867 | ) | 153,322 | 77,210 | |||||||||||||||||||||||||||||||||||||
| Galaxy Plus Fund - Doherty Feeder Fund (528) LLC | (16,672 | ) | (289,977 | ) | 39,719 | (266,930 | ) | (30,836 | ) | 65,015 | (3,247 | ) | 30,932 | (12,879 | ) | 39,369 | (23,273 | ) | 3,217 | (18,045 | ) | 41,460 | 2,070 | 25,485 | ||||||||||||||||||||||||||||||||||||||||
| Galaxy Plus Fund - EvE STP Feeder Fund (516) LLC | (87,246 | ) | 799,734 | (791,836 | ) | (79,348 | ) | (266,736 | ) | 305,378 | 586,966 | 625,608 | ||||||||||||||||||||||||||||||||||||||||||||||||||||
| Galaxy Plus Fund - Emil van Essen STP Feeder Fund (516) LL | (68,449 | ) | 525,034 | (732,131 | ) | (275,546 | ) | (80,645 | ) | 809,976 | (431,386 | ) | 297,945 | |||||||||||||||||||||||||||||||||||||||||||||||||||
| Galaxy Plus Fund - Fort Contrarian Feeder Fund (510) LLC | (20,107 | ) | (471,750 | ) | 73,955 | (417,902 | ) | (51,011 | ) | 485,719 | 323,893 | 758,601 | (10,825 | ) | 24,104 | 41,083 | 54,362 | (37,146 | ) | (161,057 | ) | 416,622 | 218,419 | |||||||||||||||||||||||||||||||||||||||||
| Galaxy Plus Fund - LRR Feeder Fund (522) LLC | — | — | 35,643 | 35,643 | — | — | (445,146 | ) | (445,146 | ) | — | — | (4,884 | ) | (4,884 | ) | — | (63 | ) | (256,549 | ) | (256,612 | ) | |||||||||||||||||||||||||||||||||||||||||
| Galaxy Plus Fund - QIM Feeder Fund (526) LLC | (35,900 | ) | (900,196 | ) | (363,122 | ) | (1,299,218 | ) | (968,914 | ) | 4,086,647 | (603,298 | ) | 2,514,435 | (38,176 | ) | (205,387 | ) | 29,398 | (214,165 | ) | (52,684 | ) | (693,062 | ) | 690,348 | (55,398 | ) | ||||||||||||||||||||||||||||||||||||
| Galaxy Plus Fund - Quantmetrics Feeder Fund (527) LLC | (41,561 | ) | 76,468 | (5,773 | ) | 29,134 | (85,477 | ) | 378,608 | 194,533 | 487,664 | (10,502 | ) | 37,958 | (5,938 | ) | 21,518 | (31,025 | ) | (185,578 | ) | (512 | ) | (217,115 | ) | |||||||||||||||||||||||||||||||||||||||
| Galaxy Plus Fund - Quest Feeder Fund (517) LLC | (6,723 | ) | 11,076 | (22,123 | ) | (17,770 | ) | (7,926 | ) | 108,029 | (267,713 | ) | (167,610 | ) | (6,575 | ) | (46,302 | ) | 6,537 | (46,340 | ) | (7,239 | ) | (14,512 | ) | 2,826 | (18,925 | ) | ||||||||||||||||||||||||||||||||||||
| Galaxy Plus Fund - Welton GDP Feeder Fund (538) LLC | (73,636 | ) | (1,587,857 | ) | 120,046 | (1,541,447 | ) | (18,911 | ) | 27,469 | 21,214 | 29,772 | (38,085 | ) | 46,290 | 67,221 | 75,426 | (87,162 | ) | (408,339 | ) | 385,991 | (109,510 | ) | ||||||||||||||||||||||||||||||||||||||||
| Total | $ | (315,287 | ) | $ | (2,416,208 | ) | $ | (1,287,006 | ) | $ | (4,018,501 | ) | $ | (1,454,224 | ) | $ | 5,683,986 | $ | (428,936 | ) | $ | 3,800,826 | $ | (194,782 | ) | $ | 355,161 | $ | (476,310 | ) | $ | (315,931 | ) | $ | (333,191 | ) | $ | (668,042 | ) | $ | 1,026,230 | $ | 24,997 | |||||||||||||||||||||
| Frontier Winton Fund — | ||||||||||||||||||||||||||||||||||||||||||||||||||||||||||||||||
| Frontier Trading Company II LLC | $ | — | — | (992,595 | ) | (992,595 | ) | $ | — | — | — | — | ||||||||||||||||||||||||||||||||||||||||||||||||||||
| Frontier Winton Fund | ||||||||||||||||||||||||||||||||||||||||||||||||||||||||||||||||
| Frontier Trading Company II, LLC | $ | — | $ | — | $ | 2,568 | $ | 2,568 | ||||||||||||||||||||||||||||||||||||||||||||||||||||||||
| Frontier Trading Company XXXVIII, LLC | — | — | (37,082 | ) | (37,082 | ) | — | — | (281,256 | ) | (281,256 | ) | — | — | 154,297 | 154,297 | — | — | (31,155 | ) | (31,155 | ) | ||||||||||||||||||||||||||||||||||||||||||
| Total | $ | — | $ | — | $ | (1,029,677 | ) | $ | (1,029,677 | ) | $ | — | $ | — | $ | (281,256 | ) | $ | (281,256 | ) | $ | — | $ | — | $ | 156,865 | $ | 156,865 | $ | — | $ | — | $ | (31,155 | ) | $ | (31,155 | ) | ||||||||||||||||||||||||||
| Frontier Frontier Select Fund — | ||||||||||||||||||||||||||||||||||||||||||||||||||||||||||||||||
| Frontier Frontier Select Fund | ||||||||||||||||||||||||||||||||||||||||||||||||||||||||||||||||
| Frontier Trading Company XXXIX, LLC | $ | — | $ | — | $ | — | $ | — | $ | — | $ | — | $ | (199,401 | ) | $ | (199,401 | ) | $ | — | $ | — | $ | 3,227 | $ | 3,227 | $ | — | $ | — | $ | 53,727 | $ | 53,727 | ||||||||||||||||||||||||||||||
| Frontier Trading Company XXXVIII, LLC | — | — | 5,578 | 5,578 | — | — | (48,358 | ) | (48,358 | ) | — | — | (20,172 | ) | (20,172 | ) | — | — | (8,337 | ) | (8,337 | ) | ||||||||||||||||||||||||||||||||||||||||||
| Galaxy Plus Fund - TT Feeder Fund (531) LLC | (21,700 | ) | 91,839 | 25,085 | 95,224 | (35,396 | ) | 67,150 | (116,095 | ) | (84,341 | ) | ||||||||||||||||||||||||||||||||||||||||||||||||||||
| Galaxy Plus Fund - Welton GDP Feeder Fund (538) LLC | (50,983 | ) | (548,310 | ) | 30,050 | (569,243 | ) | — | — | — | — | (31,965 | ) | 13,930 | 25,712 | 7,677 | (209,529 | ) | (209,529 | ) | ||||||||||||||||||||||||||||||||||||||||||||
| Galaxy Plus Fund - TT Feeder Fund (531) LLC | (37,496 | ) | (82,277 | ) | (191,609 | ) | (311,382 | ) | — | — | — | — | ||||||||||||||||||||||||||||||||||||||||||||||||||||
| Total | $ | (88,479 | ) | $ | (630,587 | ) | $ | (155,981 | ) | $ | (875,047 | ) | $ | — | $ | — | $ | (247,759 | ) | $ | (247,759 | ) | $ | (53,665 | ) | $ | 105,769 | $ | 33,852 | $ | 85,956 | $ | (35,396 | ) | $ | 67,150 | $ | (280,234 | ) | $ | (248,480 | ) | ||||||||||||||||||||||
| Frontier Heritage Fund — | ||||||||||||||||||||||||||||||||||||||||||||||||||||||||||||||||
| Frontier Heritage Fund | ||||||||||||||||||||||||||||||||||||||||||||||||||||||||||||||||
| Frontier Trading Company II, LLC | $ | — | — | (122,535 | ) | (122,535 | ) | $ | (1,582 | ) | 205,958 | (119,773 | ) | 84,603 | $ | — | $ | — | $ | 19,781 | $ | 19,781 | $ | — | $ | — | $ | 46,789 | $ | 46,789 | ||||||||||||||||||||||||||||||||||
| Frontier Trading Company XXXVIII, LLC | — | — | (967 | ) | (967 | ) | — | — | (62,556 | ) | (62,556 | ) | — | — | 1,051 | 1,051 | — | — | (9,998 | ) | (9,998 | ) | ||||||||||||||||||||||||||||||||||||||||||
| Galaxy Plus Fund - Welton GDP Feeder Fund (538) LLC | (52,775 | ) | (544,577 | ) | 56,882 | (540,470 | ) | — | — | — | — | (33,189 | ) | 14,991 | 22,315 | 4,117 | $ | (29,980 | ) | $ | 51,752 | $ | (142,541 | ) | (120,769 | ) | ||||||||||||||||||||||||||||||||||||||
| Total | $ | (52,775 | ) | $ | (544,577 | ) | $ | (66,620 | ) | $ | (663,972 | ) | $ | (1,582 | ) | $ | 205,958 | $ | (182,329 | ) | $ | 22,047 | $ | (33,189 | ) | $ | 14,991 | $ | 43,147 | $ | 24,949 | $ | (29,980 | ) | $ | 51,752 | $ | (105,750 | ) | $ | (83,978 | ) | ||||||||||||||||||||||
| Frontier Long/Short Commodity Fund | ||||||||||||||||||||||||||||||||||||||||||||||||||||||||||||||||
| Frontier Trading Company XXXVIII, LLC | $ | — | — | 58 | 58 | $ | — | — | — | — | $ | — | $ | — | $ | 1,511 | $ | 1,511 | $ | — | $ | — | $ | (1,334 | ) | $ | (1,334 | ) | ||||||||||||||||||||||||||||||||||||
| Galaxy Plus Fund - Chesapeake Feeder Fund (518) LLC | — | — | — | — | (23,979 | ) | (20,152 | ) | 88,010 | 43,879 | — | — | — | — | (5,111 | ) | 10,011 | (15,755 | ) | (10,855 | ) | |||||||||||||||||||||||||||||||||||||||||||
| Galaxy Plus Fund - EvE STP Feeder Fund (516) LLC | (29,775 | ) | 170,180 | (161,895 | ) | (21,490 | ) | (110,395 | ) | 123,650 | 217,765 | 231,020 | ||||||||||||||||||||||||||||||||||||||||||||||||||||
| Galaxy Plus Fund - Emil van Essen STP Feeder Fund (516) LLC | (19,658 | ) | 84,795 | (121,669 | ) | (56,532 | ) | (37,912 | ) | 210,831 | (102,127 | ) | 70,792 | |||||||||||||||||||||||||||||||||||||||||||||||||||
| Galaxy Plus Fund - LRR Feeder Fund (522) LLC | — | — | 93,458 | 93,458 | — | — | 98,146 | 98,146 | — | — | (90,105 | ) | (90,105 | ) | — | (2,869 | ) | 5,305 | 2,436 | |||||||||||||||||||||||||||||||||||||||||||||
| Galaxy Plus Fund - Welton GDP Feeder Fund (538) LLC | (25,584 | ) | (229,565 | ) | 16,878 | (238,271 | ) | — | — | — | — | (15,062 | ) | 5,925 | 10,810 | 1,673 | (30,671 | ) | (59,091 | ) | 52,198 | (37,564 | ) | |||||||||||||||||||||||||||||||||||||||||
| Total | $ | (55,359 | ) | $ | (59,385 | ) | $ | (51,501 | ) | $ | (166,245 | ) | $ | (134,374 | ) | $ | 103,498 | $ | 403,921 | $ | 373,045 | $ | (34,720 | ) | $ | 90,720 | $ | (199,453 | ) | $ | (143,453 | ) | $ | (73,694 | ) | $ | 158,882 | $ | (61,713 | ) | $ | 23,475 | ||||||||||||||||||||||
| Frontier Diversified Fund — | ||||||||||||||||||||||||||||||||||||||||||||||||||||||||||||||||
| Frontier Diversified Fund | ||||||||||||||||||||||||||||||||||||||||||||||||||||||||||||||||
| Frontier Trading Company II, LLC | $ | — | — | (150,626 | ) | (150,626 | ) | $ | (2,207 | ) | 287,834 | (168,084 | ) | 117,543 | $ | — | $ | — | $ | 34,017 | $ | 34,017 | $ | — | $ | — | $ | 29,203 | $ | 29,203 | ||||||||||||||||||||||||||||||||||
| Frontier Trading Company XXXVIII, LLC | — | — | 983 | 983 | — | — | (127,834 | ) | (127,834 | ) | — | — | 2,127 | 2,127 | — | — | 3,026 | 3,026 | ||||||||||||||||||||||||||||||||||||||||||||||
| Galaxy Plus Fund - Aspect Feeder Fund (532) LLC | (16,472 | ) | (17,902 | ) | (21,898 | ) | (56,272 | ) | (18,795 | ) | (110,622 | ) | 92,962 | (36,455 | ) | (4,157 | ) | (23,653 | ) | 34,404 | 6,594 | (8,281 | ) | (26,711 | ) | 65,961 | 30,969 | |||||||||||||||||||||||||||||||||||||
| Galaxy Plus Fund - Chesapeake Feeder Fund (518) LLC | — | — | — | — | (27,081 | ) | (209,832 | ) | 411,774 | 174,861 | — | — | — | — | (5,529 | ) | 14,423 | (32,526 | ) | (23,632 | ) | |||||||||||||||||||||||||||||||||||||||||||
| Galaxy Plus Fund - Doherty Feeder Fund (528) LLC | (10,111 | ) | (143,967 | ) | 22,561 | (131,517 | ) | (21,265 | ) | 39,737 | (1,568 | ) | 16,904 | (9,004 | ) | 22,242 | (13,179 | ) | 59 | (11,301 | ) | 21,985 | 865 | 11,549 | ||||||||||||||||||||||||||||||||||||||||
| Galaxy Plus Fund - Emil van Essen STP Feeder Fund (516) LLC | (46,698 | ) | 399,867 | (395,918 | ) | (42,749 | ) | (231,611 | ) | 274,493 | 479,780 | 522,662 | (39,614 | ) | 258,878 | (358,841 | ) | (139,577 | ) | (41,460 | ) | 371,152 | (187,157 | ) | 142,535 | |||||||||||||||||||||||||||||||||||||||
| Galaxy Plus Fund - Fort Contrarian Feeder Fund (510) LLC | (9,673 | ) | (152,263 | ) | 32,729 | (129,207 | ) | (37,392 | ) | 281,553 | 188,043 | 432,204 | (9,027 | ) | 10,939 | 20,972 | 22,884 | (15,109 | ) | (55,000 | ) | 140,263 | 70,154 | |||||||||||||||||||||||||||||||||||||||||
| Galaxy Plus Fund - LRR Feeder Fund (522) LLC | — | — | 17,509 | 17,509 | — | — | (165,105 | ) | (165,105 | ) | — | — | (2,350 | ) | (2,350 | ) | — | (15 | ) | (93,042 | ) | (93,057 | ) | |||||||||||||||||||||||||||||||||||||||||
| Galaxy Plus Fund - QIM Feeder Fund (526) LLC | (21,385 | ) | (468,883 | ) | (175,777 | ) | (666,045 | ) | (605,293 | ) | 2,419,961 | (310,537 | ) | 1,504,131 | (20,929 | ) | (92,636 | ) | 16,282 | (97,283 | ) | (38,315 | ) | (410,394 | ) | 402,029 | (46,680 | ) | ||||||||||||||||||||||||||||||||||||
| Galaxy Plus Fund - Quantmetrics Feeder Fund (527) LLC | (25,502 | ) | 38,234 | (2,886 | ) | 9,846 | (82,684 | ) | 306,260 | 157,534 | 381,110 | (8,047 | ) | 17,990 | (2,619 | ) | 7,324 | (25,622 | ) | (105,994 | ) | (426 | ) | (132,042 | ) | |||||||||||||||||||||||||||||||||||||||
| Galaxy Plus Fund - Quest Feeder Fund (517) LLC | (7,647 | ) | 11,076 | (22,123 | ) | (18,694 | ) | (33,083 | ) | 458,019 | (995,039 | ) | (570,103 | ) | (7,511 | ) | (46,302 | ) | 6,537 | (47,276 | ) | (10,292 | ) | (25,052 | ) | 26,393 | (8,951 | ) | ||||||||||||||||||||||||||||||||||||
| Galaxy Plus Fund - Welton GDP Feeder Fund (538) LLC | (40,732 | ) | (776,278 | ) | 46,407 | (770,603 | ) | (12,810 | ) | 18,312 | 14,142 | 19,644 | (20,337 | ) | 21,164 | 31,504 | 32,331 | (58,330 | ) | (244,662 | ) | 245,800 | (57,192 | ) | ||||||||||||||||||||||||||||||||||||||||
| Total | $ | (178,220 | ) | $ | (1,110,116 | ) | $ | (649,039 | ) | $ | (1,937,375 | ) | $ | (1,072,221 | ) | $ | 3,765,715 | $ | (423,932 | ) | $ | 2,269,562 | $ | (118,626 | ) | $ | 168,622 | $ | (231,146 | ) | $ | (181,150 | ) | $ | (214,239 | ) | $ | (460,268 | ) | $ | 600,389 | $ | (74,118 | ) | ||||||||||||||||||||
| Frontier Masters Fund — | ||||||||||||||||||||||||||||||||||||||||||||||||||||||||||||||||
| Frontier Masters Fund | ||||||||||||||||||||||||||||||||||||||||||||||||||||||||||||||||
| Frontier Trading Company II, LLC | $ | — | — | (241,769 | ) | (241,769 | ) | $ | 45,189 | 166,870 | (97,159 | ) | 114,900 | $ | — | $ | — | $ | (4,703 | ) | $ | (4,703 | ) | $ | — | $ | — | $ | 36,130 | $ | 36,130 | |||||||||||||||||||||||||||||||||
| Frontier Trading Company XV, LLC | — | — | — | — | (63,500 | ) | 78,115 | (115,394 | ) | (100,779 | ) | |||||||||||||||||||||||||||||||||||||||||||||||||||||
| Frontier Trading Company XXXVIII, LLC | — | — | 8,414 | 8,414 | — | — | (76,512 | ) | (76,512 | ) | — | — | 3,100 | 3,100 | — | — | (4,657 | ) | (4,657 | ) | ||||||||||||||||||||||||||||||||||||||||||||
| Galaxy Plus Fund - Chesapeake Feeder Fund (518) LLC | — | (76,396 | ) | 68,413 | (7,983 | ) | (37,315 | ) | (42,890 | ) | 187,492 | 107,287 | — | — | — | — | (11,827 | ) | 27,230 | (47,312 | ) | (31,909 | ) | |||||||||||||||||||||||||||||||||||||||||
| Galaxy Plus Fund - EvE STP Feeder Fund (516) LLC | (78,638 | ) | 470,101 | (474,473 | ) | (83,010 | ) | (139,418 | ) | 169,016 | 296,799 | 326,397 | ||||||||||||||||||||||||||||||||||||||||||||||||||||
| Galaxy Plus Fund - Emil van Essen STP Feeder Fund (516) LLC | (51,154 | ) | 235,343 | (326,220 | ) | (142,031 | ) | (62,543 | ) | 419,529 | (214,880 | ) | 142,106 | |||||||||||||||||||||||||||||||||||||||||||||||||||
| Galaxy Plus Fund - Welton GDP Feeder Fund (538) LLC | (55,931 | ) | (699,656 | ) | 30,089 | (725,498 | ) | — | — | — | — | (32,744 | ) | 17,636 | 26,253 | 11,145 | (55,827 | ) | (139,604 | ) | 81,403 | (114,028 | ) | |||||||||||||||||||||||||||||||||||||||||
| Galaxy Plus Fund - TT Feeder Fund (531) LLC | (37,607 | ) | (115,302 | ) | (214,295 | ) | (367,204 | ) | — | — | — | — | (17,623 | ) | 95,172 | 21,795 | 99,344 | — | — | (128,372 | ) | (128,372 | ) | |||||||||||||||||||||||||||||||||||||||||
| Total | $ | (172,176 | ) | $ | (421,253 | ) | $ | (823,621 | ) | $ | (1,417,050 | ) | $ | (195,044 | ) | $ | 371,111 | $ | 195,226 | $ | 371,293 | $ | (101,521 | ) | $ | 348,151 | $ | (279,775 | ) | $ | (33,145 | ) | $ | (130,197 | ) | $ | 307,155 | $ | (277,688 | ) | $ | (100,730 | ) | |||||||||||||||||||||
3743
| Nine Months Ended September 30, 2018 | Nine Months Ended September 2017 | |||||||||||||||||||||||||||||||
| Change in | Change in | |||||||||||||||||||||||||||||||
| Trading | Realized | Unrealized | Net Income | Trading | Realized | Unrealized | Net Income | |||||||||||||||||||||||||
| Commissions | Gain/(Loss) | Gain/(Loss) | (Loss) | Commissions | Gain/(Loss) | Gain/(Loss) | (Loss) | |||||||||||||||||||||||||
| Frontier Balanced Fund | ||||||||||||||||||||||||||||||||
| Frontier Trading Company II, LLC | $ | — | $ | — | $ | 114,510 | $ | 114,510 | $ | (32,747 | ) | $ | 216,451 | $ | (342,327 | ) | $ | (158,623 | ) | |||||||||||||
| Frontier Trading Company XXXVIII, LLC | — | — | (8,908 | ) | (8,908 | ) | — | — | (215,180 | ) | (215,180 | ) | ||||||||||||||||||||
| Galaxy Plus Fund - Aspect Feeder Fund (532) LLC | (53,188 | ) | (277,921 | ) | 103,487 | (227,622 | ) | (64,009 | ) | (444,842 | ) | 139,701 | (369,150 | ) | ||||||||||||||||||
| Galaxy Plus Fund - Doherty Feeder Fund (528) LLC | (44,264 | ) | (119,199 | ) | (22,162 | ) | (185,625 | ) | (68,404 | ) | 189,463 | (32,758 | ) | 88,301 | ||||||||||||||||||
| Galaxy Plus Fund - Emil van Essen STP Feeder Fund (516) LL | (296,953 | ) | 894,510 | (718,674 | ) | (121,117 | ) | (450,701 | ) | 1,744,230 | 8,954 | 1,302,483 | ||||||||||||||||||||
| Galaxy Plus Fund - Fort Contrarian Feeder Fund (510) LLC | (47,185 | ) | (114,597 | ) | 51,845 | (109,937 | ) | (134,386 | ) | 896,859 | (27,111 | ) | 735,362 | |||||||||||||||||||
| Galaxy Plus Fund - LRR Feeder Fund (522) LLC | (123 | ) | — | (8,469 | ) | (8,592 | ) | — | (63 | ) | (1,015,265 | ) | (1,015,328 | ) | ||||||||||||||||||
| Galaxy Plus Fund - QIM Feeder Fund (526) LLC | (111,704 | ) | (813,565 | ) | 90,256 | (835,013 | ) | (1,105,937 | ) | 3,100,899 | 394,461 | 2,389,423 | ||||||||||||||||||||
| Galaxy Plus Fund - Quantmetrics Feeder Fund (527) LLC | (73,053 | ) | (34,735 | ) | 6,431 | (101,357 | ) | (175,559 | ) | 207,540 | 217,419 | 249,400 | ||||||||||||||||||||
| Galaxy Plus Fund - Quest Feeder Fund (517) LLC | (20,503 | ) | (88,994 | ) | 9,703 | (99,794 | ) | (20,728 | ) | 643,877 | (818,574 | ) | (195,425 | ) | ||||||||||||||||||
| Galaxy Plus Fund - Welton GDP Feeder Fund (538) LLC | (175,522 | ) | (1,567,177 | ) | 154,073 | (1,588,626 | ) | (217,096 | ) | (862,039 | ) | (70,599 | ) | (1,149,734 | ) | |||||||||||||||||
| Total | $ | (822,495 | ) | $ | (2,121,678 | ) | $ | (227,908 | ) | $ | (3,172,081 | ) | $ | (2,269,567 | ) | $ | 5,692,375 | $ | (1,761,279 | ) | $ | 1,661,529 | ||||||||||
| Frontier Winton Fund | ||||||||||||||||||||||||||||||||
| Frontier Trading Company II, LLC | $ | — | $ | — | $ | (183,988 | ) | $ | (183,988 | ) | $ | — | $ | — | $ | — | $ | — | ||||||||||||||
| Frontier Trading Company XXXVIII, LLC | — | — | 88,092 | 88,092 | — | — | (334,372 | ) | (334,372 | ) | ||||||||||||||||||||||
| Total | $ | — | $ | — | $ | (95,896 | ) | $ | (95,896 | ) | $ | — | $ | — | $ | (334,372 | ) | $ | (334,372 | ) | ||||||||||||
| Frontier Frontier Select Fund | ||||||||||||||||||||||||||||||||
| Frontier Trading Company XXXIX, LLC | $ | — | $ | — | $ | (38,351 | ) | $ | (38,351 | ) | $ | — | $ | — | $ | (249,165 | ) | $ | (249,163 | ) | ||||||||||||
| Frontier Trading Company XXXVIII, LLC | — | — | (15,611 | ) | (15,611 | ) | — | — | (70,090 | ) | (70,092 | ) | ||||||||||||||||||||
| Galaxy Plus Fund - TT Feeder Fund (531) LLC | (83,404 | ) | (433,416 | ) | 92,847 | (423,973 | ) | (26,272 | ) | 455,907 | (1,076,952 | ) | (647,317 | ) | ||||||||||||||||||
| Galaxy Plus Fund - Welton GDP Feeder Fund (538) LLC | (112,056 | ) | (80,517 | ) | (182,320 | ) | (374,893 | ) | (35,396 | ) | 67,150 | (209,529 | ) | (177,775 | ) | |||||||||||||||||
| Total | $ | (195,460 | ) | $ | (513,933 | ) | $ | (143,435 | ) | $ | (852,828 | ) | $ | (61,668 | ) | $ | 523,057 | $ | (1,605,736 | ) | $ | (966,572 | ) | |||||||||
| Frontier Heritage Fund | ||||||||||||||||||||||||||||||||
| Frontier Trading Company II, LLC | $ | — | $ | — | $ | 26,444 | $ | 26,444 | $ | (61,563 | ) | $ | 113,582 | $ | (118,339 | ) | $ | (66,320 | ) | |||||||||||||
| Frontier Trading Company XXXVIII, LLC | — | — | (3,644 | ) | (3,644 | ) | — | — | (104,610 | ) | (104,610 | ) | ||||||||||||||||||||
| Galaxy Plus Fund - Welton GDP Feeder Fund (538) LLC | (128,567 | ) | (535,418 | ) | 67,067 | (596,918 | ) | $ | (29,980 | ) | $ | 51,752 | $ | (142,541 | ) | (120,769 | ) | |||||||||||||||
| Total | $ | (128,567 | ) | $ | (535,418 | ) | $ | 89,867 | $ | (574,118 | ) | $ | (91,543 | ) | $ | 165,334 | $ | (365,490 | ) | $ | (291,699 | ) | ||||||||||
| Frontier Long/Short Commodity Fund | ||||||||||||||||||||||||||||||||
| Frontier Trading Company XXXVIII, LLC | $ | — | $ | — | $ | (301 | ) | $ | (301 | ) | $ | — | $ | — | $ | 48,430 | $ | 48,430 | ||||||||||||||
| Galaxy Plus Fund - Chesapeake Feeder Fund (518) LLC | — | — | — | — | (49,244 | ) | (27,947 | ) | 56,870 | (20,321 | ) | |||||||||||||||||||||
| Galaxy Plus Fund - Emil van Essen STP Feeder Fund (516) LLC | (75,198 | ) | 191,295 | (164,749 | ) | (48,652 | ) | (219,046 | ) | 608,857 | 93,673 | 483,484 | ||||||||||||||||||||
| Galaxy Plus Fund - LRR Feeder Fund (522) LLC | (681 | ) | — | (145,612 | ) | (146,293 | ) | (570,790 | ) | (2,869 | ) | 5,305 | (568,354 | ) | ||||||||||||||||||
| Galaxy Plus Fund - Welton GDP Feeder Fund (538) LLC | (59,678 | ) | (230,562 | ) | 24,115 | (266,125 | ) | (61,797 | ) | (61,934 | ) | (105,149 | ) | (228,880 | ) | |||||||||||||||||
| Total | $ | (135,557 | ) | $ | (39,267 | ) | $ | (286,547 | ) | $ | (461,371 | ) | $ | (900,877 | ) | $ | 516,107 | $ | 99,129 | $ | (285,641 | ) | ||||||||||
| Frontier Diversified Fund | ||||||||||||||||||||||||||||||||
| Frontier Trading Company II, LLC | $ | — | $ | — | $ | 40,239 | 40,239 | (34,961 | ) | 156,232 | (215,541 | ) | (94,270 | ) | ||||||||||||||||||
| Frontier Trading Company XXXVIII, LLC | — | — | 307 | 307 | — | — | (217,505 | ) | (217,505 | ) | ||||||||||||||||||||||
| Galaxy Plus Fund - Aspect Feeder Fund (532) LLC | (25,766 | ) | (94,474 | ) | 36,713 | (83,527 | ) | (47,202 | ) | (275,640 | ) | 107,879 | (214,963 | ) | ||||||||||||||||||
| Galaxy Plus Fund - Chesapeake Feeder Fund (518) LLC | — | — | — | — | (57,740 | ) | (282,402 | ) | 368,874 | 28,732 | ||||||||||||||||||||||
| Galaxy Plus Fund - Doherty Feeder Fund (528) LLC | (28,732 | ) | (48,799 | ) | (12,067 | ) | (89,598 | ) | (48,192 | ) | 115,185 | (20,362 | ) | 46,631 | ||||||||||||||||||
| Galaxy Plus Fund - Emil van Essen STP Feeder Fund (516) LLC | (127,929 | ) | 449,134 | (404,314 | ) | (83,109 | ) | (372,907 | ) | 1,308,793 | 157,823 | 1,093,709 | ||||||||||||||||||||
| Galaxy Plus Fund - Fort Contrarian Feeder Fund (510) LLC | (28,612 | ) | (2,139 | ) | 29,425 | (1,326 | ) | (86,543 | ) | 613,006 | (32,023 | ) | 494,440 | |||||||||||||||||||
| Galaxy Plus Fund - LRR Feeder Fund (522) LLC | — | (62 | ) | 1,592 | 1,530 | — | (15 | ) | (379,526 | ) | (379,541 | ) | ||||||||||||||||||||
| Galaxy Plus Fund - QIM Feeder Fund (526) LLC | (62,615 | ) | (428,811 | ) | 18,024 | (473,402 | ) | (716,264 | ) | 2,120,108 | (618 | ) | 1,403,226 | |||||||||||||||||||
| Galaxy Plus Fund - Quantmetrics Feeder Fund (527) LLC | (45,287 | ) | (7,954 | ) | 2,742 | (50,499 | ) | (170,681 | ) | 290,815 | 121,852 | 241,986 | ||||||||||||||||||||
| Galaxy Plus Fund - Quest Feeder Fund (517) LLC | (23,108 | ) | (89,102 | ) | 9,703 | (102,507 | ) | (65,209 | ) | 1,793,033 | (2,309,045 | ) | (581,221 | ) | ||||||||||||||||||
| Galaxy Plus Fund - Welton GDP Feeder Fund (538) LLC | (92,781 | ) | (751,752 | ) | 54,921 | (789,612 | ) | (167,731 | ) | (525,880 | ) | (78,889 | ) | (772,500 | ) | |||||||||||||||||
| Total | $ | (434,830 | ) | $ | (973,959 | ) | $ | (222,715 | ) | $ | (1,631,504 | ) | $ | (1,767,430 | ) | $ | 5,313,235 | $ | (2,497,081 | ) | $ | 1,048,724 | ||||||||||
| Frontier Masters Fund | ||||||||||||||||||||||||||||||||
| Frontier Trading Company II, LLC | $ | — | $ | — | $ | (99,255 | ) | (99,255 | ) | 25,034 | 91,810 | (254,854 | ) | (138,010 | ) | |||||||||||||||||
| Frontier Trading Company XV, LLC | — | — | — | — | (82,918 | ) | 78,115 | (115,394 | ) | (120,197 | ) | |||||||||||||||||||||
| Frontier Trading Company XXXVIII, LLC | — | — | 20,318 | 20,318 | — | — | (108,362 | ) | (108,362 | ) | ||||||||||||||||||||||
| Galaxy Plus Fund - Chesapeake Feeder Fund (518) LLC | — | (76,396 | ) | 68,413 | (7,983 | ) | (81,868 | ) | (54,404 | ) | 103,126 | (33,146 | ) | |||||||||||||||||||
| Galaxy Plus Fund - Emil van Essen STP Feeder Fund (516) LLC | (200,364 | ) | 498,398 | (429,904 | ) | (131,870 | ) | (287,707 | ) | 937,794 | 43,617 | 693,704 | ||||||||||||||||||||
| Galaxy Plus Fund - Welton GDP Feeder Fund (538) LLC | (132,925 | ) | (709,314 | ) | 39,893 | (802,346 | ) | (89,695 | ) | (176,476 | ) | (192,207 | ) | (458,378 | ) | |||||||||||||||||
| Galaxy Plus Fund - TT Feeder Fund (531) LLC | (64,811 | ) | 7,178 | (157,460 | ) | (215,093 | ) | — | — | (749,376 | ) | (749,376 | ) | |||||||||||||||||||
| Total | $ | (398,100 | ) | $ | (280,134 | ) | $ | (557,995 | ) | $ | (1,236,229 | ) | $ | (517,154 | ) | $ | 876,839 | $ | (1,273,450 | ) | $ | (913,765 | ) | |||||||||
44
The Series’ investments in private investment companies have certain redemption and liquidity restrictions which are described in the following table:
| Redemptions | Redemptions | Liquidity | ||||
| Notice Period | Permitted | Restrictions | ||||
| Frontier Diversified Fund | ||||||
| Multi-Strategy | ||||||
| Galaxy Plus Fund - EvE STP Feeder Fund (516) LLC | 24 hours | Daily | None | |||
| Galaxy Plus Fund - LRR Feeder Fund (522) LLC | 24 hours | Daily | None | |||
| Galaxy Plus Fund - Quantmetrics Feeder Fund (527) LLC | 24 hours | Daily | None | |||
| Galaxy Plus Fund - Welton GDP Feeder Fund (538) LLC | 24 hours | Daily | None | |||
| Trend Following | ||||||
| Galaxy Plus Fund - Aspect Feeder Fund (532) LLC | 24 hours | Daily | None | |||
| Galaxy Plus Fund - Fort Contrarian Feeder Fund (510) LLC | 24 hours | Daily | None | |||
| Galaxy Plus Fund - QIM Feeder Fund (526) LLC | 24 hours | Daily | None | |||
| Galaxy Plus Fund - Quest Feeder Fund (517) LLC | 24 hours | Daily | None | |||
| Option Trading | ||||||
| Galaxy Plus Fund - Doherty Feeder Fund (528) LLC | 24 hours | Daily | None | |||
| Frontier Masters Fund | ||||||
| Trend Following | ||||||
| Galaxy Plus Fund - TT Feeder Fund (531) LLC | 24 hours | Weekly | None | |||
| Multi-Strategy | ||||||
| Galaxy Plus Fund - EvE STP Feeder Fund (516) LLC | 24 hours | Daily | None | |||
| Galaxy Plus Fund - Welton GDP Feeder Fund (538) LLC | 24 hours | Daily | None | |||
| Frontier Long/Short Commodity Fund | ||||||
| Multi-Strategy | ||||||
| Galaxy Plus Fund - EvE STP Feeder Fund (516) LLC | 24 hours | Daily | None | |||
| Galaxy Plus Fund - LRR Feeder Fund (522) LLC | 24 hours | Daily | None | |||
| Galaxy Plus Fund - Welton GDP Feeder Fund (538) LLC | 24 hours | Daily | None | |||
| Frontier Balanced Fund | ||||||
| Multi-Strategy | ||||||
| Galaxy Plus Fund - EvE STP Feeder Fund (516) LLC | 24 hours | Daily | None | |||
| Galaxy Plus Fund - Quantmetrics Feeder Fund (527) LLC | 24 hours | Daily | None | |||
| Galaxy Plus Fund - LRR Feeder Fund (522) LLC | 24 hours | Daily | None | |||
| Galaxy Plus Fund - Welton GDP Feeder Fund (538) LLC | 24 hours | Daily | None | |||
| Trend Following | ||||||
| Galaxy Plus Fund - Aspect Feeder Fund (532) LLC | 24 hours | Daily | None | |||
| Galaxy Plus Fund - Fort Contrarian Feeder Fund (510) LLC | 24 hours | Daily | None | |||
| Galaxy Plus Fund - QIM Feeder Fund (526) LLC | 24 hours | Daily | None | |||
| Galaxy Plus Fund - Quest Feeder Fund (517) LLC | 24 hours | Daily | None | |||
| Option Trading | ||||||
| Galaxy Plus Fund - Doherty Feeder Fund (528) LLC | 24 hours | Daily | None | |||
| Frontier Select Fund | ||||||
| Trend Following | ||||||
| Galaxy Plus Fund - TT Feeder Fund (531) LLC | 24 hours | Weekly | None | |||
| Frontier Heritage Fund | ||||||
| Multi-Strategy | ||||||
| Galaxy Plus Fund - Welton GDP Feeder Fund (538) LLC | 24 hours | Weekly | None |
3845
6. Transactions with Affiliates
The Managing Owner contributes funds to the Trust, with respect to the Series, in order to have a 1% interest (“Minimum Purchase Commitment”) in the aggregate capital, profits and losses of all Series and in return will receive units designated as general units in the Series in which the Managing Owner invests such funds. The general units may only be purchased by the Managing Owner and may be subject to no advisory fees or advisory fees at reduced rates. Otherwise, the general units hold the same rights as the limited units. The Managing Owner will make contributions to the Series of the Trust necessary to maintain at least a 1% interest in the aggregate capital, profits and losses of the combined Series of the Trust. Such contribution was made by the Managing Owner before trading commenced for the Trust and will be maintained throughout the existence of the Trust, and the Managing Owner will make such purchases as are necessary to effect this requirement. Additionally, the Managing Owner agreed with certain regulatory bodies to maintain a 1% interest specifically in the Frontier Balanced Fund Class 1AP and 2a Units, aggregated, and each of the Frontier Long/Short Commodity Fund, Frontier Diversified Fund and Frontier Masters Fund. The 1% interest in these specific Series is included in computing the Minimum Purchase Commitment in aggregate capital. In addition to the general units the Managing Owner receives in respect of its Minimum Purchase Commitment, the Managing Owner may purchase limited units in any Series as a Limited Owner. Principals of the Managing Owner or affiliates are allowed to own beneficial interests in the Trust, with respect to the Series, as well. All Units purchased by the Managing Owner are held for investment purposes only and not for resale. The Managing Owner may make purchases or redemptions at any time on the same terms as any Limited Owner. The Trust has and will continue to have certain relationships with the Managing Owner and its affiliates.
Expenses
Management Fees—Each Series of Units pays to the Managing Owner a monthly management fee equal to a percentage of the notional assets of such Series allocated to Trading Companies, calculated on a daily basis. The percentage bases of the fees vary and are in line with the amounts being disclosed below. In addition, the Managing Owner receives a monthly management equal to a certain percentage of the assets in the Galaxy Plus entities attributable to such Series’ (including notional assets), calculated on a monthly basis. The management fees attributable to Galaxy Plus entities are included in unrealized gain/(loss) on private investment companies on the Statements of Operations. The total amount of assets of a Series allocated to Trading Advisors and/or reference programs, including (i) actual funds deposited in accounts directed by the Trading Advisors or deposited as margin in respect of swaps or other derivative instruments referencing a reference program plus (ii) any notional equity allocated to the Trading Advisors and any reference programs, is referred to herein as the “notional assets” of the Series. The annual rate of the management fee is: 0.5% for the Frontier Balanced Fund Class 1 Class 2 and Class 3,2, 1.0% for the Frontier Balanced Fund Class 1AP, Class 2a and Class 3a, 2.0% for the Frontier Winton Fund, Frontier Long/Short Commodity Fund Class 1a, Class 2a and Class 3a and Frontier Masters Fund, 0.75% for Frontier Diversified Fund, 2.5% for the Frontier Heritage Fund and Frontier Select Fund, and 3.5% for the Frontier Long/Short Commodity Fund Class 1, Class 2 and Class 3. The Managing Owner may pay all or a portion of such management fees to the Trading Advisor(s) and/or waive (up to the percentage specified) any such management fee to the extent any related management fee is paid by a trading company or estimated management fee is embedded in a swap or other derivative instrument. Any management fee embedded in a swap or other derivative instrument may be greater or less than the management fee that would otherwise be charged to the Series by the Managing Owner.
As of the date of this report, for a Series that has invested in a swap, the Managing Owner or Trading Advisor(s) do not receive any management fees directly from the Series for such swap, and instead the relevant Trading Advisor receives compensation via the fees embedded in the swap. As of September 30, 2018, the management fees embedded based on fair value of swaps in (i) swaps owned by Frontier Diversified Fund was 1.00% per annum, (ii) swaps owned by Frontier Balanced Fund was 1.00% per annum, (iii) swaps owned by Frontier Long/Short Commodity Fund was 1.50% per annum, and (iv) swaps owned by Frontier Heritage Fund was 1.00% per annum, and the Managing Owner has waived the entire management fee due to it from those Series in respect of such Series’ investment in swaps. In each case, the embedded management fee was accrued on the relevant notional amount of the swap.
46
The management fee as a percentage of the applicable Series’ notional assets will be greater than the percentage of the applicable Series’ net asset value to the extent that the notional assets of the Series exceeds its net asset value. The Managing Owner expects that the notional assets of each Series will generally be maintained at a level in excess of the net asset value of such Series and such excess may be substantial to the extent the Managing Owner deems necessary to achieve the desired level of volatility.
Trading Fees— In connection with each Series’ trading activities the Frontier Balanced Fund, Frontier Select Fund, Frontier Winton Fund and Frontier Heritage Fund pays to the Managing Owner aan FCM Fee of up to 2.25% per annum of notional assets allocated to the trading advisors, including through investments in commodity pools available on the Galaxy Plus Platform, and any reference programs of the applicable Series. The Frontier Diversified Fund, Frontier Long/Short Commodity Fund and Frontier Masters Fund pays to the Managing Owner aan FCM Fee of up to 2.25% of notional assets allocated to the trading advisors, including through investments in commodity pools available on the Galaxy Plus Platform, and a custodial/due diligence fee of 0.12% of such Series’ NAV, calculated daily.
39
Incentive Fees— Some Series pay to the Managing Owner an incentive fee of a certain percentage of new net trading profits generated in the Trading Companies by such Series, monthly or quarterly. In addition, the Managing Owner receives a quarterly incentive fee of a certain percentage of new net trading profits generated in the Galaxy Plus entities that have been allocated to the Series. The incentive fees attributable to Galaxy Plus entities are included in unrealized gain/(loss) on private investment companies on the Statements of Operations. Because the Frontier Balanced Fund, Frontier Diversified Fund, Frontier Masters Fund, Frontier Heritage Fund, Frontier Select Fund, and Frontier Long/Short Commodity Fund may each employ multiple Trading Advisors, these Series will pay the Managing Owner a monthly incentive fee calculated on a Trading Advisor by Trading Advisor basis. It is therefore possible that in any given period the Series may pay incentive fees to the Managing Owner for one or more Trading Advisors while each of these Series as a whole experiences losses. The incentive fee is 25% for the Frontier Balanced Fund and the Frontier Diversified Fund and 20% for the Frontier Winton Fund, Frontier Heritage Fund, Frontier Select Fund, Frontier Long/Short Commodity Fund and Frontier Masters Fund. The Managing Owner may pay all or a portion of such incentive fees to the Trading Advisor(s) for such Series.
As of the date of this report, for a Series that has invested in a swap, the Managing Owner or Trading Advisor(s) do not receive any incentive fees directly from the Series for such swap, and instead the relevant Trading Advisor receives compensation via the fees embedded in the swap. As of March 31,September 30, 2018, the range of incentive fees as a percentage of net new trading profits on swaps embedded in (i) swaps owned by Frontier Diversified Fund was 20-25% per annum, (ii) swaps owned by Frontier Balanced Fund was 20-25% per annum, (iii) swaps owned by Frontier Long/Short Commodity Fund was 25% per annum, and (iv) swaps owned by Frontier Heritage Fund was 15% per annum, and the Managing Owner has waived the entire incentive fee due to it from those Series in respect of such Series’ investment in swaps. TheseIn each case, the embedded incentive fees may be higher or lower inmanagement fee was accrued on the future.relevant notional amount of the swap.
Service Fees—Investors who have purchased Class 1 or Class 1a Units of Frontier Diversified Fund, Frontier Masters Fund, and Frontier Long/Short Commodity Fund are charged a service fee of up to two percent (2.0%) annually of the NAV (of the purchase price, in case of the initial service fee) of each Unit purchased, for the benefit of selling agents selling such Class 1 or Class 1a Units. The initial service fee, which is amortized monthly at an annual rate of up to two percent (2.0%) of the average daily NAV of Class 1 or Class 1a of such Series, is prepaid to the Managing Owner by each Series, and paid to the selling agents by the Managing Owner in the month following sale; provided, however, that investors who redeem all or a portion of their Class 1 and Class 1a Units of any Series during the first twelve (12) months following the effective date of their purchase are subject to a redemption fee of up to two percent (2.0%) of the purchase price at which such investor redeemed to reimburse the Managing Owner for the then unamortized balance of the prepaid initial service fee. Investors who have purchased Class 1 or Class 1a Units of Frontier Balanced Fund, Frontier Heritage Fund, Frontier Select Fund, and Frontier Winton Fund are charged a service fee of up to three percent (3.0%) annually of the NAV (of the purchase price, in case of the initial service fee) of each Unit purchased, for the benefit of selling agents selling such Class 1 or Class 1a Units. The initial service fee, which is amortized monthly at an annual rate of up to three percent (3.0%) of the average daily NAV of Class 1 or Class 1a of such Series, is prepaid to the Managing Owner by each Series, and paid to the selling agents by the Managing Owner in the month following sale; provided, however, that investors who redeem all or a portion of their Class 1 and Class 1a Units of any Series during the first twelve (12) months following the effective date of their purchase are subject to a redemption fee of up to three percent (3.0%) of the purchase price at which such investor redeemed to reimburse the Managing Owner for the then-unamortized balance of the prepaid initial service fee. With respect to Class 2 and Class 2a Units of any Series, the Managing Owner pays an ongoing service fee to selling agents of up to one half percent (0.5%) annually of the NAV of each Class 2 or Class 2a Unit (of which 0.25% will be charged to Limited Owners holding Class 2 Units of the Frontier Diversified Fund and Frontier Masters Fund or Class 2a Units of the Frontier Long/Short Commodity Fund sold) until such Class 2 or Class 2a Units which are subject to the fee limitation are reclassified as Class 3 or Class 3a Units of the applicable Series for administrative purposes. Currently the service fee is not charged to Class 1AP investors. The Managing Owner may also pay selling agents certain additional fees and expenses for administrative and other services rendered and expenses incurred by such selling agents.
4047
The following table summarizes fees earned by the Managing Owner for the three months and nine months ended March 31,September 30, 2018 and 2017:
Three Months Ended March 31,September 30, 2018
| Incentive Fees (rebate) | Management Fees | Service Fees | Trading Fees | |||||||||||||||||||||||||||||
| Incentive Fees (rebate) | Management Fees | Service Fees | Trading Fees | |||||||||||||||||||||||||||||
| Frontier Diversified Fund | $ | 1,881 | $ | 11,563 | $ | 16,115 | $ | 165,150 | $ | 10,897 | $ | 13,113 | $ | 14,432 | $ | 145,750 | ||||||||||||||||
| Frontier Masters Fund | — | 32,349 | 14,969 | 134,048 | — | 22,605 | 11,605 | 95,225 | ||||||||||||||||||||||||
| Frontier Long/Short Commodity Fund | — | — | 657 | 24,693 | — | — | 334 | 19,318 | ||||||||||||||||||||||||
| Frontier Balanced Fund | 145,134 | 20,336 | 262,981 | 384,176 | — | 26,643 | 222,302 | 339,537 | ||||||||||||||||||||||||
| Frontier Select Fund | — | — | 39,689 | 37,594 | — | — | 32,149 | 27,076 | ||||||||||||||||||||||||
| Frontier Winton Fund | — | 130,660 | 94,260 | 82,258 | — | 104,062 | 76,839 | 73,379 | ||||||||||||||||||||||||
| Frontier Heritage Fund | 1,394 | 35,981 | 37,108 | 42,292 | — | 22,635 | 29,343 | 33,624 | ||||||||||||||||||||||||
Three Months Ended March 31,September 30, 2017
| Incentive Fees (rebate) | Management Fees | Service Fees | Trading Fees | |||||||||||||||||||||||||||||
| Incentive Fees (rebate) | Management Fees | Service Fees | Trading Fees | |||||||||||||||||||||||||||||
| Frontier Diversified Fund | $ | (63,508 | ) | $ | 27,958 | $ | 44,833 | $ | 466,674 | $ | — | $ | 13,509 | $ | 24,584 | $ | 221,452 | |||||||||||||||
| Frontier Masters Fund | — | 85,229 | 28,774 | 190,175 | — | 26,862 | 19,585 | 151,229 | ||||||||||||||||||||||||
| Frontier Long/Short Commodity Fund | — | — | 7,461 | 76,785 | — | — | 1,867 | 40,897 | ||||||||||||||||||||||||
| Frontier Balanced Fund | — | 38,479 | 398,860 | 539,715 | — | 25,760 | 323,572 | 462,275 | ||||||||||||||||||||||||
| Frontier Select Fund | — | 56,175 | 69,331 | 49,044 | — | — | 46,479 | 39,673 | ||||||||||||||||||||||||
| Frontier Winton Fund | (49,790 | ) | 261,955 | 142,629 | 149,338 | — | 188,835 | 99,725 | 127,661 | |||||||||||||||||||||||
| Frontier Heritage Fund | (4,603 | ) | 58,992 | 52,095 | 59,672 | — | 43,021 | 40,954 | 36,907 | |||||||||||||||||||||||
Nine Months Ended September 30, 2018
| Incentive Fees (rebate) | Management Fees | Service Fees | Trading Fees | |||||||||||||
| Frontier Diversified Fund | $ | 12,778 | $ | 37,905 | $ | 45,236 | $ | 454,513 | ||||||||
| Frontier Masters Fund | — | 83,816 | 39,503 | 335,271 | ||||||||||||
| Frontier Long/Short Commodity Fund | — | — | 1,398 | 65,530 | ||||||||||||
| Frontier Balanced Fund | 145,134 | 69,545 | 723,093 | 1,068,482 | ||||||||||||
| Frontier Select Fund | — | — | 105,111 | 92,779 | ||||||||||||
| Frontier Winton Fund | — | 366,404 | 252,006 | 236,657 | ||||||||||||
| Frontier Heritage Fund | 1,394 | 92,509 | 97,753 | 112,771 | ||||||||||||
Nine Months Ended September 30, 2017
| Incentive Fees (rebate) | Management Fees | Service Fees | Trading Fees | |||||||||||||
| Frontier Diversified Fund | $ | (63,508 | ) | $ | 69,251 | $ | 110,769 | $ | 1,154,233 | |||||||
| Frontier Masters Fund | — | 150,767 | 72,519 | 527,813 | ||||||||||||
| Frontier Long/Short Commodity Fund | (87,670 | ) | — | 12,838 | 183,990 | |||||||||||
| Frontier Balanced Fund | — | 102,297 | 1,106,847 | 1,625,446 | ||||||||||||
| Frontier Select Fund | — | 102,047 | 176,247 | 137,940 | ||||||||||||
| Frontier Winton Fund | (49,790 | ) | 677,921 | 368,816 | 431,025 | |||||||||||
48
The following table summarizes fees payable to the Managing Owner as of March 31,September 30, 2018 and December 31, 2017.
As of March 31,September 30, 2018
| Incentive Fees | Management Fees | Interest Fees | Service Fees | Trading Fees | ||||||||||||||||||||||||||||||||||||
| Incentive Fees | Management Fees | Interest Fees | Service Fees | Trading Fees | ||||||||||||||||||||||||||||||||||||
| Frontier Diversified Fund | $ | 1,881 | $ | 8,056 | $ | — | $ | 2,972 | $ | 52,807 | $ | 10,897 | $ | 8,244 | $ | — | $ | 4,552 | $ | 47,283 | ||||||||||||||||||||
| Frontier Masters Fund | — | 20,841 | — | 2,955 | 40,213 | — | 7,494 | — | 2,625 | 32,173 | ||||||||||||||||||||||||||||||
| Frontier Long/Short Commodity Fund | — | — | 135 | 96 | 8,309 | — | — | 44 | 66 | 6,259 | ||||||||||||||||||||||||||||||
| Frontier Balanced Fund | 145,134 | 18,079 | 5,960 | 75,541 | 122,667 | — | 23,019 | 3,591 | 61,951 | 108,152 | ||||||||||||||||||||||||||||||
| Frontier Select Fund | — | — | 243 | 11,782 | 11,479 | — | — | 765 | 7,750 | 8,530 | ||||||||||||||||||||||||||||||
| Frontier Winton Fund | — | 87,508 | 9,915 | 25,269 | 26,536 | — | 34,474 | 15,770 | 20,813 | 23,696 | ||||||||||||||||||||||||||||||
| Frontier Heritage Fund | 1,394 | 25,192 | 1,149 | 9,573 | 13,995 | — | 6,370 | 1,918 | 10,001 | 11,980 | ||||||||||||||||||||||||||||||
As of December 31, 2017
| Incentive Fees | Management Fees | Interest Fees | Service Fees | Trading Fees | ||||||||||||||||
| Frontier Diversified Fund | $ | 12,847 | $ | 4,049 | $ | — | $ | 3,614 | $ | 61,188 | ||||||||||
| Frontier Masters Fund | — | 8,949 | — | 3,570 | 49,131 | |||||||||||||||
| Frontier Long/Short Commodity Fund | — | — | 103 | 172 | 9,125 | |||||||||||||||
| Frontier Balanced Fund | 40,189 | 11,465 | 2,528 | 88,149 | 140,868 | |||||||||||||||
| Frontier Select Fund | — | — | 1,358 | 14,743 | 14,898 | |||||||||||||||
| Frontier Winton Fund | — | 53,039 | 20,992 | 26,714 | 43,573 | |||||||||||||||
| Frontier Heritage Fund | — | 13,471 | 2,608 | 11,483 | 15,703 | |||||||||||||||
41
With respect to the service fees, the initial service fee (for the first 12 months) relating to a purchase of Units by an investor is prepaid by the Managing Owner to the relevant selling agent in the month following such purchase and is reimbursed therefore by the Series monthly in arrears in an amount based upon a corresponding percentage of NAV, calculated daily. Consequently, the Managing Owner bears the risk and the benefit of the upside potential of any difference between the amount of the initial service fee prepaid by it and the amount of the reimbursement thereof, which may result from variations in NAV over the following 12 months.
Aggregate interest income from all sources, including U.S. Treasury Securities assets net of premiums and cash held at clearing brokers, of up to the first 2% (annualized) is paid to the Managing Owner by the Frontier Balanced Fund (Class 1 and Class 2), Frontier Long/Short Commodity Fund (Class 2 and Class 3), Frontier Winton Fund, Frontier Select Fund, and Frontier Heritage Fund. For the Frontier Diversified Fund, Frontier Long/Short Commodity Fund (Class 1a, Class 2a, Class 3a only), Frontier Masters Fund, and Frontier Balanced Fund (Class 1AP, Class 2a and Class 3a) 100% of the interest is retained by the respective Series.
4249
The following table outlines the interest paid by each Series to the Managing Owner and its ratio to average net assets for the three and threenine months ended March 31,September 30, 2018 and 2017:
Three Months Ended
| March 31, 2018 | March 31, 2017 | March 31, 2018 | March 31, 2017 | |||||||||||||||||||||||||
| Gross Amount | Gross Amount | |||||||||||||||||||||||||||
| Paid to the | Paid to the | Ratio to | Ratio to | September 30, 2018 | September 30, 2017 | September 30, 2018 | September 30, 2017 | |||||||||||||||||||||
| Managing | Managing | Average Net | Average Net | |||||||||||||||||||||||||
| Owner | Owner | Assets | Assets | Gross Amount Paid to | Gross Amount Paid to | Ratio to Average Net | Ratio to Average | |||||||||||||||||||||
| the Managing Owner | the Managing Owner | Assets | Net Assets | |||||||||||||||||||||||||
| Frontier Diversified Class 1 | $ | — | $ | (3,860 | ) | 0.00% | -0.09% | $ | — | $ | — | 0.00 | % | 0.00 | % | |||||||||||||
| Frontier Diversified Class 2 | — | (19,555 | ) | 0.00% | -0.05% | — | — | 0.00 | % | 0.00 | % | |||||||||||||||||
| Frontier Diversified Class 3 | — | (7,071 | ) | 0.00% | -0.05% | — | — | 0.00 | % | 0.00 | % | |||||||||||||||||
| Frontier Masters Class 1 | — | (4,674 | ) | 0.00% | -0.09% | — | (314 | ) | 0.00 | % | -0.01 | % | ||||||||||||||||
| Frontier Masters Class 2 | — | (4,780 | ) | 0.00% | -0.08% | — | (333 | ) | 0.00 | % | -0.01 | % | ||||||||||||||||
| Frontier Masters Class 3 | — | (5,338 | ) | 0.00% | -0.08% | — | (543 | ) | 0.00 | % | -0.01 | % | ||||||||||||||||
| Frontier Long/Short Class 2 | 50 | (96 | ) | 0.02% | -0.01% | 4 | 35 | 0.00 | % | 0.01 | % | |||||||||||||||||
| Frontier Long/Short Class 3 | 541 | (565 | ) | 0.02% | -0.01% | 55 | 289 | 0.31 | % | 0.01 | % | |||||||||||||||||
| Frontier Long/Short Class 1a | — | 533 | 0.00% | 0.04% | — | — | 0.00 | % | 0.00 | % | ||||||||||||||||||
| Frontier Long/Short Class 2a | — | 233 | 0.00% | 0.02% | — | — | 0.00 | % | 0.00 | % | ||||||||||||||||||
| Frontier Long/Short Class 3a | — | 189 | 0.00% | 0.01% | — | — | 0.00 | % | 0.00 | % | ||||||||||||||||||
| Frontier Balanced Fund Class 1 | 11,898 | 34,592 | 0.03% | 0.06% | 4,688 | 9,154 | 0.02 | % | 0.02 | % | ||||||||||||||||||
| Frontier Balanced Fund Class 1AP | 192 | 411 | 0.03% | 0.06% | 85 | 123 | 0.02 | % | 0.02 | % | ||||||||||||||||||
| Frontier Balanced Fund Class 2 | 2,138 | 14,069 | 0.03% | 0.06% | 848 | 2,046 | 0.02 | % | 0.02 | % | ||||||||||||||||||
| Frontier Balanced Fund Class 2A | 45 | 78 | 0.01% | 0.01% | 12 | (77 | ) | 0.00 | % | -0.01 | % | |||||||||||||||||
| Frontier Balanced Fund Class 3A | 127 | 248 | 0.01% | 0.01% | 31 | (136 | ) | 0.00 | % | -0.01 | % | |||||||||||||||||
| Frontier Select Fund Class 1 | 2,460 | 13,085 | 0.05% | 0.14% | 228 | 4,708 | 0.00 | % | 0.08 | % | ||||||||||||||||||
| Frontier Select Fund Class 1AP | 10 | 36 | 0.04% | 0.14% | 1 | 17 | 0.00 | % | 0.08 | % | ||||||||||||||||||
| Frontier Select Fund Class 2 | 366 | 1,919 | 0.05% | 0.14% | 20 | 686 | 0.00 | % | 0.08 | % | ||||||||||||||||||
| Frontier Winton Class 1 | 28,689 | 51,077 | 0.22% | 0.26% | 5,024 | 28,693 | 0.27 | % | 0.22 | % | ||||||||||||||||||
| Frontier Winton Class 1AP | 83 | 92 | 0.22% | 0.26% | 18 | 74 | 0.00 | % | 0.22 | % | ||||||||||||||||||
| Frontier Winton Class 2 | 3,777 | 29,644 | 0.23% | 0.26% | 310 | 23,095 | 0.00 | % | 0.22 | % | ||||||||||||||||||
| Frontier Heritage Fund Class 1 | 4,383 | 14,182 | 0.09% | 0.20% | 412 | 7,622 | 0.02 | % | 0.14 | % | ||||||||||||||||||
| Frontier Heritage Fund Class 1AP | 5 | 11 | 0.09% | 0.19% | — | 8 | 0.00 | % | 0.15 | % | ||||||||||||||||||
| Frontier Heritage Fund Class 2 | 636 | 5,244 | 0.09% | 0.20% | 68 | 1,297 | 0.00 | % | 0.14 | % | ||||||||||||||||||
| Total | $ | 55,400 | $ | 119,704 | $ | 11,804 | $ | 76,444 | ||||||||||||||||||||
4350
Nine Months Ended
| September 30, 2018 | September 30, 2017 | September 30, 2018 | September 30, 2017 | |||||||||||||
| Gross Amount Paid to | Gross Amount Paid to | Ratio to Average Net | Ratio to Average Net | |||||||||||||
| the Managing Owner | the Managing Owner | Assets | Assets | |||||||||||||
| Frontier Diversified Class 1 | $ | — | $ | (3,860 | ) | 0.00 | % | -0.10 | % | |||||||
| Frontier Diversified Class 2 | — | (19,555 | ) | 0.00 | % | -0.07 | % | |||||||||
| Frontier Diversified Class 3 | — | (7,071 | ) | 0.00 | % | -0.06 | % | |||||||||
| Frontier Masters Class 1 | — | (4,988 | ) | 0.00 | % | -0.12 | % | |||||||||
| Frontier Masters Class 2 | — | (5,113 | ) | 0.00 | % | -0.11 | % | |||||||||
| Frontier Masters Class 3 | — | (5,881 | ) | 0.00 | % | -0.09 | % | |||||||||
| Frontier Long/Short Class 2 | 41 | 167 | 0.00 | % | 0.03 | % | ||||||||||
| Frontier Long/Short Class 3 | 543 | 1,566 | 2.71 | % | 0.04 | % | ||||||||||
| Frontier Long/Short Class 1a | — | 533 | 0.00 | % | 0.07 | % | ||||||||||
| Frontier Long/Short Class 2a | — | 233 | 0.00 | % | 0.03 | % | ||||||||||
| Frontier Long/Short Class 3a | — | 189 | 0.00 | % | 0.01 | % | ||||||||||
| Frontier Balanced Fund Class 1 | 19,340 | 199,538 | 0.06 | % | 0.40 | % | ||||||||||
| Frontier Balanced Fund Class 1AP | 341 | 2,539 | 0.06 | % | 0.41 | % | ||||||||||
| Frontier Balanced Fund Class 2 | 3,504 | 54,615 | 0.06 | % | 0.31 | % | ||||||||||
| Frontier Balanced Fund Class 2A | 51 | 494 | 0.01 | % | 0.09 | % | ||||||||||
| Frontier Balanced Fund Class 3A | 139 | 1,316 | 0.01 | % | 0.08 | % | ||||||||||
| Frontier Select Fund Class 1 | 6,063 | 28,362 | 0.05 | % | 0.36 | % | ||||||||||
| Frontier Select Fund Class 1AP | 26 | 84 | 0.07 | % | 0.35 | % | ||||||||||
| Frontier Select Fund Class 2 | 744 | 4,295 | 0.07 | % | 0.36 | % | ||||||||||
| Frontier Winton Class 1 | 67,727 | 40,855 | 3.41 | % | 0.25 | % | ||||||||||
| Frontier Winton Class 1AP | 212 | 50 | 0.00 | % | 0.14 | % | ||||||||||
| Frontier Winton Class 2 | 7,338 | 17,017 | 0.09 | % | 0.15 | % | ||||||||||
| Frontier Heritage Fund Class 1 | 5,794 | 33,744 | 0.24 | % | 0.53 | % | ||||||||||
| Frontier Heritage Fund Class 1AP | 5 | 29 | 0.00 | % | 0.52 | % | ||||||||||
| Frontier Heritage Fund Class 2 | 904 | 10,039 | 0.02 | % | 0.56 | % | ||||||||||
| Total | $ | 112,772 | $ | 349,196 | ||||||||||||
51
The following information presents the financial highlights of the Trust, with respect to the Series, for the three and nine months ended March 31,September 30, 2018 and 2017.
| Frontier Diversified Fund | Frontier Masters Fund | Frontier Long/Short Commodity Fund | Frontier Diversified Fund | Frontier Masters Fund | Frontier Long/Short Commodity Fund | |||||||||||||||||||||||||||||||||||||||||||||||||||||||||||||||||||||||||||||||||||
| Class 1 | Class 2 | Class 3 | Class 1 | Class 2 | Class 3 | Class 1a | Class 2 | Class 2a | Class 3 | Class 3a | Class 1 | Class 2 | Class 3 | Class 1 | Class 2 | Class 3 | Class 1a | Class 2 | Class 2a | Class 3 | Class 3a | |||||||||||||||||||||||||||||||||||||||||||||||||||||||||||||||||||
| Per unit operating performance (1) | ||||||||||||||||||||||||||||||||||||||||||||||||||||||||||||||||||||||||||||||||||||||||
| Net asset value, December 31, 2017 | $ | 116.41 | $ | 135.19 | $ | 125.68 | $ | 114.74 | $ | 133.27 | $ | 124.40 | $ | 81.35 | $ | 115.81 | $ | 93.59 | $ | 121.50 | $ | 97.99 | ||||||||||||||||||||||||||||||||||||||||||||||||||||||||||||||||||
| Net asset value, June 30, 2018 | $ | 108.30 | $ | 126.87 | $ | 118.09 | $ | 99.33 | $ | 116.38 | $ | 108.77 | $ | 70.78 | $ | 106.52 | $ | 82.13 | $ | 111.75 | $ | 86.11 | ||||||||||||||||||||||||||||||||||||||||||||||||||||||||||||||||||
| Net operating results: | ||||||||||||||||||||||||||||||||||||||||||||||||||||||||||||||||||||||||||||||||||||||||
| Interest income | 0.04 | 0.05 | 0.05 | 0.09 | 0.10 | 0.09 | 0.08 | 0.11 | 0.09 | 0.12 | 0.10 | 0.06 | 0.07 | 0.06 | 0.07 | 0.08 | 0.07 | 0.07 | 0.11 | 0.08 | 0.11 | 0.08 | ||||||||||||||||||||||||||||||||||||||||||||||||||||||||||||||||||
| Expenses | (1.82 | ) | (1.16 | ) | (1.08 | ) | (2.29 | ) | (1.98 | ) | (1.85 | ) | (1.20 | ) | (0.69 | ) | (0.56 | ) | (0.72 | ) | (0.59 | ) | (1.83 | ) | (1.19 | ) | (1.11 | ) | (2.16 | ) | (1.91 | ) | (1.79 | ) | (1.15 | ) | (0.64 | ) | (0.48 | ) | (0.67 | ) | (0.50 | ) | ||||||||||||||||||||||||||||||||||||||||||||
| Net gain/(loss) on investments, net of non-controlling interests | (8.10 | ) | (9.82 | ) | (9.06 | ) | (14.24 | ) | (16.72 | ) | (15.54 | ) | (2.37 | ) | (2.79 | ) | (3.17 | ) | (2.93 | ) | (3.26 | ) | (2.07 | ) | (2.83 | ) | (2.57 | ) | (0.02 | ) | (0.15 | ) | (0.06 | ) | (3.50 | ) | (2.44 | ) | (4.58 | ) | (2.57 | ) | (4.75 | ) | ||||||||||||||||||||||||||||||||||||||||||||
| Net income/(loss) | (9.88 | ) | (10.93 | ) | (10.09 | ) | (16.44 | ) | (18.60 | ) | (17.30 | ) | (3.49 | ) | (3.37 | ) | (3.64 | ) | (3.53 | ) | (3.75 | ) | (3.84 | ) | (3.96 | ) | (3.62 | ) | (2.13 | ) | (1.99 | ) | (1.78 | ) | (4.59 | ) | (2.98 | ) | (4.98 | ) | (3.13 | ) | (5.17 | ) | ||||||||||||||||||||||||||||||||||||||||||||
| Net asset value, March 31, 2018 | $ | 106.53 | $ | 124.26 | $ | 115.59 | $ | 98.30 | $ | 114.67 | $ | 107.10 | $ | 77.86 | $ | 112.44 | $ | 89.95 | $ | 117.97 | $ | 94.24 | ||||||||||||||||||||||||||||||||||||||||||||||||||||||||||||||||||
| Net asset value, September 30, 2018 | $ | 104.46 | $ | 122.91 | $ | 114.47 | $ | 97.20 | $ | 114.39 | $ | 106.99 | $ | 66.19 | $ | 103.54 | $ | 77.15 | $ | 108.62 | $ | 80.94 | ||||||||||||||||||||||||||||||||||||||||||||||||||||||||||||||||||
| Ratios to average net assets | ||||||||||||||||||||||||||||||||||||||||||||||||||||||||||||||||||||||||||||||||||||||||
| Net investment income/(loss) | -6.45 | % | -3.44 | % | -3.44 | % | -8.38 | % | -6.10 | % | -6.10 | % | -5.43 | % | -2.00 | % | -2.00 | % | -2.00 | % | -2.00 | % | -6.52 | % | -3.45 | % | -3.45 | % | -8.57 | % | -6.38 | % | -6.38 | % | -6.44 | % | -2.04 | % | -2.04 | % | -2.04 | % | -2.04 | % | ||||||||||||||||||||||||||||||||||||||||||||
| Expenses before incentive fees (3)(4) | 6.60 | % | 3.58 | % | 3.58 | % | 8.70 | % | 6.42 | % | 6.42 | % | 5.82 | % | 2.39 | % | 2.39 | % | 2.39 | % | 2.39 | % | 6.67 | % | 3.60 | % | 3.60 | % | 8.83 | % | 6.65 | % | 6.65 | % | 6.84 | % | 2.45 | % | 2.45 | % | 2.45 | % | 2.45 | % | ||||||||||||||||||||||||||||||||||||||||||||
| Expenses after incentive fees (3)(4) | 6.61 | % | 3.59 | % | 3.59 | % | 8.70 | % | 6.42 | % | 6.42 | % | 5.82 | % | 2.39 | % | 2.39 | % | 2.39 | % | 2.39 | % | 6.73 | % | 3.66 | % | 3.66 | % | 8.83 | % | 6.65 | % | 6.65 | % | 6.84 | % | 2.45 | % | 2.45 | % | 2.45 | % | 2.45 | % | ||||||||||||||||||||||||||||||||||||||||||||
| Total return before incentive fees (2) | -8.48 | % | -8.08 | % | -8.02 | % | -14.33 | % | -13.96 | % | -13.91 | % | -4.29 | % | -2.91 | % | -3.89 | % | -2.91 | % | -3.83 | % | -3.48 | % | -3.06 | % | -3.00 | % | -2.14 | % | -1.71 | % | -1.64 | % | -6.48 | % | -2.80 | % | -6.06 | % | -2.80 | % | -6.00 | % | ||||||||||||||||||||||||||||||||||||||||||||
| Total return after incentive fees (2) | -8.49 | % | -8.08 | % | -8.03 | % | -14.33 | % | -13.96 | % | -13.91 | % | -4.29 | % | -2.91 | % | -3.89 | % | -2.91 | % | -3.83 | % | -3.55 | % | -3.12 | % | -3.07 | % | -2.14 | % | -1.71 | % | -1.64 | % | -6.48 | % | -2.80 | % | -6.06 | % | -2.80 | % | -6.00 | % | ||||||||||||||||||||||||||||||||||||||||||||
| Frontier Balanced Fund | Frontier Select Fund | Frontier Balanced Fund | Frontier Select Fund | |||||||||||||||||||||||||||||||||||||||||||||||||||||||||||||||||||||||||||||||||||||
| Class 1 | Class 1AP | Class 2 | Class 2a | Class 3a | Class 1 | Class 1AP | Class 2 | Class 1 | Class 1AP | Class 2 | Class 2a | Class 3a | Class 1 | Class 1AP | Class 2 | |||||||||||||||||||||||||||||||||||||||||||||||||||||||||||||||||||||||||
| Per unit operating performance (1) | ||||||||||||||||||||||||||||||||||||||||||||||||||||||||||||||||||||||||||||||||||||||||
| Net asset value, December 31, 2017 | $ | 135.96 | $ | 150.56 | $ | 202.90 | $ | 175.77 | $ | 175.18 | $ | 90.27 | $ | 100.02 | $ | 132.73 | ||||||||||||||||||||||||||||||||||||||||||||||||||||||||||||||||||||||||
| Net asset value, June 30, 2018 | $ | 125.21 | $ | 140.68 | $ | 189.72 | $ | 164.33 | $ | 163.77 | $ | 74.75 | $ | 84.07 | $ | 111.56 | ||||||||||||||||||||||||||||||||||||||||||||||||||||||||||||||||||||||||
| Net operating results: | ||||||||||||||||||||||||||||||||||||||||||||||||||||||||||||||||||||||||||||||||||||||||
| Interest income | 0.05 | 0.05 | 0.07 | 0.06 | 0.06 | 0.00 | 0.00 | 0.00 | 0.02 | 0.03 | 0.03 | 0.03 | 0.03 | 0.00 | 0.00 | 0.00 | ||||||||||||||||||||||||||||||||||||||||||||||||||||||||||||||||||||||||
| Expenses | (2.57 | ) | (1.79 | ) | (2.41 | ) | (2.10 | ) | (2.09 | ) | (1.15 | ) | (0.57 | ) | (0.76 | ) | (2.14 | ) | (1.38 | ) | (1.86 | ) | (1.61 | ) | (1.60 | ) | (1.01 | ) | (0.50 | ) | (0.67 | ) | ||||||||||||||||||||||||||||||||||||||||||||||||||||||||
| Net gain/(loss) on investments, net of non-controlling interests | (8.51 | ) | (9.49 | ) | (12.68 | ) | (11.06 | ) | (11.03 | ) | (12.65 | ) | (14.09 | ) | (18.69 | ) | (3.30 | ) | (3.70 | ) | (5.00 | ) | (4.26 | ) | (4.26 | ) | 1.67 | 1.88 | 2.51 | |||||||||||||||||||||||||||||||||||||||||||||||||||||||||||
| Net income/(loss) | (11.03 | ) | (11.23 | ) | (15.02 | ) | (13.10 | ) | (13.06 | ) | (13.80 | ) | (14.66 | ) | (19.45 | ) | (5.40 | ) | (5.05 | ) | (6.82 | ) | (5.85 | ) | (5.83 | ) | 0.66 | 1.38 | 1.84 | |||||||||||||||||||||||||||||||||||||||||||||||||||||||||||
| Net asset value, March 31, 2018 | $ | 124.93 | $ | 139.33 | $ | 187.88 | $ | 162.67 | $ | 162.12 | $ | 76.47 | $ | 85.36 | $ | 113.28 | ||||||||||||||||||||||||||||||||||||||||||||||||||||||||||||||||||||||||
| Net asset value, September 30, 2018 | $ | 119.81 | $ | 135.63 | $ | 182.90 | $ | 158.48 | $ | 157.94 | $ | 75.41 | $ | 85.45 | $ | 113.40 | ||||||||||||||||||||||||||||||||||||||||||||||||||||||||||||||||||||||||
| Ratios to average net assets | ||||||||||||||||||||||||||||||||||||||||||||||||||||||||||||||||||||||||||||||||||||||||
| Net investment income/(loss) | -6.89 | % | -3.89 | % | -3.89 | % | -3.89 | % | -3.89 | % | -5.46 | % | -2.46 | % | -2.46 | % | -6.89 | % | -3.89 | % | -3.89 | % | -3.89 | % | -3.89 | % | -5.36 | % | -2.36 | % | -2.36 | % | ||||||||||||||||||||||||||||||||||||||||||||||||||||||||
| Expenses before incentive fees (3)(4) | 6.71 | % | 3.72 | % | 3.72 | % | 3.72 | % | 3.72 | % | 5.46 | % | 2.46 | % | 2.46 | % | 7.01 | % | 4.01 | % | 4.01 | % | 4.01 | % | 4.01 | % | 5.36 | % | 2.36 | % | 2.36 | % | ||||||||||||||||||||||||||||||||||||||||||||||||||||||||
| Expenses after incentive fees (3)(4) | 7.04 | % | 4.05 | % | 4.05 | % | 4.05 | % | 4.05 | % | 5.46 | % | 2.46 | % | 2.46 | % | 7.01 | % | 4.01 | % | 4.01 | % | 4.01 | % | 4.01 | % | 5.36 | % | 2.36 | % | 2.36 | % | ||||||||||||||||||||||||||||||||||||||||||||||||||||||||
| Total return before incentive fees (2) | -7.79 | % | -7.13 | % | -7.08 | % | -7.13 | % | -7.13 | % | -15.29 | % | -14.66 | % | -14.65 | % | -4.31 | % | -3.59 | % | -3.59 | % | -3.56 | % | -3.56 | % | 0.88 | % | 1.64 | % | 1.65 | % | ||||||||||||||||||||||||||||||||||||||||||||||||||||||||
| Total return after incentive fees (2) | -8.11 | % | -7.46 | % | -7.40 | % | -7.45 | % | -7.46 | % | -15.29 | % | -14.66 | % | -14.65 | % | -4.31 | % | -3.59 | % | -3.59 | % | -3.56 | % | -3.56 | % | 0.88 | % | 1.64 | % | 1.65 | % | ||||||||||||||||||||||||||||||||||||||||||||||||||||||||
| Frontier Winton Fund | Frontier Heritage Fund | Frontier Winton Fund | Frontier Heritage Fund | |||||||||||||||||||||||||||||||||||||||||||||||||||||||||||||||||||||||||||||||||||||
| Class 1 | Class 1AP | Class 2 | Class 1 | Class 1AP | Class 2 | Class 1 | Class 1AP | Class 2 | Class 1 | Class 1AP | Class 2 | |||||||||||||||||||||||||||||||||||||||||||||||||||||||||||||||||||||||||||||
| Per unit operating performance (1) | ||||||||||||||||||||||||||||||||||||||||||||||||||||||||||||||||||||||||||||||||||||||||
| Net asset value, December 31, 2017 | $ | 159.08 | $ | 176.44 | $ | 216.50 | $ | 121.19 | $ | 134.28 | $ | 179.70 | ||||||||||||||||||||||||||||||||||||||||||||||||||||||||||||||||||||||||||||
| Net asset value, June 30, 2018 | $ | 148.66 | $ | 167.19 | $ | 203.47 | $ | 102.68 | $ | 115.46 | $ | 154.54 | ||||||||||||||||||||||||||||||||||||||||||||||||||||||||||||||||||||||||||||
| Net operating results: | ||||||||||||||||||||||||||||||||||||||||||||||||||||||||||||||||||||||||||||||||||||||||
| Interest income | 0.00 | 0.00 | 0.00 | 0.00 | 0.00 | 0.00 | 0.00 | 0.00 | 0.00 | 0.00 | 0.00 | 0.00 | ||||||||||||||||||||||||||||||||||||||||||||||||||||||||||||||||||||||||||||
| Expenses | (3.45 | ) | (2.55 | ) | (3.24 | ) | (2.46 | ) | (1.78 | ) | (2.38 | ) | (3.55 | ) | (2.74 | ) | (3.63 | ) | (2.04 | ) | (1.43 | ) | (1.91 | ) | ||||||||||||||||||||||||||||||||||||||||||||||||||||||||||||||||
| Net gain/(loss) on investments, net of non-controlling interests | (11.03 | ) | (12.28 | ) | (16.50 | ) | (14.23 | ) | (15.86 | ) | (21.21 | ) | 0.91 | 1.06 | 6.36 | 0.46 | 0.55 | 0.68 | ||||||||||||||||||||||||||||||||||||||||||||||||||||||||||||||||||||||
| Net income/(loss) | (14.48 | ) | (14.83 | ) | (19.65 | ) | (16.69 | ) | (17.64 | ) | (23.59 | ) | (2.64 | ) | (1.68 | ) | 2.73 | (1.58 | ) | (0.88 | ) | (1.23 | ) | |||||||||||||||||||||||||||||||||||||||||||||||||||||||||||||||||
| Net asset value, March 31, 2018 | $ | 144.60 | $ | 161.61 | $ | 196.85 | $ | 104.50 | $ | 116.64 | $ | 156.11 | ||||||||||||||||||||||||||||||||||||||||||||||||||||||||||||||||||||||||||||
| Net asset value, September 30, 2018 | $ | 146.02 | $ | 165.51 | $ | 206.20 | $ | 101.10 | $ | 114.58 | $ | 153.31 | ||||||||||||||||||||||||||||||||||||||||||||||||||||||||||||||||||||||||||||
| Ratios to average net assets | ||||||||||||||||||||||||||||||||||||||||||||||||||||||||||||||||||||||||||||||||||||||||
| Net investment income/(loss) | -8.98 | % | -5.98 | % | -5.98 | % | -8.51 | % | -5.52 | % | -5.52 | % | -9.49 | % | -6.49 | % | -6.49 | % | -7.93 | % | -4.93 | % | -4.93 | % | ||||||||||||||||||||||||||||||||||||||||||||||||||||||||||||||||
| Expenses before incentive fees (3)(4) | 8.98 | % | 5.98 | % | 5.98 | % | 8.49 | % | 5.50 | % | 5.50 | % | 9.49 | % | 6.49 | % | 6.49 | % | 7.93 | % | 4.93 | % | 4.93 | % | ||||||||||||||||||||||||||||||||||||||||||||||||||||||||||||||||
| Expenses after incentive fees (3)(4) | 8.98 | % | 5.98 | % | 5.98 | % | 8.51 | % | 5.52 | % | 5.52 | % | 9.49 | % | 6.49 | % | 6.49 | % | 7.93 | % | 4.93 | % | 4.93 | % | ||||||||||||||||||||||||||||||||||||||||||||||||||||||||||||||||
| Total return before incentive fees (2) | -9.10 | % | -8.41 | % | -9.12 | % | -13.75 | % | -13.11 | % | -13.10 | % | -1.78 | % | -1.00 | % | 1.34 | % | -1.54 | % | -0.76 | % | -0.80 | % | ||||||||||||||||||||||||||||||||||||||||||||||||||||||||||||||||
| Total return after incentive fees (2) | -9.10 | % | -8.41 | % | -9.12 | % | -13.77 | % | -13.14 | % | -13.13 | % | -1.78 | % | -1.00 | % | 1.34 | % | -1.54 | % | -0.76 | % | -0.80 | % | ||||||||||||||||||||||||||||||||||||||||||||||||||||||||||||||||
| (1) | Interest income and expenses per unit are calculated by dividing these amounts by the average number of units outstanding during the period. The net gain/(loss) on investments, net of non-controlling interests is a balancing amount necessary to reconcile the change in net asset value per unit with the other per unit information. |
| (2) | Impact of incentive fee computed using average net assets, otherwise computed using average units outstanding during the period prior to the effects of any non-controlling transactions. An owner’s total returns may vary from the above returns based on the timing of contributions and withdrawals. Total returns are not annualized. |
| (3) | Expense ratios do not reflect interest allocated to the Managing Owner as such expenses are not included in the Statements of Operations of the Series, see footnote 6. |
| (4) | Expense ratios do not include |
4452
| Frontier Diversified Fund | Frontier Masters Fund | Frontier Long/Short Commodity Fund | Frontier Diversified Fund | Frontier Masters Fund | Frontier Long/Short Commodity Fund | |||||||||||||||||||||||||||||||||||||||||||||||||||||||||||||||||||||||||||||||||||
| Class 1 | Class 2 | Class 3 | Class 1 | Class 2 | Class 3 | Class 1a | Class 2 | Class 2a | Class 3 | Class 3a | Class 1 | Class 2 | Class 3 | Class 1 | Class 2 | Class 3 | Class 1a | Class 2 | Class 2a | Class 3 | Class 3a | |||||||||||||||||||||||||||||||||||||||||||||||||||||||||||||||||||
| Per unit operating performance (1) | ||||||||||||||||||||||||||||||||||||||||||||||||||||||||||||||||||||||||||||||||||||||||
| Net asset value, December 31, 2016 | $ | 116.43 | $ | 132.94 | $ | 123.27 | $ | 112.80 | $ | 128.78 | $ | 119.89 | $ | 92.78 | $ | 129.56 | $ | 105.67 | $ | 130.80 | $ | 107.50 | ||||||||||||||||||||||||||||||||||||||||||||||||||||||||||||||||||
| Net asset value, December 31, 2017 | $ | 116.41 | $ | 135.19 | $ | 125.68 | $ | 114.74 | $ | 133.27 | $ | 124.40 | $ | 81.35 | $ | 115.81 | $ | 93.59 | $ | 121.50 | $ | 97.99 | ||||||||||||||||||||||||||||||||||||||||||||||||||||||||||||||||||
| Net operating results: | ||||||||||||||||||||||||||||||||||||||||||||||||||||||||||||||||||||||||||||||||||||||||
| Interest income | 0.15 | 0.18 | 0.16 | 0.27 | 0.31 | 0.29 | 0.01 | 0.00 | 0.00 | 0.00 | 0.00 | 0.16 | 0.19 | 0.17 | 0.25 | 0.30 | 0.28 | 0.23 | 0.33 | 0.26 | 0.34 | 0.27 | ||||||||||||||||||||||||||||||||||||||||||||||||||||||||||||||||||
| Expenses | (2.09 | ) | (1.03 | ) | (0.96 | ) | (2.47 | ) | (2.10 | ) | (1.96 | ) | (1.34 | ) | (1.16 | ) | (0.96 | ) | (1.17 | ) | (0.97 | ) | (3.19 | ) | (3.72 | ) | (3.47 | ) | (5.44 | ) | (6.43 | ) | (5.97 | ) | (1.43 | ) | (2.06 | ) | (1.62 | ) | (2.15 | ) | (1.70 | ) | ||||||||||||||||||||||||||||||||||||||||||||
| Net gain/(loss) on investments, net of non-controlling interests | 4.82 | 4.66 | 4.40 | 2.50 | 2.67 | 2.56 | 3.55 | 4.77 | 4.77 | 5.24 | 5.45 | (8.91 | ) | (8.74 | ) | (7.92 | ) | (12.35 | ) | (12.75 | ) | (11.72 | ) | (13.96 | ) | (10.54 | ) | (15.08 | ) | (11.08 | ) | (15.62 | ) | |||||||||||||||||||||||||||||||||||||||||||||||||||||||
| Net income/(loss) | 2.88 | 3.80 | 3.61 | 0.30 | 0.87 | 0.89 | 2.22 | 3.61 | 3.81 | 4.07 | 4.48 | (11.95 | ) | (12.28 | ) | (11.21 | ) | (17.54 | ) | (18.88 | ) | (17.41 | ) | (15.16 | ) | (12.27 | ) | (16.44 | ) | (12.88 | ) | (17.05 | ) | |||||||||||||||||||||||||||||||||||||||||||||||||||||||
| Net asset value, March 31, 2017 | $ | 119.31 | $ | 136.74 | $ | 126.88 | $ | 113.10 | $ | 129.65 | $ | 120.78 | $ | 95.00 | $ | 133.17 | $ | 109.48 | $ | 134.87 | $ | 111.98 | ||||||||||||||||||||||||||||||||||||||||||||||||||||||||||||||||||
| Net asset value, September 30, 2018 | $ | 104.46 | $ | 122.91 | $ | 114.47 | $ | 97.20 | $ | 114.39 | $ | 106.99 | $ | 66.19 | $ | 103.54 | $ | 77.15 | $ | 108.62 | $ | 80.94 | ||||||||||||||||||||||||||||||||||||||||||||||||||||||||||||||||||
| Ratios to average net assets | ||||||||||||||||||||||||||||||||||||||||||||||||||||||||||||||||||||||||||||||||||||||||
| Net investment income/(loss) | -6.99 | % | -2.91 | % | -2.91 | % | -7.75 | % | -5.53 | % | -5.53 | % | -5.64 | % | -3.50 | % | -3.50 | % | -3.50 | % | -3.50 | % | -3.73 | % | -3.73 | % | -3.73 | % | -6.92 | % | -6.92 | % | -6.92 | % | -2.08 | % | -2.08 | % | -2.08 | % | -2.08 | % | -2.08 | % | ||||||||||||||||||||||||||||||||||||||||||||
| Expenses before incentive fees (3)(4) | 7.63 | % | 3.55 | % | 3.55 | % | 8.69 | % | 6.47 | % | 6.47 | % | 5.64 | % | 3.50 | % | 3.50 | % | 3.50 | % | 3.50 | % | 3.86 | % | 3.86 | % | 3.86 | % | 7.26 | % | 7.26 | % | 7.26 | % | 2.47 | % | 2.47 | % | 2.47 | % | 2.47 | % | 2.47 | % | ||||||||||||||||||||||||||||||||||||||||||||
| Expenses after incentive fees (3)(4) | 7.51 | % | 3.43 | % | 3.43 | % | 8.69 | % | 6.47 | % | 6.47 | % | 5.64 | % | 3.50 | % | 3.50 | % | 3.50 | % | 3.50 | % | 3.93 | % | 3.93 | % | 3.93 | % | 7.26 | % | 7.26 | % | 7.26 | % | 2.47 | % | 2.47 | % | 2.47 | % | 2.47 | % | 2.47 | % | ||||||||||||||||||||||||||||||||||||||||||||
| Total return before incentive fees (2) | 2.36 | % | 2.75 | % | 2.82 | % | 0.27 | % | 0.68 | % | 0.74 | % | 2.39 | % | 2.79 | % | 3.61 | % | 3.11 | % | 4.17 | % | -10.20 | % | -9.01 | % | -8.85 | % | -15.29 | % | -14.17 | % | -14.00 | % | -18.64 | % | -10.59 | % | -17.57 | % | -10.60 | % | -17.40 | % | ||||||||||||||||||||||||||||||||||||||||||||
| Total return after incentive fees (2) | 2.47 | % | 2.86 | % | 2.93 | % | 0.27 | % | 0.68 | % | 0.74 | % | 2.39 | % | 2.79 | % | 3.61 | % | 3.11 | % | 4.17 | % | -10.27 | % | -9.08 | % | -8.92 | % | -15.29 | % | -14.17 | % | -14.00 | % | -18.64 | % | -10.59 | % | -17.57 | % | -10.60 | % | -17.40 | % | ||||||||||||||||||||||||||||||||||||||||||||
| Frontier Balanced Fund | Frontier Select Fund | Frontier Balanced Fund | Frontier Select Fund | |||||||||||||||||||||||||||||||||||||||||||||||||||||||||||||||||||||||||||||||||||||
| Class 1 | Class 1AP | Class 2 | Class 2a | Class 3a | Class 1 | Class 1AP | Class 2 | Class 1 | Class 1AP | Class 2 | Class 2a | Class 3a | Class 1 | Class 1AP | Class 2 | |||||||||||||||||||||||||||||||||||||||||||||||||||||||||||||||||||||||||
| Per unit operating performance (1) | ||||||||||||||||||||||||||||||||||||||||||||||||||||||||||||||||||||||||||||||||||||||||
| Net asset value, December 31, 2016 | $ | 134.80 | $ | 144.97 | $ | 194.99 | $ | 169.05 | $ | 168.49 | $ | 94.06 | $ | 101.16 | $ | 134.25 | ||||||||||||||||||||||||||||||||||||||||||||||||||||||||||||||||||||||||
| Net asset value, December 31, 2017 | $ | 135.96 | $ | 150.56 | $ | 202.90 | $ | 175.77 | $ | 175.18 | $ | 90.27 | $ | 100.02 | $ | 132.73 | ||||||||||||||||||||||||||||||||||||||||||||||||||||||||||||||||||||||||
| Net operating results: | ||||||||||||||||||||||||||||||||||||||||||||||||||||||||||||||||||||||||||||||||||||||||
| Interest income | 0.00 | 0.00 | 0.00 | 0.00 | 0.00 | 0.00 | 0.00 | 0.00 | 0.10 | 0.11 | 0.15 | 0.13 | 0.13 | 0.00 | 0.00 | 0.00 | ||||||||||||||||||||||||||||||||||||||||||||||||||||||||||||||||||||||||
| Expenses | (1.96 | ) | (1.06 | ) | (1.43 | ) | (1.24 | ) | (1.23 | ) | (1.61 | ) | (1.01 | ) | (1.35 | ) | (6.82 | ) | (4.49 | ) | (6.06 | ) | (5.26 | ) | (5.24 | ) | (3.15 | ) | (1.56 | ) | (2.10 | ) | ||||||||||||||||||||||||||||||||||||||||||||||||||||||||
| Net gain/(loss) on investments, net of non-controlling interests | 4.97 | 5.38 | 7.24 | 6.35 | 6.33 | (2.57 | ) | (2.88 | ) | (3.70 | ) | (9.44 | ) | (10.55 | ) | (14.09 | ) | (12.16 | ) | (12.13 | ) | (11.71 | ) | (13.01 | ) | (17.22 | ) | |||||||||||||||||||||||||||||||||||||||||||||||||||||||||||||
| Net income/(loss) | 3.01 | 4.32 | 5.82 | 5.12 | 5.10 | (4.18 | ) | (3.89 | ) | (5.05 | ) | (16.15 | ) | (14.93 | ) | (20.00 | ) | (17.29 | ) | (17.24 | ) | (14.86 | ) | (14.57 | ) | (19.32 | ) | |||||||||||||||||||||||||||||||||||||||||||||||||||||||||||||
| Net asset value, March 31, 2017 | $ | 137.81 | $ | 149.29 | $ | 200.81 | $ | 174.17 | $ | 173.59 | $ | 89.88 | $ | 97.27 | $ | 129.20 | ||||||||||||||||||||||||||||||||||||||||||||||||||||||||||||||||||||||||
| Net asset value, September 30, 2018 | $ | 119.81 | $ | 135.63 | $ | 182.90 | $ | 158.48 | $ | 157.94 | $ | 75.41 | $ | 85.45 | $ | 113.41 | ||||||||||||||||||||||||||||||||||||||||||||||||||||||||||||||||||||||||
| �� | ||||||||||||||||||||||||||||||||||||||||||||||||||||||||||||||||||||||||||||||||||||||||
| Ratios to average net assets | ||||||||||||||||||||||||||||||||||||||||||||||||||||||||||||||||||||||||||||||||||||||||
| Net investment income/(loss) | -5.86 | % | -2.93 | % | -2.93 | % | -2.93 | % | -2.93 | % | -7.05 | % | -4.12 | % | -4.12 | % | -7.05 | % | -4.05 | % | -4.05 | % | -4.05 | % | -4.05 | % | -5.37 | % | -2.37 | % | -2.37 | % | ||||||||||||||||||||||||||||||||||||||||||||||||||||||||
| Expenses before incentive fees (3)(4) | 5.87 | % | 2.93 | % | 2.93 | % | 2.93 | % | 2.93 | % | 7.05 | % | 4.12 | % | 4.12 | % | 6.81 | % | 3.81 | % | 3.81 | % | 3.81 | % | 3.81 | % | 5.37 | % | 2.37 | % | 2.37 | % | ||||||||||||||||||||||||||||||||||||||||||||||||||||||||
| Expenses after incentive fees (3)(4) | 5.87 | % | 2.93 | % | 2.93 | % | 2.93 | % | 2.93 | % | 7.05 | % | 4.12 | % | 4.12 | % | 7.17 | % | 4.17 | % | 4.17 | % | 4.17 | % | 4.17 | % | 5.37 | % | 2.37 | % | 2.37 | % | ||||||||||||||||||||||||||||||||||||||||||||||||||||||||
| Total return before incentive fees (2) | 2.23 | % | 2.98 | % | 2.98 | % | 3.03 | % | 3.03 | % | -4.44 | % | -3.85 | % | -3.76 | % | -11.52 | % | -9.55 | % | -9.50 | % | -9.48 | % | -9.48 | % | -16.46 | % | -14.57 | % | -14.56 | % | ||||||||||||||||||||||||||||||||||||||||||||||||||||||||
| Total return after incentive fees (2) | 2.23 | % | 2.98 | % | 2.98 | % | 3.03 | % | 3.03 | % | -4.44 | % | -3.85 | % | -3.76 | % | -11.88 | % | -9.92 | % | -9.86 | % | -9.84 | % | -9.84 | % | -16.46 | % | -14.57 | % | -14.56 | % | ||||||||||||||||||||||||||||||||||||||||||||||||||||||||
| Frontier Winton Fund | Frontier Heritage Fund | Frontier Winton Fund | Frontier Heritage Fund | |||||||||||||||||||||||||||||||||||||||||||||||||||||||||||||||||||||||||||||||||||||
| Class 1 | Class 1AP | Class 2 | Class 1 | Class 1AP | Class 2 | Class 1 | Class 1AP | Class 2 | Class 1 | Class 1AP | Class 2 | |||||||||||||||||||||||||||||||||||||||||||||||||||||||||||||||||||||||||||||
| Per unit operating performance (1) | ||||||||||||||||||||||||||||||||||||||||||||||||||||||||||||||||||||||||||||||||||||||||
| Net asset value, December 31, 2016 | $ | 154.51 | $ | 166.17 | $ | 210.98 | $ | 119.58 | $ | 128.60 | $ | 172.10 | ||||||||||||||||||||||||||||||||||||||||||||||||||||||||||||||||||||||||||||
| Net asset value, December 31, 2017 | $ | 159.08 | $ | 176.44 | $ | 216.50 | $ | 121.19 | $ | 134.28 | $ | 179.70 | ||||||||||||||||||||||||||||||||||||||||||||||||||||||||||||||||||||||||||||
| Net operating results: | ||||||||||||||||||||||||||||||||||||||||||||||||||||||||||||||||||||||||||||||||||||||||
| Interest income | 0.00 | 0.00 | 0.00 | 0.00 | 0.00 | 0.00 | 0.00 | 0.00 | 0.00 | 0.00 | 0.00 | 0.00 | ||||||||||||||||||||||||||||||||||||||||||||||||||||||||||||||||||||||||||||
| Expenses | (3.06 | ) | (2.11 | ) | (2.68 | ) | (2.22 | ) | (1.48 | ) | (1.97 | ) | (10.70 | ) | (8.20 | ) | (10.43 | ) | (6.79 | ) | (5.00 | ) | (6.56 | ) | ||||||||||||||||||||||||||||||||||||||||||||||||||||||||||||||||
| Net gain/(loss) on investments, net of non-controlling interests | 1.48 | 1.20 | 2.00 | (2.14 | ) | (1.48 | ) | (3.11 | ) | (2.36 | ) | (2.73 | ) | 0.13 | (13.31 | ) | (14.70 | ) | (19.83 | ) | ||||||||||||||||||||||||||||||||||||||||||||||||||||||||||||||||||||
| Net income/(loss) | (1.58 | ) | (0.91 | ) | (0.68 | ) | (4.36 | ) | (2.96 | ) | (5.08 | ) | (13.06 | ) | (10.93 | ) | (10.30 | ) | (20.10 | ) | (19.70 | ) | (26.39 | ) | ||||||||||||||||||||||||||||||||||||||||||||||||||||||||||||||||
| Net asset value, March 31, 2017 | $ | 152.93 | $ | 165.26 | $ | 210.30 | $ | 115.22 | $ | 125.64 | $ | 167.02 | ||||||||||||||||||||||||||||||||||||||||||||||||||||||||||||||||||||||||||||
| Net asset value, September 30, 2018 | $ | 146.02 | $ | 165.51 | $ | 206.20 | $ | 101.09 | $ | 114.58 | $ | 153.31 | ||||||||||||||||||||||||||||||||||||||||||||||||||||||||||||||||||||||||||||
| Ratios to average net assets | ||||||||||||||||||||||||||||||||||||||||||||||||||||||||||||||||||||||||||||||||||||||||
| Net investment income/(loss) | -8.56 | % | -5.64 | % | -5.64 | % | -7.77 | % | -4.84 | % | -4.84 | % | -9.52 | % | -6.52 | % | -6.52 | % | -8.46 | % | -5.47 | % | -5.47 | % | ||||||||||||||||||||||||||||||||||||||||||||||||||||||||||||||||
| Expenses before incentive fees (3)(4) | 8.72 | % | 5.80 | % | 5.80 | % | 7.81 | % | 4.88 | % | 4.88 | % | 9.52 | % | 6.52 | % | 6.52 | % | 8.44 | % | 5.44 | % | 5.44 | % | ||||||||||||||||||||||||||||||||||||||||||||||||||||||||||||||||
| Expenses after incentive fees (3)(4) | 8.56 | % | 5.64 | % | 5.64 | % | 7.77 | % | 4.84 | % | 4.84 | % | 9.52 | % | 6.52 | % | 6.52 | % | 8.46 | % | 5.47 | % | 5.47 | % | ||||||||||||||||||||||||||||||||||||||||||||||||||||||||||||||||
| Total return before incentive fees (2) | -1.18 | % | -0.71 | % | -0.48 | % | -3.69 | % | -2.35 | % | -3.00 | % | -8.21 | % | -6.19 | % | -4.76 | % | -16.56 | % | -14.64 | % | -14.66 | % | ||||||||||||||||||||||||||||||||||||||||||||||||||||||||||||||||
| Total return after incentive fees (2) | -1.02 | % | -0.55 | % | -0.32 | % | -3.65 | % | -2.30 | % | -2.95 | % | -8.21 | % | -6.19 | % | -4.76 | % | -16.59 | % | -14.67 | % | -14.69 | % | ||||||||||||||||||||||||||||||||||||||||||||||||||||||||||||||||
| (1) | Interest income and expenses per unit are calculated by dividing these amounts by the average number of units outstanding during the period. The net gain/(loss) on investments, net of non-controlling interests is a balancing amount necessary to reconcile the change in net asset value per unit with the other per unit information. |
| (2) | Impact of incentive fee computed using average net assets, otherwise computed using average units outstanding during the period prior to the effects of any non-controlling transactions. An owner’s total returns may vary from the above returns based on the timing of contributions and withdrawals. Total returns are not annualized. |
| (3) | Expense ratios do not reflect interest allocated to the Managing Owner as such expenses are not included in the Statements of Operations of the Series, see footnote 6. |
| (4) | Expense ratios do not include mangement and incentive fees at the Galaxy Plus entities. The ratios would have been higher had those expenses been included. The impact of those fees are included in the total return. |
53
| Frontier Diversified Fund | Frontier Masters Fund | Frontier Long/Short Commodity Fund | ||||||||||||||||||||||||||||||||||||||||||
| Class 1 | Class 2 | Class 3 | Class 1 | Class 2 | Class 3 | Class 1a | Class 2 | Class 2a | Class 3 | Class 3a | ||||||||||||||||||||||||||||||||||
| Per unit operating performance (1) | ||||||||||||||||||||||||||||||||||||||||||||
| Net asset value, June 30, 2017 | $ | 111.73 | $ | 128.62 | $ | 119.42 | $ | 102.39 | $ | 117.90 | $ | 109.90 | $ | 83.63 | $ | 116.35 | $ | 95.39 | $ | 122.06 | $ | 99.76 | ||||||||||||||||||||||
| Net operating results: | ||||||||||||||||||||||||||||||||||||||||||||
| Interest income | 0.01 | 0.01 | 0.01 | 0.11 | 0.12 | 0.11 | 0.00 | 0.00 | 0.00 | 0.00 | 0.00 | |||||||||||||||||||||||||||||||||
| Expenses | (1.86 | ) | (1.22 | ) | (1.13 | ) | (2.03 | ) | (1.65 | ) | (1.54 | ) | (1.16 | ) | (0.87 | ) | (0.72 | ) | (0.91 | ) | (0.75 | ) | ||||||||||||||||||||||
| Net gain/(loss) on investments, net of non-controlling interests | 0.22 | (0.11 | ) | (0.03 | ) | (1.06 | ) | (1.42 | ) | (1.24 | ) | 0.79 | 0.84 | 0.69 | 0.89 | 0.78 | ||||||||||||||||||||||||||||
| Net income/(loss) | (1.63 | ) | (1.32 | ) | (1.15 | ) | (2.98 | ) | (2.95 | ) | (2.67 | ) | (0.37 | ) | (0.03 | ) | (0.03 | ) | (0.02 | ) | 0.03 | |||||||||||||||||||||||
| Net asset value, September 30, 2017 | $ | 110.10 | $ | 127.30 | $ | 118.27 | $ | 99.41 | $ | 114.95 | $ | 107.23 | $ | 83.26 | $ | 116.32 | $ | 95.36 | $ | 122.04 | $ | 99.79 | ||||||||||||||||||||||
| Ratios to average net assets (3) | ||||||||||||||||||||||||||||||||||||||||||||
| Net investment income/(loss) | -6.50 | % | -3.69 | % | -3.69 | % | -7.26 | % | -4.99 | % | -4.99 | % | -5.31 | % | -2.87 | % | -2.87 | % | -2.87 | % | -2.87 | % | ||||||||||||||||||||||
| Expenses before incentive fees (rebate) (4)(5) | 6.52 | % | 3.72 | % | 3.72 | % | 7.66 | % | 5.39 | % | 5.39 | % | 5.31 | % | 2.87 | % | 2.87 | % | 2.87 | % | 2.87 | % | ||||||||||||||||||||||
| Expenses after incentive fees (rebate) (4)(5) | 6.52 | % | 3.72 | % | 3.72 | % | 7.66 | % | 5.39 | % | 5.39 | % | 5.31 | % | 2.87 | % | 2.87 | % | 2.87 | % | 2.87 | % | ||||||||||||||||||||||
| Total return before incentive fees (rebate) (2) | -1.46 | % | -1.03 | % | -0.96 | % | -2.91 | % | -2.50 | % | -2.43 | % | -0.44 | % | -0.03 | % | -0.03 | % | -0.02 | % | 0.03 | % | ||||||||||||||||||||||
| Total return after incentive fees (rebate) (2) | -1.46 | % | -1.03 | % | -0.96 | % | -2.91 | % | -2.50 | % | -2.43 | % | -0.44 | % | -0.03 | % | -0.03 | % | -0.02 | % | 0.03 | % | ||||||||||||||||||||||
| Frontier Balanced Fund | Frontier Select Fund | |||||||||||||||||||||||||||||||||||||||||||
| Class 1 | Class 1AP | Class 2 | Class 2a | Class 3a | Class 1 | Class 1AP | Class 2 | |||||||||||||||||||||||||||||||||||||
| Per unit operating performance (1) | ||||||||||||||||||||||||||||||||||||||||||||
| Net asset value, June 30, 2017 | $ | 129.84 | $ | 141.71 | $ | 190.62 | $ | 165.77 | $ | 165.22 | $ | 78.79 | $ | 85.90 | $ | 114.11 | ||||||||||||||||||||||||||||
| Net operating results: | ||||||||||||||||||||||||||||||||||||||||||||
| Interest income | 0.02 | 0.02 | 0.03 | 0.03 | 0.03 | 0.00 | 0.00 | 0.00 | ||||||||||||||||||||||||||||||||||||
| Expenses | (2.20 | ) | (1.32 | ) | (1.77 | ) | (1.54 | ) | (1.54 | ) | (1.07 | ) | (0.50 | ) | (0.66 | ) | ||||||||||||||||||||||||||||
| Net gain/(loss) on investments, net of non-controlling interests | 0.54 | 0.57 | 0.76 | 0.72 | 0.71 | (3.26 | ) | (3.52 | ) | (4.79 | ) | |||||||||||||||||||||||||||||||||
| Net income/(loss) | (1.64 | ) | (0.73 | ) | (0.98 | ) | (0.79 | ) | (0.80 | ) | (4.33 | ) | (4.02 | ) | (5.45 | ) | ||||||||||||||||||||||||||||
| Net asset value, September 30, 2017 | $ | 128.20 | $ | 140.98 | $ | 189.64 | $ | 164.98 | $ | 164.42 | $ | 74.46 | $ | 81.88 | $ | 108.66 | ||||||||||||||||||||||||||||
| Ratios to average net assets (3) | ||||||||||||||||||||||||||||||||||||||||||||
| Net investment income/(loss) | -6.57 | % | -3.57 | % | -3.57 | % | -3.57 | % | -3.57 | % | -5.24 | % | -2.24 | % | -2.24 | % | ||||||||||||||||||||||||||||
| Expenses before incentive fees (rebate) (4)(5) | 6.63 | % | 3.63 | % | 3.63 | % | 3.63 | % | 3.63 | % | 5.24 | % | 2.24 | % | 2.24 | % | ||||||||||||||||||||||||||||
| Expenses after incentive fees (rebate) (4)(5) | 6.63 | % | 3.63 | % | 3.63 | % | 3.63 | % | 3.63 | % | 5.24 | % | 2.24 | % | 2.24 | % | ||||||||||||||||||||||||||||
| Total return before incentive fees (rebate) (2) | -1.26 | % | -0.52 | % | -0.51 | % | -0.48 | % | -0.48 | % | -5.50 | % | -4.68 | % | -4.78 | % | ||||||||||||||||||||||||||||
| Total return after incentive fees (rebate) (2) | -1.26 | % | -0.52 | % | -0.51 | % | -0.48 | % | -0.48 | % | -5.50 | % | -4.68 | % | -4.78 | % | ||||||||||||||||||||||||||||
| Frontier Winton Fund | Frontier Heritage Fund | |||||||||||||||||||||||||||||||||||||||||||
| Class 1 | Class 1AP | Class 2 | Class 1 | Class 1AP | Class 2 | |||||||||||||||||||||||||||||||||||||||
| Per unit operating performance (1) | ||||||||||||||||||||||||||||||||||||||||||||
| Net asset value, June 30, 2017 | $ | 144.09 | $ | 157.26 | $ | 199.66 | $ | 108.98 | $ | 118.94 | $ | 159.18 | ||||||||||||||||||||||||||||||||
| Net operating results: | ||||||||||||||||||||||||||||||||||||||||||||
| Interest income | 0.12 | 0.13 | 0.17 | 0.00 | 0.00 | 0.00 | ||||||||||||||||||||||||||||||||||||||
| Expenses | (3.18 | ) | (2.28 | ) | (2.90 | ) | (2.23 | ) | (1.53 | ) | (2.05 | ) | ||||||||||||||||||||||||||||||||
| Net gain/(loss) on investments, net of non-controlling interests | 1.27 | 1.39 | 1.77 | (0.76 | ) | (0.86 | ) | (1.16 | ) | |||||||||||||||||||||||||||||||||||
| Net income/(loss) | (1.79 | ) | (0.76 | ) | (0.96 | ) | (2.99 | ) | (2.39 | ) | (3.21 | ) | ||||||||||||||||||||||||||||||||
| Net asset value, September 30, 2017 | $ | 142.30 | $ | 156.50 | $ | 198.70 | $ | 105.99 | $ | 116.55 | $ | 155.97 | ||||||||||||||||||||||||||||||||
| Ratios to average net assets (3) | ||||||||||||||||||||||||||||||||||||||||||||
| Net investment income/(loss) | -8.38 | % | -5.38 | % | -5.38 | % | -8.02 | % | -5.02 | % | -5.02 | % | ||||||||||||||||||||||||||||||||
| Expenses before incentive fees (rebate) (4)(5) | 8.71 | % | 5.71 | % | 5.71 | % | 8.02 | % | 5.02 | % | 5.02 | % | ||||||||||||||||||||||||||||||||
| Expenses after incentive fees (rebate) (4)(5) | 8.71 | % | 5.71 | % | 5.71 | % | 8.02 | % | 5.02 | % | 5.02 | % | ||||||||||||||||||||||||||||||||
| Total return before incentive fees (rebate) (2) | -1.24 | % | -0.48 | % | -0.48 | % | -2.74 | % | -2.01 | % | -2.02 | % | ||||||||||||||||||||||||||||||||
| Total return after incentive fees (rebate) (2) | -1.24 | % | -0.48 | % | -0.48 | % | -2.74 | % | -2.01 | % | -2.02 | % | ||||||||||||||||||||||||||||||||
| (1) | Interest income and expenses per unit are calculated by dividing these amounts by the average number of units outstanding during the period. The net gain/(loss) on investments, net of non-controlling interests is a balancing amount necessary to reconcile the change in net asset value per unit with the other per unit information. |
| (2) | Impact of incentive fee computed using average net assets, otherwise computed using average units outstanding during the period prior to the effects of any non-controlling transactions. An owner’s total returns may vary from the above returns based on the timing of contributions and withdrawals. Total returns are not annualized. |
| (3) | Annualized with the exception of incentive fees. |
| (4) | Expense ratios do not reflect interest allocated to the Managing Owner as such expenses are not included in the Statements of Operations of the Series, refer to Note 6 of the Financial Statements. |
| (5) | Expense ratios do not include management and incentive fees at the Galaxy Plus entities. The ratios would have been higher had those expenses been included. The impact of those fees are included in the total return. |
4554
| Frontier Diversified Fund | Frontier Masters Fund | Frontier Long/Short Commodity Fund | ||||||||||||||||||||||||||||||||||||||||||
| Class 1 | Class 2 | Class 3 | Class 1 | Class 2 | Class 3 | Class 1a | Class 2 | Class 2a | Class 3 | Class 3a | ||||||||||||||||||||||||||||||||||
| Per unit operating performance (1) | ||||||||||||||||||||||||||||||||||||||||||||
| Net asset value, December 31, 2016 | $ | 116.43 | $ | 132.94 | $ | 123.27 | $ | 112.80 | $ | 128.78 | $ | 119.89 | $ | 92.78 | $ | 129.56 | $ | 105.67 | $ | 130.80 | $ | 107.50 | ||||||||||||||||||||||
| Net operating results: | ||||||||||||||||||||||||||||||||||||||||||||
| Interest income | 0.27 | 0.30 | 0.28 | 0.53 | 0.61 | 0.56 | 0.01 | 0.00 | 0.00 | 0.00 | 0.00 | |||||||||||||||||||||||||||||||||
| Expenses | (6.36 | ) | (3.56 | ) | (3.28 | ) | (6.82 | ) | (5.69 | ) | (5.27 | ) | (3.15 | ) | (2.19 | ) | (1.79 | ) | (2.22 | ) | (1.82 | ) | ||||||||||||||||||||||
| Net gain/(loss) on investments, net of non-controlling interests | (0.24 | ) | (2.38 | ) | (2.00 | ) | (7.10 | ) | (8.75 | ) | (7.95 | ) | (6.38 | ) | (11.05 | ) | (8.52 | ) | (6.54 | ) | (5.89 | ) | ||||||||||||||||||||||
| Net income/(loss) | (6.33 | ) | (5.64 | ) | (5.00 | ) | (13.39 | ) | (13.83 | ) | (12.66 | ) | (9.52 | ) | (13.24 | ) | (10.31 | ) | (8.76 | ) | (7.71 | ) | ||||||||||||||||||||||
| Net asset value, September 30, 2017 | $ | 110.10 | $ | 127.30 | $ | 118.27 | $ | 99.41 | $ | 114.95 | $ | 107.23 | $ | 83.26 | $ | 116.32 | $ | 95.36 | $ | 122.04 | $ | 99.79 | ||||||||||||||||||||||
| Ratios to average net assets (3) | ||||||||||||||||||||||||||||||||||||||||||||
| Net investment income/(loss) | -7.02 | % | -3.26 | % | -3.26 | % | -7.59 | % | -5.33 | % | -5.33 | % | -4.92 | % | -2.70 | % | -2.70 | % | -2.70 | % | -2.70 | % | ||||||||||||||||||||||
| Expenses before incentive fees (rebate) (4)(5) | 7.46 | % | 3.70 | % | 3.70 | % | 8.23 | % | 5.97 | % | 5.97 | % | 6.17 | % | 3.95 | % | 3.95 | % | 3.95 | % | 3.95 | % | ||||||||||||||||||||||
| Expenses after incentive fees (rebate) (4)(5) | 7.32 | % | 3.56 | % | 3.56 | % | 8.23 | % | 5.97 | % | 5.97 | % | 4.92 | % | 2.70 | % | 2.70 | % | 2.70 | % | 2.70 | % | ||||||||||||||||||||||
| Total return before incentive fees (rebate) (2) | -5.58 | % | -4.39 | % | -4.20 | % | -11.87 | % | -10.74 | % | -10.56 | % | -11.52 | % | -11.47 | % | -11.01 | % | -7.95 | % | -8.43 | % | ||||||||||||||||||||||
| Total return after incentive fees (rebate) (2) | -5.44 | % | -4.24 | % | -4.06 | % | -11.87 | % | -10.74 | % | -10.56 | % | -10.26 | % | -10.22 | % | -9.76 | % | -6.70 | % | -7.17 | % | ||||||||||||||||||||||
| Frontier Balanced Fund | Frontier Select Fund | |||||||||||||||||||||||||||||||||||||||||||
| Class 1 | Class 1AP | Class 2 | Class 2a | Class 3a | Class 1 | Class 1AP | Class 2 | |||||||||||||||||||||||||||||||||||||
| Per unit operating performance (1) | ||||||||||||||||||||||||||||||||||||||||||||
| Net asset value, December 31, 2016 | $ | 134.80 | $ | 144.97 | $ | 194.99 | $ | 169.05 | $ | 168.49 | $ | 94.06 | $ | 101.16 | $ | 134.25 | ||||||||||||||||||||||||||||
| Net operating results: | ||||||||||||||||||||||||||||||||||||||||||||
| Interest income | 0.02 | 0.02 | 0.03 | 0.02 | 0.02 | 0.00 | 0.00 | 0.00 | ||||||||||||||||||||||||||||||||||||
| Expenses | (6.75 | ) | (4.06 | ) | (5.49 | ) | (4.75 | ) | (4.73 | ) | (4.24 | ) | (2.49 | ) | (3.32 | ) | ||||||||||||||||||||||||||||
| Net gain/(loss) on investments, net of non-controlling interests | 0.13 | 0.05 | 0.11 | 0.66 | 0.64 | (15.36 | ) | (16.79 | ) | (22.27 | ) | |||||||||||||||||||||||||||||||||
| Net income/(loss) | (6.60 | ) | (3.99 | ) | (5.35 | ) | (4.07 | ) | (4.07 | ) | (19.60 | ) | (19.28 | ) | (25.59 | ) | ||||||||||||||||||||||||||||
| Net asset value, September 30, 2017 | $ | 128.20 | $ | 140.98 | $ | 189.64 | $ | 164.98 | $ | 164.42 | $ | 74.46 | $ | 81.88 | $ | 108.66 | ||||||||||||||||||||||||||||
| Ratios to average net assets (3) | ||||||||||||||||||||||||||||||||||||||||||||
| Net investment income/(loss) | -6.66 | % | -3.68 | % | -3.68 | % | -3.68 | % | -3.68 | % | -6.51 | % | -3.54 | % | -3.54 | % | ||||||||||||||||||||||||||||
| Expenses before incentive fees (rebate) (4)(5) | 6.68 | % | 3.70 | % | 3.70 | % | 3.70 | % | 3.70 | % | 6.51 | % | 3.54 | % | 3.54 | % | ||||||||||||||||||||||||||||
| Expenses after incentive fees (rebate) (4)(5) | 6.68 | % | 3.70 | % | 3.70 | % | 3.70 | % | 3.70 | % | 6.51 | % | 3.54 | % | 3.54 | % | ||||||||||||||||||||||||||||
| Total return before incentive fees (rebate) (2) | -4.90 | % | -2.75 | % | -2.74 | % | -2.41 | % | -2.42 | % | -20.84 | % | -19.06 | % | -19.06 | % | ||||||||||||||||||||||||||||
| Total return after incentive fees (rebate) (2) | -4.90 | % | -2.75 | % | -2.74 | % | -2.41 | % | -2.42 | % | -20.84 | % | -19.06 | % | -19.06 | % | ||||||||||||||||||||||||||||
| Frontier Winton Fund | Frontier Heritage Fund | |||||||||||||||||||||||||||||||||||||||||||
| Class 1 | Class 1AP | Class 2 | Class 1 | Class 1AP | Class 2 | |||||||||||||||||||||||||||||||||||||||
| Per unit operating performance (1) | ||||||||||||||||||||||||||||||||||||||||||||
| Net asset value, December 31, 2016 | $ | 154.51 | $ | 166.17 | $ | 210.98 | $ | 119.58 | $ | 128.60 | $ | 172.10 | ||||||||||||||||||||||||||||||||
| Net operating results: | ||||||||||||||||||||||||||||||||||||||||||||
| Interest income | 0.11 | 0.12 | 0.15 | 0.00 | 0.00 | 0.00 | ||||||||||||||||||||||||||||||||||||||
| Expenses | (9.63 | ) | (6.83 | ) | (8.66 | ) | (6.81 | ) | (4.62 | ) | (6.24 | ) | ||||||||||||||||||||||||||||||||
| Net gain/(loss) on investments, net of non-controlling interests | (2.69 | ) | (2.96 | ) | (3.77 | ) | (6.78 | ) | (7.43 | ) | (9.89 | ) | ||||||||||||||||||||||||||||||||
| Net income/(loss) | (12.21 | ) | (9.67 | ) | (12.28 | ) | (13.59 | ) | (12.05 | ) | (16.13 | ) | ||||||||||||||||||||||||||||||||
| Net asset value, September 30, 2017 | $ | 142.30 | $ | 156.50 | $ | 198.70 | $ | 105.99 | $ | 116.55 | $ | 155.97 | ||||||||||||||||||||||||||||||||
| Ratios to average net assets (3) | ||||||||||||||||||||||||||||||||||||||||||||
| Net investment income/(loss) | -8.55 | % | -5.58 | % | -5.58 | % | -7.98 | % | -5.01 | % | -5.01 | % | ||||||||||||||||||||||||||||||||
| Expenses before incentive fees (rebate) (4)(5) | 8.83 | % | 5.85 | % | 5.85 | % | 8.04 | % | 5.06 | % | 5.06 | % | ||||||||||||||||||||||||||||||||
| Expenses after incentive fees (rebate) (4)(5) | 8.65 | % | 5.67 | % | 5.67 | % | 7.98 | % | 5.01 | % | 5.01 | % | ||||||||||||||||||||||||||||||||
| Total return before incentive fees (rebate) (2) | -8.08 | % | -6.00 | % | -6.00 | % | -11.42 | % | -9.43 | % | -9.43 | % | ||||||||||||||||||||||||||||||||
| Total return after incentive fees (rebate) (2) | -7.90 | % | -5.82 | % | -5.82 | % | -11.36 | % | -9.37 | % | -9.37 | % | ||||||||||||||||||||||||||||||||
| (2) | Impact of incentive fee computed using average net assets, otherwise computed using average units outstanding during the period prior to the effects of any non-controlling transactions. An owner’s total returns may vary from the above returns based on the timing of contributions and withdrawals. Total returns are not annualized. |
| (3) | Annualized with the exception of incentive fees. |
| (4) | Expense ratios do not reflect interest allocated to the Managing Owner as such expenses are not included in the Statements of Operations of the Series, refer to Note 6 of the Financial Statements. |
| (5) | Expense ratios do not include management and incentive fees at the Galaxy Plus entities. The ratios would have been higher had those expenses been included. The impact of those fees are included in the total return. |
55
8. Derivative Instruments and Hedging Activities
The Series’ primary business is to engage in speculative trading of a diversified portfolio of futures, forwards (including interbank foreign currencies)Currencies), options contracts and other derivative instruments (including swap contracts). The Series do not enter into or hold positions for hedging purposes as defined under ASC 815,Derivatives and Hedging (“ASC 815”). The detail of the fair value of the Series’ derivatives by instrument types as of March 31,September 30, 2018 and December 31, 2017 is included in the Condensed Schedules of Investments. See Note 4 for further disclosure related to each Series’ position in swap contracts.
56
The following tables summarize the monthly averages of forwards, options and futures contracts bought and sold for each respective Series of the Trust:
For the Three Months Ended March 31, 2018
| For the Three Months Ended September 30, 2018 | ||||||||
| Monthly average contracts | ||||||||
| Bought | Sold | |||||||
| Frontier Balanced Fund | 231 | 231 | ||||||
Monthly average contracts
| For the Three Months Ended September 30, 2017 | ||||||||
| Monthly average contracts | ||||||||
| Bought | Sold | |||||||
| Frontier Balanced Fund | 567 | 459 | ||||||
| Frontier Winton Fund | 1,849 | 1,477 | ||||||
| Bought | Sold | |||||||
| Frontier Balanced Fund | 1,348 | 1,217 | ||||||
| For the Nine Months Ended September 30, 2018 | ||||||||
| Monthly average contracts | ||||||||
| Bought | Sold | |||||||
| Frontier Balanced Fund | 1,753 | 1,749 | ||||||
For the Three Months Ended March 31, 2017
Monthly average contracts
| For the Nine Months Ended September 30, 2017 | ||||||||||||||||
| Monthly average contracts | ||||||||||||||||
| Bought | Sold | Bought | Sold | |||||||||||||
| Frontier Balanced Fund | 1,465 | 1,410 | 1,195 | 1,121 | ||||||||||||
| Frontier Select Fund | 4,859 | 4,745 | 4,690 | 4,675 | ||||||||||||
| Frontier Winton Fund | 2,195 | 2,156 | 2,168 | 1,978 | ||||||||||||
4657
The following tables summarize the trading revenues for the three and nine months ended March 31,September 30, 2018 and 2017 by sector:
| Realized Trading Revenue from Futures, Forwards and Options |
| for the Three Months Ended |
| Frontier Balanced | Frontier Balanced | |||||||
| Type of contract | Fund | Fund | ||||||
| Metals | $ | (59,526 | ) | $ | 122,534 | |||
| Currencies | 17,651 | 8,349 | ||||||
| Energies | 48,325 | (18,352 | ) | |||||
| Agriculturals | 28,070 | (26,065 | ) | |||||
| Interest rates | (86,844 | ) | (64,465 | ) | ||||
| Stock indices | 26,652 | (8,877 | ) | |||||
| Realized trading income/(loss)(1) | $ | (25,672 | ) | $ | 13,124 | |||
| Realized Trading Revenue from Futures, Forwards and Options |
| for the Three Months Ended |
| Frontier Balanced | Frontier Select | Frontier Winton | Frontier Balanced | Frontier Winton | ||||||||||||||||
| Type of contract | Fund | Fund | Fund | Fund | Fund | |||||||||||||||
| Metals | $ | (14,488 | ) | $ | 2,832 | $ | (702,474 | ) | $ | (35,090 | ) | $ | (380,449 | ) | ||||||
| Currencies | (175,009 | ) | 247,514 | (8,427 | ) | 418,961 | 274,057 | |||||||||||||
| Energies | (25,993 | ) | (192,655 | ) | (597,930 | ) | (37,022 | ) | (434,257 | ) | ||||||||||
| Agriculturals | (189,510 | ) | (315,584 | ) | (97,479 | ) | (255,648 | ) | (307,146 | ) | ||||||||||
| Interest rates | (187,068 | ) | (520,324 | ) | (120,095 | ) | 26,520 | (125,819 | ) | |||||||||||
| Stock indices | 215,957 | 951,177 | 3,833,740 | (35,713 | ) | 697,405 | ||||||||||||||
| Realized trading income/(loss)(1) | $ | (376,111 | ) | $ | 172,961 | $ | 2,307,335 | $ | 82,008 | $ | (276,209 | ) | ||||||||
| (1) | Amounts recorded in the Statements of Operations under Net realized gain/(loss) on futures, forwards, and options |
| Unrealized Trading Revenue from Futures, Forwards and Options |
| for the Three Months Ended |
| Frontier Balanced | Frontier Balanced | |||||||
| Type of contract | Fund | Fund | ||||||
| Metals | $ | 13,694 | $ | (10,838 | ) | |||
| Currencies | (41,931 | ) | (83,636 | ) | ||||
| Energies | (44,022 | ) | 6,294 | |||||
| Agriculturals | 41,234 | 38,061 | ||||||
| Interest rates | 148,669 | (24,837 | ) | |||||
| Stock indices | (7,379 | ) | 11,426 | |||||
| Change in unrealized trading income/(loss)(1) | $ | 110,265 | ||||||
| Change in unrealized trading income/(loss)(1) | $ | (63,530 | ) | |||||
| Unrealized Trading Revenue from Futures, Forwards and Options |
| for the Three Months Ended |
| Frontier Balanced | Frontier Select | Frontier Winton | Frontier Balanced | Frontier Winton | ||||||||||||||||
| Type of contract | Fund | Fund | Fund | Fund | Fund | |||||||||||||||
| Metals | $ | (32,743 | ) | $ | (198,411 | ) | $ | (490,237 | ) | $ | 41,418 | $ | (5,368 | ) | ||||||
| Currencies | (565,832 | ) | 146,018 | (162,275 | ) | (257,141 | ) | (221,054 | ) | |||||||||||
| Energies | 247,539 | (639,356 | ) | (125,218 | ) | 8,412 | 204,615 | |||||||||||||
| Agriculturals | 37,881 | 10,560 | (188,079 | ) | 59,883 | 204,560 | ||||||||||||||
| Interest rates | 281,778 | 475,301 | 1,226,766 | 31,989 | (179,186 | ) | ||||||||||||||
| Stock indices | 13,737 | 201,538 | (184,803 | ) | 31,400 | 771,765 | ||||||||||||||
| Change in unrealized trading income/(loss)(1) | $ | (17,640 | ) | $ | (4,350 | ) | $ | 76,154 | $ | (84,039 | ) | $ | 775,332 | |||||||
| (1) | Amounts recorded in the Statements of Operations under Net change in open trade equity/(deficit) |
4758
| Realized Trading Revenue from Futures, Forwards and Options |
| for the Nine Months Ended September 30, 2018 |
| Frontier Balanced | ||||
| Type of contract | Fund | |||
| Metals | $ | 16,990 | ||
| Currencies | (190,681 | ) | ||
| Energies | 42,905 | |||
| Agriculturals | 24,718 | |||
| Interest rates | (161,677 | ) | ||
| Stock indices | (2,467 | ) | ||
| Realized trading income/(loss)(1) | $ | (270,212 | ) | |
| Realized Trading Revenue from Futures, Forwards and Options |
| for the Nine Months Ended September 30, 2017 |
| Frontier Balanced | Frontier Select | Frontier Winton | ||||||||||
| Type of contract | Fund | Fund | Fund | |||||||||
| Metals | $ | (112,630 | ) | $ | (145,043 | ) | $ | (1,442,763 | ) | |||
| Currencies | 238,745 | (126,402 | ) | (1,244,155 | ) | |||||||
| Energies | (868 | ) | (516,253 | ) | (1,721,544 | ) | ||||||
| Agriculturals | (509,639 | ) | 27,824 | 399,406 | ||||||||
| Interest rates | (425,751 | ) | (768,438 | ) | (1,296,976 | ) | ||||||
| Stock indices | 240,982 | 832,876 | 6,359,249 | |||||||||
| Realized trading income/(loss)(1) | $ | (569,161 | ) | $ | (695,436 | ) | $ | 1,053,217 | ||||
| (1) | Amounts recorded in the Statements of Operations under Net realized gain/(loss) on futures, forwards, and options |
| Unrealized Trading Revenue from Futures, Forwards and Options |
| for the Nine Months Ended September 30, 2018 |
| Frontier Balanced | ||||
| Type of contract | Fund | |||
| Metals | $ | 12,286 | ||
| Currencies | (185,045 | ) | ||
| Energies | (45,174 | ) | ||
| Agriculturals | (5,025 | ) | ||
| Interest rates | 87,216 | |||
| Stock indices | (5,450 | ) | ||
| Change in unrealized trading income/(loss)(1) | $ | (141,192 | ) | |
| Unrealized Trading Revenue from Futures, Forwards and Options |
| for the Nine Months Ended September 30, 2017 |
| Frontier Balanced | Frontier Select | Frontier Winton | ||||||||||
| Type of contract | Fund | Fund | Fund | |||||||||
| Metals | $ | (110,251 | ) | $ | (51,351 | ) | $ | 10,108 | ||||
| Currencies | (258,229 | ) | (370,286 | ) | (843,998 | ) | ||||||
| Energies | 11,735 | (146,125 | ) | 28,571 | ||||||||
| Agriculturals | (96,789 | ) | 108,409 | (92,870 | ) | |||||||
| Interest rates | 38,801 | (296,328 | ) | (827,879 | ) | |||||||
| Stock indices | 11,496 | 609,833 | 95,619 | |||||||||
| Change in unrealized trading income/(loss)(1) | $ | (403,237 | ) | $ | (145,848 | ) | $ | (1,630,449 | ) | |||
| (1) | Amounts recorded in the Statements of Operations under Net change in open trade equity/(deficit) |
59
Certain financial instruments and derivative instruments are eligible for offset in the statements of financial condition under GAAP. The Series’ open trade equity/(deficit), options written, and receivables from futures commissions merchants (each, an “FCM”) are subject to master netting arrangements and collateral arrangements and meet the GAAP guidance to qualify for offset. A master netting arrangement with a counterparty creates a right of offset for amounts due to and from that same counterparty that is enforceable in the event of a default or bankruptcy. The Series’ policy is to recognize amounts subject to master netting arrangements on a net basis on the statements of financial condition.
The following tables present gross and net information about the Series’ assets and liabilities subject to master netting arrangements as disclosed on the statements of financial condition as of March 31,September 30, 2018 and December 31, 2017.
As of March 31,September 30, 2018
| Net Amounts | Net Amounts | |||||||||||||||||||||||
| Gross Amounts | Presented in the | Gross Amounts | Presented in the | |||||||||||||||||||||
| Gross Amounts | offset in the | Statements of | Gross Amounts of | offset in the | Statements of | |||||||||||||||||||
| of recognized | Statements of | Financial | recognized | Statements of | Financial | |||||||||||||||||||
| Derivative Assets | Financial Condition | Condition | Derivative Assets | Financial | Condition | |||||||||||||||||||
| Frontier Balanced Fund | ||||||||||||||||||||||||
| Open Trade Equity/(Deficit) | $ | 454,558 | $ | (165,741 | ) | $ | 288,817 | $ | 580,714 | $ | (604,158 | ) | $ | (23,444 | ) | |||||||||
| Swap Contracts | 10,340,801 | — | 10,340,801 | 9,850,185 | — | 9,850,185 | ||||||||||||||||||
| Frontier Diversified Fund | ||||||||||||||||||||||||
| Swap Contracts | $ | 5,728,465 | $ | — | $ | 5,728,465 | $ | 5,575,997 | $ | — | $ | 5,575,997 | ||||||||||||
| Frontier Long/Short Commodity Fund | ||||||||||||||||||||||||
| Swap Contracts | $ | 482,309 | $ | — | $ | 482,309 | $ | 471,942 | $ | — | $ | 471,942 | ||||||||||||
| Frontier Heritage Fund | ||||||||||||||||||||||||
| Swap Contracts | $ | 3,089,571 | $ | — | $ | 3,089,571 | $ | 3,010,288 | $ | — | $ | 3,010,288 | ||||||||||||
4860
As of December 31, 2017
| Net Amounts | ||||||||||||
| Gross Amounts | Presented in the | |||||||||||
| Gross Amounts | offset in the | Statements of | ||||||||||
| of recognized | Statements of | Financial | ||||||||||
| Derivative Assets | Financial Condition | Condition | ||||||||||
| Frontier Balanced Fund | ||||||||||||
| Open Trade Equity/(Deficit) | $ | 343,222 | $ | (164,670 | ) | $ | 178,552 | |||||
| Swap Contracts | 11,340,959 | — | 11,340,959 | |||||||||
| Frontier Diversified Fund | ||||||||||||
| Swap Contracts | $ | 6,376,472 | $ | — | $ | 6,376,472 | ||||||
| Frontier Long/Short Commodity Fund | ||||||||||||
| Swap Contracts | $ | 397,039 | $ | — | $ | 397,039 | ||||||
| Frontier Heritage Fund | ||||||||||||
| Swap Contracts | $ | 3,094,367 | $ | — | $ | 3,094,367 | ||||||
4961
9. Trading Activities and Related Risks
The purchase and sale of futures and options on futures contracts require margin deposits with FCMs. Additional deposits may be necessary for any loss on contract value. The Commodity Exchange Act, as amended (the “Commodity Exchange Act”) requires an FCM to segregate all customer transactions and assets from the FCM’s proprietary activities. A customer’s cash and other property (for example, U.S. treasury bills) deposited with an FCM are considered commingled with all other customer funds subject to the FCM’s segregation requirements. In the event of an FCM’s insolvency, recovery may be limited to a pro rata share of segregated funds available. It is possible that the recovered amount could be less than the total of cash and other property deposited.
The term “off-balance sheet risk” refers to an unrecorded potential liability that, even though it does not appear on the statements of financial condition, may result in future obligation or loss in excess of the amount paid by the Series for a particular investment. Each Trading Company expects to trade in futures, options, forward and swap contracts and will therefore be a party to financial instruments with elements of off-balance sheet market and credit risk. In entering into these contracts, there exists a market risk that such contracts may be significantly influenced by market conditions, such as interest rate volatility, resulting in such contracts being less valuable. If the markets should move against all of the futures positions held by a Trading Company in respect of any Series at the same time, and if the Trading Advisor(s) of such Trading Company are unable to offset such futures interests positions, such Trading Company could lose all of its assets and the holders of Units of such Series would realize a 100% loss. The Managing Owner will seek to minimize market risk through real-time monitoring of open positions and the level of diversification of each Trading Advisor’s portfolio. It is anticipated that any Trading Advisor’s margin-to-equity ratio will typically not exceed approximately 35% although the actual ratio could be higher or lower from time to time.
In addition to market risk, trading futures, forward and swap contracts entails credit risk that a counterparty will not be able to meet its obligations to a Trading Company. The counterparty for futures contracts traded in the United States and on most foreign exchanges is the clearinghouse associated with such exchange. In general, clearinghouses are backed by the corporate members of the clearinghouse who are required to share any financial burden resulting from the non-performance by one of their members and, as such, should significantly reduce this credit risk. In cases where the clearinghouse is not backed by the clearing members, like some foreign exchanges, it is normally backed by a consortium of banks or other financial institutions. Some non-U.S. exchanges, in contrast to U.S. exchanges, are principals’ markets in which performance is the responsibility only of the individual counterparty with whom the Trading Company has entered into the transaction, and not of the exchange or clearing corporation. In these kinds of markets, there is risk of bankruptcy or other failure or refusal to perform by the counterparty.
In the case of forward contracts traded on the interbank market and swaps, neither is traded on exchanges. The counterparty is generally a single bank or other financial institution, rather than a group of financial institutions; thus there may be a greater counterparty credit risk. The Managing Owner expects the Trading Advisors to trade only with those counterparties which it believes to be creditworthy. All positions of each Trading Company will be valued each day on a mark-to-market basis. There can be no assurance that any clearing member, clearinghouse or other counterparty will be able to meet its obligations to any Trading Company.
The Managing Owner has established procedures to actively monitor and minimize market and credit risks. The Limited Owners bear the risk of loss only to the extent of the market value of their respective investments and, in certain specific circumstances, distributions and redemptions received.
10. Indemnifications and Guarantees noted in Management Discussion and Analysis
The Trust has entered into agreements, which provide for the indemnification of futures clearing brokers, and commodity trading advisers, among others, against losses, costs, claims and liabilities arising from the performance of their individual obligations under such agreements, except for gross negligence or bad faith. The Trust has had no prior claims or payments pursuant to these agreements. The Trust’s individual maximum exposure under these arrangements is unknown, as this would involve future claims that may be made against the Trust that have not yet occurred. However, based on experience the Trust expects the risk of loss to be remote. Maximum exposure is unfulfilled obligations of the Series up to the amount of equity at risk with UBS SecuritiesMorgan Stanley & Co. LLC of the referenced Series as allocated from the Trading Company. The Series have not recorded any liability for the guarantees in the accompanying financial statements as it expects any possibility of losses to be remote.
The Trust has guaranteed the obligations of the Trading Companies under the customer agreements with UBS Securities LLC as Clearing Broker. In the event that one Series of the Trust is unable to meet its obligations to UBS Securities LLC, the assets of the other Series will be available to UBS Securities LLC as part of the guarantee, but only to the extent of such Series’ pro rata allocation to the Trading Company. The Series have not recorded any liability for the indemnifications in the accompanying financial statement, as it expects any possibility of losses to be remote.
5062
11.Subsequent Events
From AprilOctober 1, 2018 through May 15,November 19, 2018, Frontier Balanced Fund, Frontier Diversified Fund, Frontier Heritage Fund, Frontier Long/Short Commodity Fund, Frontier Masters Fund, Frontier Select Fund, and Frontier Winton Fund paid $1,929,645, $455,644, $197,813, $235,808, $1,193,358, $508,610$1,602,003, $234,295, $181,043, $211,739, $435,911 $192,279 and $1,707,268,$215,916, respectively, in redemptions.
All the owner redemptions payable on the Statements of Financial Condition were paid on April 3, 2018.
On April 11, 2018, the swap terminating on April 18, 2018 was extended to March 27, 2023.
5163
| Frontier Funds |
| Consolidated Statements of Financial Condition |
| 3/31/18 | 12/31/17 | 9/30/18 | 12/31/17 | |||||||||||||
| ASSETS | ||||||||||||||||
| Cash and cash equivalents | $ | 11,376,539 | $ | 2,695,377 | $ | 665,406 | $ | 2,695,377 | ||||||||
| U.S. Treasury securities, at fair value | 6,962,652 | 10,887,786 | 9,591,613 | 10,887,786 | ||||||||||||
| Receivable from futures commission merchants | 10,636,284 | 20,584,602 | 10,714,941 | 20,584,602 | ||||||||||||
| Open trade equity, at fair value | 804,497 | 1,568,414 | 346,726 | 1,568,414 | ||||||||||||
| Incentive fee receivable | 57,082 | 57,082 | 57,082 | 57,082 | ||||||||||||
| Swap contracts, at fair value | 19,641,146 | 21,208,838 | 18,908,412 | 21,208,838 | ||||||||||||
| Investments in private investment companies, at fair value | 57,608,289 | 66,933,235 | 50,998,548 | 66,933,235 | ||||||||||||
| Interest receivable | 46,466 | 214,730 | 71,656 | 214,730 | ||||||||||||
| Due from Managing Owner | 31,412 | 31,887 | — | 31,887 | ||||||||||||
| Receivables from related party | 69,782 | 58,146 | — | 58,146 | ||||||||||||
| Other assets | 18,183 | — | — | — | ||||||||||||
| Total Assets | $ | 107,252,332 | $ | 124,240,097 | $ | 91,354,384 | $ | 124,240,097 | ||||||||
| LIABILITIES & CAPITAL | ||||||||||||||||
| LIABILITIES | ||||||||||||||||
| Owner redemptions payable | $ | 53,170 | $ | 76,773 | $ | 321,128 | $ | 76,773 | ||||||||
| Incentive fees payable to Managing Owner | 148,409 | 53,036 | 10,897 | 53,036 | ||||||||||||
| Management fees payable to Managing Owner | 176,311 | 90,972 | 79,601 | 90,972 | ||||||||||||
| Interest payable to Managing Owner | 17,403 | 26,007 | 22,088 | 26,007 | ||||||||||||
| Trading fees payable to Managing Owner | 128,188 | 334,485 | 238,073 | 334,485 | ||||||||||||
| Service fees payable to Managing Owner | 276,006 | 148,445 | 107,758 | 148,445 | ||||||||||||
| Risk analysis fees payable | 30,355 | 25,576 | 28,610 | 25,576 | ||||||||||||
| Advance on unrealized Swap Appreciation | 9,441,555 | 9,441,555 | 9,441,555 | 9,441,555 | ||||||||||||
| Other liabilities | — | 278,983 | 255,497 | 278,983 | ||||||||||||
| Total Liabilities | 10,271,397 | 10,475,832 | 10,505,207 | 10,475,832 | ||||||||||||
| OWNERS CAPITAL | ||||||||||||||||
| Managing Owner Units | 1,055,075 | 1,159,984 | 880,124 | 1,159,984 | ||||||||||||
| Limited Owner Units | 95,925,860 | 112,604,281 | 79,969,053 | 112,604,281 | ||||||||||||
| Total Owners Capital | 96,980,935 | 113,764,265 | 80,849,177 | 113,764,265 | ||||||||||||
| Total Liabilities and Owners Capital | $ | 107,252,332 | $ | 124,240,097 | $ | 91,354,384 | $ | 124,240,097 | ||||||||
The accompanying notes are an integral part of these consolidated financial statements.
5264
| Frontier Funds |
| Consolidated Condensed Schedule of Investments |
| Fair | % of Total Capital | Fair | % of Total Capital | |||||||||||||||||||||
| Description | Description | Value | (Net Asset Value) | Description | Value | (Net Asset Value) | ||||||||||||||||||
| LONG FUTURES CONTRACTS * | LONG FUTURES CONTRACTS * | LONG FUTURES CONTRACTS * | ||||||||||||||||||||||
| Various agriculture futures contracts (U.S.) | $ | 19,790 | 0.02 | % | Various agriculture futures contracts (Canada) | $ | (173 | ) | 0.00 | % | ||||||||||||||
| Various base metals futures contracts (U.S.) | (318,833 | ) | -0.33 | % | Various agriculture futures contracts (Europe) | (2,265 | ) | 0.00 | % | |||||||||||||||
| Various currency futures contracts (Europe) | 10,231 | 0.01 | % | Various agriculture futures contracts (U.S.) | 2,310 | 0.00 | % | |||||||||||||||||
| Various currency futures contracts (Latin America) | 17,165 | 0.02 | % | Various base metals futures contracts (U.S.) | (85,792 | ) | -0.11 | % | ||||||||||||||||
| Various currency futures contracts (Oceanic) | (3,810 | ) | 0.00 | % | Various currency futures contracts (Europe) | 5,110 | 0.01 | % | ||||||||||||||||
| Various energy futures contracts (Europe) | (587 | ) | 0.00 | % | Various currency futures contracts (Latin America) | 35,880 | 0.04 | % | ||||||||||||||||
| Various energy futures contracts (U.S.) | 457,796 | 0.47 | % | Various energy futures contracts (U.S.) | 149,308 | 0.18 | % | |||||||||||||||||
| Various interest rates futures contracts (Europe) | 144,716 | 0.15 | % | Various interest rates futures contracts (Canada) | (3,340 | ) | 0.00 | % | ||||||||||||||||
| Various interest rates futures contracts (Far East) | 2,166 | 0.00 | % | Various interest rates futures contracts (Europe) | (98,875 | ) | -0.12 | % | ||||||||||||||||
| Various interest rates futures contracts (Oceanic) | (892 | ) | 0.00 | % | Various interest rates futures contracts (Far East) | (3,610 | ) | 0.00 | % | |||||||||||||||
| Various interest rates futures contracts (U.S.) | 5,406 | 0.01 | % | Various interest rates futures contracts (Oceanic) | (11,160 | ) | -0.01 | % | ||||||||||||||||
| Various precious metal futures contracts (U.S.) | (7,855 | ) | -0.01 | % | Various interest rates futures contracts (U.S.) | (90,328 | ) | -0.11 | % | |||||||||||||||
| Various soft futures contracts (U.S.) | 36,371 | 0.04 | % | Various precious metal futures contracts (U.S.) | 4,870 | 0.01 | % | |||||||||||||||||
| Various stock index futures contracts (Europe) | (2,836 | ) | 0.00 | % | Various soft futures contracts (U.S.) | (51,765 | ) | -0.06 | % | |||||||||||||||
| Various stock index futures contracts (Far East) | 10,024 | 0.01 | % | Various stock index futures contracts (Europe) | 18,675 | 0.02 | % | |||||||||||||||||
| Various stock index futures contracts (Oceanic) | (17,721 | ) | -0.02 | % | Various stock index futures contracts (Far East) | 37,635 | 0.05 | % | ||||||||||||||||
| Various stock index futures contracts (U.S.) | (245,461 | ) | -0.25 | % | Various stock index futures contracts (Oceanic) | 4,107 | 0.01 | % | ||||||||||||||||
| Total Long Futures Contracts | $ | 105,670 | 0.12 | % | Various stock index futures contracts (U.S.) | 31,544 | 0.04 | % | ||||||||||||||||
| Total Long Futures Contracts | $ | (57,869 | ) | -0.05 | % | |||||||||||||||||||
| SHORT FUTURES CONTRACTS * | SHORT FUTURES CONTRACTS * | SHORT FUTURES CONTRACTS * | ||||||||||||||||||||||
| Various agriculture futures contracts (Europe) | $ | 246 | 0.00 | % | ||||||||||||||||||||
| Various agriculture futures contracts (U.S.) | 35,601 | 0.04 | % | |||||||||||||||||||||
| Various base metals futures contracts (U.S.) | 200,489 | 0.21 | % | |||||||||||||||||||||
| Various currency futures contracts (Canada) | (12,735 | ) | -0.01 | % | Various agriculture futures contracts (Canada) | $ | 84,444 | 0.10 | % | |||||||||||||||
| Various currency futures contracts (Europe) | 26,719 | 0.03 | % | Various agriculture futures contracts (U.S.) | (38,870 | ) | -0.05 | % | ||||||||||||||||
| Various currency futures contracts (Far East) | (1,750 | ) | 0.00 | % | Various base metals futures contracts (U.S.) | (13,753 | ) | -0.02 | % | |||||||||||||||
| Various currency futures contracts (Oceanic) | 5,730 | 0.01 | % | Various currency futures contracts (Europe) | 19,481 | 0.02 | % | |||||||||||||||||
| Various energy futures contracts (U.S.) | (2,160 | ) | 0.00 | % | Various currency futures contracts (Far East) | 191,075 | 0.24 | % | ||||||||||||||||
| Various interest rates futures contracts (Canada) | (9,693 | ) | -0.01 | % | Various currency futures contracts (Oceanic) | (34,915 | ) | -0.04 | % | |||||||||||||||
| Various interest rates futures contracts (Europe) | (11,428 | ) | -0.01 | % | Various energy futures contracts (U.S.) | (37,980 | ) | -0.05 | % | |||||||||||||||
| Various interest rates futures contracts (Far East) | (659 | ) | 0.00 | % | Various interest rates futures contracts (Canada) | 7,731 | 0.01 | % | ||||||||||||||||
| Various interest rates futures contracts (Oceanic) | (13,558 | ) | -0.01 | % | Various interest rates futures contracts (Europe) | 25,411 | 0.03 | % | ||||||||||||||||
| Various interest rates futures contracts (U.S.) | 116,297 | 0.12 | % | Various interest rates futures contracts (Far East) | 1,761 | 0.00 | % | |||||||||||||||||
| Various precious metal futures contracts (U.S.) | 78,700 | 0.08 | % | Various interest rates futures contracts (U.S.) | 64,383 | 0.08 | % | |||||||||||||||||
| Various soft futures contracts (Europe) | (17,827 | ) | -0.02 | % | Various precious metal futures contracts (U.S.) | 162,150 | 0.20 | % | ||||||||||||||||
| Various soft futures contracts (Far East) | 7,326 | 0.01 | % | Various soft futures contracts (Far East) | 1,101 | 0.00 | % | |||||||||||||||||
| Various soft futures contracts (U.S.) | 145,428 | 0.15 | % | Various soft futures contracts (U.S.) | 255,560 | 0.32 | % | |||||||||||||||||
| Various stock index futures contracts (Africa) | (834 | ) | 0.00 | % | Various stock index futures contracts (Africa) | 2,471 | 0.00 | % | ||||||||||||||||
| Various stock index futures contracts (Europe) | 2,329 | 0.00 | % | Various stock index futures contracts (Far East) | (1,465 | ) | 0.00 | % | ||||||||||||||||
| Various stock index futures contracts (U.S.) | 122,500 | 0.13 | % | Various stock index futures contracts (U.S.) | 14,481 | 0.02 | % | |||||||||||||||||
| Total Short Futures Contracts | $ | 670,721 | 0.72 | % | Total Short Futures Contracts | $ | 703,066 | 0.86 | % | |||||||||||||||
| CURRENCY FORWARDS * | CURRENCY FORWARDS * | CURRENCY FORWARDS * | ||||||||||||||||||||||
| Various currency forwards contracts (NA) | $ | 28,106 | 0.03 | % | Various currency forwards contracts (NA) | $ | (298,471 | ) | -0.37 | % | ||||||||||||||
| Total Currency Forwards | $ | 28,106 | 0.03 | % | Total Currency Forwards | $ | (298,471 | ) | -0.37 | % | ||||||||||||||
| Total Open Trade Equity (Deficit) | $ | 804,497 | 0.87 | % | Total Open Trade Equity (Deficit) | $ | 346,726 | 0.44 | % | |||||||||||||||
| SWAPS (1) | SWAPS (1) | SWAPS (1) | ||||||||||||||||||||||
| Frontier Brevan Howard swap (U.S.) | $ | 3,089,571 | 3.19 | % | Frontier Brevan Howard swap (U.S.) | $ | 3,010,288 | 3.72 | % | |||||||||||||||
| Frontier XXXIV Balanced select swap (U.S.) | 10,340,801 | 10.66 | % | Frontier XXXIV Balanced select swap (U.S.) | 9,850,185 | 12.18 | % | |||||||||||||||||
| Frontier XXXV Diversified select swap (U.S.) | 5,728,465 | 5.91 | % | Frontier XXXV Diversified select swap (U.S.) | 5,575,997 | 6.90 | % | |||||||||||||||||
| Frontier XXXVII L/S select swap (U.S.) | 482,309 | 0.50 | % | Frontier XXXVII L/S select swap (U.S.) | 471,942 | 0.58 | % | |||||||||||||||||
| Total Swaps | $ | 19,641,146 | 20.26 | % | Total Swaps | $ | 18,908,412 | 23.38 | % | |||||||||||||||
| PRIVATE INVESTMENT COMPANIES (2) | PRIVATE INVESTMENT COMPANIES (2) | PRIVATE INVESTMENT COMPANIES (2) | ||||||||||||||||||||||
| Galaxy Plus Fund - EvE STP Feeder Fund (516) LLC | 6,425,315 | 6.63 | % | Galaxy Plus Fund - EvE STP Feeder Fund (516) LLC | 6,063,170 | 7.50 | % | |||||||||||||||||
| Galaxy Plus Fund - Doherty Feeder Fund (528) LLC | 3,596,703 | 3.71 | % | Galaxy Plus Fund - Doherty Feeder Fund (528) LLC | 3,356,591 | 4.15 | % | |||||||||||||||||
| Galaxy Plus Fund - Fort Contrarian Feeder Fund (510) LLC | 6,081,449 | 6.27 | % | Galaxy Plus Fund - Fort Contrarian Feeder Fund (510) LLC | 5,285,097 | 6.54 | % | |||||||||||||||||
| Galaxy Plus Fund - QIM Feeder Fund (526) LLC | 5,241,123 | 5.40 | % | Galaxy Plus Fund - QIM Feeder Fund (526) LLC | 4,824,012 | 5.97 | % | |||||||||||||||||
| Galaxy Plus Fund - Quantmetrics Feeder Fund (527) LLC | 7,655,851 | 7.89 | % | Galaxy Plus Fund - Quantmetrics Feeder Fund (527) LLC | 6,246,313 | 7.73 | % | |||||||||||||||||
| Galaxy Plus Fund - Quest Fit Feeder Fund (517) LLC | 1,326,605 | 1.37 | % | Galaxy Plus Fund - Quest Fit Feeder Fund (517) LLC | 2,016,365 | 2.49 | % | |||||||||||||||||
| Galaxy Plus Fund - Quest Feeder Fund (517) LLC | 721,758 | 0.74 | % | Galaxy Plus Fund - Quest Feeder Fund (517) LLC | 686,691 | 0.85 | % | |||||||||||||||||
| Galaxy Plus Fund - Aspect Feeder Fund (532) LLC | 1,480,334 | 1.53 | % | Galaxy Plus Fund - Aspect Feeder Fund (532) LLC | 1,452,297 | 1.80 | % | |||||||||||||||||
| Galaxy Plus Fund - Welton GDP Feeder Fund (538) LLC | 20,068,078 | 20.69 | % | Galaxy Plus Fund - Welton GDP Feeder Fund (538) LLC | 16,717,851 | 20.68 | % | |||||||||||||||||
| Galaxy Plus Fund - TT Feeder Fund (531) LLC | 3,867,445 | 3.99 | % | Galaxy Plus Fund - TT Feeder Fund (531) LLC | 3,255,902 | 4.03 | % | |||||||||||||||||
| Galaxy Plus Fund - LRR Feeder Fund (522) LLC | 1,143,628 | 1.18 | % | Galaxy Plus Fund - LRR Feeder Fund (522) LLC | 1,094,259 | 1.35 | % | |||||||||||||||||
| Total Private Investment Companies | $ | 57,608,289 | 59.40 | % | Total Private Investment Companies | $ | 50,998,548 | 63.09 | % | |||||||||||||||
| U.S. TREASURY SECURITIES | U.S. TREASURY SECURITIES | |||||||||||||||||||||||
| FACE VALUE | FACE VALUE | Fair Value | Fair Value | FACE VALUE | Fair Value | Fair Value | ||||||||||||||||||
| U.S. TREASURY SECURITIES | ||||||||||||||||||||||||
| $ | 8,269,000 | US Treasury Note 6.875% due 08/15/2025 (Cost $10,985,078) | 6,962,652 | 7.18 | % | 7,737,000 | US Treasury Note 6.875% due 08/15/2025 (Cost $9,813,689) | 9,591,613 | 11.86 | % | ||||||||||||||
| Total U.S. Treasury Securities | $ | 6,962,652 | 7.18 | % | Total U.S. Treasury Securities | $ | 9,591,613 | 11.86 | % | |||||||||||||||
| * | Except for those items disclosed, no individual futures, forwards and option on futures contract position constituted greater than 1 percent of Net Asset Value. Accordingly, the number of contracts and expiration dates are not presented. |
| (1) | See Notes to Consolidated Financial Statements, Note 4. |
| (2) | See Notes to Consolidated Financial Statements, Note 5. |
The accompanying notes are an integral part of these consolidated financial statements.
5365
| Frontier Funds |
| Consolidated Condensed Schedule of Investments |
| December 31, 2017 |
| Fair | % of Total Capital | Fair | % of Total Capital | |||||||||||||||||||||
| Description | Description | Value | (Net Asset Value) | Description | Value | (Net Asset Value) | ||||||||||||||||||
| LONG FUTURES CONTRACTS * | LONG FUTURES CONTRACTS * | LONG FUTURES CONTRACTS * | ||||||||||||||||||||||
| Various base metals futures contracts (U.S.) | $ | 1,088,822 | 0.96 | % | Various base metals futures contracts (U.S.) | $ | 1,088,822 | 0.96 | % | |||||||||||||||
| Various currency futures contracts (Canada) | 18,470 | 0.02 | % | Various currency futures contracts (Canada) | 18,470 | 0.02 | % | |||||||||||||||||
| Various currency futures contracts (Europe) | 27,263 | 0.02 | % | Various currency futures contracts (Europe) | 27,263 | 0.02 | % | |||||||||||||||||
| Various currency futures contracts (Oceanic) | 20,670 | 0.02 | % | Various currency futures contracts (Oceanic) | 20,670 | 0.02 | % | |||||||||||||||||
| Various currency futures contracts (U.S.) | (52,460 | ) | -0.05 | % | Various currency futures contracts (U.S.) | (52,460 | ) | -0.05 | % | |||||||||||||||
| Various energy futures contracts (U.S.) | 513,613 | 0.45 | % | Various energy futures contracts (U.S.) | 513,613 | 0.45 | % | |||||||||||||||||
| Various energy futures contracts (Europe) | (11,873 | ) | -0.01 | % | Various energy futures contracts (Europe) | (11,873 | ) | -0.01 | % | |||||||||||||||
| Various interest rates futures contracts (Europe) | (118,226 | ) | -0.10 | % | Various interest rates futures contracts (Europe) | (118,226 | ) | -0.10 | % | |||||||||||||||
| Various interest rates futures contracts (Far East) | (4,756 | ) | 0.00 | % | Various interest rates futures contracts (Far East) | (4,756 | ) | 0.00 | % | |||||||||||||||
| Various interest rates futures contracts (Oceanic) | (23,380 | ) | -0.02 | % | Various interest rates futures contracts (Oceanic) | (23,380 | ) | -0.02 | % | |||||||||||||||
| Various interest rates futures contracts (U.S.) | (25,875 | ) | -0.02 | % | Various interest rates futures contracts (U.S.) | (25,875 | ) | -0.02 | % | |||||||||||||||
| Various precious metal futures contracts (U.S.) | 18,190 | 0.02 | % | Various precious metal futures contracts (U.S.) | 18,190 | 0.02 | % | |||||||||||||||||
| Various soft futures contract (Europe) | (372 | ) | 0.00 | % | Various soft futures contract (Europe) | (372 | ) | 0.00 | % | |||||||||||||||
| Various soft futures contract (U.S.) | 55,621 | 0.05 | % | Various soft futures contract (U.S.) | 55,621 | 0.05 | % | |||||||||||||||||
| Various stock index futures contracts (Africa) | 4,465 | 0.00 | % | Various stock index futures contracts (Africa) | 4,465 | 0.00 | % | |||||||||||||||||
| Various stock index futures contracts (Canada) | 5,605 | 0.00 | % | Various stock index futures contracts (Canada) | 5,605 | 0.00 | % | |||||||||||||||||
| Various stock index futures contracts (Europe) | (104,638 | ) | -0.09 | % | Various stock index futures contracts (Europe) | (104,638 | ) | -0.09 | % | |||||||||||||||
| Various stock index futures contracts (Far East) | 96,403 | 0.08 | % | Various stock index futures contracts (Far East) | 96,403 | 0.08 | % | |||||||||||||||||
| Various stock index futures contracts (Oceanic) | 2,815 | 0.00 | % | Various stock index futures contracts (Oceanic) | 2,815 | 0.00 | % | |||||||||||||||||
| Various stock index futures contracts (U.S.) | 197,228 | 0.17 | % | Various stock index futures contracts (U.S.) | 197,228 | 0.17 | % | |||||||||||||||||
| Total Long Futures Contracts | $ | 1,707,585 | 1.50 | % | Total Long Futures Contracts | $ | 1,707,585 | 1.50 | % | |||||||||||||||
| SHORT FUTURES CONTRACTS * | SHORT FUTURES CONTRACTS * | SHORT FUTURES CONTRACTS * | ||||||||||||||||||||||
| Various base metals futures contracts (U.S.) | $ | (411,270 | ) | -0.36 | % | Various base metals futures contracts (U.S.) | $ | (411,270 | ) | -0.36 | % | |||||||||||||
| Various currency futures contracts (Europe) | (89,175 | ) | -0.08 | % | Various currency futures contracts (Europe) | (89,175 | ) | -0.08 | % | |||||||||||||||
| Various currency futures contracts (Far East) | (50,066 | ) | -0.04 | % | Various currency futures contracts (Far East) | (50,066 | ) | -0.04 | % | |||||||||||||||
| Various currency futures contracts (U.S.) | 40,897 | 0.04 | % | Various currency futures contracts (U.S.) | 40,897 | 0.04 | % | |||||||||||||||||
| Various energy futures contracts (U.S.) | (77,171 | ) | -0.07 | % | Various energy futures contracts (U.S.) | (77,171 | ) | -0.07 | % | |||||||||||||||
| Various interest rates futures contracts (Canada) | (4,439 | ) | 0.00 | % | Various interest rates futures contracts (Canada) | (4,439 | ) | 0.00 | % | |||||||||||||||
| Various interest rates futures contracts (Europe) | (6,824 | ) | -0.01 | % | Various interest rates futures contracts (Europe) | (6,824 | ) | -0.01 | % | |||||||||||||||
| Various interest rates futures contracts (Oceanic) | 1,509 | 0.00 | % | Various interest rates futures contracts (Oceanic) | 1,509 | 0.00 | % | |||||||||||||||||
| Various interest rates futures contracts (U.S.) | 104,111 | 0.09 | % | Various interest rates futures contracts (U.S.) | 104,111 | 0.09 | % | |||||||||||||||||
| Various precious metal futures contracts (U.S.) | (153,585 | ) | -0.14 | % | Various precious metal futures contracts (U.S.) | (153,585 | ) | -0.14 | % | |||||||||||||||
| Various soft futures contract (U.S.) | 93,576 | 0.08 | % | Various soft futures contract (U.S.) | 93,576 | 0.08 | % | |||||||||||||||||
| Various soft futures contracts (Europe) | 35,920 | 0.03 | % | Various soft futures contracts (Europe) | 35,920 | 0.03 | % | |||||||||||||||||
| Various stock index futures contracts (U.S.) | (45,128 | ) | -0.04 | % | Various stock index futures contracts (U.S.) | (45,128 | ) | -0.04 | % | |||||||||||||||
| Total Short Futures Contracts | $ | (561,645 | ) | -0.50 | % | Total Short Futures Contracts | $ | (561,645 | ) | -0.50 | % | |||||||||||||
| CURRENCY FORWARDS * | CURRENCY FORWARDS * | CURRENCY FORWARDS * | ||||||||||||||||||||||
| Various currency forwards contracts (NA) | $ | 422,474 | 0.37 | % | Various currency forwards contracts (NA) | $ | 422,474 | 0.37 | % | |||||||||||||||
| Total Currency Forwards | $ | 422,474 | 0.37 | % | Total Currency Forwards | $ | 422,474 | 0.37 | % | |||||||||||||||
| Total Open Trade Equity (Deficit) | $ | 1,568,414 | 1.37 | % | Total Open Trade Equity (Deficit) | $ | 1,568,414 | 1.37 | % | |||||||||||||||
| SWAPS (1) | SWAPS (1) | SWAPS (1) | ||||||||||||||||||||||
| Frontier Brevan Howard swap (U.S.) | $ | 3,094,367 | 2.72 | % | Frontier Brevan Howard swap (U.S.) | $ | 3,094,367 | 2.72 | % | |||||||||||||||
| Frontier XXXIV Balanced select swap (U.S.) | 11,340,960 | 9.97 | % | Frontier XXXIV Balanced select swap (U.S.) | 11,340,960 | 9.97 | % | |||||||||||||||||
| Frontier XXXV Diversified select swap (U.S.) | 6,376,472 | 5.60 | % | Frontier XXXV Diversified select swap (U.S.) | 6,376,472 | 5.60 | % | |||||||||||||||||
| Frontier XXXVII L/S select swap (U.S.) | 397,039 | 0.35 | % | Frontier XXXVII L/S select swap (U.S.) | 397,039 | 0.35 | % | |||||||||||||||||
| Total Swaps | $ | 21,208,838 | 18.64 | % | Total Swaps | $ | 21,208,838 | 18.64 | % | |||||||||||||||
| PRIVATE INVESTMENT COMPANIES (2) | PRIVATE INVESTMENT COMPANIES (2) | PRIVATE INVESTMENT COMPANIES (2) | ||||||||||||||||||||||
| Galaxy Plus Fund - Chesapeake Feeder Fund (518) | $ | 1,774,375 | 1.56 | % | Galaxy Plus Fund - Chesapeake Feeder Fund (518) | $ | 1,774,375 | 1.56 | % | |||||||||||||||
| Galaxy Plus Fund - EvE STP Feeder Fund (516) LLC | 6,507,863 | 5.72 | % | Galaxy Plus Fund - EvE STP Feeder Fund (516) LLC | 6,507,863 | 5.72 | % | |||||||||||||||||
| Galaxy Plus Fund - Doherty Feeder Fund (528) LLC | 3,759,970 | 3.31 | % | Galaxy Plus Fund - Doherty Feeder Fund (528) LLC | 3,759,970 | 3.31 | % | |||||||||||||||||
| Galaxy Plus Fund - Fort Contrarian Feeder Fund (510) LLC | 7,523,327 | 6.61 | % | Galaxy Plus Fund - Fort Contrarian Feeder Fund (510) LLC | 7,523,327 | 6.61 | % | |||||||||||||||||
| Galaxy Plus Fund - QIM Feeder Fund (526) LLC | 6,607,668 | 5.81 | % | Galaxy Plus Fund - QIM Feeder Fund (526) LLC | 6,607,668 | 5.81 | % | |||||||||||||||||
| Galaxy Plus Fund - Quantmetrics Feeder Fund (527) LLC | 6,204,663 | 5.45 | % | Galaxy Plus Fund - Quantmetrics Feeder Fund (527) LLC | 6,204,663 | 5.45 | % | |||||||||||||||||
| Galaxy Plus Fund - Quest Fit Feeder Fund (517) LLC | 2,151,869 | 1.89 | % | Galaxy Plus Fund - Quest Fit Feeder Fund (517) LLC | 2,151,869 | 1.89 | % | |||||||||||||||||
| Galaxy Plus Fund - Quest Feeder Fund (517) LLC | 759,647 | 0.67 | % | Galaxy Plus Fund - Quest Feeder Fund (517) LLC | 759,647 | 0.67 | % | |||||||||||||||||
| Galaxy Plus Fund - Aspect Feeder Fund (532) LLC | 1,919,350 | 1.69 | % | Galaxy Plus Fund - Aspect Feeder Fund (532) LLC | 1,919,350 | 1.69 | % | |||||||||||||||||
| Galaxy Plus Fund - Welton GDP Feeder Fund (538) LLC | 23,045,760 | 20.26 | % | Galaxy Plus Fund - Welton GDP Feeder Fund (538) LLC | 23,045,760 | 20.26 | % | |||||||||||||||||
| Galaxy Plus Fund - TT Feeder Fund (531) LLC | 5,195,266 | 4.57 | % | Galaxy Plus Fund - TT Feeder Fund (531) LLC | 5,195,266 | 4.57 | % | |||||||||||||||||
| Galaxy Plus Fund - LRR Feeder Fund (522) LLC | 1,483,477 | 1.30 | % | Galaxy Plus Fund - LRR Feeder Fund (522) LLC | 1,483,477 | 1.30 | % | |||||||||||||||||
| Total Private Investment Companies | $ | 66,933,235 | 58.84 | % | Total Private Investment Companies | $ | 66,933,235 | 58.84 | % | |||||||||||||||
| U.S. TREASURY SECURITIES | U.S. TREASURY SECURITIES | |||||||||||||||||||||||
| FACE VALUE | FACE VALUE | Fair Value | Fair Value | FACE VALUE | Fair Value | Fair Value | ||||||||||||||||||
| U.S. TREASURY SECURITIES | ||||||||||||||||||||||||
| $ | 8,269,000 | US Treasury Note 6.875% due 08/15/2025 (Cost $10,985,078) | 10,887,786 | 9.57 | % | 8,269,000 | US Treasury Note 6.875% due 08/15/2025 (Cost $10,985,078) | 10,887,786 | 9.57 | % | ||||||||||||||
| Total U.S. Treasury Securities | $ | 10,887,786 | 9.57 | % | Total U.S. Treasury Securities | $ | 10,887,786 | 9.57 | % | |||||||||||||||
| * | Except for those items disclosed, no individual futures, forwards and option on futures contract position constituted greater than 1 percent of Net Asset Value. Accordingly, the number of contracts and expiration dates are not presented. |
| (1) | See Notes to Consolidated Financial Statements, Note 4. |
| (2) | See Notes to Consolidated Financial Statements, Note 5. |
The accompanying notes are an integral part of these consolidated financial statements.
5466
| Frontier Funds |
| Consolidated Statements of Operations |
| For the Three Months Ended |
| 2018 | 2017 | 2018 | 2017 | |||||||||||||
| Investment income: | ||||||||||||||||
| Interest - net | $ | 60,326 | $ | 114,519 | $ | 58,726 | $ | 42,985 | ||||||||
| Total Income | 60,326 | 114,519 | 58,726 | 42,985 | ||||||||||||
| Expenses: | ||||||||||||||||
| Incentive Fees (rebate) | 148,409 | (117,901 | ) | 10,897 | — | |||||||||||
| Management Fees | 230,889 | 528,788 | 189,058 | 297,987 | ||||||||||||
| Risk analysis Fees | 22,798 | 46,681 | 21,033 | 31,067 | ||||||||||||
| Service Fees - Class 1 | 465,780 | 743,983 | 387,003 | 556,766 | ||||||||||||
| Trading Fees | 870,525 | 1,531,403 | 733,788 | 1,080,095 | ||||||||||||
| Other Fees | — | (2,428 | ) | |||||||||||||
| Total Expenses | 1,738,401 | 2,732,954 | 1,341,779 | 1,963,487 | ||||||||||||
| Investment income/(loss) - net | (1,678,075 | ) | (2,618,435 | ) | (1,283,053 | ) | (1,920,502 | ) | ||||||||
| Realized and unrealized gain/(loss) on investments: | ||||||||||||||||
| Net realized gain/(loss) on futures, forwards and options | (754,751 | ) | 2,104,185 | 1,175,855 | (194,202 | ) | ||||||||||
| Net unrealized gain/(loss) on private investment companies | (9,139,562 | ) | 3,738,486 | (761,505 | ) | (2,049,818 | ) | |||||||||
| Net realized gain/(loss) on private investment companies | 844,793 | 2,423,425 | (146,345 | ) | 1,291,678 | |||||||||||
| Net change in open trade equity/(deficit) | (763,917 | ) | (1,737,987 | ) | (713,117 | ) | 691,294 | |||||||||
| Net unrealized gain/(loss) on swap contracts | 1,532,308 | (1,096,699 | ) | (788,755 | ) | 663,203 | ||||||||||
| Net realized gain/(loss) on U.S. Treasury securities | (288,824 | ) | (934,648 | ) | (98,396 | ) | — | |||||||||
| Net unrealized gain/(loss) on U.S. Treasury securities | (13,612 | ) | 1,136,654 | (16 | ) | (22,945 | ) | |||||||||
| Trading commissions | (18,998 | ) | (70,015 | ) | (23,960 | ) | (24,044 | ) | ||||||||
| Net gain/(loss) on investments | (8,602,563 | ) | 5,563,401 | (1,356,241 | ) | 355,166 | ||||||||||
| NET INCREASE/(DECREASE) IN OWNERS’ CAPITAL RESULTING FROM OPERATIONS | $ | (10,280,638 | ) | $ | 2,944,966 | $ | (2,639,294 | ) | $ | (1,565,336 | ) | |||||
The accompanying notes are an integral part of these consolidated financial statements.
5567
| Frontier Funds |
| Consolidated Statements of Operations |
| For the Nine Months Ended September 30, 2018 and 2017 (unaudited) |
| 2018 | 2017 | |||||||
| Investment income: | ||||||||
| Interest - net | $ | 175,283 | $ | 200,963 | ||||
| Total Income | 175,283 | 200,963 | ||||||
| Expenses: | ||||||||
| Incentive Fees (rebate) | 159,306 | (205,571 | ) | |||||
| Management Fees | 650,179 | 1,263,162 | ||||||
| Risk analysis Fees | 64,753 | 116,226 | ||||||
| Service Fees - Class 1 | 1,264,101 | 1,989,777 | ||||||
| Trading Fees | 2,366,003 | 4,206,610 | ||||||
| Other Fees | — | 220,622 | ||||||
| Total Expenses | 4,504,342 | 7,590,826 | ||||||
| Investment income/(loss) - net | (4,329,059 | ) | (7,389,863 | ) | ||||
| Realized and unrealized gain/(loss) on investments: | ||||||||
| Net realized gain/(loss) on futures, forwards and options | 1,136,964 | (211,381 | ) | |||||
| Net unrealized gain/(loss) on private investment companies | (8,567,706 | ) | (5,325,203 | ) | ||||
| Net realized gain/(loss) on private investment companies | 277,090 | 6,098,199 | ||||||
| Net change in open trade equity/(deficit) | (1,227,357 | ) | (2,179,533 | ) | ||||
| Net unrealized gain/(loss) on swap contracts | 799,575 | 94,319 | ||||||
| Net realized gain/(loss) on U.S. Treasury securities | (500,063 | ) | (2,129,137 | ) | ||||
| Net unrealized gain/(loss) on U.S. Treasury securities | 21,003 | 2,857,993 | ||||||
| Trading commissions | (75,709 | ) | (142,453 | ) | ||||
| Net gain/(loss) on investments | (8,136,203 | ) | (937,196 | ) | ||||
| NET INCREASE/(DECREASE) IN OWNERS’ CAPITAL RESULTING FROM OPERATIONS | $ | (12,465,262 | ) | $ | (8,327,059 | ) | ||
The accompanying notes are an integral part of Contentsthese consolidated financial statements.
68
| Frontier Funds |
| Consolidated Statements of Changes in Owners’ Capital |
| For the |
| Managing | Limited | Managing | Limited | |||||||||||||||||||||
| Owner | Owners | Total | Owner | Owners | Total | |||||||||||||||||||
| Owners’ Capital, December 31, 2017 | 1,159,984 | 112,604,281 | 113,764,265 | 1,159,984 | 112,604,281 | 113,764,265 | ||||||||||||||||||
| Sale of Units (including transfers) | — | — | — | — | — | — | ||||||||||||||||||
| Redemption of Units (including transfers) | — | (6,502,692 | ) | (6,502,692 | ) | — | (20,449,826 | ) | (20,449,826 | ) | ||||||||||||||
| Net increase/(decrease) in Owners’ | ||||||||||||||||||||||||
| Capital resulting from operations | (104,909 | ) | (10,175,729 | ) | (10,280,638 | ) | ||||||||||||||||||
| Payment made by Related Party | — | — | — | |||||||||||||||||||||
| Net increase/(decrease) in Owners’ Capital resulting from operations | (279,860 | ) | (12,185,402 | ) | (12,465,262 | ) | ||||||||||||||||||
| Owners’ Capital, March 31, 2018 | $ | 1,055,075 | $ | 95,925,860 | $ | 96,980,935 | ||||||||||||||||||
| Owners’ Capital, September 30, 2018 | $ | 880,124 | $ | 79,969,053 | $ | 80,849,177 | ||||||||||||||||||
The consolidated Trust is not unitized as are the individual Series of the Trust
The accompanying notes are an integral part of these consolidated financial statements.
5669
| Frontier Funds |
| Consolidated Statements of Cash Flows |
| For the |
| 2018 | 2017 | 2018 | 2017 | |||||||||||||
| Cash Flows from Operating Activities: | ||||||||||||||||
| Net increase/(decrease) in capital resulting from operations | $ | (10,280,638 | ) | $ | 2,944,966 | $ | (12,465,262 | ) | $ | (8,327,059 | ) | |||||
| Adjustments to reconcile net increase/(decrease) in capital resulting from operations to net cash provided by (used in) operating activities: | ||||||||||||||||
| Change in: | ||||||||||||||||
| Net change in open trade equity | 763,917 | 1,737,987 | 1,221,688 | 2,766,175 | ||||||||||||
| Net realized gain/(loss) on futures, forwards and options | — | — | ||||||||||||||
| Net change in ownership allocation of U.S. Treasury Securities | — | |||||||||||||||
| Net unrealized (gain)/loss on swap contracts | (1,532,308 | ) | 1,096,699 | (799,574 | ) | (94,319 | ) | |||||||||
| Net unrealized (gain)/loss on U.S. Treasury securities | 13,612 | (1,136,654 | ) | (21,003 | ) | (2,857,993 | ) | |||||||||
| Net realized (gain)/loss on U.S. Treasuries securities | 288,824 | 934,648 | 500,063 | 2,129,137 | ||||||||||||
| Net unrealized gain/(loss) on private investment companies | 9,139,562 | (4,980,602 | ) | |||||||||||||
| Net realized gain/(loss) on private investment companies | (844,793 | ) | (1,181,309 | ) | ||||||||||||
| Net unrealized (gain)/loss on private investment companies | 8,567,706 | 5,325,203 | ||||||||||||||
| Net realized (gain)/loss on private investment companies | (277,090 | ) | (6,098,199 | ) | ||||||||||||
| (Purchases) sales of: | ||||||||||||||||
| (Purchases) of U.S. Treasury securities | (6,197,080 | ) | — | (16,729,100 | ) | — | ||||||||||
| Sales of U.S. Treasury securities | 9,749,302 | 10,089,672 | 17,281,128 | 31,077,906 | ||||||||||||
| (Purchases) of Private Investment Companies | (13,480,163 | ) | (12,500,000 | ) | (20,597,103 | ) | (48,309,537 | ) | ||||||||
| Sales of Private Investment Companies | 14,510,340 | 22,843,672 | 28,241,174 | 87,612,483 | ||||||||||||
| Reduction of collateral in Swap contracts | 3,100,000 | — | 3,100,000 | 18,578,050 | ||||||||||||
| U.S. Treasury interest and premium paid/amortized | 70,478 | 271,301 | 265,085 | 348,378 | ||||||||||||
| Increase and/or decrease in: | ||||||||||||||||
| Receivable from futures commission merchants | 9,948,318 | (2,049,656 | ) | 9,869,661 | 12,811,157 | |||||||||||
| Interest receivable | 168,264 | 565,020 | 143,074 | 719,026 | ||||||||||||
| Receivable from related parties | (11,636 | ) | 87,670 | 58,146 | 87,670 | |||||||||||
| Other assets | (18,183 | ) | (73,325 | ) | (93,479 | ) | (8,974 | ) | ||||||||
| Incentive fees payable to Managing Owner | 95,373 | — | (42,139 | ) | — | |||||||||||
| Management fees payable to Managing Owner | 85,339 | (103,830 | ) | (11,371 | ) | (325,996 | ) | |||||||||
| Interest payable to Managing Owner | (8,604 | ) | 44,968 | (3,919 | ) | (56,946 | ) | |||||||||
| Trading fees payable to Managing Owner | (206,297 | ) | 507,096 | (96,412 | ) | (168,831 | ) | |||||||||
| Service fees payable to Managing Owner | 127,561 | (66,313 | ) | (40,687 | ) | 70,771 | ||||||||||
| Due from Managing Owner | 475 | — | 31,887 | — | ||||||||||||
| Risk analysis fees payable | 4,779 | 31,008 | 3,034 | 19,815 | ||||||||||||
| Payables to related parties | — | 42,952 | — | (85,078 | ) | |||||||||||
| Other liabilities | (278,983 | ) | 120,908 | (23,486 | ) | (144,049 | ) | |||||||||
| Net cash provided by operating activities | 15,207,457 | 19,226,878 | 18,175,500 | 95,068,790 | ||||||||||||
| Cash Flows from Financing Activities: | ||||||||||||||||
| Proceeds from sale of capital | — | 3,268,287 | — | 1,433,633 | ||||||||||||
| Payment for redemption of capital | (6,502,692 | ) | (14,951,026 | ) | (20,449,826 | ) | (89,319,399 | ) | ||||||||
| Redemptions payable | (23,603 | ) | (1,050,366 | ) | 244,355 | (499,642 | ) | |||||||||
| Net cash used in financing activities | (6,526,295 | ) | (12,733,105 | ) | (20,205,471 | ) | (88,385,408 | ) | ||||||||
| Net increase (decrease) in cash and cash equivalents | 8,681,162 | 6,493,773 | (2,029,971 | ) | 6,683,382 | |||||||||||
| Cash and cash equivalents, beginning of period | 2,695,377 | 4,747,043 | 2,695,377 | 4,747,043 | ||||||||||||
| Cash and cash equivalents, end of period | $ | 11,376,539 | $ | 11,240,816 | $ | 665,406 | $ | 11,430,425 | ||||||||
The accompanying notes are an integral part of these consolidated financial statements.
5770
Frontier Funds
Notes to Consolidated Financial Statements (Unaudited)
1. Organization and Purpose
Frontier Funds, which is referred to in this report as the “Trust”, was formed on August 8, 2003, as a Delaware statutory trust and is set to expire on December 31, 2053. The Trust is a multi-advisor commodity pool, as described in CFTC Regulation § 4.10(d)(2). The Trust has authority to issue separate Series of Units pursuant to the requirements of the Trust Act. The assets of each Series are valued and accounted for separately from the assets of other Series. The Trust is not registered as an investment company under the Investment Company Act. It is managed by the Managing Owner.
Purchasers of Units are Limited Owners of the Trust with respect to beneficial interests of the Series’ Units purchased. The Trust Act provides that, except as otherwise provided in the second amended and restated declaration of trust and trust agreement dated December 9, 2013, as further amended, by and among the Managing Owner, Wilmington Trust Company as trustee and the unitholders, as amended from time to time (the “Trust Agreement”), unitholders of the Trust will have the same limitation of liability as do stockholders of private corporations organized under the General Corporation Law of the State of Delaware. The Trust Agreement confers substantially the same limited liability, and contains the same limited exceptions thereto, as would a limited partnership agreement for a Delaware limited partnership engaged in like transactions as the Trust. In addition, pursuant to the Trust Agreement, the Managing Owner of the Trust is liable for obligations of a Series in excess of that Series’ assets. Limited Owners do not have any such liability. The Managing Owner will make contributions to the Series of the Trust necessary to maintain at least a 1% interest in the aggregate capital, profits and losses of all Series.
The Trust has been organized to pool investor funds for the purpose of trading in the U.S. and international markets for currencies, interest rates, stock indices, agricultural and energy products, precious and base metals and other commodities. The Trust may also engage in futures contracts, forwards, option contracts and other interest in derivative instruments, including swap contracts.
The Trust has seven (7) separate and distinct Series of Units issued and outstanding: Frontier Diversified Fund, Frontier Masters Fund, Frontier Long/Short Commodity Fund, Frontier Balanced Fund, Frontier Select Fund, Frontier Winton Fund, and Frontier Heritage Fund. The Trust financial statements are comprised of unitized Series which are consolidated into the Trust financial statements. However, the consolidated Trust does not issue units.
The Trust, with respect to each Series:
| engages in the speculative trading of a diversified portfolio of futures, forwards (including interbank foreign currencies), options contracts and other derivative instruments (including swap contracts), and may, from time to time, engage in cash and spot transactions; |
| allocates funds to a limited liability trading company or companies (“Trading Company” or “Trading Companies”) and Galaxy Plus entities (“Galaxy Plus”). Except as otherwise described in these notes, each Trading Company and Galaxy Plus entity has one-year renewable contracts with its own independent commodity trading advisor (s), or each, a Trading Advisor, that will manage all or a portion of such Trading Company’s and Galaxy Plus assets and make the trading decisions for the assets of each Series vested in such Trading Company and Galaxy Plus entity. Each Trading Company and Galaxy Plus entity will segregate its assets from any other Trading Company and Galaxy Plus entity; |
| maintains separate, distinct records for each Series, and accounts for the assets of each Series separately from the other Series; |
| calculates the Net Asset Value (“NAV”) of its Units for each Series separately from the other Series; |
| has an investment objective of increasing the value of each Series’ Units over the long term (capital appreciation), while managing risk and volatility; further, to offer exposure to the investment programs of individual Trading Advisors and to specific instruments; |
71
| maintains each Series of Units in three to seven sub-classes—Class 1, Class 1AP, Class 1a, Class 2, Class 2a, Class 3, and Class 3a. Investors who have purchased Class 1 or Class 1a Units of Frontier Diversified Fund, Frontier Masters Fund, and Frontier Long/Short Commodity Fund are charged a service fee of up to two percent (2.0%) annually of the NAV (of the purchase price, in case of the initial service fee) of each Unit purchased, for the benefit of selling agents selling such Class 1 or Class 1a Units. The initial service fee, which is amortized monthly at an annual rate of up to two percent (2.0%) of the average daily NAV of Class 1 or Class 1a of such Series, is prepaid to the Managing Owner by each Series, and paid to the selling agents by the Managing Owner in the month following sale; provided, however, that investors who redeem all or a portion of their Class 1 or Class 1a Units of any Series during the first twelve (12) months following the effective date of their purchase are subject to a redemption fee of up to two percent (2.0%) of the purchase price at which such investor redeemed to reimburse the Managing Owner for the then-unamortized balance of the prepaid initial service fee. Investors who have purchased Class 1 or Class 1a Units of Frontier Balanced Fund, Frontier Heritage Fund, Frontier Select Fund, and Frontier Winton Fund are charged a service fee of up to three percent (3.0%) annually of the NAV (of the purchase price, in case of the initial service fee) of each Unit purchased, for the benefit of selling agents selling such Class 1 or Class 1a Units. The initial service fee, which is amortized monthly at an annual rate of up to three percent (3.0%) of the average daily NAV of Class 1 or Class 1a of such Series, is prepaid to the Managing Owner by each Series, and paid to the selling agents by the Managing Owner in the month following sale. With respect to Class 2 and Class 2a Units of any Series, the Managing Owner pays an ongoing service fee to selling agents of up to one half percent (0.5%) annually of the NAV of each Class 2 or Class 2a Unit (of which 0.25% will be charged to Limited Owners holding Class 2 Units of the Frontier Diversified Fund, and Frontier Masters Fund or Class 2a Units of the Frontier Long/Short Commodity Fund sold until such Class 2 or Class 2a Units which are subject to the fee limitation are reclassified as Class 3 or Class 3a Units of the applicable Series. Class 1AP was created as a sub-class of Class 1 and it has been presented separately because the fees applicable to it are different from those applicable to Class 1. Currently the service fee is not charged to Class 1AP investors. The Managing Owner may also pay selling agents certain additional fees and expenses for administrative and other services rendered and expenses incurred by such selling agents; and |
58
| all payments made to selling agents who are members of the Financial Industry Regulatory Authority, Inc. (“FINRA”) and their associated persons that constitute underwriting compensation will be subject to the limitations set forth in Rule 2310(b)(4)(B)(ii) (formerly Rule 2810(b)(4)(B)(ii)) of the Conduct Rules of FINRA (“Rule 2310”). An investor’s Class 1 Units or Class 2 Units of any Series, or Class 1a Units or Class 2a Units of the Frontier Long/Short Commodity Fund or Frontier Balanced Fund will be classified as Class 3 or Class 3a Units of such Series, as applicable, when the Managing Owner determines that the fee limitation set forth in Rule 2310 with respect to such Units has been reached or will be reached. The service fee limit applicable to each unit sold is reached upon the earlier of when (i) the aggregate initial and ongoing service fees received by the selling agent with respect to such unit equals 9% of the purchase price of such unit or (ii) the aggregate underwriting compensation (determined in accordance with FINRA Rule 2310) paid in respect of such unit totals 10% of the purchase price of such unit. No service fees are paid with respect to Class 3 or Class 3a Units. Units of any Class in a Series may be redeemed, in whole or in part, on a daily basis, at the then current NAV per Unit for such Series on the day of the week after the date the Managing Owner is in receipt of a redemption request for at least one (1) Business Day to be received by the Managing Owner prior to 4:00 PM in New York. |
The assets of any particular Series include only those funds and other assets that are paid to, held by or distributed to the Trust on account of and for the benefit of that Series. Under the “Inter-Series Limitation on Liability” expressly provided for under Section 3804(a) of the Trust Act, separate and distinct records of the cash and equivalents, although pooled for maximizing returns, is maintained in the books and records of each Series.
As of March 31,September 30, 2018, the Trust, with respect to the Frontier Diversified Fund and Frontier Masters Fund, separates Units into three separate Classes—Class 1, Class 2, and Class 3. The Trust, with respect to the Frontier Select Fund Frontier Winton Fund and Frontier Heritage Fund separates Units into a maximum of three separate Classes- Class 1, Class 2 and Class 1AP. The Trust, with respect to the Frontier Balanced Fund separates Units into a maximum of five separate Classes—Class 1, Class 1AP, Class 2, Class 2A and Class 3A. The Trust, with respect to the Frontier Long/Short Commodity Fund separates Units into a maximum of five separate Classes—Class 1A, Class 2A, Class 2, Class 3A and Class 3. Between April 15, 2016 and May 10, 2017, a portion of the interests in Frontier Trading Company I, LLC and all of the interests in Frontier Trading Company VII, LLC, Frontier Trading Company XV, LLC, and Frontier Trading Company XXIII LLC held by Frontier Diversified Fund, Frontier Masters Fund, Frontier Select Fund, Frontier Balanced Fund and Frontier Long/Short Commodity Fund were exchanged for equivalent interests in the Galaxy Plus Managed Account Platform (“Galaxy Plus”) which is an unaffiliated, third-party managed account platform. The assets of Frontier Trading Company I, LLC, which included exposure to Quantmetrics Capital Management LLP’s Multi-Strategy Program, Quantitative Investment Management, LLC’s Quantitative Global Program, Quest Partners LLC’s Quest Tracker Index Program, and Doherty Advisors LLC’s Relative Value Moderate Program, the assets of Frontier Trading Company VII, LLC, which included exposure to Emil van Essen LLC’s Multi-Strategy Program, Red Oak Commodity Advisors, Inc.’s Fundamental Diversified Program, Rosetta Capital Management, LLC’s Rosetta Trading Program, and Landmark Trading Company’s Landmark Program, the assets of Frontier Trading Company XV, LLC, which included exposure to Transtrend B.V.’s TT Enhanced Risk (USD) Program, and the assets of Frontier Trading Company XXIII, LLC which included exposure to Fort L.P.’s Global Contrarian Program have been transferred to individual Delaware limited liability companies (“Master Funds”) in Galaxy Plus. Each Master Fund is sponsored and operated by Gemini Alternative Funds, LLC (“Sponsor”). The Sponsor has contracted with the Trading Advisors to manage the portfolios of the Master Funds pursuant to the advisors’ respective program. For those Series that invest in Galaxy Plus, approximately 30-70% of those Series assets are used to support the margin requirements of the Master Funds. The remaining assets of the Series are split between investments in Trading Companies and a pooled cash management account that invests primarily in U.S. Treasury securities. For those Series that do not invest in Galaxy Plus, their assets are split between investments in Trading Companies and investments in the pooled cash management account.
5972
As of March 31,September 30, 2018, Frontier Winton Fund has invested a portion of its assets in a singleinto two Trading Company,Companies, and a single Trading Advisor manages 100% of the assets invested in sucheach of these Trading Company.Companies. Each of the remaining Series has invested a portion of its assets in several different Trading Companies or Galaxy Plus entities and one or more Trading Advisors may manage the assets invested in such Trading Companies or Galaxy Plus entities.
The Trust has entered into agreements, which provide for the indemnification of futures clearing brokers, currency trading companies, and commodity trading advisers, among others, against losses, costs, claims and liabilities arising from the performance of their individual obligations under such agreements, except for gross negligence or bad faith.
2. Significant Accounting Policies
The following are the significant accounting policies of the Trust.
Basis of Presentation—The Trust follows GAAP, as established by the Financial Accounting Standards Board (the “FASB”), to ensure consistent reporting of financial condition, condensed schedules of investments, results of operations, changes in capital and cash flows. The Trust is an investment company following accounting and reporting guidance in Accounting Standards Codification (“ASC”) 946.
Consolidation—The Series, through investing in the Trading Companies and Galaxy Plus, authorize certain Trading Advisors to place trades and manage assets at pre-determined investment levels. The Trading Companies were organized by the Managing Owner for the purpose of investing in commodities interests and derivative instruments, and have no operating income or expenses, except for trading income and expenses and a risk analysis fee (for closed Series only), all of which is allocated to the Series, if consolidated by a Series. Galaxy Plus is a series of Delaware limited liability companies, sponsored by Gemini Alternative Funds, LLC, that create exposure to a variety of third party professional managed futures and foreign exchange advisors. Galaxy Plus is available to qualified high-net-worth individuals and institutional investors. Investment interests in Galaxy Plus entities are accounted for using net asset value as the practical expedient, which approximates fair value. Fair value represents the proportionate share of the Trust’s interest in the NAV in the Galaxy Plus entities. The equity interest held by Trust is shown as investments in private investment companies in the statements of financial condition. The income or is shown in the statements of operations as net unrealized gain/(loss) on private investment companies. The Trading Companies and Series of the Trust are consolidated by the Trust.
Galaxy Plus entities are co-mingled investment vehicles. In addition to the Trust, there are other non-affiliated investors in Galaxy Plus. Subscriptions and redemptions by these non-affiliated investors will have a direct impact on the Trust ownership percentage in Galaxy Plus. It is expected that ownership percentage will fluctuate (sometimes significantly) on a week by week basis which could also result in frequent changes in the consolidating Series. Such fluctuations make consolidating the financial statements of the Galaxy Plus entities both impractical and misleading. Non-consolidation of these Galaxy Plus entities presents a more useful financial statement for the readers. As such, management has decided that presenting Galaxy Plus entities on a non-consolidated basis as investments in other investments companies (a “fund of funds” approach) is appropriate and preferable to the users of these financial statements. Refer to Note 5 for additional disclosures related to these private investment companies.
73
Change in Consolidation Method—In February 2017, the Trust elected to change its method by which it consolidates its investments in the Galaxy Plus entities and applied to its December 31, 2016 financial statements. Prior to the change, any Series that had a controlling interest in a Galaxy Plus entity would consolidate the assets and liabilities of that entity into its Statement of Financial Condition and the profit and loss into the Statement of Operations. The Managing Owner believes that this treatment does not provide meaningful data to the end user of the financial statements. As such, all investments in Galaxy Plus entities are accounted for using the net asset value as the practical expedient. In accordance with ASC 250 (Accounting Changes and Error Corrections), the comparative financial statements as of and for the three and nine months ended September 30, 2016 have been adjusted to apply the new method retrospectively. This will impact management fees, incentive fees (rebate), net realized gain/(loss) on futures, forwards and options, net change in open trade equity/(deficit), net unrealized gain/(loss) on private investment companies, net realized gain/(loss) on private investment companies, and operations attributable to non-controlling interests on the Statement of Operations. We also note that there is no impact to total capital or net increase/(decrease) in capital resulting from operations attributable to controlling interests.
Use of Estimates—The preparation of consolidated financial statements in conformity with GAAP may require the Managing Owner to make estimates and assumptions that affect the reported amounts of assets and liabilities and disclosure of contingent assets and liabilities at the date of the financial statements and the reported amounts of revenue and expenses during the reporting period. The valuation of swap contracts requires significant estimates as well as the valuation of certain other investments. Please refer to Note 3 for discussion of valuation methodology. Actual results could differ from these estimates and such differences could be material.
60
Cash and Cash Equivalents—Cash and cash equivalents include cash and overnight investments in interest-bearing demand deposits held at banks with original maturities of three months or less. This cash is not restricted.
Interest Income—U.S. Treasury Securities are pooled for purposes of maximizing returns on these assets to investors of all Series. Interest income from pooled cash management assets is recognized on the accrual basis and allocated daily to each Series based upon its daily proportion of ownership of the pool. Aggregate interest income from all sources, including U.S. Treasuries and assets held at a futures commission merchant (“FCM”), of up to two percentage points of the aggregate percentage yield (annualized) of net asset value less any fair market value related to swaps, is paid to the Managing Owner by the Frontier Balanced Fund (Class 1 and Class 2), Frontier Long/Short Commodity Fund (Class 2 and Class 3), Frontier Winton Fund, Frontier Select Fund, and Frontier Heritage Fund. For the Frontier Diversified Fund, Frontier Long/Short Commodity Fund (Class 1a, Class 2a, Class 3a only), Frontier Masters Fund, and Frontier Balanced Fund (Class 1AP, Class 2a and Class 3a) 100% of the interest is retained by the respective Series. All interest not paid to the Managing Owner is interest income to the Series, and shown net on the statement of operations.
U.S. Treasury Securities—U.S. Treasury Securities are reported at fair value as Level 1 inputs under ASC 820,Fair ValueMeasurements and Disclosures (“ (“ASC 820”). The Trust values U.S. Treasury Securities at fair value and records the daily change in value in the consolidated statements of operations as net unrealized gain/(loss) on U.S. Treasury securities. Accrued interest is reported on the consolidated statements of financial condition as interest receivable.
Receivable from Futures Commission Merchants—The Trust deposits assets with a FCM subject to CFTC regulations and various exchange and broker requirements. Margin requirements are satisfied by the deposit of cash with such FCM. The Trust earns interest income on its assets deposited with the FCM. A portion of the receivable is restricted cash required to meet maintenance margin requirements. Cash with the clearing broker as of March 31,September 30, 2018 included restricted cash for margin requirements of $1,838,199$1,450,731 for the Frontier Trading Company I LLC and $3,693,894$4,305,571 for Frontier Trading Company II LLC.
Investment Transactions—Futures, options on futures, forward and swap contracts are recorded on a trade date basis and realized gains or losses are recognized when contracts are settled. Unrealized gains or losses on open contracts (the difference between contract trade price and market price) are reported in the consolidated statements of financial condition as a net unrealized gain or loss, as there exists a right of offset of unrealized gains or losses in accordance with FASB ASC 210,Balance Sheet (“ASC 210”) and Accounting Standards Update (ASU) 2013-01,Balance Sheet (Topic 210).
Any change in net unrealized gain or loss from the preceding period is reported in the consolidated statements of operations. Fair value of exchange-traded contracts is based upon exchange settlement prices. Fair value of non-exchange-traded contracts is based on third party quoted dealer values on the interbank market. For U.S. Treasury securities, interest was recognized in the period earned and the instruments were marked-to-market daily based on third party information. Transaction costs are recognized as incurred and reflected separately in the consolidated statements of operations.
74
Purchase and Sales of Private Investment Companies – The Trust is able to subscribe into and redeem from the Galaxy Plus entities on a weekly basis. The value of the private investment companies is determined by the Sponsor and reported on a daily basis. The change in value is calculated as the difference between the total purchase proceeds and the fair value calculated by the Sponsor and is recorded as net unrealized gain/(loss) on private investment companies on the statements of operations.
Foreign Currency Transactions—The Series of the Trust’s functional currency is the U.S. dollar; however, they transact business in currenciesCurrencies other than the U.S. dollar. The Series of the Trust do not isolate that portion of the results of operations resulting from changes in foreign exchange rates on investments from fluctuations arising from changes in market prices of securities held. Such fluctuations are included with the net realized or unrealized gain or loss from investments.
61
Allocation of Earnings—Each Series of the Trust may maintain three to seven classes of Units—Class 1, Class 2, Class 3, Class 1a, Class 2a Class 3a and Class 1AP. All classes have identical voting, dividend, liquidation and other rights and the same terms and conditions, except that fees charged to a Class or Series differ as described below. Revenues, expenses (other than expenses attributable to a specific class), and realized and unrealized trading gains and losses of each Series are allocated daily to Class 1, Class 1a, Class 2, Class 2a, Class 3, Class 3a and Class 1AP Units based on each Class’ respective owners’ capital balances as applicable to the classes maintained by the Series.
Each Series allocates funds to an affiliated Trading Company, or Companies, of the Trust, or unaffiliated Galaxy Plus entity. Each Trading Company allocates all of its daily trading gains or losses to the Series in proportion to each Series’ ownership trading level interest in the Trading Company, adjusted on a daily basis (except for Trading Advisors and other investments such as swaps that are directly allocated to a specific series). Likewise, trading gains and losses earned and incurred by the Series through their investments in Galaxy Plus entities are allocated to those Series on a daily basis. The allocation of gains and losses in Galaxy Plus entities are based on each Series pro-rata shares of the trading level of that entity which is updated at the beginning of each month or more frequently if there is a subscription or redemption activity in the entity. The value of all open contracts and cash held at clearing brokers is similarly allocated to the Series in proportion to each Series’ funds allocated to the Trading Companies or Galaxy Plus entities.
Investments and Swaps— The Trust records investment transactions on a trade date basis and all investments are recorded at fair value, with changes in fair value reported as a component of realized and unrealized gains/(losses) on investments in the statements of operations. Investments in private investment companies are valued utilizing the net asset values as a practical expedient. Certain Series of the Trust strategically invest a portion or all of their assets in total return swaps, selected at the discretion of the Managing Owner. Swaps are privately negotiated contracts designed to provide investment returns linked to those produced by one or more underlying investment products or indices. In a typical swap, two parties agree to exchange the returns (or differentials in rates of return) earned or realized on one or more particular predetermined investments or instruments. The gross returns to be exchanged or “swapped” between the parties are calculated with respect to a “notional amount” (i.e., the amount of value of the underlying asset used in computing the particular interest rate, return, or other amount to be exchanged) in a particular investment, or in a “basket” of securities. The valuation of swap contracts requires significant estimates..estimates. Swap contracts are reported at fair value based upon daily reports from the counterparty. The Managing Owner reviews and approves current day pricing of the CTA positions, as received from the counterparty which includes intra-day volatility and volume and daily index performance, that is used to determine a daily fair value NAV for the swap contracts.
Income Taxes—The Trust applies the provisions of ASC 740Income Taxes(“ASC 740”), which provides guidance for how uncertain tax positions should be recognized, measured, presented and disclosed in the financial statements. This interpretation also provides guidance on derecognition, classification, interest and penalties, accounting in interim periods and disclosure. ASC 740 requires the evaluation of tax positions taken or expected to be taken in the course of preparing the Trust’s financial statements to determine whether the tax positions are “more-likely-than-not” of being sustained by the applicable tax authority. Tax positions with respect to tax at the Trust’s level not deemed to meet the “more-likely-than-not” threshold would be recorded as a tax benefit or expense in the current year. The Managing Owner has concluded there is no tax expense, interest or penalties to be recorded by the Trust for the year ended December 31, 2017. The 2014 through 2017 tax years generally remain subject to examination by U.S. federal and most state tax authorities.
75
In the opinion of the Managing Owner, (i) the Trust is treated as a partnership for Federal income tax purposes and, assuming that at least 90% of the gross income of the Trust constitutes “qualifying income” within the meaning of Section 7704(d) of the Code, (ii) the Trust is not a publicly traded partnership treated as a corporation, and (iii) the discussion set forth in the Prospectus under the heading “U.S. Federal Income Tax Consequences” correctly summarizes the material Federal income tax consequences as of the date of the Prospectus to potential U.S. Limited Owners of the purchase, ownership and disposition of Series Units of the Trust.
Fees and Expenses—All management fees, incentive fees, service fees, risk analysis feefees (for closed Series only) and trading fees of the Trust, with respect to the Series, are paid to the Managing Owner. It is the responsibility of the Managing Owner to pay all Trading Advisor management and incentive fees, selling agent service fees and all other operating expenses and continuing offering costs of the Trust, with respect to the Series. Only management fees and incentive fees related to assets allocated through Trading Companies are included in expense on the Statement of Operations. The Series are all charged management and incentive fees on the asset allocated through the Galaxy Plus entities. Those fees are included in unrealized gain/(loss) on private investment companies on the Statements of Operations. The Series are also charged management and incentive fees on assets allocated to swaps. Such fees are embedded in the fair value of the swap and are included in net unrealized gain (loss) on swap contracts on the Statements of Operations. Certain Series are also changed a risk analysis fee (for closed Series only) based on a percentage of nominal assets. Such fee is paid to a third party.
Incentive Fee (rebate)—The Managing Owner is allowed to share in the incentive fees earned by the Commodity Trading Advisors up to 10% of New Net Profits (as defined in the prospectus). If the Managing Owner’s share of the incentive fee exceeds 10% of new net profits during the period, then the Managing Owner is obligated to return any amount in excess. The returned amounts are recorded as Incentive Fee (Rebate) on the Statements of Operations.
62
Service Fees—The Trust may maintain each Series of Units in three to seven sub-classes—Class 1, Class 1AP, Class 1a, Class 2, Class 2a, Class 3, and Class 3a. Investors who have purchased Class 1 or Class 1a Units of Frontier Diversified Fund, Frontier Masters Fund, and Frontier Long/Short Commodity Fund are charged a service fee of up to two percent (2.0%) annually of the NAV (of the purchase price, in case of the initial service fee) of each Unit purchased, for the benefit of selling agents selling such Class 1 or Class 1a Units. The initial service fee, which is amortized monthly at an annual rate of up to two percent (2.0%) of the average daily NAV of Class 1 or Class 1a of such Series, is prepaid to the Managing Owner by each Series, and paid to the selling agents by the Managing Owner in the month following sale; provided, however, that investors who redeem all or a portion of their Class 1 and Class 1a Units of any Series during the first twelve (12) months following the effective date of their purchase are subject to a redemption fee of up to two percent (2.0%) of the purchase price at which such investor redeemed to reimburse the Managing Owner for the then-unamortized balance of the prepaid initial service fee. Investors who have purchased Class 1 or Class 1a Units of Frontier Balanced Fund, Frontier Heritage Fund, Frontier Select Fund, and Frontier Winton Fund are charged a service fee of up to three percent (3.0%) annually of the NAV (of the purchase price, in case of the initial service fee) of each Unit purchased, for the benefit of selling agents selling such Class 1 or Class 1a Units. The initial service fee, which is amortized monthly at an annual rate of up to three percent (3.0%) of the average daily NAV of Class 1 or Class 1a of such Series, is prepaid to the Managing Owner by each Series, and paid to the selling agents by the Managing Owner in the month following sale; provided, however, that investors who redeem all or a portion of their Class 1 and Class 1a Units of any Series during the first twelve (12) months following the effective date of their purchase are subject to a redemption fee of up to three percent (3.0%) of the purchase price at which such investor redeemed to reimburse the Managing Owner for the then-unamortized balance of the prepaid initial service fee. With respect to Class 2 and Class 2a Units of any Series, the Managing Owner pays an ongoing service fee to Selling agents of up to one half percent (0.5%) annually of the NAV of each Class 2 or Class 2a Unit (of which 0.25% will be charged to Limited Owners holding Class 2 Units of the Frontier Diversified Fund and Frontier Masters Fund or Class 2a Units of the Frontier Long/Short Commodity Fund sold) until such Class 2 or Class 2a Units which are subject to the fee limitation are reclassified as Class 3 or Class 3a Units of the applicable Series for administrative purposes. Currently the service fee is not charged to Class 1AP investors. The Managing Owner may also pay selling agents certain additional fees and expenses for administrative and other services rendered and expenses incurred by such Selling agents.
76
These service fees are part of the offering costs of the Trust, which include registration and filing fees, legal and blue sky expenses, accounting and audit, printing, marketing support and other offering costs which are borne by the Managing Owner. With respect to the service fees, the initial service fee (for the first 12 months) relating to a purchase of Class 1 and Class 1a Units by an investor is prepaid by the Managing Owner to the relevant selling agent in the month following such purchase and is reimbursed for such payment by the Series monthly in arrears in an amount based upon a corresponding percentage of NAV, calculated daily. Consequently, the Managing Owner bears the risk of the downside and enjoys the benefit of the upside potential of any difference between the amount of the initial service fee prepaid by it and the amount of the reimbursement thereof, which may result from variations in NAV over the following 12 months.
Pending Owner Additions—Funds received for new subscriptions and for additions to existing owner interests are recorded as capital additions at the NAV per unit of the second business day following receipt.
Owner redemptions payable—Funds payable for existing owner redemption requests are recorded as capital subtractions at the NAV per unit as of the second business day following receipt or request.
Subsequent Events—The Trust follows the provisions of ASC 855,Subsequent Events, which establishes general standards of accounting for and disclosure of events that occur after the balance sheet date and up through the date the financial statements are issued.
3. Fair Value Measurements
In connection with the valuation of investments the Trust applies ASC 820. ASC 820 provides clarification that when a quoted price in an active market for the identical asset or liability is not available, a reporting entity is required to measure fair value using certain techniques. ASC 820 also clarifies that when estimating the fair value of an asset or liability, a reporting entity is not required to include a separate input or adjustment to other inputs relating to the existence of a restriction that prevents the transfer of an asset or liability. ASC 820 also clarifies that both a quoted price in an active market for the identical asset or liability at the measurement date and the quoted price for the identical asset or liability when traded as an asset in an active market when no adjustments to the quoted price of the asset are required are Level 1 fair value measurements.
Level 1 Inputs
Unadjusted quoted prices in active markets for identical financial assets that the reporting entity has the ability to access at the measurement date.
Level 2 Inputs
Inputs other than quoted prices included in Level 1 that are observable for the financial assets or liabilities, either directly or indirectly. These might include quoted prices for similar financial assets in active markets, quoted prices for identical or similar financial assets in markets that are not active, inputs other than quoted prices that are observable for the financial assets or inputs that are derived principally from or corroborated by market data by correlation or other means.
63
Level 3 Inputs
Unobservable inputs for determining the fair value of financial assets that reflect an entity’s own assumptions about the assumptions that market participants would use in pricing the financial asset.
The Trust, with respect to the Series, uses the following methodologies to value instruments within its financial asset portfolio at fair value:
Trading Securities. These instruments include U.S. Treasury securities and open trade equity positions (futures contracts) that are actively traded on public markets with quoted pricing for corroboration. U.S. Treasury securities and futures contracts are reported at fair value using Level 1 inputs. Trading securities instruments further include open trade equity positions (trading options and currency forwards) that are quoted prices for identical or similar assets that are not traded on active markets. Trading options and currency forwards are reported at fair value using Level 2 inputs.
77
Swap Contracts.Certain Series of the Trust strategically invest a portion or all of their assets in total return swaps, selected at the direction of the Managing Owner. Swaps are privately negotiated contracts designed to provide investment returns linked to those produced by one or more investment products or indices. In a typical swap, two parties agree to exchange the returns (or differentials in rates of return) earned or realized on one or more particular predetermined investments or instruments. The gross returns to be exchanged or “swapped” between parties are calculated with respect to a “notional amount” (i.e., the amount of value of the underlying asset used in computing the particular interest rate, return, or other amount to be exchanged) in a particular investment, or in a “basket” of securities. Swap contracts are reported at fair value upon daily reports from the counterparty.
Investments in Private Investment Companies. Investments in private investment companies are valued utilizing the net asset values provided by the underlying private investment companies as a practical expedient. A Series applies the practical expedient to its investments in private investment companies on an investment-by-investment basis, and consistently with the Series’ entire position in a particular investment, unless it is probable that the Series will sell a portion of an investment at an amount different from the net asset value of the investment.
The following table summarizes the instruments that comprise the Trust financial asset portfolio, by Series, measured at fair value on a recurring basis as of March 31,September 30, 2018 and December 31, 2017 segregated by the level of valuation inputs within the fair value hierarchy utilized to measure fair value.
| March 31, 2018 | Level 1 Inputs | Level 2 Inputs | Level 3 Inputs | Fair Value | ||||||||||||||||||||||||||||
| September 30, 2018 | Level 1 Inputs | Level 2 Inputs | Level 3 Inputs | Fair Value | ||||||||||||||||||||||||||||
| Open Trade Equity (Deficit) | $ | 776,391 | $ | 28,106 | $ | — | $ | 804,497 | $ | 645,197 | $ | (298,471 | ) | $ | — | $ | 346,726 | |||||||||||||||
| Swap Contracts | — | — | 19,641,146 | 19,641,146 | — | — | 18,908,412 | 18,908,412 | ||||||||||||||||||||||||
| U.S. Treasury Securities | 6,962,652 | — | — | 6,962,652 | 9,591,613 | — | — | 9,591,613 | ||||||||||||||||||||||||
| Total | Total | |||||||||||||||||||||||||||||||
| December 31, 2017 | Level 1 Inputs | Level 2 Inputs | Level 3 Inputs | Fair Value | Level 1 Inputs | Level 2 Inputs | Level 3 Inputs | Fair Value | ||||||||||||||||||||||||
| Open Trade Equity (Deficit) | $ | 1,145,940 | $ | 422,474 | $ | — | $ | 1,568,414 | $ | 1,145,940 | $ | 422,474 | $ | — | $ | 1,568,414 | ||||||||||||||||
| Swap Contracts | — | — | 21,208,838 | 21,208,838 | — | — | 21,208,838 | 21,208,838 | ||||||||||||||||||||||||
| U.S. Treasury Securities | 10,887,786 | — | — | 10,887,786 | 10,887,786 | — | — | 10,887,786 | ||||||||||||||||||||||||
6478
The changes in Level 3 assets measured at fair value on a recurring basis are summarized in the following tables. Swap contract asset gains and losses (realized/unrealized) included in earnings are classified in “realized and unrealized gain (loss) on investments – net unrealized gain/(loss) on swap contracts” on the statements of operations.
| For the Three | ||||
| months ended | ||||
| March 31, 2018 | ||||
| Balance of recurring Level 3 assets as of January 1, 2018 | 21,208,838 | |||
| Total gains or losses (realized/unrealized): | ||||
| Included in earnings-realized | — | |||
| Included in earnings-unrealized | 1,532,308 | |||
| Proceeds from collateral reduction | (3,100,000 | ) | ||
| Purchase of investments | — | |||
| Sale of investments | — | |||
| Transfers in and/or out of Level 3 | — | |||
| Balance of recurring Level 3 assets as of March 31, 2018 | 19,641,146 | |||
| For the Year ended | ||||
| December 31, 2017 | ||||
| Balance of recurring Level 3 assets as of January 1, 2017 | $ | 40,189,178 | ||
| Total gains or losses (realized/unrealized): | ||||
| Included in earnings-realized | — | |||
| Included in earnings-unrealized | (402,290 | ) | ||
| Proceeds from collateral reduction | (18,578,050 | ) | ||
| Purchase of investments | — | |||
| Sale of investments | — | |||
| Transfers in and/or out of Level 3 | — | |||
| Balance of recurring Level 3 assets as of December 31, 2017 | $ | 21,208,838 | ||
Swaps
| For the Nine months ended September 30, 2018 | ||||
| Balance of recurring Level 3 assets as of January 1, 2018 | 21,208,838 | |||
| Total gains or losses (realized/unrealized): | ||||
| Included in earnings-realized | — | |||
| Included in earnings-unrealized | 799,575 | |||
| Proceeds from collateral reduction | (3,100,000 | ) | ||
| Purchase of investments | — | |||
| Sale of investments | — | |||
| Transfers in and/or out of Level 3 | — | |||
| Balance of recurring Level 3 assets as of September 30, 2018 | 18,908,412 | |||
| For the Year ended December 31, 2017 | ||||
| Balance of recurring Level 3 assets as of January 1, 2017 | $ | 40,189,178 | ||
| Total gains or losses (realized/unrealized): | ||||
| Included in earnings-realized | — | |||
| Included in earnings-unrealized | (402,290 | ) | ||
| Proceeds from collateral reduction | (18,578,050 | ) | ||
| Purchase of investments | — | |||
| Sale of investments | — | |||
| Transfers in and/or out of Level 3 | — | |||
| Balance of recurring Level 3 assets as of December 31, 2017 | $ | 21,208,838 | ||
79
The Trust assesses the levels of the investments at each measurement date, and transfers between levels are recognized on the actual date of the event or change in circumstances that caused the transfer in accordance with the Trust’s accounting policy regarding the recognition of transfers between levels of the fair value hierarchy. During the threenine months ended March 31,September 30, 2018, the Trust did not transfer any assets between Levels 1, 2 and 3.
The total change in unrealized appreciation (depreciation) included in the statements of operations attributable to level 3 investments still held at March 31,September 30, 2018:
| Swap contracts | $ |
The total change in unrealized appreciation (depreciation) included in the statements of operations attributable to level 3 investments still held at December 31, 2017:
| Swap contracts | $ |
65
Table of Contents4. Swaps Contracts
In addition to authorizing Trading Advisors to manage pre-determined investment levels of futures and forward contracts, certain Series of the Trust will strategically invest a portion or all of their assets in total return swaps, selected at the direction of the Managing Owner. Total return swaps are privately negotiated contracts designed to provide investment returns linked to those produced by one or more investment products or indices. In a typical total return swap, two parties agree to exchange the returns (or differentials in rates of return) earned or realized on one or more particular predetermined investments or instruments. The gross returns to be exchanged or “swapped” between the parties are calculated with respect to a “notional amount” (i.e., the amount or value of the underlying asset used in computing the particular interest rate, return, or other amount to be exchanged) in a particular investment, or in a “basket” of securities.
The Trust’s investment in swaps will likely differ substantially over time due to cash flows, portfolio management decisions and market movements. The swaps serve to diversify the investment holdings of the Trust and to provide access to programs and advisors that would not be otherwise available to the Trust, and are not used for hedging purposes.
The Managing Owner follows a procedure in selecting well-established financial institutions which the Managing Owner, in its sole discretion, considers to be reputable, reliable, financially responsible and well established to act as swap counterparties. The procedure includes due diligence review of documentation on all new and existing financial institution counterparties prior to initiation of the relationship, and quarterly ongoing review during the relationship, to ensure that counterparties meet the Managing Owner’s minimum credit requirements, the counterparty average rating being no less than an investment grade rating as defined by the rating agencies. As of March 31,September 30, 2018 and December 31, 2017, approximately 4.0%1.46% or $4,284,450$1,180,900 and 3.80% or $4,284,450, respectively, of the Trust’s assets were deposited with over-the-counter counterparties in order to initiate and maintain swaps and is recorded as Swap Contracts, at fair value on the Statements of Financial Condition of the Trust. This cash held with the counterparty is not restricted.
The Trust strategically invests assets in one or more swaps linked to certain underlying investments or indices at the direction of the Managing Owner. The Trading Company in which the assets of the Trust will be invested will not own any of the investments or indices referenced by any swap entered into by the Trust. In addition, neither the swap counterparty nor any advisor referenced by any such swap is a Trading Advisor to the Trust.
80
The Trust had invested in the following swap contracts as of and for the threenine months ended March 31,September 30, 2018:
| XXXIV Balanced select swap | XXXV Diversified select swap | XXXVII L/S select swap | Brevan Howard | XXXIV Balanced select swap | XXXV Diversified select swap | XXXVII L/S select swap | Brevan Howard | |||||||||
| Total Return Swap | Total Return Swap | Total Return Swap | Total Return Swap | Total Return Swap | Total Return Swap | Total Return Swap | Total Return Swap | |||||||||
| Counterparty | DeutscheBank AG | DeutscheBank AG | DeutscheBank AG | DeutscheBank AG | DeutscheBank AG | DeutscheBank AG | DeutscheBank AG | DeutscheBank AG | ||||||||
| Notional Amount | $13,373,629 | $4,651,155 | $653,610 | $2,072,056 | $11,735,292 | $3,054,369 | $653,610 | $2,072,056 | ||||||||
| Termination Date | 8/2/2018 | 8/2/2018 | 8/7/2018 | 4/18/2018 | 7/31/2023 | 7/31/2023 | 7/31/2023 | 3/27/2023 | ||||||||
| Cash Collateral | $86,000 | $86,000 | $29,950 | $982,500 | $86,000 | $86,000 | $29,950 | $978,950 | ||||||||
| Swap Value | $10,254,801 | $5,642,465 | $452,359 | $2,107,071 | $9,764,185 | $5,489,997 | $441,992 | $2,031,338 | ||||||||
| Investee Returns | Total Returns | Total Returns | Total Returns | Total Returns | Total Returns | Total Returns | Total Returns | Total Returns | ||||||||
| Realized Gain/(Loss) | $0 | $0 | $0 | $0 | $0 | $0 | $0 | $0 | ||||||||
| Change in Unrealized Gain/(Loss) | $999,842 | $451,993 | $85,270 | ($4,796) | $509,226 | $299,525 | $74,903 | ($84,079) | ||||||||
| Fair Value as of 3/31/2018 | $10,340,801 | $5,728,465 | $482,309 | $3,089,571 | ||||||||||||
| Fair Value as of September 30, 2018 | $9,850,185 | $5,575,997 | $471,942 | $3,010,288 | ||||||||||||
| Advance on swap appreciation | ($4,926,555) | ($2,500,000) | ($115,000) | ($1,900,000) | ($4,926,555) | ($2,500,000) | ($115,000) | ($1,900,000) | ||||||||
The Trust had invested in the following swap contracts as of and for the year ended December 31, 2017:
| XXXIV Balanced select swap | XXXV Diversified select swap | XXXVII L/S select swap | XXXIX Brevan Howard | |||||
| Total Return Swap | Total Return Swap | Total Return Swap | Total Return Swap | |||||
| Counterparty | DeutscheBank AG | DeutscheBank AG | DeutscheBank AG | DeutscheBank AG | ||||
| Notional Amount | $13,373,629 | $4,651,155 | $653,610 | $2,072,056 | ||||
| Termination Date | 8/2/2018 | 8/2/2018 | 8/7/2018 | 3/26/2018 | ||||
| Cash Collateral | $2,086,000 | $1,186,000 | $29,950 | $982,500 | ||||
| Swap Value | $9,254,959 | $5,190,472 | $367,089 | $2,111,867 | ||||
| Investee Returns | Total Returns | Total Returns | Total Returns | Total Returns | ||||
| Realized Gain/(Loss) | $0 | $0 | $0 | $0 | ||||
| Change in Unrealized Gain/(Loss) | ($84,491) | ($47,375) | $26,621 | ($297,047) | ||||
| Fair Value as of 12/31/2017 | $11,340,959 | $6,376,472 | $397,039 | $3,094,367 | ||||
| Advance on swap appreciation | ($4,926,555) | ($2,500,000) | ($115,000) | ($1,900,000) |
66
Table of Contents5. Investments in Private Investment Companies
Investments in private investment companies represent cash and open trade equity invested in the private investment companies as well as the cumulative trading profits or losses allocated to the Trust by the Private Investment Companies. Private investment companies allocate trading profits or losses on the basis of the proportion of the Trust’s capital allocated for trading to each respective Private Investment Company, which bears no relationship to the amount of cash invested by the Trust in the Private Investment Companies. Investments in private investment companies are valued using the NAV provided by the underlying private investment.
The Galaxy Plus entities are made up a feeder funds in which the Trust invests and master trading entities into which the feeder funds invest. No investment held by the Galaxy Plus master trading entity is greater than 5% of the Trust’s total capital.
81
The following table summarizes the Trust’s equity in earnings from each of the private investment companies during the three and nine months ended March 31,September 30, 2018 and 2017:
| Three Months Ended March 31, 2018 | Three Months Ended March 31, 2017 | |||||||||||||||||||||||||||||||||||||||||||||||||||||||||||||||
| Trading | Realized | Change in | Net Income | Trading | Realized | Change in | Net Income | Three Months Ended September 30, 2018 | Three Months Ended September 30, 2017 | |||||||||||||||||||||||||||||||||||||||||||||||||||||||
| Commissions | Gain/(Loss) | Unrealized | (Loss) | Commissions | Gain/(Loss) | Unrealized | (Loss) | Change in | Change in | |||||||||||||||||||||||||||||||||||||||||||||||||||||||
| Gain/(Loss) | Gain/(Loss) | Trading | Realized | Unrealized | Net Income | Trading | Realized | Unrealized | Net Income | |||||||||||||||||||||||||||||||||||||||||||||||||||||||
| Commissions | Gain/(Loss) | Gain/(Loss) | (Loss) | Commissions | Gain/(Loss) | Gain/(Loss) | (Loss) | |||||||||||||||||||||||||||||||||||||||||||||||||||||||||
| Galaxy Plus Fund - Aspect Feeder Fund (532) LLC | (49,914 | ) | (71,608 | ) | (87,591 | ) | (209,113 | ) | (40,195 | ) | (276,580 | ) | 232,246 | (84,529 | ) | $ | (13,448 | ) | $ | (89,558 | ) | $ | 130,963 | $ | 27,957 | $ | (27,526 | ) | $ | (83,578 | ) | $ | 219,283 | $ | 108,179 | |||||||||||||||||||||||||||||
| Galaxy Plus Fund - Chesapeake Feeder Fund (518) LLC | — | (76,396 | ) | 68,413 | (7,983 | ) | (88,375 | ) | (272,874 | ) | 687,276 | 326,027 | — | — | — | — | (22,467 | ) | 51,664 | (95,593 | ) | (66,396 | ) | |||||||||||||||||||||||||||||||||||||||||
| Galaxy Plus Fund - Doherty Feeder Fund (528) LLC | (26,783 | ) | (433,944 | ) | 62,280 | (398,447 | ) | (52,101 | ) | 104,752 | (4,815 | ) | 47,836 | (21,883 | ) | 61,611 | (36,452 | ) | 3,276 | (29,346 | ) | 63,445 | 2,935 | 37,034 | ||||||||||||||||||||||||||||||||||||||||
| Galaxy Plus Fund - EvE STP Feeder Fund (516) LLC | (242,357 | ) | 1,839,882 | (1,824,122 | ) | (226,597 | ) | (748,160 | ) | 872,537 | 1,581,310 | 1,705,687 | ||||||||||||||||||||||||||||||||||||||||||||||||||||
| Galaxy Plus Fund - Emil van Essen STP Feeder Fund (516) LLC | (178,875 | ) | 1,104,050 | (1,538,861 | ) | (613,686 | ) | (222,560 | ) | 1,811,488 | (935,550 | ) | 653,378 | |||||||||||||||||||||||||||||||||||||||||||||||||||
| Galaxy Plus Fund - Fort Contrarian Feeder Fund (510) LLC | (29,780 | ) | (624,013 | ) | 106,684 | (547,109 | ) | (88,403 | ) | 767,272 | 511,936 | 1,190,805 | (19,852 | ) | 35,043 | 62,055 | 77,246 | (52,255 | ) | (216,057 | ) | 556,885 | 288,573 | |||||||||||||||||||||||||||||||||||||||||
| Galaxy Plus Fund - LRR Feeder Fund (522) LLC | — | — | 146,610 | 146,610 | — | — | (512,105 | ) | (512,105 | ) | — | — | (97,339 | ) | (97,339 | ) | — | (2,947 | ) | (344,286 | ) | (347,233 | ) | |||||||||||||||||||||||||||||||||||||||||
| Galaxy Plus Fund - QIM Feeder Fund (526) LLC | (57,285 | ) | (1,369,079 | ) | (538,899 | ) | (1,965,263 | ) | (1,574,207 | ) | 6,506,608 | (913,835 | ) | 4,018,566 | (59,105 | ) | (298,023 | ) | 45,680 | (311,448 | ) | (90,999 | ) | (1,103,456 | ) | 1,092,377 | (102,078 | ) | ||||||||||||||||||||||||||||||||||||
| Galaxy Plus Fund - Quantmetrics Feeder Fund (527) LLC | (67,063 | ) | 114,702 | (8,659 | ) | 38,980 | (168,161 | ) | 684,868 | 352,067 | 868,774 | (18,549 | ) | 55,948 | (8,557 | ) | 28,842 | (56,647 | ) | (291,572 | ) | (938 | ) | (349,157 | ) | |||||||||||||||||||||||||||||||||||||||
| Galaxy Plus Fund - Quest Feeder Fund (517) LLC | (14,370 | ) | 24,498 | (44,246 | ) | (34,118 | ) | (41,009 | ) | 566,048 | (1,262,752 | ) | (737,713 | ) | (14,086 | ) | (92,604 | ) | 13,074 | (93,616 | ) | (17,531 | ) | (39,564 | ) | 29,219 | (27,876 | ) | ||||||||||||||||||||||||||||||||||||
| Galaxy Plus Fund - Quest FIT Feeder Fund (535) LLC | — | — | (27,611 | ) | (27,611 | ) | (59,844 | ) | (299,382 | ) | (351,627 | ) | (710,853 | ) | — | — | (256,019 | ) | (256,019 | ) | — | — | (91,259 | ) | (91,259 | ) | ||||||||||||||||||||||||||||||||||||||
| Galaxy Plus Fund - TT Feeder Fund (531) LLC | (75,103 | ) | (197,579 | ) | (405,904 | ) | (678,586 | ) | — | — | — | — | (39,323 | ) | 187,011 | 46,880 | 194,568 | — | — | (244,467 | ) | (244,467 | ) | |||||||||||||||||||||||||||||||||||||||||
| Galaxy Plus Fund - Welton GDP Feeder Fund (538) LLC | (299,641 | ) | (4,386,243 | ) | 300,352 | (4,385,532 | ) | (31,721 | ) | 45,781 | 35,356 | 49,416 | (171,382 | ) | 119,936 | 183,815 | 132,369 | (297,366 | ) | (732,794 | ) | 413,322 | (616,838 | ) | ||||||||||||||||||||||||||||||||||||||||
| Total | $ | (862,296 | ) | $ | (5,179,780 | ) | $ | (2,252,693 | ) | $ | (8,294,769 | ) | (2,892,176 | ) | $ | 8,699,030 | $ | 355,057 | $ | 6,161,911 | $ | (536,503 | ) | $ | 1,083,414 | $ | (1,454,761 | ) | $ | (907,850 | ) | $ | (816,697 | ) | $ | (543,371 | ) | $ | 601,928 | $ | (758,140 | ) | ||||||||||||||||||||||
| Nine Months Ended September 30, 2018 | Nine Months Ended September 30, 2017 | |||||||||||||||||||||||||||||||
| Change in | Change in | |||||||||||||||||||||||||||||||
| Trading | Realized | Unrealized | Net Income | Trading | Realized | Unrealized | Net Income | |||||||||||||||||||||||||
| Commissions | Gain/(Loss) | Gain/(Loss) | (Loss) | Commissions | Gain/(Loss) | Gain/(Loss) | (Loss) | |||||||||||||||||||||||||
| Galaxy Plus Fund - Aspect Feeder Fund (532) LLC | $ | (81,572 | ) | $ | (372,395 | ) | $ | 140,200 | $ | (313,767 | ) | $ | (111,211 | ) | $ | (720,482 | ) | $ | 247,580 | $ | (584,113 | ) | ||||||||||
| Galaxy Plus Fund - Chesapeake Feeder Fund (518) LLC | — | (76,396 | ) | 68,413 | (7,983 | ) | (188,852 | ) | (364,753 | ) | 528,870 | (24,735 | ) | |||||||||||||||||||
| Galaxy Plus Fund - Doherty Feeder Fund (528) LLC | (72,912 | ) | (167,998 | ) | (34,229 | ) | (275,139 | ) | (116,596 | ) | 304,648 | (53,120 | ) | 134,932 | ||||||||||||||||||
| Galaxy Plus Fund - Emil van Essen STP Feeder Fund (516) LLC | (700,233 | ) | 2,033,337 | (1,717,641 | ) | (384,537 | ) | (1,330,361 | ) | 4,599,674 | 304,067 | 3,573,380 | ||||||||||||||||||||
| Galaxy Plus Fund - Fort Contrarian Feeder Fund (510) LLC | (73,829 | ) | (116,736 | ) | 81,270 | (109,295 | ) | (220,929 | ) | 1,509,865 | (59,134 | ) | 1,229,802 | |||||||||||||||||||
| Galaxy Plus Fund - LRR Feeder Fund (522) LLC | (804 | ) | (62 | ) | (152,150 | ) | (153,016 | ) | (570,790 | ) | (2,947 | ) | (1,389,486 | ) | (1,963,223 | ) | ||||||||||||||||
| Galaxy Plus Fund - QIM Feeder Fund (526) LLC | (174,274 | ) | (1,242,377 | ) | 108,280 | (1,308,371 | ) | (1,822,201 | ) | 5,221,007 | 393,843 | 3,792,649 | ||||||||||||||||||||
| Galaxy Plus Fund - Quantmetrics Feeder Fund (527) LLC | (118,457 | ) | (42,689 | ) | 9,173 | (151,973 | ) | (346,240 | ) | 498,355 | 339,271 | 491,386 | ||||||||||||||||||||
| Galaxy Plus Fund - Quest Feeder Fund (517) LLC | (43,536 | ) | (175,750 | ) | 19,406 | (199,880 | ) | (85,937 | ) | 2,436,910 | (3,127,619 | ) | (776,646 | ) | ||||||||||||||||||
| Galaxy Plus Fund - Quest FIT Feeder Fund (535) LLC | — | — | (329,083 | ) | (329,083 | ) | — | — | (795,707 | ) | (795,707 | ) | ||||||||||||||||||||
| Galaxy Plus Fund - TT Feeder Fund (531) LLC | (134,728 | ) | 39,795 | (286,272 | ) | (381,205 | ) | (26,272 | ) | 455,907 | (1,826,328 | ) | (1,396,693 | ) | ||||||||||||||||||
| Galaxy Plus Fund - Welton GDP Feeder Fund (538) LLC | (715,002 | ) | (4,340,773 | ) | 379,408 | (4,676,367 | ) | (601,695 | ) | (1,507,427 | ) | (798,914 | ) | (2,908,036 | ) | |||||||||||||||||
| Total | $ | (2,115,347 | ) | $ | (4,462,044 | ) | $ | (1,713,225 | ) | $ | (8,290,616 | ) | $ | (5,421,084 | ) | $ | 12,430,757 | $ | (6,236,677 | ) | $ | 772,996 | ||||||||||
6782
The Trust’s investments in private investment companies have certain redemption and liquidity restrictions which are described in the following table:
| Redemptions | Redemptions | Liquidity | ||||
| Notice Period | Permitted | Restrictions | ||||
| Frontier Funds | ||||||
| Multi-Strategy | ||||||
| Galaxy Plus Fund - EvE STP Feeder Fund (516) LLC | 24 hours | Daily | None | |||
| Galaxy Plus Fund - LRR Feeder Fund (522) LLC | 24 hours | Daily | None | |||
| Galaxy Plus Fund - Quantmetrics Feeder Fund (527) LLC | 24 hours | Daily | None | |||
| Galaxy Plus Fund - Welton GDP Feeder Fund (538) LLC | 24 hours | Daily | None | |||
| Trend Following | ||||||
| Galaxy Plus Fund - Aspect Feeder Fund (532) LLC | 24 hours | Daily | None | |||
| Galaxy Plus Fund - Fort Contrarian Feeder Fund (510) LLC | 24 hours | Daily | None | |||
| Galaxy Plus Fund - QIM Feeder Fund (526) LLC | 24 hours | Daily | None | |||
| Galaxy Plus Fund - Quest Feeder Fund (517) LLC | 24 hours | Daily | None | |||
| Galaxy Plus Fund - QuestFIT Feeder Fund (535) Segregated Portfolio | 24 hours | Daily | None | |||
| Galaxy Plus Fund - TT Feeder Fund (531) LLC | 24 hours | Weekly | None | |||
| Option Trading | ||||||
| Galaxy Plus Fund - Doherty Feeder Fund (528) LLC | 24 hours | Daily | None | |||
6. Transactions with Affiliates
The Managing Owner contributes funds to the Trust in order to have a 1% interest in the aggregate capital, profits and losses and in return will receive units designated as general units in the Series of the Trust in which the Managing Owner invests such funds. The general units may only be purchased by the Managing Owner and may be subject to no advisory fees or management advisory fees at reduced rates. Otherwise, the general units hold the same rights as the limited units. The Managing Owner is required to maintain at least a 1% interest (“Minimum Purchase Commitment”) in the aggregate capital, profits and losses of the Trust so long as it is acting as the Managing Owner of the Trust. Such contribution was made by the Managing Owner before trading commenced for the Trust and will be maintained throughout the existence of the Trust, and the Managing Owner will make such purchases as are necessary to effect this requirement. Additionally, the Managing Owner agreed with certain regulatory bodies to maintain a 1% interest specifically in the Frontier Balanced Fund Class 1AP Units and Frontier Balanced Fund Class 2a Units, aggregated, and each of the Frontier Long/Short Commodity Fund, Frontier Diversified Fund, and Frontier Masters Fund. The 1% interest in these specific Series of the Trust is included in computing the Minimum Purchase Commitment in aggregate capital. In addition to the general units the Managing Owner receives in respect of its Minimum Purchase Commitment, the Managing Owner may purchase limited units in any Series as a Limited Owner. Principals of the Managing Owner or affiliates are allowed to own beneficial interests in the Trust, as well. All units purchased by the Managing Owner are held for investment purposes only and not for resale. The Managing Owner may make purchases or redemptions at any time on the same terms as any Limited Owner. The Trust has and will continue to have certain relationships with the Managing Owner and its affiliates.
Expenses
Management Fees—Each Series of Units pays to the Managing Owner a monthly management fee equal to a percentage of the notional assets of such Series allocated to Trading Companies, calculated on a daily basis. The percentage basis of the fees varies and are in line with the amounts being disclosed below. In addition, the Managing Owner receives a monthly management equal to a certain percentage of the assets in the Galaxy Plus entities attributable to such Series’ (including notional assets), calculated on a monthly basis. The management fees attributable to Galaxy Plus entities are included in unrealized gain/(loss) on private investment companies on the Statements of Operations. The total amount of assets of a Series allocated to Trading Advisors and/or reference programs, including (i) actual funds deposited in accounts directed by the Trading Advisors or deposited as margin in respect of swaps or other derivative instruments referencing a reference program plus (ii) any notional equity allocated to the Trading Advisors and any reference programs, is referred to herein as the “notional assets” of the Series. The annual rate of the management fee is: 0.5% for the Frontier Balanced Fund Class 1 Class 2 and Class 3,2, 1.0% for the Frontier Balanced Fund Class 1AP, Class 2a and Class 3a, 2.0% for the Frontier Winton Fund, Frontier Long/Short Commodity Fund Class 1a, Class 2a and Class 3a and Frontier Masters Fund, 0.75% for Frontier Diversified Fund, 2.5% for the Frontier Heritage Fund and Frontier Select Fund, and 3.5% for the Frontier Long/Short Commodity Fund Class 1, Class 2 and Class 3. The Managing Owner may pay all or a portion of such management fees to the Trading Advisor(s) and/or waive (up to the percentage specified) any such management fee to the extent any related management fee is paid by a trading company or estimated management fee is embedded in a swap or other derivative instrument. Any management fee embedded in a swap or other derivative instrument may be greater or less than the management fee that would otherwise be charged to the Series by the Managing Owner.
As of the date of this report, for a Series that has invested in a swap, the Managing Owner or Trading Advisor(s) do not receive any management fees directly from the Series for such swap, and instead the relevant Trading Advisor receives compensation via the fees embedded in the swap. As of March 31,September 30, 2018, the range of management fees embedded based on fair value of swaps in (i) swaps owned by Frontier Diversified Fund was 1.00% per annum, (ii) swaps owned by Frontier Balanced Fund was 1.00% per annum, (iii) swaps owned by Frontier Long/Short Commodity Fund was 1.50% per annum, and (iv) swaps owned by Frontier Heritage Fund was 1.00% per annum, and the Managing Owner has waived the entire management fee due to it from those Series in respect of such Series’ investment in swaps. TheseIn each case, the embedded management fees may be higher or lower infee was accrued on the future.relevant notional amount of the swap.
6883
The management fee as a percentage of the applicable Series’ notional assets will be greater than the percentage of the applicable Series’ net asset value to the extent that the notional assets of the Series exceeds its net asset value. The Managing Owner expects that the notional assets of each Series will generally be maintained at a level in excess of the net asset value of such Series and such excess may be substantial to the extent the Managing Owner deems necessary to achieve the desired level of volatility.
Trading Fees— In connection with each Series’ trading activities the Frontier Balanced Fund, Frontier Select Fund, Frontier Winton Fund and Frontier Heritage Fund pays to the Managing Owner aan FCM Fee of up to 2.25% per annum of notional assets allocated to the trading advisors, including through investments in commodity pools available on the Galaxy Plus Platform, and any reference programs of the applicable Series. The Frontier Diversified Fund, Frontier Long/Short Commodity Fund and Frontier Masters Fund pays to the Managing Owner aan FCM Fee of up to 2.25% of notional assets allocated to the trading advisors, including through investments in commodity pools available on the Galaxy Plus Platform, and a custodial/due diligence fee of 0.12% of such Series’ NAV, calculated daily.
Incentive Fees— Some Series pay to the Managing Owner an incentive fee of a certain percentage of new net trading profits generated in the Trading Companies by such Series, monthly or quarterly. In addition, the Managing Owner receives a quarterly incentive fee of a certain percentage of new net trading profits generated in the Galaxy Plus entities that have been allocated to the Series. The incentive fees attributable to Galaxy Plus entities are included in unrealized gain/(loss) on private investment companies on the Statements of Operations. Because the Frontier Balanced Fund, Frontier Diversified Fund, Frontier Masters Fund, Frontier Heritage Fund, Frontier Select Fund, and Frontier Long/Short Commodity Fund may each employ multiple Trading Advisors, these Series will pay the Managing Owner a monthly incentive fee calculated on a Trading Advisor by Trading Advisor basis. It is therefore possible that in any given period the Series may pay incentive fees to the Managing Owner for one or more Trading Advisors while each of these Series as a whole experiences losses. The incentive fee is 25% for the Frontier Balanced Fund and the Frontier Diversified Fund and 20% for the Frontier Winton Fund, Frontier Heritage Fund, Frontier Select Fund, Frontier Long/Short Commodity Fund and Frontier Masters Fund. The Managing Owner may pay all or a portion of such incentive fees to the Trading Advisor(s) for such Series. As of the date of this report, for a Series that has invested in a swap, the Managing Owner or Trading Advisor(s) do not receive any incentive fees directly from the Series for such swap, and instead the relevant Trading Advisor receives compensation via the fees embedded in the swap. As of March 31,September 30, 2018, the range of incentive fees as a percentage of net new trading profits on swaps embedded in (i) swaps owned by Frontier Diversified Fund was 20-25% per annum, (ii) swaps owned by Frontier Balanced Fund was 20-25% per annum, (iii) swaps owned by Frontier Long/Short Commodity Fund was 25% per annum, and (iv) swaps owned by Frontier Heritage Fund was 15% per annum, and the Managing Owner has waived the entire incentive fee due to it from those Series in respect of such Series’ investment in swaps.
84
These embedded incentive fees may be higher or lower in the future.
Service Fees—In addition, with respect to Class 1 and Class 1a Units of each Series of the Trust, as applicable, the Series pays monthly or quarterly to the Managing Owner a service fee of up to 3% and 2% annually, for the closed Series and open Series, respectively, which the Managing Owner pays to selling agents of the Trust.
As of March 31,September 30, 2018, the Trust had a payable to the Managing Owner in the amounts of $148,409, $176,311, $17,403, $128,188,$10,897, $79,601, $22,088, $107,758, and $276,006$238,073 for incentive fees, management fees, interest, service fees, and trading fees, and service fees, respectively.
69
As of December 31, 2017, the Trust had a payable to the Managing Owner in the amounts of $53,036, $90,972, $26,007, $334,485 and $148,445 for incentive fees, management fees, interest, trading fees, and service fees, respectively.
For the three months ended March 31,September 30, 2018 the Trust paid the Managing Owner $148,409, $230,889, $465,780$10,897, $189,058, $387,003 and $870,525$733,788 for incentive fees, management fees, service fees, and trading fees, respectively.
For the three months ended March 31,September 30, 2017 the Trust paid the Managing Owner $(117,901)$0, $297,987, $556,766 and $1,080,095 for incentive fees, management fees, service fees, and trading fees, respectively.
For the nine months ended September 30, 2018 the Trust paid the Managing Owner $159,306, $650,179, $1,264,101 and $2,366,003 for incentive fees, management fees, service fees, and trading fees, respectively.
For the nine months ended September 30, 2017 the Trust paid the Managing Owner $(205,571), $528,788, $743,983$1,263,162, $1,989,777 and $1,531,403$4,206,610 for incentive fees, management fees, service fees, and trading fees, respectively.
With respect to the service fees, the initial service fee (for the first 12 months) relating to a purchase of Units by an investor is prepaid by the Managing Owner to the relevant selling agent in the month following such purchase and is reimbursed therefore by the Series monthly in arrears in an amount based upon a corresponding percentage of NAV, calculated daily. Consequently, the Managing Owner bears the risk and enjoys the benefit of the upside potential of any difference between the amount of the initial service fee prepaid by it and the amount of the reimbursement thereof, which may result from variations in NAV over the following 12 months. For the three months ended March 31,September 30, 2018 and 2017, amounts received or receivable from the Managing Owner for the difference in monthly service fees from the prepaid initial service fees were $0 and $0, respectively.
Aggregate interest income from all sources, including U.S. Treasury Securities assets net of premiums and cash held at clearing brokers, of up to the first 2% (annualized) is paid to the Managing Owner by the Frontier Balanced Fund (Class 1 and Class 2), Frontier Long/Short Commodity Fund (Class 2 and Class 3), Frontier Winton Fund, Frontier Select Fund, and Frontier Heritage Fund. For the Frontier Diversified Fund, Frontier Long/Short Commodity Fund (Class 1a, Class 2a, Class 3a only), Frontier Masters Fund, and Frontier Balanced Fund (Class 1AP, Class 2a and Class 3a) 100% of the interest is retained by the respective Series. During the threenine months ended March 31,September 30, 2018 and 2017, the Trust received $124,430 and paid $55,400 and $119,704,$349,196, respectively, of such interest income from/to the Managing Owner. Such amounts are not included in the consolidated statements of operations of the Trust. All other interest income is recorded by the Trust on the consolidated statements of operations.
85
7. Financial Highlights
The following information presents the financial highlights of the Trust for the three and nine months ended March 31,September 30, 2018 and 2017. This data has been derived from the information presented in the consolidated financial statements.
| Three months ended | ||||||||
| 2018 | 2017 | |||||||
| Ratios to average net assets (1) | ||||||||
| Net investment gain/(loss) (1) | -5.99 | % | 10.28 | % | ||||
| Expenses before incentive fees (3) | 6.08 | % | 5.38 | % | ||||
| Expenses after incentive fees (3) | 6.22 | % | 5.33 | % | ||||
| Total return before incentive fees (2) | -9.55 | % | 1.32 | % | ||||
| Total return after incentive fees (2) | -9.69 | % | 1.37 | % | ||||
Three months ended
| 2018 | 2017 | |||||||
| Ratios to average net assets (1) | ||||||||
| Net investment gain/(loss) (1) | -6.10 | % | -5.76 | % | ||||
| Expenses before incentive fees (3) | 6.37 | % | 5.89 | % | ||||
| Expenses after incentive fees (3) | 6.38 | % | 5.89 | % | ||||
| Total return before incentive fees (2) | -3.17 | % | -1.18 | % | ||||
| Total return after incentive fees (2) | -3.18 | % | -1.18 | % | ||||
Nine months ended
| 2018 | 2017 | |||||||
| Ratios to average net assets (1) | ||||||||
| Net investment gain/(loss) (1) | -6.07 | % | -5.73 | % | ||||
| Expenses before incentive fees (3) | 6.15 | % | 6.01 | % | ||||
| Expenses after incentive fees (3) | 6.32 | % | 5.89 | % | ||||
| Total return before incentive fees (2) | -13.04 | % | -4.92 | % | ||||
| Total return after incentive fees (2) | -13.20 | % | -4.80 | % | ||||
| (1) | Annualized with the exception of incentive fees. |
| (2) | Total returns are not annualized. |
| (3) | Expense ratios do not reflect interest allocated to the Managing Owner as such expenses are not included in the Consolidated Statements of Operations of the Trust. See |
The Trust financial highlights are calculated based upon the Trust’s consolidated financial statements. The consolidated Trust does not issue units and therefore the financial highlights do not disclose any unitized data.
7086
8. Derivative Instruments and Hedging Activities
The Trust’s primary business is to engage in speculative trading of a diversified portfolio of futures, forwards (including interbank foreign currencies), options contracts and other derivative instruments (including swap contracts). The Trust does not enter into or hold positions for hedging purposes as defined under ASC 815. The detail of the fair value of the Trust’s derivatives by instrument types as of March 31,September 30, 2018 and December 31, 2017 is included in the Consolidated Condensed Schedules of Investments. See Note 4 for further disclosure related to the Trust’s positions in swap contracts.
For the three months ended March 31,September 30, 2018 March 31,and September 30, 2017, the monthly average of forwards, options and futures contracts bought was approximately 1,348764 and 8,519,2,416, respectively and sold was approximately 1,217544 and 8,311,1,936, respectively.
For the nine months ended September 30, 2018 and September 30, 2017, the monthly average of forwards, options and futures contracts bought was approximately 2,819 and 8,053, respectively and sold was approximately 2,375 and 7,774, respectively.
7187
The following tables summarize the trading revenues for the three and nine months ended March 31,September 30, 2018 and 2017 by sector:
| Realized Trading Revenue from Futures, Forwards and Options | ||||
| for the Three Months Ended March 31, 2018(1) | ||||
| Type of contract | ||||
| Metals | $ | 175,869 | ||
| Currencies | (333,820 | ) | ||
| Energies | (258,495 | ) | ||
| Agriculturals | (164,058 | ) | ||
| Interest rates | (178,994 | ) | ||
| Stock indices | 4,746 | |||
| Realized trading income/(loss)(1) | $ | (754,751 | ) | |
| Net Change in Open Trade Equity from Futures, Forwards and Options | ||||
| for the Three Months Ended March 31, 2018(2) | ||||
| Type of contract | ||||
| Metals | $ | (589,655 | ) | |
| Currencies | (270,575 | ) | ||
| Energies | 30,389 | |||
| Agriculturals | 42,190 | |||
| Interest rates | 312,483 | |||
| Stock indices | (288,750 | ) | ||
| Change in unrealized trading income/(loss)(2) | $ | (763,917 | ) | |
| Realized Trading Revenue from Futures, Forwards and Options |
| for the Three Months Ended September 30, 2018 |
Type of contract
| Metals | $ | 234,519 | ||
| Currencies | 520,493 | |||
| Energies | (25,579 | ) | ||
| Agriculturals | 198,513 | |||
| Interest rates | (298,384 | ) | ||
| Stock indices | 546,293 | |||
| Realized trading income/(loss)(1) | $ | 1,175,855 |
| Realized Trading Revenue from Futures, Forwards and Options |
| for the Three Months Ended September 30, 2017 |
Type of contract
| Metals | $ | (415,539 | ) | |
| Currencies | 693,018 | |||
| Energies | (471,279 | ) | ||
| Agriculturals | (562,795 | ) | ||
| Interest rates | (99,299 | ) | ||
| Stock indices | 661,692 | |||
| Realized trading income/(loss)(1) | $ | (194,202 | ) |
| (1) |
| Unrealized Trading Revenue from Futures, Forwards and Options | |
| Realized Trading Revenue from Futures, Forwards and Options | ||||
| for the Three Months Ended March 31, 2017(1) | ||||
| Type of contract | ||||
| Metals | $ | (714,130 | ) | |
| Currencies | 64,078 | |||
| Energies | (816,579 | ) | ||
| Agriculturals | (602,573 | ) | ||
| Interest rates | (827,486 | ) | ||
| Stock indices | 5,000,875 | |||
| Realized trading income/(loss)(1) | $ | 2,104,185 | ||
| Net Change in Open Trade Equity from Futures, Forwards and Options | ||||
| for the Three Months Ended March 31, 2017(2) | ||||
| Type of contract | ||||
| Metals | $ | 6,346 | ||
| Currencies | (503,572 | ) | ||
| Energies | (296,350 | ) | ||
| Agriculturals | 231,741 | |||
| Interest rates | (791,598 | ) | ||
| Stock indices | (384,554 | ) | ||
| Change in unrealized trading income/(loss)(2) | $ | (1,737,987 | ) | |
Type of contract
| Metals | $ | (235,504 | ) | |
| Currencies | (538,221 | ) | ||
| Energies | 60,010 | |||
| Agriculturals | (160,030 | ) | ||
| Interest rates | 84,141 | |||
| Stock indices | 76,487 | |||
| Change in unrealized trading income/(loss)(1) | $ | (713,117 | ) |
| Unrealized Trading Revenue from Futures, Forwards and Options |
| for the Three Months Ended September 30, 2017 |
Type of contract
| Metals | $ | 36,050 | ||
| Currencies | (478,195 | ) | ||
| Energies | 213,027 | |||
| Agriculturals | 264,443 | |||
| Interest rates | (147,197 | ) | ||
| Stock indices | 803,166 | |||
| Change in unrealized trading income/(loss)(1) | $ | 691,294 |
| (1) |
88
| Realized Trading Revenue from Futures, Forwards and Options |
| for the Nine Months Ended September 30, 2018 |
Type of contract
| Metals | $ | 1,012,647 | ||
| Currencies | (985,268 | ) | ||
| Energies | 1,048,526 | |||
| Agriculturals | 287,301 | |||
| Interest rates | 1,723 | |||
| Stock indices | (227,965 | ) | ||
| Realized trading income/(loss)(1) | $ | 1,136,964 |
| Realized Trading Revenue from Futures, Forwards and Options |
| for the Nine Months Ended September 30, 2017 |
Type of contract
| Metals | $ | (1,700,436 | ) | |
| Currencies | (1,131,814 | ) | ||
| Energies | (2,238,664 | ) | ||
| Agriculturals | (82,409 | ) | ||
| Interest rates | (2,491,165 | ) | ||
| Stock indices | 7,433,107 | |||
| Realized trading income/(loss)(1) | $ | (211,381 | ) |
| (1) | Amounts recorded in the Statements of Operations under Net realized gain/(loss) on futures, forwards, and options |
| Unrealized Trading Revenue from Futures, Forwards and Options |
| for the Nine Months Ended September 30, 2018 |
Type of contract
| Metals | $ | (474,681 | ) | |
| Currencies | (425,578 | ) | ||
| Energies | (313,242 | ) | ||
| Agriculturals | 65,596 | |||
| Interest rates | (30,149 | ) | ||
| Stock indices | (49,303 | ) | ||
| Change in unrealized trading income/(loss)(1) | $ | (1,227,357 | ) |
| Unrealized Trading Revenue from Futures, Forwards and Options |
| for the Nine Months Ended September 30, 2017 |
Type of contract
| Metals | $ | (151,493 | ) | |
| Currencies | (1,472,515 | ) | ||
| Energies | (105,818 | ) | ||
| Agriculturals | (81,250 | ) | ||
| Interest rates | (1,085,406 | ) | ||
| Stock indices | 716,949 | |||
| Change in unrealized trading income/(loss)(1) | $ | (2,179,533 | ) |
89
Certain financial instruments and derivative instruments are eligible for offset in the statements of financial condition under GAAP. The Trust’s open trade equity/(deficit), options written, and receivables from futures commission merchants (each, an “FCM”) are subject to master netting arrangements and collateral arrangements and meet the GAAP guidance to qualify for offset. A master netting arrangement with a counterparty creates a right of offset for amounts due to and from that same counterparty that is enforceable in the event of a default or bankruptcy. The Trust’s policy is to recognize amounts subject to master netting arrangements on a net basis on the consolidated statements of financial condition.
72
The following tables present gross and net information about the Trust’s assets and liabilities subject the master netting arrangements as disclosed on the consolidated statements of financial condition as of March 31,September 30, 2018 and December 31, 2017:
| As of March 31, 2018 | Net Amounts | |||||||||||
| Gross Amounts | Presented in the | |||||||||||
| offset in the | Consolidated | |||||||||||
| Gross Amounts | Consolidated | Statements of | ||||||||||
| of recognized | Statements of | Financial | ||||||||||
| Derivative Assets | Financial Condition | Condition | ||||||||||
| Open Trade Equity/(Deficit) | $ | 1,884,578 | $ | (1,080,081 | ) | $ | 804,497 | |||||
| Swap Contracts | 19,641,146 | — | 19,641,146 | |||||||||
| As of December 31, 2017 | Net Amounts | |||||||||||
| Gross Amounts | Presented in the | |||||||||||
| offset in the | Consolidated | |||||||||||
| Gross Amounts | Consolidated | Statements of | ||||||||||
| of recognized | Statements of | Financial | ||||||||||
| Derivative Assets | Financial Condition | Condition | ||||||||||
| Open Trade Equity/(Deficit) | $ | 2,758,014 | $ | (1,189,600 | ) | $ | 1,568,414 | |||||
| Swap Contracts | 21,208,838 | — | 21,208,838 | |||||||||
As of September 30, 2018
| Net Amounts | ||||||||||||
| Gross Amounts | Presented in the | |||||||||||
| Gross Amounts of | offset in the | Statements of | ||||||||||
| recognized | Statements of | Financial | ||||||||||
| Derivative Assets | Financial | Condition | ||||||||||
| Open Trade Equity/(Deficit) | $ | 1,593,779 | $ | (1,247,053 | ) | $ | 346,726 | |||||
| Swap Contracts | 18,908,412 | — | 18,908,412 | |||||||||
As of December 31, 2017
| Net Amounts | ||||||||||||
| Gross Amounts | Presented in the | |||||||||||
| offset in the | Consolidated | |||||||||||
| Gross Amounts | Consolidated | Statements of | ||||||||||
| of recognized | Statements of | Financial | ||||||||||
| Derivative Assets | Financial Condition | Condition | ||||||||||
| Open Trade Equity/(Deficit) | $ | 2,758,014 | $ | (1,189,600 | ) | $ | 1,568,414 | |||||
| Swap Contracts | 21,208,838 | — | 21,208,838 | |||||||||
9. Trading Activities and Related Risks
The purchase and sale of futures and options on futures contracts require margin deposits with FCMs. Additional deposits may be necessary for any loss on contract value. The CEA requires an FCM to segregate all customer transactions and assets from the FCM’s proprietary activities. A customer’s cash and other property (for example, U.S. treasury bills) deposited with an FCM are considered commingled with all other customer funds subject to the FCM’s segregation requirements. In the event of an FCM’s insolvency, recovery may be limited to a pro rata share of segregated funds available. It is possible that the recovered amount could be less than the total of cash and other property deposited.
90
The term “off-balance sheet risk” refers to an unrecorded potential liability that, even though it does not appear on the statements of financial condition, may result in future obligation or loss in excess of the amount paid by the Series for a particular investment. Each Trading Company and Galaxy Plus entity expects to trade in futures, options, forward and swap contracts and will therefore be a party to financial instruments with elements of off-balance sheet market and credit risk. In entering into these contracts, there exists a market risk that such contracts may be significantly influenced by market conditions, such as interest rate volatility, resulting in such contracts being less valuable. If the markets should move against all of the futures positions held by a Trading Company or Galaxy Plus entity in respect of any Series at the same time, and if the Trading Advisor(s) of such Trading Company or Galaxy Plus entity are unable to offset such futures interests positions, such Trading Company or Galaxy Plus entity could lose all of its assets and the holders of Units of such Series would realize a 100% loss. The Managing Owner will seek to minimize market risk through real-time monitoring of open positions and the level of diversification of each Trading Advisor’s portfolio. It is anticipated that any Trading Advisor’s margin-to-equity ratio will typically not exceed approximately 35% although the actual ratio could be higher or lower from time to time.
In addition to market risk, trading futures, forward and swap contracts entails credit risk that a counterparty will not be able to meet its obligations to a Trading Company or Galaxy Plus entity. The counterparty for futures contracts traded in the United States and on most foreign exchanges is the clearinghouse associated with such exchange. In general, clearinghouses are backed by the corporate members of the clearinghouse who are required to share any financial burden resulting from the non-performance by one of their members and, as such, should significantly reduce this credit risk. In cases where the clearinghouse is not backed by the clearing members, like some foreign exchanges, it is normally backed by a consortium of banks or other financial institutions. Some non-U.S. exchanges, in contrast to U.S. exchanges, are principals’ markets in which performance is the responsibility only of the individual counterparty with whom the Trading Company has entered into the transaction, and not of the exchange or clearing corporation. In these kinds of markets, there is risk of bankruptcy or other failure or refusal to perform by the counterparty.
In the case of forward contracts traded on the interbank market and swaps, neither is traded on exchanges. The counterparty is generally a single bank or other financial institution, rather than a group of financial institutions; thus, there may be a greater counterparty credit risk. The Managing Owner expects the Trading Advisors to trade only with those counterparties which it believes to be creditworthy. All positions of each Trading Company will be valued each day on a mark-to-market basis. There can be no assurance that any clearing member, clearinghouse or other counterparty will be able to meet its obligations to any Trading Company.
The Managing Owner has established procedures to actively monitor and minimize market and credit risks. The Limited Owners bear the risk of loss only to the extent of the market value of their respective investments and, in certain specific circumstances, distributions and redemptions received.
10. Indemnifications and Guarantees
The Trust has entered into agreements, which provide for the indemnification of futures clearing brokers, and commodity trading advisers, among others, against losses, costs, claims and liabilities arising from the performance of their individual obligations under such agreements, except for gross negligence, bad faith or willful misconduct. The Trust has had no prior claims or payments pursuant to these agreements. The Trust’s individual maximum exposure under these arrangements is unknown, as this would involve future claims that may be made against the Trust that have not yet occurred. However, based on experience the Trust expects the risk of loss to be remote. Maximum exposure is unfulfilled obligations of the Trust up to the amount of equity at risk with Morgan Stanley & Co. LLC. The Trust has not recorded any liability for the guarantees in the accompanying financial statements as it expects any possibility of losses to be remote. The Trust has not recorded any liability for the indemnifications in the accompanying financial statements as it expects any possibility of losses to be remote.
11. Subsequent Events |
Effective January 1, 2018, Chesapeake Capital Corporation no longer serves as a Trading Advisor to the Trust.
On April 11,From October 1, 2018 through November 19, 2018, the swap terminating on April 18, 2018 was extended to March 27, 2023.Trust paid $3,073,186 in redemptions.
7391
| Item 2. | MANAGEMENT’S DISCUSSION AND ANALYSIS OF FINANCIAL CONDITION AND RESULTS OF OPERATIONS |
Introduction
The following discussion and analysis contain forward-looking statements about the Managing Owner’s expectations of what may happen in the future. Forward-looking statements are based on a number of assumptions and estimates that are inherently subject to significant risks and uncertainties, and our results could differ materially from the results anticipated by our forward-looking statements as a result of many known or unknown factors, including, but not limited to, those factors discussed in “Risk Factors.” See also the “Special Note About Forward-Looking Statements” set forth at the beginning of this report.
The following discussion and tables should be read in conjunction with our unaudited consolidated financial statements and notes thereto included in this quarterly report and our 2017 Annual Report on Form 10-K for the year ended December 31, 2017.
Overview
The Trust is a Delaware statutory trust formed on August 8, 2003. The Trust is a multi-advisor commodity pool, as described in CFTC Regulation § 4.10(d)(2). The Trust is authorized to issue multiple Series of Units, pursuant to the requirements of the Trust Act. The assets of each Series are held and accounted for in separate and distinct records separately from the assets of other Series. The Trust is managed by the Managing Owner, and its term will expire on December 31, 2053 (unless terminated earlier in certain circumstances).
The Trust, with respect to each Series of Units, engages in the speculative trading of a diversified portfolio of futures, forward (including interbank foreign currencies) and options contracts and other derivative instruments (including swaps). The Trust allocates funds to affiliated Trading Companies and Galaxy Plus entities, each of which has one-year renewable contracts with its own independent Trading Advisor(s) that will manage all or a portion of the applicable Trading Company’s or Galaxy Plus entity’s assets, and make the trading decisions for the assets of each Series vested in such Trading Company or Gemini Plus entity. The assets of each Trading Company and Galaxy Plus entity will be segregated from the assets of each other Trading Company and Galaxy Plus entity. The Trust has an investment objective of increasing the value of the Units over the long term (capital appreciation), while controlling risk and volatility; further, to offer exposure to the investment programs of individual Trading Advisors and to specific instruments (currencies). For additional overview of the Trust’s structure and business activities, see Item 1.
All management fees, incentive fees, service fees, risk analysis fee (for closed Series only) and trading fees of the Trust are paid to the Managing Owner. It is the responsibility of the Managing Owner to pay all Trading Advisor management and incentive fees, selling agent service fees and all other operating expenses and continuing offering costs of the Trust. Only management fees and incentive fees related to assets allocated through Trading Companies are included in expense on the Statement of Operations. The Series are all charged management and incentive fees on the assets allocated through the Galaxy Plus entities. Those fees are included in unrealized gain/(loss) on private investment companies on the Statements of Operations. As of the date of this report, for a Series that has invested in a swap, the Managing Owner or Trading Advisor(s) do not receive any incentive fees directly from the Series for such swap, and instead the relevant Trading Advisor receives compensation via the fees embedded in the swap. As of March 31, 2018, the range of incentive fees embedded in (i) swaps owned by Frontier Diversified Fund was 20-25% per annum, (ii) swaps owned by Frontier Balanced Fund was 20-25% per annum, (iii) swaps owned by Frontier Long/Short Commodity Fund was 25% per annum, and (iv) swaps owned by Frontier Heritage Fund was 15% per annum, and the Managing Owner has waived the entire incentive fee due to it from those Series in respect of such Series’ investment in swaps. In each case, the embedded incentive fee was accrued based on the net new trading profits of the swap. The Series are also charged management and incentive fees on assets allocated to swaps. Such fees are embedded in the fair value of the swap and are included in net unrealized gain (loss) on swap contracts on the Statements of Operations. Embedded in the swap fair value is management and incentive fees being paid to Trading Advisors. As of March 31,September 30, 2018, the management fees and range of incentive fees by Trading Company were as follows:
| Trading Company | Management Fee | Incentive Fee | ||
| Frontier Trading Company XXXIV LLC | 1% | 20-25% | ||
| Frontier Trading Company XXXV LLC | 1% | 20-25% | ||
| Frontier Trading Company XXXVII LLC | 1.5% | 25% | ||
| Frontier Trading Company XXXIX LLC | 1% | 15% |
92
For further discussion of fees paid by the Trust, see Item 1-Notes 2 and 6 “Significant Accounting Policies” and “Transactions with Affiliates”, respectively, in the Notes to Financial Statements (unaudited)
74
Critical Accounting Policies and Estimates
The preparation of financial statements in conformity with accounting principles generally accepted in the United States (“GAAP”) requires the Managing Owner to adopt accounting policies and make estimates and assumptions that affect amounts reported in the Trust’s financial statements. The Trust’s most significant accounting policy, described below, includes the valuation of its futures and forward contracts, options contracts, swap contracts, U.S. treasury securities and investments in unconsolidated Trading Companies and Galaxy Plus entities, Thethe majority of these investments are exchange traded contracts valued upon exchange settlement prices or non-exchange traded contracts and obligations with valuation based on third-party quoted dealer values on the Interbank market.
The Trust’s other significant accounting policies are described in detail in Note 2 of the financial statements.
Investment Transactions and Valuation
The Managing Owner has evaluated the nature and type of transactions processed and estimates that it makes in preparing the Trust’s financial statements and related disclosures and has adoptedAccounting Standard Codification (“ASC”) 820,Fair Value Measurements and Disclosure, and implemented the framework for measuring fair value for assets and liabilities.
The Trust utilizes valuation techniques that are consistent with the market approach per the requirement of ASC 820 for the valuation of futures (exchange traded) contracts, forward (non-exchange traded) contracts, option contracts, swap contracts and other non-cash assets. The market approach uses prices and other relevant information generated by market transactions involving identical or comparable assets or liabilities. The Trust applies the valuation techniques in a consistent manner for each asset or liability. The Trust records all investments at fair value in its Statements of Financial Condition, with changes in fair value reported as a component of net gain/(loss) on investments in the Statements of Operations.
Inputs to valuation techniques refer to the assumptions that market participants would use in pricing the assets or liabilities. Inputs may be observable, meaning those that reflect the assumptions market participants would use in pricing the financial asset or liability based on market data obtained from independent sources, or unobservable, meaning those that reflect the reporting entity’s own assumptions about the assumptions market participants would use in pricing the financial asset or liability based on the best information available in the circumstances.
In addition, the Trust monitors counterparty credit risk and incorporates any identified risk factors when assigning input levels to underlying financial assets or liabilities. In that regard ASC 820 establishes a fair value hierarchy for valuation inputs that gives the highest priority to quoted prices in active markets for identical financial assets and the lowest priority to unobservable inputs. A full disclosure of the fair value hierarchy is presented in Note 3 of the financial statements—Fair Value Measurements.
Selection and Replacement of Trading Advisors
The Managing Owner is responsible for the selection, retention and termination of the trading advisors and reference programs on behalf of each Series. The actual allocation among trading advisors for each Series will vary based upon the relative trading performance of the trading advisors and/or reference programs, and the Managing Owner may otherwise vary such percentages from time to time in its sole discretion. The Managing Owner will adjust its allocations and rebalance the portfolio of any Series among trading advisors to maintain weightings that it believes will most likely achieve capital growth within the investment guidelines of the relevant Series.
The Managing Owner utilizes certain quantitative and qualitative analysis in connection with the identification, evaluation and selection of the trading advisors. The Managing Owner’s proprietary and commercial analytical software programs and comprehensive trading advisor database provide the quantitative basis for the trading advisor selection, portfolio implementation process, and ongoing risk management, monitoring, and review.
93
The Managing Owner’s research department is continually refining ways to assimilate vast amounts of trading advisor performance data and due-diligence information. The proprietary and commercial database of alternative investment programs is always increasing. Research team members regularly interact with trading advisors throughout the due diligence and monitoring process. Only those programs that have met strict quantitative and qualitative review are considered as potential managers of client assets. Following is a summary of the quantitative and qualitative analysis:
Quantitative Analysis
The Managing Owner’s analytical software system applies a variety of statistical measures towards the evaluation of current and historical advisor performance data. Statistical measures include but are not limited to: (1) risk/reward analysis, (2) time window analysis, (3) risk analysis, (4) correlation analysis, (5) statistical overlays and (6) performance cycle analysis.
75
Qualitative Analysis
Although quantitative analysis statistically identifies the top performing trading advisors, qualitative analysis plays a major role in the trading advisor evaluation and final selection process. Each trading advisor in the Managing Owner’s top decile universe initially undergoes extensive qualitative review by the Managing Owner’s research department, as well as continual monitoring. This analysis generally includes, but is not limited to: (1) preliminary information and due diligence, (2) background review, (3) onsite due diligence, (4) extensive due diligence questionnaires and (5)(4) written review and periodic updates. This information allows a thorough review of each trading advisor’s trading philosophy, trading systems and corporate structure.
Multi-Manager Approach
A multi-manager approach to portfolio management provides diversification of trading advisors and access to broader global markets. Multiple trading advisors can provide diversification across trading methodologies, trading time horizons, and markets traded. Additionally, multi-manager portfolios tend to provide a greater level of professional management with ongoing risk management and review. The result can be more consistent returns with lower volatility.
94
The trading system of each of the major commodity Trading Advisors and the means by which the Series access those Trading Advisors are as follows:
| Major Commodity Trading Advisor | Trading System Style | Accessed Through | ||
| Aspect Capital Limited | Systematic | Galaxy Plus | ||
| Beach Horizon | Systematic | Trading Company | ||
| BH-DG Systematic Trading LLP | Systematic | Swap | ||
| Crabel Capital Partners LLPC | Systematic | Swap | ||
| Doherty Advisors, LLC | Discretionary | Galaxy Plus | ||
| Emil Van Essen, LLC | Discretionary | Galaxy Plus | ||
| Fort, L.P. | Systematic | Galaxy Plus | ||
| H2O Asset Management | Systematic | Swap | ||
| J E Moody & Company | Systematic | Swap | ||
| Landmark Trading Company | Discretionary | Galaxy Plus | ||
| Quantitative Investment Management, LLC | Systematic | Galaxy Plus | ||
| Quantmetrics Capital Management LLP | Systematic | Galaxy Plus | ||
| Quest Partners LLC | Systematic | Galaxy Plus | ||
| Red Oak Commodity Advisors, Inc. | Discretionary | Galaxy Plus | ||
| Rosetta Capital Management, LLC | Discretionary | Galaxy Plus | ||
| Transtrend B.V. | Systematic | Galaxy Plus | ||
| Welton Investment Partners LLC | Systematic | Galaxy Plus | ||
| Winton Capital Management Ltd. | Systematic | Trading Company |
7695
As of March 31,September 30, 2018, the allocation of the assets of each applicable Series of the Trust between the Trading Advisors was as follows:
| Allocation as of March 31, 2018 (expressed as a percentage of aggregate notional exposure to commodity trading programs) | ||||||||||||||||||||||||||||||||||||||||||||||||||||||||
| Frontier | Frontier | |||||||||||||||||||||||||||||||||||||||||||||||||||||||
| Frontier | Long/Short | Frontier | Frontier | Frontier | Frontier | Frontier | Long/Short | Frontier | Frontier | Frontier | Frontier | |||||||||||||||||||||||||||||||||||||||||||||
| Diversified | Commodity | Masters | Balanced | Frontier | Winton | Heritage | Diversified | Commodity | Masters | Balanced | Frontier | Winton | Heritage | |||||||||||||||||||||||||||||||||||||||||||
| Advisor | Fund | Fund | Fund | Fund | Select Fund | Fund | Fund | Fund | Fund | Fund | Fund | Select Fund | Fund | Fund | ||||||||||||||||||||||||||||||||||||||||||
| Aspect Capital Limited | 3 | % | — | — | 4 | % | — | — | — | 3 | % | — | — | 4 | % | — | — | — | ||||||||||||||||||||||||||||||||||||||
| Beach Horizon | — | — | — | 4 | % | — | — | — | — | — | — | 4 | % | — | — | — | ||||||||||||||||||||||||||||||||||||||||
| BH-DG Systematic Trading LLP | — | — | — | — | 19 | % | — | 16 | % | — | — | — | — | 25 | % | — | 20 | % | ||||||||||||||||||||||||||||||||||||||
| Crabel Capital Partners, LLPC | 5 | % | — | — | 4 | % | — | — | — | 5 | % | — | — | 4 | % | — | — | — | ||||||||||||||||||||||||||||||||||||||
| Doherty | 5 | % | — | — | 4 | % | — | — | — | 5 | % | — | — | 4 | % | — | — | — | ||||||||||||||||||||||||||||||||||||||
| Emil Van Essen, LLC | 11 | % | 28 | % | 27 | % | 10 | % | — | — | — | 12 | % | 22 | % | 28 | % | 10 | % | — | — | — | ||||||||||||||||||||||||||||||||||
| Fort, L.P. | 11 | % | — | — | 12 | % | — | — | — | 13 | % | — | — | 10 | % | — | — | — | ||||||||||||||||||||||||||||||||||||||
| H2O Asset Management | 13 | % | — | — | 16 | % | — | — | — | 12 | % | — | — | 15 | % | — | — | — | ||||||||||||||||||||||||||||||||||||||
| J E Moody & Company | 13 | % | — | — | — | — | — | — | 15 | % | — | — | — | — | — | |||||||||||||||||||||||||||||||||||||||||
| Landmark | 1 | % | 3 | % | — | 1 | % | — | — | — | 1 | % | 7 | % | — | 1 | % | — | — | — | ||||||||||||||||||||||||||||||||||||
| Quantitative Investment Management, LLC | 13 | % | — | — | 13 | % | — | — | — | 13 | % | — | — | 13 | % | — | — | — | ||||||||||||||||||||||||||||||||||||||
| Quantmetrics Capital Management LLP | 8 | % | — | — | 7 | % | — | — | — | 10 | % | — | — | 10 | % | — | — | — | ||||||||||||||||||||||||||||||||||||||
| Quest Partners LLC | 3 | % | — | — | 1 | % | — | — | — | 3 | % | — | — | 1 | % | — | — | — | ||||||||||||||||||||||||||||||||||||||
| Red Oak Commodity Advisors, Inc. | — | 5 | % | — | — | — | — | — | — | 10 | % | — | — | — | — | — | ||||||||||||||||||||||||||||||||||||||||
| Rosetta Capital Management, LLC | — | 26 | % | — | — | — | — | — | — | 22 | % | — | — | — | — | — | ||||||||||||||||||||||||||||||||||||||||
| Transtrend B.V. | — | 16 | % | — | 35 | % | — | — | — | — | 14 | % | — | 30 | % | — | — | |||||||||||||||||||||||||||||||||||||||
| Welton Investment Partners LLC | 14 | % | 25 | % | 25 | % | 13 | % | 46 | % | — | 40 | % | 13 | % | 22 | % | 29 | % | 13 | % | 46 | % | — | 40 | % | ||||||||||||||||||||||||||||||
| Winton Capital Management Ltd. | 13 | % | — | 32 | % | 11 | % | — | 100 | % | 44 | % | 12 | % | — | 29 | % | 10 | % | — | 100 | % | 40 | % | ||||||||||||||||||||||||||||||||
Liquidity and Capital Resources
The Trust will raise additional capital only through the sale of Units offered pursuant to the continuing offering, and does not intend to raise any capital through borrowing. Due to the nature of the Trust’s business, it makes no capital expenditures and has no capital assets that are not operating capital or assets.
The Managing Owner is responsible for the payment of all of the ordinary expenses associated with the organization of the Trust and the offering of each Series of Units, except for the initial and ongoing service fee, if any, and no Series will be required to reimburse these expenses. As a result, 100% of each Series’ offering proceeds are initially available for that Series’ trading activities.
A portion of each Trading Company’s assets is used as margin to maintain that Trading Company’s forward currency contract positions, and another portion is deposited in cash in segregated accounts in the name of each Trading Company maintained for each Trading Company at the clearing brokers in accordance with CFTC segregation requirements. At March 31,September 30, 2018, cash deposited at the clearing brokers was $11,376,539$11,472,343 for the Trust. The clearing brokers are expected to credit each Trading Company with approximately 80%-100% of the interest earned on its average net assets on deposit with the clearing brokers each month. Currently, with the Federal Funds target rate at 1.25%2.00% to 1.50%2.25%, this amount is estimated to be 1.25%2.00%. In an attempt to increase interest income earned, the Managing Owner also may invest the non-margin assets in U.S. government securities which include any security issued or guaranteed as to principal or interest by the U.S., or by a person controlled by or supervised by and acting as an instrumentality of the government of the U.S. pursuant to authority granted by Congress or any certificate of deposit for any of the foregoing, including U.S. treasury bonds, U.S. treasury bills and issues of agencies of the U.S. government, and certain cash items such as money market funds and time deposits. Aggregate interest income from all sources, including assets held at clearing brokers, of up to 2%2.00% (annualized) is paid to the Managing Owner by the Frontier Balanced Fund (Class 1 and Class 2 only), Frontier Winton Fund, Frontier Select Fund, and Frontier Heritage Fund. For the Frontier Diversified Fund, Frontier Long/Short Commodity Fund (Class 1a, Class 2a, Class 3a only), Frontier Masters Fund and Frontier Balanced Fund (Class 1AP, Class 2a and Class 3a), 20% of the total interest allocated to the Series was paid to the Managing Owner from January 1, 2017 through April 28, 2017; thereafter 100% of the interest is retained by the respective Series. The amount reflected in the financial statements for the Trust and Series are disclosed on a net basis. Due to some classes not exceeding the 2% paid to the Managing Owner, amounts earned by those classes may be zero.
96
Approximately 10% to 30% of the Trust’s assets are expected to be committed as required margin for futures contracts and forwards and options trading and held by the respective broker, although the amount committed may vary significantly. Such assets are maintained in the form of cash or U.S. treasury bills in segregated accounts with the futures broker pursuant to the Commodity Exchange Act and regulations there under. Approximately 2% to 6% of the Trust’s assets are expected to be deposited with over-the-counter counterparties in order to initiate and maintain forward and swap contracts. Such assets are not held in segregation or otherwise regulated under the Commodity Exchange Act, unless such over-the-counter counterparty is registered as a futures commission merchant. These assets are held either in U.S. government securities or short-term time deposits with U.S.-regulated bank affiliates of the over-the-counter counterparties. The remaining approximately 64% to 88% of the Trust’s assets will normally be invested in cash equivalents and short-term investments, such as money market funds and time deposits and held by the clearing broker, the over-the-counter counterparties and by U.S. federally chartered banks. As of March 31,September 30, 2018, total cash and cash equivalents held at banking institutions were $814,242$65,101 for the Frontier Diversified Fund, $537,675$35,548 for the Frontier Masters Fund, $32,954 for the Frontier Long/Short Commodity Fund, $1,174,917 for the Frontier Masters Fund, $2,359,539$105,108 for the Frontier Balanced Fund, $348,711$22,923 for the Frontier Select Fund, $5,489,764$344,707 for the Frontier Winton Fund, and $651,692$59,065 for the Frontier Heritage Fund.
77
As a commodity pool, the Trust has large cash positions. Such cash positions are used to pay margin for the trading of futures, forwards and options, and also to pay redemptions. Generally, the Trust has not been forced to liquidate positions to fund redemptions. During the three months ended March 31,September 30, 2018, the Trust was able to pay all redemptions.
Off-Balance Sheet Risk
The term “off-balance sheet risk” refers to an unrecorded potential liability that, even though it does not appear on the balance sheet, may result in future obligation or loss. Each Trading Company trades in futures, forward and swap contracts and is therefore a party to financial instruments with elements of off-balance sheet market and credit risk. In entering into these contracts there exists a market risk that such contracts may be significantly influenced by market conditions, such as interest rate volatility, resulting in such contracts being less valuable. If the markets should move against all of the futures interests positions held by a Trading Company in respect of any Series at the same time, and if the Trading Advisor(s) of such Trading Company are unable to offset such futures interests positions, such Trading Company could lose all of its assets and the holders of Units of such Series would realize a 100% loss. The Managing Owner seeks to minimize market risk through real-time monitoring of open positions and the level of diversification of each Trading Advisor’s portfolio. It is anticipated that any Trading Advisor’s margin-to-equity ratio will typically not exceed approximately 35% although the actual ratio could be higher or lower from time to time.
In addition to market risk, trading futures, forward and swap contracts entails credit risk which is the risk that a counterparty will not be able to meet its obligations to a Trading Company. The counterparty for futures contracts traded in the U.S. and on most foreign exchanges is the clearinghouse associated with such exchange. In general, clearinghouses are backed by the corporate members of the clearinghouse who are required to share any financial burden resulting from the non-performance by one of their members and, as such, should significantly reduce this credit risk. In cases where the clearinghouse is not backed by the clearing members, like some foreign exchanges, it is normally backed by a consortium of banks or other financial institutions. Some non-U.S. exchanges, in contrast to U.S. exchanges are principals’ markets in which performance is the responsibility only of the individual counterparty with whom the Trading Company has entered into the transaction and not of the exchange or clearing corporation. In these kinds of markets, there is risk of bankruptcy or other failure or refusal to perform by the counterparty.
In the case of forward contracts and swaps traded on the interbank market, neither is traded on an exchange. The counterparty is generally a single bank or other financial institution, rather than a group of financial institutions; thus, there may be a greater counterparty credit risk. The Managing Owner expects the Trading Advisors to trade only with those counterparties which it believes to be creditworthy. All positions of each Trading Company are valued each day on a mark-to-market basis. There can be no assurance that any clearing member, clearinghouse or other counterparty will be able to meet its obligations to any Trading Company.
97
The Trust has entered into agreements, which provide for the indemnification of futures clearing brokers, currency trading companies, and commodity trading advisers, among others, against losses, costs, claims and liabilities arising from the performance of their individual obligations under such agreements, except for gross negligence or bad faith. The Trust has had no prior claims or payments pursuant to these agreements. The Trust’s individual maximum exposure under these arrangements is unknown, as this would involve future claims that may be made against the Trust that have not yet occurred. However, based on experience the Trust expects the risk of loss to be remote.
Disclosure of Contractual Obligations
The business of the Trust is the speculative trading of commodity interests. The majority of the Trust’s futures and forward positions, which may be categorized as “purchase obligations” under Item 303 of Regulation S-K, are short-term. That is, they are held for less than one year. Because the Trust does not enter into other long-term debt obligations, capital lease obligations, operating lease obligations or other long-term liabilities that would otherwise be reflected on the Trust’s Statement of Financial Condition, a table of contractual obligations has not been presented.
78
Results of Operations
Series Returns and Other Information
The returns for each Series and Class of Units for the three months ended March 31,September 30, 2018 and 2017, and related information, are discussed below. The activities of the Trust on a consolidated basis are explained through the activity of the underlying Series. Please refer to the discussion of the Series activities in relation to the Trust on a consolidated basis.
Each Series had exposure to commodity interest positions within one or more sectors during the three months ended March 31,September 30, 2018 and 2017. The performance of each Series was impacted over the course of the periods by, among other things, the relative performance of the relevant sector or sectors and the commodities within those sectors, the changing allocations among, and the specific positions taken by the Series’ Trading Advisors in, the relevant sector(s) and commodities, and the timing of entries and exits. For certain of the Series, a sector attribution chart has been included at the end of the relevant discussion. Each chart depicts the performance of the relevant Series’ positions within each of the relevant sectors (determined by the Managing Owner using monthly gross return and NAV figures, with various adjustments to net out a proportional allocation of the fees and expenses chargeable to the Series) during the periods presented.
Three months ended March 31,September 30, 2018 Compared to Three Months Ended March 31,September 30, 2017.
Frontier Diversified Fund
The Frontier Diversified Fund— Class 1 NAV lost 3.55% and lost 1.46%, respectively, for the three months ended September 30, 2018 and 2017, net of fees and expenses; the Frontier Diversified Fund—Class 2 NAV lost 3.12% and lost 1.03%, respectively for the three months ended September 30, 2018 and 2017, net of fees and expenses; the Frontier Diversified Fund—Class 3 NAV lost 3.07% and lost 0.96%, respectively for the three months ended September 30, 2018 and 2017.
For the three months ended September 30, 2018, the Frontier Diversified Fund recorded net loss on investments of $403,356, net investment loss of $174,822, and total expenses of $184,192 resulting in a net decrease in Owners’ capital from operations of $578,178. For the three months ended September 30, 2017, the Frontier Diversified Fund recorded net gain on investments of $68,284 net investment loss of $257,720, net investment income of $1,825 and total expenses of $259,545 resulting in a net decrease in Owners’ capital from operations of $189,436.
98
Please see additional discussion under “Nine Months Ended September 30, 2018 Compared to Nine Months Ended September 30, 2017 –Frontier Diversified Fund.”
Frontier Masters Fund
The Frontier Masters Fund—Class 1 NAV lost 2.14% and lost 2.91% for the three months ended September 30, 2018 and 2017 net of fees and expenses; the Frontier Masters Fund —Class 2 NAV lost 1.71% and lost 2.50% for the three months ended September 30, 2018 and 2017, net of fees and expenses; the Frontier Masters Fund—Class 3 NAV lost 1.64% and lost 2.43% for the three months ended September 30, 2018 and 2017, net of fees and expenses.
For the three months ended September 30, 2018, the Frontier Masters Fund recorded net loss on investments of $10,638, net investment loss of $124,728, and total expenses of $129,435, resulting in a net decrease in Owners’ capital from operations of $135,366. For the three months ended September 30, 2017, the Frontier Masters Fund recorded net loss on investments of $106,063, net investment loss of $184,502, and total expenses of $197,676, resulting in a net decrease in Owners’ capital from operations of $290,565.
Please see additional discussion under “Nine Months Ended September 30, 2018 Compared to Nine Months Ended September 30, 2017— Frontier Masters Fund.”
Frontier Long/Short Commodity Fund
The Frontier Long/Short Commodity Fund—Class 2 NAV lost 2.80% and lost 0.03%, respectively, for the three months ended September 30, 2018 and 2017 net of fees and expenses; the Frontier Long/Short Commodity Fund —Class 3 NAV lost 2.80% and lost 0.02% respectively for the three months ended September 30, 2018 and 2017 net of fees and expenses; the Frontier Long/Short Commodity Fund —Class 1a NAV lost 6.48% and lost 0.44% respectively, for the three months ended September 30, 2018 and 2017 net of fees and expenses; the Frontier Long/Short Commodity Fund —Class 2a NAV lost 6.06% and lost 0.03% respectively, for the three months ended September 30, 2018 and 2017 net of fees and expenses; the Frontier Long/Short Commodity Fund Class 3a NAV lost 6.00% and lost 0.03%, respectively, for the three months ended September 30, 2018 and 2017, net of fees and expenses.
For the three months ended September 30, 2018, the Frontier Long/Short Commodity Fund recorded net loss on investments of $111,396, net investment loss of $16,476, and total expenses of $19,652, resulting in a net decrease in Owners’ capital from operations of $127,872. For the three months ended September 30, 2017, the Frontier Long/Short Commodity Fund recorded net gain on investments of $72,790, net investment loss of $40,336, and total expenses of $40,336, resulting in a net increase in Owners’ capital from operations of $32,454.
Please see additional discussion under “Nine Months Ended September 30, 2018 Compared to Nine Months Ended September 30, 2017 – Frontier Long/Short Commodity Fund.”
Frontier Balanced Fund
The Frontier Balanced Fund—Class 1 NAV lost 4.31% and lost 1.26%, respectively, for the three months ended September 30, 2018 and 2017, net of fees and expenses; the Frontier Balanced Fund —Class 2 NAV lost 3.59% and lost 0.51%, respectively, for the three months ended September 30, 2018 and 2017, net of fees and expenses; the Frontier Balanced Fund —Class 2a NAV lost 3.56% and lost 0.48%, respectively, for the three months ended September 30, 2018 and 2017, net of fees and expenses; the Frontier Balanced Fund —Class 3a NAV lost 3.56% and lost 0.48%, respectively, for the three months ended September 30, 2018 and 2017, net of fees and expenses; the Frontier Balanced Fund —Class 1AP NAV lost 3.59% and lost 0.52% for the three months ended September 30, 2018 and 2017, net of fees and expenses.
For the three months ended September 30, 2018, the Frontier Balanced Fund recorded net loss on investments of $1,017,197 net investment loss of $579,502, and total expenses of $590,094, resulting in a net decrease in Owners’ capital from operations of $1,596,699. For the three months ended September 30, 2017, the Frontier Balanced Fund recorded net gain on investments of $367,405 net investment loss of $808,362, and total expenses of $816,616, resulting in a net decrease in Owners’ capital from operations of $440,957.
99
Please see additional discussion under “Nine Months Ended September 30, 2018 Compared to Nine Months Ended September 30, 2017 – Frontier Balanced Fund.”
Frontier Select Fund
The Frontier Select Fund—Class 1 NAV gained 0.88% and lost 5.50%, respectively, for the three months ended September 30, 2018 and 2017, net of fees and expenses; the Frontier Select Fund —Class 2 NAV gained 1.65% and lost 4.78% respectively for the three months ended September 30, 2018 and 2017, net of fees and expenses; the Frontier Select Fund —Class 1AP NAV gained 1.64% and lost 4.68%, respectively, for the three months ended September 30, 2018 and 2017.
For the three months ended September 30, 2018, the Frontier Select Fund recorded net gain on investments of $97,395, net investment loss of $59,225 and total expenses of $59,225, resulting in a net increase in Owners’ capital from operations of $38,170. For the three months ended September 30, 2017, the Frontier Select Fund recorded net loss on investments of $246,729, net investment loss of $86,152 and total expenses of $86,152, resulting in a net decrease in Owners’ capital from operations of $332,881.
Please see additional discussion under “Nine Months Ended September 30, 2018 Compared to Nine Months Ended September 30, 2017 – Frontier Select Fund.”
Frontier Winton Fund
The Frontier Winton Fund—Class 1 NAV lost 1.78% and lost 1.24%, respectively, for the three months ended September 30, 2018 and 2017, net of fees and expenses; the Frontier Winton Fund —Class 2 NAV gained 1.34% and lost 0.48%, respectively, for the three months ended September 30, 2018 and 2017, net of fees and expenses; the Frontier Winton Fund —Class 1AP NAV lost 1.00% and lost 4.11%, respectively, for the three months ended September 30, 2018 and 2017.
For the three months ended September 30, 2018, the Frontier Winton Fund recorded net gain on investments of $66,648, net investment loss of $254,280, and total expenses of $254,280, resulting in a net decrease in Owners’ capital from operations of $187,632. For the three months ended September 30, 2017, the Frontier Winton Fund recorded net gain on investments of $440,557, net investment loss of $422,546, and total expenses of $442,278 resulting in a net decrease in Owners’ capital from operations of $196,414, after non-controlling interests of $214,425.
Please see additional discussion under “Nine Months Ended September 30, 2018 Compared to Nine Months Ended September 30, 2017 – Frontier Winton Fund.”
Frontier Heritage Fund
The Frontier Heritage Fund—Class 1 NAV lost 1.54% and lost 2.74%, respectively, for the three months ended September 30, 2018 and 2017 net of fees and expenses; the Frontier Heritage Fund —Class 2 NAV lost 0.80% and lost 2.02%, respectively for the three months ended September 30, 2018 and 2017, net of fees and expenses; the Frontier Heritage Fund —Class 1AP NAV lost 0.76% and lost 2.01%, respectively, for the three months ended September 30, 2018 and 2017.
For the three months ended September 30, 2018, the Frontier Heritage Fund recorded net gain on investments of $22,592, net investment loss of $85,602, and total expenses of $85,602, resulting in a net decrease in Owners’ capital from operations of $66,140, after non-controlling interests of $3,130 For the three months ended September 30, 2017, the Frontier Heritage Fund recorded net gain on investments of $27,074, net investment loss of $120,882, and total expenses of $120,882, resulting in a net decrease in Owners’ capital from operations of $147,535, after non-controlling interests of $53,727.
100
Please see additional discussion under “Nine Months Ended September 30, 2018 Compared to Nine Months Ended September 30, 2017 – Frontier Heritage Fund.”
Nine months ended September 30, 2018 Compared to Nine Months Ended September 30, 2017.
Frontier Diversified Fund
2018
The Frontier Diversified Fund—Class 1 NAV lost 8.49%10.27% and gained 2.47%lost 5.44%, respectively, for the threenine months ended March 31,September 30, 2018 and 2017, net of fees and expenses; the Frontier Diversified Fund—Class 2 NAV lost 8.08%9.08% and gained 2.86%lost 4.24%, respectively for the threenine months ended March 31,September 30, 2018 and 2017, net of fees and expenses; the Frontier Diversified Fund—Class 3 NAV lost 8.03%8.92% and gained 2.93%lost 4.06%, respectively for the threenine months ended March 31,September 30, 2018 and 2017.
For the threenine months ended March 31,September 30, 2018, the Frontier Diversified Fund recorded net loss on investments of $1,514,894$1,380,601 net investment loss of $187,092, net investment income of $7,617$523,024, and total expenses of $194,709$550,432 resulting in a net decrease in Owners’ capital from operations of $1,701,986. The net investment loss reflected a deduction of $45,819 as total realized embedded fees in swaps. Of this amount, $0 in management fees and $0 in incentive fees were payable to the Managing Owner and $20,840 in management fees and $24,979 in incentive fees were payable to the Trading Advisor(s).$1,903,625. The NAV per Unit, Class 1, decreased from $116.41 at December 31, 2017 to $106.54$104.46 as of March 31,September 30, 2018. The NAV per Unit, Class 2, decreased from $135.19 at December 31, 2017 to $124.26$122.91 as of March 31,September 30, 2018. The NAV per Unit, Class 3 decreased from $125.68 at December 31, 2017 to $115.59$114.47 as of March 31,September 30, 2018. Total Class 1 subscriptions and redemptions for the period were $0 and $213,456$354,495, respectively. Total Class 2 subscriptions and redemptions for the period were $0 and $529,912,$933,695, respectively. Total Class 3 subscriptions and redemptions for the period were $0 and $302,632,$1,330,409, respectively. Ending capital at March 31,September 30, 2018 was $1,919,307$1,740,332 for Class 1, $8,350,387$7,861,937 for Class 2 and $8,449,007$7,342,192 for Class 3. Ending capital at December 31, 2017 was $2,332,222 for Class 1, $9,632,746 for Class 2 and $9,501,719 for Class 3.
The Frontier Diversified Fund may have both long and short exposure to the Interest Rates, Currencies, Stock Indices, Energies, Metals and Commodities sectors.
79101
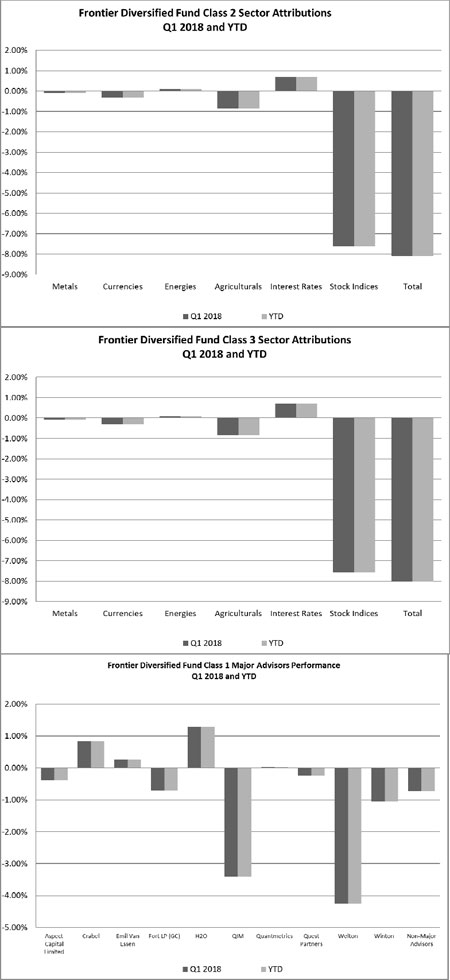
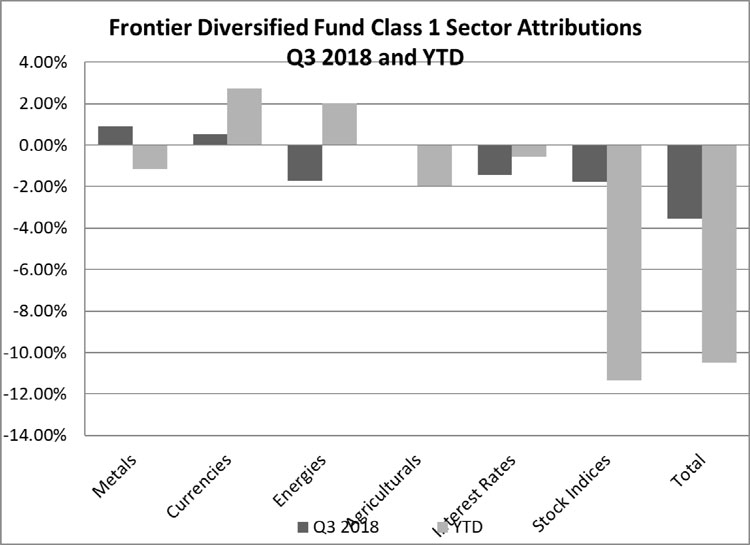
80102
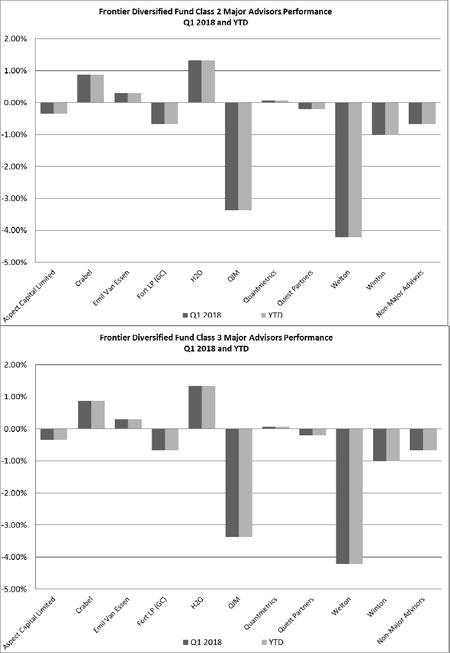
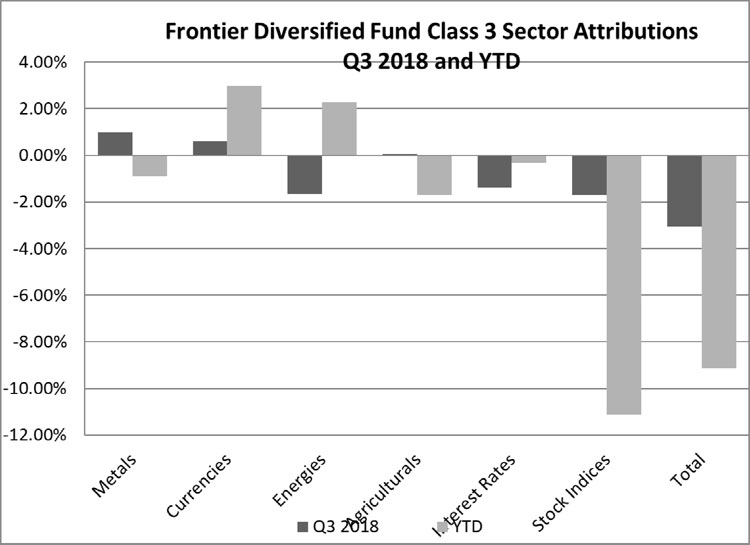
103
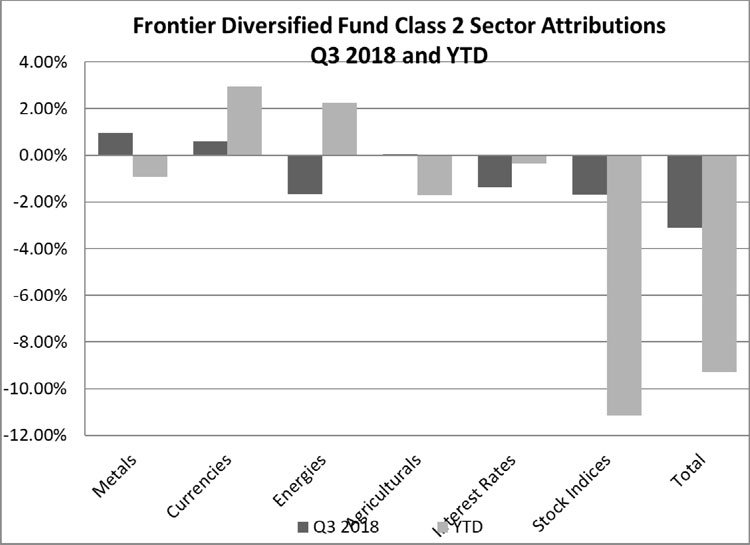
104
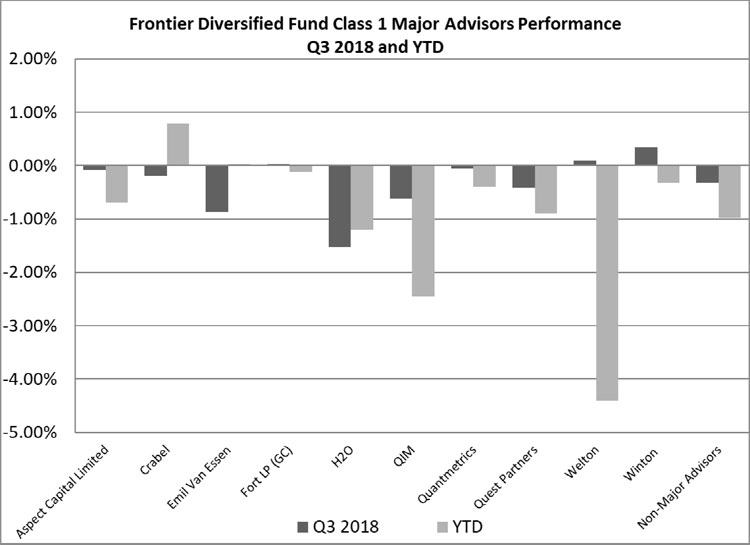
105
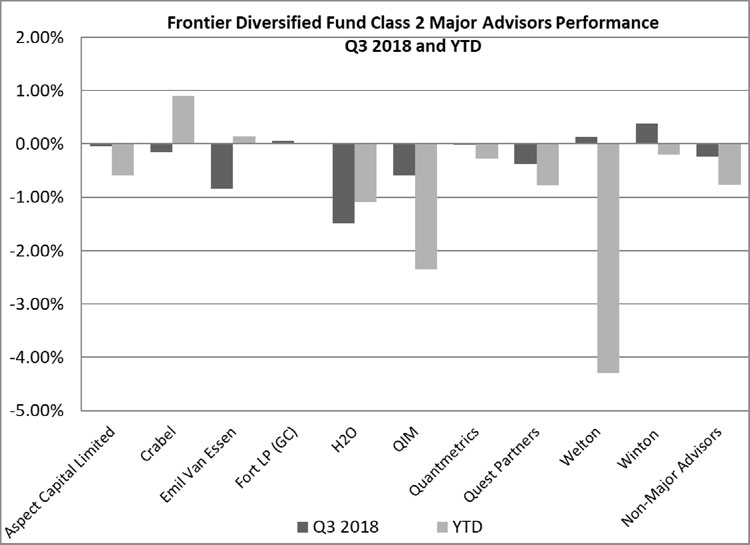
106

Two of the six sectors traded in the Frontier Diversified Fund waswere profitable in Q1Q3 2018 and two of the six were profitable YTD. Metals and Currencies were profitable for Q3 2018 while Energies, and Interest Rates, was profitable for Q1 2018 while Metals, Currencies, Agriculturals and Stock IndiciesIndices finished negative for the quarter. Currencies and Energies and Interest Rates waswere profitable for YTD while Interest Rates, Metals, Currencies, Agriculturals and Stock IndiciesIndices finished negative YTDYTD.
In terms of major CTA performance Crabel, Emil Van Essen, H20Fort, Welton and QuantmetricsWinton finished positive for the quarter. Aspect, Crabel, Fort,Emil Van Essen, H20, Quantitative Investment Management, Quantmetrics and Quest Welton, and WintonPartners were negative for the quarterquarter.
Crabel and Emil Van Essen Fort, H20, and QIM Crabel, Emil Van Essen, H20 and Quantmetrics were positive YTD while Aspect, Crabel, Fort, Quest,H2O, Quantitative Investment Management, Quantmetrics, Welton and Winton were negative YTD.
81107
Frontier Diversified Fund
2017
The Frontier Diversified Fund—Class 1 NAV gained 2.47%lost 5.44% and gained 2.52%0.23%, respectively, for the threenine months ended March 31,September 30, 2017 and 2016, net of fees and expenses; the Frontier Diversified Fund—Class 2 NAV gained 2.86%lost 4.24% and gained 2.96%1.57%, respectively for the threenine months ended March 31,September 30, 2017 and 2016, net of fees and expenses; the Frontier Diversified Fund—Class 3 NAV gained 2.93%lost 4.06% and gained 3.03%1.76%, respectively for the threenine months ended March 31,September 30, 2017 and 2016.
For the threenine months ended March 31,September 30, 2017, the Frontier Diversified Fund recorded net gain on investments of $2,007,523$1,411,439 net investment incomeloss of $73,263,$1,173,289, and total expenses of $475,957$1,272,511 resulting in a net increase in Owners’ capital from operations of $1,604,829.$238,150. The NAV per Unit, Class 1, increaseddecreased from $116.43 at December 31, 2016 to $119.31$110.10 as of March 31,September 30, 2017. The NAV per Unit, Class 2, increaseddecreased from $132.94 at December 31, 2016 to $136.74$127.30 as of March 31,September 30, 2017. The NAV per Unit, Class 3 increaseddecreased from $123.27 at December 31, 2016 to $126.88$118.27 as of March 31,September 30, 2017. Total Class 1 subscriptions and redemptions for the period were $3,063 and $1,213,227,$1,652,836 respectively. Total Class 2 subscriptions and redemptions for the period were $599,571 and $1,388,611,$30,047,952, respectively. Total Class 3 subscriptions and redemptions for the period were $934,124$1,357,356 and $1,247,303,$4,472,986, respectively. Ending capital at March 31,September 30, 2017 was $4,088,255$3,352,300 for Class 1, $38,553,983$9,547,801 for Class 2 and $13,121,599$9,595,656 for Class 3. Ending capital at December 31, 2016 was $5,189,420 for Class 1, $38,231,581 for Class 2 and $13,050,390 for Class 3.
The Frontier Diversified Fund may have both long and short exposure to the Interest Rates, Currencies, Stock Indices, Energies, Metals and Commodities sectors.
82108
83
84
OneTwo of the six sectors traded in the Frontier Diversified Fund waswere profitable in Q1 2017.Q3 2017 and two of the six were profitable YTD. Energies and Stock Indices waswere profitable for Q3 2017 while Metals, Currencies, Energies, Agriculturals and Interest Rates finished negative for the quarter. Energies and Stock Indices were profitable for YTD while Metals, Currencies, Agriculturals and Interest Rates finished negative YTD
In terms of major CTA performance Chesapeake, Emil Van Essen, Fort, LP,H20 and QIM Quantmetrics and Winton finished positive for the quarter. Aspect, Chesapeake, Crabel, Quantmetrics, Quest, Welton and Winton were negative for the quarter
Emil Van Essen, Fort, H20 and QIM was positive YTD while Aspect, Chesapeake, Crabel, Quantmetrics, Quest, Welton and Winton were negative YTD.
109
Frontier Masters Fund
2018
The Frontier Masters Fund—Class 1 NAV lost 14.33%15.29% and gained 0.27%lost 9.23%, respectively, for the threenine months ended March 31,September 30, 2018 and 2017 net of fees and expenses; the Frontier Masters Fund —Class 2 NAV lost 13.96%14.17%, and gained 0.68%lost 8.45%, respectively for the threenine months ended March 31,September 30, 2018 and 2017, net of fees and expenses; the Frontier Masters Fund—Class 3 NAV lost 13.91%14.00% and gained 0.74%lost 8.33%, respectively, for the threenine months ended March 31,September 30, 2018 and 2017, net of fees and expenses.
For the threenine months ended March 31,September 30, 2018, the Frontier Masters Fund recorded net loss on investments of $1,462,847,$1,270,952, net investment loss of $172,947,$437,149, and total expenses of $181,366,$458,590, resulting in a net decrease in Owners’ capital from operations of $1,635,794.$1,708,101. The NAV per Unit, Class 1, decreased from $114.74 at December 31, 2017 to $98.30$97.20 as of March 31,September 30, 2018. The NAV per Unit, Class 2, decreased from $133.27 at December 31, 2017 to $114.67$114.39 as of March 31,September 30, 2018. The NAV per Unit, Class 3, decreased from $124.40 at December 31, 2017 to $107.10$106.99 as of March 31,September 30, 2018. Total Class 1 subscriptions and redemptions for the period were $0 and $87,730,$299,860, respectively. Total Class 2 subscriptions and redemptions for the period were $0 and $461,827,$1,477,167, respectively. Total Class 3 subscriptions and redemptions for the period were $0 and $645,784,$1,679,341, respectively. Ending capital at March 31,September 30, 2018 was $2,422,157$2,102,479 for Class 1, $2,574,6005$1,532,527 for Class 2 and $4,129,248$3,157,665 for Class 3. Ending capital at December 31, 2017 was $2,913,542 for Class 1, $3,538,600 for Class 2 and $5,504,998 for Class 3.
110
The Frontier Masters Fund may have both long and short exposure to the Interest Rates, Currencies, Stock Indices, Energies, Metals and Commodities sectors.
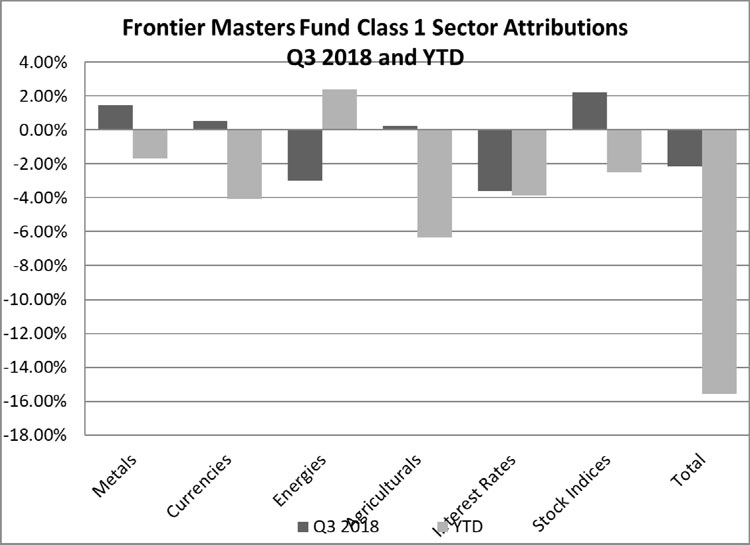
85111
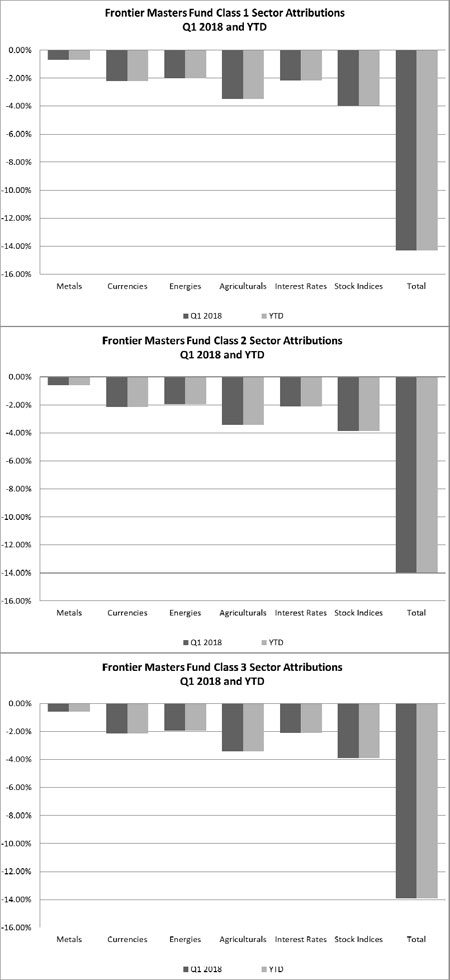

86112

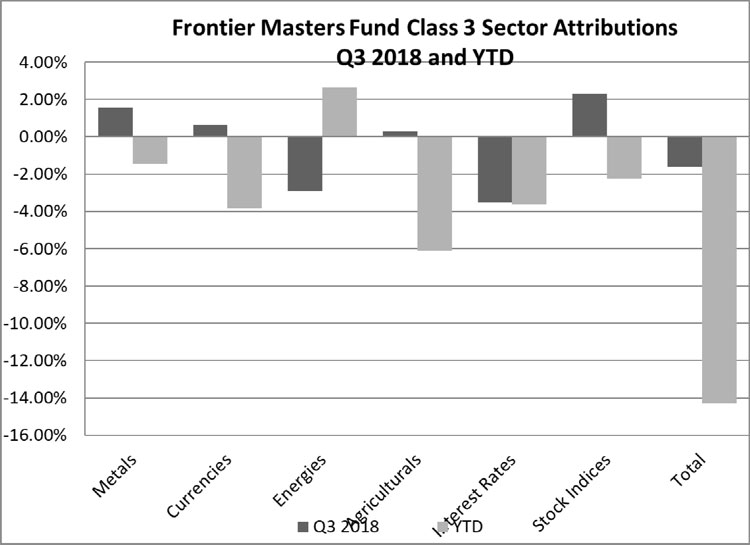
113
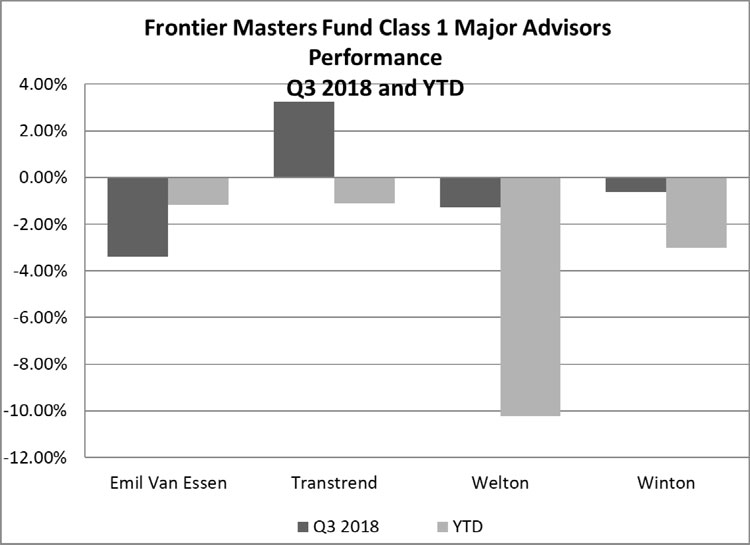
114
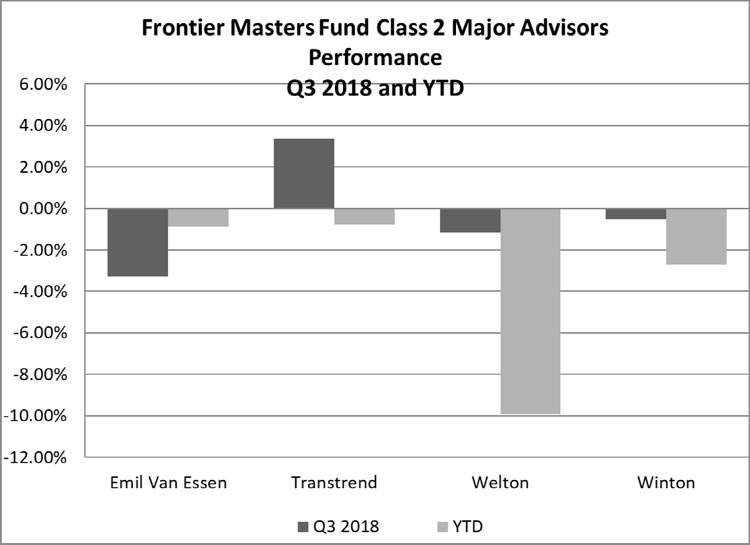
115
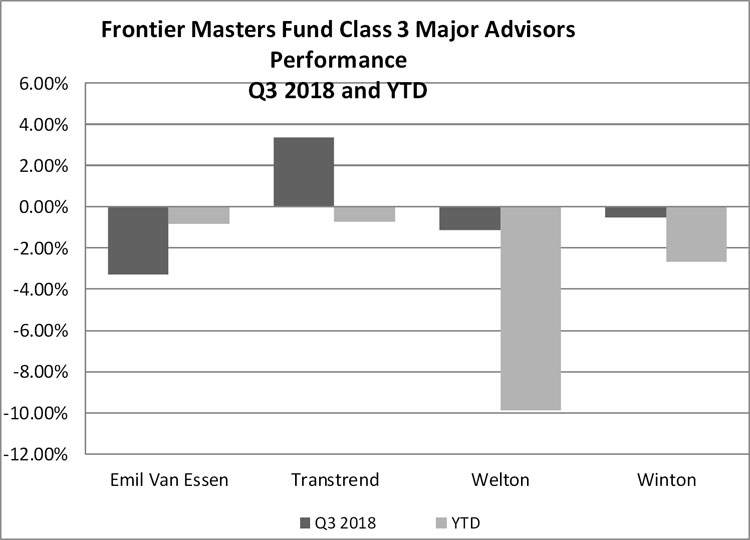
NoneFour of the six sectors traded in the Frontier Masters Fund waswere profitable in Q1Q3 2018 and allone of the six was profitable YTD. Agriculturals, Metals, Currencies and Stock Indices were profitable for Q3 2018 while Energies and Interest Rates finished negative for the quarter. Energies were profitable YTD while Metals, Currencies, Agriculturals, Interest Rates and Stock Indices finished negative YTD.
In terms of major CTA performance Emil Van Essen finished positive for the quarter. Winton,Welton, Transtrend and WeltonWinton were negative for the quarter
quarter. Emil Van Essen, was positive YTD while Transtrend, Welton and Winton were negative YTD.
87116
2017
The Frontier Masters Fund—Class 1 NAV gained 0.27%lost 11.87% and gained 5.44%5.47%, respectively, for the threenine months ended March 31,September 30, 2017 and 2016 net of fees and expenses; the Frontier Masters Fund —Class 2 NAV gained 0.68%lost 10.74%, and gained 5.90%6.87% respectively, for the threenine months ended March 31,September 30, 2017 and 2016, net of fees and expenses; the Frontier Masters Fund—Class 3 NAV gained 0.74%lost 10.56% and gained 5.97%7.08%, respectively, for the threenine months ended March 31,September 30, 2017 and 2016, net of fees and expenses.
For the threenine months ended March 31,September 30, 2017, the Frontier Masters Fund recorded net gainloss on investments of $388,839,$871,687 net investment incomeloss of $40,095,$680,300, and total expenses of $304,178,$752,891, resulting in a net increasedecrease in Owners’ capital from operations of $124,756.$1,551,987. The NAV per Unit, Class 1, increaseddecreased from $112.80 at December 31, 2016 to $113.10$99.41 as of March 31,September 30, 2017. The NAV per Unit, Class 2, increaseddecreased from $128.78 at December 31, 2016 to $129.65$114.95 as of March 31,September 30, 2017. The NAV per Unit, Class 3, increaseddecreased from $119.89 at December 31, 2016 to $120.78$107.23 as of March 31,September 30, 2017. Total Class 1 subscriptions and redemptions for the period were $2,610 and $465,552,$1,976,359, respectively. Total Class 2 subscriptions and redemptions for the period were $65,000 and $478,486,$2,102,200, respectively. Total Class 3 subscriptions and redemptions for the period were $364,269$1,571,804 and $338,109,$1,272,628, respectively. Ending capital at March 31,September 30, 2017 was $4,921,108$2,949,731 for Class 1, $5,295,008$3,194,222 for Class 2 and $6,227,679$5,761,594 for Class 3. Ending capital at December 31, 2016 was $5,361,626 for Class 1, $5,657,562 for Class 2 and $6,150,119 for Class 3.
117
The Frontier Masters Fund may have both long and short exposure to the Interest Rates, Currencies, Stock Indices, Energies, Metals and Commodities sectors.
88
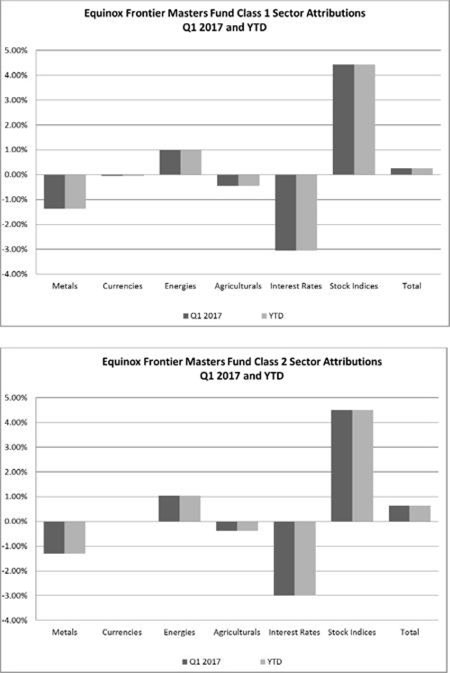
89
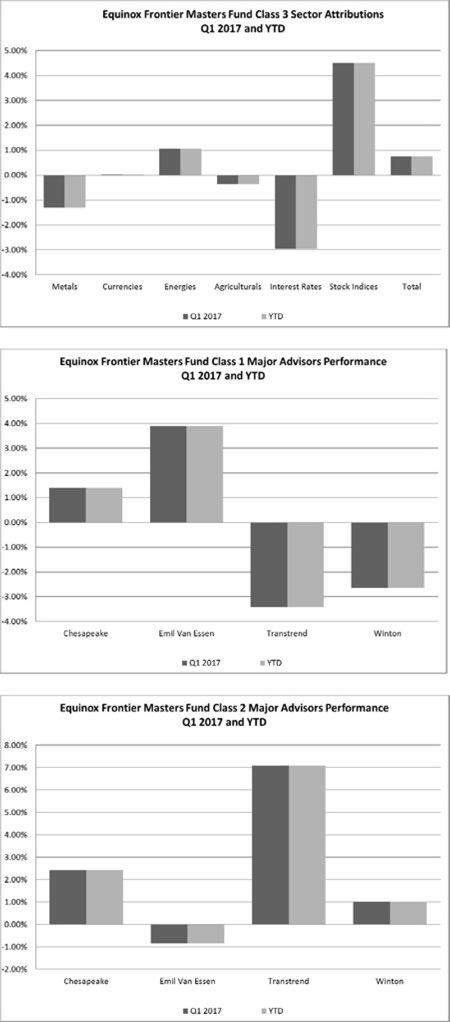
90
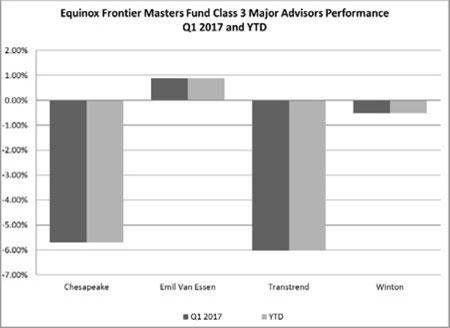

TwoThree of the six sectors traded in the Frontier Masters Fund were profitable in Q1 2017.Q3 2017 and two of the six were profitable YTD. Metals, Energies and Stock Indices were positiveprofitable for Q3 2017 while Currencies, Agriculturals and Interest Rates finished negative for the quarter. Energies and Stock Indices were profitable for YTD while Metals, Currencies, Agriculturals and Interest Rates werefinished negative for the quarter. YTD
In terms of major CTA performance Emil Van Essen was profitable, whileand Winton finished positive for the quarter. Chesapeake, Transtrend and WintonWelton were negative for the quarter
Emil Van Essen was positive YTD while Chesapeake, Transtrend, Welton and Winton were negative YTD.
118
Frontier Long/Short Commodity Fund
2018
The Frontier Long/Short Commodity Fund—Class 2 NAV lost 2.91%10.59% and gained 2.79 %,lost 10.20%, respectively, for the threenine months ended March 31,September 30, 2018 and 2017, net of fees and expenses; the Frontier Long/Short Commodity Fund —Class 3 NAV lost 2.91%10.60% and gained 3.11%lost 6.70% respectively for the threenine months ended March 31,September 30, 2018 and 2017, net of fees and expenses; the Frontier Long/Short Commodity Fund —Class 1a NAV lost 4.29%18.64% and gained 2.39%lost 10.26% respectively, for the threenine months ended March 31,September 30, 2018 and 2017, net of fees and expenses; the Frontier Long/Short Commodity Fund —Class 2a NAV lost 3.89%17.57% and gained 3.61%lost 9.76% respectively, for the threenine months ended March 31,September 30, 2018 and 2017, net of fees and expenses; the Frontier Long/Short Commodity Fund Class 3a NAV lost 3.83%17.40% and gained 4.17%lost 7.17%, respectively, for the threenine months ended March 31,September 30, 2018 and 2017, net of fees and expenses.
For the threenine months ended March 31,September 30, 2018, the Frontier Long/Short Commodity Fund recorded net loss on investments of $103,393,$419,317, net investment loss of $21,315,$56,293, and total expenses of $21,315,$66,928, resulting in a net decrease in Owners’ capital from operations of $124,708. The net investment loss reflected a deduction of $3,829 as total realized embedded fees in swaps. Of this amount, $0 in management fees and $0 in incentive fees were payable to the Managing Owner and $3,829 in management fees and $0 in incentive fees were payable to the Trading Advisor(s).$475,610. The NAV per Unit, Class 2, decreased from $115.81 at December 31, 2017 to $112.44$103.54 as of March 31,September 30, 2018. The NAV per Unit, Class 3, decreased from $121.50$115.81 at December 31, 2017 to $ 117.97$108.62 as of March 31,September 30, 2018. The NAV per Unit, Class 1a, decreased from $81.35 at December 31, 2017 to $ 77.86$66.19 as of March 31,September 30, 2018. The NAV per Unit, Class 2a, decreased from $93.59 at December 31, 2017 to $89.95$77.15 as of March 31,September 30, 2018. The NAV per Unit, Class 3a, decreased from $97.99 at December 31, 2017 to $94.24$80.94 as of March 31,September 30, 2018. Total Class 2 redemptions for the period were $63,154.$114,112. Total Class 3 redemptions for the period were $58,209.$215,389. Total Class 1a redemptions were $60,185.$79,178. Class 2a redemptions for the period were $85,871.$96,591. Class 3a subscriptions and redemptions for the period were $0 and $25,324$263,745 respectively. Ending capital at March 31,September 30, 2018 was $191,347$127,697 for Class 2, $2,344,659$2,010,934 for Class 3, $48,403$23,320 for Class 1a, $341,967$282,810 for Class 2a and $910,225$564,666 for Class 3a. Ending capital at December 31, 2017 was $258,900 for Class 2, $2,472,994 for Class 3, $107,619 for Class 1a, $442,644 for Class 2a and $971,895 for Class 3a.
119
The Frontier Long/Short Commodity Fund may have both long and short exposure to the Base Metals, Energies, Grains, Meats, Precious Metals, Financials and Softs sectors, although the majority of the exposure will typically be in the Energies, Metals and Softs sectors.
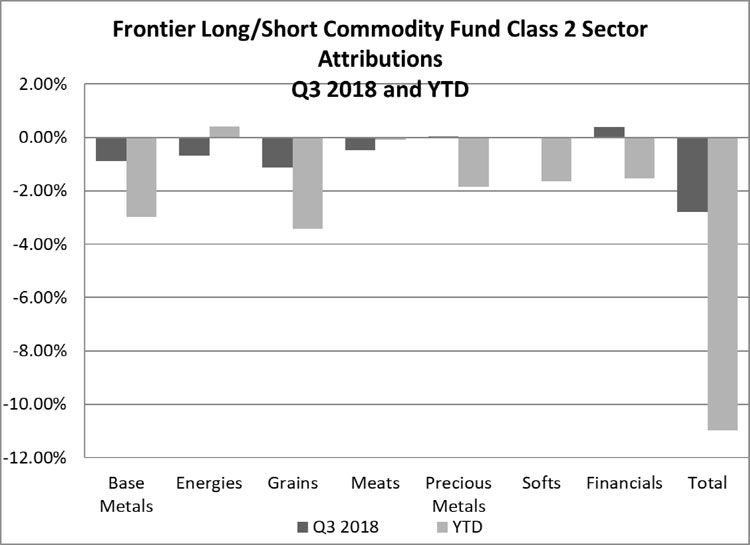
91120
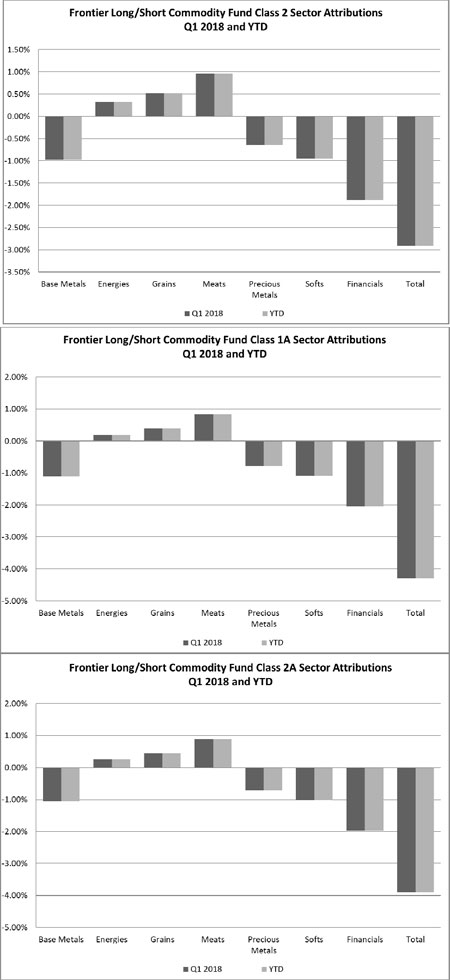
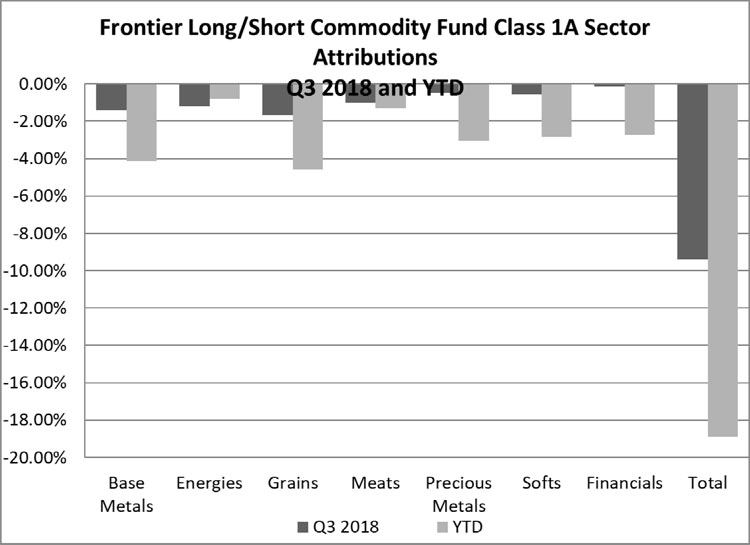
92121
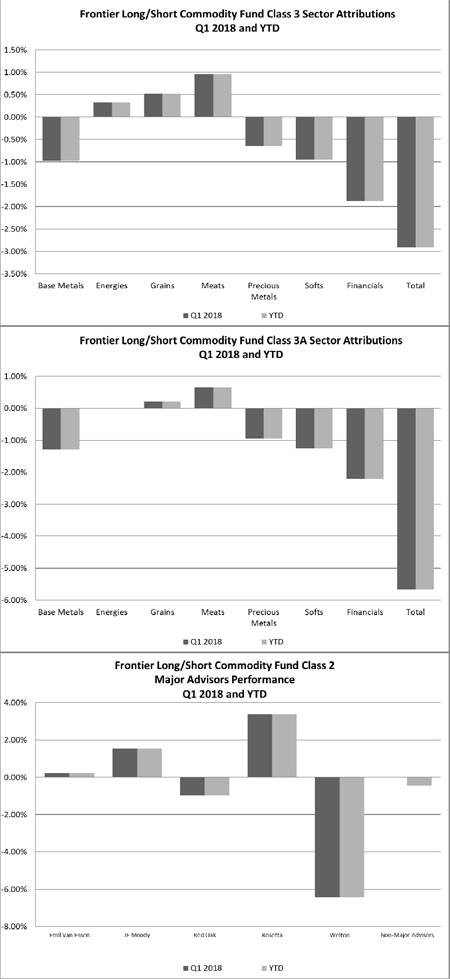
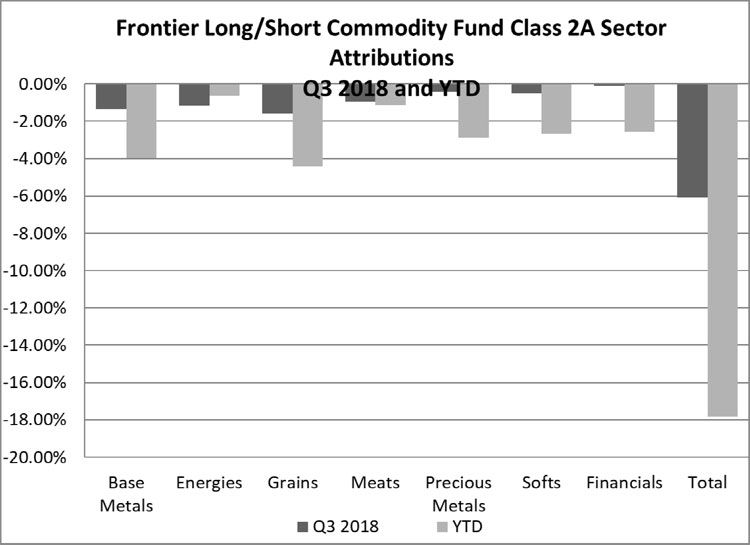
93122
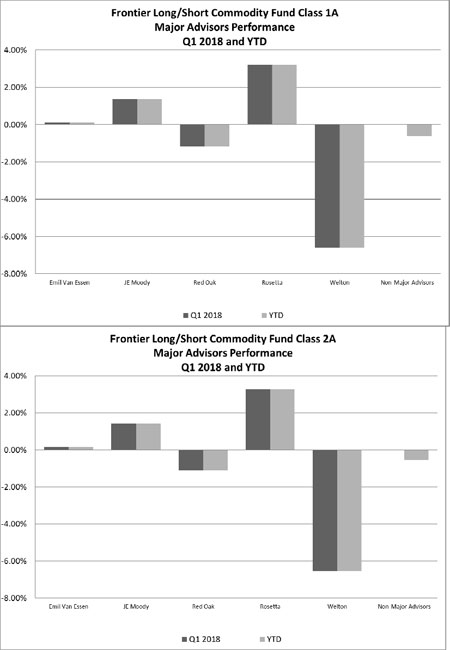
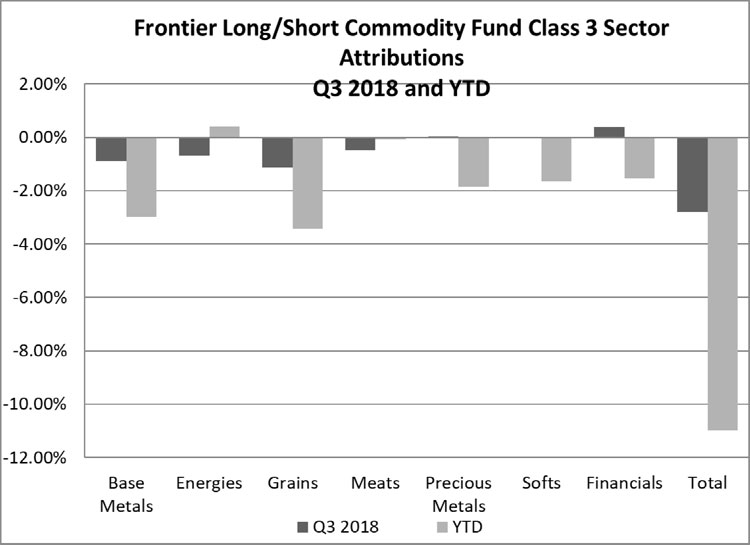
94123
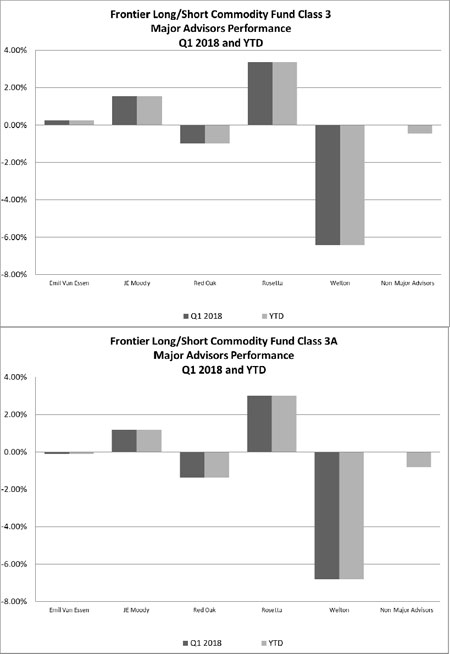
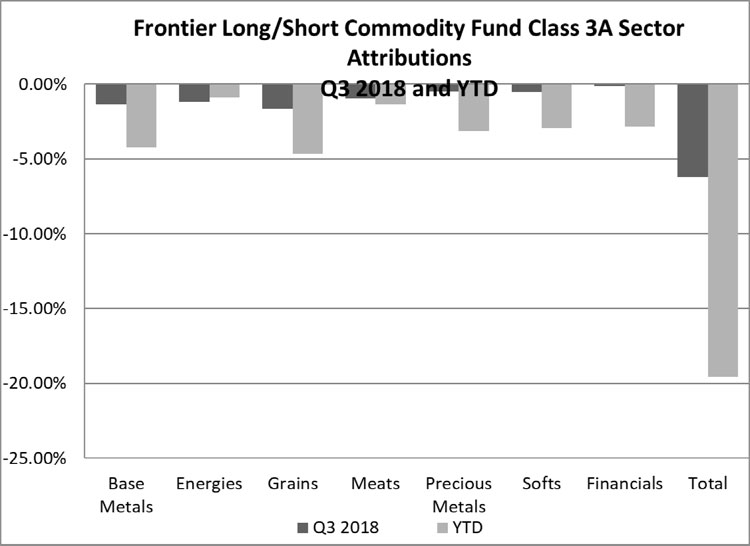
124
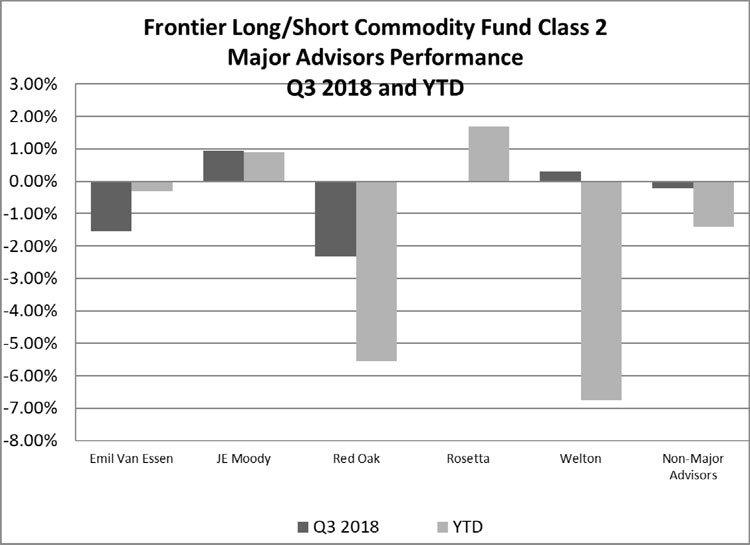
125
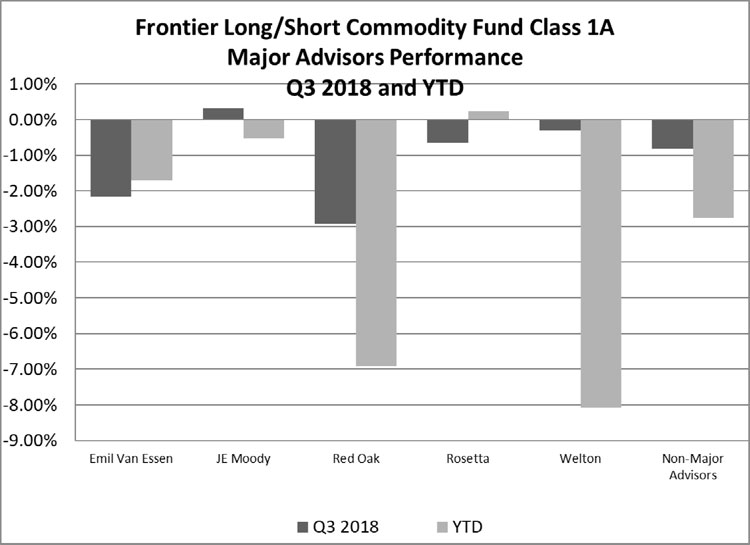
126
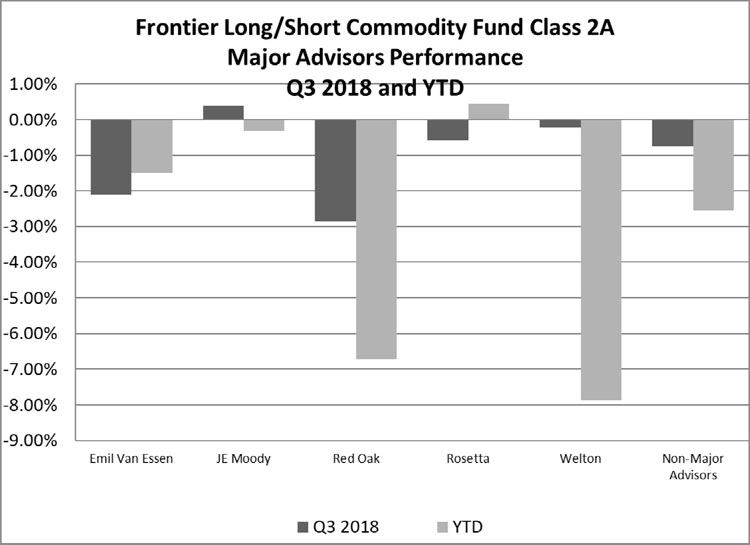
127
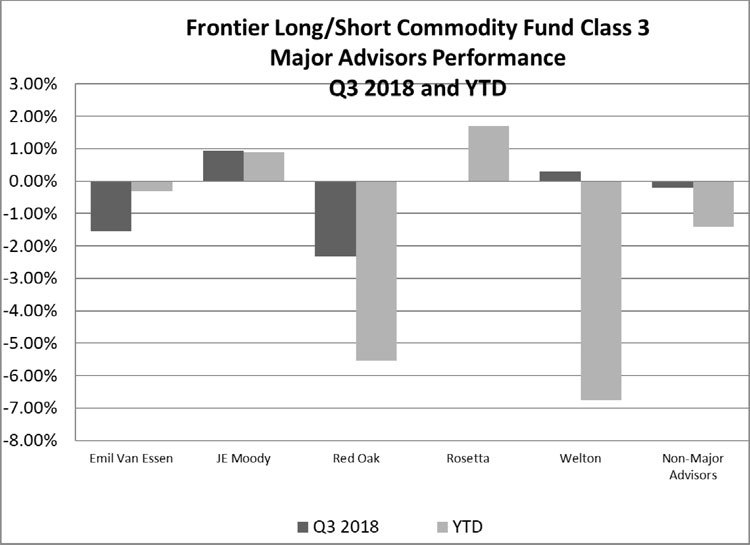
128
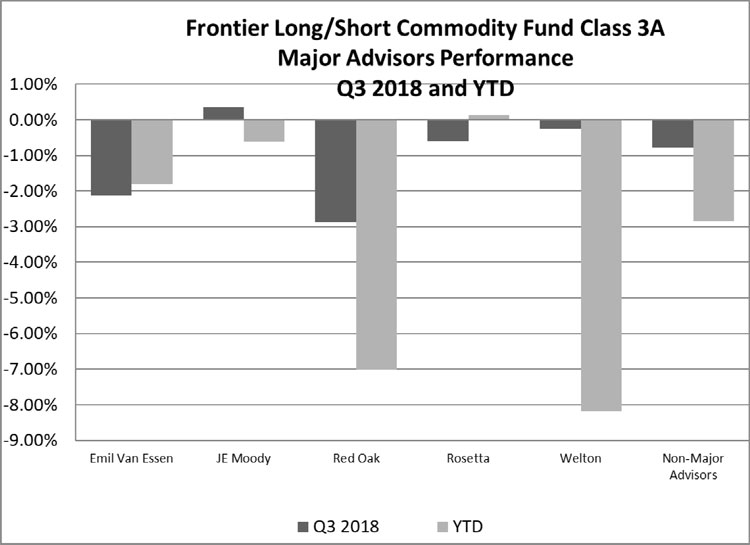
ThreeNone of the seven sectors traded in the Frontier Long/Short Commodity Fund were profitable in Q3 2018 and None of the seven were profitable YTD. Energies, Base Metals, Grains, Meats, Precious Metals, Softs and Financials finished negative for the quarter. Energies, Base Metals, Grains, Meats, Precious Metals Softs and Financials finished negative YTD.
In terms of major CTA performance JE Moody finished positive for the quarter. Emil Van Essen, Red Oak, Rosetta and Welton were negative for the quarter
JE Moody and Rosetta were positive YTD while, Emil Van Essen, Red Oak and Welton were negative YTD.
129
2017
The Frontier Long/Short Commodity Fund—Class 2 NAV lost 10.22% and lost 4.95%, respectively, for the nine months ended September 30, 2017 and 2016, net of fees and expenses; the Frontier Long/Short Commodity Fund —Class 3 NAV lost 6.70% and lost 4.06% respectively for the nine months ended September 30, 2017 and 2016, net of fees and expenses; the Frontier Long/Short Commodity Fund —Class 1a NAV lost 10.26% and lost 5.30% respectively, for the nine months ended September 30, 2017 and 2016, net of fees and expenses; the Frontier Long/Short Commodity Fund —Class 2a NAV lost 9.76% and lost 4.16% respectively, for the nine months ended September 30, 2017 and 2016, net of fees and expenses; the Frontier Long/Short Commodity Fund Class 3a NAV lost 7.17% and lost 3.17%, respectively, for the nine months ended September 30, 2017 and 2016, net of fees and expenses.
For the nine months ended September 30, 2017, the Frontier Long/Short Commodity Fund recorded net loss on investments of $231,314, net investment loss of $131,706, and total expenses of $131,706, resulting in a net decrease in Owners’ capital from operations of $363,020. The NAV per Unit, Class 2, decreased from $129.56 at December 31, 2016 to $116.32 as of September 30, 2017. The NAV per Unit, Class 3, decreased from $130.80 at December 31, 2016 to $122.04 as of September 30, 2017. The NAV per Unit, Class 1a, decreased from $92.78 at December 31, 2016 to $83.26 as of September 30, 2017. The NAV per Unit, Class 2a, decreased from $105.67 at December 31, 2016 to $95.36 as of September 30, 2017. The NAV per Unit, Class 3a, decreased from $107.50 at December 31, 2016 to $99.79 as of September 30, 2017. Total Class 2 redemptions for the period were $460,379. Total Class 3 redemptions for the period were $1,665,875. Total Class 1a redemptions were $1,783,854. Class 2a redemptions for the period were $450,732. Class 3a subscriptions and redemptions for the period were $1,051,248 and $847,983 respectively. Ending capital at September 30, 2017 was $323,267 for Class 2, $2,558,912 for Class 3, $130,409 for Class 1a, $467,824 for Class 2a and $1,264,520 for Class 3a. Ending capital at December 31, 2016 was $808,363 for Class 2, $4,405,863 for Class 3, $1,913,595 for Class 1a, $963,195 for Class 2a and $1,174,511 for Class 3a.
130
The Frontier Long/Short Commodity Fund may have both long and short exposure to the Base Metals, Energies, Grains, Meats, Precious Metals, Financials and Softs sectors, although the majority of the exposure will typically be in the Energies, Metals and Softs sectors.
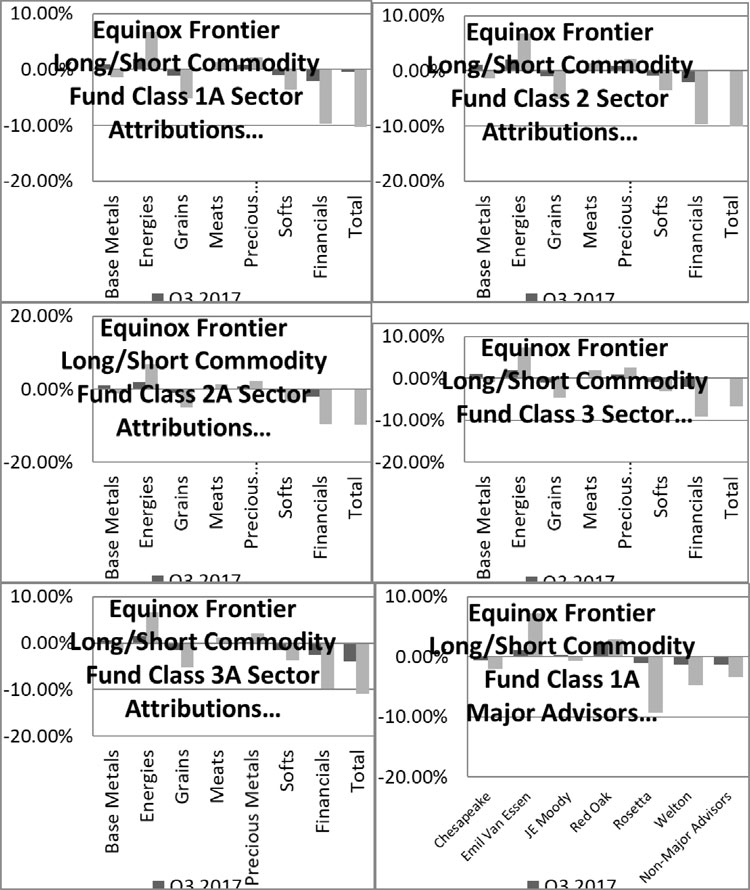
131
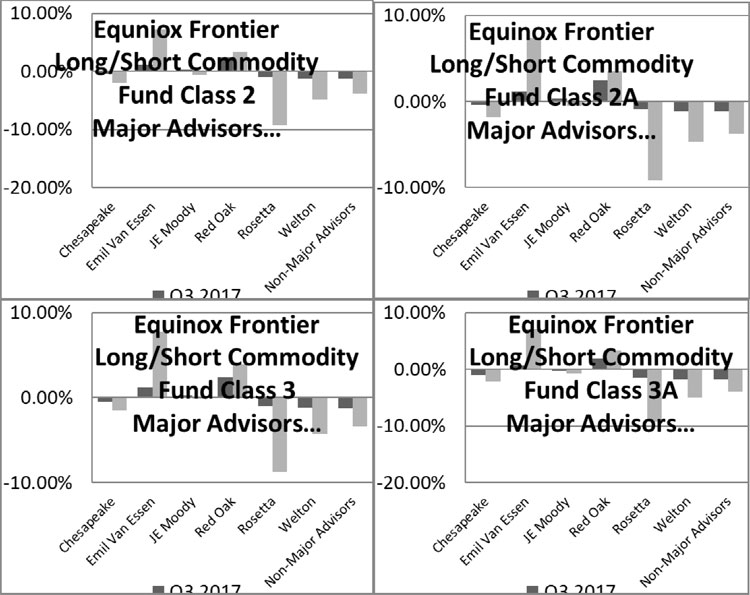
Four of the seven sectors traded in the Frontier Long/Short Commodity Fund was profitable in Q1 2018Q3 2017 and three of the seven were profitable YTD. Base Metal, Energies Grains, and MeatsPrecious Metals were profitable for Q1 2018Q3 2017 while Base Metal, Precious Metal,Grains, Softs and Financials finished negative for the quarter. Energies, Grains,Meats and MeatsPrecious Metals was profitable for YTD while Base Metal, Precious Metal,Metals, Grains, Softs and Financials finished negative YTD
In terms of major CTA performance Emil Van Essen, JE Moody and RosettaRed Oak finished positive for the quarter. Red Oak,Chesapeake, Rosetta and Welton were negative for the quarter.
Emil Van Essen JE Moody, and RosettaRed Oak were positive YTD while Red Oak,Chesapeake, JE Moody, Rosetta and Welton were negative YTD.
95132
2017
The Frontier Long/Short Commodity Fund—Class 2 NAV gained 2.79% for the three months ended March 31, 2017, net of fees and expenses; the Frontier Long/Short Commodity Fund —Class 3 NAV gained 3.11% for the three months ended March 31, 2017, net of fees and expenses; the Frontier Long/Short Commodity Fund —Class 1a NAV gained 2.39%, for the three months ended March 31, 2017, net of fees and expenses; the Frontier Long/Short Commodity Fund —Class 2a NAV gained 3.61% , for the three months ended March 31, 2017, net of fees and expenses; the Frontier Long/Short Commodity Fund Class 3a NAV gained 4.17% for the three months ended March 31, 2017, net of fees and expenses.
For the three months ended March 31, 2017, the Frontier Long/Short Commodity Fund recorded net gain on investments of $435,033, net investment income of $0, and total expenses of $84,246, resulting in a net increase in Owners’ capital from operations of $340,787 The NAV per Unit, Class 2, increased from $129.56 at December 31, 2016 to $133.17 as of March 31, 2017. The NAV per Unit, Class 3, increased from $130.80 at December 31, 2016 to $134.87 as of March 31, 2017. The NAV per Unit, Class 1a, increased from $92.78 at December 31, 2016 to $95.00 as of March 31, 2017. The NAV per Unit, Class 2a, increased from $105.67 at December 31, 2016 to $109.48 as of March 31, 2017. The NAV per Unit, Class 3a, increased from $107.50 at December 31, 2016 to $111.98 as of March 31, 2017. Total Class 2 redemptions for the period were $305,995. Total Class 3 redemptions for the period were $714,148 Total Class 1a redemptions were $1,052,525. Class 2a redemptions for the period were $234,095. Class 3a subscriptions and redemptions for the period were $704,623 and $318,658 respectively. Ending capital at March 31, 2017 was $542,287 for Class 2, $3,893,593 for Class 3, $954,692 for Class 1a, $782,297 for Class 2a and $1,624,974 for Class 3a. Ending capital at December 31, 2016 was $808,137 for Class 2, $4,404,630 for Class 3, $1,913,059 for Class 1a, $962,925 for Class 2a and $1,174,183 for Class 3a.
The Frontier Long/Short Commodity Fund may have both long and short exposure to the Interest Rates, Currencies, Stock Indices, Energies, Metals, and Commodities sectors, although the majority of the exposure will typically be in the Energies, Metals, and Commodities sectors.
96
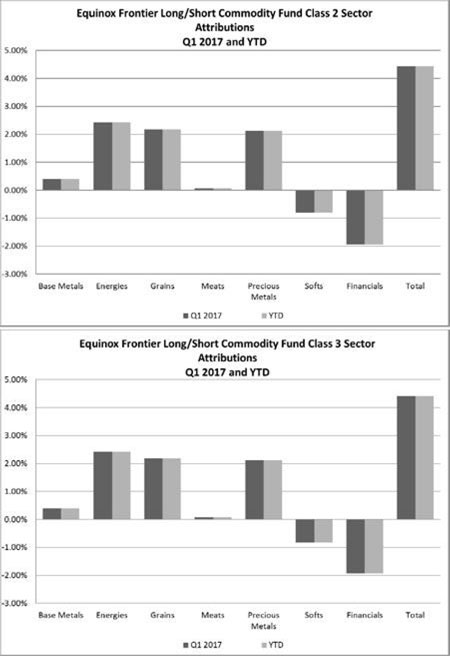
97
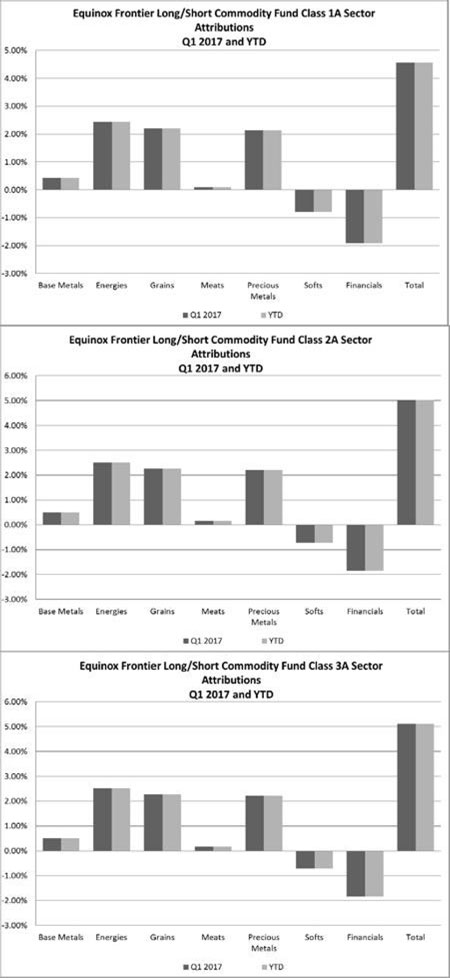
98
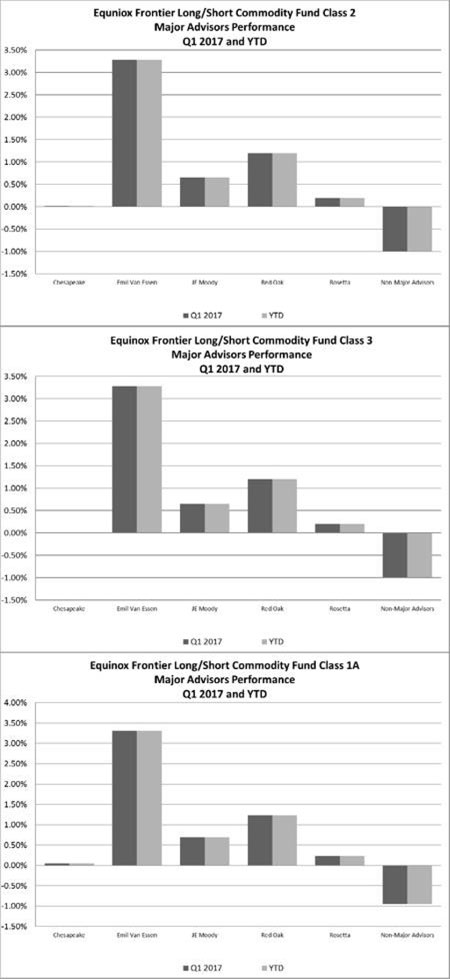
99
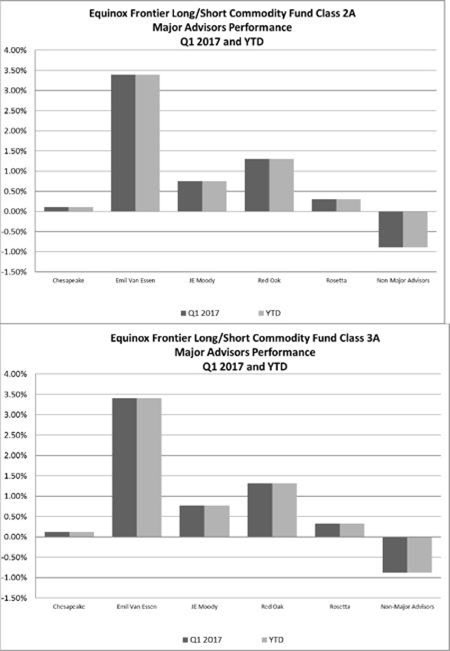
Five of the seven sectors traded in the Frontier Long/Short Commodity Fund were profitable in Q1 2017. Base Metals, Energies, Grains, Meats and Precious Metals finished positive for the quarter while Softs and Financials finished negative for the quarter.
In terms of major CTA performance, all five major CTAs in the Frontier Long/Short Commodity Fund were profitable in Q1 2017. The non-major CTAs were negative for the quarter.
100
Frontier Balanced Fund
2018
The Frontier Balanced Fund—Class 1 NAV lost 8.11%11.88% and gained 2.23%lost 4.90%, respectively, for the threenine months ended March 31,September 30, 2018 and 2017, net of fees and expenses; the Frontier Balanced Fund —Class 2 NAV lost 7.40%9.86% and gained 2.98%lost 2.74%, respectively, for the threenine months ended March 31,September 30, 2018 and 2017, net of fees and expenses; the Frontier Balanced Fund —Class 2a NAV lost 7.45%9.84% and gained 3.03%lost 2.14%, respectively, for the threenine months ended March 31,September 30, 2018 and 2017, net of fees and expenses; the Frontier Balanced Fund —Class 3a NAV lost 7.46%9.84% and gained 3.03%2.41%, respectively, for the threenine months ended March 31,September 30, 2018 and 2017, net of fees and expenses; the Frontier Balanced Fund —Class 1AP NAV lost 7.46%9.92% and gained 2.98%lost 2.25% for the threenine months ended March 31,September 30, 2018 and 2017, net of fees and expenses.
For the threenine months ended March 31,September 30, 2018, the Frontier Balanced Fund recorded net loss on investments of $2,907,257,$3,185,079 net investment loss of $797,948, net investment income of $16,516,$1,975,859, and total expenses of $814,464,$2,011,395, resulting in a net increasedecrease in Owners’ capital from operations of $3,705,205. The net investment loss reflected a deduction of $123,896 as total realized embedded fees in swaps. Of this amount, $0 in management fees and $0 in incentive fees were payable to the Managing Owner and $53,123 in management fees and $70,773 in incentive fees were payable to the Trading Advisor(s).$5,160,938. The NAV per Unit, Class 1, decreased from $135.96 at December 31, 2017 to $124.93$119.81 as of March 31,September 30, 2018. The NAV per Unit, Class 1AP, decreased from $150.56 at December 31, 2017 to $139.33$135.63 as of March 31,September 30, 2018. The NAV per Unit, Class 2, decreased from $202.90 at December 31, 2017 to $187.88$182.90 as of March 31,September 30, 2018. The NAV per Unit, Class 2a, increaseddecreased from $175.77 at December 31, 2017 to $162.67$158.48 as of March 31,September 30, 2018. The NAV per Unit, Class 3a, decreased from $175.18 at December 31, 2017 to $162.12$157.94 as of March 31,September 30, 2018. Total Class 1 subscriptions and redemptions for the period were $2,340,422.$0 and $6,038,368 respectively. Total Class 1AP redemptions for the period were $0.$111,300. Total Class 2 subscriptions and redemptions for the period were $549,135.$0 and $1,514,640, respectively. Total Class 2a subscriptions and redemptions for the period were $65,968.$0 and $75,968, respectively. Total Class 3a redemptions for the period were $87,336.$348,080. Ending capital at March 31,September 30, 2018 was $33,417,322$28,460,992 for Class 1, $556,803$431,663 for Class 1AP, $5,923,141$4,815,402 for Class 2, $430,639$368,147 for Class 2a, and $1,198,208$906,681 for Class 3a. Ending capital at December 31, 2017 was $38,744,003 for Class 1, $601,247 for Class 1AP, $6,977,027 for Class 2, $529,931 for Class 2a and $1,379,971 for Class 3a.
133
The Frontier Balanced Fund may have both long and short exposure to the Interest Rates, Currencies, Stock Indices, Energies, Metals and Commodities sectors.
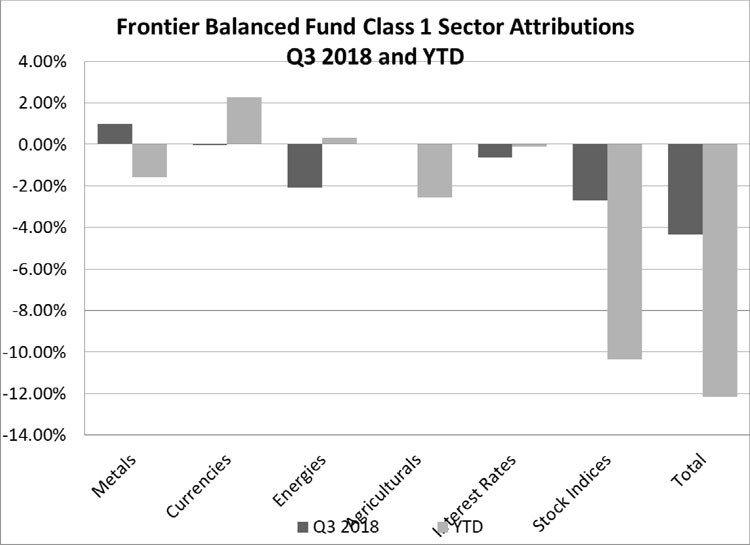
101134
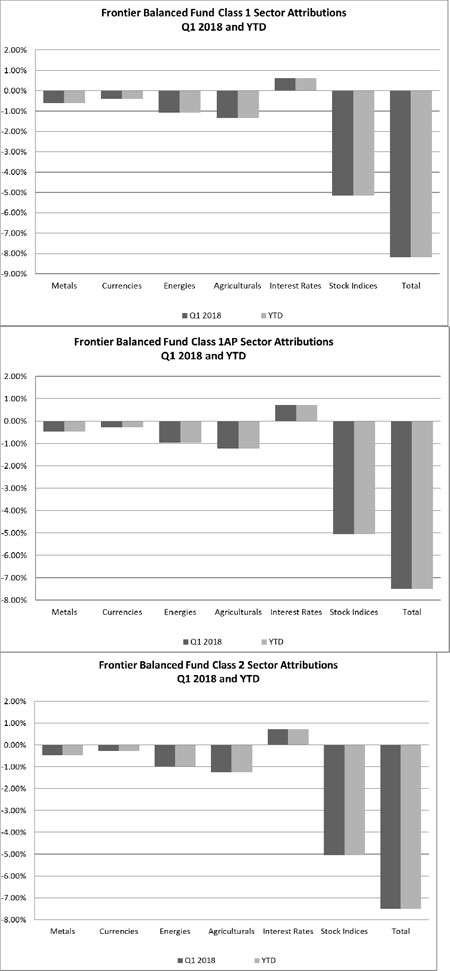
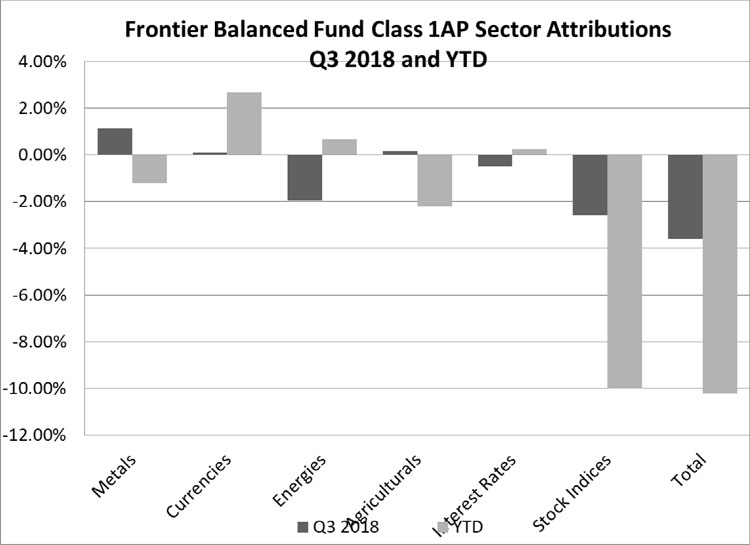
102135
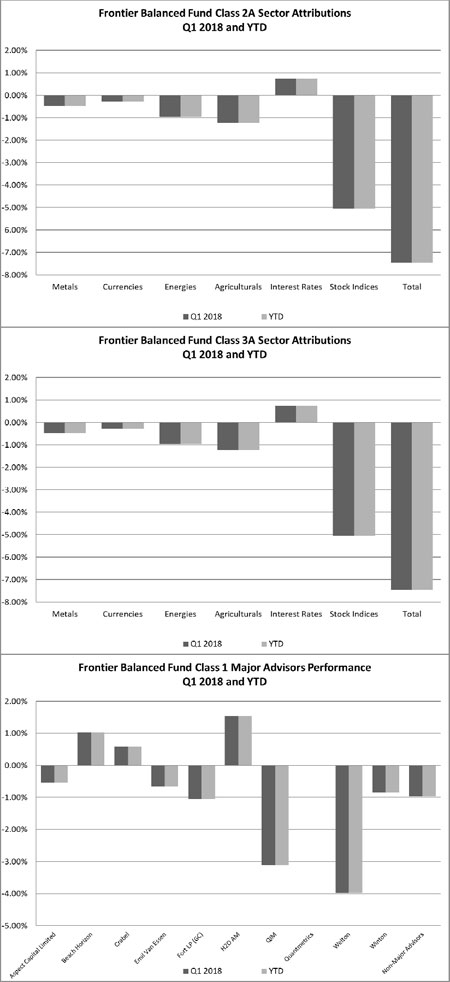

103136
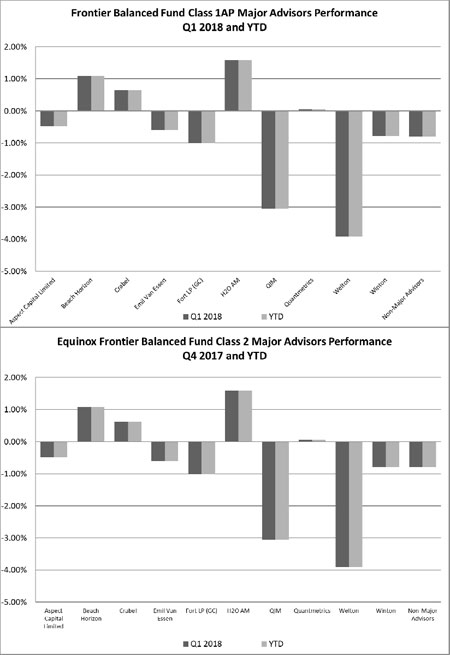
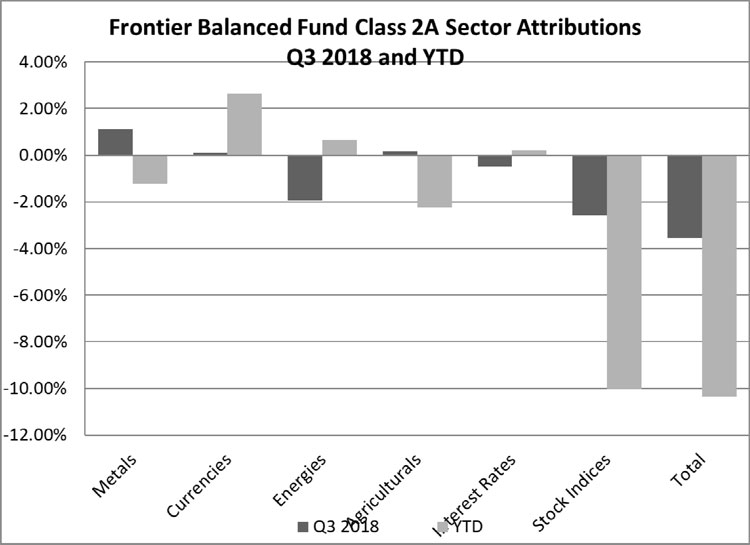
104137
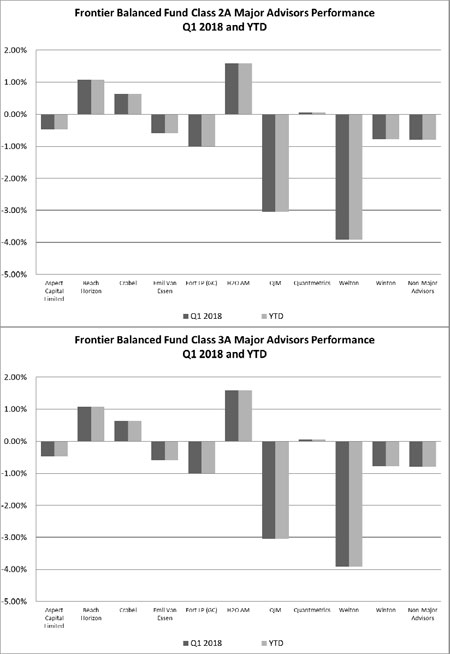

138
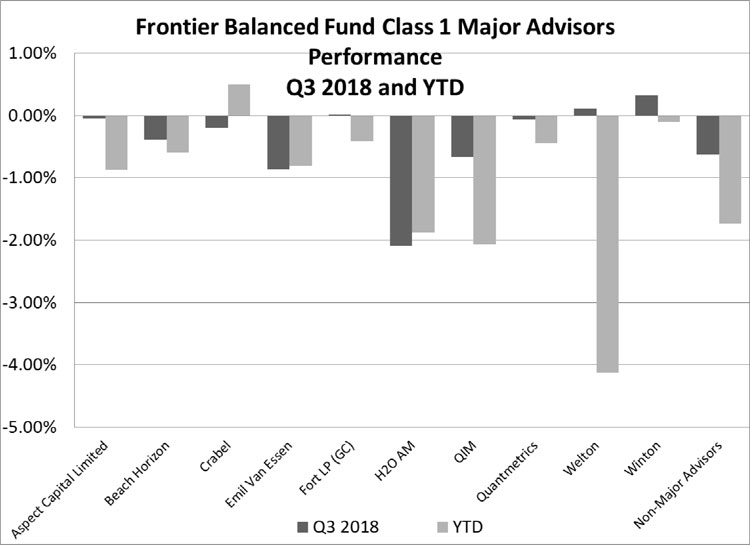
139

140
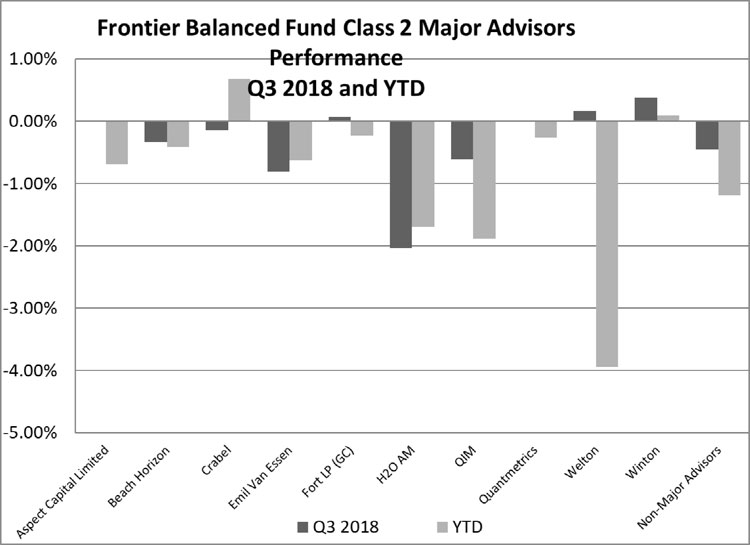
141
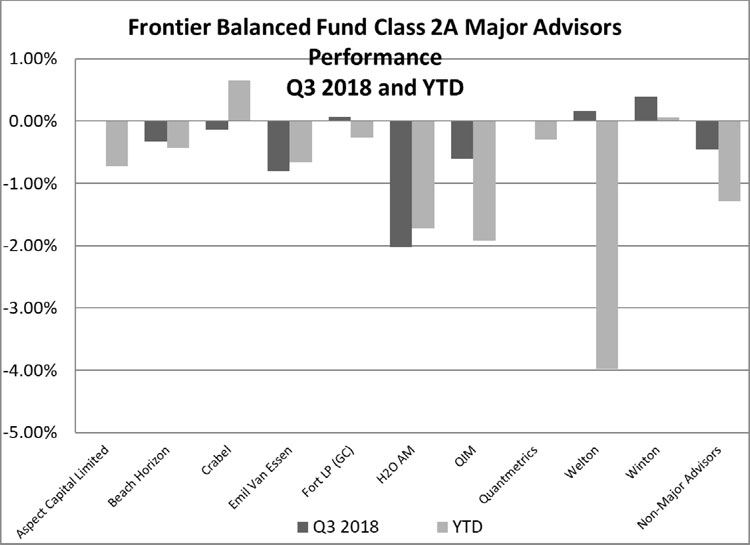
142

OneTwo of the six sectors traded in the Frontier Balanced Fund were profitable in Q1 2018.Q3 2018 and two of the six were profitable YTD. Metals and Agriculturals were profitable for Q3 2018 while Currencies and Energies were profitable YTD. Energies, Interest Rates, were profitable while Metals, Currencies Agriculturals,and Stock Indicies and Energies finishedIndices were negative for the quarter.quarter, while Agriculturals, Interest Rates, were positive YTD while Metals Currencies, Agriculturals,and Stock Indicies and Energies wereIndices finished negative YTD.
In terms of major CTA performance four ofFort, Welton and Winton finished positive for the ten major CTAs in the Frontier Balanced Fund were profitable in Q1 2018.quarter. Aspect, Beach Horizon, Crabel, H20 AM and Quantmetrics were positive for the quarter while Aspect, Emil Van Essen, Fort LP (GC), QIM, WeltonH20, Quantmetrics and Winton areQuantitative Investment Management were negative for the quarter.
Beach Horizon, Crabel H20 AM and Quantmetrics Winton were positive YTD while Aspect, Beach Horizon, Emil Van Essen, Fort, LP (GC), QIM,H20, Quantitative Investment Management, Quantmetrics and Welton and Winton were negative YTD.
105143
2017
The Frontier Balanced Fund—Class 1 NAV lost 4.90% and gained 2.23%1.94%, respectively, for the threenine months ended March 31,September 30, 2017 and 2016, net of fees and expenses; the Frontier Balanced Fund —Class 2 NAV lost 2.74% and gained 2.98%4.28%, respectively, for the threenine months ended March 31,September 30, 2017 and 2016, net of fees and expenses; the Frontier Balanced Fund —Class 2a NAV lost 2.41% and gained 3.03%4.82%, respectively, for the threenine months ended March 31,September 30, 2017 and 2016, net of fees and expenses; the Frontier Balanced Fund —Class 3a NAV lost 2.41% and gained 3.034.82%, respectively, for the threenine months ended March 31,September 30, 2017 and 2016, net of fees and expenses; the Frontier Balanced Fund —Class���Class 1AP NAV lost 2.75% and gained 2.98%4.28% for the threenine months ended March 31,September 30, 2017 and 2016, net of fees and expenses.
For the threenine months ended March 31,September 30, 2017, the Frontier Balanced Fund recorded net gain on investments of $2,926,792$1,312,398 net investment incomeloss of $1,161,$3,028,545, and total expenses of $981,478,$3,037,960, resulting in a net increasedecrease in Owners’ capital from operations of $1,946,475.$1,716,147. The NAV per Unit, Class 1, increaseddecreased from $134.80 at December 31, 2016 to $137.81$128.20 as of March 31,September 30, 2017. The NAV per Unit, Class 1AP, increaseddecreased from $144.97 at December 31, 2016 to $149.29$140.98 as of March 31,September 30, 2017. The NAV per Unit, Class 2, increaseddecreased from $194.99 at December 31, 2016 to $200.81$189.64 as of March 31,September 30, 2017. The NAV per Unit, Class 2a, increaseddecreased from $169.05 at December 31, 2016 to $174.17$164.98 as of March 31,September 30, 2017. The NAV per Unit, Class 3a, increaseddecreased from $168.49 at December 31, 2016 to $173.59$164.42 as of March 31,September 30, 2017. Total Class 1 subscriptions and redemptions for the period were $34,075$34,027 and $4,066,907,$15,765,084 respectively. Total Class 1AP redemptions for the period were $90,030.$92,739. Total Class 2 subscriptions and redemptions for the period were $4,937 and $360,713,$15,256,156, respectively. Total Class 2a subscriptions and redemptions for the period were $123,835.$123,835 and $122,954, respectively. Total Class 3a redemptions for the period were $30,584.$323,956. Ending capital at March 31,September 30, 2017 was $54,121,504$39,265,876 for Class 1, $607,004$570,654 for Class 1AP, $22,705,082$7,448,454 for Class 2, $655,919$501,231 for Class 2a, and $1,770,950$1,398,919 for Class 3a. Ending capital at December 31, 2016 was $56,955,371 for Class 1, $677,181 for Class 1AP, $22,401,557 for Class 2, $516,256 for Class 2a and $1,749,006 for Class 3a.
144
The Frontier Balanced Fund may have both long and short exposure to the Interest Rates, Currencies, Stock Indices, Energies, Metals and Commodities sectors.
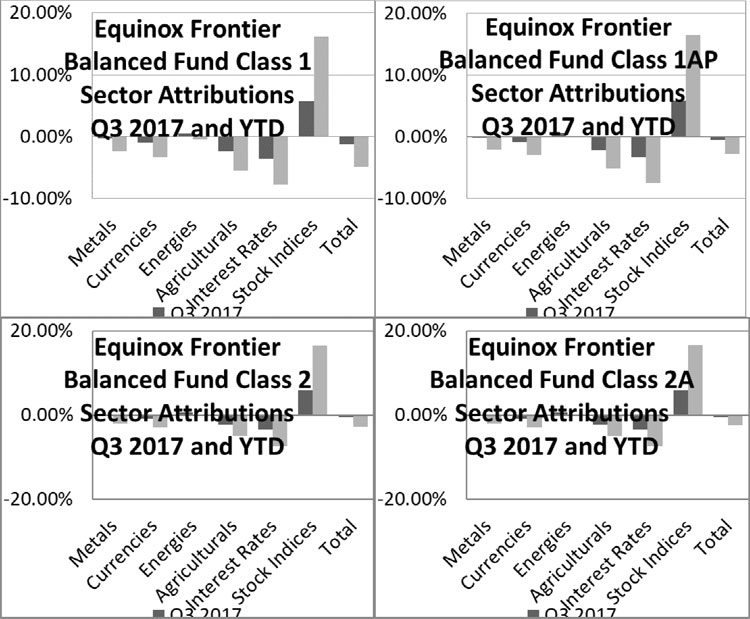
106145
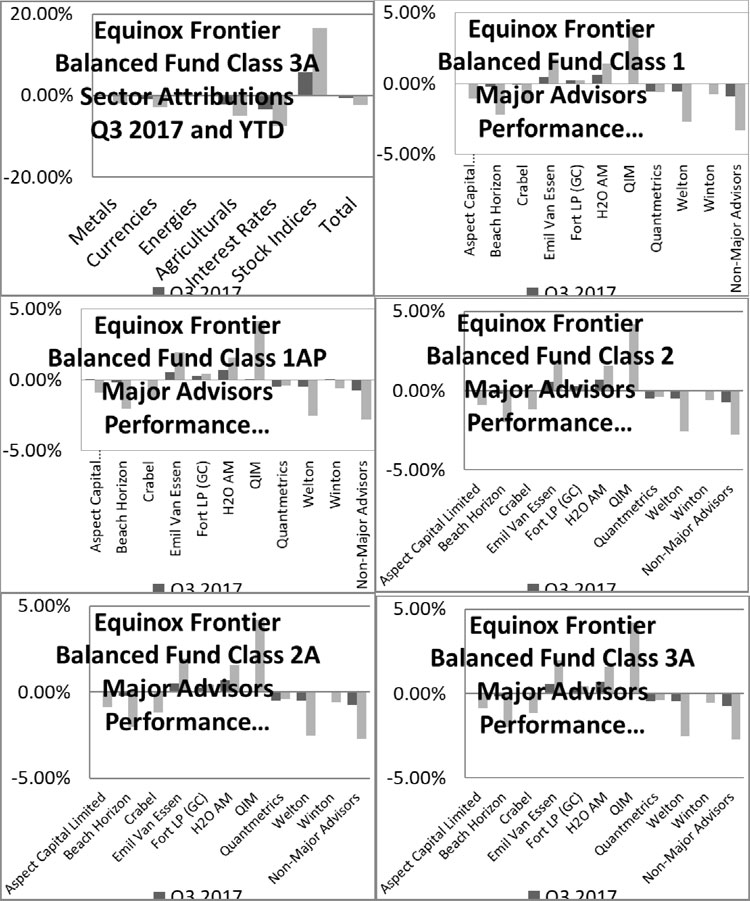
Two of Contentsthe six sectors traded in the Frontier Balanced Fund were profitable in Q3 2017 and one of the six was profitable YTD. Energies and Stock Indices were profitable for Q3 2016 while Metals, Currencies, Agriculturals and Interest Rates finished negative for the quarter. Stock Indices were profitable YTD while Currencies, Energies, Agriculturals and Interest Rates finished negative YTD.
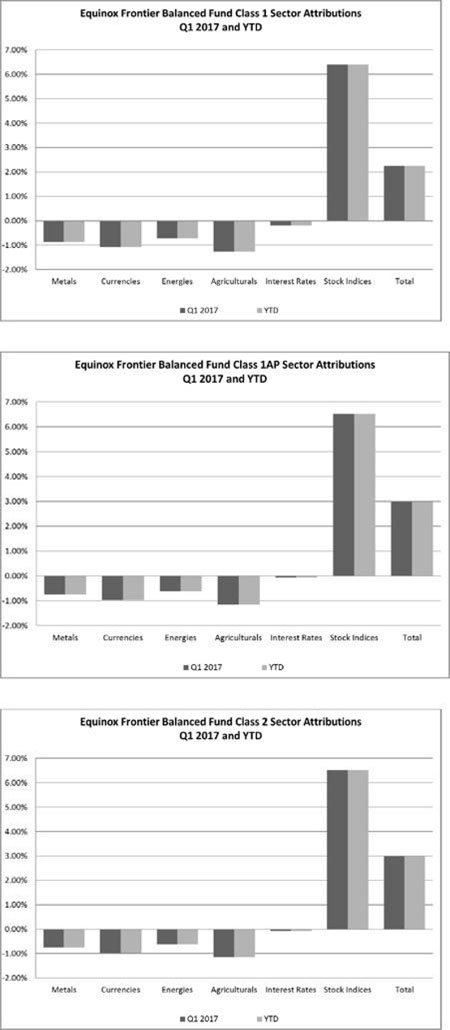
In terms of major CTA performance Emil Van Essen, Fort and H20 finished positive for the quarter. Aspect, Beach Horizon, Crabel, QIM, Quantmetrics, Welton and Winton were negative for the quarter.
Emil Van Essen, Fort, H20 and QIM were positive YTD while Aspect, Beach Horizon, Crabel, Quantmetrics, Welton and Winton were negative YTD.
107146
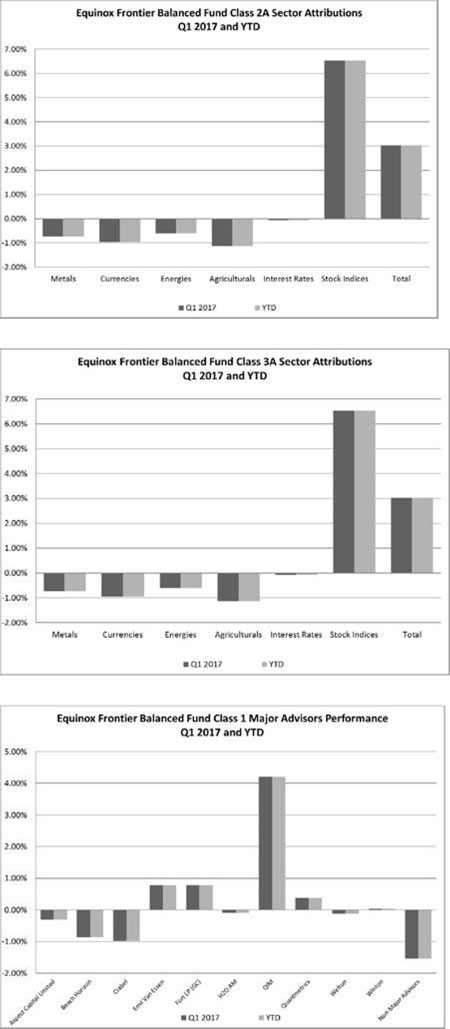
108
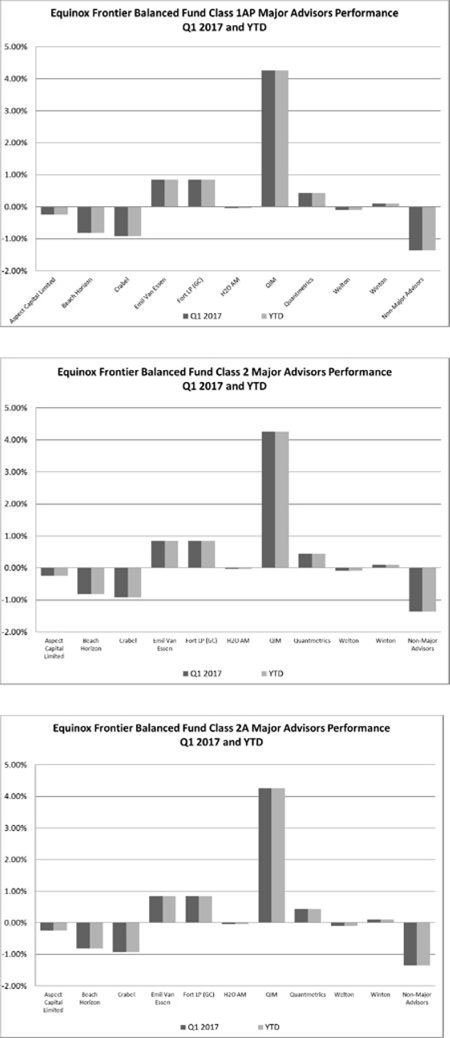
109
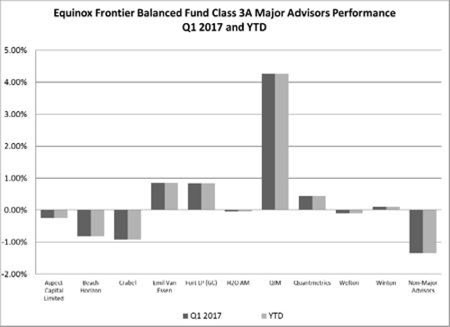
Frontier Select Fund
2018
The Frontier Select Fund—Class 1 NAV lost 15.29%16.46% and lost 4.44%20.84%, respectively, for the threenine months ended March 31,September 30, 2018 and 2017, net of fees and expenses; the Frontier Select Fund —Class 2 NAV lost 14.65%14.56% and lost 3.76%19.06% respectively for the threenine months ended March 31,September 30, 2018 and 2017, net of fees and expenses; the Frontier Select Fund —Class 1AP NAV lost 14.66%14.57% and gained 3.85%19.06%, respectively, for the threenine months ended March 31,September 30, 2018 and 2017.
For the threenine months ended March 31,September 30, 2018, the Frontier Select Fund recorded net loss on investments of $894,845,$865,762, net investment loss of $77,283,$197,890, and total expenses of $77,283,$197,890, resulting in a net decrease in Owners’ capital from operations of $972,128. The net investment loss reflected a deduction of $5,072 as total realized embedded fees in swaps. Of this amount, $0 in management fees and $0 in incentive fees were payable to the Managing Owner and $5,072 in management fees and $0 in incentive fees were payable to the Trading Advisor(s).$1,063,652. The NAV per Unit, Class 1, decreased from $90.27 at December 31, 2017 to $76.47$75.41 as of March 31,September 30, 2018. The NAV per Unit, Class 1AP, decreased from $100.02 at December 31, 2017 to $85.36$85.45 as of March 31,September 30, 2018. The NAV per Unit, Class 2, decreased from $132.73 at December 31, 2017 to $113.28$113.40 as of March 31,September 30, 2018. Total Class 1 subscriptions and redemptions for the period were $324,691.$0 and $813,081 respectively. Total Class 1AP redemptions for the period were $0.$3,144. Total Class 2 subscriptions and redemptions for the period were $30,957.$0 and $525,844, respectively. Ending capital at March 31,September 30, 2018 was $4,741,199$4,179,762 for Class 1, $21,163$17,905 for Class 1AP and $711,790$198,540 for Class 2. Ending capital at December 31, 2017 was $5,912,980 for Class 1, $23,354 for Class 1AP and $865,594 for Class 2.
147
The Frontier Select Fund may have both long and short exposure to the Interest Rates, Currencies, Stock Indices, Energies, Metals, Hybrids and Commodities sectors.
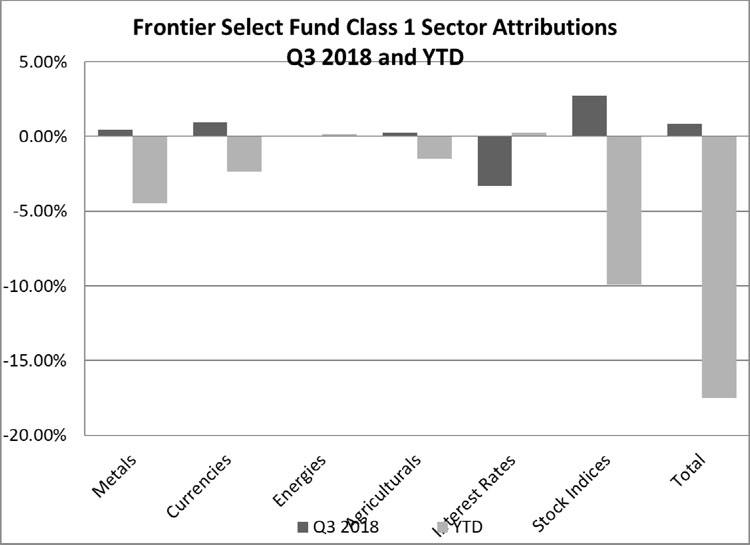
110148
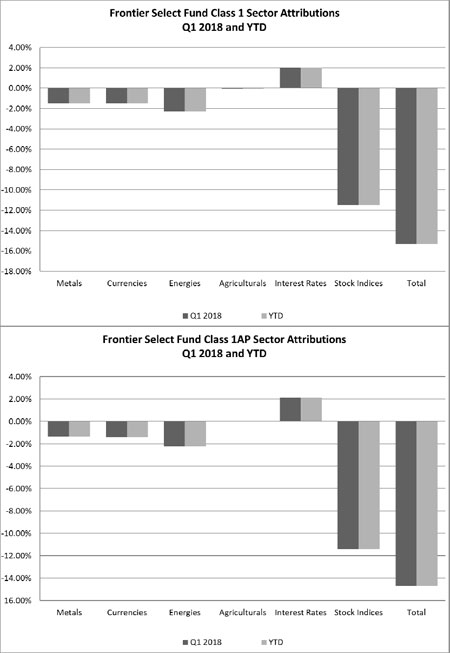
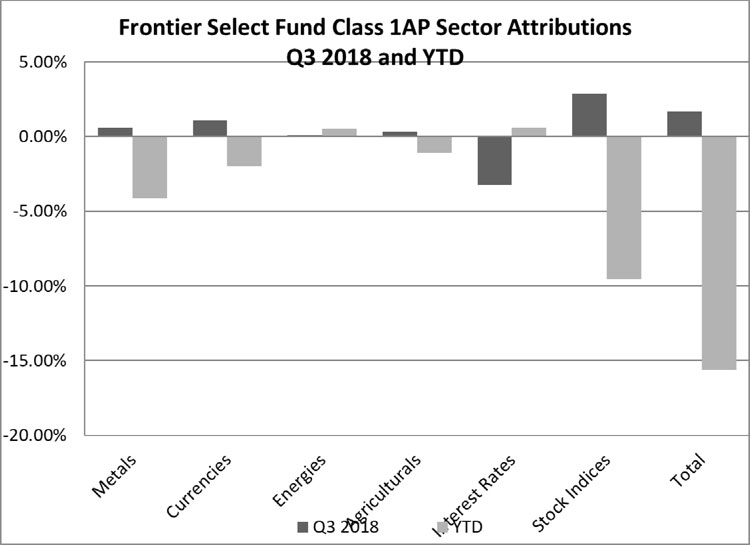
111149
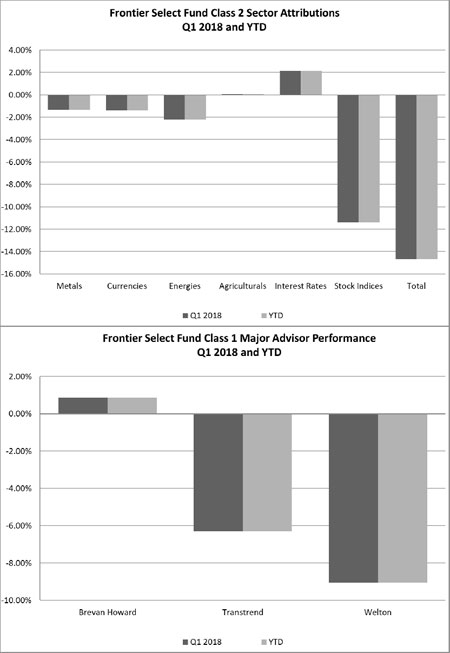

112150
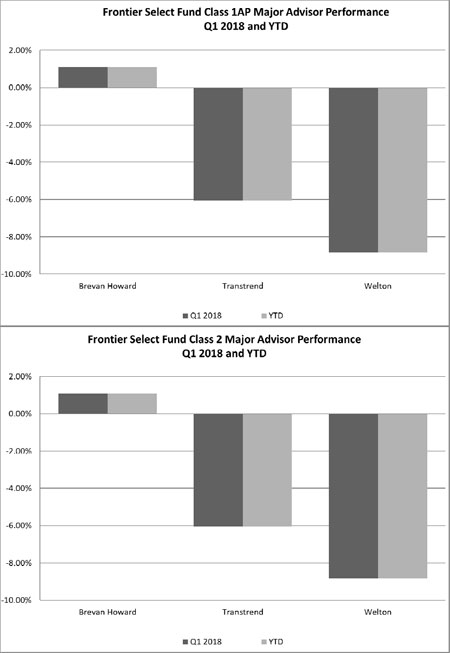
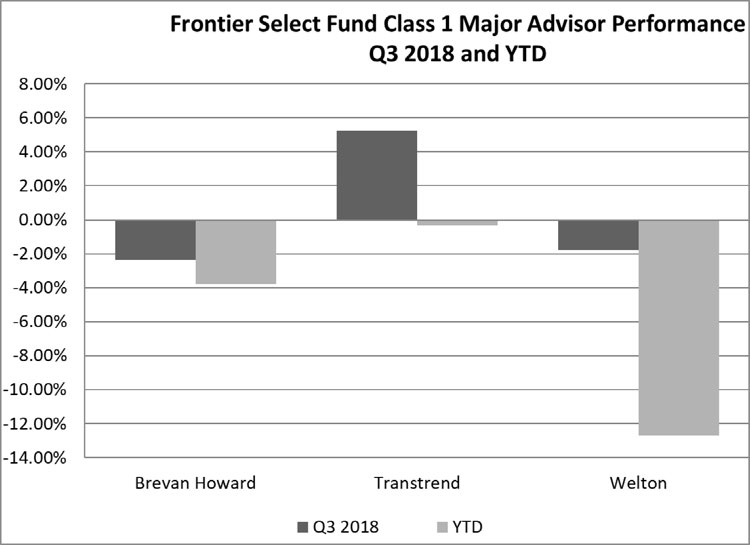
151
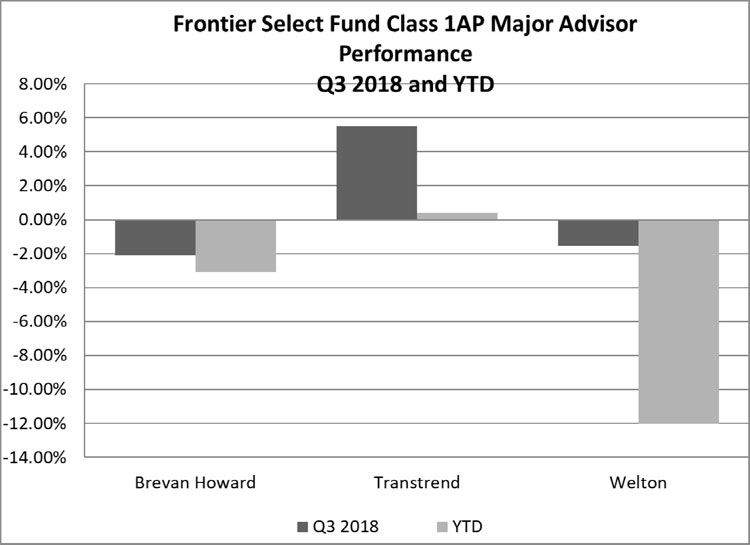
152
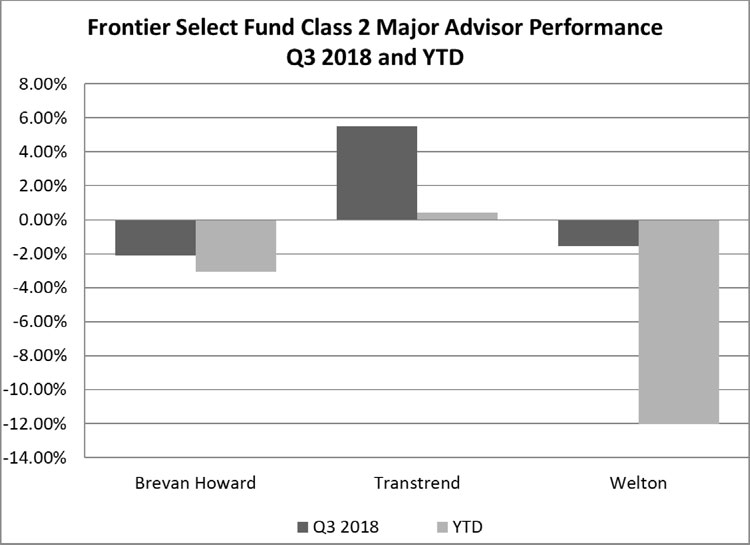
OneFour of the six sectors traded in the Frontier Select Fund were profitable in Q1Q3 2018 and onetwo of the six were profitable YTD. Interest Rates were positive whileMetals, Currencies, Agriculturals , Metals, Energies, and Stock Indices were positive while Energies and Interest Rates were negative for the quarter. Energies and Interest Rates were profitable YTD while andMetals, Currencies Agriculturals , Metals, Energies, and Stock Indices finished negative YTD.
In terms of major CTA performance, Brevan HowardTranstrend finished positive for the quarter and positive YTD. TranstrendBrevan Howard and Welton finished negative for bothnegative. There was no positive CTA performance in the quarter andFrontier Select Fund YTD.
153
2017
The Frontier Select Fund—Class 1 NAV lost 4.44%20.84% and gained 10.02%6.54%, respectively, for the threenine months ended March 31,September 30, 2017 and 2016, net of fees and expenses; the Frontier Select Fund —Class 2 NAV lost 3.76%19.06% and gained 10.85%8.98% respectively for the threenine months ended March 31,September 30, 2017 and 2016, net of fees and expenses; the Frontier Select Fund —Class 1AP NAV lost 3.85%19.06% and gained 10.84%8.98%, respectively, for the threenine months ended March 31,September 30, 2017 and 2016.
For the threenine months ended March 31,September 30, 2017, the Frontier Select Fund recorded net loss on investments of $366,365,$2,000,503, net investment incomeloss of $0,$417,969, and total expenses of $181,379,$417,969, resulting in a net decrease in Owners’ capital from operations of $493,434,$1,985,844, after non-controlling interests of $54,310.$432,628. The NAV per Unit, Class 1, decreased from $94.06 at December 31, 2016 to $89.88$74.46 as of March 31,September 30, 2017. The NAV per Unit, Class 1AP, decreased from $101.16 at December 31, 2016 to $97.27$81.88 as of March 31,September 30, 2017. The NAV per Unit, Class 2, decreased from $134.25 at December 31, 2016 to $129.20$108.66 as of March 31,September, 2017. Total Class 1 subscriptions and redemptions for the period were $1,467 and $1,090,824$3,380,914 respectively. Total Class 1AP redemptions for the period were $4,175.$6,074. Total Class 2 subscriptions and redemptions for the period were $99,345$98,345 and 17,740,$527,352, respectively. Ending capital at March 31,September 30, 2017 was $9,012,666$5,422,744 for Class 1, $24,609$19,118 for Class 1AP and $1,438,403$739,805 for Class 2. Ending capital at December 31, 2016 was $10,540,702 for Class 1, $29,897 for Class 1AP and $1,411,440 for Class 2.
154
The Frontier Select Fund may have both long and short exposure to the Interest Rates, Currencies, Stock Indices, Energies, Metals, Hybrids and Commodities sectors.
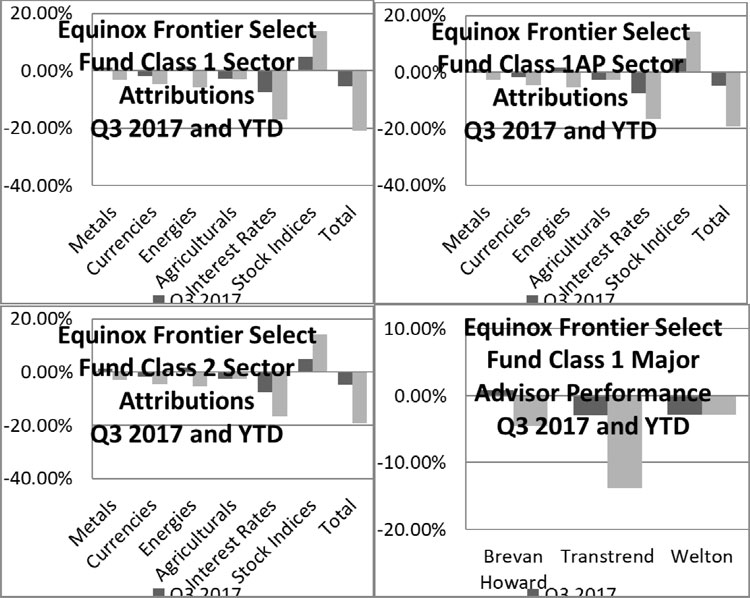
113155
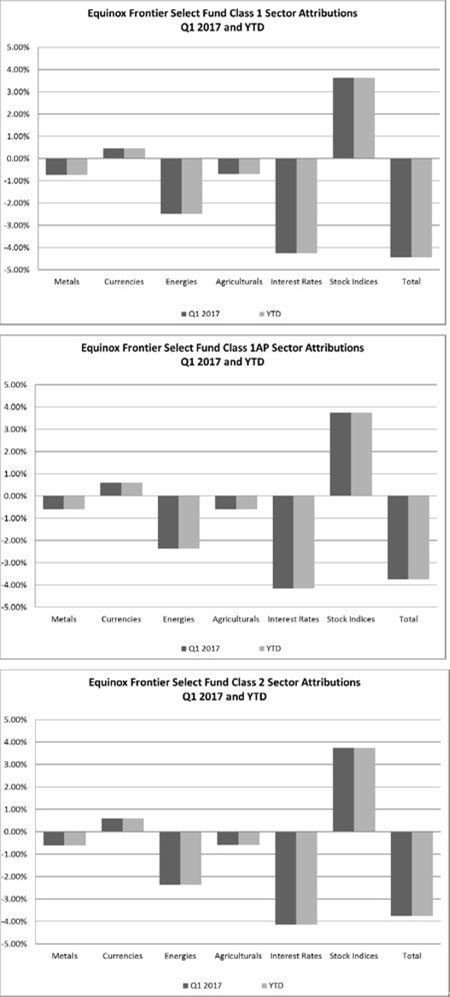
114
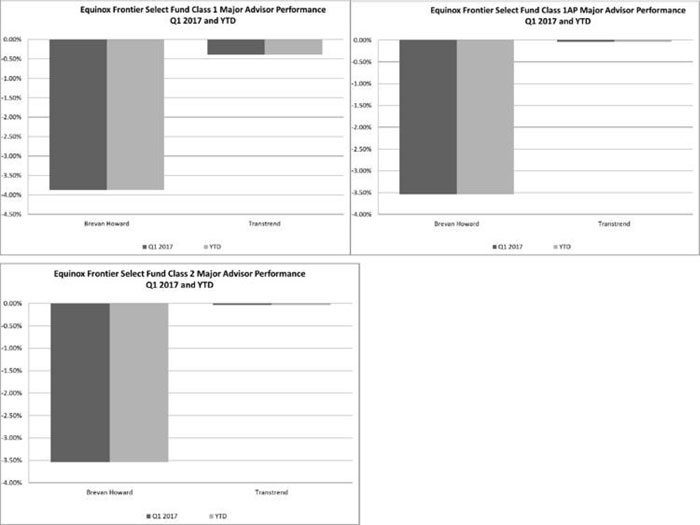
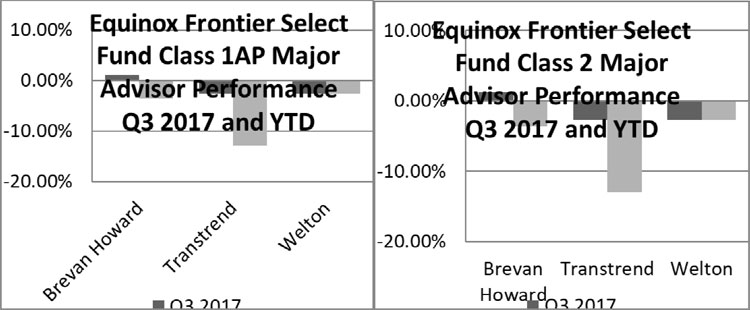
TwoThree of the six sectors traded in the Frontier Select Fund were profitable in Q1 2017. CurrenciesQ3 2017 and one of the six were profitable YTD. Metals, Energies and Stock Indices were positive while Metals, Energies,Currencies, Agriculturals and Interest Rates were negative for the quarter. Stock Indices were profitable YTD while Metals, Currencies, Energies, Agriculturals and Interest Rates finished negative YTD.
In terms of major CTA performance, both Brevan Howard and Transtrend finished positive for the quarter.quarter and negative YTD. Transtrend and Welton finished negative for both the quarter and YTD.
156
Frontier Winton Fund
2018
The Frontier Winton Fund—Class 1 NAV lost 9.10%8.21% and lost 1.02%7.90%, respectively, for the threenine months ended March 31,September 30, 2018 and 2017, net of fees and expenses; the Frontier Winton Fund —Class 2 NAV lost 9.12%4.76% and gained 0.32%lost 5.82%, respectively, for the threenine months ended March 31,September 30, 2018 and 2017, net of fees and expenses; the Frontier Winton Fund —Class 1AP NAV lost 8.41%6.19% and lost 0.55%5.82%, respectively, for the threenine months ended March 31,September 30, 2018 and 2017.
For the threenine months ended March 31,September 30, 2018, the Frontier Winton Fund recorded net loss on investments of $1,026,553,$338,678, net investment loss of $307,495,$855,067, and total expenses of $307,495,$855,067, resulting in a net decrease in Owners’ capital from operations of $1,334,048.$1,193,745. The NAV per Unit, Class 1, decreased from $159.08 at December 31, 2017 to $144.60$146.02 as of March 31,September 30, 2018. The NAV per Unit, Class 1AP, decreased from $176.44 at December 31, 2017 to $161.61$165.51 as of March 31,September 30, 2018. The NAV per Unit, Class 2, decreased from $216.50 at December 31, 2017 to $196.76$206.20 as of March 31,September 30, 2018. Total Class 1 subscriptions and redemptions for the period were $163,674. .$0 and $2,251,329, respectively. There were no subscriptions or redemptions for Class 1AP. Total Class 1AP2 subscriptions and redemptions for the period were $61. Total Class 2 redemptions for the period were $207,909.$0 and $1,129,083, respectively. Ending capital at March 31,September 30, 2018 was $11,754,668$9,745,132 for Class 1, $34,525$35,337 for Class 1AP, and $1,354,765$495,023 for Class 2. Ending capital at December 31, 2017 was $13,102,614 for Class 1, $37,761 for Class 1AP and $1,709,275 for Class 2.
157
The Frontier Winton Fund may have both long and short exposure to the Interest Rates, Currencies, Stock Indices, Energies, Metals and Commodities sectors.
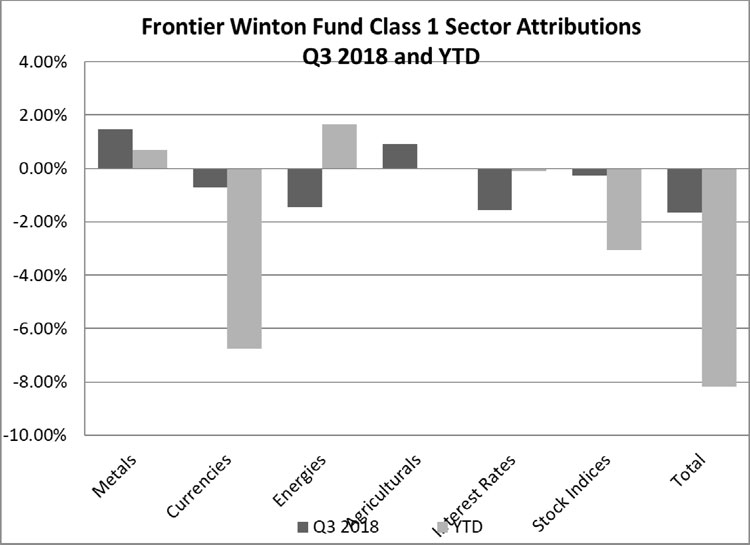
115158
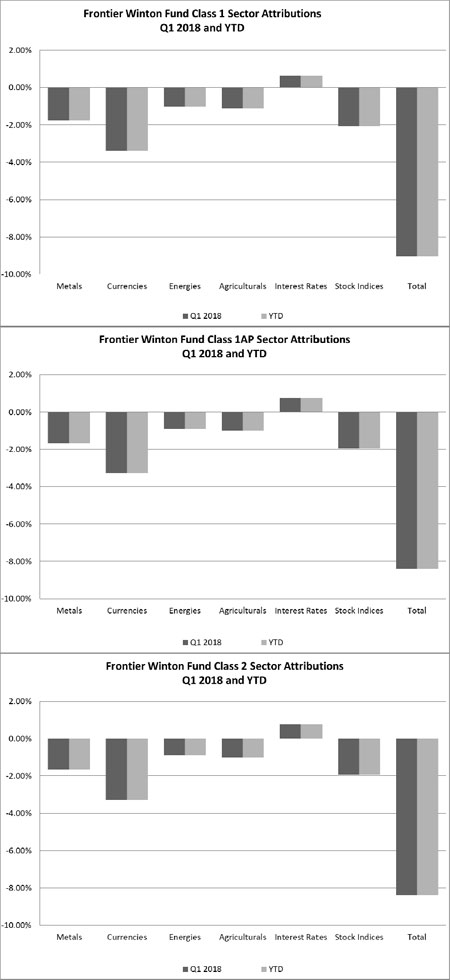
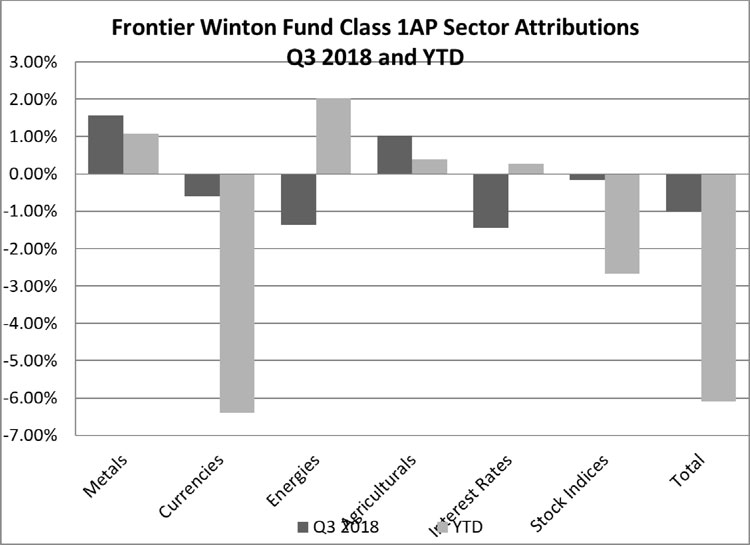
116159
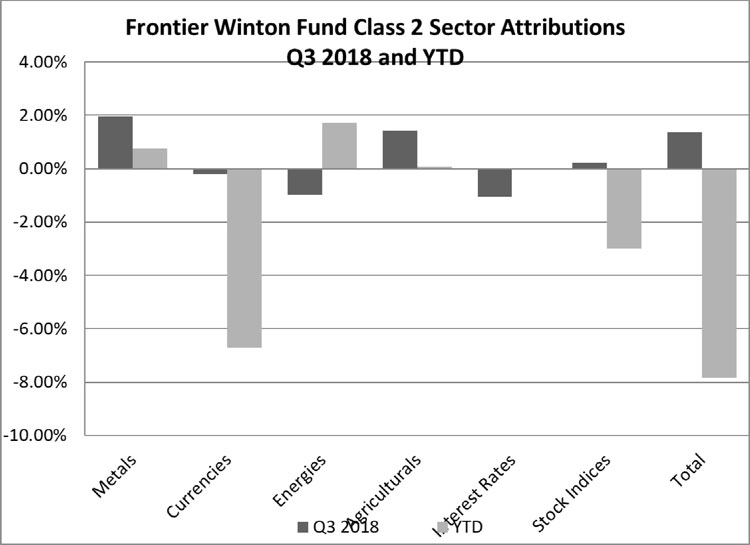
One of the six sectors traded in the Frontier Winton Fund was profitable in Q3 2018 and two of the six were profitable in Q1 2018. Interest RatesYTD. Agriculturals were positive while Currencies, Metals, Currencies, Energies, Agriculturals,Interest Rates and Stock IndiciesIndices were negative for the quarter. Interest RatesEnergies and Agriculturals are positive YTD while Metals, Currencies, Energies, AgriculturalsInterest Rates and Stock Indicies areIndices were negative YTD.
160
2017
The Frontier Winton Fund—Class 1 NAV lost 1.02%7.90% and gained 3.05%lost 0.58%, respectively, for the threenine months ended March 31,September 30, 2017 and 2016, net of fees and expenses; the Frontier Winton Fund —Class 2 NAV lost 0.32%5.82% and gained 3.82%1.70%, respectively, for the threenine months ended March 31,September 30, 2017 and 2016, net of fees and expenses; the Frontier Winton Fund —Class 1AP NAV lost 0.55%5.82% and gained 3.82%1.70%, respectively, for the threenine months ended March 31,September 30, 2017 and 2016.
For the threenine months ended March 31,September 30, 2017, the Frontier Winton Fund recorded net gainloss on investments of $686,811,$865,453, net investment incomeloss of $0,$1,512,144, and total expenses of $539,560,$1,531,876, resulting in a net decrease in Owners’ capital from operations of $248,287,$2,025,481, after non-controlling interests of $395,538.$352,116. The NAV per Unit, Class 1, decreased from $154.51 at December 31, 2016 to $152.93$142.30 as of March 31,September 30, 2017. The NAV per Unit, Class 1AP decreased from $166.17 at December 31, 2016 to $165.26$156.50 as of March 31,September 30, 2017. Class 2, decreased from $210.98 at December 31, 2016 to $210.30$198.70 as of March 31,September 30, 2017. Total Class 1 subscriptions and redemptions for the period were $30,102$16,141 and $919,596$6,612,116 respectively. There were no subscriptions or redemptions for Class 1AP. Total Class 2 subscriptions and redemptions for the period were $267,829 and 54,413,$631,501, respectively. Ending capital at March 31,September 30, 2017 was $19,189,478$12,330,314 for Class 1, $35,365$33,413 for Class 1AP, and $11,617.318$10,417,671 for Class 2. Ending capital at December 31, 2016 was $20,284,935$20,248,935 for Class 1, $35,478 for Class 1AP and $11,446,113 for Class 2.
161
The Frontier Winton Fund may have both long and short exposure to the Interest Rates, Currencies, Stock Indices, Energies, Metals and Commodities sectors.
117
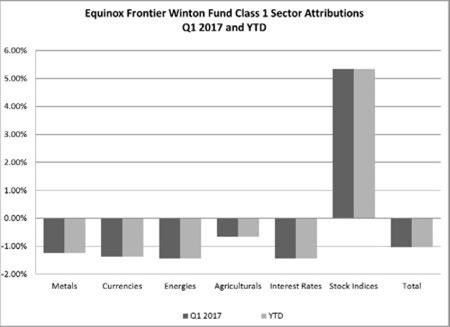
118
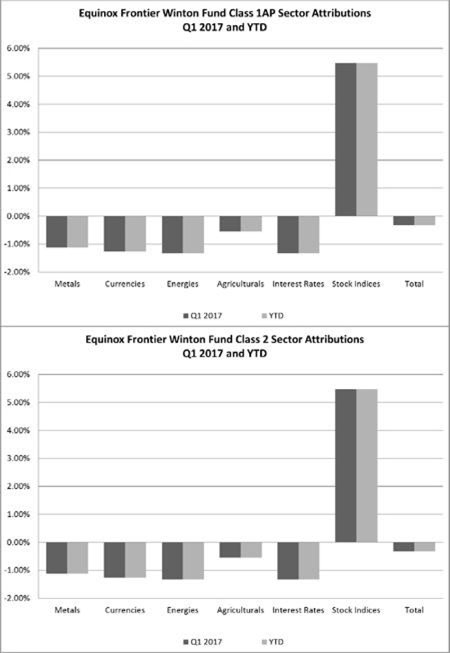
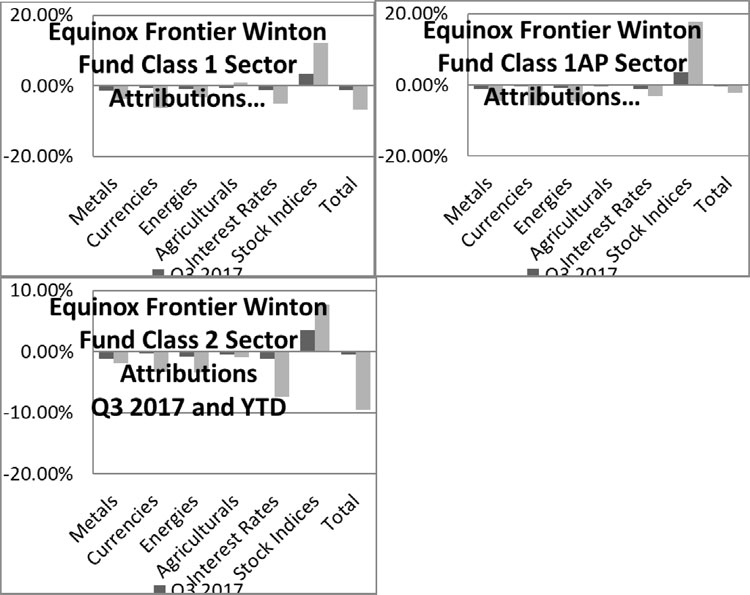
One of the six sectors traded in the Frontier Winton Fund werewas profitable in Q1 2017.Q3 2017 and one was positive YTD.. Stock Indices were positive while Metals, Currencies, Energies, Agriculturals and Interest Rates were negative for the quarter. Stock Indices are positive YTD while Metals, Currencies, Energies, Agriculturals and Interest Rates are negative YTD.
119162
Frontier Heritage Fund
2018
The Frontier Heritage Fund—Class 1 NAV lost 13.77%16.59% and lost 3.65%11.36%, respectively, for the threenine months ended March 31,September 30, 2018 and 2017 net of fees and expenses; the Frontier Heritage Fund —Class 2 NAV lost 13.1%14.69% and lost 2.95%9.37%, respectively for the threenine months ended March 31,September 30, 2018 and 2017, net of fees and expenses; the Frontier Heritage Fund —Class 1AP NAV lost 13.14%14.67% and lost 2.30%9.37%, respectively, for the threenine months ended March 31,September 30, 2018 and 2017.
For the threenine months ended March 31,September 30, 2018, the Frontier Heritage Fund recorded net loss on investments of $692,322,$695,930, net investment loss $116,775,of $304,427, and total expenses of $116,775,$304,427, resulting in a net decrease in Owners’ capital from operations of $809,097,$959,592, after non-controlling interests of $2,326. The net investment loss reflected a deduction of $5,386 as total realized embedded fees in swaps. Of this amount, $0 in management fees and $0 in incentive fees were payable to the Managing Owner and $5,386 in management fees and $0 in incentive fees were payable to the Trading Advisor(s).$40,765. The NAV per Unit, Class 1, decreased from $121.19 at December 31, 2017 to $104.50$101.10 as of March 31,September 30, 2018. The NAV per Unit, Class 1AP, decreased from $134.28 at December 31, 2017 to $116.64$114.58 as of March 31,September 30, 2018. The NAV per Unit, Class 2, decreased from $179.70 at December 31, 2017 to $ 156.11$153.31 as of March 31,September 30, 2018. Total Class 1 subscriptions and redemptions for the period were $295,955. There$0 and $783,919, respectively. Total Class 1AP redemptions were no4,081. Total Class 2 subscriptions orand redemptions for Class 1AP.
Therethe period were no subscriptions or redemptions for Class 2.$0 and $7,000, respectively. Ending capital at March 31,September 30, 2018 was $4,433,799$3,805,123 for Class 1, $5,284$1,011 for Class 1AP and $660,817$641,900 for Class 2. Ending capital at December 31, 2017 was $5,435,871 for Class 1, $6,083 for Class 1AP and $760,672 for Class 2.
163
The Frontier Heritage Fund may have both long and short exposure to the Interest Rates, Currencies, Stock Indices, Energies, Metals and Commodities sectors.
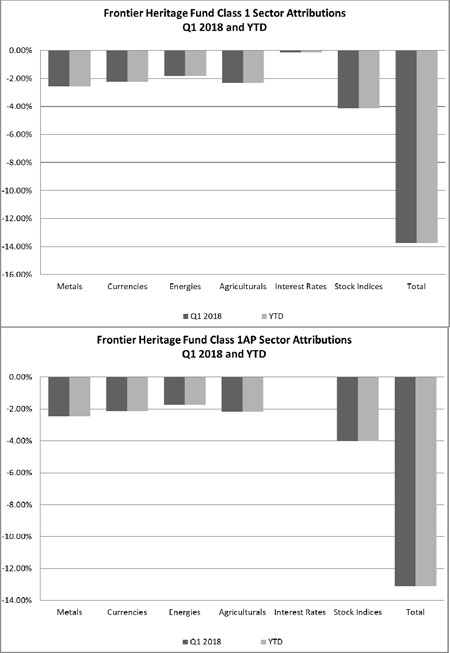
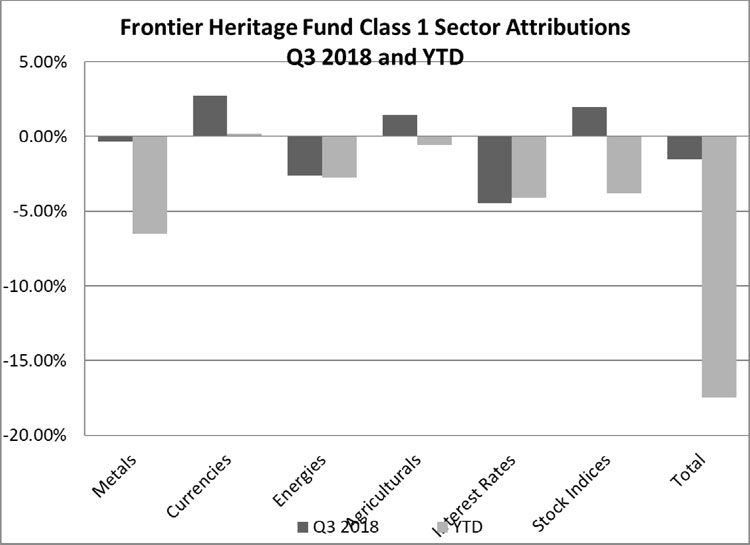
120164
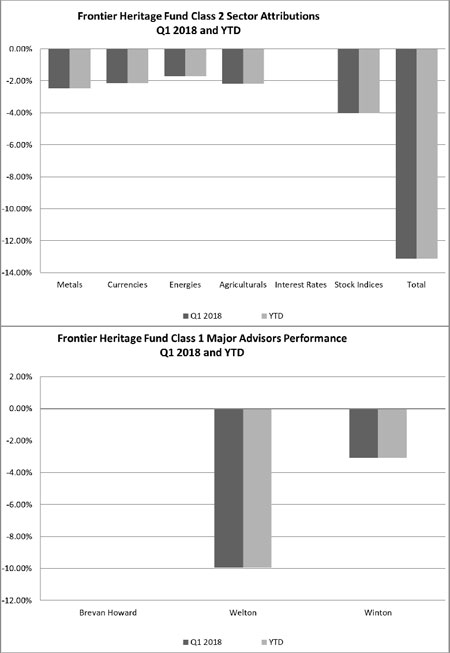
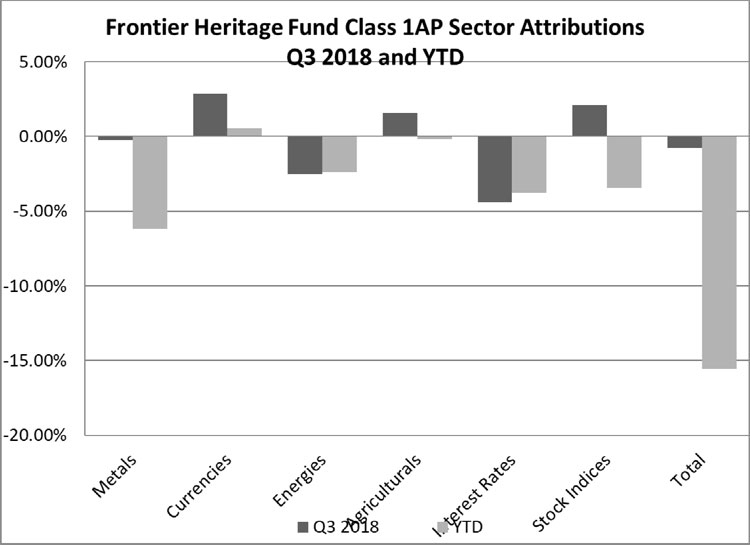
121165
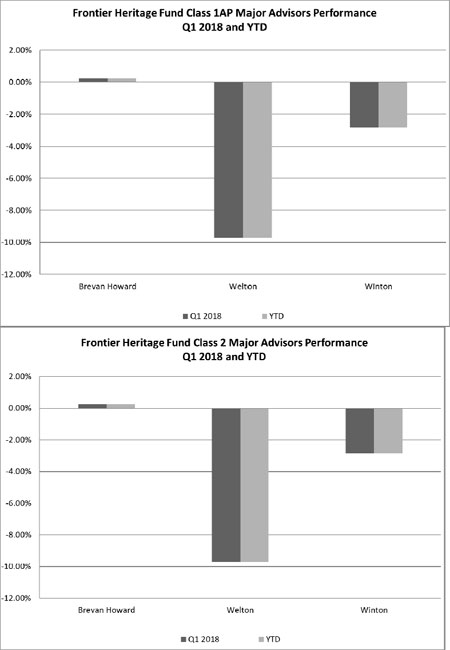
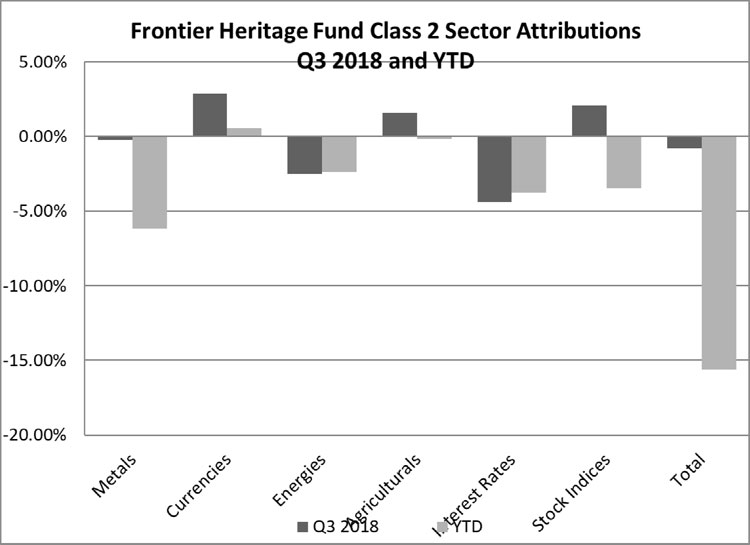
166
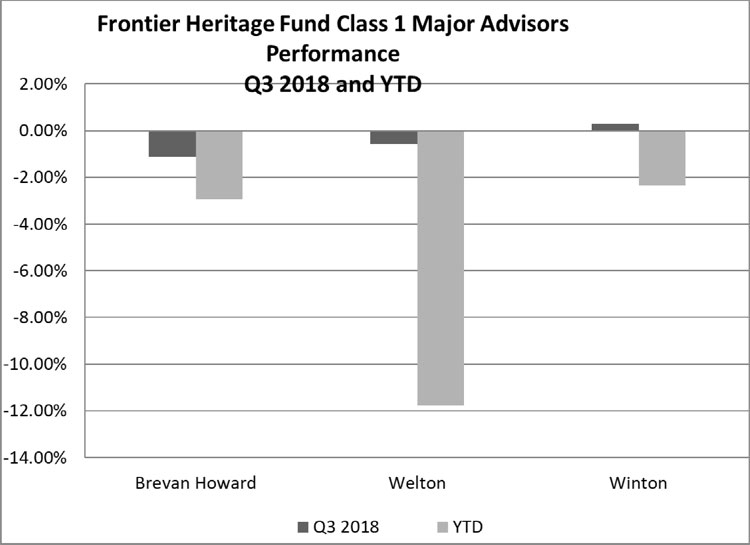
167
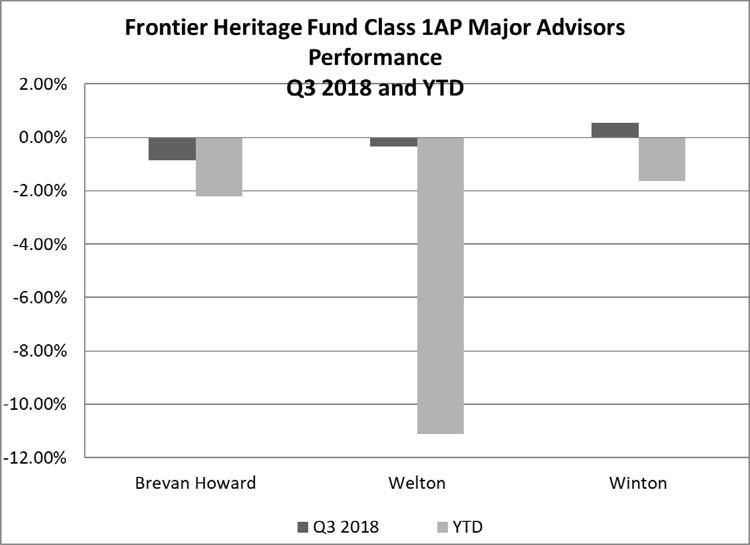
168

NoneThree of the six sectors traded in the Frontier Heritage Fund were profitable in Q1Q3 2018 and noneone of the six was profitable YTD. Currencies, Agriculturals and Interest Rates were positive while Energies, Metals and Stock Indices were negative for the quarter. Currencies were profitable YTD while Metals, Agriculturals, Energies and Interest Rates finished negative YTD.
In terms of major CTA performance, Winton was positive for Q3 while Welton and Brevan Howard finished positivewere both negative for the quarter and positive YTD. Welton, Brevan Howard and Winton finishedwere negative for both the quarter and YTD.
122169
2017
The Frontier Heritage Fund—Class 1 NAV lost 3.65%11.36% and gained 5.22%0.30%, respectively, for the threenine months ended March 31,September 30, 2017 and 2016 net of fees and expenses; the Frontier Heritage Fund —Class 2 NAV lost 2.95%9.37% and gained 6.01%2.60%, respectively for the threenine months ended March 31,September 2017 and 2016, net of fees and expenses; the Frontier Heritage Fund —Class 1AP NAV lost 2.30%9.37% and gained 6.02%2.60%, respectively, for the threenine months ended March 31,September 30, 2017 and 2016.
For the threenine months ended March 31,September 30, 2017, the Frontier Heritage Fund recorded net loss on investments of $373,402,$725,978, net investment loss income $0,$445,913, and total expenses of $166,158,$445,913, resulting in a net decrease in Owners’ capital from operations of $340,160,$922,727, after non-controlling interests of $199,400.$249,164. The NAV per Unit, Class 1, decreased from $119.58 at December 31, 2016 to $115.22$105.99 as of March 31,September 30, 2017. The NAV per Unit, Class 1AP, decreased from $128.60 at December 31, 2016 to $125.64$116.55 as of March 31,September 30, 2017. The NAV per Unit, Class 2, decreased from $172.10 at December 31, 2016 to $167.02$155.97 as of March 31,September 30, 2017. Total Class 1 subscriptions and redemptions for the period were $9,862$9,861 and $417,190,$1,808,099, respectively. There were no subscriptions or redemptions for Class 1AP. Total Class 2 subscriptions and redemptions for the period were $24,575 and $142,145,$1,856,707, respectively. Ending capital at March 31,September 30, 2017 was $6,838,189$4,964,672 for Class 1, $5,654$5,280 for Class 1AP and $2,548,372$734,224 for Class 2. Ending capital at December 31, 2016 was $7,507,072 for Class 1, $5,826 for Class 1AP and $2,744,375 for Class 2.
The Frontier Heritage Fund may have both long and short exposure to the Interest Rates, Currencies, Stock Indices, Energies, Metals, and Commodities sectors.
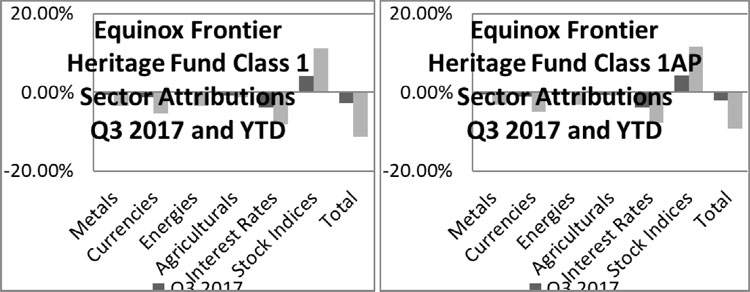
123170
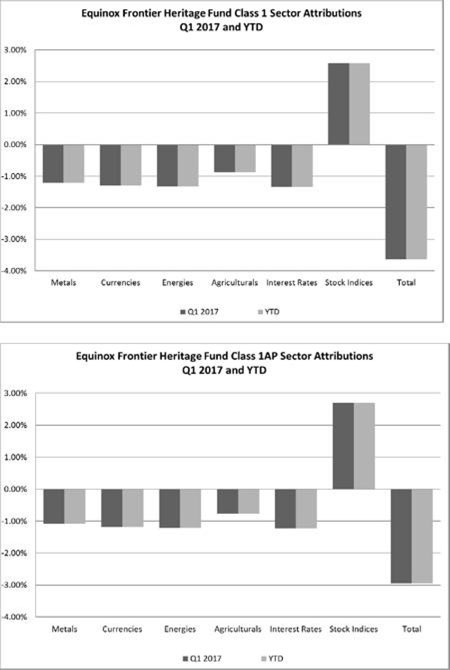
124
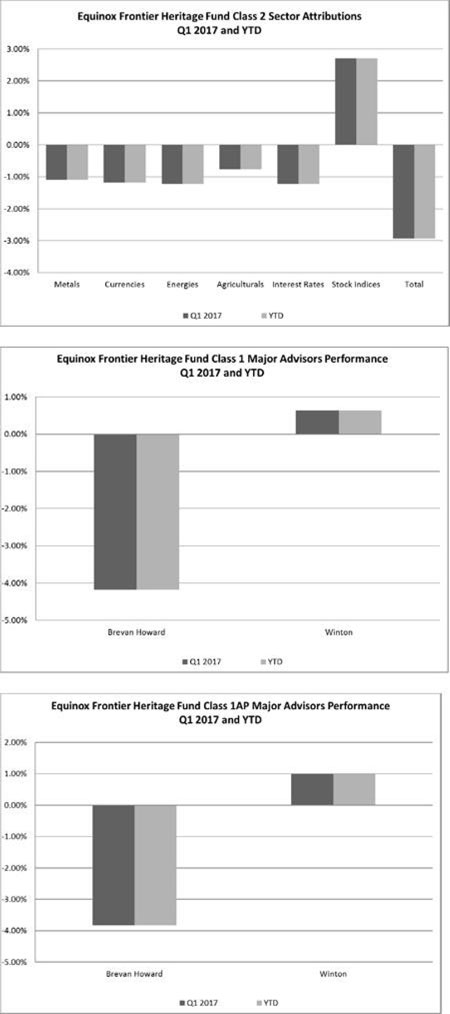
125
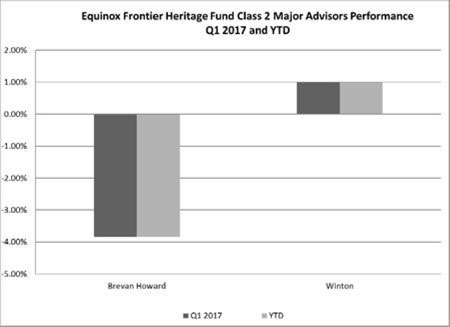
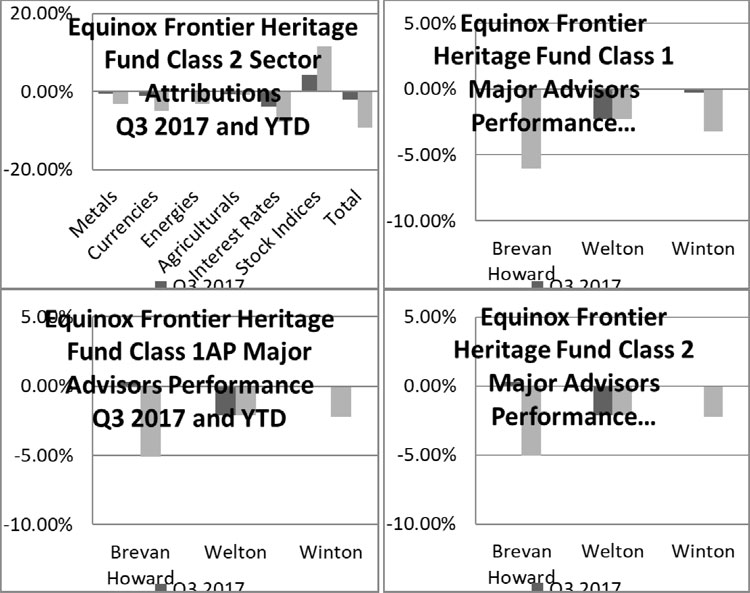
OneTwo of the six sectors traded in the Frontier Heritage Fund were profitable in Q1 2017.Q3 2017 and one of the six was profitable YTD. Energies and Stock Indices were positive while Metals, Currencies, Agriculturals and Interest Rates were negative for the quarter. Stock Indices were profitable YTD while Metals, Currencies, Energies, Agriculturals and Interest Rates werefinished negative for the quarter.YTD.
In terms of major CTA performance, both WintonBrevan Howard finished positive for the quarter while Brevan Howardand negative YTD. Welton and Winton finished negative for both the period.quarter and YTD.
171
| ITEM 3. | QUANTITATIVE AND QUALITATIVE DISCLOSURES ABOUT MARKET RISK |
The Trust is a speculative commodity pool. The market sensitive instruments which are held by the Trading Companies or Galaxy Plus entities in which the Series are invested are acquired for speculative trading purposes and all or a substantial amount of the Series’ assets are subject to the risk of trading loss. Unlike an operating company, the risk of market sensitive instruments is integral, not incidental, to the Series’ main line of business.
Market movements result in frequent changes in the fair market value of each Trading Company’s open positions and, consequently, in each Series of the Trust’s earnings and cash flow. The Trading Companies’ and Galaxy Plus entities’ and consequently the Series’ market risk is influenced by a wide variety of factors, including the level and volatility of exchange rates, interest rates,Interest Rates, equity price levels, the market value of financial instruments and contracts, the diversification effects among the open positions and the liquidity of the markets in which trades are made.
Each Trading Company and Galaxy Plus entity rapidly acquires and liquidates both long and short positions in a wide range of different markets. Consequently, it is not possible to predict how a particular future market scenario will affect performance, and the past performance for any Series is not necessarily indicative of the future results of such Series.
Additional risk of trading loss from investment in an unaffiliated Trading Company may result from the Managing Owner’s inability to directly control or stop trading in the event of exercise of certain withdrawal provisions in the investment agreement.
The Trading Companies’ and Galaxy Plus entities’, and consequently the Series’ primary market risk exposures as well as the strategies used and to be used by the Trading Advisors for managing such exposures are subject to numerous uncertainties, contingencies and risks, any one of which could cause the actual results of the Trust’s and the Managing Owner’s risk controls to differ materially from the objectives of such strategies. Government interventions, defaults and expropriations, illiquid markets, the emergence of dominant fundamental factors, political upheavals, changes in historical price relationships, an influx of new market participants, increased regulation and many other factors could result in material losses as well as in material changes to the risk exposures and the risk management strategies of the Trading Companies and Galaxy Plus entities and consequently the Trust. There can be no assurance that the Trading Companies’ and Galaxy Plus entities’ current market exposure and/or risk management strategies will not change materially or that any such strategies will be effective in either the short- or long-term. Investors must be prepared to lose all or substantially all of their investment in a Series.
126
Quantitative Market Risk
Trading Risk
The Series’ approximate risk exposure in the various market sectors traded by its trading advisors is quantified below in terms of value at risk. Due to the Series’ mark-to-market accounting, any loss in the fair value of the Series’ (through the Trading Companies and Galaxy Plus entities) open positions is directly reflected in the Series’ earnings, realized or unrealized gain/loss.
Exchange maintenance margin requirements have been used by the Trust as the measure of its value at risk. Maintenance margin requirements are set by exchanges to equal or exceed the maximum losses reasonably expected to be incurred in the fair value of any given contract in 95% to 99% of any one-day interval. The maintenance margin levels are established by brokers, dealers and exchanges using historical price studies as well as an assessment of current market volatility and economic fundamentals to provide a probabilistic estimate of the maximum expected near-term one-day price fluctuation. Maintenance margin has been used rather than the more generally available initial margin, because initial margin includes a credit risk component that is not relevant to value at risk.
In the case of market sensitive instruments that are not exchange-traded, including currenciesCurrencies and some energy products and metals,Metals, the margin requirements for the equivalent futures positions have been used as value at risk. In those cases in which a futures-equivalent margin is not available, dealers’ margins have been used.
In the case of contracts denominated in foreign currencies,Currencies, the value at risk figures include foreign currency margin amounts converted into U.S. dollars with an incremental adjustment to reflect the exchange rate risk inherent to the Series, which is valued in U.S. dollars, in expressing value at risk in a functional currency other than U.S. dollars. In quantifying each Series’ value at risk, 100% positive correlation in the different positions held in each market risk category has been assumed. Consequently, the margin requirements applicable to the open contracts have simply been aggregated to determine each trading category’s aggregate value at risk. The diversification effects resulting from the fact that the Series’ positions held through the Trading Companies and Galaxy Plus entities are rarely, if ever, 100% positively correlated have not been reflected.
127172
Value at Risk by Market Sectors
The following tables present the trading value at risk associated with each Series’ exposure to open positions (as held by the Trading Companies) by market sector as of March 31,September 30, 2018 and December 31, 2017. All open position trading risk exposures of the Series have been included in calculating the figures set forth below.
DOMESTIC EXPOSURE
Frontier Diversified Fund:
| March 31, 2018 | December 31, 2017 | |||||||||||||||
| VALUE | % OF TOTAL | VALUE | % OF TOTAL | |||||||||||||
| AT RISK | CAPITALIZATION | AT RISK | CAPITALIZATION | |||||||||||||
| MARKET SECTOR | ||||||||||||||||
| Interest Rates | $ | 5,746,322 | 30.70 | % | $ | 6,395,053 | 29.79 | % | ||||||||
| Currencies | 202,644 | 1.08 | % | 63,093 | 0.29 | % | ||||||||||
| Stock Indices | 52,600 | 0.28 | % | 34,558 | 0.16 | % | ||||||||||
| Metals | 78,025 | 0.42 | % | 218,878 | 1.02 | % | ||||||||||
| Agriculturals/Softs | 22,104 | 0.12 | % | 14,196 | 0.07 | % | ||||||||||
| Energy | 61,730 | 0.33 | % | 66,604 | 0.31 | % | ||||||||||
| Total: | $ | 6,163,425 | 32.93 | % | $ | 6,792,381 | 31.64 | % | ||||||||
Frontier Long/Short Commodity Fund:
| March 31, 2018 | December 31, 2017 | |||||||||||||||
| VALUE | % OF TOTAL | VALUE | % OF TOTAL | |||||||||||||
| AT RISK | CAPITALIZATION | AT RISK | CAPITALIZATION | |||||||||||||
| MARKET SECTOR | ||||||||||||||||
| Interest Rates | $ | 482,309 | 12.57 | % | $ | 397,039 | 9.33 | % | ||||||||
| Currencies | — | 0.00 | % | — | 0.00 | % | ||||||||||
| Stock Indices | — | 0.00 | % | — | 0.00 | % | ||||||||||
| Metals | — | 0.00 | % | — | 0.00 | % | ||||||||||
| Agriculturals/Softs | — | 0.00 | % | — | 0.00 | % | ||||||||||
| Energy | — | 0.00 | % | — | 0.00 | % | ||||||||||
| Total: | $ | 482,309 | 12.57 | % | $ | 397,039 | 9.33 | % | ||||||||
Frontier Masters Fund:
| March 31, 2018 | December 31, 2017 | |||||||||||||||
| VALUE | % OF TOTAL | VALUE | % OF TOTAL | |||||||||||||
| AT RISK | CAPITALIZATION | AT RISK | CAPITALIZATION | |||||||||||||
| MARKET SECTOR | ||||||||||||||||
| Interest Rates | $ | 10,102 | 0.11 | % | $ | 10,512 | 0.09 | % | ||||||||
| Currencies | 114,639 | 1.26 | % | 35,692 | 0.30 | % | ||||||||||
| Stock Indices | 29,756 | 0.33 | % | 19,550 | 0.16 | % | ||||||||||
| Metals | 44,140 | 0.48 | % | 123,822 | 1.04 | % | ||||||||||
| Agriculturals/Softs | 12,504 | 0.14 | % | 8,031 | 0.07 | % | ||||||||||
| Energy | 34,922 | 0.38 | % | 37,679 | 0.32 | % | ||||||||||
| Total: | $ | 246,063 | 2.70 | % | $ | 235,286 | 3.38 | % | ||||||||
Frontier Balanced Fund:
| March 31, 2018 | December 31, 2017 | |||||||||||||||
| VALUE | % OF TOTAL | VALUE | % OF TOTAL | |||||||||||||
| AT RISK | CAPITALIZATION | AT RISK | CAPITALIZATION | |||||||||||||
| MARKET SECTOR | ||||||||||||||||
| Interest Rates | $ | 10,370,271 | 24.97 | % | $ | 11,368,274 | 23.64 | % | ||||||||
| Currencies | 1,289,718 | 3.11 | % | 167,215 | 0.35 | % | ||||||||||
| Stock Indices | 77,324 | 0.19 | % | 51,406 | 0.11 | % | ||||||||||
| Metals | 174,754 | 0.42 | % | 462,467 | 0.96 | % | ||||||||||
| Agriculturals/Softs | 129,200 | 0.31 | % | 70,758 | 0.15 | % | ||||||||||
| Energy | 116,618 | 0.28 | % | 222,766 | 0.46 | % | ||||||||||
| Total: | $ | 12,157,884 | 29.28 | % | $ | 12,342,887 | 25.67 | % | ||||||||
Frontier Select Fund:
| March 31, 2018 | December 31, 2017 | |||||||||||||||
| VALUE | % OF TOTAL | VALUE | % OF TOTAL | |||||||||||||
| AT RISK | CAPITALIZATION | AT RISK | CAPITALIZATION | |||||||||||||
| MARKET SECTOR | ||||||||||||||||
| Interest Rates | $ | 1,497,939 | 27.36 | % | $ | 1,500,264 | 22.06 | % | ||||||||
| Currencies | — | 0.00 | % | — | 0.00 | % | ||||||||||
| Stock Indices | — | 0.00 | % | — | 0.00 | % | ||||||||||
| Metals | — | 0.00 | % | — | 0.00 | % | ||||||||||
| Agriculturals/Softs | — | 0.00 | % | — | 0.00 | % | ||||||||||
| Energy | — | 0.00 | % | — | 0.00 | % | ||||||||||
| Total: | $ | 1,497,939 | 27.36 | % | $ | 1,500,264 | 22.06 | % | ||||||||
Frontier Winton Fund:
| March 31, 2018 | December 31, 2017 | |||||||||||||||
| VALUE | % OF TOTAL | VALUE | % OF TOTAL | |||||||||||||
| AT RISK | CAPITALIZATION | AT RISK | CAPITALIZATION | |||||||||||||
| MARKET SECTOR | ||||||||||||||||
| Interest Rates | $ | 59,166 | 0.45 | % | $ | 61,564 | 0.41 | % | ||||||||
| Currencies | 671,404 | 5.11 | % | 209,040 | 1.40 | % | ||||||||||
| Stock Indices | 174,274 | 1.33 | % | 114,498 | 0.77 | % | ||||||||||
| Metals | 258,513 | 1.97 | % | 725,189 | 4.85 | % | ||||||||||
| Agriculturals/Softs | 73,235 | 0.56 | % | 47,034 | 0.31 | % | ||||||||||
| Energy | 204,526 | 1.56 | % | 220,673 | 1.48 | % | ||||||||||
| Total: | $ | 1,441,117 | 10.96 | % | $ | 1,377,999 | 9.22 | % | ||||||||
Frontier Heritage Fund:
| March 31, 2018 | December 31, 2017 | |||||||||||||||
| VALUE | % OF TOTAL | VALUE | % OF TOTAL | |||||||||||||
| AT RISK | CAPITALIZATION | AT RISK | CAPITALIZATION | |||||||||||||
| MARKET SECTOR | ||||||||||||||||
| Interest Rates | $ | 1,603,177 | 28.24 | % | $ | 1,606,116 | 23.68 | % | ||||||||
| Currencies | 131,016 | 2.31 | % | 40,791 | 0.60 | % | ||||||||||
| Stock Indices | 34,007 | 0.60 | % | 22,343 | 0.33 | % | ||||||||||
| Metals | 50,445 | 0.89 | % | 141,511 | 2.09 | % | ||||||||||
| Agriculturals/Softs | 14,291 | 0.25 | % | 9,178 | 0.14 | % | ||||||||||
| Energy | 39,910 | 0.70 | % | 43,061 | 0.63 | % | ||||||||||
| Total: | $ | 1,872,847 | 32.99 | % | $ | 1,863,001 | 27.47 | % | ||||||||
| DOMESTIC EXPOSURE | ||||||||||||||||
| Frontier Diversified Fund: | ||||||||||||||||
| September 30, 2018 | December 31, 2017 | |||||||||||||||
| VALUE | % OF TOTAL | VALUE | % OF TOTAL | |||||||||||||
| AT RISK | CAPITALIZATION | AT RISK | CAPITALIZATION | |||||||||||||
| MARKET SECTOR | ||||||||||||||||
| Interest Rates | $ | 5,722,256 | 33.77 | % | $ | 6,395,053 | 29.79 | % | ||||||||
| Currencies | 161,794 | 0.95 | % | 63,093 | 0.29 | % | ||||||||||
| Stock Indices | 174 | 0.00 | % | 34,558 | 0.16 | % | ||||||||||
| Metals | 52,302 | 0.31 | % | 218,878 | 1.02 | % | ||||||||||
| Agriculturals/Softs | 29,337 | 0.17 | % | 14,196 | 0.07 | % | ||||||||||
| Energy | 13,940 | 0.08 | % | 66,604 | 0.31 | % | ||||||||||
| Total: | $ | 5,979,803 | 35.29 | % | $ | 6,792,381 | 31.64 | % | ||||||||
| Frontier Long/Short Commodity Fund: | ||||||||||||||||
| September 30, 2018 | December 31, 2017 | |||||||||||||||
| VALUE | % OF TOTAL | VALUE | % OF TOTAL | |||||||||||||
| AT RISK | CAPITALIZATION | AT RISK | CAPITALIZATION | |||||||||||||
| MARKET SECTOR | ||||||||||||||||
| Interest Rates | $ | 402,975 | 13.39 | % | $ | 397,039 | 9.33 | % | ||||||||
| Currencies | — | 0.00 | % | — | 0.00 | % | ||||||||||
| Stock Indices | — | 0.00 | % | — | 0.00 | % | ||||||||||
| Metals | — | 0.00 | % | — | 0.00 | % | ||||||||||
| Agriculturals/Softs | — | 0.00 | % | — | 0.00 | % | ||||||||||
| Energy | — | 0.00 | % | — | 0.00 | % | ||||||||||
| Total: | $ | 402,975 | 13.39 | % | $ | 397,039 | 9.33 | % | ||||||||
| Frontier Masters Fund: | ||||||||||||||||
| September 30, 2018 | December 31, 2017 | |||||||||||||||
| VALUE | % OF TOTAL | VALUE | % OF TOTAL | |||||||||||||
| AT RISK | CAPITALIZATION | AT RISK | CAPITALIZATION | |||||||||||||
| MARKET SECTOR | ||||||||||||||||
| Interest Rates | $ | 16,772 | 0.25 | % | $ | 10,512 | 0.09 | % | ||||||||
| Currencies | 147,028 | 2.16 | % | 35,692 | 0.30 | % | ||||||||||
| Stock Indices | 158 | 0.00 | % | 19,550 | 0.16 | % | ||||||||||
| Metals | 47,528 | 0.70 | % | 123,822 | 1.04 | % | ||||||||||
| Agriculturals/Softs | 26,660 | 0.39 | % | 8,031 | 0.07 | % | ||||||||||
| Energy | 12,668 | 0.19 | % | 37,679 | 0.32 | % | ||||||||||
| Total: | $ | 250,814 | 3.69 | % | $ | 235,286 | 3.38 | % | ||||||||
| Frontier Balanced Fund: | ||||||||||||||||
| September 30, 2018 | December 31, 2017 | |||||||||||||||
| VALUE | % OF TOTAL | VALUE | % OF TOTAL | |||||||||||||
| AT RISK | CAPITALIZATION | AT RISK | CAPITALIZATION | |||||||||||||
| MARKET SECTOR | ||||||||||||||||
| Interest Rates | $ | 10,421,896 | 29.79 | % | $ | 11,368,274 | 23.64 | % | ||||||||
| Currencies | 1,382,093 | 3.95 | % | 167,215 | 0.35 | % | ||||||||||
| Stock Indices | 20,350 | 0.06 | % | 51,406 | 0.11 | % | ||||||||||
| Metals | 112,015 | 0.32 | % | 462,467 | 0.96 | % | ||||||||||
| Agriculturals/Softs | 71,287 | 0.20 | % | 70,758 | 0.15 | % | ||||||||||
| Energy | 49,393 | 0.14 | % | 222,766 | 0.46 | % | ||||||||||
| Total: | $ | 12,057,034 | 34.47 | % | $ | 12,342,887 | 25.67 | % | ||||||||
| Frontier Select Fund: | ||||||||||||||||
| September 30, 2018 | December 31, 2017 | |||||||||||||||
| VALUE | % OF TOTAL | VALUE | % OF TOTAL | |||||||||||||
| AT RISK | CAPITALIZATION | AT RISK | CAPITALIZATION | |||||||||||||
| MARKET SECTOR | ||||||||||||||||
| Interest Rates | $ | 981,739 | 22.33 | % | $ | 1,500,264 | 22.06 | % | ||||||||
| Currencies | — | 0.00 | % | — | 0.00 | % | ||||||||||
| Stock Indices | — | 0.00 | % | — | 0.00 | % | ||||||||||
| Metals | — | 0.00 | % | — | 0.00 | % | ||||||||||
| Agriculturals/Softs | — | 0.00 | % | — | 0.00 | % | ||||||||||
| Energy | — | 0.00 | % | — | 0.00 | % | ||||||||||
| Total: | $ | 981,739 | 22.33 | % | $ | 1,500,264 | 22.06 | % | ||||||||
| Frontier Winton Fund: | ||||||||||||||||
| September 30, 2018 | December 31, 2017 | |||||||||||||||
| VALUE | % OF TOTAL | VALUE | % OF TOTAL | |||||||||||||
| AT RISK | CAPITALIZATION | AT RISK | CAPITALIZATION | |||||||||||||
| MARKET SECTOR | ||||||||||||||||
| Interest Rates | $ | 77,151 | 0.75 | % | $ | 61,564 | 0.41 | % | ||||||||
| Currencies | 676,328 | 6.58 | % | 209,040 | 1.40 | % | ||||||||||
| Stock Indices | 727 | 0.01 | % | 114,498 | 0.77 | % | ||||||||||
| Metals | 218,630 | 2.13 | % | 725,189 | 4.85 | % | ||||||||||
| Agriculturals/Softs | 122,636 | 1.19 | % | 47,034 | 0.31 | % | ||||||||||
| Energy | 58,273 | 0.57 | % | 220,673 | 1.48 | % | ||||||||||
| Total: | $ | 1,153,745 | 11.23 | % | $ | 1,377,999 | 9.22 | % | ||||||||
| Frontier Heritage Fund: | ||||||||||||||||
| September 30, 2018 | December 31, 2017 | |||||||||||||||
| VALUE | % OF TOTAL | VALUE | % OF TOTAL | |||||||||||||
| AT RISK | CAPITALIZATION | AT RISK | CAPITALIZATION | |||||||||||||
| MARKET SECTOR | ||||||||||||||||
| Interest Rates | $ | 1,057,366 | 21.21 | % | $ | 1,606,116 | 23.68 | % | ||||||||
| Currencies | 124,664 | 2.50 | % | 40,791 | 0.60 | % | ||||||||||
| Stock Indices | 134 | 0.00 | % | 22,343 | 0.33 | % | ||||||||||
| Metals | 40,299 | 0.81 | % | 141,511 | 2.09 | % | ||||||||||
| Agriculturals/Softs | 22,605 | 0.45 | % | 9,178 | 0.14 | % | ||||||||||
| Energy | 10,741 | 0.22 | % | 43,061 | 0.63 | % | ||||||||||
| Total: | $ | 1,255,809 | 25.18 | % | $ | 1,863,001 | 27.47 | % | ||||||||
128173
FOREIGN EXPOSURE
Frontier Diversified Fund
| March 31, 2018 | December 31, 2017 | |||||||||||||||
| VALUE | % OF TOTAL | VALUE | % OF TOTAL | |||||||||||||
| AT RISK | CAPITALIZATION | AT RISK | CAPITALIZATION | |||||||||||||
| MARKET SECTOR | ||||||||||||||||
| Interest Rates | $ | 4,901 | 0.03 | % | $ | 20,044 | 0.09 | % | ||||||||
| Currencies | — | 0.00 | % | 29,397 | 0.14 | % | ||||||||||
| Stock Indices | 4,372 | 0.02 | % | 29,331 | 0.14 | % | ||||||||||
| Metals | — | 0.00 | % | — | 0.00 | % | ||||||||||
| Agriculturals/Softs | 2,584 | 0.01 | % | 3,343 | 0.02 | % | ||||||||||
| Total: | $ | 11,941 | 0.06 | % | $ | 83,811 | 0.39 | % | ||||||||
Frontier Long/Short Commodity Fund
| March 31, 2018 | December 31, 2017 | |||||||||||||||
| VALUE | % OF TOTAL | VALUE | % OF TOTAL | |||||||||||||
| AT RISK | CAPITALIZATION | AT RISK | CAPITALIZATION | |||||||||||||
| MARKET SECTOR | ||||||||||||||||
| Interest Rates | $ | — | 0.00 | % | $ | — | 0.00 | % | ||||||||
| Currencies | — | 0.00 | % | — | 0.00 | % | ||||||||||
| Stock Indices | — | 0.00 | % | — | 0.00 | % | ||||||||||
| Metals | — | 0.00 | % | — | 0.00 | % | ||||||||||
| Agriculturals/Softs | — | 0.00 | % | — | 0.00 | % | ||||||||||
| Total: | $ | — | 0.00 | % | $ | — | 0.00 | % | ||||||||
Frontier Masters Fund
| March 31, 2018 | December 31, 2017 | |||||||||||||||
| VALUE | % OF TOTAL | VALUE | % OF TOTAL | |||||||||||||
| AT RISK | CAPITALIZATION | AT RISK | CAPITALIZATION | |||||||||||||
| MARKET SECTOR | ||||||||||||||||
| Interest Rates | $ | 2,773 | 0.03 | % | $ | 11,339 | 0.09 | % | ||||||||
| Currencies | — | 0.00 | % | 16,630 | 0.14 | % | ||||||||||
| Stock Indices | 2,473 | 0.03 | % | 16,593 | 0.14 | % | ||||||||||
| Metals | — | 0.00 | % | — | 0.00 | % | ||||||||||
| Agriculturals/Softs | 1,462 | 0.02 | % | 1,891 | 0.02 | % | ||||||||||
| Energy | 48 | 0.00 | % | 960 | 0.01 | % | ||||||||||
| Total: | $ | 6,755 | 0.07 | % | $ | 47,413 | 0.40 | % | ||||||||
Frontier Balanced Fund:
| March 31, 2018 | December 31, 2017 | |||||||||||||||
| VALUE | % OF TOTAL | VALUE | % OF TOTAL | |||||||||||||
| AT RISK | CAPITALIZATION | AT RISK | CAPITALIZATION | |||||||||||||
| MARKET SECTOR | ||||||||||||||||
| Interest Rates | $ | 153,782 | 0.37 | % | $ | 57,304 | 0.12 | % | ||||||||
| Currencies | — | 0.00 | % | 43,214 | 0.09 | % | ||||||||||
| Stock Indices | 9,589 | 0.02 | % | 54,910 | 0.11 | % | ||||||||||
| Metals | — | 0.00 | % | — | 0.00 | % | ||||||||||
| Agriculturals/Softs | 11,124 | 0.03 | % | 17,823 | 0.04 | % | ||||||||||
| Energy | 123 | 0.00 | % | 2,495 | 0.01 | % | ||||||||||
| Total: | $ | 174,618 | 0.42 | % | $ | 175,746 | 0.37 | % | ||||||||
Frontier Select Fund:
| March 31, 2018 | December 31, 2017 | |||||||||||||||
| VALUE | % OF TOTAL | VALUE | % OF TOTAL | |||||||||||||
| AT RISK | CAPITALIZATION | AT RISK | CAPITALIZATION | |||||||||||||
| MARKET SECTOR | ||||||||||||||||
| Interest Rates | $ | — | 0.00 | % | $ | — | 0.00 | % | ||||||||
| Currencies | — | 0.00 | % | — | 0.00 | % | ||||||||||
| Stock Indices | — | 0.00 | % | — | 0.00 | % | ||||||||||
| Metals | — | 0.00 | % | — | 0.00 | % | ||||||||||
| Agriculturals/Softs | — | 0.00 | % | — | 0.00 | % | ||||||||||
| Energy | — | 0.00 | % | — | 0.00 | % | ||||||||||
| Total: | $ | — | 0.00 | % | $ | — | 0.00 | % | ||||||||
Frontier Winton Fund:
| March 31, 2018 | December 31, 2017 | |||||||||||||||
| VALUE | % OF TOTAL | VALUE | % OF TOTAL | |||||||||||||
| AT RISK | CAPITALIZATION | AT RISK | CAPITALIZATION | |||||||||||||
| MARKET SECTOR | ||||||||||||||||
| Interest Rates | $ | 16,239 | 0.12 | % | $ | 66,410 | 0.44 | % | ||||||||
| Currencies | — | 0.00 | % | 97,397 | 0.65 | % | ||||||||||
| Stock Indices | 14,484 | 0.11 | % | 97,179 | 0.65 | % | ||||||||||
| Metals | — | 0.00 | % | — | 0.00 | % | ||||||||||
| Agriculturals/Softs | 8,560 | 0.07 | % | 11,075 | 0.07 | % | ||||||||||
| Energy | 278 | 0.00 | % | 5,623 | 0.04 | % | ||||||||||
| Total: | $ | 39,562 | 0.30 | % | $ | 277,684 | 1.86 | % | ||||||||
Frontier Heritage Fund:
| FOREIGN EXPOSURE | FOREIGN EXPOSURE | |||||||||||||||||||||||||||||||
| Frontier Diversified Fund | Frontier Diversified Fund | |||||||||||||||||||||||||||||||
| September 30, 2018 | December 31, 2017 | |||||||||||||||||||||||||||||||
| VALUE | % OF TOTAL | VALUE | % OF TOTAL | |||||||||||||||||||||||||||||
| AT RISK | CAPITALIZATION | AT RISK | CAPITALIZATION | |||||||||||||||||||||||||||||
| MARKET SECTOR | ||||||||||||||||||||||||||||||||
| Interest Rates | $ | 17,411 | 0.10 | % | $ | 20,044 | 0.09 | % | ||||||||||||||||||||||||
| Currencies | 582 | 0.00 | % | 29,397 | 0.14 | % | ||||||||||||||||||||||||||
| Stock Indices | 6,362 | 0.04 | % | 29,331 | 0.14 | % | ||||||||||||||||||||||||||
| Metals | — | 0.00 | % | — | 0.00 | % | ||||||||||||||||||||||||||
| Agriculturals/Softs | 5,267 | 0.03 | % | 3,343 | 0.02 | % | ||||||||||||||||||||||||||
| Total: | $ | 30,111 | 0.18 | % | $ | 83,811 | 0.39 | % | ||||||||||||||||||||||||
| Frontier Long/Short Commodity Fund | Frontier Long/Short Commodity Fund | |||||||||||||||||||||||||||||||
| September 30, 2018 | December 31, 2017 | |||||||||||||||||||||||||||||||
| VALUE | % OF TOTAL | VALUE | % OF TOTAL | |||||||||||||||||||||||||||||
| AT RISK | CAPITALIZATION | AT RISK | CAPITALIZATION | |||||||||||||||||||||||||||||
| MARKET SECTOR | ||||||||||||||||||||||||||||||||
| Interest Rates | $ | — | 0.00 | % | $ | — | 0.00 | % | ||||||||||||||||||||||||
| Currencies | — | 0.00 | % | — | 0.00 | % | ||||||||||||||||||||||||||
| Stock Indices | — | 0.00 | % | — | 0.00 | % | ||||||||||||||||||||||||||
| Metals | — | 0.00 | % | — | 0.00 | % | ||||||||||||||||||||||||||
| Agriculturals/Softs | — | 0.00 | % | — | 0.00 | % | ||||||||||||||||||||||||||
| Total: | $ | — | 0.00 | % | $ | — | 0.00 | % | ||||||||||||||||||||||||
| Frontier Masters Fund | Frontier Masters Fund | |||||||||||||||||||||||||||||||
| March 31, 2018 | December 31, 2017 | September 30, 2018 | December 31, 2017 | |||||||||||||||||||||||||||||
| VALUE | % OF TOTAL | VALUE | % OF TOTAL | VALUE | % OF TOTAL | VALUE | % OF TOTAL | |||||||||||||||||||||||||
| AT RISK | CAPITALIZATION | AT RISK | CAPITALIZATION | AT RISK | CAPITALIZATION | AT RISK | CAPITALIZATION | |||||||||||||||||||||||||
| MARKET SECTOR | ||||||||||||||||||||||||||||||||
| Interest Rates | $ | 3,169 | 0.06 | % | $ | 12,959 | 0.19 | % | $ | 15,822 | 0.23 | % | $ | 11,339 | 0.09 | % | ||||||||||||||||
| Currencies | — | 0.00 | % | 19,006 | 0.28 | % | 529 | 0.01 | % | 16,630 | 0.14 | % | ||||||||||||||||||||
| Stock Indices | 2,826 | 0.05 | % | 18,963 | 0.28 | % | 5,782 | 0.09 | % | 16,593 | 0.14 | % | ||||||||||||||||||||
| Metals | — | 0.00 | % | — | 0.00 | % | — | 0.00 | % | — | 0.00 | % | ||||||||||||||||||||
| Agriculturals/Softs | 1,670 | 0.03 | % | 2,161 | 0.03 | % | 4,787 | 0.07 | % | 1,891 | 0.02 | % | ||||||||||||||||||||
| Energy | 54 | 0.00 | % | 1,097 | 0.02 | % | 444 | 0.01 | % | 960 | 0.01 | % | ||||||||||||||||||||
| Total: | $ | 7,720 | 0.14 | % | $ | 54,186 | 0.80 | % | $ | 27,363 | 0.40 | % | $ | 47,413 | 0.40 | % | ||||||||||||||||
| Frontier Balanced Fund: | Frontier Balanced Fund: | |||||||||||||||||||||||||||||||
| September 30, 2018 | December 31, 2017 | |||||||||||||||||||||||||||||||
| VALUE | % OF TOTAL | VALUE | % OF TOTAL | |||||||||||||||||||||||||||||
| AT RISK | CAPITALIZATION | AT RISK | CAPITALIZATION | |||||||||||||||||||||||||||||
| MARKET SECTOR | ||||||||||||||||||||||||||||||||
| Interest Rates | $ | 73,868 | 0.21 | % | $ | 57,304 | 0.12 | % | ||||||||||||||||||||||||
| Currencies | 1,120 | 0.00 | % | 43,214 | 0.09 | % | ||||||||||||||||||||||||||
| Stock Indices | 37,881 | 0.11 | % | 54,910 | 0.11 | % | ||||||||||||||||||||||||||
| Metals | — | 0.00 | % | — | 0.00 | % | ||||||||||||||||||||||||||
| Agriculturals/Softs | 16,596 | 0.05 | % | 17,823 | 0.04 | % | ||||||||||||||||||||||||||
| Energy | 940 | 0.00 | % | 2,495 | 0.01 | % | ||||||||||||||||||||||||||
| Total: | $ | 130,405 | 0.37 | % | $ | 175,746 | 0.37 | % | ||||||||||||||||||||||||
| Frontier Select Fund: | Frontier Select Fund: | |||||||||||||||||||||||||||||||
| September 30, 2018 | December 31, 2017 | |||||||||||||||||||||||||||||||
| VALUE | % OF TOTAL | VALUE | % OF TOTAL | |||||||||||||||||||||||||||||
| AT RISK | CAPITALIZATION | AT RISK | CAPITALIZATION | |||||||||||||||||||||||||||||
| MARKET SECTOR | ||||||||||||||||||||||||||||||||
| Interest Rates | $ | — | 0.00 | % | $ | — | 0.00 | % | ||||||||||||||||||||||||
| Currencies | — | 0.00 | % | — | 0.00 | % | ||||||||||||||||||||||||||
| Stock Indices | — | 0.00 | % | — | 0.00 | % | ||||||||||||||||||||||||||
| Metals | — | 0.00 | % | — | 0.00 | % | ||||||||||||||||||||||||||
| Agriculturals/Softs | — | 0.00 | % | — | 0.00 | % | ||||||||||||||||||||||||||
| Energy | — | 0.00 | % | — | 0.00 | % | ||||||||||||||||||||||||||
| Total: | $ | — | 0.00 | % | $ | — | 0.00 | % | ||||||||||||||||||||||||
| Frontier Winton Fund: | Frontier Winton Fund: | |||||||||||||||||||||||||||||||
| September 30, 2018 | December 31, 2017 | |||||||||||||||||||||||||||||||
| VALUE | % OF TOTAL | VALUE | % OF TOTAL | |||||||||||||||||||||||||||||
| AT RISK | CAPITALIZATION | AT RISK | CAPITALIZATION | |||||||||||||||||||||||||||||
| MARKET SECTOR | ||||||||||||||||||||||||||||||||
| Interest Rates | $ | 72,781 | 0.71 | % | $ | 66,410 | 0.44 | % | ||||||||||||||||||||||||
| Currencies | 2,432 | 0.02 | % | 97,397 | 0.65 | % | ||||||||||||||||||||||||||
| Stock Indices | 26,596 | 0.26 | % | 97,179 | 0.65 | % | ||||||||||||||||||||||||||
| Metals | — | 0.00 | % | — | 0.00 | % | ||||||||||||||||||||||||||
| Agriculturals/Softs | 22,018 | 0.21 | % | 11,075 | 0.07 | % | ||||||||||||||||||||||||||
| Energy | 2,043 | 0.02 | % | 5,623 | 0.04 | % | ||||||||||||||||||||||||||
| Total: | $ | 125,868 | 1.22 | % | $ | 277,684 | 1.86 | % | ||||||||||||||||||||||||
| Frontier Heritage Fund: | Frontier Heritage Fund: | |||||||||||||||||||||||||||||||
| September 30, 2018 | December 31, 2017 | |||||||||||||||||||||||||||||||
| VALUE | % OF TOTAL | VALUE | % OF TOTAL | |||||||||||||||||||||||||||||
| AT RISK | CAPITALIZATION | AT RISK | CAPITALIZATION | |||||||||||||||||||||||||||||
| MARKET SECTOR | ||||||||||||||||||||||||||||||||
| Interest Rates | $ | 13,415 | 0.27 | % | $ | 12,959 | 0.19 | % | ||||||||||||||||||||||||
| Currencies | 448 | 0.01 | % | 19,006 | 0.28 | % | ||||||||||||||||||||||||||
| Stock Indices | 4,902 | 0.10 | % | 18,963 | 0.28 | % | ||||||||||||||||||||||||||
| Metals | — | 0.00 | % | — | 0.00 | % | ||||||||||||||||||||||||||
| Agriculturals/Softs | 4,058 | 0.08 | % | 2,161 | 0.03 | % | ||||||||||||||||||||||||||
| Energy | 376 | 0.01 | % | 1,097 | 0.02 | % | ||||||||||||||||||||||||||
| Total: | $ | 23,201 | 0.47 | % | $ | 54,186 | 0.80 | % | ||||||||||||||||||||||||
129174
Material Limitations on Value at Risk as an Assessment of Market Risk
The face value of the market sector instruments held on behalf of the Series is typically many times the applicable maintenance margin requirement, which generally ranges between approximately 1% and 10% of contract face value, as well as many times the capitalization of the Series. The magnitude of each Series’ open positions creates a risk of ruin not typically found in most other investment vehicles. Because of the size of their positions, certain market conditions, although unusual, but historically recurring from time to time, could cause a Series to incur severe losses over a short period of time. The value at risk table above, as well as the past performance of the Series, gives no indication of this risk of severe losses.
Non-Trading Risk
The Series have non-trading market risk on their foreign cash balances not needed for margin. However, these balances, as well as the market risk they represent, are immaterial. The Series also have non-trading market risk as a result of investing a portion of their available assets in U.S. government securities which include any security issued or guaranteed as to principal or interest by the U.S., or by a person controlled by or supervised by and acting as an instrumentality of the government of the U.S. pursuant to authority granted by Congress of the U.S. or any certificate of deposit for any of the foregoing, including U.S. treasury bonds, U.S. treasury bills and issues of agencies of the U.S. government and certain cash items such as money market funds, certificates of deposit (under three months) and time deposits. The market risk represented by these investments is also immaterial.
Qualitative Market Risk
The following are the primary trading risk exposures of the Series of the Trust as of March 31,September 30, 2018, by market sector.
Interest Rates
Interest rate risk is one of the principal market exposures of each Series. Interest rate movements directly affect the price of interest rate futures positions held and indirectly the value of a Trading Company’s stock index and currency positions. Interest rate movements in one country as well as relative interest rate movements between countries materially impact profitability. The primary interest rate exposure is to interest rate fluctuations in the U.S. and the other G-7 countries. However, the Trading Companies and Galaxy Plus entities also may take futures positions on the government debt of smaller nations. The Managing Owner anticipates that G-7 interest rates will remain the primary market exposure of each Trading Company and Galaxy Plus entities and accordingly of each Series for the foreseeable future. The changes in interest rates which are expected to have the most effect on the Series are changes in long-term, as opposed to short-term rates. Most of the speculative positions to be held by the Trading Companies and Galaxy Plus entities will be in medium- to long-term instruments. Consequently, even a material change in short-term rates is expected to have little effect on the Series if the medium- to long-term rates remain steady. Aggregate interest income from all sources, including assets held at clearing brokers, of up to 2% (annualized) is paid to the Managing Owner by the Frontier Balanced Fund (Class 1 and Class 2 only), Frontier Winton Fund, Frontier Select Fund and Frontier Heritage Fund. For the Frontier Diversified Fund, Frontier Long/Short Commodity Fund (Class 1a, Class 2a, Class 3a only), Frontier Masters Fund and Frontier Balanced Fund (Class 1AP, Class 2a and Class 3a), 20% of the total interest allocated to each Series was paid to the Managing Owner from January 1, 2017 through April 28, 2017; thereafter 100% of the interest is retained by the respective Series.
Currencies
Exchange rate risk is a significant market exposure of each Series of the Trust in general. For each Series of the Trust in general, currency exposure is to exchange rate fluctuations, primarily fluctuations that disrupt the historical pricing relationships between different currenciesCurrencies and currency pairs. These fluctuations are influenced by interest rate changes as well as political and general economic conditions. The Trading Advisors on behalf of a Series trade in a large number of currencies,Currencies, including cross-rates, which are positions between two currenciesCurrencies other than the U.S. dollar. The Managing Owner does not anticipate that the risk profile of the Series’ currency sector will change significantly in the future.
175
Stock Indices
For each Series, its primary equity exposure is equity price risk in the G-7 countries as well as other smaller jurisdictions. Each Series of the Trust is primarily exposed to the risk of adverse price trends or static markets in the major U.S., European and Japanese indices.
Metals
For each Series, its metalsMetals market exposure is fluctuations in the price of both precious metals,Metals, including gold and silver, as well as base metalsMetals including aluminum, copper, nickel and zinc. Some metals,Metals, such as gold, are used as surrogate stores of value, in place of hard currency and thus have currency or interest rate risk associated with them relative to their price in a specific currency. Other metals,Metals, such as silver, platinum, copper and steel, have substantial industrial applications and may be subject to forces affecting industrial production and demand.
130
Agriculturals/Softs
Each Series may also invest in raw commodities and may thus have exposure to agricultural price movements, which are often directly affected by severe or unexpected weather conditions or by political events in countries that comprise significant sources of commodity supply.
Energy
For each Series its primary energy market exposure is in oil, gas and other energy product price movements, often resulting from political developments and ongoing conflicts in the Middle East. Oil and gas prices can be volatile and substantial profits and losses have been and are expected to continue to be experienced in this market.
Other Trading Risks
As a result of leverage, small changes in the price of a Trading Company’s positions may result in substantial losses for a Series. Futures, forwards and options are typically traded on margin. This means that a small amount of capital can be used to invest in contracts of much greater total value. The resulting leverage means that a relatively small change in the market price of a contract can produce a substantial loss. Like other leveraged investments, any purchase or sale of a contract may result in losses in excess of the amount invested in that contract. The Trading Companies and Galaxy Plus entities may lose more than their initial margin deposits on a trade.
The Trading Companies’ and Galaxy Plus entities’ trading is subject to execution risks. Market conditions may make it impossible for the Trading Advisors to execute a buy or sell order at the desired price, or to close out an open position. Daily price fluctuation limits are established by the exchanges and approved by the CFTC. When the market price of a contract reaches its daily price fluctuation limit, no trades can be executed at prices outside the limit. The holder of a contract may therefore be locked into an adverse price movement for several days or more and lose considerably more than the initial margin put up to establish the position. Thinly traded or illiquid markets also can make it difficult or impossible to execute trades. The Trading Advisor’s positions are subject to speculative limits. The CFTC and domestic exchanges have established speculative position limits on the maximum futures position which any person, or group of persons acting in concert, may hold or control in particular futures contracts or options on futures contracts traded on U.S. commodity exchanges. Under current regulations, other accounts of the Trading Advisors are combined with the positions held by them on behalf of the applicable Trading Company and Galaxy Plus entity for position limit purposes. This trading could preclude additional trading in these commodities by the Trading Advisors for the accounts of the Series.
Systematic strategies do not consider fundamental types of data and do not have the benefit of discretionary decision making. The assets of the Series are allocated to Trading Advisors that rely on technical, systematic strategies that do not take into account factors external to the market itself (although certain of these strategies may have minor discretionary elements incorporated into their systematic strategy). The widespread use of technical trading systems frequently results in numerous trading advisors attempting to execute similar trades at or about the same time, altering trading patterns and affecting market liquidity. Furthermore, the profit potential of trend-following systems may be diminished by the changing character of the markets, which may make historical price data (on which technical programs are based) only marginally relevant to future market patterns. Systematic strategies are developed on the basis of a statistical analysis of market prices. Consequently, any factor external to the market itself that dominates prices that a discretionary decision maker may take into account may cause major losses for a systematic strategy. For example, a pending political or economic event may be very likely to cause a major price movement, but a systematic strategy may continue to maintain positions indicated by its trading method that might incur major losses if the event proved to be adverse.
176
However, because certain of the Trading Advisors’ strategies involve some discretionary aspects in addition to their technical factors, certain of the Trading Advisors may occasionally use discretion in investing the assets of a Trading Company. For example, the Trading Advisors often use discretion in selecting contracts and markets to be followed. In exercising such discretion, such Trading Advisor may take positions opposite to those recommended by the Trading Advisor’s trading system or signals. Discretionary decision making may also result in a Trading Advisor failing to capitalize on certain price trends or making unprofitable trades in a situation where another trader relying solely on a systematic approach might not have done so. Furthermore, such use of discretion may not enable the relevant Series of the Trust to avoid losses and in fact, such use of discretion may cause such Series to forego profits which it may have otherwise earned had such discretion not been used.
Cyber Risks and Security
The Trust’s business requires it to use and store investor, employee and business partner personally identifiable information (“PII”). This may include, among other information, names, addresses, phone numbers, email addresses, contact preferences, tax identification numbers and payment account information.
The Trust requires user names and passwords in order to access its information technology systems. The Trust also uses encryption and authentication technologies designed to secure the transmission and storage of data and prevent access to Trust data or accounts. These security measures are subject to third-party security breaches, employee error, malfeasance, faulty password management, or other irregularities. To help protect investors and the Trust, the Trust monitors accounts and systems for unusual activity and may freeze accounts under suspicious circumstances.
131
The Trust devotes significant resources to network security, data encryption and other security measures to protect its systems and data, but these security measures cannot provide absolute security. To the extent the Trust was to experience a breach of its systems and was unable to protect sensitive data, such a breach could materially damage business partner and investor relationships. Moreover, if a computer security breach affects the Trust’s systems or results in the unauthorized release of PII, the Trust’s reputation and brand could be materially damaged and the Trust could be exposed to a risk of loss or litigation and possible liability. While the Trust maintains insurance coverage that, subject to policy terms and conditions and subject to a significant self-insured retention, is designed to address certain aspects of cyber risks, such insurance coverage may be insufficient to cover all losses or all types of claims that may arise in the continually evolving area of cyber risk.
Qualitative Disclosures Regarding Means of Managing Risk Exposure
The means by which the Managing Owner attempts to manage the risk of the Trust’s open positions is essentially the same in all market categories traded. The Managing Owner applies risk management policies to trading which generally are designed to limit the total exposure of assets under management. In addition, the Managing Owner follows diversification guidelines which are often formulated in terms of the balanced volatility between markets and correlated groups.
| ITEM 4. | CONTROLS AND PROCEDURES |
Evaluation of Disclosure Controls and Procedures
Under the supervision and with the participation of the management of the Managing Owner, including its Chairman and Chief Financial Officer, the Trust evaluated the effectiveness of the design and operation of the disclosure controls and procedures (as defined in Rule 13a-15(e) under the Securities Exchange Act of 1934, as amended (the “Exchange Act”)), for the Trust and each Series as of March 31,September 30, 2018 (the “Evaluation Date”). Any control system, no matter how well designed and operated, can provide only reasonable (not absolute) assurance that its objectives will be met. Furthermore, no evaluation of controls can provide absolute assurance that all control issues and instances of fraud, if any, have been detected. Based upon their evaluation, the Chairman and Chief Financial Officer of the Managing Owner concluded that, as of the Evaluation Date, the disclosure controls and procedures for the Trust and each Series were effective to provide reasonable assurance that they are timely alerted to the material information relating to the Trust and each Series required to be included in the Trust’s periodic SEC filing.
177
Changes in Internal Control Over Financial Reporting
There were no changes in the Trust’s internal control over financial reporting for the quarter ended March 31, 2018.
On January 31, 2018, Garrett W. Phillips resigned as the Chief Financial Officer and Treasurer of the Managing Owner, and as the Chief Operations Officer of Wakefield Advisors LLC.
In connection with the resignation of Mr. Phillips, Patrick J. Kane was appointed as the Chief Financial Officer of the Managing Owner, effective as of January 31,September 30, 2018.
Scope of Exhibit 31 Certifications
The certification of the Chairman and Chief Financial Officer of the Managing Owner included as Exhibit 31.1 to this Form 10-Q applies not only to the Trust as a whole but also to each Series individually.
132
| ITEM 1. | LEGAL PROCEEDINGS. |
There are no material legal proceedings pending against the Trust, or any of the Series.
| ITEM 1A. | RISK FACTORS. |
The sections each entitled “Risk Factors” in the Prospectuses filed pursuant to Rule 424(b)(3) (File Nos. 333-210313 and 333-155800) are incorporated by reference into this section.
| ITEM 2. | UNREGISTERED SALES OF EQUITY SECURITIES AND USE OF PROCEEDS. |
The following table provides information regarding the sale of unregistered Units by the Trust for the threenine months ended March 31,September 30, 2018. The number of Units listed below for each transaction is the aggregate number of Units in the particular Series of the Trust purchased in such transaction. The consideration listed below for each transaction is, except as otherwise noted, the aggregate amount of cash paid for the Units purchased. For each transaction reported below, the price per Unit was NAV per Unit at the time of the transaction and the Managing Owner of the Trust was the purchaser of the Units. No underwriting discount or sales commission was paid or received with respect to any of the transactions reported below. The Trust claims an exemption from registration of each of the transactions listed below under Section 4(a)(2) of the Securities Act of 1933, as amended, as a sale by an issuer not involving a public offering.
| SERIES | DATE | UNITS | CONSIDERATION | |||
| NONE |
One hundred percent of the offering proceeds from the sale of Units are initially available for the Series’ trading activities.
| ITEM 3. | DEFAULTS UPON SENIOR SECURITIES. |
None
| ITEM 4. | MINE SAFETY DISCLOSURES. |
Not applicable.
| ITEM 5. | OTHER INFORMATION. |
None
178
| ITEM 6. | EXHIBITS. |
Exhibits (numbered in accordance with Item 601 of Regulation S-K)
133179
Pursuant to the requirements of the Securities Exchange Act of 1934,as amended, the registrant has duly caused this report to be signed on its behalf by the undersigned thereunto duly authorized.
| Frontier Funds | |||
| (Registrant) | |||
| Date: | By: | /s/ P | |
Patrick J. Kane | |||
| Chairman, | |||
134180
SIGNATURES
Pursuant to the requirements of the Securities Exchange Act of 1934, as amended, the registrant has duly caused this report to be signed on its behalf by the undersigned thereunto duly authorized.
| Frontier Balanced Fund, | |||
| a Series of Frontier Funds | |||
| (Registrant) | |||
| Date: | By: | /s/ P | |
Patrick J. Kane | |||
| Chairman, | |||
135181
SIGNATURES
Pursuant to the requirements of the Securities Exchange Act of 1934, as amended, the registrant has duly caused this report to be signed on its behalf by the undersigned thereunto duly authorized.
| Frontier Heritage Fund, | |||
| a Series of Frontier Funds | |||
| (Registrant) | |||
| Date: | By: | /s/ P | |
| Patrick J. Kane | |||
| Chairman and Chief Financial Officer of Frontier Fund Management LLC, the Managing Owner of Frontier Funds | |||
136182
SIGNATURES
Pursuant to the requirements of the Securities Exchange Act of 1934, as amended, the registrant has duly caused this report to be signed on its behalf by the undersigned thereunto duly authorized.
| Frontier Winton Fund, | |||
| a Series of Frontier Funds | |||
| (Registrant) | |||
| Date: | By: | /s/ P | |
Patrick J. Kane | |||
| Chairman and Chief Financial Officer of Frontier Fund Management LLC, the Managing Owner of Frontier Funds | |||
137183
SIGNATURES
Pursuant to the requirements of the Securities Exchange Act of 1934, as amended, the registrant has duly caused this report to be signed on its behalf by the undersigned thereunto duly authorized.
| Frontier Select Fund, | |||
a Series of Frontier Funds (Registrant) | |||
| Date: | By: | /s/ P | |
| Patrick J. Kane | |||
| Chairman and Chief Financial Officer of Frontier Fund Management LLC, the Managing Owner of Frontier Funds | |||
138184
SIGNATURES
Pursuant to the requirements of the Securities Exchange Act of 1934, as amended, the registrant has duly caused this report to be signed on its behalf by the undersigned thereunto duly authorized.
Frontier Long/Short Commodity Fund, a Series of Frontier Funds (Registrant) | |||
| Date: | By: | /s/ P | |
| Patrick J. Kane | |||
Chairman and Chief Financial Officer of Frontier Fund Management LLC, the Managing Owner of Frontier Funds | |||
139185
SIGNATURES
Pursuant to the requirements of the Securities Exchange Act of 1934, as amended, the registrant has duly caused this report to be signed on its behalf by the undersigned thereunto duly authorized.
| Frontier Diversified Fund, | ||||
| a Series of Frontier Funds | ||||
| (Registrant) | ||||
| Date: | By: | /s/ P | ||
| Patrick J. Kane | ||||
Chairman and Chief Financial Officer of Frontier Fund Management LLC, the Managing Owner of Frontier Funds | ||||
140186
SIGNATURES
Pursuant to the requirements of the Securities Exchange Act of 1934, as amended, the registrant has duly caused this report to be signed on its behalf by the undersigned thereunto duly authorized.
| Frontier Masters Fund, | ||||
| a Series of Frontier Funds | ||||
| (Registrant) | ||||
| Date: | By: | /s/ P | ||
| Patrick J. Kane | ||||
Chairman and Chief Financial Officer of Frontier Fund Management LLC, the Managing Owner of Frontier Funds | ||||
141187