| (Mark One) | |||||
| ☒ | QUARTERLY REPORT PURSUANT TO SECTION 13 OR 15(d) OF THE SECURITIES EXCHANGE ACT OF 1934 | ||||
| ☐ | TRANSITION REPORT PURSUANT TO SECTION 13 OR 15(d) OF THE SECURITIES EXCHANGE ACT OF 1934 | ||||
| Maryland | 80-0947092 | ||||||||||
| (State or other jurisdiction of incorporation or organization) | (I.R.S. Employer Identification No.) | ||||||||||
| 2800 Post Oak Boulevard | |||||||||||
| Suite 5000 | |||||||||||
| Houston | Texas | 77056-6118 | |||||||||
| (Address of principal executive offices) | (Zip code) | ||||||||||
| Large accelerated filer | ☐ | Accelerated filer | ☐ | Non-accelerated filer | ☒ | ||||||||||||||||||||||||||||||||||||
| Smaller reporting company | ☒ | Emerging growth company | |||||||||||||||||||||||||||||||||||||||
| If an emerging growth company, indicate by check mark if the registrant has elected not to use the extended transition period for complying with any new or revised financial accounting standards provided pursuant to Section 13 (a) of the Exchange Act. | ☐ | ||||||||||||||||||||||||||||||||||||||||
| PART I – FINANCIAL INFORMATION | ||||||||||||||
| Item 1. | Condensed Consolidated Financial Statements (Unaudited): | |||||||||||||
| Item 2. | ||||||||||||||
| Item 3. | ||||||||||||||
| Item 4. | ||||||||||||||
| PART II – OTHER INFORMATION | ||||||||||||||
| Item 1. | ||||||||||||||
| Item 1A. | ||||||||||||||
| Item 2. | ||||||||||||||
| Item 3. | ||||||||||||||
| Item 4. | ||||||||||||||
| Item 5. | ||||||||||||||
| Item 6. | ||||||||||||||
| June 30, 2019 | December 31, 2018 | June 30, 2020 | December 31, 2019 | |||||||||||||||||||||
| (in thousands, except per share amounts) | (in thousands, except per share amounts) | |||||||||||||||||||||||
| ASSETS | ASSETS | |||||||||||||||||||||||
| Investment property, net | $ | 917,662 | $ | 787,189 | Investment property, net | $ | 1,266,124 | $ | 1,254,304 | |||||||||||||||
| Investments in real estate-related securities | 19,833 | 9,599 | Investments in real estate-related securities | 37,653 | 36,491 | |||||||||||||||||||
| Cash and cash equivalents | 34,353 | 27,138 | Cash and cash equivalents | 71,558 | 45,875 | |||||||||||||||||||
| Restricted cash | 7,026 | 9,848 | Restricted cash | 6,122 | 10,563 | |||||||||||||||||||
| Derivative instruments | 63 | 174 | Derivative instruments | 337 | 163 | |||||||||||||||||||
| Tenant and other receivables, net | 11,007 | 8,995 | Tenant and other receivables, net | 14,589 | 14,160 | |||||||||||||||||||
| Intangible lease assets, net | 54,086 | 90,697 | Intangible lease assets, net | 81,923 | 98,537 | |||||||||||||||||||
| Right-of-use asset, net | 33,691 | — | Right-of-use asset, net | 4,153 | 37,606 | |||||||||||||||||||
| Deferred leasing costs, net | 18,031 | 13,282 | Deferred leasing costs, net | 15,757 | 18,418 | |||||||||||||||||||
| Deferred financing costs, net | Deferred financing costs, net | 1,909 | 2,311 | |||||||||||||||||||||
| Other assets | 3,012 | 1,907 | Other assets | 10,107 | 5,129 | |||||||||||||||||||
| Assets held for sale | Assets held for sale | — | 49,988 | |||||||||||||||||||||
| Total assets | $ | 1,098,764 | $ | 948,829 | Total assets | $ | 1,510,232 | $ | 1,573,545 | |||||||||||||||
| LIABILITIES AND EQUITY | LIABILITIES AND EQUITY | |||||||||||||||||||||||
| Liabilities: | Liabilities: | |||||||||||||||||||||||
| Accounts payable and accrued expenses | $ | 21,183 | $ | 26,186 | Accounts payable and accrued expenses | $ | 28,319 | $ | 29,838 | |||||||||||||||
| Due to affiliates | 30,205 | 26,022 | Due to affiliates | 37,596 | 42,782 | |||||||||||||||||||
| Intangible lease liabilities, net | 18,290 | 18,034 | Intangible lease liabilities, net | 16,865 | 19,633 | |||||||||||||||||||
| Operating lease liability | Operating lease liability | 1,510 | 1,583 | |||||||||||||||||||||
| Other liabilities | 10,310 | 55,391 | Other liabilities | 12,519 | 21,428 | |||||||||||||||||||
| Derivative instruments | Derivative instruments | — | 1,079 | |||||||||||||||||||||
| Distributions payable | 2,860 | 2,024 | Distributions payable | 4,501 | 3,837 | |||||||||||||||||||
| Note payable to affiliate | — | 55,000 | Note payable to affiliate | — | 75,000 | |||||||||||||||||||
| Notes payable, net | 596,812 | 487,439 | Notes payable, net | 605,395 | 752,131 | |||||||||||||||||||
| Liabilities associated with assets held for sale | Liabilities associated with assets held for sale | — | 34,713 | |||||||||||||||||||||
| Total liabilities | 679,660 | 670,096 | Total liabilities | 706,705 | 982,024 | |||||||||||||||||||
| Commitments and contingencies (Note 11) | — | — | Commitments and contingencies (Note 11) | — | — | |||||||||||||||||||
| Equity: | Equity: | |||||||||||||||||||||||
| Stockholders’ equity: | Stockholders’ equity: | |||||||||||||||||||||||
| Preferred shares, $0.001 par value per share; 500,000 preferred shares authorized, none issued or outstanding as of June 30, 2019 and December 31, 2018 | — | — | ||||||||||||||||||||||
| Preferred shares, $0.001 par value per share; 500,000 preferred shares authorized, 0ne issued or outstanding as of June 30, 2020 and December 31, 2019 | Preferred shares, $0.001 par value per share; 500,000 preferred shares authorized, 0ne issued or outstanding as of June 30, 2020 and December 31, 2019 | — | — | |||||||||||||||||||||
| Common shares, $0.001 par value per share (Note 6) | 62 | 44 | Common shares, $0.001 par value per share (Note 6) | 97 | 83 | |||||||||||||||||||
| Additional paid-in capital | 533,778 | 371,274 | Additional paid-in capital | 868,235 | 735,545 | |||||||||||||||||||
| Accumulated distributions in excess of earnings | (113,933 | ) | (91,711 | ) | Accumulated distributions in excess of earnings | (57,398) | (146,830) | |||||||||||||||||
| Accumulated other comprehensive income (loss) | (803 | ) | (874 | ) | Accumulated other comprehensive income (loss) | (7,407) | 2,723 | |||||||||||||||||
| Total stockholders’ equity | 419,104 | 278,733 | Total stockholders’ equity | 803,527 | 591,521 | |||||||||||||||||||
| Noncontrolling interests | — | — | Noncontrolling interests | — | — | |||||||||||||||||||
| Total equity | 419,104 | 278,733 | Total equity | 803,527 | 591,521 | |||||||||||||||||||
| Total liabilities and equity | $ | 1,098,764 | $ | 948,829 | Total liabilities and equity | $ | 1,510,232 | $ | 1,573,545 | |||||||||||||||
| Three Months Ended June 30, | Six Months Ended June 30, | ||||||||||||||||||||||||||||||||||||||||
| 2020 | 2019 | 2020 | 2019 | ||||||||||||||||||||||||||||||||||||||
| (in thousands, except per share amounts) | |||||||||||||||||||||||||||||||||||||||||
| Revenues: | |||||||||||||||||||||||||||||||||||||||||
| Rental revenue | $ | 27,001 | $ | 23,018 | $ | 60,120 | $ | 44,468 | |||||||||||||||||||||||||||||||||
| Other revenue | 813 | 536 | 1,539 | 823 | |||||||||||||||||||||||||||||||||||||
| Total revenues | 27,814 | 23,554 | 61,659 | 45,291 | |||||||||||||||||||||||||||||||||||||
| Expenses: | |||||||||||||||||||||||||||||||||||||||||
| Property operating expenses | 7,139 | 5,170 | 15,213 | 10,706 | |||||||||||||||||||||||||||||||||||||
| Real property taxes | 3,489 | 2,699 | 6,971 | 5,297 | |||||||||||||||||||||||||||||||||||||
| Property management fees | 1,192 | 940 | 2,549 | 1,644 | |||||||||||||||||||||||||||||||||||||
| Depreciation and amortization | 14,457 | 9,741 | 30,686 | 19,069 | |||||||||||||||||||||||||||||||||||||
| Acquisition related expenses | 274 | 13 | 291 | 17 | |||||||||||||||||||||||||||||||||||||
| Asset management fees | 2,747 | 1,801 | 5,538 | 3,288 | |||||||||||||||||||||||||||||||||||||
| Performance participation allocation | — | 1,476 | — | 2,597 | |||||||||||||||||||||||||||||||||||||
| General and administrative expenses | 1,286 | 948 | 2,324 | 1,795 | |||||||||||||||||||||||||||||||||||||
| Total expenses | 30,584 | 22,788 | 63,572 | 44,413 | |||||||||||||||||||||||||||||||||||||
| Other income (expenses): | |||||||||||||||||||||||||||||||||||||||||
| Gain (loss) on derivative instruments | 1,514 | (77) | 8,470 | (1,187) | |||||||||||||||||||||||||||||||||||||
| Gain (loss) on investments in real estate-related securities | 3,136 | 161 | (4,601) | 1,327 | |||||||||||||||||||||||||||||||||||||
| Gain on sale of real estate | 80,457 | — | 130,101 | — | |||||||||||||||||||||||||||||||||||||
| Foreign currency gains (losses) | 1,374 | (267) | (1,145) | (336) | |||||||||||||||||||||||||||||||||||||
| Interest expense | (4,463) | (4,317) | (10,395) | (8,514) | |||||||||||||||||||||||||||||||||||||
| Interest and other income | 159 | 244 | 710 | 372 | |||||||||||||||||||||||||||||||||||||
| Income (loss) before benefit (provision) for income taxes | 79,407 | (3,490) | 121,227 | (7,460) | |||||||||||||||||||||||||||||||||||||
| Benefit (provision) for income taxes | 1,906 | 40 | 1,838 | 11 | |||||||||||||||||||||||||||||||||||||
| Provision for income taxes related to sale of real estate | (7,773) | — | (7,773) | — | |||||||||||||||||||||||||||||||||||||
| Net income (loss) | 73,540 | (3,450) | 115,292 | (7,449) | |||||||||||||||||||||||||||||||||||||
| Net (income) loss attributable to noncontrolling interests | (4) | (4) | (7) | (7) | |||||||||||||||||||||||||||||||||||||
| Net income (loss) attributable to common stockholders | $ | 73,536 | $ | (3,454) | $ | 115,285 | $ | (7,456) | |||||||||||||||||||||||||||||||||
| Basic and diluted income (loss) per common share | $ | 0.77 | $ | (0.06) | $ | 1.23 | $ | (0.14) | |||||||||||||||||||||||||||||||||
| Weighted average number of common shares outstanding | 95,490 | 57,004 | 93,900 | 52,049 | |||||||||||||||||||||||||||||||||||||
| Comprehensive income (loss): | |||||||||||||||||||||||||||||||||||||||||
| Net income (loss) | $ | 73,540 | $ | (3,450) | $ | 115,292 | $ | (7,449) | |||||||||||||||||||||||||||||||||
| Other comprehensive income (loss): | |||||||||||||||||||||||||||||||||||||||||
| Foreign currency translation adjustment | 5,483 | 2,091 | (10,130) | 71 | |||||||||||||||||||||||||||||||||||||
| Comprehensive income (loss) | $ | 79,023 | $ | (1,359) | $ | 105,162 | $ | (7,378) | |||||||||||||||||||||||||||||||||
| Comprehensive (income) loss attributable to noncontrolling interests | (4) | (4) | (7) | (7) | |||||||||||||||||||||||||||||||||||||
| Comprehensive income (loss) attributable to common stockholders | $ | 79,019 | $ | (1,363) | $ | 105,155 | $ | (7,385) | |||||||||||||||||||||||||||||||||
| Three Months Ended June 30, | Six Months Ended June 30, | ||||||||||||||
| 2019 | 2018 | 2019 | 2018 | ||||||||||||
| (in thousands, except per share amounts) | |||||||||||||||
| Revenues: | |||||||||||||||
| Rental revenue | $ | 23,018 | $ | 15,725 | $ | 44,468 | $ | 32,168 | |||||||
| Other revenue | 536 | 249 | 823 | 537 | |||||||||||
| Total revenues | 23,554 | 15,974 | 45,291 | 32,705 | |||||||||||
| Expenses: | |||||||||||||||
| Property operating expenses | 5,170 | 2,668 | 10,706 | 5,494 | |||||||||||
| Real property taxes | 2,699 | 2,018 | 5,297 | 4,099 | |||||||||||
| Property management fees | 940 | 344 | 1,644 | 656 | |||||||||||
| Depreciation and amortization | 9,741 | 6,959 | 19,069 | 14,300 | |||||||||||
| Acquisition related expenses | 13 | 10 | 17 | 144 | |||||||||||
| Asset management fees | 1,801 | 1,214 | 3,288 | 2,420 | |||||||||||
| Performance participation allocation | 1,476 | 1,185 | 2,597 | 2,777 | |||||||||||
| General and administrative expenses | 948 | 659 | 1,795 | 1,511 | |||||||||||
| Total expenses | 22,788 | 15,057 | 44,413 | 31,401 | |||||||||||
| Other income (expenses): | |||||||||||||||
| Gain (loss) on derivative instruments | (77 | ) | (45 | ) | (1,187 | ) | (47 | ) | |||||||
| Gain (loss) on investments in real estate-related securities | 161 | — | 1,327 | — | |||||||||||
| Gain on sale of real estate | — | — | — | 14,491 | |||||||||||
| Foreign currency gains (losses) | (267 | ) | (291 | ) | (336 | ) | (316 | ) | |||||||
| Interest expense | (4,317 | ) | (2,677 | ) | (8,514 | ) | (5,491 | ) | |||||||
| Interest income | 244 | 34 | 372 | 47 | |||||||||||
| Income (loss) before benefit (provision) for income taxes | (3,490 | ) | (2,062 | ) | (7,460 | ) | 9,988 | ||||||||
| Benefit (provision) for income taxes | 40 | 654 | 11 | (20 | ) | ||||||||||
| Net income (loss) | (3,450 | ) | (1,408 | ) | (7,449 | ) | 9,968 | ||||||||
| Net (income) loss attributable to noncontrolling interests | (4 | ) | (3 | ) | (7 | ) | (6 | ) | |||||||
| Net income (loss) attributable to common stockholders | $ | (3,454 | ) | $ | (1,411 | ) | $ | (7,456 | ) | $ | 9,962 | ||||
| Basic and diluted income (loss) per common share | $ | (0.06 | ) | $ | (0.04 | ) | $ | (0.14 | ) | $ | 0.25 | ||||
| Weighted average number of common shares outstanding | 57,004 | 39,489 | 52,049 | 39,443 | |||||||||||
| Comprehensive income (loss): | |||||||||||||||
| Net income (loss) | $ | (3,450 | ) | $ | (1,408 | ) | $ | (7,449 | ) | $ | 9,968 | ||||
| Other comprehensive income (loss): | |||||||||||||||
| Foreign currency translation adjustment | 2,091 | (5,515 | ) | 71 | (2,799 | ) | |||||||||
| Comprehensive income (loss) | $ | (1,359 | ) | $ | (6,923 | ) | $ | (7,378 | ) | $ | 7,169 | ||||
| Comprehensive (income) loss attributable to noncontrolling interests | (4 | ) | (3 | ) | (7 | ) | (6 | ) | |||||||
| Comprehensive income (loss) attributable to common stockholders | $ | (1,363 | ) | $ | (6,926 | ) | $ | (7,385 | ) | $ | 7,163 | ||||
| Hines Global Income Trust, Inc. Stockholders | ||||||||||||||||||||||||||||||||||||||||||||||||||||||||||||||||||||||||||||||||
| Common Shares | Additional Paid-in Capital | Accumulated Distributions in Excess of Earnings | Accumulated Other Comprehensive Income (Loss) | Total Stockholders’ Equity | Noncontrolling Interests | |||||||||||||||||||||||||||||||||||||||||||||||||||||||||||||||||||||||||||
| Shares | Amount | |||||||||||||||||||||||||||||||||||||||||||||||||||||||||||||||||||||||||||||||
| Balance as of January 1, 2020 | 81,847 | $ | 83 | $ | 735,545 | $ | (146,830) | $ | 2,723 | $ | 591,521 | $ | — | |||||||||||||||||||||||||||||||||||||||||||||||||||||||||||||||||||
| Issuance of common shares | 10,735 | 12 | 112,179 | — | — | 112,191 | — | |||||||||||||||||||||||||||||||||||||||||||||||||||||||||||||||||||||||||
| Distributions declared | — | — | — | (12,401) | — | (12,401) | (3) | |||||||||||||||||||||||||||||||||||||||||||||||||||||||||||||||||||||||||
| Redemption of common shares | (464) | — | (5,395) | — | — | (5,395) | — | |||||||||||||||||||||||||||||||||||||||||||||||||||||||||||||||||||||||||
| Selling commissions, dealer manager fees and distribution and stockholder servicing fees | — | — | (6,240) | — | — | (6,240) | — | |||||||||||||||||||||||||||||||||||||||||||||||||||||||||||||||||||||||||
| Offering costs | — | — | (863) | — | — | (863) | — | |||||||||||||||||||||||||||||||||||||||||||||||||||||||||||||||||||||||||
| Net income (loss) | — | — | — | 41,749 | — | 41,749 | 3 | |||||||||||||||||||||||||||||||||||||||||||||||||||||||||||||||||||||||||
| Foreign currency translation adjustment | — | — | — | — | (15,613) | (15,613) | — | |||||||||||||||||||||||||||||||||||||||||||||||||||||||||||||||||||||||||
| Balance as of March 31, 2020 | 92,118 | $ | 95 | $ | 835,226 | $ | (117,482) | $ | (12,890) | $ | 704,949 | $ | — | |||||||||||||||||||||||||||||||||||||||||||||||||||||||||||||||||||
| Issuance of common shares | 4,822 | 3 | 49,404 | — | — | 49,407 | — | |||||||||||||||||||||||||||||||||||||||||||||||||||||||||||||||||||||||||
| Distributions declared | — | — | — | (13,452) | — | (13,452) | (4) | |||||||||||||||||||||||||||||||||||||||||||||||||||||||||||||||||||||||||
| Redemption of common shares | (1,037) | (1) | (11,399) | — | — | (11,400) | — | |||||||||||||||||||||||||||||||||||||||||||||||||||||||||||||||||||||||||
| Selling commissions, dealer manager fees and distribution and stockholder servicing fees | — | — | (4,009) | — | — | (4,009) | — | |||||||||||||||||||||||||||||||||||||||||||||||||||||||||||||||||||||||||
| Offering costs | — | — | (987) | — | — | (987) | — | |||||||||||||||||||||||||||||||||||||||||||||||||||||||||||||||||||||||||
| Net income (loss) | — | — | — | 73,536 | — | 73,536 | 4 | |||||||||||||||||||||||||||||||||||||||||||||||||||||||||||||||||||||||||
| Foreign currency translation adjustment | — | — | — | — | 2,323 | 2,323 | — | |||||||||||||||||||||||||||||||||||||||||||||||||||||||||||||||||||||||||
| Foreign currency translation adjustment reclassified into earnings | — | — | — | — | 3,160 | 3,160 | — | |||||||||||||||||||||||||||||||||||||||||||||||||||||||||||||||||||||||||
| Balance as of June 30, 2020 | 95,903 | $ | 97 | $ | 868,235 | $ | (57,398) | $ | (7,407) | $ | 803,527 | $ | — | |||||||||||||||||||||||||||||||||||||||||||||||||||||||||||||||||||
| Hines Global Income Trust, Inc. Stockholders | Hines Global Income Trust, Inc. Stockholders | Hines Global Income Trust, Inc. Stockholders | ||||||||||||||||||||||||||||||||||||||||||||||||||||||||||||||||||||||||||||||||||||||||||||||||||||||||
| Common Shares | Additional Paid-in Capital | Accumulated Distributions in Excess of Earnings | Accumulated Other Comprehensive Income (Loss) | Total Stockholders’ Equity | Noncontrolling Interests | Common Shares | Additional Paid-in Capital | Accumulated Distributions in Excess of Earnings | Accumulated Other Comprehensive Income (Loss) | Total Stockholders’ Equity | Noncontrolling Interests | |||||||||||||||||||||||||||||||||||||||||||||||||||||||||||||||||||||||||||||||||||||||||||||||
| Shares | Amount | Shares | Amount | |||||||||||||||||||||||||||||||||||||||||||||||||||||||||||||||||||||||||||||||||||||||||||||||||||||||
| Balance as of January 1, 2019 | 43,584 | $ | 44 | $ | 371,274 | $ | (91,711 | ) | $ | (874 | ) | $ | 278,733 | $ | — | Balance as of January 1, 2019 | 43,584 | $ | 44 | $ | 371,274 | $ | (91,711) | $ | (874) | $ | 278,733 | $ | — | |||||||||||||||||||||||||||||||||||||||||||||||||||||||||||||||||||||||||||||
| Issuance of common shares | 6,109 | 7 | 62,886 | — | — | 62,893 | — | Issuance of common shares | 6,109 | 7 | 62,886 | — | — | 62,893 | — | |||||||||||||||||||||||||||||||||||||||||||||||||||||||||||||||||||||||||||||||||||||||||||
| Distributions declared | — | — | — | (6,704 | ) | — | (6,704 | ) | (3 | ) | Distributions declared | — | — | — | (6,704) | — | (6,704) | (3) | ||||||||||||||||||||||||||||||||||||||||||||||||||||||||||||||||||||||||||||||||||||||||
| Redemption of common shares | (362 | ) | — | (4,014 | ) | — | — | (4,014 | ) | — | Redemption of common shares | (362) | — | (4,014) | — | — | (4,014) | — | ||||||||||||||||||||||||||||||||||||||||||||||||||||||||||||||||||||||||||||||||||||||||
| Selling commissions, dealer manager fees and distribution and stockholder servicing fees | — | — | (4,366 | ) | — | — | (4,366 | ) | — | Selling commissions, dealer manager fees and distribution and stockholder servicing fees | — | — | (4,366) | — | — | (4,366) | — | |||||||||||||||||||||||||||||||||||||||||||||||||||||||||||||||||||||||||||||||||||||||||
| Offering costs | — | — | (1,240 | ) | — | — | (1,240 | ) | — | Offering costs | — | — | (1,240) | — | — | (1,240) | — | |||||||||||||||||||||||||||||||||||||||||||||||||||||||||||||||||||||||||||||||||||||||||
| Net income (loss) | — | — | — | (4,002 | ) | — | (4,002 | ) | 3 | Net income (loss) | — | — | — | (4,002) | — | (4,002) | 3 | |||||||||||||||||||||||||||||||||||||||||||||||||||||||||||||||||||||||||||||||||||||||||
| Foreign currency translation adjustment | — | — | — | — | (2,020 | ) | (2,020 | ) | — | Foreign currency translation adjustment | — | — | — | — | (2,020) | (2,020) | — | |||||||||||||||||||||||||||||||||||||||||||||||||||||||||||||||||||||||||||||||||||||||||
| Balance as of March 31, 2019 | 49,331 | $ | 51 | $ | 424,540 | $ | (102,417 | ) | $ | (2,894 | ) | $ | 319,280 | $ | — | Balance as of March 31, 2019 | 49,331 | $ | 51 | $ | 424,540 | $ | (102,417) | $ | (2,894) | $ | 319,280 | $ | — | |||||||||||||||||||||||||||||||||||||||||||||||||||||||||||||||||||||||||||||
| Issuance of common shares | 11,785 | 11 | 121,908 | — | — | 121,919 | — | Issuance of common shares | 11,785 | 11 | 121,908 | — | — | 121,919 | — | |||||||||||||||||||||||||||||||||||||||||||||||||||||||||||||||||||||||||||||||||||||||||||
| Distributions declared | — | — | — | (8,062 | ) | — | (8,062 | ) | (4 | ) | Distributions declared | — | — | — | (8,062) | — | (8,062) | (4) | ||||||||||||||||||||||||||||||||||||||||||||||||||||||||||||||||||||||||||||||||||||||||
| Redemption of common shares | (402 | ) | — | (3,111 | ) | — | — | (3,111 | ) | — | Redemption of common shares | (402) | — | (3,111) | — | — | (3,111) | — | ||||||||||||||||||||||||||||||||||||||||||||||||||||||||||||||||||||||||||||||||||||||||
| Selling commissions, dealer manager fees and distribution and stockholder servicing fees | — | — | (8,511 | ) | — | — | (8,511 | ) | — | Selling commissions, dealer manager fees and distribution and stockholder servicing fees | — | — | (8,511) | — | — | (8,511) | — | |||||||||||||||||||||||||||||||||||||||||||||||||||||||||||||||||||||||||||||||||||||||||
| Offering costs | — | — | (1,048 | ) | — | — | (1,048 | ) | — | Offering costs | — | — | (1,048) | — | — | (1,048) | — | |||||||||||||||||||||||||||||||||||||||||||||||||||||||||||||||||||||||||||||||||||||||||
| Net income (loss) | — | — | — | (3,454 | ) | — | (3,454 | ) | 4 | Net income (loss) | — | — | — | (3,454) | — | (3,454) | 4 | |||||||||||||||||||||||||||||||||||||||||||||||||||||||||||||||||||||||||||||||||||||||||
| Foreign currency translation adjustment | — | — | — | — | 2,091 | 2,091 | — | Foreign currency translation adjustment | — | — | — | — | 2,091 | 2,091 | — | |||||||||||||||||||||||||||||||||||||||||||||||||||||||||||||||||||||||||||||||||||||||||||
| Balance as of June 30, 2019 | 60,714 | $ | 62 | $ | 533,778 | $ | (113,933 | ) | $ | (803 | ) | $ | 419,104 | $ | — | Balance as of June 30, 2019 | 60,714 | $ | 62 | $ | 533,778 | $ | (113,933) | $ | (803) | $ | 419,104 | $ | — | |||||||||||||||||||||||||||||||||||||||||||||||||||||||||||||||||||||||||||||
| Hines Global Income Trust, Inc. Stockholders | ||||||||||||||||||||||||||
| Common Shares | Additional Paid-in Capital | Accumulated Distributions in Excess of Earnings | Accumulated Other Comprehensive Income (Loss) | Total Stockholders’ Equity | Noncontrolling Interests | |||||||||||||||||||||
| Shares | Amount | |||||||||||||||||||||||||
| Balance as of January 1, 2018 | 39,256 | $ | 39 | $ | 336,761 | $ | (68,193 | ) | $ | 4,938 | $ | 273,545 | $ | — | ||||||||||||
| Issuance of common shares | 308 | — | 2,990 | — | — | 2,990 | — | |||||||||||||||||||
| Distributions declared | — | — | — | (5,514 | ) | — | (5,514 | ) | (3 | ) | ||||||||||||||||
| Redemption of common shares | (133 | ) | — | (2,032 | ) | — | — | (2,032 | ) | — | ||||||||||||||||
| Selling commissions, dealer manager fees and distribution and stockholder servicing fees | — | — | 4 | — | — | 4 | — | |||||||||||||||||||
| Offering costs | — | — | (17 | ) | — | — | (17 | ) | — | |||||||||||||||||
| Net income (loss) | — | — | — | 11,373 | — | 11,373 | 3 | |||||||||||||||||||
| Foreign currency translation adjustment | — | — | — | — | 2,716 | 2,716 | — | |||||||||||||||||||
| Balance as of March 31, 2018 | 39,431 | $ | 39 | $ | 337,706 | $ | (62,334 | ) | $ | 7,654 | $ | 283,065 | $ | — | ||||||||||||
| Issuance of common shares | 464 | 1 | 4,598 | — | — | 4,599 | — | |||||||||||||||||||
| Distributions declared | — | — | — | (5,528 | ) | — | (5,528 | ) | (3 | ) | ||||||||||||||||
| Redemption of common shares | (395 | ) | — | (4,212 | ) | — | — | (4,212 | ) | — | ||||||||||||||||
| Selling commissions, dealer manager fees and distribution and stockholder servicing fees | — | — | (28 | ) | — | — | (28 | ) | — | |||||||||||||||||
| Offering costs | — | — | (1,627 | ) | — | — | (1,627 | ) | — | |||||||||||||||||
| Net income (loss) | — | — | — | (1,411 | ) | — | (1,411 | ) | 3 | |||||||||||||||||
| Foreign currency translation adjustment | — | — | — | — | (5,515 | ) | (5,515 | ) | — | |||||||||||||||||
| Balance as of June 30, 2018 | 39,500 | $ | 40 | $ | 336,437 | $ | (69,273 | ) | $ | 2,139 | $ | 269,343 | $ | — | ||||||||||||
| 2020 | 2019 | ||||||||||||||||
| (In thousands) | |||||||||||||||||
| CASH FLOWS FROM OPERATING ACTIVITIES: | |||||||||||||||||
| Net income (loss) | $ | 115,292 | $ | (7,449) | |||||||||||||
| Adjustments to reconcile net income (loss) to net cash from (used in) operating activities: | |||||||||||||||||
| Depreciation and amortization | 31,842 | 19,673 | |||||||||||||||
| Gain on sale of real estate | (130,101) | — | |||||||||||||||
| Foreign currency (gains) losses | 1,145 | 336 | |||||||||||||||
| (Gain) loss on derivative instruments | (8,470) | 1,187 | |||||||||||||||
| (Gain) loss on investments in real estate-related securities | 4,601 | (1,327) | |||||||||||||||
| Changes in assets and liabilities: | |||||||||||||||||
| Change in other assets | (4,453) | (683) | |||||||||||||||
| Change in tenant and other receivables | (3,016) | (2,032) | |||||||||||||||
| Change in deferred leasing costs | (2,691) | (5,616) | |||||||||||||||
| Change in accounts payable and accrued expenses | (569) | (3,629) | |||||||||||||||
| Change in other liabilities | (6,510) | (5,958) | |||||||||||||||
| Change in due to affiliates | (8,941) | (2,680) | |||||||||||||||
| Net cash from (used in) operating activities | (11,871) | (8,178) | |||||||||||||||
| CASH FLOWS FROM INVESTING ACTIVITIES: | |||||||||||||||||
| Investments in acquired properties and lease intangibles | (164,096) | (182,714) | |||||||||||||||
| Capital expenditures at operating properties | (4,613) | (3,886) | |||||||||||||||
| Proceeds from sale of real estate | 340,532 | — | |||||||||||||||
| Purchases of real estate-related securities | (24,575) | (14,086) | |||||||||||||||
| Proceeds from settlement of real estate-related securities | 18,812 | 5,180 | |||||||||||||||
| Net cash from (used in) investing activities | 166,060 | (195,506) | |||||||||||||||
| CASH FLOWS FROM FINANCING ACTIVITIES: | |||||||||||||||||
| Proceeds from issuance of common shares | 147,932 | 177,269 | |||||||||||||||
| Redemption of common shares | (14,985) | (7,704) | |||||||||||||||
| Payment of offering costs | (2,850) | (2,734) | |||||||||||||||
| Payment of selling commissions, dealer manager fees and distribution and stockholder servicing fees | (5,516) | (5,570) | |||||||||||||||
| Distributions paid to stockholders and noncontrolling interests | (11,575) | (6,394) | |||||||||||||||
| Proceeds from notes payable | 75,970 | 109,935 | |||||||||||||||
| Payments on notes payable | (248,750) | (957) | |||||||||||||||
| Proceeds from related party note payable | — | 44,000 | |||||||||||||||
| Payments on related party note payable | (75,000) | (99,000) | |||||||||||||||
| Change in security deposit liability | 736 | 250 | |||||||||||||||
| Deferred financing costs paid | (404) | (631) | |||||||||||||||
| Payments related to interest rate contracts | — | (39) | |||||||||||||||
| Net cash from (used in) financing activities | (134,442) | 208,425 | |||||||||||||||
| Effect of exchange rate changes on cash, restricted cash and cash equivalents | 1,495 | (348) | |||||||||||||||
| Net change in cash, restricted cash and cash equivalents | 21,242 | 4,393 | |||||||||||||||
| Cash, restricted cash and cash equivalents, beginning of period | 56,438 | 36,986 | |||||||||||||||
| Cash, restricted cash and cash equivalents, end of period | $ | 77,680 | $ | 41,379 | |||||||||||||
| 2019 | 2018 | ||||||
| (In thousands) | |||||||
| CASH FLOWS FROM OPERATING ACTIVITIES: | |||||||
| Net income (loss) | $ | (7,449 | ) | $ | 9,968 | ||
| Adjustments to reconcile net income (loss) to net cash from (used in) operating activities: | |||||||
| Depreciation and amortization | 19,673 | 14,307 | |||||
| Gain on sale of real estate | — | (14,491 | ) | ||||
| Foreign currency (gains) losses | 336 | 316 | |||||
| (Gain) loss on derivative instruments | 1,187 | 47 | |||||
| (Gain) loss on investments in real estate-related securities | (1,327 | ) | — | ||||
| Changes in assets and liabilities: | |||||||
| Change in other assets | (683 | ) | 384 | ||||
| Change in tenant and other receivables | (2,032 | ) | 1,933 | ||||
| Change in deferred leasing costs | (5,616 | ) | (4,335 | ) | |||
| Change in accounts payable and accrued expenses | (3,629 | ) | (198 | ) | |||
| Change in other liabilities | (5,958 | ) | (2,947 | ) | |||
| Change in due to affiliates | (2,680 | ) | 1,755 | ||||
| Net cash from (used in) operating activities | (8,178 | ) | 6,739 | ||||
| CASH FLOWS FROM INVESTING ACTIVITIES: | |||||||
| Investments in acquired properties and lease intangibles | (182,714 | ) | — | ||||
| Capital expenditures at operating properties | (3,886 | ) | (8,095 | ) | |||
| Proceeds from sale of real estate | — | 37,087 | |||||
| Purchases of real estate-related securities | (14,086 | ) | — | ||||
| Proceeds from settlement of real estate-related securities | 5,180 | — | |||||
| Net cash from (used in) investing activities | (195,506 | ) | 28,992 | ||||
| CASH FLOWS FROM FINANCING ACTIVITIES: | |||||||
| Proceeds from issuance of common shares | 177,269 | 1,628 | |||||
| Redemption of common shares | (7,704 | ) | (5,174 | ) | |||
| Payment of offering costs | (2,734 | ) | — | ||||
| Payment of selling commissions, dealer manager fees and distribution and stockholder servicing fees | (5,570 | ) | (1,322 | ) | |||
| Distributions paid to stockholders and noncontrolling interests | (6,394 | ) | (5,111 | ) | |||
| Proceeds from notes payable | 109,935 | — | |||||
| Payments on notes payable | (957 | ) | (844 | ) | |||
| Proceeds from related party note payable | 44,000 | 15,500 | |||||
| Payments on related party note payable | (99,000 | ) | (26,700 | ) | |||
| Change in security deposit liability | 250 | 100 | |||||
| Deferred financing costs paid | (631 | ) | (127 | ) | |||
| Payments related to interest rate contracts | (39 | ) | (10 | ) | |||
| Net cash from (used in) financing activities | 208,425 | (22,060 | ) | ||||
| Effect of exchange rate changes on cash, restricted cash and cash equivalents | (348 | ) | (1,087 | ) | |||
| Net change in cash, restricted cash and cash equivalents | 4,393 | 12,584 | |||||
| Cash, restricted cash and cash equivalents, beginning of period | 36,986 | 24,553 | |||||
| Cash, restricted cash and cash equivalents, end of period | $ | 41,379 | $ | 37,137 | |||
| Gain (Loss) Recorded on Investments in Real Estate-Related Securities | ||||||||||||||||||||||||||||||||||||||||||||
| Three months ended June 30, | Six months ended June 30, | |||||||||||||||||||||||||||||||||||||||||||
| 2020 | 2019 | 2020 | 2019 | |||||||||||||||||||||||||||||||||||||||||
| Unrealized gain (loss) | $ | 4,548 | $ | (4) | $ | (2,839) | $ | 1,099 | ||||||||||||||||||||||||||||||||||||
| Realized gain (loss) | (1,412) | 165 | (1,762) | 228 | ||||||||||||||||||||||||||||||||||||||||
| Total gain (loss) on real estate-related securities | $ | 3,136 | $ | 161 | $ | (4,601) | $ | 1,327 | ||||||||||||||||||||||||||||||||||||
| June 30, 2020 | December 31, 2019 | ||||||||||||||||
| Prepaid insurance | $ | 1,151 | $ | 726 | |||||||||||||
| Prepaid property taxes | 634 | 589 | |||||||||||||||
Deferred tax assets (1) | 5,160 | 2,973 | |||||||||||||||
| Other | 3,162 | (2) | 932 | ||||||||||||||
| Other assets | $ | 10,107 | $ | 5,220 | (3) | ||||||||||||
| June 30, 2019 | December 31, 2018 | |||||||
| Prepaid insurance | $ | 806 | $ | 493 | ||||
| Prepaid property taxes | 347 | 80 | ||||||
Deferred tax assets (1) | 979 | 844 | ||||||
| Other | 880 | 490 | ||||||
| Other assets | $ | 3,012 | $ | 1,907 | ||||
| June 30, 2020 | December 31, 2019 | |||||||||||||
| Buildings and improvements | $ | 1,008,292 | $ | 1,077,207 | ||||||||||
| Less: accumulated depreciation | (46,984) | (51,719) | ||||||||||||
| Buildings and improvements, net | 961,308 | 1,025,488 | ||||||||||||
| Land | 304,816 | 278,639 | ||||||||||||
| Investment property, net | $ | 1,266,124 | $ | 1,304,127 | (1) | |||||||||
| June 30, 2019 | December 31, 2018 | ||||||
Buildings and improvements (1) | $ | 773,380 | $ | 693,834 | |||
| Less: accumulated depreciation | (40,003 | ) | (30,574 | ) | |||
| Buildings and improvements, net | 733,377 | 663,260 | |||||
| Land | 184,285 | 123,929 | |||||
| Investment property, net | $ | 917,662 | $ | 787,189 | |||
| Property Name | Acquisition Date | Building and Improvements (1) | Land (1) | In-place Lease Intangibles (1) | Out-of-Market Lease Intangibles, Net (1) | Total (1) | ||||||||||||||||||||||||||||||||
| The Emerson | 1/24/2020 | $ | 97,659 | $ | 17,725 | $ | 2,197 | $ | — | $ | 117,581 | |||||||||||||||||||||||||||
| Bratzler ABC Westland | 2/19/2020 | $ | 7,181 | $ | 5,704 | $ | 816 | $ | — | $ | 13,701 | |||||||||||||||||||||||||||
| Madrid Airport Complex | 6/19/2020 | $ | 3,807 | $ | 20,469 | $ | 9,787 | $ | — | $ | 34,063 | |||||||||||||||||||||||||||
| Building and Improvements | Land | In-place Lease Intangibles | Out-of-Market Lease Intangibles, Net | Total | ||||
| $74,059 | (1) | $59,664 | $6,902 | $(1,124) | $139,501 | |||
| Lease Intangibles | |||||||||||||||||||||||||||||
| In-Place Leases | Out-of-Market Lease Assets | Out-of-Market Lease Liabilities | |||||||||||||||||||||||||||
| Cost | $ | 123,640 | $ | 6,631 | $ | (22,428) | |||||||||||||||||||||||
| Less: accumulated amortization | (46,620) | (1,728) | 5,563 | ||||||||||||||||||||||||||
| Net | $ | 77,020 | $ | 4,903 | $ | (16,865) | |||||||||||||||||||||||
| Lease Intangibles | |||||||||||
In-Place Leases (1) | Out-of-Market Lease Assets | Out-of-Market Lease Liabilities | |||||||||
| Cost | $ | 87,802 | $ | 5,692 | $ | (23,458 | ) | ||||
| Less: accumulated amortization | (36,950 | ) | (2,458 | ) | 5,168 | ||||||
| Net | $ | 50,852 | $ | 3,234 | $ | (18,290 | ) | ||||
| Lease Intangibles | |||||||||||||||||||||||||||||
| In-Place Leases | Out-of-Market Lease Assets | Out-of-Market Lease Liabilities | |||||||||||||||||||||||||||
| Cost | $ | 136,215 | $ | 8,957 | $ | (25,579) | |||||||||||||||||||||||
| Less: accumulated amortization | (43,808) | (2,827) | 5,946 | ||||||||||||||||||||||||||
| Net | $ | 92,407 | $ | 6,130 | $ | (19,633) | |||||||||||||||||||||||
| Lease Intangibles | |||||||||||
| In-Place Leases | Out-of-Market Lease Assets | Out-of-Market Lease Liabilities | |||||||||
| Cost | $ | 118,585 | $ | 5,558 | $ | (22,318 | ) | ||||
| Less: accumulated amortization | (31,320 | ) | (2,126 | ) | 4,284 | ||||||
| Net | $ | 87,265 | $ | 3,432 | $ | (18,034 | ) | ||||
| In-Place Lease | Out-of-Market Leases, Net | ||||||||||
| July 1, 2020 through December 31, 2020 | $ | 11,532 | $ | (576) | |||||||
| 2021 | $ | 15,853 | $ | (1,244) | |||||||
| 2022 | $ | 12,910 | $ | (1,102) | |||||||
| 2023 | $ | 8,239 | $ | (875) | |||||||
| 2024 | $ | 5,108 | $ | (684) | |||||||
| 2025 | $ | 4,547 | $ | (668) | |||||||
| In-Place Lease | Out-of-Market Leases, Net | ||||||
| July 1, 2019 through December 31, 2019 | $ | 7,462 | $ | (1,026 | ) | ||
| 2020 | $ | 11,770 | $ | (1,673 | ) | ||
| 2021 | $ | 7,388 | $ | (1,495 | ) | ||
| 2022 | $ | 4,741 | $ | (1,314 | ) | ||
| 2023 | $ | 4,172 | $ | (988 | ) | ||
| Fixed Future Minimum Rentals | |||||
| July 1, 2020 through December 31, 2020 | $ | 35,708 | |||
| 2021 | 65,524 | ||||
| 2022 | 54,198 | ||||
| 2023 | 45,079 | ||||
| 2024 | 37,856 | ||||
| 2025 | 34,295 | ||||
| Thereafter | 147,763 | ||||
| Total | $ | 420,423 | |||
| Fixed Future Minimum Rentals | |||
| July 1, 2019 through December 31, 2019 | $ | 31,699 | |
| 2020 | 58,037 | ||
| 2021 | 50,520 | ||
| 2022 | 42,001 | ||
| 2023 | 39,174 | ||
| Thereafter | 199,061 | ||
| Total | $ | 420,492 | |
| Description | Origination or Assumption Date | Maturity Date | Maximum Capacity in Functional Currency | Interest Rate Description | Interest Rate as of June 30, 2020 | Principal Outstanding at June 30, 2020 | Principal Outstanding at December 31, 2019 | ||||||||||||||||||||||||||||||||||||||||||||||
| Secured Mortgage Debt | |||||||||||||||||||||||||||||||||||||||||||||||||||||
| Bishop's Square | 3/3/2015 | 3/2/2022 | (3) | € | 55,200 | Euribor + 1.30% (1) | N/A | $ | — | $ | 61,907 | ||||||||||||||||||||||||||||||||||||||||||
| Domain Apartments | 1/29/2016 | 1/29/2020 | (4) | $ | 34,300 | Libor + 1.60% (1) | N/A | — | 34,300 | (7) | |||||||||||||||||||||||||||||||||||||||||||
| Cottonwood Corporate Center | 7/5/2016 | 8/1/2023 | $ | 78,000 | Fixed | 2.98% | 71,464 | 72,359 | |||||||||||||||||||||||||||||||||||||||||||||
| Goodyear Crossing II | 8/18/2016 | 8/18/2021 | (5) | $ | 29,000 | Libor + 2.00% | N/A | — | 29,000 | ||||||||||||||||||||||||||||||||||||||||||||
| Rookwood Commons | 1/6/2017 | 7/1/2023 | (6) | $ | 67,000 | Fixed | 3.13% | 67,000 | 67,000 | ||||||||||||||||||||||||||||||||||||||||||||
| Rookwood Pavilion | 1/6/2017 | 7/1/2023 | (6) | $ | 29,000 | Fixed | 2.87% | 29,000 | 29,000 | ||||||||||||||||||||||||||||||||||||||||||||
| Montrose Student Residences | 3/24/2017 | 3/23/2022 | € | 22,605 | Euribor + 1.85% (1) | 2.00% | 25,381 | 25,352 | |||||||||||||||||||||||||||||||||||||||||||||
| Queen's Court Student Residences | 12/18/2017 | 12/18/2022 | £ | 29,500 | Libor + 2.00% (1) | 2.49% | 36,362 | 38,896 | |||||||||||||||||||||||||||||||||||||||||||||
| Venue Museum District | 9/21/2018 | 10/9/2020 | $ | 45,000 | Libor + 1.95% (1) | 4.02% | 45,000 | 45,000 | |||||||||||||||||||||||||||||||||||||||||||||
| Fresh Park Venlo | 10/3/2018 | 8/15/2023 | € | 75,000 | Euribor + 1.50% (1) | 1.50% | 84,190 | 84,092 | |||||||||||||||||||||||||||||||||||||||||||||
| Maintal Logistics | 2/21/2019 | 2/28/2024 | € | 23,500 | Euribor + 1.10% (1) | 1.10% | 26,034 | 26,136 | |||||||||||||||||||||||||||||||||||||||||||||
| ABC Westland | 5/3/2019 | 2/15/2024 | € | 75,000 | Euribor + 1.50% (1) | 1.50% | 81,291 | 82,655 | |||||||||||||||||||||||||||||||||||||||||||||
| Łódź Urban Logistics | 9/20/2019 | 9/20/2024 | € | 13,600 | Fixed (2) | 1.05% | 15,143 | 15,211 | |||||||||||||||||||||||||||||||||||||||||||||
| Glasgow West End | 9/26/2019 | 9/26/2024 | £ | 43,200 | Libor + 1.80% (1) | 2.19% | 53,248 | 56,959 | |||||||||||||||||||||||||||||||||||||||||||||
| Gdańsk PL II | 10/4/2019 | 9/20/2024 | € | 16,800 | Fixed (2) | 1.05% | 18,706 | 18,790 | |||||||||||||||||||||||||||||||||||||||||||||
| Madrid Airport Complex | 6/19/2020 | 6/19/2023 | € | 15,150 | Fixed | 2.80% | 17,010 | — | |||||||||||||||||||||||||||||||||||||||||||||
| Other Notes Payable | |||||||||||||||||||||||||||||||||||||||||||||||||||||
| JPMorgan Chase Revolving Credit Facility | 9/13/2019 | 11/15/2022 | $ | 275,000 | Variable | 1.69% | 40,000 | 104,000 | |||||||||||||||||||||||||||||||||||||||||||||
| Notes Payable | $ | 609,829 | $ | 790,657 | |||||||||||||||||||||||||||||||||||||||||||||||||
| Affiliate Note Payable | |||||||||||||||||||||||||||||||||||||||||||||||||||||
| Credit Facility with Hines | 10/2/2017 | 12/31/2020 | $ | 75,000 | Variable | 1.78% | — | 75,000 | |||||||||||||||||||||||||||||||||||||||||||||
| Total Note Payable to Affiliate | $ | — | $ | 75,000 | |||||||||||||||||||||||||||||||||||||||||||||||||
| Total Principal Outstanding | $ | 609,829 | $ | 865,657 | |||||||||||||||||||||||||||||||||||||||||||||||||
| Unamortized discount | — | (104) | |||||||||||||||||||||||||||||||||||||||||||||||||||
| Unamortized financing fees | (4,434) | (4,126) | |||||||||||||||||||||||||||||||||||||||||||||||||||
| Total | $ | 605,395 | $ | 861,427 | |||||||||||||||||||||||||||||||||||||||||||||||||
| Description | Origination or Assumption Date | Maturity Date | Maximum Capacity in Functional Currency | Interest Rate Description | Interest Rate as of June 30, 2019 | Principal Outstanding at June 30, 2019 | Principal Outstanding at December 31, 2018 | |||||||||||||
| Secured Mortgage Debt | ||||||||||||||||||||
| Bishop's Square | 3/3/2015 | 3/2/2022 | € | 55,200 | Euribor + 1.30% (1) | 1.30% | $ | 62,740 | $ | 63,171 | ||||||||||
| Domain Apartments | 1/29/2016 | 1/29/2020 | $ | 34,300 | Libor + 1.60% | 4.00% | 34,300 | 34,300 | ||||||||||||
| Cottonwood Corporate Center | 7/5/2016 | 8/1/2023 | $ | 78,000 | Fixed | 2.98% | 73,241 | 74,110 | ||||||||||||
| Goodyear Crossing II | 8/18/2016 | 8/18/2021 | $ | 29,000 | Libor + 2.00% | 4.44% | 29,000 | 29,000 | ||||||||||||
| Rookwood Commons | 1/6/2017 | 7/1/2020 | $ | 67,000 | Fixed | 3.13% | 67,000 | 67,000 | ||||||||||||
| Rookwood Pavilion | 1/6/2017 | 7/1/2020 | $ | 29,000 | Fixed | 2.87% | 29,000 | 29,000 | ||||||||||||
| Montrose Student Residences | 3/24/2017 | 3/23/2022 | € | 22,605 | Euribor + 1.85% (2) | 1.85% | 25,693 | 25,869 | ||||||||||||
| Queen's Court Student Residences | 12/18/2017 | 12/18/2022 | £ | 29,500 | Libor + 2.00% (3) | 2.88% | 37,436 | 37,565 | ||||||||||||
| Venue Museum District | 9/21/2018 | 10/9/2020 | $ | 45,000 | Libor + 1.95% (4) | 4.36% | 45,000 | 45,000 | ||||||||||||
| Fresh Park Venlo | 10/3/2018 | 8/15/2023 | € | 75,000 | Euribor + 1.50% (5) | 1.50% | 85,225 | 85,809 | ||||||||||||
| Maintal Logistics | 2/21/2019 | 2/28/2024 | € | 23,500 | Euribor + 1.10% (6) | 1.10% | 26,621 | — | ||||||||||||
| ABC Westland | 5/3/2019 | 2/15/2024 | € | 75,000 | Euribor + 1.50% (7) | 1.50% | 85,245 | — | ||||||||||||
| Notes Payable | $ | 600,501 | $ | 490,824 | ||||||||||||||||
| Affiliate Note Payable | ||||||||||||||||||||
| Credit Facility with Hines | 10/2/2017 | 12/31/2019 | $ | 75,000 | Variable | N/A | — | 55,000 | ||||||||||||
| Total Note Payable to Affiliate | $ | — | $ | 55,000 | ||||||||||||||||
| Total Principal Outstanding | $ | 600,501 | $ | 545,824 | ||||||||||||||||
| Unamortized discount | (210 | ) | (316 | ) | ||||||||||||||||
| Unamortized financing fees | (3,479 | ) | (3,069 | ) | ||||||||||||||||
| Total | $ | 596,812 | $ | 542,439 | ||||||||||||||||
| Payments Due by Year | |||||||||||||||||||||||||||||||||||||||||||||||||||||||||||||||||
| July 1, 2020 through December 31, 2020 | 2021 | 2022 | 2023 | 2024 | Thereafter | ||||||||||||||||||||||||||||||||||||||||||||||||||||||||||||
| Principal payments | $ | 144,789 | (1) | $ | 7,658 | $ | 109,406 | $ | 165,888 | $ | 182,088 | $ | — | ||||||||||||||||||||||||||||||||||||||||||||||||||||
| Payments Due by Year | |||||||||||||||||||||||
| July 1, 2019 through December 31, 2019 | 2020 | 2021 | 2022 | 2023 | Thereafter | ||||||||||||||||||
| Principal payments | $ | 994 | $ | 177,388 | $ | 31,143 | $ | 128,068 | $ | 152,289 | $ | 110,619 | |||||||||||
| Interest Rate Contracts | ||||||||||||||||||||||||||||||||||||||||||||||||||
| Type | Property | Effective Date | Expiration Date | Maximum Capacity of Debt in Functional Currency | Notional Amount | Interest Rate Received | Pay Rate /Strike Rate | |||||||||||||||||||||||||||||||||||||||||||
| Interest rate cap | Montrose Student Residences | March 24, 2017 | March 23, 2022 | € | 22,605 | € | 16,954 | Euribor | 1.25 | % | ||||||||||||||||||||||||||||||||||||||||
| Interest rate cap | Queen’s Court Student Residences | December 20, 2017 | December 20, 2020 | £ | 29,500 | £ | 22,125 | LIBOR | 2.00 | % | ||||||||||||||||||||||||||||||||||||||||
| Interest rate cap | Venue Museum District | September 21, 2018 | October 9, 2020 | $ | 45,000 | $ | 45,000 | LIBOR | 3.50 | % | ||||||||||||||||||||||||||||||||||||||||
| Interest rate cap | Fresh Park Venlo | October 8, 2018 | August 15, 2023 | € | 75,000 | € | 52,487 | Euribor | 2.00 | % | ||||||||||||||||||||||||||||||||||||||||
| Interest rate cap | Maintal Logistics | February 28, 2019 | February 28, 2024 | € | 23,500 | € | 16,450 | Euribor | 2.00 | % | ||||||||||||||||||||||||||||||||||||||||
| Interest rate cap | ABC Westland | May 3, 2019 | February 15, 2024 | € | 75,000 | € | 52,500 | Euribor | 1.00 | % | ||||||||||||||||||||||||||||||||||||||||
| Interest rate swap | Łódź Urban Logistics | October 10, 2019 | September 20, 2024 | € | 13,600 | € | 13,600 | Euribor | (0.36) | % | ||||||||||||||||||||||||||||||||||||||||
| Interest rate swap | Gdańsk PL II | October 10, 2019 | September 20, 2024 | € | 16,800 | € | 16,800 | Euribor | (0.36) | % | ||||||||||||||||||||||||||||||||||||||||
| Interest rate cap | Glasgow West End | September 27, 2019 | September 24, 2024 | £ | 43,200 | £ | 32,400 | LIBOR | 2.00 | % | ||||||||||||||||||||||||||||||||||||||||
| Interest Rate Cap Contracts | |||||||||||||
| Property | Effective Date | Expiration Date | Notional Amount (1) | Interest Rate Received | Pay Rate /Strike Rate | ||||||||
| Bishop’s Square | March 3, 2015 | April 25, 2020 | $ | 62,735 | Euribor | 2.00 | % | ||||||
| Montrose Student Residences | March 24, 2017 | March 23, 2022 | $ | 19,268 | Euribor | 1.25 | % | ||||||
| Queen’s Court Student Residences | December 20, 2017 | December 20, 2020 | $ | 28,077 | LIBOR | 2.00 | % | ||||||
| Venue Museum District | September 21, 2018 | October 9, 2020 | $ | 45,000 | LIBOR | 3.50 | % | ||||||
| Fresh Park Venlo | October 8, 2018 | August 15, 2023 | $ | 59,652 | Euribor | 2.00 | % | ||||||
| Maintal Logistics | February 28, 2019 | February 28, 2024 | $ | 18,695 | Euribor | 2.00 | % | ||||||
| ABC Westland | May 3, 2019 | February 15, 2024 | $ | 58,800 | Euribor | 1.00 | % | ||||||
| Foreign Currency Forward Contracts | ||||||||||||||||||||||||||||||||
| Effective Date | Expiration Date | Notional Amount | Buy/Sell | Traded Currency Rate | ||||||||||||||||||||||||||||
| October 24, 2019 | February 28, 2020 | £ | 31,000 | USD/GBP | $ | 1.29 | ||||||||||||||||||||||||||
| December 9, 2019 | February 28, 2020 | £ | 15,000 | USD/GBP | $ | 1.32 | ||||||||||||||||||||||||||
| February 21, 2020 | May 29, 2020 | £ | 31,000 | USD/GBP | $ | 1.30 | ||||||||||||||||||||||||||
| February 21, 2020 | May 29, 2020 | £ | 15,000 | USD/GBP | $ | 1.30 | ||||||||||||||||||||||||||
| March 2, 2020 | April 30, 2020 | € | 60,000 | USD/EUR | $ | 1.12 | ||||||||||||||||||||||||||
| March 10, 2020 | April 30, 2020 | € | 50,000 | USD/EUR | $ | 1.14 | ||||||||||||||||||||||||||
| May 27, 2020 | June 30, 2020 | £ | 31,000 | USD/GBP | $ | 1.23 | ||||||||||||||||||||||||||
| May 27, 2020 | June 30, 2020 | £ | 15,000 | USD/GBP | $ | 1.23 | ||||||||||||||||||||||||||
| June 26, 2020 | July 15, 2020 | £ | 32,500 | USD/GBP | $ | 1.24 | ||||||||||||||||||||||||||
| Gain (Loss) on Derivative Instruments | ||||||||||||||||||||||||||||||||||||||||||||
| Three months ended June 30, | Six months ended June 30, | |||||||||||||||||||||||||||||||||||||||||||
| 2020 | 2019 | 2020 | 2019 | |||||||||||||||||||||||||||||||||||||||||
| Derivatives not designated as hedging instruments: | ||||||||||||||||||||||||||||||||||||||||||||
| Interest rate swaps | $ | 165 | $ | — | $ | 348 | $ | — | ||||||||||||||||||||||||||||||||||||
| Interest rate caps | 14 | (151) | (73) | (311) | ||||||||||||||||||||||||||||||||||||||||
| Foreign currency forward contracts | 1,335 | 74 | 8,195 | (876) | ||||||||||||||||||||||||||||||||||||||||
| Total gain (loss) on derivatives | $ | 1,514 | $ | (77) | $ | 8,470 | $ | (1,187) | ||||||||||||||||||||||||||||||||||||
| Gain (Loss) Recorded on Derivative Instruments | ||||||||||||||||
| Three months ended June 30, | Six months ended June 30, | |||||||||||||||
| 2019 | 2018 | 2019 | 2018 | |||||||||||||
| Derivatives not designated as hedging instruments: | ||||||||||||||||
| Interest rate caps | $ | (151 | ) | $ | (45 | ) | $ | (311 | ) | $ | (47 | ) | ||||
| Foreign currency forward contracts | 74 | — | (876 | ) | — | |||||||||||
| Total gain (loss) on derivatives | $ | (77 | ) | $ | (45 | ) | $ | (1,187 | ) | $ | (47 | ) | ||||
| June 30, 2019 | December 31, 2018 | June 30, 2020 | December 31, 2019 | |||||||||||||||||||||||||||||||||||||||||||
| Shares Authorized | Shares Issued | Shares Outstanding | Shares Authorized | Shares Issued | Shares Outstanding | Shares Authorized | Shares Issued and Outstanding | Shares Authorized | Shares Issued and Outstanding | |||||||||||||||||||||||||||||||||||||
| Class AX common stock, $0.001 par value per share | 40,000 | 18,960 | 18,960 | 40,000 | 19,123 | 19,123 | Class AX common stock, $0.001 par value per share | 40,000 | 18,619 | 40,000 | 18,885 | |||||||||||||||||||||||||||||||||||
| Class TX common stock, $0.001 par value per share | 40,000 | 19,951 | 19,951 | 40,000 | 19,969 | 19,969 | Class TX common stock, $0.001 par value per share | 40,000 | 19,780 | 40,000 | 19,901 | |||||||||||||||||||||||||||||||||||
| Class IX common stock, $0.001 par value per share | 10,000 | 98 | 98 | 10,000 | 96 | 96 | Class IX common stock, $0.001 par value per share | 10,000 | 93 | 10,000 | 91 | |||||||||||||||||||||||||||||||||||
| Class JX common stock, $0.001 par value per share | 10,000 | — | — | 10,000 | — | — | Class JX common stock, $0.001 par value per share | 10,000 | — | 10,000 | — | |||||||||||||||||||||||||||||||||||
| Class T common stock, $0.001 par value per share | 350,000 | 15,021 | 15,021 | 350,000 | 2,858 | 2,858 | Class T common stock, $0.001 par value per share | 350,000 | 36,769 | 350,000 | 28,837 | |||||||||||||||||||||||||||||||||||
| Class S common stock, $0.001 par value per share | 350,000 | — | — | 350,000 | — | — | Class S common stock, $0.001 par value per share | 350,000 | — | 350,000 | — | |||||||||||||||||||||||||||||||||||
| Class D common stock, $0.001 par value per share | 350,000 | 4,497 | 4,497 | 350,000 | 1,479 | 1,479 | Class D common stock, $0.001 par value per share | 350,000 | 9,237 | 350,000 | 6,927 | |||||||||||||||||||||||||||||||||||
| Class I common stock, $0.001 par value per share | 350,000 | 2,187 | 2,187 | 350,000 | 59 | 59 | Class I common stock, $0.001 par value per share | 350,000 | 11,405 | 350,000 | 7,206 | |||||||||||||||||||||||||||||||||||
| Class AX | Class TX | Class IX | Class T | Class D | Class I | Total | |||||||||||||||||||||||||||||||||||||||||||||||||||||||||||||||||||||||||||||||||||||||||||||||||||||||||||||||||||||||
| Shares | Amount | Shares | Amount | Shares | Amount | Shares | Amount | Shares | Amount | Shares | Amount | Shares | Amount | ||||||||||||||||||||||||||||||||||||||||||||||||||||||||||||||||||||||||||||||||||||||||||||||||||||||||||||||||
| Balance as of January 1, 2020 | 18,885 | $ | 19 | 19,901 | $ | 22 | 91 | $ | — | 28,837 | $ | 29 | 6,927 | $ | 6 | 7,206 | $ | 7 | 81,847 | $ | 83 | ||||||||||||||||||||||||||||||||||||||||||||||||||||||||||||||||||||||||||||||||||||||||||||||||||||||||
| Issuance of common shares | 126 | — | 146 | 1 | 1 | — | 5,809 | 6 | 1,696 | 2 | 2,957 | 3 | 10,735 | 12 | |||||||||||||||||||||||||||||||||||||||||||||||||||||||||||||||||||||||||||||||||||||||||||||||||||||||||||||||
| Redemption of common shares | (159) | — | (183) | — | — | — | (86) | — | (20) | — | (16) | — | (464) | — | |||||||||||||||||||||||||||||||||||||||||||||||||||||||||||||||||||||||||||||||||||||||||||||||||||||||||||||||
| Balance as of March 31, 2020 | 18,852 | $ | 19 | 19,864 | $ | 23 | 92 | $ | — | 34,560 | $ | 35 | 8,603 | $ | 8 | 10,147 | $ | 10 | 92,118 | $ | 95 | ||||||||||||||||||||||||||||||||||||||||||||||||||||||||||||||||||||||||||||||||||||||||||||||||||||||||
| Issuance of common shares | 150 | — | 127 | — | 1 | — | 2,528 | 2 | 702 | — | 1,314 | 1 | 4,822 | 3 | |||||||||||||||||||||||||||||||||||||||||||||||||||||||||||||||||||||||||||||||||||||||||||||||||||||||||||||||
| Redemption of common shares | (383) | (1) | (211) | — | — | — | (319) | — | (68) | — | (56) | — | (1,037) | (1) | |||||||||||||||||||||||||||||||||||||||||||||||||||||||||||||||||||||||||||||||||||||||||||||||||||||||||||||||
| Balance as of June 30, 2020 | 18,619 | $ | 18 | 19,780 | $ | 23 | 93 | $ | — | 36,769 | $ | 37 | 9,237 | $ | 8 | 11,405 | $ | 11 | 95,903 | $ | 97 | ||||||||||||||||||||||||||||||||||||||||||||||||||||||||||||||||||||||||||||||||||||||||||||||||||||||||
| Class AX | Class TX | Class IX | Class T | Class D | Class I | Total | Class AX | Class TX | Class IX | Class T | Class D | Class I | Total | ||||||||||||||||||||||||||||||||||||||||||||||||||||||||||||||||||||||||||||||||||||||||||||||||||||||||||||||||||||||||||||||||||||||||||||||||||||||||||||||||||||||||||||
| Shares | Amount | Shares | Amount | Shares | Amount | Shares | Amount | Shares | Amount | Shares | Amount | Shares | Amount | Shares | Amount | Shares | Amount | Shares | Amount | Shares | Amount | Shares | Amount | Shares | Amount | Shares | Amount | ||||||||||||||||||||||||||||||||||||||||||||||||||||||||||||||||||||||||||||||||||||||||||||||||||||||||||||||||||||||||||||||||||||||||||||||||||||||||||||||
| Balance as of January 1, 2019 | 19,123 | $ | 19 | 19,969 | $ | 21 | 96 | $ | — | 2,858 | $ | 3 | 1,479 | $ | 1 | 59 | $ | — | 43,584 | $ | 44 | Balance as of January 1, 2019 | 19,123 | $ | 19 | 19,969 | $ | 21 | 96 | $ | — | 2,858 | $ | 3 | 1,479 | $ | 1 | 59 | $ | — | 43,584 | $ | 44 | ||||||||||||||||||||||||||||||||||||||||||||||||||||||||||||||||||||||||||||||||||||||||||||||||||||||||||||||||||||||||||||||||||||||||||||||
| Issuance of common shares | 136 | — | 155 | 1 | 1 | — | 4,011 | 4 | 1,198 | 1 | 608 | 1 | 6,109 | 7 | Issuance of common shares | 136 | — | 155 | 1 | 1 | — | 4,011 | 4 | 1,198 | 1 | 608 | 1 | 6,109 | 7 | ||||||||||||||||||||||||||||||||||||||||||||||||||||||||||||||||||||||||||||||||||||||||||||||||||||||||||||||||||||||||||||||||||||||||||||||||||||||||||||
| Redemption of common shares | (163 | ) | — | (195 | ) | — | — | — | — | — | (4 | ) | — | — | — | (362 | ) | — | Redemption of common shares | (163) | — | (195) | — | — | — | — | — | (4) | — | — | — | (362) | — | ||||||||||||||||||||||||||||||||||||||||||||||||||||||||||||||||||||||||||||||||||||||||||||||||||||||||||||||||||||||||||||||||||||||||||||||||||||||||
| Balance as of March 31, 2019 | 19,096 | $ | 19 | 19,929 | $ | 22 | 97 | $ | — | 6,869 | $ | 7 | 2,673 | $ | 2 | 667 | $ | 1 | 49,331 | $ | 51 | Balance as of March 31, 2019 | 19,096 | $ | 19 | 19,929 | $ | 22 | 97 | $ | — | 6,869 | $ | 7 | 2,673 | $ | 2 | 667 | $ | 1 | 49,331 | $ | 51 | ||||||||||||||||||||||||||||||||||||||||||||||||||||||||||||||||||||||||||||||||||||||||||||||||||||||||||||||||||||||||||||||||||||||||||||||
| Issuance of common shares | 134 | — | 154 | — | 1 | — | 8,152 | 8 | 1,824 | 2 | 1,520 | 1 | 11,785 | 11 | Issuance of common shares | 134 | — | 154 | — | 1 | — | 8,152 | 8 | 1,824 | 2 | 1,520 | 1 | 11,785 | 11 | ||||||||||||||||||||||||||||||||||||||||||||||||||||||||||||||||||||||||||||||||||||||||||||||||||||||||||||||||||||||||||||||||||||||||||||||||||||||||||||
| Redemption of common shares | (270 | ) | — | (132 | ) | — | — | — | — | — | — | — | — | — | (402 | ) | — | Redemption of common shares | (270) | — | (132) | — | — | — | — | — | — | — | — | — | (402) | — | |||||||||||||||||||||||||||||||||||||||||||||||||||||||||||||||||||||||||||||||||||||||||||||||||||||||||||||||||||||||||||||||||||||||||||||||||||||||||
| Balance as of June 30, 2019 | 18,960 | $ | 19 | 19,951 | $ | 22 | 98 | $ | — | 15,021 | $ | 15 | 4,497 | $ | 4 | 2,187 | $ | 2 | 60,714 | $ | 62 | Balance as of June 30, 2019 | 18,960 | $ | 19 | 19,951 | $ | 22 | 98 | $ | — | 15,021 | $ | 15 | 4,497 | $ | 4 | 2,187 | $ | 2 | 60,714 | $ | 62 | ||||||||||||||||||||||||||||||||||||||||||||||||||||||||||||||||||||||||||||||||||||||||||||||||||||||||||||||||||||||||||||||||||||||||||||||
| Class AX | Class TX | Class IX | Class T | Class D | Total | ||||||||||||||||||||||||||||||||||||
| Shares | Amount | Shares | Amount | Shares | Amount | Shares | Amount | Shares | Amount | Shares | Amount | ||||||||||||||||||||||||||||||
| Balance as of January 1, 2018 | 19,206 | $ | 19 | 19,958 | $ | 20 | 92 | $ | — | — | $ | — | — | $ | — | 39,256 | $ | 39 | |||||||||||||||||||||||
| Issuance of common shares | 145 | — | 162 | — | 1 | — | — | — | — | — | 308 | — | |||||||||||||||||||||||||||||
| Redemption of common shares | (116 | ) | — | (17 | ) | — | — | — | — | — | — | — | (133 | ) | — | ||||||||||||||||||||||||||
| Balance as of March 31, 2018 | 19,235 | $ | 19 | 20,103 | $ | 20 | 93 | $ | — | — | $ | — | — | $ | — | 39,431 | $ | 39 | |||||||||||||||||||||||
| Issuance of common shares | 143 | — | 159 | 1 | 1 | — | 123 | — | 38 | — | 464 | 1 | |||||||||||||||||||||||||||||
| Redemption of common shares | (136 | ) | — | (259 | ) | — | — | — | — | — | — | — | (395 | ) | — | ||||||||||||||||||||||||||
| Balance as of June 30, 2018 | 19,242 | $ | 19 | 20,003 | $ | 21 | 94 | $ | — | 123 | $ | — | 38 | $ | — | 39,500 | $ | 40 | |||||||||||||||||||||||
| Stockholders | ||||||||||||||||||||||||||||||||||||||
| Distributions for the Three Months Ended | Cash Distributions | Distributions Reinvested | Total Declared | |||||||||||||||||||||||||||||||||||
| 2020 | ||||||||||||||||||||||||||||||||||||||
| June 30, 2020 | $ | 6,262 | $ | 7,190 | $ | 13,452 | ||||||||||||||||||||||||||||||||
| March 31, 2020 | 5,669 | 6,732 | 12,401 | |||||||||||||||||||||||||||||||||||
| Total | $ | 11,931 | $ | 13,922 | $ | 25,853 | ||||||||||||||||||||||||||||||||
| 2019 | ||||||||||||||||||||||||||||||||||||||
| December 31, 2019 | $ | 4,992 | $ | 6,092 | $ | 11,084 | ||||||||||||||||||||||||||||||||
| September 30, 2019 | 4,383 | 5,325 | 9,708 | |||||||||||||||||||||||||||||||||||
| June 30, 2019 | 3,647 | 4,415 | 8,062 | |||||||||||||||||||||||||||||||||||
| March 31, 2019 | 3,090 | 3,614 | 6,704 | |||||||||||||||||||||||||||||||||||
| Total | $ | 16,112 | $ | 19,446 | $ | 35,558 | ||||||||||||||||||||||||||||||||
| Stockholders | ||||||||||||
| Distributions for the Three Months Ended | Cash Distributions | Distributions Reinvested | Total Declared | |||||||||
| 2019 | ||||||||||||
| June 30, 2019 | $ | 3,647 | $ | 4,415 | $ | 8,062 | ||||||
| March 31, 2019 | 3,090 | 3,614 | 6,704 | |||||||||
| Total | $ | 6,737 | $ | 8,029 | $ | 14,766 | ||||||
| 2018 | ||||||||||||
| December 31, 2018 | $ | 2,765 | $ | 3,168 | $ | 5,933 | ||||||
| September 30, 2018 | 2,617 | 3,034 | 5,651 | |||||||||
| June 30, 2018 | 2,554 | 2,974 | 5,528 | |||||||||
| March 31, 2018 | 2,544 | 2,970 | 5,514 | |||||||||
| Total | $ | 10,480 | $ | 12,146 | $ | 22,626 | ||||||
| Three Months Ended June 30, | Six Months Ended June 30, | |||||||||||||||||||||||||||||||||||||||||||||||||
| 2020 | 2019 | 2020 | 2019 | |||||||||||||||||||||||||||||||||||||||||||||||
| Distributions declared per Class AX share, net | $ | 0.16 | $ | 0.16 | $ | 0.31 | $ | 0.31 | ||||||||||||||||||||||||||||||||||||||||||
| Distributions declared per Class TX share, net | $ | 0.13 | $ | 0.13 | $ | 0.26 | $ | 0.26 | ||||||||||||||||||||||||||||||||||||||||||
| Distributions declared per Class IX share, net | $ | 0.15 | $ | 0.15 | $ | 0.30 | $ | 0.30 | ||||||||||||||||||||||||||||||||||||||||||
| Distributions declared per Class T share, net | $ | 0.13 | $ | 0.13 | $ | 0.26 | $ | 0.26 | ||||||||||||||||||||||||||||||||||||||||||
| Distributions declared per Class S share, net | $ | 0.13 | $ | 0.13 | $ | 0.26 | $ | 0.26 | ||||||||||||||||||||||||||||||||||||||||||
| Distributions declared per Class D share, net | $ | 0.14 | $ | 0.15 | $ | 0.29 | $ | 0.30 | ||||||||||||||||||||||||||||||||||||||||||
| Distributions declared per Class I share, net | $ | 0.16 | $ | 0.16 | $ | 0.31 | $ | 0.31 | ||||||||||||||||||||||||||||||||||||||||||
| Three Months Ended June 30, | Six Months Ended June 30, | |||||||||||||||
| 2019 | 2018 | 2019 | 2018 | |||||||||||||
| Distributions declared per Class AX share, net | $ | 0.16 | $ | 0.15 | $ | 0.31 | $ | 0.30 | ||||||||
| Distributions declared per Class TX share, net | $ | 0.13 | $ | 0.13 | $ | 0.26 | $ | 0.26 | ||||||||
| Distributions declared per Class IX share, net | $ | 0.15 | $ | 0.15 | $ | 0.30 | $ | 0.29 | ||||||||
| Distributions declared per Class T share, net | $ | 0.13 | $ | 0.13 | $ | 0.26 | $ | 0.26 | ||||||||
| Distributions declared per Class S share, net | $ | 0.13 | $ | 0.13 | $ | 0.26 | $ | 0.26 | ||||||||
| Distributions declared per Class D share, net | $ | 0.15 | $ | 0.15 | $ | 0.30 | $ | 0.29 | ||||||||
| Distributions declared per Class I share, net | $ | 0.16 | $ | 0.15 | $ | 0.31 | $ | 0.30 | ||||||||
| Incurred | ||||||||||||||||||||||||||||||||||||||||||||||||||||||||
| Three Months Ended June 30, | Six Months Ended June 30, | Unpaid as of | ||||||||||||||||||||||||||||||||||||||||||||||||||||||
| Type and Recipient | 2020 | 2019 | 2020 | 2019 | June 30, 2020 | December 31, 2019 | ||||||||||||||||||||||||||||||||||||||||||||||||||
Selling Commissions- Dealer Manager (1) | $ | 658 | $ | 2,390 | $ | 2,304 | $ | 3,560 | $ | — | $ | — | ||||||||||||||||||||||||||||||||||||||||||||
| Dealer Manager Fee- Dealer Manager | 117 | 422 | 413 | 630 | — | — | ||||||||||||||||||||||||||||||||||||||||||||||||||
| Distribution & Stockholder Servicing Fees- Dealer Manager | 3,234 | 5,698 | 7,532 | 8,687 | 27,212 | 22,479 | ||||||||||||||||||||||||||||||||||||||||||||||||||
| Organization and Offering Costs- the Advisor | 987 | 1,048 | 1,850 | 2,288 | 6,762 | 7,763 | ||||||||||||||||||||||||||||||||||||||||||||||||||
| Asset Management Fees- the Advisor | 2,747 | 1,801 | 5,538 | 3,288 | 2,630 | 2,353 | ||||||||||||||||||||||||||||||||||||||||||||||||||
Other- the Advisor (2) | 692 | 730 | 1,054 | 1,223 | 629 | 1,106 | ||||||||||||||||||||||||||||||||||||||||||||||||||
Performance Participation Allocation- the Advisor (3) | — | 1,476 | — | 2,597 | — | 7,713 | ||||||||||||||||||||||||||||||||||||||||||||||||||
Interest expense- Hines and its affiliates (4) | 2 | 310 | 362 | 747 | — | 443 | ||||||||||||||||||||||||||||||||||||||||||||||||||
| Property Management Fees- Hines and its affiliates | 513 | 443 | 1,195 | 815 | 124 | 287 | ||||||||||||||||||||||||||||||||||||||||||||||||||
| Development and Construction Management Fees- Hines and its affiliates | 27 | 223 | 90 | 290 | 110 | 30 | ||||||||||||||||||||||||||||||||||||||||||||||||||
| Leasing Fees- Hines and its affiliates | 126 | 230 | 219 | 337 | 197 | 344 | ||||||||||||||||||||||||||||||||||||||||||||||||||
| Expense Reimbursement- Hines and its affiliates (with respect to management and operations of the Company's properties) | 1,843 | 983 | 3,759 | 1,795 | (68) | 264 | ||||||||||||||||||||||||||||||||||||||||||||||||||
| Total | $ | 10,946 | $ | 15,754 | $ | 24,316 | $ | 26,257 | $ | 37,596 | $ | 42,782 | ||||||||||||||||||||||||||||||||||||||||||||
| Incurred | ||||||||||||||||||||||||
| Three Months Ended June 30, | Six Months Ended June 30, | Unpaid as of | ||||||||||||||||||||||
| Type and Recipient | 2019 | 2018 | 2019 | 2018 | June 30, 2019 | December 31, 2018 | ||||||||||||||||||
Selling Commissions- Dealer Manager (1) | $ | 2,390 | $ | 36 | $ | 3,560 | $ | 36 | $ | 1 | $ | 4 | ||||||||||||
| Dealer Manager Fee- Dealer Manager | 422 | 6 | 630 | 6 | — | 3 | ||||||||||||||||||
| Distribution & Stockholder Servicing Fees- Dealer Manager | 5,698 | — | 8,687 | — | 15,644 | 8,332 | ||||||||||||||||||
| Organization and Offering Costs- the Advisor | 1,048 | 998 | 2,288 | 1,502 | 8,555 | 9,001 | ||||||||||||||||||
| Asset Management Fees- the Advisor | 1,801 | 1,214 | 3,288 | 2,420 | 1,930 | 1,317 | ||||||||||||||||||
Other- the Advisor (2) | 730 | 280 | 1,223 | 672 | 509 | 691 | ||||||||||||||||||
Performance Participation Allocation- the Advisor (3) | 1,476 | 1,185 | 2,597 | 2,777 | 2,597 | 5,954 | ||||||||||||||||||
Interest expense- Hines and its affiliates (4) | 310 | 11 | 747 | 198 | — | 151 | ||||||||||||||||||
| Property Management Fees- Hines and its affiliates | 443 | 248 | 815 | 459 | 148 | 78 | ||||||||||||||||||
| Development and Construction Management Fees- Hines and its affiliates | 223 | 139 | 290 | 251 | 191 | 28 | ||||||||||||||||||
| Leasing Fees- Hines and its affiliates | 230 | 26 | 337 | 110 | 266 | 228 | ||||||||||||||||||
| Expense Reimbursement- Hines and its affiliates (with respect to management and operations of the Company's properties) | 983 | 409 | 1,795 | 885 | 364 | 235 | ||||||||||||||||||
| Total | $ | 15,754 | $ | 4,552 | $ | 26,257 | $ | 9,316 | $ | 30,205 | $ | 26,022 | ||||||||||||
| Basis of Fair Value Measurements | ||||||||||||||||||
| As of | Description | Fair Value of Assets | Quoted Prices In Active Markets for Identical Items (Level 1) | Significant Other Observable Inputs (Level 2) | Significant Unobservable Inputs (Level 3) | |||||||||||||
| June 30, 2019 | Investments in real estate-related securities | $ | 19,833 | $ | 19,833 | $ | — | $ | — | |||||||||
| December 31, 2018 | Investments in real estate-related securities | $ | 9,599 | $ | 9,599 | $ | — | $ | — | |||||||||
| Basis of Fair Value Measurements | ||||||||||||||||||||||||||||||||||||||||||||||||||||||||
| As of | Description | Fair Value of Assets | Quoted Prices In Active Markets for Identical Items (Level 1) | Significant Other Observable Inputs (Level 2) | Significant Unobservable Inputs (Level 3) | |||||||||||||||||||||||||||||||||||||||||||||||||||
| June 30, 2020 | Investments in real estate-related securities | $ | 37,653 | $ | 37,653 | $ | — | $ | — | |||||||||||||||||||||||||||||||||||||||||||||||
| December 31, 2019 | Investments in real estate-related securities | $ | 36,491 | $ | 36,491 | $ | — | $ | — | |||||||||||||||||||||||||||||||||||||||||||||||
| Three Months Ended June 30, | Six Months Ended June 30, | ||||||||||||||||||||||||||||||||||
| 2020 | 2019 | 2020 | 2019 | ||||||||||||||||||||||||||||||||
| Revenues | |||||||||||||||||||||||||||||||||||
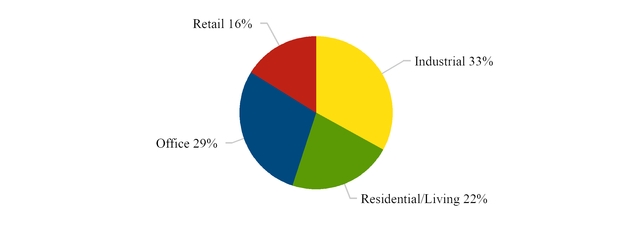
| Domestic office investments | $ | 3,836 | $ | 4,128 | $ | 7,771 | $ | 8,337 | |||||||||||||||||||||||||||
| Domestic residential/living investments | 4,908 | 2,741 | 9,314 | 5,473 | |||||||||||||||||||||||||||||||
| Domestic retail investments | 5,151 | 4,903 | 12,524 | 9,852 | |||||||||||||||||||||||||||||||
| Domestic industrial investments | — | 1,099 | 533 | 2,185 | |||||||||||||||||||||||||||||||
| International industrial investments | 10,723 | 6,582 | 21,758 | 11,335 | |||||||||||||||||||||||||||||||
| International office investments | 528 | 1,860 | 3,042 | 3,791 | |||||||||||||||||||||||||||||||
| International residential/living investments | 2,668 | 2,241 | 6,717 | 4,318 | |||||||||||||||||||||||||||||||
| Total revenues | $ | 27,814 | $ | 23,554 | $ | 61,659 | $ | 45,291 | |||||||||||||||||||||||||||
| Three Months Ended June 30, | Six Months Ended June 30, | ||||||||||||||
| 2019 | 2018 | 2019 | 2018 | ||||||||||||
| Total Revenue | |||||||||||||||
| Domestic office investments | $ | 4,128 | $ | 4,110 | $ | 8,337 | $ | 8,138 | |||||||
| Domestic residential/living investments | 2,741 | 1,229 | 5,473 | 2,443 | |||||||||||
| Domestic retail investments | 4,903 | 5,010 | 9,852 | 10,054 | |||||||||||
| Domestic industrial investments | 1,099 | 1,312 | 2,185 | 3,290 | |||||||||||
| International industrial investments | 6,582 | — | 11,335 | — | |||||||||||
| International office investments | 1,860 | 1,963 | 3,791 | 4,062 | |||||||||||
| International residential/living investments | 2,241 | 2,350 | 4,318 | 4,718 | |||||||||||
| Total Revenue | $ | 23,554 | $ | 15,974 | $ | 45,291 | $ | 32,705 | |||||||
| Three Months Ended June 30, | Six Months Ended June 30, | ||||||||||||||||||||||||||||||||||
| 2020 | 2019 | 2020 | 2019 | ||||||||||||||||||||||||||||||||
| Total revenues | |||||||||||||||||||||||||||||||||||
| United States | 49 | % | 55 | % | 49 | % | 57 | % | |||||||||||||||||||||||||||
| The Netherlands | 25 | % | 24 | % | 23 | % | 21 | % | |||||||||||||||||||||||||||
| United Kingdom | 13 | % | 5 | % | 14 | % | 5 | % | |||||||||||||||||||||||||||
| Poland | 5 | % | — | % | 4 | % | — | % | |||||||||||||||||||||||||||
| Ireland | 4 | % | 12 | % | 7 | % | 13 | % | |||||||||||||||||||||||||||
| Germany | 3 | % | 4 | % | 3 | % | 4 | % | |||||||||||||||||||||||||||
| Spain | 1 | % | — | % | — | % | — | % | |||||||||||||||||||||||||||
| Three Months Ended June 30, | Six Months Ended June 30, | ||||||||||
| 2019 | 2018 | 2019 | 2018 | ||||||||
| Total Revenue | |||||||||||
| United States | 55 | % | 73 | % | 57 | % | 73 | % | |||
| The Netherlands | 24 | % | — | % | 21 | % | — | % | |||
| Ireland | 12 | % | 19 | % | 13 | % | 18 | % | |||
| United Kingdom | 5 | % | 8 | % | 5 | % | 9 | % | |||
| Germany | 4 | % | — | % | 4 | % | — | % | |||
| Three Months Ended June 30, | Six Months Ended June 30, | ||||||||||||||||||||||||||||||||||
| 2020 | 2019 | 2020 | 2019 | ||||||||||||||||||||||||||||||||
Revenues in excess of property operating expenses (1) | |||||||||||||||||||||||||||||||||||
| Domestic office investments | $ | 2,600 | $ | 2,813 | $ | 5,170 | $ | 5,709 | |||||||||||||||||||||||||||
| Domestic residential/living investments | 2,461 | 1,340 | 4,757 | 2,784 | |||||||||||||||||||||||||||||||
| Domestic retail investments | 2,217 | 2,816 | 6,598 | 5,628 | |||||||||||||||||||||||||||||||
| Domestic industrial investments | (3) | 958 | 364 | 1,656 | |||||||||||||||||||||||||||||||
| International industrial investments | 6,718 | 3,743 | 13,386 | 6,321 | |||||||||||||||||||||||||||||||
| International office investments | 370 | 1,533 | 2,333 | 2,480 | |||||||||||||||||||||||||||||||
| International residential/living investments | 1,631 | 1,542 | 4,318 | 3,066 | |||||||||||||||||||||||||||||||
| Total revenues in excess of property operating expenses | $ | 15,994 | $ | 14,745 | $ | 36,926 | $ | 27,644 | |||||||||||||||||||||||||||
| Three Months Ended June 30, | Six Months Ended June 30, | ||||||||||||||
| 2019 | 2018 | 2019 | 2018 | ||||||||||||
Property revenues in excess of expenses (1) | |||||||||||||||
| Domestic office investments | $ | 2,813 | $ | 2,852 | $ | 5,709 | $ | 5,572 | |||||||
| Domestic residential/living investments | 1,340 | 816 | 2,784 | 1,590 | |||||||||||
| Domestic retail investments | 2,816 | 3,245 | 5,628 | 6,407 | |||||||||||
| Domestic industrial investments | 958 | 989 | 1,656 | 2,519 | |||||||||||
| International industrial investments | 3,743 | — | 6,321 | — | |||||||||||
| International office investments | 1,533 | 1,522 | 2,480 | 3,124 | |||||||||||
| International residential/living investments | 1,542 | 1,520 | 3,066 | 3,244 | |||||||||||
| Property revenues in excess of expenses | $ | 14,745 | $ | 10,944 | $ | 27,644 | $ | 22,456 | |||||||
| June 30, 2020 | December 31, 2019 | ||||||||||
| Assets | |||||||||||
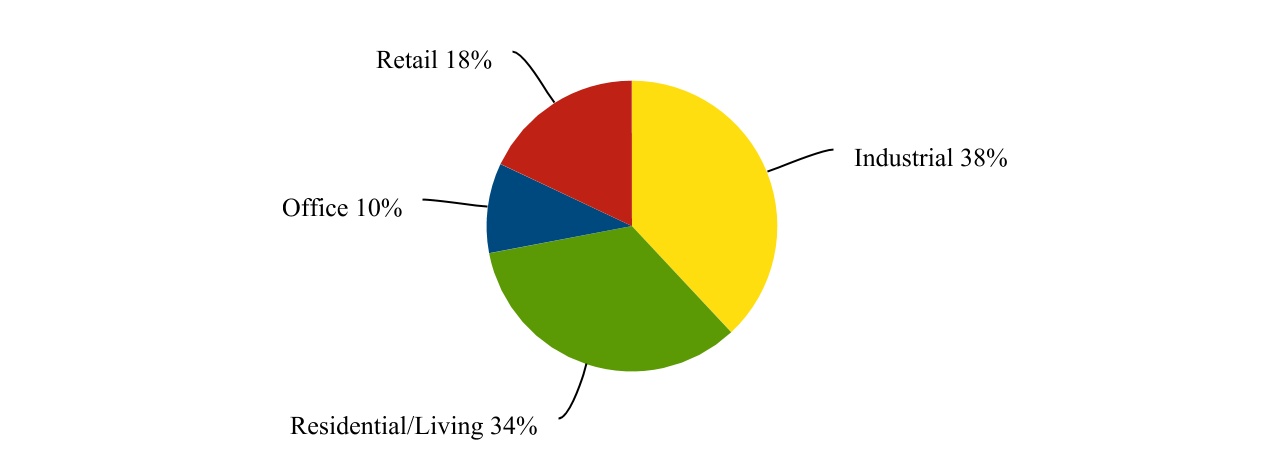
| Domestic office investments | $ | 123,199 | $ | 124,144 | |||||||
| Domestic residential/living investments | 283,117 | 220,988 | |||||||||
| Domestic retail investments | 300,668 | 292,526 | |||||||||
| Domestic industrial investments | 191 | 51,520 | |||||||||
| International industrial investments | 532,700 | 494,268 | |||||||||
| International office investments | 14,526 | (1) | 122,342 | ||||||||
| International residential/living investments | 195,476 | 211,785 | |||||||||
| Corporate-level accounts | 60,355 | 55,972 | |||||||||
| Total assets | $ | 1,510,232 | $ | 1,573,545 | |||||||
| June 30, 2019 | December 31, 2018 | ||||||
| Total Assets | |||||||
| Domestic office investments | $ | 127,441 | $ | 130,021 | |||
| Domestic residential/living investments | 121,579 | 126,175 | |||||
| Domestic retail investments | 196,686 | 199,819 | |||||
| Domestic industrial investments | 51,821 | 51,103 | |||||
| International industrial investments | 336,747 | 190,001 | |||||
| International office investments | 121,466 | 122,471 | |||||
| International residential/living investments | 108,385 | 111,803 | |||||
| Corporate-level accounts | 34,639 | 17,436 | |||||
| Total Assets | $ | 1,098,764 | $ | 948,829 | |||
| June 30, 2020 | December 31, 2019 | ||||||||||
| Total assets | |||||||||||
| United States | 51 | % | 47 | % | |||||||
| The Netherlands | 19 | % | 17 | % | |||||||
| United Kingdom | 17 | % | 18 | % | |||||||
| Ireland | 4 | % | 11 | % | |||||||
| Poland | 4 | % | 4 | % | |||||||
| Germany | 3 | % | 3 | % | |||||||
| Spain | 2 | % | — | % | |||||||
| June 30, 2019 | December 31, 2018 | ||||
| Total Assets | |||||
| United States | 49 | % | 55 | % | |
| Ireland | 15 | % | 18 | % | |
| The Netherlands | 26 | % | 15 | % | |
| United Kingdom | 6 | % | 7 | % | |
| Germany | 4 | % | 5 | % | |
| Three Months Ended June 30, | Six Months Ended June 30, | ||||||||||||||||||||||||||||||||||
| 2020 | 2019 | 2020 | 2019 | ||||||||||||||||||||||||||||||||
| Reconciliation to revenues in excess of property operating expenses | |||||||||||||||||||||||||||||||||||
| Net income (loss) | $ | 73,540 | $ | (3,450) | $ | 115,292 | $ | (7,449) | |||||||||||||||||||||||||||
| Depreciation and amortization | 14,457 | 9,741 | 30,686 | 19,069 | |||||||||||||||||||||||||||||||
| Acquisition related expenses | 274 | 13 | 291 | 17 | |||||||||||||||||||||||||||||||
| Asset management fees | 2,747 | 1,801 | 5,538 | 3,288 | |||||||||||||||||||||||||||||||
| Performance participation allocation | — | 1,476 | — | 2,597 | |||||||||||||||||||||||||||||||
| General and administrative expenses | 1,286 | 948 | 2,324 | 1,795 | |||||||||||||||||||||||||||||||
| (Gain) loss on derivative instruments | (1,514) | 77 | (8,470) | 1,187 | |||||||||||||||||||||||||||||||
| (Gain) loss on investments in real estate-related securities | (3,136) | (161) | 4,601 | (1,327) | |||||||||||||||||||||||||||||||
| Gain on sale of real estate | (80,457) | — | (130,101) | — | |||||||||||||||||||||||||||||||
| Foreign currency (gains) losses | (1,374) | 267 | 1,145 | 336 | |||||||||||||||||||||||||||||||
| Interest expense | 4,463 | 4,317 | 10,395 | 8,514 | |||||||||||||||||||||||||||||||
| Interest and other income | (159) | (244) | (710) | (372) | |||||||||||||||||||||||||||||||
| (Benefit) provision for income taxes | (1,906) | (40) | (1,838) | (11) | |||||||||||||||||||||||||||||||
| Provision for income taxes related to sale of real estate | 7,773 | — | 7,773 | — | |||||||||||||||||||||||||||||||
| Total revenues in excess of property operating expenses | $ | 15,994 | $ | 14,745 | $ | 36,926 | $ | 27,644 | |||||||||||||||||||||||||||
| Three Months Ended June 30, | Six Months Ended June 30, | ||||||||||||||
| 2019 | 2018 | 2019 | 2018 | ||||||||||||
| Reconciliation to property revenue in excess of expenses | |||||||||||||||
| Net income (loss) | $ | (3,450 | ) | $ | (1,408 | ) | $ | (7,449 | ) | $ | 9,968 | ||||
| Depreciation and amortization | 9,741 | 6,959 | 19,069 | 14,300 | |||||||||||
| Acquisition related expenses | 13 | 10 | 17 | 144 | |||||||||||
| Asset management fees | 1,801 | 1,214 | 3,288 | 2,420 | |||||||||||
| Performance participation allocation | 1,476 | 1,185 | 2,597 | 2,777 | |||||||||||
| General and administrative expenses | 948 | 659 | 1,795 | 1,511 | |||||||||||
| (Gain) loss on derivative instruments | 77 | 45 | 1,187 | 47 | |||||||||||
| (Gain) loss on real estate-related securities | (161 | ) | — | (1,327 | ) | — | |||||||||
| Gain on sale of real estate | — | — | — | (14,491 | ) | ||||||||||
| Foreign currency (gains) losses | 267 | 291 | 336 | 316 | |||||||||||
| Interest expense | 4,317 | 2,677 | 8,514 | 5,491 | |||||||||||
| Interest income | (244 | ) | (34 | ) | (372 | ) | (47 | ) | |||||||
| (Benefit) provision for income taxes | (40 | ) | (654 | ) | (11 | ) | 20 | ||||||||
| Total property revenues in excess of expenses | $ | 14,745 | $ | 10,944 | $ | 27,644 | $ | 22,456 | |||||||
| Six Months Ended June 30, | |||||||||||||||||
| 2020 | 2019 | ||||||||||||||||
| Supplemental Disclosure of Cash Flow Information | |||||||||||||||||
| Cash paid for interest | $ | 9,686 | $ | 7,947 | |||||||||||||
| Cash paid for income taxes related to sale of real estate | $ | 7,773 | $ | — | |||||||||||||
| Supplemental Schedule of Non-Cash Investing and Financing Activities | |||||||||||||||||
| Distributions declared and unpaid | $ | 4,501 | $ | 2,860 | |||||||||||||
| Distributions reinvested | $ | 13,618 | $ | 7,543 | |||||||||||||
| Shares tendered for redemption | $ | 3,489 | $ | 596 | |||||||||||||
| Non-cash net liabilities assumed | $ | 848 | $ | 2,686 | |||||||||||||
| Offering costs payable to the Advisor | $ | 1,850 | $ | 2,288 | |||||||||||||
| Distribution and stockholder servicing fees payable to the Dealer Manager | $ | 7,532 | $ | 8,687 | |||||||||||||
| Accrued capital additions | $ | 961 | $ | 2,282 | |||||||||||||
| Accrued acquisition costs | $ | 1,084 | $ | 164 | |||||||||||||
| Six Months Ended June 30, | |||||||
| 2019 | 2018 | ||||||
| Supplemental Disclosure of Cash Flow Information | |||||||
| Cash paid for interest | $ | 7,947 | $ | 5,025 | |||
| Supplemental Schedule of Non-Cash Investing and Financing Activities | |||||||
| Distributions declared and unpaid | $ | 2,860 | $ | 1,844 | |||
| Distributions reinvested | $ | 7,543 | $ | 5,961 | |||
| Shares tendered for redemption | $ | 596 | $ | 1,090 | |||
| Non-cash net liabilities assumed | $ | 2,686 | $ | — | |||
| Offering costs payable to the Advisor | $ | 2,288 | $ | 1,502 | |||
| Distribution and stockholder servicing fees payable to the Dealer Manager | $ | 8,687 | $ | — | |||
| Accrued capital additions | $ | 2,282 | $ | 2,636 | |||
| Accrued acquisition costs | $ | 164 | $ | — | |||
| — | Whether we will have the opportunity to invest offering and distribution reinvestment plan proceeds to acquire properties or other investments or whether such proceeds will be needed to redeem shares or for other purposes, and if proceeds are available for investment, our ability to make such investments in a timely manner and at appropriate amounts that provide acceptable returns; | ||||
| — | Competition for tenants and real estate investment opportunities, including competition with other programs sponsored by or affiliated with Hines Interests Limited Partnership (“Hines”); | ||||
| — | Our reliance on our Advisor, Hines and affiliates of Hines for our day-to-day operations and the selection of real estate investments, and our Advisor’s ability to attract and retain high-quality personnel who can provide service at a level acceptable to us; | ||||
| — | Our ability to complete acquisitions of properties under contract; | ||||
| — | Risks associated with conflicts of interests that result from our relationship with our Advisor and Hines, as well as conflicts of interests certain of our officers and directors face relating to the positions they hold with other entities; | ||||
| — | The potential need to fund tenant improvements, lease-up costs or other capital expenditures, as well as increases in property operating expenses and costs of compliance with environmental matters or discovery of previously undetected environmentally hazardous or other undetected adverse conditions at our properties; | ||||
| — | The availability and timing of distributions we may pay is uncertain and cannot be assured; | ||||
| — | Our distributions have been paid using cash flows from financing activities, including proceeds from our public offering, as well as cash from the waiver of fees by our Advisor, and some or all of the distributions we pay in the future may be paid from similar sources or sources such as cash advances by our Advisor, cash resulting from a waiver or deferral of fees, borrowings and/or proceeds from the offering. When we pay distributions from sources other than our cash flow from operations, we will have less funds available for the acquisition of properties, and your overall return may be reduced; | ||||
| — | Risks associated with debt and our ability to secure financing; | ||||
| — | |||||
| Catastrophic events, such as hurricanes, earthquakes, tornadoes and terrorist attacks; and our ability to secure adequate insurance at reasonable and appropriate rates; | |||||
| — | The failure of any bank in which we deposit our funds could reduce the amount of cash we have available to pay distributions and make additional investments; | ||||
| — | Changes in governmental, tax, real estate and zoning laws and regulations and the related costs of compliance and increases in our administrative operating expenses, including expenses associated with operating as a public company; | ||||
| — | International investment risks, including the burden of complying with a wide variety of foreign laws and the uncertainty of such laws, the tax treatment of transaction structures, political and economic instability, foreign currency fluctuations, and inflation and governmental measures to curb inflation may adversely affect our operations and our ability to make distributions; | ||||
| — | The lack of liquidity associated with our assets; and | ||||
| — | Our ability to qualify as a real estate investment trust (“REIT”) for U.S. federal income tax purposes. | ||||
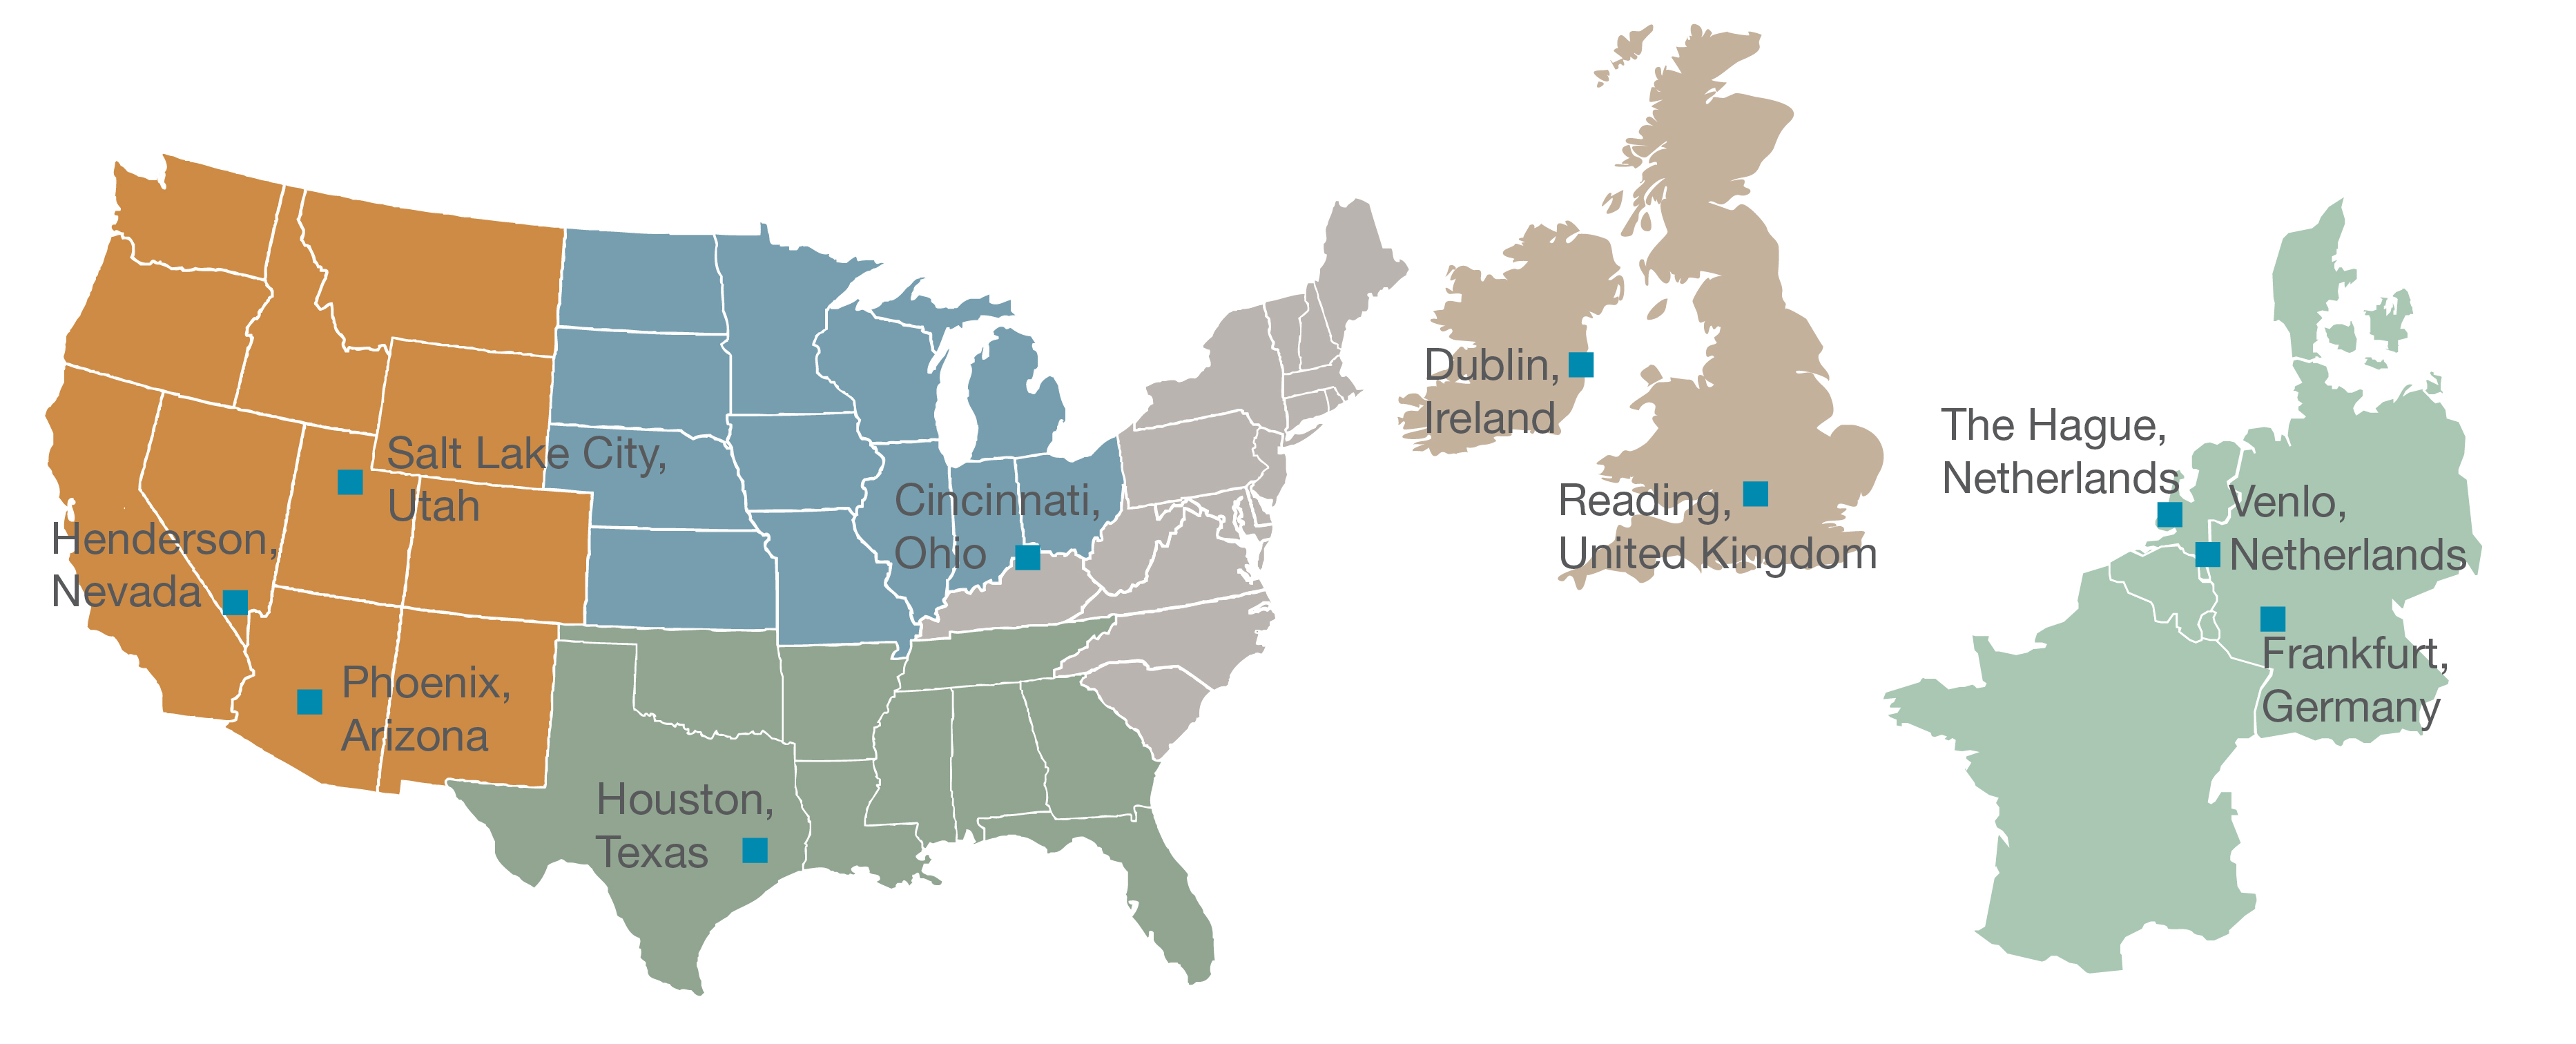
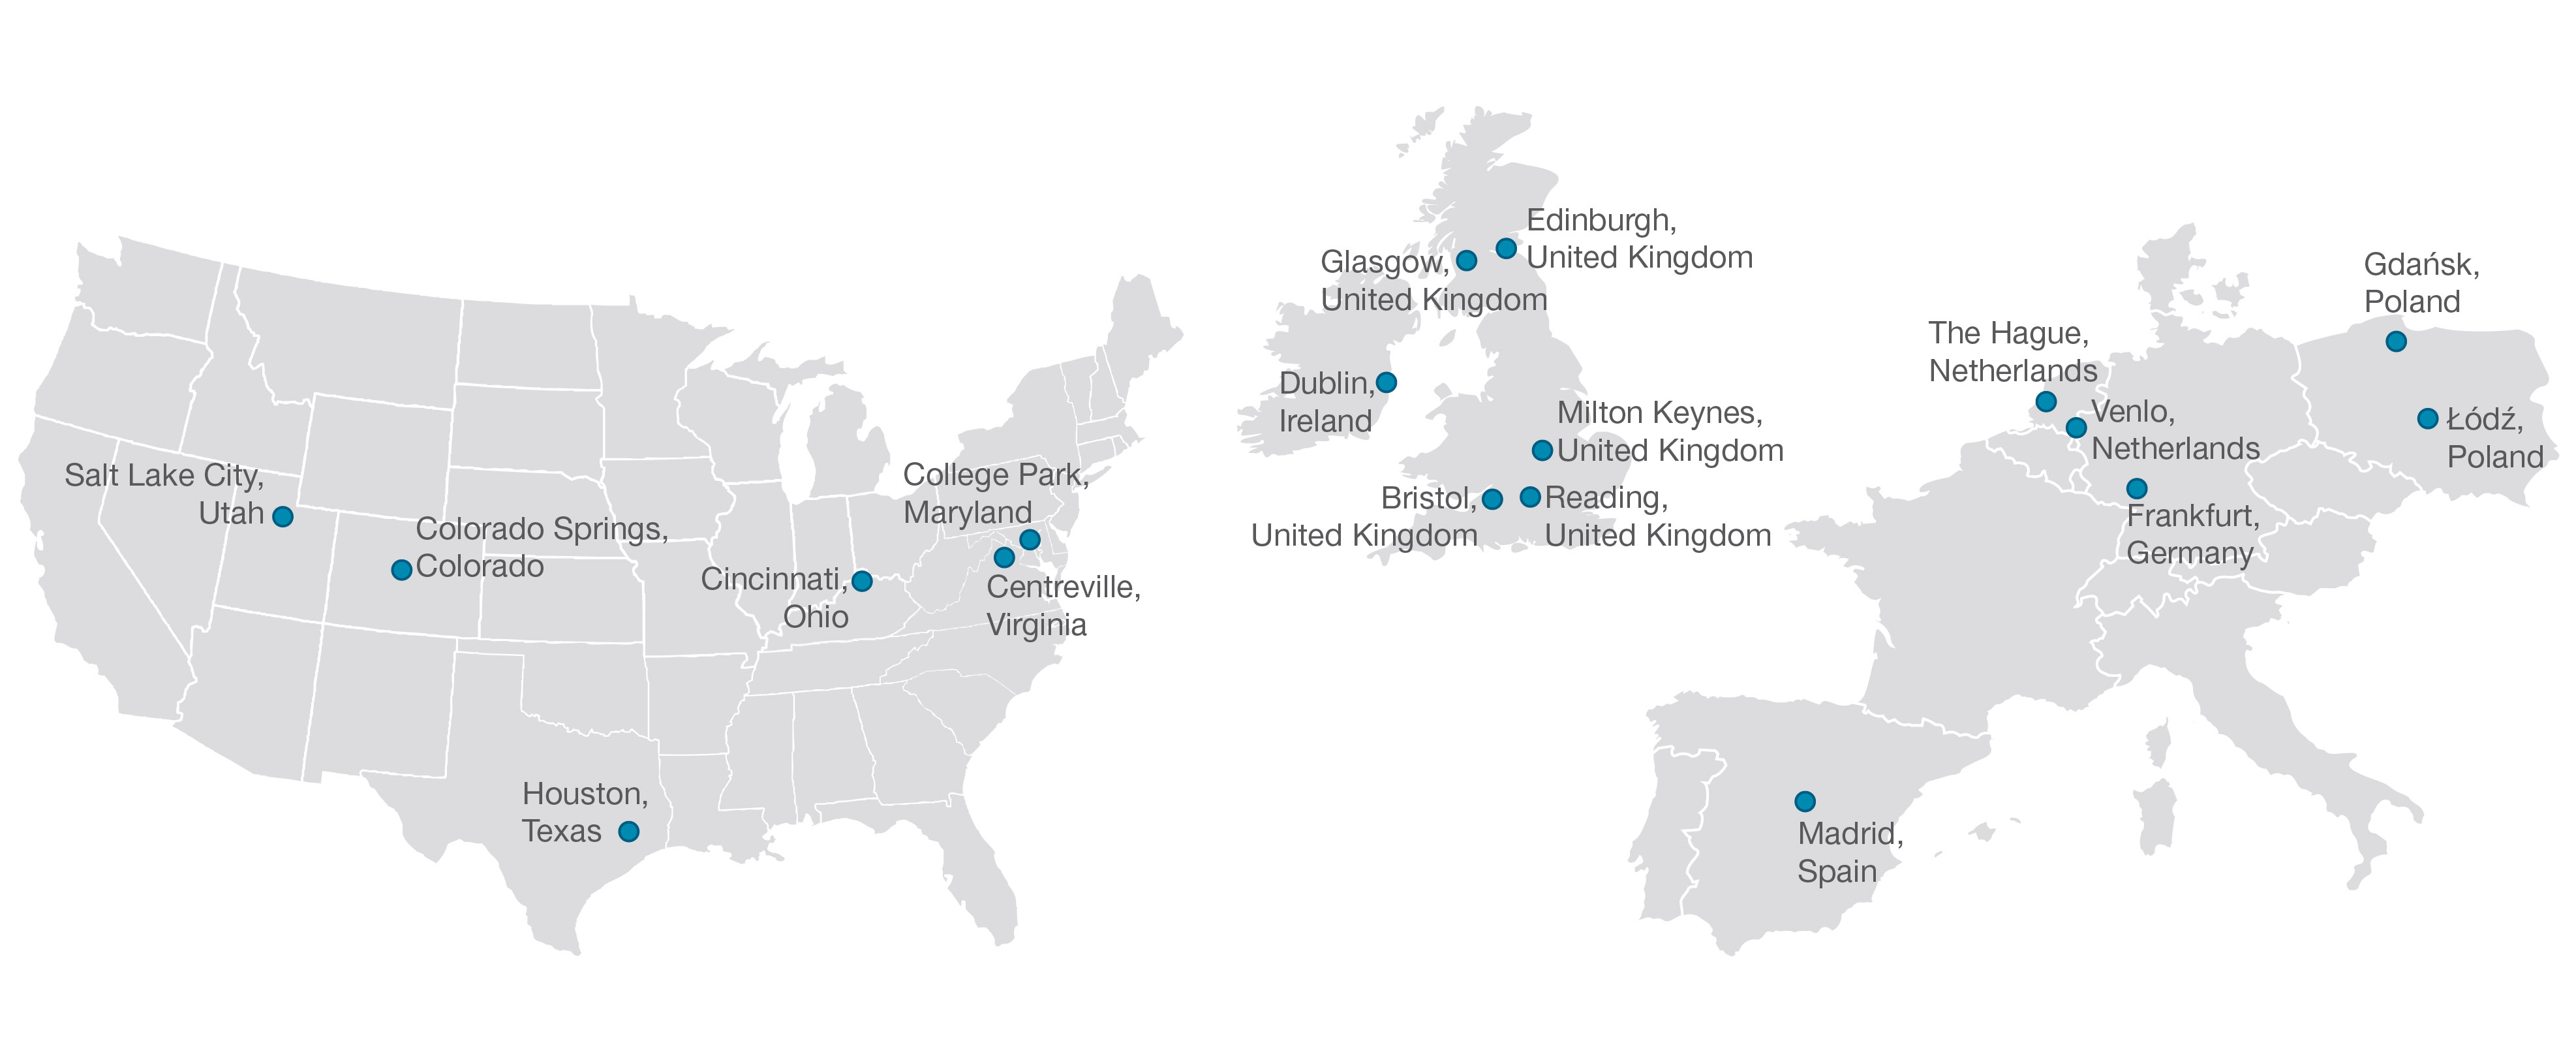
| Property | Location | Investment Type | Date Acquired/ Net Purchase Price (in millions)(1) | Estimated Going-in Capitalization Rate (2) | Leasable Square Feet | Percent Leased | |||||||||||||||||||||||||||||||||||||||||
| Cottonwood Corporate Center | Salt Lake City, Utah | Office | 7/2016; $139.2 | 6.9% | 487,518 | 96 | % | ||||||||||||||||||||||||||||||||||||||||
| Rookwood | Cincinnati, Ohio | Retail | 1/2017; $193.7 | 6.0% | 600,973 | 90 | % | ||||||||||||||||||||||||||||||||||||||||
| Montrose Student Residences | Dublin, Ireland | Residential/Living | 3/2017; $40.6 | 5.5% | 53,835 | 100 | % | (3) | |||||||||||||||||||||||||||||||||||||||
| Queen’s Court Student Residences | Reading, United Kingdom | Residential/Living | 10/2017; $65.3 | 6.2% | 79,115 | 100 | % | (3) | |||||||||||||||||||||||||||||||||||||||
| Venue Museum District | Houston, Texas | Residential/Living | 9/2018; $72.9 | 3.9% | 294,964 | 96 | % | ||||||||||||||||||||||||||||||||||||||||
| Fresh Park Venlo | Venlo, Netherlands | Industrial | 10/2018; $136.3 | 6.7% | 2,863,620 | 96 | % | ||||||||||||||||||||||||||||||||||||||||
| Maintal Logistics | Frankfurt, Germany | Industrial | 12/2018; $43.8 | 5.7% | 387,253 | 96 | % | ||||||||||||||||||||||||||||||||||||||||
| ABC Westland | The Hague, Netherlands | Industrial | 5/2019; $142.8 | 6.2% | 1,386,847 | 91 | % | ||||||||||||||||||||||||||||||||||||||||
| Promenade Shops at Briargate | Colorado Springs, Colorado | Retail | 9/2019; $93.2 | 7.7% | 236,539 | 84 | % | ||||||||||||||||||||||||||||||||||||||||
| Gdańsk PL II | Gdańsk, Poland | Industrial | 9/2019; $29.9 | 6.7% | 346,996 | 100 | % | ||||||||||||||||||||||||||||||||||||||||
| Łódź Urban Logistics | Łódź, Poland | Industrial | 9/2019; $25.2 | 6.6% | 389,233 | 100 | % | ||||||||||||||||||||||||||||||||||||||||
| Glasgow West End | Glasgow, United Kingdom | Residential/Living | 9/2019; $89.5 | 5.5% | 113,389 | 98 | % | (3) | |||||||||||||||||||||||||||||||||||||||
| Charles Tyrwhitt DC | Milton Keynes, United Kingdom | Industrial | 11/2019; $19.9 | 5.7% | 140,106 | 100 | % | ||||||||||||||||||||||||||||||||||||||||
| The Alloy | College Park, Maryland | Residential/Living | 11/2019; $98.0 | 5.0% | 230,362 | 87 | % | ||||||||||||||||||||||||||||||||||||||||
| DSG Bristol | Bristol, United Kingdom | Industrial | 11/2019; $47.0 | 5.0% | 265,000 | 100 | % | ||||||||||||||||||||||||||||||||||||||||
| Royal Mail | Edinburgh, United Kingdom | Industrial | 12/2019; $33.4 | 5.3% | 212,028 | 100 | % | ||||||||||||||||||||||||||||||||||||||||
| The Emerson | Centreville, Virginia | Residential/Living | 01/2020; $117.0 | 4.5% | 328,341 | 80 | % | ||||||||||||||||||||||||||||||||||||||||
| Madrid Airport Complex | Madrid, Spain | Industrial | 6/2020; $33.2 | 12.7% | 467,014 | 100 | % | ||||||||||||||||||||||||||||||||||||||||
| Total for All Investments | 8,883,133 | 95 | % | ||||||||||||||||||||||||||||||||||||||||||||
| Property | Location | Investment Type | Date Acquired/ Net Purchase Price (in millions) (1) | Estimated Going-in Capitalization Rate (2) | Leasable Square Feet | Percent Leased | |||||||||
| Bishop’s Square | Dublin, Ireland | Office | 3/2015; $103.2 | 6.1% | 182,370 | 100 | % | ||||||||
| Domain Apartments | Las Vegas, Nevada | Residential/Living | 1/2016; $58.1 | 5.5% | 331,038 | 96 | % | ||||||||
| Cottonwood Corporate Center | Salt Lake City, Utah | Office | 7/2016; $139.2 | 6.9% | 487,283 | 97 | % | ||||||||
| Goodyear Crossing II | Phoenix, Arizona | Industrial | 8/2016; $56.2 | 8.5% | 820,384 | 100 | % | ||||||||
| Rookwood | Cincinnati, Ohio | Retail | 1/2017; $193.7 | 6.0% | 567,335 | 96 | % | ||||||||
| Montrose Student Residences | Dublin, Ireland | Residential/Living | 3/2017; $40.6 | 5.5% | 53,835 | 100 | % | (3) | |||||||
| Queen’s Court Student Residences | Reading, United Kingdom | Residential/Living | 10/2017; $65.3 | 6.2% | 79,115 | 91 | % | (3) | |||||||
| Venue Museum District | Houston, Texas | Residential/Living | 9/2018; $72.9 | 3.9% | 294,964 | 93 | % | ||||||||
| Fresh Park Venlo | Venlo, Netherlands | Industrial | 10/2018; $136.3 | 6.7% | 2,863,628 | 93 | % | ||||||||
| Maintal Logistics | Frankfurt, Germany | Industrial | 12/2018; $43.8 | 5.7% | 387,253 | 96 | % | ||||||||
| ABC Westland | The Hague, Netherlands | Industrial | 5/2019; $130.3 | 6.2% | 1,268,515 | 97 | % | ||||||||
| Total for All Investments | 7,335,720 | 96 | % | ||||||||||||
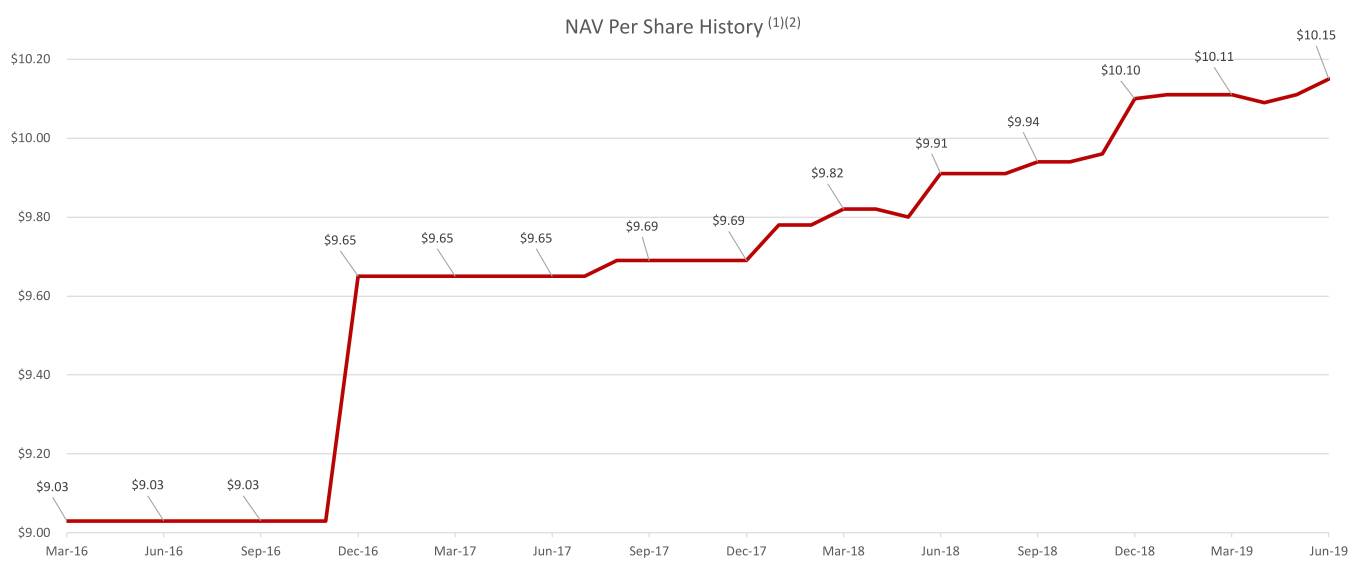
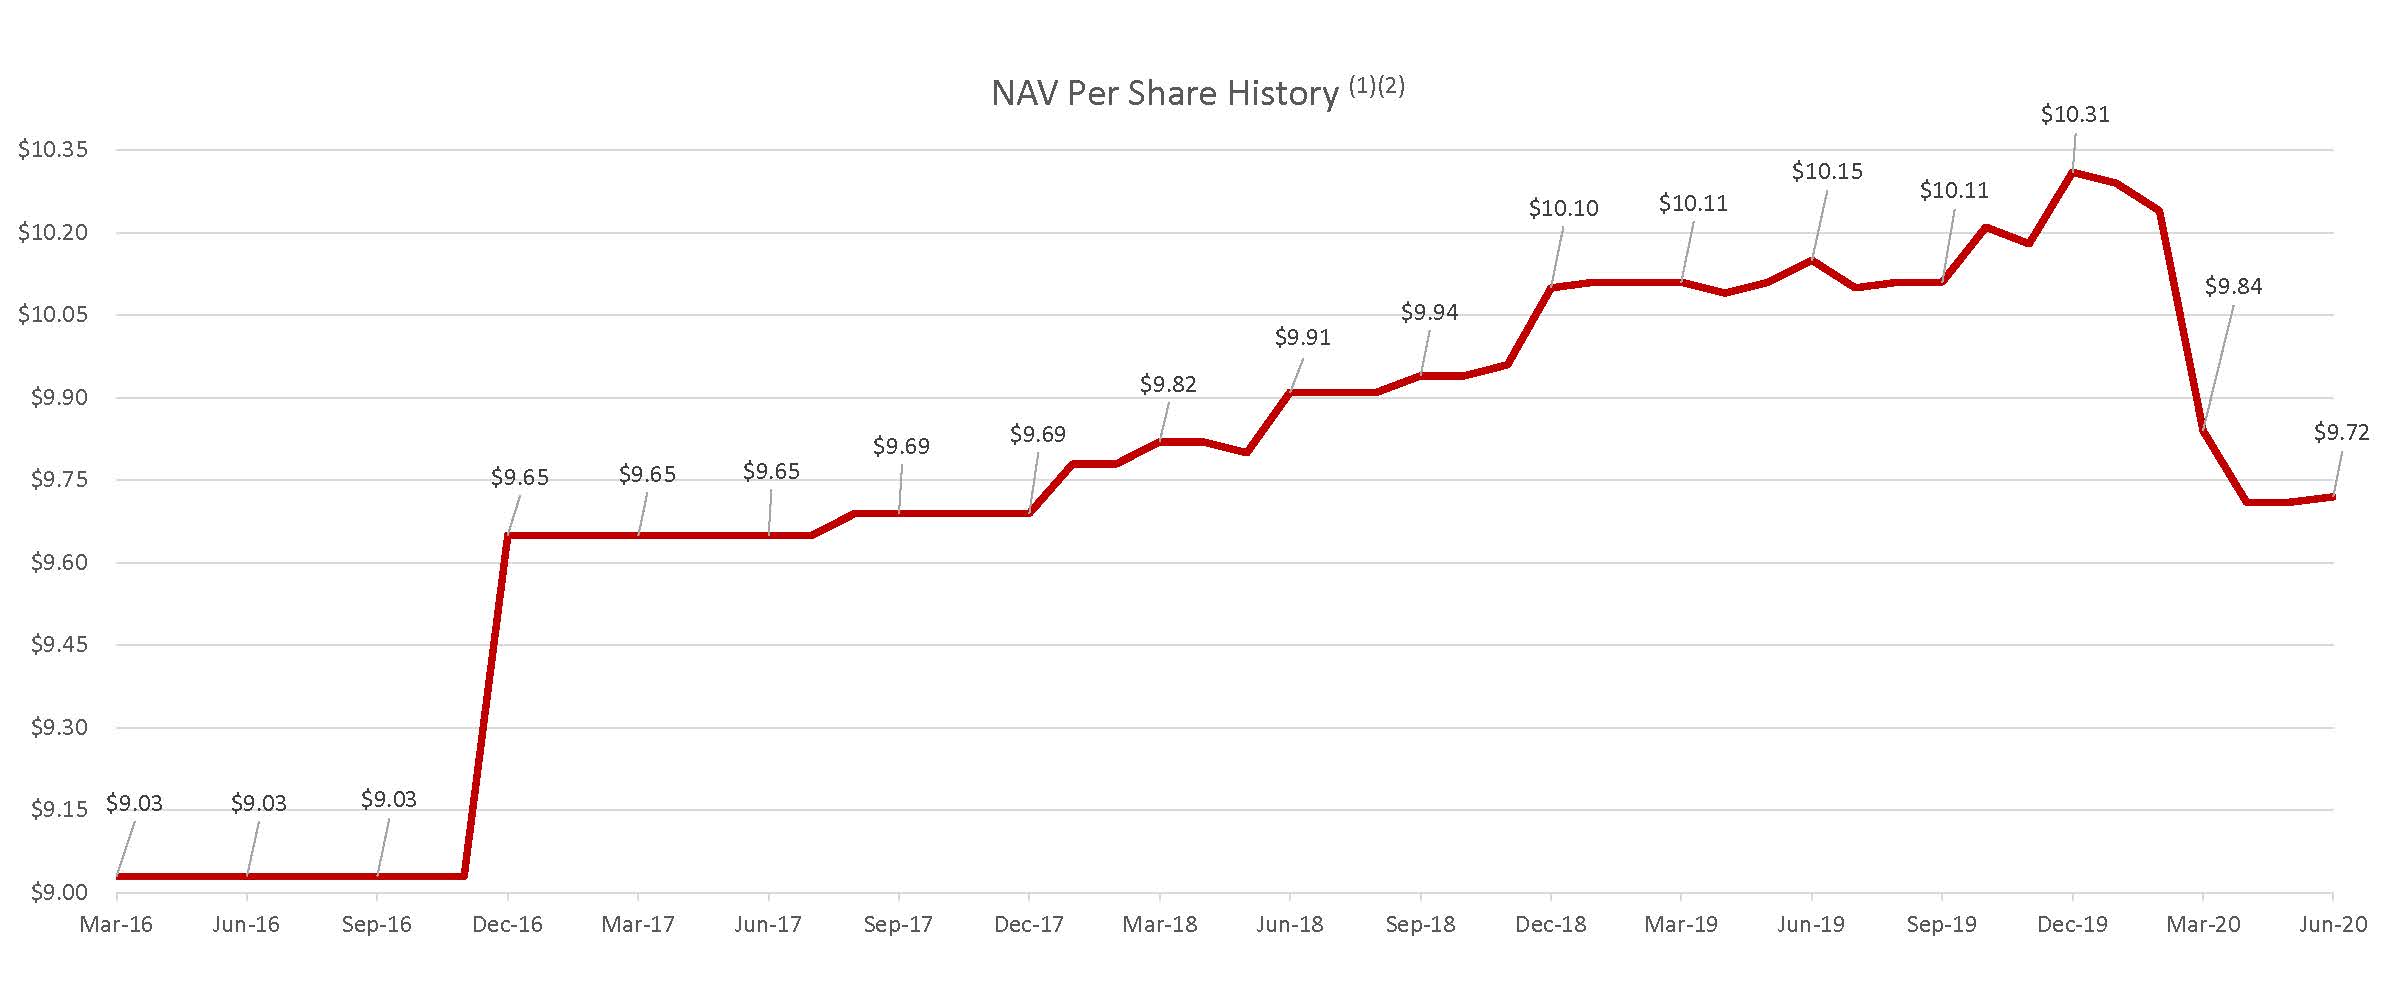
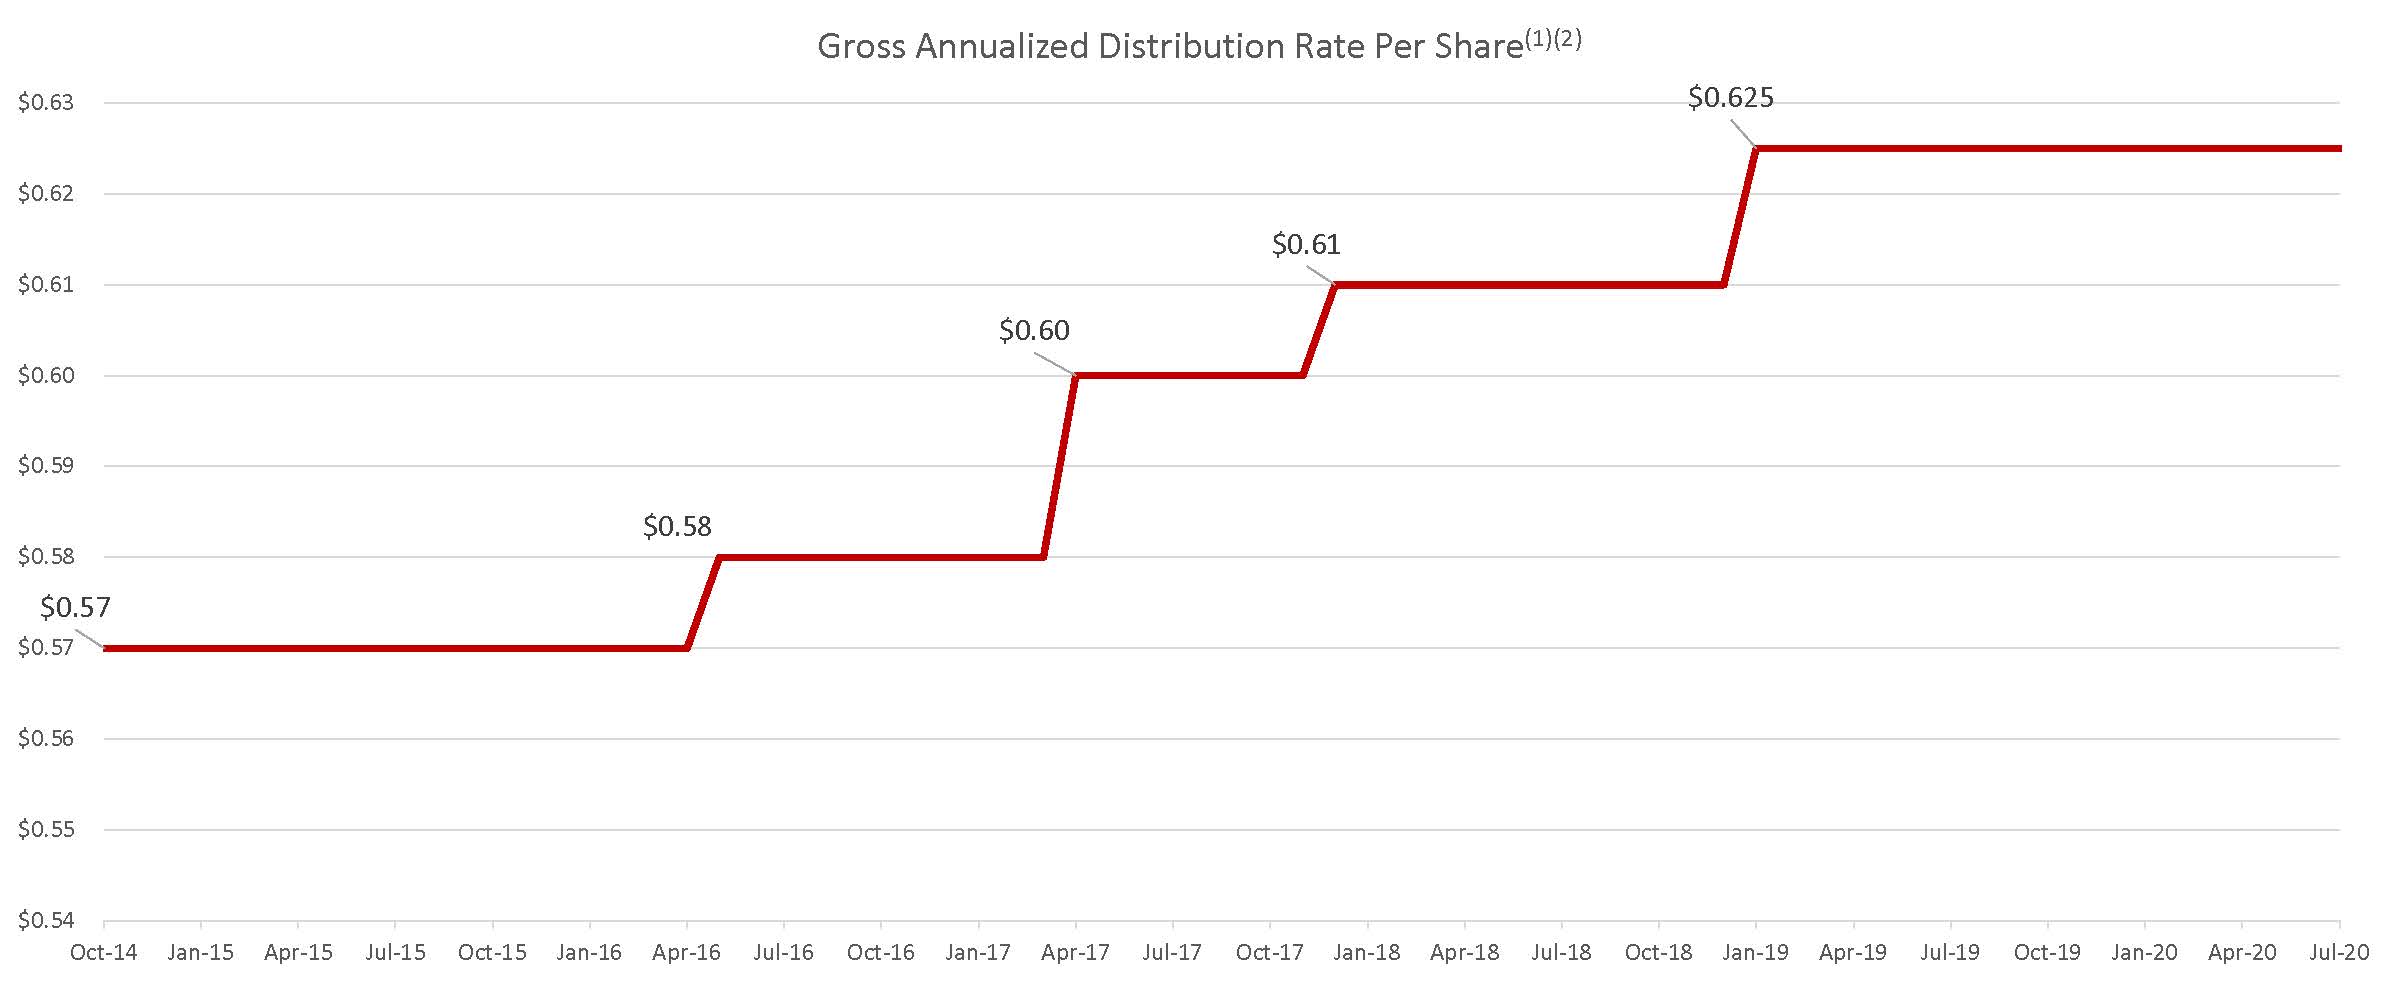
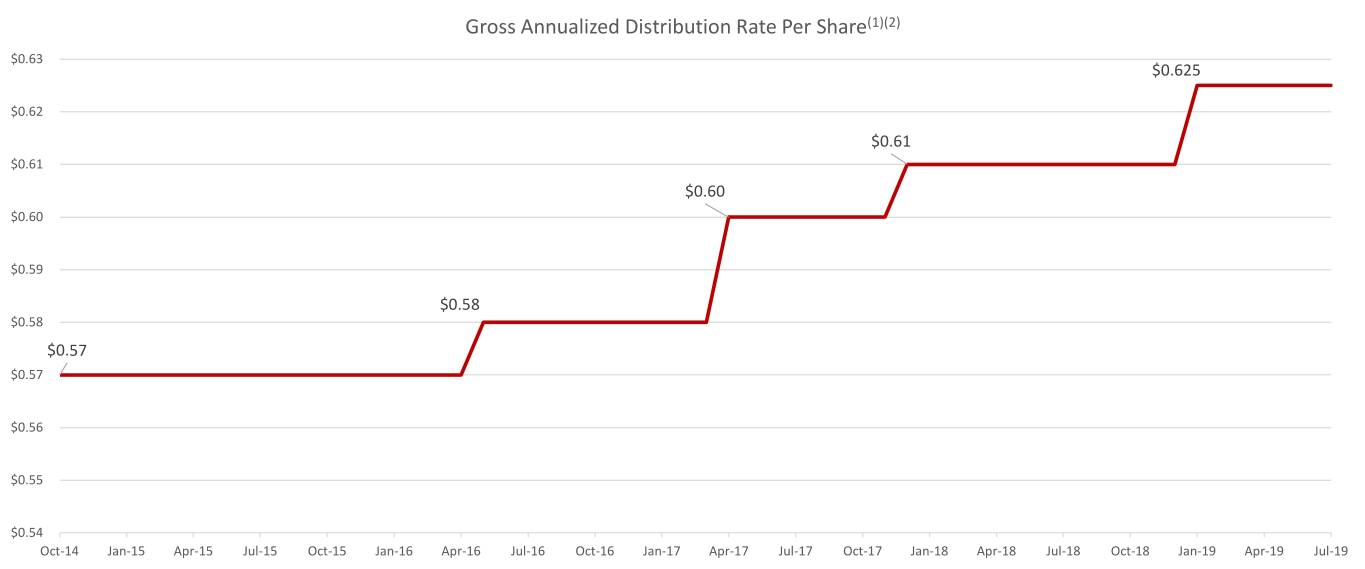
| As of June 30, 2019 | |||||||||
| Shares Class | 1-Year | 3-Year | ITD | ||||||
| Class AX Shares (No Sales Load) | 8.92 | % | 11.82 | % | 11.04 | % | |||
| Class AX Shares (With Sales Load) | N/A | 6.96 | % | 7.57 | % | ||||
| Class TX Shares (No Sales Load) | 7.84 | % | 10.51 | % | 10.23 | % | |||
| Class TX Shares (With Sales Load) | N/A | 8.08 | % | 8.20 | % | ||||
| Class IX Shares (No Sales Load) | 8.65 | % | N/A | 9.08 | % | ||||
| Class IX Shares (With Sales Load) | N/A | N/A | 8.62 | % | |||||
| As of June 30, 2020 | ||||||||||||||||||||
Shares Class (1) | 1-Year | ITD | ||||||||||||||||||
Class I Shares (2) | 1.90 | % | 6.50 | % | ||||||||||||||||
Class D Shares (2) | 1.64 | % | 6.24 | % | ||||||||||||||||
Class S Shares (No Sales Load) (3) | 0.88 | % | 5.45 | % | ||||||||||||||||
Class S Shares (With Sales Load) (4) | (2.67) | % | 3.96 | % | ||||||||||||||||
Class T Shares (No Sales Load) (3) | 0.88 | % | 5.45 | % | ||||||||||||||||
Class T Shares (With Sales Load) (4) | (2.67) | % | 3.96 | % | ||||||||||||||||
| As of June 30, 2020 | ||||||||||||||||||||
Shares Class (1) | 1-Year | 3-Year | ITD | |||||||||||||||||
| Class AX Shares (No Sales Load) | 1.90 | % | 6.65 | % | 7.95 | % | ||||||||||||||
| Class AX Shares (With Sales Load) | N/A | 3.23 | % | 5.83 | % | |||||||||||||||
| Class TX Shares (No Sales Load) | 0.88 | % | 5.59 | % | 7.27 | % | ||||||||||||||
| Class TX Shares (With Sales Load) | N/A | 4.13 | % | 6.00 | % | |||||||||||||||
| Class IX Shares (No Sales Load) | 1.64 | % | 6.38 | % | 6.37 | % | ||||||||||||||
| Class IX Shares (With Sales Load) | N/A | 6.09 | % | 6.10 | % | |||||||||||||||
| As of June 30, 2019 | ||||||
| Shares Class | 1-Year | ITD | ||||
| Class I Shares | 8.92 | % | 9.94 | % | ||
| Class D Shares | 8.65 | % | 9.65 | % | ||
| Class S Shares (No Sales Load) | 7.84 | % | 8.81 | % | ||
| Class S Shares (With Sales Load) | 4.07 | % | 6.16 | % | ||
| Class T Shares (No Sales Load) | 7.84 | % | 8.81 | % | ||
| Class T Shares (With Sales Load) | 4.07 | % | 6.16 | % | ||
| Stockholders | Distributions Paid With Cash Flows From Operating Activities (1) | |||||||||||||||||||||||||||||||||||||||||||||||||||||||||||||||||||
| Distributions for the Three Months Ended | Cash Distributions | Distributions Reinvested | Total Declared | |||||||||||||||||||||||||||||||||||||||||||||||||||||||||||||||||
| 2020 | ||||||||||||||||||||||||||||||||||||||||||||||||||||||||||||||||||||
| June 30, 2020 | $ | 6,262 | $ | 7,190 | $ | 13,452 | $ | — | — | % | ||||||||||||||||||||||||||||||||||||||||||||||||||||||||||
| March 31, 2020 | 5,669 | 6,732 | 12,401 | — | — | % | ||||||||||||||||||||||||||||||||||||||||||||||||||||||||||||||
| Total | $ | 11,931 | $ | 13,922 | $ | 25,853 | $ | — | — | % | ||||||||||||||||||||||||||||||||||||||||||||||||||||||||||
| 2019 | ||||||||||||||||||||||||||||||||||||||||||||||||||||||||||||||||||||
| December 31, 2019 | $ | 4,992 | $ | 6,092 | $ | 11,084 | $ | 11,087 | 100 | % | ||||||||||||||||||||||||||||||||||||||||||||||||||||||||||
| September 30, 2019 | 4,383 | 5,325 | 9,708 | 9,711 | 100 | % | ||||||||||||||||||||||||||||||||||||||||||||||||||||||||||||||
| June 30, 2019 | 3,647 | 4,415 | 8,062 | — | — | % | ||||||||||||||||||||||||||||||||||||||||||||||||||||||||||||||
| March 31, 2019 | 3,090 | 3,614 | 6,704 | — | — | % | ||||||||||||||||||||||||||||||||||||||||||||||||||||||||||||||
| Total | $ | 16,112 | $ | 19,446 | $ | 35,558 | $ | 20,798 | 58 | % | ||||||||||||||||||||||||||||||||||||||||||||||||||||||||||
| Stockholders | Distributions Paid With Cash Flows From Operating Activities (1) | ||||||||||||||||||
| Distributions for the Three Months Ended | Cash Distributions | Distributions Reinvested | Total Declared | ||||||||||||||||
| 2019 | |||||||||||||||||||
| June 30, 2019 | $ | 3,647 | $ | 4,415 | $ | 8,062 | $ | — | — | % | |||||||||
| March 31, 2019 | 3,090 | 3,614 | 6,704 | — | — | % | |||||||||||||
| Total | $ | 6,737 | $ | 8,029 | $ | 14,766 | $ | — | — | % | |||||||||
| 2018 | |||||||||||||||||||
| December 31, 2018 | $ | 2,765 | $ | 3,168 | $ | 5,933 | $ | 3,091 | 52 | % | |||||||||
| September 30, 2018 | 2,617 | 3,034 | 5,651 | 5,654 | 100 | % | |||||||||||||
| June 30, 2018 | 2,554 | 2,974 | 5,528 | 2,065 | 37 | % | |||||||||||||
| March 31, 2018 | 2,544 | 2,970 | 5,514 | 4,674 | 85 | % | |||||||||||||
| Total | $ | 10,480 | $ | 12,146 | $ | 22,626 | $ | 15,484 | 68 | % | |||||||||
| Three Months Ended June 30, | Change | |||||||||||||
| 2019 | 2018 | $ | % | |||||||||||
Property revenues in excess of expenses(1) | ||||||||||||||
| Same-store properties | ||||||||||||||
| Domestic office investments | $ | 2,813 | $ | 2,852 | $ | (39 | ) | (1 | )% | |||||
| Domestic residential/living investments | 838 | 816 | 22 | 3 | % | |||||||||
| Domestic retail investments | 2,816 | 3,245 | (429 | ) | (2) | (13 | )% | |||||||
| Domestic industrial investments | 958 | 1,009 | (51 | ) | (5 | )% | ||||||||
| International office investments | 1,533 | 1,522 | 11 | 1 | % | |||||||||
| International residential/living investments | 1,542 | 1,520 | 22 | 1 | % | |||||||||
| Total same-store properties | $ | 10,500 | $ | 10,964 | $ | (464 | ) | (4 | )% | |||||
| Recent acquisitions | 4,245 | — | 4,245 | 100 | % | |||||||||
| Disposed properties | — | (20 | ) | 20 | (100 | )% | ||||||||
| Total property revenues in excess of expenses | $ | 14,745 | $ | 10,944 | $ | 3,801 | 35 | % | ||||||
| Six Months Ended June 30, | Change | |||||||||||||
| 2019 | 2018 | $ | % | |||||||||||
Property revenues in excess of expenses(1) | ||||||||||||||
| Same-store properties | ||||||||||||||
| Domestic office investments | $ | 5,710 | $ | 5,572 | $ | 138 | 2 | % | ||||||
| Domestic residential/living investments | 1,687 | 1,590 | 97 | 6 | % | |||||||||
| Domestic retail investments | 5,628 | 6,407 | (779 | ) | (2) | (12 | )% | |||||||
| Domestic industrial investments | 1,656 | 2,036 | (380 | ) | (3) | (19 | )% | |||||||
| International office investments | 2,480 | 3,124 | (644 | ) | (4) | (21 | )% | |||||||
| International residential/living investments | 3,066 | 3,244 | (178 | ) | (5 | )% | ||||||||
| Total same-store properties | $ | 20,227 | $ | 21,973 | $ | (1,746 | ) | (8 | )% | |||||
| Recent acquisitions | 7,417 | — | 7,417 | 100 | % | |||||||||
| Disposed properties | — | 483 | (483 | ) | (100 | )% | ||||||||
| Total property revenues in excess of expenses | $ | 27,644 | $ | 22,456 | $ | 5,188 | 23 | % | ||||||
| Three Months Ended June 30, | Change | ||||||||||||||||||||||||||||||||||
| 2020 | 2019 | $ | % | ||||||||||||||||||||||||||||||||
| Revenues: | |||||||||||||||||||||||||||||||||||
| Rental revenue | $ | 27,001 | $ | 23,018 | $ | 3,983 | 17 | % | |||||||||||||||||||||||||||
| Other revenue | 813 | 536 | 277 | 52 | % | ||||||||||||||||||||||||||||||
| Total revenues | 27,814 | 23,554 | 4,260 | 18 | % | ||||||||||||||||||||||||||||||
| Expenses: | |||||||||||||||||||||||||||||||||||
| Property operating expenses | 7,139 | 5,170 | 1,969 | 38 | % | ||||||||||||||||||||||||||||||
| Real property taxes | 3,489 | 2,699 | 790 | 29 | % | ||||||||||||||||||||||||||||||
| Property management fees | 1,192 | 940 | 252 | 27 | % | ||||||||||||||||||||||||||||||
| Depreciation and amortization | 14,457 | 9,741 | 4,716 | 48 | % | ||||||||||||||||||||||||||||||
| Acquisition related expenses | 274 | 13 | 261 | N/A* | |||||||||||||||||||||||||||||||
| Asset management fees | 2,747 | 1,801 | 946 | 53 | % | ||||||||||||||||||||||||||||||
| Performance participation allocation | — | 1,476 | (1,476) | (100) | % | ||||||||||||||||||||||||||||||
| General and administrative expenses | 1,286 | 948 | 338 | 36 | % | ||||||||||||||||||||||||||||||
| Total expenses | 30,584 | 22,788 | 7,796 | 34 | % | ||||||||||||||||||||||||||||||
| Other income (expenses): | |||||||||||||||||||||||||||||||||||
| Gain (loss) on derivative instruments | 1,514 | (77) | 1,591 | N/A* | |||||||||||||||||||||||||||||||
| Gain (loss) on investments in real estate-related securities | 3,136 | 161 | 2,975 | N/A* | |||||||||||||||||||||||||||||||
| Gain on sale of real estate | 80,457 | — | 80,457 | N/A* | |||||||||||||||||||||||||||||||
| Foreign currency gains (losses) | 1,374 | (267) | 1,641 | N/A* | |||||||||||||||||||||||||||||||
| Interest expense | (4,463) | (4,317) | (146) | (3) | % | ||||||||||||||||||||||||||||||
| Interest and other income | 159 | 244 | (85) | (35) | % | ||||||||||||||||||||||||||||||
| Income (loss) before benefit (provision) for income taxes | 79,407 | (3,490) | 82,897 | N/A* | |||||||||||||||||||||||||||||||
| Benefit (provision) for income taxes | 1,906 | 40 | 1,866 | N/A* | |||||||||||||||||||||||||||||||
| Provision for income taxes related to sale of real estate | (7,773) | — | (7,773) | N/A* | |||||||||||||||||||||||||||||||
| Net income (loss) | $ | 73,540 | $ | (3,450) | $ | 76,990 | N/A* | ||||||||||||||||||||||||||||
| Three Months Ended June 30, | Change | |||||||||||||
| 2019 | 2018 | $ | % | |||||||||||
| Other | ||||||||||||||
| Depreciation and amortization | $ | 9,741 | $ | 6,959 | $ | 2,782 | 40 | % | ||||||
| Acquisition related expenses | $ | 13 | $ | 10 | $ | 3 | 30 | % | ||||||
| Asset management fees | $ | 1,801 | $ | 1,214 | $ | 587 | 48 | % | ||||||
| Performance participation allocation | $ | 1,476 | $ | 1,185 | $ | 291 | 25 | % | ||||||
| General and administrative expenses | $ | 948 | $ | 659 | $ | 289 | 44 | % | ||||||
| Interest expense | $ | 4,317 | $ | 2,677 | $ | 1,640 | 61 | % | ||||||
| Benefit (provision) for income taxes | $ | 40 | $ | 654 | $ | (614 | ) | (94 | )% | |||||
| Three Months Ended June 30, | Change | ||||||||||||||||||||||||||||||||||
| 2020 | 2019 | $ | % | ||||||||||||||||||||||||||||||||
| Revenues | |||||||||||||||||||||||||||||||||||
| Same-store properties | |||||||||||||||||||||||||||||||||||
| Domestic office investments | $ | 3,835 | $ | 4,128 | $ | (293) | (1) | (7) | % | ||||||||||||||||||||||||||
| Domestic residential/living investments | 1,461 | 1,464 | (3) | — | % | ||||||||||||||||||||||||||||||
| Domestic retail investments | 3,207 | 4,903 | (1,696) | (2) | (35) | % | |||||||||||||||||||||||||||||
| International industrial investments | 4,637 | 4,687 | (50) | (1) | % | ||||||||||||||||||||||||||||||
| International residential/living investments | 1,216 | 2,242 | (1,026) | (3) | (46) | % | |||||||||||||||||||||||||||||
| Total same-store properties | $ | 14,356 | $ | 17,424 | $ | (3,068) | (18) | % | |||||||||||||||||||||||||||
| Recent acquisitions | 12,929 | 1,895 | 11,034 | N/A* | |||||||||||||||||||||||||||||||
| Disposed properties | 529 | 4,235 | (3,706) | (88) | % | ||||||||||||||||||||||||||||||
| Total revenues | $ | 27,814 | $ | 23,554 | $ | 4,260 | 18 | % | |||||||||||||||||||||||||||
| Three Months Ended June 30, | Change | ||||||||||||||||||||||||||||||||||
| 2020 | 2019 | $ | % | ||||||||||||||||||||||||||||||||
Property operating expenses(1) | |||||||||||||||||||||||||||||||||||
| Same-store properties | |||||||||||||||||||||||||||||||||||
| Domestic office investments | $ | 1,235 | $ | 1,315 | $ | (80) | (6) | % | |||||||||||||||||||||||||||
| Domestic residential/living investments | 972 | 960 | 12 | 1 | % | ||||||||||||||||||||||||||||||
| Domestic retail investments | 2,010 | 2,087 | (77) | (4) | % | ||||||||||||||||||||||||||||||
| International industrial investments | 2,074 | 1,984 | 90 | 5 | % | ||||||||||||||||||||||||||||||
| International residential/living investments | 600 | 694 | (94) | (14) | % | ||||||||||||||||||||||||||||||
| Total same-store properties | $ | 6,891 | $ | 7,040 | $ | (149) | (2) | % | |||||||||||||||||||||||||||
| Recent acquisitions | 4,767 | 855 | 3,912 | N/A* | |||||||||||||||||||||||||||||||
| Disposed properties | 162 | 914 | (752) | (82) | % | ||||||||||||||||||||||||||||||
| Total property operating expenses | $ | 11,820 | $ | 8,809 | $ | 3,011 | 34 | % | |||||||||||||||||||||||||||
| Three Months Ended June 30, | Change | ||||||||||||||||||||||||||||||||||
| 2020 | 2019 | $ | % | ||||||||||||||||||||||||||||||||
Revenues in excess of property operating expenses(1) | |||||||||||||||||||||||||||||||||||
| Same-store properties | |||||||||||||||||||||||||||||||||||
| Domestic office investments | $ | 2,600 | $ | 2,813 | $ | (213) | (2) | (8) | % | ||||||||||||||||||||||||||
| Domestic residential/living investments | 489 | 504 | (15) | (3) | % | ||||||||||||||||||||||||||||||
| Domestic retail investments | 1,197 | 2,816 | (1,619) | (2) | (57) | % | |||||||||||||||||||||||||||||
| International industrial investments | 2,563 | 2,703 | (140) | (5) | % | ||||||||||||||||||||||||||||||
| International residential/living investments | 616 | 1,548 | (932) | (2) | (60) | % | |||||||||||||||||||||||||||||
| Total same-store properties | $ | 7,465 | $ | 10,384 | $ | (2,919) | (28) | % | |||||||||||||||||||||||||||
| Recent acquisitions | 8,162 | 1,040 | 7,122 | N/A* | |||||||||||||||||||||||||||||||
| Disposed properties | 367 | 3,321 | (2,954) | (89) | % | ||||||||||||||||||||||||||||||
| Total revenues in excess of property operating expenses | $ | 15,994 | $ | 14,745 | $ | 1,249 | 8 | % | |||||||||||||||||||||||||||
| Six Months Ended June 30, | Change | |||||||||||||
| 2019 | 2018 | $ | % | |||||||||||
| Other | ||||||||||||||
| Depreciation and amortization | $ | 19,069 | $ | 14,300 | $ | 4,769 | 33 | % | ||||||
| Acquisition related expenses | $ | 17 | $ | 144 | $ | (127 | ) | (88 | )% | |||||
| Asset management fees | $ | 3,288 | $ | 2,420 | $ | 868 | 36 | % | ||||||
| Performance participation allocation | $ | 2,597 | $ | 2,777 | $ | (180 | ) | (6 | )% | |||||
| General and administrative expenses | $ | 1,795 | $ | 1,511 | $ | 284 | 19 | % | ||||||
| Gain on sale of real estate | $ | — | $ | 14,491 | $ | (14,491 | ) | N/A* | ||||||
| Interest expense | $ | 8,514 | $ | 5,491 | $ | 3,023 | 55 | % | ||||||
| Benefit (provision) for income taxes | $ | 11 | $ | (20 | ) | $ | 31 | (155 | )% | |||||
| Six Months Ended June 30, | Change | ||||||||||||||||||||||||||||||||||
| 2020 | 2019 | $ | % | ||||||||||||||||||||||||||||||||
| Revenues: | |||||||||||||||||||||||||||||||||||
| Rental revenue | $ | 60,120 | $ | 44,468 | $ | 15,652 | 35 | % | |||||||||||||||||||||||||||
| Other revenue | 1,539 | 823 | 716 | 87 | % | ||||||||||||||||||||||||||||||
| Total revenues | 61,659 | 45,291 | 16,368 | 36 | % | ||||||||||||||||||||||||||||||
| Expenses: | |||||||||||||||||||||||||||||||||||
| Property operating expenses | 15,213 | 10,706 | 4,507 | 42 | % | ||||||||||||||||||||||||||||||
| Real property taxes | 6,971 | 5,297 | 1,674 | 32 | % | ||||||||||||||||||||||||||||||
| Property management fees | 2,549 | 1,644 | 905 | 55 | % | ||||||||||||||||||||||||||||||
| Depreciation and amortization | 30,686 | 19,069 | 11,617 | 61 | % | ||||||||||||||||||||||||||||||
| Acquisition related expenses | 291 | 17 | 274 | N/A* | |||||||||||||||||||||||||||||||
| Asset management fees | 5,538 | 3,288 | 2,250 | 68 | % | ||||||||||||||||||||||||||||||
| Performance participation allocation | — | 2,597 | (2,597) | (100) | % | ||||||||||||||||||||||||||||||
| General and administrative expenses | 2,324 | 1,795 | 529 | 29 | % | ||||||||||||||||||||||||||||||
| Total expenses | 63,572 | 44,413 | 19,159 | 43 | % | ||||||||||||||||||||||||||||||
| Other income (expenses): | |||||||||||||||||||||||||||||||||||
| Gain (loss) on derivative instruments | 8,470 | (1,187) | 9,657 | N/A* | |||||||||||||||||||||||||||||||
| Gain (loss) on investments in real estate-related securities | (4,601) | 1,327 | (5,928) | N/A* | |||||||||||||||||||||||||||||||
| Gain on sale of real estate | 130,101 | — | 130,101 | N/A* | |||||||||||||||||||||||||||||||
| Foreign currency gains (losses) | (1,145) | (336) | (809) | N/A* | |||||||||||||||||||||||||||||||
| Interest expense | (10,395) | (8,514) | (1,881) | (22) | % | ||||||||||||||||||||||||||||||
| Interest and other income | 710 | 372 | 338 | 91 | % | ||||||||||||||||||||||||||||||
| Income (loss) before benefit (provision) for income taxes | 121,227 | (7,460) | 128,687 | N/A* | |||||||||||||||||||||||||||||||
| Benefit (provision) for income taxes | 1,838 | 11 | 1,827 | N/A* | |||||||||||||||||||||||||||||||
| Provision for income taxes related to sale of real estate | (7,773) | — | (7,773) | N/A* | |||||||||||||||||||||||||||||||
| Net income (loss) | $ | 115,292 | $ | (7,449) | $ | 122,741 | N/A* | ||||||||||||||||||||||||||||
| Six months ended June 30, | Change | ||||||||||||||||||||||||||||||||||
| 2020 | 2019 | $ | % | ||||||||||||||||||||||||||||||||
| Revenues | |||||||||||||||||||||||||||||||||||
| Same-store properties | |||||||||||||||||||||||||||||||||||
| Domestic office investments | $ | 7,771 | $ | 8,337 | $ | (566) | (1) | (7) | % | ||||||||||||||||||||||||||
| Domestic residential/living investments | 2,943 | 2,943 | — | — | % | ||||||||||||||||||||||||||||||
| Domestic retail investments | 7,901 | 9,852 | (1,951) | (2) | (20) | % | |||||||||||||||||||||||||||||
| International industrial investments | 9,440 | 9,440 | — | — | % | ||||||||||||||||||||||||||||||
| International residential/living investments | 3,464 | 4,319 | (855) | (3) | (20) | % | |||||||||||||||||||||||||||||
| Total same-store properties | $ | 31,519 | $ | 34,891 | $ | (3,372) | (10) | % | |||||||||||||||||||||||||||
| Recent acquisitions | 26,480 | 1,895 | 24,585 | N/A* | |||||||||||||||||||||||||||||||
| Disposed properties | 3,660 | 8,505 | (4,845) | (57) | % | ||||||||||||||||||||||||||||||
| Total revenues | $ | 61,659 | $ | 45,291 | $ | 16,368 | 36 | % | |||||||||||||||||||||||||||
| Six months ended June 30, | Change | ||||||||||||||||||||||||||||||||||
| 2020 | 2019 | $ | % | ||||||||||||||||||||||||||||||||
Property operating expenses(1) | |||||||||||||||||||||||||||||||||||
| Same-store properties | |||||||||||||||||||||||||||||||||||
| Domestic office investments | $ | 2,608 | $ | 2,628 | $ | (20) | (1) | % | |||||||||||||||||||||||||||
| Domestic residential/living investments | 1,968 | 1,837 | 131 | (2) | 7 | % | |||||||||||||||||||||||||||||
| Domestic retail investments | 4,073 | 4,225 | (152) | (4) | % | ||||||||||||||||||||||||||||||
| International industrial investments | 4,215 | 4,159 | 56 | 1 | % | ||||||||||||||||||||||||||||||
| International residential/living investments | 1,270 | 1,247 | 23 | 2 | % | ||||||||||||||||||||||||||||||
| Total same-store properties | $ | 14,134 | $ | 14,096 | $ | 38 | — | % | |||||||||||||||||||||||||||
| Recent acquisitions | 9,638 | 855 | 8,783 | N/A* | |||||||||||||||||||||||||||||||
| Disposed properties | 961 | 2,696 | (1,735) | (64) | % | ||||||||||||||||||||||||||||||
| Total property operating expenses | $ | 24,733 | $ | 17,647 | $ | 7,086 | 40 | % | |||||||||||||||||||||||||||
| Six months ended June 30, | Change | ||||||||||||||||||||||||||||||||||
| 2020 | 2019 | $ | % | ||||||||||||||||||||||||||||||||
Revenues in excess of property operating expenses(1) | |||||||||||||||||||||||||||||||||||
| Same-store properties | |||||||||||||||||||||||||||||||||||
| Domestic office investments | $ | 5,163 | $ | 5,709 | $ | (546) | (2) | (10) | % | ||||||||||||||||||||||||||
| Domestic residential/living investments | 975 | 1,106 | (131) | (2) | (12) | % | |||||||||||||||||||||||||||||
| Domestic retail investments | 3,828 | 5,627 | (1,799) | (2) | (32) | % | |||||||||||||||||||||||||||||
| International industrial investments | 5,225 | 5,281 | (56) | (1) | % | ||||||||||||||||||||||||||||||
| International residential/living investments | 2,194 | 3,072 | (878) | (2) | (29) | % | |||||||||||||||||||||||||||||
| Total same-store properties | $ | 17,385 | $ | 20,795 | $ | (3,410) | (16) | % | |||||||||||||||||||||||||||
| Recent acquisitions | 16,842 | 1,040 | 15,802 | N/A* | |||||||||||||||||||||||||||||||
| Disposed properties | 2,699 | 5,809 | (3,110) | (54) | % | ||||||||||||||||||||||||||||||
| Total revenues in excess of property operating expenses | $ | 36,926 | $ | 27,644 | $ | 9,282 | 34 | % | |||||||||||||||||||||||||||
| Three Months Ended June 30, | Six Months Ended June 30, | Period from July 31, 2013 (date of inception) through June 30, 2020 | ||||||||||||||||||||||||||||||||||||||||||
| 2020 | 2019 | 2020 | 2019 | |||||||||||||||||||||||||||||||||||||||||
| Net income (loss) | $ | 73,540 | $ | (3,450) | $ | 115,292 | $ | (7,449) | $ | 59,372 | ||||||||||||||||||||||||||||||||||
Depreciation and amortization (1) | 14,457 | 9,741 | 30,686 | 19,069 | 158,672 | |||||||||||||||||||||||||||||||||||||||
| Gain on sale of real estate | (80,457) | — | (130,101) | — | (144,592) | |||||||||||||||||||||||||||||||||||||||
| Taxes related to sale of real estate | 7,773 | — | 7,773 | — | 7,773 | |||||||||||||||||||||||||||||||||||||||
(Gain) loss on securities (2) | (3,136) | (161) | 4,601 | (1,327) | 2,686 | |||||||||||||||||||||||||||||||||||||||
Adjustments for noncontrolling interests (3) | — | (7) | — | (15) | 117 | |||||||||||||||||||||||||||||||||||||||
| Funds From Operations attributable to common stockholders | $ | 12,177 | $ | 6,123 | $ | 28,251 | $ | 10,278 | $ | 84,028 | ||||||||||||||||||||||||||||||||||
| Basic and diluted income (loss) per common share | $ | 0.77 | $ | (0.06) | $ | 1.23 | $ | (0.14) | $ | 1.95 | ||||||||||||||||||||||||||||||||||
| Funds From Operations attributable to common stockholders per common share | $ | 0.13 | $ | 0.11 | $ | 0.30 | $ | 0.20 | $ | 2.75 | ||||||||||||||||||||||||||||||||||
| Weighted average shares outstanding | 95,490 | 57,004 | 93,900 | 52,049 | 30,580 | |||||||||||||||||||||||||||||||||||||||
| Three Months Ended June 30, | Six Months Ended June 30, | Period from July 31, 2013 (date of inception) through June 30, 2019 | |||||||||||||||||
| 2019 | 2018 | 2019 | 2018 | ||||||||||||||||
| Net income (loss) | $ | (3,450 | ) | $ | (1,408 | ) | $ | (7,449 | ) | $ | 9,968 | $ | (43,821 | ) | |||||
Depreciation and amortization (1) | 9,741 | 6,959 | 19,069 | 14,300 | 100,862 | ||||||||||||||
| Gain on sale of real estate | — | — | — | (14,491 | ) | (14,491 | ) | ||||||||||||
Adjustments for noncontrolling interests (2) | (7 | ) | (7 | ) | (15 | ) | (6 | ) | 124 | ||||||||||
| Funds From Operations attributable to common stockholders | $ | 6,284 | $ | 5,544 | $ | 11,605 | $ | 9,771 | $ | 42,674 | |||||||||
| Basic and diluted income (loss) per common share | $ | (0.06 | ) | $ | (0.04 | ) | $ | (0.14 | ) | $ | 0.25 | $ | (2.03 | ) | |||||
| Funds From Operations attributable to common stockholders per common share | $ | 0.11 | $ | 0.14 | $ | 0.22 | $ | 0.25 | $ | 1.98 | |||||||||
| Weighted average shares outstanding | 57,004 | 39,489 | 52,049 | 39,443 | 21,526 | ||||||||||||||
•As of December 6, 2017, through its ownership of the special limited partner interest in the Operating Partnership, our Advisor is entitled to an annual performance participation allocation of 12.5% of the Operating Partnership’s total return subject to the Company earning a 5% total return annually, after considering the effect of any losses carried forward from the prior year. The performance participation allocation accrues monthly and is payable after the completion of each calendar year. We do not consider the performance participation allocation in evaluating our operating performance. For the three and six months ended June 30, 2020, we did not incur any performance participation allocation fees. For the three and six months ended June 30, 2019, we incurred $1.5 million and $2.6 million in performance participation allocation fees, respectively. Total performance participation allocation fees incurred were $13.9 million from inception through June 30, 2020. Refer to Note 7—Related Party Transactions for more information on the performance participation allocation. 49 •For the three and six months ended June 30, 2020, we recorded adjustments primarily related to amortization of out-of-market lease intangibles and lease incentives and straight-line rent adjustments, which resulted in a net increase to rental revenue of $0.5 million and $1.4 million, respectively. For the three and six months ended June 30, 2019, |
| Reduction in Book Value as of June 30, 2020 | Reduction in Net Income (Loss) for the Six Months Ended June 30, 2020 | ||||||||||||||||
| EUR | $15,767 | $13 | |||||||||||||||
| GBP | $5,732 | $60 | |||||||||||||||
| Reduction in Book Value as of June 30, 2019 | Reduction in Net Income (Loss) for the Six Months Ended June 30, 2019 | |||
| EUR | $10,066 | $98 | ||
| GBP | $2,461 | $116 | ||
| Period | Total Number of Shares Redeemed | Average Price Paid Per Share | Total Number of Shares Purchased as Part of Publicly Announced Plans of Programs | Maximum Number of Shares that May Yet be Redeemed Under the Plans or Programs(1) | ||||||||||||||||||||||
| April 1, 2020 to April 30, 2020 | 271,461 | $ | 10.24 | 271,461 | 1,490,516 | |||||||||||||||||||||
| May 1, 2020 to May 31, 2020 | 342,187 | $ | 9.84 | 342,187 | 1,460,206 | |||||||||||||||||||||
| June 1, 2020 to June 30, 2020 | 423,848 | $ | 9.71 | 423,848 | 1,888,507 | |||||||||||||||||||||
| Total | 1,037,496 | 1,037,496 | ||||||||||||||||||||||||
| Period | Total Number of Shares Redeemed | Average Price Paid Per Share | Total Number of Shares Purchased as Part of Publicly Announced Plans of Programs | Maximum Number of Shares that May Yet be Redeemed Under the Plans or Programs(1) | |||||||||
| April 1, 2019 to April 30, 2019 | 153,701 | $ | 10.11 | 153,701 | 833,444 | ||||||||
| May 1, 2019 to May 31, 2019 | 89,661 | $ | 10.11 | 89,661 | 972,987 | ||||||||
| June 1, 2019 to June 30, 2019 | 159,459 | $ | 10.09 | 159,459 | 1,139,159 | ||||||||
| Total | 402,821 | 402,821 | |||||||||||
| Exhibit No. | Description | |||||||||||||
| 3.1 | ||||||||||||||
| 3.2 | ||||||||||||||
| 3.3 | ||||||||||||||
| 3.4 | ||||||||||||||
| 3.5 | ||||||||||||||
| 3.6 | ||||||||||||||
| 3.7 | ||||||||||||||
| 3.8 | ||||||||||||||
| 3.9 | ||||||||||||||
| 3.10 | ||||||||||||||
| 3.11 | ||||||||||||||
| 4.1 | ||||||||||||||
| 4.2 | ||||||||||||||
| 31.2* | ||||||||||||||
| 32.1* | ||||||||||||||
| 99.1 | ||||||||||||||
| Instance Document—The instance document does not appear in the interactive data file because its XBRL tags are embedded within the inline XBRL document. | ||||||||||||||
| 101 SCH* | XBRL Taxonomy Extension Schema Document | |||||||||||||
| 101.CAL* | XBRL Taxonomy Extension Calculation Linkbase Document | |||||||||||||
| 101.DEF* | XBRL Taxonomy Extension Definition Linkbase Document | |||||||||||||
| 101.LAB* | XBRL Taxonomy Extension Labels Linkbase Document | |||||||||||||
| 101.PRE* | XBRL Taxonomy Extension Presentation Linkbase Document | |||||||||||||
| * | Filed herewith | |||||||||||||
| HINES GLOBAL INCOME TRUST, INC. | |||||||||||||||||||||||||||||||||||
| August 14, | By: | /s/ | |||||||||||||||||||||||||||||||||
| Chairman of the Board of Directors | |||||||||||||||||||||||||||||||||||
| August 14, | By: | /s/ J. Shea Morgenroth | |||||||||||||||||||||||||||||||||
| J. Shea Morgenroth | |||||||||||||||||||||||||||||||||||
| Chief Financial Officer | |||||||||||||||||||||||||||||||||||