UNITED STATES
SECURITIES AND EXCHANGE COMMISSION
WASHINGTON, D.C. 20549
FORM 10-Q
|
| |
| [X] | QUARTERLY REPORT PURSUANT TO SECTION 13 OR 15(d) OF THE SECURITIES EXCHANGE ACT OF 1934 |
OctoberJuly 1, 20162017OR
|
| |
| [ ] | TRANSITION REPORT PURSUANT TO SECTION 13 OR 15(d) OF THE SECURITIES EXCHANGE ACT OF 1934 |
Commission file number 001-36353
Perrigo Company plc
(Exact name of registrant as specified in its charter)
|
| | |
| Ireland | | Not Applicable |
(State or other jurisdiction of incorporation or organization) | | (I.R.S. Employer Identification No.) |
| | |
| Treasury Building, Lower Grand Canal Street, Dublin 2, Ireland | | - |
| (Address of principal executive offices) | | (Zip Code) |
(Registrant’s telephone number, including area code)
Not Applicable
(Former name, former address and former fiscal year, if changed since last report)
________________________________________
Indicate by check mark whether the registrant (1) has filed all reports required to be filed by Section 13 or 15(d) of the Securities Exchange Act of 1934 during the preceding 12 months (or for such shorter period that the registrant was required to file such report), and (2) has been subject to such filing requirements for the past 90 days. YES [X] NO [ ]
Indicate by check mark whether the registrant has submitted electronically and posted on its corporate Web site, if any, every Interactive Data File required to be submitted and posted pursuant to Rule 405 of Regulation S-T (§232.405 of this chapter) during the preceding 12 months (or for such shorter period that the registrant was required to submit and post such files). YES [X] NO [ ]
Indicate by check mark whether the registrant is a large accelerated filer, an accelerated filer, a non-accelerated filer, or a smaller reporting company, or an emerging growth company. See definitions of “large accelerated filer”, “accelerated filer”, and “smaller reporting company”, and "emerging growth company" in Rule 12b-2 of the Exchange Act.
|
| | | | | | | | | | |
Large accelerated filer [X] | [X] | | Accelerated filer | [ ] |
| Non-accelerated filer | [ ] | | Smaller reporting company | [ ] |
(Do not check if a smaller reporting company)Emerging growth company | [ ] | | | | | | | | | |
| | | | | | | | | | |
| If an emerging growth company, indicate by check mark if the registrant has elected not to use the extended transition period for complying with any new or revised financial accounting standards provided pursuant to Section 13(a) of the Exchange Act. | [ ] |
Indicate by check mark whether the registrant is a shell company (as defined in Rule 12b-2 of the Exchange Act). [ ] YES [X] NO
As of NovemberAugust 4, 2016,2017, there were 143,374,427142,611,088 ordinary shares outstanding.
PERRIGO COMPANY PLC
FORM 10-Q
INDEX
| | | | | PAGE NUMBER | | PAGE NUMBER |
| | | | |
| | | | | |
| PART I. FINANCIAL INFORMATION | PART I. FINANCIAL INFORMATION | | PART I. FINANCIAL INFORMATION | |
| | | |
| | | | |
| | | |
| | |
| | | |
| | | |
| | |
| | | |
| | | |
| | |
| | | |
| | | |
| | |
| | | |
| | | |
| | | | |
| | | |
| 1 | | | | |
| | | |
| 2 | | | | |
| | | |
| 3 | | | | |
| | | |
| 4 | | | | |
| | | |
| 5 | | | | |
| | | |
| 6 | | | | |
| | | |
| 7 | | | | |
| | | |
| 8 | | | | |
| | | |
| 9 | | | | |
| | | |
| 10 | | | | |
| | | |
| 11 | | | | |
| | | |
| 12 | | | | |
| | | |
| 13 | | | | |
| | | |
| 14 | | | | |
| | | |
| 15 | | | | |
| | | |
| 16 | | | | |
| | | |
| 17 | | | | |
| | | |
| | | | |
| | | |
| | | | |
| | | |
| | | | |
| | | |
| PART II. OTHER INFORMATION | PART II. OTHER INFORMATION | | PART II. OTHER INFORMATION | |
| | | |
| | | | |
| | | |
| | | | |
| | | |
| | |
| | | |
| | | |
| | | | |
| | | |
| | | | |
Cautionary Note Regarding Forward-Looking StatementsCAUTIONARY NOTE REGARDING FORWARD-LOOKING STATEMENTS
Certain statements in this report are “forward-looking statements” within the meaning of Section 21E of the Securities Exchange Act of 1934, as amended, and are subject to the safe harbor created thereby. These statements relate to future events or our future financial performance and involve known and unknown risks, uncertainties and other factors that may cause our, or our industry's,industry’s actual results, levels of activity, performance or achievements to be materially different from those expressed or implied by any forward-looking statements.In particular, statements about our expectations, beliefs, plans, objectives, assumptions, future events or future performance contained in this report, including certain statements contained in “Management’s Discussion and Analysis of Financial Condition and Results of Operations” are forward-looking statements. In some cases, forward-looking statements can be identified by terminology such as “may,” “will,” “could,” “would,” “should,” “expect,” “plan,” “anticipate,” “intend,” “believe,” “estimate,” “predict,” “potential” or the negative of those terms or other comparable terminology.
Please see Item 1A of our Form 10-KT10-K for the transition period from June 28, 2015 toyear ended December 31, 2015 and Part II, Item 1A of this Form 10-Q2016 for a discussion of certain important risk factors that relate to forward-looking statements contained in this report.report and Part II, Item 1A of this Form 10-Q. We have based these forward-looking statements on our current expectations, assumptions, estimates and projections. While we believe these expectations, assumptions, estimates and projections are reasonable, such forward-looking statements are only predictions and involve known and unknown risks and uncertainties, many of which are beyond our control, includingincluding: the timing, amount and cost of any share repurchases,repurchases; future impairment charges,charges; the success of management transition; customer acceptance of new products; competition from other industry participants, some of whom have greater marketing resources or larger market shares in certain product categories than we do; pricing pressures from customers and consumers; potential third-party claims and litigation, including litigation relating to our restatement of previously-filed financial information; potential impacts of ongoing or future government investigations and regulatory initiatives; general economic conditions; fluctuations in currency exchange rates and interest rates; the consummation of announced acquisitions or dispositions, and our ability to achieve our guidance,realize the desired benefits thereof; and the ability to execute and achieve the desired benefits of announced cost-reduction efforts and other initiatives. In addition, we may identify and be unable to remediate one or more material weaknesses in our internal control over financial reporting. Furthermore, we and/or our subsidiaries may incur additional tax liabilities in respect of 2016 and prior years as a result of any restatement or may be found to have breached certain provisions of Irish company legislation in respect of prior financial statements and if so may incur additional expenses and penalties. These and other important factors, including those discussed in our Form 10-KT10-K for the transition period from June 28, 2015 toyear ended December 31, 2015,2016, in this Form 10-Qreport under "Risk Factors"“Risk Factors” and in any subsequent filings with the United States Securities and Exchange Commission, may cause actual results, performance or achievements to differ materially from those expressed or implied by these forward-looking statements. The forward-looking statements in this report are made only as of the date hereof, and unless otherwise required by applicable securities laws, we disclaim any intention or obligation to update or revise any forward-looking statements, whether as a result of new information, future events, or otherwise.
TRADEMARKS, TRADENAMESTRADE NAMES AND SERVICE MARKS
This report contains trademarks, trade names and service marks that are the property of Perrigo Company plc, as well as, for informational purposes, trademarks, trade names, and service marks that are the property of other organizations. Solely for convenience, certain trademarks, trade names, and service marks referred to in this report appear without the ®, ™ and SM symbols, but those references are not intended to indicate that we or the applicable owner, as the case may be, will not assert, to the fullest extent under applicable law, our or their rights to such trademarks, trade names, and service marks.
Perrigo Company plc - Item 1
PART I. FINANCIAL INFORMATION
ITEM 1. FINANCIAL STATEMENTS (UNAUDITED)
PERRIGO COMPANY PLC
CONDENSED CONSOLIDATED STATEMENTS OF OPERATIONS
(in millions, except per share amounts)
(unaudited)
| | | | Three Months Ended | | Nine Months Ended | Three Months Ended | | Six Months Ended |
| | October 1,
2016 | | September 26,
2015 | | October 1,
2016 | | September 26,
2015 | July 1,
2017 | | July 2,
2016 | | July 1,
2017 | | July 2,
2016 |
| Net sales | $ | 1,354.9 |
| | $ | 1,344.7 |
| | $ | 4,219.1 |
| | $ | 3,925.4 |
| $ | 1,237.9 |
| | $ | 1,340.5 |
| | $ | 2,431.9 |
| | $ | 2,687.8 |
|
| Cost of sales | 848.6 |
| | 795.9 |
| | 2,622.7 |
| | 2,369.7 |
| 733.3 |
| | 794.0 |
| | 1,463.0 |
| | 1,608.2 |
|
| Gross profit | 506.3 |
| | 548.8 |
| | 1,596.4 |
| | 1,555.7 |
| 504.6 |
| | 546.5 |
| | 968.9 |
| | 1,079.6 |
|
| | | | | | | | | | | | | | | |
| Operating expenses | | | | | | | | | | | | | | |
| Distribution | 21.6 |
| | 24.9 |
| | 65.9 |
| | 63.3 |
| 21.6 |
| | 22.5 |
| | 42.7 |
| | 44.3 |
|
| Research and development | 50.2 |
| | 41.6 |
| | 142.5 |
| | 139.7 |
| 42.6 |
| | 47.0 |
| | 82.3 |
| | 92.2 |
|
| Selling | 154.6 |
| | 167.9 |
| | 506.9 |
| | 391.6 |
| 155.6 |
| | 171.6 |
| | 310.6 |
| | 352.4 |
|
| Administration | 108.6 |
| | 123.6 |
| | 316.8 |
| | 343.3 |
| 98.2 |
| | 104.3 |
| | 203.6 |
| | 211.8 |
|
| Impairment charges | 1,679.9 |
| | — |
| | 2,127.1 |
| | — |
| 27.4 |
| | 10.5 |
| | 39.6 |
| | 414.4 |
|
| Restructuring | 6.6 |
| | 2.2 |
| | 17.9 |
| | 3.1 |
| 12.1 |
| | 5.8 |
| | 50.8 |
| | 11.3 |
|
| Other operating income | | (1.7 | ) | | — |
| | (38.0 | ) | | — |
|
| Total operating expenses | 2,021.5 |
| | 360.2 |
| | 3,177.1 |
| | 941.0 |
| 355.8 |
| | 361.7 |
| | 691.6 |
| | 1,126.4 |
|
| | | | | | | | | | | | | | | |
| Operating income (loss) | (1,515.2 | ) | | 188.6 |
| | (1,580.7 | ) | | 614.7 |
| 148.8 |
| | 184.8 |
| | 277.3 |
| | (46.8 | ) |
| | | | | | | | | | | | | | | |
| Change in financial assets | | 38.7 |
| | 910.8 |
| | 21.6 |
| | 1,115.3 |
|
| Interest expense, net | 54.6 |
| | 43.4 |
| | 163.2 |
| | 132.7 |
| 45.1 |
| | 57.4 |
| | 98.4 |
| | 108.6 |
|
| Other expense, net | 1.0 |
| | 13.0 |
| | 34.1 |
| | 294.2 |
| 6.1 |
| | 28.8 |
| | 2.5 |
| | 31.3 |
|
| Loss on extinguishment of debt | 0.7 |
| | — |
| | 1.1 |
| | 0.9 |
| 135.2 |
| | — |
| | 135.2 |
| | 0.4 |
|
| Income (loss) before income taxes | (1,571.5 | ) | | 132.2 |
| | (1,779.1 | ) | | 186.9 |
| (76.3 | ) | | (812.2 | ) | | 19.6 |
| | (1,302.4 | ) |
| Income tax expense (benefit) | (316.3 | ) | | 19.6 |
| | (383.7 | ) | | 112.7 |
| (6.7 | ) | | (277.9 | ) | | 17.6 |
| | (238.9 | ) |
| Net income (loss) | $ | (1,255.2 | ) | | $ | 112.6 |
| | $ | (1,395.4 | ) | | $ | 74.2 |
| $ | (69.6 | ) | | $ | (534.3 | ) | | $ | 2.0 |
| | $ | (1,063.5 | ) |
| | | | | | | | | | | | | | | |
| Income (loss) per share | | | | | | | | |
| Earnings (loss) per share | | | | | | | | |
| Basic | $ | (8.76 | ) | | $ | 0.77 |
| | $ | (9.74 | ) | | $ | 0.51 |
| $ | (0.49 | ) | | $ | (3.73 | ) | | $ | 0.01 |
| | $ | (7.43 | ) |
| Diluted | $ | (8.76 | ) | | $ | 0.77 |
| | $ | (9.74 | ) | | $ | 0.51 |
| $ | (0.49 | ) | | $ | (3.73 | ) | | $ | 0.01 |
| | $ | (7.43 | ) |
| | | | | | | | | | | | | | | |
| Weighted-average shares outstanding | | | | | | | | | | | | | | |
| Basic | 143.3 |
| | 146.3 |
| | 143.2 |
| | 144.4 |
| 143.3 |
| | 143.2 |
| | 143.3 |
| | 143.2 |
|
| Diluted | 143.3 |
| | 146.9 |
| | 143.2 |
| | 145.0 |
| 143.3 |
| | 143.2 |
| | 143.6 |
| | 143.2 |
|
| | | | | | | | | | | | | | | |
| Dividends declared per share | $ | 0.145 |
| | $ | 0.125 |
| | $ | 0.435 |
| | $ | 0.375 |
| $ | 0.160 |
| | $ | 0.145 |
| | $ | 0.320 |
| | $ | 0.290 |
|
See accompanying Notes to the Condensed Consolidated Financial Statements
Perrigo Company plc - Item 1
PERRIGO COMPANY PLC
CONDENSED CONSOLIDATED STATEMENTS OF COMPREHENSIVE INCOME (LOSS)
(in millions)
(unaudited)
| | | | Three Months Ended | | Nine Months Ended | Three Months Ended | | Six Months Ended |
| | October 1,
2016 | | September 26,
2015 | | October 1,
2016 | | September 26,
2015 | July 1,
2017 | | July 2,
2016 | | July 1,
2017 | | July 2,
2016 |
| Net income (loss) | $ | (1,255.2 | ) | | $ | 112.6 |
| | $ | (1,395.4 | ) | | $ | 74.2 |
| $ | (69.6 | ) | | $ | (534.3 | ) | | $ | 2.0 |
| | $ | (1,063.5 | ) |
| Other comprehensive income (loss): | | | | | | | | |
| Other comprehensive income: | | | | | | | | |
| Foreign currency translation adjustments | 27.0 |
| | (39.8 | ) | | 71.8 |
| | 50.9 |
| 154.7 |
| | (107.6 | ) | | 220.1 |
| | 43.9 |
|
| Change in fair value of derivative financial instruments, net of tax | 3.6 |
| | 0.1 |
| | (3.5 | ) | | 5.6 |
| 6.9 |
| | (1.3 | ) | | 8.5 |
| | (7.0 | ) |
| Change in fair value of investment securities, net of tax | 9.8 |
| | 2.5 |
| | 18.4 |
| | (2.4 | ) | (4.8 | ) | | 2.4 |
| | (16.3 | ) | | 8.5 |
|
| Change in post-retirement and pension liability adjustments, net of tax | (0.2 | ) | | — |
| | 0.3 |
| | 3.7 |
| — |
| | (0.3 | ) | | — |
| | 0.6 |
|
| Other comprehensive income (loss), net of tax | 40.2 |
| | (37.2 | ) | | 87.0 |
| | 57.8 |
| 156.8 |
| | (106.8 | ) | | 212.3 |
| | 46.0 |
|
| Comprehensive income (loss) | $ | (1,215.0 | ) | | $ | 75.4 |
| | $ | (1,308.4 | ) | | $ | 132.0 |
| $ | 87.2 |
| | $ | (641.1 | ) | | $ | 214.3 |
| | $ | (1,017.5 | ) |
See accompanying Notes to the Condensed Consolidated Financial Statements
Perrigo Company plc - Item 1
PERRIGO COMPANY PLC
CONDENSED CONSOLIDATED BALANCE SHEETS
(in millions)millions, except share and per share amounts)
(unaudited)
| | | | (Unaudited) | | | | | | | |
| | October 1,
2016 | | December 31,
2015 | July 1,
2017 | | December 31,
2016 |
| Assets | | | | | | |
| Cash and cash equivalents | $ | 362.7 |
| | $ | 417.8 |
| $ | 760.8 |
| | $ | 622.3 |
|
| Accounts receivable, net of allowance for doubtful accounts of $4.4 million and $3.0 million, respectively | 1,129.2 |
| | 1,193.1 |
| |
| Accounts receivable, net of allowance for doubtful accounts of $5.3 million and $6.3 million, respectively | | 1,065.9 |
| | 1,176.0 |
|
| Inventories | 884.6 |
| | 844.4 |
| 818.1 |
| | 795.0 |
|
| Prepaid expenses and other current assets | 250.6 |
| | 289.1 |
| 176.5 |
| | 212.0 |
|
| Total current assets | 2,627.1 |
| | 2,744.4 |
| 2,821.3 |
| | 2,805.3 |
|
| Property and equipment, net | 881.3 |
| | 886.2 |
| |
| Property, plant and equipment, net | | 876.9 |
| | 870.1 |
|
| Financial asset | | — |
| | 2,350.0 |
|
| Goodwill and other indefinite-lived intangible assets | 5,282.7 |
| | 7,281.2 |
| 4,253.0 |
| | 4,163.9 |
|
| Other intangible assets, net | 8,340.9 |
| | 8,190.5 |
| 3,373.4 |
| | 3,396.8 |
|
| Non-current deferred income taxes | 129.3 |
| | 54.6 |
| 31.7 |
| | 72.1 |
|
| Other non-current assets | 206.3 |
| | 237.0 |
| 435.9 |
| | 211.9 |
|
| Total non-current assets | 14,840.5 |
| | 16,649.5 |
| 8,970.9 |
| | 11,064.8 |
|
| Total assets | $ | 17,467.6 |
| | $ | 19,393.9 |
| $ | 11,792.2 |
| | $ | 13,870.1 |
|
| Liabilities and Shareholders’ Equity | | | | | | |
| Liabilities | | | | |
| Accounts payable | $ | 507.9 |
| | $ | 554.9 |
| $ | 480.8 |
| | $ | 471.7 |
|
| Payroll and related taxes | 106.8 |
| | 125.3 |
| 131.0 |
| | 115.8 |
|
| Accrued customer programs | 325.5 |
| | 398.0 |
| 370.2 |
| | 380.3 |
|
| Accrued liabilities | 258.7 |
| | 308.4 |
| 240.8 |
| | 263.3 |
|
| Accrued income taxes | 76.2 |
| | 85.2 |
| — |
| | 32.4 |
|
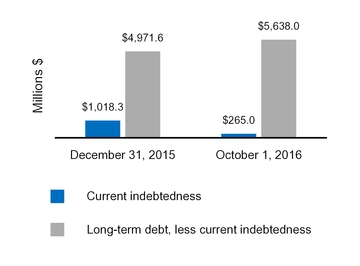
| Current indebtedness | 265.0 |
| | 1,018.3 |
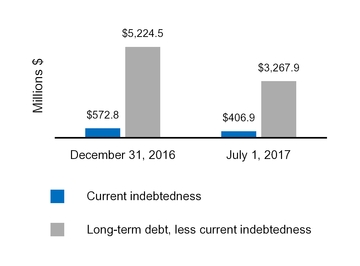
| 406.9 |
| | 572.8 |
|
| Total current liabilities | 1,540.1 |
| | 2,490.1 |
| 1,629.7 |
| | 1,836.3 |
|
| Long-term debt, less current portion | 5,638.0 |
| | 4,971.6 |
| 3,267.9 |
| | 5,224.5 |
|
| Non-current deferred income taxes | 1,169.3 |
| | 1,563.7 |
| 368.4 |
| | 389.9 |
|
| Other non-current liabilities | 448.9 |
| | 332.4 |
| 445.0 |
| | 461.8 |
|
| Total non-current liabilities | 7,256.2 |
| | 6,867.7 |
| 4,081.3 |
| | 6,076.2 |
|
| Total liabilities | 8,796.3 |
| | 9,357.8 |
| 5,711.0 |
| | 7,912.5 |
|
| Commitments and contingencies - Note 14 | | | | | | |
| Shareholders’ equity | | | | | | |
| Controlling interest: | | | | |
| Preferred shares, $0.0001 par value, 10 million shares authorized | — |
| | — |
| — |
| | — |
|
| Ordinary shares, €0.001 par value, 10 billion shares authorized | 8,151.4 |
| | 8,144.6 |
| 8,044.7 |
| | 8,135.0 |
|
| Accumulated other comprehensive income | 71.5 |
| | (15.5 | ) | |
| Retained earnings | 449.0 |
| | 1,907.6 |
| |
| Accumulated other comprehensive income (loss) | | 130.5 |
| | (81.8 | ) |
| Retained earnings (accumulated deficit) | | (2,094.0 | ) | | (2,095.1 | ) |
| Total controlling interest | 8,671.9 |
| | 10,036.7 |
| 6,081.2 |
| | 5,958.1 |
|
| Noncontrolling interest | (0.6 | ) | | (0.6 | ) | — |
| | (0.5 | ) |
| Total shareholders’ equity | 8,671.3 |
| | 10,036.1 |
| 6,081.2 |
| | 5,957.6 |
|
| Total liabilities and shareholders' equity | $ | 17,467.6 |
| | $ | 19,393.9 |
| $ | 11,792.2 |
| | $ | 13,870.1 |
|
| | | | | | | |
| Supplemental Disclosures of Balance Sheet Information | | | | | | |
| Preferred shares, issued and outstanding | — |
| | — |
| |
| Ordinary shares, issued and outstanding | 143.4 |
| | 143.1 |
| 142.6 |
| | 143.4 |
|
See accompanying Notes to the Condensed Consolidated Financial Statements
Perrigo Company plc - Item 1
PERRIGO COMPANY PLC
CONDENSED CONSOLIDATED STATEMENTS OF CASH FLOWS
(in millions)
(unaudited)
| | | | Nine Months Ended | Six Months Ended |
| | October 1,
2016 | | September 26,
2015 | July 1,
2017 | | July 2,
2016 |
| Cash Flows From (For) Operating Activities | | | | | | |
| Net income (loss) | $ | (1,395.4 | ) | | $ | 74.2 |
| $ | 2.0 |
| | $ | (1,063.5 | ) |
| Adjustments to derive cash flows | | | | | | |
| Depreciation and amortization | 556.3 |
| | 470.4 |
| 220.8 |
| | 223.7 |
|
| Loss on acquisition-related foreign currency derivatives | — |
| | 300.0 |
| |
| Share-based compensation | 16.1 |
| | 29.7 |
| 14.8 |
| | 9.6 |
|
| Impairment charges | 2,127.1 |
| | — |
| 39.6 |
| | 414.4 |
|
| Change in financial assets | | 21.6 |
| | 1,115.3 |
|
| Loss on extinguishment of debt | 1.1 |
| | 0.9 |
| 135.2 |
| | 0.4 |
|
| Non-cash restructuring charges | 17.9 |
| | 3.1 |
| |
| Restructuring charges | | 50.8 |
| | 11.3 |
|
| Deferred income taxes | (507.2 | ) | | 7.7 |
| (8.1 | ) | | (322.8 | ) |
| Amortization of debt discount (premium) | | (11.8 | ) | | (16.2 | ) |
| Other non-cash adjustments | 34.5 |
| | 15.3 |
| (20.6 | ) | | 28.1 |
|
| Subtotal | 850.4 |
| | 901.3 |
| 444.3 |
| | 400.3 |
|
| Increase (decrease) in cash due to: | | | | | | |
| Accounts receivable | 113.6 |
| | (30.9 | ) | 51.8 |
| | 41.2 |
|
| Inventories | (29.9 | ) | | (28.6 | ) | (4.6 | ) | | 4.7 |
|
| Accounts payable | (51.8 | ) | | (6.5 | ) | (6.0 | ) | | (47.0 | ) |
| Payroll and related taxes | (40.0 | ) | | (26.6 | ) | (37.9 | ) | | (39.2 | ) |
| Accrued customer programs | (74.7 | ) | | 17.7 |
| (13.8 | ) | | (44.2 | ) |
| Accrued liabilities | (42.8 | ) | | 46.7 |
| (49.4 | ) | | (53.9 | ) |
| Accrued income taxes | 9.7 |
| | 0.3 |
| (85.8 | ) | | (2.8 | ) |
| Other | (31.0 | ) | | (6.7 | ) | (13.3 | ) | | (29.4 | ) |
| Subtotal | (146.9 | ) | | (34.6 | ) | (159.0 | ) | | (170.6 | ) |
| Net cash from (for) operating activities | 703.5 |
| | 866.7 |
| |
| Net cash from operating activities | | 285.3 |
| | 229.7 |
|
| Cash Flows From (For) Investing Activities | | | | | | |
| Proceeds from royalty rights | | 85.7 |
| | 169.9 |
|
| Acquisitions of businesses, net of cash acquired | (432.1 | ) | | (2,499.9 | ) | — |
| | (419.7 | ) |
| Asset acquisitions | (65.1 | ) | | (4.0 | ) | |
| Additions to property and equipment | (84.6 | ) | | (127.6 | ) | (37.2 | ) | | (57.1 | ) |
| Proceeds from sale of business | 58.5 |
| | — |
| |
| Settlement of acquisition-related foreign currency derivatives | — |
| | (304.8 | ) | |
| Net proceeds from sale of business and other assets | | 37.2 |
| | — |
|
Proceeds from sale of the Tysabri® royalty stream | | 2,200.0 |
| | — |
|
| Other investing | (1.0 | ) | | (2.7 | ) | (3.7 | ) | | (1.0 | ) |
| Net cash from (for) investing activities | (524.3 | ) | | (2,939.0 | ) | 2,282.0 |
| | (307.9 | ) |
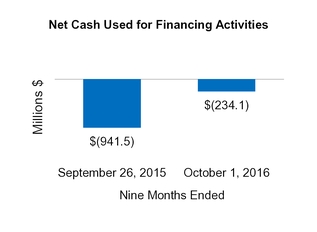
| Cash Flows From (For) Financing Activities | | | | | | |
| Issuances of long-term debt | 1,190.3 |
| | — |
| — |
| | 1,190.3 |
|
| Payments on long-term debt | (545.8 | ) | | (903.3 | ) | (2,229.1 | ) | | (28.7 | ) |
| Borrowings (repayments) of revolving credit agreements and other financing, net | (803.6 | ) | | 28.6 |
| — |
| | (803.9 | ) |
| Deferred financing fees | (2.8 | ) | | (3.3 | ) | (4.0 | ) | | (2.4 | ) |
| Premium on early debt retirement | (0.6 | ) | | — |
| (116.1 | ) | | — |
|
| Issuance of ordinary shares | 8.2 |
| | 6.2 |
| 0.2 |
| | 3.5 |
|
| Repurchase of ordinary shares | | (58.2 | ) | | — |
|
| Cash dividends | (62.4 | ) | | (54.2 | ) | (46.0 | ) | | (41.6 | ) |
| Other financing | (17.4 | ) | | (15.5 | ) | 4.7 |
| | (11.7 | ) |
| Net cash from (for) financing activities | (234.1 | ) | | (941.5 | ) | (2,448.5 | ) | | 305.5 |
|
| Effect of exchange rate changes on cash | (0.2 | ) | | (75.8 | ) | |
| Net increase (decrease) in cash and cash equivalents | (55.1 | ) | | (3,089.6 | ) | |
| Effect of exchange rate changes on cash and cash equivalents | | 19.7 |
| | (3.3 | ) |
| Net increase in cash and cash equivalents | | 138.5 |
| | 224.0 |
|
| Cash and cash equivalents, beginning of period | 417.8 |
| | 3,596.1 |
| 622.3 |
| | 417.8 |
|
| Cash and cash equivalents, end of period | $ | 362.7 |
| | $ | 506.5 |
| $ | 760.8 |
| | $ | 641.8 |
|
| | | | | |
| Supplemental Disclosures of Cash Flow Information | | | | |
| Cash paid/received during the year for: | | | | |
| Interest paid | $ | 124.1 |
| | $ | 92.5 |
| |
| Interest received | $ | 1.1 |
| | $ | 1.0 |
| |
| Income taxes paid | $ | 116.6 |
| | $ | 130.0 |
| |
| Income taxes refunded | $ | 6.0 |
| | $ | 3.1 |
| |
See accompanying Notes to the Condensed Consolidated Financial Statements
Perrigo Company plc - Item 1
Note 1
NOTE 1 – SUMMARY OF SIGNIFICANT ACCOUNTING POLICIES
a. General Information
The Company
Perrigo Company plc was incorporated under the laws of Ireland on June 28, 2013 and became the successor registrant of Perrigo Company, a Michigan corporation, on December 18, 2013 in connection with the acquisition of Elan Corporation, plc ("Elan"). Unless the context requires otherwise, the terms "Perrigo," the "Company," "we," "our," "us," and similar pronouns used herein refer to Perrigo Company plc, its subsidiaries, and all predecessors of Perrigo Company plc and its subsidiaries.
We are a leading global over-the-counter ("OTC") consumer goodshealthcare company, delivering value to our customers and specialty pharmaceutical company, offering patients and customers high quality products at affordable prices. From our beginningconsumers by providing Quality Affordable Healthcare Products®. Founded in 1887 as a packager of home remedies, we have grown to becomebuilt a unique business model that is best described as the convergence of a fast-moving consumer goods company, a high-quality pharmaceutical manufacturing organization and a world-class supply chain network. We believe we are one of the world's largest manufacturermanufacturers of OTCover-the-counter (“OTC”) healthcare products and supplier of infant formulas for the store brand market. We also are also a leading provider of branded OTC products throughout Europe and the U.S., as well as a leading producer of generic standard topical products such as creams, lotions, and gels, as well as inhalants and injections ("extended topicaltopical") prescription products,drugs. We are headquartered in Ireland, and we receive royalties from sales of the multiple sclerosis drug Tysabri®. We provide “Quality Affordable Healthcare Products®” across a wide variety of product categories and geographies,sell our products primarily in North America Europe, and Australia,Europe, as well as in other markets, including Australia, Israel China, and Latin America.China.
Basis of Presentation
The accompanying unaudited Condensed Consolidated Financial Statements have been prepared in accordance with U.S. generally accepted accounting principles ("GAAP") for interim financial information and with the instructions to Article 10 of Regulation S-X. Accordingly, they do not include all of the information and footnotes required by GAAP for complete financial statements. The unaudited Condensed Consolidated Financial Statements should be read in conjunction with the consolidated financial statements and footnotes included in our TransitionAnnual Report on Form 10-KT10-K for the transition period from June 28, 2015 toyear ended December 31, 2015.2016. In the opinion of management, all adjustments (consisting of normal recurring accruals and other adjustments) considered necessary for a fair presentation have been included. Theof the unaudited Condensed Consolidated Financial Statements have been included and include our accounts and the accounts of all majority-owned subsidiaries. All intercompany transactions and balances have been eliminated in consolidation.
Our fiscal year previously consisted of a 52- or 53-week year ending on or around June 30 of each year with each quarter ending on the Saturday closest to each calendar quarter-end. Beginning on January 1, 2016, we changed our fiscal year to begin on January 1 and end on December 31 of each year. We will continue to cut off our quarterly accounting periods on the Saturday closest to the end of the calendar quarter, with the fourth quarter ending on December 31 of each year.
During the three months ended April 2, 2016, we identified certain errors in our consolidated financial statements for the transition period of June 28, 2015 to December 31, 2015, related primarily to the accrual estimates associated with product returns and tax-related items in our Branded Consumer Healthcare ("BCH") segment. These errors were corrected during the three months ended April 2, 2016 by increasing the consolidated operating loss by $14.5 million, which when combined with tax-related items, increased the consolidated net loss by $13.7 million within the Condensed Consolidated Statements of Operations. We concluded that these errors were not material to the consolidated financial statements for the transition period of June 28, 2015 to December 31, 2015 and are not expected to be material to the consolidated financial statements for the year ending December 31, 2016.
Perrigo Company plc - Item 1
Note 1
b. Recent Accounting Standard Pronouncements
Below are recent accounting standard updates that we are still assessing to determine the effect on our consolidated financial statements.Condensed Consolidated Financial Statements. We do not believe that any other recently issued accounting standards could have a material effect on our consolidated financial statements.Condensed Consolidated Financial Statements. As new accounting pronouncements are issued, we will adopt those that are applicable under the circumstances.
|
| | | | | | |
Recently Issued Accounting Standards Not Yet Adopted |
| Standard | | Description | | Effective Date of adoption | | Effect on the Financial Statements or Other Significant Matters |
| Clarifying the Definition of a Business | | This update clarifies the definition of a business and addresses whether transactions should be accounted for as asset acquisitions or business combinations (or divestitures). The guidance includes an initial threshold that an acquired set of assets will not be considered a business if substantially all of the fair value of the assets acquired is concentrated in a single tangible or identifiable intangible asset (or group of similar assets). If the acquired set does not pass the initial threshold, then the guidance requires that, to be a business, the set must include an input and a substantive process that together significantly contribute to the ability to create outputs. Different factors are considered to determine whether the set includes a substantive process, such as the inclusion of an organized workforce. Further, the guidance removes language stating that a business need not include all of the inputs and processes that the seller used in operating the business. | | January 1, 2017 | | We early adopted this new standard and will apply it prospectively when determining whether transactions should be accounted for as asset acquisitions (divestitures) or business combinations (divestitures). During the six months ended July 1, 2017, we applied the new guidance when determining whether certain product divestitures represented sales of assets or businesses. In each case, we determined that the assets sold did not meet the definition of a business under the new rules.
|
| Improvements to Employee Share-Based Payment Accounting
| | This guidance is intended to simplify several aspects of the accounting for share-based payment award transactions. It will require all income tax effects of awards to be recorded through the income statement when theythe awards vest or settle as opposed to certain amounts being recorded in additional paid-in capital. An entity will also have to elect whether to account for forfeitures as they occur or by estimating the number of awards expected to be forfeited and adjusting the estimate when it is likely to change (as currently required). The guidance will also increase the amount an employer can withhold to cover income taxes on awards. Early adoption is permitted. | | January 1, 2017 | | We are currently evaluatingadopted this standard as of January 1, 2017. We elected to estimate the implicationsnumber of adoptionawards expected to be forfeited and adjust the estimate when it is likely to change, consistent with past practice. We did not change the amounts that we withhold to cover income taxes on awards. As the requirement to record all income tax effects of vested or settled awards through the income statement is prospective in nature, there was no cumulative effect of adopting the standard on our consolidated financial statements.balance sheet. |
Perrigo Company plc - Item 1
Note 1
|
| | | | | | |
| Recently Issued Accounting Standards Not Yet Adopted |
| Standard | | Description | | Effective Date | | Effect on the Financial Statements or Other Significant Matters |
| Revenue from Contracts with Customers | | The core principle of the guidance is that an entity should recognize revenue to depict the transfer of promised goods or services to customers in an amount that reflects the consideration to which the entity expects to be entitled in exchange for those goods or services. To achieve that core principle, an entity should apply the following steps: identify the contract(s) with a customer; identify the performance obligations in the contract; determine the transaction price; allocate the transaction price to the performance obligations in the contract; and recognize revenue when (or as) the entity satisfies a performance obligation. This guidance allows for two adoption methods, full retrospective approach or modified retrospective approach. Early adoption is not permitted. | | January 1, 2018 | | We continue to evaluate the implications of adoption of the new revenue standard on our Consolidated Financial Statements. We have completed an initial assessment of the adoption and are in the process of completing a detailed review of our various customer contracts. In our assessment of the new standard, our contract reviews have been focused on, but not limited to, the concepts of over-time vs. point-in-time recognition, variable consideration and performance obligations. We plan to adopt the new revenue standard effective January 1, 2018 using the modified retrospective method. |
| Intra-Entity Asset Transfers of Assets Other Than Inventory | | Under the new guidance, the tax impact to the seller on the profit from the transfers and the buyer’s deferred tax benefit on the increased tax basis would be recognized when the transfers occur, resulting in the recognition of expense sooner than under historical guidance. The guidance excludes intra-entity transfers of inventory. For intra-entity transfers of inventory, the Financial Accounting Standards Board ("FASB") decided to retain current GAAP, which requires an entity to recognize the income tax consequences when the inventory has been sold to an outside party. | | January 1, 2018 | | We are currently evaluating the possible adoption methodologies and the implications of adoption on our consolidated financial statements.Consolidated Financial Statements and considering whether to early adopt the standard.
|
| Leases | | This guidance was issued to increase transparency and comparability among organizations by requiring recognition of lease assets and lease liabilities on the balance sheet and disclosure of key information about leasing arrangements. For leases with a term of 12 months or less, lessees are permitted to make an election to not recognize right-of-use assets and lease liabilities. Upon adoption, lessees will apply the new standard as of the beginning of the earliest comparative period presented in the financial statements, however lessees will be able to exclude leases that expire as of the implementation date. Early adoption is permitted.
| | January 1, 2019 | | We are currently evaluating the implications of adoption on our consolidated financial statements and considering whether to early adopt the standard.Consolidated Financial Statements.
|
Perrigo Company plc - Item 1
Note 1
|
| | | | | | |
| Recently Issued Accounting Standards Not Yet Adopted (continued) |
| Standard | | Description | | Effective Date | | Effect on the Financial Statements or Other Significant Matters |
| Measurement of Credit Losses on Financial Instruments | | This guidance changes the impairment model for most financial assets and certain other instruments, replacing the current "incurred loss" approach with an "expected loss" credit impairment model, which will apply to most financial assets measured at amortized cost and certain other instruments, including trade and other receivables, loans, held-to-maturity debt securities, and off-balance sheet credit exposures such as letters of credit. Early adoption is permitted.
| | January 1, 2020 | | We are currently evaluating the new standard for potential impacts on our receivables, debt, and other financial instrumentsinstruments. |
Intangibles - Goodwill and considering whetherOther Simplifying the Test for Goodwill | | The objective of this update is to reduce the cost and complexity of subsequent goodwill accounting by simplifying the impairment test by removing the Step 2 requirement to perform a hypothetical purchase price allocation when the carrying value of a reporting unit exceeds its fair value. If a reporting unit’s carrying value exceeds its fair value, an entity would record an impairment charge based on that difference, limited to the amount of goodwill attributed to that reporting unit. The proposal would not change the guidance on completing Step 1 of the goodwill impairment test. The proposed guidance would be applied prospectively with an effective date for Perrigo of January 1, 2020, with early adoptadoption permitted as of January 1, 2017. | | January 1, 2020 | | We are currently evaluating the standard.implications of adoption on our Consolidated Financial Statements.
|
NOTE 2 – ACQUISITIONS AND DIVESTITURES
All of the below acquisitions, with the exception of the generic Benzaclin™ product purchase, have been accounted for under the acquisition method of accounting based on our analysis of the acquired inputs and processes, and the related assets acquired and liabilities assumed were recorded at fair value as of the acquisition date.
Fair value estimates are based on a complex series of judgments about future events and rely heavily on estimates and assumptions. The judgments used to determine the estimated fair value assigned to each class of assets acquired and liabilities assumed, as well as asset lives, can materially impact our results of operations.
The effects of all of the acquisitions described below are included in the Condensed Consolidated Financial Statements prospectively from the date of each acquisition. Unless otherwise indicated, acquisition costs incurred were immaterial and were recorded in Administration expense.
Current Year Acquisitions
Generic Benzaclin™ ProductDivestitures
On August 2, 2016,February 1, 2017, we purchasedcompleted the remaining 60.9% product rights to a generic Benzaclin™ product ("Generic Benzaclin™"),sale of the Animal Health pet treats plant fixed assets, which we had developedwere previously classified as held-for sale, and marketed in collaboration with Barr Laboratories, Inc. ("Barr"), a subsidiary of Teva Pharmaceuticals, for $62.0received $7.7 million in cash. In September 2007, we entered intoproceeds which resulted in an initial development, marketing and commercialization agreement with Barr, in which Barr contributed to the product's development costs and we developed and marketed the product in the U.S. and Israel. Under this agreement, we paid Barr a percentage of net income from the product's sales in these territories, adjusted for Barr's contributions to the product's development costs. By purchasing the remaining product right from Barr, we are now entitled to 100% of income from sales of the product. Operating results attributable to Generic Benzaclin™ are included within our Prescription Pharmaceuticals ("Rx") segment. The intangible asset acquired is a distribution and license agreement with a nine-year useful life.
Tretinoin Product Portfolio
On January 22, 2016, we acquired a portfolio of generic dosage forms and strengths of Retin-A® (tretinoin), a topical prescription acne treatment, from Matawan Pharmaceuticals, LLC, for $416.4 million in cash ("Tretinoin Products"), which further expanded our extended topicals portfolio. We were the authorized generic distributor of these products from 2005 to 2013. Operating results attributable to the acquisition are included within our Rx segment. The intangible assets acquired included generic product rights valued using the multi-period excess earnings method and assigned a 20-year useful life, and non-compete agreements valued using the lost income method and assigned a five-year useful life. The goodwill acquired is deductible for tax purposes.
Perrigo Company plc - Item 1
Note 2
Development-Stage Rx Products
In May 2015, we entered into an agreement with a clinical stage biotechnology company for two specialty pharmaceutical products in development ("Development-Stage Rx Products"). We paid $18.0 million for an option to acquire the two products, which was recorded in Research and Development expense. On March 1, 2016, to further invest in our specialty Rx portfolio, we exercised the option for both products, which requires us to make contingent payments if we obtain regulatory approval and achieve certain sales milestones. We will also be obligated to make certain royalty payments over periods ranging from seven to ten years from the launch of each product.
We accounted for the option exercise as a business acquisition within our Rx segment, recording IPR&D and contingent consideration on the balance sheet. The IPR&D was valued using the multi-period excess earnings method and has an indefinite useful life until such time as the research is completed (at which time it will become a definite-lived intangible asset), or is determined to have no future use (at which time it would be impaired). The contingent consideration is an estimate of the future milestone payments and royalties based on probability-weighted outcomes, sensitivity analysis, and discount rates reflective of the risk involved. The amount of contingent consideration recognized was $24.9 million and was recorded in Other non-current liabilities.
Perrigo Company plc - Item 1
Note 2
Purchase Price Allocation of Current Year Acquisitions
The purchase accounting allocation for four small product acquisitions in our Consumer Healthcare ("CHC") and Rx segments (included in "All Other" in the table below) are preliminary and are based on the valuation information, estimates, and assumptions available at October 1, 2016. As we finalize the fair value estimate, additional purchase price adjustments may be recorded during the measurement period to contingent consideration and intangible assets.
The below table indicates the purchase price allocation for acquisitions completed in the current year (in millions):
|
| | | | | | | | | | | |
| | Tretinoin Products | | Development-Stage Rx Products | | All Other(1)* |
| Purchase price paid | $ | 416.4 |
| | $ | — |
| | $ | 21.9 |
|
| Contingent consideration | — |
| | 24.9 |
| | 30.6 |
|
| Total purchase consideration | $ | 416.4 |
| | $ | 24.9 |
| | $ | 52.5 |
|
| | | | | | |
| Assets acquired: | | | | | |
| Cash and cash equivalents | $ | — |
| | $ | — |
| | $ | 3.8 |
|
| Accounts receivable | — |
| | — |
| | 4.9 |
|
| Inventories | 1.4 |
| | — |
| | 7.1 |
|
| Prepaid expenses and other current assets | — |
| | — |
| | 0.1 |
|
| Property and equipment | — |
| | — |
| | 1.2 |
|
| Goodwill | 1.7 |
| | — |
| | 0.2 |
|
Definite-lived intangibles: | | | | | |
| Distribution and license agreements, supply agreements | — |
| | — |
| | 3.4 |
|
| Developed product technology, formulations, and product rights | 411.0 |
| | — |
| | 23.3 |
|
| Customer relationships and distribution networks | — |
| | — |
| | 8.2 |
|
| Non-compete agreements | 2.3 |
| | — |
| | — |
|
Indefinite-lived intangibles: | | | | | |
| In-process research and development | — |
| | 24.9 |
| | 7.0 |
|
| Total intangible assets | $ | 413.3 |
| | $ | 24.9 |
| | $ | 41.9 |
|
| Total assets | $ | 416.4 |
| | $ | 24.9 |
| | $ | 59.2 |
|
| Liabilities assumed: | | | | | |
| Accounts payable | $ | — |
| | $ | — |
| | $ | 2.8 |
|
| Accrued liabilities | — |
| | — |
| | 0.1 |
|
| Long-term debt | — |
| | — |
| | 3.3 |
|
| Net deferred income tax liabilities | — |
| | — |
| | 0.5 |
|
| Total liabilities | $ | — |
| | $ | — |
| | $ | 6.7 |
|
| Net assets acquired | $ | 416.4 |
| | $ | 24.9 |
| | $ | 52.5 |
|
* Opening balance sheet is preliminary
| |
(1) | Consists of four product acquisitions in the CHC and Rx segments |
Perrigo Company plc - Item 1
Note 2
Prior Year Acquisitions
Entocort®
On December 15, 2015, we completed our acquisition of Entocort® (budesonide) capsules, as well as the authorized generic capsules, for sale within the U.S., from AstraZeneca plc for $380.2 million in cash. Entocort® is a gastroenterology medicine for patients with mild to moderate Crohn's disease. The acquisition complemented our Rx portfolio. Operating results attributable to the acquisition are included within our Rx segment. The intangible assets acquired included branded and authorized generic product rights with useful lives of 10 and 15 years, respectively, which were valued using the multi-period excess earnings method.
Naturwohl Pharma GmbH
On September 15, 2015, we completed our acquisition of 100% of Naturwohl Pharma GmbH ("Naturwohl"), a Munich, Germany-based nutritional business known for its leading German dietary supplement brand, Yokebe®. The acquisition built on our BCH segment's OTC product portfolio and European commercial infrastructure. The assets were purchased through an all-cash transaction valued at €133.5 million ($150.4 million). Operating results attributable to Naturwohl are included in the BCH segment. The intangible assets acquired included a trademark with a 20-year useful life, customer relationships with a 15-year useful life, non-compete agreements with a three-year useful life, and a licensing agreement with a three-year useful life. We utilized the relief from royalty method for valuing the trademark, the multi-period excess earnings method for valuing the customer relationships, and the lost income method for valuing the non-compete agreements and the licensing agreement. The goodwill acquired is not deductible for tax purposes.
ScarAway®
On August 28, 2015, we completed our acquisition of ScarAway®, a leading U.S. OTC scar management brand portfolio comprised of five products, from Enaltus, LLC, for $26.7 million in cash. This acquisition served as our entry into the niche branded OTC business in the U.S. Operating results attributable to ScarAway® are included in the CHC segment. The intangible assets acquired included a trademark with a 25-year useful life, non-compete agreements with a four-year useful life, developed product technology with an eight-year useful life, and customer relationships with a 15-year useful life. We utilized the relief from royalty method for valuing the trademark and developed product technology, the multi-period excess earnings method for valuing the customer relationships, and the lost income method for valuing the non-compete agreements. The goodwill acquired is deductible for tax purposes.
GlaxoSmithKlineConsumer Healthcare Product Portfolio
On August 28, 2015, we completed our acquisition of a portfolio of well-established OTC brands from GlaxoSmithKline Consumer Healthcare (“GSK Products”). This acquisition further leveraged our European market share and expanded our product offerings. The assets were purchased through an all-cash transaction valued at €200.0 million ($223.6 million). Operating results attributable to the acquired GSK Products are included primarily in the BCH segment. The intangible assets acquired included trademarks with a 20-year useful life and customer relationships with a 15-year useful life. We utilized the relief from royalty method for valuing the trademarks and the multi-period excess earnings method for valuing the customer relationships. The goodwill acquired is deductible for tax purposes and recorded primarily in the BCH segment.
Gelcaps Exportadora de Mexico, S.A. de C.V.immaterial loss.
On May 12, 2015,January 3, 2017, we completed our acquisition of 100% of Gelcaps Exportadora de Mexico, S.A. de C.V.sold certain Abbreviated New Drug Applications ("Gelcaps"ANDAs"), the Mexican operations of Durham, North Carolina-based Patheon Inc., for $37.9 million in cash. The acquisition added softgel manufacturing technology to our supply chain capabilities and broadened our presence, product portfolio, and customer network in Mexico. Operating results attributable to Gelcaps are included in the CHC segment. The intangible assets acquired included a trademark with a 25-year useful life and customer relationships with a 20-year useful life. We utilized the relief from royalty method for valuing the trademark and the multi-period excess earnings method for valuing the customer relationships.
Perrigo Company plc - Item 1
Note 2
Based on valuation estimates utilizing the comparative sales method, a step-up in the value of inventory of $0.6 million was recorded in the opening balance sheet, which was charged to cost of goods sold during the three months ended June 27, 2015. In addition, property, plant and equipment was written up by $0.9$15.0 million to its estimated fair market value based on a valuation method that included both the cost and market approaches. This additional step-up in value is being depreciated over the estimated remaining useful lives of the assets. The goodwill recorded is not deductible for tax purposes.
Omega Pharma Invest N.V.
On March 30, 2015, we completed our acquisition of Omega Pharma Invest N.V. ("Omega"), a limited liability company incorporated under the laws of Belgium. Omega was a leading European OTC company and is providing us several key benefits, including advancing our growth strategy outside the U.S. by providing access across a larger global platform with critical mass in key European countries, establishing commercial infrastructure in the high barrier-to-entry European OTC marketplace, strengthening our product portfolio while enhancing scale and distribution, and expanding our international management capabilities.
We purchased95.77% of the issued and outstanding share capital of Omega (685,348,257 shares) from Alychlo N.V. (“Alychlo”) and Holdco I BE N.V. (together with Alychlo, the “Sellers”), limited liability companies incorporated under the laws of Belgium, under the terms of the Share Purchase Agreement dated November 6, 2014 (the "Share Purchase Agreement"). Omega holds the remaining 30,243,983 shares as treasury shares.
The acquisition was a cash and stock transaction made up of the following consideration (in millions except per share data):
|
| | | | |
| Perrigo ordinary shares issued | | 5.4 |
|
| Perrigo per share price at transaction close on March 30, 2015 | | $ | 167.64 |
|
| Total value of Perrigo ordinary shares issued | | $ | 904.9 |
|
| Cash consideration | | 2,078.3 |
|
| Total consideration | | $ | 2,983.2 |
|
The cash consideration shown in the above table was financed by a combination of debt and equity. We issued $1.6 billion of debt as described in Note 10, and issued 6.8 million ordinary shares, which raised $999.3 million, net of issuance costs.
The Sellers agreed to indemnify us for certain potential future losses. The Sellers’ indemnification and other obligations to us under the Share Purchase Agreement are secured by up to €120.9 million ($135.9 million as of October 1, 2016) in cash that has been escrowed or is committed to be escrowed and 1.08 million of our ordinary shares, which are both being held in escrow to secure such obligations. Under the terms of the Share Purchase Agreement, Alychlo and its affiliates are subject to a three-year non-compete in Europe, and the Sellers are subject to a two-year non-solicit, in each case subject to certain exceptions. The Share Purchase Agreement contains other customary representations, warranties, and covenants of the parties thereto. Our Board of Directors has authorized us to issue an arbitral claim against the sellers, which we plan to do.
The operating results attributable to Omega are included in the BCH segment. We incurred general transaction costs (legal, banking and other professional fees), financing fees, and debt extinguishment charges in connection with the Omega acquisition. The amounts recorded were not allocated to a reporting segment. The table below details the acquisition costs, as well as losses on hedging activities associated with the acquisition purchase price, and where they were recorded for the nine months ended September 26, 2015 (in millions):
Perrigo Company plc - Item 1
Note 2
|
| | | | |
| | | Nine Months Ended |
| Line item | | September 26, 2015 |
| Administration | | $ | 18.1 |
|
| Interest expense, net | | 18.7 |
|
| Other expense, net | | 258.2 |
|
| Total acquisition-related costs | | $ | 295.0 |
|
See Note 8 for further details on losses on the Omega-related hedging activities shown above in Other expense, net, and Note 10 for details on the loss on extinguishment of debt.
We acquired the following intangible assets: indefinite-lived brands, a definite-lived trade name with an eight-year useful life, definite-lived brands with a 22-year useful life, a distribution network with a 21-year useful life, and developed product technology with useful lives ranging from fourto 13 years. We also recorded goodwill, which is not deductible for tax purposes and represents the value we assigned to the expected synergies described above, in our BCH segment. We utilized the multi-period excess earnings method to value the indefinite-lived brands, the definite-lived brands, and distribution network. We utilized the relief from royalty method to value the developed product technology and definite-lived trade name.
Based on valuation estimates utilizing the comparative sales method, a step-up in the value of inventory of $15.1 million was recorded in the opening balance sheet and was charged to cost of goods sold during the three months ended June 27, 2015. In addition, property, plant and equipment were written up $41.5 million to their estimated fair market value based on a valuation method that included both the cost and market approaches. This additional step-up in value is being depreciated over the estimated remaining useful lives of the assets. Additionally, the fair value of the debt assumedon the date of acquisition exceeded par value by $101.9 million,third party, which was recorded as parta gain in Other operating income on the Condensed Consolidated Statements of Operations in our Prescription Pharmaceuticals ("RX") segment.
On April 6, 2017, we completed the sale of our India Active Pharmaceutical Ingredients ("API") business to Strides Shasun Limited. We received $22.2 million of proceeds inclusive of an estimated working capital adjustment. Prior to closing the sale, we determined that the carrying value of the
underlying debt and will be amortized as a reductionIndia API business exceeded its fair value less the cost to sell, resulting in an impairment charge of
interest expense over the remaining terms of the respective debt instruments. For more information$35.3 million, which was recorded in Impairment charges on the
debt we assumed from Omega and our subsequent payments on the debt, see Note 10.
Perrigo Company plc - Item 1
Note 2
Purchase Price AllocationConsolidated Statements of Prior Year Acquisitions
The purchase accounting allocationOperations for the Entocort® and GSK Products acquisitions were finalized during the three months ended April 2, 2016. Changes to the allocations were due to adjustments to the intangible asset valuation assumptions. The purchase accounting for all other prior year acquisitions was final as of December 31, 2015. The below table indicates the purchase price allocation for acquisitions completed during the year ended December 31, 2015 (in millions): |
| | | | | | | | | | | | | | | | | | | | | | | | | | | |
| | Entocort® | | Naturwohl | | ScarAway® | | GSK Products | | Gelcaps | | Omega | | All Other(1) |
| Purchase price paid | $ | 380.2 |
| | $ | 150.4 |
| | $ | 26.7 |
| | $ | 223.6 |
| | $ | 37.9 |
| | $ | 2,983.2 |
| | $ | 15.3 |
|
| Contingent consideration | — |
| | — |
| | — |
| | — |
| | — |
| | — |
| | 13.9 |
|
| Total purchase consideration | $ | 380.2 |
| | $ | 150.4 |
| | $ | 26.7 |
| | $ | 223.6 |
| | $ | 37.9 |
| | $ | 2,983.2 |
| | $ | 29.2 |
|
| | | | | | | | | | | | | | |
| Assets acquired: | | | | | | | | | | | | | |
| Cash and cash equivalents | $ | — |
| | $ | 4.6 |
| | $ | — |
| | $ | — |
| | $ | 4.6 |
| | $ | 14.7 |
| | $ | — |
|
| Accounts receivable | — |
| | 3.3 |
| | — |
| | — |
| | 7.3 |
| | 260.1 |
| | — |
|
| Inventories | 0.2 |
| | 1.5 |
| | 1.0 |
| | — |
| | 7.2 |
| | 202.5 |
| | — |
|
| Prepaid expenses and other current assets | — |
| | — |
| | — |
| | — |
| | 2.1 |
| | 39.2 |
| | — |
|
| Property and equipment | — |
| | — |
| | — |
| | — |
| | 6.0 |
| | 130.8 |
| | — |
|
| Goodwill | — |
| | 61.0 |
| | 3.5 |
| | 32.6 |
| | 6.0 |
| | 1,900.4 |
| | — |
|
Definite-lived intangibles: | | | | | | | | | | | | | |
| Distribution and license agreements, supply agreements | — |
| | 21.4 |
| | — |
| | — |
| | — |
| | — |
| | — |
|
| Developed product technology, formulations, and product rights | 380.0 |
| | — |
| | 0.5 |
| | — |
| | — |
| | 27.2 |
| | — |
|
| Customer relationships and distribution networks | — |
| | 25.9 |
| | 9.8 |
| | 61.5 |
| | 6.6 |
| | 1,056.3 |
| | — |
|
| Trademarks, trade names, and brands | — |
| | 64.2 |
| | 11.4 |
| | 129.5 |
| | — |
| | 287.5 |
| | — |
|
| Non-compete agreements | — |
| | 0.3 |
| | 0.5 |
| | — |
| | — |
| | — |
| | — |
|
Indefinite-lived intangibles: | | | | | | | | | | | | | |
| Trademarks, trade names, and brands | — |
| | — |
| | — |
| | — |
| | 4.4 |
| | 2,003.8 |
| | — |
|
| In-process research and development | — |
| | — |
| | — |
| | — |
| | — |
| | — |
| | 29.2 |
|
| Total intangible assets | $ | 380.0 |
| | $ | 111.8 |
| | $ | 22.2 |
| | $ | 191.0 |
| | $ | 11.0 |
| | $ | 3,374.8 |
| | $ | 29.2 |
|
| Other non-current assets | — |
| | — |
| | — |
| | — |
| | 0.4 |
| | 2.4 |
| | — |
|
| Total assets | $ | 380.2 |
| | $ | 182.2 |
| | $ | 26.7 |
| | $ | 223.6 |
| | $ | 44.6 |
| | $ | 5,924.9 |
| | $ | 29.2 |
|
| Liabilities assumed: | | | | | | | | | | | | | |
| Accounts payable | $ | — |
| | $ | 2.8 |
| | $ | — |
| | $ | — |
| | $ | 3.3 |
| | $ | 243.1 |
| | $ | — |
|
| Short-term debt | — |
| | — |
| | — |
| | — |
| | — |
| | 24.6 |
| | — |
|
| Accrued liabilities | — |
| | 1.6 |
| | — |
| | — |
| | 1.6 |
| | 43.9 |
| | — |
|
| Payroll and related taxes | — |
| | — |
| | — |
| | — |
| | — |
| | 51.3 |
| | — |
|
| Accrued customer programs | — |
| | — |
| | — |
| | — |
| | — |
| | 39.8 |
| | — |
|
| Long-term debt | — |
| | — |
| | — |
| | — |
| | — |
| | 1,471.0 |
| | — |
|
| Net deferred income tax liabilities | — |
| | 27.4 |
| | — |
| | — |
| | 1.4 |
| | 1,014.5 |
| | — |
|
| Other non-current liabilities | — |
| | — |
| | — |
| | — |
| | 0.4 |
| | 53.5 |
| | — |
|
| Total liabilities | — |
| | 31.8 |
| | — |
| | — |
| | 6.7 |
| | 2,941.7 |
| | — |
|
| Net assets acquired | $ | 380.2 |
| | $ | 150.4 |
| | $ | 26.7 |
| | $ | 223.6 |
| | $ | 37.9 |
| | $ | 2,983.2 |
| | $ | 29.2 |
|
| |
(1) | Consists of eight product acquisitions in the CHC, BCH, and Rx segments |
Perrigo Company plc - Item 1
Note 2
2016.
Actual and Unaudited Pro Forma Impact of Acquisitions
Our Condensed Consolidated Financial Statements include operating results from the Tretinoin Products, Entocort®, Naturwohl, GSK Products, ScarAway®, Omega, and Gelcaps acquisitions, as well as from four small product acquisitions, from the date of each acquisition through October 1, 2016. Net sales and operating income attributable to acquisitions completed in the current year and included in our financial statements totaled $25.3 million and $13.0 million, respectively, for the three months ended October 1, 2016 and totaled $47.7 million and $31.3 million, respectively, for the nine months ended October 1, 2016.
The following unaudited pro forma information gives effect to the Tretinoin Products, Entocort®, Naturwohl, GSK Products, ScarAway®, Omega, and Gelcaps acquisitions, as well as four small product acquisitions, as if the acquisitions had occurred on the first day of the nine months ended September 26, 2015 and had been included in our Results of Operations for all periods presented thereafter (in millions):
|
| | | | | | | | | | | | | | | |
| | Three Months Ended | | Nine Months Ended |
| (Unaudited) | October 1,
2016 | | September 26,
2015 | | October 1,
2016 | | September 26,
2015 |
| Net sales | $ | 1,359.6 |
| | $ | 1,429.9 |
| | $ | 4,243.3 |
| | $ | 4,451.4 |
|
| Net income (loss) | $ | (1,254.9 | ) | | $ | 142.0 |
| | $ | (1,392.8 | ) | | $ | 154.7 |
|
The historical consolidated financial information of Perrigo, and the Tretinoin Products, Entocort®, Naturwohl, GSK Products, ScarAway®, Omega and Gelcaps acquisitions and the four small product acquisitions, has been adjusted in the pro forma information to give effect to pro forma events that are (1) directly attributable to the transactions, (2) factually supportable and (3) expected to have a continuing impact on combined results. In order to reflect the occurrence of the acquisitions on the first day of the nine months ended September 26, 2015 as required, the unaudited pro forma results include adjustments to reflect the incremental amortization expense to be incurred based on the current values of each acquisition's identifiable intangible and tangible assets, along with the reclassification of acquisition-related costs from the nine months ended October 1, 2016 to the nine months endedSeptember 26, 2015. The unaudited pro forma results do not reflect future events that have occurred or may occur after the acquisitions.
CurrentPrior Year Divestitures
On August 5, 2016, we completed the sale of our U.S. Vitamins, Minerals, and Supplements ("VMS") business within our CHCConsumer Healthcare Americas ("CHCA) segment to International Vitamins Corporation ("IVC") for $61.8 million inclusive of an estimated working capital adjustment. The assets and liabilities related to this sale were classified as held-for-sale at December 31, 2015. Prior to closing the sale, we determined that the carrying value of the VMS business exceeded its fair value less the cost to sell, resulting in an impairment charge of $6.2 million, which was recorded in Impairment charges on the Condensed Consolidated Statements of Operations duringfor the nine monthsyear ended October 1,December 31, 2016.
Perrigo Company plc - Item 1
Note 3
NOTE 3 – GOODWILL AND OTHER INTANGIBLE ASSETS
Goodwill
Changes in the carrying amount of goodwill, by reportable segment, were as follows (in millions): |
| | | | | | | | | | | | | | | | | | | | | | | | | | | | |
| Reporting Segments: | | December 31, 2015 | | Business acquisitions | | Business divestitures | | Impairments | | Changes in assets held for sale | | Currency translation adjustment | | October 1,
2016 |
| CHC | | $ | 1,890.0 |
| | $ | 0.2 |
| | $ | (8.5 | ) | | $ | — |
| | $ | 13.0 |
| | $ | (6.8 | ) | | $ | 1,887.9 |
|
| BCH | | 1,980.5 |
| | — |
| | — |
| | (967.5 | ) | | — |
| | 92.4 |
| | 1,105.4 |
|
| Rx | | 1,222.2 |
| | 1.7 |
| | — |
| | — |
| | — |
| | (13.7 | ) | | 1,210.2 |
|
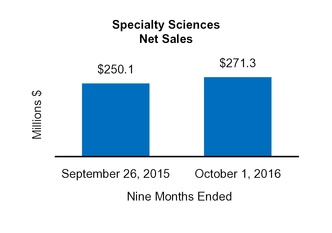
| Specialty Sciences | | 200.7 |
| | — |
| | — |
| | — |
| | — |
| | — |
| | 200.7 |
|
| Other | | 71.5 |
| | — |
| | — |
| | — |
| | 11.7 |
| | 3.2 |
| | 86.4 |
|
| Total goodwill | | $ | 5,364.9 |
| | $ | 1.9 |
| | $ | (8.5 | ) | | $ | (967.5 | ) | | $ | 24.7 |
| | $ | 75.1 |
| | $ | 4,490.6 |
|
Perrigo Company plc - Item 1
Note 3
|
| | | | | | | | | | | | | | | | |
| Reporting Segments: | | December 31,
2016 | | Changes in assets held for sale | | Currency translation adjustment | | July 1,
2017 |
| CHCA | | $ | 1,810.6 |
| | $ | — |
| | $ | 3.1 |
| | $ | 1,813.7 |
|
| CHCI | | 1,070.8 |
| | (4.0 | ) | | 85.2 |
| | 1,152.0 |
|
| RX | | 1,086.6 |
| | — |
| | 7.7 |
| | 1,094.3 |
|
| Other | | 81.4 |
| | — |
| | 8.9 |
| | 90.3 |
|
| Total goodwill | | $ | 4,049.4 |
| | $ | (4.0 | ) | | $ | 104.9 |
| | $ | 4,150.3 |
|
In connection with the preparation of our financial statements for the three-month periodthree months ended April 2, 2016, we identified indicators of goodwill impairment infor our BCHBranded Consumer Healthcare - restRest of world (“BCH - ROW”World ("BCH-ROW") reporting unit, which comprises primarily operations attributable to the Omega Pharma Invest N.V. ("Omega") acquisition in all geographic regions except for Belgium. Identification of these indicators of impairment required us to complete interim goodwill impairment testing. The primary impairment indicators included the decline in our 2016 performance expectations and a reduction in our long-range revenue growth forecast. Step one of the goodwill impairment test involved determining the fair value of the reporting unit using a discounted cash flow technique and comparing it to the reporting unit’s carrying value. The main assumptions supporting the cash flow projections used to determine the reporting unit’s fair value included revenue growth based on product line extensions, product life cycle strategies, and geographical expansion within the markets in which the reporting unit distributes products, gross margins consistent with historical trends, and advertising and promotion investments largely consistent with the reporting unit's growth plans. The BCH - ROW reporting unitBCH-ROW did not pass step one of goodwill impairment testing. The change in fair value from previous estimates was due primarily to the changes in the market and performance of certainthe brands such that the evaluation of brand prioritization and product extensions or launches in new regions areis being more focused to maximize the potential of all brands in the segment's portfolio.
The second step of the goodwill impairment test required that we determine the implied fair value of the BCH - ROW reporting unit’s goodwill, which involved determining the value of the reporting unit’s individual assets and liabilities. Due to the complex and time-consuming nature of step two, based Based on our evaluation and initial estimates of the fair values of the assets and liabilities and the deficit of the fair value when compared to the related book value, we recorded an estimated$130.5 million in impairment charge of $193.6 millioncharges for the three months ended April 2, 2016. We finalized the step two fair value calculation during the three months ended July 2, 2016 which resulted in a $30.3 million reduction to the estimated impairment charge recorded during the three months ended April 2, 2016.
In connection with the preparation of our financial statements for the three months ended October 1, 2016, we identified additional indicators of goodwill impairment in both our BCH - ROW and our BCH - Belgium reporting units. With respect to both reporting units, the primary impairment indicators included an additional decline in our 2016 performance expectations for the remainder of the year and a reduction in our long-range revenue growth and margin forecasts due to the factors outlined below. Step one of the goodwill impairment test involved determining the fair value of the reporting units using a discounted cash flow technique and comparing it to the respective reporting units' carrying value. The main assumptions supporting the cash flow projections used to determine each reporting unit’s fair value included revenue growth based on product line extensions, product life cycle strategies, and geographical expansion within the markets in which the reporting unit distributes products, gross margins consistent with historical trends and including supply chain cost improvement plans, and advertising and promotion investments largely consistent with the reporting unit's growth plans. Both the BCH - ROW and the BCH - Belgium reporting units did not pass step one of goodwill impairment testing. As it relates to the BCH - ROW reporting unit, the changes in fair value from previous estimates were due primarily to (1) changes in the market and performance of certain brands due to moderated new product launch assumptions, (2) execution of certain key product strategies falling short of expectations causing a reduction to baseline forecast models in France, Germany and Italy, (3) certain macro-economic factors having continued to impact the business more than expected in France, Russia and Turkey in addition to unfavorable foreign currency impacts experienced primarily in the UK related to Brexit. As it relates to BCH - Belgium reporting unit, the changes in fair value from previous estimates due to change in the forecast as a result of a reduction in volume with a major wholesaler due to factors consistent with those outlined for BCH - ROW.
The second step of the goodwill impairment test required that we determine the implied fair value of both the BCH - ROW and BCH - Belgium reporting units' goodwill, which involved determining the value of each reporting unit’s individual assets and liabilities. Based on our evaluation and initial estimates of the fair values of the assets and liabilities and the deficit of the fair value when compared to the related book value, we recorded an estimated impairment charge of $734.7 million related to the BCH - ROW reporting unit and $69.4 million related to the BCH - Belgium reporting unit for the three months ended October 1, 2016. Both charges were recorded in Impairment charges on the Condensed Consolidated Statements of Operations within our BCHConsumer Healthcare International ("CHCI") segment. Due to the complex and time-consuming nature of step two, we expect to finalize the fair value calculation during the fourth quarter of 2016, which could result in an adjustment to the estimated impairment charge. As of October 1, 2016, the implied fair value of goodwill that remains in the BCH - ROW and BCH - Belgium reporting units is $1.0 billion and $70.2 million, respectively.
Perrigo Company plc - Item 1
Note 3
While no impairment charges were recorded as a result of the goodwill impairment testing for the transition period of June 28, 2015 to December 31, 2015, our Specialty Sciences reporting unit's fair value exceeded the carrying value by less than 10%. Management evaluated the primary source of cash flow in this segment, the Tysabri® royalty stream, based on a combination of factors including independent external research, information provided from our royalty partner, and internal estimates. Based on this information, management’s assessment of future cash flow from this royalty stream has been reduced primarily due to anticipated new competitors entering the market and unfavorable currency exchange effects. Future performance different from the assumptions utilized in our quantitative analysis may further reduce the fair value of the reporting unit, which may result in the fair value no longer exceeding the carrying value. In February 2016, a competitor's pipeline product, Ocrevus®, received breakthrough therapy designation from the FDA and could potentially be approved in 2016. The product would compete with Tysabri® and could have a significant negative impact on the royalty we receive from Biogen Idec, Inc. ("Biogen") and the performance of the Specialty Sciences segment. We continue to monitor the progress of all potential competing products and assess the reporting unit for potential impairment should impairment indicators arise, as applicable, and at least annually during our fourth quarter impairment testing.
During the three months ended June 27, 2015, we performed our annual goodwill impairment testing, which indicated that our CHC Mexico reporting unit's goodwill fair value was below its net book value as of March 28, 2015. As a result, we initiated the second step of the goodwill impairment test to measure the amount of impairment. We concluded that the goodwill was fully impaired and recorded an impairment of $6.8 million in the CHC segment during the nine months ended September 26, 2015 in Other expense, net.
Intangible Assets
Other intangible assets and related accumulated amortization consisted of the following (in millions):
| | | | October 1, 2016 | | December 31, 2015 | July 1, 2017 | | December 31, 2016 |
| | Gross | | Accumulated Amortization | | Gross | | Accumulated Amortization | Gross | | Accumulated Amortization | | Gross | | Accumulated Amortization |
Definite-lived intangibles: | | | | | | | | | | | | | | |
| Distribution and license agreements, supply agreements | $ | 6,122.3 |
| | $ | 914.0 |
| | $ | 6,053.4 |
| | $ | 667.2 |
| $ | 309.4 |
| | $ | 145.2 |
| | $ | 305.6 |
| | $ | 120.4 |
|
| Developed product technology, formulations, and product rights | 1,805.9 |
| | 529.0 |
| | 1,383.5 |
| | 426.0 |
| 1,385.6 |
| | 566.5 |
| | 1,418.1 |
| | 526.0 |
|
| Customer relationships and distribution networks | 1,564.0 |
| | 288.8 |
| | 1,520.7 |
| | 193.0 |
| 1,584.6 |
| | 384.8 |
| | 1,489.9 |
| | 307.5 |
|
| Trademarks, trade names, and brands | 631.6 |
| | 54.7 |
| | 539.4 |
| | 22.8 |
| 1,279.5 |
| | 91.8 |
| | 1,189.3 |
| | 55.3 |
|
| Non-compete agreements | 14.6 |
| | 11.0 |
| | 15.2 |
| | 12.7 |
| 14.6 |
| | 12.0 |
| | 14.3 |
| | 11.2 |
|
| Total definite-lived intangibles | $ | 10,138.4 |
| | $ | 1,797.5 |
| | $ | 9,512.2 |
| | $ | 1,321.7 |
| $ | 4,573.7 |
| | $ | 1,200.3 |
| | $ | 4,417.2 |
| | $ | 1,020.4 |
|
Indefinite-lived intangibles: | | | | | | | | | | | | | | |
| Trademarks, trade names, and brands | $ | 724.2 |
| | $ | — |
| | $ | 1,868.1 |
| | $ | — |
| $ | 51.5 |
| | $ | — |
| | $ | 50.5 |
| | $ | — |
|
| In-process research and development | 67.9 |
| | — |
| | 48.2 |
| | — |
| 51.2 |
| | — |
| | 64.0 |
| | — |
|
| Total indefinite-lived intangibles | 792.1 |
| | — |
| | 1,916.3 |
| | — |
| 102.7 |
| | — |
| | 114.5 |
| | — |
|
| Total other intangible assets | $ | 10,930.5 |
| | $ | 1,797.5 |
| | $ | 11,428.5 |
| | $ | 1,321.7 |
| $ | 4,676.4 |
| | $ | 1,200.3 |
| | $ | 4,531.7 |
| | $ | 1,020.4 |
|
Certain intangible assets are denominated in currencies other than the U.S. dollar; therefore, their gross and net carrying valuesaccumulated amortization balances are subject to foreign currency movements.
We recorded amortization expense of $162.1 million and $147.6 million for the three months ended October 1, 2016 and September 26, 2015, respectively, and $481.8 million and $397.9 million for the nine months ended October 1, 2016 and September 26, 2015, respectively. The increase in amortization expense for the 2016 nine-month period was due primarily to the incremental amortization expense incurred on the definite-lived intangible assets acquired from the Omega, Entocort®,and Tretinoin Products acquisitions.
During our impairment testing for the transition period of June 28, 2015 to December 31, 2015, we identified an impairment of certain indefinite-lived intangible assets purchased in conjunction with the Omega acquisition based on management’s expectations of the prospects for future revenues, profits, and cash flows associated with
Perrigo Company plc - Item 1
Note 3
these
We recorded amortization expense of $87.2 million and $88.9 million for the three months ended July 1, 2017 and July 2, 2016, respectively, and $172.8 million and $174.1 million for the six months ended July 1, 2017 and July 2, 2016, respectively.
We recorded an impairment charge of $12.2 million on certain In Process Research and Development ("IPR&D") assets during the three months ended April 1, 2017 due to changes in the projected development and regulatory timelines for various projects. During the six months ended July 1, 2017, we recorded a decrease in the contingent consideration liability associated with certain IPR&D assets in Other operating income on the Condensed Consolidated Statements of Operations. Refer to Note 6 for additional information.
During the three months ended July 1, 2017, we identified impairment indicators for our Lumara Health, Inc. ("Lumara") product assets. The primary impairment indicators included the decline in our 2017 performance expectations and a reduction in our long-range revenue growth forecast. The assessment utilized the multi-period excess earnings method to determine fair value and resulted in an impairment charge of $185.1$18.5 million in Impairment charges on the Condensed Consolidated Statements of Operations within our BCHRX segment, which represented the difference between the carrying amount of the intangible assets and their estimated fair value. See our Transition Report on Form 10-KT filed on February 25, 2016 for a further discussion of this impairment charge.
In connection with the preparation of our financial statementsCondensed Consolidated Financial Statements for the three-month period ended April 2, 2016, we identified indicators of impairment associated with certain indefinite-lived intangible assets acquired in conjunction with the Omega acquisition. The primary impairment indicators included the decline in our 2016 performance expectations and a reduction in our long-range revenue growth forecast. The assessment utilized the excess earnings method to determine fair value and resulted in an impairment charge of $273.4 million, which was recorded in Impairment charges on the Condensed Consolidated Statements of Operations within our BCHCHCI segment, which represented the difference between the carrying amount of the intangible assets and their estimated fair value. The change in fair value from previous estimates was due primarily to the changes in the market and performance of the brands such that the evaluation of brand prioritization and product extensions or launches in new regions areis being more focused to maximize the potential of all brands in the segment's portfolio. The main assumptions supporting the fair value of these assets and cash flow projections included revenue growth based on product line extensions, product life cycle strategies, and geographical expansion within the markets in which the BCHCHCI segment distributes products, gross margins consistent with historical trends, and advertising and promotion investments largely consistent with the segment's growth plans.
In connection with the preparationaddition, due to reprioritization of our financial statements for the three months ended October 1, 2016, we identified additional indicators of impairment associated with certain indefinite-lived and definite-lived intangible brand category assets acquired in conjunction with the Omega acquisition. The primary impairment indicators are discussed above in goodwill. The assessment of the indefinite-lived assets utilized the excess earnings method to determine fair value and resulted in an impairment charge of $575.7 million for the three months ended October 1, 2016. With regards to the definite-lived asset, it was determined that the carrying value of the asset group was not recoverable based on an assessment of the undiscounted future cash flows expected to be generated by the asset group. Given this, the excess earnings method was utilized to determine fair value of the definite-lived asset and resulted in an impairment charge of $290.2 million for the three months ended October 1, 2016. Both charges, which represented the difference between the carrying amount of the intangible assets and their estimated fair value, were recorded in Impairment charges on the Condensed Consolidated Statements of Operations within our BCH segment. The main assumptions supporting the fair value of these assets and cash flow projections are includedbrands in the goodwill discussions above.
The carrying value for certain intangible assetsCHCI segment and goodwill equals estimated and implied fair values, respectively, and as a result, any further deterioration in those assets' fair value would lead to a further impairment charge. Future performance different from the assumptions utilized in our quantitative analyses may result in additional changes in the fair value. We will continue to monitor and assess these assets for potential impairment should further impairment indicators arise. We will complete our required annual impairment testing during the fourth quarter of 2016.
In addition, given the additional change in performance expectations for our remaining impairedthe cough/cold/allergy, anti-parasite, personal care, lifestyle, and natural health brands, previously recorded as indefinite-lived assets,on April 3, 2016, we reclassified the remaining asset balance$364.5 million of $672.4 million related to these fourindefinite-lived assets to definite-lived assets with a 20-year useful life andof 20 years. We began amortizing the assets asduring the second quarter of October 2, 2016.
NOTE 4 - ACCOUNTS RECEIVABLE FACTORING
We have multiple accounts receivable factoring arrangements with non-related third-party financial institutions (the “Factors”). Pursuant to the terms of the arrangements, we sell to the Factors certain of our accounts receivable balances on a non-recourse basis for credit approved accounts. An administrative fee ranging from 0.14%0.07% to 0.15% per invoice is charged on the gross amount of accounts receivables assigned to the Factors, plusand interest is calculated at the applicable EUR LIBOR rate plus 50 to 70 basis points. The total amount factored on a non-recourse basis and excluded from accounts receivable was $36.4$27.0 million and $106.7$50.7 million at OctoberJuly 1, 20162017 and December 31, 2015,2016, respectively.
Perrigo Company plc - Item 1
Note 5
NOTE 5 – INVENTORIES
Major components of inventory were as follows (in millions):
| | | | October 1,
2016 | | December 31,
2015 | July 1,
2017 | | December 31,
2016 |
| Finished goods | $ | 511.6 |
| | $ | 483.4 |
| $ | 467.5 |
| | $ | 431.1 |
|
| Work in process | 171.0 |
| | 151.4 |
| 136.8 |
| | 165.7 |
|
| Raw materials | 202.0 |
| | 209.6 |
| 213.8 |
| | 198.2 |
|
| Total inventories | $ | 884.6 |
| | $ | 844.4 |
| $ | 818.1 |
| | $ | 795.0 |
|
NOTE 6 – FAIR VALUE MEASUREMENTS
Fair value is the price that would be received upon sale of an asset or paid to transfer a liability in an orderly transaction between market participants at the measurement date. The following fair value hierarchy is used in selecting inputs, with the highest priority given to Level 1, as these are the most transparent or reliable.
| |
| Level 1: | Quoted prices for identical instruments in active markets. |
| |
| Level 2: | Quoted prices for similar instruments in active markets; quoted prices for identical or similar instruments in markets that are not active; and model-derived valuations in which all significant inputs are observable in active markets. |
| |
| Level 3: | Valuations derived from valuation techniques in which one or more significant inputs are not observable. |
Perrigo Company plc - Item 1
Note 6
The following table summarizes the valuation of our financial instruments carried at fair value and measured at fair value on a recurring and non-recurring basis by the above pricing categories (in millions):
| | | | | Fair Value | | Fair Value |
| | | Fair Value Hierarchy | | October 1,
2016 | | December 31,
2015 | | Fair Value Hierarchy | | July 1,
2017 | | December 31,
2016 |
| Measured at fair value on a recurring basis: | | | | | | | | |
| Assets: | | | | | | | | |
| Investment securities | | Level 1 | | $ | 53.0 |
| | $ | 14.9 |
| | Level 1 | | $ | 13.6 |
| | $ | 38.2 |
|
| | | | | | | | | |
| Foreign currency forward contracts | | Level 2 | | $ | 5.2 |
| | $ | 4.8 |
| | Level 2 | | $ | 16.6 |
| | $ | 3.8 |
|
| Funds associated with Israeli severance liability | | | Level 2 | | 18.1 |
| | 15.9 |
|
| Total level 2 assets | | | $ | 34.7 |
| | $ | 19.7 |
|
| | | | | | |
| Royalty Pharma contingent milestone payments | | | Level 3 | | $ | 145.8 |
| | $ | — |
|
Tysabri® royalty stream | | | Level 3 | | — |
| | 2,350.0 |
|
| Total level 3 assets | | | $ | 145.8 |
| | $ | 2,350.0 |
|
| | | | | | | | | |
| Liabilities: | | | | | | | | |
| Interest rate swap agreements | | Level 2 | | $ | — |
| | $ | 0.3 |
| |
| Foreign currency forward contracts | | Level 2 | | 0.8 |
| | 3.9 |
| | Level 2 | | $ | 4.0 |
| | $ | 5.0 |
|
| Total level 2 liabilities | | $ | 0.8 |
| | $ | 4.2 |
| |
| | | | | | | | | |
| Contingent consideration | | Level 3 | | $ | 75.0 |
| | $ | 17.9 |
| | Level 3 | | $ | 49.7 |
| | $ | 69.9 |
|
| | | | | | | | | |
| Measured at fair value on a non-recurring basis: | | | | | | | | |
| Assets: | | | | | | | | |
Goodwill(1) | | Level 3 | | $ | 1,105.4 |
| | $ | — |
| | Level 3 | | $ | — |
| | $ | 1,148.4 |
|
Indefinite-lived intangible assets(2) | | Level 3 | | 672.4 |
| | 1,031.8 |
| | Level 3 | | 13.8 |
| | 0.3 |
|
Definite-lived intangible assets(3) | | Level 3 | | 66.9 |
| | — |
| | Level 3 | | 11.5 |
| | 758.0 |
|
| Assets held for sale, net | | Level 3 | | 14.1 |
| | 37.5 |
| | Level 3 | | 11.8 |
| | 18.2 |
|
| Total level 3 assets | | $ | 1,858.8 |
| | $ | 1,069.3 |
| | $ | 37.1 |
| | $ | 1,924.9 |
|
| |
(1) | GoodwillAs of December 31, 2016, goodwill with a carrying amount of $1.9$2.2 billion was written down to its implied fair value of $1.1 billion, resulting in an impairment charge of $804.1 million for the three months ended October 1, 2016; impairment charges totaled $967.5 million for the nine months ended October 1, 2016 and are included in Impairment charges on the Condensed Consolidated Statements of Operations.billion. |
Perrigo Company plc - Item 1
Note 6
| |
(2) | Indefinite-livedAs of April 1, 2017, indefinite-lived intangible assets with a carrying amount of $1.2$26.0 million were written down to a fair value of $13.8 million, resulting in a total impairment charge of $12.2 million. As of December 31, 2016, indefinite-lived intangible assets with a carrying amount of $0.7 million were written down to a fair value of $0.3 million. |
| |
(3) | As of July 1, 2017, definite-lived intangible assets with a carrying amount of $31.1 million were written down to a fair value of $11.5 million, resulting in a total impairment charge of $19.6 million. As of December 31, 2016, definite-lived intangible assets with a carrying amount of $2.3 billion were written down to a fair value of $672.4$758.0 million, resulting in a total impairment chargescharge of $575.7 million for the three months ended October 1, 2016; impairment charges totaled $849.1 million for the nine months ended October 1, 2016 and$1.5 billion. Included in this balance are included in Impairment charges on the Condensed Consolidated Statements of Operations. |
| |
(3) | Definite-livedindefinite-lived intangible assets with a carrying amount of $357.1 million were written down to a fair value of $66.9$364.5 million resulting in an impairment charge of $290.2and $674.2 million for the threethat were reclassified to definite-lived assets at April 3, 2016 and nine months ended October 1,2, 2016, which is included in Impairment charges on the Condensed Consolidated Statements of Operations.respectively. |
There were no transfers among Level 1, 2, and 3 during the three and ninesix months ended OctoberJuly 1, 2016 and September 26, 2015.2017 or the year ended December 31, 2016. Our policy regarding the recording of transfers between levels is to record any such transfers at the end of the reporting period. See Note 7 for information on our investment securities. See Note 8 for a discussion of derivatives.
Foreign currency forward contracts
The fair value of foreign currency forward contracts is determined using a market approach, which utilizes values for comparable derivative instruments.
Perrigo Company plc - Item 1
Note 6
Funds Associated with Israel Severance Liability
Israeli labor laws and agreements require us to pay benefits to employees dismissed or retiring under certain circumstances. Severance pay is calculated on the basis of the most recent employee salary levels and the length of employee service. Our Israeli subsidiaries also provide retirement bonuses to certain managerial employees. We make regular deposits to retirement funds and purchase insurance policies to partially fund these liabilities. The funds are determined using prices for recently traded financial instruments with similar underlying terms, as well as directly or indirectly observable inputs, such as interest rates and yield curves, that are observable at commonly quoted intervals.
Tysabri® Royalty Stream
On December 18, 2013, we acquired Elan, which had a royalty agreement with Biogen Idec Inc. ("Biogen"), whereby Biogen conveyed the right to receive royalties that are typically payable on sales revenue generated by the sale, distribution or other use of the drug Tysabri®. Pursuant to the royalty agreement, we were entitled to royalty payments from Biogen based on its Tysabri® sales in all indications and geographies. We received royalties of 12% on worldwide Biogen sales of Tysabri® from December 18, 2013 through April 30, 2014. From May 1, 2014, we received royalties of 18% on annual worldwide Biogen sales of Tysabri® up to $2.0 billion and 25% on annual sales above $2.0 billion.
We accounted for the Tysabri® royalty stream as a financial asset and elected to use the fair value option model. We made the election to account for the Tysabri® financial asset using the fair value option as we believed this method was most appropriate for an asset that did not have a par value, a stated interest stream, or a termination date. The financial asset acquired represented a single unit of accounting. The fair value of the financial asset acquired was determined by using a discounted cash flow analysis related to the expected probability weighted future cash flows to be generated by the royalty stream. The financial asset was classified as a Level 3 asset within the fair value hierarchy, as our valuation utilized significant unobservable inputs, including industry analyst estimates for global Tysabri® sales, probability weighted as to the timing and amount of future cash flows along with certain discount rate assumptions. Cash flow forecasts included the estimated effect and timing of future competition, considering patents in effect for Tysabri® through 2024 and contractual rights to receive cash flows into perpetuity. The discounted cash flows were based upon the expected royalty stream forecasted into perpetuity using a 20-year discrete period with a declining rate terminal value.
In the first quarter of 2016, a competitor's pipeline product, Ocrevus®, received breakthrough therapy designation from the U.S. Food and Drug Administration ("FDA"). Breakthrough therapy designation is granted when a drug is intended alone or in combination with one or more other drugs to treat a serious or life threatening disease or condition and preliminary clinical evidence indicates that the drug may demonstrate substantial improvement over existing therapies on one or more clinically significant endpoints, such as substantial treatment effects observed early in clinical development. In June 2016, the FDA granted priority review with a target action date in December 2016. A priority review is a designation when the FDA will direct overall attention and resources to the evaluation of applications for drugs that, if approved, would be significant improvements in the safety or effectiveness of the treatment, diagnosis, or prevention of serious conditions when compared to standard applications. The product was approved late in the first quarter of 2017. The product is expected to compete with Tysabri®, and we expected it to have a significant negative impact on the Tysabri® royalty stream. Industry analysts believe that, based on released clinical study information, Ocrevus® will compete favorably against Tysabri® in the relapsing, remitting multiple sclerosis market segment due to its high efficacy and convenient dosage form.
Given the new market information for Ocrevus®, we used industry analyst estimates to reduce our first ten year growth forecasts from an average of growth of approximately 3.4% in the fourth calendar quarter of 2015 to an average decline of approximately minus 2.0% in the third and fourth calendar quarters of 2016. In November 2016, we announced we were evaluating strategic alternatives for the Tysabri® asset. As of December 31, 2016, the financial asset was adjusted based on the strategic review and sale process. These effects, combined with the change in discount rate each quarter, led to a reduction in fair value of $204.4 million, $910.8 million, $377.4 million and $1.1 billion in the first, second, third and fourth quarters of 2016, respectively.
Perrigo Company plc - Item 1
Note 6
On March 27, 2017, we announced the completed divestment of our Tysabri® royalty stream to Royalty Pharma for up to $2.85 billion, which consists of $2.2 billion in cash and up to $250.0 million and $400.0 million in milestone payments if the royalties on global net sales of Tysabri® that are received by Royalty Pharma meet specific thresholds in 2018 and 2020, respectively. As a result of this transaction, we transferred the entire financial asset to Royalty Pharma and recorded a $17.1 million gain during the three months ended July 1, 2017. We elected to account for the contingent milestone payments using the fair value option method, and these were recorded at an estimated fair value of $145.8 million as of July 1, 2017. We chose the fair value option as we believe it will help investors understand the potential future cash flows we may receive associated with the two contingent milestones.
We valued the contingent milestone payments using a modified Black-Scholes Option Pricing Model ("BSOPM"). Key inputs in the BSOPM are the estimated volatility and rate of return of royalties on global net sales of Tysabri® that are received by Royalty Pharma over time until payment of the contingent milestone payments is completed. Volatility and the estimated fair value of the milestones have a positive relationship such that higher volatility translates to a higher estimated fair value of the contingent milestone payments. We assumed volatility of 30.0% and a rate of return of 8.05% in the valuation of contingent milestone payments performed as of July 1, 2017. We assess volatility and rate of return inputs quarterly by analyzing certain market volatility benchmarks and the risk associated with Royalty Pharma achieving the underlying projected royalties. During the three months ended July 1, 2017, the fair value of the Royalty Pharma contingent milestone payments decreased $39.2 million as a result of a decrease in the estimated projected Tysabri® revenues due to the launch of Ocrevus® late in the first quarter of 2017.
Our accounts receivable balance at December 31, 2016 included $84.4 million related to the Tysabri® royalty stream.
The table below presents a reconciliation for Royalty Pharma contingent milestone payments measured at fair value on a recurring basis using significant unobservable inputs (Level 3) (in millions). Realized losses in the table were recorded in the line item "Change in financial assets" on the Condensed Consolidated Statements of Operations.
|
| | | | | | | |
| | Three Months Ended | | Six Months Ended |
| | July 1,
2017 | | July 1,
2017 |
| Royalty Pharma Contingent Milestone Payments | | | |
| Beginning balance | $ | 184.5 |
| | $ | — |
|
| Purchases or additions | — |
| | 184.5 |
|
| Foreign currency effect | 0.5 |
| | 0.5 |
|
| Realized losses | (39.2 | ) | | (39.2 | ) |
| Ending balance | $ | 145.8 |
| | $ | 145.8 |
|
Contingent Consideration
Contingent consideration represents milestone payment obligations obtained through product acquisitions, which are valued using estimates based on probability-weighted outcomes, sensitivity analysis, and discount rates reflective of the risk involved. The estimates are updated quarterly and the liabilities are adjusted to fair value depending on a number of assumptions, including the competitive landscape and regulatory approvals that may impact the future sales of a product.
The non-recurring fair values included in the table above represent only those We reduced a contingent consideration liability associated with certain IPR&D assets whose carrying values were adjusted to fair valueand recorded a corresponding gain of $15.6 million during the reporting period. Seesix months ended July 1, 2017. The liability decrease relates to a reduction of the probability of achievement assumptions and anticipated cash flows. Purchases or additions for the six months ended July 2, 2016 included contingent consideration associated with two transactions. Refer to Note 3 for a more detailed discussion of the impaired goodwill and indefinite-lived intangible assets and the valuation methods used, and additional information.
Perrigo Company plc - Item 1
Note 9 for information on the impaired assets held for sale, net.6
The table below presents a reconciliation for liabilities measured at fair value on a recurring basis using significant unobservable inputs (Level 3) (in millions). Net realized (gains) losses in the table were recorded in Administrative expense.Other expense, net.
| | | | Three Months Ended | | Nine Months Ended | Three Months Ended | | Six Months Ended |
| | October 1,
2016 | | September 26,
2015 | | October 1,
2016 | | September 26,
2015 | July 1,
2017 | | July 2,
2016 | | July 1,
2017 | | July 2,
2016 |
| Contingent Consideration | | | | | | | | | | | | | | |
| Beginning balance | $ | 44.9 |
| | $ | — |
| | $ | 17.9 |
| | $ | 12.4 |
| $ | 52.0 |
| | $ | 48.0 |
| | $ | 69.9 |
| | $ | 17.9 |
|
| Net realized (gains) losses | (0.4 | ) | | — |
| | (4.0 | ) | | (12.4 | ) | (1.3 | ) | | (3.9 | ) | | (15.6 | ) | | (3.8 | ) |
| Purchases or additions | 30.6 |
| | — |
| | 61.1 |
| | — |
| — |
| | 1.0 |
| | — |
| | 30.5 |
|
| Foreign currency effect | — |
| | — |
| | 0.1 |
| | — |
| 1.4 |
| | (0.2 | ) | | 1.3 |
| | 0.3 |
|
| Settlements | (0.1 | ) | | — |
| | (0.1 | ) | | — |
| (2.4 | ) | | — |
| | (5.9 | ) | | — |
|
| Ending balance | $ | 75.0 |
| | $ | — |
| | $ | 75.0 |
| | $ | — |
| $ | 49.7 |
| | $ | 44.9 |
| | $ | 49.7 |
| | $ | 44.9 |
|
Goodwill and Indefinite-Lived Intangible Assets
We have seven reporting units for which we assess goodwill for impairment. We utilize a comparable company market approach, weighted equally with a discounted cash flow analysis, to determine the fair value of the reporting units. We utilize either a relief from royalty method or a multi-period excess earnings method ("MPEEM") to value our indefinite-lived intangible assets, and use a consistent set of projected financial information for the goodwill and indefinite-lived asset impairment tests. The discounted cash flow analysis that we prepared for goodwill impairment testing purposes for the year ended December 31, 2016 included long-term growth rates ranging from 2.0% to 3.0%. We also utilized discount rates ranging from 7.0% to 14.5%, which were deemed to be commensurate with the required investment return and risk involved in realizing the projected free cash flows of each reporting unit. In addition, we burdened projected free cash flows with the capital spending deemed necessary to support the cash flows of each reporting unit, and applied the tax rates that were applicable to the jurisdictions represented within each reporting unit. We recorded Impairment charges on the Condensed Consolidated Statements of Operations related to Goodwill and indefinite-lived intangible assets of $130.5 million and $273.4 million, respectively, for the three months ended April 2, 2016. See Note 3 for additional detail on impaired goodwill and indefinite-lived intangible assets.
Definite-Lived Intangible Assets
When assessing our definite-lived assets for impairment, we utilize either a MPEEM or a relief from royalty method to determine the fair value of the asset and use the forecasts that are consistent with those used in the reporting unit analysis. Below is a summary of the various metrics used in our valuations:
|
| |
| Three Months Ended |
| July 1, 2017 |
| Lumara |
| 5-year average growth rate | (4.1)% |
| Discount rate | 13.5% |
| Valuation method | MPEEM |
Perrigo Company plc - Item 1
Note 6
|
| | | | | | | | | |
| | Year Ended |
| | December 31, 2016 |
| | Omega - Lifestyle | | Omega - XLS | | Entocort® - Branded Products | | Entocort® - AG Products | | Herron Trade names and Trademarks |
| 5-year average growth rate | 2.5% | | 3.2% | | (31.7)% | | (30.4)% | | 4.6% |
| Long-term growth rates | 2.0% | | NA | | (10.0)% | | (4.7)% | | 2.5% |
| Discount rate | 9.3% | | 9.5% | | 13.0% | | 10.5% | | 10.8% |
| Royalty rate | NA | | 4.0% | | NA | | NA | | 11.0% |
| Valuation method | MPEEM | | Relief from Royalty | | MPEEM | | MPEEM | | Relief from Royalty |
Assets Held for sale
When a group of assets is classified as held-for-sale, the book value is evaluated and adjusted to the lower of its carrying amount or fair value less the cost to sell. See Note 9 for additional information on the impaired assets held for sale, net.
Fixed Rate Long-term Debt
As of OctoberJuly 1, 20162017 and December 31, 2015,2016, our fixed rate long-term debt consisted of public bonds, a private placement note,notes, and retail bonds. As of OctoberJuly 1, 2016,2017, the public bonds and private placement note had a carrying value of $4.6$2.6 billion and a fair value of $4.7 billion,$2.7 billion. As of December 31, 2016, the public bonds had a carrying value and fair value of $4.6 billion. The fair values of our public bonds for both periods were based on quoted market prices (Level 1).
As of December 31, 2015, the publicJuly 1, 2017, our retail bonds and private placement notenotes had a carrying value of $3.9 billion and fair value of $3.8 billion, based on quoted market prices (Level 1). As of October 1, 2016, our retail bonds had a carrying value of $826.4$634.3 million (excluding a premium of $60.7$40.2 million) and a fair value of $891.4$682.7 million. As of December 31, 2015,2016, our retail bonds and private placement notes had a carrying value of $798.3$773.1 million (excluding a premium of $82.5$49.8 million) and a fair value of $859.8$825.0 million. The fair valuevalues of our relatedretail bonds and private placement notes for both periods waswere based on interest rates offered for borrowings of a similar nature and remaining maturities (Level 2).
The carrying amounts of our other financial instruments, consisting of cash and cash equivalents, accounts receivable, accounts payable, short-term debt and variable rate long-term debt, approximate their fair value.
Perrigo Company plc - Item 1
Note 7
NOTE 7 – INVESTMENTS
Available for Sale Securities
Our available for sale securities are reported in Prepaid expenses and other current assets. Unrealized investment gains gains/(losses) on available for sale securities were as follows (in millions):
| | | | October 1,
2016 | | December 31, 2015 | July 1,
2017 | | December 31, 2016 |
| Equity securities, at cost less impairments | $ | 20.1 |
| | $ | 6.4 |
| $ | 15.5 |
| | $ | 16.5 |
|
| Gross unrealized gains | 32.9 |
| | 9.3 |
| — |
| | 21.7 |
|
| Gross unrealized losses | — |
| | (0.8 | ) | (1.9 | ) | | — |
|
| Estimated fair value of equity securities | $ | 53.0 |
| | $ | 14.9 |
| $ | 13.6 |
| | $ | 38.2 |
|
The factors affecting the assessment of impairments include both general financial market conditions and factors specific to a particular company. WeDuring the six months ended July 2, 2016, we recorded an impairment chargescharge of $1.8$1.7 million, related to other-than-temporary impairments of marketable equity securities during the nine months ended October 1, 2016 due to prolonged losses incurred on each of the investments.
We have evaluated the near-term prospects of the equity securities in relation to the severity and duration of any impairments, and based on that evaluation, we have the ability and intent to hold these investments until a recovery of fair value.
Perrigo Company plc - Item 1
Note 7
During the six months ended July 1, 2017, we sold a number of our investment securities and recorded a gain of $1.6 million. The gain was reclassified out of Accumulated Other Comprehensive Income (loss) ("AOCI") and into earnings.
Cost Method Investments
Our cost method investments totaled $7.0$7.1 million and $6.9 million at OctoberJuly 1, 20162017, and December 31, 2015, respectively,2016, and are included in Other non-current assets.
Equity Method Investments
Our equity method investments totaled $4.9 million and $45.5$4.6 million at OctoberJuly 1, 20162017 and December 31, 2015,2016, respectively, and are included in Other non-current assets. We recorded net gains of $0.2 million and $0.3 million during the three and six months ended July 1, 2017, respectively, and net losses of $1.6 million and $3.9 million during the three and six months endedJuly 2, 2016, respectively, for our proportionate share of the equity method investment earnings or losses. The gains and losses were recorded in Other expense, net.
Due to significant and prolonged losses incurred on one of our equity method investments, we recorded a $22.3 million impairment in Other expense, net, duringDuring the ninesix months ended October 1, 2016. In addition, during the nine months ended October 1,July 2, 2016, one of our equity method investments became publicly traded. As a result, we transferred the $15.5 million investment to available for sale and recorded an $8.7 million unrealized gain, net of tax in Other Comprehensive Income ("OCI"), as reflected in the available for sale securities table above.
We. In addition, due to significant and prolonged losses incurred on one of our equity method investments, we recorded a net gain of $0.1$22.3 million and a net loss of $4.1 million during the three months ended October 1, 2016 and September 26, 2015, respectively, and a net loss of $3.8 million and $7.7 million during the nine months ended October 1, 2016, and September 26, 2015, respectively, for our proportionate share of the equity method investment earnings or losses. The gains and losses were recordedimpairment charge in Other expense, net.net during the six months ended July 2, 2016.
NOTE 8 – DERIVATIVE INSTRUMENTS AND HEDGING ACTIVITIES
We enter into certain derivative financial instruments, when available on a cost-effective basis, to mitigate our risk associated with changes in interest rates and foreign currency exchange rates as follows:
Interest rate risk management - We are exposed to the impact of interest rate changes through our cash investments and borrowings. We utilize a variety of strategies to manage the impact of changes in interest rates, including using a mix of debt maturities along with both fixed-rate and variable-rate debt. In addition, we may enter into treasury-lock agreements and interest rate swap agreements on certain investing and borrowing transactions to manage our exposure to interest rate changes and our overall cost of borrowing.
Foreign currency exchange risk management - We conduct business in several major currencies other than the U.S. dollar and are subject to risks associated with changing foreign exchange rates. Our objective is to reduce cash flow volatility associated with foreign exchange rate changes on a consolidated basis to allow management to focus its attention on business operations. Accordingly, we enter into various contracts that change in value as foreign exchange rates change to protect the value of existing foreign currency assets and liabilities, commitments, and anticipated foreign currency sales and expenses.
Perrigo Company plc - Item 1
Note 8
All derivative instruments are managed on a consolidated basis to efficiently net exposures and thus take advantage of any natural offsets. Gains and losses related to the derivative instruments are expected to be offset largely by gains and losses on the original underlying asset or liability. We do not use derivative financial instruments for speculative purposes.
All of our designated derivatives were classified as cash flow hedges as of OctoberJuly 1, 20162017 and December 31, 2015.2016. Designated derivatives meet hedge accounting criteria, which means the fair value of the hedge is recorded in shareholders’ equity as a component of OCI, net of tax. The deferred gains and losses are recognized in income in the period in which the hedged item affects earnings. Any ineffective portion of the change in fair value of the derivative is immediately recognized in earnings. All of our designated derivatives are assessed for hedge effectiveness quarterly.
We also have economic non-designated derivatives that do not meet hedge accounting criteria. These derivative instruments are adjusted to current market value at the end of each period through earnings. Gains or losses on these instruments are offset substantially by the remeasurement adjustment on the hedged item.
Perrigo Company plc - Item 1
Note 8
Interest Rate Swaps and Treasury Locks
Interest rate swap agreements are contracts to exchange floating rate for fixed rate payments (or vice versa) over the life of the agreement without the exchange of the underlying notional amounts. The notional amounts of the interest rate swap agreements are used to measure interest to be paid or received and do not represent the amount of exposure to credit loss. The differential paid or received on the interest rate swap agreements is recognized as an adjustment to interest expense.
During the three months ended July 1, 2017, we repaid $584.4 million of senior notes with an interest rate of 4.000% due 2023 and $309.5 million of senior notes with an interest rate of 5.300% due 2043 (refer to Note 10). As a result of the senior note repayments on June 15, 2017, the proportionate amount remaining in OCI related to the pre-issuance hedge was reclassified to earnings. Accordingly, we recorded a loss of $5.9 million in Other expense, net, during the three months ended July 1, 2017 for the amount remaining in OCI.
During the six months ended December 31, 2015, we entered into a forward interest rate swap to hedge against changes in the benchmark interest rate between the date the interest rate swap was entered into and the date of expected future debt issuance. The interest rate swap was designated as a cash flow hedge and had a notional amount totaling $200.0 million. The interest rate swap was settled upon the issuance of an aggregate $1.2 billion principal amount of senior notes on March 7, 2016 for a cumulative after-tax loss of $7.0 million in OCI during the ninesix months ended October 1,July 2, 2016.
In connection with the Omega acquisition, we assumed a $20.0 million private placement note. We also assumed an interest rate swap agreement with a notional amount totaling $20.0 million that was in place to hedge the cross currency exchange differences between the U.S. dollar and the euro on the above-mentioned debt. On May 29, 2015, we repaid the loan and the interest rate swap. We also assumed €500.0 million ($544.5 million) of debt under Omega's revolving credit facility, as well as an interest rate swap agreement with a notional amount of €135.0 million ($147.0 million) that was in place to hedge the change in the floating rate on that credit facility. On April 8, 2015, we repaid the loan and terminated the interest rate swap. Because both interest rate swaps mentioned above were recorded at fair market value on the date of termination, no gain or loss was recorded. For more information on the acquired debt and termination, see Note 10.
During the nine months ended September 26, 2015, we repaid a $300.0 million term loan with floating interest rates priced off the LIBOR yield curve, see Note 10. As a result of the term loan repayment on June 25, 2015, the forward interest rate swap agreements with notional amounts totaling $240.0 million that were in place to hedge the change in the LIBOR rate were terminated as well. We recorded a loss of $3.6 million in Other expense, net, during the nine months ended September 26, 2015 for the amount remaining in Accumulated Other Comprehensive Income ("AOCI") when the hedges were terminated.
Foreign Currency Derivatives
We enter into foreign currency forward contracts, both designated and non-designated, in order to manage the impact of foreign exchange fluctuations on expected future purchases and related payables denominated in a foreign currency, as well as to hedge the impact of foreign exchange fluctuations on expected future sales and related receivables denominated in a foreign currency. Both types of forward contracts have a maximum maturity date of 1518 months. The total notional amount for these contracts was $482.5$644.9 million and $755.5$533.5 million as of OctoberJuly 1, 20162017 and December 31, 2015,2016, respectively.
Perrigo Company plc - Item 1
Note 8
In order to economically hedge the foreign currency exposure associated with the planned payment of the euro-denominated purchase price of Omega, we entered into non-designated forward contracts that matured during the three months ended March 28, 2015. We recorded losses of $259.8 million during the nine months ended September 26, 2015 related to the settlement of the forward contracts in Other expense, net. The losses on the derivatives due to changes in the euro-to-U.S. dollar exchange rates were economically offset at closing in the final settlement of the euro-denominated Omega purchase price. In June 2015, in order to economically hedge the foreign currency exposure associated with the planned payment of the euro-denominated GSK Products acquisition discussed in Note 2, we entered into a non-designated option contract to protect against a strengthening of the euro relative to the U.S. dollar. We recorded losses of $1.9 million for the change in fair value of the option contract during the nine months ended September 26, 2015 in Other expense, net. Because these derivatives were economically hedging future acquisitions, the cash outflows associated with their settlement are shown as investing activity on the Consolidated Statements of Cash Flows.
Effects of Derivatives on the Financial Statements
The below tables indicate the effects of all derivative instruments on the Condensed Consolidated Financial Statements. All amounts exclude income tax effects and are presented in millions.
The balance sheet location and gross fair value of our outstanding derivative instruments were as follows:
| | | | Asset Derivatives | Asset Derivatives |
| | Balance Sheet Location | | Fair Value | Balance Sheet Location | | Fair Value |
| | | | October 1,
2016 | | December 31, 2015 | | | July 1,
2017 | | December 31,
2016 |
| Designated derivatives: | | | | | | | | |
| Foreign currency forward contracts | Other current assets | | $ | 3.8 |
| | $ | 3.8 |
| Other current assets | | $ | 5.2 |
| | $ | 3.1 |
|
| Total designated derivatives | | $ | 3.8 |
| | $ | 3.8 |
| |
| Non-designated derivatives: | | | | | | | | |
| Foreign currency forward contracts | Other current assets | | $ | 1.4 |
| | $ | 1.0 |
| Other current assets | | $ | 11.4 |
| | $ | 0.7 |
|
| Total non-designated derivatives | | $ | 1.4 |
| | $ | 1.0 |
| |
| | | | Liability Derivatives | Liability Derivatives |
| | Balance Sheet Location | | Fair Value | Balance Sheet Location | | Fair Value |
| | | | October 1,
2016 | | December 31, 2015 | | | July 1,
2017 | | December 31,
2016 |
| Designated derivatives: | | | | | | | | |
| Foreign currency forward contracts | Accrued liabilities | | $ | 0.3 |
| | $ | 2.0 |
| Accrued liabilities | | $ | 2.9 |
| | $ | 3.0 |
|
| Interest rate swap agreements | Other non-current liabilities | | — |
| | 0.3 |
| |
| Total designated derivatives | | $ | 0.3 |
| | $ | 2.3 |
| |
| Non-designated derivatives: | | | | | | | | |
| Foreign currency forward contracts | Accrued liabilities | | $ | 0.5 |
| | $ | 1.9 |
| Accrued liabilities | | $ | 1.1 |
| | $ | 2.0 |
|
| Total non-designated derivatives | | $ | 0.5 |
| | $ | 1.9 |
| |
Perrigo Company plc - Item 1
Note 8
The gains (losses) recorded in OCI for the effective portion of our designated cash flow hedges were as follows:
|
| | | | | | | | | | | | | | | | |
| | | Amount of Gain/(Loss) Recorded in OCI
(Effective Portion) |
| | | Three Months Ended | | Nine Months Ended |
| Designated Cash Flow Hedges | | October 1,
2016 | | September 26,
2015 | | October 1,
2016 | | September 26,
2015 |
| Interest rate swap agreements | | $ | — |
| | $ | — |
| | $ | (9.0 | ) | | $ | (12.0 | ) |
| Foreign currency forward contracts | | 3.4 |
| | (0.5 | ) | | 4.7 |
| | (1.6 | ) |
| Total | | $ | 3.4 |
| | $ | (0.5 | ) | | $ | (4.3 | ) | | $ | (13.6 | ) |
Perrigo Company plc - Item 1
Note 8
|
| | | | | | | | | | | | | | | | |
| | | Amount of Gain/(Loss) Recorded in OCI
(Effective Portion) |
| | | Three Months Ended | | Six Months Ended |
| Designated Cash Flow Hedges | | July 1,
2017 | | July 2,
2016 | | July 1,
2017 | | July 2,
2016 |
| Interest rate swap agreements | | $ | — |
| | $ | — |
| | $ | — |
| | $ | (9.0 | ) |
| Foreign currency forward contracts | | 2.7 |
| | (0.3 | ) | | 5.2 |
| | 1.3 |
|
| Total | | $ | 2.7 |
| | $ | (0.3 | ) | | $ | 5.2 |
| | $ | (7.7 | ) |
The gains (losses) reclassified from AOCI into earnings for the effective portion of our designated cash flow hedges were as follows:
| | | | | Amount of Gain/(Loss) Reclassified from AOCI to Income
(Effective Portion) | | Amount of Gain/(Loss) Reclassified from AOCI into Earnings
(Effective Portion) |
| | | Three Months Ended | | Nine Months Ended | | Three Months Ended | | Six Months Ended |
| Designated Cash Flow Hedges | | Income Statement Location | | October 1,
2016 | | September 26,
2015 | | October 1,
2016 | | September 26,
2015 | | Income Statement Location | | July 1,
2017 | | July 2,
2016 | | July 1,
2017 | | July 2,
2016 |
| Treasury locks | | Interest expense, net | | $ | — |
| | $ | — |
| | $ | (0.1 | ) | | $ | (0.1 | ) | |
| Interest rate swap agreements | | Interest expense, net | | (0.6 | ) | | (0.4 | ) | | (1.7 | ) | | (18.6 | ) | | Interest expense, net | | $ | (0.6 | ) | | $ | (0.6 | ) | | $ | (1.3 | ) | | $ | (1.1 | ) |
| | | | Other expense, net | | (5.9 | ) | | — |
| | (5.9 | ) | | — |
|
| Foreign currency forward contracts | | Net sales | | 0.1 |
| | (0.1 | ) | | 1.0 |
| | 1.8 |
| | Net sales | | 0.6 |
| | (0.1 | ) | | 0.9 |
| | 0.4 |
|
| | | Cost of sales | | 0.9 |
| | 0.2 |
| | 1.8 |
| | (4.4 | ) | | Cost of sales | | 0.9 |
| | 0.6 |
| | 1.6 |
| | 0.9 |
|
| | | Interest expense, net | | (0.4 | ) | | — |
| | (1.3 | ) | | — |
| | Interest expense, net | | (0.5 | ) | | (0.6 | ) | | (1.1 | ) | | (0.9 | ) |
| | | Other expense, net | | (1.4 | ) | | (0.1 | ) | | — |
| | (0.6 | ) | | Other expense, net | | — |
| | 1.7 |
| | (0.5 | ) | | 1.9 |
|
| Total | | $ | (1.4 | ) | | $ | (0.4 | ) | | $ | (0.3 | ) | | $ | (21.9 | ) | | $ | (5.5 | ) | | $ | 1.0 |
| | $ | (6.3 | ) | | $ | 1.2 |
|
The net of tax amount expected to be reclassified from AOCI into earnings during the next 12 months is a $2.0 million gain.
The gains (losses) recognized against earnings for the ineffective portion of our designated cash flow hedges were as follows:
| | | | | Amount of Gain/(Loss) Recognized in Income
(Ineffective Portion) | | Amount of Gain/(Loss) Recognized against Earnings
(Ineffective Portion) |
| | | Three Months Ended | | Nine Months Ended | | Three Months Ended | | Six Months Ended |
| Designated Cash Flow Hedges | | Income Statement Location | | October 1,
2016 | | September 26,
2015 | | October 1,
2016 | | September 26,
2015 | | Income Statement Location | | July 1,
2017 | | July 2,
2016 | | July 1,
2017 | | July 2,
2016 |
| Interest rate swap agreements | | Other expense, net | | $ | — |
| | $ | — |
| | $ | (0.1 | ) | | $ | — |
| | Other expense, net | | $ | — |
| | $ | — |
| | $ | — |
| | $ | (0.1 | ) |
| Foreign currency forward contracts | | Net sales | | — |
| | — |
| | 0.1 |
| | (0.3 | ) | | Net sales | | — |
| | (0.1 | ) | | — |
| | 0.1 |
|
| | | Cost of sales | | — |
| | — |
| | — |
| | 0.1 |
| | Cost of sales | | — |
| | (0.1 | ) | | — |
| | — |
|
| | | Other expense, net | | — |
| | — |
| | 0.6 |
| | — |
| | Other expense, net | | 0.1 |
| | 0.6 |
| | 1.0 |
| | 0.6 |
|
| Total | | $ | — |
| | $ | — |
| | $ | 0.6 |
| | $ | (0.2 | ) | | $ | 0.1 |
| | $ | 0.4 |
| | $ | 1.0 |
| | $ | 0.6 |
|
The effects of our non-designated derivatives on the Condensed Consolidated Statements of Operations were as follows:
| | | | | Amount of Gain/(Loss) Recognized in Income | | Amount of Gain/(Loss) Recognized against Earnings |
| | | Three Months Ended | | Nine Months Ended | | Three Months Ended | | Six Months Ended |
| Non-Designated Derivatives | | Income Statement Location | | October 1,
2016 | | September 26,
2015 | | October 1,
2016 | | September 26,
2015 | | Income Statement Location | | July 1,
2017 | | July 2,
2016 | | July 1,
2017 | | July 2,
2016 |
| Foreign currency forward contracts | | Other expense, net | | $ | (0.2 | ) | | $ | (8.9 | ) | | $ | (8.7 | ) | | $ | (259.4 | ) | | Other expense, net | | $ | (5.0 | ) | | $ | (1.6 | ) | | $ | (13.9 | ) | | $ | (8.5 | ) |
| | | Interest expense, net | | (1.0 | ) | | 0.1 |
| | (1.5 | ) | | (3.4 | ) | | Interest expense, net | | (0.7 | ) | | (0.6 | ) | | (1.1 | ) | | (0.5 | ) |
| Total | | $ | (1.2 | ) | | $ | (8.8 | ) | | $ | (10.2 | ) | | $ | (262.8 | ) | | $ | (5.7 | ) | | $ | (2.2 | ) | | $ | (15.0 | ) | | $ | (9.0 | ) |
Perrigo Company plc - Item 1
Note 8
NOTE 9 – ASSETS HELD FOR SALE
During the six months ended December 31, 2015, management committed to a plan to sell our U.S. VMS andOur India Active Pharmaceutical Ingredients ("API") businesses. As a result, the net assets attributable to both businesses wereAPI business was classified as held-for-sale beginning atas of December 31, 2015. We recorded an impairment charge totaling $6.3 million during the year ended December 31, 2016 after determining the carrying value of the India API business exceeded its fair value less the cost to sell. The API business is reported in our Other segment. As described in Note 2,on April 6, 2017, we completed the sale of our U.S. VMS business to IVC on August 5, 2016. In addition, duringIndia API business.
During the three months ended October 1, 2016, management committed to a plan to sell certain fixed assets associated with our Animal Health pet treats plant. Such assets were classified as held-for-sale beginning at October 1, 2016. As described in
When a groupNote 2,on February 1, 2017, we completed the sale of assets is classified as held-for-sale, the book value is evaluated and adjusted to the lower of its carrying amount or fair value less the cost to sell. At December 31, 2015, we determined that the carrying value of the India API business exceeded its fair value less cost to sell, resulting in an impairment charge ofPerrigo Company plc - Item 1
Note 9
$29.0 million.our Animal Health pet treats plant fixed assets. We recorded additional impairment charges totaling $10.8 million during the nine months ended October 1, 2016. The API business is reported primarily in our Other segment.
At October 1, 2016, we determined that the carrying value of the fixed assets associated with our Animal Health pet treats plant exceeded the fair value less the cost to sell, resulting in ansell. We recorded impairment charge of $3.4 million.charges totaling $3.7 million during the year ended December 31, 2016. The assets associated with our Animal Health pet treats plant are reported in our CHCCHCA segment.
During the three months ended July 1, 2017, management committed to a plan to sell our Russian business. Such assets were classified as held-for-sale beginning at July 1, 2017. We determined that the carrying value of the goodwill associated with our Russian business exceeded the fair value less the cost to sell. We recorded impairment charges totaling $3.7 million during the three months ended July 1, 2017. The assets associated with our Russian business are reported in our CHCI segment.
The assets held-for-sale wereare reported within Prepaid expenses and other current assets and liabilities held-for-sale wereare reported in Accrued liabilities. The amounts consistedconsist of the following (in millions):
| | | | October 1,
2016 | | December 31,
2015 | July 1,
2017 | | December 31,
2016 |
| | CHC | | Other | | CHC | | Other | CHCI | | CHCA | | Other |
| Assets held for sale | | | | | | | | | | | | |
| Current assets | $ | — |
| | $ | 7.3 |
| | $ | 55.1 |
| | $ | 13.6 |
| $ | 17.0 |
| | $ | — |
| | $ | 5.1 |
|
| Goodwill | — |
| | 2.8 |
| | 13.0 |
| | 14.5 |
| 7.7 |
| | — |
| | 5.5 |
|
| Property, plant and equipment | 13.3 |
| | 34.0 |
| | 18.8 |
| | 37.4 |
| — |
| | 13.5 |
| | 33.2 |
|
| Other assets | — |
| | 3.2 |
| | — |
| | 3.2 |
| — |
| | — |
| | 3.8 |
|
| Less: impairment reserves | (3.4 | ) | | (39.8 | ) | | — |
| | (29.0 | ) | (3.7 | ) | | (3.7 | ) | | (35.3 | ) |
| Total assets held for sale | $ | 9.9 |
| | $ | 7.5 |
| | $ | 86.9 |
| | $ | 39.7 |
| $ | 21.0 |
| | $ | 9.8 |
| | $ | 12.3 |
|
| Liabilities held for sale | | | | | | | | | | | | |
| Current liabilities | $ | 0.3 |
| | $ | 0.9 |
| | $ | 30.5 |
| | $ | 0.5 |
| $ | 8.0 |
| | $ | 0.1 |
| | $ | 1.9 |
|
| Other liabilities | — |
| | 2.1 |
| | — |
| | 1.7 |
| 1.2 |
| | — |
| | 1.9 |
|
| Total liabilities held for sale | $ | 0.3 |
| | $ | 3.0 |
| | $ | 30.5 |
| | $ | 2.2 |
| $ | 9.2 |
| | $ | 0.1 |
| | $ | 3.8 |
|
Perrigo Company plc - Item 1
Note 10
NOTE 10 – INDEBTEDNESS
Total borrowings outstanding are summarized as follows (in millions):
| | | | | October 1,
2016 | | December 31,
2015 | |
| Revolving credit agreements | | | | | |
| | 2015 Revolver | $ | — |
| | $ | 380.0 |
| |
| | 2014 Revolver | — |
| | 300.0 |
| | | | | | | | | |
| | Total revolving credit agreements | — |
| | 680.0 |
| | July 1,
2017 | | December 31,
2016 |
| Term loans | Term loans | | | | | Term loans | | | | |
| * | 2014 Term loan due December 5, 2019 | 463.8 |
| | 488.8 |
| |
| | | 2014 term loan due December 5, 2019 | (1) | | $ | 428.6 |
| | $ | 420.7 |
|
| Notes and Bonds | Notes and Bonds | | | | | Notes and Bonds | | | | |
| | Coupon | Due | | | | | Coupon | Due | | | | |
| | 1.300% | November 8, 2016 | (2) | | — |
| | 500.0 |
| 4.500% | May 23, 2017 | (1)(2) | | — |
| | 189.3 |
|
| * | 4.500% | May 23, 2017 | (3) | | 202.4 |
| | 195.5 |
| |
| * | 5.125% | December 12, 2017 | (3) | | 337.3 |
| | 325.8 |
| |
| | 2.300% | November 8, 2018 | (2) | | 600.0 |
| | 600.0 |
| |
| * | 5.000% | May 23, 2019 | (3) | | 134.9 |
| | 130.3 |
| |
| | 3.500% | March 15, 2021 | (4) | | 500.0 |
| | — |
| 5.125% | December 12, 2017 | (1)(2) | | 342.9 |
| | 315.6 |
|
| | 3.500% | December 15, 2021 | (1) | | 500.0 |
| | 500.0 |
| 2.300% | November 8, 2018 |
| | — |
| | 600.0 |
|
| * | 5.105% | July 19, 2023 | (3) | | 151.8 |
| | 146.7 |
| |
| | | 5.000% | May 23, 2019 | (1)(2) | | 137.1 |
| | 126.2 |
|
| | | 3.500% | March 15, 2021 |
| | 280.4 |
| | 500.0 |
|
| | | 3.500% | December 15, 2021 |
| | 309.6 |
| | 500.0 |
|
| | | 5.105% | July 19, 2023 | (1)(2) | | 154.3 |
| | 142.0 |
|
| | 4.000% | November 15, 2023 | (2) | | 800.0 |
| | 800.0 |
| 4.000% | November 15, 2023 |
| | 215.6 |
| | 800.0 |
|
| | 3.900% | December 15, 2024 | (1) | | 700.0 |
| | 700.0 |
| 3.900% | December 15, 2024 |
| | 700.0 |
| | 700.0 |
|
| | 4.375% | March 15, 2026 | (4) | | 700.0 |
| | — |
| 4.375% | March 15, 2026 |
| | 700.0 |
| | 700.0 |
|
| | 5.300% | November 15, 2043 | (2) | | 400.0 |
| | 400.0 |
| 5.300% | November 15, 2043 |
| | 90.5 |
| | 400.0 |
|
| | 4.900% | December 15, 2044 | (1) | | 400.0 |
| | 400.0 |
| 4.900% | December 15, 2044 |
| | 303.9 |
| | 400.0 |
|
| | Total notes and bonds | | 5,426.4 |
| | 4,698.3 |
| Total notes and bonds | | 3,234.3 |
| | 5,373.1 |
|
| Other financing | Other financing | 4.1 |
| | 86.0 |
| Other financing | 2.9 |
| | 3.6 |
|
| Unamortized premium (discount), net | Unamortized premium (discount), net | 43.3 |
| | 73.4 |
| Unamortized premium (discount), net | 29.1 |
| | 33.0 |
|
| Deferred financing fees | Deferred financing fees | (34.6 | ) | | (36.6 | ) | Deferred financing fees | (20.1 | ) | | (33.1 | ) |
| Total borrowings outstanding | Total borrowings outstanding | 5,903.0 |
| | 5,989.9 |
| Total borrowings outstanding | 3,674.8 |
| | 5,797.3 |
|
| | Current indebtedness | (265.0 | ) | | (1,018.3 | ) | Current indebtedness | (406.9 | ) | | (572.8 | ) |
| Total long-term debt less current portion | Total long-term debt less current portion | $ | 5,638.0 |
| | $ | 4,971.6 |
| Total long-term debt less current portion | $ | 3,267.9 |
| | $ | 5,224.5 |
|
| |
| (1) | Discussed below collectively as the "2014 Notes." |
| |
(2) | Discussed below collectively as the "2013 Notes." |
| |
(3) | Debt assumed from Omega. |
| |
(4) | Discussed below collectively as the "2016 Notes." |
| |
* | Debt denominated in eurosEuros subject to fluctuations in the euro-to-U.S. dollar exchange rate. |
| |
| (2) | Debt assumed from Omega. |
As previously disclosed, during the three months ended April 1, 2017 we entered into amendments to the 2014 Revolver and the 2014 term loan to modify provisions of such agreements necessary as a result of the correction in accounting related to the Tysabri® royalty stream, as well as waivers of any default or event of default that may have arisen from any restatement of or deficiencies in our financial statements for the periods specified in such amendments and waivers. We wereare in compliance with all covenants under our debt agreements as of OctoberJuly 1, 2016.2017.
Revolving Credit Agreements
On December 9, 2015, our 100% owned finance subsidiary, Perrigo Finance Unlimited Company (formerly Perrigo Finance plc) ("Perrigo Finance"), entered intoWe have a $750.0 million revolving credit agreement with a borrowing capacity of $1.0 billion (the "2015"2014 Revolver"). On March 15, 2016, we used the proceeds of the long-term debt issuance described below under "2016 Notes" to repay the $750.0 million thenThere were no borrowings outstanding under the 20152014 Revolver as of July 1, 2017 and terminated the facility.December 31, 2016.
On March 30, 2015,Other Financing
Overdraft Facilities
We have overdraft facilities available that we assumed a revolving credit facility with €500.0 million ($544.5 million)use to support our cash management operations. We report any balances outstanding from Omega. On April 8, 2015,in the €500.0 million ($539.1 million)above table under "Other Financing". There were no balances outstanding under the assumed revolving credit facility was repaidfacilities at July 1, 2017 and the facility was terminated.December 31, 2016.
Perrigo Company plc - Item 1
Note 10
On December 5, 2014, Perrigo Finance entered into a $600.0 million revolving credit agreement, which we increased to $1.0 billion on March 30, 2015 (the "2014 Revolver"). On March 15, 2016, we used the proceeds of the long-term debt issuance described below under "2016 Notes" to repay the $435.0 million then outstanding under the 2014 Revolver. There were no borrowings outstanding under the 2014 Revolver as of October 1, 2016.
Term LoansDebt Repayments and Related Extinguishment
On December 5, 2014, Perrigo Finance entered into a term loan agreement consisting of a €500.0 million ($614.3 million) tranche, with the ability to draw an additional €300.0 million ($368.6 million) tranche, maturing December 5, 2019, and we entered into a $300.0 million term loan tranche maturing December 18, 2015, which we repaid in full on June 25, 2015. During the ninesix months endedOctober July 1, 2016,2017, we made $41.9 million in scheduled principal payments on the euro-denominated term loan.reduced our outstanding debt through a variety of transactions (in millions):
|
| | | | | | | | |
| Date | | Series | | Transaction Type | | Principal Retired |
| April 1, 2017 | | 2014 term loan due December 5, 2019 | | Scheduled quarterly payment | | $ | 13.3 |
|
| July 1, 2017 | | 2014 term loan due December 5, 2019 | | Scheduled quarterly payment | | 14.5 |
|
| May 8, 2017 | | $600.0 2.300% senior notes due 2018 | | Early redemption | | 600.0 |
|
| May 23, 2017 | | €180.0 4.500% retail bonds due 2017 | | Scheduled maturity | | 201.3 |
|
| June 15, 2017 | | $500.0 3.500% senior notes due 2021 | | Tender offer | | 190.4 |
|
| June 15, 2017 | | $500.0 3.500% senior notes due 2021 | | Tender offer | | 219.6 |
|
| June 15, 2017 | | $800.0 4.000% senior notes due 2023 | | Tender offer | | 584.4 |
|
| June 15, 2017 | | $400.0 5.300% senior notes due 2043 | | Tender offer | | 309.5 |
|
| June 15, 2017 | | $400.0 4.900% senior notes due 2044 | | Tender offer | | 96.1 |
|
| | | | | | | $ | 2,229.1 |
|
Notes and Bonds
2016 Notes
On March 7, 2016, Perrigo Finance issued $500.0 million in aggregate principal amount of 3.500% senior notes due 2021 and $700.0 million in aggregate principal amount of 4.375% senior notes due 2026 (together, the "2016 Notes") and received net proceeds of $1.2 billion after fees and market discount. Interest on the 2016 Notes is payable semiannually in arrears in March and September of each year, beginning in September 2016. The 2016 Notes are governed by a base indenture and a second supplemental indenture (collectively, the "2016 Indenture"). The 2016 Notes are fully and unconditionally guaranteed on a senior basis by Perrigo, and no other subsidiary of Perrigo guarantees the 2016 Notes. The proceeds were used to repay amounts borrowed under the 2015 Revolver and the 2014 Revolver, as mentioned above. There are no restrictions under the 2016 Notes on our ability to obtain funds from our subsidiaries. Perrigo Finance may redeem the 2016 Notes in whole or in part at any time for cash at the make-whole redemption prices described in the 2016 Indenture.
Notes and Bonds Assumed from Omega
In connection with the Omega acquisition, on March 30, 2015, we assumed:
$20.0 million in aggregate principal amount of 6.190% senior notes due 2016, which was repaid on May 29, 2015 in full;
€135.0 million ($147.0 million) in aggregate principal amount of 5.1045% senior notes due 2023 (the "2023 Notes");
€300.0 million ($326.7 million) in aggregate principal amount of 5.125% retail bonds due 2017; €180.0 million ($196.0 million) in aggregate principal amount of 4.500% retail bonds due 2017; and €120.0 million ($130.7 million) in aggregate principal amount of 5.000% retail bonds due 2019 (collectively, the "Retail Bonds").
The fair value of the 2023 Notes and Retail Bondsexceeded par value by €93.6 million($101.9 million) on the date of the Omega acquisition. As a result a fair value adjustment was recorded as part of the carrying valuedebt retirements discussed above, we recorded a loss of $135.2 million during the underlyingthree months ended July 1, 2017 in Loss on extinguishment of debt and will be amortized as a reduction of interest expense over the remaining terms of the respective debt instruments. The adjustment does not affect cash interest payments.(in millions):
|
| | | | |
| Premium on debt repayment | | $ | 116.1 |
|
| Transaction costs | | 3.8 |
|
| Write-off of deferred financing fees | | 10.6 |
|
| Write-off of remaining discount on bond | | 4.7 |
|
| Total loss on extinguishment of debt | | $ | 135.2 |
|
On December 2, 2014, Perrigo Finance issued $500.0 million in aggregate principal amount of 3.500% senior notes due 2021 (the "2021 Notes”), $700.0 million in aggregate principal amount of 3.900% senior notes due 2024 (the “2024 Notes”), and $400.0 million in aggregate principal amount of 4.900% senior notes due 2044 (the “2044 Notes” and, together with the 2021 Notes and the 2024 Notes, the “2014 Notes”) and received net proceeds of $1.6 billion after fees and market discount. Interest on the 2014 Notes is payable semiannually in arrears in June and December of each year, beginning in June 2015. The 2014 Notes are governed by a base indenture and a first supplemental indenture (collectively, the "2014 Indenture"). The 2014 Notes are fully and unconditionally guaranteed on a senior unsecured basis by Perrigo, and no other subsidiary of Perrigo guarantees the 2014 Notes.
Perrigo Company plc - Item 1
Note 10
There are no restrictions under the 2014 Notes on our ability to obtain funds from our subsidiaries. Perrigo Finance may redeem the 2014 Notes in whole or in part at any time for cash at the make-whole redemption prices described in the 2014 Indenture.
2013 Notes
On November 8, 2013, Perrigo Company issued $500.0 million aggregate principal amount of its 1.300% senior notes due 2016 (the "1.300% 2016 Notes"), $600.0 million aggregate principal amount of its 2.300% senior notes due 2018 (the "2018 Notes"), $800.0 million aggregate principal amount of its 4.000% senior notes due 2023 (the "4.000% 2023 Notes") and $400.0 million aggregate principal amount of its 5.300% senior notes due 2043 (the "2043 Notes" and, together with the 1.300% 2016 Notes, the 2018 Notes and the 4.000% 2023 Notes, the "2013 Notes") in a private placement with registration rights. We received net proceeds of $2.3 billion from the issuance of the 2013 Notes after fees and market discount. On September 29, 2016, we repaid all $500.0 million of the 1.300% 2016 Notes outstanding.
Interest on the 2013 Notes is payable semiannually in arrears in May and November of each year, beginning in May 2014. The 2013 Notes are governed by a base indenture and a first supplemental indenture (collectively, the "2013 Indenture"). The 2013 Notes are our unsecured and unsubordinated obligations, ranking equally in right of payment to all of our existing and future unsecured and unsubordinated indebtedness. The 2013 Notes are not entitled to mandatory redemption or sinking fund payments. We may redeem the 2013 Notes in whole or in part at any time for cash at the make-whole redemption prices described in the 2013 Indenture. The 2013 Notes were guaranteed on an unsubordinated, unsecured basis by the same entities that guaranteed our then-outstanding credit agreement until November 21, 2014, at which time the 2013 Indenture was amended to remove all guarantors.
Other Financing
Overdraft Facilities
On March 30, 2015, we assumed and repaid certain overdraft facilities totaling €51.4 million ($56.0 million) with the Omega acquisition. Our BCH segment uses overdraft facilities to increase the efficiency of its cash utilization and meet its short-term liquidity needs. We repaid the balance outstanding under the overdraft facilities during the nine months endedOctober 1, 2016, but retain the ability to use the facilities in our day-to-day cash operations. The balance outstanding under the facilities was $82.9 million at December 31, 2015 and is shown in the above table under "Other Financing".
Perrigo Company plc - Item 1
Note 11
NOTE 11 – EARNINGS PER SHARE AND SHAREHOLDERS' EQUITY
Earnings per Share
A reconciliation of the numerators and denominators used in the basic and diluted earnings per share ("EPS") calculation is as follows (in millions):
| | | | Three Months Ended | | Nine Months Ended | Three Months Ended | | Six Months Ended |
| | October 1,
2016 | | September 26,
2015 | | October 1,
2016 | | September 26,
2015 | July 1,
2017 | | July 2,
2016 | | July 1,
2017 | | July 2,
2016 |
| Numerator: | | | | | | | | | | | | | | |
| Net income (loss) | $ | (1,255.2 | ) | | $ | 112.6 |
| | $ | (1,395.4 | ) | | $ | 74.2 |
| $ | (69.6 | ) | | $ | (534.3 | ) | | $ | 2.0 |
| | $ | (1,063.5 | ) |
| | | | | | | | | | | | | | | |
| Denominator: | | | | | | | | | | | | | | |
| Weighted average shares outstanding for basic EPS | 143.3 |
| | 146.3 |
| | 143.2 |
| | 144.4 |
| 143.3 |
| | 143.2 |
| | 143.3 |
| | 143.2 |
|
| Dilutive effect of share-based awards* | — |
| | 0.6 |
| | — |
| | 0.6 |
| — |
| | — |
| | 0.3 |
| | — |
|
| Weighted average shares outstanding for diluted EPS | 143.3 |
| | 146.9 |
| | 143.2 |
| | 145.0 |
| 143.3 |
| | 143.2 |
| | 143.6 |
| | 143.2 |
|
| | | | | | | | | | | | | | | |
| Anti-dilutive share-based awards excluded from computation of diluted EPS* | — |
| | 0.1 |
| | — |
| | — |
| — |
| | — |
| | 0.8 |
| | — |
|
* In the period of a net loss, diluted shares equal basic shares.
Perrigo Company plc - Item 1
Note 11
Shareholders' Equity
Shares
We issued shares related to the exercise and vesting of share-based compensation as follows:
|
| | | | | | | | | | |
| Three Months Ended | | Nine Months Ended |
October 1,
2016 | | September 26,
2015 | | October 1,
2016 | | September 26,
2015 |
| 185,000 |
| | 154,000 |
| | 283,000 |
| | 246,000 |
|
|
| | | | | | | | | | |
| Three Months Ended | | Six Months Ended |
July 1,
2017 | | July 2,
2016 | | July 1,
2017 | | July 2,
2016 |
| 31,900 |
| | 19,000 |
| | 46,400 |
| | 98,000 |
|
Share Repurchases
On October 22, 2015, the Board of Directors approved a share repurchase plan of up to $2.0 billion (the "2015 Authorization"). During the three months ended July 1, 2017, we repurchased 812,184 ordinary shares at an average repurchase price of which $1.5$71.67 per share, for a total of $58.2 million. As of July 1, 2017, there was $1.4 billion is still available to be repurchased through December 31, 2018.2018 under the 2015 Authorization. We did not repurchase any shares under the share repurchase plan during the ninesix months ended October 1,July 2, 2016.
NOTE 12 – ACCUMULATED OTHER COMPREHENSIVE INCOME (LOSS)
Changes in our AOCI balances, net of tax were as follows (in millions):
| | | | Foreign currency translation adjustments | | Fair value of derivative financial instruments, net of tax | | Fair value of investment securities, net of tax | | Post-retirement and pension liability adjustments, net of tax | | Total AOCI | Foreign currency translation adjustments | | Fair value of derivative financial instruments, net of tax | | Fair value of investment securities, net of tax | | Post-retirement and pension liability adjustments, net of tax | | Total AOCI |
| Balance at December 31, 2015 | $ | (4.4 | ) | | $ | (14.2 | ) | | $ | 6.3 |
| | $ | (3.2 | ) | | $ | (15.5 | ) | |
| Balance at December 31, 2016 | | $ | (67.9 | ) | | $ | (19.5 | ) | | $ | 15.1 |
| | $ | (9.5 | ) | | $ | (81.8 | ) |
| OCI before reclassifications | 71.8 |
| | (3.7 | ) | | 17.1 |
| | 0.3 |
| | 85.5 |
| 220.1 |
| | 3.5 |
| | (14.7 | ) | | — |
| | 208.9 |
|
| Amounts reclassified from AOCI | — |
| | 0.2 |
| | 1.3 |
| | — |
| | 1.5 |
| — |
| | 5.0 |
| | (1.6 | ) | | — |
| | 3.4 |
|
| Other comprehensive income (loss) | 71.8 |
| | (3.5 | ) | | 18.4 |
| | 0.3 |
| | 87.0 |
| 220.1 |
| | 8.5 |
| | (16.3 | ) | | — |
| | 212.3 |
|
| Balance at October 1, 2016 | $ | 67.4 |
| | $ | (17.7 | ) | | $ | 24.7 |
| | $ | (2.9 | ) | | $ | 71.5 |
| |
| Balance at July 1, 2017 | | $ | 152.2 |
| | $ | (11.0 | ) | | $ | (1.2 | ) | | $ | (9.5 | ) | | $ | 130.5 |
|
Perrigo Company plc - Item 1
Note 13
NOTE 13 – INCOME TAXES
The effective tax rate for the three months ended OctoberJuly 1, 20162017 was 20.1%8.7% on a net loss compared to 14.8% on net income for the three months ended September 26, 2015. The effective tax rate for the nine months ended October 1, 2016 was 21.6% on a net loss reported in the period compared to 60.3%34.2% on a net loss for the three months ended July 2, 2016. The effective tax rate for the
six months ended July 1, 2017 was 89.9% on net income reported in the period compared to 18.3% on net loss for the ninesix months ended September 26, 2015. For the three and nine months ended October 1, 2016, we have estimated income taxes using the annualJuly 2, 2016. The effective tax rate method.
Income taxes recorded through July 2, 2016 were estimated usingfor the discrete method. For the three and ninesix months ended ended OctoberJuly 1, 2016, we had significant changes2017 was negatively impacted by non-deductible fees related to our estimates related todebt cancellation and additional asset impairments recognized in the third quarter and therefore determined that estimating income taxes using the annual effectivevaluation allowances recorded against deferred tax rate method was the more appropriate method for the period ending October 1, 2016.assets.
Our tax rate is subject to adjustment over the balance of the fiscal year due to, among other things: income tax rate changes by governments; the jurisdictions in which our profits are determined to be earned and taxed; changes in the valuation of our deferred tax assets and liabilities; adjustments to estimated taxes upon finalization of various tax returns; adjustments based on differing interpretations of the applicable transfer pricing standards; changes in available tax credits, grants and other incentives; changes in stock-based compensation expense; changes in tax laws or the interpretation of such tax laws (for example, proposals for fundamental U.S. international tax reform); changes in U.S. GAAP; expiration of or the inability to renew tax rulings or tax holiday incentives; and the repatriation of earnings with respect to which we have not previously provided for taxes.
Israel passed legislation in January 2016, effective immediately, reducing the tax rate from 26.5% to 25%. The impact on our effective tax rate was minimal.
The United Kingdom passed legislation in September 2016, reducing the tax rate effective April 1, 2020, from 18% to 17%. We expect the impact on our effective tax rate to be minimal.
The total liability for uncertain tax positions was $368.4$427.4 million and $334.7$398.0 million as of OctoberJuly 1, 20162017 and December 31, 2015,2016, respectively, before considering the federal tax benefit of certain state and local items.
Perrigo Company plc - Item 1
Note 13
We recognize interest and penalties related to uncertain tax positions as a component of income tax expense. The total amount accrued for interest and penalties in the liability for uncertain tax positions was $56.4$71.8 million and $52.1$63.5 million as of OctoberJuly 1, 20162017 and December 31, 2015,2016, respectively.
We file income tax returns in numerous jurisdictions and are therefore subject to audits by tax authorities. Our primary income tax jurisdictions are Ireland, the U.S.,United States, Israel, Belgium, France, and the U.K.United Kingdom.
Although we believe that the tax estimates are reasonable and that we prepare our tax filings in accordance with all applicable tax laws, the final determination with respect to any tax audit and any related litigation could be materially different from estimates or from historical income tax provisions and accruals. The results of an audit or litigation could have a material effect on our operating results and/or cash flows in the periods for which that determination is made. In addition, future period earnings may be adversely impacted by litigation costs, settlements, penalties, and/or interest assessments.
The IRSIn the United States, the Internal Revenue Service ("IRS") audit of our fiscal years ended June 27, 2009 and June 26, 2010 had previously concluded with the issuance of a statutory notice of deficiency on August 27, 2014. While we had previously agreed on certain adjustments and made associated payments of $8.0 million (inclusive of interest) in November 2014, the statutory notice of deficiency asserted various additional adjustments, including transfer pricing adjustments. The statutory notice of deficiency's adjustments for fiscal years 2009 and 2010 asserted an incremental tax obligation of approximately $68.9 million, inclusive of interest and penalties. We disagree with the IRS’s positions asserted in the statutory notice of deficiency. To contest the IRS's adjustments, in January 2015 we paid the incremental tax obligation (a prerequisite to contesting the proposed adjustments in U.S. district court), and in June 2015, we filed an administrative request for a refund with the IRS. The payment was recorded during the three months ended March 28, 2015 as a deferred charge on the balance sheet given our anticipated action to recover this amount. The IRS subsequently denied our request for a refund. We anticipate filing a complaint in U.S. district court claiming a refund of the paid amounts in August 2017.
The IRS issued a statutory notice of deficiency on April 20, 2017 for the IRS audits of our fiscal years ended June 25, 2011 and June 30, 2012. While we agreed to certain adjustments with respect to these years in October 2016 and made minimal associated payments, the statutory notice of deficiency asserted various additional adjustments, including transfer pricing adjustments. The statutory notice of deficiency for fiscal years 2011 and 2012 asserted an incremental tax obligation of approximately $74.2 million, inclusive of interest and penalties. We disagree with the IRS's positions asserted in this notice. In anticipation of contesting the IRS's adjustments, in May 2017 we paid the incremental tax obligation (a prerequisite to contesting the proposed adjustments in U.S. District Court) and filed an administrative request for a refund. The payment was recorded in the second quarter of the year ending December 31, 2017 as a deferred charge on the balance sheet given our anticipated action to recover this amount.
On December 22, 2016, we received a notice of proposed adjustment for the IRS audit of Athena Neurosciences, Inc. (“Athena”), a subsidiary of Elan acquired in 1996, for the years ended December 31, 2011, December 31, 2012 and December 31, 2013. Perrigo acquired Elan in December 2013. This proposed adjustment relates to the deductibility of litigation costs. We disagree with the IRS’s position asserted in the notice of proposed adjustment and intend to contest it.
On July 11, 2017, we received a draft notice of proposed adjustment associated with transfer pricing positions for the IRS audit of Athena for the years ended December 31, 2011, December 31, 2012 and December 31, 2013. Athena was the originator of the patents associated with Tysabri® prior to the acquisition of Athena by Elan in 1996. The amount of adjustments that may be asserted by the IRS in the final notice of proposed adjustment cannot be quantified at this time; however, based on the draft notice received, the amount to be assessed may be material. We disagree with the IRS’s position as asserted in the draft notice of proposed adjustment and intend to contest it.
Unfavorable resolutions of the audit matters discussed above could have a material impact on our consolidated financial statements in future periods.
Perrigo Company plc - Item 1
Note 13
refund of the paid amounts prior to August 2017. An unfavorable resolution of this matter could have a material impact on our consolidated financial statements in future periods.
We have ongoing audits in multiple other jurisdictions the resolution of which remains uncertain. These jurisdictions include, but are not limited to, the United States, Israel and Belgium.France. The IRS is currently auditing our fiscal years ended June 25, 201129, 2013 and June 30, 2012, and may make adjustments consistent with the adjustments made in the statutory notice of deficiency for28, 2014. The Israel Tax Authority is currently auditing our fiscal years 2009ended June 29, 2013 and 2010. In February 2016, the BelgiumJune 28, 2014. The French Tax Authority notified us that all Belgium locations will be audited foris currently auditing the years ended December 31, 20132014, December 2015 and December 31, 2014. At this time, we cannot predict the outcome of any audit or related litigation.2016.
NOTE 14 – COMMITMENTS AND CONTINGENCIES
In view of the inherent difficulties of predicting the outcome of various types of legal proceedings, we cannot determine the ultimate resolution of the matters described below. We establish reserves for litigation and regulatory matters when losses associated with the claims become probable and the amounts can be reasonably estimated. The actual costs of resolving legal matters may be substantially higher or lower than the amounts reserved for those matters. For matters where the likelihood or extent of a loss is not probable or cannot be reasonably be estimated as of OctoberJuly 1, 2016,2017, we have not recorded a loss reserve. If certain of these matters are determined against the Company, there could be a material adverse effect on our financial condition, results of operations, or cash flows. We currently believe we have valid defenses to the claims in these lawsuits and intend to defend these lawsuits vigorously regardless of whether or not we have a loss reserve. Other than what is disclosed below, we do not expect the outcome of the litigation matters to which we are currently subject to individually or in the aggregate, have a material adverse effect on our financial condition, results of operations, or cash flows.
Antitrust Violations
We have been named as a counterclaim co-defendant in the lawsuit Fera Pharmaceuticals, LLC v. Akorn, Inc., et al., in which Akorn, Inc. (“Akorn”) alleges tortious interference and antitrust violations against us and Fera Pharmaceuticals, LLC (“Fera”). This litigation arises from our acquisition of bacitracin ophthalmic ointment from Fera in 2013. Akorn asserts claims under Sections 1 and 2 of the Sherman Antitrust Act alleging that we and Fera conspired to monopolize, attempted to monopolize, and did unlawfully monopolize the market for sterile bacitracin ophthalmic ointment in the United States through the use of an exclusive agreement with a supplier of sterile bacitracin active pharmaceutical ingredient. The lawsuit is currently pending in the Southern District of New York. A mediation is scheduled for September 2017 and a trial is set for January 2018. Akorn seeks damages, injunctive relief, and attorney’s fees. Any award of antitrust damages would be subject to trebling under antitrust laws. An estimate of any possible loss cannot be determined at this time.
We believe the claims are without merit and intend to defend them vigorously. We have preserved our indemnification rights against Fera for potential liability, defense costs, and expenses incurred as a result of this litigation.
Price-Fixing Lawsuits
We have been named as a co-defendant with other manufacturers in a number of cases alleging that we and other manufacturers of the same product engaged in anti-competitive behavior to fix or raise the prices of certain drugs starting, in some instances, as early as June 2013. The products in question are Clobetasol, Desonide, and Econazole and one complaint involving Levothyroxine, a product that we neither made nor sold. At this stage, we cannot reasonably predict the outcome of the liability, if any, associated with these claims.
Securities Litigation
In the United States
On May 18, 2016, a shareholder filed a securities case against the Company and our former CEO, Joseph Papa, in the U.S. District Court for the District of New Jersey (Roofers’ Pension Fund v. Papa, et al.). The plaintiff purportspurported to represent a class of shareholders for the period from April 21, 2015 through May 11, 2016, inclusive. The original complaint allegesalleged violations of Securities Exchange Act sections 10(b) (and Rule 10b‑5) and 14(e) against both defendants and 20(a) control person liability against Mr. Papa. In general, the allegations concernconcerned the actions taken by the Company and the former executive to defend against the hostileunsolicited takeover bid by Mylan in the period from April 21, 2015 through November 13, 2015. The plaintiff also allegesalleged that wethe defendants provided inadequate disclosure concerning alleged integration problems related to the Omega
Perrigo Company plc - Item 1
Note 14
acquisition in the period from April 21, 2015 through May 11, 2016. The case is in an early stage. Four different plaintiff groups have sought appointment as lead plaintiff/lead counsel. The court will decide who will represent the purported class. Once the court has chosen a lead plaintiff, the plaintiff will likely file an amended complaint and the defendants will then have an opportunity to make a motion to dismiss the case.
On July 19, 2016, a different shareholder filed a securities class action against the Company and our former CEO, Joseph Papa, also in the District of New Jersey.Jersey (Wilson v. Papa, et al.). The plaintiff purportspurported to represent a class of persons who sold put options on the Company shares between April 21, 2015 and May 11, 2016. In general, the allegations and the claims arewere the same as those made in the original complaint filed in the Roofers' Pension Fund case described above. Subsequently, this shareholder filed papers inOn December 8, 2016, the court consolidated Roofers' Pension Fund case as one of four candidates seeking to be named lead plaintiff or co-lead plaintiff in that case. The Wilson plaintiff also filed a motion to haveand the Wilson case consolidated withunder the Roofers' Pension Fund case number. In February 2017, the court selected the lead plaintiffs for the consolidated case and the lead counsel to the putative class. In March 2017, the court entered a scheduling order.
On June 21, 2017, the court-appointed lead plaintiffs filed an amended complaint that superseded the original complaints in the Roofers’ Pension Fund case and the Wilsoncase. The courtlead plaintiffs seek to represent a class of shareholders for the period April 21, 2015 through May 3, 2017, and identifies three subclasses - shareholders who traded during the entire period on the US exchanges; shareholders who traded during the entire period on the Tel Aviv exchange; and shareholders who traded during the period while the Mylan tender offer was pending (April 21, 2015 through November 13, 2015). The amended complaint names as defendants the Company and 11 current or former directors and officers of Perrigo (Mses. Judy Brown, Laurie Brlas, Jacqualyn Fouse, Ellen Hoffing, and Messrs. Joe Papa, Marc Coucke, Gary Cohen, Michael Jandernoa, Gerald Kunkle, Herman Morris, and Donal O’Connor). The amended complaint alleges violations of Securities Exchange Act sections 10(b) (and Rule 10b‑5) and 14(e) against all defendants and 20(a) control person liability against the 11 individuals. In general, the allegations concern the actions taken by the Company and the former executive to defend against the unsolicited takeover bid by Mylan in the period from April 21, 2015 through November 13, 2015 and the allegedly inadequate disclosure throughout the entire class period related to purported integration problems related to the Omega acquisition, alleges incorrect reporting of organic growth at the Company, alleges price fixing activities with respect to six generic prescription pharmaceuticals, and alleges improper accounting for the Tysabri® royalty stream. The amended complaint does not include an estimate of damages. The time for the defendants to respond to the amended complaint has not yet actedexpired. We will defend the lawsuit vigorously.
In Israel
Because the Company’s shares are traded on the motionTel Aviv exchange under a dual trading arrangement, the Company is subject to consolidate or the motion for appointment as lead plaintiff.securities litigation in Israel. Three cases are currently pending. Perrigo is consulting Israeli counsel about its response to these allegations and will defend these cases vigorously.
On May 22, 2016, shareholders filed a securities class action against the Company and five individual defendants: Our former CEO Mr. Papa, our former Executive Vice President and General Manager of the BCH segment Marc Coucke, our Chief Executive Officer John Hendrickson, and our Board members Gary Kunkle, Jr. and Laurie Brlas alleging violations of Israeli law in the District Court of Tel Aviv-Jaffa (SchwiegerSchweiger et al. v. Perrigo Company plc, et al.). On June 15, 2016, Perrigo filed a motion to stay the case pending the outcome of the securities class action pending in the New Jersey federal court.Federal Court. The plaintiffs did not oppose the motion. The Israeli court granted the motion on the same day, and the Schweigeraction is stayed. We will defend the lawsuit vigorously when and if the stay is lifted.
On March 29, 2017, plaintiff Eyal Keinan commenced an action in the District Court of Tel Aviv-Jaffa asserting securities claims against two defendants: Perrigo and its auditor Ernst & Young LLP ("EY"). The case is styled Keinan v. Perrigo Company plc, et al. The action seeks certification of a class of purchasers of Perrigo shares on the Israeli exchange beginning February 6, 2014. The proposed closing date for the class is not clear from the complaint though it appears to extend into 2017. In general, the plaintiff asserts that Perrigo improperly accounted for its stream of royalty income from two drugs: Tysabri® and Prialt. The court filings contend that the alleged improper accounting caused the audited financial results for Perrigo to be incorrect for the six month period ended December 31, 2015, and the years ended June 27, 2015 and June 28, 2014 and the other financial data released by the Company over those years and 2016 to also be inaccurate. The plaintiff maintains that the defendants are liable under Israeli securities law or, in the alternative, under U.S. securities law. The plaintiff indicates an initial, preliminary class damages estimate of 686.0 million NIS (approximately $192.0 million at 1 NIS = $0.28 cent). The response from the defendants is not yet due. We intend to defend the lawsuit vigorously.
On June 28, 2017, a plaintiff filed a complaint in Tel Aviv District Court styled Israel Elec. Corp. Employees’ Educ. Fund v. Perrigo Company plc, et al. The lead plaintiff seeks to represent a class of shareholders who traded
Perrigo Company plc - Item 1
Note 14
in Perrigo stock on the Tel Aviv exchange during the period April 24, 2015 through May 3, 2017. The amended complaint names as defendants the Company, EY (the Company’s auditor), and 11 current or former directors and officers of Perrigo (Mses. Judy Brown, Laurie Brlas, Jacqualyn Fouse, Ellen Hoffing, and Messrs. Joe Papa, Marc Coucke, Gary Cohen, Michael Jandernoa, Gerald Kunkle, Herman Morris, and Donal O’Connor). The complaint alleges violations under US securities laws of Securities Exchange Act sections 10(b) (and Rule 10b‑5) and 14(e) against all defendants and 20(a) control person liability against the 11 individuals or, in the alternative, under Israeli securities laws. In general, the allegations concern the actions taken by the Company and the former executive to defend against the unsolicited takeover bid by Mylan in the period from April 21, 2015 through November 13, 2015 and the allegedly inadequate disclosure concerning purported integration problems related to the Omega acquisition, alleges incorrect reporting of organic growth at the Company, alleges price fixing activities with respect to six generic prescription pharmaceuticals, and alleges improper accounting for the Tysabri® royalty stream. The plaintiff indicates an initial, preliminary class damages estimate of 2.7 billion NIS (approximately $760.0 million at 1 NIS = $0.28 cent). We intend to defend the lawsuit vigorously.
On July 12, 2017, the plaintiff in the Israel Elec. Corp. Employees’ Educ. Fund v. Perrigo Company plc, et al. case filed a motion to have all three cases pending in Israel either consolidated or the other two cases dismissed so that the Israel Elec. Corp. Educ. Fund plaintiff can proceed as the sole plaintiff. That motion is pending. A variety of other procedural motions are also pending at this time having to do with the timing of any response by defendants.
Eltroxin
During October and November 2011, nine applications to certify a class action lawsuit were filed in various courts in Israel related to Eltroxin, a prescription thyroid medication manufactured by a third party and distributed in Israel by our subsidiary, Perrigo Israel Agencies Ltd. The respondents included our subsidiaries, Perrigo Israel Pharmaceuticals Ltd. and/or Perrigo Israel Agencies Ltd., the manufacturers of the product, and various healthcare providers who provide healthcare services as part of the compulsory healthcare system in Israel.
One of the applications was dismissed and the remaining eight applications were consolidated into one application. The applications arose from the 2011 launch of a reformulated version of Eltroxin in Israel. The consolidated application generally alleges that the respondents:respondents (a) failed to timely inform patients, pharmacists and physicians about the change in the formulation; and (b) failed to inform physicians about the need to monitor patients taking the new formulation in order to confirm patients were receiving the appropriate dose of the drug. As a result, claimants allege they incurred the following damages: (a) purchases of product that otherwise would not have been made by patients had they been aware of the reformulation; (b) adverse events to some patients resulting from an imbalance of thyroid functions that could have been avoided; and (c) harm resulting from the patients' lack of informed consent prior to the use of the reformulation.
Several hearings on whether or not to certify the consolidated application took place in December 2013 and January 2014. On May 17, 2015, the District Court certified the motion against Perrigo Israel Agencies Ltd. and dismissed it against the remaining respondents, including Perrigo Israel Pharmaceuticals Ltd.
On June 16, 2015, Perrigowe submitted a motion for permission to appeal the decision to certify to the Israeli Supreme Court together with a motion to stay the proceedings of the class action until the motion for permission to appeal is adjudicated. Perrigo hasWe have filed itsour statement of defense to the underlying proceedings andproceedings. The parties are currently engaged in mediation in an attempt to settle the matter. The underlying proceedings have been stayed pending the outcome of the mediation process and, if necessary, a decision on the motion to appeal.
Perrigo Company plc - Item 1
Note 14
During a July 11, 2016 hearing on Perrigo’s motion to appeal the certification decision, the court noted that permission should be granted to Perrigo's appeal given issues with the scope of the District Court's decision. The court ultimately recommended the parties pursue mediation, noting that no decision on Perrigo's motion to appeal will be made pending the results of the mediation. The parties are now engaged in the mediation process. At this stage, we cannot reasonably predict the outcome or the liability, if any, associated with this claim.
Tysabri® Product Liability Lawsuits
PerrigoWe and our collaborator Biogen are co-defendants in product liability lawsuits arising out of the occurrence of Progressive Multifocal Leukoencephalopathy, a serious brain infection, and serious adverse events, including deaths, which occurred in patients taking Tysabri®. Perrigo and Biogen will eachEach co-defendant would be responsible for 50% of losses and expenses arising out of any Tysabri® product liability claims. During calendar year 2016, one case in the U.S. was settled and two others were dismissed with prejudice. In April 2017, another case was dismissed with prejudice. While we intend to vigorously defend the remaining lawsuits, will be vigorously defended, management cannot predict how these cases will be resolved. Adverse results in one or more of these lawsuits could result in substantial judgments against the Company.us.
NOTE 15 – COLLABORATION AGREEMENTS AND OTHER CONTRACTUAL ARRANGEMENTSClaim Arising from the Omega Acquisition
In May 2015,On December 16, 2016, we entered into a development agreement wherein we transferredand Perrigo Ireland 2 brought an arbitral claim ("Claim") against Alychlo NV ("Alychlo") and Holdco I BE NV ("Holdco") (together the ownership rights to two pharmaceutical products to a clinical stage development company to fundSellers) in accordance with clause 26.2 of the Share Purchase Agreement dated November 6, 2014 ("SPA") and conduct development activitiesthe rules of the Belgian Centre for the products. We do not expect to incur any expense relatedArbitration and Mediation ("CEPANI"). Our Claim relates to the developmentaccuracy and completeness of either product. If the products are approvedinformation about Omega provided by the FDA, we will execute a buy-back agreement to purchase each product for a multipleSellers as part of the development costs incurred. Based onsale process, the initial development budget for each product, the estimated purchase price for both products is approximately $78.0 million. If development costs exceed the initial budgeted amounts, the purchase price will increase but will not exceed approximately $105.0 million. If the products are approvedwithholding of information by the FDASellers during that process and we purchasebreaches of Sellers’ warranties. We are seeking monetary damages from the products, we estimate the acquisitions will occur in 2019 and 2020.
Perrigo Company plc - Item 1
Note 15
In June 2016, we added an additional productSellers. The Sellers served their respective responses to the May 2015 development agreementClaim on February 20, 2017. In its response, Alychlo has asserted a counterclaim for monetary damages contending that is subject to similar buy-back terms ifwe breached the product is approved byduty of good faith in performing the FDA. The estimated purchase price for this additional product, based on the initial development budget, is approximately $42.0 million. If development costs exceed the initial budgeted amounts, the purchase price will increase, but will not exceed approximately $57.0 million. If the product is approved by the FDA and we purchase the product, we estimate the acquisition will occur in 2020.SPA. There can be no assurance that any such productsour Claim will be approvedsuccessful, and Sellers deny liability for the Claim. We deny that Alychlo is entitled to any relief (including monetary relief) under the counterclaim. The arbitration proceedings are confidential as required by the FDA onSPA and the anticipated schedule or at all.rules of the CEPANI.
NOTE 1615 – RESTRUCTURING CHARGES
We periodically take action to reduce redundant expenses and improve operating efficiencies, typically in connection with business acquisitions.efficiencies. The following reflects our restructuring activity (in millions):
| | | | Three Months Ended | | Nine Months Ended | Three Months Ended | | Six Months Ended |
| | October 1,
2016 | | September 26,
2015 | | October 1,
2016 | | September 26,
2015 | July 1,
2017 | | July 2,
2016 | | July 1,
2017 | | July 2,
2016 |
| Beginning balance | $ | 12.2 |
| | $ | 1.7 |
| | $ | 20.7 |
| | $ | 3.2 |
| $ | 51.5 |
| | $ | 13.0 |
| | $ | 19.7 |
| | $ | 20.7 |
|
| Additional charges | 6.6 |
| | 2.2 |
| | 17.9 |
| | 3.1 |
| 12.1 |
| | 5.8 |
| | 50.8 |
| | 11.3 |
|
| Payments | (8.6 | ) | | (1.9 | ) | | (33.3 | ) | | (4.5 | ) | (23.6 | ) | | (6.6 | ) | | (30.7 | ) | | (24.8 | ) |
| Non-cash adjustments | 0.1 |
| | (0.7 | ) | | 5.0 |
| | (0.5 | ) | (0.3 | ) | | — |
| | (0.1 | ) | | 5.0 |
|
| Ending balance | $ | 10.3 |
| | $ | 1.3 |
| | $ | 10.3 |
| | $ | 1.3 |
| $ | 39.7 |
| | $ | 12.2 |
| | $ | 39.7 |
| | $ | 12.2 |
|
Restructuring activity includes severance, lease exit costs, and asset impairments. The charges incurred during the three and ninesix months ended OctoberJuly 1, 20162017 were primarily associated primarily with actions we took to streamline our organization as announced on October 22, 2015February 21, 2017. During the three and did not materially impact any one reportablesix months ended July 1, 2017, $12.1 million and $50.8 million of restructuring expenses were recorded, respectively. Of the amount recorded during the six months ended July 1, 2017, $28.0 million was related to the CHCA segment. There were no other material restructuring programs inthat significantly impacted any of the periods presented.other reportable segment. All charges are recorded in Restructuring expense. The remaining $5.1$35.5 million liability for employee severance benefits willis expected to be paid within the next year, while cash expenditures related to the remaining $5.2$4.2 million liability for lease exit costs willis expected to be incurred over the remaining terms of the applicable leases.
NOTE 1716 – SEGMENT INFORMATION
Our reporting segments are as follows:
CHCCHCA, is focused primarily on the global sale of OTC store brand products including cough, cold, allergycomprises our U.S., Mexico and sinus, analgesic, gastrointestinal, smoking cessation,Canada consumer healthcare business (OTC, contract, infant formula and food, animal health,Animal Health categories).
Perrigo Company plc - Item 1
Note 16
CHCI,comprises our legacy Branded Consumer Healthcare segment and diagnostic products.now includes our consumer focused businesses in the U.K., Australia, and Israel. This segment also includes our U.K. liquid licensed products business.
RX,comprises our U.S. Prescription Pharmaceuticals business.
| |
�� | BCHdevelops, manufactures, markets and distributes many well-known European OTC brands in the natural health and vitamins, cough, cold and allergy, smoking cessation, personal care and derma-therapeutics, lifestyle, and anti-parasite categories.
|
Rxdevelops, manufactures and markets a portfolio of generic and specialty pharmaceutical prescription drugs primarily for the U.S. and U.K. markets.
| |
• | Specialty Sciences is comprised primarily of royalties received from assets focused on the management of multiple sclerosis (Tysabri®).
|
We also have an Other"Other" reporting segment that consists of our legacy API business, which does not meet the quantitative threshold required to be a separately reportable segment. Effective January 1, 2017, due to the sale of the Tysabri® financial asset, all legal expenses associated with the former Specialty Sciences segment were moved to unallocated expenses. Our segments reflect the way in which our chief operating decision maker reviews our operating results and allocates resources.
Perrigo Company plc - Item 1
Note 17
The below tables show select financial measures by reporting segment (in millions):
|
| | | | | | | | |
| Total Assets | | October 1,
2016 | | December 31, 2015 |
| CHC | | $ | 3,873.8 |
| | $ | 4,007.8 |
|
| BCH | | 4,460.2 |
| | 6,324.0 |
|
| Rx | | 3,304.0 |
| | 3,015.5 |
|
| Specialty Sciences | | 5,634.0 |
| | 5,833.5 |
|
| Other | | 195.6 |
| | 213.1 |
|
| Total | | $ | 17,467.6 |
| | $ | 19,393.9 |
|
|
| | | | | | | | |
| | | Total Assets |
| | | July 1,
2017 | | December 31,
2016 |
| CHCA | | $ | 3,907.1 |
| | $ | 3,351.3 |
|
| CHCI | | 5,012.1 |
| | 4,795.2 |
|
| RX | | 2,560.8 |
| | 2,646.4 |
|
| Specialty Sciences | | — |
| | 2,775.8 |
|
| Other | | 312.2 |
| | 301.4 |
|
| Total | | $ | 11,792.2 |
| | $ | 13,870.1 |
|
| | | | Three Months Ended | Three Months Ended |
| | October 1, 2016 | | September 26, 2015 | July 1, 2017 | | July 2, 2016 |
| | Net Sales | | Operating Income (Loss) | | Intangible Asset Amortization | | Net Sales | | Operating Income (Loss) | | Intangible Asset Amortization | Net Sales | | Operating Income (Loss) | | Intangible Asset Amortization | | Net Sales | | Operating Income (Loss) | | Intangible Asset Amortization |
| CHC | $ | 669.1 |
| | $ | 100.1 |
| | $ | 19.2 |
| | $ | 675.2 |
| | $ | 117.3 |
| | $ | 19.4 |
| |
| BCH | 304.0 |
| | (1,684.3 | ) | | 38.9 |
| | 302.2 |
| | 4.4 |
| | 36.3 |
| |
| Rx | 267.4 |
| | 77.9 |
| | 30.7 |
| | 260.3 |
| | 91.0 |
| | 18.6 |
| |
| CHCA | | $ | 604.9 |
| | $ | 104.2 |
| | $ | 17.0 |
| | $ | 629.9 |
| | $ | 116.8 |
| | $ | 17.6 |
|
| CHCI | | 376.5 |
| | 3.9 |
| | 47.5 |
| | 415.9 |
| | 0.6 |
| | 44.9 |
|
| RX | | 240.4 |
| | 69.3 |
| | 22.3 |
| | 276.9 |
| | 92.6 |
| | 25.9 |
|
| Specialty Sciences | 93.4 |
| | 23.3 |
| | 72.8 |
| | 84.5 |
| | 9.0 |
| | 72.8 |
| — |
| | — |
| | — |
| | — |
| | (3.8 | ) | | — |
|
| Other | 21.0 |
| | (1.6 | ) | | 0.5 |
| | 22.5 |
| | 6.2 |
| | 0.5 |
| 16.1 |
| | 4.1 |
| | 0.4 |
| | 17.8 |
| | (1.3 | ) | | 0.5 |
|
| Unallocated | — |
| | (30.6 | ) | | — |
| | — |
| | (39.3 | ) | | — |
| — |
| | (32.7 | ) | | — |
| | — |
| | (20.1 | ) | | — |
|
| Total | $ | 1,354.9 |
| | $ | (1,515.2 | ) | | $ | 162.1 |
| | $ | 1,344.7 |
| | $ | 188.6 |
| | $ | 147.6 |
| $ | 1,237.9 |
| | $ | 148.8 |
| | $ | 87.2 |
| | $ | 1,340.5 |
| | $ | 184.8 |
| | $ | 88.9 |
|
|
| | | | | | | | | | | | | | | | | | | | | | | |
| | Nine Months Ended |
| | October 1, 2016 | | September 26, 2015 |
| | Net Sales | | Operating Income (Loss) | | Intangible Asset Amortization | | Net Sales | | Operating Income (Loss) | | Intangible Asset Amortization |
| CHC | $ | 2,055.6 |
| | $ | 313.6 |
| | $ | 58.1 |
| | $ | 2,106.4 |
| | $ | 364.8 |
| | $ | 52.1 |
|
| BCH* | 1,015.3 |
| | (2,128.7 | ) | | 113.9 |
| | 703.4 |
| | 31.0 |
| | 70.5 |
|
| Rx | 817.4 |
| | 262.1 |
| | 90.1 |
| | 790.1 |
| | 290.4 |
| | 55.5 |
|
| Specialty Sciences | 271.3 |
| | 49.7 |
| | 218.3 |
| | 250.1 |
| | 21.0 |
| | 218.4 |
|
| Other | 59.5 |
| | 2.6 |
| | 1.4 |
| | 75.4 |
| | 18.6 |
| | 1.4 |
|
| Unallocated | — |
| | (80.0 | ) | | — |
| | — |
| | (111.1 | ) | | — |
|
| Total* | $ | 4,219.1 |
| | $ | (1,580.7 | ) | | $ | 481.8 |
| | $ | 3,925.4 |
| | $ | 614.7 |
| | $ | 397.9 |
|
|
| | | | | | | | | | | | | | | | | | | | | | | |
| | Six Months Ended |
| | July 1, 2017 | | July 2, 2016 |
| | Net Sales | | Operating Income (Loss) | | Intangible Asset Amortization | | Net Sales | | Operating Income (Loss) | | Intangible Asset Amortization |
| CHCA | $ | 1,187.6 |
| | $ | 179.2 |
| | $ | 34.2 |
| | $ | 1,269.0 |
| | $ | 217.4 |
| | $ | 35.7 |
|
| CHCI | 751.5 |
| | 4.2 |
| | 93.2 |
| | 855.3 |
| | (395.8 | ) | | 86.1 |
|
| RX | 457.8 |
| | 157.5 |
| | 44.6 |
| | 525.0 |
| | 184.0 |
| | 51.4 |
|
| Specialty Sciences | — |
| | — |
| | — |
| | — |
| | (5.2 | ) | | — |
|
| Other | 35.0 |
| | 9.7 |
| | 0.8 |
| | 38.5 |
| | 4.2 |
| | 0.9 |
|
| Unallocated | — |
| | (73.3 | ) | | — |
| | — |
| | (51.4 | ) | | — |
|
| Total | $ | 2,431.9 |
| | $ | 277.3 |
| | $ | 172.8 |
| | $ | 2,687.8 |
| | $ | (46.8 | ) | | $ | 174.1 |
|
| |
* | The BCH segment was created on March 30, 2015 as a result of the Omega acquisition, thus data for the nine months ended September 26, 2015 includes only six months of results from operations attributable to Omega. |
NOTE 17 – SUBSEQUENT EVENTS
On August 4, 2017, we signed a definitive agreement for the sale of our Israel API business to SK Capital for $110.0 million in cash, inclusive of a working capital adjustment. We expect to finalize the sale within the next six months, and the sale is not expected to have a material impact on our operations.
Perrigo Company plc - Item 2
Executive Overview
ITEM 2. MANAGEMENT'S DISCUSSION AND ANALYSIS OF FINANCIAL CONDITION AND RESULTS OF OPERATIONS
EXECUTIVE OVERVIEW
This Management’s Discussion and Analysis of Financial Condition and Results of Operations should be read in conjunction with the financial statements included in this Form 10-Q and our Form 10-KT10-K for the transition period from June 28, 2015 toyear ended December 31, 2015.2016 (the “2016 Form 10-K”). These historical financial statements may not be indicative of our future performance. This discussion contains a number of forward-looking statements, all of which are based on our current expectations and could be affected by the uncertainties and risks referred to under “Risk Factors” in Item 1A of our 2016 Form 10-KT for the transition period from June 28, 2015 to December 31, 201510-K and Part II, Item 1A of this Form 10-Q.
Perrigo Company plc - Item 2
Executive Overview
Perrigo Company plc was incorporated under the laws of Ireland on June 28, 2013 and became the successor registrant of Perrigo Company, a Michigan corporation, on December 18, 2013 in connection with the acquisition of Elan Corporation, plc ("Elan"). Unless the context requires otherwise, the terms "Perrigo," the "Company," "we," "our," "us," and similar pronouns used herein refer to Perrigo Company plc, its subsidiaries, and all predecessors of Perrigo Company plc and its subsidiaries.
We are a leading global over-the-counter ("OTC") consumer goodshealthcare company that delivers value to our customers and specialty pharmaceutical company, offering patients and customers high quality products at affordable prices. From our beginningconsumers by providing Quality Affordable Healthcare Products®. Founded in 1887 as a packager of home remedies, we have grown to becomebuilt a unique business model that is best described as the convergence of a fast-moving consumer goods company, a high-quality pharmaceutical manufacturing organization and a world-class supply chain network. We believe we are one of the world's largest manufacturermanufacturers of OTCover-the-counter (“OTC”) healthcare products and supplier of infant formulas for the store brand market. We also are also a leading provider of branded OTC products throughout Europe and the U.S., as well as a leading producer of generic standard topical products such as creams, lotions, and gels, as well as inhalants and injections ("extended topicaltopical") prescription products,drugs. We are headquartered in Ireland, and we receive royalties from sales of the multiple sclerosis drug Tysabri.® We provide “Quality Affordable Healthcare Products®” across a wide variety of product categories and geographies,sell our products primarily in North America Europe, and Australia,Europe, as well as in other markets, including Australia, Israel China, and Latin America.China.
Our reporting segments are as follows:
Consumer Healthcare Americas ("CHC"CHCA") is focused primarily on the global sale of OTC store brand products including cough, cold, allergy, comprises our U.S., Mexico and sinus, analgesic, gastrointestinal, smoking cessation,Canada consumer healthcare business (OTC, contract, infant formula and food, animal health, and diagnostic products.Animal Health categories).
Branded Consumer Healthcare International ("BCH"CHCI") develops, manufactures, markets,comprises our legacy Branded Consumer Healthcare segment and distributes many well-known European OTC brandsnow includes our consumer focused businesses in the natural healthU.K., Australia, and vitamins, cough, cold and allergy, smoking cessation, personal care and derma-therapeutics, lifestyle, and anti-parasite categories.Israel. This segment also includes our U.K. liquid licensed products business.
Prescription Pharmaceuticals ("Rx"RX") develops, manufactures and markets a portfolio of generic and specialty pharmaceutical prescription drugs primarily for the,comprises our U.S. and U.K. markets.Prescription Pharmaceuticals business.
| |
• | Specialty Sciences is comprised primarily of royalties received from assets focused on the management of multiple sclerosis (Tysabri®).
|
We also have an "Other" reporting segment, comprised ofwhich comprises our active pharmaceutical ingredientslegacy Active Pharmaceutical Ingredients ("API") business,which develops, manufactures, and markets active API used worldwide by both generic and branded pharmaceutical companies.does not meet the quantitative threshold required to be a separately reportable segment. Effective January 1, 2017, due to the sale of the Tysabri® financial asset, all legal expenses associated with the former Specialty Sciences segment were moved to unallocated expenses. For results by segment, see "Segment Results" below and Item 1. Note 1716.
Leadership Changes
On August 29, 2016, Jim Michaud joined the Company as Executive Vice President, Chief Human Resources Officer.
On November 8, 2016, we appointed John Wesolowski the General Manager, Rx Pharmaceuticals. Mr. Wesolowski served as Acting General Manager, Rx Pharmaceuticals following the resignation of Doug Boothe on July 20, 2016.
On April 27, 2016, Sharon Kochan's role as Executive Vice President and General Manager, International, was expanded to lead the BCH segment following the resignation of Marc Coucke as Executive Vice President and General Manager of the BCH segment.
On April 24, 2016, we named Laurie Brlas as Chairman of the Board of Directors, promoted John T. Hendrickson from President to Chief Executive Officer, and accepted the resignation of Joseph C. Papa as Chairman and Chief Executive Officer.
Interim Impairment Testing
In connection with the preparation of our financial statements for the three-month period ended April 2, 2016, we identified indicators of goodwill impairment in our BCH - rest of world (“BCH - ROW”) reporting unit, which
Perrigo Company plc - Item 2
Executive Overview
comprises primarily operations attributable to the Omega acquisition in all geographic regions except for Belgium. The primary impairment indicators included the decline in our 2016 performance expectations and a reduction in our long-range revenue growth forecast. Step one of the goodwill impairment test involved determining the fair value of the reporting unit using a discounted cash flow technique and comparing it to the reporting unit’s carrying value. The main assumptions supporting the cash flow projections used to determine the reporting unit’s fair value included revenue growth based on product line extensions, product life cycle strategies, and geographical expansion within the markets in which the reporting unit distributes products, gross margins consistent with historical trends, and advertising and promotion investments largely consistent with the reporting unit's growth plans. The BCH-ROW reporting unit did not pass step one of goodwill impairment testing. The change in fair value from previous estimates was due primarily to the changes in the market and performance of certain brands such that the evaluation of brand prioritization and product extensions or launches in new regions are being more focused to maximize the potential of all brands in the segment's portfolio.
The second step of the goodwill impairment test required that we determine the implied fair value of the BCH - ROW reporting unit’s goodwill, which involved determining the value of the reporting unit’s individual assets and liabilities. Due to the complex and time-consuming nature of step two, based on our evaluation and initial estimates of the fair values of the assets and liabilities and the deficit of the fair value when compared to the related book value, we recorded an estimated impairment charge of $193.6 million for the three months ended April 2, 2016. We finalized the step two fair value calculation during the three months ended July 2, 2016, which resulted in a $30.3 million reduction to the estimated impairment charge recorded during the three months ended April 2, 2016,
In connection with the preparation of our financial statements for the three months ended October 1, 2016, we identified additional indicators of goodwill impairment in both our BCH - ROW and our BCH - Belgium reporting units. With respect to both reporting units, the primary impairment indicators included an additional decline in our 2016 performance expectations for the remainder of the year and a reduction in our long-range revenue growth and margin forecasts due to the factors outlined below. Step one of the goodwill impairment test involved determining the fair value of the reporting units using a discounted cash flow technique and comparing it to the respective reporting units' carrying value. The main assumptions supporting the cash flow projections used to determine each reporting unit’s fair value included revenue growth based on product line extensions, product life cycle strategies, and geographical expansion within the markets in which the reporting unit distributes products, gross margins consistent with historical trends and including supply chain cost improvement plans, and advertising and promotion investments largely consistent with the reporting unit's growth plans. Both the BCH - ROW and the BCH - Belgium reporting units did not pass step one of goodwill impairment testing. As it relates to the BCH - ROW reporting unit, the changes in fair value from previous estimates were due primarily to (1) changes in the market and performance of certain brands due to moderated new product launch assumptions, (2) execution of certain key product strategies falling short of expectations causing a reduction to baseline forecast models in France, Germany and Italy, (3) certain macro-economic factors having continued to impact the business more than expected in France, Russia and Turkey in addition to unfavorable foreign currency impacts experienced primarily in the UK related to Brexit. As it relates to BCH - Belgium reporting unit, the changes in fair value from previous estimates due to change in the forecast as a result of a reduction in volume with a major wholesaler due to factors consistent with those outlined for BCH - ROW.
The second step of the goodwill impairment test required that we determine the implied fair value of both the BCH - ROW and BCH - Belgium reporting units' goodwill, which involved determining the value of each reporting unit’s individual assets and liabilities. Based on our evaluation and initial estimates of the fair values of the assets and liabilities and the deficit of the fair value when compared to the related book value, we recorded an estimated impairment charge of $734.7 million related to the BCH - ROW reporting unit and $69.4 million related to the BCH - Belgium reporting unit for the three months ended October 1, 2016. Both charges were recorded in Impairment charges on the Condensed Consolidated Statements of Operations within our BCH segment. Due to the complex and time-consuming nature of step two we expect to finalize the fair value calculation during the fourth quarter of 2016, which could result in an adjustment to the estimated impairment charge. As of October 1, 2016, $1.0 billion and $70.2 million of goodwill remains in the BCH - ROW and BCH - Belgium reporting units, respectively.
In connection with the preparation of our financial statements for the three-month period ended April 2, 2016, we identified indicators of impairment associated with certain indefinite-lived intangible assets acquired in conjunction with the Omega acquisition. The primary impairment indicators included the decline in our 2016
Perrigo Company plc - Item 2
Executive Overview
performance expectations and a reduction in our long-range revenue growth forecast. The assessment utilized the excess earnings method to determine fair value and resulted in an impairment charge of $273.4 million in Impairment charges on the Condensed Consolidated Statements of Operations within our BCH segment, which represented the difference between the carrying amount of the intangible assets and their estimated fair value. The change in fair value from previous estimates was due primarily to the changes in the market and performance of the brands such that the evaluation of brand prioritization and product extensions or launches in new regions are being more focused to maximize the potential of all brands in the segment's portfolio. The main assumptions supporting the fair value of these assets and cash flow projections included revenue growth based on product line extensions, product life cycle strategies, and geographical expansion within the markets in which the BCH segment distributes products, gross margins consistent with historical trends, and advertising and promotion investments largely consistent with the segment's growth plans.
In connection with the preparation of our financial statements for the three months ended October 1, 2016, we identified additional indicators of impairment associated with certain indefinite-lived and definite-lived intangible brand category assets acquired in conjunction with the Omega acquisition. The primary impairment indicators are discussed above in goodwill. The assessment of the indefinite-lived assets utilized the excess earnings method to determine fair value and resulted in an impairment charge of $575.7 million for the three months ended October 1, 2016. With regards to the definite-lived asset, it was determined that the carrying value of the asset group was not recoverable based on an assessment of the undiscounted future cash flows expected to be generated by the asset group. Given this, the excess earnings method was utilized to determine fair value of the definite-lived asset and resulted in an impairment charge of $290.2 million for the three months ended October 1, 2016. Both charges, which represented the difference between the carrying amount of the intangible assets and their estimated fair value, were recorded in Impairment charges on the Condensed Consolidated Statements of Operations within our BCH segment. The main assumptions supporting the fair value of these assets and cash flow projections are included in the goodwill discussions above.
The carrying value for certain intangible assets and goodwill equals estimated and implied fair values, respectively, and as a result, any further deterioration in those assets' fair value would lead to a further impairment charge. Future performance different from the assumptions utilized in our quantitative analyses may result in additional changes in the fair value. We will continue to monitor and assess these assets for potential impairment should further impairment indicators arise. We will complete our required annual impairment testing during the fourth quarter of 2016.
In addition, given the additional change in performance expectations for our remaining impaired cough/cold/allergy, anti-parasite, personal care and natural health brands previously recorded as indefinite-lived assets, we reclassified the remaining asset balance of $672.4 million related to these four assets to definite-lived assets with a 20-year useful life and began amortizing the assets as of October 2, 2016.
Perrigo Company plc - Item 2
Executive Overview
20162017 Year-to-Date Highlights
Consistent with previously announced actions, we added a number of positions and processes to our Dublin headquarters across a range of corporate functions, including supply chain/global operations, procurement, enterprise risk management, and corporate finance, leveraging the strength of our global platform; | |
| • | On March 27, 2017, we completed the sale of our Tysabri® royalty stream, effective January 1, 2017, to Royalty Pharma for up to $2.85 billion, which consists of $2.2 billion in cash and up to $250.0 million and $400.0 million in milestone payments if the royalties on global net sales of Tysabri® that are received by Royalty Pharma meet specific thresholds in 2018 and 2020, respectively. As a result of this transaction, we derecognized the Tysabri® financial asset and recorded a $17.1 million gain. |
We continued restructuring associated primarily with actionsOn April 6, 2017, we took to streamline our organization as announced on October 22, 2015;
We issued $1.2 billion of senior notes and repaid borrowings under revolving credit facilities;
We prepaid $500.0 million outstanding under our 1.300% Senior Notes due 2016 ("1.300% 2016 Notes") on September 29, 2016;
We completed several strategic acquisitions within our CHC and Rx segments that expanded our portfolio of products; and
We completed the sale of our U.S. Vitamins, Minerals, and Supplements ("VMS")Israel API business to International Vitamins Corporation ("IVC")Strides Shasun Limited for $22.2 million, inclusive of an estimated working capital adjustment.
On August 4, 2017, we signed a definitive agreement for the sale of our Israel API business to SK Capital for $110.0 million in cash, inclusive of a working capital adjustment. We expect to finalize the sale within the next six months, and the sale is not expected to have a material impact on August 5, 2016.our operations.
We completed $2.2 billion of debt repayments during the six months ended July 1, 2017.
RESULTS OF OPERATIONS
CONSOLIDATED
Recent Trends and DevelopmentsRestructuring
On February 21, 2017, we approved a workforce reduction plan as part of a larger cost optimization strategy across the Company. We expect to reduce our global workforce by approximately 750 employees, which includes some actions already taken and 235 employees who have experiencedelected to participate in a voluntary early retirement program. This represents a reduction of approximately 14% of our global non-production workforce. The changes to our workforce will vary by country, based on legal requirements and required consultations with works councils and other employee representatives, as appropriate. During the six months ended July 1, 2017, we recognized $50.8 million of restructuring expenses due primarily to this cost optimization strategy.
In connection with this plan, we estimate that we will recognize total pre-tax restructuring charges of approximately $55.0 million to $65.0 million, consisting of one-time termination benefits, severance arrangements, and other termination costs. We expect to incur the majority of the remaining charges in pricing expectations2017, with the balance to be recognized during 2016 in comparison to historical patterns in our U.S. businesses, in particular in our Rx segment, due to industry and competitive pressures in the sector. The reduced pricing is attributable to a variety of factors including increased focus from customers to capture supply chain productivity savings, low raw material commodity pricing, competition in specific product categories, the loss of exclusivity on certain products, and consolidation of certain customers in the Rx segment. We have seen year-over-year pricing in the thirdfirst quarter of 2016 moderate from the levels experienced in the first half of 2016. We expect this pricing environment to continue to impact the Company for the foreseeable future.year ending December 31, 2018.
Our expectations for the BCH segment continuecost optimization strategy is expected to be impactedyield approximately $130.0 million in savings per annum by market dynamicsmid-2018. This is in key countries such as Belgium, France, Germany and Italy. Factors impacting these countries include softness in certain leading brand categories primarily due to lower sell-through during the current year dueaddition to the re-staging launch timing of certain products, changes in timing of certain advertising and promotional campaigns compared to the prior year, and macro-economic factors, including unfavorable foreign currency impacts experienced primarily in the UK related to Brexit. The BCH segment has established a brand prioritization strategy to address these market dynamics, with an objective to balance the cost of advertising and promotion investments with expected contributions from category sales. The segment has further impacted in Belgium by a change in the forecasts with a major wholesaler, as management implements improvedsavings that our supply chain efficiencies in this market.
Our expectationsorganization continues to generate for 2016 new product sales are consistent with those communicated inboth our Form 10-Q for the three months ended April 2, 2016, but continue to remain lower than we anticipated as of December 31, 2015. Several new product launches have been delayed due to the regulatory approval process for certain new products in the U.S.North American and modifications to market share penetration and timing assumptions for new products in our Rx and BCHInternational segments.
On November 10, 2016, we announced the following strategic actions: (1) we are exploring strategic alternatives for the potential sale our Tysabri® asset, which is reported in our Specialty Sciences segment; (2) as part of the Company’s portfolio review process, we are conducting a comprehensive internal evaluation of the Rx pharmaceuticals segments’ market position, growth opportunities and interdependencies with other Company manufacturing and shared service operations to determine if
Perrigo Company plc - Item 2
Consolidated
strategic alternatives should be explored; and (3) we are conducting a review of segment and corporate cost structures to align with existing and future expected market dynamics. We expect to complete these evaluations and reviews by the end of March 2017.
Consolidated Results
| | | | Three Months Ended | | % Change | | Nine Months Ended | | % Change | Three Months Ended | | Six Months Ended |
| ($ in millions) | September 26,
2015 | | October 1,
2016 | | September 26,
2015 | | October 1,
2016 | | July 2,
2016 | | July 1,
2017 | | July 2,
2016 | | July 1,
2017 |
| Net sales | $ | 1,344.7 |
| | $ | 1,354.9 |
| | 1 | % | | $ | 3,925.4 |
| | $ | 4,219.1 |
| | 7 | % | $ | 1,340.5 |
| | $ | 1,237.9 |
| | $ | 2,687.8 |
| | $ | 2,431.9 |
|
| Gross profit | $ | 548.8 |
| | $ | 506.3 |
| | (8 | )% | | $ | 1,555.7 |
| | $ | 1,596.4 |
| | 3 | % | $ | 546.5 |
| | $ | 504.6 |
| | $ | 1,079.6 |
| | $ | 968.9 |
|
| Gross profit % | 40.8 | % | | 37.4 | % | | | | 39.6 | % | | 37.8 | % | | | 40.8 | % | | 40.8 | % | | 40.2 | % | | 39.8 | % |
| Operating expenses | $ | 360.2 |
| | $ | 2,021.5 |
| | 461 | % | | $ | 941.0 |
| | $ | 3,177.1 |
| | 238 | % | $ | 361.7 |
| | $ | 355.8 |
| | $ | 1,126.4 |
| | $ | 691.6 |
|
| Operating expenses % | 26.8 | % | | 149.2 | % | | | | 24.0 | % | | 75.3 | % | | | 27.0 | % | | 28.7 | % | | 41.9 | % | | 28.4 | % |
| Operating income (loss) | $ | 188.6 |
| | $ | (1,515.2 | ) | | (904 | )% | | $ | 614.7 |
| | $ | (1,580.7 | ) | | (357 | )% | $ | 184.8 |
| | $ | 148.8 |
| | $ | (46.8 | ) | | $ | 277.3 |
|
| Operating income (loss) % | 14.0 | % | | (111.8 | )% | | | | 15.7 | % | | (37.5 | )% | | | 13.8 | % | | 12.0 | % | | (1.7 | )% | | 11.4 | % |
| Change in financial assets | | $ | 910.8 |
| | $ | 38.7 |
| | $ | 1,115.3 |
| | $ | 21.6 |
|
| Interest and other, net | $ | 56.4 |
| | $ | 56.3 |
| | — | % | | $ | 427.8 |
| | $ | 198.4 |
| | (54 | )% | $ | 86.2 |
| | $ | 51.2 |
| | $ | 139.9 |
| | $ | 100.9 |
|
| Loss on extinguishment of debt | | $ | — |
| | $ | 135.2 |
| | $ | 0.4 |
| | $ | 135.2 |
|
| Income tax expense (benefit) | $ | 19.6 |
| | $ | (316.3 | ) | | (1,719 | )% | | $ | 112.7 |
| | $ | (383.7 | ) | | (440 | )% | $ | (277.9 | ) | | $ | (6.7 | ) | | $ | (238.9 | ) | | $ | 17.6 |
|
| Net income (loss) | $ | 112.6 |
| | $ | (1,255.2 | ) | | (1,215 | )% | | $ | 74.2 |
| | $ | (1,395.4 | ) | | (1,981 | )% | $ | (534.3 | ) | | $ | (69.6 | ) | | $ | (1,063.5 | ) | | $ | 2.0 |
|
The increase in consolidated sales for the three months ended October 1, 2016 as compared to the prior year period was primarily due to higher sales in the Rx segment attributable to contributions from acquisitions and new products and in the Specialty Sciences segment as a result of increased royalties from sales of Tysabri®. These increases were offset partially by lower sales in the CHC segment due to the sale of the U.S. VMS business in August 2016 and lower sales in the cough/cold and analgesics categories. Consolidated operating income for the three months ended October 1, 2016 decreased from the prior year period due primarily to lower gross profit margin flow through primarily as a result of reduced pricing in the Rx segment and product mix in the BCH segment.
The most significant change in our consolidated nine-month year-over-year results was the addition of Omega Pharma Invest N.V. ("Omega"). Omega was acquired on March 30, 2015; thus, results for the nine-months ended September 26, 2015 included only six months of operations attributable to Omega. The net loss for the nine months ended October 1, 2016 was due primarily to the recording of goodwill and intangible asset impairment charges totaling $2.1 billion, as described above under "Interim Impairment Testing" and in Item 1. Note 3. Net income in the prior year period included a $259.8 million loss on derivatives we used to economically hedge fluctuations in the euro-denominated purchase price of the Omega acquisition as described in Item 1. Note 8.
Further detailsDetails and analysis of our financial results for the three and ninesix months ended OctoberJuly 1, 2016 and September 26, 20152017 are provideddescribed below by reporting segment and line item. Refer to the "Interest, Other and Change in financial assets (Consolidated)" and "Unallocated Expenses" sections below for discussions related to our expenses.
Perrigo Company plc - Item 2
CHCCHCA
CONSUMER HEALTHCARE AMERICAS
Recent Trends and Developments
On August 5, 2016, we completed the sale of our U.S. VMS business to IVC for $61.8 million inclusive of an estimated working capital adjustment. Sales attributable to the U.S. VMS business totaled $21.0 million and $40.9 million for the three months ended October 1, 2016 and September 26, 2015, respectively, and $110.1 million and $118.0 million for the nine months ended October 1, 2016 and September 26, 2015, respectively.
We have experienced a reduction in pricing expectations within our CHCA segment, primarily in the cough/cold, animal health, and analgesics categories within our CHC segment in 2016 due to various factors, including increased focus from customers to capture supply chain productivity savings low raw material commodity pricing, and competition in specific product categories. We expect this pricing environment to continue to impact our CHCCHCA segment for the foreseeable future.
| |
| • | We completed the sale of the Animal Health pet treats plant fixed assets on February 1, 2017 and received $7.7 million in proceeds (refer to Item 1. Note 2). |
Segment Results
Three Month Comparison
| | | | Three Months Ended | Three Months Ended |
| ($ in millions) | September 26, 2015 | | October 1,
2016 | July 2,
2016 | | July 1,
2017 |
| Net sales | $ | 675.2 |
| | $ | 669.1 |
| $ | 629.9 |
| | $ | 604.9 |
|
| Gross profit | $ | 231.0 |
| | $ | 216.8 |
| $ | 220.0 |
| | $ | 203.8 |
|
| Gross profit % | 34.2 | % | | 32.4 | % | 34.9 | % | | 33.7 | % |
| Operating income | $ | 117.3 |
| | $ | 100.1 |
| $ | 116.8 |
| | $ | 104.2 |
|
| Operating income % | 17.4 | % | | 15.0 | % | 18.5 | % | | 17.2 | % |
Three Months Ended OctoberJuly 1, 20162017 vs. Three Months Ended September 26, 2015July 2, 2016
Net sales decreased $6.1$25.0 million, or 1%4%, over the prior year period due to:
Lower year-over-year sales of $19.9 million attributable to the U.S. VMS business, which was sold in August 2016;
A net decrease in sales of existing products of $12.3 million due to:
Strong sales in our infant nutrition and smoking cessation categories; more than offset by
Pricing pressure primarily in the cough/cold, animal health, and analgesics categories;
A milder allergy season, which impacted sales in the cough/cold category; and
Lower sales in the antacids category; | |
| • | The absence of $42.2 million in sales attributable to the U.S. Vitamins, Minerals, Supplements ("VMS") business, which was sold in August 2016 (refer to Item 1. Note 2); and |
Discontinued products of $5.6 million; and
Unfavorable foreign currency movement of $7.0$3.2 million; offset partially by
| |
| • | New product sales of $33.1$12.5 million related primarily to the launches of fluticasone nasal spray (store brand equivalent to Flonase®), the guaifenesin family of products (store brand equivalent to Mucinex®), and several new infant formula and foodsmoking cessation products; and |
| |
• | Incremental net sales of $5.6 million from acquisitions (primarily the ScarAway® acquisition).A net increase in sales of existing products of $8.3 million due to: Higher sales in the dermatologic and smoking cessation categories and improved performance in our Mexico business; offset partially by Pricing pressures and lower volumes in the cough/cold and analgesics categories; and Decreased sales in our Animal Health category driven by increased competition on certain products.
|
Perrigo Company plc - Item 2
CHCCHCA
Operating income decreased $17.2$12.6 million, or 15%11%, as a result of:
A decrease of $14.2$16.2 million in gross profit due to:
| |
| • | The absence of $7.1 million in gross profit as a result of the sale of the U.S. VMS business (refer to Item 1. Note 2); and |
Pricing pressureSales of higher margin products in the previous year and pricing pressures as noted above; offset partially by
Positive contributions from supply chain manufacturing efficiencies.
A decrease of $3.6 million in operating expenses due to:
| |
| • | The absence of a $6.2 million impairment charge related to the U.S. VMS business (refer to Item 1. Note 2); |
Decreased selling expenses of $2.9 million due to timing of promotions related to our Animal Health category; and
| |
| • | A $2.5 million gain related to contingent consideration (refer to Item 1. Note 6); offset partially by |
A $4.1 million impairment charge recorded on idle property, plant and equipment; and
| |
| • | Increased intangible asset amortizationrestructuring expense associatedof $4.0 million related primarily with the ScarAwayto cost reduction initiatives (refer to Item 1. Note 15® acquisition; offset partially by). |
Margin
Gross profit as a percentage of net sales was 1.2% lower due primarily to an unfavorable product mix and pricing in certain categories offset partially by positive contributions from new productssupply chain and strong performance in the infant health and smoking cessation categories; and
Continued manufacturing and supply chain efficiencies.
An increase of $3.0 million in operating expenses due to:
Increased research and development investments of $1.1 million due to timing of clinical trials;
Increased restructuring expenses of $3.2 million related primarily to the sale of our U.S. VMS business; and
A $3.4 million impairment charge recorded on the held-for-sale assets associated with our Animal Health pet treats plant; offset partially by
Decreased administrative expenses of $4.3 million due to cost containment.
NineSix Month Comparison
| | | | Nine Months Ended | Six Months Ended |
| ($ in millions) | September 26,
2015 | | October 1,
2016 | July 2,
2016 | | July 1,
2017 |
| Net sales | $ | 2,106.4 |
| | $ | 2,055.6 |
| $ | 1,269.0 |
| | $ | 1,187.6 |
|
| Gross profit | $ | 701.1 |
| | $ | 660.8 |
| $ | 415.9 |
| | $ | 392.1 |
|
| Gross profit % | 33.3 | % | | 32.1 | % | 32.8 | % | | 33.0 | % |
| Operating income | $ | 364.8 |
| | $ | 313.6 |
| $ | 217.4 |
| | $ | 179.2 |
|
| Operating income % | 17.3 | % | | 15.3 | % | 17.1 | % | | 15.1 | % |
NineSix Months Ended OctoberJuly 1, 20162017 vs. NineSix Months Ended September 26, 2015July 2, 2016
Net sales decreased $50.8$81.4 million, or 2%6%, over the prior year period due to:
A net $94.4 million decrease in existing product sales as a result of:
Strong sales in our infant nutrition and smoking cessation categories; more than offset by
A milder cold and flu season in the first and second quarters of 2016, which led to weaker sales in the cough/cold and analgesics categories;
Pricing pressure, which particularly impacted sales in the cough/cold, analgesics, and animal health categories;
Lower sales in the antacids category; and
Timing of promotions in the second and third quarters of 2015 and a milder allergy season in the third quarter of 2016, which impacted current year sales in the cough/cold category; and | |
| • | The absence of $89.2 million in sales attributable to the U.S. VMS business (refer to Item 1. Note 2); |
Discontinued products of $55.0 million related primarily to a label refresh within the infant formula category;
Lower year-over-year sales of $7.9 million attributable to the U.S. VMS business, which was sold in August 2016; and$8.2 million;
Unfavorable foreign currency movement of $19.6$2.5 million;
A net decrease in sales of existing products of $19.4 million due to:
Higher sales in the OTC contract category driven by new analgesic contracts; more than offset by
Lower sales in our infant nutrition category due to supply constraints;
Pricing pressures and lower volumes in the analgesics and gastrointestinal categories; and
Decreased sales in our Animal Health category driven by increased competition on certain products; offset partially by
| |
| • | New product sales of $96.3$37.8 million related primarily to the launches of fluticasone nasal spray (store brand equivalent to Flonase®), the guaifenesin family of products (store brand equivalent to Mucinex®), several new infant formula and food products, and new animal health products; and |
| |
• | Incremental net sales of $29.8 million due primarily to the Gelcaps Exportadora de Mexico, S.A. de C.V. ("Gelcaps") and the ScarAway® acquisitions.smoking cessation products.
|
Perrigo Company plc - Item 2
CHCCHCA
Operating income decreased $51.2$38.2 million, or 14%18%, as a result of:
A decrease of $40.3$23.8 million in gross profit due to:
| |
| • | The absence of $15.0 million in gross profit as a result of the sale of the U.S. VMS business (refer to Item 1. Note 2); and |
Pricing pressureSales of higher margin products in th previous year and pricing pressures as noted above; andoffset partially by
Positive contributions from supply chain manufacturing efficiencies.
An increase of $14.4 million in operating expenses due to:
| |
| • | Increased intangible asset amortization expense associatedrestructuring expenses of $26.2 million related primarily with the Gelcapsto cost reduction initiatives (refer to Item 1. Note 15); and ScarAway® acquisitions; offset partially by |
Margin contributions from new products and strong performance in the infant nutrition and smoking cessation categories; and
Continued manufacturing and supply chain efficiencies.
An increase of $10.9 million in operating expenses due to:
A $6.2 million impairment charge related to the sale of the U.S. VMS business;
A $3.4$4.1 million impairment charge recorded on the held-for-sale assets associated withidle property, plant and equipment; offset partially by
| |
| • | The absence of a $6.2 million impairment charge related to the U.S. VMS business (refer to Item 1. Note 2); |
Decreased selling expenses of $6.8 million due primarily to timing of promotions related to our Animal Health Pet treats plant;category; and
Increased restructuringDecreased Research and Development ("R&D") expenses of $5.0$3.1 million related primarily to the sale of the U.S. VMS business; and
Increased research and development investments due to timing of clinical trials; offset partially bytrials.
Decreased administrative expenses
Operating income as a percentage of net sales was 2.0% lower due primarily to cost containment.the once-off costs of the restructuring actions that we took as a result of our previously announced strategic initiatives.
BRANDED CONSUMER HEALTHCARE INTERNATIONAL
Recent Trends and Developments
Our expectations forAs part of our strategic initiatives, management continues to drive improvements and evaluate the BCHoverall cost structures within our CHCI segment continue to be impacted by market dynamics in key countries such as Belgium, France, Germany and Italy. Factors impacting these countries include softnessthe following ways:
On December 8, 2016, we announced the cancellation of the unprofitable EuroGenerics NV distribution agreement in certain leading brand categories primarily due to lower sell-through duringBelgium. The cancellation, combined with the current year due to the re-staging launch timingexit of certain products, changesOTC distribution agreements, is expected to reduce net sales by approximately $220.0 million in timing of certain advertising and promotional campaigns compared to the prior year, and macro-economic factors, including unfavorable foreign currency impacts experienced primarily in the UK related to Brexit. The BCH segment has established a brand prioritization strategy to address these market dynamics, with an objective to balance the cost of advertising and promotion investments with expected contributions from category sales. The segment has further impacted in Belgium by a change in the forecasts with a major wholesaler, as management implements improved supply chain efficiencies in this market.2017.
Our expectations for 2016 new product sales are consistent with those communicated in our Form 10-Q for the three months ended April 2, 2016, but continue to remain lower than anticipated as of December 31, 2015. Several new product launches have been delayed due to modifications to market share penetration and timing assumptions for new products in Europe.
We continue to make progress on our previously announced restructuring plans to right-size the BCHOmega business due to the impact of market dynamics on sales volumes. In addition, we made several strategic leadership changes during the three months ended October 1, 2016, including new leaders for Belgium, France and Germany. Management continues to evaluate the overall cost structure relative to current and expected market dynamics. During the six months ended July 1, 2017, we recognized $9.5 million of restructuring expense in the CHCI segment.
Management continues to evaluate the most effective business model for each country, aligning our sales infrastructure and has announced strategic evaluations for Russia, South Africa,actively integrating sales strategies with promotional programs.
| |
| • | During the three months ended July 1, 2017, management committed to a plan to sell our Russian business. As a result, the related assets and liabilities are classified as held-for-sale (refer to Item 1. Note 9). |
The combination of these actions is expected to improve the segment's focus on higher value OTC products, reduce selling costs and Argentina.improve operating margins in the segment.
Perrigo Company plc - Item 2
BCHCHCI
Segment Results
Three Month Comparison
| | | | Three Months Ended | Three Months Ended |
| ($ in millions) | September 26,
2015 | | October 1,
2016 | July 2,
2016 | | July 1,
2017 |
| Net sales | $ | 302.2 |
| | $ | 304.0 |
| $ | 415.9 |
| | $ | 376.5 |
|
| Gross profit | $ | 164.3 |
| | $ | 131.6 |
| $ | 187.6 |
| | $ | 174.0 |
|
| Gross profit % | 54.4 | % | | 43.3 | % | 45.1% | | 46.2 | % |
| Operating income (loss) | $ | 4.4 |
| | $ | (1,684.3 | ) | |
| Operating income (loss) % | 1.4 | % | | (554.1 | )% | |
| Operating income | | $ | 0.6 |
| | $ | 3.9 |
|
| Operating income % | | 0.1 | % | | 1.0 | % |
Three Months Ended OctoberJuly 1, 20162017 vs. Three Months Ended September 26, 2015July 2, 2016
Net sales increased $1.8decreased $39.4 million, or 1%9%, over the prior year period due primarily to:
New productThe absence of $38.6 million in sales attributable to the cancellation of $25.8 million; andunprofitable distribution contracts;
Incremental net sales of $17.5 million from the Naturwohl Pharma GmbH ("Naturwohl") and GlaxoSmithKlineConsumer Healthcare Product Portfolio ("GSK Products") acquisitions; offset by
| |
• | Decreased sales volumes of existing products totaling $32.1 million due primarily to weaker current year sales in the lifestyle category attributable in large part to a product launch in the prior year period and the natural health/vitamins category due primarily to timing of promotional activities and the planned divestment of the Etixx® brand;
|
Unfavorable foreign currency movement of $5.5$16.3 million; and
Discontinued products of $4.1 million.$5.3 million; offset partially by
New product sales of $19.3 million and increased sales primarily in the cough/cold, allergy and analgesics categories.
Operating income decreased $1.7 billion,increased $3.3 million, as a result of:
A decrease of $32.7$13.6 million in gross profit due to:
Decreased sales of existing products in the higher-margin lifestyle and natural health/vitamins categories as noted above;
Weaker performance in Belgium;
Higher inventory obsolescence realized primarily from prior year product levels; andto:
Unfavorable foreign currency effect; offset partially bymovement;
Decreased sales due to the exit of certain unprofitable distribution contracts; and
Lower margins in our U.K. store brand business.
An increaseA decrease of $1.7 billion$16.9 million in operating expenses due primarily to intangible asset and goodwill impairment charges totaling $1.7 billion, as described above under "Interim Impairment Testing"; andto:
A decrease of advertising$21.4 million in selling and promotional spendingadministrative expenses due to previously announced strategic initiatives to better align promotional investments with sales.sales and cost reduction initiatives taken in the current year; offset partially by
Increased restructuring charges totaling $1.8 million related to strategic organizational enhancements; and
| |
| • | A $3.7 million impairment charge recorded related to the Russian business (refer to Item 1. Note 9). |
Gross profit as a percentage of net sales was 1.1% higher due primarily to the exit of certain unprofitable distribution contracts, as described above, and the insource production of branded OTC products; offset by lower margins in our United Kingdom store brand business.
Nine Month Comparison*
* The BCH segmentOperating income as a percentage of net sales was created on March 30, 20150.9% higher due primarily to the exit of certain unprofitable distribution contracts and lower operating costs as a result of the Omega acquisition, thus comparative prior year data for the nine months ended September 26, 2015 includes only six months of results from operations.our previously announced strategic initiatives to better align promotional investments with sales and improve operating efficiencies.
Perrigo Company plc - Item 2
BCHCHCI
Six Month Comparison
| | | | Nine Months Ended | Six Months Ended |
| ($ in millions) | September 26, 2015* | | October 1,
2016 | July 2,
2016 | | July 1,
2017 |
| Net sales | $ | 703.4 |
| | $ | 1,015.3 |
| $ | 855.3 |
| | $ | 751.5 |
|
| Gross profit | $ | 354.5 |
| | $ | 461.2 |
| $ | 386.9 |
| | $ | 343.5 |
|
| Gross profit % | 50.4 | % | | 45.4 | % | 45.2 | % | | 45.7 | % |
| Operating income (loss) | $ | 31.0 |
| | $ | (2,128.7 | ) | $ | (395.8 | ) | | $ | 4.2 |
|
| Operating income (loss) % | 4.4 | % | | (209.7 | )% | (46.3 | )% | | 0.6 | % |
NineSix Months Ended OctoberJuly 1, 20162017 vs. NineSix Months Ended September 26, 2015July 2, 2016
Net sales increased $311.9decreased $103.8 million, or 44%12%, over the prior year period due primarily to:
An additional three monthsThe absence of results from operations$96.4 million in sales attributable to Omega;the cancellation of unprofitable distribution contracts;
New products totaling $85.3Unfavorable foreign currency movement of $36.7 million; and
Sales from the Naturwohl and GSK Products acquisitions totaling $84.2Discontinued products of $7.3 million; offset partially by
New product sales of $38.8 million and increased sales primarily in the cough/cold, allergy and lifestyle categories.
Operating income increased $400.0 million due to:
A decrease of $43.4 million in gross profit due primarily to:
Unfavorable foreign currency movement; and
Decreased sales due to the exit of certain unprofitable distribution contracts.
A decrease of $443.4 million in operating expenses due primarily to:
| |
| • | Decreased sales volumesA $3.7 million impairment charge recorded related to the Russian business (refer to Item 1. Note 9); more than offset by |
| |
| • | The absence of existing products due primarily to weaker current year sales in the lifestyle category due in part to a product launchintangible asset and goodwill impairment charges totaling $403.9 million recorded in the prior year period and the natural health/vitamins category due primarily(refer to timing of promotional activitiesItem 1. Note 3); and the planned divestment of the Etixx® brand; |
Unfavorable foreign currency movementA decrease in selling and administrative expenses of $5.0$43.9 million; and
Discontinued products of $5.6 million.
Operating income decreased $2.2 billion due to:
A $106.7 million increase in gross profit due to an additional three months of operations attributablepreviously announced strategic initiatives to Omega; more than offset by
Decreasedbetter align promotional investments with sales of existing productsand cost reduction initiatives taken in the higher-margin lifestyle and natural health/vitamins categories noted above,
Weaker performance in Belgium,
Higher inventory obsolescence realized primarily from a prior year product levels, and
Unfavorable foreign currency effect; more than offset by
An increase of $2.3 billion in operating expenses due primarily to:
Intangible asset and goodwill impairment charges totaling $2.1 billion, as described above under "Interim Impairment Testing";
An additional three months of operations; and
Restructuring charges totaling $8.3 million related to strategic organizational enhancements; offset partially by
Cost control measures employed to mitigate lower forecasted sales and operating income.
Perrigo Company plc - Item 2
Rx
current year.
PRESCRIPTION PHARMACEUTICALS
Recent Trends and Developments
We continue to experience a significant reduction in pricing expectations from historical levels in our RxRX segment due to industry and competitive pressures in the sector.pressures. This softness in pricing is attributedattributable to various factors, including increased focus from customers to capture supply chain productivity savings, low raw material commodity pricing, competition in specific products, and consolidation of certain customers. We expect this softness to continue to impact the segment for the foreseeable future.future, and we are forecasting a 9% to 11% pricing decline in this segment for the year ending December 31, 2017.
On November 10, 2016, we announced that as part of our portfolio review process we are conducting a comprehensive internal evaluation of the RX segment's market position, growth opportunities, and interdependencies with our manufacturing and shared service operations to determine if strategic alternatives should be explored.
Perrigo Company plc - Item 2
RX
| |
| • | On January 22,During the three months ended December 31, 2016, we acquired a portfolio of generic dosage forms and strengths of Retin-Athe U.S. market for Entocort® (tretinoin), a topical prescription acne treatment, from Matawan Pharmaceuticals, LLC,(Budesonide) capsules, including both brand and authorized generic capsules, experienced significant and unexpected increased competition, which reduced our future revenue stream. We expect our net sales in the RX segment for $416.4 million in cash ("Tretinoin Products").the year ending December 31, 2017 will be negatively impacted by approximately $72.0 million.
|
On MarchDuring the six months ended July 1, 2016,2017, we completed the acquisition of two development-stage specialty Rx products to further invest in our specialty Rx portfolio.sold various Abbreviated New Drug Applications ("ANDAs") for $18.7 million.
| |
• | On August 22, 2016, we purchased the remaining 60.9% ownership right to a generic BenzaclinTM product ("Generic BenzaclinTM"), which we developed and marketed in collaboration with Barr Laboratories. As a result of this transaction, we are now entitled to 100% of income from sales of the product.
|
Segment Results
Three Month Comparison
| | | | Three Months Ended | Three Months Ended |
| ($ in millions) | September 26, 2015 | | October 1,
2016 | July 2,
2016 | | July 1,
2017 |
| Net sales | $ | 260.3 |
| | $ | 267.4 |
| $ | 276.9 |
| | $ | 240.4 |
|
| Gross profit | $ | 130.4 |
| | $ | 128.1 |
| $ | 131.4 |
| | $ | 119.1 |
|
| Gross profit % | 50.1 | % | | 47.9 | % | 47.5 | % | | 49.6 | % |
| Operating income | $ | 91.0 |
| | $ | 77.9 |
| $ | 92.6 |
| | $ | 69.3 |
|
| Operating income % | 34.9 | % | | 29.1 | % | 33.5 | % | | 28.8 | % |
Three Months Ended OctoberJuly 1, 20162017 vs. Three Months Ended September 26, 2015July 2, 2016
Net sales increased $7.1decreased $36.5 million, or 3%13%, due to:
| |
| • | Sales attributableLower Entocort® sales of $26.4 million;
|
Decreased sales of other existing products of $14.1 million due primarily to pricing pressure across the portfolio; and
Discontinued products of $1.9 million; offset partially by
Increased sales volume of certain products; and
New product sales of $5.9 million due primarily to Testosterone 2% topical.
Segment operating income decreased $23.3 million, or 25%, as a result of:
A decrease of $12.3 million in gross profit due primarily to:
| |
| • | Lower Entocort® sales as noted above; and |
Pricing pressure as discussed above.
An increase of $11.0 million in operating expenses due primarily to:
| |
| • | A $18.5 million impairment charge on certain definite-lived intangible assets (refer to Item 1. Note 3); offset partially by |
Decreased selling expenses of $5.1 million due primarily to the absence of the specialty pharmaceuticals sale force restructuring initiative; and
Decreased R&D expenses of $3.9 million due to timing of clinical trials.
| |
| • | Gross profit as a percentage of net sales was 2.1% higher due primarily to improved product mix and reduced floor stock adjustments; offset by lower sales of Entocort® and Tretinoin Products acquisitions totaling $32.2 million; andpricing pressures. |
| |
| • | Operating income as a percentage of net sales was 4.7% lower due primarily to lower sales of Entocort® and a current year definite-lived intangible asset impairment charge (refer to Item 1. Note 3). |
Perrigo Company plc - Item 2
RX
Six Month Comparison
|
| | | | | | | |
| | Six Months Ended |
| ($ in millions) | July 2,
2016 | | July 1,
2017 |
| Net sales | $ | 525.0 |
| | $ | 457.8 |
|
| Gross profit | $ | 259.3 |
| | $ | 215.4 |
|
| Gross profit % | 49.4 | % | | 47.0 | % |
| Operating income | $ | 184.0 |
| | $ | 157.5 |
|
| Operating income % | 35.0 | % | | 34.4 | % |
Six Months Ended July 1, 2017 vs. Six Months Ended July 2, 2016
Net sales decreased $67.2 million, or 13%, due to:
| |
| • | Lower Entocort® sales of $51.6 million; |
Decreased sales of existing products of $36.1 million due to decreased sales volume of certain products and pricing pressure across the portfolio; and
Discontinued products of $1.9 million; offset partially by
New product sales of $18.3$22.4 million due primarily to sales of benzoyl peroxide 5%-clindamycin 1% gel (a generic version of Benzaclin™); offset partially by
Decreased sales of existing products of $40.7 million due to lower sales volume of certain products, pricing pressure across the portfolio, and the lack of exclusive market position for two key products versus the prior year; and
Unfavorable foreign exchange movement of $2.8 million.Testosterone 2% topical.
Segment operatingOperating income decreased $13.1$26.5 million, or 14%, as a result of:
A decrease of $43.9 million in gross profit due primarily to:
| |
| • | Lower Entocort® sales as noted above; |
Pricing pressure as discussed above; and
Decreased R&D expenses due to timing of clinical trials.
A decrease of $17.4 million in operating expenses due to:
Gain on sales of certain ANDAs of $23.0 million;
| |
| • | A decrease of $2.3$15.6 million in gross profit due primarilygain related to the pricing pressure noted above as well as higher amortization expense from the Entocortcontingent consideration (refer to Item 1. Note 6® and Tretinoin Products acquisitions, offset largely by an increase); |
Perrigo Company plc - Item 2
Rx
in gross profit attributable to product acquisitions, new product sales, and increased manufacturing productivity.
An increaseDecreased selling expenses of $10.8$8.5 million in operating expenses due primarily to increased researchthe prior year specialty pharmaceuticals sales force restructuring initiative; and development investments
Decreased R&D expenses of $5.7$6.8 million as a result of thedue to timing of clinical trials and a $4.9trials; offset partially by
| |
| • | Impairment charges related to certain definite-lived intangible assets and In-Process Research and Development ("IPR&D") of $30.7 million (refer to Item 1. Note 3); and |
Increased restructuring expenses of $5.8 million fair value adjustment on contingent consideration related to the two development-stage specialty Rx products that we acquired on March 1, 2016.
Nine Month Comparison
|
| | | | | | | |
| | Nine Months Ended |
| ($ in millions) | September 26,
2015 | | October 1,
2016 |
| Net sales | $ | 790.1 |
| | $ | 817.4 |
|
| Gross profit | $ | 433.4 |
| | $ | 394.7 |
|
| Gross profit % | 54.8 | % | | 48.3 | % |
| Operating income | $ | 290.4 |
| | $ | 262.1 |
|
| Operating income % | 36.7 | % | | 32.1 | % |
Nine Months Ended October 1, 2016 vs. Nine Months Ended September 26, 2015
Netpharmaceuticals sales increased $27.3 million, or 3%, due to:force.
| |
| • | NetGross profit as a percentage of net sales attributablewas 2.4% lower due primarily to thelower sales of Entocort® and Tretinoin Products acquisitions totaling $121.5 million; andas discussed above.
|
New product sales of $55.1 million due primarily to sales of benzoyl peroxide 5%-clindamycin 1% gel (a generic version of Benzaclin™); offset partially by
Decreased sales of existing products of $140.9 million due to declined sales volume of certain products, pricing pressure across the portfolio, and the lack of exclusive market position for two key products versus the prior year;
Discontinued products of $3.6 million; and
Unfavorable foreign exchange movement of $4.8 million.
Segment operating income decreased $28.3 million, or 10%, as a result of:
| |
• | A decrease of $38.7 million in gross profit due primarily to the pricing pressure noted above, as well as higher amortization expense from the Entocort® and Tretinoin Products acquisitions; offset partially by
|
A decrease of $10.4 million in operating expenses due primarily to:
The absence of an $18.0 million research and development payment made in connection with a research and development contractual arrangement in the prior year; offset by
Increased selling and administration expenses of $4.1 million; and
Increased research and development investments of $3.2 million due to timing of clinical trials.
Perrigo Company plc - Item 2
Specialty SciencesOther
SPECIALTY SCIENCES
Recent Trends and Developments
| |
• | In February 2016, a competitor's pipeline product, Ocrevus®, received breakthrough therapy designation from the FDA and could potentially be approved in 2016. The product would compete with Tysabri® and could have a significant negative impact on the royalty we receive from Biogen Idec, Inc. ("Biogen") and the performance of the Specialty Sciences segment. We continue to monitor the progress of all potential competing products.
|
| |
• | On November 10, 2016, we announced that we are exploring strategic alternatives for our Tysabri® asset, which is reported in our Specialty Sciences segment.
|
Segment Results
Three Month Comparison
|
| | | | | | | |
| | Three Months Ended |
| ($ in millions) | September 26, 2015 | | October 1,
2016 |
| Net sales | $ | 84.5 |
| | $ | 93.4 |
|
| Gross profit | $ | 12.0 |
| | $ | 20.6 |
|
| Gross profit % | 14.2 | % | | 22.1 | % |
| Operating income | $ | 9.0 |
| | $ | 23.3 |
|
| Operating income % | 10.7 | % | | 25.0 | % |
Three Months Ended October 1, 2016 vs. Three Months Ended September 26, 2015
Net sales increased $8.9 million due to an increase in royalties received from Biogen's sales of Tysabri®, inclusive of a one-time favorable adjustment Biogen made to their discounts and allowances. Based on the current royalty percentage that we receive, the effect of this benefit was approximately $3.6 million. Operating income increased $14.3 million due to the increased royalties as well a $5.7 million reduction in operating expenses due to lower legal costs in the current year.
|
| | | | | | | |
| | Nine Months Ended |
| ($ in millions) | September 26,
2015 | | October 1,
2016 |
| Net sales | $ | 250.1 |
| | $ | 271.3 |
|
| Gross profit | $ | 32.5 |
| | $ | 53.0 |
|
| Gross profit % | 13.0 | % | | 19.5 | % |
| Operating income | $ | 21.0 |
| | $ | 49.7 |
|
| Operating income % | 8.4 | % | | 18.3 | % |
Perrigo Company plc - Item 2
Specialty Sciences
Nine Months Ended October 1, 2016 vs. Nine Months Ended September 26, 2015
Net sales increased $21.2 million due to an increase in royalties received from Biogen's sales of Tysabri®, inclusive of a one-time favorable adjustment Biogen made to their discounts and allowances. Based on the current royalty percentage that we receive, the effect of this benefit was approximately $3.6 million in the three months ended October 1, 2016. This increase was offset partially by $1.4 million of unfavorable foreign currency movement. Operating income increased $28.7 million due to the increased royalties as well a $8.2 million reduction in operating expenses due primarily to lower legal costs in the current year.
OTHER
Recent Trends and Developments
We are pursuingOn August 4, 2017, we signed a definitive agreement for the sale of our Israel API business basedto SK Capital for $110.0 million in India andcash, inclusive of a working capital adjustment. We expect to finalize the sale to take place inwithin the next 12 months. six months, and the sale is not expected to have a material impact on our operations.
On
October 1, 2016,April 6, 2017, we completed the
net assetssale of our India API business to Strides Shasun Limited. We received $22.2 million of proceeds inclusive of an estimated working capital adjustment. Prior to closing the sale, we determined that the carrying value of the India API business
were classified as "heldexceeded its fair value less the cost to sell, resulting in an impairment charge of $35.3 million, which was recorded in Impairment charges on the Consolidated Statements of Operations for
sale" as discussed in Item 1. Note 9.the year ended December 31, 2016.
Segment Results
Three Month Comparison
| | | | Three Months Ended | Three Months Ended |
| ($ in millions) | September 26, 2015 | | October 1,
2016 | July 2,
2016 | | July 1,
2017 |
| Net sales | $ | 22.5 |
| | $ | 21.0 |
| $ | 17.8 |
| | $ | 16.1 |
|
| Gross profit | $ | 11.1 |
| | $ | 9.3 |
| $ | 7.5 |
| | $ | 8.5 |
|
| Gross profit % | 49.5 | % | | 44.5 | % | 42.4 | % | | 52.6 | % |
| Operating income (loss) | $ | 6.2 |
| | $ | (1.6 | ) | |
| Operating income (loss) % | 27.5 | % | | (7.4 | )% | |
| Operating income | | $ | (1.3 | ) | | $ | 4.1 |
|
| Operating income % | | (7.1 | )% | | 25.1 | % |
Three Months Ended OctoberJuly 1, 20162017 vs. Three Months Ended September 26, 2015July 2, 2016
Net sales decreased $1.5$1.7 million due primarily to increased competition on certain products,products. Operating income increased $5.4 million due to a $1.0 million increase in particular, U.S. salesgross profit driven by favorable product mix and a decrease of Temozolomide. The$4.4 million in operating loss in the current year period was dueexpenses, related primarily to the absence of a $6.5$4.3 million impairment charge recorded on the India API held-for-sale business offset partially by reduced operating expenses.in the prior year.
NineSix Month Comparison
|
| | | | | | | |
| | Six Months Ended |
| ($ in millions) | July 2,
2016 | | July 1,
2017 |
| Net sales | $ | 38.5 |
| | $ | 35.0 |
|
| Gross profit | $ | 17.5 |
| | $ | 18.7 |
|
| Gross profit % | 45.3 | % | | 53.4 | % |
| Operating income | $ | 4.2 |
| | $ | 9.7 |
|
| Operating income % | 10.8 | % | | 27.8 | % |
Perrigo Company plc - Item 2
Other
|
| | | | | | | |
| | Nine Months Ended |
| ($ in millions) | September 26,
2015 | | October 1,
2016 |
| Net sales | $ | 75.4 |
| | $ | 59.5 |
|
| Gross profit | $ | 34.2 |
| | $ | 26.8 |
|
| Gross profit % | 45.4 | % | | 45.0 | % |
| Operating income | $ | 18.6 |
| | $ | 2.6 |
|
| Operating income % | 24.6 | % | | 4.4 | % |
NineSix Months Ended OctoberJuly 1, 20162017 vs. NineSix Months Ended September 26, 2015July 2, 2016
Net sales decreased $15.9$3.5 million due primarily to competition on certain products, in particular, U.S. sales of Temozolomide.products. Operating income decreased $16.0increased $5.5 million due primarily to a $7.4$1.2 million increase in gross profit driven by favorable product mix and a $4.3 million decrease in gross profit dueoperating expenses, related primarily to increased competition andthe absence of a $10.8$4.3 million impairment charge recorded on the India API held-for-sale business offset partially by a reduction in operating expenses.the prior year.
Unallocated Expenses
Unallocated expenses are comprised of certain corporate expensesservices not allocated to theour reporting segments and are recorded in operating income.above Operating income on the Condensed Consolidated Statements of Operations. Unallocated expenses were $30.5as follows (in millions):
|
| | | | | | | | | | | | | | |
| Three Months Ended | | Six Months Ended |
July 2,
2016 | | July 1,
2017 | | July 2,
2016 | | July 1,
2017 |
| $ | 20.1 |
| | $ | 31.9 |
| | $ | 51.4 |
| | $ | 72.5 |
|
The increase of $11.8 million forin unallocated expenses during the three months ended OctoberJuly 1, 2016,2017 compared to $39.3the prior year period was due primarily to an increase in share-based compensation expense of $13.6 million driven primarily by the resignation of certain executives, which had a favorable impact on prior year period.
The increase of $21.1 million in unallocated expenses during the six months ended July 1, 2017 compared to the prior year period was due to an increase of $11.3 million of administrative expenses driven by legal and other professional fees, $5.8 million of restructuring expenses related to ourcost reduction initiatives, and an increase of $4.1 million in share-based compensation driven primarily by the resignation of certain executives. Effective January 1, 2017, due to the sale of the Tysabri® financial asset, all legal expenses associated with the former Specialty Sciences segment were moved to unallocated expenses.
Interest, Other and Change in financial assets (Consolidated)
|
| | | | | | | | | | | | | | | |
| | Three Months Ended | | Six Months Ended |
| ($ in millions) | July 2,
2016 | | July 1,
2017 | | July 2,
2016 | | July 1,
2017 |
| Change in financial assets | $ | 910.8 |
| | $ | 38.7 |
| | $ | 1,115.3 |
| | $ | 21.6 |
|
| Interest expense, net | $ | 57.4 |
| | $ | 45.1 |
| | $ | 108.6 |
| | $ | 98.4 |
|
| Other expense, net | $ | 28.8 |
| | $ | 6.1 |
| | $ | 31.3 |
| | $ | 2.5 |
|
| Loss on extinguishment of debt | $ | — |
| | $ | 135.2 |
| | $ | 0.4 |
| | $ | 135.2 |
|
Change in Financial Assets
On December 18, 2013, we acquired Elan, which had a royalty agreement with Biogen Idec Inc. ("Biogen"), whereby Biogen conveyed the right to receive royalties that are typically payable on sales revenue generated by the sale, distribution or other use of the drug Tysabri®. Pursuant to the royalty agreement, we were entitled to royalty payments from Biogen based on its Tysabri® sales in all indications and geographies. We received royalties of 12% on worldwide Biogen sales of Tysabri® from December 18, 2013 through April 30, 2014. From May 1, 2014, we received royalties of 18% on annual worldwide Biogen sales of Tysabri® up to $2.0 billion and 25% on annual sales above $2.0 billion.
We accounted for the Tysabri® royalty stream as a financial asset and elected to use the fair value option model. We made the election to account for the Tysabri® financial asset using the fair value option as we believed this method was most appropriate for an asset that did not have a par value, a stated interest stream, or a termination date. The financial asset acquired represented a single unit of accounting. The fair value of the financial asset acquired was determined by using a discounted cash flow analysis related to the expected probability
Perrigo Company plc - Item 2
Unallocated, Interest, Other, and Taxes
weighted future cash flows to be generated by the royalty stream. The financial asset was classified as a Level 3 asset within the fair value hierarchy, as our valuation utilized significant unobservable inputs, including industry analyst estimates for global Tysabri® sales, probability weighted as to the timing and amount of future cash flows along with certain discount rate assumptions. Cash flow forecasts included the estimated effect and timing of future competition, considering patents in effect for Tysabri® through 2024 and contractual rights to receive cash flows into perpetuity. The discounted cash flows were based upon the expected royalty stream forecasted into perpetuity using a 20-year discrete period with a declining rate terminal value.
In the first quarter of 2016, a competitor's pipeline product, Ocrevus®, received breakthrough therapy designation from the U.S. Food and Drug Administration ("FDA"). Breakthrough therapy designation is granted when a drug is intended alone or in combination with one or more other drugs to treat a serious or life threatening disease or condition and preliminary clinical evidence indicates that the drug may demonstrate substantial improvement over existing therapies on one or more clinically significant endpoints, such as substantial treatment effects observed early in clinical development. In June 2016, the FDA granted priority review with a target action date in December 2016. A priority review is a designation when the FDA will direct overall attention and resources to the evaluation of applications for drugs that, if approved, would be significant improvements in the safety or effectiveness of the treatment, diagnosis, or prevention of serious conditions when compared to standard applications. The product was approved late in the first quarter of 2017. The product is expected to compete with Tysabri®, and we expected it to have a significant negative impact on the Tysabri® royalty stream. Industry analysts believe that, based on released clinical study information, Ocrevus® will compete favorably against Tysabri® in the relapsing, remitting multiple sclerosis market segment due to its high efficacy and convenient dosage form.
Given the new market information for Ocrevus®, we used industry analyst estimates to reduce our first ten year growth forecasts from an average of growth of approximately 3.4% in the fourth calendar quarter of 2015 to an average decline of approximately minus 2.0% in the third and fourth calendar quarters of 2016. In November 2016, we announced we were evaluating strategic alternatives for the Tysabri® asset. As of December 31, 2016, the financial asset was adjusted based on the strategic review and sale process. These effects, combined with the change in discount rate each quarter, led to a reduction in fair value of $204.4 million, $910.8 million, $377.4 million and $1.1 billion in the first, second, third and fourth quarters of 2016, respectively.
On March 27, 2017, we announced the completed divestment of our Tysabri® royalty stream to Royalty Pharma for up to $2.85 billion, which consists of $2.2 billion in cash and up to $250.0 million and $400.0 million in milestone payments if the royalties on global net sales of Tysabri® that are received by Royalty Pharma meet specific thresholds in 2018 and 2020, respectively. As a result of this transaction, we transferred the entire financial asset to Royalty Pharma and recorded a $17.1 million gain during the three months ended September 26, 2015,July 1, 2017. We elected to account for the contingent milestone payments using the fair value option method, and these were recorded at an estimated fair value of $145.8 million as of July 1, 2017. We chose the fair value option as we believe it will help investors understand the potential future cash flows we may receive associated with the two contingent milestones.
We valued the contingent milestone payments using a modified Black-Scholes Option Pricing Model ("BSOPM"). Key inputs in the BSOPM are the estimated volatility and rate of return of royalties on global net sales of Tysabri® that are received by Royalty Pharma over time until payment of the contingent milestone payments is completed. Volatility and the estimated fair value of the milestones have a positive relationship such that higher volatility translates to a higher estimated fair value of the contingent milestone payments. We assumed volatility of 30.0% and a rate of return of 8.05% in the valuation of contingent milestone payments performed as of July 1, 2017. We assess volatility and rate of return inputs quarterly by analyzing certain market volatility benchmarks and the risk associated with Royalty Pharma achieving the underlying projected royalties. During the three months ended July 1, 2017, the fair value of the Royalty Pharma contingent milestone payments decreased $39.2 million as a result of a decrease of $8.8 million. The reduction in unallocated expenses was due primarily to fees of $15.6 million related to our defense against the hostile takeover bid by Mylan N.V. ("Mylan") incurred in the prior-year period, offset partially by a $7.4 million increase in legal and professional feesestimated projected Tysabri® revenues due to the launch of Ocrevus® late in the current period.
Unallocated expenses were $79.9 million for the nine months ended October 1, 2016 comparedfirst quarter of 2017 (refer to $111.1 million for the prior year period, a decrease of $31.2 million. The reduction in unallocated expense was due primarily to $18.1 million of Omega acquisition-related fees and $29.0 million of legal and professional fees related to our defense against the hostile takeover bid by Mylan, both of which were incurred only in the prior-year period. We also experienced a $14.9 million reduction in share-based compensation in the current year period due primarily to the resignation of Joseph C. Papa. These decreases were offset partially by a $20.2 million increase in legal and professional fees in the current period.
Interest Expense, Net
Interest expense, net was $54.6 million for the three months ended October 1, 2016, compared to $43.4 million for the prior year period. The $11.2 million increase was due to interest incurred in the current year on the $1.2 billion senior notes issued on March 7, 2016.
Interest expense, net was $163.2$45.1 million and $98.4 millionduring the three and six months ended July 1, 2017, respectively, compared to $57.4 million and $108.6 million for the ninethree and six months ended October 1,July 2, 2016, compared to $132.7respectively. The $12.3 million forand $10.2 million decreases were the prior year period. The $30.5 million increase was due to interest incurred onresult of the early debt assumed in the Omega acquisition, borrowings on our revolving credit agreements repayments made
Perrigo Company plc - Item 2
Unallocated, Interest, Other, and Taxes
Other (Income) Expense, Net
Other expense, net was $1.0$6.1 million for the three months ended OctoberJuly 1, 2016,2017, compared to $13.0$28.8 million infor the prior year period.three months ended July 2, 2016. The $12.0$22.7 million decrease in expense was due primarily to the absence of a $4.2$22.3 million
Perrigo Company plc - Item 2
Unallocated, Interest, Other, and Taxes
loss on equity methods investments and a $4.8 million loss associated with an acquisition-related derivative recorded in the prior year. Seeinvestment impairment (refer to Item 1. NotesNote 7), $1.6 million of favorable changes in cash balances held in foreign currencies, and 8, for more information on the derivative losses anda $1.8 million reduction in equity method investment losses, respectively.partially offset by a $5.9 million loss related to the pre-issuance hedge reclassification (refer to Item 1. Note 8).
Other expense, net was $34.1$2.5 million during the six months ended July 1, 2017, compared to $31.3 million for the ninesix months ended October 1, 2016, compared to $294.2July 2, 2016. The $28.8 million decrease in the prior year period. The $260.1 million decreaseexpense was due primarily to the absence of the $259.8a $22.3 million equity investment impairment (refer to Item 1. Note 7), $4.2 million of favorable changes in cash balances held in foreign currencies, and a $4.1 million reduction in equity method losses, partially offset by a $5.9 million loss incurred in the prior year period on the derivatives we used to economically hedge fluctuations in the euro-denominated purchase price of the Omega and GSK Products acquisitions. The losses on the derivatives duerelated to the changes inpre-issuance hedge reclassification (refer to Item 1. Note 8).
Loss on Extinguishment of Debt
During the EUR/USD exchange rate priorsix months ended July 1, 2017, we recorded a $135.2 million loss on extinguishment of debt, which consisted of tender premium on debt repayments, transaction costs, write-off of deferred financing fees, and bond discounts related to their settlement economically offset the final settlement of the euro-denominated Omega purchase price paid on$500.0 million 3.500% senior notes due December 2021, $500.0 million 3.500% senior notes due March 30, 2015.2021, $400.0 million 4.900% senior notes due 2044, $800.0 million 4.000% senior notes due 2023, and $400.0 million 5.300% senior notes due 2043 (refer to Item 1. Note 10).
Income Taxes (Consolidated)
The effective tax rate for the three months ended October 1, 2016 was 20.1% on a net loss compared to 14.8% on net income for the three months ended September 26, 2015. rates were as follows:
|
| | | | | | | | | | |
| Three Months Ended | | Six Months Ended |
July 2,
2016 | | July 1,
2017 | | July 2,
2016 | | July 1,
2017 |
| 34.2 | % | | 8.7 | % | | 18.3 | % | | 89.9 | % |
The effective tax rate for the ninesix months ended OctoberJuly 1, 20162017 was 21.6% on a net loss reported in the period compared to 60.3% on net income for the nine months ended September 26, 2015. For the three and nine months ended October 1, 2016, we have estimated income taxes using the annual effective tax rate method.
Income taxes recorded through July 2, 2016 were estimated using the discrete method. For the three and nine months ended October 1, 2016, we had significant changesnegatively impacted by non-deductible fees related to our estimates related todebt cancellation and additional asset impairments recognized in the third quarter and therefore determined that estimating income taxes using the annual effectivevaluation allowances recorded against deferred tax rate method was the more appropriate method for the period ending October 1, 2016.assets.
Our tax rate is subject to adjustment over the balance of the fiscal year due to, among other things: income tax rate changes by governments; the jurisdictions in which our profits are determined to be earned and taxed; changes in the valuation of our deferred tax assets and liabilities; adjustments to estimated taxes upon finalization of various tax returns; adjustments based on differing interpretations of the applicable transfer pricing standards; changes in available tax credits, grants and other incentives; changes in stock-based compensation expense; changes in tax laws or the interpretation of such tax laws (for example, proposals for fundamental U.S. international tax reform); changes in U.S. GAAP; expiration of or the inability to renew tax rulings or tax holiday incentives; and the repatriation of earnings with respect to which we have not previously provided for taxes.
Although we believe that the tax estimates are reasonable and that we prepare our tax filings in accordance with all applicable tax laws, the final determination with respect to any tax audit and any related litigation could be materially different from estimates or from historical income tax provisions and accruals. The results of an audit or litigation could have a material effect on our operating results and/or cash flows in the periods for which that determination is made. In addition, future period earnings may be adversely impacted by litigation costs, settlements, penalties, and/or interest assessments.
The IRSIn the United States, the Internal Revenue Service ("IRS") audit of our fiscal years ended June 27, 2009 and June 26, 2010 had previously concluded with the issuance of a statutory notice of deficiency on August 27, 2014. While we had previously agreed on certain adjustments and made associated payments of $8.0 million (inclusive
Perrigo Company plc - Item 2
Unallocated, Interest, Other, and Taxes
(inclusive of interest) in November 2014, the statutory notice of deficiency asserted various additional adjustments, including transfer pricing adjustments. The statutory notice of deficiency's adjustments for fiscal years 2009 and 2010 asserted an incremental tax obligation of approximately $68.9 million, inclusive of interest and penalties. We disagree with the IRS’s positions asserted in the statutory notice of deficiency. To contest the IRS's adjustments, in January 2015 we paid the incremental tax obligation (a prerequisite to contesting the proposed adjustments in U.S. district court), and in June 2015, we filed an administrative request for a refund with the IRS. The payment was recorded during the three months ended March 28, 2015 as a deferred charge on the balance sheet given our anticipated action to recover this amount. The IRS subsequently denied our request for a refund. We anticipate filing a complaint in U.S. district court claiming a refund of the paid amounts in August 2017.
The IRS issued a statutory notice of deficiency on April 20, 2017 for the IRS audits of our fiscal years ended June 25, 2011 and June 30, 2012. While we agreed to certain adjustments with respect to these years in October 2016 and made minimal associated payments, the statutory notice of deficiency asserted various additional adjustments, including transfer pricing adjustments. The statutory notice of deficiency for fiscal years 2011 and 2012 asserted an incremental tax obligation of approximately $74.2 million, inclusive of interest and penalties. We disagree with the IRS's positions asserted in this notice. In anticipation of contesting the IRS's adjustments, in May 2017 we paid the incremental tax obligation (a prerequisite to contesting the proposed adjustments in U.S. District Court) and filed an administrative request for a refund. The payment was recorded in the second quarter of the year ending December 31, 2017 as a deferred charge on the balance sheet given our anticipated action to recover this amount.
On December 22, 2016, we received a notice of proposed adjustment for the IRS audit of Athena Neurosciences, Inc. (“Athena”), a subsidiary of Elan Corporation plc (“Elan”) acquired in 1996, for the years ended December 31, 2011, December 31, 2012 and December 31, 2013. Perrigo acquired Elan in December 2013. This proposed adjustment relates to the deductibility of litigation costs. We disagree with the IRS’s position asserted in the notice of proposed adjustment and intend to contest it.
On July 11, 2017, we received a draft notice of proposed adjustment associated with transfer pricing positions for the IRS audit of Athena for the years ended December 31, 2011, December 31, 2012 and December 31, 2013. Athena was the originator of the patents associated with Tysabri®prior to August 2017. An unfavorable resolutionthe acquisition of Athena by Elan in 1996. The amount of adjustments that may be asserted by the IRS in the final notice of proposed adjustment cannot be quantified at this mattertime; however, based on the draft notice received, the amount to be assessed may be material. We disagree with the IRS’s position as asserted in the draft notice of proposed adjustment and intend to contest it.
Unfavorable resolutions of the audit matters discussed above could have a material impact on our consolidated financial statements in future periods.
We have ongoing audits in multiple other jurisdictions the resolution of which remains uncertain. These jurisdictions include, but are not limited to, the United States, Israel and Belgium.France. The IRS is currently auditing our fiscal years ended June 25, 201129, 2013 and June 30, 2012,28, 2014. The Israel Tax Authority is currently auditing our fiscal years ended June 29, 2013 and may make adjustments consistent withJune 28, 2014. The French Tax Authority is currently auditing the adjustments made in theyears ended December 2014, December 2015 and December 2016.
Perrigo Company plc - Item 2
Unallocated, Interest, Other,Financial Condition, Liquidity and TaxesCapital Resources
statutory notice of deficiency for fiscal years 2009 and 2010. In February 2016, the Belgium Tax Authority notified us that all Belgium locations will be audited for the years ended December 31, 2013 and December 31, 2014. At this time, we cannot predict the outcome of any audit or related litigation.
FINANCIAL CONDITION, LIQUIDITY, AND CAPITAL RESOURCES
Cash and Cash Equivalents
* Working capital represents current assets less current liabilities, excluding cash and cash equivalents, and current indebtedness.
Cash, cash equivalents, and cash flows from operations, and borrowings available under our credit facilities are expected to be sufficient to finance ourthe known and/or foreseeable liquidity and capital expenditures. In addition, we have the ability to borrow under our credit facilities. Although our lenders have made commitments to make funds available to us in a timely fashion under our revolving credit agreements and overdraft facilities, if economic conditions worsen or new information becomes publicly available impacting the institutions’ credit rating or capital ratios, these lenders may be unable or unwilling to lend money pursuant to our existing credit facilities.
Operating Activities
| | | | Nine Months Ended | Six Months Ended |
| | September 26,
2015 | | October 1,
2016 | | Increase/(Decrease) | |
| (in millions) | | July 2,
2016 | | July 1,
2017 | | Increase/(Decrease) |
| Cash Flows From (For) Operating Activities | | | | | | | | | | |
| Net income (loss) | $ | 74.2 |
| | $ | (1,395.4 | ) | | $ | (1,469.6 | ) | $ | (1,063.5 | ) | | $ | 2.0 |
| | $ | 1,065.5 |
|
| Non-cash adjustments | 827.1 |
| | 2,245.8 |
| | 1,418.7 |
| 1,463.8 |
| | 442.3 |
| | (1,021.5 | ) |
| Subtotal | 901.3 |
| | 850.4 |
| | (50.9 | ) | 400.3 |
| | 444.3 |
| | 44.0 |
|
| | | | | | | | | | | |
| Increase (decrease) in cash due to: | | | | | | | | | | |
| Accounts receivable | (30.9 | ) | | 113.6 |
| | 144.5 |
| 41.2 |
| | 51.8 |
| | 10.6 |
|
| Inventories | (28.6 | ) | | (29.9 | ) | | (1.3 | ) | 4.7 |
| | (4.6 | ) | | (9.3 | ) |
| Accounts payable | (6.5 | ) | | (51.8 | ) | | (45.3 | ) | (47.0 | ) | | (6.0 | ) | | 41.0 |
|
| Payroll and related taxes | (26.6 | ) | | (40.0 | ) | | (13.4 | ) | (39.2 | ) | | (37.9 | ) | | 1.3 |
|
| Accrued customer programs | 17.7 |
| | (74.7 | ) | | (92.4 | ) | (44.2 | ) | | (13.8 | ) | | 30.4 |
|
| Accrued liabilities | 46.7 |
| | (42.8 | ) | | (89.5 | ) | (53.9 | ) | | (49.4 | ) | | 4.5 |
|
| Accrued income taxes | 0.3 |
| | 9.7 |
| | 9.4 |
| (2.8 | ) | | (85.8 | ) | | (83.0 | ) |
| Other | (6.7 | ) | | (31.0 | ) | | (24.3 | ) | (29.4 | ) | | (13.3 | ) | | 16.1 |
|
| Subtotal | $ | (34.6 | ) | | $ | (146.9 | ) | | $ | (112.3 | ) | $ | (170.6 | ) | | $ | (159.0 | ) | | $ | 11.6 |
|
| | | | | | | | | | | |
| Net cash from (for) operating activities | $ | 866.7 |
|
| $ | 703.5 |
|
| $ | (163.2 | ) | |
| Net cash from operating activities | | $ | 229.7 |
| | $ | 285.3 |
|
| $ | 55.6 |
|
We generated $285.3 million of cash from operating activities during the six months ended July 1, 2017, a $55.6 million increase over the prior year period, due to the following:
Perrigo Company plc - Item 2
Financial Condition, Liquidity and Capital Resources
We generated $703.5 million of cash from operating activities during the nine months ended October 1, 2016, a $163.2 million decrease over the comparable prior year period, due primarily to increased working capital, as noted above, as a result of the following:
Decreased net earnings after adjusting | |
| • | Increased net earnings after adjustments for non-cash items such as deferred income taxes, impairment charges, restructuring charges, changes in the fair value of the Tysabri® royalty stream, and depreciation and amortization; |
Changes in accounts payable due primarily to changes to the Omega accounts payable structure as discussed below;that occurred in the prior year period;
Changes in accrued customer-related programs due to the pricing dynamics in the RxRX segment; and
Changes in accounts receivable due to increased sales volumes and timing of collections,receipt of payments; offset partiallyprimarily by a reduction of factoring in the current period; and
Changes in accrued liabilities due primarily to lower legal expenses.
Our operating cash flow for the current year period was unfavorably impacted by actions we took to establish a more normalized cash flow pattern within our BCH segment. Generally our BCH segment has seasonally stronger sales and cash flow inflows in the second and fourth quarters and stronger cash outflows in the first and third quarters. In the past, accounts payable terms with suppliers were structured to take account of this seasonality. This payment structure had a favorable impact on operating cash flow during the prior year period as only the second quarter inflow from these payment structures was included. In order to establish a more sustainable cash flow pattern during the year, we changed these payment structures during the nine months ended October 1, 2016, which had a one-time unfavorable impact on operating cash flow. | |
| • | Changes in accrued income taxes due primarily to the annual effective tax rate computation impacts in the current quarter and a tax obligation payment made in current year period (refer to Item 1. Note 13). |
Investing Activities
|
| | | | | | | | | | | |
| | Six Months Ended |
| ($ in millions) | July 2,
2016 | | July 1,
2017 | | Increase/(Decrease) |
| Cash Flows From (For) Investing Activities |
| Proceeds from royalty rights | $ | 169.9 |
| | $ | 85.7 |
| | $ | (84.2 | ) |
| Acquisitions of businesses, net of cash acquired | (419.7 | ) | | — |
| | 419.7 |
|
| Additions to property and equipment | (57.1 | ) | | (37.2 | ) | | 19.9 |
|
| Net proceeds from sale of business and other assets | — |
| | 37.2 |
| | 37.2 |
|
Proceeds from sale of the Tysabri® royalty stream | — |
| | 2,200.0 |
| | 2,200.0 |
|
| Other investing | (1.0 | ) | | (3.7 | ) | | (2.7 | ) |
| Net cash from (for) investing activities | $ | (307.9 | ) | | $ | 2,282.0 |
| | $ | 2,589.9 |
|
Cash used forgenerated from investing activities totaled $524.3 million$2.3 billion for the ninesix months ended OctoberJuly 1, 2016,2017, compared to $2.9 billioncash used of $307.9 million in the prior year period. The cash usedinflow in the current year was due primarily to the Tretinoin Productscompleted divestment of our Tysabri® royalty stream to Royalty Pharma, for which we received $2.2 billion in cash at closing (refer toItem 1. Note 6). The outflow in the prior year was due primarily to the acquisition of a portfolio of generic dosage forms and Generic Benzaclin™ acquisitions,strengths of Retin-A® ("Tretinoin"), a topical prescription acne treatment from Mattawan Pharmaceuticals, LLC, which used $478.4$416.4 million in cash. In the comparable prior year period, cash used for investing activities consisted primarily of a $2.5 billion outflow for business acquisitions, mainly attributable to Omega, as well as a $304.8 million outflow related to the cash settlement of the non-designated foreign currency derivatives we used to hedge the euro-denominated Omega and GSK Products purchase prices. Cash used for capital expenditures totaled $84.6$37.2 million during ninethe six months ended OctoberJuly 1, 20162017 compared to $127.6$57.1 million in the prior period year.year period. The decrease in cash used for capital expenditures over the prior year period was due primarily to several large infrastructure projects nearing completion.
Perrigo Company plc - Item 2
Financial Condition, Liquidity and Capital Resources
Financing Activities
|
| | | | | | | | | | | |
| | Six Months Ended |
| ($ in millions) | July 2,
2016 | | July 1,
2017 | | Increase/(Decrease) |
| Cash Flows From (For) Financing Activities |
| Issuances of long-term debt | $ | 1,190.3 |
| | $ | — |
| | $ | (1,190.3 | ) |
| Borrowings (repayments) of revolving credit agreements and other financing, net | (803.9 | ) | | — |
| | 803.9 |
|
| Payments on long-term debt | (28.7 | ) | | (2,229.1 | ) | | (2,200.4 | ) |
| Deferred financing fees | (2.4 | ) | | (4.0 | ) | | (1.6 | ) |
| Premium on early debt retirement | — |
| | (116.1 | ) | | (116.1 | ) |
| Issuance of ordinary shares | 3.5 |
| | 0.2 |
| | (3.3 | ) |
| Repurchase of ordinary shares | — |
| | (58.2 | ) | | (58.2 | ) |
| Cash dividends | (41.6 | ) | | (46.0 | ) | | (4.4 | ) |
| Other financing | (11.7 | ) | | 4.7 |
| | 16.4 |
|
| Net cash from (for) financing activities | $ | 305.5 |
| | $ | (2,448.5 | ) | | $ | (2,754.0 | ) |
Cash used for financing activities totaled $234.1 million$2.4 billion for the ninesix months ended OctoberJuly 1, 2016,2017, compared to $941.5$305.5 million of cash generated from financing activities for the comparable prior year period. In the current year period, cash used for financing included $803.6$2.2 billion of repayments on long-term debt and $116.1 million of discounts on early debt retirement related to repay balances outstanding underthe current year debt extinguishment and $58.2 million in share repurchases, as discussed below. In the prior year period, the cash generated from financing activities was due primarily to borrowings of $1.2 billion of long-term debt, offset in part by net repayments on our revolving credit agreements and other short-term financing and $500.0 million used to prepay our 1.300% 2016 Notes. These payments were offset by the borrowing of $1.2 billion of long-term debt. In the prior year period, the cash used for financing activities was due primarily to payments of $903.3 million on long-term debt, which included the repayment of debt assumed from Omega and a $300.0 million legacy Perrigo term loan.$803.9 million. For more information see "Borrowings and Capital Resources" below and Item 1. Note 10.
The declaration and payment of dividends, if any, is subject to the discretion of our Board of Directors and will depend on our earnings, financial condition, availability of distributable reserves, capital and surplus requirements, and other factors our Board of Directors may consider relevant.
InOn October 22, 2015, the Board of Directors approved a share repurchase plan of up to $2.0 billion (the "2015 Authorization"). During the six months ended July 1, 2017, we repurchased 812,184 ordinary shares at an average repurchase price of which $1.5$71.67 per share, for a total of $58.2 million. As of July 1, 2017, there was $1.4 billion is still available to be repurchased through December 31, 2018.2018 under the 2015 Authorization. We did not repurchase any shares under the share repurchase plan during the ninesix months ended October 1,July 2, 2016. The timing and amount of future repurchases, if any, will depend upon several factors, including market and business conditions, the trading price of our ordinary shares, available cash flow, and other investment opportunities.
Borrowings and Capital Resources
Perrigo Company plc - Item 2
Financial Condition, Liquidity and Capital Resources
Overdraft Facilities
Our BCH segment usesWe have overdraft facilities available that we use to increase the efficiency of itssupport our cash utilization and meet its short-term liquidity needs. We repaid the balancemanagement operations. There were no balances outstanding under the overdraft facilities during the nine months endedOctoberat July 1, 2016, but retain the ability to use the facilities in our day-to-day cash operations. The balance outstanding under the overdraft facilities was $82.9 million at2017 and December 31, 2015.2016.
Accounts Receivable Factoring
We have multiple accounts receivable factoring arrangements with non-related third-party financial institutions (the “Factors”). Pursuant to the terms of the arrangements, we sell to the Factors certain of our accounts receivable balances on a non-recourse basis for credit approved accounts. An administrative fee ranging from 0.14%0.07% to 0.15% per invoice is charged on the gross amount of accounts receivables assigned to the Factors, plusand interest is calculated at the applicable EUR LIBOR rate plus 50 to 70 basis points. The total amount factored on a non-recourse basis and excluded from accounts receivable on the Condensed Consolidated Balance Sheets was $36.4$27.0 million and $106.7$50.7 million at OctoberJuly 1, 20162017 and December 31, 2015,2016, respectively.
Revolving Credit Agreements
On December 9, 2015, our 100% owned finance subsidiary, Perrigo Finance Unlimited Company (formerly Perrigo Finance plc) ("Perrigo Finance"), entered into a $750.0 million revolving credit agreement (the "2015 Revolver"). At December 31, 2015, $380.0 million was outstanding under the 2015 Revolver. On March 15, 2016, we used the proceeds of the long-term debt issuance described below under "Long-Term Debt" to repay the $750.0 million then outstanding under the 2015 Revolver and terminated the facility.
On December 5, 2014, Perrigo Finance entered into a $600.0 million revolving credit agreement, which we increased to $1.0 billion on March 30, 2015 (the "2014 Revolver"). At December 31, 2015, $300.0 million was outstanding under the 2014 Revolver. On March 15, 2016, we used the proceeds of the long-term debt issuance described below under "Long-Term Debt" to repay the $435.0 million then outstanding under the 2014 Revolver. There were no borrowings outstanding under the 2014 Revolver as of OctoberJuly 1, 2016.2017.
Long-Term DebtTerm Loans and Notes
On March 7, 2016, Perrigo Finance issued $500.0 million in aggregate principal amount of 3.500% senior notes due 2021 and $700.0 million in aggregate principal amount of 4.375% senior notes due 2026 (together, the "2016 Notes") and received net proceeds of $1.2 billion after fees and market discount, which were used to repay the amounts outstanding under the 2015 Revolver and 2014 Revolver mentioned above.
We had $5.4$3.2 billion and $4.7$5.4 billion outstanding under our notes and bonds, and $463.8$428.6 million and $488.8$420.7 million outstanding under our term loan, as of OctoberJuly 1, 20162017 and December 31, 2015,2016, respectively. On September 29, 2016, we repaid the $500.01.300% senior notes due 2016 in full.
On December 5, 2014, Perrigo Finance entered into a term loan agreement consisting of a €500.0 million outstanding under($614.3 million) tranche, with the 1.300% 2016 Notes.ability to draw an additional €300.0 million ($368.6 million) tranche, maturing December 5, 2019, and we entered into a $300.0 million term loan tranche maturing December 18, 2015, which we repaid in full on June 25, 2015.
Perrigo Company plc - Item 2
Financial Condition, Liquidity and Capital Resources
Debt Repayments
During the six months ended July 1, 2017, we reduced our outstanding debt through a variety of transactions (in millions):
|
| | | | | | | | |
| Date | | Series | | Transaction Type | | Principal Retired |
| April 1, 2017 | | 2014 term loan due December 5, 2019 | | Scheduled quarterly payment | | $ | 13.3 |
|
| July 1, 2017 | | 2014 term loan due December 5, 2019 | | Scheduled quarterly payment | | 14.5 |
|
| May 8, 2017 | | $600.0 2.300% senior notes due 2018 | | Early redemption | | 600.0 |
|
| May 23, 2017 | | €180.0 4.500% retail bonds due 2017 | | Scheduled maturity | | 201.3 |
|
| June 15, 2017 | | $500.0 3.500% senior notes due 2021 | | Tender offer | | 190.4 |
|
| June 15, 2017 | | $500.0 3.500% senior notes due 2021 | | Tender offer | | 219.6 |
|
| June 15, 2017 | | $800.0 4.000% senior notes due 2023 | | Tender offer | | 584.4 |
|
| June 15, 2017 | | $400.0 5.300% senior notes due 2043 | | Tender offer | | 309.5 |
|
| June 15, 2017 | | $400.0 4.900% senior notes due 2044 | | Tender offer | | 96.1 |
|
| | | | | | | $ | 2,229.1 |
|
As previously disclosed, during the three months ended April 1, 2017 we entered into amendments to the 2014 Revolver and the 2014 Term Loan to modify provisions of such agreements necessary as a result of the correction in accounting related to the Tysabri® royalty stream, as well as waivers of any default or event of default that may have arisen from any restatement of or deficiencies in our financial statements for the periods specified in such amendments and waivers. We wereare in compliance with all covenants under our debt agreements as of OctoberJuly 1, 2016.2017.
See Item 1. Note 10 for more information on all of the above debt facilities.
Credit Ratings
Our credit ratings on OctoberJuly 1, 20162017 were Baa3 (negative)(stable) and BBB- (stable) by Moody's Investors Service and Standard and Poor's ("S&P") Global Ratings, respectively.
Credit rating agencies review their ratings periodically and, therefore, the credit rating assigned to us by each agency may be subject to revision at any time. Accordingly, we are not able to predict whether current credit ratings will remain as disclosed above. Factors that can affect our credit ratings include changes in operating performance, the economic environment, our financial position, and changes in business strategy. If changes in our credit ratings were to occur, they could impact, among other things, future borrowing costs, access to capital markets, and vendor financing terms.
Perrigo Company plc - Item 2
Financial Condition, Liquidity and Capital Resources
Contractual Obligations and Commitments
Other than the obligations related to the changes to our debt structure in relation to the 2016 Notes,repayments, as discussed in Item 1. Note 10 of the Notes to the Condensed Consolidated Financial Statements,, there were no material changes in contractual obligations as of OctoberJuly 1, 20162017 from those provided in our Transition Report on2016 Form 10-KT for the transition period from June 28, 2015 to December 31, 2015. 10-K. See below for a revised schedule of our enforceable and legally binding obligations as of OctoberJuly 1, 20162017 related to our short and long-term debt arrangements.
|
| | | | | | | | | | | | | | | | | | | |
| | Payment Due by Period (in millions) |
| | 2016(1) | | 2017 - 2018 | | 2019 - 2020 | | After 2020 | | Total |
Short and long-term debt(2) | $ | 77.7 |
| | $ | 1,691.1 |
| | $ | 817.0 |
| | $ | 5,510.1 |
| | $ | 8,095.9 |
|
|
| | | | | | | | | | | | | | | | | | | |
| | Payment Due by Period (in millions) |
| | 2017(1) | | 2018 - 2019 | | 2020 - 2021 | | After 2021 | | Total |
Short and long-term debt(2) | $ | 452.8 |
| | $ | 791.8 |
| | $ | 811.9 |
| | $ | 2,853.8 |
| | $ | 4,910.3 |
|
(1) Reflects remaining threesix months of 2016.2017.
| |
(2) | Short and long-term debt includes interest payments, which were calculated using the effective interest rate at OctoberJuly 1, 2016.2017. |
Perrigo Company plc - Item 3
Quantitative and Qualitative Disclosures
ITEM 3. QUANTITATIVE AND QUALITATIVE DISCLOSURES ABOUT MARKET RISK
There have been no material changes to our quantitative or qualitative disclosures found in Item 7A, "Quantitative and Qualitative Disclosures about Market Risk," of our TransitionAnnual Report on Form 10-KT10-K for the transition period from June 28, 2015 toyear ended December 31, 2015.2016.
ITEM 4. CONTROLS AND PROCEDURES
Conclusion Regarding the Effectiveness of Disclosure Controls and Procedures
Our management, with the participation of our Chief Executive Officer and Chief Financial Officer, has evaluated the effectiveness of the design and operation of our disclosure controls and procedures (as defined in Rule 13a-15(e) or 15d-15(e) of the Exchange Act) as of OctoberJuly 1, 2016.2017. Based upon that evaluation, our Chief Executive Officer and Chief Financial Officer have concluded that our disclosure controls and procedures were not effective as of OctoberJuly 1, 20162017 because of the material weaknessweaknesses in our internal control over financial reporting described below.
All systems of internal control, no matter how well designed, have inherent limitations. Therefore, even those systems deemed to be effective can provide only reasonable assurance with respect to financial statement preparation and presentation. A material weakness is a deficiency, or combination of deficiencies, in internal control over financial reporting, such that there is a reasonable possibility that a material misstatement of a company’s annual or interim consolidated financial statements will not be prevented or detected on a timely basis.
Evaluation of Disclosure Controls and Proceduresthe Effectiveness of Internal Control over Financial Reporting
We conducted an evaluation of the effectiveness of our internal control over financial reporting based upon the framework established in the 2013 Internal Control - Integrated Framework issued by the Committee of Sponsoring Organizations of the Treadway Commission (“COSO”).
InTysabri® Contingent Payments
We acquired the Tysabri® royalty stream in our acquisition of Elan Pharmaceuticals plc (“Elan”) in December 2013, and at the time of the acquisition, concluded that the right to receive quarterly royalty payments from Biogen Idec Inc. should be an intangible asset and such payments recognized as revenue in our financial statements. As discussed in Item 4.02 of our Form 8-K filed on April 25, 2017, during the 2016 year-end close process, and in anticipation of our potential sale of the Tysabri® royalty rights and the 2018 adoption of ASC 606 Revenue from Contracts with Customers, we re-evaluated the historical classification of the Tysabri® royalty stream as an intangible asset and concluded that it should have been reflected in the financial statements as a financial asset as of its 2013 acquisition date. As part of this evaluation, management determined that its control over the review of the application of the accounting guidance in ASC 805 Business Combinations did not operate effectively in the appropriate identification of the assets acquired and liabilities assumed in connection with the preparationElan acquisition in December 2013.All of our originally filed financial statements through the filing of the Form 10-Q for the quarter ended April 2,October 1, 2016, as originally filed on November 10, 2016, included the disclosure of the Elan acquisition with the Tysabri® royalty stream presented as an intangible asset. In addition, due to the fact that the asset was historically classified as an intangible asset, we did not design or implement controls around the fair value accounting for the Tysabri® royalty stream as a financial asset, so these controls were not in place at any quarter end subsequent to the acquisition, including the date of the quarterly and annual assessment of internal control. Accordingly, management concluded that these control deficiencies represent material weaknesses.
Income Taxes
Management has determined that we did not design andor maintain effective management review controls related to our (1) evaluation of non-routine transactions that operatedimpact our effective tax rate on an annual and interim basis and (2) determination of our deferred taxes in connection with business combinations.
During our quarterly and annual fiscal 2016 close processes, management determined that the design and operating effectiveness of our controls around the evaluation of non-routine events did not operate appropriately. As
Perrigo Company plc - Item 4
Controls and Procedures
disclosed in our Form 10-Q for the quarterly period ended April 2, 2016, our management review controls did not operate at a sufficient level of precision to ensure interim income taxes were properly recorded and disclosed in our condensed consolidated financial statements in connection with the recording of an indefinite-lived intangible asset impairment and an estimated goodwill impairment.impairment as part of the Company’s controls to evaluate non-routine events that occur during a quarterly period and the related income tax impacts. These control deficiencies resulted in a material misstatement in income taxes in the preliminary financial statements for the quarter ended April 2, 2016. The material misstatementAdditionally, these controls remained unremediated as of July 1, 2017, as they were in interim income taxes was corrected prior to the filing of the Form 10-Q for the quarter ended April 2, 2016. These control deficienciesFebruary 2017, when we identified that these controls did not resultappropriately evaluate the need for a valuation allowance. ASC 740, Income Taxes, requires a company to record a valuation allowance to reduce a deferred tax asset to its net realizable value. Our controls related to consideration of non-routine transactions or events were not designed and did not operate appropriately and identify whether a valuation allowance was needed as they did not identify that we entered into a three year cumulative loss and did not consider the positive and negative evidence in evaluating the potential sources of taxable income in determining whether a misstatement ofvaluation allowance was required in the consolidated financial statementsstatements.
In February 2017, management identified the existence of tax basis in certain acquired intangible assets (“tax amortization benefits”) that existed at the time of the acquisition of Omega Pharma Invest N.V. (“Omega”) on March 30, 2015. Upon evaluating the tax amortization benefits, management concluded that the purchase accounting for Omega should have included the transition period from June 28, 2015 to December 31, 2015, and would have no effecttax basis in the intangible assets in calculating the deferred tax liability in the opening balance sheet. This omission of existing tax basis in calculating the deferred tax liability on the accounting foracquisition date indicated that management’s review over the opening balance sheet deferred income taxes for the fiscal year ending December 31, 2016. However, these control deficiencies created a reasonable possibility that a material misstatement to the interim consolidated financial statements wouldtax accounts was not be preventeddesigned or detected on a timely basis. operating appropriately.
Accordingly, management concluded that these control deficiencies represent material weaknesses.
Impairment
In connection with our long-lived asset impairment testing, management determined that the controls around the identification of the relevant asset group under ASC 360, Impairment and Disposal of Long-lived Assets, did not operate effectively. In determining the level to evaluate the long-lived assets in our Animal Health reporting unit for impairment testing, we inappropriately grouped the assets that constituted the asset group in applying the guidance in ASC 360.
Accordingly, management concluded that this control deficiency represented a material weakness.
Remediation Plan for the Material Weaknesses
We are committed to remediating the control deficiencies that gave rise to the material weaknesses described above. Management is responsible for implementing changes and improvements to internal control over financial reporting and for remediating the control deficiencies that gave rise to the material weaknesses.
To remediate the material weakness in internal control over financial reporting related to the acquisition of the Tysabri® royalty rights, we have begun, with oversight from the Audit Committee, to:
Review the processes and controls in place related to our application of ASC 805 to enhance the effectiveness of the design and operation of those controls to identify assets acquired and liabilities assumed; and
Evaluate and enhance management review controls related to business acquisitions.
Until the remediation actions are fully implemented and the design and operating effectiveness of related internal controls is validated through testing, the material weaknesses described above will continue to exist.
In addition, following our identification of misstatements in certain of our previous financial statements, we designed and initiated certain controls around the accounting for the Tysabri® royalty stream as a financial asset. These controls that we implemented include: (1) review procedures related to the fair value estimation process, such as the use of relevant data and key assumptions utilized in the projections of future cash flows and calculation of discount rates and (2) management review controls over key assumptions and methodologies used in the
Perrigo Company plc - Item 4
Controls and Procedures
Remediation Plancalculations. Based on the testing performed on these newly implemented controls around the accounting for financial assets in the Material Weaknessfirst and second quarter of 2017, we have concluded that these controls have been designed appropriately and are operating effectively. As such, we consider this material weakness to be remediated as of July 1, 2017.
To remediate the material weaknessweaknesses in internal control over financial reporting described above,related to income taxes, we plan, with oversight from the Audit Committee, we have:to continue to:
ReviewedReview the organization structure, resources, processes and controls in place to measure and record income taxes to enhance the efficiency and effectiveness of the design and operation of those controls;
EnhancedEvaluate the design and operating effectiveness of our controls related to income taxes for business acquisitions and non-routine transactions on an interim and annual basis;
Enhance monitoring activities related to income taxes by adding additional internal controls and checklists;taxes; and
EvaluatedEvaluate and enhancedenhance the level of precision in the management review controls related to income taxes by adding additional levels of review.taxes.
We are in the process of testing and evaluating the design and operating effectiveness of the control procedures and are assessing the effectiveness ofexpect to implement the remediation plan, which we began implementing during the three months ended July 2, 2016 and are continuing to implement.actions in 2017. Until the remediation actions are fully implemented and the operational effectiveness of related internal controls is validated through testing, the material weaknessweaknesses described above will continue to exist.
To remediate the material weakness in internal control over financial reporting related to the identification of assets groups as part of our impairment testing, we have begun, with oversight from the Audit Committee, to:
Review the design and operation of our controls related to asset group determination in our impairment process on an interim and annual basis; and
Evaluate and enhance the management review controls related to impairment
We expect to implement the remediation actions in 2017. Until the remediation actions are fully implemented and the operational effectiveness of related internal controls is validated through testing, the material weaknesses described above will continue to exist.
We are committed to achieving and maintaining a strong internal control environment and believe the remediation measures will strengthen our internal control over financial reporting and remediate the material weaknessweaknesses identified. We intend to review each of the identified material weaknesses and add resources and improve our processes to achieve and maintain a strong control environment. We will continue to monitor the effectiveness of these remediation measures and will make any changes and take such other actions that we deem appropriate given the circumstances.
Changes in Internal Control over Financial Reporting
As discussedOther than as described above under the heading entitled "Remediation Plan for Material Weaknesses" related to the Material Weakness,"accounting for financial assets, there werehave been no changes in our internal control over financial reporting during the three months ended OctoberJuly 1, 20162017 that have materially affected, or are reasonably likely to materially affect, our internal control over financial reporting.
PART II. OTHER INFORMATION
ITEM 1. LEGAL PROCEEDINGS
Perrigo Company plc - Item 1A
.00ITEMRisk Factors
ITEM 1A. RISK FACTORS
Our TransitionAnnual Report on Form 10-KT10-K for the transition period from June 28, 2015 toyear ended December 31, 20152016 includes a detailed discussion of our risk factors. At the time of this filing, there have been no material changes to the risk factors that were included in the Form 10-KT10-K, other than those described below.
As partWe identified material weaknesses in our internal controls over financial reporting; failure to remediate the material weaknesses could negatively impact our business and the price of our ongoing strategic portfolio review, we are considering alternatives that could result in certain asset divestitures, which may impact our future operations and financial position.ordinary shares.
On November 10, 2016, as partIn connection with our review of our ongoing strategic portfolio review, we announcedcertain material misstatements related to the following strategic actions: (1) exploring strategic alternatives forcharacterization of the potential sale our Tysabri® royalty asset, which is reportedstream acquired in the Elan transaction, as well as material misstatements related to the calculation of deferred tax liabilities that existed at the time of the acquisition of Omega, and the evaluation of long-lived assets in our Specialty Sciences segment; (2) conducting a comprehensive internal evaluationAnimal Health reporting unit for impairment testing, in each case contained in certain of our businesses, including the Rx pharmaceuticals segments’ market position, growth opportunities and interdependencies withhistorical financial statements, we concluded that there were material weaknesses in our other manufacturing and shared service operationsinternal control over financial reporting that contributed to determine if strategic alternatives should be explored; and (3) conducting a review of segment and corporate cost structures to align with existing and future expected market dynamics. If we determine that we will pursue a strategic divestiture asthose misstatements. As a result of this portfolio review, our future business, prospects,the material weaknesses, which existed at December 31, 2016 and remained at July 1, 2017, we have concluded that we did not maintain, in all material respects, effective internal control over financial condition, liquidity and operating results could be significantly different than thosereporting as of December 31, 2016, April 1, 2017 or July 1, 2017, based on criteria established in historical periods or projectedInternal Control - Integrated Framework (2013) issued by our management, which maythe Committee of Sponsoring Organizations of the Treadway Commission (“COSO”). The failure to maintain effective control over financial reporting in turn resulted in material deficiencies in our disclosure controls and procedures.
We have identified and begun the implementation of actions, and continue to identify and implement, actions to improve the effectiveness of our internal control over financial reporting and disclosure controls and procedures, but there can be no assurance that such remediation efforts will be successful. We have also incurred and will continue to incur substantial accounting, legal, consulting, and other costs in connection with identifying and remediating the material weaknesses. Failure to remediate the material weaknesses could have a material adverse effectnegative impact on our business and the market valuefor our ordinary shares. For more information on our material weaknesses and the status of our ordinary shares or credit ratings. We cannot provide any commitment regarding if or when any such divestiture would occur.remediation efforts, See Part I, Item 4 - Controls and Procedures.
We are dependentcurrently involved in a search for a new Chief Executive Officer and a subsequent search for a permanent Chief Financial Officer. If these searches are delayed, our business could be negatively impacted.
On June 5, 2017, we announced the forthcoming retirement of John T. Hendrickson as our Chief Executive Officer. Mr. Hendrickson will continue to serve as our Chief Executive Officer and a member of our Board until such time as a successor has been appointed. Our Board of Directors has initiated a Chief Executive Officer search process and has retained an executive search and leadership advisory firm to assist with the process of identifying and evaluating candidates.
In addition, on February 21, 2017, we announced the servicesresignation of certainJudy L. Brown as our Executive Vice President, Business Operations and Chief Financial Officer, effective February 27, 2017. Since that time, Ronald L. Winowiecki has served as our acting Chief Financial Officer. Although Mr. Winowiecki remains a key executivecandidate for our permanent Chief Financial Officer, our Board of Directors has suspended its Chief Financial Officer search during its search for Mr. Hendrickson’s successor as Chief Executive Officer. There are no assurances concerning the timing or outcome of our search for a new Chief Executive Officer or subsequent search for a permanent Chief Financial Officer. If there are any delays in this process, or if any transition is not successful, our business could be negatively impacted.
The resolution of uncertain tax positions could be unfavorable, which could have an adverse effect on our business.
Although we believe that our tax estimates are reasonable and scientific employees. This year, we replacedthat our chief executive officer andtax filings are prepared in accordance with all applicable tax laws, the general managers of both our BCH and Rx segments. Our inability to successfully manage the transitionfinal determination with respect to these key executives,any tax audit, and any related litigation, could be materially different from our estimates or from our historical income tax provisions and accruals. The results of an audit or litigation could have a material effect on operating results or cash flows in the failure to attract and retainperiods for which that determination is made. In addition, future period earnings may be adversely impacted by litigation costs, settlements, penalties or interest assessments.
Perrigo Company plc - Item 1A
Risk Factors
In the United States, the Internal Revenue Service (“IRS”) audit of our fiscal years ended June 27, 2009 and June 26, 2010 had previously concluded with the issuance of a statutory notice of deficiency on August 27, 2014. While we had previously agreed on certain adjustments and made associated payments of $8.0 million (inclusive of interest) in November 2014, the statutory notice of deficiency asserted various additional adjustments, including transfer pricing adjustments. The statutory notice of deficiency's adjustments for fiscal years 2009 and 2010 asserted an incremental tax obligation of approximately $68.9 million, inclusive of interest and penalties. We disagree with the IRS’s positions asserted in the statutory notice of deficiency. To contest the IRS’s adjustments, in January 2015 we paid the incremental tax obligation (a prerequisite to contesting the proposed adjustments in U.S. district court), and in June 2015, we filed an administrative request for a refund with the IRS. The IRS subsequently denied our request for a refund. We anticipate filing a complaint in U.S. district court claiming a refund of the paid amounts in August 2017.
The IRS issued a statutory notice of deficiency on April 20, 2017 for the IRS audits of our fiscal years ended June 25, 2011 and June 30, 2012. While we agreed to certain adjustments with respect to these years in October 2016 and made minimal associated payments, the statutory notice of deficiency asserted various additional adjustments, including transfer pricing adjustments. The statutory notice of deficiency for fiscal years 2011 and 2012 asserted an incremental tax obligation of approximately $74.2 million, inclusive of interest and penalties. We disagree with the IRS’s positions asserted in this notice. In anticipation of contesting the IRS’s adjustments, in May 2017 we paid the incremental tax obligation (a prerequisite to contesting the proposed adjustments in U.S. district court) and expect to file an administrative request for refund.
On December 22, 2016, we received a notice of proposed adjustment for the IRS audit of Athena Neurosciences, Inc. (“Athena”), a subsidiary of Elan Corporation plc (“Elan”) acquired in 1996, for the years ended December 31, 2011, December 31, 2012 and December 31, 2013. We acquired Elan in December 2013. This proposed amendment relates to the deductibility of litigation costs. We disagree with the IRS’s position asserted in the notice of proposed adjustment and intend to contest it.
On July 11, 2017, we received a draft notice of proposed adjustment associated with transfer pricing positions for the IRS audit of Athena for the years ended December 31, 2011, December 31, 2012 and December 31, 2013. Athena was the originator of the patents associated with Tysabri® prior to the acquisition of Athena by Elan in 1996. The amount of adjustments that may be asserted by the IRS in the final notice of proposed adjustment cannot be quantified at this time; however, based on the draft notice received, the amount to be assessed may be material. We disagree with the IRS’s position as asserted in the draft notice of proposed adjustment and intend to contest it.
There are numerous other key executive and scientific employees, mayincome tax jurisdictions for which tax returns are not yet settled, none of which are individually significant. At this time, we cannot predict the outcome of any audit or related litigation. Unfavorable resolutions of the audit matters discussed above could have a material adverse impact on our results of operations.
As previously disclosedconsolidated financial statements in the "Risk Factors" section of our Form 10-KT, we are dependent on the services of certain key employees, and our future success will depend in large part upon our ability to attract and retain highly skilled employees. periods.
In April 2016, we announced that our former Chairman and Chief Executive Officer, Joseph C. Papa, resigned from the Company and that John T. Hendrickson, formerly our President, was appointed to serve as our new Chief Executive Officer. Mr. Hendrickson was later appointed to serve as a member of our Board of Directors.ITEM 2. UNREGISTERED SALES OF EQUITY SECURITIES AND USE OF PROCEEDS
In April 2016, we announced thatShare repurchase activity during the former Executive Vice President and General Manager of our BCH segment, Marc Coucke, resigned from the Company and that our current Executive Vice President and General Manager, International, Sharon Kochan, would undertake expanded responsibilities that include providing leadership and strategic direction to our BCH segment.three months ended July 1, 2017 was as follows:
On November 8, 2016, we appointed John Wesolowski the General Manager, Rx Pharmaceuticals. Mr. Wesolowski served as Acting General Manager, Rx Pharmaceuticals following the resignation of Doug Boothe on July 20, 2016.
If this management transition is not successful, or if we are unable to attract or retain other key qualified employees, our future operating results may be adversely impacted.
Publishing earnings guidance subjects us to risks, including increased stock volatility that could lead to potential lawsuits by investors.
Because we publish earnings guidance, we are subject to a number of risks. For a variety of reasons discussed under “Cautionary Note Regarding Forward-Looking Statements”, this Item 1A, and Item 1A of our Transition Report on Form 10-KT for the transition period from June 28, 2015 to December 31, 2015, actual results may vary from the guidance we provide investors from time to time, such that our stock price may decline following, among other things, any earnings releases or guidance that do not meet market expectations.
On February 18, 2016, we announced our results for the fourth quarter and calendar year ended December 31, 2015, as well as our updated guidance for calendar year 2016, and on April 25, 2016 we announced our preliminary financial results for the first quarter ended April 2, 2016, as well as our updated guidance for calendar year 2016. Our stock price declined following each such announcement, resulting in a decrease in our market capitalization. Additionally, we announced updated guidance on August 10, 2016. It has become increasingly commonplace for investors to file lawsuits against companies following a rapid decrease in market capitalization. These types of lawsuits can be costly and divert management attention and other resources away from our business, regardless of their merits, and could result in adverse settlements or judgments.
We are or may become involved in shareholder class action lawsuits and may experience unfavorable outcomes of such proceedings.
We are a defendant to a securities lawsuit in which the complaint alleges violations of Securities Exchange Act sections 10(b) (and Rule 10b‑5) and 14(e) against both Perrigo and our former Chief Executive Officer, Joseph C. Papa, and 20(a) control person liability against Mr. Papa. In general, the allegations concern the actions taken by the Company and former executive to defend against the hostile takeover bid by Mylan in the period April 21, 2015 through November 13, 2015. The plaintiff also alleges that we provided inadequate disclosure concerning alleged integration problems as a result of the Omega acquisition in the period April 21, 2015 through May 11, 2016. Another securities class action case was also filed in the same court making essentially the same claims on behalf of a class of persons who sold put options in Perrigo shares during the same class period. There is a motion pending to consolidate the two actions. |
| | | | | | | | | | | | | |
| | Total Number of Shares Purchased | | Average Price Paid per Share | | Total Number of Shares Purchased as Part of Publicly Announced Plans | | Value of Shares Available for Purchase(1) |
| April 1 - April 30, 2017 | — |
| | $ | — |
| | — |
| | $ | 1.50 | billion |
| May 1 - May 31, 2017 | — |
| | $ | — |
| | — |
| | $ | 1.50 | billion |
| June 1 - June 30, 2017 | 812,184 |
| | $ | 71.67 |
| | 812,184 |
| | |
| Total | 812,184 |
| | | | | | $ | 1.44 | billion |
We along with certain of our current and former executive officers and board members are also defendants in a securities class action suit where the plaintiff allege violations of Israeli law(1) The remaining $1.44 billion in the District Courttable represents the amount available to be repurchased under our 2015 Authorization as of Tel Aviv-Jaffa.July 1, 2017.
Perrigo Company plc - Item 1A
Risk Factors
On June 15, 2016, Perrigo filed a motion to stay the case pending the outcome of the securities class action pending in the New Jersey federal court. The plaintiffs did not oppose the motion. The Israeli court granted the motion on the same day, and the action is stayed.
We intend to vigorously defend against these lawsuits, however, we cannot predict how the cases will be resolved. Adverse results in the cases could result in substantial monetary judgments. See Part I. Item 1. Note 14 for more information on the above mentioned lawsuits.
We may not be able to improve operating results in our business segments.
We have experienced a reduction in pricing expectations during 2016 in comparison to historical patterns in our U.S. businesses, in particular in our Rx segment, due to industry and competitive pressures in the sector. The reduced pricing is attributable to a variety of factors including increased focus from customers to capture supply chain productivity savings, low raw material commodity pricing, competition in specific product categories, the loss of exclusivity on certain products, and consolidation of certain customers in the Rx segment. We have seen year-over-year pricing in the third quarter of 2016 moderate from the levels experienced in the first half of 2016. We expect this pricing environment to continue to impact the Company for the foreseeable future.
Our expectations for the BCH segment continue to be impacted by market dynamics in key countries such as Belgium, France, Germany and Italy. Factors impacting these countries include softness in certain leading brand categories primarily due to lower sell-through during the current year due to the re-staging launch timing of certain products, changes in timing of certain advertising and promotional campaigns compared to the prior year, and macro-economic factors, including unfavorable foreign currency impacts experienced primarily in the UK related to Brexit. The BCH segment has established a brand prioritization strategy to address these market dynamics, with an objective to balance the cost of advertising and promotion investments with expected contributions from category sales. The segment has further impacted in Belgium by a change in the forecasts with a major wholesaler, as management implements improved supply chain efficiencies in this market.
Our expectations for 2016 new product sales are consistent with those communicated in our Form 10-Q for the three months ended April 2, 2016, but continue to remain lower than we anticipated as of December 31, 2015. Several new product launches have been delayed due to the regulatory approval process for certain new products in the U.S. and modifications to market share penetration and timing assumptions for new products in our Rx and BCH segments.
There can be no assurance that we will not continue to experience challenges related to our segments, and these challenges could have a material impact on our business, cash flows, and results of operations or result in impairment charges, and the market value of our ordinary shares and/or debt securitiesmay decline.
We have acquired significant intangible assets and goodwill that could become impaired or subject us to losses and may result in an adverse impact on our results of operations.
We have recorded significant intangible assets and goodwill on our balance sheet as a result of previous acquisitions, which could become impaired and lead to material charges in the future. We regularly review our intangible assets and goodwill for impairment. Goodwill and indefinite-lived intangible assets are subject to impairment review on an annual basis and whenever impairment indicators are present.
In connection with the preparation of our financial statements for the three-month period ended April 2, 2016, we identified indicators of goodwill impairment in our BCH - rest of world (“BCH - ROW”) reporting unit, which comprises primarily operations attributable to the Omega acquisition in all geographic regions except for Belgium. The primary impairment indicators included the decline in our 2016 performance expectations and a reduction in our long-range revenue growth forecast. Step one of the goodwill impairment test involved determining the fair value of the reporting unit using a discounted cash flow technique and comparing it to the reporting unit’s carrying value. The main assumptions supporting the cash flow projections used to determine the reporting unit’s fair value included revenue growth based on product line extensions, product life cycle strategies, and geographical expansion within the markets in which the reporting unit distributes products, gross margins consistent with historical trends, and
Perrigo Company plc - Item 1A
Risk Factors
advertising and promotion investments largely consistent with the reporting unit's growth plans. The BCH-ROW reporting unit did not pass step one of goodwill impairment testing. The change in fair value from previous estimates was due primarily to the changes in the market and performance of certain brands such that the evaluation of brand prioritization and product extensions or launches in new regions are being more focused to maximize the potential of all brands in the segment's portfolio.
The second step of the goodwill impairment test required that we determine the implied fair value of the BCH - ROW reporting unit’s goodwill, which involved determining the value of the reporting unit’s individual assets and liabilities. Due to the complex and time-consuming nature of step two, based on our evaluation and initial estimates of the fair values of the assets and liabilities and the deficit of the fair value when compared to the related book value, we recorded an estimated impairment charge of $193.6 million for the three months ended April 2, 2016. We finalized the step two fair value calculation during the three months ended July 2, 2016, which resulted in a $30.3 million reduction to the estimated impairment charge recorded during the three months ended April 2, 2016,
In connection with the preparation of our financial statements for the three months ended October 1, 2016, we identified additional indicators of goodwill impairment in both our BCH - ROW and our BCH - Belgium reporting units. With respect to both reporting units, the primary impairment indicators included an additional decline in our 2016 performance expectations for the remainder of the year and a reduction in our long-range revenue growth and margin forecasts due to the factors outlined below. Step one of the goodwill impairment test involved determining the fair value of the reporting units using a discounted cash flow technique and comparing it to the respective reporting units' carrying value. The main assumptions supporting the cash flow projections used to determine each reporting unit’s fair value included revenue growth based on product line extensions, product life cycle strategies, and geographical expansion within the markets in which the reporting unit distributes products, gross margins consistent with historical trends and including supply chain cost improvement plans, and advertising and promotion investments largely consistent with the reporting unit's growth plans. Both the BCH - ROW and the BCH - Belgium reporting units did not pass step one of goodwill impairment testing. As it relates to the BCH - ROW reporting unit, the changes in fair value from previous estimates were due primarily to (1) changes in the market and performance of certain brands due to moderated new product launch assumptions, (2) execution of certain key product strategies falling short of expectations causing a reduction to baseline forecast models in France, Germany and Italy, (3) certain macro-economic factors having continued to impact the business more than expected in France, Russia and Turkey in addition to unfavorable foreign currency impacts experienced primarily in the UK related to Brexit. As it relates to BCH - Belgium reporting unit, the changes in fair value from previous estimates due to change in the forecast as a result of a reduction in volume with a major wholesaler due to factors consistent with those outlined for BCH - ROW.
The second step of the goodwill impairment test required that we determine the implied fair value of both the BCH - ROW and BCH - Belgium reporting units' goodwill, which involved determining the value of each reporting unit’s individual assets and liabilities. Based on our evaluation and initial estimates of the fair values of the assets and liabilities and the deficit of the fair value when compared to the related book value, we recorded an estimated impairment charge of $734.7 million related to the BCH - ROW reporting unit and $69.4 million related to the BCH - Belgium reporting unit for the three months ended October 1, 2016. Both charges were recorded in Impairment charges on the Condensed Consolidated Statements of Operations within our BCH segment. Due to the complex and time-consuming nature of step two, we expect to finalize the fair value calculation during the fourth quarter of 2016, which could result in an adjustment to the estimated impairment charge. As of October 1, 2016, $1.0 billion and $70.2 million of goodwill remains in the BCH - ROW and BCH - Belgium reporting units, respectively.
While no impairment charges were recorded as a result of the goodwill impairment testing for the transition period of June 28, 2015 to December 31, 2015, our Specialty Sciences reporting unit's fair value exceeded the carrying value by less than 10%. Management evaluated the primary source of cash flow in this segment, the Tysabri® royalty stream, based on a combination of factors including independent external research, information provided from our royalty partner, and internal estimates. Based on this information, management’s assessment of future cash flow from this royalty stream has been reduced primarily due to anticipated new competitors entering the market and unfavorable currency exchange effects. Future performance different from the assumptions utilized in our quantitative analysis may further reduce the fair value of the reporting unit, which may result in the fair value no longer exceeding the carrying value. In February 2016, a competitor's pipeline product, Ocrevus®, received breakthrough therapy designation from the FDA and could potentially be approved in 2016. The product would
Perrigo Company plc - Item 1A
Risk Factors
compete with Tysabri® and could have a significant negative impact on the royalty we receive from Biogen Idec Inc. ("Biogen") and the performance of the Specialty Sciences segment. We continue to monitor the progress of all potential competing products and assess the reporting unit for potential impairment should impairment indicators arise, as applicable, and at least annually during our fourth quarter impairment testing.
In connection with the preparation of our financial statements for the three-month period ended April 2, 2016, we identified indicators of impairment associated with certain indefinite-lived intangible assets acquired in conjunction with the Omega acquisition. The primary impairment indicators included the decline in our 2016 performance expectations and a reduction in our long-range revenue growth forecast. The assessment utilized the excess earnings method to determine fair value and resulted in an impairment charge of $273.4 million in Impairment charges on the Condensed Consolidated Statements of Operations within our BCH segment, which represented the difference between the carrying amount of the intangible assets and their estimated fair value. The change in fair value from previous estimates was due primarily to the changes in the market and performance of the brands such that the evaluation of brand prioritization and product extensions or launches in new regions are being more focused to maximize the potential of all brands in the segment's portfolio. The main assumptions supporting the fair value of these assets and cash flow projections included revenue growth based on product line extensions, product life cycle strategies, and geographical expansion within the markets in which the BCH segment distributes products, gross margins consistent with historical trends, and advertising and promotion investments largely consistent with the segment's growth plans.
In connection with the preparation of our financial statements for the three months ended October 1, 2016, we identified additional indicators of impairment associated with certain indefinite-lived and definite-lived intangible brand category assets acquired in conjunction with the Omega acquisition. The primary impairment indicators are discussed above in goodwill. The assessment of the indefinite-lived assets utilized the excess earnings method to determine fair value and resulted in an impairment charge of $575.7 million for the three months ended October 1, 2016. With regards to the definite-lived asset, it was determined that the carrying value of the asset group was not recoverable based on an assessment of the undiscounted future cash flows expected to be generated by the asset group. Given this, the excess earnings method was utilized to determine fair value of the definite-lived asset and resulted in an impairment charge of $290.2 million for the three months ended October 1, 2016. Both charges, which represented the difference between the carrying amount of the intangible assets and their estimated fair value, were recorded in Impairment charges on the Condensed Consolidated Statements of Operations within our BCH segment. The main assumptions supporting the fair value of these assets and cash flow projections are included in the goodwill discussions above.
The carrying value for certain intangible assets and goodwill equals estimated and implied fair values, respectively, and as a result, any further deterioration in those assets' fair value would lead to a further impairment charge. Future performance different from the assumptions utilized in our quantitative analyses may result in additional changes in the fair value. We will continue to monitor and assess these assets for potential impairment should further impairment indicators arise. We will complete our required annual impairment testing during the fourth quarter of 2016.
In addition, given the additional change in performance expectations for our remaining impaired cough/cold/allergy, anti-parasite, personal care and natural health brands previously recorded as indefinite-lived assets, we reclassified the remaining asset balance of $672.4 million related to these four assets to definite-lived assets with a 20-year useful life and began amortizing the assets as of October 2, 2016.
We identified a material weakness in our internal controls over financial reporting; failure to remediate the material weakness could negatively impact our business and the price of our ordinary shares.
In connection with the preparation of our financial statements for the three-month period ended April 2, 2016, we concluded that a material weakness existed in our internal controls over financial reporting, as described under Item 4. “Controls and Procedures.” More specifically, we did not design and maintain effective management review controls that operated at a sufficient level of precision to ensure interim income taxes are properly recorded and disclosed in our consolidated financial statements in connection with the recording of an indefinite-lived intangible asset impairment and an estimated goodwill impairment for the three months ended April 2, 2016. InPerrigo Company plc - Item 1A
Risk Factors
response to the identified material weakness, and with oversight from our Audit Committee, we are focused on improving our internal controls over financial reporting and remedying the identified material weakness.
To remediate the material weakness in internal control over financial reporting described above, with oversight from the Audit Committee, we have:
Reviewed the processes and controls in place to measure and record income taxes to enhance the efficiency and effectiveness of the design and operation of those controls;
Enhanced monitoring activities related to income taxes by adding additional internal controls and checklists; and
Evaluated and enhanced the level of precision in the management review controls related to income taxes by adding additional levels of review.
We are in the process of testing and evaluating the design and operating effectiveness of the control procedures and are assessing the effectiveness of the remediation plan, which we began implementing during the three months ended July 2, 2016 and are continuing to implement. Until the remediation actions are fully implemented and the operational effectiveness of related internal controls is validated through testing, the material weakness described above will continue to exist. We will continue to monitor the effectiveness of these remediation measures and will make any changes and take such other actions that we deem appropriate given the circumstances. We cannot assure you that we will be able to remediate this material weakness on a timely basis or at all. Failure to remediate this material weakness or difficulties encountered during implementation of these remediation efforts could result in material misstatements in or a future restatement of our financial statements, a failure to meet our reporting obligations, or the loss of investor confidence in our reported financial information, any of which could negatively impact our business and the price of our ordinary shares.
Our global operations could be negatively impacted by the economic and political instability caused by the United Kingdom ("UK") vote to leave the European Union ("EU").
The UK held a referendum on June 23, 2016 on its membership in the EU. A majority of UK voters voted to exit the EU (“Brexit”), and negotiations will commence to determine the future terms of the UK’s relationship with the EU, subject to a negotiation period that could last up to two years after the UK government formally initiates the withdraw process, including the terms of trade between the UK and the EU. Brexit has created significant instability and volatility in the global financial markets, has led to significant weakening of the British pound compared to the U.S. dollar and other currencies, and could adversely affect European or worldwide economic or market conditions. Although it is unknown what those terms will be, they may impair the ability of our operations in the EU to transact business in the future in the UK, and similarly the ability of our UK operations to transact business in the future in the EU. Specifically, it is possible that there will be greater restrictions on imports and exports between the UK and EU countries and increased regulatory complexities. These changes may adversely affect our operations and financial results. In addition, Brexit could lead to legal uncertainty and potentially divergent national laws and regulations as the UK determines which EU laws to replace or replicate. Further, among other things, Brexit could reduce consumer spending in the UK and the EU, which could result in decreased demand for our products. Any of these effects of Brexit, and others we cannot anticipate, could adversely affect our business, business opportunities, results of operations, financial condition and cash flows.
ITEM 5. OTHER INFORMATION
Director Appointments
On November 7, 2016, the Board of Directors appointed each of Geoffrey M. Parker and Theodore R. Samuels as members of the Board, effective November 7, 2016 and January 4, 2017, respectively. Each of Messrs. Parker and Samuels will serve as directors until the Company’s 2017 annual meeting of shareholders or until their successors are duly elected and qualified. Mr. Parker will serve on the Board’s Audit Committee. In connection with their appointment and service to the Board, Messrs. Parker and Samuels will receive, on a prorated basis, the same director compensation that our non-employee directors are eligible to receive, as previously disclosed in the Company’s definitive proxy statement on Schedule 14A filed with the SEC on March 17, 2016.
Perrigo Company plc - Item 1A
Risk Factors
There are no arrangements or understandings between either of Messrs. Parker and Samuels and any other person in connection with their respective appointments to the Board. There are no transactions in which either Messrs. Parker or Samuels, or any member of their immediate family, has an interest that would require disclosure under Item 404(a) of Regulation S-K.
Directors Not Standing for Re-election
On November 7, 2016, Michael Jandernoa and Gary Kunkle advised the Board that they will not stand for re-election as directors of the Company at the 2017 annual meeting of shareholders. Messrs. Jandernoa and Kunkle will continue to serve as directors until the Company’s 2017 annual meeting of shareholders. Mr. Kunkle has served as a director since 2002 and held the position of Lead Independent Director of the Company between August 2009 and April 2016. In addition, Mr. Kunkle served on the Board’s Audit Committee and Remuneration Committee. Mr. Jandernoa has served as a director since 1981, and was the Company’s Chief Executive Officer from 1988 to 2000 and Chairman of the Board from 1991 to 2003. Each of Messrs. Kunkle and Jandernoa advised the Board that he has determined to retire from the Board after many years of distinguished service and that his decision not to stand for re-election at the 2017 annual meeting of shareholders is not the result of any disagreement with the other Board members or with the Company on any matters involving the Company’s operations, policies or practices.
Perrigo Company plc - Part II - Item 6
Exhibits
ITEM 6. EXHIBITS
|
| | |
Exhibit Number | | Description |
| | | |
| 3.1 | | Certificate of Incorporation of Perrigo Company plc (formerly known as Perrigo Company Limited) (incorporated by reference from Exhibit 4.1 to the Company'sCompany’s Registration Statement on Form S-8 filed on December 19, 2013). |
| | | |
| 3.2 | | Memorandum and Articles of Association of Perrigo Company plc, as amended (incorporated by reference from Exhibit 3.2 to the Company's Transition Report on Form 10-KT filed on February 25, 2016)and restated (filed herewith). |
| | |
| 3.3 | | Memorandum and Articles of Association of Perrigo Company plc, as amended and restated (marked copy) (filed herewith). |
| | | |
| 10.1 | | EmploymentAmendment No. 5 and Waiver to Revolving Credit Agreement, dated as of August 3, 2016,April 19, 2017, among Perrigo Company plc, Perrigo Finance Unlimited Company, the lenders party thereto and JP Morgan Chase Bank, N.A., as administrative agent (incorporated by reference from Exhibit 10.1 to the Company's Current Report on Form 8-K filed on April 25, 2017). |
| | |
| 10.2 | | Amendment No. 5 and Waiver to Term Loan Credit Agreement, dated as of April 19, 2017, among Perrigo Company plc, Perrigo Finance Unlimited Company, the lenders party thereto and JP Morgan Chase Bank, N.A., as administrative agent (incorporated by reference from Exhibit 10.2 to the Company's Current Report on Form 8-K filed on April 25, 2017). |
| | |
| 10.3 | | Amendment No.1 to Employment Agreement, effective as of June 5, 2017, made by and among thePerrigo Company plc, Perrigo Management Company and John T. Hendrickson (incorporated by reference from Exhibit 10.1 to the Company’sCompany's Current Report on Form 8-K filed on AugustJune 5, 2016)2017). |
| | | |
10.210.4 | | Amendment No. 2, dated September 9,Perrigo Company Employee Severance Programme - Ireland, effective December 18, 2016 to the Revolving Credit Agreement by and among Perrigo Finance Unlimited Company, the Company, JPMorgan Chase Bank, N.A. and the other lenders party thereto, dated as of December 5, 2014, as amended by Amendment No. 1, dated as of February 26, 2016 (incorporated by reference from Exhibit 10.1 to the Company’s Current Report on Form 8-K filed on September 9, 2016)(filed herewith). |
| | | |
10.310.5 | | Amendment No. 2, dated September 9, 2016, to the Term Loan Credit Agreement by and among Perrigo Finance Unlimited Company the Company, JPMorgan Chase Bank, N.A. and the other lenders party thereto, datedplc Executive Committee Severance Policy, effective as of December 5, 2014, as amended byJune 14, 2017 (filed herewith). |
| | |
| 10.6 | | Forms of Amendment No. 1, dated asto Service-Based Restricted Stock Unit Award Agreements under Perrigo Company plc's 2013 Long-Term Incentive Plan (filed herewith). |
| | |
| 10.7 | | Forms of February 26, 2016 (incorporated by reference from Exhibit 10.2Amendment to the Company’s Current Report on Form 8-K filed on September 9, 2016)Performance-Based Restricted Stock Unit Award Agreements under Perrigo Company plc's 2013 Long-Term Incentive Plan (filed herewith). |
| | |
| 10.8 | | Forms of Amendment to Nonqualified Stock Option Agreements under Perrigo Company plc's 2013 Long-Term Incentive Plan (filed herewith). |
| | | |
| 31.1 | | Rule 13a-14(a) Certification by John T. Hendrickson, Chief Executive Officer (filed herewith). |
| | | |
| 31.2 | | Rule 13a-14(a) Certification by JudyRonald L. Brown, Executive Vice President, Business Operations andWinowiecki, Acting Chief Financial Officer (filed herewith). |
| | | |
| 32 | | Certification Pursuant to 18 United States Code 1350 and Rule 13a-14(b) of the Securities Exchange Act of 1934 (furnished herewith). |
| | | |
| 101.INS | | XBRL Instance Document. |
| | | |
| 101.SCH | | XBRL Taxonomy Extension Schema Document. |
| | | |
| 101.CAL | | XBRL Taxonomy Extension Calculation Linkbase Document. |
| | | |
| 101.DEF | | XBRL Taxonomy Extension Definition Linkbase Document. |
| | | |
| 101.LAB | | XBRL Taxonomy Extension Label Linkbase Document. |
| | | |
| 101.PRE | | XBRL Taxonomy Extension Presentation Linkbase Document. |
SIGNATURES
Pursuant to the requirements of the Securities Exchange Act of 1934, the registrant has duly caused this report to be signed on its behalf by the undersigned thereunto duly authorized.
|
| | | |
| | | | PERRIGO COMPANY PLC |
| | | | (Registrant) |
| | | | |
| Date: | NovemberAugust 10, 20162017 | | By: /s/ John T. Hendrickson |
| | | | John T. Hendrickson |
| | | | Chief Executive Officer |
| | | | (Principal Executive Officer) |
| | | | |
| Date: | NovemberAugust 10, 20162017 | | By: /s/ JudyRonald L. BrownWinowiecki |
| | | | JudyRonald L. BrownWinowiecki |
| | | | Executive Vice President, Business Operations andActing Chief Financial Officer |
| | | | (Principal Accounting and Financial Officer) |