UNITED STATES
SECURITIES AND EXCHANGE COMMISSION
WASHINGTON, D.C. 20549
FORM 10-Q
| | | | | |
| ☒ | |
[X] | QUARTERLY REPORT PURSUANT TO SECTION 13 OR 15(d) OF THE SECURITIES EXCHANGE ACT OF 1934 |
SeptemberMarch 30, 20172024
OR
| | | | | |
| ☐ | |
[ ] | TRANSITION REPORT PURSUANT TO SECTION 13 OR 15(d) OF THE SECURITIES EXCHANGE ACT OF 1934 |
Commission file number 001-36353
Perrigo Company plc
(Exact name of registrant as specified in its charter)
| | | | | | | | |
| Ireland | | Not Applicable |
| | |
Ireland | | Not Applicable |
(State or other jurisdiction of
incorporation or organization)
| | (I.R.S. Employer
Identification No.)
|
| |
Treasury Building, Lower Grand Canal Street, Dublin 2, Ireland | | - |
(Address of principal executive offices) | | (Zip Code) |
The Sharp Building, Hogan Place, Dublin 2, Ireland D02 TY74
+353 1 7094000
(Registrant’sAddress, including zip code, and telephone number, including
area code)code, of registrant’s principal executive offices)
Not Applicable
(Former name, former address and former fiscal year, if changed since last report)
________________________________________ Securities registered pursuant to Section 12(b) of the Act:
| | | | | | | | |
| Title of each class | Trading Symbol(s) | Name of each exchange on which registered |
| Ordinary shares, €0.001 par value | PRGO | New York Stock Exchange |
| 3.900% Notes due 2024 | PRGO24 | New York Stock Exchange |
| 4.375% Notes due 2026 | PRGO26 | New York Stock Exchange |
| 4.650% Notes due 2030 | PRGO30 | New York Stock Exchange |
| 5.300% Notes due 2043 | PRGO43 | New York Stock Exchange |
| 4.900% Notes due 2044 | PRGO44 | New York Stock Exchange |
Indicate by check mark whether the registrant (1) has filed all reports required to be filed by Section 13 or 15(d) of the Securities Exchange Act of 1934 during the preceding 12 months (or for such shorter period that the registrant was required to file such report)reports), and (2) has been subject to such filing requirements for the past 90 days. YES [X] NO [ ]Yes ☒ No ☐
Indicate by check mark whether the registrant has submitted electronically and posted on its corporate Web site, if any, every Interactive Data File required to be submitted and posted pursuant to Rule 405 of Regulation S-T (§232.405 of this chapter) during the preceding 12 months (or for such shorter period that the registrant was required to submit and post such files). YES [X] NO [ ]Yes ☒ No ☐
Indicate by check mark whether the registrant is a large accelerated filer, an accelerated filer, a non-accelerated filer, a smaller reporting company, or an emerging growth company. See definitions of “large accelerated filer”, “accelerated filer”, “smaller reporting company”, and "emerging growth company" in Rule 12b-2 of the Exchange Act.
| | | | | | | | | | | | | | | | | | | | | | | | | | | | | | | | |
| | | | | | | | | | |
| Large accelerated filer | [X]☒ | | Accelerated filer | [ ]☐ | | Non-accelerated filer | [ ]☐ | | (Do not check if smaller reporting company)
| Smaller reporting company | [ ]☐ |
| Emerging growth company | [ ]☐ | | | | | | | | | |
| | | | | | | | | | |
| If an emerging growth company, indicate by check mark if the registrant has elected not to use the extended transition period for complying with any new or revised financial accounting standards provided pursuant to Section 13(a) of the Exchange Act. | [ ]☐ |
Indicate by check mark whether the registrant is a shell company (as defined in Rule 12b-2 of the Exchange Act). [ ] YES [X] NO☐ Yes ☒ No
As of NovemberMay 3, 2017,2024, there were 140,840,721136,320,433 ordinary shares outstanding.
PERRIGO COMPANY PLC
FORM 10-Q
INDEX
| | | | | | | | |
| PAGE NUMBER |
| |
| |
| PART I. FINANCIAL INFORMATION | |
| | |
| |
| | |
| |
| | |
| |
| | |
| |
| | |
| |
| | |
| |
| | |
| |
| | |
| 1 | | |
| | |
| 2 | | |
| | |
| | |
| | |
| 3 | | |
| | |
| 4 | | |
| | |
| 5 | | |
| | |
| 6 | | |
| | |
| 7 | | |
| | |
| 8 | | |
| | |
| 9 | | |
| | |
| 10 | | |
| | |
| 11 | | |
| | |
| 12 | | |
| | |
| 13 | | |
| | |
| 14 | | |
| | |
| 15 | | |
| | |
| 16 | | |
| | |
| | |
| | |
| |
| | |
| |
| | |
| |
| | |
| PART II. OTHER INFORMATION | |
| | |
| |
| | |
| |
| | |
| |
| | |
| |
| | |
| |
| | |
| |
|
| | |
| | PAGE NUMBER |
| |
| | |
| PART I. FINANCIAL INFORMATION | |
| | | |
| |
| | | |
| |
| | | |
| |
| | | |
| |
| | | |
| |
| | | |
| |
| | | |
| 1 | | |
| | | |
| 2 | | |
| | | |
| 3 | | |
| | | |
| 4 | | |
| | | |
| 5 | | |
| | | |
| 6 | | |
| | | |
| 7 | | |
| | | |
| 8 | | |
| | | |
| 9 | | |
| | | |
| 10 | | |
| | | |
| 11 | | |
| | | |
| 12 | | |
| | | |
| 13 | | |
| | | |
| 14 | | |
| | | |
| 15 | | |
| | | |
| 16 | | |
| | | |
| |
| | | |
| |
| | | |
| |
| | | |
| PART II. OTHER INFORMATION | |
| | | |
| |
| | | |
| |
| | | |
| |
| | | |
| |
| | | |
| |
| | | |
| |
CAUTIONARY NOTE REGARDING FORWARD-LOOKING STATEMENTS
Certain statements in this report are “forward-looking statements” within the meaning of Section 21E of the Securities Exchange Act of 1934, as amended, and are subject to the safe harbor created thereby. These statements relate to future events or our future financial performance and involve known and unknown risks, uncertainties and other factors that may cause our, or our industry’s actual results, levels of activity, performance or achievements to be materially different from those expressed or implied by any forward-looking statements. In particular, statements about our expectations, beliefs, plans, objectives, assumptions, future events or future performance contained in this report, including certain statements contained in “Management’s Discussion and Analysis of Financial Condition and Results of Operations” are forward-looking statements. In some cases, forward-looking statements can be identified by terminology such as “may,” “will,” “could,” “would,” “should,” “expect,” “plan,” “anticipate,” “intend,” “believe,” “estimate,” "forecast," “predict,” “potential” or the negative of those terms or other comparable terminology.
Please see Item 1A of our Form 10-K for the year ended December 31, 2016 for a discussion of certain important risk factors that relate to forward-looking statements contained in this report and Part II, Item 1A of this Form 10-Q. We haveThe Company has based these forward-looking statements on ourits current expectations, assumptions, estimates and projections. While we believethe Company believes these expectations, assumptions, estimates and projections are reasonable, such forward-looking statements are only predictions and involve known and unknown risks and uncertainties, many of which are beyond ourthe Company’s control, including: supply chain impacts on the timing, amountCompany’s business, including those caused or exacerbated by armed conflict, trade and costother economic sanctions and/or disease; general economic, credit, and market conditions; the impact of the war in Ukraine and any share repurchases;escalation thereof, including the effects of economic and political sanctions imposed by the United States, United Kingdom, European Union, and other countries related thereto; the outbreak or escalation of conflict in other regions where we do business; future impairment charges;charges, if we determine that the successcarrying amount of management transition;specific assets may not be recoverable from the expected future cash flows of such assets; customer acceptance of new products; competition from other industry participants, some of whom have greater marketing resources or larger market shares in certain product categories than we do;the Company does; pricing pressures from customers and consumers; potential third-party claimsresolution of uncertain tax positions and litigation, includingany litigation relating to our restatement of previously-filed financial information; potential impacts ofthereto, ongoing or future government investigations and regulatory initiatives; resolution of uncertain tax positions;uncertainty regarding the Company’s ability to obtain and maintain its regulatory approvals; potential costs and reputational impact of product recalls or sales halts; potential adverse changes to U.S. and foreign tax, reform legislation; general economic conditions;healthcare and other government policy; the effect of the coronavirus (COVID-19) pandemic and its variants, or other epidemic or pandemic disease; the timing, amount and cost of any share repurchases (or the absence thereof) and/or any refinancing of outstanding debt at or prior to maturity; fluctuations in currency exchange rates and interest rates; the consummation and success of the proposed sale of the HRA Rare Diseases portfolio, including the risk that the parties fail to obtain the required regulatory approvals or to fulfill the other conditions to closing on the expected timeframe or at all, the occurrence of any other event, change or circumstance that could delay the transaction or result in the termination of the sale agreement or that the Company faces higher than anticipated costs in connection with the proposed sale; the risk that potential costs or liabilities incurred or retained in connection with the sale of the Company's Rx business may exceed the Company’s estimates or adversely affect the Company’s business or operations; the Company’s ability to achieve the benefits expected from the acquisitions of Héra SAS ("HRA Pharma") and Nestlé’s Gateway infant formula plant along with the U.S. and Canadian rights to the GoodStart® infant formula brand and other related formula brands ("Gateway") and/or the risks that the Company’s synergy estimates are inaccurate or that the Company faces higher than anticipated integration or other costs in connection with the acquisitions; risks associated with the integration of HRA Pharma and Gateway, including the risk that growth rates are adversely affected by any delay in the integration of sales and distribution networks; the consummation and success of other announced and unannounced acquisitions or dispositions, and ourthe Company’s ability to realize the desired benefits thereof; and the Company’s ability to execute and achieve the desired benefits of announced cost-reduction efforts and other initiatives. In addition, we may identifystrategic initiatives and investments, including the Company’s ability to achieve the expected benefits from its ongoing restructuring programs described herein. Adverse results with respect to pending litigation could have a material adverse impact on the Company's operating results, cash flows and liquidity, and could ultimately require the use of corporate assets to pay damages, reducing assets that would otherwise be unable to remediate one or more material weaknesses in our internal control over financial reporting. Furthermore, we and/or our subsidiaries may incur additional tax liabilities in respect of 2016 and prior years as a result of any restatement or may be found to have breached certain provisions of Irish company legislation in respect of prior financial statements and if so may incur additional expenses and penalties.available for other corporate purposes. These and other important factors, including those discussed in our Form 10-K for the year ended December 31, 2016, in2023, this report under “Risk Factors” and in any subsequent filings with the United States Securities and Exchange Commission, may cause actual results, performance or achievements to differ materially from those expressed or implied by these forward-looking statements. The forward-looking statements in this report are made only as of the date hereof, and unless otherwise required by applicable securities laws, we disclaim any intention or obligation to update or revise any forward-looking statements, whether as a result of new information, future events, or otherwise.
TRADEMARKS, TRADE NAMES AND SERVICE MARKS
This report contains trademarks, trade names and service marks that are the property of Perrigo Company plc, as well as, for informational purposes, trademarks, trade names, and service marks that are the property of other organizations. Solely for convenience, certain trademarks, trade names, and service marks referred to in this report appear without the ®,™ and SM symbols, but those references are not intended to indicate that we or the applicable owner, as the case may be, will not assert, to the fullest extent under applicable law, our or their rights to such trademarks, trade names, and service marks.
Perrigo Company plc - Item 1
PART I. FINANCIAL INFORMATION
ITEM 1. FINANCIAL STATEMENTS (UNAUDITED)
PERRIGO COMPANY PLC
CONDENSED CONSOLIDATED STATEMENTS OF OPERATIONS
(in millions, except per share amounts)
(unaudited)
| | | | | | | | | | | | | | | |
| | Three Months Ended | | |
| | March 30, 2024 | | April 1, 2023 | | | | |
| Net sales | $ | 1,082.1 | | | $ | 1,181.7 | | | | | |
| Cost of sales | 724.4 | | | 767.9 | | | | | |
| Gross profit | 357.7 | | | 413.8 | | | | | |
| | | | | | | |
| Operating expenses | | | | | | | |
| Distribution | 24.9 | | | 28.6 | | | | | |
| Research and development | 29.0 | | | 31.1 | | | | | |
| Selling | 150.3 | | | 167.9 | | | | | |
| Administration | 130.4 | | | 135.0 | | | | | |
| | | | | | | |
| Restructuring | 44.3 | | | 3.4 | | | | | |
| Other operating expense (income), net | 34.0 | | | (0.7) | | | | | |
| Total operating expenses | 412.9 | | | 365.3 | | | | | |
| | | | | | | |
| Operating (loss) income | (55.2) | | | 48.5 | | | | | |
| | | | | | | |
| | | | | | | |
| Interest expense, net | 43.0 | | | 43.7 | | | | | |
| Other (income) expense, net | 0.4 | | | 0.5 | | | | | |
| | | | | | | |
| Income (loss) from continuing operations before income taxes | (98.6) | | | 4.3 | | | | | |
| Income tax (benefit) expense | (102.7) | | | 5.4 | | | | | |
| Income (loss) from continuing operations | 4.1 | | | (1.1) | | | | | |
| Income (loss) from discontinued operations, net of tax | (2.1) | | | (1.9) | | | | | |
| Net income (loss) | $ | 2.0 | | | $ | (3.0) | | | | | |
| | | | | | | |
| Earnings (loss) per share | | | | | | | |
| Basic | | | | | | | |
| Continuing operations | $ | 0.03 | | | $ | (0.01) | | | | | |
| Discontinued operations | (0.02) | | | (0.01) | | | | | |
| Basic earnings (loss) per share | $ | 0.01 | | | $ | (0.02) | | | | | |
| Diluted | | | | | | | |
| Continuing operations | $ | 0.03 | | | $ | (0.01) | | | | | |
| Discontinued operations | (0.02) | | | (0.01) | | | | | |
| Diluted earnings (loss) per share | $ | 0.01 | | | $ | (0.02) | | | | | |
| | | | | | | |
| Weighted-average shares outstanding | | | | | | | |
| Basic | 136.6 | | | 134.9 | | | | | |
| Diluted | 137.6 | | | 134.9 | | | | | |
|
| | | | | | | | | | | | | | | |
| | Three Months Ended | | Nine Months Ended |
| | September 30,
2017 | | October 1,
2016 | | September 30,
2017 | | October 1,
2016 |
| Net sales | $ | 1,231.3 |
| | $ | 1,261.6 |
| | $ | 3,663.1 |
| | $ | 3,949.3 |
|
| Cost of sales | 733.5 |
| | 777.1 |
| | 2,196.4 |
| | 2,385.2 |
|
| Gross profit | 497.8 |
| | 484.5 |
| | 1,466.7 |
| | 1,564.1 |
|
| | | | | | | | |
| Operating expenses | | | | | | | |
| Distribution | 21.5 |
| | 21.6 |
| | 64.2 |
| | 65.9 |
|
| Research and development | 38.4 |
| | 50.2 |
| | 120.8 |
| | 142.5 |
|
| Selling | 143.5 |
| | 154.6 |
| | 454.1 |
| | 506.9 |
|
| Administration | 123.3 |
| | 105.4 |
| | 326.9 |
| | 317.2 |
|
| Impairment charges | 7.8 |
| | 1,614.4 |
| | 47.4 |
| | 2,028.8 |
|
| Restructuring | 3.8 |
| | 6.6 |
| | 54.7 |
| | 17.9 |
|
| Other operating income | (2.9 | ) | | — |
| | (41.0 | ) | | — |
|
| Total operating expenses | 335.4 |
| | 1,952.8 |
| | 1,027.1 |
| | 3,079.2 |
|
| | | | | | | | |
| Operating income (loss) | 162.4 |
| | (1,468.3 | ) | | 439.6 |
| | (1,515.1 | ) |
| | | | | | | | |
| Change in financial assets | 2.6 |
| | 377.4 |
| | 24.2 |
| | 1,492.6 |
|
| Interest expense, net | 34.7 |
| | 54.6 |
| | 133.1 |
| | 163.2 |
|
| Other (income) expense, net | (3.6 | ) | | 1.0 |
| | (1.1 | ) | | 32.4 |
|
| Loss on extinguishment of debt | — |
| | 0.7 |
| | 135.2 |
| | 1.1 |
|
| Income (loss) before income taxes | 128.7 |
| | (1,902.0 | ) | | 148.2 |
| | (3,204.4 | ) |
| Income tax expense (benefit) | 84.2 |
| | (311.8 | ) | | 101.8 |
| | (550.7 | ) |
| Net income (loss) | $ | 44.5 |
| | $ | (1,590.2 | ) | | $ | 46.4 |
| | $ | (2,653.7 | ) |
| | | | | | | | |
| Earnings (loss) per share | | | | | | | |
| Basic | 0.31 |
| | (11.10 | ) | | $ | 0.33 |
| | $ | (18.53 | ) |
| Diluted | $ | 0.31 |
| | $ | (11.10 | ) | | $ | 0.32 |
| | $ | (18.53 | ) |
| | | | | | | | |
| Weighted-average shares outstanding | | | | | | | |
| Basic | 141.3 |
| | 143.3 |
| | 142.5 |
| | 143.2 |
|
| Diluted | 141.7 |
| | 143.3 |
| | 142.8 |
| | 143.2 |
|
| | | | | | | | |
| Dividends declared per share | $ | 0.160 |
| | $ | 0.145 |
| | $ | 0.480 |
| | $ | 0.435 |
|
See accompanying Notes to the Condensed Consolidated Financial StatementsStatements.
Perrigo Company plc - Item 1
PERRIGO COMPANY PLC
CONDENSED CONSOLIDATED STATEMENTS OF COMPREHENSIVE INCOME (LOSS)
(in millions)
(unaudited)
| | | | | | | | | | | | | | | |
| Three Months Ended | | |
| March 30, 2024 | | April 1, 2023 | | | | |
| Net income (loss) | $ | 2.0 | | | $ | (3.0) | | | | | |
| Other comprehensive income (loss): | | | | | | | |
| Foreign currency translation adjustments | (58.3) | | | 52.7 | | | | | |
| Change in fair value of derivative financial instruments, net of tax | 10.9 | | | (31.5) | | | | | |
| | | | | | | |
| Change in post-retirement and pension liability, net of tax | (1.0) | | | (0.5) | | | | | |
| Other comprehensive income (loss), net of tax | (48.4) | | | 20.7 | | | | | |
| Comprehensive income (loss) | $ | (46.4) | | | $ | 17.7 | | | | | |
|
| | | | | | | | | | | | | | | |
| | Three Months Ended | | Nine Months Ended |
| | September 30,
2017 | | October 1,
2016 | | September 30,
2017 | | October 1,
2016 |
| Net income (loss) | $ | 44.5 |
| | $ | (1,590.2 | ) | | $ | 46.4 |
| | $ | (2,653.7 | ) |
| Other comprehensive income: | | | | | | | |
| Foreign currency translation adjustments | 69.9 |
| | 27.5 |
| | 289.9 |
| | 71.5 |
|
| Change in fair value of derivative financial instruments, net of tax | 0.1 |
| | 3.6 |
| | 8.7 |
| | (3.5 | ) |
| Change in fair value of investment securities, net of tax | (8.1 | ) | | 9.8 |
| | (24.4 | ) | | 18.4 |
|
| Change in post-retirement and pension liability, net of tax | (1.2 | ) | | (0.2 | ) | | (1.2 | ) | | 0.4 |
|
| Other comprehensive income, net of tax | 60.7 |
| | 40.7 |
| | 273.0 |
| | 86.8 |
|
| Comprehensive income (loss) | $ | 105.2 |
| | $ | (1,549.5 | ) | | $ | 319.4 |
| | $ | (2,566.9 | ) |
See accompanying Notes to the Condensed Consolidated Financial StatementsStatements.
Perrigo Company plc - Item 1
PERRIGO COMPANY PLC
CONDENSED CONSOLIDATED BALANCE SHEETS
(in millions, except share and per share amounts)
(unaudited)
| | March 30, 2024 | | | March 30, 2024 | | December 31, 2023 |
| Assets | |
| | Cash, cash equivalents and restricted cash | |
| | September 30,
2017 | | December 31,
2016 |
| Assets | | | |
| Cash and cash equivalents | $ | 775.9 |
| | $ | 622.3 |
|
| Accounts receivable, net of allowance for doubtful accounts of $6.2 million and $6.3 million, respectively | 1,076.6 |
| | 1,176.0 |
|
| Cash, cash equivalents and restricted cash | |
| | Cash, cash equivalents and restricted cash | |
| | Accounts receivable, net of allowance for credit losses of $8.1 and $7.8, respectively | |
| Accounts receivable, net of allowance for credit losses of $8.1 and $7.8, respectively | |
| Accounts receivable, net of allowance for credit losses of $8.1 and $7.8, respectively | |
| Inventories | 821.9 |
| | 795.0 |
|
| | Prepaid expenses and other current assets | 297.4 |
| | 212.0 |
|
| Prepaid expenses and other current assets | |
| Prepaid expenses and other current assets | |
| | Total current assets | 2,971.8 |
| | 2,805.3 |
|
| Total current assets | |
| Total current assets | |
| | Property, plant and equipment, net | 822.3 |
| | 870.1 |
|
| Financial assets | — |
| | 2,350.0 |
|
| Goodwill and other indefinite-lived intangible assets | 4,255.4 |
| | 4,163.9 |
|
| Other intangible assets, net | 3,347.4 |
| | 3,396.8 |
|
| Non-current deferred income taxes | 22.4 |
| | 72.1 |
|
| Property, plant and equipment, net | |
| Property, plant and equipment, net | |
| Operating lease assets | |
| | Goodwill and indefinite-lived intangible assets | |
| Goodwill and indefinite-lived intangible assets | |
| Goodwill and indefinite-lived intangible assets | |
| Definite-lived intangible assets, net | |
| Deferred income taxes | |
| | Other non-current assets | |
| Other non-current assets | |
| Other non-current assets | 423.3 |
| | 211.9 |
|
| Total non-current assets | 8,870.8 |
| | 11,064.8 |
|
| Total assets | $ | 11,842.6 |
| | $ | 13,870.1 |
|
| Liabilities and Shareholders’ Equity | | | |
| | Accounts payable | |
| | Accounts payable | |
| | Accounts payable | $ | 477.1 |
| | $ | 471.7 |
|
| Payroll and related taxes | 133.4 |
| | 115.8 |
|
| Accrued customer programs | 368.8 |
| | 380.3 |
|
| Accrued liabilities | 274.6 |
| | 263.3 |
|
| Other accrued liabilities | |
| Accrued income taxes | 61.5 |
| | 32.4 |
|
| | Current indebtedness | 417.1 |
| | 572.8 |
|
| Current indebtedness | |
| Current indebtedness | |
| | Total current liabilities | 1,732.5 |
| | 1,836.3 |
|
| Total current liabilities | |
| Total current liabilities | |
| | Long-term debt, less current portion | 3,275.7 |
| | 5,224.5 |
|
| Non-current deferred income taxes | 357.7 |
| | 389.9 |
|
| Long-term debt, less current portion | |
| Long-term debt, less current portion | |
| Deferred income taxes | |
| | Other non-current liabilities | |
| Other non-current liabilities | |
| Other non-current liabilities | 434.9 |
| | 461.8 |
|
| Total non-current liabilities | 4,068.3 |
| | 6,076.2 |
|
| Total liabilities | 5,800.8 |
| | 7,912.5 |
|
| Commitments and contingencies - Note 14 | | | |
| Contingencies - Refer to Note 15 | | Contingencies - Refer to Note 15 | | | |
| Shareholders’ equity | | | |
| Controlling interest: | | | |
| Preferred shares, $0.0001 par value, 10 million shares authorized | — |
| | — |
|
| Ordinary shares, €0.001 par value, 10 billion shares authorized | 7,900.1 |
| | 8,135.0 |
|
| Accumulated other comprehensive income (loss) | 191.2 |
| | (81.8 | ) |
| Controlling interests: | |
| Controlling interests: | |
| Controlling interests: | |
| Preferred shares, $0.0001 par value per share, 10 shares authorized | |
| Preferred shares, $0.0001 par value per share, 10 shares authorized | |
| Preferred shares, $0.0001 par value per share, 10 shares authorized | |
| Ordinary shares, €0.001 par value per share, 10,000 shares authorized | |
| Accumulated other comprehensive income | |
| Retained earnings (accumulated deficit) | (2,049.6 | ) | | (2,095.1 | ) |
| Total controlling interest | 6,041.7 |
| | 5,958.1 |
|
| Noncontrolling interest | 0.1 |
| | (0.5 | ) |
| | Total shareholders’ equity | |
| | Total shareholders’ equity | |
| | Total shareholders’ equity | 6,041.8 |
| | 5,957.6 |
|
| Total liabilities and shareholders' equity | $ | 11,842.6 |
| | $ | 13,870.1 |
|
| | | | |
| Supplemental Disclosures of Balance Sheet Information | | | |
| Ordinary shares, issued and outstanding (in millions) | 140.8 |
| | 143.4 |
|
| Supplemental Disclosures of Balance Sheet Information | |
| Supplemental Disclosures of Balance Sheet Information | |
| Preferred shares, issued and outstanding | |
| Preferred shares, issued and outstanding | |
| Preferred shares, issued and outstanding | |
| Ordinary shares, issued and outstanding | |
See accompanying Notes to the Condensed Consolidated Financial StatementsStatements.
Perrigo Company plc - Item 1
PERRIGO COMPANY PLC
CONDENSED CONSOLIDATED STATEMENTS OF SHAREHOLDERS’ EQUITY
(in millions, except per share amounts)
(unaudited)
| | | | | | | | | | | | | | | | | | | | | | | | | | | | | |
| | Ordinary Shares
Issued | | Accumulated
Other
Comprehensive
Income | | Retained
Earnings
(Accumulated Deficit) | | Total |
| | Shares | | Amount |
| Balance at December 31, 2022 | 134.7 | | | $ | 6,936.7 | | | $ | (27.0) | | | $ | (2,067.6) | | | $ | 4,842.1 | |
| | | | | | | | | |
| Net loss | — | | | — | | | — | | | (3.0) | | | (3.0) | |
| Other comprehensive loss | — | | | — | | | 20.7 | | | — | | | 20.7 | |
| | | | | | | | | |
| Restricted stock plan | 1.0 | | | — | | | — | | | — | | | — | |
| | | | | | | | | |
| Compensation for restricted stock | — | | | 24.9 | | | — | | | — | | | 24.9 | |
| Cash dividends, $0.26 per share | — | | | (36.2) | | | — | | | — | | | (36.2) | |
| Shares withheld for payment of employees' withholding tax liability | (0.4) | | | (14.6) | | | — | | | — | | | (14.6) | |
| | | | | | | | | |
| Balance at April 1, 2023 | 135.3 | | | $ | 6,910.8 | | | $ | (6.3) | | | $ | (2,070.6) | | | $ | 4,833.9 | |
| | | | | | | | | |
| | | | | | | | | |
| | | | | | | | | |
| | | | | | | | | |
| | | | | | | | | |
| | | | | | | | | |
| | | | | | | | | |
| | | | | | | | | |
| | | | | | | | | |
| | | | | | | | | |
| | | | | | | | | |
| | | | | | | | | |
| | | | | | | | | |
| | | | | | | | | |
| | | | | | | | | |
| | | | | | | | | |
| | | | | | | | | |
| | | | | | | | | |
| | | | | | | | | |
| | | | | | | | | |
| | | | | | | | | |
| | | | | | | | | |
| | | | | | | | | |
| | | | | | | | | |
| | | | | | | | | |
| | | | | | | | | |
| | | | | | | | | |
| | | | | | | | | |
| | | | | | | | | |
| | | | | | | | | |
| | | | | | | | | |
| | | | | | | | | |
| | | | | | | | | |
| | | | | | | | | |
| | | | | | | | | |
| | | | | | | | | |
| | | | | | | | | |
| | | | | | | | | |
| | | | | | | | | | | | | | | | | | | | | | | | | | | | | |
| | Ordinary Shares
Issued | | Accumulated
Other
Comprehensive
Income | | Retained
Earnings
(Accumulated Deficit) | | Total |
| | Shares | | Amount |
| Balance at December 31, 2023 | 135.5 | | | $ | 6,837.5 | | | $ | 10.7 | | | $ | (2,080.3) | | | $ | 4,767.9 | |
| | | | | | | | | |
| Net income | — | | | — | | | — | | | 2.0 | | | 2.0 | |
| Other comprehensive income | — | | | — | | | (48.4) | | | — | | | (48.4) | |
| | | | | | | | | |
| | | | | | | | | |
| | | | | | | | | |
| Compensation for restricted stock | 1.2 | | | 15.6 | | | — | | | — | | | 15.6 | |
| Cash dividends, $0.27 per share | — | | | (37.6) | | | — | | | — | | | (37.6) | |
| Shares withheld for payment of employees' withholding tax liability | (0.4) | | | (12.5) | | | — | | | — | | | (12.5) | |
| Balance at March 30, 2024 | 136.3 | | | $ | 6,803.0 | | | $ | (37.7) | | | $ | (2,078.3) | | | $ | 4,687.0 | |
| | | | | | | | | |
| | | | | | | | | |
| | | | | | | | | |
| | | | | | | | | |
| | | | | | | | | |
| | | | | | | | | |
| | | | | | | | | |
| | | | | | | | | |
| | | | | | | | | |
| | | | | | | | | |
| | | | | | | | | |
| | | | | | | | | |
| | | | | | | | | |
| | | | | | | | | |
| | | | | | | | | |
| | | | | | | | | |
| | | | | | | | | |
| | | | | | | | | |
| | | | | | | | | |
| | | | | | | | | |
| | | | | | | | | |
| | | | | | | | | |
| | | | | | | | | |
| | | | | | | | | |
| | | | | | | | | |
| | | | | | | | | |
| | | | | | | | | |
| | | | | | | | | |
| | | | | | | | | |
| | | | | | | | | |
| | | | | | | | | |
| | | | | | | | | |
| | | | | | | | | |
| | | | | | | | | |
| | | | | | | | | |
| | | | | | | | | |
| | | | | | | | | |
See accompanying Notes to the Condensed Consolidated Financial Statements.
Perrigo Company plc - Item 1
PERRIGO COMPANY PLC
CONDENSED CONSOLIDATED STATEMENTS OF CASH FLOWS
(in millions)
(unaudited)
| | | | | | | | | | | |
| Three Months Ended |
| | March 30, 2024 | | April 1, 2023 |
| Cash Flows From (For) Operating Activities | | | |
| Net income (loss) | $ | 2.0 | | | $ | (3.0) | |
| Adjustments to derive cash flows: | | | |
| Depreciation and amortization | 81.4 | | | 88.7 | |
| Restructuring charges | 44.3 | | | 3.4 | |
| Share-based compensation | 15.6 | | | 24.9 | |
| Amortization of debt discount | 0.4 | | | 0.7 | |
| Gain on sale of assets | — | | | (3.9) | |
| | | |
| | | |
| | | |
| Deferred income taxes | (11.0) | | | (9.9) | |
| Other non-cash adjustments, net | (7.4) | | | 6.4 | |
| Subtotal | 125.3 | | | 107.3 | |
| Increase (decrease) in cash due to: | | | |
| Accrued income taxes | (81.6) | | | 2.5 | |
| Accounts receivable | (51.9) | | | (39.8) | |
| Payroll and related taxes | (51.6) | | | (34.3) | |
| Accounts payable | (16.7) | | | (29.8) | |
| Prepaid expenses and other current assets | (1.7) | | | 17.1 | |
| Inventories | 10.6 | | | (28.6) | |
| Accrued customer programs | 18.2 | | | 6.8 | |
| Accrued liabilities | 30.6 | | | 8.0 | |
| Other operating, net | 17.4 | | | 10.2 | |
| Subtotal | (126.7) | | | (87.9) | |
| Net cash (for) from operating activities | (1.4) | | | 19.4 | |
| Cash Flows From (For) Investing Activities | | | |
| Additions to property, plant and equipment | (25.1) | | | (23.2) | |
| | | |
| | | |
| | | |
| | | |
| Proceeds from sale of assets | — | | | 1.8 | |
| Proceeds from royalty rights | 1.6 | | | 1.8 | |
| | | |
| Net cash for investing activities | (23.5) | | | (19.6) | |
| Cash Flows For Financing Activities | | | |
| Cash dividends | (37.6) | | | (36.2) | |
| Payments on long-term debt | (9.8) | | | (5.9) | |
| | | |
| | | |
| | | |
| | | |
| | | |
| | | |
| Other financing, net | (13.0) | | | (8.6) | |
| Net cash for financing activities | (60.4) | | | (50.7) | |
| Effect of exchange rate changes on cash and cash equivalents | (7.5) | | | 3.2 | |
| Net decrease in cash and cash equivalents | (92.8) | | | (47.7) | |
| Cash, cash equivalents and restricted cash of continuing operations, beginning of period | 751.3 | | | 600.7 | |
| | | |
| | | |
| Cash, cash equivalents and restricted cash of continuing operations, end of period | $ | 658.5 | | | $ | 553.0 | |
|
| | | | | | | |
| | Nine Months Ended |
| | September 30,
2017 | | October 1,
2016 |
| Cash Flows From (For) Operating Activities | | | |
| Net income (loss) | $ | 46.4 |
| | $ | (2,653.7 | ) |
| Adjustments to derive cash flows | | | |
| Depreciation and amortization | 333.1 |
| | 338.4 |
|
| Share-based compensation | 28.1 |
| | 15.3 |
|
| Impairment charges | 47.4 |
| | 2,028.8 |
|
| Change in financial assets | 24.2 |
| | 1,492.6 |
|
| Loss on extinguishment of debt | 135.2 |
| | 1.1 |
|
| Restructuring charges | 54.7 |
| | 17.9 |
|
| Deferred income taxes | (16.3 | ) | | (674.1 | ) |
| Amortization of debt premium | (18.4 | ) | | (24.6 | ) |
| Other non-cash adjustments, net | (27.2 | ) | | 34.5 |
|
| Subtotal | 607.2 |
| | 576.2 |
|
| Increase (decrease) in cash due to: | | | |
| Accounts receivable | 38.4 |
| | 113.0 |
|
| Inventories | (28.3 | ) | | 25.1 |
|
| Accounts payable | (6.0 | ) | | (57.7 | ) |
| Payroll and related taxes | (36.7 | ) | | (40.0 | ) |
| Accrued customer programs | (15.8 | ) | | (73.7 | ) |
| Accrued liabilities | (18.8 | ) | | (90.0 | ) |
| Accrued income taxes | (61.5 | ) | | 5.2 |
|
| Other, net | 3.5 |
| | (9.4 | ) |
| Subtotal | (125.2 | ) | | (127.5 | ) |
| Net cash from operating activities | 482.0 |
| | 448.7 |
|
| Cash Flows From (For) Investing Activities | | | |
| Proceeds from royalty rights | 86.4 |
| | 259.5 |
|
| Acquisitions of businesses, net of cash acquired | — |
| | (436.8 | ) |
| Asset acquisitions | — |
| | (65.1 | ) |
| Additions to property, plant and equipment | (55.2 | ) | | (84.6 | ) |
| Net proceeds from sale of business and other assets | 46.7 |
| | 58.5 |
|
Proceeds from sale of the Tysabri® financial asset | 2,200.0 |
| | — |
|
| Other investing, net | (5.8 | ) | | (1.0 | ) |
| Net cash from (for) investing activities | 2,272.1 |
| | (269.5 | ) |
| Cash Flows From (For) Financing Activities | | | |
| Issuances of long-term debt | — |
| | 1,190.3 |
|
| Payments on long-term debt | (2,243.7 | ) | | (545.8 | ) |
| Borrowings (repayments) of revolving credit agreements and other financing, net | — |
| | (803.6 | ) |
| Deferred financing fees | (4.2 | ) | | (2.8 | ) |
| Premium on early debt retirement | (116.1 | ) | | (0.6 | ) |
| Issuance of ordinary shares | 0.5 |
| | 8.2 |
|
| Repurchase of ordinary shares | (191.5 | ) | | — |
|
| Cash dividends | (68.7 | ) | | (62.4 | ) |
| Other financing | 2.7 |
| | (17.4 | ) |
| Net cash (for) financing activities | (2,621.0 | ) | | (234.1 | ) |
| Effect of exchange rate changes on cash and cash equivalents | 20.5 |
| | (0.2 | ) |
| Net increase (decrease) in cash and cash equivalents | 153.6 |
| | (55.1 | ) |
| Cash and cash equivalents, beginning of period | 622.3 |
| | 417.8 |
|
| Cash and cash equivalents, end of period | $ | 775.9 |
| | $ | 362.7 |
|
See accompanying Notes to the Condensed Consolidated Financial StatementsStatements.
Perrigo Company plc - Item 1
Note 1
NOTE 1 –- SUMMARY OF SIGNIFICANT ACCOUNTING POLICIES
General Information
The Company
Perrigo Company plc was incorporated under the laws of Ireland on June 28, 2013 and became the successor registrant of Perrigo Company, a Michigan corporation, on December 18, 2013 in connection with the acquisition of Elan Corporation, plc ("Elan"). Unless the context requires otherwise, the terms "Perrigo," the "Company," "we," "our," "us," and similar pronouns used herein refer to Perrigo Company plc, its subsidiaries, and all predecessors of Perrigo Company plc and its subsidiaries.
We are a leading global healthcare company, delivering value to our customers and consumers by providing Quality Affordable Healthcare Products®. Founded in 1887 as a packager of home remedies, we have built a unique business model that is best described as the convergence of a fast-moving consumer goods company, a high-quality pharmaceutical manufacturing organization and a world-class supply chain network. We believe we are one of the world's largest manufacturers of over-the-counter (“OTC”) healthcare products and suppliers of infant formulas for the store brand market. We also are a leading provider of branded OTC products throughout Europeover-the-counter ("OTC") health and wellness solutions that are designed to enhance individual well-being and empower consumers to proactively prevent or treat conditions that can be self-managed. Our vision is to provide the U.S., as well as a leading producer of generic standard topical products such as creams, lotions, and gels, as well as inhalants and injections ("extended topical") prescription drugs.best self-care for everyone. We are headquartered in Ireland and sell our products primarily in North America and Europe as well as in other markets including Australia, Israel and China.around the world.
Basis of Presentation
The accompanyingOur unaudited Condensed Consolidated Financial Statements have been prepared in accordanceconformity with U.S.accounting principles generally accepted accounting principlesin the United States of America ("U.S. GAAP") for interim financial information and with the instructions to Article 10 of Regulation S-X. Accordingly, they do not include all of the information and footnotes required by U.S. GAAP for complete financial statements. The unaudited Condensed Consolidated Financial Statements should be read in conjunction with the consolidated financial statementsConsolidated Financial Statements and footnotes included in our Annual Report on Form 10-K for the year ended December 31, 2016.2023. In the opinion of management, all adjustments (consisting of normal recurring accruals and other adjustments) considered necessary for a fair presentation of the unaudited Condensed Consolidated Financial Statements have been included and include our accounts and the accounts of all majority-owned subsidiaries. All intercompany transactions and balances have been eliminated in consolidation. Certain prior period amounts have been reclassified to conform to the current period presentation. Some amounts in this report may not add due to rounding.
Segment Reporting
Our reporting and operating segments are as follows:
•Consumer Self-Care Americas ("CSCA") comprises our consumer self-care business in the U.S. and Canada.
•Consumer Self-Care International ("CSCI") comprises our consumer self-care business outside of the U.S. and Canada, primarily in Europe and Australia.
We previously had an Rx segment which was comprised of our generic prescription pharmaceuticals business in the U.S., and other pharmaceuticals and diagnostic business in Israel, which have been divested. Following the divestiture, there were no substantial assets or operations left in this segment. The Rx segment was reported as Discontinued Operations in 2021, and is presented as such for all periods in this report (refer to Note 3).
Our segments reflect the way in which our chief operating decision maker, who is our CEO, makes operating decisions, allocates resources and manages the growth and profitability of the Company. Financial information related to our business segments and geographic locations can be found in Note 2 and Note 16.
Foreign Currency Translation and Transactions
We translate our non-U.S. dollar-denominated operations’ assets and liabilities into U.S. dollars at current rates of exchange as of the balance sheet date and income and expense items at the average exchange rate for the reporting period. Translation adjustments resulting from exchange rate fluctuations are recorded in the cumulative translation account, a component of Accumulated other comprehensive income (loss) ("AOCI"). Gains or losses from foreign currency transactions are included in Other (income) expense, net.
Perrigo Company plc - Item 1
Note 1
Cash, Cash Equivalents and Restricted Cash
Recent Accounting Standard Pronouncements
Cash and cash equivalents consist primarily of demand deposits and other short-term investments with maturities of three months or less at the date of purchase.
Below are recent accounting standard updates that we are still assessing to determine
We have $7.0 million of restricted cash as of March 30, 2024 and December 31, 2023 in the effect on our Condensed Consolidated Financial Statements.Balance Sheets. We entered into an agreement to extend a credit line to an existing customer in exchange for a cash security deposit. The agreement requires the cash to be held in a separate account and will be returned to the customer at the expiration of the agreement provided all credits have been paid as agreed.
Allowance for Credit Losses
Expected credit losses on trade receivables and contract assets are measured collectively by geographic location. Historical credit loss experience provides the primary basis for estimation of expected credit losses and is adjusted for current conditions and for reasonable and supportable forecasts. Receivables that do not believe that any other recently issued accounting standards could have a material effectshare risk characteristics are evaluated on our Condensed Consolidated Financial Statements. As new accounting pronouncementsan individual basis and are issued, we will adopt those that are applicable undernot included in the circumstances.collective evaluation. The following table presents the allowance for credit losses activity (in millions):
| | | | | | | | | | | | | | | |
| Three Months Ended | | |
| March 30, 2024 | | April 1, 2023 | | | | |
| Balance at beginning of period | $ | 7.8 | | | $ | 6.8 | | | | | |
| Provision for credit losses, net | 0.3 | | | — | | | | | |
| Receivables written-off | — | | | (0.3) | | | | | |
| Recoveries collected | 0.1 | | | — | | | | | |
| | | | | | | |
| Currency translation adjustment | (0.1) | | | 0.6 | | | | | |
| Balance at end of period | $ | 8.1 | | | $ | 7.1 | | | | | |
|
| | | | | | |
Recently Issued Accounting Standards Adopted |
Standard | | Description | | Date of adoption | | Effect on the Financial Statements or Other Significant Matters |
Clarifying the Definition of a Business | | This update clarifies the definition of a business and addresses whether transactions should be accounted for as asset acquisitions or business combinations (or divestitures). The guidance includes an initial threshold that an acquired set of assets will not be considered a business if substantially all of the fair value of the assets acquired is concentrated in a single tangible or identifiable intangible asset (or group of similar assets). If the acquired set does not pass the initial threshold, then the guidance requires that, to be a business, the set must include an input and a substantive process that together significantly contribute to the ability to create outputs. Different factors are considered to determine whether the set includes a substantive process, such as the inclusion of an organized workforce. Further, the guidance removes language stating that a business need not include all of the inputs and processes that the seller used in operating the business. | | January 1, 2017 | | We early adopted this new standard and will apply it prospectively when determining whether transactions should be accounted for as asset acquisitions (divestitures) or business combinations (divestitures). During the nine months ended September 30, 2017, we applied the new guidance when determining whether certain product divestitures represented sales of assets or businesses.
|
Improvements to Employee Share-Based Payment Accounting
| | This guidance is intended to simplify several aspects of the accounting for share-based payment award transactions. It will require all income tax effects of awards to be recorded through the income statement when the awards vest or settle as opposed to certain amounts being recorded in additional paid-in capital. An entity will also have to elect whether to account for forfeitures as they occur or by estimating the number of awards expected to be forfeited and adjusting the estimate when it is likely to change (as currently required). The guidance will also increase the amount an employer can withhold to cover income taxes on awards. | | January 1, 2017 | | We adopted this standard as of January 1, 2017. We elected to estimate the number of awards expected to be forfeited and adjust the estimate when it is likely to change, consistent with past practice. We did not change the amounts that we withhold to cover income taxes on awards. As the requirement to record all income tax effects of vested or settled awards through the income statement is prospective in nature, there was no cumulative effect of adopting the standard on our balance sheet. |
Perrigo Company plc - Item 1
Note 1
|
| | | | | | |
Recently Issued Accounting Standards Not Yet Adopted |
Standard | | Description | | Effective Date | | Effect on the Financial Statements or Other Significant Matters |
Revenue from Contracts with Customers | | The core principle of the guidance is that an entity should recognize revenue to depict the transfer of promised goods or services to customers in an amount that reflects the consideration to which the entity expects to be entitled in exchange for those goods or services. To achieve that core principle, an entity should apply the following steps: identify the contract(s) with a customer; identify the performance obligations in the contract; determine the transaction price; allocate the transaction price to the performance obligations in the contract; and recognize revenue when (or as) the entity satisfies a performance obligation. This guidance allows for two adoption methods, full retrospective approach or modified retrospective approach. | | January 1, 2018 | | We continue to evaluate the implications of adoption of the new revenue standard on our Consolidated Financial Statements. We have completed an initial assessment and are in the process of quantifying the adoption impact, if any, related to certain topics identified through our evaluation process. Our assessment of the new revenue standard has been focused on, but has not been limited to, the concepts of over-time versus point-in-time revenue recognition patterns, variable consideration, and identification of performance obligations. We will not complete our final assessment and quantification of the impact of the new revenue standard on our Consolidated Financial Statements until the adoption date. Our analysis indicates that certain contract manufacturing and private label arrangements may require revenue recognition over-time in situations in which we produce products that have no alternative use and we have an enforceable right to payment for performance completed to date, inclusive of a reasonable profit margin. This may result in an acceleration of revenue recognition for certain contractual arrangements as compared to recognition under current accounting literature. We plan to adopt the new revenue standard effective January 1, 2018 using the modified retrospective method. |
Intra-Entity Asset Transfers of Assets Other Than Inventory | | Under the new guidance, the tax impact to the seller on the profit from the transfers and the buyer’s deferred tax benefit on the increased tax basis would be recognized when the transfers occur, resulting in the recognition of expense sooner than under historical guidance. The guidance excludes intra-entity transfers of inventory. For intra-entity transfers of inventory, the Financial Accounting Standards Board ("FASB") decided to retain current GAAP, which requires an entity to recognize the income tax consequences when the inventory has been sold to an outside party. | | January 1, 2018 | | We are currently evaluating the implications of adoption on our Consolidated Financial Statements. |
Financial Instruments - Recognition and Measurement of Financial Assets and Liabilities | | The objective of this simplification update is to improve the decision usefulness of financial instrument reporting, and it principally affects accounting for equity investments currently classified as available for sale and financial liabilities where the fair value option has been elected. Entities will have to measure many equity investments at fair value and recognize changes in fair value in net income rather than other comprehensive income as required under current U.S. GAAP. | | January 1, 2018 | | We have identified certain investments that will require an adjustment, however, at this time, we are unable to estimate the impact of adopting this standard as the significance of the impact will depend upon our equity investments as of the date of adoption. |
Perrigo Company plc - Item 1
Note 1
|
| | | | | | |
Recently Issued Accounting Standards Not Yet Adopted (continued) |
Standard | | Description | | Effective Date | | Effect on the Financial Statements or Other Significant Matters |
Leases | | This guidance was issued to increase transparency and comparability among organizations by requiring recognition of lease assets and lease liabilities on the balance sheet and disclosure of key information about leasing arrangements. For leases with a term of 12 months or less, lessees are permitted to make an election to not recognize right-of-use assets and lease liabilities. Upon adoption, lessees will apply the new standard as of the beginning of the earliest comparative period presented in the financial statements, however lessees will be able to exclude leases that expire as of the implementation date. Early adoption is permitted. | | January 1, 2019 | | We are currently evaluating the implications of adoption on our Consolidated Financial Statements and have commenced the first step of identifying a task force to take the lead in implementing the new Lease standard. |
Derivatives and Hedging | | This update was issued to enable entities to better portray the economics of their risk management activities in the financial statements and enhance the transparency and understandability of hedge results. In addition, the amendments simplify the application of hedge accounting in certain situations. Under the new rule, the entity’s ability to hedge non-financial and financial risk components is expanded. The guidance eliminates the requirement to separately measure and report hedge ineffectiveness and also eases certain documentation and assessment requirements. Early adoption is permitted. | | January 1, 2019 | | We are currently evaluating the implications of adoption on our Consolidated Financial Statements.
|
Measurement of Credit Losses on Financial Instruments | | This guidance changes the impairment model for most financial assets and certain other instruments, replacing the current "incurred loss" approach with an "expected loss" credit impairment model, which will apply to most financial assets measured at amortized cost and certain other instruments, including trade and other receivables, loans, held-to-maturity debt securities, and off-balance sheet credit exposures such as letters of credit. Early adoption is permitted. | | January 1, 2020 | | We are currently evaluating the new standard for potential impacts on our receivables, debt, and other financial instruments. |
Intangibles - Goodwill and Other Simplifying the Test for Goodwill | | The objective of this update is to reduce the cost and complexity of subsequent goodwill accounting by simplifying the impairment test by removing the Step 2 requirement to perform a hypothetical purchase price allocation when the carrying value of a reporting unit exceeds its fair value. If a reporting unit’s carrying value exceeds its fair value, an entity would record an impairment charge based on that difference, limited to the amount of goodwill attributed to that reporting unit. The proposal would not change the guidance on completing Step 1 of the goodwill impairment test. The proposed guidance would be applied prospectively. Early adoption is permitted. | | January 1, 2020 | | We are currently evaluating the implications of adoption on our Consolidated Financial Statements.
|
Perrigo Company plc - Item 1
Note 2
NOTE 2 – DIVESTITURES- REVENUE RECOGNITION
Current Year DivestituresThe following is a summary of our net sales by category (in millions):
| | | | | | | | | | | | | | | |
| Three Months Ended | | |
| March 30, 2024 | | April 1, 2023 | | | | |
CSCA(1) | | | | | | | |
| Upper Respiratory | $ | 130.3 | | | $ | 153.7 | | | | | |
| Digestive Health | 122.2 | | | 124.0 | | | | | |
| Nutrition | 90.6 | | | 138.5 | | | | | |
| Pain and Sleep-Aids | 82.6 | | | 103.4 | | | | | |
| Healthy Lifestyle | 71.3 | | | 73.4 | | | | | |
| Oral Care | 64.7 | | | 83.3 | | | | | |
| Skin Care | 49.6 | | | 69.8 | | | | | |
| Women's Health | 27.2 | | | 12.3 | | | | | |
| Vitamins, Minerals, and Supplements ("VMS") | 4.2 | | | 4.5 | | | | | |
Other CSCA(2) | 1.4 | | | 0.8 | | | | | |
| Total CSCA | $ | 644.1 | | | $ | 763.7 | | | | | |
| CSCI | | | | | | | |
| Skin Care | $ | 114.7 | | | $ | 83.4 | | | | | |
| Upper Respiratory | 69.1 | | | 84.8 | | | | | |
| Healthy Lifestyle | 64.6 | | | 66.4 | | | | | |
| Pain and Sleep-Aids | 51.4 | | | 49.9 | | | | | |
| VMS | 44.6 | | | 47.8 | | | | | |
| Women's Health | 32.0 | | | 29.1 | | | | | |
| Oral Care | 28.7 | | | 29.1 | | | | | |
| Digestive Health | 9.5 | | | 8.8 | | | | | |
Other CSCI(3) | 23.3 | | | 18.8 | | | | | |
| Total CSCI | 437.9 | | | 418.1 | | | | | |
| | | | | | | |
| Total net sales | $ | 1,082.1 | | | $ | 1,181.7 | | | | | |
On January 3, 2017, we sold
(1) We updated our global reporting product categories as a result of legacy Rx sales being moved out of Other CSCA and into respective categories. These product categories have been adjusted retroactively to reflect the changes and have no impact on historical financial position, results of operations, or cash flows.
(2) Consists primarily of product sales and royalty income related to supply and distribution agreements and other miscellaneous or otherwise uncategorized product lines and markets, none of which is greater than 10% of the segment net sales.
(3) Consists primarily of our Rare Diseases business and other miscellaneous or otherwise uncategorized product lines and other adjustments, none of which is greater than 10% of the segment net sales.
While the majority of revenue is recognized at a point in time, certain Abbreviated New Drug Applications ("ANDAs")of our product revenue is recognized over time. Customer contracts recognized over time exist predominately in contract manufacturing arrangements, which occur in both the CSCA and CSCI segments. Contract manufacturing revenue was $72.2 million for $15.0the three months ended March 30, 2024, and $90.0 million for the three months ended April 1, 2023.
We also recognize a portion of the store brand OTC product revenues in the CSCA segment on an over time basis; however, the timing difference between over time and point in time revenue recognition for store brand contracts is not significant due to the short time period between the customization of the product and shipment or delivery.
The following table provides information about contract assets from contracts with customers (in millions):
| | | | | | | | | | | | | | | | | |
| Balance Sheet Location | | March 30, 2024 | | December 31, 2023 |
| Short-term contract assets | Prepaid expenses and other current assets | | $ | 25.7 | | | $ | 28.5 | |
Perrigo Company plc - Item 1
Note 2
We generated net sales in the following geographic locations(1) (in millions):
| | | | | | | | | | | | | | | |
| Three Months Ended | | |
| March 30, 2024 | | April 1, 2023 | | | | |
| U.S. | $ | 632.3 | | | $ | 750.0 | | | | | |
Europe(2) | 419.7 | | | 407.3 | | | | | |
All other countries(3) | 30.1 | | | 24.4 | | | | | |
| Total net sales | $ | 1,082.1 | | | $ | 1,181.7 | | | | | |
(1) The net sales by geography are derived from the location of the entity that sells to a third party,party.
(2) Includes Ireland net sales of $4.3 million for the three months ended March 30, 2024, and $7.3 million for the three months ended April 1, 2023.
(3) Includes net sales generated primarily in Australia and Canada.
NOTE 3 - DISCONTINUED OPERATIONS
Our discontinued operations primarily consist of our former Rx segment, which was recorded as a gainheld our prescription pharmaceuticals business in Other operating income on the Condensed Consolidated Statements of OperationsU.S. and our pharmaceuticals and diagnostic businesses in our Prescription Pharmaceuticals ("RX"Israel (collectively, the “Rx business”) segment..
On February 1, 2017,July 6, 2021, we completed the sale of the animal health pet treats plant fixed assets within our Consumer Healthcare AmericasRx business to Altaris Capital Partners, LLC ("CHCA"Altaris") segment,for aggregate consideration of $1.55 billion. The consideration included a $53.3 million reimbursement related to Abbreviated New Drug Application (“ANDA") for a generic topical lotion which Altaris delivered in cash to Perrigo pursuant to the terms of the definitive agreement during the first quarter of 2022.
Under the terms of a transition services agreement ("TSA"), we provided transition services which were previously classifiedsubstantially completed as held-for sale.of the end of the third quarter of 2022. We received $7.7 millionalso entered into reciprocal supply agreements pursuant to which Perrigo will supply certain products to the Rx business and the Rx business will supply certain products to Perrigo. The supply agreements have a term of four years, extendable up to seven years by the party who is the purchaser of the products under such agreement. We also extended distribution rights to the Rx business for certain OTC products owned and manufactured by Perrigo that may be fulfilled through pharmacy channels, in proceeds, which resulted in an immaterial loss.return for a share of the net profits.
On April 6, 2017, we completedIn connection with the sale, Perrigo retained certain pre-closing liabilities arising out of our India Active Pharmaceutical Ingredients ("API"antitrust (refer to Note 15 - Contingencies under the header "Price-Fixing Lawsuits") businessand opioid matters and the Company’s Albuterol recall, subject to, Strides Shasun Limited.in each case, Altaris' obligation to indemnify the Company for fifty percent of these liabilities up to an aggregate cap on Altaris' obligation of $50.0 million. We received $22.2 millionhave not requested payments from Altaris related to the indemnity of proceeds, inclusive of an estimated working capital adjustment, which resulted in an immaterial gain recorded in our Other segment. Prior to closing the sale, we determined that the carrying value of the India API business exceeded its fair value less the cost to sell, resulting in an impairment charge of $35.3 million, which was recorded in Impairment charges on the Consolidated Statements of Operations for the year ended December 31, 2016.
On August 25, 2017, we completed the sale of our Russian business, which was previously classified as held-for-sale, to Alvogen Pharma LLC and Alvogen CEE Kft. The total sale price was €12.7 million ($15.1 million), inclusive of an estimated working capital adjustment, which resulted in an immaterial gain recorded in our Consumer Healthcare International ("CHCI") segment. Prior to closing the sale, we determined that the carrying value of the Russian business exceeded its fair value less the cost to sell, resulting in an impairment charge of $3.7 million, which was recorded in Impairment charges on the Condensed Consolidated Statements of Operations forthese liabilities during the three months ended JulyMarch 30, 2024.
Current and prior period reported net loss from discontinued operations primarily relates to legal fees, partially offset by an income tax benefit.
NOTE 4 - INVENTORIES
Major components of inventory were as follows (in millions):
| | | | | | | | | | | |
| March 30, 2024 | | December 31, 2023 |
| Finished goods | $ | 642.7 | | | $ | 646.8 | |
| Work in process | 236.0 | | | 241.9 | |
| Raw materials | 242.6 | | | 252.2 | |
| Total inventories | $ | 1,121.3 | | | $ | 1,140.9 | |
Perrigo Company plc - Item 1 2017.
Note 5
Prior Year Divestitures
NOTE 5 - INVESTMENTS
On August 5, 2016, we completed
The following table summarizes the salemeasurement category, balance sheet location, and balances of our U.S. Vitamins, Minerals, and Supplements ("VMS") business within our CHCA segment to International Vitamins Corporation ("IVC") for $61.8 million inclusive of an estimated working capital adjustment. Prior to closing the sale, we determined that the carrying value of the VMS business exceeded itsequity securities (in millions):
| | | | | | | | | | | | | | | | | | | | |
| Measurement Category | | Balance Sheet Location | | March 30, 2024 | | December 31, 2023 |
| Fair value method | | Prepaid expenses and other current assets | | $ | — | | | $ | 0.1 | |
Fair value method(1) | | Other non-current assets | | $ | 1.1 | | | $ | 1.3 | |
| Equity method | | Other non-current assets | | $ | 59.5 | | | $ | 60.1 | |
(1) Measured at fair value lessusing the cost to sell, resultingNet Asset Value practical expedient.
The following table summarizes the expense recognized in an impairment chargeearnings of $6.2 million,our equity securities (in millions):
| | | | | | | | | | | | | | | | | | | | | | | | |
| | | | Three Months Ended | | |
| Measurement Category | | Income Statement Location | | March 30, 2024 | | April 1, 2023 | | | | |
| Fair value method | | Other operating expense (income), net | | $ | 0.1 | | | $ | 0.1 | | | | | |
| Equity method | | Other operating expense (income), net | | $ | 0.6 | | | $ | 0.7 | | | | | |
NOTE 6 - LEASES
The balance sheet locations of our lease assets and liabilities were as follows (in millions):
| | | | | | | | | | | | | | | | | | | | |
| Assets | | Balance Sheet Location | | March 30, 2024 | | December 31, 2023 |
| Operating | | Operating lease assets | | $ | 176.7 | | | $ | 183.6 | |
| Finance | | Other non-current assets | | 13.4 | | | 13.7 | |
| Total | | | | $ | 190.1 | | | $ | 197.3 | |
| | | | | | | | | | | | | | | | | | | | |
| Liabilities | | Balance Sheet Location | | March 30, 2024 | | December 31, 2023 |
| Current | | | | | | |
| Operating | | Other accrued liabilities | | $ | 26.6 | | | $ | 27.5 | |
| Finance | | Current indebtedness | | 1.9 | | | 1.9 | |
| Non-Current | | | | | | |
| Operating | | Other non-current liabilities | | 152.5 | | | 159.6 | |
| Finance | | Long-term debt, less current portion | | 13.0 | | | 13.2 | |
| Total | | | | $ | 194.0 | | | $ | 202.2 | |
Perrigo Company plc - Item 1
Note 6
The below tables show our lease assets and liabilities by reporting segment (in millions):
| | | | | | | | | | | | | | | | | | | | | | | | | | | | | | | | | | |
| | Assets |
| | Operating | | Financing | | | | |
| | March 30, 2024 | | December 31, 2023 | | March 30, 2024 | | December 31, 2023 | | | | | | | | |
| CSCA | | $ | 77.3 | | | $ | 79.3 | | | $ | 12.7 | | | $ | 12.8 | | | | | | | | | |
| CSCI | | 42.0 | | | 44.7 | | | 0.2 | | | 0.3 | | | | | | | | | |
| | | | | | | | | | | | | | | | |
| | | | | | | | | | | | | | | | |
| Unallocated | | 57.4 | | | 59.6 | | | 0.5 | | | 0.6 | | | | | | | | | |
| Total | | $ | 176.7 | | | $ | 183.6 | | | $ | 13.4 | | | $ | 13.7 | | | | | | | | | |
| | | | | | | | | | | | | | | | | | | | | | | | | | |
| | Liabilities |
| | Operating | | Financing |
| | March 30, 2024 | | December 31, 2023 | | March 30, 2024 | | December 31, 2023 |
| CSCA | | $ | 79.2 | | | $ | 81.6 | | | $ | 14.1 | | | $ | 14.2 | |
| CSCI | | 45.5 | | | 47.8 | | | 0.2 | | | 0.3 | |
| | | | | | | | |
| | | | | | | | |
| Unallocated | | 54.4 | | | 57.7 | | | 0.6 | | | 0.6 | |
| Total | | $ | 179.1 | | | $ | 187.1 | | | $ | 14.9 | | | $ | 15.1 | |
Lease expense was as follows (in millions):
| | | | | | | | | | | | | | | | | | |
| | Three Months Ended | | |
| | March 30, 2024 | | April 1, 2023 | | | | |
Operating leases(1) | | $ | 11.6 | | | $ | 12.0 | | | | | |
| | | | | | | | |
| Finance leases | | | | | | | | |
| Amortization | | $ | 0.6 | | | $ | 1.1 | | | | | |
| Interest | | 0.1 | | | 0.1 | | | | | |
| Total finance leases | | $ | 0.7 | | | $ | 1.2 | | | | | |
(1) Includes short-term leases and variable lease costs, which was recorded in Impairment charges on the Condensed Consolidated Statementsare immaterial.
The annual future maturities of Operations for the year ended December 31, 2016.our leases as of March 30, 2024 are as follows (in millions):
| | | | | | | | | | | | | | | | | | | | |
| | Operating Leases | | Finance Leases | | Total |
| 2024 | | $ | 24.3 | | | $ | 1.8 | | | $ | 26.1 | |
| 2025 | | 30.3 | | | 1.9 | | | 32.2 | |
| 2026 | | 24.4 | | | 1.6 | | | 26.0 | |
| 2027 | | 22.6 | | | 1.6 | | | 24.2 | |
| 2028 | | 16.5 | | | 1.6 | | | 18.1 | |
| After 2028 | | 88.9 | | | 9.0 | | | 97.9 | |
| Total lease payments | | $ | 207.0 | | | $ | 17.5 | | | $ | 224.5 | |
| Less: Interest | | 27.9 | | | 2.6 | | | 30.5 | |
| Present value of lease liabilities | | $ | 179.1 | | | $ | 14.9 | | | $ | 194.0 | |
Perrigo Company plc - Item 1
Note 6
Our weighted average lease terms and discount rates are as follows:
| | | | | | | | | | | | | | |
| | March 30, 2024 | | April 1, 2023 |
| Weighted-average remaining lease term (in years) | | | | |
| Operating leases | | 9.72 | | 10.85 |
| Finance leases | | 9.43 | | 9.49 |
| Weighted-average discount rate | | | | |
| Operating leases | | 3.3 | % | | 2.5 | % |
| Finance leases | | 3.5 | % | | 3.0 | % |
Our lease cash flow classifications are as follows (in millions):
| | | | | | | | | | | | | | |
| | Three Months Ended |
| | March 30, 2024 | | April 1, 2023 |
| Cash paid for amounts included in the measurement of lease liabilities | | | | |
| Operating cash flows for operating leases | | $ | 8.5 | | | $ | 9.0 | |
| Operating cash flows for finance leases | | $ | 0.1 | | | $ | 0.1 | |
| Financing cash flows for finance leases | | $ | 0.5 | | | $ | 1.0 | |
| | | | |
| Leased assets obtained in exchange for new finance lease liabilities | | $ | 0.3 | | | $ | — | |
| Leased assets obtained in exchange for new operating lease liabilities | | $ | 1.7 | | | $ | 1.4 | |
NOTE 3 –7 - GOODWILL AND OTHER INTANGIBLE ASSETS
Goodwill
Changes in the carrying amount of goodwill, by reportable segment, were as follows (in millions): |
| | | | | | | | | | | | | | | | | | | | |
| Reporting Segments: | | December 31,
2016 | | Business divestitures | | Re-class to assets held-for-sale | | Currency translation adjustment | | September 30,
2017 |
| CHCA | | $ | 1,810.6 |
| | $ | — |
| | $ | — |
| | $ | 2.9 |
| | $ | 1,813.5 |
|
| CHCI | | 1,070.8 |
| | (4.1 | ) | | — |
| | 122.3 |
| | 1,189.0 |
|
| RX | | 1,086.6 |
| | — |
| | — |
| | 6.5 |
| | 1,093.1 |
|
| Other | | 81.4 |
| | — |
| | (32.6 | ) | | 7.6 |
| | 56.4 |
|
| Total goodwill | | $ | 4,049.4 |
| | $ | (4.1 | ) | | $ | (32.6 | ) | | $ | 139.3 |
| | $ | 4,152.0 |
|
| | | | | | | | | | | | | | | | | | | | | | | | | | | | | | |
| | December 31, 2023 | | | | | | | | | | | | Currency translation adjustments | | March 30, 2024 |
CSCA(1) | | $ | 2,080.9 | | | | | | | | | | | | | $ | (1.7) | | | $ | 2,079.2 | |
CSCI(2) | | 1,448.2 | | | | | | | | | | | | | (34.5) | | | 1,413.7 | |
| | | | | | | | | | | | | | | | |
| Total goodwill | | $ | 3,529.1 | | | | | | | | | | | | | $ | (36.2) | | | $ | 3,492.9 | |
As discussed in our Form 10-K for the year ended(1) We had accumulated goodwill impairments of $6.1 million as of March 30, 2024 and December 31, 2016, during the three months ended April 2, 20162023.
(2) We had accumulated goodwill impairments of $968.4 million as of March 30, 2024 and October 1, 2016, we identified indicators of impairment for our Branded Consumer Healthcare - Rest of World ("BCH-ROW") reporting unit and recorded impairment charges of $130.5 million and $675.6 million, respectively. In addition, during the three months ended October 1, 2016, we identified impairment indicators in our Branded Consumer Healthcare - Belgium ("BCH-Belgium") reporting unit and recorded impairment charges of $62.3 million. The impairment charges for both reporting units were recorded within our CHCI segment.December 31, 2023.
Perrigo Company plc - Item 1
Note 37
Intangible Assets
Other intangibleIntangible assets and related accumulated amortization consisted of the following (in millions):
| | | | | | | | | | | | | | | | | | | | | | | | | | | |
| | March 30, 2024 | | December 31, 2023 | | |
| | Gross | | Accumulated
Amortization | | Gross | | Accumulated
Amortization | | | | |
Indefinite-lived intangibles:(1) | | | | | | | | | | | |
| Trademarks, trade names, and brands | $ | 3.3 | | | $ | — | | | $ | 3.4 | | | $ | — | | | | | |
| In-process research and development | 1.9 | | | — | | | 1.9 | | | — | | | | | |
| Total indefinite-lived intangibles | $ | 5.2 | | | $ | — | | | $ | 5.3 | | | $ | — | | | | | |
| Definite-lived intangibles: | | | | | | | | | | | |
| Distribution and license agreements and supply agreements | $ | 88.7 | | | $ | 56.3 | | | $ | 90.8 | | | $ | 57.5 | | | | | |
| Developed product technology, formulations, and product rights | 528.2 | | | 243.9 | | | 534.0 | | | 238.4 | | | | | |
| Customer relationships and distribution networks | 1,840.7 | | | 1,112.8 | | | 1,868.1 | | | 1,108.9 | | | | | |
| Trademarks, trade names, and brands | 2,453.3 | | | 627.6 | | | 2,502.0 | | | 609.3 | | | | | |
| Non-compete agreements | 2.1 | | | 2.1 | | | 2.1 | | | 2.1 | | | | | |
| Total definite-lived intangibles | $ | 4,913.0 | | | $ | 2,042.7 | | | $ | 4,997.0 | | | $ | 2,016.2 | | | | | |
| Total intangible assets | $ | 4,918.2 | | | $ | 2,042.7 | | | $ | 5,002.3 | | | $ | 2,016.2 | | | | | |
|
| | | | | | | | | | | | | | | |
| | September 30, 2017 | | December 31, 2016 |
| | Gross | | Accumulated Amortization | | Gross | | Accumulated Amortization |
Definite-lived intangibles: | | | | | | | |
| Distribution and license agreements, supply agreements | $ | 310.2 |
| | $ | 157.5 |
| | $ | 305.6 |
| | $ | 120.4 |
|
| Developed product technology, formulations, and product rights | 1,355.4 |
| | 568.8 |
| | 1,418.1 |
| | 526.0 |
|
| Customer relationships and distribution networks | 1,623.7 |
| | 424.5 |
| | 1,489.9 |
| | 307.5 |
|
| Trademarks, trade names, and brands | 1,317.5 |
| | 111.0 |
| | 1,189.3 |
| | 55.3 |
|
| Non-compete agreements | 14.7 |
| | 12.3 |
| | 14.3 |
| | 11.2 |
|
| Total definite-lived intangibles | $ | 4,621.5 |
| | $ | 1,274.1 |
| | $ | 4,417.2 |
| | $ | 1,020.4 |
|
Indefinite-lived intangibles: | | | | | | | |
| Trademarks, trade names, and brands | $ | 52.0 |
| | $ | — |
| | $ | 50.5 |
| | $ | — |
|
| In-process research and development | 51.4 |
| | — |
| | 64.0 |
| | — |
|
| Total indefinite-lived intangibles | 103.4 |
| | — |
| | 114.5 |
| | — |
|
| Total other intangible assets | $ | 4,724.9 |
| | $ | 1,274.1 |
| | $ | 4,531.7 |
| | $ | 1,020.4 |
|
(1) Certain intangible assets are denominated in currencies other than the U.S. dollar; therefore, their gross and accumulated amortization balancesnet carrying values are subject to foreign currency movements.
We recorded amortization expense of $88.5$58.4 million and $89.7$65.4 million for the three months ended SeptemberMarch 30, 20172024 and OctoberApril 1, 2016, respectively, and $261.3 million and $263.9 million for the nine months ended September 30, 2017 and October 1, 2016,2023, respectively.
We recorded an impairment charge within our RX segment of $12.7 million on certain In Process Research and Development ("IPR&D") assets during the nine months ended September 30, 2017 due to changes in the projected development and regulatory timelines for various projects. During the nine months ended September 30, 2017, we recorded a decrease in the contingent consideration liability associated with certain IPR&D assets in Other operating income on the Condensed Consolidated Statements of Operations (refer to Note 6).
During the three months ended July 1, 2017, we identified impairment indicators for our Lumara Health, Inc. ("Lumara") product assets. The primary impairment indicators included the decline in our 2017 performance expectations and a reduction in our long-range revenue growth forecast. The assessment utilized the multi-period excess earnings method to determine fair value and resulted in an impairment charge of $18.5 million in Impairment charges on the Condensed Consolidated Statements of Operations within our RX segment, which represented the difference between the carrying amount of the intangible assets and their estimated fair value.
As discussed in our Form 10-K for the year ended December 31, 2016, during the three months ended April 2, 2016, we identified indicators of impairment associated with certain indefinite-lived intangible assets acquired in conjunction with our acquisition of Omega Pharma Invest N.V. ("Omega") and recorded an impairment charge of $273.4 million. In addition, during the three months ended October 1, 2016, we identified indicators of impairment associated with certain indefinite-lived and definite-lived intangible brand category assets acquired in conjunction with the Omega acquisition. As a result of these additional indicators, we recorded impairment charges of $575.7 million on our indefinite-lived assets and $290.9 million on our definite-lived assets. The impairment charges for both the indefinite-lived assets and definite-lived assets were recorded within our CHCI segment.
In addition, due to reprioritization of certain brands in the CHCI segment and change in performance expectations for the cough/cold/allergy, anti-parasite, personal care, lifestyle, and natural health brands, we
Perrigo Company plc - Item 1
Note 3
reclassified $364.5 million and $674.4 million of indefinite-lived assets to definite-lived assets with useful lives of 20 years, which we began amortizing during the second and third quarters of 2016, respectively.
NOTE 4 - ACCOUNTS RECEIVABLE FACTORING
We have multiple accounts receivable factoring arrangements with non-related third-party financial institutions (the “Factors”). Pursuant to the terms of the arrangements, we sell to the Factors certain of our accounts receivable balances on a non-recourse basis for credit approved accounts. An administrative fee ranging from 0.14% to 0.15% per invoice is charged on the gross amount of accounts receivables assigned to the Factors, and interest is calculated at the applicable EUR LIBOR rate plus 70 basis points. The total amount factored on a non-recourse basis and excluded from accounts receivable was $24.3 million and $50.7 million at September 30, 2017 and December 31, 2016, respectively.
NOTE 5 – INVENTORIES
Major components of inventory were as follows (in millions):
|
| | | | | | | |
| | September 30,
2017 | | December 31,
2016 |
| Finished goods | $ | 471.4 |
| | $ | 431.1 |
|
| Work in process | 146.8 |
| | 165.7 |
|
| Raw materials | 203.7 |
| | 198.2 |
|
| Total inventories | $ | 821.9 |
| | $ | 795.0 |
|
NOTE 6 –8 - FAIR VALUE MEASUREMENTS
Fair value is the price that would be received upon sale of an asset or paid to transfer a liability in an orderly transaction between market participants at the measurement date. The following fair value hierarchy is used in selecting inputs, with the highest priority given to Level 1, as these are the most transparent or reliable.
| |
Level 1: | Quoted prices for identical instruments in active markets. |
| |
Level 2: | Quoted prices for similar instruments in active markets; quoted prices for identical or similar instruments in markets that are not active; and model-derived valuations in which all significant inputs are observable in active markets. |
| |
Level 3: | Valuations derived from valuation techniques in which one or more significant inputs are not observable. |
Perrigo Company plc - Item 1
Note 6
The following table below summarizes the valuation of our financial instruments carried at fair value and measured at fair value on a recurring and non-recurring basis by the aboveapplicable pricing categories (in millions):
| | | | | | | | | | | | | | | | | | | | | | | | | | | | | | | | | | | | | | |
| | March 30, 2024 | | December 31, 2023 |
| Measured at fair value on a recurring basis: | | Level 1 | | Level 2 | | Level 3 | | Level 1 | | Level 2 | | Level 3 |
| Assets: | | | | | | | | | | | | |
| Investment securities | | $ | — | | | $ | — | | | $ | — | | | $ | 0.1 | | | $ | — | | | $ | — | |
| Foreign currency forward contracts | | — | | | 1.9 | | | — | | | — | | | 0.6 | | | — | |
| | | | | | | | | | | | |
| | | | | | | | | | | | |
| Interest rate swap agreements | | — | | | 49.2 | | | — | | | — | | | 30.5 | | | — | |
| | | | | | | | | | | | |
| Total assets | | $ | — | | | $ | 51.1 | | | $ | — | | | $ | 0.1 | | | $ | 31.1 | | | $ | — | |
| Liabilities: | | | | | | | | | | | | |
| Cross-currency swap | | $ | — | | | $ | 130.5 | | | $ | — | | | $ | — | | | $ | 172.0 | | | $ | — | |
| Foreign currency forward contracts | | — | | | 2.6 | | | — | | | — | | | 2.7 | | | — | |
| | | | | | | | | | | | |
| Interest rate swap agreements | | — | | | 4.7 | | | — | | | — | | | 11.7 | | | — | |
| Total liabilities | | $ | — | | | $ | 137.8 | | | $ | — | | | $ | — | | | $ | 186.4 | | | $ | — | |
| | | | | | | | | | | | |
| Measured at fair value on a non-recurring basis: | | | | | | | | | | | | |
| Assets: | | | | | | | | | | | | |
Goodwill(1) | | $ | — | | | $ | — | | | $ | — | | | $ | — | | | $ | — | | | $ | 118.9 | |
| | | | | | | | | | | | |
| | | | | | | | | | | | |
| | | | | | | | | | | | |
| Total assets | | $ | — | | | $ | — | | | $ | — | | | $ | — | | | $ | — | | | $ | 118.9 | |
| | | | | | | | | | | | |
| | | | | | | | | | | | |
| | | | | | | | | | | | |
| | | | | | | | | | | | |
(1) During the year ended December 31, 2023, goodwill within our Rare Diseases reporting unit with a carrying value of $208.9 million was written down to a fair value of $118.9 million. |
| | | | | | | | | | |
| | | | | Fair Value |
| | | Fair Value Hierarchy | | September 30,
2017 | | December 31,
2016 |
| Measured at fair value on a recurring basis: | | | | | | |
| Assets: | | | | | | |
| Investment securities | | Level 1 | | $ | 6.1 |
| | $ | 38.2 |
|
| | | | | | | |
| Foreign currency forward contracts | | Level 2 | | $ | 13.1 |
| | $ | 3.8 |
|
| Funds associated with Israeli severance liability | | Level 2 | | 16.1 |
| | 15.9 |
|
| Total level 2 assets | | | | $ | 29.2 |
| | $ | 19.7 |
|
| | | | | | | |
| Royalty Pharma contingent milestone payments | | Level 3 | | $ | 143.2 |
| | $ | — |
|
| Financial assets | | Level 3 | | — |
| | 2,350.0 |
|
| Total level 3 assets | | | | $ | 143.2 |
| | $ | 2,350.0 |
|
| | | | | | | |
| Liabilities: | | | | | | |
| Foreign currency forward contracts | | Level 2 | | $ | 3.3 |
| | $ | 5.0 |
|
| | | | | | | |
| Contingent consideration | | Level 3 | | $ | 44.9 |
| | $ | 69.9 |
|
| | | | | | | |
| Measured at fair value on a non-recurring basis: | | | | | | |
| Assets: | | | | | | |
Goodwill(1) | | Level 3 | | $ | — |
| | $ | 1,148.4 |
|
Indefinite-lived intangible assets(2) | | Level 3 | | 13.3 |
| | 0.3 |
|
Definite-lived intangible assets(3) | | Level 3 | | 11.5 |
| | 758.0 |
|
| Assets held for sale, net | | Level 3 | | 95.1 |
| | 18.2 |
|
| Total level 3 assets | | | | $ | 119.9 |
| | $ | 1,924.9 |
|
| |
(1)
| As of December 31, 2016, goodwill with a carrying amount of $2.2 billion was written down to its implied fair value of $1.1 billion. |
| |
(2)
| As of September 30, 2017, indefinite-lived intangible assets with a carrying amount of $26.0 million were written down to a fair value of $13.3 million. As of December 31, 2016, indefinite-lived intangible assets with a carrying amount of $0.7 million were written down to a fair value of $0.3 million. |
| |
(3)
| As of July 1, 2017, definite-lived intangible assets with a carrying amount of $31.1 million were written down to a fair value of $11.5 million. As of December 31, 2016, definite-lived intangible assets with a carrying amount of $2.3 billion were written down to a fair value of $758.0 million. Included in this balance are indefinite-lived intangible assets with a fair value of $364.5 million and $674.2 million that were reclassified to definite-lived assets at April 3, 2016 and October 2, 2016, respectively. |
There were no transfers amongwithin Level 1, 2, and 3 fair value measurements during the three and nine months endedSeptember March 30, 20172024 or the year ended December 31, 2016. Our policy regarding the recording of transfers between levels is to record any such transfers at the end of the reporting period (refer to Note 7 for information on our investment securities and Note 8 for a discussion of derivatives).2023.
Perrigo Company plc - Item 1
Note 68
Non-recurring Fair Value Measurements
Foreign Currency Forward Contracts
TheNon-recurring fair value of foreign currency forward contracts is determined using a market approach, which utilizes values for comparable derivative instruments.
Funds Associated with Israel Severance Liability
Israeli labor laws and agreements require us to pay benefits to employees dismissed or retiring under certain circumstances. Severance pay is calculated on the basis of the most recent employee salary levels and the length of employee service. Our Israeli subsidiaries also provide retirement bonuses to certain managerial employees. We make regular deposits to retirement funds and purchase insurance policies to partially fund these liabilities. The funds are determined using prices for recently traded financial instruments with similar underlying terms, as well as directly or indirectly observable inputs, such as interest rates and yield curves, that are observable at commonly quoted intervals.
Royalty Pharma Contingent Milestone Payments and Financial Assets
On December 18, 2013, we acquired Elan, which had a royalty agreement with Biogen Idec Inc. ("Biogen"), whereby Biogen conveyed the right to receive royalties that are typically payable on sales revenue generated by the sale, distribution or other use of the drug Tysabri®. Pursuant to the royalty agreement, werepresent only those assets whose carrying values were entitled to royalty payments from Biogen based on its Tysabri® sales in all indications and geographies. We received royalties of 12% on worldwide Biogen sales of Tysabri® from December 18, 2013 through April 30, 2014. From May 1, 2014, we received royalties of 18% on annual worldwide Biogen sales of Tysabri® up to $2.0 billion and 25% on annual sales above $2.0 billion.
We accounted for the Tysabri® royalty stream as a financial asset and elected to use the fair value option model. We made the election to account for the Tysabri® financial asset using the fair value option as we believed this method was most appropriate for an asset that did not have a par value, a stated interest stream, or a termination date. The financial asset acquired represented a single unit of accounting. The fair value of the financial asset acquired was determined by using a discounted cash flow analysis related to the expected probability weighted future cash flows to be generated by the royalty stream. The financial asset was classified as a Level 3 asset within the fair value hierarchy, as our valuation utilized significant unobservable inputs, including industry analyst estimates for global Tysabri® sales, probability weighted as to the timing and amount of future cash flows along with certain discount rate assumptions. Cash flow forecasts included the estimated effect and timing of future competition, considering patents in effect for Tysabri® through 2024 and contractual rights to receive cash flows into perpetuity. The discounted cash flows were based upon the expected royalty stream forecasted into perpetuity using a 20-year discrete period with a declining rate terminal value.
In the first quarter of 2016, a competitor's pipeline product, Ocrevus®, received breakthrough therapy designation from the U.S. Food and Drug Administration ("FDA"). Breakthrough therapy designation is granted when a drug is intended alone or in combination with one or more other drugs to treat a serious or life threatening disease or condition and preliminary clinical evidence indicates that the drug may demonstrate substantial improvement over existing therapies on one or more clinically significant endpoints, such as substantial treatment effects observed early in clinical development. In June 2016, the FDA granted priority review with a target action date in December 2016. A priority review is a designation when the FDA will direct overall attention and resources to the evaluation of applications for drugs that, if approved, would be significant improvements in the safety or effectiveness of the treatment, diagnosis, or prevention of serious conditions when compared to standard applications. The product was approved late in the first quarter of 2017. The product is expected to compete with Tysabri®, and we expected it to have a significant negative impact on the Tysabri® royalty stream. Industry analysts believe that, based on released clinical study information, Ocrevus® will compete favorably against Tysabri® in the relapsing, remitting multiple sclerosis market segment due to its high efficacy and convenient dosage form.
Perrigo Company plc - Item 1
Note 6
Given the new market information for Ocrevus®, we used industry analyst estimates to reduce our first ten year growth forecasts from an average of growth of approximately 3.4% in the fourth calendar quarter of 2015 to an average decline of approximately minus 2.0% in the third and fourth calendar quarters of 2016. In November 2016, we announced we were evaluating strategic alternatives for the Tysabri® asset. As of December 31, 2016, the financial asset was adjusted based on the strategic review and sale process. These effects, combined with the change in discount rate each quarter, led to a reduction in fair value of $204.4 million, $910.8 million, $377.4 million and $1.1 billion in the first, second, third and fourth quarters of 2016, respectively.
On March 27, 2017, we announced the completed divestment of our Tysabri® financial asset to Royalty Pharma for up to $2.85 billion, which consists of $2.2 billion in cash and up to $250.0 million and $400.0 million in milestone payments if the royalties on global net sales of Tysabri® that are received by Royalty Pharma meet specific thresholds in 2018 and 2020, respectively. As a result of this transaction, we transferred the entire financial asset to Royalty Pharma and recorded a $17.1 million gain during the three months ended July 1, 2017. We elected to account for the contingent milestone payments using the fair value option method, and these were recorded at an estimated fair value of $143.2 million as of September 30, 2017. We chose the fair value option as we believe it will help investors understand the potential future cash flows we may receive associated with the two contingent milestones.
We valued the contingent milestone payments using a modified Black-Scholes Option Pricing Model ("BSOPM"). Key inputs in the BSOPM are the estimated volatility and rate of return of royalties on global net sales of Tysabri® that are received by Royalty Pharma over time until payment of the contingent milestone payments is completed. Volatility and the estimated fair value of the milestones have a positive relationship such that higher volatility translates to a higher estimated fair value of the contingent milestone payments. In the valuation of contingent milestone payments performed, we assumed volatility of 30.0% and a rate of return of 8.05% as of July 1, 2017 and volatility of 30.0% and a rate of return of 8.06% as of September 30, 2017. We assess volatility and rate of return inputs quarterly by analyzing certain market volatility benchmarks and the risk associated with Royalty Pharma achieving the underlying projected royalties. During the three and nine months ended September 30, 2017, the fair value of the Royalty Pharma contingent milestone payments decreased $2.9 million and $42.1 million, respectively, as a result of the decrease in the estimated projected Tysabri® revenues due to the launch of Ocrevus® late in the first quarter of 2017.
Our accounts receivable balance at December 31, 2016 included $84.4 million related to the Tysabri® financial asset.
The table below presents a reconciliation for the Royalty Pharma contingent milestone payments measured at fair value on a recurring basis using significant unobservable inputs (Level 3) (in millions). Change in fair value in the table was recorded in Change in financial assets on the Condensed Consolidated Statements of Operations.
|
| | | | | | | |
| | Three Months Ended | | Nine Months Ended |
| | September 30,
2017 | | September 30,
2017 |
| Royalty Pharma Contingent Milestone Payments | | | |
| Beginning balance | $ | 145.8 |
| | $ | — |
|
| Additions | — |
| | 184.5 |
|
| Foreign currency effect | 0.3 |
| | 0.8 |
|
| Change in fair value | (2.9 | ) | | (42.1 | ) |
| Ending balance | $ | 143.2 |
| | $ | 143.2 |
|
Contingent Consideration
Contingent consideration represents milestone payment obligations obtained through product acquisitions, which are valued using estimates based on probability-weighted outcomes, sensitivity analysis, and discount rates reflective of the risk involved. The estimates are updated quarterly and the liabilities are adjusted to fair value depending on a number of assumptions, including the competitive landscape and regulatory approvals that may impact the future sales of a product. We reduced a contingent consideration liability associated with certain IPR&D assets (refer to Note 3) and recorded a corresponding gain of $17.0 million during the nine months ended September 30, 2017. The liability decrease relates to a reduction of the probability of achievement assumptions andreporting period.Perrigo Company plc - Item 1
Note 6
anticipated cash flows. Purchases or additions for the nine months ended October 1, 2016 included contingent consideration associated with five transactions.
The table below presents a reconciliation for liabilities measured at fair value on a recurring basis using significant unobservable inputs (Level 3) (in millions). Net realized losses in the table were recorded in Other (income) expense, net on the Condensed Consolidated Statements of Operations.
|
| | | | | | | | | | | | | | | |
| | Three Months Ended | | Nine Months Ended |
| | September 30,
2017 | | October 1,
2016 | | September 30,
2017 | | October 1,
2016 |
| Contingent Consideration | | | | | | | |
| Beginning balance | $ | 49.7 |
| | $ | 44.9 |
| | $ | 69.9 |
| | $ | 17.9 |
|
| Net realized losses | (2.9 | ) | | (0.4 | ) | | (18.5 | ) | | (4.0 | ) |
| Purchases or additions | — |
| | 30.6 |
| | — |
| | 61.1 |
|
| Foreign currency effect | 0.2 |
| | — |
| | 1.5 |
| | 0.1 |
|
| Settlements | (2.1 | ) | | (0.1 | ) | | (8.0 | ) | | (0.1 | ) |
| Ending balance | $ | 44.9 |
| | $ | 75.0 |
| | $ | 44.9 |
| | $ | 75.0 |
|
Goodwill and Indefinite-Lived Intangible Assets
We have seven reporting units for which we assess goodwill for impairment. We utilize a comparable company market approach, weighted equally with a discounted cash flow analysis, to determine the fair value of the reporting units. We utilize either a relief from royalty method or a multi-period excess earnings method ("MPEEM") to value our indefinite-lived intangible assets, and use a consistent set of projected financial information for the goodwill and indefinite-lived asset impairment tests. The discounted cash flow analysis that we prepared for goodwill impairment testing purposes for the year ended December 31, 2016 included long-term growth rates ranging from 2.0% to 3.0%. We also utilized discount rates ranging from 7.0% to 14.5%, which were deemed to be commensurate with the required investment return and risk involved in realizing the projected free cash flows of each reporting unit. In addition, we burdened projected free cash flows with the capital spending deemed necessary to support the cash flows of each reporting unit, and applied the tax rates that were applicable to the jurisdictions represented within each reporting unit. We recorded impairment charges on the Condensed Consolidated Statements of Operations related to goodwill in the BCH-ROW reporting unit and indefinite-lived intangible assets of $130.5 million and $273.4 million, respectively, for the three months ended April 2, 2016. For the three months ended October 1, 2016, we recorded impairment charges related to goodwill on the Condensed Consolidated Statements of Operations of $675.6 million in the BCH-ROW reporting unit and $62.3 million in the BCH-Belgium reporting unit, as well as indefinite-lived intangible asset impairments of $575.7 million (refer to Note 3).
Definite-Lived Intangible Assets
When assessing our definite-lived assets for impairment, we utilize either a MPEEM or a relief from royalty method to determine the fair value of the asset and use the forecasts that are consistent with those used in the reporting unit analysis. Below is a summary of the various metrics used in our valuations:
|
| |
| Nine Months Ended |
| September 30, 2017 |
| Lumara |
5-year average growth rate | (4.1)% |
Discount rate | 13.5% |
Valuation method | MPEEM |
Perrigo Company plc - Item 1
Note 6
|
| | | | | | | | | |
| | Year Ended |
| | December 31, 2016 |
| | Omega - Lifestyle | | Omega - XLS | | Entocort® - Branded Products | | Entocort® - AG Products | | Herron Trade Names and Trademarks |
| 5-year average growth rate | 2.5% | | 3.2% | | (31.7)% | | (30.4)% | | 4.6% |
| Long-term growth rates | 2.0% | | NA | | (10.0)% | | (4.7)% | | 2.5% |
| Discount rate | 9.3% | | 9.5% | | 13.0% | | 10.5% | | 10.8% |
| Royalty rate | NA | | 4.0% | | NA | | NA | | 11.0% |
| Valuation method | MPEEM | | Relief from Royalty | | MPEEM | | MPEEM | | Relief from Royalty |
We recorded Impairment charges on the Condensed Consolidated Statements of Operations related to definite-lived intangible assets of $18.5 million and $290.9 million for the nine months ended September 30, 2017 and October 1, 2016, respectively (refer to Note 3).
Assets Held For Sale
When a group of assets is classified as held-for-sale, the book value is evaluated and adjusted to the lower of its carrying amount or fair value less the cost to sell (refer to Note 9).
Fixed Rate Long-term Debt
As of September 30, 2017 and December 31, 2016, ourOur fixed rate long-term debt consisted of public bonds, a private placement note, and retail bonds. As of September 30, 2017, the public bonds had a carrying value offollowing (in millions):
$2.6 billion and a fair value of $2.7 billion. As of December 31, 2016, the public bonds had a carrying value and fair value of $4.6 billion. | | | | | | | | | | | | | |
| March 30, 2024 | December 31, 2023 |
| Public Bonds | Level 1 | | Level 1 | | |
| | | | | |
| Carrying value (excluding discount) | $ | 2,244.4 | | | $ | 2,244.4 | | | |
| Fair value | $ | 2,083.8 | | | $ | 2,062.2 | | | |
| | | | | |
| | | | | |
| | | | | |
| | | | | |
The fair values of our public bonds for bothall periods were based on quoted market prices
(Level 1).
As of September 30, 2017, our retail bonds and private placement note had a carrying value of $655.8 million (excluding a premium of $35.6 million) and a fair value of $699.2 million. As of December 31, 2016, our retail bonds and private placement note had a carrying value of $773.1 million (excluding a premium of $49.8 million) and a fair value of $825.0 million.prices. The fair values of our retail bonds and private placement notenotes for bothall periods were based on interest rates offered for borrowings of a similar nature and remaining maturities (Level 2).maturities.
The carrying amounts of our other financial instruments, consisting of cash and cash equivalents, accounts receivable, accounts payable, short-term debt, revolving credit agreements, and variable rate long-term debt, approximate their fair value.
NOTE 7 – INVESTMENTS
Available for Sale Securities
Our available for sale securities are reported in Prepaid expenses and other current assets. Unrealized investment gains/(losses) on available for sale securities were as follows (in millions):
|
| | | | | | | |
| | September 30,
2017 | | December 31, 2016 |
| Equity securities, at cost less impairments | $ | 15.5 |
| | $ | 16.5 |
|
| Gross unrealized gains | — |
| | 21.7 |
|
| Gross unrealized losses | (9.4 | ) | | — |
|
| Estimated fair value of equity securities | $ | 6.1 |
| | $ | 38.2 |
|
The factors affecting the assessment of impairments include both general financial market conditions and factors specific to a particular company. During the nine months ended October 1, 2016, we recorded an impairment charge of $1.8 million, which related to other-than-temporary impairments of marketable equity securities due to prolonged losses incurred on each of the investments.
Perrigo Company plc - Item 1
Note 7
We have evaluated the near-term prospects of the equity securities in relation to the severity and duration of any impairments, and based on that evaluation, we have the ability and intent to hold these investments until a recovery of fair value.
During the nine months ended September 30, 2017, we sold a number of our investment securities and recorded a gain of $1.6 million. The gain was reclassified out of Accumulated Other Comprehensive Income (loss) ("AOCI") and into earnings.
Cost Method Investments
Our cost method investments totaled $7.2 million and $6.9 million at September 30, 2017 and
December 31, 2016, respectively, and are included in Other non-current assets.
Equity Method Investments
Our equity method investments totaled$4.8 million and $4.6 million at September 30, 2017 and December 31, 2016, respectively, and are included in Other non-current assets. We recorded net losses of $0.1 million and net gains of $0.2 million during the three and nine months ended September 30, 2017, respectively, and net gains of $0.1 million and net losses of $3.8 million during the three and nine months endedOctober 1, 2016, respectively, for our proportionate share of the equity method investment earnings or losses. The gains and losses were recorded in Other (income) expense, net on the Condensed Consolidated Statements of Operations.
During the nine months ended October 1, 2016, one of our equity method investments became publicly traded. As a result, we transferred the $15.5 million investment to available for sale and recorded an $8.7 million unrealized gain, net of tax in Other Comprehensive Income ("OCI"). In addition, due to significant and prolonged losses incurred on one of our equity method investments, we recorded a $22.3 million impairment charge in Other (income) expense, net on the Condensed Consolidated Statements of Operations.
NOTE 8 –9 - DERIVATIVE INSTRUMENTS AND HEDGING ACTIVITIES
We enter into certain derivative financial instruments, when available on a cost-effective basis,Interest Rate Swaps
In April 2022, to mitigate our risk associated with changes ineconomically hedge the interest rates and foreign currency exchange rates as follows:
Interest rate risk management - We are exposed toof the impact of interest rate changes through our cash investments and borrowings. We utilize a variety of strategies to manage the impact of changesSenior Secured Credit Facilities (as defined in interest rates, including using a mix of debt maturities along with both fixed-rate and variable-rate debt. In addition,Note 10), we may enterentered into treasury-lock agreements andfive variable-to-fixed interest rate swap agreements on certain investing and borrowing transactions to manage our exposure toagreements. Three of the interest rate changes and our overall cost of borrowing.
Foreign currency exchange risk management - We conduct business in several major currencies other than the U.S. dollar and are subject to risks associated with changing foreign exchange rates. Our objective is to reduce cash flow volatility associated with foreign exchange rate changes on a consolidated basis to allow management to focus its attention on business operations. Accordingly, we enter into various contracts that change in value as foreign exchange rates change to protect the value of existing foreign currency assets and liabilities, commitments, and anticipated foreign currency sales and expenses.
All derivative instruments are managed on a consolidated basis to efficiently net exposures and thus take advantage of any natural offsets. Gains and losses related to the derivative instruments are expected to be offset largely by gains and losses on the original underlying asset or liability. We do not use derivative financial instruments for speculative purposes.
All of ourswaps were designated
derivatives were classified as cash flow hedges
as of September 30, 2017 and December 31, 2016. Designated derivatives meet hedge accounting criteria, which meansto fix the
fair valueinterest rate on a substantial portion of the
Term Loan B Facility (as defined in Note 10). The interest rate swaps cover an interest period ranging from June 1, 2022, through April 1, 2029, on notional balances that decline from $1.0 billion to $812.5 million over the term. The other two interest rate swaps were designated as cash flow hedges to fix the interest rate on a substantial portion of the Term Loan A Facility (as defined in Note 10). The interest rate swaps cover an interest period ranging from June 1, 2022, through April 1, 2027, on notional balances that decline from $487.5 million to $387.5 million over the term.
In December 2023, to economically hedge is recordedthe interest rate risk of the Term B Loans (as defined in shareholders’ equityNote 10), we entered into four variable-to-fixed interest rate swap agreements. The interest rate swaps were designated as cash flow hedges to fix the interest rate on a componentsubstantial portion of OCI, net of tax.the Term B Loans (as defined in Note 10). The deferredinterest rate swaps cover an interest period from December 15, 2023 through April 20, 2029, on notional balances that decline from $300 million to $229 million over the term.
As a designated cash flow hedge, gains and losses arewill be deferred in AOCI and recognized in income in the period in which the hedged item affects earnings. Any ineffective portion of the change
Perrigo Company plc - Item 1
Note 8
in fair value of the derivativewithin Interest expense, net when interest is immediately recognized in earnings. All of our designated derivatives are assessed for hedge effectiveness quarterly.
We also have economic non-designated derivatives that do not meet hedge accounting criteria. These derivative instruments are adjusted to current market value at the end of each period through earnings. Gains or losses on these instruments are offset substantially by the remeasurement adjustmentpaid on the hedged item. Senior Secured Credit Facilities.
Interest RateCross-currency Swaps and Treasury Locks
Interest rate swap agreements are contracts to exchange floating rate for fixed rate payments (or vice versa) over the life of the agreement without the exchange of the underlying notional amounts. The notional amounts of the interest rate swap agreements are used to measure interest to be paid or received and do not represent the amount of exposure to credit loss. The differential paid or received on the interest rate swap agreements is recognized as an adjustment to interest expense.
During the three months ended July 1, 2017, we repaid $584.4 million of senior notes with an interest rate of 4.000% due 2023 and $309.5 million of senior notes with an interest rate of 5.300% due 2043 (refer to Note 10). As a result of the senior note repayments on June 15, 2017, the proportionate amount remaining in OCI related to the pre-issuance hedge was reclassified to earnings. Accordingly, we recorded a loss of $5.9 million in Other expense, net, on the Condensed Consolidated Statements of Operations during the three months ended July 1, 2017 for the amount remaining in OCI.
During the six months ended December 31, 2015,In October 2022, we entered into a forwardthree fixed-for-fixed cross currency interest rate swapswaps at market rates and designated the instruments as net investment hedges on our investment in European operations. The following are the terms and notional amounts outstanding:
•$700 million notional amount outstanding from October 25, 2022 through December 15, 2024;
•$700 million notional amount outstanding from October 25, 2022 through March 15, 2026; and
•$100 million notional amount outstanding from October 25, 2022 through June 15, 2030.
On November 21, 2023, we entered into fixed-for-fixed cross currency interest rate swaps designated as net investment hedges to hedge against changesthe EUR currency exposure of our investment in European operations. The following are the benchmark interest rate between the date the interest rate swap was entered intoterms and the date of expected future debt issuance. The interest rate swap was designated as a cash flow hedge and had a notional amount totaling $200.0 million. The interest rate swap was settled upon the issuance of an aggregate $1.2 billion principaloutstanding:
Perrigo Company plc - Item 1
Note 9
•$300 million notional amount of senior notes on March 7, 2016 for a cumulative after-tax loss of $7.0 million in OCI during the three months endedoutstanding from November 21, 2023 through April 2, 2016.20, 2027.
Foreign Currency DerivativesForwards
We enter intoNotional amounts of foreign currency forward contracts both designated and non-designated,were as follows (in millions):
| | | | | | | | | | | | | | |
| | March 30, 2024 | | December 31, 2023 |
| British Pound (GBP) | | $ | 128.9 | | | $ | 72.4 | |
| Swedish Krona (SEK) | | 68.4 | | | 36.5 | |
| European Euro (EUR) | | 66.8 | | | 79.9 | |
| Danish Krone (DKK) | | 54.4 | | | 5.9 | |
| United States Dollar (USD) | | 52.4 | | | 22.1 | |
| Canadian Dollar (CAD) | | 38.1 | | | 7.1 | |
| Chinese Yuan (CNH) | | 24.2 | | | 14.1 | |
| Polish Zloty (PLZ) | | 18.9 | | | 3.8 | |
| Norwegian Krone (NOK) | | 4.2 | | | 4.4 | |
| Hungarian Forint (HUF) | | 3.7 | | | 3.9 | |
| | | | |
| | | | |
| | | | |
| | | | |
| | | | |
| | | | |
Other (1) | | 3.2 | | | 3.5 | |
| Total | | $ | 463.2 | | | $ | 253.6 | |
(1) Number consists of various currencies notional amounts, none of which individually exceed $10 million in order to manage the impacteither period presented.
The maximum term of foreignour forward currency exchange fluctuations on expected future purchases and related payables denominated in a foreign currency, as well as to hedge the impact of foreign exchange fluctuations on expected future sales and related receivables denominated in a foreign currency. Both types of forward contracts have a maximum maturity date of 18is 60 months. The total notional amount for these contracts was $578.3 million and $533.5 million as of September 30, 2017 and December 31, 2016, respectively.
Effects of Derivatives on the Financial Statements
The below tables indicate the effects of all derivative instruments on the Condensed Consolidated Financial Statements. All amounts exclude income tax effects and are presented in millions.
effects. The balance sheet location and gross fair value of our outstanding derivative instruments were as follows:follows (in millions):
| | | | | | | | | | | | | | | | | |
| | | |
| Balance Sheet Location | | March 30, 2024 | | December 31, 2023 |
| Designated derivative assets: | | | | | |
| Foreign currency forward contracts | Prepaid expenses and other current assets | | $ | 1.5 | | | $ | — | |
| | | | | |
| Foreign currency forward contracts | Other non-current assets | | 0.3 | | | 0.4 | |
| | | | | |
| | | | | |
| Interest rate swap agreements | Other non-current assets | | 49.2 | | | 30.5 | |
| Total designated derivative assets | | | $ | 51.0 | | | $ | 30.9 | |
| Non-designated derivative assets: | | | | | |
| Foreign currency forward contracts | Prepaid expenses and other current assets | | $ | 0.1 | | | $ | 0.2 | |
| | | | | |
| | | | | |
| Total non-designated derivative assets | | | $ | 0.1 | | | $ | 0.2 | |
| Designated derivative liabilities: | | | | | |
| Foreign currency forward contracts | Other accrued liabilities | | $ | 1.8 | | | $ | — | |
| Cross-currency swap | Other accrued liabilities | | 59.0 | | | 75.1 | |
| Cross-currency swap | Other non-current liabilities | | 71.5 | | | 96.9 | |
| Interest rate swap agreements | Other non-current liabilities | | 4.7 | | | 11.7 | |
| Total designated derivative liabilities | | | $ | 137.0 | | | $ | 183.7 | |
| Non-designated derivative liabilities: | | | | | |
| Foreign currency forward contracts | Other accrued liabilities | | $ | 0.8 | | | $ | 2.7 | |
|
| | | | | | | | | |
| | Asset Derivatives |
| | Balance Sheet Location | | Fair Value |
| | | | September 30,
2017 | | December 31,
2016 |
| Designated derivatives: | | | | | |
| Foreign currency forward contracts | Other current assets | | $ | 4.6 |
| | $ | 3.1 |
|
| Non-designated derivatives: | | | | | |
| Foreign currency forward contracts | Other current assets | | $ | 8.5 |
| | $ | 0.7 |
|
Perrigo Company plc - Item 1
Note 89
|
| | | | | | | | | |
| | Liability Derivatives |
| | Balance Sheet Location | | Fair Value |
| | | | September 30,
2017 | | December 31,
2016 |
| Designated derivatives: | | | | | |
| Foreign currency forward contracts | Accrued liabilities | | $ | 2.6 |
| | $ | 3.0 |
|
| Non-designated derivatives: | | | | | |
| Foreign currency forward contracts | Accrued liabilities | | $ | 0.7 |
| | $ | 2.0 |
|
The gains (losses) recordedamounts of (income)/expense recognized in OCI forearnings related to our non-designated derivatives on the effective portionConsolidated Statements of our designated cash flow hedgesOperations were as follows:follows (in millions):
| | | | | | | | | | | | | | | | | | | | | | | | |
| | | | Three Months Ended | | |
| Non-Designated Derivatives | | Income Statement Location | | March 30, 2024 | | April 1, 2023 | | | | |
| Foreign currency forward contracts | | Other (income) expense, net | | $ | (2.1) | | | $ | (1.2) | | | | | |
| | Interest expense, net | | — | | | (0.6) | | | | | |
| | | | $ | (2.1) | | | $ | (1.8) | | | | | |
| | | | | | | | | | |
| | | | | | | | | | |
| | | | | | | | | | |
| | | | | | | | | | |
|
| | | | | | | | | | | | | | | | |
| | | Amount of Gain/(Loss) Recorded in OCI
(Effective Portion) |
| | | Three Months Ended | | Nine Months Ended |
| Designated Cash Flow Hedges | | September 30,
2017 | | October 1,
2016 | | September 30,
2017 | | October 1,
2016 |
| Interest rate swap agreements | | $ | — |
| | $ | — |
| | $ | — |
| | $ | (9.0 | ) |
| Foreign currency forward contracts | | 1.1 |
| | 3.4 |
| | 6.3 |
| | 4.7 |
|
| Total | | $ | 1.1 |
| | $ | 3.4 |
| | $ | 6.3 |
| | $ | (4.3 | ) |
The gains (losses) reclassified fromfollowing tables summarize the effect of derivative instruments designated as hedging instruments in AOCI into earnings for the effective portion(in millions):
| | | | | | | | | | | | | | | | | | | | | | | | | | | | | | | | |
| | Gain/(Loss) |
| | | | Reclassified from AOCI into Earnings | | Related to Amounts Excluded from Effectiveness Testing |
| | Amount Recorded in OCI(1) | | Classification | | Amount(2) | | Classification | | Amount Recognized in Earnings on Derivatives |
| Three Months Ended March 30, 2024 | | | | | | | | | | |
| Cash flow hedges | | | | | | | | | | |
| | | | | | | | | | |
| Interest rate swap agreements | | $ | 33.5 | | | Interest expense, net | | $ | 7.8 | | | Interest expense, net | | $ | — | |
| Foreign currency forward contracts | | $ | 0.9 | | | Net sales | | $ | 0.1 | | | Net sales | | $ | (0.3) | |
| | | | Cost of sales | | $ | — | | | Cost of sales | | $ | (0.2) | |
| | | | | | | | Other (income) expense, net | | $ | — | |
| Total Cash flow hedges | | $ | 34.4 | | | | | $ | 7.9 | | | | | $ | (0.5) | |
| Net investment hedges | | | | | | | | | | |
| Cross-currency swap | | $ | 48.9 | | | | | | | Interest expense, net | | $ | 7.3 | |
| | | | | | | | | | |
| | | | | | | | | | |
| | | | | | | | | | |
| | | | | | | | | | |
| | | | | | | | | | |
| | | | | | | | | | |
| | | | | | | | | | |
| | | | | | | | | | |
| | | | | | | | | | |
| | | | | | | | | | |
| | | | | | | | | | |
| | | | | | | | | | |
| Three Months Ended April 1, 2023 | | | | | | | | | | |
| Cash flow hedges | | | | | | | | | | |
| Interest rate swap agreements | | $ | 24.9 | | | Interest expense, net | | $ | 2.9 | | | Interest expense, net | | $ | — | |
| Foreign currency forward contracts | | $ | (6.7) | | | Net sales | | 0.4 | | | Net sales | | $ | — | |
| | | | Cost of sales | | (0.2) | | | Cost of sales | | $ | — | |
| | | | | | | | Other (income) expense, net | | $ | 0.1 | |
| Total Cash flow hedges | | $ | 18.2 | | | | | $ | 3.1 | | | | | $ | 0.1 | |
| Net investment hedges | | | | | | | | | | |
| Cross-currency swap | | $ | (23.7) | | | | | | | Interest expense, net | | $ | (6.5) | |
| | | | | | | | | | |
| | | | | | | | | | |
| | | | | | | | | | |
| | | | | | | | | | |
| | | | | | | | | | |
| | | | | | | | | | |
| | | | | | | | | | |
| | | | | | | | | | |
| | | | | | | | | | |
| | | | | | | | | | |
(1) Net income of our designated cash flow hedges were as follows:
|
| | | | | | | | | | | | | | | | | | |
| | | | | Amount of Gain/(Loss) Reclassified from AOCI into Earnings
(Effective Portion) |
| | | | | Three Months Ended | | Nine Months Ended |
| Designated Cash Flow Hedges | | Income Statement Location | | September 30,
2017 | | October 1,
2016 | | September 30,
2017 | | October 1,
2016 |
| Treasury locks | | Interest expense, net | | $ | — |
| | $ | — |
| | $ | — |
| | $ | (0.1 | ) |
| Interest rate swap agreements | | Interest expense, net | | (0.4 | ) | | (0.6 | ) | | (1.7 | ) | | (1.7 | ) |
| | | Other (income) expense, net | | — |
| | — |
| | (5.9 | ) | | — |
|
| Foreign currency forward contracts | | Net sales | | — |
| | (0.1 | ) | | 0.9 |
| | 0.3 |
|
| | | Cost of sales | | 1.8 |
| | 0.9 |
| | 3.5 |
| | 1.8 |
|
| | | Interest expense, net | | (0.7 | ) | | (0.4 | ) | | (1.8 | ) | | (1.3 | ) |
| | | Other (income) expense, net | | (1.2 | ) | | (1.2 | ) | | (1.7 | ) | | 0.7 |
|
| Total | | | | $ | (0.5 | ) | | $ | (1.4 | ) | | $ | (6.7 | ) | | $ | (0.3 | ) |
The net of tax amount$23.7 million is expected to be reclassified fromout of AOCI into earnings during the next 12 months is a $2.8 million gain.
(2) For additional details about the effect of the amounts reclassified from AOCI refer to Note 12.
Perrigo Company plc - Item 1
Note 8
The gains (losses) recognized against earnings for the ineffective portion of our designated cash flow hedges were as follows:
|
| | | | | | | | | | | | | | | | | | |
| | | | | Amount of Gain/(Loss) Recognized against Earnings
(Ineffective Portion) |
| | | | | Three Months Ended | | Nine Months Ended |
| Designated Cash Flow Hedges | | Income Statement Location | | September 30,
2017 | | October 1,
2016 | | September 30,
2017 | | October 1,
2016 |
| Interest rate swap agreements | | Other (income) expense, net | | $ | — |
| | $ | — |
| | $ | — |
| | $ | (0.1 | ) |
| Foreign currency forward contracts | | Net sales | | 0.2 |
| | — |
| | 0.1 |
| | 0.1 |
|
| | | Cost of sales | | 0.1 |
| | — |
| | 0.1 |
| | — |
|
| | | Other (income) expense, net | | — |
| | — |
| | 1.0 |
| | 0.6 |
|
| Total | | | | $ | 0.3 |
| | $ | — |
| | $ | 1.2 |
| | $ | 0.6 |
|
The effects of our non-designated derivatives on the Condensed Consolidated Statements of Operations were as follows:
|
| | | | | | | | | | | | | | | | | | |
| | | | | Amount of Gain/(Loss) Recognized against Earnings |
| | | | | Three Months Ended | | Nine Months Ended |
| Non-Designated Derivatives | | Income Statement Location | | September 30,
2017 | | October 1,
2016 | | September 30,
2017 | | October 1,
2016 |
| Foreign currency forward contracts | | Other (income) expense, net | | $ | 10.1 |
| | $ | (0.2 | ) | | $ | (3.8 | ) | | $ | (8.7 | ) |
| | | Interest expense, net | | (1.8 | ) | | (1.0 | ) | | (2.9 | ) | | (1.5 | ) |
| Total | | | | $ | 8.3 |
| | $ | (1.2 | ) | | $ | (6.7 | ) | | $ | (10.2 | ) |
NOTE 9 – ASSETS HELD FOR SALE
Our India API business was classified as held-for-sale beginning as of December 31, 2015. We recorded an impairment charge totaling $6.3 million during the year ended December 31, 2016 after determining the carrying value of the India API business exceeded its fair value less the cost to sell. The India API business is reported in our Other segment. On April 6, 2017, we completed the sale of our India API business (refer to Note 2).
During the three months ended October 1, 2016, management committed to a plan to sell certain fixed assets associated with our animal health pet treats plant. Such assets were classified as held-for-sale beginning at October 1, 2016. On February 1, 2017, we completed the sale of our animal health pet treats plant fixed assets (refer to Note 2). We determined that the carrying value of the fixed assets associated with our animal health pet treats plant exceeded the fair value less the cost to sell. We recorded impairment charges totaling $3.7 million during the year ended December 31, 2016. The assets associated with our animal health pet treats plant are reported in our CHCA segment.
During the three months ended September 30, 2017, management committed to a plan to sell our Israel API business. The business was classified as held-for-sale beginning at September 30, 2017. We determined that the carrying value of the Israel API business exceeded its fair value less the cost to sell. We recorded impairment charges totaling $3.3 million during the three months ended September 30, 2017. The Israel API business is reported in our Other segment.
Perrigo Company plc - Item 1
Note 9
The assets held-for-sale are reported within Prepaid expensesclassification and other current assetsamount of gain/(loss) recognized in earnings on fair value and liabilities held-for-sale are reported in Accrued liabilities. The amounts consist of the followinghedging relationships were as follows (in millions):
| | | | | | | | | | | | | | | | | | | | | | | | | | |
| | Net Sales | | Cost of Sales | | Interest Expense, net | | Other (Income) Expense, net |
| Three Months Ended March 30, 2024 | | | | | | | | |
| Total amounts of income and expense line items presented on the Condensed Consolidated Statements of Operations in which the effects of fair value or cash flow hedges are recorded | | $ | 1,082.1 | | | $ | 724.4 | | | $ | 43.0 | | | $ | 0.4 | |
| | | | | | | | |
| Gain (loss) on cash flow hedging relationships | | | | | | | | |
| Foreign currency forward contracts | | | | | | | | |
| Amount of gain or (loss) reclassified from AOCI into earnings | | $ | 0.1 | | | $ | — | | | $ | — | | | $ | — | |
| Amount excluded from effectiveness testing recognized using a systematic and rational amortization approach | | $ | (0.3) | | | $ | (0.2) | | | $ | — | | | $ | — | |
| Interest rate swap agreements | | | | | | | | |
| Amount of gain or (loss) reclassified from AOCI into earnings | | $ | — | | | $ | — | | | $ | 7.8 | | | $ | — | |
| | | | | | | | |
| | | | | | | | |
| | | | | | | | |
| | | | | | | | |
| | | | | | | | |
| | | | | | | | |
| | | | | | | | |
| | | | | | | | |
| | | | | | | | |
| | | | | | | | |
| | | | | | | | |
| Three Months Ended April 1, 2023 | | | | | | | | |
| Total amounts of income and expense line items presented on the Condensed Consolidated Statements of Operations in which the effects of fair value or cash flow hedges are recorded | | $ | 1,181.7 | | | $ | 767.9 | | | $ | 43.7 | | | $ | 0.5 | |
| | | | | | | | |
| Gain (loss) on cash flow hedging relationships | | | | | | | | |
| Foreign currency forward contracts | | | | | | | | |
| Amount of gain or (loss) reclassified from AOCI into earnings | | $ | 0.4 | | | $ | (0.2) | | | $ | — | | | $ | — | |
| Amount excluded from effectiveness testing recognized using a systematic and rational amortization approach | | $ | — | | | $ | — | | | $ | — | | | $ | 0.1 | |
| Interest rate swap agreements | | | | | | | | |
| Amount of gain or (loss) reclassified from AOCI into earnings | | $ | — | | | $ | — | | | $ | 2.9 | | | $ | — | |
| | | | | | | | |
| | | | | | | | |
| | | | | | | | |
| | | | | | | | |
| | | | | | | | |
| | | | | | | | |
| | | | | | | | |
| | | | | | | | |
| | | | | | | | |
| | | | | | | | |
| | | | | | | | |
| | | | | | | | |
|
| | | | | | | | | | | |
| | September 30,
2017 | | December 31,
2016 |
| | Other | | CHCA | | Other |
| Assets held for sale | | | | | |
| Current assets | $ | 44.0 |
| | $ | — |
| | $ | 5.1 |
|
| Goodwill | 32.6 |
| | — |
| | 5.5 |
|
| Intangible assets | 5.5 |
| | — |
| | — |
|
| Property, plant and equipment | 45.9 |
| | 13.5 |
| | 33.2 |
|
| Other assets | 3.1 |
| | — |
| | 3.8 |
|
| Less: impairment reserves | (3.3 | ) | | (3.7 | ) | | (35.3 | ) |
| Total assets held for sale | $ | 127.8 |
| | $ | 9.8 |
| | $ | 12.3 |
|
| Liabilities held for sale | | | | | |
| Current liabilities | $ | 7.6 |
| | $ | 0.1 |
| | $ | 1.9 |
|
| Other liabilities | 25.1 |
| | — |
| | 1.9 |
|
| Total liabilities held for sale | $ | 32.7 |
| | $ | 0.1 |
| | $ | 3.8 |
|
Perrigo Company plc - Item 1
Note 10
NOTE 10 –- INDEBTEDNESS
Total borrowings outstanding are summarized as follows (in millions):
| | | | | | | | | | | | | | | | | | | | | | | |
| | | | | March 30, 2024 | | December 31, 2023 |
| Term loans | | | | | |
| Term A Loans due April 20, 2027(1) | | | $ | 465.6 | | | $ | 471.9 | |
| Term B Loans due April 20, 2029(1) | | | 1,382.7 | | | 1,386.2 | |
| Total term loans | | | $ | 1,848.3 | | | $ | 1,858.1 | |
| Notes and Bonds | | | | | |
| Coupon | Due | | | | | |
| 3.900% | December 15, 2024 | | | $ | 400.0 | | | $ | 400.0 | |
| 4.375% | March 15, 2026 | | | 700.0 | | | 700.0 | |
| 4.650% | June 15, 2030(2) | | | 750.0 | | | 750.0 | |
| 5.300% | November 15, 2043 | | | 90.5 | | | 90.5 | |
| 4.900% | December 15, 2044 | | | 303.9 | | | 303.9 | |
| Total notes and bonds | | | 2,244.4 | | | 2,244.4 | |
| Other financing | 14.6 | | | 14.8 | |
| Unamortized premium (discount), net | (17.0) | | | (17.8) | |
| Deferred financing fees | (24.8) | | | (26.1) | |
| Total borrowings outstanding | 4,065.5 | | | 4,073.4 | |
| Current indebtedness | (440.6) | | | (440.6) | |
| Total long-term debt less current portion | $ | 3,624.9 | | | $ | 3,632.8 | |
|
| | | | | | | | | | | |
| | | | | | September 30,
2017 | | December 31,
2016 |
| Term loans | | | | | |
| | 2014 term loan due December 5, 2019 | (1) | | $ | 428.3 |
| | $ | 420.7 |
|
| Notes and Bonds | | | | | |
| | Coupon | Due | | | | | |
| | 4.500% | May 23, 2017 | (1)(2) | | — |
| | 189.3 |
|
| | 5.125% | December 12, 2017 | (1)(2) | | 354.5 |
| | 315.6 |
|
| | 2.300% | November 8, 2018 |
| | — |
| | 600.0 |
|
| | 5.000% | May 23, 2019 | (1)(2) | | 141.8 |
| | 126.2 |
|
| | 3.500% | March 15, 2021 |
| | 280.4 |
| | 500.0 |
|
| | 3.500% | December 15, 2021 |
| | 309.6 |
| | 500.0 |
|
| | 5.105% | July 19, 2023 | (1)(2) | | 159.5 |
| | 142.0 |
|
| | 4.000% | November 15, 2023 |
| | 215.6 |
| | 800.0 |
|
| | 3.900% | December 15, 2024 |
| | 700.0 |
| | 700.0 |
|
| | 4.375% | March 15, 2026 |
| | 700.0 |
| | 700.0 |
|
| | 5.300% | November 15, 2043 |
| | 90.5 |
| | 400.0 |
|
| | 4.900% | December 15, 2044 |
| | 303.9 |
| | 400.0 |
|
| | Total notes and bonds | | | 3,255.8 |
| | 5,373.1 |
|
| Other financing | 2.9 |
| | 3.6 |
|
| Unamortized premium (discount), net | 24.8 |
| | 33.0 |
|
| Deferred financing fees | (19.0 | ) | | (33.1 | ) |
| Total borrowings outstanding | 3,692.8 |
| | 5,797.3 |
|
| | Current indebtedness | (417.1 | ) | | (572.8 | ) |
| Total long-term debt less current portion | $ | 3,275.7 |
| | $ | 5,224.5 |
|
| |
(1) | Debt denominated in Euros subject to fluctuations in the euro-to-U.S. dollar exchange rate. |
| |
(2) | Debt assumed from Omega. |
(2) The coupon rate noted above is as of March 30, 2024. This will increase from 4.650% to 4.900% on payments starting after June 15, 2024, following a credit rating downgrade by S&P global in the first quarter of 2024. Future interest rate adjustments are subject to a 2.0% total cap above the original 3.150% interest rate based on certain rating events as specified in the Note’s Supplemental Indenture No. 3, dated as of June 19, 2020, among Perrigo Finance Unlimited Company, Perrigo Company plc, the guarantors party thereto and Wells Fargo Bank, National Association, as trustee.
Credit Agreements
On April 20, 2022, we and our indirect wholly owned subsidiary, Perrigo Investments, LLC, (the "Borrower") entered into the senior secured credit facilities, which consisted of (i) a $1.0 billion five-year revolving credit facility (the “Revolver”), (ii) a $500.0 million five-year Term Loan A facility (the “Term Loan A Facility” and the Term A Loans thereunder, the "Term A Loans"), and (iii) a $1.1 billion seven-year Term Loan B facility (the “Term Loan B Facility” and the Term B Loans thereunder borrowed on April 20, 2022, the "2022 Term B Loans” and, together with the Revolver and Term Loan A Facility, the "Senior Secured Credit Facilities"), pursuant to a Term Loan and Revolving Credit Agreement (the "Credit Agreement").
On December 15, 2023, we and the Borrower, entered into Amendment No. 1, an Incremental Assumption Agreement (the "Amendment") to the Credit Agreement. The Amendment provides for a fungible add on to the 2022 Term B Loans in an aggregate principal amount of $300.0 million (the "Incremental Term B Loans" and together with the 2022 Term B Loans, the “Term B Loans”). The terms of the Incremental Term B Loans, including pricing and maturity, are identical to the 2022 Term B Loans. The Term B Loans will mature on April 20, 2029. The net proceeds from the Incremental Term B Loans were used to settle the cash tender offer by Perrigo Finance Unlimited Company ("Perrigo Finance") for $300.0 million in aggregate principal amount of 3.900% Senior Notes due 2024 ("2024 Notes"). The tender offer was settled on December 15, 2023, and Perrigo Finance accepted for purchase $300.0 million of the 2024 Notes and paid approximately $295.1 million in aggregate cash consideration (excluding accrued interest).
Perrigo Company plc - Item 1
Note 10
The Senior Secured Credit Facilities are guaranteed, along with any hedging or cash management obligations entered into with a lender, by us, and certain of our direct and indirect wholly-owned subsidiaries organized in the United States, Ireland, Belgium and England and Wales (subject to certain exceptions) (the “Guarantor Subsidiaries”). Additionally, the Borrower and the Guarantor Subsidiaries provide full and unconditional guarantees, jointly and severally, on a senior unsecured basis, of the 5.300% Notes due 2043 issued by the Company, and the Guarantor Subsidiaries, the Company and the Borrower provide full and unconditional guarantees, jointly and severally, on a senior unsecured basis, of the 3.900% Notes due 2024, the 4.375% Notes due 2026, the 4.650% Notes due 2030 and the 4.900% Notes due 2044 issued by Perrigo Finance Unlimited Company, a wholly-owned subsidiary.
We are subject to financial covenants in the Senior Secured Credit Facilities. The agreements contain financial covenants that require the Borrower and its restricted subsidiaries to (a) not exceed a maximum first lien secured net leverage ratio of 3.00 to 1.00 at the end of each fiscal quarter and (b) not fall below a minimum interest coverage ratio of 3.00 to 1.00 at the end of each fiscal quarter, provided that such covenants apply only to the Revolver and the Term Loan A Facility. If we consummate certain qualifying acquisitions during the term of the loan, the maximum first lien secured net leverage ratio covenant would increase to 3.25 to 1.00 for such quarter and the three following fiscal quarters thereafter.
During the three months ended April 1, 2017, we entered into amendments toMarch 30, 2024, principal repayments of $6.3 million and $3.5 million were made on the 2014Term Loan A Facility and Term Loan B Facility, respectively.
There were no borrowings outstanding under the Revolver (as defined below) and the 2014 term loan to modify provisionsas of such agreements necessary as a result of the correction in accounting related to the Tysabri® financial asset, as well as waivers of any defaultMarch 30, 2024 or event of default that may have arisen from any restatement of or deficiencies in our financial statements for the periods specified in such amendments and waivers. December 31, 2023, respectively.
We are in compliance with all the covenants under our debt agreements as of SeptemberMarch 30, 2017.2024.
Revolving Credit Agreements
We have a revolving credit agreement with a borrowing capacity of $1.0 billion (the "2014 Revolver"). There were no borrowings outstanding under the 2014 Revolver as of September 30, 2017 and December 31, 2016.
Other Financing
Overdraft Facilities
We have overdraft facilities available that we use to support our cash management operations. We report any balances outstanding in the above table under "Other financing". ThereThere were no balances outstandingborrowings outstanding under the overdraft facilities at Septemberas of March 30, 2017 and2024 or December 31, 2016.2023.
Debt Repayments and Related ExtinguishmentWe have financing leases that are reported in the above table under "Other financing" (refer to Note 6).
During the nine months endedSeptember 30, 2017, we reduced our outstanding debt through a variety of transactions (in millions):
|
| | | | | | | | |
| Date | | Series | | Transaction Type | | Principal Retired |
| April 1, 2017 | | 2014 term loan due December 5, 2019 | | Scheduled quarterly payment | | $ | 13.3 |
|
| July 1, 2017 | | 2014 term loan due December 5, 2019 | | Scheduled quarterly payment | | 14.3 |
|
| September 30, 2017 | | 2014 term loan due December 5, 2019 | | Scheduled quarterly payment | | 14.8 |
|
| May 8, 2017 | | $600.0 2.300% senior notes due 2018 | | Early redemption | | 600.0 |
|
| May 23, 2017 | | €180.0 4.500% retail bonds due 2017 | | Scheduled maturity | | 201.3 |
|
| June 15, 2017 | | $500.0 3.500% senior notes due 2021 | | Tender offer | | 190.4 |
|
| June 15, 2017 | | $500.0 3.500% senior notes due 2021 | | Tender offer | | 219.6 |
|
| June 15, 2017 | | $800.0 4.000% senior notes due 2023 | | Tender offer | | 584.4 |
|
| June 15, 2017 | | $400.0 5.300% senior notes due 2043 | | Tender offer | | 309.5 |
|
| June 15, 2017 | | $400.0 4.900% senior notes due 2044 | | Tender offer | | 96.1 |
|
| | | | | | | $ | 2,243.7 |
|
As a result of the of the early redemption and tender offer transactions discussed above, we recorded a loss of $135.2 million during the three months ended July 1, 2017 in Loss on extinguishment of debt (in millions):
|
| | | | |
| Premium on debt repayment | | $ | 116.1 |
|
| Transaction costs | | 3.8 |
|
| Write-off of deferred financing fees | | 10.6 |
|
| Write-off of remaining discount on bond | | 4.7 |
|
| Total loss on extinguishment of debt | | $ | 135.2 |
|
Perrigo Company plc - Item 1
Note 11
NOTE 11 –- EARNINGS PER SHARE AND SHAREHOLDERS' EQUITY
Earnings per Share
A reconciliation of the numerators and denominators used in theour basic and diluted earnings per share ("EPS") calculation is as follows (in millions):
| | | | | | | | | | | | | | | |
| | Three Months Ended | | |
| | March 30,
2024 | | April 1, 2023 | | | | |
| Numerator: | | | | | | | |
| Income (loss) from continuing operations | $ | 4.1 | | | $ | (1.1) | | | | | |
| Income (loss) from discontinued operations, net of tax | (2.1) | | | (1.9) | | | | | |
| Net income (loss) | $ | 2.0 | | | $ | (3.0) | | | | | |
| Denominator: | | | | | | | |
| Weighted average shares outstanding for basic EPS | 136.6 | | | 134.9 | | | | | |
| Dilutive effect of share-based awards | 1.0 | | | — | | | | | |
Weighted average shares outstanding for diluted EPS (1) | 137.6 | | | 134.9 | | | | | |
| | | | | | | |
| | | | | | | |
| | | | | | | |
|
| | | | | | | | | | | | | | | |
| | Three Months Ended | | Nine Months Ended |
| | September 30,
2017 | | October 1,
2016 | | September 30,
2017 | | October 1,
2016 |
| Numerator: | | | | | | | |
| Net income (loss) | $ | 44.5 |
| | $ | (1,590.2 | ) | | $ | 46.4 |
| | $ | (2,653.7 | ) |
| | | | | | | | |
| Denominator: | | | | | | | |
| Weighted average shares outstanding for basic EPS | 141.3 |
| | 143.3 |
| | 142.5 |
| | 143.2 |
|
| Dilutive effect of share-based awards* | 0.4 |
| | — |
| | 0.3 |
| | — |
|
| Weighted average shares outstanding for diluted EPS | 141.7 |
| | 143.3 |
| | 142.8 |
| | 143.2 |
|
| | | | | | | | |
Anti-dilutive share-based awards excluded from computation of diluted EPS* | 1.0 |
| | — |
| | 0.8 |
| | — |
|
*(1) In the period of a net loss from continuing operations, diluted shares equal basic shares.
Perrigo Company plc - Item 1
Note 11
Shareholders' Equity
Shares
We issued shares relatedIn October 2018, our Board of Directors authorized up to the exercise and vesting$1.0 billion of share-based compensation as follows:
|
| | | | | | | | | | |
| Three Months Ended | | Nine Months Ended |
September 30,
2017 | | October 1,
2016 | | September 30,
2017 | | October 1,
2016 |
| 99,800 |
| | 185,000 |
| | 146,100 |
| | 283,000 |
|
Share Repurchases
On October 22, 2015,share repurchases with no expiration date, subject to the Board of Directors approved aDirectors’ approval of the pricing parameters and amount that may be repurchased under each specific share repurchase plan of up to $2.0 billionprogram (the "2015"2018 Authorization"). During the three and nine months ended September 30, 2017, we repurchased 1.9 million and 2.7 million ordinary shares at an average repurchase price of $71.73 and $71.72 per share, for a total of $133.3 million and $191.5 million, respectively. As of September 30, 2017, there was $1.3 billion still available to be repurchased through December 31, 2018 under the 2015 Authorization. We did not repurchase any shares under the share repurchase plan during the ninethree months ended OctoberMarch 30, 2024 or April 1, 2016.2023.
Perrigo Company plc - Item 1
Note 12
NOTE 12 –- ACCUMULATED OTHER COMPREHENSIVE INCOME (LOSS)
Changes in our AOCI balances, net of tax were as follows (in millions):
| | | | | | | | | | | | | | | | | | | | | | | | | |
| Fair Value of Derivative Financial Instruments, net of tax | | Foreign Currency Translation Adjustments | | | | Post-Employment Plan Adjustments, net of tax | | Total AOCI |
| Balance at December 31, 2023 | $ | 17.1 | | | $ | (4.0) | | | | | $ | (2.4) | | | $ | 10.7 | |
| OCI before reclassifications | 18.5 | | | (58.3) | | | | | (1.0) | | | (40.8) | |
| Amounts reclassified from AOCI | (7.6) | | | — | | | | | — | | | (7.6) | |
| Other comprehensive income (loss) | $ | 10.9 | | | $ | (58.3) | | | | | $ | (1.0) | | | $ | (48.4) | |
| Balance at March 30, 2024 | $ | 28.0 | | | $ | (62.3) | | | | | $ | (3.4) | | | $ | (37.7) | |
|
| | | | | | | | | | | | | | | | | | | |
| | Foreign currency translation adjustments | | Fair value of derivative financial instruments, net of tax | | Fair value of investment securities, net of tax | | Post-retirement and pension liability adjustments, net of tax | | Total AOCI |
| Balance at December 31, 2016 | $ | (67.9 | ) | | $ | (19.5 | ) | | $ | 15.1 |
| | $ | (9.5 | ) | | $ | (81.8 | ) |
| OCI before reclassifications | 289.9 |
| | 4.4 |
| | (22.8 | ) | | (1.2 | ) | | 270.3 |
|
| Amounts reclassified from AOCI | — |
| | 4.3 |
| | (1.6 | ) | | — |
| | 2.7 |
|
| Other comprehensive income (loss) | 289.9 |
| | 8.7 |
| | (24.4 | ) | | (1.2 | ) | | 273.0 |
|
| Balance at September 30, 2017 | $ | 222.0 |
| | $ | (10.8 | ) | | $ | (9.3 | ) | | $ | (10.7 | ) | | $ | 191.2 |
|
NOTE 13 – INCOME TAXES
The effective tax rates were as follows:
|
| | | | | | | | | | |
| Three Months Ended | | Nine Months Ended |
September 30,
2017 | | October 1,
2016 | | September 30,
2017 | | October 1,
2016 |
| 65.5 | % | | 16.4 | % | | 68.7 | % | | 17.2 | % |
The effective tax rate forFor additional details about the nine months ended September 30, 2017 was negatively impacted by non-deductible fees related to our debt cancellation, discrete tax items, and additional valuation allowances recorded against deferred tax assets.
Our tax rate is subject to adjustment over the balanceeffect of the
fiscal year dueamounts reclassified from AOCI refer to
among other things: the jurisdictions in which our profits are determined to be earned and taxed; changes in the valuation of our deferred tax assets and liabilities; adjustments to estimated taxes upon finalization of various tax returns; adjustments based on differing interpretations of the applicable transfer pricing standards; changes in available tax credits, grants and other incentives; changes in stock-based compensation expense; changes in tax laws or the interpretation of such tax laws (for example, proposals for fundamental U.S. international tax reform); changes in U.S. GAAP; and expiration of or the inability to renew tax rulings or tax holiday incentives.Note 9.
The total liability for uncertain tax positions was $454.9 million and $398.0 million as of September 30, 2017 and December 31, 2016, respectively, before considering the federal tax benefit of certain state and local items.
We recognize interest and penalties related to uncertain tax positions as a component of income tax expense. The total amount accrued for interest and penalties in the liability for uncertain tax positions was $79.0 million and $63.5 million as of September 30, 2017 and December 31, 2016, respectively.
We file income tax returns in numerous jurisdictions and are therefore subject to audits by tax authorities. Our primary income tax jurisdictions are Ireland, the United States, Israel, Belgium, France, and the United Kingdom.
On August 15, 2017, we filed a complaint in the United States District Court for the Western District of Michigan to recover $163.6 million of Federal income tax, penalties, and interest assessed and collected by the Internal Revenue Service (“IRS”), plus statutory interest thereon from the dates of payment, for the fiscal years ended June 27, 2009, June 26, 2010, June 25, 2011, and June 30, 2012 (the “2009 tax year,” “2010 tax year,” “2011 tax year,” and “2012 tax year,” respectively). The IRS audits of those years culminated in the issuances of two statutory notices of deficiency: (1) on August 27, 2014 for the 2009 and 2010 tax years and (2) on April 20, 2017 for the 2011 and 2012 tax years. The statutory notices of deficiency both included un-agreed income adjustments related principally to transfer pricing adjustments regarding the purchase, distribution, and sale of store-brand OTC pharmaceutical products in the United States. In addition, the statutory notice of deficiency for the 2011 and 2012 tax years included the capitalization of certain expenses that were deducted when paid or incurred in defending
Perrigo Company plc - Item 1
Note 13
against certain patent infringement lawsuits. We fully paid the assessed amounts of tax, interest, and penalties set forth in the statutory notices and filed timely claims for refund on June 11, 2015 and June 7, 2017 for the 2009-2010 tax years and 2011-2012 tax years, respectively. Our claims for refund were disallowed by certified letters dated August 18, 2015 and July 11, 2017, for the 2009-2010 tax years and 2011-2012 tax years, respectively. The complaint was timely, based upon the refund claim denials, and seeks refunds of tax, interest, and penalties of $37.2 million for the 2009 tax year, $61.5 million for the 2010 tax year, $40.2 million for the 2011 tax year, and $24.7 million for the 2012 tax year. The amounts sought in the complaint for the 2009 and 2010 tax years were recorded as deferred charges on our balance sheet during the three months ended March 28, 2015, and the amounts sought in the complaint for the 2011 and 2012 tax years were recorded as deferred charges on our balance sheet during the three months ended July 1, 2017.
On December 22, 2016, we received a notice of proposed adjustment for the IRS audit of Athena Neurosciences, Inc. (“Athena”), a subsidiary of Elan acquired in 1996, for the years ended December 31, 2011, December 31, 2012, and December 31, 2013. Perrigo acquired Elan in December 2013. This proposed adjustment relates to the deductibility of litigation costs. We disagree with the IRS’s position asserted in the notice of proposed adjustment and intend to contest it.
On July 11, 2017, we received a draft notice of proposed adjustment associated with transfer pricing positions for the IRS audit of Athena for the years ended December 31, 2011, December 31, 2012, and December 31, 2013. Athena was the originator of the patents associated with Tysabri® prior to the acquisition of Athena by Elan in 1996. The amount of adjustments that may be asserted by the IRS in the final notice of proposed adjustment cannot be quantified at this time; however, based on the draft notice received, the amount to be assessed may be material. We disagree with the IRS’s position as asserted in the draft notice of proposed adjustment and intend to contest it.
We have ongoing audits in multiple other jurisdictions the resolution of which remains uncertain. These jurisdictions include, but are not limited to, the United States, Israel and France. In addition to the matters discussed above, the IRS is currently auditing our fiscal years ended June 29, 2013, June 28, 2014, and June 27, 2015. The Israel Tax Authority is currently auditing our fiscal years ended June 29, 2013 and June 28, 2014. The French Tax Authority is currently auditing the years ended December 2014, December 2015, and December 2016.
NOTE 14 – COMMITMENTS AND CONTINGENCIES
In view of the inherent difficulties of predicting the outcome of various types of legal proceedings, we cannot determine the ultimate resolution of the matters described below. We establish reserves for litigation and regulatory matters when losses associated with the claims become probable and the amounts can be reasonably estimated. The actual costs of resolving legal matters may be substantially higher or lower than the amounts reserved for those matters. For matters where the likelihood or extent of a loss is not probable or cannot be reasonably estimated as of September 30, 2017, we have not recorded a loss reserve. If certain of these matters are determined against us, there could be a material adverse effect on our financial condition, results of operations, or cash flows. We currently believe we have valid defenses to the claims in these lawsuits and intend to defend these lawsuits vigorously regardless of whether or not we have a loss reserve. Other than what is disclosed below, we do not expect the outcome of the litigation matters to which we are currently subject individually or in the aggregate, to have a material adverse effect on our financial condition, results of operations, or cash flows.
Antitrust Violations
We have been named as a counterclaim co-defendant in the lawsuit Fera Pharmaceuticals, LLC v. Akorn, Inc., et al., in which Akorn, Inc. (“Akorn”) alleges tortious interference and antitrust violations against us and Fera Pharmaceuticals, LLC (“Fera”). This litigation arises from our acquisition of bacitracin ophthalmic ointment from Fera in 2013. Akorn asserts claims under Sections 1 and 2 of the Sherman Antitrust Act alleging that we and Fera conspired to monopolize, attempted to monopolize, and did unlawfully monopolize the market for sterile bacitracin ophthalmic ointment in the United States through the use of an exclusive agreement with a supplier of sterile bacitracin active pharmaceutical ingredient. The lawsuit is currently pending in the Southern District of New York. Trial was rescheduled from January 2018 to February 2018. Akorn seeks damages, injunctive relief, and attorney’s fees. Any award of antitrust damages would be subject to trebling under antitrust laws. An estimate of any possible loss cannot be determined at this time.
Perrigo Company plc - Item 1
Note 14
We believe the claims are without merit and intend to defend them vigorously. We have preserved our indemnification rights against Fera for potential liability, defense costs, and expenses incurred as a result of this litigation.
Price-Fixing Lawsuits
We have been named as a co-defendant with other manufacturers in a number of cases alleging that we and other manufacturers of the same product engaged in anti-competitive behavior to fix or raise the prices of certain drugs starting, in some instances, as early as June 2013. The products in question are Clobetasol, Desonide, and Econazole. These complaints, along with complaints filed against other companies alleging price fixing with respect to 15 other drugs, have been consolidated for pretrial proceedings as part of a case captioned In re Generic Pharmaceuticals Pricing Antitrust Litigation, MDL No. 2724. Pursuant to the court’s schedule staging various cases in phases, we have moved to dismiss the complaints relating to Clobetasol and Econazole. At this stage, we cannot reasonably predict the outcome of the liability, if any, associated with these claims.
Securities Litigation
In the United States
On May 18, 2016, a shareholder filed a securities case against us and our former CEO, Joseph Papa, in the U.S. District Court for the District of New Jersey (Roofers’ Pension Fund v. Papa, et al.). The plaintiff purported to represent a class of shareholders for the period from April 21, 2015 through May 11, 2016, inclusive. The original complaint alleged violations of Securities Exchange Act sections 10(b) (and Rule 10b‑5) and 14(e) against both defendants and 20(a) control person liability against Mr. Papa. In general, the allegations concerned the actions taken by us and the former executive to defend against the unsolicited takeover bid by Mylan in the period from April 21, 2015 through November 13, 2015. The plaintiff also alleged that the defendants provided inadequate disclosure concerning alleged integration problems related to the Omega acquisition in the period from April 21, 2015 through May 11, 2016. On July 19, 2016, a different shareholder filed a securities class action against us and our former CEO, Joseph Papa, also in the District of New Jersey (Wilson v. Papa, et al.). The plaintiff purported to represent a class of persons who sold put options on our shares between April 21, 2015 and May 11, 2016. In general, the allegations and the claims were the same as those made in the original complaint filed in the Roofers' Pension Fund case described above. On December 8, 2016, the court consolidated Roofers' Pension Fund case and the Wilson case under the Roofers' Pension Fund case number. In February 2017, the court selected the lead plaintiffs for the consolidated case and the lead counsel to the putative class. In March 2017, the court entered a scheduling order.
On June 21, 2017, the court-appointed lead plaintiffs filed an amended complaint that superseded the original complaints in the Roofers’ Pension Fund case and the Wilson case. The lead plaintiffs seek to represent a class of shareholders for the period April 21, 2015 through May 3, 2017, and identifies three subclasses - shareholders who traded during the entire period on the U.S. exchanges; shareholders who traded during the entire period on the Tel Aviv exchange; and shareholders who traded during the period while the Mylan tender offer was pending (April 21, 2015 through November 13, 2015). The amended complaint names as defendants us and 11 current or former directors and officers of Perrigo (Mses. Judy Brown, Laurie Brlas, Jacqualyn Fouse, Ellen Hoffing, and Messrs. Joe Papa, Marc Coucke, Gary Cohen, Michael Jandernoa, Gerald Kunkle, Herman Morris, and Donal O’Connor). The amended complaint alleges violations of Securities Exchange Act sections 10(b) (and Rule 10b‑5) and 14(e) against all defendants and 20(a) control person liability against the 11 individuals. In general, the allegations concern the actions taken by us and the former executives to defend against the unsolicited takeover bid by Mylan in the period from April 21, 2015 through November 13, 2015 and the allegedly inadequate disclosure throughout the entire class period related to purported integration problems related to the Omega acquisition, alleges incorrect reporting of organic growth at the Company, alleges price fixing activities with respect to six generic prescription pharmaceuticals, and alleges improper accounting for the Tysabri® royalty stream. The amended complaint does not include an estimate of damages. In August 2017, the defendants filed motions to dismiss the amended complaint. The plaintiffs filed their opposition in October 2017. The defendants filed replies in support of the motions to dismiss in November 2017. The court has not indicated whether there will be oral argument of the motions or whether the court will decide the motions on the papers. We intend to defend the lawsuit vigorously.
Perrigo Company plc - Item 1
Note 14
On November 1, 2017, Carmignac Gestion, S.A., filed a securities lawsuit against us and three individuals (former Chairman and CEO Joseph Papa, former CFO Judy Brown, and former Executive Vice President and Board member Marc Coucke). This lawsuit is not a securities class action. The case is styled Carmignac Gestion, S.A. v. Perrigo Company plc, et al., and was filed in the U.S. District Court for the District of New Jersey. The complaint asserts claims under Securities Exchange Act sections 10(b) (and Rule 10b-5), 14(e), and 18 against all defendants as well as 20(a) control person liability against the individual defendants. In general, the plaintiff’s allegations focus on events during the period from April 2015 through April 2016. Plaintiff contends that the defendants provided inadequate disclosure throughout the period concerning the valuation and integration of Omega, the financial guidance provided by us during that period, our reporting about the generic prescription pharmaceutical business and its prospects, and the activities surrounding the efforts to defeat the Mylan tender offer during 2015. Many of the allegations in this newly-filed case overlap with the allegations of the June 2017 amended complaint in the Roofers’ Pension Fund case described above. The plaintiff does not provide an estimate of damages. We intend to defend the lawsuit vigorously.
In Israel
Because our shares are traded on the Tel Aviv exchange under a dual trading arrangement, we are subject to securities litigation in Israel. Three cases are currently pending. We are consulting Israeli counsel about our response to these allegations and we intend to defend these cases vigorously.
On May 22, 2016, shareholders filed a securities class action against us and five individual defendants: Our former CEO Mr. Papa, our former Executive Vice President and General Manager of the BCH segment Marc Coucke, our Chief Executive Officer John Hendrickson, our former Board member Gary Kunkle, Jr., and our Board member Laurie Brlas alleging violations of Israeli law in the District Court of Tel Aviv-Jaffa (Schweiger et al. v. Perrigo Company plc, et al.). On June 15, 2016, we filed a motion to stay the case pending the outcome of the securities class action pending in the New Jersey Federal Court. The plaintiffs did not oppose the motion. The Israeli court granted the motion on the same day, and the Schweiger action is stayed. We intend to defend the lawsuit vigorously when and if the stay is lifted. In October 2017, the Schweiger plaintiffs dismissed their claims without prejudice because of the pendency of another class action case filed in Israel (see discussion below of the Israel Elec. Corp. Employees’ Educ. Fund case). The court approved the voluntary dismissal.
On March 29, 2017, plaintiff Eyal Keinan commenced an action in the District Court of Tel Aviv-Jaffa asserting securities claims against two defendants: Perrigo and its auditor Ernst & Young LLP ("EY"). The case is styled Keinan v. Perrigo Company plc, et al. The action seeks certification of a class of purchasers of Perrigo shares on the Israeli exchange beginning February 6, 2014. The proposed closing date for the class is not clear from the complaint though it appears to extend into 2017. In general, the plaintiff asserts that we improperly accounted for our stream of royalty income from two drugs: Tysabri® and Prialt. The court filings contend that the alleged improper accounting caused the audited financial results for Perrigo to be incorrect for the six month period ended December 31, 2015, and the years ended June 27, 2015 and June 28, 2014 and the other financial data released by us over those years and 2016 to also be inaccurate. The plaintiff maintains that the defendants are liable under Israeli securities law or, in the alternative, under U.S. securities law. The plaintiff indicates an initial, preliminary class damages estimate of 686.0 million NIS (approximately $192.0 million at 1 NIS = $0.28 cent). The response from the defendants is not yet due. We intend to defend the lawsuit vigorously.
On June 28, 2017, a plaintiff filed a complaint in Tel Aviv District Court styled Israel Elec. Corp. Employees’ Educ. Fund v. Perrigo Company plc, et al. The lead plaintiff seeks to represent a class of shareholders who traded in Perrigo stock on the Tel Aviv exchange during the period April 24, 2015 through May 3, 2017. The amended complaint names as defendants the Company, EY (the Company’s auditor), and 11 current or former directors and officers of Perrigo (Mses. Judy Brown, Laurie Brlas, Jacqualyn Fouse, Ellen Hoffing, and Messrs. Joe Papa, Marc Coucke, Gary Cohen, Michael Jandernoa, Gerald Kunkle, Herman Morris, and Donal O’Connor). The complaint alleges violations under U.S. securities laws of Securities Exchange Act sections 10(b) (and Rule 10b‑5) and 14(e) against all defendants and 20(a) control person liability against the 11 individuals or, in the alternative, under Israeli securities laws. In general, the allegations concern the actions taken by us and our former executives to defend against the unsolicited takeover bid by Mylan in the period from April 21, 2015 through November 13, 2015 and the allegedly inadequate disclosure concerning purported integration problems related to the Omega acquisition, alleges incorrect reporting of organic growth at the Company, alleges price fixing activities with respect to six
Perrigo Company plc - Item 1
Note 14
generic prescription pharmaceuticals, and alleges improper accounting for the Tysabri® royalty stream. The plaintiff indicates an initial, preliminary class damages estimate of 2.7 billion NIS (approximately $760.0 million at 1 NIS = $0.28 cent). We intend to defend the lawsuit vigorously.
On July 12, 2017, the plaintiff in the Israel Elec. Corp. Employees’ Educ. Fund v. Perrigo Company plc, et al. case filed a motion to have all three cases pending in Israel either consolidated or the other two cases dismissed so that the Israel Elec. Corp. Educ. Fund plaintiff can proceed as the sole plaintiff. That motion is pending. In October 2017, the Schweiger plaintiffs (see description above) voluntarily dismissed their securities class action without prejudice as part of their response to the motion filed by the Israel Elec. Corp. Educ. Fund plaintiff. A variety of other procedural motions are also pending at this time having to do with the timing of any response by defendants. The court has scheduled an initial conference on November 9, 2017 to address the motion filed by the Israel Elec. Corp. Educ. Fund plaintiff. The court has indicated that other procedural motions will be addressed after it has decided the Israel Elec. Corp. Educ. Fund plaintiff’s motion.
Eltroxin
During October and November 2011, nine applications to certify a class action lawsuit were filed in various courts in Israel related to Eltroxin, a prescription thyroid medication manufactured by a third party and distributed in Israel by our subsidiary, Perrigo Israel Agencies Ltd. The respondents included our subsidiaries, Perrigo Israel Pharmaceuticals Ltd. and/or Perrigo Israel Agencies Ltd., the manufacturers of the product, and various healthcare providers who provide healthcare services as part of the compulsory healthcare system in Israel.
One of the applications was dismissed and the remaining eight applications were consolidated into one application. The applications arose from the 2011 launch of a reformulated version of Eltroxin in Israel. The consolidated application generally alleges that the respondents (a) failed to timely inform patients, pharmacists and physicians about the change in the formulation; and (b) failed to inform physicians about the need to monitor patients taking the new formulation in order to confirm patients were receiving the appropriate dose of the drug. As a result, claimants allege they incurred the following damages: (a) purchases of product that otherwise would not have been made by patients had they been aware of the reformulation; (b) adverse events to some patients resulting from an imbalance of thyroid functions that could have been avoided; and (c) harm resulting from the patients' lack of informed consent prior to the use of the reformulation.
Several hearings on whether or not to certify the consolidated application took place in December 2013 and January 2014. On May 17, 2015, the District Court certified the motion against Perrigo Israel Agencies Ltd. and dismissed it against the remaining respondents, including Perrigo Israel Pharmaceuticals Ltd.
On June 16, 2015, we submitted a motion for permission to appeal the decision to certify to the Israeli Supreme Court together with a motion to stay the proceedings of the class action until the motion for permission to appeal is adjudicated. We have filed our statement of defense to the underlying proceedings. The parties are currently engaged in mediation in an attempt to settle the matter. The underlying proceedings have been stayed pending the outcome of the mediation process and, if necessary, a decision on the motion to appeal.
Tysabri® Product Liability Lawsuits
We and our collaborator Biogen are co-defendants in product liability lawsuits arising out of the occurrence of Progressive Multifocal Leukoencephalopathy, a serious brain infection, and serious adverse events, including deaths, which occurred in patients taking Tysabri®. Each co-defendant would be responsible for 50% of losses and expenses arising out of any Tysabri® product liability claims. During calendar year 2016, one case in the U.S. was settled and two others were dismissed with prejudice. In 2017, seven other cases were dismissed with prejudice. While we intend to vigorously defend the remaining lawsuits, management cannot predict how these cases will be resolved. Adverse results in one or more of these lawsuits could result in substantial judgments against us.
Claim Arising from the Omega Acquisition
On December 16, 2016, we and Perrigo Ireland 2 brought an arbitral claim ("Claim") against Alychlo NV ("Alychlo") and Holdco I BE NV ("Holdco") (together the Sellers) in accordance with clause 26.2 of the Share Purchase Agreement dated November 6, 2014 ("SPA") and the rules of the Belgian Centre for Arbitration and
Perrigo Company plc - Item 1
Note 14
Mediation ("CEPANI"). Our Claim relates to the accuracy and completeness of information about Omega provided by the Sellers as part of the sale process, the withholding of information by the Sellers during that process and breaches of Sellers’ warranties. We are seeking monetary damages from the Sellers. The Sellers served their respective responses to the Claim on February 20, 2017. In its response, Alychlo has asserted a counterclaim for monetary damages contending that we breached the duty of good faith in performing the SPA. There can be no assurance that our Claim will be successful, and Sellers deny liability for the Claim. We deny that Alychlo is entitled to any relief (including monetary relief) under the counterclaim. The arbitration proceedings are confidential as required by the SPA and the rules of the CEPANI.
NOTE 15 –13 - RESTRUCTURING CHARGES
We periodically take action to reduce redundant expenses and improve operating efficiencies. Restructuring activity includes severance, lease exit costs, asset impairments, and related consulting fees. The following reflects our restructuring activity (in millions):
| | | | | | | | | | | | | | | | | | | |
| Three Months Ended |
| March 30, 2024 | | |
| Supply Chain
Reinvention | HRA Pharma
Integration | Project Energize | Other Initiatives | Total | | |
| Beginning balance | $ | 0.7 | | $ | 6.8 | | $ | 2.9 | | $ | 1.8 | | $ | 12.2 | | | |
| Additional charges | 2.6 | | 0.1 | | 41.4 | | 0.2 | | 44.3 | | | |
| Payments | (2.4) | | (0.3) | | (6.9) | | (1.1) | | (10.7) | | | |
| Non-cash adjustments | — | | — | | (4.8) | | — | | (4.8) | | | |
| | | | | | | |
| Ending balance | $ | 0.9 | | $ | 6.6 | | $ | 32.6 | | $ | 0.9 | | $ | 41.0 | | | |
|
| | | | | | | | | | | | | | | |
| | Three Months Ended | | Nine Months Ended |
| | September 30,
2017 | | October 1,
2016 | | September 30,
2017 | | October 1,
2016 |
| Beginning balance | $ | 39.7 |
| | $ | 12.2 |
| | $ | 19.7 |
| | $ | 20.7 |
|
| Additional charges | 3.8 |
| | 6.6 |
| | 54.7 |
| | 17.9 |
|
| Payments | (17.8 | ) | | (8.6 | ) | | (47.6 | ) | | (33.3 | ) |
| Non-cash adjustments | 0.4 |
| | 0.1 |
| | (0.7 | ) | | 5.0 |
|
| Ending balance | $ | 26.1 |
| | $ | 10.3 |
| | $ | 26.1 |
| | $ | 10.3 |
|
| | | | | | | | | | | | | | |
| Three Months Ended |
| April 1, 2023 |
| Supply Chain Reinvention | HRA Pharma Integration | Other Initiatives | Total |
| Beginning balance | $ | 2.2 | | $ | 13.3 | | $ | 4.3 | | $ | 19.8 | |
| Additional charges | 2.6 | | 0.8 | | — | | 3.4 | |
| Payments | (4.4) | | (2.6) | | (1.0) | | (8.0) | |
| Non-cash adjustments | — | | 0.3 | | 0.1 | | 0.4 | |
| | | | |
| Ending balance | $ | 0.4 | | $ | 11.8 | | $ | 3.4 | | $ | 15.6 | |
Restructuring activity includes severance, lease exit costs, and asset impairments.
The charges incurred during the three and nine months ended SeptemberMarch 30, 20172024 and April 1, 2023 were primarily associated with actions we took to streamline our organization as announcedtaken on February 21, 2017. During the threesupply chain restructuring, Project Energize and nine months ended September 30, 2017, $3.8 million and $54.7 million of restructuring expenses were recorded, respectively. HRA Pharma integration activities.
Of the amount recorded during the ninethree months ended SeptemberMarch 30, 2017, $27.22024, $15.5 million was related to our CSCI segment and $16.5 million related to our CSCA segment, and $12.3 million was related to our Unallocated segment. For all segments, amounts were due primarily to Project Energize. Of the CHCAamount recorded during the three months ended April 1, 2023, $0.9 million was related to our CSCI segment, and $1.2 million was related to our CSCA
Perrigo Company plc - Item 1
Note 13
segment, and $1.3 million was related to our Unallocated segment. For all segments, amounts were due primarily to supply chain restructuring.
There were no other material restructuring programs that significantly impacted any other reportable segments.for the periods presented. All charges are recorded in Restructuring expense on the Condensed Consolidated Statements of Operations. The remaining $22.4$41.0 million liability for employee severance benefits and consulting fees is expected to be mostly paid within the next year.
NOTE 14 - INCOME TAXES
The effective tax rates were as follows:
| | | | | | | | | | | | |
| Three Months Ended | | |
| March 30, 2024 | | April 1, 2023 | | | | |
| 104.2 | % | | 123.8 | % | | | | |
The effective tax rate on the pre-tax loss for the three months ended March 30, 2024 was largely impacted by the year-to-date losses recognized in the various tax jurisdictions as well as the impacts of accounting for income taxes in interim reporting periods. As a result, a significant variation in the customary relationship between income tax expense and pre-tax book income may occur. Due to the net impact of planned inter-company intellectual property sales, estimated worldwide non-deductible expenses, as well as establishing a partial valuation allowance in the United.States, we are projecting an income tax expense for the full year whileended December 31, 2024, which results in an unusually high annual effective tax rate when applied to the forecasted pre-tax income for the year.
The Organization for Economic Co-operation and Development (“OECD”), which represents a coalition of member countries, has recommended changes to numerous long-standing tax principles. In particular, the OECD’s Pillar Two initiative introduces a global per-country minimum tax of 15%. Pillar Two legislation has been enacted or substantively enacted in many of the jurisdictions in which we operate. The legislation is effective for our financial year beginning January 1, 2024. We are in scope of the enacted or substantively enacted legislation and have performed an assessment of our potential exposure to Pillar Two income taxes.
The assessment of the potential exposure to Pillar Two income taxes is based on the most recent tax filings, country-by-country reporting and financial statements for our constituent entities. Based on the assessment, the Pillar Two effective tax rates in most of the jurisdictions in which we operate are above 15%. However, there are a limited number of jurisdictions where the transitional safe harbor reliefs do not apply, and the Pillar Two effective tax rate is below 15%. We do not expect a material exposure to Pillar Two income taxes in those jurisdictions.
Internal Revenue Service Audits of Perrigo Company, a U.S. Subsidiary
Perrigo Company, our U.S. subsidiary ("Perrigo U.S."), is engaged in a series of tax disputes in the U.S. relating primarily to transfer pricing adjustments including income in connection with the purchase, distribution, and sale of store-brand OTC pharmaceutical products in the United States, including the heartburn medication omeprazole. On August 27, 2014, we received a statutory notice of deficiency from the Internal Revenue Service ("IRS") relating to our fiscal tax years ended June 27, 2009, and June 26, 2010 (the “2009 tax year” and “2010 tax year”, respectively). On April 20, 2017, we received a statutory notice of deficiency from the IRS for the years ended June 25, 2011 and June 30, 2012 (the “2011 tax year” and “2012 tax year”, respectively). Specifically, both statutory notices proposed adjustments related to the offshore reporting of profits on sales of omeprazole in the United States resulting from the assignment of an omeprazole distribution contract to an Israeli affiliate. In addition to the transfer pricing adjustments, which applied to all four tax years, the statutory notice of deficiency for the 2011 and 2012 tax years included adjustments requiring the capitalization and amortization of certain legal expenses that were deducted when paid or incurred in defending against certain patent infringement lawsuits related to Abbreviated New Drug Applications ("ANDAs") filed with a Paragraph IV Certification.
We do not agree with the audit adjustments proposed by the IRS in either of the notices of deficiency. We paid the assessed amounts of tax, interest, and penalties set forth in the statutory notices and timely filed claims for refund on June 11, 2015 for the 2009 and 2010 tax years, and on June 7, 2017, for the 2011 and 2012 tax years. On August 15, 2017, following disallowance of such refund claims, we timely filed a complaint in the United States
Perrigo Company plc - Item 1
Note 14
District Court for the Western District of Michigan seeking refunds of tax, interest, and penalties of $27.5 million for the 2009 tax year, $41.8 million for the 2010 tax year, $40.1 million for the 2011 tax year, and $24.7 million for the 2012 tax year, for a total of $134.1 million, plus statutory overpayment interest thereon from the dates of payment. The amounts sought in the complaint for the 2009 and 2010 tax years were recorded as deferred charges in Other non-current assets on our balance sheet during the three months ended March 28, 2015, and the amounts sought in the complaint for the 2011 and 2012 tax years were recorded as deferred charges in Other non-current assets on our balance sheet during the three months ended July 1, 2017.
A bench trial was held during the period May 25, 2021 to June 7, 2021 for the refund case in the United States District Court for the Western District of Michigan. The total amount of cumulative deferred charge that we are seeking to receive in this litigation is approximately $113.3 million, which reflects the impact of conceding that Perrigo U.S. should have received a 5.24% royalty on all omeprazole sales. That concession was previously paid and is the subject of the above refund claims. The issues outlined in the statutory notices of deficiency described above are continuing in nature, and the IRS will likely carry forward the adjustments set forth therein as long as the OTC medication is sold, in the case of the omeprazole issue, and for all post-2012 Paragraph IV filings that trigger patent infringement suits, in the case of the ANDA issue. Post-trial briefings were completed on September 24, 2021 and the case is now fully submitted for the court’s decision. On April 30, 2021, we filed a Notice of New Authority in our refund case in the Western District of Michigan alerting the court to a United States Tax Court decision in Mylan v. Comm'r that ruled in favor of the taxpayer on nearly identical ANDA issues as we have before the court. On January 28, 2022, the IRS filed a Notice of Appeal with the United States Court of Appeals of the Third Circuit to appeal the United States Tax Court's decision in Mylan v. Comm'r. Briefing to the appellate court was completed during 2022, oral argument was held before the Third Circuit on January 12, 2023, and on July 27, 2023, the Third Circuit Court affirmed the decision of the Tax Court. On August 1, 2023, we filed a Notice of New Authority in our refund case in the Western District of Michigan alerting the court to the Third Circuit Court decision in Mylan v. Comm’r that ruled in favor of the taxpayer on nearly identical ANDA issues that we have before the court. On August 22, 2022, the parties filed a Notice of New Authority in the refund case alerting the court to a United States Court of Federal Claims decision in Actavis Laboratories v. United States that also ruled in favor of the taxpayer on the ANDA issues. The government appealed the Actavis Laboratories decision to the United States court of Appeals for the Federal Circuit in December of 2022; briefing to the appellate court has been completed and the case is awaiting oral argument.
On January 13, 2021, the IRS issued a 30-day letter and Revenue Agent's Report ("RAR") with respect to its audit of our fiscal tax years ended June 29, 2013, June 28, 2014, and June 27, 2015. The 30-day letter proposed, among other modifications, transfer pricing adjustments in connection with the distribution of omeprazole in the aggregate amount of $141.6 million and ANDA-related adjustments in the aggregate amount of $21.9 million. The 30-day letter also set forth adjustments described in the next two paragraphs. We timely filed a protest to the 30-day letter for those additional adjustments but noting that due to the pending refund litigation described above, IRS Appeals would not consider the merits of the omeprazole or ANDA matters. We believe that we should prevail on the merits on both carryforward issues and have reserved for taxes and interest payable on the 5.24% deemed royalty on omeprazole through the tax year ended December 31, 2018. Beginning with the tax year ended December 31, 2019, we began reporting income commensurate with the 5.24% deemed royalty. We have not reserved for the ANDA-related issue described above. While we believe we should prevail on the merits of this case, the outcome remains uncertain. If our litigation position on the omeprazole issue is not sustained, the outcome for the 2009–2012 tax years could range from a reduction in the refund amount to denial of any refund. In addition, we expect that the outcome of the refund litigation could effectively bind future tax years. In that event, an adverse ruling on the omeprazole issue could have a material impact on subsequent periods, with additional tax liability in the range of $25.0 million to $124.0 million, not including interest and any applicable penalties.
The 30-day letter for the 2013-2015 tax years also proposed to reduce Perrigo U.S.'s deductible interest expense for the 2014 tax year and the 2015 tax year on $7.5 billion in certain intercompany debts owed by it to Perrigo Company plc. The debts were incurred in connection with the 2013 Elan merger transaction in 2013. On May 7, 2020, the IRS issued a Notice of Proposed Adjustment ("NOPA") capping the interest rate on the debts for U.S. federal tax purposes at 130.0% of the Applicable Federal Rate ("AFR") (a blended rate reduction of 4.0% per annum) on the stated ground that the loans were not negotiated on an arms-length basis. The May 7, 2020 NOPA proposed a reduction in gross interest expense of approximately $414.7 million for tax years 2014 and 2015. On January 13, 2021, we received a RAR, together with the 30-day letter, requiring our filing of a written protest to request IRS Appeals consideration. The protest was timely filed with the IRS on February 26, 2021. On January 20,
Perrigo Company plc - Item 1
Note 14
2022, the IRS responded to our protest with its rebuttal in which it revised its position on this interest rate issue by reasserting that implicit parental support considerations are necessary to determine the arm's length interest rates and proposed revised interest rates that are higher than the interest rates proposed under its 130.0% of AFR assertion. The blended interest rate proposed by the IRS rebuttal was 4.36%, an increase from the blended interest rate in the RAR of 2.57% but lower than the stated blended interest rate of the loans of 6.8%. An IRS Appeals conference for the interest rate issue was held during March 7, 2023 through March 9, 2023. On May 5, 2023, we finalized an agreement with IRS Appeals resulting in settlement of the May 7, 2020 NOPA of $153.4 million of gross interest expense reduction for the 2014-2015 tax years. This implies a blended interest rate of 5.44%. In addition, based on the above agreement with IRS Appeals, we will apply similar adjustments for all remaining tax years through 2018. On December 20, 2023, the IRS Examination Team confirmed that the interest rates agreed with IRS Appeals for the 2014-2015 tax years will be applied to the future tax years through 2018. In the second and fourth quarters of fiscal year 2023 we adjusted our previously established reserves related to this matter to account for the agreed reduction of the interest rates. On March 28, 2024, we received a Notice of Assessment and on April 10, 2024, subsequent to the quarter end, we made the settlement payment.
On December 2, 2021, the IRS commenced an audit of our federal income tax returns for the tax years ended December 31, 2015, through December 31, 2019.
Internal Revenue Service Audit of Athena Neurosciences, Inc., a U.S. Subsidiary
On December 22, 2016, we received a NOPA for the year ended December 31, 2011, denying the deductibility of settlement costs incurred in 2011 by Athena's parent company Elan Pharmaceuticals, Inc. ("EPI") related to illegal marketing of Zonegran by EPI's employees in the United States raised in a Qui Tam action under the U.S. False Claims Act. We strongly disagreed with the IRS' position on this issue. Because we believed that any concession on this issue in Appeals would be contrary to our evaluation of the issue and to avoid double taxation of the same income in the United States and Ireland, we pursued our remedies under the Mutual Agreement Procedure ("MAP") of the U.S.-Ireland Income Tax Treaty to alleviate double taxation. On October 20, 2020, we requested Competent Authority assistance and the request was accepted. This issue remains pending in the MAP and is being considered by the U.S. and Irish Competent Authorities.
Summary
Although we believe that our tax estimates are reasonable and that we prepare our tax filings in accordance with all applicable tax laws, the final determination with respect to any tax audit and any related litigation could be materially different from our estimates or from our historical income tax provisions and accruals. The results of an audit or litigation could have a material effect on operating results and/or cash flows in the periods for which that determination is made. In addition, future period earnings may be adversely impacted by litigation costs, settlements, penalties, and/or interest assessments.
Based on the final resolution of tax examinations, judicial or administrative proceedings, changes in facts or law, expirations of statute of limitations in specific jurisdictions or other resolutions of, or changes in, tax positions - one or more of which may occur within the next twelve months - it is reasonably possible that unrecognized tax benefits for certain tax positions taken on previously filed tax returns may change materially from those recorded as of March 30, 2024. However, we are not able to estimate a reasonably possible range of how these events may impact our unrecognized tax benefits in the next twelve months.
Perrigo Company plc - Item 1
Note 15
NOTE 15 - CONTINGENCIES
In view of the inherent difficulties of predicting the outcome of various types of legal proceedings, we cannot determine the ultimate resolution of the matters described below. We establish reserves for litigation and regulatory matters when losses associated with the claims become probable and the amounts can be reasonably estimated. The actual costs of resolving legal matters may be substantially higher or lower than the amounts reserved for those matters. For matters where the likelihood or extent of a loss is not probable or cannot be reasonably estimated as of March 30, 2024, we have not recorded a loss reserve. If certain of these matters are determined against us, there could be a material adverse effect on our financial condition, results of operations, or cash flows. We currently believe we have valid defenses to the claims in these lawsuits and intend to defend these lawsuits vigorously regardless of whether or not we have a loss reserve. Other than what is disclosed below, we do not expect the outcome of the litigation matters to which we are currently subject to, individually or in the aggregate, have a material adverse effect on our financial condition, results of operations, or cash flows.
Price-Fixing Lawsuits Related to the Company's Former Rx Business
Beginning in 2016, the Company, along with other manufacturers, was named as a defendant in lawsuits in the United States and Canada generally alleging anticompetitive conduct with respect to the sale of generic drugs by the Company’s former Rx business. The complaints – which have been filed by putative classes of direct purchasers, end payors, andindirect resellers, as well as individual direct and indirect purchasers and certain cities and counties – allege a conspiracy to fix, maintain, stabilize, and/or raise prices, rig bids, and allocate markets or customers for various generic drugs in violation of federal and state antitrust and consumer protection laws. While most of the class complaints involve alleged single-drug conspiracies, the three putative classes and many of the opt out plaintiffs have each filed an over-arching conspiracy complaint alleging that Perrigo and other manufacturers (and some individuals) entered into an “overarching conspiracy” that involved allocating customers, rigging bids, and raising, maintaining, and fixing prices for various products.The vast majority of the lawsuits described in this paragraph have been consolidated in the In re Generic Pharmaceuticals Pricing Antitrust Litigation multidistrict litigation ("MDL") MDL No. 2724 (United States District Court for Eastern District of Pennsylvania).
The Court has designated three sets of cases to proceed as "bellwethers," meaning that they will proceed on a more expedited basis than the other cases in the MDL. Those cases are (a) class actions alleging "single drug" conspiracies involving Clobetasol and Clomipramine; and (b) the third Complaint filed by the State Attorneys General alleging an overarching conspiracy concerning various topical products (described below). Perrigo was initially named as a defendant in the Clobetasol class bellwether cases, but the classes voluntarily dismissed their claims against Perrigo relating to “single drug” conspiracies involving Clobetasol in May 2023. Discovery closed in the bellwether cases on October 2, 2023. Summary judgment motions in the State bellwether case are due September 23, 2024. No trial dates have been set for any of the bellwether cases, or any of the other cases in the MDL.
State Attorney General Complaint
On June 10, 2020, the Connecticut Attorney General’s office filed a lawsuit on behalf of Connecticut and 50 other states and territories against Perrigo, 35 generic pharmaceutical manufacturers, and certain individuals (including two former Perrigo employees), alleging an overarching conspiracy to allocate customers and/or fix, raise, or stabilize prices of eighty products. This case is included among the “bellwether cases” designated to follow the expedited schedule described above. On April 19, 2024, this case was remanded from the MDL and transferred to the District of Connecticut. No trial date has been set for this case.
Canadian Class Action Complaint
In June 2020, an end payor filed a class action in Ontario, Canada against Perrigo and 29 manufacturers alleging an overarching conspiracy to allocate customers and/or fix, raise or stabilize prices of dozens of products, most of which were neither made nor sold by Perrigo's former Rx business. The product conspiracies allegedly involving Perrigo focus on the same products as those involved in other MDL complaints naming Perrigo: Clobetasol, Desonide, Econazole, and Nystatin. In December 2020, Plaintiffs amended their complaint to add additional claims based on the State Attorney General Complaint of June 2020.
Perrigo Company plc - Item 1
Note 15
Hospitals Complaint
On June 30, 2023, a group of 150 hospitals filed a complaint against Perrigo and 35 other generic drug manufacturers alleging a conspiracy to fix, raise, or stabilize prices of 228 products. Perrigo's former Rx business made and sold 33 of these products. Most of the product conspiracies allegedly involving Perrigo focus on products that are the same as the products involved in other MDL complaints naming Perrigo. This case was transferred to the MDL on September 15, 2023 for all pre-trial proceedings.
At this stage, we cannot reasonably estimate the outcome of the liability if any, associated with the claims listed above. We intend to defend each of these lawsuits vigorously.
Self-Insured Employer Complaint
On April 4, 2024, nine corporate employers with self-insured health and benefit plans filed a complaint against Perrigo and 35 other generic drug manufacturers alleging a conspiracy to fix, raise, or stabilize prices of scores of generic drug products, most of which were neither made nor sold by Perrigo. The allegations in this complaint, and the products at issue, parallel the allegations in other complaints in the MDL. This case is in the process of being transferred into the MDL for pretrial proceedings.
At this stage, we cannot reasonably estimate the outcome of the liability if any, associated with the claims listed above. We intend to defend each of these lawsuits vigorously.
Securities Litigation
In the United States (cases related to events in 2015-2017)
Beginning in May 2016, purported class action complaints were filed against the Company and our former CEO, Joseph Papa, in the U.S. District Court for the District of New Jersey (Roofers’ Pension Fund v. Papa, et al.) purporting to represent a class of shareholders for the period from April 21, 2015 through May 11, 2016, inclusive. The original complaint alleged violations of federal securities laws in connection with the actions taken by us and the former executive to defend against the unsolicited takeover bid by Mylan in the period from April 21, 2015 through November 13, 2015. The plaintiff also alleged that the defendants provided inadequate disclosure concerning alleged business developments during the alleged class period including integration problems related to the Omega acquisition.
The operative complaint is the first amended complaint filed on June 21, 2017, and named as defendants us and 11 current or former directors and officers of Perrigo (Mses. Judy Brown, Laurie Brlas, Jacqualyn Fouse, Ellen Hoffing, and Messrs. Joe Papa, Marc Coucke, Gary Cohen, Michael Jandernoa, Gerald Kunkle, Herman Morris, and Donal O’Connor). The amended complaint alleges violations of federal securities laws arising out of the actions taken by us and the former directors and executives to defend against the unsolicited takeover bid by Mylan in the period from April 21, 2015 through November 13, 2015 and the allegedly inadequate disclosure throughout the entire class period related to the business developments during that longer period (April 2015 to May 2017) including purported integration problems related to the Omega acquisition, alleges incorrect reporting of organic growth at the Company and at Omega, alleges price fixing activities with respect to six generic prescription pharmaceuticals, and alleges improper accounting for the Tysabri® royalty stream. During 2017, the defendants filed motions to dismiss, which the plaintiffs opposed. On July 27, 2018, the court issued an opinion and order granting the defendants’ motions to dismiss in part and denying the motions to dismiss in part. The court dismissed without prejudice defendants Laurie Brlas, Jacqualyn Fouse, Ellen Hoffing, Gary Cohen, Michael Jandernoa, Gerald Kunkle, Herman Morris, Donal O’Connor, and Marc Coucke. The court also dismissed without prejudice claims arising from the Tysabri® accounting issue described above and claims alleging incorrect disclosure of organic growth described above. The defendants who were not dismissed are the Company, Joe Papa, and Judy Brown. The claims (described above) that were not dismissed relate to the integration issue regarding the Omega acquisition, the defense against the Mylan tender offer, and the alleged price fixing activities with respect to six generic prescription pharmaceuticals. The defendants who remain in the case (us, Mr. Papa, and Ms. Brown) have filed answers denying liability.
On November 14, 2019, the court granted the lead plaintiffs’ motion and certified three classes for the case: (i) all those who purchased shares between April 21, 2015 through May 2, 2017 inclusive on a U.S. exchange and were
Perrigo Company plc - Item 1
Note 15
damaged thereby; (ii) all those who purchased shares between April 21, 2015 through May 2, 2017 inclusive on the Tel Aviv exchange and were damaged thereby; and (iii) all those who owned shares as of November 12, 2015 and held such stock through at least 8:00 a.m. on November 13, 2015 (whether or not a person tendered shares in response to the Mylan tender offer) (the "tender offer class"). Plaintiffs' counsels sent notices during 2020 to the alleged classes.
The parties took discovery from 2018 through 2020. After discovery ended, defendants filed motions for summary judgement and to exclude plaintiffs' experts, which were fully briefed. On August 17, 2023, the court granted summary judgment to Ms. Brown on all claims and dismissed her from the case; the court granted summary judgment in part to Mr. Papa terminating the claim against him that he made false statements with respect to alleged collusive pricing at the Generic Rx business. The court did not grant summary judgment on statements made about the integration of Omega during 2015. Thereafter, parties engaged in court-ordered settlement conferences.
On April 5, 2024, the class plaintiffs filed papers seeking Court approval of a settlement between the alleged classes and the defendants for $97 million. Perrigo and the remaining $3.7individual defendant agreed to the proposed settlement without any concession of liability or wrongdoing. Because this is a settlement of a class action lawsuit, Court oversight and approval is required. On April 23, 2024, the Court issued an Order of Preliminary Approval of the proposed settlement. A hearing on final approval of the proposed settlement is set for September 5, 2024. If the Court issues a Final Approval Judgment and Order after the final approval hearing, the case will be settled and terminated as to Perrigo, its co-defendant, and other individuals who previously had been named as defendants. We recorded an additional loss provision of $34 million during the quarter as a result of the pending settlement. The expense is presented within Other operating expense (income), net on the Condensed Consolidated Statements of Operations for the three months ended March 30, 2024.
In addition to the class action, the following opt-out cases have been filed against us, and in some cases, Mr. Papa and Ms. Brown. We intend to defend these lawsuits vigorously. These cases in the New Jersey federal court currently are stayed pending further developments in the Roofers' case (discussed above). We anticipate that one or more of the opt-out plaintiffs will take a position that the settlement of the Roofer’s case does not have any direct effect on the opt out cases discussed below. The following lawsuits contain factual allegations and claims that are similar to some or all of the factual allegations and claims in the class actions, but involve different evidence, expert witnesses, and theories of liability:
Perrigo Company plc - Item 1
Note 15
| | | | | |
| Case | Date Filed |
| Carmignac Gestion, S.A. v. Perrigo Company plc, et al. | 11/1/2017 |
| First Manhattan Co. v. Perrigo Company plc, et al. | 2/16/2018; amended 4/20/2018 |
| Nationwide Mutual Funds, et al. v. Perrigo Company plc, et al. | 10/29/2018 |
| Schwab Capital Trust, et al. v. Perrigo Company plc, et al. | 1/31/2019 |
| Aberdeen Canada Funds -- Global Equity Fund, et al. v. Perrigo Company plc, et al. | 2/22/2019 |
| Principal Funds, Inc., et al. v. Perrigo Company plc, et al. | 3/5/2020 |
| Kuwait Investment Authority, et al. v. Perrigo Company plc, et al. | 3/31/2020 |
| Mason Capital L.P., et al. v. Perrigo Company plc, et al. | 1/26/2018 |
| Pentwater Equity Opportunities Master Fund Ltd., et al. v. Perrigo Company plc, et al. | 1/26/2018 |
| WCM Alternatives: Event-Drive Fund, et al. v. Perrigo Co., plc, et al. | 11/15/2018 |
| Hudson Bay Master Fund Ltd., et al. v. Perrigo Co., plc, et al. | 11/15/2018 |
| Discovery Global Citizens Master Fund, Ltd., et al. v. Perrigo Co. plc, et al. | 12/18/2019 |
| York Capital Management, L.P., et al. v. Perrigo Co. plc, et al. | 12/20/2019 |
| Burlington Loan Management DAC v. Perrigo Co. plc, et al. | 2/12/2020 |
| Universities Superannuation Scheme Limited v. Perrigo Co. plc, et al. | 3/2/2020 |
| Harel Insurance Company, Ltd., et al. v. Perrigo Company plc, et al. | 2/13/2018 |
| TIAA-CREF Investment Management, LLC., et al. v. Perrigo Company plc, et al. | 4/20/2018 |
| Sculptor Master Fund (f/k/a OZ Master Fund, Ltd.), et al. v. Perrigo Company plc, et al. | 2/6/2019 |
| BlackRock Global Allocation Fund, Inc., et al. v. Perrigo Co. plc, et al. | 4/21/2020 |
| Starboard Value and Opportunity C LP, et al. v. Perrigo Company plc, et al. | 2/25/2021 |
| |
| |
| |
In June 2020, three Highfields Capital entities filed a lawsuit in Massachusetts State Court with factual allegations that generally were similar to the factual allegations in the Amended Complaint in the Roofers' Pension Fund case described above, except that the Highfields plaintiffs did not include allegations about alleged collusive pricing of generic prescription drugs, and alleged Massachusetts state law claims under the Massachusetts Unfair Business Methods Law (chapter 93A) and Massachusetts common law claims of tortious interference with prospective economic advantage, common law fraud, negligent misrepresentation, and unjust enrichment. In December 2021, the Massachusetts State Court granted Defendants’ motion to dismiss in part and denied it in part. Defendants filed their answers in January 2022 denying liability. This is the only opt out case that has not been stayed during the summary judgment proceedings in the New Jersey federal court. The fact discovery phase in this case ended in March 2024 and expert discovery is underway (including discovery related to some factual allegations that were not part of the discovery in the actions in New Jersey federal court). The Court's current scheduling order provides for the end of expert discovery in August 2024, and a post-discovery court conference in September 2024. We intend to defend the lawsuit vigorously.
In Israel (cases related to events in 2015-2017)
On June 28, 2017, a plaintiff filed a complaint in Tel Aviv District Court styled Israel Elec. Corp. Employees’ Educ. Fund v. Perrigo Company plc, et al. The lead plaintiff seeks to represent a class of shareholders who purchased Perrigo stock on the Tel Aviv exchange during the period from April 24, 2015 through May 3, 2017 and also a claim for those that owned shares on the final day of the Mylan tender offer (November 13, 2015). The complaint names as defendants the Company, Ernst & Young LLP (the Company’s auditor), and 11 current or former directors and officers of Perrigo (Mses. Judy Brown, Laurie Brlas, Jacqualyn Fouse, Ellen Hoffing, and Messrs. Joe Papa, Marc Coucke, Gary Cohen, Michael Jandernoa, Gerald Kunkle, Herman Morris, and Donal O’Connor). The complaint alleges violations under Israeli securities laws that are similar to U.S. Securities Exchange Act sections 10(b) (and Rule 10b‑5) and 14(e) against all defendants and 20(a) control person liability against the 11 individuals or, in the alternative, under other Israeli securities laws. In general, the allegations in Israel are similar to the factual allegations in the Roofers' Pension Fund case in the U.S. as described above. The plaintiff indicates an initial, preliminary class damages estimate of 2.7 billion NIS (approximately $760.0 million at 1 NIS = 0.28 cents). After the other two cases filed in Israel were voluntarily dismissed, the plaintiff in this case agreed to stay this case pending
Perrigo Company plc - Item 1
Note 15
the outcome of the Roofers’ Pension Fund case in the U.S. (described above). The Israeli court approved the stay, and this case is now stayed. We intend to defend the lawsuit vigorously.
In Israel (case related to Irish Tax events)
On December 31, 2018, a shareholder filed an action against the Company, our former CEO Murray Kessler, and our former CFO Ronald Winowiecki in Tel Aviv District Court (Baton v. Perrigo Company plc, et. al.). The case is a securities class action brought in Israel making similar factual allegations for the same period as those asserted in a securities class action case (for those who purchased on a U.S. exchange) in New York federal court in which the settlement received final approval in February 2022. The Baton case alleges that persons who purchased securities through the Tel Aviv stock exchange and suffered damages can assert claims under Israeli securities law that will follow the liability principles of Sections 10(b) and 20(a) of the U.S. Securities Exchange Act. The plaintiff does not provide an estimate of class damages. Since 2019, the court granted several requests by Perrigo to stay the proceedings pending the resolution of proceedings in the New York federal court. During 2022, the case was reassigned to a newly-appointed judge. After the settlement of the U.S. case in New York federal court, Perrigo's counsel informed the Israeli Court of the final approval of the settlement of the U.S. case. The parties then sought further stays of the case while they attempted mediation, which the Court granted. In April 2023, the parties reported to the Court that the mediation had led to a preliminary agreement on settlement. The parties submitted settlement papers to the Court on November 17, 2023. The Court set a deadline of early January 2024 for objections to the proposed class settlement, and a hearing on the motion to certify the settlement is scheduled for May 15, 2024.
Other Matters
Talcum Powder
The Company has been named, together with other manufacturers, in product liability lawsuits in a variety of state courts alleging that the use of body powder products containing talcum powder causes mesothelioma and lung cancer due to the presence of asbestos. All but one of these cases involve legacy talcum powder products that have not been manufactured by the Company since 1999. One of the pending actions involves a current prescription product that contains talc as an excipient. As of March 30, 2024, the Company has been named in approximately 110 individual lawsuits seeking compensatory and punitive damages. The Company has several defenses and intends to aggressively defend these lawsuits. Trials for these lawsuits are currently scheduled throughout 2024 and 2025.
Ranitidine
After regulatory bodies announced worldwide that ranitidine may potentially contain N-nitrosodimethylamine ("NDMA"), the Company promptly began testing its externally-sourced ranitidine API and ranitidine-based products. On October 8, 2019, the Company halted shipments of the product based upon preliminary results and on October 23, 2019, the Company made the decision to conduct a voluntary retail market withdrawal.
In February 2020, the resulting actions involving Zantac® and other ranitidine products were transferred for coordinated pretrial proceedings to a Multi-District Litigation ("MDL") (In re Zantac®/Ranitidine Products Liability Litigation, MDL No. 2924) in the U.S. District Court for the Southern District of Florida. The Company successfully moved to dismiss the first set of Master Complaints in the MDL, which the Court granted without prejudice.
After the filing of Amended Complaints, on June 30, 2021, the Court then dismissed all claims against the retail and distributor defendants with prejudice and on July 8, 2021, the Court dismissed all claims against the Company with prejudice. Appeals of these dismissal orders to the U.S. Court of Appeals for the 11th Circuit have been filed, as well as several state level claims related to the theories advanced in the MDL litigation. The Company will continue to vigorously defend each of these lawsuits. In December 2022 the Court granted in full the brand defendants' Daubert motions, finding no scientific causation, and in turn granted summary judgment dismissing the actions with prejudice. The Court later ruled that it was appropriate to apply the same standards to the retail and distributor defendants as well as the generic defendants, and the Court thereby ruled that its Daubert decision applied equally to these defendants as well. Appeals of these orders have been filed to the 11th Circuit.
Excepting the MDL due to the nature of the multiple dismissals as described above, as of March 30, 2024, the Company has been named in approximately 190 personal injury lawsuits, primarily in the state courts of California
Perrigo Company plc - Item 1
Note 15
and Pennsylvania. The Company is named in these lawsuits with manufacturers of the national brand Zantac® and other manufacturers of ranitidine products, as well as distributors, repackagers, and/or retailers. The Company believes that it has strong defenses to such claims based on a significant body of scientific evidence, and pursuant to the doctrine of federal preemption. As noted above, the Company has won multiple motions to dismiss in the MDL, most recently in Illinois where the Circuit Court granted in full the Company's motions to dismiss based on federal preemption, as well as additional state court actions in California and Maryland. The Company has also been dismissed from additional state court actions in Ohio, New York and New Jersey.
The Company, along with other manufacturers has also been named in a Complaint brought by the New Mexico Attorney General based on nuisance and negligence theories. The Company's motions to dismiss the action were denied. The Company will continue to vigorously defend this lawsuit.
Some of the Company’s retailer customers are seeking indemnity from the Company for a portion of their defense costs and liability relating to these cases.
Acetaminophen
In October 2022, the Judicial Panel on Multidistrict Litigation consolidated a number of pending actions filed in various federal courts alleging that prenatal exposure to acetaminophen is purportedly associated with the development of autism spectrum disorder (“ASD”) and attention-deficit/hyperactivity disorder (“ADHD”). The acetaminophen MDL is styled In re: Acetaminophen – ASD/ADHD Products Liability Litigation (MDL No. 3043) and is pending before the U.S. District Court for the Southern District of New York. Plaintiffs in the MDL have asserted claims against Johnson & Johnson Consumer, Inc. (“JJCI”) and various retailer chains alleging that plaintiff-mothers took acetaminophen products while pregnant and that plaintiff-children developed ASD and/or ADHD as a result of prenatal exposure to these acetaminophen products. As of March 30, 2024, the Company has not been named as a defendant in any Complaints filed in the MDL. Certain of the Company’s customers have made requests regarding indemnity from the Company for a portion of their defense costs and potential liability. On December 18, 2023, the Court granted in full defendants' motions to exclude testimony of Plaintiffs' general causation expert witnesses, finding Plaintiffs presented no credible evidence of scientific causation between prenatal ingestion of acetaminophen and ASD or ADHD in children. Final judgment has been entered as to the majority of pending cases with an appeal to proceed in the Second Circuit. A small minority of cases have been exempted from the Court’s dismissal, and will be evaluated through a similar process as the larger majority later this year to determine if they can withstand scientific causation through a new expert. Currently, it is not possible to assess reliably the outcome of these cases or any potential future financial impact on the Company.
Phenylephrine
In September 2023, the FDA’s Advisory Committee on Nonprescription Drugs issued an advisory opinion calling into question the efficacy of orally administered phenylephrine (PE) containing products as a nasal decongestant. While the FDA itself has thus far taken no action in response to the Advisory Committee opinion, several putative class action lawsuits have been filed asserting various economic injury claims to consumers. On December 6, 2023, a number of the pending PE actions filed in various federal courts were consolidated into a multi-district litigation ("MDL") (In re: Oral Phenylephrine Marketing and Sales Practices Litigation, MDL No. 3089), pending before the U.S. District Court for the Eastern District of New York. A smaller group of putative class-action lawsuits alleging various PE products also were mislabeled as "Maximum Strength" were initially excluded from the consolidation, but have recently been joined to the MDL. Several individual arbitrations have also been threatened or filed with the American Arbitration Association with similar efficacy allegations.
At this time, the MDL proceedings are in the early stages. Currently, it is not possible to assess reliably the outcome of these cases or any potential future financial impact on the Company. Certain of the Company’s customers have made requests regarding indemnity from the Company for a portion of their defense costs and potential liability.
Contingencies Accruals
As a result of the matters discussed in this Note, the Company has established a loss accrual for litigation contingencies where we believe a loss to be probable and for which an amount of loss can be reasonably estimated. However, we cannot determine a reasonable estimate of the maximum possible loss or range of loss for these matters given that they are at various stages of the litigation process and each case is subject to inherent
Perrigo Company plc - Item 1
Note 15
uncertainties of litigation. At March 30, 2024, the loss accrual for litigation contingencies reflected on the balance sheet in Other accrued liabilities was $100.9 million. The Company also recorded an insurance recovery receivable reflected on the balance sheet in Prepaid expenses and other current assets of $25.5 million related to these litigation contingencies because it believes such amount is recoverable based on communications with its insurers to date; however, the Company may erode this insurance receivable as it incurs defense costs associated with defending the matters. The Company’s management believes these accruals for contingencies are reasonable and sufficient based upon information currently available to management; however, there can be no assurance that final costs related to these contingencies will not exceed current estimates or that all of the final costs related to these contingencies will be covered by insurance. (See "Insurance Coverage Litigation," below.) In addition, we have other litigation matters pending for which we have not recorded any accruals because our potential liability for lease exit coststhose matters is expected tonot probable or cannot be incurred over the remaining termsreasonably estimated based on currently available information. For those matters where we have not recorded an accrual but a loss is reasonably possible, we cannot determine a reasonable estimate of the applicable leases.maximum possible loss or range of loss for these matters given that they are at various stages of the litigation process and each case is subject to the inherent uncertainties of litigation.
Insurance Coverage Litigation
In May 2021, insurers on multiple policies of D&O insurance filed an action in the High Court in Dublin against the Company and multiple current and former directors and officers of the Company seeking declaratory judgments on certain coverage issues. Those coverage issues include claims that policies for periods beginning in December 2015 (the "2015 Policy" and December 2016 (the "2016 Policy"), respectively, do not have to provide coverage for the securities actions described above pending in the District of New Jersey or in Massachusetts state court concerning the events of 2015-2017. The policy for the period beginning December 2014 (the "2014 Policy") is currently providing coverage for those matters. However, if the insurers were successful, the total amount of insurance coverage available to defend such lawsuits and to satisfy any judgment or settlement costs thereunder would be limited to one policy period. The insurers’ lawsuit also challenges aspects of coverage for Krueger derivatively on behalf of nominal defendant Perrigo Company plc v. Alford et al., a prior derivative action filed in the District of New Jersey that was dismissed in August 2020, and for the counterclaims brought in the Omega arbitration proceedings. Perrigo responded on November 1, 2021; Perrigo’s defense and counterclaim included its position that the 2015 Policy and 2016 Policy also provide coverage for the underlying securities litigation matters and sought a ruling to that effect. The discovery stage of the case occurred in 2022, and a bench trial was held in mid-November 2023. In January 2024, the Court issued an opinion rejecting the insurers' position that Perrigo's insurance coverage is limited to the 2014 Policy. The Court held an additional hearing in April 2024 to hear the parties' submissions concerning under which of the 2014, 2015, and 2016 Policies Perrigo is entitled to coverage. Insurers now claim the cover is limited to the 2015 Policy year. The insurers have 28 days after the order is finalized to seek an appeal of the Court's January 2024 decision.
NOTE 16 –- SEGMENT INFORMATION
Our reporting segments are as follows:
CHCA,comprises our U.S., Mexico and Canada consumer healthcare business (OTC, contract, infant formula and animal health categories).
CHCI,comprises our legacy Branded Consumer Healthcare segment and now includes our consumer focused businesses in the U.K., Australia, and Israel. This segment also includes our U.K. liquid licensed products business.
RX,comprises our U.S. Prescription Pharmaceuticals business.
We also have an "Other" reporting segment that consists of our legacy API business, which does not meet the quantitative threshold required to be a separately reportable segment. Effective January 1, 2017, due to the sale of the Tysabri® financial asset, all legal expenses associated with the former Specialty Sciences segment were moved to unallocated expenses. Our segments reflect the way in which our chief operating decision maker reviews our operating results and allocates resources.
Perrigo Company plc - Item 1
Note 16
The tables below tables show select financial measures by reporting segment (in millions):
| | | | | | | | | | | | | | |
| | Total Assets |
| | March 30, 2024 | | December 31, 2023 |
| CSCA | | $ | 4,902.7 | | | $ | 4,952.9 | |
| CSCI | | 5,737.6 | | | 5,856.2 | |
| | | | |
| | | | |
| | | | |
| Total | | $ | 10,640.3 | | | $ | 10,809.1 | |
| | | | | | | | | | | | | | | | | | | | | | | | | | | | | | | | | | | |
| Three Months Ended |
| March 30, 2024 | | April 1, 2023 |
| Net
Sales | | Operating Income (Loss) | | Intangible Asset Amortization | | Net
Sales | | Operating Income (Loss) | | Intangible Asset Amortization |
| CSCA | $ | 644.1 | | | $ | 15.7 | | | $ | 14.6 | | | $ | 763.7 | | | $ | 83.2 | | | $ | 13.9 | |
| CSCI | 437.9 | | | 26.5 | | | 43.8 | | | 418.1 | | | 21.3 | | | 51.5 | |
| | | | | | | | | | | |
| | | | | | | | | | | |
| Unallocated | — | | | (97.4) | | | — | | | — | | | (56.0) | | | — | |
| Continuing Operations Total | $ | 1,082.1 | | | $ | (55.2) | | | $ | 58.4 | | | $ | 1,181.7 | | | $ | 48.5 | | | $ | 65.4 | |
Perrigo Company plc - Item 2
Note 16
|
| | | | | | | | |
| | | Total Assets |
| | | September 30,
2017 | | December 31,
2016 |
| CHCA | | $ | 3,833.7 |
| | $ | 3,351.3 |
|
| CHCI | | 5,114.2 |
| | 4,795.2 |
|
| RX | | 2,597.0 |
| | 2,646.4 |
|
| Specialty Sciences | | — |
| | 2,775.8 |
|
| Other | | 297.7 |
| | 301.4 |
|
| Total | | $ | 11,842.6 |
| | $ | 13,870.1 |
|
NOTE 17 - SUBSEQUENT EVENTS
Divestitures
On April 25, 2024, we announced a binding offer to sell our HRA Pharma Rare Diseases business ("Rare Disease") to Esteve Healthcare, S.L. ("ESTEVE") for total consideration of up to €275 million, consisting of an upfront cash payment of €190 million and up to €85 million in potential earnout payments based on the Rare Diseases business achieving certain sales milestones. Following an information and consultation process with HRA Pharma Works Council in France, Perrigo would be able to exercise the put option granted by ESTEVE and enter into a definitive agreement with ESTEVE for the sale of the Rare Diseases business. The transaction is expected to close during the third quarter of 2024.
The criteria for reporting our Rare Disease disposal group as held for sale were met after the balance sheet date, and therefore we classified the business as held and used as of March 30, 2024. The total carrying amounts of our Rare Disease Business assets and liabilities that will be disposed, excluding cash, were approximately $325.6 million and $57.2 million, respectively, as of March 30, 2024. After considering estimates for the fair value of the contingent milestones and the remaining costs to sell, we expect to recognize an impairment loss between $20 and $30 million resulting from the measurement as held for sale during the second quarter of 2024.
|
| | | | | | | | | | | | | | | | | | | | | | | |
| | Three Months Ended |
| | September 30, 2017 | | October 1, 2016 |
| | Net Sales | | Operating Income (Loss) | | Intangible Asset Amortization | | Net Sales | | Operating Income (Loss) | | Intangible Asset Amortization |
| CHCA | $ | 598.8 |
| | $ | 124.3 |
| | $ | 16.9 |
| | $ | 611.2 |
| | $ | 99.0 |
| | $ | 17.6 |
|
| CHCI | 365.4 |
| | 4.6 |
| | 50.2 |
| | 377.4 |
| | (1,615.5 | ) | | 44.4 |
|
| RX | 250.6 |
| | 82.1 |
| | 21.0 |
| | 251.9 |
| | 74.4 |
| | 27.2 |
|
| Specialty Sciences | — |
| | — |
| | — |
| | — |
| | 3.2 |
| | — |
|
| Other | 16.5 |
| | (0.4 | ) | | 0.4 |
| | 21.1 |
| | (1.5 | ) | | 0.5 |
|
| Unallocated | — |
| | (48.2 | ) | | — |
| | — |
| | (27.9 | ) | | — |
|
| Total | $ | 1,231.3 |
| | $ | 162.4 |
| | $ | 88.5 |
| | $ | 1,261.6 |
| | $ | (1,468.3 | ) | | $ | 89.7 |
|
Perrigo Company plc - Item 2
Executive Overview
|
| | | | | | | | | | | | | | | | | | | | | | | |
| | Nine Months Ended |
| | September 30, 2017 | | October 1, 2016 |
| | Net Sales | | Operating Income (Loss) | | Intangible Asset Amortization | | Net Sales | | Operating Income (Loss) | | Intangible Asset Amortization |
| CHCA | $ | 1,786.4 |
| | $ | 303.6 |
| | $ | 51.1 |
| | $ | 1,880.2 |
| | $ | 316.4 |
| | $ | 53.3 |
|
| CHCI | 1,116.8 |
| | 8.7 |
| | 143.4 |
| | 1,232.7 |
| | (2,011.3 | ) | | 130.6 |
|
| RX | 708.4 |
| | 239.6 |
| | 65.6 |
| | 776.9 |
| | 258.3 |
| | 78.6 |
|
| Specialty Sciences | — |
| | — |
| | — |
| | — |
| | (1.9 | ) | | — |
|
| Other | 51.5 |
| | 9.4 |
| | 1.2 |
| | 59.5 |
| | 2.6 |
| | 1.4 |
|
| Unallocated | — |
| | (121.7 | ) | | — |
| | — |
| | (79.2 | ) | | — |
|
| Total | $ | 3,663.1 |
| | $ | 439.6 |
| | $ | 261.3 |
| | $ | 3,949.3 |
| | $ | (1,515.1 | ) | | $ | 263.9 |
|
ITEM 2. MANAGEMENT'S DISCUSSION AND ANALYSIS OF FINANCIAL CONDITION AND RESULTS OF OPERATIONS
EXECUTIVE OVERVIEW
ThisThe following Management’s Discussion and Analysis ("MD&A") is intended to provide readers with an understanding of Financial Conditionour financial condition, results of operations, and Results of Operationscash flows by focusing on changes in certain key measures from year to year. This MD&A is provided as a supplement to, and should be read in conjunction with the financial statementsour Condensed Consolidated Financial Statements and accompanying Notes found in Item I included in this Form 10-Q, and our Form 10-K for the year ended December 31, 20162023 (the “2016“2023 Form 10-K”). These historical financial statements may not be indicative of our future performance. This discussion contains a number of forward-looking statements, all of which are based on our current expectations and could be affected by the uncertainties and risks referred to under “Risk Factors” in Item 1A of our 20162023 Form 10-K and Part II,II. Item 1A of this Form 10-Q.
Perrigo Company plc was incorporated under the laws of Ireland on June 28, 2013 and became the successor registrant of Perrigo Company, a Michigan corporation, on December 18, 2013 in connection with the acquisition of Elan Corporation, plc ("Elan"). Unless the context requires otherwise, the terms "Perrigo," the "Company," "we," "our," "us," and similar pronouns used herein refer to Perrigo Company plc, its subsidiaries, and all predecessors of Perrigo Company plc and its subsidiaries.
EXECUTIVE OVERVIEW
Perrigo Company plc - Item 2
Executive Overview
We areis a leading global healthcarepure-play self-care company that delivers value to our customerswith more than a century of innovation and consumers by providing Quality Affordable Healthcare Products®. Founded in 1887 as a packagerexperience serving the health and wellness needs of home remedies, we have built a unique business model that is best described as the convergence of a fast-moving consumer goods company, a high-quality pharmaceutical manufacturing organization and a world-class supply chain network. We believe we areconsumers. As one of the world's largest manufacturersoriginators of the over-the-counter (“OTC”("OTC") healthcareself-care market, Perrigo has a powerful legacy and vast scale in producing high-quality self-care products through a proven ability to proactively shape its portfolio to meet the evolving needs of consumers and supplierscustomers.
Perrigo provides access to trusted self-care products that can be procured without the need to visit a doctor for a prescription. Guided by our vision and purpose, our strategic goal is to create a sustainable and value accretive growth engine by 1) delivering consumer preferred brands and innovation, 2) driving category growth with our customers, 3) powering our business with our world-class quality and supply chain, including a focus on sustainability with meaningful goals to reduce greenhouse gas emissions, water, and waste, in addition to improving the recyclability of infant formulas for theour packaging, and 4) evolving our global organization to a single operating model. Our unique competency is to deliver a blended-branded business model of branded, value and store brand market. We alsoproduct offerings that provide consumers access to self-care products across the value spectrum.
Perrigo's broad offerings are a leading provider of branded OTC products throughout Europe and the U.S.,well diversified across several major product categories as well as a leading producer of generic standard topical products such as creams, lotions, and gels, as well as inhalants and injections ("extended topical") prescription drugs. We are headquartered in Ireland, and sell our productsacross geographies, primarily in North America and Europe as well aswith no one product representing more than 3% of total revenue. In North America, Perrigo is the leading store brand private label provider of self-care products in many categories, including upper respiratory, nutrition and women's health, along with brands including Opill® and Merderma®. In Europe, our portfolio consists primarily of brands, including Compeed®, EllaOne®, Solpadeine®, and ACO®.
Several initiatives are anticipated to advance our self-care strategy, including the implementation of our Supply Chain Reinvention Program and Project Energize, a global investment and efficiency program. In addition, we continue to invest in other markets,initiatives, including Australia, Israelinnovation, information systems and China.tools, and our people to drive consistent and sustainable results.
Our fiscal year begins on January 1 and ends on December 31. We end our quarterly accounting periods on the Saturday closest to the end of the calendar quarter, with the fourth quarter ending on December 31 of each year.
Our Segments
Our reporting and operating segments are as follows:reflect the way our chief operating decision maker, who is our CEO, makes operating decisions, allocates resources and manages the growth and profitability of the Company. Our reporting and operating segments are:
•Consumer HealthcareSelf-Care Americas ("CHCA" ("CSCA"), comprises our consumer self-care business in the U.S., Mexico and Canada.
•Consumer Self-Care International ("CSCI") comprises our consumer self-care business outside of the U.S. and Canada, consumer healthcareprimarily in Europe and Australia.
Perrigo Company plc - Item 2
Executive Overview
We previously had an Rx segment comprised of our generic prescription pharmaceuticals business (OTC, contract, infant formulain the U.S. and animal health categories).
Consumer Healthcare International("CHCI"),comprises our legacy Branded Consumer Healthcare segmentother pharmaceuticals and now includes our consumer focuseddiagnostic businesses in the U.K., Australia,Israel, which have been divested. The Rx segment was reported as Discontinued Operations in 2021, and Israel. This segment also includes our U.K. liquid licensed products business.
Prescription Pharmaceuticals("RX"),comprises our U.S. Prescription Pharmaceuticals business.
We also have an "Other" reporting segment, which comprises our legacy Active Pharmaceutical Ingredients ("API") business,which does not meet the quantitative threshold required to be a separately reportable segment. Effective January 1, 2017, due to the sale of the Tysabri® financial asset,is presented as such for all legal expenses associated with our former Specialty Sciences segment were moved to unallocated expenses. For results by segment, see "Segment Results" below and periods in this report. See Item 1. Note 163. for more information.
2017 Year-to-DateRecent Highlights
| |
• | On March 27, 2017, we completed the sale of our Tysabri® financial asset, effective January 1, 2017, to Royalty Pharma for up to $2.85 billion, which consists of $2.2 billion in cash and up to $250.0 million and $400.0 million in milestone payments if the royalties on global net sales of Tysabri® that are received by Royalty Pharma meet specific thresholds in 2018 and 2020, respectively. As a result of this transaction, we derecognized the Tysabri® financial asset and recorded a $17.1 million gain (refer to Item 1. Note 6). |
| |
• | On April 6, 2017, we completed the sale of our India API business to Strides Shasun Limited for $22.2 million, inclusive of an estimated working capital adjustment. The sale did not have a material impact on our operations (refer to Item 1. Note 2). |
| |
• | On August 4, 2017, we signed a definitive agreement for the sale of our Israel API business to SK Capital for $110.0 million in cash, inclusive of a net debt adjustment. We expect to finalize the sale within the next three months. The sale is not expected to have a material impact on our operations (refer to Item 1. Note 9). |
| |
• | We completed $2.2 billion of debt repayments during the nine months ended September 30, 2017 (refer to Item 1. Note 10). |
| |
• | On August 25, 2017, we completed the sale of our Russian business to Alvogen Pharma LLC and Alvogen CEE Kft. for €12.7 million ($15.1 million), inclusive of an estimated working capital adjustment. The sale did not have a material impact on our operations (refer to Item 1. Note 2). |
•On February 27, 2024, we launched Project Energize - a global investment and efficiency program to drive the next evolution of capabilities and organizational agility.
•During the first quarter, we launched Opill®, the first-ever over-the-counter oral contraceptive in the U.S., at more than 65,000 retail stores nationwide.
•On April 25, 2024, we announced a binding offer to sell our HRA Pharma Rare Diseases business ("Rare Disease") to Esteve Healthcare, S.L. ("ESTEVE") for total consideration of up to €275 million, consisting of an upfront cash payment of €190 million and up to €85 million in potential earnout payments based on the Rare Diseases business achieving certain sales milestones.
•On May 7, 2024, we announced that Svend Andersen, Executive Vice President and President, CSCI, intends to retire from the Company in December of this year. Roberto Khoury, a strong leader with more than 20 years of experience cultivating successful branded consumer products and pan-European brands, will be appointed to lead the business.
Supply Chain Reinvention Program
In 2022, we initiated our Supply Chain Reinvention Program to reduce structural costs, improve profitability and our service levels to our retail partners, and strengthen our resiliency by streamlining and simplifying our global supply chain. Through this initiative, we are reducing portfolio complexity, investing in advanced planning capabilities, diversifying sourcing, and optimizing our manufacturing assets and distribution models. We have identified a total annual run-rate potential savings opportunity by the end of fiscal year 2028 of between an estimated $200 million to $300 million per year (not including related depreciation expense on capital investments) if all facets of the Program are successfully implemented and executed. To obtain these potential benefits, we anticipate incurring aggregate costs of between $350 million to $570 million by the end of fiscal year 2028 to complete the program implementation, including capital investments, restructuring expenses, and implementation costs. A significant portion of the annual run-rate potential savings of the Program, between $150 million to $200 million per year (not including related depreciation expense on capital investments), are anticipated by the end of fiscal year 2025, along with associated potential spend of between $300 million and $450 million. Refer to Item 1. Note 13 for further details on restructuring charges.
Project Energize
Perrigo has successfully transformed into a pure-play consumer self-care company and is now embarking on the next stage of its self-care journey - evolving to One Perrigo. This evolution will create sustainable, value accretive growth through a blended-branded business model that better positions the Company to win in self-care.
As part of the Company's sustainable, value accretive growth strategy, the Company launched Project Energize - a global investment and efficiency program to drive the next evolution of capabilities and organizational agility. This three-year program is expected to produce significant benefits in the Company’s long-term business performance by enabling our One Perrigo growth strategy, increasing organizational agility and mitigating impacts from stabilizing and strengthening the infant formula business.
Project Energize was initiated in the first quarter of 2024, subject to local law and consultation requirements, and is expected to deliver an annualized pre-tax savings in the range of $140 million to $170 million by 2026. The Company expects to reinvest approximately $40 million to $60 million of these savings to drive its blended-branded business model. Restructuring and related charges associated with these actions are estimated to be in the range of $140 million to $160 million, including $20 million to $40 million in investments to enhance capabilities, and are
Perrigo Company plc - Item 2
ConsolidatedExecutive Overview
expected to be substantially incurred by the end of 2026. Restructuring activities as part of Project Energize are expected to result in the net reduction of approximately 6% of total Perrigo roles. To date, Project Energize has achieved approximately $17 million in savings.
Market Factors and Trends
Economic Uncertainty
Current macroeconomic conditions remain very dynamic, including impacts from rising inflation and interest rates, volatile changes in foreign currency exchange rates, political unrest and legislative and regulatory changes. Any causes of market size contraction could reduce our sales or erode our operating margin and consequently reduce our net earnings and cash flows.
Our interest expense is impacted by the overall global economic and interest rate environment. We manage interest rate risk through our capital structure and the use of interest rate swaps to fix the interest rate on greater than 90% of our outstanding debt.
Inflationary Costs and Supply Chain
As the war in Ukraine continues, supply chain disruptions in specific categories such as oil, agricultural and paper based commodities continue to lead to inflationary pressures in those respective areas. Additionally, we experienced employment vacancies and attrition as the labor market negatively impacted productivity and drove the need for wage rate increases and other retention benefits. We implemented a series of actions to substantially mitigate these and other inflationary cost pressures such as strategic pricing and our Supply Chain Reinvention Program. Benefits from our actions have begun to substantially offset inflationary pressures, and the global freight constraints in availability of freight containers and truck drivers has normalized. However, future supply chain disruptions and inflationary pressures from the continuation of the war in Ukraine and the more recent events from the war in Israel are uncertain.
Infant Formula
As part of its efforts to prevent supply interruptions and risk of Cronobacter spp. illnesses associated with powdered infant formula, in March 2023, the FDA released an “Immediate National Strategy to Increase the Resiliency of the U.S. Infant Formula Market” and issued a letter to the powdered infant formula industry to share information to assist the industry in improving the microbiologic safety of powdered infant formula. In response to those changes, we made considerable investments in all our infant formula manufacturing sites, including enhanced cleaning and sanitation protocols, enhancements to our environmental monitoring programs and additional quality personnel. These changes resulted in higher costs and lower manufacturing output and production yields across our infant formula network.
As previously disclosed, the Company received a warning letter from the FDA on August 30, 2023 relating to the Perrigo Wisconsin infant formula facility, which was acquired from a third party in November 2022. While the Company worked to resolve the issues raised in the August 30 letter, on November 29, 2023, the Company received notice from the FDA of additional inspection observations relating to Perrigo Wisconsin. Consistent with the Company’s commitment to quality, the Company temporarily paused all production at that facility and conducted an extended site-wide assessment and cleaning.
The Company also bolstered its internal resources and brought in additional outside expertise to help revise, enhance and strengthen comprehensive standards and processes across our infant formula network, including in some instances, pausing production for comprehensive cleaning and infrastructure improvements. Currently, any planned large-scale manufacturing plant resets have been completed, and we are progressing the next phase of our quality enhancements.
This next phase of enhancements includes further protocol, process and procedural improvements at the site level, and we are making additional investments to upgrade infrastructure. We do not expect these continuing improvements to result in extended shutdowns beyond normal maintenance activities.
Perrigo Company plc - Item 2
Executive Overview
We have incurred and expect to incur certain extraordinary non-recurring costs associated with the evolving U.S. infant formula regulatory landscape, including consulting and legal fees relating to the Company’s responses to the FDA and the development and institution of new protocols across our infant formula manufacturing sites, as well as other costs relating to the extended cleaning and sanitization and the pausing and restarting of production. Cash costs in 2024 to achieve this remediation plan are estimated at $35 to $45 million. We also expect higher ongoing operating costs at our infant formula manufacturing sites moving forward as we continue to implement our enhanced program with additional internal capabilities. Due to these costs and the unabsorbed overhead and depressed sales volumes resulting from these actions, infant formula results in 2024 are expected to be below 2023 levels.
War in Ukraine
The invasion of Ukraine by Russia and resulting economic and political sanctions imposed by the United States, United Kingdom, European Union, and other countries on Russia, Belarus, and occupied regions in Ukraine have negatively impacted our results from operations in the region. We currently have 67 employees working in our Ukraine subsidiary. We do not have a subsidiary or employees in Russia. We have no manufacturing facilities in either Russia or Ukraine and we previously sold products into Russia entirely through distributors. In March 2022, we halted all sales to distributors in Russia and sales in Ukraine were severely depressed. Future impacts are difficult to predict due to the high level of uncertainty related to the war's duration, evolution and resolution. If the conflict spreads or materially escalates, or economic conditions deteriorate, the impact on our business and results of operations could be material.
Israel-Hamas War
We continue to closely monitor the ongoing Israel/Hamas conflict and the social, political and economic environment in Israel and in the surrounding region to evaluate the impacts on our operations and supply chain. Israel is a global technology research and development center that plays a critical role to the global API market, as a number of key suppliers are located within Israel. The Company sources some raw materials and finished goods from suppliers in Israel for certain self-care products, including Omeprazole. Despite this situation, to date, Perrigo has confirmed that our suppliers in the region have active operations and continue to manufacture materials for us, and we have not received any reports of restrictions on imports or exports in Israel. However, there is potential for some disruption as it relates to in-country logistics, including freight. As a precaution, Perrigo has engaged alternate suppliers to help minimize a potential supply disruption. If the conflict spreads or materially escalates, or if the conflict leads to further volatility and uncertainty in financial markets or economic conditions, the impact on our business and results of operations could be material.
Foreign Exchange
We have both translation and transaction exposure to the fluctuation of exchange rates. Translation exposures relate to exchange rate impacts of measuring income statements of foreign subsidiaries that do not use the U.S. dollar as their functional currency. Transaction exposures relate to 1) the impact from input costs that are denominated in a currency other than the local reporting currency and 2) the revaluation of transaction-related working capital balances denominated in currencies other than the functional currency. Significant exchange rate fluctuations, especially in the Euro or the British Pound Sterling, have had, and could continue to have, a significant impact on our net sales, net earnings and cash flows.
RESULTS OF OPERATIONS
CONSOLIDATED
Consolidated Results
|
| | | | | | | | | | | | | | | |
| | Three Months Ended | | Nine Months Ended |
| ($ in millions) | October 1,
2016 | | September 30,
2017 | | October 1,
2016 | | September 30,
2017 |
| Net sales | $ | 1,261.6 |
| | $ | 1,231.3 |
| | $ | 3,949.3 |
| | $ | 3,663.1 |
|
| Gross profit | $ | 484.5 |
| | $ | 497.8 |
| | $ | 1,564.1 |
| | $ | 1,466.7 |
|
| Gross profit % | 38.4 | % | | 40.4 | % | | 39.6 | % | | 40.0 | % |
| Operating expenses | $ | 1,952.8 |
| | $ | 335.4 |
| | $ | 3,079.2 |
| | $ | 1,027.1 |
|
| Operating expenses % | 154.8 | % | | 27.2 | % | | 78.0 | % | | 28.0 | % |
| Operating income (loss) | $ | (1,468.3 | ) | | $ | 162.4 |
| | $ | (1,515.1 | ) | | $ | 439.6 |
|
| Operating income (loss) % | (116.4 | )% | | 13.2 | % | | (38.4 | )% | | 12.0 | % |
| Change in financial assets | $ | 377.4 |
| | $ | 2.6 |
| | $ | 1,492.6 |
| | $ | 24.2 |
|
| Interest and other, net | $ | 55.6 |
| | $ | 31.1 |
| | $ | 195.6 |
| | $ | 132.0 |
|
| Loss on extinguishment of debt | $ | 0.7 |
| | $ | — |
| | $ | 1.1 |
| | $ | 135.2 |
|
| Income tax expense (benefit) | $ | (311.8 | ) | | $ | 84.2 |
| | $ | (550.7 | ) | | $ | 101.8 |
|
| Net income (loss) | $ | (1,590.2 | ) | | $ | 44.5 |
| | $ | (2,653.7 | ) | | $ | 46.4 |
|
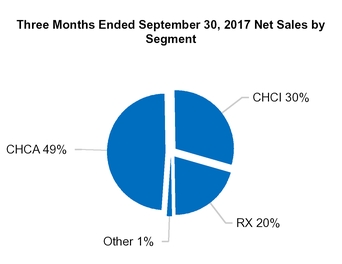
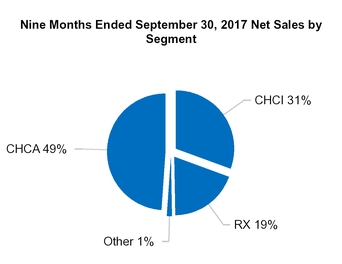
The $30.3 million decrease in consolidatedAny currency translation effects described below represent estimates of the net salesdifferences between translation of foreign currency transactions into U.S. dollars for the three months ended SeptemberMarch 30, 2017 as compared to2024 at the prior yearaverage exchange rates for the reporting period was due to discontinued products of $6.2 million, lower sales in the CHCA segment, due primarily to the absence of $21.0 million of sales related to the U.S. Vitamins, Minerals, and Supplements ("VMS") business, lower sales in the CHCI segment due primarily to the absence of $41.7 million of sales as a result of the cancellation of certain distribution contracts, and lower sales in the RX segment driven by lower net sales of Entocort® in the amount of $10.2 million and pricing pressures across the portfolio. These decreases were partially offset by new product sales of $55.4 million and favorable foreign currency translation of $13.0 million. Consolidated operating incomeaverage exchange rates for the three months ended September 30, 2017 increasedApril 1, 2023.
Perrigo Company plc - Item 2
Consolidated
CONSOLIDATED FINANCIAL RESULTS
| | | | | | | | | | | | |
| | Three Months Ended | |
| (in millions, except percentages) | March 30, 2024 | | April 1, 2023 | |
| Net sales | $ | 1,082.1 | | | $ | 1,181.7 | | |
| Gross profit | $ | 357.7 | | | $ | 413.8 | | |
| Gross profit % | 33.1 | % | | 35.0 | % | |
| | | | |
| | | | |
| Operating income | $ | (55.2) | | | $ | 48.5 | | |
| Operating income % | (5.1) | % | | 4.1 | % | |
Net sales decreased $99.6 million, or 8.4%, due primarily to:
•$81.4 million decrease, or 7.0%, due primarily to the absence of asset impairment charges in the amount of $1.6 billion taken in the prior year period (refer to Item 1. Note 3).
The $286.2 million decrease in consolidatedlower net sales forin U.S. Nutrition driven by actions to augment and strengthen the nine months ended September 30, 2017infant formula network and purposeful SKU prioritization actions to enhance margins as compared to the prior year period was due to discontinued products of $18.4 million, lower sales in the CHCA segment due primarily to the absence of $110.1 million of sales related to the U.S. VMS business, lower sales in the CHCI segment due primarily to the absence of $118.4 million of sales as a resultpart of the cancellation of certain distribution contracts,Company's Supply Chain Reinvention Program across most product categories. These factors were partially offset by strategic pricing actions and new products. The primary product category drivers are the previously discussed issues relating to infant formula in Nutrition, and lower sales in the RX segmentUpper Respiratory and Oral Care from lost distribution, partially offset by growth in Women's Health and Skincare; and
•$15.3 million decrease from exited product lines.
Operating income decreased $103.7 million, or 213.8%, due primarily to:
•$56.1 million decrease in gross profit driven by lower net salesmanufacturing productivity within U.S. Nutrition driven by actions to augment and strengthen the infant formula network, lower volume, and higher cost of Entocort®goods sold inflation primarily in the amount of $61.4 million and pricing pressures across the portfolio. These decreases wereCSCI, partially offset by strategic pricing actions, higher margin new product sales
Perrigo Company plc - Item 2
Consolidated
of $155.8 million. Consolidated operating income for the nine months ended September 30, 2017 increased due primarily to the absence of asset impairment charges in the amount of $2.0 billion taken in the prior year period (refer to Item 1. Note 3).
Restructuring
On February 21, 2017, we approved a workforce reduction plan as part of a larger cost optimization strategy across the Company. We expect to reduce our global workforce by approximately 750 employees, which includes some actions already taken and 235 employees who have elected to participate in a voluntary early retirement program. This represents a reduction of approximately 14% of our global non-production workforce. The changes to our workforce will vary by country, based on legal requirements and required consultations with works councils and other employee representatives, as appropriate.
In connection with this plan, we estimate that we will recognize total pre-tax restructuring charges of approximately $55.0 million to $65.0 million, consisting of one-time termination benefits, severance arrangements, and other termination costs. We expect to incur the majority of the remaining charges in 2017, with the balance to be recognized during the first quarter of the year ending December 31, 2018. During the three and nine months ended September 30, 2017, we recognized $3.8 million and $54.7 million, respectively, of restructuring expenses due primarily to this cost optimization strategy.
Our cost optimization strategy is expected to yield approximately $130.0 million in savings per annum by mid-2018. This is in addition to the savings that our supply chain organization continues to generate for both our North American and International segments.
CONSUMER HEALTHCARE AMERICAS
Recent Trends and Developments
We continue to experience a reduction in pricing expectations within our CHCA segment, primarily in the cough/cold, animal health, and analgesics categories due to various factors, including increased focus from customers to capture supply chain productivity savings and competition in specific product categories. We expect this pricing environment to continue to impact our CHCA segment for the foreseeable future.
| |
• | We completed the sale of the animal health pet treats plant fixed assets on February 1, 2017 and received $7.7 million in proceeds (refer to Item 1. Note 2). |
Perrigo Company plc - Item 2
CHCA
Segment Results
Three Month Comparison
|
| | | | | | | |
| | Three Months Ended |
| ($ in millions) | October 1,
2016 | | September 30,
2017 |
| Net sales | $ | 611.2 |
| | $ | 598.8 |
|
| Gross profit | $ | 199.2 |
| | $ | 206.1 |
|
| Gross profit % | 32.6 | % | | 34.4 | % |
| Operating income | $ | 99.0 |
| | $ | 124.3 |
|
| Operating income % | 16.2 | % | | 20.8 | % |
Three Months Ended September 30, 2017 vs. Three Months Ended October 1, 2016
Net sales decreased $12.4 million, or 2%, over the prior year period due to:
| |
• | New product sales of $13.2 million related primarily to the launches of Esomemprazole Magnesium (store brand equivalent to Nexium®); and
|
Favorable foreign currency translation movement of $1.4 million; more than offset by
| |
• | The absence of $21.0 million in sales attributable to the U.S. VMS business, which was sold in August 2016 (refer to Item 1. Note 2); |
A net decrease in sales of existing products of $3.2 million due primarily to:
Higher sales in the gastrointestinal and animal health categories and in our Mexico business;
Pricing pressures in the cough/cold, and analgesics categories; and
Lower volumes in the nicotine replacement category; and
Discontinued products of $2.7 million.
Operating income increased $25.3 million, or 26%, as a result of:
An increase of $6.9 million in gross profit due to:
Favorable product mix in certain categories; and
Positive contributions from supply chain efficiencies; offset partially by
| |
• | The absence of $3.4 million in gross profit as a result of the sale of the U.S. VMS business (refer to Item 1. Note 2); and |
Pricing pressures in certain categories as discussed above.
A decrease of $18.4 million in operating expenses due to:
| |
• | Decreased restructuring expense of $4.8 million related primarily to the cost reduction initiatives taken in the prior year (refer to Item 1. Note 15); |
Decreased selling and administrative expenses of $4.8 million due primarily to timing of promotions related to our animal health category and savings related toachieved through our previously announced strategic initiatives;
Decreased Research and Development ("R&D") expenses of $4.5 million due to timing of clinical trials; and
| |
• | The absence of a $3.4 million impairment charge related to held-for-sale assets associated with our animal health pet treats plant (refer to Item 1. Note 9); offset partially by |
| |
• | A $2.0 million gain related to contingent consideration (refer to Item 1. Note 6). |
restructuring programs. Gross profit as a percentage of net sales was 1.8% higherdecreased 190 basis points compared to the prior year due to the same factors that drove gross profit partially offset by benefits from purposeful SKU prioritization actions in CSCA.
•$47.6 million increase in operating expenses due primarily to favorable product mixincreased expenses associated with an additional provision for securities litigation contingencies and supply chain efficiencies as discussed above.increased restructuring expenses; which were partially offset by decreased selling expenses and savings from Project Energize.
Perrigo Company plc - Item 2
CHCA
CONSUMER SELF-CARE AMERICAS FINANCIAL RESULTS
Operating income as a percentage of net sales was 4.6% higher due primarily to favorable product mix as discussed above and decreased operating expenses.
| | | | | | | | | | | | | | | |
| | Three Months Ended | | | | |
| (in millions, except percentages) | March 30, 2024 | | April 1, 2023 | | |
| Net sales | $ | 644.1 | | | $ | 763.7 | | | | | |
| Gross profit | $ | 153.5 | | | $ | 210.8 | | | | | |
| Gross profit % | 23.8 | % | | 27.6 | % | | | | |
| Operating income | $ | 15.7 | | | $ | 83.2 | | | | | |
| Operating income % | 2.4 | % | | 10.9 | % | | | | |
Nine Month Comparison
|
| | | | | | | |
| | Nine Months Ended |
| ($ in millions) | October 1,
2016 | | September 30,
2017 |
| Net sales | $ | 1,880.2 |
| | $ | 1,786.4 |
|
| Gross profit | $ | 615.1 |
| | $ | 598.3 |
|
| Gross profit % | 32.7 | % | | 33.5 | % |
| Operating income | $ | 316.4 |
| | $ | 303.6 |
|
| Operating income % | 16.8 | % | | 17.0 | % |
Nine Months Ended September 30, 2017 vs. Nine Months Ended October 1, 2016
Net sales decreased $93.8$119.6 million, or 5%15.7%, overdue primarily to:
•$110.2 million decrease, or 14.6%, due primarily to lower net sales in U.S. Nutrition driven by actions to augment and strengthen the infant formula network, purposeful SKU prioritization actions to enhance margins as part of the Company's Supply Chain Reinvention program across most product categories, reduced inventories at retail customers resulting in lower net sales of store brand offerings and lower distribution in Oral Care. These factors were partially offset by growth in e-commerce and new products, including the launch of Opill® in the U.S.; and
•$9.4 million decrease from exited product lines.
Perrigo Company plc - Item 2
CSCA
CSCA net sales by product category were as follows:
| | | | | | | | | | | | | | | | | | | | | | | |
| Sales | Three Months Ended | | | | |
(in millions, except percentages)(1) | March 30, 2024 | | April 1, 2023 | | $ Change | | % Change |
| Upper Respiratory | $ | 130.3 | | | $ | 153.7 | | | $ | (23.4) | | | (15.2) | % |
| Digestive Health | 122.2 | | | 124.0 | | | (1.8) | | | (1.5) | % |
| Nutrition | 90.6 | | | 138.5 | | | (47.9) | | | (34.6) | % |
| Pain and Sleep-Aids | 82.6 | | | 103.4 | | | (20.8) | | | (20.1) | % |
| Healthy Lifestyle | 71.3 | | | 73.4 | | | (2.1) | | | (2.9) | % |
| Oral Care | 64.7 | | | 83.3 | | | (18.6) | | | (22.3) | % |
| Skin Care | 49.6 | | | 69.8 | | | (20.2) | | | (28.9) | % |
| Women's Health | 27.2 | | | 12.3 | | | 14.9 | | | 121.1 | % |
| Vitamins, Minerals, and Supplements ("VMS") | 4.2 | | | 4.5 | | | (0.3) | | | (6.7) | % |
| Other CSCA | 1.4 | | | 0.8 | | | 0.6 | | | 75.0 | % |
| Total CSCA | $ | 644.1 | | | $ | 763.7 | | | $ | (119.6) | | | (15.7)% |
(1) We updated our global reporting product categories as a result of legacy Rx sales being moved out of Other CSCA and into respective categories. These product categories have been adjusted retroactively to reflect the changes and have no impact on historical financial position, results of operations, or cash flows.
Sales in each category were driven primarily by:
•Upper Respiratory: Net sales of $130.3 million decreased 15.2% due primarily to inventory de-stocking at U.S. retail customers, resulting in lower net sales of cough cold and allergy products, in addition to strong net sales in the prior year period due to:quarter. The category was also impacted by a 2.7 percentage points reduction from exited product lines and portfolio optimization actions;
| |
• | New product sales of $51.2 million related primarily to the launches of fluticasone nasal spray (store brand equivalent to Flonase®), smoking cessation products and Esomemprazole Magnesium (store brand equivalent to Nexium®); more than offset by
|
| |
• | The absence of $110.1 million in sales attributable to the U.S. VMS business (refer to Item 1. Note 2); |
A net decrease in•Digestive Health: Net sales of existing$122.2 million decreased 1.5% as higher volumes of laxative products, including Polyethylene Glycol, were more than offset by a 5.3 percentage points reduction from portfolio optimization actions;
•Nutrition: Net sales of $22.6$90.6 million decreased 34.6% due to:primarily to lower shipments to customers as the company works through its infant formula plant remediation plans, in addition to a 1.8 percentage points decline from exited product lines in the category;
Higher•Pain and Sleep-aids: Net sales of $82.6 million decreased 20.1% due primarily to purposeful SKU prioritization actions and exited product lines which had an aggregate negative impact of 13.0 percentage points. In addition, inventory reductions by U.S. retail customers resulted in lower net sales of pain and sleep-aid products. These impacts more than offset new products, including store brand Acetaminophen 250mg and Ibuprofen 125mg Tablets;
•Healthy Lifestyle: Net sales of $71.3 million decreased 2.9% due primarily to inventory de-stocking at U.S. retail customers, resulting in lower net sales of smoking cessation products, and lower category consumption compared to the prior year.;
•Oral Care: Net sales of $64.7 million decreased 22.3% due primarily to lower distribution at specific retail customers and the comparison to strong sales in the cough/cold categoryprior year quarter as customers normalized inventories;
•Skin Care: Net sales of $49.6 million decreased 28.9% due primarily to portfolio optimization actions and Mexico business;exited product lines, which had an aggregate negative impact of 30.9 percentage points. These headwinds more than offset bystrong, double digit, growth of Mederma®;
Lower•Women's Health: Net sales in our infant nutritionof $27.2 million increased 121.1% due primarily to the launch of Opill®, which was partially offset by an 11.7 percentage point reduction from exited product lines and animal health categories;portfolio optimization actions; and
Pricing pressures•VMS and Other: Net sales of $5.6 million increased 5.7% due primarily to volume growth in the cough/cold, analgesics, and gastrointestinal categories; andVMS category.
Lower volumes in the nicotine replacement category;
Perrigo Company plc - Item 2
Discontinued products of $11.1 million; andCSCA
Unfavorable foreign currency translation movement of $1.1 million.
Operating income decreased $12.8$67.5 million, or 4%81.1%, as a result of:
A decrease of $16.8 million in gross profit due to:
Favorable product mix in certain categories; and
Positive contributions from supply chain efficiencies; more than offset by
| |
• | The absence of $17.6 million in gross profit as a result of the sale of the U.S. VMS business (refer to Item 1. Note 2); and |
Pricing pressures in certain categories as discussed above.
A decrease of $4.0 million in operating expenses due to:
Decreased selling and administrative expenses of $10.8 million due primarily to timing of promotions related to our animal health category and savings related to our cost reduction initiatives taken in the prior year;
| |
• | The absence of a $9.6 million impairment charge related to the U.S. VMS business (refer to Item 1. Note 2) and held-for-sale assets associated with our animal health pet treats plant (refer to Item 1. Note 9); and |
Decreased R&D expenses of $7.6 million due to timing of clinical trials, reduced spending on infant formula clinical trials and lower costs related to our cost reduction initiatives; offset partially by
| |
• | A $2.9 million gain related to contingent consideration (refer to Item 1. Note 6); |
| |
• | Increased restructuring expenses of $21.5 million related primarily to strategic organizational enhancements (refer to Item 1. Note 15); and |
A $4.1 million impairment charge recorded on idle property, plant and equipment.
Perrigo Company plc - Item 2
CHCI
CONSUMER HEALTHCARE INTERNATIONAL
Recent Trends and Developments
As part of our strategic initiatives, management continues to drive improvements and evaluate the overall cost structures within our CHCI segment in the following ways:
On December 8, 2016, we announced the cancellation of the unprofitable EuroGenerics NV distribution agreement in Belgium. The cancellation, combined with the exit of certain OTC distribution agreements, is expected to reduce net sales by approximately $210.0 million in 2017.
We continue to make progress on our previously announced restructuring plans to right-size the Omega business due to the impact of market dynamics on sales volumes. Management continues to evaluate the overall cost structure relative to current and expected market dynamics. During the three and nine months ended September 30, 2017, we recognized $3.6 million and $13.2 million of restructuring expense in the CHCI segment, respectively.
Management continues to evaluate the most effective business model for each country, aligning our sales infrastructure and actively integrating sales strategies with promotional programs.
| |
• | On August 25, 2017, we completed the sale of our Russian business, which was previously classified as held-for-sale, to Alvogen Pharma LLC and Alvogen CEE Kft. The total sale price was €12.7 million ($15.1 million), inclusive of an estimated working capital adjustment, which resulted in an immaterial gain in the segment (refer to Item 1. Note 2). |
The combination of these actions is expected to improve the segment's focus on higher value OTC products, reduce selling costs and improve operating margins in the segment.
Segment Results
Three Month Comparison
|
| | | | | | | |
| | Three Months Ended |
| ($ in millions) | October 1,
2016 | | September 30,
2017 |
| Net sales | $ | 377.4 |
| | $ | 365.4 |
|
| Gross profit | $ | 155.2 |
| | $ | 165.9 |
|
| Gross profit % | 41.1 | % | | 45.4 | % |
| Operating income (loss) | $ | (1,615.5 | ) | | $ | 4.6 |
|
| Operating income (loss) % | (428.1 | )% | | 1.2 | % |
Three Months Ended September 30, 2017 vs. Three Months Ended October 1, 2016
Net sales decreased $12.0 million, or 3%, over the prior year period due primarily to:
Favorable foreign currency translation movement of $11.6 million;
New product sales of $11.4 million; and
A net increase in sales of existing products of $8.9•$57.3 million due to increased sales primarily in the cough/cold, allergy, analgesics, and lifestyle categories; more than offset by
Perrigo Company plc - Item 2
CHCI
The absence of $41.7 million in sales attributable to the cancellation of unprofitable distribution contracts; and
Discontinued products of $3.2 million.
Operating income increased $1.6 billion, as a result of:
An increase of $10.7 milliondecrease in gross profit due primarily to:
Favorable foreign currency translation movement;
Improved product mix for sales of existing products;to lower manufacturing productivity in U.S. Nutrition driven by actions to augment and
Operational efficiencies across strengthen the organization.
A decrease of $1.6 billion in operating expenses due primarily to:
The absence of $1.6 billion of impairment charges on certain indefinite-lived and definite-lived intangible brand category assets and goodwill impairments in the Branded Consumer Healthcare - Rest of World ("BCH-ROW") and Branded Consumer Healthcare - Belgium ("BCH-Belgium")
reporting units recorded in the prior year period (refer to Item 1. Note 3); andA decrease of $4.6 million in selling and administrative expenses due to previously announced strategic initiatives to better align promotional investments with sales and cost reduction initiatives taken in the current year;infant formula network; partially offset partially by
| |
• | Increased restructuring charges totaling $1.2 million related to strategic organizational enhancements (refer to Item 1. Note 15). |
Supply Chain Reinvention savings. Gross profit as a percentage of net sales was 4.3% higherdecreased 380 basis points compared to the prior year due to the same factors that impacted gross profit, partially offset by benefits from purposeful SKU prioritization actions and high margin new products, including Opill®.
•$10.3 million increase in operating expenses due primarily to improvedhigher restructuring expenses; which were partially offset by decreased selling expenses and savings from Project Energize.
CONSUMER SELF-CARE INTERNATIONAL FINANCIAL RESULTS
| | | | | | | | | | | |
| | Three Months Ended |
| (in millions, except percentages) | March 30, 2024 | | April 1, 2023 |
| Net sales | $ | 437.9 | | | $ | 418.1 | |
| Gross profit | $ | 204.2 | | | $ | 203.0 | |
| Gross profit % | 46.6 | % | | 48.6 | % |
| Operating income | $ | 26.5 | | | $ | 21.3 | |
| Operating income % | 6.1 | % | | 5.1 | % |
Net sales increased $19.8 million, or 4.7%, due primarily to:
•$28.7 million increase, or 7.0%, due primarily to strategic pricing actions in addition to new products, and a favorable impact from the absence of distributor transition sales returns recognized in the prior year period. Product category growth was driven primarily by increased sales in Skin Care and Women's Health; partially offset by
•$5.9 million decrease from exited product mixlines and lower net sales in Upper Respiratory and VMS due primarily to supply constraints.
CSCI net sales by product category were as follows:
| | | | | | | | | | | | | | | | | | | | | | | |
| Sales | Three Months Ended | | | | |
| (in millions, except percentages) | March 30, 2024 | | April 1, 2023 | | $ Change | | % Change |
| Skin Care | $ | 114.7 | | | $ | 83.4 | | | $ | 31.3 | | | 37.5 | % |
| Upper Respiratory | 69.1 | | | 84.8 | | | (15.7) | | | (18.5) | % |
| Healthy Lifestyle | 64.6 | | | 66.4 | | | (1.8) | | | (2.7) | % |
| Pain and Sleep-Aids | 51.4 | | | 49.9 | | | 1.5 | | | 3.0 | % |
| VMS | 44.6 | | | 47.8 | | | (3.2) | | | (6.7) | % |
| Women's Health | 32.0 | | | 29.1 | | | 2.9 | | | 10.0 | % |
| Oral Care | 28.7 | | | 29.1 | | | (0.4) | | | (1.4) | % |
| Digestive Health | 9.5 | | | 8.8 | | | 0.7 | | | 8.0 | % |
| Other CSCI | 23.3 | | | 18.8 | | | 4.5 | | | 23.9 | % |
| Total CSCI | $ | 437.9 | | | $ | 418.1 | | | $ | 19.8 | | | 4.7 | % |
Sales in each category were driven primarily by:
•Skin Care: Net sales of $114.7 million increased 37.5%, inclusive of a 3.4% unfavorable effect of currency translation, due to strong growth in Compeed driven by the cancellationnew product launch of certain unprofitableCompeed Spots, and the absence of prior year distribution contracts, as described above.transitions sales returns. Category growth was also driven by performance of ACO® and Sebamed®, partially offset by a 2.2 percentage point reduction from exited product lines;
| |
• | Operating income as a percentage of net sales was 429.3% higher due primarily to the absence of $1.6 billion of intangible asset and goodwill impairment charges as discussed above (refer to Item 1. Note 3). |
Nine Month Comparison
•Upper Respiratory: Net sales of $69.1 million decreased 18.5%, inclusive of a 1.7% favorable effect of currency translation, due primarily to lower net sales of cough cold products stemming from lower incidence
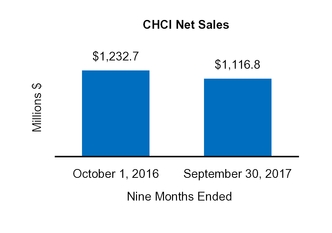
Perrigo Company plc - Item 2
CSCI
|
| | | | | | | |
| | Nine Months Ended |
| ($ in millions) | October 1,
2016 | | September 30,
2017 |
| Net sales | $ | 1,232.7 |
| | $ | 1,116.8 |
|
| Gross profit | $ | 542.1 |
| | $ | 509.4 |
|
| Gross profit % | 44.0% | | 45.6 | % |
| Operating income (loss) | $ | (2,011.3 | ) | | $ | 8.7 |
|
| Operating income (loss) % | (163.2 | )% | | 0.8 | % |
Nine Months EndedSeptember 30, 2017 vs. Nine Months EndedOctober 1, 2016
Net sales decreased $115.9 million, or 9%, overof cough cold throughout the E.U. compared to the prior year periodand supply constraints on several products in the category. The category was also impacted by a 2.4 percentage points reduction from exited product lines;
•Healthy Lifestyle: Net sales of $64.6 million decreased 2.7%, inclusive of a 7.4% unfavorable effect of currency translation, due primarily to:to the seasonal sell in of anti-parasite products including, Jungle Formula and Paranix, partially offset by lower category consumption in weight loss, impacting XLS Medical. The category was impacted by a 1.3 percentage points reduction from exited product lines;
New product•Pain & Sleep-Aids: Net sales of $50.4 million; more than offset$51.4 million increased 3.0%, inclusive of a 3.8% favorable effect of currency translation, due primarily to lower net sales of store brand products;
•VMS: Net sales of $44.6 million decreased 6.7%, inclusive of a 1.0% favorable effect of currency translation, due primarily to timing of sales of Granufink and Abte, in addition to promotional phasing of Davitamon;
•Women's Health: Net sales of $32.0 million increased 10.0%, inclusive of a 0.3% favorable effect of currency translation, due primarily to higher net sales of contraceptive products including EllaOne, driven by
The the absence of $118.4prior year distribution transitions sales returns;
•Oral Care: Net sales of $28.7 million in sales attributable to the cancellationdecreased 1.4%, inclusive of unprofitable distribution contracts;
Unfavorable foreigna 2.0% favorable effect of currency translation, movement of $25.2 million;
A decrease indue primarily to lower net sales of existing productsstore brand offerings;
•Digestive Health and Other: Net sales of $17.4$32.8 million increased 18.8%, inclusive of a 1.0% favorable effect of currency translation, due primarily in the anti-parasites and vitamins categories; and
Discontinued productsto higher net sales of $5.0 million.
Perrigo Company plc - Item 2
CHCI
store brand digestive health products.
Operating income increased $2.0 billion$5.2 million, or 24.4%, due primarily to:
A decrease of $32.7•$1.2 million increase in gross profit due primarily to:
Improved product mix for sales of existing products;to strategic pricing actions, higher margin new products, and
Operational efficiencies across the organization; more than Supply Chain Reinvention savings,partially offset by
Lower margins in our U.K. store brand business; lower volume/mix and
Unfavorable foreign currency translation movement.
A decrease higher cost of $2.1 billion in operating expenses due primarily to:
The absence of $2.0 billion of impairment charges on certain indefinite-lived and definite-lived intangible brand category assets and goodwill impairments in the BCH-ROW and BCH-Belgium
reporting units recorded in the prior year period (refer to Item 1. Note 3); andA decrease in selling and administrative expenses of $48.5 million due to previously announced strategic initiatives to better align promotional investments with sales and cost reduction initiatives taken in the current year; offset partially by
| |
• | A $4.8 million impairment charge recorded related to the Russian business (refer to Item 1. Note 2) and In-Process Research and Development ("IPR&D"); and |
| |
• | Increased restructuring expense of $2.8 million related to strategic organizational enhancements (refer to Item 1. Note 15). |
goods sold inflation. Gross profit as a percentage of net sales was 1.6%decreased 200 basis points compared to the prior year due to the same factors impacting gross profit being more than offset by higher due primarily to improvedcost of goods sold inflation and unfavorable product mix primarily driven in part by the cancellation of certain unprofitable distribution contracts, as described above.supply constraints; and
| |
• | Operating income as a percentage of net sales was 164.0% higher due primarily to the absence of $2.0 billion of intangible asset and goodwill impairment charges as discussed above (refer to Item 1. Note 3). |
PRESCRIPTION PHARMACEUTICALS
Recent Trends and Developments
We continue to experience a significant reduction in pricing expectations from historical levels in our RX segment due to industry and competitive pressures. This softness in pricing is attributable to various factors, including increased focus from customers to capture supply chain productivity savings, low raw material commodity pricing, competition in specific products, and consolidation of certain customers. We expect this softness to continue to impact the segment for the foreseeable future, and we are forecasting a high single digit pricing decline in this segment for the year ending December 31, 2017.
On November 10, 2016, we announced that as part of our portfolio review process we are conducting a comprehensive internal evaluation of the RX segment's market position, growth opportunities, and interdependencies with our manufacturing and shared service operations to determine if strategic alternatives should be explored.
| |
• | During the three months ended December 31, 2016, the U.S. market for Entocort® (Budesonide) capsules, including both brand and authorized generic capsules, experienced significant and unexpected increased competition, which reduced our future revenue stream. We expect our net sales in the RX segment for the year ending December 31, 2017 will be negatively impacted by approximately $67.0 million.
|
During the nine months ended September 30, 2017, we sold various Abbreviated New Drug Applications ("ANDAs") for a total gain of $23.0 million.
Perrigo Company plc - Item 2
RX
Segment Results
Three Month Comparison
|
| | | | | | | |
| | Three Months Ended |
| ($ in millions) | October 1,
2016 | | September 30,
2017 |
| Net sales | $ | 251.9 |
| | $ | 250.6 |
|
| Gross profit | $ | 120.9 |
| | $ | 116.7 |
|
| Gross profit % | 48.0 | % | | 46.6 | % |
| Operating income | $ | 74.4 |
| | $ | 82.1 |
|
| Operating income % | 29.5 | % | | 32.8 | % |
Three Months Ended September 30, 2017 vs. Three Months Ended October 1, 2016
Net sales decreased $1.3•$4.1 million or 1%, due to:
| |
• | New product sales of $30.8 million due primarily to the sale of Scopolamine and Testosterone 2% topical (store brand equivalent to Axiron®); more than offset by
|
Decreased sales of existing products of $21.5 million due primarily to pricing pressure across the portfolio; and
| |
• | Lower Entocort® sales of $10.2 million.
|
Segment operating income increased $7.7 million, or 10%, as a result of:
A decrease of $4.2 million in gross profit due primarily to:
| |
• | Lower Entocort® sales as discussed above; and
|
Pricing pressure as discussed above.
A decrease of $11.9 million in operating expenses due primarily to:
Decreased selling and administrative expenses of $8.4 million due primarily to the prior year specialty pharmaceuticals sales force restructuring initiative; and
Decreased R&D expenses of $7.3 million due to timing of clinical trials, lower legal spend, and lower ongoing costs on certain projects; offset partially by
A $4.0 million impairment charge on certain fixed assets in the current period.
| |
• | Gross profit as a percentage of net sales was 1.4% lower due primarily to lower sales of Entocort® and pricing pressures.
|
| |
• | Operating income as a percentage of net sales was 3.3% higher due primarily to decreased costs related to R&D spend and restructuring initiatives taken in the prior year; offset partially by lower sales of Entocort®.
|
Perrigo Company plc - Item 2
RX
Nine Month Comparison
|
| | | | | | | |
| | Nine Months Ended |
| ($ in millions) | October 1,
2016 | | September 30,
2017 |
| Net sales | $ | 776.9 |
| | $ | 708.4 |
|
| Gross profit | $ | 380.2 |
| | $ | 332.1 |
|
| Gross profit % | 48.9 | % | | 46.9 | % |
| Operating income | $ | 258.3 |
| | $ | 239.6 |
|
| Operating income % | 33.3 | % | | 33.8 | % |
Nine Months Ended September 30, 2017 vs. Nine Months Ended October 1, 2016
Net sales decreased $68.5 million, or 9%, due to:
| |
• | New product sales of $53.2 million due primarily to sales of Scopolamine and Testosterone 2% topical (store brand equivalent to Axiron®); more than offset by
|
| |
• | Lower Entocort® sales of $61.4 million;
|
Decreased sales of existing products of $58.0 million due to decreased sales volume of certain products and pricing pressure across the portfolio; and
Discontinued products of $2.3 million.
Operating income decreased $18.7 million, or 7%, as a result of:
A decrease of $48.1 million in gross profit due primarily to:
| |
• | Lower Entocort® sales as noted above; and
|
Pricing pressure as discussed above.
A decrease of $29.4 million in operating expenses due to:
A $23.0 million gain on sales of certain ANDAs;
| |
• | A $17.0 million gain related to contingent consideration (refer to Item 1. Note 6); |
Decreased selling and administrative expenses of $18.3 million due primarily to the prior year specialty pharmaceuticals sales force restructuring initiative; and
Decreased R&D expenses of $14.1 million due to timing of clinical trials, lower legal spend, and lower ongoing costs on certain projects; offset partially by
| |
• | Impairment charges related to certain definite-lived intangible assets, certain fixed assets and IPR&D of $34.8 million (refer to Item 1. Note 3); and |
| |
• | Increased restructuring expenses of $5.9 million related to strategic organizational enhancements (refer to Item 1. Note 15). |
| |
• | Gross profit as a percentage of net sales was 2.0% lower due primarily to lower sales of Entocort® as discussed above.
|
Perrigo Company plc - Item 2
Other
OTHER
Recent Trends and Developments
On April 6, 2017, we completed the sale of our India API business to Strides Shasun Limited. We received $22.2 million of proceeds, inclusive of an estimated working capital adjustment, which resulted in an immaterial gain. Prior to closing the sale, we determined that the carrying value of the India API business exceeded its fair value less the cost to sell, resulting in an impairment charge of $35.3 million, which was recorded in Impairment charges on the Consolidated Statements of Operations for the year ended December 31, 2016 (refer to Item 1. Note 2).
On August 4, 2017, we signed a definitive agreement for the sale of our Israel API business to SK Capital for $110.0 million in cash, inclusive of a net debt adjustment. We expect to finalize the sale within the next three months, and the sale is not expected to have a material impact on our operations (refer to Item 1. Note 9).
Segment Results
Three Month Comparison
|
| | | | | | | |
| | Three Months Ended |
| ($ in millions) | October 1,
2016 | | September 30,
2017 |
| Net sales | $ | 21.1 |
| | $ | 16.5 |
|
| Gross profit | $ | 9.4 |
| | $ | 9.1 |
|
| Gross profit % | 44.5 | % | | 55.5 | % |
| Operating income (loss) | $ | (1.5 | ) | | $ | (0.4 | ) |
| Operating income (loss)% | (7.4 | )% | | (2.4 | )% |
Three Months Ended September 30, 2017 vs. Three Months Ended October 1, 2016
Net sales decreased $4.6 million due primarily to increased competition on certain products. Operating loss decreased $1.1 million due primarily to a $1.4 million decrease in operating expenses. The decrease in operating expenses related to the absence of a $6.5 million impairment charge recorded on the India API business in the prior year; offset partially by a $3.3 million impairment charge recorded on the Israel API business in the current period (refer to Item 1. Note 9).
Perrigo Company plc - Item 2
Other
Nine Month Comparison
|
| | | | | | | |
| | Nine Months Ended |
| ($ in millions) | October 1,
2016 | | September 30,
2017 |
| Net sales | $ | 59.5 |
| | $ | 51.5 |
|
| Gross profit | $ | 26.8 |
| | $ | 27.8 |
|
| Gross profit % | 45.0 | % | | 54.1 | % |
| Operating income | $ | 2.6 |
| | $ | 9.4 |
|
| Operating income % | 4.4 | % | | 18.2 | % |
Nine Months Ended September 30, 2017 vs. Nine Months Ended October 1, 2016
Net sales decreased $8.0 million due primarily to competition on certain products. Operating income increased $6.8 million due to a $1.0 million increase in gross profit driven by favorable product mixProject Energize cost savings and a $5.8 million decrease in operatingHRA synergies, partially offset by increased restructuring expenses. The decrease in operating expenses related primarily to the absence of a $10.8 million impairment charge recorded on the India API business in the prior year; offset partially by a $3.3 million impairment charge recorded on the Israel API business in the current period (refer to Item 1. Note 9).
Unallocated Expenses
Unallocated expenses are comprised of certain corporate services not allocated to our reporting segments and are recorded abovein Operating income on the Condensed Consolidated Statements of Operations. Unallocated expenses were as follows (in millions):
| | | | | | | | | | | | |
| Three Months Ended | | |
| March 30, 2024 | | April 1, 2023 | | | | |
| $ | 97.4 | | | $ | 56.0 | | | | | |
|
| | | | | | | | | | | | | | |
| Three Months Ended | | Nine Months Ended |
October 1,
2016 | | September 30,
2017 | | October 1,
2016 | | September 30,
2017 |
| $ | 27.7 |
| | $ | 48.2 |
| | $ | 79.1 |
| | $ | 120.8 |
|
Effective January 1, 2017, due to the sale of the Tysabri® financial asset, all legal expenses associated with the former Specialty Sciences segment were moved to unallocated expenses.
The increase of $20.5$41.4 million in unallocated expenses during the three months ended SeptemberMarch 30, 20172024, compared to the prior year period was due primarily to an increase in share-based compensationexpenses associated with our securities litigation settlement and restructuring expenses associated primarily with Project Energize.
Interest expense, of $4.7net, and Other (income) expense, net
| | | | | | | | | | | | | | | |
| Three Months Ended | | |
| (in millions) | March 30, 2024 | | April 1, 2023 | | | | |
| Interest expense, net | $ | 43.0 | | | $ | 43.7 | | | | | |
| Other (income) expense, net | $ | 0.4 | | | $ | 0.5 | | | | | |
| | | | | | | |
The $0.7 million driven primarily by the resignation of certain executives, which had a favorable impact on the prior year period, and an increase of $15.6 million of administrative expenses driven by consulting fees and employee-related expenses.
The increase of $41.7 milliondecrease in unallocated expensesInterest Expense, net during the ninethree months ended SeptemberMarch 30, 20172024 compared to the prior year period was due primarily to an increase of $26.9 million of administrative expenses drivenin interest income partially offset by consulting fees and employee-related expenses, $8.8 million in share-based compensation driven primarily by the resignation of certain executives, which had a favorable impactincreasing interest rates on the prior year period, and $5.9 million of restructuring expenses related to ourcost reduction initiatives.debt (see Item 1. Note 10 for further detail).
Perrigo Company plc - Item 2
Unallocated, Interest, Other, and Taxes
Interest, Other and Change in financial assets (Consolidated)
|
| | | | | | | | | | | | | | | |
| | Three Months Ended | | Nine Months Ended |
| ($ in millions) | October 1,
2016 | | September 30,
2017 | | October 1,
2016 | | September 30,
2017 |
| Change in financial assets | $ | 377.4 |
| | $ | 2.6 |
| | $ | 1,492.6 |
| | $ | 24.2 |
|
| Interest expense, net | $ | 54.6 |
| | $ | 34.7 |
| | $ | 163.2 |
| | $ | 133.1 |
|
| Other (income) expense, net | $ | 1.0 |
| | $ | (3.6 | ) | | $ | 32.4 |
| | $ | (1.1 | ) |
| Loss on extinguishment of debt | $ | 0.7 |
| | $ | — |
| | $ | 1.1 |
| | $ | 135.2 |
|
Change in Financial Assets
On December 18, 2013, we acquired Elan, which had a royalty agreement with Biogen Idec Inc. ("Biogen"), whereby Biogen conveyed the right to receive royalties that are typically payable on sales revenue generated by the sale, distribution or other use of the drug Tysabri®. Pursuant to the royalty agreement, we were entitled to royalty payments from Biogen based on its Tysabri® sales in all indications and geographies. We received royalties of 12% on worldwide Biogen sales of Tysabri® from December 18, 2013 through April 30, 2014. From May 1, 2014, we received royalties of 18% on annual worldwide Biogen sales of Tysabri® up to $2.0 billion and 25% on annual sales above $2.0 billion.
We accounted for the Tysabri® royalty stream as a financial asset and elected to use the fair value option model. We made the election to account for the Tysabri® financial asset using the fair value option as we believed this method was most appropriate for an asset that did not have a par value, a stated interest stream, or a termination date. The financial asset acquired represented a single unit of accounting. The fair value of the financial asset acquired was determined by using a discounted cash flow analysis related to the expected probability weighted future cash flows to be generated by the royalty stream. The financial asset was classified as a Level 3 asset within the fair value hierarchy, as our valuation utilized significant unobservable inputs, including industry analyst estimates for global Tysabri® sales, probability weighted as to the timing and amount of future cash flows along with certain discount rate assumptions. Cash flow forecasts included the estimated effect and timing of future competition, considering patents in effect for Tysabri® through 2024 and contractual rights to receive cash flows into perpetuity. The discounted cash flows were based upon the expected royalty stream forecasted into perpetuity using a 20-year discrete period with a declining rate terminal value.
In the first quarter of 2016, a competitor's pipeline product, Ocrevus®, received breakthrough therapy designation from the U.S. Food and Drug Administration ("FDA"). Breakthrough therapy designation is granted when a drug is intended alone or in combination with one or more other drugs to treat a serious or life threatening disease or condition and preliminary clinical evidence indicates that the drug may demonstrate substantial improvement over existing therapies on one or more clinically significant endpoints, such as substantial treatment effects observed early in clinical development. In June 2016, the FDA granted priority review with a target action date in December 2016. A priority review is a designation when the FDA will direct overall attention and resources to the evaluation of applications for drugs that, if approved, would be significant improvements in the safety or effectiveness of the treatment, diagnosis, or prevention of serious conditions when compared to standard applications. The product was approved late in the first quarter of 2017. The product is expected to compete with Tysabri®, and we expected it to have a significant negative impact on the Tysabri® royalty stream. Industry analysts believe that, based on released clinical study information, Ocrevus® will compete favorably against Tysabri® in the relapsing, remitting multiple sclerosis market segment due to its high efficacy and convenient dosage form.
Given the new market information for Ocrevus®, we used industry analyst estimates to reduce our first ten year growth forecasts from an average of growth of approximately 3.4% in the fourth calendar quarter of 2015 to an average decline of approximately minus 2.0% in the third and fourth calendar quarters of 2016. In November 2016, we announced we were evaluating strategic alternatives for the Tysabri® asset. As of December 31, 2016, the financial asset was adjusted based on the strategic review and sale process. These effects, combined with the change in discount rate each quarter, led to a reduction in fair value of $204.4 million, $910.8 million, $377.4 million and $1.1 billion in the first, second, third and fourth quarters of 2016, respectively.
On March 27, 2017, we announced the completed divestment of our Tysabri® financial asset to Royalty Pharma for up to $2.85 billion, which consists of $2.2 billion in cash and up to $250.0 million and $400.0 million in
Perrigo Company plc - Item 2
Unallocated, Interest, Other, and Taxes
milestone payments if the royalties on global net sales of Tysabri® that are received by Royalty Pharma meet specific thresholds in 2018 and 2020, respectively. As a result of this transaction, we transferred the entire financial asset to Royalty Pharma and recorded a $17.1 million gain during the three months ended July 1, 2017. We elected to account for the contingent milestone payments using the fair value option method, and these were recorded at an estimated fair value of $143.2 million as of September 30, 2017. We chose the fair value option as we believe it will help investors understand the potential future cash flows we may receive associated with the two contingent milestones.
We valued the contingent milestone payments using a modified Black-Scholes Option Pricing Model ("BSOPM"). Key inputs in the BSOPM are the estimated volatility and rate of return of royalties on global net sales of Tysabri® that are received by Royalty Pharma over time until payment of the contingent milestone payments is completed. Volatility and the estimated fair value of the milestones have a positive relationship such that higher volatility translates to a higher estimated fair value of the contingent milestone payments. In the valuation of contingent milestone payments performed, we assumed volatility of 30.0% and a rate of return of 8.05% as of July 1, 2017 and a volatility of 30.0% and a rate of return of 8.06% as of September 30, 2017. We assess volatility and rate of return inputs quarterly by analyzing certain market volatility benchmarks and the risk associated with Royalty Pharma achieving the underlying projected royalties. During the three and nine months ended September 30, 2017, the fair value of the Royalty Pharma contingent milestone payments decreased $2.9 million and $42.1 million, respectively, as a result of the decrease in the estimated projected Tysabri® revenues due to the launch of Ocrevus® late in the first quarter of 2017 (refer to Item 1. Note 6).
Interest Expense, Net
Interest expense, net was $34.7 million and $133.1 millionduring the three and nine months ended September 30, 2017, respectively, compared to $54.6 million and $163.2 million for the three and nine months ended October 1, 2016, respectively. The $19.9 million and $30.1 million decreases were the result of the early debt repayments made during the nine months ended September 30, 2017 (refer to the "Borrowings and Capital Resources" section below and Item 1. Note 10).
Other (Income) Expense, Net
Other (income) expense, net was $3.6 million income for the three months ended SeptemberMarch 30, 2017, compared to $1.0 million expense for the three months ended October 1, 2016. The $4.6 million decrease in expense2024 was due primarily to $2.6 million of favorable changes in revaluation of monetary assets and liabilities held in foreign currencies.
Other (income) expense, net was $1.1 million income during the nine months ended September 30, 2017, compared to $32.4 million expense for the nine months ended October 1, 2016. The $33.5 million decrease in expenses was due primarilycomparable to the absence of a $22.3 million equity investment impairment (refer to Item 1. Note 7), $6.7 million of favorable changes in revaluation of monetary assets and liabilities held in foreign currencies, and a $4.2 million reduction in equity method losses, partially offset by a $5.9 million loss related to the pre-issuance hedge reclassification (refer to Item 1. Note 8).prior year period.
Loss on Extinguishment of Debt
During the nine months ended September 30, 2017, we recorded a $135.2 million loss on extinguishment of debt, which consisted of tender premium on debt repayments, transaction costs, write-off of deferred financing fees, and bond discounts related to the $500.0 million 3.500% senior notes due December 2021, $500.0 million 3.500% senior notes due March 2021, $400.0 million 4.900% senior notes due 2044, $800.0 million 4.000% senior notes due 2023, and $400.0 million 5.300% senior notes due 2043 (refer to Item 1. Note 10).
Perrigo Company plc - Item 2
Unallocated, Interest, Other, and Taxes
Income Taxes (Consolidated)
The effective tax rates were as follows:
| | | | | | | | | | | | | | | | |
| Three Months Ended | | | | |
| March 30, 2024 | | April 1, 2023 | | | | | | | | |
| 104.2 | % | | 123.8 | % | | | | | | | | |
|
| | | | | | | | | | |
| Three Months Ended | | Nine Months Ended |
October 1,
2016 | | September 30,
2017 | | October 1,
2016 | | September 30,
2017 |
| 16.4 | % | | 65.5 | % | | 17.2 | % | | 68.7 | % |
The effective tax rate foron the nine months ended September 30, 2017 was negatively impacted by non-deductible fees related to our debt cancellation, discrete tax items, and additional valuation allowances recorded against deferred tax assets.
Our tax rate is subject to adjustment over the balance of the fiscal year due to, among other things: the jurisdictions in which our profits are determined to be earned and taxed; changes in the valuation of our deferred tax assets and liabilities; adjustments to estimated taxes upon finalization of various tax returns; adjustments based on differing interpretations of the applicable transfer pricing standards; changes in available tax credits, grants and other incentives; changes in stock-based compensation expense; changes in tax laws or the interpretation of such tax laws (for example, proposalspre-tax loss for fundamental U.S. international tax reform); changes in U.S. GAAP; and expiration of or the inability to renew tax rulings or tax holiday incentives.
On August 15, 2017, we filed a complaint in the United States District Court for the Western District of Michigan to recover $163.6 million of Federal income tax, penalties, and interest assessed and collected by the Internal Revenue Service (“IRS”), plus statutory interest thereon from the dates of payment, for the fiscal years ended June 27, 2009, June 26, 2010, June 25, 2011, and June 30, 2012 (the “2009 tax year,” “2010 tax year,” “2011 tax year,” and “2012 tax year,” respectively). The IRS audits of those years culminated in the issuances of two statutory notices of deficiency: (1) on August 27, 2014 for the 2009 and 2010 tax years and (2) on April 20, 2017 for the 2011 and 2012 tax years. The statutory notices of deficiency both included un-agreed income adjustments related principally to transfer pricing adjustments regarding the purchase, distribution, and sale of store-brand OTC pharmaceutical products in the United States. In addition, the statutory notice of deficiency for the 2011 and 2012 tax years included the capitalization of certain expenses that were deducted when paid or incurred in defending against certain patent infringement lawsuits. We fully paid the assessed amounts of tax, interest, and penalties set forth in the statutory notices and filed timely claims for refund on June 11, 2015 and June 7, 2017 for the 2009-2010 tax years and 2011-2012 tax years, respectively. Our claims for refund were disallowed by certified letters dated August 18, 2015 and July 11, 2017, for the 2009-2010 tax years and 2011-2012 tax years, respectively. The complaint was timely, based upon the refund claim denials, and seeks refunds of tax, interest, and penalties of $37.2 million for the 2009 tax year, $61.5 million for the 2010 tax year, $40.2 million for the 2011 tax year, and $24.7 million for the 2012 tax year. The amounts sought in the complaint for the 2009 and 2010 tax years were recorded as deferred charges on our balance sheet during the three months ended March 28, 2015, and30, 2024 was largely impacted by the amounts soughtyear-to-date losses recognized in the complaintvarious tax jurisdictions as well as the impacts of accounting for income taxes in interim reporting periods. As a result, a significant variation in the customary relationship between income tax expense and pre-tax book income may occur. Due to the net impact of planned inter-company intellectual property sales, estimated worldwide non-deductible expenses, as well as establishing a partial valuation allowance in the United States, we are projecting an income tax expense for the 2011 and 2012 tax years were recorded as deferred charges on our balance sheet during the three months ended July 1, 2017.
On December 22, 2016, we received a notice of proposed adjustment for the IRS audit of Athena Neurosciences, Inc. (“Athena”), a subsidiary of Elan acquired in 1996, for the yearsfull year ended December 31, 2011, December 31, 2012, and December 31, 2013. Perrigo acquired Elan2024, which results in December 2013. This proposed adjustment relatesan unusually high annual effective tax rate when applied to the deductibility of litigation costs.
On July 11, 2017, we received a draft notice of proposed adjustment associated with transfer pricing positionsforecasted pre-tax income for the IRS audit of Athena for the years ended December 31, 2011, December 31, 2012, and December 31, 2013. Athena was the originator of the patents associated with Tysabri® prior to the acquisition of Athena by Elan in 1996. The amount of adjustments that may be asserted by the IRS in the final notice of proposed adjustment cannot be quantified at this time; however, based on the draft notice received, the amount to be assessed may be material. We disagree with the IRS’s position as asserted in the draft notice of proposed adjustment and intend to contest it.year.
Perrigo Company plc - Item 2
Unallocated, Interest, Other, and Taxes
We have ongoing audits in multiple other jurisdictions the resolution of which remains uncertain. These jurisdictions include, but are not limited to, the United States, Israel and France. In addition to the matters discussed above, the IRS is currently auditing our fiscal years ended June 29, 2013, June 28, 2014, and June 27, 2015. The Israel Tax Authority is currently auditing our fiscal years ended June 29, 2013 and June 28, 2014. The French Tax Authority is currently auditing the years ended December 2014, December 2015, and December 2016.
FINANCIAL CONDITION, LIQUIDITY, AND CAPITAL RESOURCES
Overview
We finance our operations with internally generated funds, supplemented by credit arrangements with third parties and capital market financing. We routinely monitor current and expected operational requirements and financial market conditions to evaluate other available financing sources including term and revolving bank credit and securities offerings. In determining our future capital requirements, we regularly consider, among other factors, known trends and uncertainties, such as the war in Ukraine and Israel, inflation and interest rates, the status of material contingent liabilities, recent financial market volatility and other uncertainties. Subject to relevant restrictions under our debt agreements, our cash requirements for other purposes and other factors management deems relevant, we may from time to time use available funds to redeem, repurchase or refinance our debt in privately negotiated or open market transactions, by tender offer or otherwise, in compliance with applicable laws, rules and regulations, at prices and on terms we deem appropriate (which may be below par).
Based on the foregoing, management believes that our operations and borrowing resources are sufficient to provide for our short-term and long-term capital requirements, as described below. However, an adverse result with respect to our appeal of any material outstanding tax assessments or litigation, including securities or drug pricing matters and product liability cases, damages resulting from third-party claims, and related interest and/or penalties, could ultimately require the use of corporate assets to pay such assessments and any such use of corporate assets would limit the assets available for other corporate purposes. As such, we continue to evaluate the impact of the above factors on liquidity and may determine that modifications to our capital structure are appropriate if market conditions deteriorate, favorable capital market opportunities become available, or any change in conditions relating to the war in Ukraine and Israel, inflation and interest rates, the status of material contingent liabilities, financial market volatility or other uncertainties have a material impact on our capital requirements.
Cash, and Cash Equivalents and Restricted Cash
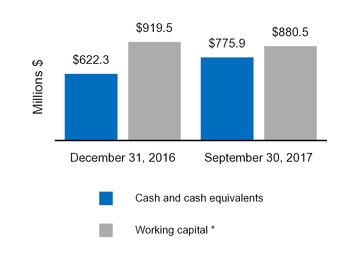
| | | | | | | | | | | |
| (in millions) | March 30, 2024 | | December 31, 2023 |
| Cash, cash equivalents and restricted cash | $ | 658.5 | | | $ | 751.3 | |
Working capital(1) | $ | 1,034.0 | | | $ | 935.9 | |
*(1) Working capital represents current assets less current liabilities, excluding cash, and cash equivalents and restricted cash and excluding current indebtedness.
Cash, cash equivalents, restricted cash, cash flows from operations, and borrowings available under our credit facilities are expected to be sufficient to finance the known and/or foreseeableour liquidity and capital expenditures.expenditures in both the short and long term. Although our lenders have made commitments to make funds available to us in a timely fashion under our revolving credit agreements and overdraft facilities, if economic conditions worsen or new information becomes publicly available impacting the institutions’ credit rating or capital ratios, these lenders may be unable or unwilling to
Perrigo Company plc - Item 2
Financial Condition, Liquidity and Capital Resources
lend money pursuant to our existing credit facilities. Should our outlook on liquidity requirements change substantially from current projections, we may seek additional sources of liquidity in the future.
Cash Flows
The following table includes summarized cash flow activities:
| | | | | | | | | | | | | | | | | |
| Three Months Ended | | |
| (in millions) | March 30, 2024 | | April 1, 2023 | | $ Change |
| Net cash (for) from operating activities | $ | (1.4) | | | $ | 19.4 | | | $ | (20.8) | |
| Net cash for investing activities | (23.5) | | | (19.6) | | | (3.9) | |
| Net cash for financing activities | (60.4) | | | (50.7) | | | (9.7) | |
| Effect of exchange rate changes on cash and cash equivalents | (7.5) | | | 3.2 | | | (10.7) | |
| Net decrease in cash and cash equivalents | $ | (92.8) | | | $ | (47.7) | | | $ | (45.1) | |
Net cash (for) from Operating Activities
The $20.8 million decrease in operating cash flow was primarily driven by the change in accrued income taxes, partially offset by an increase in cash flow from the change in net earnings after adjustments for items including depreciation and amortization, restructuring and share-based compensation.
Net cash for Investing Activities
The $3.9 million decrease in investing cash flow was due to increased capital expenditures and the absence of proceeds in the prior year from the sale of a brand asset.
Net cash for Financing Activities
The $9.7 million decrease in financing cash flow was due primarily to payments on our Senior Secured Credit Facilities and an increase in dividend payments compared to the prior year.
Borrowings and Capital Resources
Credit Agreements
On April 20, 2022, we and our indirect wholly-owned subsidiary, Perrigo Investments, LLC (the "Borrower") entered into the senior secured credit facilities, which consisted of (i) a $1.0 billion five-year revolving credit facility (the "Revolver"), (ii) a $500.0 million five-year Term Loan A facility (the "Term Loan A Facility" and the Term A Loans thereunder, the "Term A Loans"), and (iii) a $1.1 billion seven-year Term Loan B facility (the "Term Loan B Facility" and the Term B loans thereunder borrowed on April 20, 2022, the "2022 Term B Loans"), all pursuant to a Term Loan and Revolving Credit Agreement (the "Credit Agreement").
On December 15, 2023, we and the Borrower entered into Amendment No. 1, an Incremental Assumption Agreement (the "Amendment") to the Credit Agreement. The Amendment provides for a fungible add on to the 2022 Term B Loans in an aggregate principal amount of $300.0 million (the "Incremental Term B Loans" and together with the 2022 Term B Loans, the “Term B Loans”). The terms of the Incremental Term B Loans, including pricing and maturity, are identical to the 2022 Term B Loans. The Term B Loans will mature on April 20, 2029. The net proceeds from the Incremental Term B Loans were used to settle the cash tender offer by Perrigo Finance for $300.0 million in aggregate principal amount of 3.900% Senior Notes due 2024 ("2024 Notes"). The tender offer was settled on December 15, 2023, and Perrigo Finance accepted for purchase $300.0 million of the 2024 Notes and paid approximately $295.1 million in aggregate cash consideration (excluding accrued interest). Refer to Item 1. Note 10.
As of March 30, 2024 and December 31, 2023, we had $1,848.3 million and $1,858.1 million, respectively, outstanding under our Term Loan A Facility and Term Loan B Facility. Our short-term debt as of March 30, 2024 of $440.6 million is comprised of (i) the remaining portion of the 3.900% Senior Notes due 2024, (ii) amortization payments for the Term A Loans and the Term B Loans and (iii) lease payments.
Perrigo Company plc - Item 2
Financial Condition, Liquidity and Capital Resources
Operating ActivitiesThe interest rate net of derivatives results in a fixed rate on a substantial portion of our long-term debt, the earliest of which matures in December 2024.
|
| | | | | | | | | | | |
| | Nine Months Ended |
| (in millions) | October 1,
2016 | | September 30,
2017 | | Increase/(Decrease) |
| Cash Flows From (For) Operating Activities | | | | | |
| Net income (loss) | $ | (2,653.7 | ) | | $ | 46.4 |
| | $ | 2,700.1 |
|
| Non-cash adjustments | 3,229.9 |
| | 560.8 |
| | (2,669.1 | ) |
| Subtotal | 576.2 |
| | 607.2 |
| | 31.0 |
|
| | | | | | |
| Increase (decrease) in cash due to: | | | | | |
| Accounts receivable | 113.0 |
| | 38.4 |
| | (74.6 | ) |
| Inventories | 25.1 |
| | (28.3 | ) | | (53.4 | ) |
| Accounts payable | (57.7 | ) | | (6.0 | ) | | 51.7 |
|
| Payroll and related taxes | (40.0 | ) | | (36.7 | ) | | 3.3 |
|
| Accrued customer programs | (73.7 | ) | | (15.8 | ) | | 57.9 |
|
| Accrued liabilities | (90.0 | ) | | (18.8 | ) | | 71.2 |
|
| Accrued income taxes | 5.2 |
| | (61.5 | ) | | (66.7 | ) |
| Other, net | (9.4 | ) | | 3.5 |
| | 12.9 |
|
| Subtotal | $ | (127.5 | ) | | $ | (125.2 | ) | | $ | 2.3 |
|
| | | | | | |
| Net cash from operating activities | $ | 448.7 |
| | $ | 482.0 |
|
| $ | 33.3 |
|
We generated $482.0are in compliance with all the covenants under our debt agreements as of March 30, 2024.
Other Financing
We have overdraft facilities available that we may use to support our cash management operations. There were no borrowings outstanding under the overdraft facilities as of March 30, 2024 or December 31, 2023.
Leases
We had $194.0 million and $202.2 million of cashlease liabilities and $190.1 million and $197.3 million of lease assets as of March 30, 2024 and December 31, 2023, respectively. For information on our operating and finance lease obligations and the amount and timing of future payments refer to Item 1. Note 6.
Credit Ratings
Our credit ratings on March 30, 2024 were Ba2 (negative), BB- (stable), and BB+ (negative), by Moody's Investor Services, S&P Global Ratings, and Fitch Ratings Inc., respectively. On March 25, 2024, S&P downgraded our issuer credit rating to BB- from operating activities duringBB, senior secured notes ratings to BB from BB+ and senior unsecured notes ratings to B+ from BB- and the nine months ended September 30, 2017, a $33.3 million increase overrating outlooks remained stable. On April 16, 2024, Fitch downgraded our issuer credit rating to BB from BB+ and the prior year period, duerating outlooks remained negative.
Due to the following:
Increased net earningsdowngrade by S&P Global Ratings, the interest of the 3.150% Senior Notes due 2030 will step up from 4.650% to 4.900% on payments made after June 15, 2024. There was no impact to our interest rates as a result of the Fitch downgrade. Future interest rate adjustments for items suchof the 3.150% Senior Notes due 2030 are subject to a 2.0% total cap above the original 3.150% interest rate based on certain rating events as deferred income taxes, impairment charges, restructuring charges, changes in our financial assets, loss on extinguishment of debt, and depreciation and amortization;
Changes in accrued liabilities due to deferred revenue associated with BCH-Belgium distribution contracts and the absence of accruals related to the sale of our U.S. VMS business;
Changes in accrued customer-related programs due primarily to the pricing dynamicsspecified in the RX segment; and
Changes in accounts payable due primarily to changes to the Omega accounts payable structure that occurred in the prior year period; offset primarily by
Changes in accounts receivable due primarily to timingNote’s Supplemental Indenture No. 3, dated as of receipt of payments and the absence of receivables related to the sale of our U.S. VMS business;
Changes in inventory due to the build up of inventory levels to support customer demands in the current period; offset by improved inventory management in the comparable prior year period; and
| |
• | Changes in accrued income taxes due primarily to a U.S. Federal tax obligation payment made in the current year period, offset by expected tax refunds (refer to Item 1. Note 13). |
June 19, 2020, among Perrigo Finance Unlimited Company, Perrigo Company plc and Wells Fargo Bank, National Association, as trustee.
Guarantor Financial Information
As detailed in Item 1. Note 10, the Guarantor Subsidiaries and the Borrower provide full and unconditional guarantees, jointly and severally, on a senior unsecured basis, of the 5.300% Notes due 2043 issued by the Company, and the Loan Parties provide full and unconditional guarantees, jointly and severally, on a senior unsecured basis, of the 3.900% Notes due 2024, the 4.375% Notes due 2026, the 4.650% Notes due 2030 and the 4.900% Notes due 2044 issued by Perrigo Finance Unlimited Company ("Perrigo Finance").
The guarantees of the Guarantor Subsidiaries, the Company and the Borrower are subject to release in limited circumstances only upon the occurrence of certain customary conditions. The guarantees of the Guarantor Subsidiaries, the Company and the Borrower rank senior in right of payment to any future subordinated indebtedness of the Company, equal in right of payment with all of the Company’s existing and future senior indebtedness and effectively subordinated to any of the Company’s existing and future secured indebtedness, to the extent of the value of the collateral securing such indebtedness.
Basis of Presentation
The following tables include summarized financial information of the obligor groups of debt issued by Perrigo Finance and the Company. The summarized financial information of each obligor group is presented on a combined basis with balances and transactions within the obligor group eliminated. Investments in and the equity in earnings of non-guarantor subsidiaries, which would otherwise be consolidated in accordance with U.S. GAAP, are excluded from the below summarized financial information pursuant to SEC Regulation S-X Rule 13-01.
The summarized balance sheet information for the consolidated obligor group of debt issued by Perrigo Finance and the Company is presented in the table below:
Perrigo Company plc - Item 2
Financial Condition, Liquidity and Capital Resources
| | | | | | | | | | | |
| March 30, 2024 | | December 31, 2023 |
| Current Assets | $ | 1,894.0 | | | $ | 1,999.9 | |
| Non-current Assets | $ | 4,548.6 | | | $ | 4,596.2 | |
| Current liabilities | $ | 1,158.9 | | | $ | 1,888.8 | |
| Non-current liabilities | $ | 11,463.6 | | | $ | 11,498.4 | |
| Due to non-guarantors | $ | 7,368.7 | | | $ | 7,355.3 | |
| | | |
| | | |
Investing Activities
|
| | | | | | | | | | | |
| | Nine Months Ended |
| ($ in millions) | October 1,
2016 | | September 30,
2017 | | Increase/(Decrease) |
| Cash Flows From (For) Investing Activities |
| Proceeds from royalty rights | $ | 259.5 |
| | $ | 86.4 |
| | $ | (173.1 | ) |
| Acquisitions of businesses, net of cash acquired | (436.8 | ) | | — |
| | 436.8 |
|
| Asset acquisitions | (65.1 | ) | | — |
| | 65.1 |
|
| Additions to property, plant and equipment | (84.6 | ) | | (55.2 | ) | | 29.4 |
|
| Net proceeds from sale of business and other assets | 58.5 |
| | 46.7 |
| | (11.8 | ) |
Proceeds from sale of the Tysabri® financial asset | — |
| | 2,200.0 |
| | 2,200.0 |
|
| Other investing, net | (1.0 | ) | | (5.8 | ) | | (4.8 | ) |
| Net cash from (for) investing activities | $ | (269.5 | ) | | $ | 2,272.1 |
| | $ | 2,541.6 |
|
Cash generated from investing activities totaled $2.3 billionThe summarized results of operations information for the nine months ended September 30, 2017, compared to cash usedconsolidated obligor group of $269.5 milliondebt issued by Perrigo Finance and the Company is presented in the prior year period. The inflow in the current year was due primarily to the completed divestment of our Tysabri® financial asset to Royalty Pharma, for which we received $2.2 billion in cash at closing (refer toItem 1. Note 6). The outflow in the prior year was due primarily to the acquisition of a portfolio of generic dosage forms and strengths of Retin-A® ("Tretinoin"), a topical prescription acne treatment from Mattawan Pharmaceuticals, LLC, which used $416.4 million in cash. The prior year outflow was offset partially by proceeds from royalty rights of $259.5 million. Cash used for capital expenditures totaled $55.2 million during the nine months ended September 30, 2017 compared to $84.6 million in the prior year period. The decrease in cash used for capital expenditures was due primarily to the decrease in the number of projects in the current year compared to the prior year period.table below: | | | | | | |
| Three Months Ended | |
| March 30, 2024 | |
| Total Revenues | $ | 748.9 | | |
| Gross Profit | $ | 188.8 | | |
| Operating Income (loss) | $ | (106.6) | | |
| Net Income (loss) | $ | (18.9) | | |
| Revenue from non-guarantors | $ | 86.4 | | |
| Operating Expenses to non-guarantors | $ | (1.1) | | |
| Other (income) expense to non-guarantors | $ | (14.7) | | |
Financing Activities
|
| | | | | | | | | | | |
| | Nine Months Ended |
| ($ in millions) | October 1,
2016 | | September 30,
2017 | | Increase/(Decrease) |
| Cash Flows From (For) Financing Activities |
| Issuances of long-term debt | $ | 1,190.3 |
| | $ | — |
| | $ | (1,190.3 | ) |
| Borrowings (repayments) of revolving credit agreements and other financing, net | (803.6 | ) | | — |
| | 803.6 |
|
| Payments on long-term debt | (545.8 | ) | | (2,243.7 | ) | | (1,697.9 | ) |
| Deferred financing fees | (2.8 | ) | | (4.2 | ) | | (1.4 | ) |
| Premium on early debt retirement | (0.6 | ) | | (116.1 | ) | | (115.5 | ) |
| Issuance of ordinary shares | 8.2 |
| | 0.5 |
| | (7.7 | ) |
| Repurchase of ordinary shares | — |
| | (191.5 | ) | | (191.5 | ) |
| Cash dividends | (62.4 | ) | | (68.7 | ) | | (6.3 | ) |
| Other financing | (17.4 | ) | | 2.7 |
| | 20.1 |
|
| Net cash (for) financing activities | $ | (234.1 | ) | | $ | (2,621.0 | ) | | $ | (2,386.9 | ) |
Cash used for financing activities totaled $2.6 billion for the nine months ended September 30, 2017, compared to $234.1 million for the comparable prior year period. In the current year period, cash used for financing included $2.2 billion of repayments on long-term debt and $116.1 million of discounts on early debt retirement related to the current year debt extinguishment and $191.5 million in share repurchases, as discussed below. In the prior year period, the cash used for financing activities was due primarily to borrowings of $1.2 billion of long-term debt, more than offset by net repayments on our revolving credit agreements and other short-term financing of $803.6 million and net repayments on our long-term debt of $545.8 million (refer to "Borrowings and Capital Resources" below and Item 1. Note 10).
Perrigo Company plc - Item 2
Financial Condition, Liquidity and Capital Resources
The declaration and payment of dividends, if any, is subject to the discretion of our Board of Directors and will depend on our earnings, financial condition, availability of distributable reserves, capital and surplus requirements, and other factors our Board of Directors may consider relevant.
On October 22, 2015, the Board of Directors approved a share repurchase plan of up to $2.0 billion (the "2015 Authorization"). During the three and nine months ended September 30, 2017, we repurchased 1.9 million and 2.7 million ordinary shares at an average repurchase price of $71.73 and $71.72 per share, for a total of $133.3 million and $191.5 million, respectively. As of September 30, 2017, there was $1.3 billion still available to be repurchased through December 31, 2018 under the 2015 Authorization. We did not repurchase any shares under the share repurchase plan during the nine months ended October 1, 2016.
Borrowings and Capital Resources
Overdraft Facilities
Off-Balance Sheet Arrangements
We have overdraft facilities availableno off-balance sheet arrangements that we usehave a material current effect or that are reasonably likely to support our cash management operations. There were no balances outstanding under the facilities at September 30, 2017 and December 31, 2016.
Accounts Receivable Factoring
We have multiple accounts receivable factoring arrangements with non-related third-party financial institutions (the “Factors”). Pursuant to the terms of the arrangements, we sell to the Factors certain of our accounts receivable balancesa material future effect on a non-recourse basis for credit approved accounts. An administrative fee ranging from 0.14% to 0.15% per invoice is charged on the gross amount of accounts receivables assigned to the Factors, and interest is calculated at the applicable EUR LIBOR rate plus 70 basis points. The total amount factored on a non-recourse basis and excluded from accounts receivable was $24.3 million and $50.7 million at September 30, 2017 and December 31, 2016, respectively.
Revolving Credit Agreements
On December 9, 2015, our 100% owned finance subsidiary, Perrigo Finance Unlimited Company (formerly Perrigo Finance plc) ("Perrigo Finance"), entered into a $750.0 million revolving credit agreement (the "2015 Revolver"). On March 15, 2016, we used the proceeds of the long-term debt issuance described below to repay the $750.0 million then outstanding under the 2015 Revolver and terminated the facility.
On December 5, 2014, Perrigo Finance entered into a $600.0 million revolving credit agreement, which increased to $1.0 billion on March 30, 2015 (the "2014 Revolver"). On March 15, 2016, we used the proceeds of the long-term debt issuance described below to repay the $435.0 million then outstanding under the 2014 Revolver. There were no borrowings outstanding under the 2014 Revolver as of September 30, 2017.
Perrigo Company plc - Item 2
Financial Condition, Liquidity and Capital Resources
Term Loans and Notes
On March 7, 2016, Perrigo Finance issued $500.0 million in aggregate principal amount of 3.500% senior notes due 2021 and $700.0 million in aggregate principal amount of 4.375% senior notes due 2026 (together, the "2016 Notes") and received net proceeds of $1.2 billion after fees and market discount, which were used to repay the amounts outstanding under the 2015 Revolver and 2014 Revolver mentioned above.
We had $3.3 billion and $5.4 billion outstanding under our notes and bonds, and $428.3 million and $420.7 million outstanding under our term loan, as of September 30, 2017 and December 31, 2016, respectively. On September 29, 2016, we repaid the 1.300% senior notes due 2016 in full.
On December 5, 2014, Perrigo Finance entered into a term loan agreement consisting of a €500.0 million ($614.3 million) tranche, with the ability to draw an additional €300.0 million ($368.6 million) tranche, maturing December 5, 2019, and we entered into a $300.0 million term loan tranche maturing December 18, 2015, which we repaid in full on June 25, 2015.
Debt Repayments
During the nine months ended September 30, 2017, we reduced our outstanding debt through a variety of transactions (in millions):
|
| | | | | | | | |
| Date | | Series | | Transaction Type | | Principal Retired |
| April 1, 2017 | | 2014 term loan due December 5, 2019 | | Scheduled quarterly payment | | $ | 13.3 |
|
| July 1, 2017 | | 2014 term loan due December 5, 2019 | | Scheduled quarterly payment | | 14.3 |
|
| September 30, 2017 | | 2014 term loan due December 5, 2019 | | Scheduled quarterly payment | | 14.8 |
|
| May 8, 2017 | | $600.0 2.300% senior notes due 2018 | | Early redemption | | 600.0 |
|
| May 23, 2017 | | €180.0 4.500% retail bonds due 2017 | | Scheduled maturity | | 201.3 |
|
| June 15, 2017 | | $500.0 3.500% senior notes due 2021 | | Tender offer | | 190.4 |
|
| June 15, 2017 | | $500.0 3.500% senior notes due 2021 | | Tender offer | | 219.6 |
|
| June 15, 2017 | | $800.0 4.000% senior notes due 2023 | | Tender offer | | 584.4 |
|
| June 15, 2017 | | $400.0 5.300% senior notes due 2043 | | Tender offer | | 309.5 |
|
| June 15, 2017 | | $400.0 4.900% senior notes due 2044 | | Tender offer | | 96.1 |
|
| | | | | | | $ | 2,243.7 |
|
As previously disclosed, during the three months ended April 1, 2017 we entered into amendments to the 2014 Revolver and the 2014 term loan to modify provisions of such agreements necessary as a result of the correction in accounting related to the Tysabri® financial asset, as well as waivers of any default or event of default that may have arisen from any restatement of or deficiencies in our financial statements for the periods specified in such amendments and waivers. We are in compliance with all covenants under our debt agreements as of September 30, 2017.
See Item 1. Note 10 for more information on all of the above debt facilities.
Credit Ratings
Our credit ratings on September 30, 2017 were Baa3 (stable) and BBB- (stable) by Moody's Investors Service and Standard and Poor's Global Ratings, respectively.
Credit rating agencies review their ratings periodically and, therefore, the credit rating assigned to us by each agency may be subject to revision at any time. Accordingly, we are not able to predict whether current credit ratings will remain as disclosed above. Factors that can affect our credit ratings includecondition, changes in operating performance, the economic environment, our financial position, and changes in business strategy. If changes in our credit ratings were to occur, they could impact, among other things, future borrowing costs, access tocondition, net sales or expenses, results of operations, liquidity, capital markets, and vendor financing terms.expenditures, or capital resources.
Perrigo Company plc - Item 2
Financial Condition, Liquidity and Capital Resources
Contractual Obligations and Commitments
Other than the obligations related to the changes to our debt structure in relation to the repayments, as discussed in Item 1. Note 10, thereThere were no material changes in contractual obligations as of SeptemberMarch 30, 20172024 from those provided in our 20162023 Form 10-K. See below for a revised schedule
Significant Accounting Policies
There have been no material changes to the significant accounting policies as disclosed in our 2023 Form 10-K.
Critical Accounting Estimates
The determination of certain amounts in our enforceablefinancial statements requires the use of estimates. These estimates are based upon our historical experiences combined with management’s understanding of current facts and legally binding obligationscircumstances. Although the estimates are considered reasonable based on the currently available information, actual results could differ from the estimates we have used. There have been no material changes to the critical accounting estimates as of September 30, 2017 related todisclosed in our short and long-term debt arrangements.2023 Form 10-K.
|
| | | | | | | | | | | | | | | | | | | |
| | Payment Due by Period (in millions) |
| | 2017(1) | | 2018 - 2019 | | 2020 - 2021 | | After 2021 | | Total |
Short and long-term debt(2) | $ | 406.5 |
| | $ | 811.5 |
| | $ | 812.5 |
| | $ | 2,859.6 |
| | $ | 4,890.1 |
|
(1)Reflects remaining three months of 2017.
| |
(2)
| Short and long-term debt includes interest payments, which were calculated using the effective interest rate at September 30, 2017. |
ITEM 3. QUANTITATIVE AND QUALITATIVE DISCLOSURES ABOUT MARKET RISK
There have been no material changes to our quantitative or qualitative disclosures found in Item 7A, "Quantitative and Qualitative Disclosures about Market Risk," of our Annual Report on2023 Form 10-K for the year ended December 31, 2016.10-K.
ITEM 4. CONTROLS AND PROCEDURES
Conclusion Regarding the Effectiveness of Disclosure Controls and Procedures
Our management, with the participation of our Chief Executive Officer and Chief Financial Officer, has evaluated the effectiveness of the design and operation of our disclosure controls and procedures (as defined in Rule 13a-15(e) or
Perrigo Company plc - Item 4
Controls and Procedures
15d-15(e) of the Exchange Act) as of SeptemberMarch 30, 2017.2024. Based upon that evaluation, our Chief Executive Officer and Chief Financial Officer have concluded that our disclosure controls and procedures were notare effective as of September 30, 2017 because of thein ensuring that all material weaknessesinformation relating to us and our consolidated subsidiaries required to be included in our internal control over financial reporting described below.
All systems of internal control, no matter how well designed, have inherent limitations. Therefore, evenperiodic SEC filings would be made known to them by others within those systems deemed to be effective can provide only reasonable assurance with respect to financial statement preparation and presentation. A material weakness is a deficiency, or combination of deficiencies,entities in internal control over financial reporting, such that there is a reasonable possibility that a material misstatement of a company’s annual or interim consolidated financial statements will not be prevented or detected on a timely basis.manner and that no changes are required at this time.
Evaluation of the Effectiveness of Internal Control over Financial Reporting
We conducted an evaluation ofOur management assessed the effectiveness of our internal control over financial reporting based upon theas of March 30, 2024. The framework establishedused in carrying out our evaluation was the 2013 Internal Control - Integrated Framework issued published by the Committee of Sponsoring Organizations ("COSO") of the Treadway Commission (“COSO”).
Perrigo Company plc - Item 4
Controls and Procedures
Tysabri® Contingent Payments
We acquired the Tysabri® royalty stream inCommission. In evaluating our acquisition of Elan Pharmaceuticals plc (“Elan”) in December 2013, and at the timeinformation technology controls, we also used components of the acquisition,framework contained in the Control Objectives for Information and related Technology, which was developed by the Information Systems Audit and Control Association’s IT Governance Institute, as a complement to the COSO internal control framework. Management has concluded that the right to receive quarterly royalty payments from Biogen Idec Inc. should be an intangible asset and such payments recognized as revenue in our financial statements. As discussed in Item 4.02 of our Form 8-K filed on April 25, 2017, during the 2016 year-end close process, and in anticipation of our potential sale of the Tysabri® royalty rights and the 2018 adoption of ASC 606 Revenue from Contracts with Customers, we re-evaluated the historical classification of the Tysabri® royalty stream as an intangible asset and concluded that it should have been reflected in the financial statements as a financial asset as of its 2013 acquisition date. As part of this evaluation, management determined that its control over the review of the application of the accounting guidance in ASC 805 Business Combinations did not operate effectively in the appropriate identification of the assets acquired and liabilities assumed in connection with the Elan acquisition in December 2013.All of our originally filed financial statements through the filing of the Form 10-Q for the quarter ended October 1, 2016, as originally filed on November 10, 2016, included the disclosure of the Elan acquisition with the Tysabri® royalty stream presented as an intangible asset. In addition, due to the fact that the asset was historically classified as an intangible asset, we did not design or implement controls around the fair value accounting for the Tysabri® royalty stream as a financial asset, so these controls were not in place at any quarter end subsequent to the acquisition, including the date of the quarterly and annual assessment of internal control. Accordingly, management concluded that these control deficiencies represent material weaknesses. As discussed in our Form 10-Q for the quarter ended July 1, 2017, the material weakness related to the fair value accounting for the Tysabri® royalty stream as a financial asset was remediated during that period. See below for our discussion of the remediation efforts related to our acquisition of the Tysabri® royalty rights.
Income Taxes
Management has determined that we did not design or maintain effective management review controls related to our (1) evaluation of non-routine transactions that impact our effective tax rate on an annual and interim basis and (2) determination of our deferred taxes in connection with business combinations.
During our quarterly and annual fiscal 2016 close processes, management determined that the design and operating effectiveness of our controls around the evaluation of non-routine events did not operate appropriately. As disclosed in our Form 10-Q for the quarterly period ended April 2, 2016, our management review controls did not operate at a sufficient level of precision to ensure interim income taxes were properly recorded and disclosed in our condensed consolidated financial statements in connection with the recording of an indefinite-lived intangible asset impairment and estimated goodwill impairment as part of the Company’s controls to evaluate non-routine events that occur during a quarterly period and the related income tax impacts. These control deficiencies resulted in a material misstatement in income taxes in the preliminary financial statements for the quarter ended April 2, 2016. Additionally, these controls remained unremediated as of September 30, 2017, as they were in February 2017 when we identified that these controls did not appropriately evaluate the need for a valuation allowance. ASC 740, Income Taxes, requires a company to record a valuation allowance to reduce a deferred tax asset to its net realizable value. Our controls related to consideration of non-routine transactions or events were not designed and did not operate appropriately and identify whether a valuation allowance was needed as they did not identify that we entered into a three year cumulative loss and did not consider the positive and negative evidence in evaluating the potential sources of taxable income in determining whether a valuation allowance was required in the consolidated financial statements.
In February 2017, management identified the existence of tax basis in certain acquired intangible assets (“tax amortization benefits”) that existed at the time of the acquisition of Omega Pharma Invest N.V. (“Omega”) on March 30, 2015. Upon evaluating the tax amortization benefits, management concluded that the purchase accounting for Omega should have included the tax basis in the intangible assets in calculating the deferred tax liability in the opening balance sheet. This omission of existing tax basis in calculating the deferred tax liability on the acquisition date indicated that management’s review over the opening balance sheet deferred income tax accounts was not designed or operating appropriately.
Accordingly, management concluded that these control deficiencies represent material weaknesses.
Perrigo Company plc - Item 4
Controls and Procedures
Impairment
In connection with our long-lived asset impairment testing, management determined that the controls around the identification of the relevant asset group under ASC 360, Impairment and Disposal of Long-lived Assets, did not operate effectively. In determining the level to evaluate the long-lived assets in our animal health reporting unit for impairment testing, we inappropriately grouped the assets that constituted the asset group in applying the guidance in ASC 360.
Accordingly, management concluded that this control deficiency represented a material weakness.
Remediation Plan for the Material Weaknesses
We are committed to remediating the control deficiencies that gave rise to the material weaknesses described above. Management is responsible for implementing changes and improvements to internal control over financial reporting and for remediating the control deficiencies that gave rise to the material weaknesses.
Tysabri® Contingent Payments
To remediate the material weakness related to the acquisition of the Tysabri® royalty rights, we, with oversight from the Audit committee, designed certain controls around the identification of assets acquired and liabilities assumed in our business combination process. As part of the re-design of the controls, we: (1) considered our controls around the review of the related contracts and agreements and our application of ASC 805 to identify the type of assets acquired and liabilities assumed and (2) evaluated and enhanced management review controls related to business acquisitions. Based on the evaluation of the design and changes to our business acquisition process performed during the second and third quarters of 2017 on these newly implemented controls, we have concluded that these controls have been designed and implemented appropriately. As a result, we consider this material weakness to be remediated as of September 30, 2017.
Income Taxes
To remediate the material weaknesses in internal control over financial reporting related to income taxes, we have, with oversight from the Audit Committee, completed the review of the organizational structure, resources, processes and controls in place to measure and record income taxes to enhance the effectiveness of the design and operation of those controls. In addition, we continue to:
Evaluate the design and operating effectiveness of our controls related to income taxes for business acquisitions and non-routine transactions on an interim and annual basis;
Enhance monitoring activities related to income taxes; and
Evaluate and enhance the level of precision in the management review controls related to income taxes.
We have begun to implement the remediation actions and expect to complete the implementation as part of our 2017 fiscal year closing process. Until the remediation actions are fully implemented and the operational effectiveness of related internal controls is validated through testing, the material weaknesses related to income taxes described above will continue to exist.
Impairment
We, with oversight from the Audit Committee, designed and initiated certain controls around the financial reporting related to the identification of asset groups as part of our impairment testing. Controls we implemented include: (1) reviewing the design and operation of our controls related to asset group determination in our impairment process on an interim and annual basis and (2) evaluating and enhancing the management review controls related to impairment. Based on the testing performed during the second and third quarters of 2017 on these newly implemented controls around the identification of asset groups as part of our impairment testing, we have concluded that these controls have been designed appropriately and are operating effectively. As a result, we consider this material weakness to be remediated as of September 30, 2017.
Perrigo Company plc - Item 4
Controls and Procedures
We are committed to achieving and maintaining a strong internal control environment and believe the remediation measures will strengthen our internal control over financial reporting and remediate the material weaknesses identified. We continue to review the remaining un-remediated material weaknesses and intend to add resources and improvewas effective as of March 30, 2024. The results of management’s assessment have been reviewed with our processes to achieve and maintain a strong control environment. We will continue to monitor the effectiveness of our remediation measures and will make any changes and take such other actions that we deem appropriate given the circumstances.Audit Committee.
Changes in Internal Control over Financial Reporting
Other than as described above under "Remediation Plan for Material Weaknesses," thereThere have been no changes in our internal control over financial reporting during the three months ended SeptemberMarch 30, 20172024 that have materially affected, or are reasonably likely to materially affect, our internal control over financial reporting.
PART II. OTHER INFORMATION
ITEM 1. LEGAL PROCEEDINGS
ITEM 1A. RISK FACTORS
Our Annual Report on Form 10-K for the year ended December 31, 20162023 includes a detailed discussion of our risk factors. At the time of this filing, there have been no material changes to the risk factors that were included in the Form 10-K, other than described below.10-K.
We identified material weaknesses in our internal controls over financial reporting; failure to remediate the material weaknesses could negatively impact our business and the price of our ordinary shares.
In connection with our review of certain material misstatements related to the characterization of the Tysabri® royalty stream acquired in the Elan transaction, as well as material misstatements related to the calculation of deferred tax liabilities that existed at the time of the acquisition of Omega, and the evaluation of long-lived assets in our animal health reporting unit for impairment testing, in each case contained in certain of our historical financial statements, we concluded that there were material weaknesses in our internal control over financial reporting that contributed to those misstatements. As a result of the material weaknesses, which existed at December 31, 2016 and some of which remained at September 30, 2017, we have concluded that we did not maintain, in all material respects, effective internal control over financial reporting as of December 31, 2016, April 1, 2017, July 1, 2017 or September 30, 2017, based on criteria established in Internal Control - Integrated Framework (2013) issued by the Committee of Sponsoring Organizations of the Treadway Commission (“COSO”). The failure to maintain effective control over financial reporting in turn resulted in material deficiencies in our disclosure controls and procedures.
We have identified and begun the implementation of actions, and continue to identify and implement, actions to improve the effectiveness of our internal control over financial reporting and disclosure controls and procedures, but there can be no assurance that such remediation efforts will be successful. We have also incurred and will continue to incur substantial accounting, legal, consulting, and other costs in connection with identifying and remediating the material weaknesses. Failure to remediate the material weaknesses could have a negative impact on our business and the market for our ordinary shares. For more information on our material weaknesses and the status of our remediation efforts, See Part I, Item 4 - Controls and Procedures.
We are currently involved in a search for a new Chief Executive Officer and a subsequent search for a permanent Chief Financial Officer. If these searches are delayed, our business could be negatively impacted.
On June 5, 2017, we announced the forthcoming retirement of John T. Hendrickson as our Chief Executive Officer. Mr. Hendrickson will continue to serve as our Chief Executive Officer and a member of our Board until such time as a successor has been appointed. Our Board of Directors has initiated a Chief Executive Officer search process and has retained an executive search and leadership advisory firm to assist with the process of identifying and evaluating candidates.
Perrigo Company plc - Item 1A
Risk Factors
In addition, on February 21, 2017, we announced the resignation of Judy L. Brown as our Executive Vice President, Business Operations and Chief Financial Officer, effective February 27, 2017. Since that time, Ronald L. Winowiecki has served as our acting Chief Financial Officer. Although Mr. Winowiecki remains a key candidate for our permanent Chief Financial Officer, our Board of Directors has suspended its Chief Financial Officer search during its search for Mr. Hendrickson’s successor as Chief Executive Officer. There are no assurances concerning the timing or outcome of our search for a new Chief Executive Officer or subsequent search for a permanent Chief Financial Officer. If there are any delays in this process, or if any transition is not successful, our business could be negatively impacted.
The resolution of uncertain tax positions could be unfavorable, which could have an adverse effect on our business.
Although we believe that our tax estimates are reasonable and that our tax filings are prepared in accordance with all applicable tax laws, the final determination with respect to any tax audit and any related litigation could be materially different from our estimates or from our historical income tax provisions and accruals. The results of an audit or litigation could have a material effect on operating results or cash flows in the periods for which that determination is made. In addition, future period earnings may be adversely impacted by litigation costs, settlements, penalties or interest assessments.
On August 15, 2017, we filed a complaint in the United States District Court for the Western District of Michigan to recover $163.6 million of Federal income tax, penalties, and interest assessed and collected by the Internal Revenue Service (“IRS”), plus statutory interest thereon from the dates of payment, for the fiscal years ended June 27, 2009, June 26, 2010, June 25, 2011, and June 30, 2012 (the “2009 tax year,” “2010 tax year,” “2011 tax year,” and “2012 tax year,” respectively). The IRS audits of those years culminated in the issuances of two statutory notices of deficiency: (1) on August 27, 2014 for the 2009 and 2010 tax years and (2) on April 20, 2017 for the 2011 and 2012 tax years. The statutory notices of deficiency both included un-agreed income adjustments related principally to transfer pricing adjustments regarding the purchase, distribution, and sale of store-brand OTC pharmaceutical products in the United States. In addition, the statutory notice of deficiency for the 2011 and 2012 tax years included the capitalization of certain expenses that were deducted when paid or incurred in defending against certain patent infringement lawsuits. We fully paid the assessed amounts of tax, interest, and penalties set forth in the statutory notices and filed timely claims for refund on June 11, 2015 and June 7, 2017 for the 2009-2010 tax years and 2011-2012 tax years, respectively. Our claims for refund were disallowed by certified letters dated August 18, 2015 and July 11, 2017, for the 2009-2010 tax years and 2011-2012 tax years, respectively. The complaint was timely, based upon the refund claim denials, and seeks refunds of tax, interest, and penalties of $37.2 million for the 2009 tax year, $61.5 million for the 2010 tax year, $40.2 million for the 2011 tax year and $24.7 million for the 2012 tax year. The amounts sought in the complaint for the 2009 and 2010 tax years were recorded as deferred charges on our balance sheet during the three months ended March 28, 2015, and the amounts sought in the complaint for the 2011 and 2012 tax years were recorded as deferred charges on our balance sheet in the second quarter of the year ending December 31, 2017.
On December 22, 2016, we received a notice of proposed adjustment for the IRS audit of Athena Neurosciences, Inc. (“Athena”), a subsidiary of Elan Corporation plc (“Elan”) acquired in 1996, for the years ended December 31, 2011, December 31, 2012 and December 31, 2013. We acquired Elan in December 2013. This proposed amendment relates to the deductibility of litigation costs. We disagree with the IRS’s position asserted in the notice of proposed adjustment and intend to contest it.
On July 11, 2017, we received a draft notice of proposed adjustment associated with transfer pricing positions for the IRS audit of Athena for the years ended December 31, 2011, December 31, 2012 and December 31, 2013. Athena was the originator of the patents associated with Tysabri® prior to the acquisition of Athena by Elan in 1996. The amount of adjustments that may be asserted by the IRS in the final notice of proposed adjustment cannot be quantified at this time; however, based on the draft notice received, the amount to be assessed may be material. We disagree with the IRS’s position as asserted in the draft notice of proposed adjustment and intend to contest it.
Perrigo Company plc - Item 1A
Risk Factors
There are numerous other income tax jurisdictions for which tax returns are not yet settled, none of which are individually significant. At this time, we cannot predict the outcome of any audit or related litigation. Unfavorable resolutions of the audit matters discussed above could have a material impact on our consolidated financial statements in future periods.
ITEM 2. UNREGISTERED SALES OF EQUITY SECURITIES AND USE OF PROCEEDS
Share repurchase activity during the three months ended September 30, 2017 was as follows:
|
| | | | | | | | | | | | | |
| | Total Number of Shares Purchased | | Average Price Paid per Share | | Total Number of Shares Purchased as Part of Publicly Announced Plans | | Value of Shares Available for Purchase(1) |
| July 2 - July 31, 2017 | 484,860 |
| | $ | 72.27 |
| | 484,860 |
| | |
| August 1 - August 31, 2017 | 1,354,721 |
| | $ | 71.46 |
| | 1,354,721 |
| | |
| September 1 - September 30, 2017 | 19,124 |
| | $ | 77.50 |
| | 19,124 |
| | |
| Total | 1,858,705 |
| | | | | | $ | 1.30 | billion |
(1) The remaining $1.30 billion in the table represents the amount available to be repurchased under our 2015 Authorization as of September 30, 2017.
ITEM 5.OTHER INFORMATION
Our Board
Rule 10b5-1 Trading Plans
During the three months ended March 30, 2024, no director or executive officer adopted, modified or terminated a "Rule 10b5-1 trading arrangement" or "non-Rule 10b5-1 trading arrangement", as each term is defined in Item 408(a) of Directors has established May 4, 2018 as the date of our 2018 Annual General Meeting of Shareholders (the “2018 Annual Meeting”). Because the date of the 2018 Annual Meeting will be more than 30 days before the anniversary of our 2017 Annual General Meeting of Shareholders, we are informing shareholders of the change in accordance with Rule 14a-5(f) under the Securities Exchange Act of 1934, as amended (the “Exchange Act”).Regulation S-K.
For shareholders who wish to present a proposal to be considered for inclusion in our proxy materials for the 2018 Annual Meeting, we have set a new deadline for the receipt of those proposals in accordance with Rule 14a-8 under the Exchange Act. To be considered timely, shareholders must submit their proposals, in writing, to our Company Secretary at our principal executive offices located at Treasury Building, Lower Grand Canal Street, Dublin 2, Ireland by December 19, 2017, which we have determined to be a reasonable time before we expect to begin to print and mail our proxy materials. Shareholder proposals must also comply with all applicable requirements of Rule 14a-8.
Because the 2018 Annual Meeting will be more than 30 days before the anniversary of the 2017 Annual General Meeting of Shareholders, our Articles of Association (the “Articles”) provide that shareholders who wish to bring a proposal or nominate a director at the 2018 Annual Meeting, but who are not requesting that the proposal or nomination be included in our proxy materials, must notify our Company Secretary, in writing, not earlier than the close of business on February 3, 2018 and not later than the close of business on February 23, 2018. Shareholders are advised to review the Articles, which contain additional requirements about advance notice of shareholder proposals and director nominations.
Perrigo Company plc - Part II - Item 6
Exhibits
ITEM 6. EXHIBITS
|
| | | | | | | | | | |
Exhibit Number | | Description | | Description
| | | |
| 3.1 | | | |
| | | |
| 3.2 | | | |
| | | |
10.110.1* | | | |
| | | |
10.222 | | | |
| | | |
10.331.1 | | |
| | |
10.4 | | |
| | |
10.5 | | |
| | |
31.1 | | | |
| | | |
| 31.2 | | | |
| | | |
| 32 | | | |
| | | |
| 101.INS | | |
| | | |
| 101. INS | | XBRL Instance Document.Document - the instance document does not appear in the Interactive Data File because its XBRL tags are embedded within the Inline XBRL document. | |
| | | |
| 101.SCH | | XBRL Taxonomy Extension Schema Document. | |
| | | |
| 101.CAL | | XBRL Taxonomy Extension Calculation Linkbase Document. | |
| | | |
| 101.DEF | | XBRL Taxonomy Extension Definition Linkbase Document. | |
| | | |
| 101.LAB | | XBRL Taxonomy Extension Label Linkbase Document. | |
| | | |
| 101.PRE | | XBRL Taxonomy Extension Presentation Linkbase Document. | |
| | | |
| 104 | | Cover Page Interactive Date File, formatted in Inline XBRL (contained in Exhibit 101). | |
| | | |
| | | |
| | | |
| | | |
| | | |
| | | |
| | | |
| | | |
| | | |
| | | |
| | | |
| | | |
*Denotes management contract or compensatory plan or arrangement.
SIGNATURES
Pursuant to the requirements of the Securities Exchange Act of 1934, the registrant has duly caused this report to be signed on its behalf by the undersigned thereunto duly authorized.
| | | | | | | | | | | |
| | | |
| | | PERRIGO COMPANY PLC |
| | | (Registrant) |
| | | |
| Date: | May 7, 2024 | | /s/ Patrick Lockwood-Taylor |
| Date: | November 9, 2017 | By: /s/ John T. HendricksonPatrick Lockwood-Taylor |
| | | John T. Hendrickson |
| | | Chief Executive Officer and President |
| | | (Principal Executive Officer) |
| | | |
| Date: | May 7, 2024 | | /s/ Eduardo Bezerra |
| Date: | November 9, 2017 | By: /s/ Ronald L. WinowieckiEduardo Bezerra |
| | | Ronald L. Winowiecki |
| | | Acting Chief Financial Officer |
| | | (Principal Accounting and Financial Officer) |