UNITED STATES
SECURITIES AND EXCHANGE COMMISSION
Washington, D.C. 20549
______________________________
FORM 10-Q
______________________________
|
| | | | |
| ý | QUARTERLY REPORT PURSUANT TO SECTION 13 OR 15(d) OF THE SECURITIES EXCHANGE ACT OF 1934 |
For the Quarterly Period Ended December 31, 20172018
or
|
| | | | |
| ¨ | TRANSITION REPORT PURSUANT TO SECTION 13 OR 15(d) OF THE SECURITIES EXCHANGE ACT OF 1934 |
001-36587
(Commission File Number)
_____________________________
Catalent, Inc.
(Exact name of registrant as specified in its charter)
_____________________________
|
| | | | | | | |
| Delaware | | 20-8737688 |
| (State or other jurisdiction of incorporation or organization) | | (I.R.S. Employer Identification No.) |
| | |
| 14 Schoolhouse Road, Somerset, NJ | | 08873 |
| (Address of principal executive offices) | | (Zip code) |
(732) 537-6200
Registrant's telephone number, including area code
______________________________
Indicate by check mark whether the registrant (1) has filed all reports required to be filed by Section 13 or 15(d) of the Securities Exchange Act of 1934 during the preceding 12 months (or for such shorter period that the registrant was required to file such reports), and (2) has been subject to such filing requirements for the past 90 days. Yes x No ¨
Indicate by check mark whether the registrant has submitted electronically and posted on its corporate Web site, if any, every Interactive Data File required to be submitted and posted pursuant to Rule 405 of Regulation S-T (§ 232.405 of this chapter) during the preceding 12 months (or for such shorter period that the registrant was required to submit and post such files). x Yes ¨ No
Indicate by check mark whether the registrant is a large accelerated filer, an accelerated filer, a non-accelerated filer, smaller reporting company or an emerging growth company. See the definitions of “large accelerated filer,” “accelerated filer,” “smaller reporting company,” and “emerging growth company” in Rule 12b-2 of the Exchange Act. |
| | | | | | | | | | | | | |
Large accelerated filer x | | | Accelerated filer ¨ | |
Non-accelerated filer ¨ | | (Do not check if a smaller reporting company) | Smaller reporting company ¨ | |
| | | Emerging growth company ¨ | |
If an emerging growth company, indicate by check mark if the registrant has elected not use the extended transition period for complying with any new or revised financial accounting standards provided pursuant to Section 13(a) of the Exchange Act. ¨
Indicate by check mark whether the registrant is a shell company (as defined in Rule 12b-2 of the Exchange Act). Yes ¨ No x
On February 2, 2018,1, 2019, there were 133,318,679145,632,701 shares of the Registrant's common stock, par value $0.01 per share, issued and outstanding.
CATALENT, INC. and Subsidiaries
INDEX TO FORM 10-Q
For the Three and Six Months Ended December 31, 20172018
| | | | | | | | |
| Item | | Page |
| | |
| Part I. | | |
| | |
| Item | | Page |
| | |
Part I. 1. | | |
| | |
Item 1. | | |
| | |
| | |
| | |
| | |
| | |
| | |
| | |
| | |
| | |
| | |
| | |
| | |
| | |
| Item 2. | | |
| | |
| Item 3. | | |
| | |
| Item 4. | | |
| | |
| Part II. | | |
| | |
| Item 1. | | |
| | |
| Item 1A. | | |
| | |
| Item 2. | | |
| | |
| Item 3. | | |
| | |
| Item 4. | | |
| | |
| Item 5. | | |
| | |
| Item 6. | | |
| | |
| | |
Special Note Regarding Forward-Looking Statements
In addition to historical information, this Quarterly Report on Form 10-Q may contain “forward-looking statements” within the meaning of Section 27A of the Securities Act of 1933, as amended (the “Securities Act”), and Section 21E of the Securities Exchange Act of 1934, as amended (the “Exchange Act”), which are subject to the “safe harbor” created by those sections. All statements, other than statements of historical facts, included in this Quarterly Report on Form 10-Q are forward-looking statements. In some cases, you can identify these forward-looking statements by the use of words such as “outlook,” “believes,” “expects,” “potential,” “continues,” “may,” “will,” “should,” “could,” “seeks,” “approximately,” “predicts,” “intends,” “plans,” “estimates,” “anticipates” or the negative version of these words or other comparable words.
These statements are based on assumptions and assessments made by our management in light of their experience and their perception of historical trends, current conditions, expected future developments, and other factors they believe to be appropriate. Any forward-looking statement is subject to various risks and uncertainties. Accordingly, there are or will be important factors that could cause actual outcomes or results to differ materially from those indicated in these statements.
Some of the factors that may cause actual results, developments and business decisions to differ materially from those contemplated by such forward-looking statements include, but are not limited to, those described under the section entitled “Risk Factors” in our Annual Report on Form 10-K for the fiscal year ended June 30, 20172018 (the "Fiscal 2018 10-K") and the following:
•We participate in a highly competitive market, and increased competition may adversely affect our business.
•The demand for our offerings depends in part on our customers’ research and development and the clinical and market success of their products. Our business, financial condition, and results of operations may be harmed if our customers spend less on, or are less successful in, these activities.
•We are subject to product and other liability risks that could exceed our anticipated costs or adversely affect our results of operations, financial condition, liquidity, and cash flows.
•Failure to comply with existing and future regulatory requirements could adversely affect our results of operations and financial condition or result in claims from customers.
•Failure to provide quality offerings to our customers could have an adverse effect on our business and subject us to regulatory actions or costly litigation.
•The services and offerings we provide are highly exacting and complex, and if we encounter problems providing the services or support required, our business could suffer.
•Our global operations are subject to economic, political, and regulatory risks, including the risks of changing regulatory standards or changing interpretations of existing standards, that could affect the profitability of our operations or require costly changes to our procedures.
•The referendum inexit of the United Kingdom (the "U.K.") and resulting decision of the U.K. government to consider exiting from the European Union could have future adverse effects on our operations, revenues, and costs, and therefore our profitability.
•If we do not enhance our existing or introduce new technology or service offerings in a timely manner, our offerings may become obsolete over time, customers may not buy our offerings, and our revenue and profitability may decline.
•We and our customers depend on patents, copyrights, trademarks, trade secrets, and other forms of intellectual property protections, but these protections may not be adequate.
•Our future results of operations are subject to fluctuations in the costs, availability, and suitability of the components of the products we manufacture, including active pharmaceutical ingredients, excipients, purchased components, and raw materials.
•Changes in market access or healthcare reimbursement for our customers’ products in the United States ("U.S.") or internationally, including possible changes to the possible repeal or replacement of theU.S. Affordable Care Act, in the United States, could adversely affect our results of operations and financial condition by affecting demand for our offerings.offerings or the financial health of our customers.
•As a global enterprise, fluctuations in the exchange rate of the U.S. dollar, our reporting currency, against foreign currencies could have a material adverse effect on our financial performance and results of operations.
The impact to our business of recently enacted U.S. tax legislation could differ materially from our current estimates.
•Tax legislative or regulatory initiatives or challenges to our tax positions could adversely affect our results of operations and financial condition.
•Our ability to use our net operating loss carryforwards and certain other tax attributes may be limited.
•Changes to the estimated future profitability of the business may require that we establish an additional valuation allowance against all or some portion of our net U.S. deferred tax assets.
•We are dependent on key personnel.
•We use advanced information and communication systems to run our operations, compile and analyze financial and operational data, and communicate among our employees, customers, and counter-parties, soand the risks generally associated with information and communications systems could adversely affect our results of operations. We are continuously working to install new, and upgrade existing, systems and provide employee awareness training around phishing, malware, and other cyber securitycyber-security risks to enhance the protections available to us, but such protections may be inadequate to address malicious attacks or inadvertent compromises of data security.
•We engage, from time to time, in acquisitions and other transactions that may complement or expand our business or divest of non-strategic businesses or assets. We may not be able to complete such transactions, and such transactions, if executed, pose significant risks, including risks relating to our ability to successfully and efficiently integrate acquisitions or execute on dispositions and realize anticipated benefits therefrom. The failure to execute or realize the full benefits from any such transaction could have a negative effect on our operations.
•Our offerings or our customers’ products may infringe on the intellectual property rights of third parties.
•We are subject to environmental, health, and safety laws and regulations, which could increase our costs and restrict our operations in the future.
•We are subject to labor and employment laws and regulations, which could increase our costs and restrict our operations in the future.
•Certain of our pension plans are underfunded, and additional cash contributions we may make to increase the funding level will reduce the cash available for our business, such as the payment of our interest expense.
•Our substantial leverage could adversely affect our ability to raise additional capital to fund our operations, limit our ability to react to changes in the economy or in our industry, expose us to interest-rate risk to the extent of our variable rate debt, and prevent us from meeting our obligations under our indebtedness.
We caution you that the risks, uncertainties and other factors referenced above may not contain all of the risks, uncertainties, and other factors that are important to you. In addition, we cannot assure you that we will realize the results, benefits, or developments that we expect or anticipate or, even if substantially realized, that they will result in the consequences or affect us or our business in the way expected. There can be no assurance that (i) we have correctly measured or identified all of the factors affecting our business or the extent of these factors’ likely impact, (ii) the available information with respect to these factors on which such analysis is based is complete or accurate, (iii) such analysis is correct, or (iv) our strategy, which is based in part on this analysis, will be successful. All forward-looking statements in this report apply only as of the date of this report or as of the date they were made, and we undertake no obligation to publicly update or review any forward-looking statement, whether as a result of new information, future developments, or otherwise, except as required by law.
Social Media
We use our website (www.catalent.com), our corporate Facebook page (https://www.facebook.com/CatalentPharmaSolutions), and our corporate Twitter account (@catalentpharma) as channels for the distribution of
information. The information we post through these channels may be deemed material. Accordingly, investors should monitor these channels, in addition to following our press releases, Securities and Exchange Commission ("SEC") filings, and public conference calls and webcasts. The contents of our website and social media channels are not, however, a part of this report.
PART I. FINANCIAL INFORMATION
| |
Item 1. | Item 1. FINANCIAL STATEMENTS |
Catalent, Inc. and Subsidiaries
Consolidated Statements of Operations
(Unaudited; Dollars in millions, except per share data)
| | | | Three Months Ended
December 31, | | Six Months Ended
December 31, | | Three Months Ended
December 31, | | | Six Months Ended
December 31, | |
| | 2017 | | 2016 | | 2017 | | 2016 | | 2018 | | 2017 | | 2018 | | 2017 |
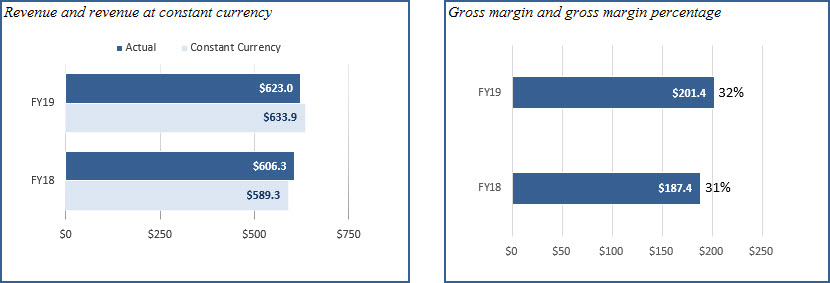
| Net revenue | $ | 606.3 |
| | $ | 483.7 |
| | $ | 1,150.2 |
| | $ | 925.9 |
| Net revenue | $ | 623.0 | | $ | 606.3 | | $ | 1,174.8 | | $ | 1,150.2 |
| Cost of sales | 418.9 |
| | 335.8 |
| | 822.7 |
| | 653.9 |
| Cost of sales | 421.6 | | 418.9 | | 824.9 | | 822.7 |
| Gross margin | 187.4 |
| | 147.9 |
| | 327.5 |
| | 272.0 |
| Gross margin | 201.4 | | 187.4 | | 349.9 | | 327.5 |
| Selling, general and administrative expenses | 114.3 |
| | 96.2 |
| | 221.3 |
| | 194.4 |
| |
| Selling, general, and administrative expenses | | Selling, general, and administrative expenses | 123.2 | | 114.8 | | 238.7 | | 222.3 |
| Impairment charges and (gain)/loss on sale of assets | 4.2 |
| | 0.5 |
| | 4.2 |
| | 0.5 |
| Impairment charges and (gain)/loss on sale of assets | (0.1) | | 4.2 | | 2.8 | | 4.2 |
| Restructuring and other | 0.1 |
| | 3.3 |
| | 1.3 |
| | 4.4 |
| Restructuring and other | 0.1 | | 0.1 | | 9.8 | | 1.3 |
| | Operating earnings | 68.8 |
| | 47.9 |
| | 100.7 |
| | 72.7 |
| Operating earnings | 78.2 | | 68.3 | | 98.6 | | 99.7 |
| Interest expense, net | 27.2 |
| | 22.8 |
| | 51.5 |
| | 44.9 |
| Interest expense, net | 25.5 | | 27.2 | | 53.6 | | 51.5 |
| Other expense/(income), net | 13.6 |
| | (1.8 | ) | | 19.3 |
| | (3.9 | ) | |
| Earnings from continuing operations, before income taxes | 28.0 |
| | 26.9 |
| | 29.9 |
| | 31.7 |
| |
| Other expense, net | | Other expense, net | 1.4 | | 13.1 | | 7.1 | | 18.3 |
| Earnings from continuing operations before income taxes | | Earnings from continuing operations before income taxes | 51.3 | | 28.0 | | 37.9 | | 29.9 |
| Income tax expense | 49.9 |
| | 9.5 |
| | 48.0 |
| | 9.7 |
| Income tax expense | 2.3 | | 49.9 | | 3.3 | | 48.0 |
| | Net earnings/(loss) | $ | (21.9 | ) | | $ | 17.4 |
| | $ | (18.1 | ) | | $ | 22.0 |
| Net earnings/(loss) | $ | 49.0 | | $ | (21.9) | | $ | 34.6 | | $ | (18.1) |
| | | | | | | | | |
| | | | | | | | | |
| Earnings per share: | | | | | | | | |
| | | Earnings/(loss) per share: | | Earnings/(loss) per share: | |
| Basic | | | | | | | | Basic | |
| | Net earnings/(loss) | $ | (0.16 | ) | | $ | 0.14 |
| | $ | (0.14 | ) | | $ | 0.18 |
| Net earnings/(loss) | $ | 0.34 | | $ | (0.16) | | $ | 0.24 | | $ | (0.14) |
| Diluted | | |
|
| | | |
|
| Diluted | | | | |
| | Net earnings/(loss) | $ | (0.16 | ) | | $ | 0.14 |
| | $ | (0.14 | ) | | $ | 0.17 |
| Net earnings/(loss) | $ | 0.33 | | $ | (0.16) | | $ | 0.24 | | $ | (0.14) |
The accompanying notes are an integral part of these unaudited consolidated financial statements.
Catalent, Inc. and Subsidiaries
Consolidated Statements of Comprehensive Income/(Loss)
(Unaudited; Dollars in millions)
| | | | Three Months Ended
December 31, | | Six Months Ended
December 31, | | Three Months Ended
December 31, | | | Six Months Ended
December 31, | |
| | 2017 | | 2016 | | 2017 | | 2016 | | 2018 | | 2017 | | 2018 | | 2017 |
| Net earnings/(loss) | $ | (21.9 | ) | | $ | 17.4 |
| | $ | (18.1 | ) | | $ | 22.0 |
| Net earnings/(loss) | $ | 49.0 | | $ | (21.9) | | $ | 34.6 | | $ | (18.1) |
| Other comprehensive income/(loss), net of tax | | | | | | | | Other comprehensive income/(loss), net of tax | |
| Foreign currency translation adjustments | (13.4 | ) | | (64.4 | ) | | 24.7 |
| | (63.8 | ) | Foreign currency translation adjustments | (17.6) | | (13.4) | | (26.4) | | 24.7 |
| Pension and other post-retirement adjustments | 0.5 |
| | 0.7 |
| | 0.9 |
| | 1.5 |
| Pension and other post-retirement adjustments | 0.6 | | 0.5 | | 1.0 | | 0.9 |
| Available for sale investments | (3.0 | ) | | 15.3 |
| | (6.4 | ) | | 15.3 |
| Available for sale investments | — | | (3.0) | | — | | (6.4) |
| | Other comprehensive income/(loss), net of tax | (15.9 | ) | | (48.4 | ) | | 19.2 |
| | (47.0 | ) | Other comprehensive income/(loss), net of tax | (17.0) | | (15.9) | | (25.4) | | 19.2 |
| Comprehensive income/(loss) | $ | (37.8 | ) | | $ | (31.0 | ) | | $ | 1.1 |
| | $ | (25.0 | ) | Comprehensive income/(loss) | $ | 32.0 | | $ | (37.8) | | $ | 9.2 | | $ | 1.1 |
|
The accompanying notes are an integral part of these unaudited consolidated financial statements.
Catalent, Inc. and Subsidiaries
Consolidated Balance Sheets
(Unaudited; Dollars in millions, except share and per share data)
| | | | December 31,
2017 | | June 30,
2017 | | December 31,
2018 | | June 30,
2018 |
| ASSETS | | | | ASSETS | | | |
| Current assets: | | | | Current assets: | |
| Cash and cash equivalents | $ | 329.5 |
| | $ | 288.3 |
| Cash and cash equivalents | $ | 207.9 | | $ | 410.2 |
| Trade receivables, net | 427.9 |
| | 488.8 |
| Trade receivables, net | 551.3 | | 555.8 |
| Inventories | 212.7 |
| | 184.9 |
| Inventories | 235.2 | | 209.1 |
| Prepaid expenses and other | 105.4 |
| | 97.8 |
| Prepaid expenses and other | 77.1 | | 65.2 |
| Total current assets | 1,075.5 |
| | 1,059.8 |
| Total current assets | 1,071.5 | | 1,240.3 |
| Property, plant, and equipment, net | 1,256.2 |
| | 995.9 |
| Property, plant, and equipment, net | 1,285.8 | | 1,270.6 |
| Other assets: | | | | Other assets: | |
| Goodwill | 1,408.3 |
| | 1,044.1 |
| Goodwill | 1,421.4 | | 1,397.2 |
| Other intangibles, net | 582.0 |
| | 273.1 |
| Other intangibles, net | 581.0 | | 544.9 |
| Deferred income taxes | 34.3 |
| | 53.9 |
| Deferred income taxes | 31.7 | | 32.9 |
| Other | 30.8 |
| | 27.5 |
| Other | 50.2 | | 45.2 |
| Total assets | $ | 4,387.1 |
| | $ | 3,454.3 |
| Total assets | $ | 4,441.6 | | $ | 4,531.1 |
| | | | | | | | |
| LIABILITIES AND SHAREHOLDERS' EQUITY | |
| LIABILITIES AND SHAREHOLDER’S DEFICIT | | LIABILITIES AND SHAREHOLDER’S DEFICIT | |
| Current liabilities: | | | | Current liabilities: | |
| Current portion of long-term obligations and other short-term borrowings | $ | 69.9 |
| | $ | 24.6 |
| Current portion of long-term obligations and other short-term borrowings | $ | 69.9 | | $ | 71.9 |
| Accounts payable | 164.3 |
| | 163.2 |
| Accounts payable | 184.4 | | 192.1 |
| Other accrued liabilities | 249.8 |
| | 281.2 |
| Other accrued liabilities | 260.0 | | 312.9 |
| Total current liabilities | 484.0 |
| | 469.0 |
| Total current liabilities | 514.3 | | 576.9 |
| Long-term obligations, less current portion | 2,672.5 |
| | 2,055.1 |
| Long-term obligations, less current portion | 2,130.0 | | 2,649.4 |
| Pension liability | 127.3 |
| | 129.5 |
| Pension liability | 129.6 | | 131.6 |
| Deferred income taxes | 40.7 |
| | 31.7 |
| Deferred income taxes | 50.1 | | 32.5 |
| Other liabilities | 57.1 |
| | 45.5 |
| Other liabilities | 54.6 | | 54.0 |
| Commitment and contingencies (see Note 13) | | | | |
| Commitment and contingencies (see Note 14) | | Commitment and contingencies (see Note 14) | |
| | | | | |
| Shareholders' equity/(deficit): | | | | |
| Common stock $0.01 par value; 1.0 billion shares authorized on December 31, 2017 and June 30, 2017, 133,318,039 and 125,049,867 issued and outstanding on December 31, 2017 and June 30, 2017, respectively. | 1.3 |
| | 1.3 |
| |
| Preferred stock $0.01 par value; 100 million authorized on December 31, 2017 and June 30, 2017, 0 issued and outstanding on December 31, 2017 and June 30, 2017. | — |
| | — |
| |
| Shareholders' equity: | | Shareholders' equity: | |
| Common stock $0.01 par value; 1.0 billion shares authorized on December 31, 2018 and June 30, 2018, 145,622,900 and 133,423,628 issued and outstanding on December 31, 2018 and June 30, 2018, respectively. | | Common stock $0.01 par value; 1.0 billion shares authorized on December 31, 2018 and June 30, 2018, 145,622,900 and 133,423,628 issued and outstanding on December 31, 2018 and June 30, 2018, respectively. | 1.5 | | 1.3 |
| Preferred stock $0.01 par value; 100 million authorized on December 31, 2018 and June 30, 2018, 0 issued and outstanding on December 31, 2018 and June 30, 2018. | | Preferred stock $0.01 par value; 100 million authorized on December 31, 2018 and June 30, 2018, 0 issued and outstanding on December 31, 2018 and June 30, 2018. | — | | — |
| | Additional paid in capital | 2,272.9 |
| | 1,992.0 |
| Additional paid in capital | 2,735.1 | | 2,283.3 |
| Accumulated deficit | (973.8 | ) | | (955.7 | ) | Accumulated deficit | (822.4) | | (872.1) |
| Accumulated other comprehensive income/(loss) | (294.9 | ) | | (314.1 | ) | Accumulated other comprehensive income/(loss) | (351.2) | | (325.8) |
| Total shareholders' equity | 1,005.5 |
| | 723.5 |
| |
| Total liabilities and shareholders' equity | $ | 4,387.1 |
| | $ | 3,454.3 |
| |
| | Total shareholder's equity | | Total shareholder's equity | 1,563.0 | | 1,086.7 |
| Total liabilities and shareholder’s equity | | Total liabilities and shareholder’s equity | $ | 4,441.6 | | $ | 4,531.1 |
The accompanying notes are an integral part of these unaudited consolidated financial statements.
Catalent, Inc. and Subsidiaries
Consolidated Statement of Changes in Shareholders' Equity/(Deficit)
(Unaudited; Dollars in millions, except share data in thousands)
|
| | | | | | | | | | | | | | | | | | | | | | |
| | Shares of Common Stock | | Common Stock | | Additional
Paid in
Capital | | Accumulated Deficit | | Accumulated Other Comprehensive Income/(Loss) | | Total Shareholders' Equity/ (Deficit) |
| Balance at June 30, 2017 | 125,049.9 |
| | $ | 1.3 |
| | $ | 1,992.0 |
| | $ | (955.7 | ) | | $ | (314.1 | ) | | $ | 723.5 |
|
| Equity offering, sale of common stock | 7,354.2 |
| | — |
| | 277.8 |
| | | | | | 277.8 |
|
Share issuances related to equity-based compensation | 913.9 |
| |
| | | | | | | | — |
|
| Equity compensation | | | | | 15.5 |
| | | | | | 15.5 |
|
Cash paid, in lieu of equity, for tax withholding | | | | | (12.4 | ) | | | | | | (12.4 | ) |
| Net earnings/(loss) | | | | | | | (18.1 | ) | | | | (18.1 | ) |
Other comprehensive income/(loss), net tax | | | | | | | | | 19.2 |
| | 19.2 |
|
| Balance at December 31, 2017 | 133,318.0 |
| | $ | 1.3 |
| | $ | 2,272.9 |
| | $ | (973.8 | ) | | $ | (294.9 | ) | | $ | 1,005.5 |
|
| | | | | | | | | | | | | | | | | | | | | | | | | | | | | | | | | | | | | | | |
| Shares of Common Stock | | Common Stock | | Additional
Paid in
Capital | | | | Accumulated Deficit | | Accumulated Other Comprehensive Income/(Loss) | | | | Total Shareholders' Equity/ (Deficit) |
| Balance at June 30, 2018 | 133,423.6 | | $ | 1.3 | | $ | 2,283.3 | | | | $ | (872.1) | | $ | (325.8) | | | | $ | 1,086.7 |
| Cumulative effect of change in accounting for ASC 606, net of tax | | | | | | | | | 15.1 | | | | | | 15.1 |
| Equity offering, sale of common stock | 11,431.4 | | 0.1 | | 445.4 | | | | | | | | | | 445.5 |
| | | | | | | | | | | | | | | |
Share issuances related to stock-based compensation | 767.9 | | 0.1 | | (0.1) | | | | | | | | | | — |
| Stock-based compensation | | | | | 17.5 | | | | | | | | | | 17.5 |
Cash paid, in lieu of equity, for tax withholding | | | | | (11.0) | | | | | | | | | | (11.0) |
| | | | | | | | | | | | | | | |
| Net earnings | | | | | | | | | 34.6 | | | | | | 34.6 |
Other comprehensive income/(loss), net of
tax | | | | | | | | | | | (25.4) | | | | (25.4) |
| Balance at December 31, 2018 | 145,622.9 | | $ | 1.5 | | $ | 2,735.1 | | | | $ | (822.4) | | $ | (351.2) | | | | $ | 1,563.0 |
The accompanying notes are an integral part of these unaudited consolidated financial statements.
Catalent, Inc. and Subsidiaries
Consolidated Statements of Cash Flows
(Unaudited; Dollars in millions)
| | | | | | | | | | | |
| Six Months Ended
December 31, | | |
| 2018 | | 2017 |
| CASH FLOWS FROM OPERATING ACTIVITIES: | | | |
| Net earnings/(loss) | $ | 34.6 | | $ | (18.1) |
| | | |
| | | |
| Adjustments to reconcile earnings/(loss) from operations to net cash from operations: | | | |
| Depreciation and amortization | 107.5 | | 85.8 |
| Non-cash foreign currency transaction (gain)/loss, net | 3.2 | | 7.1 |
| Amortization and write-off of debt financing costs | 6.1 | | 2.5 |
| Asset impairments charges and (gain)/loss on sale of assets | 2.8 | | 4.2 |
| | | |
| Reclassification of financing fees paid | — | | 11.8 |
| Stock-based compensation | 17.5 | | 15.5 |
| Provision/(benefit) for deferred income taxes | (0.1) | | 35.6 |
| Provision for bad debts and inventory | 5.1 | | 3.5 |
| Change in operating assets and liabilities: | | | |
| Decrease/(increase) in trade receivables | 3.1 | | 104.6 |
| Decrease/(increase) in inventories | (26.0) | | — |
| Increase/(decrease) in accounts payable | (11.3) | | (0.4) |
Other assets/accrued liabilities, net — current and non-current | (58.0) | | (76.1) |
| | | |
| | | |
| Net cash provided by operating activities | 84.5 | | 176.0 |
| CASH FLOWS FROM INVESTING ACTIVITIES: | | | |
| Acquisition of property and equipment and other productive assets | (81.3) | | (82.9) |
| Proceeds from sale of property and equipment | — | | 1.8 |
| Proceeds from sale of subsidiaries | — | | 3.4 |
| | | |
| Payment for acquisitions, net of cash acquired | (127.5) | | (748.0) |
| | | |
| | | |
| Net cash (used in) investing activities | (208.8) | | (825.7) |
| CASH FLOWS FROM FINANCING ACTIVITIES: | | | |
| Net change in other borrowings | (4.9) | | (0.6) |
| | | |
| Proceeds from borrowing, net | — | | 442.6 |
| Payments related to long-term obligations | (503.4) | | (9.4) |
| Financing fees paid | — | | (15.6) |
| | | |
| Proceeds from sale of common stock, net | 445.5 | | 277.8 |
| Cash paid, in lieu of equity, for tax-withholding obligations | (11.0) | | (12.4) |
| | | |
| | | |
| Net cash (used in)/provided by financing activities | (73.8) | | 682.4 |
| Effect of foreign currency exchange on cash | (4.2) | | 8.5 |
| NET INCREASE/(DECREASE) IN CASH AND EQUIVALENTS | (202.3) | | 41.2 |
| CASH AND EQUIVALENTS AT BEGINNING OF PERIOD | 410.2 | | 288.3 |
| CASH AND EQUIVALENTS AT END OF PERIOD | $ | 207.9 | | $ | 329.5 |
| SUPPLEMENTARY CASH FLOW INFORMATION: | | | |
| Interest paid | $ | 52.2 | | $ | 41.5 |
| Income taxes paid, net | $ | 24.4 | | $ | 8.0 |
|
| | | | | | | |
| | Six Months Ended
December 31, |
| | 2017 | | 2016 |
| CASH FLOWS FROM OPERATING ACTIVITIES: | | | |
| Net earnings/(loss) | $ | (18.1 | ) | | $ | 22.0 |
|
| Adjustments to reconcile earnings from continued operations to net cash from operations: | | | |
| Depreciation and amortization | 85.8 |
| | 71.3 |
|
| Non-cash foreign currency transaction (gain)/loss, net | 7.1 |
| | (3.4 | ) |
| Amortization and write off of debt financing costs | 2.5 |
| | 4.3 |
|
| Asset impairments and (gain)/loss on sale of assets | 4.2 |
| | 0.5 |
|
| Reclassification of financing fees paid | 11.8 |
| | — |
|
| Equity compensation | 15.5 |
| | 11.8 |
|
| Provision/(benefit) for deferred income taxes | 35.6 |
| | 0.9 |
|
| Provision for bad debts and inventory | 3.5 |
| | 3.3 |
|
| Change in operating assets and liabilities: | | | |
| Decrease/(increase) in trade receivables | 104.6 |
| | 41.4 |
|
| Decrease/(increase) in inventories | — |
| | (17.9 | ) |
| Increase/(decrease) in accounts payable | (0.4 | ) | | (14.6 | ) |
| Other assets/accrued liabilities, net - current and non-current | (76.1 | ) | | (23.6 | ) |
| Net cash provided by operating activities | 176.0 |
| | 96.0 |
|
| CASH FLOWS FROM INVESTING ACTIVITIES: | | | |
| Acquisition of property and equipment and other productive assets | (82.9 | ) | | (54.1 | ) |
| Proceeds from sale of property and equipment | 1.8 |
| | 1.3 |
|
| Proceeds from sale of subsidiaries | 3.4 |
| | — |
|
| Payment for acquisitions, net of cash acquired | (748.0 | ) | | (85.7 | ) |
| Net cash (used in) investing activities | (825.7 | ) | | (138.5 | ) |
| CASH FLOWS FROM FINANCING ACTIVITIES: | | | |
| Net change in other borrowings | (0.6 | ) | | (5.6 | ) |
| Proceeds from borrowing, net | 442.6 |
| | 397.4 |
|
| Payments related to long-term obligations | (9.4 | ) | | (209.2 | ) |
| Financing fees paid | (15.6 | ) | | (6.4 | ) |
| Proceeds from sale of common stock, net | 277.8 |
| | — |
|
| Cash paid, in lieu of equity, for tax withholding obligations | (12.4 | ) | | (0.5 | ) |
| Net cash provided by financing activities | 682.4 |
| | 175.7 |
|
| Effect of foreign currency on cash | 8.5 |
| | (9.0 | ) |
| NET INCREASE/(DECREASE) IN CASH AND EQUIVALENTS | 41.2 |
| | 124.2 |
|
| CASH AND EQUIVALENTS AT BEGINNING OF PERIOD | 288.3 |
| | 131.6 |
|
| CASH AND EQUIVALENTS AT END OF PERIOD | $ | 329.5 |
| | $ | 255.8 |
|
| SUPPLEMENTARY CASH FLOW INFORMATION: | | | |
| Interest paid | $ | 41.5 |
| | $ | 39.4 |
|
| Income taxes paid, net | $ | 8.0 |
| | $ | 19.7 |
|
The accompanying notes are an integral part of these unaudited consolidated financial statements.
Catalent, Inc. and Subsidiaries
Notes to Unaudited Consolidated Financial Statements
| |
1. | BASIS OF PRESENTATION AND SUMMARY OF SIGNIFICANT ACCOUNTING POLICIES |
1. BASIS OF PRESENTATION AND SUMMARY OF SIGNIFICANT ACCOUNTING POLICIES
Business
Catalent, Inc. (“Catalent”("Catalent" or the “Company”"Company") directly and wholly owns PTS Intermediate Holdings LLC (“("Intermediate Holdings”Holdings"). Intermediate Holdings directly and wholly owns Catalent Pharma Solutions, Inc. (“("Operating Company”Company"). The financial results of Catalent are comprised of the financial results of Operating Company and its subsidiaries on a consolidated basis.
Basis of Presentation
The accompanying unaudited consolidated financial statements have been prepared in accordance with generally accepted accounting principles in the United States (“GAAP”("GAAP") for interim financial information and with the instructions to Form 10-Q and Article 10 of Regulation S-X. Accordingly, they do not include all of the information and notes required by GAAP for complete financial statements. In the opinion of management, all adjustments (consisting of normal recurring adjustments) considered necessary for a fair presentation have been included. Operating results for the six months ended December 31, 20172018 are not necessarily indicative of the results that may be expected for the year ending June 30, 2018.2019. The consolidated balance sheet at June 30, 20172018 has been derived from the audited consolidated financial statements at that date but does not include all of the information and footnotes required by GAAP for complete financial statements. For further information on the Company's accounting policies and footnotes, refer to the consolidated financial statements and footnotes thereto included in the Company’s Annual Report on Form 10-K for the year ended June 30, 20172018 filed with the Securities and Exchange Commission ("SEC"(the "SEC").
UseIn fiscal 2018, the Company engaged in a business reorganization to better align its internal business unit structure with its "Follow the Molecule" strategy and the increased focus on its biologics-related offerings. Under the revised structure, the Company created two new operating segments from the former Drug Delivery Solutions segment:
•Biologics and Specialty Drug Delivery, which encompasses biologic cell-line development and manufacturing, development and manufacturing services for blow-fill-seal unit doses, prefilled syringes, vials, and cartridges; analytical development and testing services for large molecules; and development and manufacturing for inhaled products for delivery via metered dose inhalers, dry powder inhalers, and intra-nasal sprays; and
•Oral Drug Delivery, which encompasses comprehensive formulation development, manufacturing, and analytical development capabilities using advanced processing technologies such as bioavailability enhancement, controlled release, particle size engineering, and taste-masking for solid oral-dose forms.
Each of Estimates
the two new segments reports through a separate management team and ultimately reports to the Company's Chief Executive Officer who is designated as the Chief Operating Decision Maker for segment reporting purposes. The preparation of financial statementsCompany's operating segments are the same as its reporting segments. All prior-period comparative segment information has been restated to reflect the current reportable segments in conformityaccordance with GAAP requires management to make estimates and assumptions that affect amounts reported in the financial statements and accompanying notes. Such estimates include, but are not limited to, allowance for doubtful accounts, inventory and long-lived asset valuation, goodwill and other intangible asset valuation and impairment, equity-based compensation, income taxes, and pension plan asset and liability valuation. Actual amounts may differ from these estimated amounts.Accounting Standards Codification ("ASC") 280, Segment Reporting.
Foreign Currency Translation
The financial statements of the Company’s operations outside the U.S. are generally measured using the local currency as the functional currency. Adjustments to translate the assets and liabilities of these foreign operations into U.S. dollars are accumulated as a component of other comprehensive income/(loss) utilizing period-end exchange rates. The currency fluctuations related to certain long-term inter-company loans deemed to not be repayable in the foreseeable future have been recorded within cumulative translation adjustment,In June 2018, as a component of other comprehensive income/(loss). In addition, the currency fluctuation associated with the portionresult of the Company’s euro-denominated debt designatedthree-year cumulative consumer price index exceeding 100%, Argentina was classified as having a net investment hedge is included as a component of other comprehensive income/(loss). Foreign currency transaction gains and losses calculated by utilizing weighted average exchange rates forhighly inflationary economy. Beginning on July 1, 2018, the period are included in the consolidated statements of operations in the other (income)/expense, net line item. Foreign currency translation gains and losses generated from inter-company loans that are long-term in nature, but may be repayable in the foreseeable future, are also recorded within the other (income)/expense, net line item on the consolidated statements of operations.
Revenue Recognition
In accordance with Accounting Standards Codification ("ASC") 605 Revenue Recognition, the Company recognizes revenue when persuasive evidence of an arrangement exists, product delivery has occurred or the services have been rendered, the price is fixed or determinable and collectability is reasonably assured. In cases where the Company has multiple contracts with the same customer, the Company evaluates those contracts to assess if the contracts are linked or are separate arrangements. Factors the Company considers include the timing of negotiation, interdependency with other contracts or elements and payment terms. The Company and its customers generally view each contract discussion as a separate arrangement.
Manufacturing and packaging service revenue is recognized upon delivery of the product in accordance with the terms of the contract, which specify when transfer of title and risk of loss occurs. Some of the Company’s manufacturing contracts with
its customers have annual minimum purchase requirements. At the end of the contract year, revenue is recognized for the unfilled purchase obligation in accordance with the contract terms. Development service contracts generally take the form of a fee-for-service arrangement. After the Company has evidence of an arrangement, the price is determinable and there is a reasonable expectation regarding payment, the Company recognizes revenue at the point in time the service obligation is completed and accepted by the customer. Examples of output measures include a formulation report, analytical and stability testing, clinical batch production or packaging and the storage and distribution of a customer’s clinical trial material. Development service revenue is primarily driven by the Company’s Drug Delivery Solutions segment.
Arrangements containing multiple elements, including service arrangements, are accounted for in accordance with the provisions of ASC 605-25Revenue Recognition—Multiple-Element Arrangements. The Company determines the separate units of account in accordance with ASC 605-25. If the deliverable meets the criteria of a separate unit of accounting, the arrangement consideration is allocated to each element based upon its relative selling price. In determining the best evidence of selling price of a unit of account, the Company utilizes vendor-specific objective evidence (“VSOE”), which is the price the Company charges when the deliverable is sold separately. When VSOE is not available, management uses relevant third-party evidence (“TPE”) of selling price, if available. When neither VSOE nor TPE of selling price exists, management uses its best estimate of selling price.
Goodwill
The Company accounts for purchased goodwill and intangible assets with indefinite lives in accordance with ASC 350 Goodwill, Intangible and Other Assets. Under ASC 350, goodwill and intangible assets with indefinite lives are not amortized, but instead are tested for impairment at least annually. The Company's annual goodwill impairment test was conductedits Argentine operations as of April 1, 2017. The Company assesses goodwill for possible impairment by comparing the carrying value of its reporting units to their fair values. The Company determines the fair value of its reporting units utilizing estimated future discounted cash flows and incorporates assumptions that it believes marketplace participants would utilize. In addition, the Company uses comparative market information and other factors to corroborate the discounted cash flow results.
Property and Equipment and Other Definite Lived Intangible Assets
Property and equipment are stated at cost. Depreciation expense is computed using the straight-line method over the estimated useful lives of the assets, including capital lease assets that are amortized over the shorter of their useful lives or the terms of the respective leases. The Company generally uses the following ranges of useful lives for its property and equipment categories: buildings and improvements — 5 to 50 years; machinery and equipment — 3 to 10 years; and furniture and fixtures — 3 to 7 years. Depreciation expense was $30.7 million and $58.3 million for the three and six months ended December 31, 2017, respectively, and $24.4 million and $49.2 million for the three and six months ended December 31, 2016, respectively. Depreciation expense includes amortization of assets related to capital leases. The Company charges repairs and maintenance costs to expense as incurred. The amount of capitalized interest was immaterial for all periods presented.
Intangible assets with finite lives, primarily including customer relationships, patents and trademarks are amortized over their useful lives. The Company evaluates the recoverability of its other long-lived assets, including amortizing intangible assets, if circumstances indicate impairment may have occurred pursuant to ASC 360 Property, Plant and Equipment. This analysis is performed by comparing the respective carrying values of the assets to the current and expected future cash flows, on an un-discounted basis, to be generated from such assets. If such analysis indicates that the carrying value of these assets is not recoverable, the carrying value of such assets is reduced to fair value through a charge to the consolidated statements of operations. Fair value is determined based on assumptions the Company believes marketplace participants would utilize and comparable marketplace information in similar arm's length transactions. Impairment charges related to definite lived intangible assets and property, plant and equipment were not material for the three and six months ended December 31, 2017 and 2016.highly inflationary.
Research and Development Costs
The Company expenses research and development costs as incurred. Costs incurred in connection with the development of new offerings and manufacturing process improvements are recorded within selling, general, and administrative expenses. Such research and development costs included in selling, general, and administrative expenses amounted to $1.5$1.0 million and $1.5 million for the three and six months ended December 31, 2018, respectively, and $1.5 million and $3.3 million for the three and six months ended December 31, 2017,, respectively, and $1.5 million and $3.0 million for the three and six months ended December 31, 2016, respectively. Costs incurred in connection with research and
development services the Company provides to customers and services performed in support of the commercial manufacturing process for customers are recorded within cost of sales. Such research and development costs included in cost of sales amounted to $12.4$14.3 million and $25.6 million for the three and six months ended December 31, 2018, respectively, and $12.4 million and $22.4 million for the three and six months ended December 31, 2017,, respectively, and $11.0 million and $21.3 million for the three and six months ended December 31, 2016, respectively.
Earnings / (Loss) Per Share
The Company reports net earnings/(loss) per share in accordance with ASC 260Earnings per Share. Under ASC 260, basic earnings per share, which excludes dilution, is computed by dividing net earnings or loss available to common stockholders by the weighted average number of common shares outstanding for the period. Diluted earnings per share reflects the potential dilution caused by securities that could be exercised or converted into common shares, and is computed by dividing net earnings or loss available to common stockholders by the weighted average of common shares outstanding plus the dilutive potential common shares. Diluted earnings per share includes in-the-money stock options, restricted stock units, and unvested restricted stock using the treasury stock method. During a loss period, the assumed exercise of in-the-money stock options has an anti-dilutive effect, and, therefore, these instruments are excluded from the computation of diluted earnings per share.
Equity-Based Compensation
The Company accounts for its equity-based compensation awards pursuant to ASC 718 Compensation—Stock Compensation. ASC 718 requires companies to recognize compensation expense using a fair value based method for costs related to share-based payments including stock options and restricted stock units. The expense is measured based on the grant date fair value of the awards, and the expense is recorded over the applicable requisite service period using the accelerated attribution method. Forfeitures are recognized as and when they occur. In the absence of an observable market price for a share-based award, the fair value is based upon a valuation methodology that takes into consideration various factors, including the exercise price of the award, the expected term of the award, the current price of the underlying shares, the expected volatility of the underlying share price based on peer companies, the expected dividends on the underlying shares and the risk-free interest rate.
The terms of the Company’s equity-based compensation plans permit an employee holding vested stock options to elect to have the Company withhold a portion of the shares otherwise issuable upon the employee's exercise of the option, a so-called "net settlement transaction," as a means of paying the exercise price meeting tax withholding requirements, or both.
Marketable Securities
Marketable securities consist of investments that have a readily determinable fair value based on quoted market price of the investment, which is considered a Level 1 fair value measurement. Under ASC 320, Investments—Debt and Equity Securities, these investments are classified as available-for-sale and are reported at fair value in other current assets on the Company's consolidated balance sheet. Unrealized holding gains and losses are reported within accumulated other comprehensive income/(loss). Under the Company's accounting policy, a decline in the fair value of marketable securities is deemed to be "other than temporary" and such marketable securities are generally considered to be impaired if their fair value is less than the Company's cost basis for a period based on the particular facts and circumstances surrounding the investment. If a decline in the fair value of a marketable security below the Company's cost basis is determined to be other than temporary, such marketable security is written down to its estimated fair value as a new cost basis and the amount of the write-down is included in earnings as an impairment charge.
Recent Financial Accounting Standards
Recently Adopted Accounting Standards
In July 2015,May 2014, the Financial Accounting StandardsStandard Board (the "FASB"("FASB") issued Accounting Standards Update ("ASU") 2015-11, Simplifying the Measurement of Inventory2014-09, Revenue from Contracts with Customers, which was codified as ASC 606 and superseded nearly all existing revenue-recognition guidance. The guidance’s core principle is that a company will recognize revenue when it transfers promised goods or services to customers in an amount that reflects the consideration to which the company expects to be entitled in exchange for those goods or services. In doing so, the guidance creates a five-step model that requires an entitya company to measure inventory at lowerexercise judgment when considering the terms of costthe contracts and net realizable value. Net realizable valueall relevant facts and circumstances. The five steps require a company to identify customer contracts, identify the separate performance obligations, determine the transaction price, allocate the transaction price to the separate performance obligations, and recognize revenue when or as each performance obligation is satisfied. The guidance allows for either full retrospective adoption, where the estimated selling pricesstandard is applied to all periods presented, or modified retrospective adoption, where the standard is applied only to the most current period presented in the ordinary course of business, less reasonably predictable costs of completion, disposal and transportation. The ASU is effective for public reporting entities in fiscal years beginning after December 15, 2016.financial statements. The Company adopted this ASU prospectively inthe guidance as of July 1, 2018 using the modified retrospective approach applied to contracts that were not completed as of that date. The Company recorded a cumulative effect adjustment to the fiscal 2018. The2019 opening balance of its accumulated deficit upon adoption of this ASU did not have any material impact to the Company's consolidated financial statements.guidance, which decreased beginning accumulated deficit by $15.1 million.
In August 2016, the FASB issued ASU 2016-15 Statement of Cash Flows (Topic 230): Classification of Certain Cash Receipts and Cash Payments, whichThe following table provides clarification on the presentation and classification of certain cash receipts and cash payments in the statement of cash flows. The guidance will be effective for publicly reporting entities in fiscal years beginning after December 15, 2017, and interim periods within those fiscal years. Early adoption is permitted in any interim or annual period. The Company early adopted this ASU retrospectively in fiscal 2018. The adoption of this ASU did not have any material impact to the Company's consolidated financial statements.
New Accounting Standards Not Adopted as of December 31, 2017
In August 2017, the FASB issued ASU 2017-12, Derivatives and Hedging (Topic 815): Targeted Improvements to Accounting for Hedging Activities, which reduces the complexity of and simplifies the application of hedge accounting by preparers. The ASU will be effective for fiscal years beginning after December 15, 2018, and interim periods within those years. Early adoption is permitted. The Company is currently evaluating the impact of adopting thisthe guidance on itsthe Company’s financial statements:
| | | | | | | | | | | | | | | | | | | | | | | | | | | | | | | | | | | |
| | | | | | | | | | | |
| Three months Ended December 31, 2018 | | | | | | Six months Ended December 31, 2018 | | | | |
| (Dollars in millions) | As Reported | | Effects of Change | | Amount without Adoption of ASC 606 | | As Reported | | Effects of Change | | Amount without Adoption of ASC 606 |
| Net revenue | $ | 623.0 | | $ | 5.0 | | $ | 628.0 | | $ | 1,174.8 | | $ | 18.6 | | $ | 1,193.4 |
| Cost of sales | 421.6 | | 20.2 | | 441.8 | | 824.9 | | 31.6 | | 856.5 |
| Gross margin | 201.4 | | (15.2) | | 186.2 | | 349.9 | | (13.0) | | 336.9 |
| Earnings from continuing operations before income taxes | 51.3 | | (15.2) | | 36.1 | | 37.9 | | (13.0) | | 24.9 |
| Income tax expense | 2.3 | | (4.0) | | (1.7) | | 3.3 | | (3.8) | | (0.5) |
| Net earnings/(loss) | $ | 49.0 | | $ | (11.2) | | $ | 37.8 | | $ | 34.6 | | $ | (9.2) | | $ | 25.4 |
| | | | | | | | | | | |
| | | | | | | | | | | |
| | | | | | | | | | | |
| | | | | | | | | | | |
| | | | | | | | | | | |
| | | | | | | | | | | |
| | | | | | | | | | | |
| | | | | | | | | | | |
| | | | | | | | | | | |
| | | | | | | | | | | |
The impact of ASC 606 on the Company's consolidated financial statements.balance sheet is immaterial.
In May 2017,The adoption of ASC 606resulted in three primary changes as compared to the FASB issued ASU 2017-09, Compensation—Stock Compensation (Topic 718): Scope of Modification Accounting, which clarifies when an entity will apply modification accounting for changes to stock-based compensation arrangements. Modification accounting applies if the value, vesting conditions, or classificationprevious revenue recognition guidance: (a) revenue from commercial product supply is recognized following successful completion of the awards changes. The ASU will be effectiverequired quality assurance process where it was previously recognized upon shipment of the product to the customer; (b) earlier recognition of revenue from certain commercial supply contract cancellations is recognized as variable consideration as the Company’s performance obligations are satisfied rather than only upon agreement of the amount with the customer; and (c) revenue from sourcing comparator drug product for annual periods beginning after December 15, 2017, and interim periods within those annual periods. Early adoptionclinical supply services is permitted. The Company is currently evaluatingrecorded net of the impactcost of adopting this guidance on its consolidated financial statements.procuring it rather than at full value with a corresponding expense. Refer to Note 2 for the Company's revenue recognition policy.
In March 2017, the FASB issued ASU 2017-07, Compensation—Retirement Benefits (Topic 715): Improving the Presentation of Net Periodic Pension Cost and Net Periodic Postretirement Benefit Cost, which requires entities to report the service cost component of the net periodic benefit cost in the same income statement line as other compensation costs arising from services rendered by employees during the reporting period. The other components of the net benefit costs will be presented in the income statement separately from the service cost and below the income from operations subtotal. The Company adopted this guidance as of July 1, 2018, on a retrospective basis, which had an effect on the consolidated statement of operations for the three and six months ended December 31, 2017. The following table summarizes the Company's As Previously Reported and As Adjusted changes to the consolidated statement of operations for the three and six months ended December 31, 2017:
| | | | | | | | | | | | | | | | | | | | | | | |
| Three Months Ended December 31, 2017 | | | | Six Months Ended December 31, 2017 | | |
| (Dollars in millions) | As Previously Reported | | As Adjusted | | As Previously Reported | | As Adjusted |
| Selling, general, and administrative expenses | $ | 114.3 | | $ | 114.8 | | $ | 221.3 | | $ | 222.3 |
| Operating earnings | 68.8 | | 68.3 | | 100.7 | | 99.7 |
| Other expense, net | 13.6 | | 13.1 | | 19.3 | | 18.3 |
In August 2017, the FASB issued ASU will be2017-12, Derivatives and Hedging (Topic 815): Targeted Improvements to Accounting for Hedging Activities, which reduces the complexity of and simplifies the application of hedge accounting by issuers. The ASU is effective for public reporting entities in fiscal years beginning after December 15, 2017,2018 and interim periods within those years. Early adoption is permitted in the first interim period of a fiscal year.permitted. The Company is currently evaluating the impact of adoptingearly adopted this guidance as of July 1, 2018 on itsa prospective basis. The adoption of this guidance was not material to the Company's consolidated financial statements.
In May 2017, the FASB issued ASU 2017-09, Compensation—Stock Compensation (Topic 718): Scope of Modification Accounting, which clarifies when an entity will apply modification accounting for changes to stock-based compensation arrangements. Modification accounting applies if the value, vesting conditions, or classification of an award changes. The Company adopted this guidance prospectively at the beginning of fiscal 2019. The adoption of this guidance was not material to the Company's consolidated financial statements.
In January 2017, the FASB issued ASU 2017-01, Business Combinations (Topic 805): Clarifying the Definition of a Business, which provides additional guidance on the definition of a business to assist entities with evaluating whether transactions should be accounted for as acquisitions of assets or businesses. The Company adopted this guidance prospectively at the beginning of fiscal 2019. The adoption of this guidance was not material to the Company's consolidated financial statements.
In January 2016, the FASB issued ASU 2016-01, Financial Instruments—Overall (Subtopic 825-10): Recognition and Measurement of Financial Assets and Financial Liabilities, which changes the accounting for equity investments and financial liabilities under the fair value option, and presentation and disclosure requirements for financial instruments. The ASU requires equity investments with readily determinable fair values to be measured at fair value and to recognize change in fair value in net earnings. The ASU is not applicable to equity investments accounted for under the equity method of accounting or those that result in consolidation of the investee. The Company adopted this guidance at the beginning of fiscal 2019. The adoption of this guidance was not material to the Company's consolidated financial statements.
New Accounting Standards Not Adopted as of December 31, 2018
In August 2018, the FASB issued ASU 2018-15, Intangibles—Goodwill and Other—Internal-Use Software (Subtopic 350-40): Customer's Accounting for Implementation Costs Incurred in a Cloud Computing Arrangement That Is a Service Contract, which aligns the requirements for capitalizing implementation costs incurred in a hosting arrangement that is a service contract with the requirements for capitalizing implementation costs incurred to develop or obtain internal-use software. The ASU will be effective for public reporting entities in fiscal years beginning after December 15, 20172019 and interim periods within those fiscal years.years and allows for either a retrospective or prospective application. The Company is currently evaluating the impact of adopting this guidance on its consolidated financial statements.
In February 2018, the FASB issued ASU 2018-02, Income Statement—Reporting Comprehensive Income (Topic 220): Reclassification of Certain Tax Effects from Accumulated Other Comprehensive Income, which permits an entity to reclassify to retained earnings the stranded tax effects caused by the Tax Cuts and Jobs Act of 2017 on items within accumulated other comprehensive income/(loss). The ASU will be effective for fiscal years beginning after December 15, 2018 and interim periods within those years. Early adoption is permitted. The Company is currently evaluating the impact of adopting this guidance on its consolidated financial statements.
In June 2016, the FASB issued ASU 2016-13, Financial Instruments—Credit Losses (Topic 326): Measurement of Credit Losses on Financial Instruments, which introduces a new accounting model Credit Expected Credit Losses model ("CECL"). CECL requires earlier recognition of credit losses, while also providing additional transparency about credit risk. The CECL model utilizes a lifetime expected credit loss measurement objective for the recognition of credit losses for receivables at the time the financial asset is originated or acquired. The expected credit losses are adjusted each period for changes in expected lifetime credit losses. This model replaces the multiple existing impairment models in current GAAP, which generally require that a loss be incurred before it is recognized. The new standard will also apply to receivables arising from revenue transactions such as contract assets and accounts receivables. The ASU will be effective for fiscal years beginning after December 15, 2019. The Company is currently evaluating the impact of adopting this guidance on its consolidated financial statements.
In February 2016, the FASB issued ASU 2016-02, Leases (Topic 842), which will supersede ASCASC 840 Leases. The new guidance requires lessees to recognize most leases on their balance sheets for the rights and obligations created by those leases. The guidance requires enhanced disclosures regarding the amount, timing, and uncertainty of cash flows arising from leases and will be effective for publiclypublic reporting entities in annual reporting periods beginning after December 15, 2018 and interim periods within those fiscal years. Early adoption is permitted. The guidance is required to be adopted using the modified retrospective approach. The Company anticipates that most of its operating leases will result in the recognition of additional assets and corresponding liabilities on its consolidated balance sheets. The Company continues to evaluate the impact of adopting this guidance and its implication on its consolidated financial statements.
In May 2014, the FASB issued ASU No. 2014-09Revenue from Contracts with Customers, whichwill supersede nearly all existing revenue recognition guidance. The new guidance’s core principle is that a company will recognize revenue when it transfers promised goods or services to customers in an amount that reflects the consideration to which the company expects to be entitled in exchange for those goods or services. In doing so, the new guidance creates a five-step model that requires a
company to exercise judgment when considering the terms of the contracts and all relevant facts and circumstances. The five steps require a company to identify customer contracts, identify the separate performance obligations, determine the transaction price, allocate the transaction price to the separate performance obligations and recognize revenue when each performance obligation is satisfied. On July 9, 2015, the FASB approved a one-year deferral of the effective date so that the new guidance is effective for public entities for annual and interim periods beginning after December 15, 2017. The new guidance allows for either full retrospective adoption, where the standard is applied to all periods presented, or modified retrospective adoption where the standard is applied only to the most current period presented in the financial statements. Early adoption is permitted. The Company has identified its revenue streams, reviewed the initial impacts of adopting of the new standard on those revenue streams, and appointed a governance committee and project management leader. While the Company continues to assess all potential impacts of the standard, it has preliminarily assessed that the timing of revenue recognition may change for certain contractual arrangements containing minimum volume commitments in which the price is not fixed or determinable pursuant to the terms of the agreement. Under the current standard, the related pricing adjustments are considered to be contingent, while under the new standard they will likely be accounted for as variable consideration and revenue might be recognized earlier provided that the Company can reliably estimate the amount expected to be realized. Further, the Company has preliminarily determined that, for commercial supply arrangements, revenue will be recognized at the point in time of completing the required quality assurance process. The Company expects to adopt the new standard on a modified retrospective basis.
Transaction Overview:
On October 23, 2017, the Company acquired 100% of the equity interest in Cook Pharmica LLC (now doing business as Catalent Indiana, LLC, "Catalent Indiana") for an aggregate nominal purchase price of $950 million, subject to adjustment, in order to enhance the Company's biologics capabilities. Catalent Indiana is a biologics-focused contract development and manufacturing organization with capabilities across biologics development, clinical and commercial cell culture manufacturing, formulation, finished-dose manufacturing, and packaging.
The Company accounted for the transaction using the acquisition method of accounting for business combinations, in accordance with ASC 805 Business Combinations. The total consideration was (in thousands):
|
| | | |
| Cash paid at closing | $ | 748,002 |
|
| Fair value of deferred consideration at closing | | 184,838 |
|
| Total consideration | $ | 932,840 |
|
In addition to the cash paid at the closing of the acquisition, the agreement governing the purchase includes a deferred consideration arrangement that requires the Company to pay an additional $200.0 million in $50.0 million increments on each of the first four anniversaries of the closing. The fair value of the deferred consideration recognized on the acquisition date was estimated by calculating the risk-adjusted present value of four deferred cash payments and includes a component of imputed interest. This deferred consideration is included in current and long-term obligations within the consolidated balance sheet at December 31, 2017.
Following the acquisition, the operating results of the Catalent Indiana business have been included in the consolidated financial statements. For the period from the acquisition date through December 31, 2017, Catalent Indiana's net revenue was $40.4 million and pre-tax earnings were $7.9 million. Transaction costs incurred as a result of the acquisition of $1.9 million and $10.4 million are included in selling, general and administrative expenses for the three and six months ending December 31, 2017, respectively.
Valuation Assumptions and Preliminary Purchase Price Allocation:
2. REVENUE RECOGNITION
The Company estimated fair values at the date of acquisition for the preliminary allocation of consideration to the net tangible and intangible assets acquired and liabilities assumed. During the measurement period, the Company will continue to obtain information to assist in finalizing the fair value of net assets acquired, which may differ materially from these preliminary estimates. If any measurement period adjustment is material, the Company will record those adjustments, including any related impact on net income, in the reporting period in which the adjustments are determined.
The preliminary purchase price allocation to assets acquired and liabilities assumed in the transaction is (in thousands):
|
| | | |
| Accounts Receivable | $ | 37,021 |
|
| Inventory | | 25,144 |
|
| Other current assets | | 1,344 |
|
| Property, plant and equipment | | 221,139 |
|
| Identifiable intangible assets | | 330,000 |
|
| Trade and other payables | | 5,380 |
|
| Deferred revenue | | 18,132 |
|
| Total identifiable net assets | | 591,136 |
|
| Goodwill | | 341,704 |
|
| Total assets acquired and liabilities assumed | $ | 932,840 |
|
The carrying value of trade receivables, raw materials inventory and trade payables, as well as certain other current and non-current assets and liabilities, generally represented the fair value at the date of acquisition.
Property, plant and equipment was valued using a combination of the sales comparison approach and cost approach, which is based on current replacement and/or reproduction cost of the asset as new, less depreciation attributable to physical, functional, and economic factors. The Company then determined the remaining useful life based on the anticipated life of the asset and Company policy for similar assets.
Customer relationship intangible assets of $330 million were valued using the multi-period excess-earnings method, a method that values the intangible asset using the present value of the after-tax cash flows attributable to the intangible asset only. The significant assumptions used in developing the valuation included the estimated annual net cash flows (including application of an appropriate margin to forecastedrecognizes revenue selling and marketing costs, return on working capital, contributory asset charges and other factors), the discount rate which appropriately reflects the risk inherent in each future cash flow stream, the assessment of the asset’s life cycle, as well as other factors. The assumptions used in the financial forecasts were based on historical data, supplemented by current and anticipated growth rates, management plans, and market comparable information. Fair value determinations require considerable judgment and are sensitive to changes in underlying assumptions and factors. Preliminary assumptions may change and may result in significant changes to the final valuation. The customer relationship intangible asset has a weighted average useful life of 14 years.
Goodwill has preliminarily been allocated to our Drug Delivery Solutions segment as shown in Note 3, Goodwill. Goodwill is expected to be deductible for tax purposes and is mainly comprised of the following: growth from an expected increase in capacity utilization, potential new customers and the biologic expertise and know-how acquired with the acquisition of Catalent Indiana's workforce.
Pro Forma Results:
The following table provides unaudited pro forma results for the Company, prepared in accordance with ASC 805,606. The Company generally earns its revenue by supplying goods or providing services under contracts with its customers in three primary revenue streams: manufacturing and commercial product supply, development services, and clinical supply services. The Company measures the revenue from customers based on the consideration specified in its contracts, excluding any sales incentive or amount collected on behalf of a third party.
The company generally expenses sales commissions as incurred because either the amortization period is one year or less, or the balance with an amortization period greater than one year is not material.
The following tables allocate revenue for the three and six months ended December 31, 20172018 by type of activity and December 31, 2016, as if the Company had acquired Catalent Indiana as of July 1, 2016.reporting segment (in millions):
| | | | | | | | | | | | | | | | | | | | | | | | | | | | | |
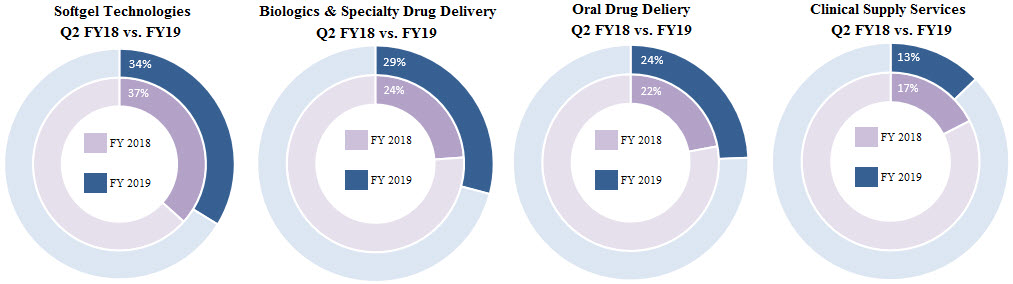
| Three months ended December 31, 2018 | Softgel Technologies | | Biologics & Specialty Drug Delivery | | Oral Drug Delivery | | Clinical Supply Services | | Total |
| Manufacturing & commercial product supply | $ | 197.0 | | $ | 88.6 | | $ | 100.5 | | $ | — | | $ | 386.1 |
| Development services | 16.7 | | 95.7 | | 53.5 | | — | | 165.9 |
| Clinical supply services | — | | — | | — | | 80.8 | | 80.8 |
| Total | $ | 213.7 | | $ | 184.3 | | $ | 154.0 | | $ | 80.8 | | $ | 632.8 |
| | | Inter-segment revenue elimination | | | | | | (9.8) |
| | | | | Combined net revenue | | | | $ | 623.0 |
|
| | | | | | | | | | | | | | | |
| | For the Three Months Ended | | For the Six Months Ended |
| | December 31, 2017 | | December 31, 2016 | | December 31, 2017 | | December 31, 2016 |
| | (in millions, except per share data) |
| Revenue | $ | 621.0 |
| | $ | 531.1 |
| | $ | 1,216.2 |
| | $ | 1,016.6 |
|
| Net income/(loss) | (10.5 | ) | | 17.6 | | | (1.0 | ) | | (0.6 | ) |
| Basic earnings/(loss) per share | (0.08 | ) | | 0.13 | | | (0.01 | ) | | 0.00 | |
| Diluted earnings/(loss) per share | (0.08 | ) | | 0.13 | | | (0.01 | ) | | 0.00 | |
| | | | | | | | | | | | | | | | | | | | | | | | | | | | | |
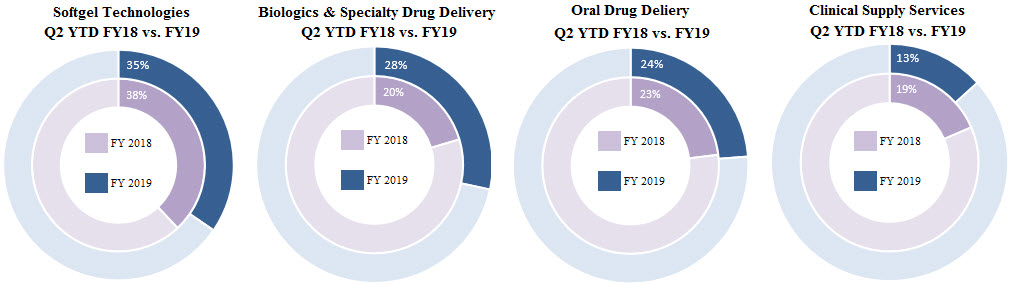
| Six months ended December 31, 2018 | Softgel Technologies | | Biologics & Specialty Drug Delivery | | Oral Drug Delivery | | Clinical Supply Services | | Total |
| Manufacturing & commercial product supply | $ | 381.4 | | $ | 162.4 | | $ | 182.2 | | $ | — | | $ | 726.0 |
| Development services | 31.5 | | 176.5 | | 101.9 | | — | | 309.9 |
| Clinical supply services | — | | — | | — | | 158.5 | | 158.5 |
| Total | $ | 412.9 | | $ | 338.9 | | $ | 284.1 | | $ | 158.5 | | $ | 1,194.4 |
| | | Inter-segment revenue elimination | | | | | | (19.6) |
| | | | | Combined net revenue | | | | $ | 1,174.8 |
The unaudited pro forma financial information was preparedfollowing table allocates revenue by the location where the goods were made or the service performed:
| | | | | | | | | | | | | | |
| (Dollars in millions) | | Three months ended December 31, 2018 | | Six months ended December 31, 2018 |
| | | | |
| United States | | $ | 315.1 | | $ | 579.5 |
| Europe | | 214.8 | | 411.2 |
| International Other | | 119.7 | | 227.3 |
| Elimination of revenue attributable to multiple locations | | (26.6) | | (43.2) |
| Total | | $ | 623.0 | | $ | 1,174.8 |
Manufacturing & Commercial Product Supply Revenue
Manufacturing and commercial product supply revenue consists of revenue earned by manufacturing products supplied to customers under long-term commercial supply arrangements. The Company recognizes revenue for manufacturing and supplying commercial products as control is transferred to the customer, which is measured based on product that has successfully completed contractually required quality assurance process. Revenue is measured based on the historical informationamount of Catalentconsideration the Company expects to receive in exchange for providing these products and Catalent Indiana. In order to reflectservices. The contractual performance obligation generally includes manufacture and the acquisition on July 1, 2016,completion of product quality release testing procedures specified in the unaudited pro formal financial information includes adjustments
to reflect the incremental amortization expensecontract. These activities are interdependent and thus are considered to be incurreda single combined performance obligation. Payment is typically due 30 to 90 days after the goods are shipped to the customer based on the fair valuepayment terms set forth in the applicable customer agreement.
Development Services Revenue
Development services contracts generally take the form of short-term, fee-for-service arrangements. Performance obligations vary, but frequently include (1) the delivery of a formulation report, analytical and stability testing report, or other report on product- or molecule-based studies or (2) the manufacture of products under development or otherwise not intended for commercial sale. The transaction prices for these arrangements include fixed consideration of the intangible assets acquired,amounts stated in the incremental depreciation expense relatedcontracts for each promised good or service, which are generally considered to be separate performance obligations. The Company recognizes revenue when or as control of each individual performance obligation is transferred to the fair value adjustmentscustomer and exercises judgment in determining the timing of revenue recognition by analyzing the point in time or period over which the customer has the ability to direct the use of and obtain substantially all of the remaining benefits of the arrangement. Control generally transfers to the customer when services have been completed or the customer has accepted the product or service deliverable and the Company has right to payment based on the terms of the agreement.
In certain arrangements, the Company recognizes revenue over time as the Company satisfies performance obligations. Satisfaction of the performance obligations is measured using an output method measure of progress based on effort expended by the Company. In other arrangements, revenue is recognized when the customer has taken legal title to or accepted the product or service deliverable and the Company has a right to payment based on the terms of the arrangement.
Development services contracts may also include certain success-based milestone payments for completed performance obligations, such as regulatory approval and product validation prior to the commencement of commercial supply. Revenue associated with Catalent Indiana's property, plantdevelopmental milestones is considered variable consideration and equipment,is typically recognized when the additional interest expense associatedsuccess-based milestone is achieved, and no significant revenue reversal is anticipated.
The Company allocates consideration to each performance obligation based on the relative selling price. Payment is typically due 30 to 90 days following the completion of services provided to the customer based on the payment terms set forth in the applicable customer agreement. Certain development service arrangements require a portion of the contract consideration to be received in advance at the commencement of the contract and is initially recorded as a contract liability.
Clinical Supply Services Revenue
Clinical supply services contracts generally take the form of fee-for-service arrangements. Performance obligations for clinical supply services revenue typically include a combination of the following services: the manufacturing, packaging, storage, distribution, destruction, and inventory management of customer clinical trials materials. Performance obligations can also include the sourcing of comparator drug products on behalf of customers to be used in clinical trials to compare performance with the issuancedrug under clinical investigation. In certain arrangements, the Company recognizes revenue over time when the Company satisfies performance obligations. Satisfaction of debt to finance the acquisition,performance obligations is measured using an output method measure of progress based on effort expended by the shares issued in connection withCompany. In other arrangements, revenue is recognized when the first quarter equity offering to financecustomer has taken legal title or accepted the acquisition,product or service deliverable and the acquisition, integration,Company has right to payment based on the terms of the arrangement. Payment is typically due 30 to 90 days following the completion of services provided to the customer based on the payment terms set forth in the applicable customer agreement.
The Company records revenue for comparator sourcing arrangements on a net basis because it is acting as an agent that does not control the product or service before it is transferred to the customer. Payment for comparator sourcing activity is typically received in advance at the commencement of the contract and financing-related costs incurredis initially recorded as a contract liability.
Contract Liabilities
Contract liabilities relate to cash consideration that the Company receives in advance of satisfying the related performance obligations. Changes in the contractual liabilities balance during the three and six months ended December 31, 2017 and 2016. The results do not include any anticipated cost savings or other effects associated with integrating Catalent Indiana into the rest2018 are as follows:
| | | | | | | | |
3.(Dollars in millions) | GOODWILL | |
| Contract liability | | |
| Balance at June 30, 2018 | | $ | 100.9 |
| | |
| | |
| | |
| | |
| Balance at December 31, 2018 | | $ | 112.4 |
| Revenue recognized in the period from: | | |
| Amounts included in contracts liability at the beginning of the period | | $ | 48.9 |
Remaining Performance Obligations
For the Softgel Technologies, Biologics and Specialty Drug Delivery, and Oral Drug Delivery segments, remaining performance obligations represent firm orders for manufacturing and commercial product supply, including minimum volume commitments and future development services, for which there are incomplete performance obligations. For the Clinical Supply Services segment, remaining performance obligations represent estimated future service revenues from work not yet completed under signed contracts. The remaining performance obligations as of December 31, 2018 were $1,274.5 million, including approximately $319.2 million related to our Clinical Supply Services segment. We expect to recognize approximately 58% of the remaining performance obligations in existence as of December 31, 2018 over the next six months, with the remaining recognized thereafter.
3. BUSINESS COMBINATIONS
Juniper Pharmaceuticals Acquisition
On August 14, 2018, Operating Company acquired Juniper Pharmaceuticals, Inc., a Delaware corporation ("Juniper") through a tender offer and back-end merger, pursuant to the terms of an agreement and plan of merger (the "Juniper Merger Agreement"), and Juniper became a wholly owned subsidiary of Operating Company. Under the terms of the Juniper Merger Agreement, all outstanding options to purchase Juniper shares were canceled in exchange for cash equal to the product of the number of Juniper shares subject to the option and the difference between the price per share paid in the tender offer and the exercise price. Similarly, all outstanding restricted stock units in respect of Juniper shares were canceled in exchange for cash equal to the product of the number of units and the price per share paid in the tender offer. Juniper has expertise in formulation development and supply and augments the Company's pre-existing portfolio of solid-state screening, pre-formulation, formulation, analytical, and bioavailability enhancement solutions, including the development of drug products produced using spray-dried dispersion, with integrated development, analytical, and clinical manufacturing. Juniper also owns the ex-U.S. rights to and supplies for sale to its licensee of such rights CRINONE®, a reproductive therapy. The primary operations of the acquired business are located in owned facilities aggregating 38,000 square feet in Nottingham, U.K. and is now included in the Oral Drug Delivery segment. Results of this segment include the results of Juniper for the period since the acquisition.
The aggregate purchase consideration, net of cash acquired, was $127.5 million, which was funded by cash on hand. As a result of the preliminary fair value allocations, the Company recognized intangible assets of $69.0 million and $10.0 million for product relationships and customer relationships, respectively. The remainder of the preliminary fair value was allocated to tangible assets acquired and goodwill. The fair value allocation is expected to be completed upon finalization of an independent appraisal over the next several months, but no later than one year from the acquisition date.
4. GOODWILL
The following table summarizes the changes between June 30, 20172018 and December 31, 20172018 in the carrying amount of goodwill in total and by reporting segment:
| | | | | | | | | | | | | | | | | | | | | | | | | | | | | |
| (Dollars in millions) | Softgel Technologies | | Biologics and Specialty Drug Delivery | | Oral Drug Delivery | | Clinical Supply Services | | Total |
| Balance at June 30, 2018 | $ | 415.2 | | $ | 505.7 | | $ | 319.9 | | $ | 156.4 | | $ | 1,397.2 |
| Additions | — | | — | | 42.9 | | — | | 42.9 |
| | | | | | | | | |
| Foreign currency translation adjustments | (7.1) | | (0.9) | | (5.2) | | (5.5) | | (18.7) |
| Balance at December 31, 2018 | $ | 408.1 | | $ | 504.8 | | $ | 357.6 | | $ | 150.9 | | $ | 1,421.4 |
|
| | | | | | | | | | | | | | | |
| (Dollars in millions) | Softgel Technologies | | Drug Delivery Solutions | | Clinical Supply Services | | Total |
| Balance at June 30, 2017 | $ | 415.2 |
| | $ | 477.2 |
| | $ | 151.7 |
| | $ | 1,044.1 |
|
| Additions | — |
| | 341.7 |
| | — |
| | 341.7 |
|
| Divestitures | (0.9 | ) | | — |
| | — |
| | (0.9 | ) |
| Foreign currency translation adjustments | 8.9 |
| | 8.3 |
| | 6.2 |
| | 23.4 |
|
| Balance at December 31, 2017 | $ | 423.2 |
| | $ | 827.2 |
| | $ | 157.9 |
| | $ | 1,408.3 |
|
The reduction in goodwill in the Softgel Technologies reporting segment relates to the sale of two manufacturing sites in the Asia Pacific region. The site divestitures were neither material individually or in aggregate to the segment or to the Company. The increase in goodwill in the Oral Drug Delivery Solutions reporting segment relates tois a result of the Catalent IndianaJuniper acquisition. See note 2 Business Combinations. There were noThe Company did not record an impairment charges recordedcharge in the current period.
| |
4. | DEFINITE LIVED LONG-LIVED ASSETS |
5. DEFINITE-LIVED LONG-LIVED ASSETS
The Company’s definite-lived long-lived assets include property, plant, and equipment as well as other intangible assets with definite lives. Refer to Note 15 16, Supplemental Balance Sheet Information for details related to property, plant, and equipment.
The details of other intangible assets subject to amortizationintangibles, net as of December 31, 20172018 and June 30, 2017,2018 are as follows:
| | | (Dollars in millions) | Weighted Average Life | | Gross Carrying Value | | Accumulated Amortization | | Net Carrying Value | (Dollars in millions) | Weighted Average Life | | Gross Carrying Value | | Accumulated Amortization | | Net Carrying Value |
| December 31, 2017 | | | | | | | |
| December 31, 2018 | | December 31, 2018 | | | | | | | |
| Amortized intangibles: | | | | | | | Amortized intangibles: | |
| Core technology | 18 years | | $ | 172.7 |
| | $ | (81.2 | ) | | $ | 91.5 |
| Core technology | 18 years | | $ | 168.0 | | $ | (88.7) | | $ | 79.3 |
| Customer relationships | 14 years | | 589.3 |
| | (121.2 | ) | | 468.1 |
| Customer relationships | 14 years | | 589.9 | | (158.4) | | 431.5 |
| Product relationships | 12 years | | 212.0 |
| | (189.6 | ) | | 22.4 |
| Product relationships | 11 years | | 275.3 | | (205.1) | | 70.2 |
| Total intangible assets | | $ | 974.0 |
| | $ | (392.0 | ) | | $ | 582.0 |
| Total intangible assets | | $ | 1,033.2 | | $ | (452.2) | | $ | 581.0 |
The increaseincreases in customer relationships isand product relationships as of December 31, 2018 are associated with the acquisition of Catalent IndianaJuniper in October 2017. Refer to Note 2 Business Combinations for details of the acquisition.August 2018.
|
| | | | | | | | | | | | | |
| (Dollars in millions) | Weighted Average Life | | Gross Carrying Value | | Accumulated Amortization | | Net Carrying Value |
| June 30, 2017 | | | | | | | |
| Amortized intangibles: | | | | | | | |
| Core technology | 18 years | | $ | 170.3 |
| | $ | (74.8 | ) | | $ | 95.5 |
|
| Customer relationships | 14 years | | 253.0 |
| | (106.1 | ) | | 146.9 |
|
| Product relationships | 12 years | | 206.9 |
| | (176.2 | ) | | 30.7 |
|
| Total intangible assets | | | $ | 630.2 |
| | $ | (357.1 | ) | | $ | 273.1 |
|
| | | | | | | | | | | | | | | | | | | | | | | |
| (Dollars in millions) | Weighted Average Life | | Gross Carrying Value | | Accumulated Amortization | | Net Carrying Value |
| June 30, 2018 | | | | | | | |
| Amortized intangibles: | | | | | | | |
| Core technology | 18 years | | $ | 170.8 | | $ | (85.3) | | $ | 85.5 |
| Customer relationships | 14 years | | 587.0 | | (140.9) | | 446.1 |
| Product relationships | 12 years | | 210.5 | | (197.2) | | 13.3 |
| Total intangible assets | | | $ | 968.3 | | $ | (423.4) | | $ | 544.9 |
Amortization expense was $16.1$19.5 million and 27.5$37.7 million for the three and six months ended December 31, 2017,2018, respectively, and $11.1$16.1 million and $22.1$27.5 million for the three and six months ended December 31, 2016,2017, respectively. Future amortization expense for the next five fiscal years is estimated to be:
| | | | | | | | | | | | | | | | | | | | | | | | | | | | | | | | | | | |
| (Dollars in millions) | Remainder
Fiscal 2019 | | 2020 | | 2021 | | 2022 | | 2023 | | 2024 |
| Amortization expense | $ | 33.8 | | $ | 58.4 | | $ | 58.4 | | $ | 58.4 | | $ | 58.4 | | $ | 58.3 |
|
| | | | | | | | | | | | | | | | | | | | | | | |
| (Dollars in millions) | Remainder
Fiscal 2018 | | 2019 | | 2020 | | 2021 | | 2022 | | 2023 |
| Amortization expense | $ | 34.8 |
| | $ | 63.8 |
| | $ | 49.7 |
| | $ | 49.7 |
| | $ | 49.7 |
| | $ | 49.7 |
|
| |
5. | LONG-TERM OBLIGATIONS AND OTHER SHORT-TERM BORROWINGS |
Long-term obligations and other short-term borrowings consist of the following at December 31, 20172018 and June 30, 2017:2018:
| | | (Dollars in millions) | Maturity as of December 31, 2017 | | December 31,
2017 | | June 30, 2017 | (Dollars in millions) | Maturity as of December 31, 2018 | | December 31, 2018 | | June 30, 2018 |
| Senior Secured Credit Facilities | | | | | | Senior Secured Credit Facilities | | | | | |
| Term loan facility dollar-denominated | May 2024 | | $ | 1,234.9 |
| | $ | 1,244.2 |
| |
| | Term loan facility U.S. dollar-denominated | | Term loan facility U.S. dollar-denominated | May 2024 | | $ | 775.8 | | $ | 1,228.4 |
| | Term loan facility euro-denominated | May 2024 | | 366.5 |
| | 352.0 |
| Term loan facility euro-denominated | May 2024 | | 349.0 | | 358.9 |
| Euro-denominated 4.75% Senior Notes due 2024 | December 2024 | | 445.4 |
| | 424.3 |
| Euro-denominated 4.75% Senior Notes due 2024 | December 2024 | | 428.7 | | 438.4 |
| U.S. dollar-denominated 4.875% Senior Notes due 2026 | January 2026 | | 443.7 |
| | — |
| U.S. dollar-denominated 4.875% Senior Notes due 2026 | January 2026 | | 444.2 | | 443.8 |
| | Deferred purchase consideration | September 2021 | | 186.0 |
| | — |
| Deferred purchase consideration | October 2021 | | 141.7 | | 188.9 |
| $200 million revolving credit facility | May 2022 | | — |
| | — |
| $200 million revolving credit facility | May 2022 | | — | | — |
| Capital lease obligations | 2020 to 2032 | | 62.8 |
| | 53.3 |
| Capital lease obligations | 2020 to 2032 | | 58.6 | | 60.8 |
| Other obligations | 2018 to 2019 | | 3.1 |
| | 5.9 |
| Other obligations | 2018 to 2019 | | 1.9 | | 2.1 |
| Total | | 2,742.4 |
| | 2,079.7 |
| Total | | 2,199.9 | | 2,721.3 |
Less: Current portion of long-term obligations and other short-term
borrowings | | 69.9 |
| | 24.6 |
| Less: Current portion of long-term obligations and other short-term
borrowings | | 69.9 | | 71.9 |
| Long-term obligations, less current portion | | $ | 2,672.5 |
| | $ | 2,055.1 |
| Long-term obligations, less current portion | | $ | 2,130.0 | | $ | 2,649.4 |
Senior Secured Credit Facilities and Third Amendment
On October 18, 2017, Operating Company completed Amendment No. 3 (the "Third Amendment") to its Amended and Restated Credit Agreement, dated as of May 20, 2014 (as subsequently amended, the "Credit Agreement"), governing the senior secured credit facilities that provide U.S. dollar, denominated term loans, euro-denominated term loans, and a revolving credit facility. The Third Amendment lowered the interest rate on U.S. dollar-denominated and euro-denominated term loans and the revolving credit facility and extended the maturity dates on the senior secured credit facilities by three years. The newFrom the Third Amendment, the applicable rate for U.S. dollar-denominated term loans is LIBOR (the London Interbank Offered Rate, subject to a floor of 1.00%) plus 2.25%, which is 0.50% lower than the previous rate, and the new applicable rate for euro-denominated term loans is LIBOR (subjectEuribor (the Euro Interbank Offered Rate published by the European Money Markets Institute, subject to a floor of 1.00%) plus 1.75%, which is 0.75% lower than the previous rate.. The new applicable rate for the revolving loans iswas initially set at LIBOR plus 2.25%, which is 1.25% lower than the previous rate, and such rate can additionally be reduced to LIBOR plus 2.00% in future periods based on a measure of Operating Company's total leverage ratio. The term loans and revolving loans will now mature in May 2024 and May 2022, respectively. The Third Amendment also includes a prepayment of 1.0% in
On July 27, 2018, the event of another repricing eventCompany completed an underwritten public equity offering (the "2018 Equity Offering") and used the net proceeds coupled with cash on or before the six-month anniversaryhand to repay $450.0 million of the Third Amendment.outstanding borrowings under its U.S. dollar-denominated term loans on July 31, 2018.
Euro-denominated 4.75% Senior Notes due 2024
On December 9, 2016, Operating Company completed a private offering of €380.0 million aggregate principal amount of 4.75% Senior Notes due 2024 (the "Euro Notes"). The Euro Notes are fully and unconditionally guaranteed, jointly and severally, by all of the wholly owned U.S. subsidiaries of Operating Company that guarantee its senior secured credit facilities. The Euro Notes were offered in the United States to qualified institutional buyers in reliance on Rule 144A under the Securities Act of 1933, as amended (the "Securities Act") and outside the United States only to non-U.S. investors pursuant to Regulation S under the Securities Act. The Euro Notes will mature on December 15, 2024, bear interest at the rate of 4.75% per annum and are payable semi-annually in arrears on June 15 and December 15 of each year.
U.S. Dollar-denominated 4.875% Senior Notes due 2026
On October 18, 2017, Operating Company completed a private offering (the "Debt Offering") of $450.0 million aggregate principal amount of 4.875% senior unsecured notesSenior Notes due 2026 (the "USD Notes"). The USD Notes are fully and unconditionally guaranteed, jointly and severally, by all of the wholly owned U.S. subsidiaries of Operating Company that guarantee its senior secured credit facilities. The USD Notes were offered in the United States to qualified institutional buyers in reliance on Rule 144A under the Securities Act and outside the United States only to non-U.S. investors pursuant to Regulation S under the Securities Act. The USD Notes will mature on January 15, 2026, bear interest at the rate of 4.875% per annum, and are payable semi-annually in arrears on January 15 and July 15 of each year, beginning on July 15, 2018. The net proceeds of the Debt Offering, after payment of the initial purchasers' discount and related fees and expenses, were used to fund a portion of the consideration for the Catalent Indiana acquisition due at its closing.
Deferred Purchase Consideration
In connection with the acquisition of Catalent Indiana in October 2017, $200$200.0 million of the $950$950.0 million aggregate nominal purchase price is payable in $50 million installments, on each of the first four anniversaries of the closing date. The Company paid the first of these four payments in October 2018. The deferred purchase consideration iswas initially recorded at fair value and includesincluded a component of imputed interest.
Bridge Loan Facility
On September 18, 2017, contemporaneous with the Company entering into the agreement to acquire Catalent Indiana, Operating Company entered into a debt commitment letter with Morgan Stanley Senior Funding, Inc., JP Morgan Chase Bank, N.A., Royal Bank of Canada, RBC Capital Markets, Bank of America, N.A., and Merrill Lynch, Pierce, Fenner & Smith Incorporated, as commitment parties. Pursuant to the debt commitment letter and subject to its terms and conditions, the commitment parties agreed to provide a senior unsecured bridge loan facility (the "Bridge Facility") of up to $700.0 million in the aggregate for the purpose of providing any back-up financing necessary to fund a portion of the consideration to be paid in the acquisition and related fees, costs, and expenses (the "Bridge Loan Commitment"). In connection with entering into the Bridge Facility, Operating Company incurred $6.1 million of associated fees, which was recorded in prepaid expenses and other in the consolidated balance sheet as of September 30, 2017.fees. Operating Company did not draw on it to fund the acquisition and the Company expensed the $6.1 million in the second quarter of fiscal 2018 as part of other income and expense, net and the facility was closed. See Note 7 for further discussion of financing costs incurred in the second quarter.
Debt Covenants
Senior Secured Credit Facilities
The Credit Agreement contains a number of covenants that, among other things, restrict, subject to certain exceptions, Operating Company’s (and Operating Company’s restricted subsidiaries’) ability to incur additional indebtedness or issue certain preferred shares; create liens on assets; engage in mergers and consolidations; sell assets; pay dividends and distributions or repurchase capital stock; repay subordinated indebtedness; engage in certain transactions with affiliates; make investments, loans, or advances; make certain acquisitions; enter into sale and leaseback transactions; amend material agreements governing Operating Company’s subordinated indebtedness; and change Operating Company’s lines of business.
The Credit Agreement also contains change of controlchange-of-control provisions and certain customary affirmative covenants and events of default. The revolving credit facility requires compliance with a net leverage covenant when there is a 30% or more draw outstanding at a period end. As of December 31, 2017,2018, Operating Company was in compliance with all material covenants related to its long-term obligations.under the Credit Agreement.
Subject to certain exceptions, the Credit Agreement permits Operating Company and its restricted subsidiaries to incur certain additional indebtedness, including secured indebtedness. None of Operating Company’s non-U.S. subsidiaries or Puerto Rico subsidiaries is a guarantor of the loans.
Under the Credit Agreement, Operating Company’s ability to engage in certain activities such as incurring certain additional indebtedness, making certain investments, and paying certain dividends is tied to ratios based on Adjusted EBITDA (which is defined as “Consolidated EBITDA” in the Credit Agreement). Adjusted EBITDA is based on the definitions in the Credit Agreement, is not defined under U.S. GAAP, and is subject to important limitations.
The Euro Notes and the USD Notes
The Indentures governing the Euro Notes and the USD Notes (the "Indentures") contain certain covenants that, among other things, limit the ability of Operating Company and its restricted subsidiaries to incur or guarantee more debt or issue certain preferred shares,shares; pay dividends on, repurchase, or make distributions in respect of their capital stock or make other
restricted payments,payments; make certain investments,investments; sell certain assets,assets; create liens,liens; consolidate, merge, sellsell; or otherwise dispose of all or substantially all of their assets,assets; enter into certain transactions with their affiliates, and designate their subsidiaries as unrestricted subsidiaries. These covenants are subject to a number of exceptions, limitations, and qualifications as set forth in the Indentures. The Indentures also contain customary events of default including, but not limited to, nonpayment, breach of covenants, and payment or acceleration defaults in certain other indebtedness of Operating Company or certain of its subsidiaries. Upon an event of default, either the holders of at least 30% in principal amount of each of the then-outstanding Euro Notes or the then-outstanding USD Notes, or either of the Trustees under the Indentures, may declare the applicable notes immediately due and payable,payable; or in certain circumstances, the applicable notes will become automatically immediately due and payable. As of December 31, 2017,2018, Operating Company was in compliance with all material covenants under the Indentures.
Fair Value of Debt Instruments
The estimated fair value of the senior secured credit facility, a Level 2 fair valuefair-value estimate, is based on the quoted market prices for the same or similar issues or on the current rates offered for debt of the same remaining maturities and considers collateral, if any. The estimated fair value of the Euro and USD Notes, a Level 1 fair valuefair-value estimate, is based on the quoted market prices of the instruments. The carrying amounts and the estimated fair values of financial instruments as of December 31, 20172018 and June 30, 20172018 are as follows:
| | | | | | | | | | | | | | | | | | | | | | | | | | |
| | December 31, 2018 | | | | June 30, 2018 | | |
| (Dollars in millions) | Fair Value Measurement | Carrying Value | | Estimated Fair Value | | Carrying Value | | Estimated Fair Value |
| Euro-denominated 4.75% Senior Notes | Level 1 | $ | 428.7 | | $ | 428.7 | | $ | 438.4 | | $ | 457.6 |
| U.S. Dollar-denominated 4.875% Senior Notes | Level 1 | 444.2 | | 419.8 | | 443.8 | | 428.3 |
| Senior Secured Credit Facilities & Other | Level 2 | 1,327.0 | | 1,246.0 | | 1,839.1 | | 1,768.0 |
| Total | | $ | 2,199.9 | | $ | 2,094.5 | | $ | 2,721.3 | | $ | 2,653.9 |
7. EARNINGS PER SHARE
|
| | | | | | | | | | | | | | | | |
| | | December 31, 2017 | | June 30, 2017 |
| (Dollars in millions) | Fair Value Measurement | Carrying Value | | Estimated Fair Value | | Carrying Value | | Estimated Fair Value |
| Euro-denominated 4.75% Senior Notes | Level 1 | $ | 445.4 |
| | $ | 474.4 |
| | $ | 424.3 |
| | $ | 454.0 |
|
| U.S. Dollar-denominated 4.875% Senior Notes | Level 1 | 443.7 |
| | 449.8 |
| | — |
| | — |
|
| Senior Secured Credit Facilities & Other | Level 2 | 1,853.3 |
| | 1,825.1 |
| | 1,655.4 |
| | 1,653.1 |
|
| Total | | $ | 2,742.4 |
| | $ | 2,749.3 |
| | $ | 2,079.7 |
| | $ | 2,107.1 |
|
The reconciliations between basic and diluted earnings per share attributable to Catalent common shareholders for the three and six months ended December 31, 20172018 and 2016,2017, respectively, are as follows (in millions, except share and per share data):
| | | | | | | | | | | | | | | | | | | | | | | |
| Three Months Ended
December 31, | | | | Six Months Ended
December 31, | | |
| 2018 | | 2017 | | 2018 | | 2017 |
| | | | | | | |
| | | | | | | |
| Net earnings/(loss) | $ | 49.0 | | $ | (21.9) | | $ | 34.6 | | $ | (18.1) |
| | | | | | | |
| Weighted average shares outstanding | 145,058,230 | | 132,983,262 | | 143,285,870 | | 129,327,188 |
| Dilutive securities issuable-stock plans | 1,602,109 | | — | | 1,775,739 | | — |
| Total weighted average diluted shares outstanding | 146,660,339 | | 132,983,262 | | 145,061,609 | | 129,327,188 |
| | | | | | | |
| Earnings/(loss) per share: | | | | | | | |
| | | | | | | |
| | | | | | | |
| Basic | $ | 0.34 | | $ | (0.16) | | $ | 0.24 | | $ | (0.14) |
| | | | | | | |
| | | | | | | |
| | | | | | | |
| | | | | | | |
| Diluted | $ | 0.33 | | $ | (0.16) | | $ | 0.24 | | $ | (0.14) |
|
| | | | | | | | | | | | | | | |
| | Three Months Ended
December 31, | | Six Months Ended
December 31, |
| | 2017 | | 2016 | | 2017 | | 2016 |
| Net earnings/(loss) | $ | (21.9 | ) | | $ | 17.4 |
| | $ | (18.1 | ) | | $ | 22.0 |
|
| | | | | | | | |
| Weighted average shares outstanding | 132,983,262 |
| | 124,889,681 |
| | 129,327,188 |
| | 124,870,327 |
|
| Dilutive securities issuable-stock plans | — |
| | 1,524,963 |
| | — |
| | 1,470,476 |
|
| Total weighted average diluted shares outstanding | 132,983,262 |
| | 126,414,644 |
| | 129,327,188 |
| | 126,340,803 |
|
| | | | | | | | |
| Basic earnings per share of common stock: | | | |
| | | | |
| Net earnings/(loss) | $ | (0.16 | ) | | $ | 0.14 |
| | $ | (0.14 | ) | | $ | 0.18 |
|
| | | | | | | | |
| Diluted earnings per share of common stock: | | | | | | | |
| Net earnings/(loss) | $ | (0.16 | ) | | $ | 0.14 |
| | $ | (0.14 | ) | | $ | 0.17 |
|
The computation of diluted earnings per share for the three and six months ended December 31, 2018 excludes the effect of the potential common shares issuable under employee-held stock options and restricted stock units of approximately 1.1 million and 1.0 million shares, respectively, because they are anti-dilutive. The computation of diluted earnings per share for the three and six months ended December 31, 2017 excludes the maximum effect of the potential common shares issuable under the employeeemployee-held stock option planoptions and restricted stock units of approximately 2.6 million shares, and excludes restricted share awards of 2.1 million shares, because the Company had a net loss for the period and the effect would therefore be anti-dilutive. The computation of diluted earnings per share for the three and six months ended December 31, 2016 excludes the effect of 0.5 million shares potentially issuable pursuant to awards granted under the 2007 Stock Incentive Plan, because the vesting provisions of those awards specify performance- or market-based conditions that had not been met as of the period end. The computation of diluted earnings per share for the three and six months ended December 31, 2016 excludes the effect of potential common shares issuable under employee-held stock options and restricted stock units of approximately 0.9 million and 1.1 million shares, respectively, because they are anti-dilutive.
8. OTHER EXPENSE, NET
| |
7. | OTHER (INCOME)/EXPENSE, NET |
The components of other (income)/expense, net for the three and six months ended December 31, 20172018 and 20162017 are as follows: | | | | Three Months Ended
December 31, | | Six Months Ended
December 31, | | Three Months Ended
December 31, | | | Six Months Ended
December 31, | |
| (Dollars in millions) | 2017 | | 2016 | | 2017 | | 2016 | (Dollars in millions) | 2018 | | 2017 | | 2018 | | 2017 |
| Other (income)/expense, net | | | | | | | | |
| Other expense, net | | Other expense, net | | | | | | | |
Debt refinancing costs (1) | $ | 11.8 |
| | $ | 4.3 |
| | $ | 11.8 |
| | $ | 4.3 |
| Debt refinancing costs (1) | $ | — | | $ | 11.8 | | $ | 4.2 | | $ | 11.8 |
| Foreign currency (gains) and losses | 1.3 |
| | (5.3 | ) | | 6.9 |
| | (7.5 | ) | |
| Foreign currency (gains) and losses (2) | | Foreign currency (gains) and losses (2) | 0.7 | | 1.3 | | 2.4 | | 6.9 |
| Other | 0.5 |
| | (0.8 | ) | | 0.6 |
| | (0.7 | ) | Other | 0.7 | | — | | 0.5 | | (0.4) |
| Total other (income)/expense, net | $ | 13.6 |
| | $ | (1.8 | ) | | $ | 19.3 |
| | $ | (3.9 | ) | |
| Total other expense, net | | Total other expense, net | $ | 1.4 | | $ | 13.1 | | $ | 7.1 | | $ | 18.3 |
(1) The 2017expense in the six months ended December 31, 2018 includes a write-off of $4.2 million of previously capitalized financing charges related to the Company's U.S. dollar term loan under its senior secured credit facility. The prior-year debt refinancing costs include financing charges related to the offering of the USD Notes and the Third Amendment and also include a $6.1 million charge for commitment fees paid during the first quarter of fiscal 2018 on the Bridge Facility. The 2016 debt refinancing costs
(2) Foreign currency remeasurement (gains) and losses include financing charges of $4.3 million related to the December 2016 offering of the Euro Notesboth cash and repricing and partial paydown of the Company's term loans.non-cash transactions.
| |
8. | RESTRUCTURING AND OTHER COSTS |
9. RESTRUCTURING AND OTHER COSTS
Restructuring Costs
TheFrom time to time, the Company has implemented plans to restructure certain operations, both domestically and internationally. The restructuring plans focused on various aspects of operations, including closing and consolidating certain manufacturing operations, rationalizing headcount and aligning operations in a strategic and more cost-efficient structure. In addition, the Company may incur restructuring charges in the future in cases where a material change in the scope of operation with its business occurs. Employee-related costs consist primarily of severance costs and also include outplacement services provided to employees who have been involuntarily terminated and duplicate payroll costs during transition periods. Facility exit and other costs consist of accelerated depreciation, equipment relocation costs and costs associated with planned facility expansions and closures to streamline Company operations.
Other Costs / Costs/(Income)
Other incomecosts/(income) includes settlement charges, net of any insurance recoveries, related to the probable resolution of certain customer claims related to a previous temporary suspension of operations at a softgel manufacturing facility. Refer to Note 13 Commitments and Contingencies for further discussions of such claims.
The following table summarizes the significant costs recorded within restructuring and other costs:
| | | | | | | | | | | | | | | | | | | | | | | |
| Three Months Ended
December 31, | | | | Six Months Ended
December 31, | | |
(Dollars in millions) | 2018 | | 2017 | | 2018 | | 2017 |
| Restructuring costs: | | | | | | | |
| Employee-related reorganization | $ | 0.1 | | $ | 1.6 | | $ | 9.8 | | $ | 3.3 |
| | | | | | | |
| Facility exit and other costs | — | | (0.7) | | — | | (0.2) |
| Total restructuring costs | $ | 0.1 | | $ | 0.9 | | $ | 9.8 | | $ | 3.1 |
| Other - customer claims, net of insurance recoveries | — | | (0.8) | | — | | (1.8) |
| Total restructuring and other costs | $ | 0.1 | | $ | 0.1 | | $ | 9.8 | | $ | 1.3 |
10. DERIVATIVE INSTRUMENTS AND HEDGING ACTIVITIES
|
| | | | | | | | | | | | | | | |
| | Three Months Ended
December 31, | | Six Months Ended
December 31, |
(Dollars in millions) | 2017 | | 2016 | | 2017 | | 2016 |
| Restructuring costs: | | | | | | | |
| Employee-related reorganization | $ | 1.6 |
| | $ | (0.1 | ) | | $ | 3.3 |
| | $ | 0.7 |
|
| Facility exit and other costs | (0.7 | ) | | 0.2 |
| | (0.2 | ) | | 0.5 |
|
| Total restructuring costs | $ | 0.9 |
| | $ | 0.1 |
| | $ | 3.1 |
| | $ | 1.2 |
|
| Other - customer claims net of insurance recoveries | (0.8 | ) | | 3.2 |
| | (1.8 | ) | | 3.2 |
|
| Total restructuring and other costs | $ | 0.1 |
| | $ | 3.3 |
| | $ | 1.3 |
| | $ | 4.4 |
|
| |
9. | DERIVATIVE INSTRUMENTS AND HEDGING ACTIVITIES |
The Company is exposed to fluctuations in the applicable exchange rate on its investments in foreign operations. While the Company does not actively hedge against changes in foreign currency, the Company has mitigated its exposure from its investments in its European operations by denominating a portion of its debt in euros. At December 31, 2017,2018, the Company had euro-denominated debt outstanding of $811.9$777.7 million that is designated and qualifies as a hedge of a net investment in foreign operations. For non-derivatives designated and qualifying as net investment hedges, the effective portions of the translation gains or losses are reported in accumulated other comprehensive income/(loss) as part of the cumulative translation adjustment. The ineffectivenon-hedge portions of
the translation gains or losses are reported in the statement of operations. The following table includes net investment hedge activity during the three and six months ended December 31, 20172018 and December 31, 2016.2017.
| | | | | | | | | | | | | | | | | | | | | |
| Three Months Ended
December 31, | | | | Six Months Ended
December 31, | | |
| (Dollars in millions) | 2018 | | 2017 | | 2018 | | 2017 |
Unrealized foreign exchange gain/(loss) within other comprehensive income | $ | 15.6 | | $ | (3.9) | | $ | 11.4 | | $ | (21.5) |
Unrealized foreign exchange gain/(loss) within statement of operations | $ | 9.4 | | $ | (2.8) | | $ | 6.9 | | $ | (16.2) |
|
| | | | | | | | | | | | | | | |
| | Three Months Ended
December 31, | | Six Months Ended
December 31, |
| (Dollars in millions) | 2017 | | 2016 | | 2017 | | 2016 |
Unrealized foreign exchange gain/(loss) within other comprehensive income | $ | (3.9 | ) | | $ | 13.6 |
| | $ | (21.5 | ) | | $ | 10.0 |
|
Unrealized foreign exchange gain/(loss) within statement of operations | $ | (2.8 | ) | | $ | 10.2 |
| | $ | (16.2 | ) | | $ | 7.6 |
|
The net accumulated gain of the instrument designated as thea hedge as of December 31, 20172018 within other comprehensive income/(loss) was approximately $38.5$59.0 million. Amounts are reclassified out of accumulated other comprehensive income/(loss) into earnings when the entity to which the gains and losses relate is either sold or substantially liquidated.
11. INCOME TAXES
U.S. Tax Reform
On December 22, 2017, the U.S. government enacted wide-ranging tax legislation, the Tax Cuts and Jobs Act (the "2017 Tax Act"). The 2017 Tax Act significantly revises U.S. tax law by, among other provisions, (a) lowering the applicable U.S. federal statutory income tax rate from 35% to 21%, (b) creating a partial territorial tax system that includes imposing a mandatory one-time transition tax on previously deferred foreign earnings, (c) creating provisions regarding the (1) Global Intangible Low Tax Income ("GILTI"), (2) the Foreign Derived Intangible Income ("FDII") deduction, and (3) the Base Erosion Anti-Abuse Tax ("BEAT"), and (d) eliminating or reducing certain income tax deductions, such as interest expense, executive compensation expenses, and certain employee expenses. While the impact of the mandatory one-time transition tax was recognized in fiscal 2018, the remaining provisions are effective for fiscal years after 2018.
ASC 740, Income Taxes ("ASC 740") requires the effects of changes in tax laws to be recognized in the period in which the legislation is enacted. However, due to the complexity and significance of the 2017 Tax Act’s provisions, the SEC staff issued Staff Accounting Bulletin No. 118 ("SAB 118"), which allowsallowed companies to record the tax effects of the 2017 Tax Act on a provisional basis based on a reasonable estimate and then, if necessary, subsequently adjust such amounts during a limited measurement period as more information becomesbecame available. The measurement period ends when a company has obtained, prepared,ended December 22, 2018 and analyzedour accounting for the information necessary to finalize its accounting, but cannot extend beyond one year from enactment. As a resulttax effects of the 2017 Tax Act through December 31, 2018 is complete as of December 31, 2018. For the Company revised its estimated annual effective rate to reflect the change in the U.S. federal statutory rate. The revised blended U.S. federal statutory tax rate for the fiscal year is 28%.
Measurement of certain income tax effects that can be reasonably estimated (provisional amounts)
During the second quarterthree and six months ended December 31, 2017,2018, the Company recorded a one-timenet benefit of $6.9 million, reducing the estimated net charge of $46.0from $42.5 million within its incomepreviously recorded during fiscal 2018, to $35.6 million. This reduction was primarily related to additional foreign tax provision as a provisional estimate of the net accounting impact of the 2017 Tax Act in accordancecredit benefits associated with SAB 118. The net charge is comprised of the following: (i) expense of $48.7 million related to the mandatory transition tax charge for deemed repatriation of deferred foreign income, $8.7 million of which the Company expects to pay over an 8-year period after considering the use of certain net operating losses and foreign tax credits, and certain limitations on executive compensation; (ii) an additional $9.5 million charge relatingincome. There were no other changes recorded to the impact of provisional changes in the Company's intentions with respect to future repatriation of undistributed earnings from non-U.S. subsidiaries and (iii) a benefit of $12.2 million related to a revaluation of the Company’s deferred tax assets and liabilities. The one-time net charge, which was recorded on a provisional basis, increased the Company’s effective tax rate by 164% and 154% during the three-month and six-month periods ended December 31, 2017, respectively.
Given the significant complexity of the 2017 Tax Act, anticipated guidance from the U.S. Treasury concerning implementation of the 2017 Tax Act, and the potential for additional guidance from the SEC or the FASBprovision related to the 2017 Tax Act, the provisional estimates that the Company recorded may require adjustment during the measurement period.Act. The provisional estimates were based on the Company’s present understanding of the 2017 Tax Act and other information available as of the time of the estimates, including assumptions and expectations about future events, such as its projected financial performance, and are subject to further refinement as additional information becomes available (including the Company’s actual full fiscal 2018 results of operations, as well as potential new or interpretative guidance issued by the SEC, the FASB, or the Internal Revenue Service) and the Company continues its analysis. The Company continues to analyze the changes to certain income tax deductions, assess calculations of earnings and profits in certain foreign subsidiaries, including whether those earnings are held in cash or other assets, and gather additional data to compute the full impact of the 2017 Tax Act on the Company’s deferred and current tax assets and liabilities.
Measurement of certain income tax effects that cannot be reasonably estimated
Because of the complexity of the new GILTI tax rules, the Company continues to evaluate this provision of the 2017 Tax Act and the application of ASC 740. In accordance with ASC 740, the Company will make an accounting policy election of either (1) treating taxes due on future U.S. inclusions in taxable income related to GILTI as a current-period expense when incurred (the “period cost method”) or (2) factoring such amounts into the Company's measurement of its deferred taxes (the “deferred method”). The Company's selection of an accounting policy with respect to the new GILTI tax rules will depend, in part, on analyzing its global income to determine whether it expects to have future U.S. inclusions in taxable income related to GILTI and, if so, what the impact is expected to be. Whether the Company expects to have future U.S. inclusions in taxable income related to GILTI depends on not only the Company's current structure and estimated future results of global operations, but also its intent and ability to modify its structure. Therefore, the Company has not made any adjustment related to potential GILTI tax in its financial statements and has not made a policy decision regarding whether to record deferred tax on GILTI.
Additionally, the Company continues to evaluate the potential impact of all other provisions, including but not limited to provisions regarding the FDII, BEAT, interest expense and certain employee expense deductions, as well as the state tax impact of the 2017 Tax Act. The Company is currently in the process of analyzing its structure and estimated future results and, as a result, is not yet able to reasonably estimate the effect of these provisions of the 2017 Tax Act.Act, as the U.S. Treasury Department has and is expected to continue issuing guidance related to the 2017 Tax Act during the Company’s fiscal year 2019.
As noted above, the 2017 Tax Act subjects a US Company to tax on GILTI earned by certain foreign subsidiaries. The Company will account for GILTI in the year the tax is incurred as a period cost.
Other Tax Matters
The Company accounts for income taxes in accordance with ASC 740. Generally, fluctuations in the effective tax rate are primarily due to changes in U.S. and non-U.S. pretax income resulting from the Company’s business mix and changes in the tax impact of special items and other discrete tax items, which may have unique tax implications depending on the nature of the item. Such discrete items include, but are not limited to, changes in foreign statutory tax rates, the amortization of certain assets, and the tax impact of changes in its ASC 740 unrecognized tax benefit reserves. In the normal course of business, the Company is subject to examination by taxing authorities around the world, including such major jurisdictions as the United States, Germany, France, and the United Kingdom. The Company is no longer subject to new non-U.S. incomeexaminations by the relevant tax examinationsauthorities for years prior to fiscal year 2008.2009. Under the terms of the 2007 purchase agreement by which the selling stockholders at that time acquired their interest in the Company, the Company is indemnified by its former owner for tax liabilities that may arise after the 2007 purchase that relate to tax periods prior to April 10, 2007. The indemnification agreement applies to, among other taxes, any and all federal, state, and international income-based taxes as well as related interest and penalties. As of December 31, 20172018 and June 30, 2017,2018, approximately $0.7$0.6 million and $0.8$0.7 million, respectively, of unrecognized tax benefit are subject to indemnification by the Company's former owner.
ASC 740 includes guidance on the accounting for uncertainty in income taxes recognized in the financial statements. This standard provides that a tax benefit from an uncertain tax position may be recognized when it is more likely than not that the position will be sustained upon examination, including resolution of any related appeal or litigation process, based on the technical merits. As of December 31, 2017,2018 and June 30, 2018, the Company had a total of $52.5$2.0 million and $2.2 million of unrecognized tax benefits. A reconciliationbenefits, respectively.
As of
its reserves for uncertain tax positions, excluding accrued interest and penalties, for December 31,
2017 is as follows: |
| | | |
| (Dollars in millions) | |
| Balance at June 30, 2017 | $ | 52.5 |
|
| Additions for tax positions of current year | — |
|
| Balance at December 31, 2017 | $ | 52.5 |
|
As of December 31, 20172018 and June 30, 2017,2018, the Company had a total of $57.5$3.7 million and $57.5$4.1 million,, respectively, of uncertain tax positions (including accrued interest and penalties). As of these dates, $41.4$2.0 million and $41.4$2.2 million,, respectively, represent the amount of unrecognized tax benefits, which, if recognized, would favorably affect the effective income tax rate. The Company recognizes interest and penalties related to uncertain tax positions as a component of income tax expense. As of December 31, 20172018 and June 30, 2017,2018, the Company has approximately $5.0$1.7 million and $5.0$2.0 million,, respectively, of accrued interest and penalties related to uncertain tax positions. As of these dates, the portion of such interest and penalties subject to indemnification by its former owner is $1.5$1.3 million and $1.7$1.6 million,, respectively.
12. EMPLOYEE RETIREMENT BENEFIT PLANS
| |
11. | EMPLOYEE RETIREMENT BENEFIT PLANS |
Components of the Company’s net periodic benefit costs are as follows: | | | | Three Months Ended
December 31, | | Six Months Ended
December 31, | | Three Months Ended
December 31, | | | Six Months Ended
December 31, | |
| (Dollars in millions) | 2017 | | 2016 | | 2017 | | 2016 | (Dollars in millions) | 2018 | | 2017 | | 2018 | | 2017 |
| Components of net periodic benefit cost: | | | | | | | | Components of net periodic benefit cost: | | | | | | | |
| Service cost | $ | 0.9 |
| | $ | 0.8 |
| | $ | 1.8 |
| | $ | 1.6 |
| Service cost | $ | 0.9 | | $ | 0.9 | | $ | 1.8 | | $ | 1.8 |
| Interest cost | 1.8 |
| | 1.6 |
| | 3.6 |
| | 3.3 |
| Interest cost | 1.9 | | 1.8 | | 3.8 | | 3.6 |
| Expected return on plan assets | (2.9 | ) | | (2.6 | ) | | (5.8 | ) | | (5.4 | ) | Expected return on plan assets | (2.6) | | (2.9) | | (5.2) | | (5.8) |
Amortization (1) | 0.6 |
| | 1.0 |
| | 1.2 |
| | 2.1 |
| Amortization (1) | 0.6 | | 0.6 | | 1.2 | | 1.2 |
| Net amount recognized | $ | 0.4 |
| | $ | 0.8 |
| | $ | 0.8 |
| | $ | 1.6 |
| Net amount recognized | $ | 0.8 | | $ | 0.4 | | $ | 1.6 | | $ | 0.8 |
| |
(1) | Amount represents the amortization of unrecognized actuarial gains/(losses). |
(1) Amount represents the amortization of unrecognized actuarial gains/(losses).
As previously disclosed, the Company notified the trustees of a multi-employer pension plan of its withdrawal from participation in such plan in fiscal 2012. The actuarial review process administered by the plan trustees ended in fiscal 2015. The liability reported reflects the present value of the Company's expected future long-term obligations. The estimated discounted value of the projected contributions related to such plans was $39.1$38.9 million and $39.0 million as of December 31, 20172018 and June 30, 20172018, respectively, and is included within pension liability on the consolidated balance sheets. The annual cash impact associated with the Company's obligationobligations in such plan approximatesis approximately $1.7 million per year.
| |
12. | EQUITY AND ACCUMULATED OTHER COMPREHENSIVE INCOME/(LOSS) |
13. EQUITY AND ACCUMULATED OTHER COMPREHENSIVE INCOME/(LOSS)
Description of Capital Stock
The Company is authorized to issue 1,000,000,000 shares of common stock, par value $0.01 per share ("Common Stock"), and 100,000,000 shares of preferred stock, par value $0.01 per share. In accordance withUnder the Company's amended and restated certificate of incorporation, each share of common stockCommon Stock has one vote, and the common stockCommon Stock votes together as a single class.
Public Stock Offering
On July 27, 2018, the Company completed the 2018 Equity Offering, a public offering in which the Company sold 11.4 million shares, including the underwriters' over-allotment option, of Common Stock at a price of $40.24 per share, before underwriting discounts and commissions. Net of these discounts and commissions and other offering expenses, the Company obtained total net proceeds from the 2018 Equity Offering, including the over-allotment exercise, of $445.5 million. The net proceeds of the 2018 Equity Offering were used to repay a corresponding portion of the outstanding borrowings under Operating Company's U.S. dollar-denominated term loans.
On September 29, 2017, the Company completed a public offering of its common stock (the "Equity"2017 Equity Offering"), pursuant to which the Company sold 7.4 million shares, including shares sold pursuant to an exercise of the underwriters' over-allotment option, of Common Stock at a price of $39.10 per share, before underwriting discounts and commissions. Net of these discounts and commissions and other offering expenses, the Company obtained total net proceeds from the 2017 Equity Offering, including the over-allotment exercise, of $277.8 million. The net proceeds of the 2017 Equity Offering after payment of the discount and related fees and expenses, were used to fund a portion of the consideration for the Catalent Indiana acquisition due at its closing.
Outstanding Stock
Shares outstanding include shares of unvested restricted stock. Unvested restricted stock included in reportable shares outstanding was 0.30.7 million shares as of December 31, 2017.2018. Shares of unvested restricted stock are excluded from our calculation of basic weighted average shares outstanding, but their dilutive impact is added back in the calculation of diluted weighted average shares outstanding.outstanding, except when the effect would be anti-dilutive.
Stock Repurchase Program
On October 29, 2015, the Company’s Board of Directors authorized a share repurchase program to use up to $100.0 million to repurchase shares of its outstanding common stock.Common Stock. Under the program, the Company is authorized to repurchase shares through open market purchases, privately negotiated transactions, or otherwise as permitted by applicable federal securities laws. There has been no purchase pursuant to this program as of December 31, 2017.
2018.
Accumulated Other Comprehensive Income/(Loss)(loss)
The components of the changes in the cumulative translation adjustment, minimum pension liability, and available for sale investment for the three and six months ended December 31, 20172018 and December 31, 20162017 are presented below.
| | | | Three Months Ended
December 31, | | Six Months Ended
December 31, | | Three Months Ended
December 31, | | | Six Months Ended
December 31, | |
| (Dollars in millions) | 2017 | | 2016 | | 2017 | | 2016 | (Dollars in millions) | 2018 | | 2017 | | 2018 | | 2017 |
| Foreign currency translation adjustments: | | | | | | | | Foreign currency translation adjustments: | | | | | | | |
| Net investment hedge | $ | (3.9 | ) | | $ | 13.6 |
| | $ | (21.5 | ) | | $ | 10.0 |
| Net investment hedge | $ | 15.6 | | $ | (3.9) | | $ | 11.4 | | $ | (21.5) |
| Long-term intercompany loans | (2.3 | ) | | (13.3 | ) | | 11.2 |
| | (20.9 | ) | Long-term intercompany loans | (10.8) | | (2.3) | | (14.1) | | 11.2 |
| Translation adjustments | (5.2 | ) | | (59.8 | ) | | 30.9 |
| | (49.2 | ) | Translation adjustments | (18.9) | | (5.2) | | (21.7) | | 30.9 |
| Total foreign currency translation adjustment, pretax | (11.4 | ) | | (59.5 | ) | | 20.6 |
| | (60.1 | ) | Total foreign currency translation adjustment, pretax | (14.1) | | (11.4) | | (24.4) | | 20.6 |
| Tax expense/(benefit) | 2.0 |
| | 4.9 |
| | (4.1 | ) | | 3.7 |
| Tax expense/(benefit) | 3.5 | | 2.0 | | 2.0 | | (4.1) |
| Total foreign currency translation adjustment, net of tax | $ | (13.4 | ) | | $ | (64.4 | ) | | $ | 24.7 |
| | $ | (63.8 | ) | Total foreign currency translation adjustment, net of tax | $ | (17.6) | | $ | (13.4) | | $ | (26.4) | | $ | 24.7 |
| | | | | | | | | | | | | | | | |
| Net change in minimum pension liability | | | | | | | | Net change in minimum pension liability | |
| Net gain/(loss) recognized during the period | 0.6 |
| | 1.0 |
| | 1.2 |
| | 2.1 |
| |
| Total pension, pretax | 0.6 |
| | 1.0 |
| | 1.2 |
| | 2.1 |
| |
| Tax expense/(benefit) | 0.1 |
| | 0.3 |
| | 0.3 |
| | 0.6 |
| |
| | Net gain recognized during the period | | Net gain recognized during the period | $ | 0.7 | | $ | 0.6 | | 1.3 | | 1.2 |
| | Total pension liability, pretax | | Total pension liability, pretax | 0.7 | | 0.6 | | 1.3 | | 1.2 |
| Tax expense | | Tax expense | 0.1 | | 0.1 | | 0.3 | | 0.3 |
| Net change in minimum pension liability, net of tax | $ | 0.5 |
| | $ | 0.7 |
| | $ | 0.9 |
| | $ | 1.5 |
| Net change in minimum pension liability, net of tax | $ | 0.6 | | $ | 0.5 | | $ | 1.0 | | $ | 0.9 |
| | | | | | | | | | | | | | | | |
| Net change in available for sale investment: | | | | | | | | Net change in available for sale investment: | |
| Net gain/(loss) recognized during the period | (3.6 | ) | | 24.5 |
| | (8.8 | ) | | 24.5 |
| |
| Net loss recognized during the period | | Net loss recognized during the period | $ | — | | $ | (3.6) | | — | | (8.8) |
| Total available for sale investment, pretax | (3.6 | ) | | 24.5 |
| | (8.8 | ) | | 24.5 |
| Total available for sale investment, pretax | — | | (3.6) | | — | | (8.8) |
| Tax expense/(benefit) | (0.6 | ) | | 9.2 |
| | (2.4 | ) | | 9.2 |
| |
| Tax benefit | | Tax benefit | — | | (0.6) | | — | | (2.4) |
| Net change in available for sale investment, net of tax | $ | (3.0 | ) | | $ | 15.3 |
| | $ | (6.4 | ) | | $ | 15.3 |
| Net change in available for sale investment, net of tax | $ | — | | $ | (3.0) | | $ | — | | $ | (6.4) |
| | | | | | | | | | | | | | | | |
For the three months ended December 31, 2017,2018, the changes in accumulated other comprehensive income,income/(loss), net of tax by component are as follows:
| | | | | | | | | | | | | | | | | | | | | | | | | | | |
| (Dollars in millions) | Foreign Exchange Translation Adjustments | | Pension and Liability Adjustments | | | | | | Available for Sale Investment Adjustments | | Total |
| Balance at September 30, 2018 | $ | (293.9) | | $ | (39.2) | | | | | | $ | (1.1) | | $ | (334.2) |
| Other comprehensive income/(loss) before reclassifications | (17.6) | | — | | | | | | — | | (17.6) |
| Amounts reclassified from accumulated other comprehensive income/(loss) | — | | 0.6 | | | | | | — | | 0.6 |
| Net current period other comprehensive income/(loss) | (17.6) | | 0.6 | | | | | | — | | (17.0) |
| Balance at December 31, 2018 | $ | (311.5) | | $ | (38.6) | | | | | | $ | (1.1) | | $ | (351.2) |
|
| | | | | | | | | | | | | | | |
| (Dollars in millions) | Foreign Exchange Translation Adjustments | | Pension and Liability Adjustments | | Available for Sale Investment Adjustments | | Total |
| Balance at September 30, 2017 | $ | (242.6 | ) | | $ | (43.5 | ) | | $ | 7.1 |
| | $ | (279.0 | ) |
| Other comprehensive income/(loss) before reclassifications | (13.4 | ) | | — |
| | (3.0 | ) | | (16.4 | ) |
| Amounts reclassified from accumulated other comprehensive income | — |
| | 0.5 |
| | — |
| | 0.5 |
|
| Net current period other comprehensive income (loss) | (13.4 | ) | | 0.5 |
| | (3.0 | ) | | (15.9 | ) |
| Balance at December 31, 2017 | $ | (256.0 | ) | | $ | (43.0 | ) | | $ | 4.1 |
| | $ | (294.9 | ) |
For the six months ended December 31, 2017,2018, the changes in accumulated other comprehensive income,income/(loss), net of tax by component are as follows:
| | | | | | | | | | | | | | | | | | | | | | | | | | | |
| (Dollars in millions) | Foreign Exchange Translation Adjustments | | Pension and Liability Adjustments | | | | | | Available for Sale Investment Adjustments | | Total |
| Balance at June 30, 2018 | $ | (285.1) | | $ | (39.6) | | | | | | $ | (1.1) | | $ | (325.8) |
| Other comprehensive income/(loss) before reclassifications | (26.4) | | — | | | | | | — | | (26.4) |
| Amounts reclassified from accumulated other comprehensive income/(loss) | — | | 1.0 | | | | | | — | | 1.0 |
| Net current period other comprehensive income/(loss) | (26.4) | | 1.0 | | | | | | — | | (25.4) |
| Balance at December 31, 2018 | $ | (311.5) | | $ | (38.6) | | | | | | $ | (1.1) | | $ | (351.2) |
14. COMMITMENTS AND CONTINGENCIES
|
| | | | | | | | | | | | | | | |
| (Dollars in millions) | Foreign Exchange Translation Adjustments | | Pension and Liability Adjustments | | Available for Sale investment Adjustments | | Total |
| Balance at June 30, 2017 | $ | (280.7 | ) | | $ | (43.9 | ) | | $ | 10.5 |
| | $ | (314.1 | ) |
| Other comprehensive income/(loss) before reclassifications | 24.7 |
| | — |
| | (6.4 | ) | | 18.3 |
|
| Amounts reclassified from accumulated other comprehensive income | — |
| | 0.9 |
| | — |
| | 0.9 |
|
| Net current period other comprehensive income (loss) | 24.7 |
| | 0.9 |
| | (6.4 | ) | | 19.2 |
|
| Balance at December 31, 2017 | $ | (256.0 | ) | | $ | (43.0 | ) | | $ | 4.1 |
| | $ | (294.9 | ) |
| |
13. | COMMITMENTS AND CONTINGENCIES
|
On August 14, 2018, Operating Company acquired Juniper pursuant to the Juniper Merger Agreement. On November 14, 2016, Juniper filed with the SEC restated audited consolidated financial statements for the fiscal years ended December 31, 2013 through December 31, 2015, including the unaudited consolidated financial information for each quarterly period within the fiscal years ended December 31, 2014 and 2015, and restated unaudited consolidated financial statements for the quarters ended March 31, 2016 and June 30, 2016 and the related quarters in 2015, in order to correct certain timing errors regarding how it recognized revenue from a supply contract with an affiliate of Merck KGaA. On January 24, 2017, Juniper received a subpoena from the SEC requesting information concerning these restatements and related issues. Juniper responded to the subpoena and is cooperating with the SEC’s inquiry, including the taking of testimony from former Juniper employees and others. The Company continues to receive and resolve claims stemming from a prior, temporary, regulatory suspension of one of our manufacturing facilities. To date, more than 30 customersunderstands that the inquiry is ongoing but does not believe the outcome of the facility have presented claims againstinvestigation will be material to it; nonetheless, the Company for alleged losses, including lost profits and other types of indirect or consequential damagescannot provide any assurance regarding that they have allegedly suffered due to the temporary suspension, or have reserved their right to do so subsequently. The Company is unable to estimate at this time either the total value of claims that are reasonably possible to be asserted with respect to this matter or the likely cost to resolve them, although (a) as of the end of December 31, 2017, the Company has settled 18 customer claims and (b) certain remaining customers have presented the Company with support for other claims having an aggregate claim value of approximately $4.0 million. To date, none of the asserted claims takes into account limitations of liability in the contracts governing these claims or any other defense that the Company may assert. In addition, the Company may have insurance for additional costs it may incur as a result of such claims, subject to various deductibles and other limitations, but there can be no assurance as to the aggregate amount or timing of insurance recoveries against any such costs.outcome.
Other
From time to time, the Company may be involved in legal proceedings arising in the ordinary course of business, including, without limitation, inquiries and claims concerning environmental contamination as well as litigation and allegations in connection with acquisitions, product liability, manufacturing or packaging defects, and claims for reimbursement for the cost of lost or damaged active pharmaceutical ingredients, the cost of any of which could be significant. The Company intends to vigorously defend itself against any such litigation and does not currently believe that the outcome of any such litigation will have a material adverse effect on the Company’s financial statements. In addition, the healthcare industry is highly regulated and government agencies continue to scrutinize certain practices affecting government programs and otherwise.
From time to time, the Company receives subpoenas or requests for information relating to the business practices and activities of customers or suppliers from various governmental agencies or private parties, including from state attorneys general, the U.S. Department of Justice, and private parties engaged in patent infringement, antitrust, tort, and other litigation. The Company generally responds to such subpoenas and requests in a timely and thorough manner, which responses sometimes require considerable time and effort and can result in considerable costs being incurred. The Company expects to incur costs in future periods in connection with future requests.
15. SEGMENT INFORMATION
The Company conducts its business within the following operating segments: Softgel Technologies, Biologics and Specialty Drug Delivery, Solutions,Oral Drug Delivery, and Clinical Supply Services. The Company evaluates the performance of its segments based on segment earnings before noncontrolling interest, other (income) expense,(expense)/income, impairments, restructuring costs, interest expense, income tax expense/(benefit)/expense,, and depreciation and amortization (“("Segment EBITDA”EBITDA"). EBITDA"EBITDA from continuing operationsoperations" is consolidated earnings from continuing operations before interest expense, income tax expense/(benefit)/expense,, and depreciation and amortization and is adjusted for the income or loss attributable to noncontrolling interest.amortization. Segment EBITDA and EBITDA from continuing operations are not defined in GAAP and may not be comparable to similarly titled measures used by other companies.
The following tables include net revenue and Segment EBITDA during the three and six months ended December 31, 20172018 and December 31, 2016:2017:
| | | | Three Months Ended
December 31, | | Six Months Ended
December 31, | | Three Months Ended
December 31, | | | Six Months Ended
December 31, | |
| (Dollars in millions) | 2017 | | 2016 | | 2017 | | 2016 | (Dollars in millions) | 2018 | | 2017 | | 2018 | | 2017 |
| Softgel Technologies | | | | | | | | Softgel Technologies | | | | | | | |
| Net revenue | $ | 228.1 |
| | $ | 201.9 |
| | $ | 447.8 |
| | $ | 388.3 |
| Net revenue | $ | 213.7 | | $ | 228.1 | | $ | 412.9 | | $ | 447.8 |
| Segment EBITDA | 50.1 |
| | 43.4 |
| | 85.2 |
| | 73.9 |
| Segment EBITDA | $ | 44.2 | | $ | 50.1 | | $ | 77.5 | | $ | 85.2 |
| Drug Delivery Solutions | | | | | | | | |
| Biologics and Specialty Drug Delivery | | Biologics and Specialty Drug Delivery | |
| Net revenue | | Net revenue | 184.3 | | 148.7 | | 338.9 | | 240.4 |
| Segment EBITDA | | Segment EBITDA | 50.8 | | 39.9 | | 77.3 | | 48.6 |
| Oral Drug Delivery | | Oral Drug Delivery | |
| Net revenue | 285.4 |
| | 214.0 |
| | 511.2 |
| | 405.3 |
| Net revenue | 154.0 | | 137.2 | | 284.1 | | 271.8 |
| Segment EBITDA | 81.1 |
| | 50.0 |
| | 128.5 |
| | 92.0 |
| Segment EBITDA | 44.8 | | 41.2 | | 72.2 | | 79.9 |
| Clinical Supply Services | | | | | | | | Clinical Supply Services | |
| Net revenue | 108.7 |
| | 77.0 |
| | 218.4 |
| | 152.0 |
| Net revenue | 80.8 | | 108.7 | | 158.5 | | 218.4 |
| Segment EBITDA | 19.0 |
| | 11.6 |
| | 35.7 |
| | 22.1 |
| Segment EBITDA | 21.0 | | 19.0 | | 41.2 | | 35.7 |
| Inter-segment revenue elimination | (15.9 | ) | | (9.2 | ) | | (27.2 | ) | | (19.7 | ) | Inter-segment revenue elimination | (9.8) | | (16.4) | | (19.6) | | (28.2) |
Unallocated Costs (1) | (48.2 | ) | | (19.8 | ) | | (82.2 | ) | | (40.1 | ) | |
| Combined Totals: | | | | | | | | |
Unallocated costs (1) | | Unallocated costs (1) | (29.4) | | (48.2) | | (69.2) | | (82.2) |
| Combined totals: | | Combined totals: | |
| Net revenue | $ | 606.3 |
| | $ | 483.7 |
| | $ | 1,150.2 |
| | $ | 925.9 |
| Net revenue | $ | 623.0 | | $ | 606.3 | | $ | 1,174.8 | | $ | 1,150.2 |
| | | | | | | | | | | | | | | | |
| EBITDA from continuing operations | $ | 102.0 |
| | $ | 85.2 |
| | $ | 167.2 |
| | $ | 147.9 |
| |
| EBITDA from operations | | EBITDA from operations | $ | 131.4 | | $ | 102.0 | | $ | 199.0 | | $ | 167.2 |
| |
(1) | Unallocated costs include restructuring and special items, equity-based compensation, impairment charges, certain other corporate directed costs, and other costs that are not allocated to the segments as follows: |
|
| | | | | | | | | | | | | | | |
| | Three Months Ended
December 31, | | Six Months Ended
December 31, |
| (Dollars in millions) | 2017 | | 2016 | | 2017 | | 2016 |
| Impairment charges and gain/(loss) on sale of assets | $ | (4.2 | ) | | $ | (0.5 | ) | | $ | (4.2 | ) | | $ | (0.5 | ) |
| Equity compensation | (8.5 | ) | | (4.9 | ) | | (15.5 | ) | | (11.8 | ) |
Restructuring and other special items (2) | (11.9 | ) | | (7.2 | ) | | (24.2 | ) | | (13.1 | ) |
Other income/(expense), net (3) | (13.6 | ) | | 1.8 |
| | (19.3 | ) | | 3.9 |
|
| Non-allocated corporate costs, net | (10.0 | ) | | (9.0 | ) | | (19.0 | ) | | (18.6 | ) |
| Total unallocated costs | $ | (48.2 | ) | | $ | (19.8 | ) | | $ | (82.2 | ) | | $ | (40.1 | ) |
| |
(2) | Segment results do not include restructuring and certain acquisition-related costs. |
| |
(3) | Refer to Note 7 for details of financing charges and foreign currency translation adjustments recorded within other income/(expense), net. |
| | | | | | | | | | | | | | | | | | | | | | | |
| Three Months Ended
December 31, | | | | Six Months Ended
December 31, | | |
| (Dollars in millions) | 2018 | | 2017 | | 2018 | | 2017 |
| Impairment charges and gain/(loss) on sale of assets | $ | 0.1 | | $ | (4.2) | | $ | (2.8) | | $ | (4.2) |
| Stock-based compensation | (7.5) | | (8.5) | | (17.5) | | (15.5) |
Restructuring and other special items (a) | (5.9) | | (11.9) | | (19.1) | | (24.2) |
| | | | | | | |
| | | | | | | |
| | | | | | | |
Other (expense), net (b) | (1.4) | | (13.1) | | (7.1) | | (18.3) |
| Non-allocated corporate costs, net | (14.7) | | (10.5) | | (22.7) | | (20.0) |
| Total unallocated costs | $ | (29.4) | | $ | (48.2) | | $ | (69.2) | | $ | (82.2) |
(a) Restructuring and other special items include transaction and integration costs associated primarily with the acquisitions of Catalent Indiana and Juniper.
(b) Refer to Note 8, Other Expense for details of financing changes and foreign currency translation adjustments recorded within Other (expense), net.
Provided below is a reconciliation
ofbetween net earnings/(loss) and EBITDA from
continuing operations to earnings/(loss) from continuing operations:
| | | | Three Months Ended
December 31, | | Six Months Ended
December 31, | | Three Months Ended
December 31, | | | Six Months Ended
December 31, | |
| (Dollars in millions) | 2017 | | 2016 | | 2017 | | 2016 | (Dollars in millions) | 2018 | | 2017 | | 2018 | | 2017 |
| Earnings/(loss) from continuing operations | $ | (21.9 | ) | | $ | 17.4 |
| | $ | (18.1 | ) | | $ | 22.0 |
| |
| Net earnings/(loss) | | Net earnings/(loss) | $ | 49.0 | | $ | (21.9) | | $ | 34.6 | | $ | (18.1) |
| Depreciation and amortization | 46.8 |
| | 35.5 |
| | 85.8 |
| | 71.3 |
| Depreciation and amortization | 54.6 | | 46.8 | | 107.5 | | 85.8 |
| Interest expense, net | 27.2 |
| | 22.8 |
| | 51.5 |
| | 44.9 |
| Interest expense, net | 25.5 | | 27.2 | | 53.6 | | 51.5 |
| Income tax expense/(benefit) | 49.9 |
| | 9.5 |
| | 48.0 |
| | 9.7 |
| |
| EBITDA from continuing operations | $ | 102.0 |
| | $ | 85.2 |
| | $ | 167.2 |
| | $ | 147.9 |
| |
| Income tax expense | | Income tax expense | 2.3 | | 49.9 | | 3.3 | | 48.0 |
| | EBITDA from operations | | EBITDA from operations | $ | 131.4 | | $ | 102.0 | | $ | 199.0 | | $ | 167.2 |
The following table includes total assets for each segment, as well as reconciling items necessary to total the amounts reported in the consolidated financial statements:
| | | | | | | | | | | |
| (Dollars in millions) | December 31,
2018 | | June 30,
2018 |
| Assets | | | |
| Softgel Technologies | $ | 1,385.0 | | $ | 1,402.0 |
| Biologics and Specialty Drug Delivery | 1,793.4 | | 1,739.7 |
| Oral Drug Delivery | 1,211.9 | | 1,074.2 |
| Clinical Supply Services | 642.0 | | 613.0 |
| Corporate and eliminations | (590.7) | | (297.8) |
| Total assets | $ | 4,441.6 | | $ | 4,531.1 |
16. SUPPLEMENTAL BALANCE SHEET INFORMATION
|
| | | | | | | |
| (Dollars in millions) | December 31,
2017 | | June 30,
2017 |
| Assets | | | |
| Softgel Technologies | $ | 1,538.4 |
| | $ | 1,631.8 |
|
| Drug Delivery Solutions | 2,650.5 |
| | 1,639.0 |
|
| Clinical Supply Services | 620.3 |
| | 596.2 |
|
| Corporate and eliminations | (422.1 | ) | | (412.7 | ) |
| Total assets | $ | 4,387.1 |
| | $ | 3,454.3 |
|
| |
15. | SUPPLEMENTAL BALANCE SHEET INFORMATION |
SupplementarySupplemental balance sheet information at December 31, 20172018 and June 30, 20172018 is detailed in the following tables.
Inventories
Work-in-process and finished goods inventories include raw materials, labor, and overhead. Total inventories consist of the following:
| | | (Dollars in millions) | December 31,
2017 | | June 30,
2017 | (Dollars in millions) | December 31,
2018 | | June 30,
2018 |
| Raw materials and supplies | $ | 134.3 |
| | $ | 107.5 |
| Raw materials and supplies | $ | 157.3 | | $ | 137.1 |
| Work-in-process | 29.3 |
| | 42.8 |
| Work-in-process | 43.8 | | 42.3 |
| Finished goods | 69.9 |
| | 56.7 |
| Finished goods | 54.8 | | 48.3 |
| Total inventories, gross | 233.5 |
| | 207.0 |
| Total inventories, gross | 255.9 | | 227.7 |
| Inventory cost adjustment | (20.8 | ) | | (22.1 | ) | Inventory cost adjustment | (20.7) | | (18.6) |
| Inventories | $ | 212.7 |
| | $ | 184.9 |
| Inventories | $ | 235.2 | | $ | 209.1 |
Prepaid expenses and other
Prepaid expenses and other current assets consist of the following:
| | | | | | | | | | | |
| (Dollars in millions) | December 31,
2018 | | June 30,
2018 |
| Prepaid expenses | $ | 20.8 | | $ | 19.2 |
| Spare parts supplies | 10.6 | | 11.1 |
| Prepaid income tax | 11.0 | | 7.2 |
| | | |
| Non-U.S. value-added tax | 17.7 | | 12.5 |
| | | |
| | | |
| | | |
| Other current assets | 17.0 | | 15.2 |
| Prepaid expenses and other | $ | 77.1 | | $ | 65.2 |
|
| | | | | | | |
| (Dollars in millions) | December 31,
2017 | | June 30,
2017 |
| Prepaid expenses | $ | 19.0 |
| | $ | 12.3 |
|
| Spare parts supplies | 11.4 |
| | 11.8 |
|
| Prepaid income tax | 10.5 |
| | 11.5 |
|
| Non-US value added tax | 19.9 |
| | 16.0 |
|
| Available for sale investment | 9.8 |
| | 18.6 |
|
| Other current assets | 34.8 |
| | 27.6 |
|
| Prepaid expenses and other | $ | 105.4 |
| | $ | 97.8 |
|
Property, plant, and equipment, net
Property, plant, and equipment, net consist of the following:
| | | | | | | | | | | |
| (Dollars in millions) | December 31,
2018 | | June 30,
2018 |
| Land, buildings, and improvements | $ | 940.0 | | $ | 928.1 |
| Machinery, equipment, and capitalized software | 1,037.6 | | 988.1 |
| Furniture and fixtures | 16.3 | | 14.9 |
| Construction in progress | 179.5 | | 166.8 |
| Property, plant, and equipment, at cost | 2,173.4 | | 2,097.9 |
| Accumulated depreciation | (887.6) | | (827.3) |
| Property, plant, and equipment, net | $ | 1,285.8 | | $ | 1,270.6 |
|
| | | | | | | |
| (Dollars in millions) | December 31,
2017 | | June 30,
2017 |
| Land, buildings, and improvements | $ | 894.2 |
| | $ | 735.2 |
|
| Machinery, equipment, and capitalized software | 944.1 |
| | 825.0 |
|
| Furniture and fixtures | 13.5 |
| | 10.1 |
|
| Construction in progress | 179.9 |
| | 137.4 |
|
| Property, plant, and equipment, at cost | 2,031.7 |
| | 1,707.7 |
|
| Accumulated depreciation | (775.5 | ) | | (711.8 | ) |
| Property, plant, and equipment, net | $ | 1,256.2 |
| | $ | 995.9 |
|
Other accrued liabilities
Other accrued liabilities consist of the following:
| | | | | | | | | | | |
| (Dollars in millions) | December 31,
2018 | | June 30,
2018 |
| Accrued employee-related expenses | $ | 72.8 | | $ | 104.3 |
| Restructuring accrual | 11.5 | | 9.4 |
| | | |
| Accrued interest | 10.9 | | 16.5 |
| | | |
| Contract liability | 112.4 | | 100.9 |
| Accrued income tax | 6.5 | | 25.9 |
| Other accrued liabilities and expenses | 45.9 | | 55.9 |
| Other accrued liabilities | $ | 260.0 | | $ | 312.9 |
|
| | | | | | | |
| (Dollars in millions) | December 31,
2017 | | June 30,
2017 |
| Accrued employee-related expenses | $ | 72.6 |
| | $ | 96.4 |
|
| Restructuring accrual | 3.0 |
| | 5.9 |
|
| Accrued interest | 5.6 |
| | 0.9 |
|
| Deferred revenue and fees | 88.1 |
| | 84.9 |
|
| Accrued income tax | 22.2 |
| | 24.7 |
|
| Other accrued liabilities and expenses | 58.3 |
| | 68.4 |
|
| Other accrued liabilities | $ | 249.8 |
| | $ | 281.2 |
|
| |
ITEM 2. | ITEM 2. MANAGEMENT’S DISCUSSION AND ANALYSIS OF FINANCIAL CONDITION AND RESULTS OF OPERATIONS |
The Company
We are the leading global provider of advanced delivery technologies and development solutions for drugs, biologics, and consumer and animal health products. Our oral, injectable, and respiratory delivery technologies provide delivery solutions acrossaddress the full diversity of the pharmaceutical industry, including small molecules, biologics, and consumer and animal health products. Through our extensive capabilities and deep expertise in product development, we help our customers take products to market faster, including nearly half of new drug products approved by the FDAU.S. Food and Drug Administration in the last decade. Our advanced delivery technology platforms, which include those in our Softgel Technologies, Biologics and ourSpecialty Drug Delivery, Solutionsand Oral Drug Delivery segments, our proven
formulation, manufacturing, and regulatory expertise, and our broad and deep intellectual property enable our customers and their patients' needs to develop more products and better treatments for patients and consumers. Across both development and delivery, our commitment to reliably supply our customers’ and their patients' needs is the foundation for the value we provide; annually, we produce approximately 7273 billion doses for nearly 7,000 customer products or approximately one1 in every twenty20 doses of such productsproduct taken each year by patients and consumers around the world. We believe that through our investments in growth-enabling capacity and capabilities, our ongoing focus on operational and quality excellence, the sales of existing customer products, the introduction of new customer products, our innovation activities and patents, and our entry into new markets, we will continue to benefit from attractive and differentiated margins and realize the growth potential from these areas.
Critical Accounting Policies and Estimates
We prepare our financial statements in accordance with GAAP.generally accepted accounting principles in the United States ("GAAP"). These standards require management to make estimates and assumptions that affect amounts reported in the financial statements and accompanying notes. Such estimates include, but are not limited to, allowance for doubtful accounts, variable consideration in revenue recognition, inventory and long-lived asset valuation, goodwill and other intangible asset impairment, income taxes, derivative financial instruments, self-insurance accruals, loss contingencies, and restructuring charge reserves. Actual amounts may differ from these estimated amounts.
There was no material change to our critical accounting policies or in the underlying accounting assumptions and estimates from those described in our fiscal year 2017 Annual Report on FormFiscal 2018 10-K, other than recently adopted accounting principles as disclosed in Note 1 to the unaudited consolidated financial statements included elsewhere in this Quarterly Report on Form 10-Q, which adoptionadoptions had no material impact on net earnings.
Non-GAAP Performance Metrics
Use of EBITDA from continuing operations
Management measures operating performance based on consolidated earnings from continuing operations before interest expense, expense/(benefit) for income taxes, and depreciation and amortization (“("EBITDA from continuing operations”operations"). EBITDA from continuing operations is not defined under GAAP, and is not a measure of operating income, operating performance, or liquidity presented in accordance with GAAP, and is subject to important limitations.
We believe that the presentation of EBITDA from continuing operations enhances an investor’s understanding of our financial performance. We believe this measure is a useful financial metric to assess our operating performance from period to period by excluding certain items that we believe are not representative of our core business and use this measure for business planning purposes. In addition, given the significant investments that we have made in the past in property, plant, and equipment, depreciation and amortization expenses represent a meaningful portion of our cost structure. We believe that EBITDA from continuing operations will provide investors with a useful tool for assessing the comparability between periods of our ability to generate cash from operations sufficient to pay taxes, to service debt, and to undertake capital expenditures because it eliminates depreciation and amortization expense. We present EBITDA from continuing operations in order to provide supplemental information that we consider relevant for the readers of our consolidated financial statements, and such information is not meant to replace or supersede GAAP measures. Our definition of EBITDA from continuing operations may not be the same as similarly titled measures used by other companies. The most directly comparable GAAP measure to EBITDA from continuing operations is earnings/(loss) from continuing operations.net earnings. Included in this report is a reconciliation of earnings/(loss) from continuing operationsnet earnings to EBITDA from continuing operations.
In addition, we evaluate the performance of our segments based on segment earnings before noncontrolling interest, other (income)/expense, impairments, restructuring costs, interest expense, income tax expense/(benefit), and depreciation and amortization (“("Segment EBITDA”EBITDA").
Use of Constant Currency
As exchange rates are an important factor in understanding period-to-period comparisons, we believe the presentation of results on a constant currency basis in addition to reported results helps improve investors’ ability to understand our operating results and evaluate our performance in comparison to prior periods. Constant currency information compares results between periods as if exchange rates had remained constant period-over-period. We use results on a constant currency basis as one measure to evaluate our performance. In this Quarterly Report on Form 10-Q, we compute constant currency by calculating current-year results using prior-year foreign currency exchange rates. We generally refer to such amounts calculated on a constant currency basis as excluding the impact of foreign exchange. These results should be considered in addition to, not as a substitute for, results reported in accordance with GAAP. Results on a constant currency basis, as we present them, may not be comparable to similarly titled measures used by other companies and are not measures of performance presented in accordance with GAAP.
Other Non-GAAP Measures
Organic revenue growth and segmentSegment EBITDA growth are useful measures calculated by the Company to explain the underlying results and trends in the business. Organic revenue growth and segmentSegment EBITDA growth are measures used to show current year sales and earnings from existing operations and include joint ventures and revenue from product participation relatedproduct-participation-related activities entered into within the year. Organic revenue growth and segmentSegment EBITDA growth exclude the impact of foreign currency, acquisitions of operating or legal entities, and divestitures within the year. These measures should be considered in addition to, not as a substitute for, performance measures reported in accordance with GAAP. These measures, as we present them, may not be comparable to similarly titled measures used by other companies and are not measures of performance presented in accordance with GAAP.
Three Months Ended December 31, 20172018 Compared to the Three Months Ended December 31, 20162017
The below tables summarize several financial metrics we use to measure performance for the three months ended December 31, 2018 and three months ended December 31, 2017. Refer to the discussions below regarding performance and use of key financial metrics.
We adopted Accounting Standards Codification ("ASC") 606, Revenue from Contracts with Customers ("ASC 606"), as of July 1, 2018 using the modified retrospective method. The reported results for the three and six months ended December 31, 2018 reflects the application of the new standard while the reported results for the three and six months ended December 31, 2017 were prepared under the previously effective guidance of ASC 605, Revenue Recognition.
Results for
the three months ended December 31, 2018 compared to the three months ended December 31, 2017
compared to three months ended December 31, 2016 were as follows:
| | | | | | | | | | | | | | Three Months Ended
December 31, | | | FX Impact | | Constant Currency Increase/(Decrease) | |
| | Three Months Ended
December 31, | | FX impact | | Constant Currency Increase/(Decrease) | | 2018 | | 2017 | | | | Change $ | | Change % |
| (Dollars in millions) | 2017 | | 2016 | |
| | Change $ | | Change % | |
| Net revenue | $ | 606.3 |
| | $ | 483.7 |
| | $ | 17.0 |
| | $ | 105.6 |
| | 22 | % | Net revenue | $ | 623.0 | | $ | 606.3 | | $ | (10.9) | | $ | 27.6 | | 5 | % |
| Cost of sales | 418.9 |
| | 335.8 |
| | 12.7 |
| | 70.4 |
| | 21 | % | |
| Cost of products sold | | Cost of products sold | 421.6 | | 418.9 | | (7.9) | | 10.6 | | 3 | % |
| Gross margin | 187.4 |
| | 147.9 |
| | 4.3 |
| | 35.2 |
| | 24 | % | Gross margin | 201.4 | | 187.4 | | (3.0) | | 17.0 | | 9 | % |
| Selling, general and administrative expenses | 114.3 |
| | 96.2 |
| | 1.1 |
| | 17.0 |
| | 18 | % | Selling, general and administrative expenses | 123.2 | | 114.8 | | (1.0) | | 9.4 | | 8 | % |
| Impairment charges and (gain)/loss on sale of assets | 4.2 |
| | 0.5 |
| | 0.1 |
| | 3.6 |
| | * |
| Impairment charges and (gain)/loss on sale of assets | (0.1) | | 4.2 | | 0.2 | | (4.5) | | * | |
| Restructuring and other | 0.1 |
| | 3.3 |
| | — |
| | (3.2 | ) | | (97 | )% | Restructuring and other | 0.1 | | 0.1 | | — | | — | | * | |
| | Operating earnings | 68.8 |
| | 47.9 |
| | 3.1 |
| | 17.8 |
| | 37 | % | Operating earnings | 78.2 | | 68.3 | | (2.2) | | 12.1 | | 18 | % |
| Interest expense, net | 27.2 |
| | 22.8 |
| | 0.3 |
| | 4.1 |
| | 18 | % | Interest expense, net | 25.5 | | 27.2 | | (0.2) | | (1.5) | | (6) | % |
| Other (income)/expense, net | 13.6 |
| | (1.8 | ) | | 1.4 |
| | 14.0 |
| | * |
| |
| Earnings from continuing operations, before income taxes | 28.0 |
| | 26.9 |
| | 1.4 |
| | (0.3 | ) | | (1 | )% | |
| Income tax expense/(benefit) | 49.9 |
| | 9.5 |
| | — |
| | 40.4 |
| | * |
| |
| Other expense, net | | Other expense, net | 1.4 | | 13.1 | | (0.7) | | (11.0) | | (84) | % |
| Earnings from continuing operations before income taxes | | Earnings from continuing operations before income taxes | 51.3 | | 28.0 | | (1.3) | | 24.6 | | 88 | % |
| Income tax expense | | Income tax expense | 2.3 | | 49.9 | | (0.1) | | (47.5) | | (95) | % |
| | Net earnings/(loss) | $ | (21.9 | ) | | $ | 17.4 |
| | $ | 1.4 |
| | $ | (40.7 | ) | | * |
| Net earnings/(loss) | $ | 49.0 | | $ | (21.9) | | $ | (1.2) | | $ | 72.1 | | * | |
|
*Percentage not meaningful
Net Revenue
| | | | | |
| 2018 vs. 2017 |
| Factors Contributing to Year-Over-Year Change | Three Months Ended
December 31, |
| Net Revenue |
| Revenue without acquisitions/divestitures | (1) | % |
| Impact of acquisitions | 6 | % |
| Impact of divestitures | — | % |
| Constant currency change | 5 | % |
| Foreign currency translation impact on reporting | (2) | % |
| Total % change | 3 | % |
Net revenue increased $105.6$27.6 million, or 22%5%, compared to the three months ended December 31, 2016,2017, excluding the impact of foreign exchange. Net revenue increased 14% as a result ofexchange, primarily driven by growth from acquisitions. We acquired Cook Pharmica LLC (now doing business as Catalent Indiana, LLC, "Catalent Indiana") in October 2017, which is included within our Drug Delivery Solutions segment and Accucaps Industries LimitedJuniper Pharmaceuticals, Inc. ("Accucaps"Juniper") in February 2017, which is in our Softgel Technologies segment. ExcludingAugust 2018. Net revenue decreased 1% without the impact of acquisitions netor divestitures primarily related to a reduction in revenue increased by 8%, primarily due to increased volume in lower-marginfrom comparator sourcing volume and our storage and distribution businessarrangements within our Clinical Supply Services segment, timingsegment. As a result of the adoption of ASC 606, we recorded comparator sourcing arrangements on a standard maintenance shut-down at our European sterile pre-filled syringe facility andnet basis versus a gross basis, resulting in a decrease in net revenue of 5%, with no corresponding decrease to EBITDA, partially offset by increased volumenet revenue within our biologics offerings within ourBiologics and Specialty Drug Delivery Solutions segment.
Gross Margin
Gross margin increased $35.2$17.0 million, or 24%9%, compared to the three months ended December 31, 2016,2017, excluding the impact of foreign exchange. Gross margin increased across all three reportable segmentsexchange, primarily due to increased sales volumes as discussed above.a result of the Catalent Indiana and the Juniper acquisitions. On a constant-currency basis, gross margin, as a percentage of revenue, increased 50130 basis points to 31.1%32.2% in the three months ended December 31, 2017,2018, compared to 30.6%30.9% in the prior yearprior-year period. TheAs a result of the adoption of ASC 606, the Company recorded comparator sourcing arrangements on a net basis versus a gross basis, which resulted in an increase was primarily due to a favorable mix shift to certain highergross margin offerings within our oral delivery solutions and biologics offerings in our U.S. operations within our Drug Delivery Solutions segment, partially offset by a decrease in our product participation revenue within both our Softgel Technologies segment and our Drug Delivery Solutions segment.percentage of 140 basis points.
Selling, General, and Administrative Expenses
Selling, general, and administrative expenses increased $17.0$9.4 million, or 18%8%, compared to the three months ended December 31, 2016,2017, excluding the impact of foreign exchange, primarily due to additional expenses from recently acquired companiesincreased employee-related costs of $9approximately $4 million which includes $5 million of incremental depreciation and amortization expense and $2 million of employee related costs. Additionally, the three months ended December 31, 2017 includes one-time transaction fees of $2 million relatedas compared to the acquisition of Catalent Indiana in October 2017.prior-year period. Selling, general, and administrative expenses further increased approximately $4 million for non-cash equity based compensation driven by higheras a result of the Juniper acquisition, which included approximately $3 million of incremental depreciation and amortization expense for certain performance based awards in the current period.and $1 million related to incremental employee related costs.
Impairment Charges and Loss on Sale of Assets
Impairment charges for the three months ended December 31, 2018 and (gain)/loss on sale of assets
Impairment chargesDecember 31, 2017 were $0.1 million and loss on sale of assets of $4.2 million, includesrespectively. The prior year included the loss on salethe sales of two Softgel Technologies segment manufacturing sites in the Asia Pacific region. The site divestitures were neithernot material, either individually or in the aggregate, to the segment or to the Company.our business as a whole.
Restructuring and Other
Restructuring and other costs of $0.1 million for the three months ended December 31, 2017 decreased $3.2 million2018 were unchanged compared to the three months ended December 31, 2016. Other costs in the three months ended December 31, 2016, included claim resolution charges of $3.2 million (without regard to possible future insurance recoveries), related to a previous temporary regulatory suspension at one of our manufacturing facilities.2017. Restructuring expense will vary period to periodperiod-to-period based on the level of acquisitions during the yearsite consolidation efforts and site consolidationother efforts to further streamline the business.
Interest Expense, net
Interest expense, net of $27.2$25.5 million for the three months ended December 31, 2017 increased2018 decreased by $4.4$1.7 million or 19%, compared to the three months ended December 31, 2016,2017, primarily driven by an average higher levela $450 million payment on our U.S. dollar-denominated term loans on August 1, 2018, principally funded by our underwritten public equity offering of outstanding debt associated with the financing for theJuly 27, 2018 (the "2018 Equity Offering"), a $50 million payment on our deferred purchase consideration related to Catalent Indiana acquisition in October 2017, partially offset by2018, ordinary-course principal payments on our term loans, and an overall reduction in our interest rates on our senior secured credit facilityfacilities compared to the prior-year period.period partially offset by deferred purchase consideration for the Catalent Indiana acquisition in October 2017.
OnIn October 18, 2017, weOperating Company completed a private offering (the "Debt Offering") of $450 million aggregate principal amount of 4.875% senior unsecured notes due 2026 (the "USD Notes").USD Notes. The USD Notes will mature on January 15, 2026, bear interest at the rate of 4.875% per annum and are payable semi-annually in arrears on January 15 and July 15 of each year beginning on July 15, 2018. The net proceeds of the Debt Offering, after payment of the initial purchasers' discount and related fees and expenses, were used to fund a portion of the Catalent Indiana acquisition consideration at its closing.
year. Concurrent with the Debt Offering, weUSD Notes offering, Operating Company completed the Third Amendment No. 3 (the "Third Amendment") to our Amended and Restatedits Credit Agreement, (as amended,which governs the "Credit Agreement"), whichsenior secured credit facilities that provide U.S. dollar-denominated term loans, euro-denominated term loans, and a revolving credit facility. The Third Amendment lowered the interest rate on U.S. dollar-denominated and euro-denominatedthe term loans and the revolving credit facility and extended the maturity dates on the senior secured credit facilities by three years.facility. The new applicable rate for U.S. dollar-denominated term loans decreased 0.50%, and the new applicable rate for euro-denominated term loans is LIBOR decreased 0.75%. The new, and the applicable rate for the revolving loans decreased 1.25%. For additional information concerning the terms of the Credit Agreement and the Third Amendment, see Note 6 to the Consolidated Financial Statements.
Further, aA component of the purchase price for the Catalent Indiana acquisition consists of $200$200.0 million in deferred purchase consideration payable in $50four annual $50.0 million installments on eachthe anniversary date of the closing date over a periodacquisition. We made the first such payment in October 2018, and the present value of four years, whichthe balance is accounted for as debt, with the difference between the nominal value and includes a component ofthe present value considered imputed interest expense.
On December 9, 2016, we completed a private offering of €380.0 million aggregate principal of 4.75% Senior Notes due 2024 (the "Euro Notes"). The Euro Notes will mature on December 15, 2024, bear interest at the rate of 4.75% per annum and are payable semi-annually in arrears on June 15 and December 15 of each year.
Other (Income)/Expense, net
Other expense, was $13.6net of $1.4 million for the three months ended December 31, 2017, compared to $1.82018 was primarily driven by non-cash foreign currency translation losses in the period of $0.7 million.
Other expense, net of $13.1 million of other income for the three months ended December 31, 2016. The expense in the three months ended December 31, 2017 was primarily driven by $11.8 million of financing charges related to the USD Notes offering and the Third Amendment, and includes a $6.1 million charge for commitment fees paid during the first quarter of fiscal 2018 on a proposed bridge loan made available to us but not used for the purpose of providing back-up financing to fund a portion of the Catalent Indiana acquisition purchase price (the "Bridge Facility").
The three months ended December 31, 2016 of $1.8 million was primarily driven by non-cash net gains of $5.3 million related to foreign currency translation, partially offset by $4.3 million of financing charges related to the December 2016 private offering of the Euro Notes and repricing and partial paydown of our term loans.
Provision/(Benefit) for Income TaxesTax Expense
On December 22, 2017, the U.S. government enacted wide-ranging tax legislation, the Tax Cuts and Jobs Act (the "2017 Tax Act"). The 2017 Tax Act significantly revises U.S. tax law by, among other provisions, (a) lowering the applicable U.S. federal statutory income tax rate from 35% to 21%, (b) creating a partial territorial tax system that includes imposing a mandatory one-time transition tax on previously deferred foreign earnings, and eliminating or reducing certain income tax deductions.
During the second quarter ended December 31, 2017, we recorded a one-time net charge of $46.0 million within our income tax provision as a provisional estimate of the net accounting impact of the 2017 Tax Act in accordance with Staff Accounting Bulletin No. 118 issued by the staff of the SEC ("SAB 118"), of which $48.7 million million related to the mandatory transition tax for deemed repatriation of deferred foreign income, $8.7 million of which we expect to pay over an 8-year period after considering the use of certain net operating losses and foreign tax credits, and certain limitations on executive compensation. The impact to our business resulting from the 2017 Tax Act, including related changes to our tax obligations and effective tax rate in future periods, as well as the one-time enactment-related charges recorded during the second quarter in fiscal 2018 on a provisional basis, are based on a reasonable estimate and are subject to change, and any change could differ materially from our current expectations. Further, there are certain effects of the 2017 Tax Act we cannot reasonably estimate as of the time of this filing, including (a) the(c) creating provisions regarding (1) Global Intangible Low Tax Income ("GILTI") rules, (b), (2) the Foreign Derived Intangible Income ("FDII") deduction, (c)and (3) the Base Erosion Anti-Abuse Tax ("BEAT"), and (d) provisions eliminating or reducing certain income tax deductions, such as interest expense, executive compensation expenses, and certain employee expenses, and (e)expenses.
The SEC staff issued Staff Accounting Bulletin No. 118 ("SAB 118"), which allowed companies to record the state tax impact of the 2017 Tax Act. As additional data is gathered, analyzed, and considered in contexteffects of the 2017 Tax Act on a provisional basis based on a reasonable estimate and ASC 740,then, if necessary, subsequently adjust such amounts during a limited measurement period as more information became available. The Company’s measurement period has expired as of December 31,2018. For the three months ended December 31, 2018, we may recordrecorded a net benefit of $6.9 million reducing the estimated net charge from $42.5 million previously recorded during fiscal 2018, to $35.6 million. This reduction is primarily related to additional or differentforeign tax charges in future periodscredit benefits associated with the mandatory transition tax charge for deemed repatriation of deferred foreign income. There were no other changes recorded to the tax provision related to the 2017 Tax Act. The Company continues to evaluate the potential impact of all provisions of the 2017 Tax Act, as the U.S. Treasury Department has and is expected to continue issuing guidance related to the 2017 Tax Act during the measurement period.Company’s fiscal year 2019.
Our provision for income taxes for the three months ended December 31, 2018 was $2.3 million relative to earnings from operations before income taxes of $51.3 million. Our provision for income taxes for the three months ended December 31, 2017 was $49.9 million relative to earnings from continuing operations before income taxes of $28.0 million. Our provision for income taxes for the three months ended December 31, 2016 was $9.5 million relative to earnings from continuing operations before income taxes of $26.9 million. The income tax provision for the current period is not comparable to the same period of the prior year due to the impact of the 2017 Tax Act as previously discussed, changes in pretax income over many jurisdictions, and the impact of discrete items. Generally, fluctuations in the effective tax rate are primarily due to changes in our geographic pretax income resulting from our business mix and changes in the tax impact of permanent differences, restructuring, other special items, and other discrete tax items, which may have unique tax implications depending on the nature of the item.
Segment Review
The following charts depict the percentages of revenue allocable to each of the Company's four segments for the three months ended December 31, 2018 compared to the three months ended December 31, 2017. Refer below for discussions regarding the segments' revenue and EBITDA performance.
Our results on a segment basis for the three months ended December 31, 20172018 compared to the three months ended December 31, 20162017 were as follows:
| | | | | | | | | | | | | | | | | | | | | | | | | | | | | |
| | Three Months Ended
December 31, | | | | FX Impact | | Constant Currency Increase/(Decrease) | | |
| 2018 | | 2017 | | | | Change $ | | Change % |
| Softgel Technologies | | | | | | | | | |
| Net revenue | $ | 213.7 | | $ | 228.1 | | $ | (7.0) | | $ | (7.4) | | (3) | % |
| Segment EBITDA | $ | 44.2 | | $ | 50.1 | | $ | (1.4) | | $ | (4.5) | | (9) | % |
| Biologics and Specialty Drug Delivery | | | | | | | | | |
| Net revenue | 184.3 | | 148.7 | | (1.2) | | 36.8 | | 25 | % |
| Segment EBITDA | 50.8 | | 39.9 | | (0.3) | | 11.2 | | 28 | % |
| Oral Drug Delivery | | | | | | | | | |
| Net revenue | 154.0 | | 137.2 | | (1.8) | | 18.6 | | 14 | % |
| Segment EBITDA | 44.8 | | 41.2 | | (0.8) | | 4.4 | | 11 | % |
| Clinical Supply Services | | | | | | | | | |
| Net revenue | 80.8 | | 108.7 | | (1.2) | | (26.7) | | (25) | % |
| Segment EBITDA | 21.0 | | 19.0 | | (0.5) | | 2.5 | | 13 | % |
| Inter-segment revenue elimination | (9.8) | | (16.4) | | 0.3 | | 6.3 | | (38) | % |
Unallocated Costs(1) | (29.4) | | (48.2) | | 0.9 | | 17.9 | | (37) | % |
| Combined Total | | | | | | | | | |
| Net revenue | $ | 623.0 | | $ | 606.3 | | $ | (10.9) | | $ | 27.6 | | 5 | % |
| | | | | | | | | |
| EBITDA from continuing operations | $ | 131.4 | | $ | 102.0 | | $ | (2.1) | | $ | 31.5 | | 31 | % |
|
| | | | | | | | | | | | | | | | | | |
| | Three Months Ended
December 31, | | FX impact | | Constant Currency Increase/(Decrease) |
| (Dollars in millions) | 2017 | | 2016 | |
| | Change $ | | Change % |
| Softgel Technologies | | | | | | | | | |
| Net revenue | $ | 228.1 |
| | $ | 201.9 |
| | $ | 7.1 |
| | $ | 19.1 |
| | 9 | % |
| Segment EBITDA | 50.1 |
| | 43.4 |
| | 1.1 |
| | 5.6 |
| | 13 | % |
| Drug Delivery Solutions | | | | | | | | | |
| Net revenue | 285.4 |
| | 214.0 |
| | 7.0 |
| | 64.4 |
| | 30 | % |
| Segment EBITDA | 81.1 |
| | 50.0 |
| | 2.0 |
| | 29.1 |
| | 58 | % |
| Clinical Supply Services | | | | | | | | | |
| Net revenue | 108.7 |
| | 77.0 |
| | 3.7 |
| | 28.0 |
| | 36 | % |
| Segment EBITDA | 19.0 |
| | 11.6 |
| | 1.0 |
| | 6.4 |
| | 55 | % |
| Inter-segment revenue elimination | (15.9 | ) | | (9.2 | ) | | (0.8 | ) | | (5.9 | ) | | 64 | % |
Unallocated costs (1) | (48.2 | ) | | (19.8 | ) | | (1.3 | ) | | (27.1 | ) | | * |
|
| Combined total | | | | | | | | | |
| Net revenue | $ | 606.3 |
| | $ | 483.7 |
| | $ | 17.0 |
| | $ | 105.6 |
| | 22 | % |
| | | | | | | | | | |
| EBITDA from continuing operations | $ | 102.0 |
| | $ | 85.2 |
| | $ | 2.8 |
| | $ | 14.0 |
| | 16 | % |
(1) Unallocated costs includes equity-basedinclude restructuring and special items, stock-based compensation, certain acquisition-related costs, impairment charges, certain other corporate directed costs, and other costs that are not allocated to the segments as follows:
| | | | Three Months Ended
December 31, | | Three Months Ended
December 31, | |
| (Dollars in millions) | 2017 | | 2016 | (Dollars in millions) | 2018 | | 2017 |
| Impairment charges and gain/(loss) on sale of assets | $ | (4.2 | ) | | $ | (0.5 | ) | Impairment charges and gain/(loss) on sale of assets | $ | 0.1 | | $ | (4.2) |
| Equity compensation | (8.5 | ) | | (4.9 | ) | |
Restructuring and other special items (2) | (11.9 | ) | | (7.2 | ) | |
Other income/(expense), net (3) | (13.6 | ) | | 1.8 |
| |
| Stock-based compensation | | Stock-based compensation | (7.5) | | (8.5) |
Restructuring and other special items (a) | | Restructuring and other special items (a) | (5.9) | | (11.9) |
| Other (expense), net (b) | | Other (expense), net (b) | (1.4) | | (13.1) |
| Non-allocated corporate costs, net | (10.0 | ) | | (9.0 | ) | Non-allocated corporate costs, net | (14.7) | | (10.5) |
| Total unallocated costs | $ | (48.2 | ) | | $ | (19.8 | ) | Total unallocated costs | $ | (29.4) | | $ | (48.2) |
(2)(a) Restructuring and other special items include transaction and integration costs associated primarily with the acquisitionacquisitions of Catalent Indiana.Indiana and Juniper.
(3)(b) Amounts for the three months ended December 31, 2017 include $11.8 million of financing expenses related to the offering of the USD Notes and the Third Amendment and include a $6.1 million charge for commitment fees paid during the first quarter of fiscal 2018 on the Bridge Facility.
Provided below is a reconciliation of net earnings/(loss) from continuing operations to EBITDA from continuing operations:
| | | | | | | | | | | |
| | Three Months Ended
December 31, | | |
| (Dollars in millions) | 2018 | | 2017 |
| Net earnings/(loss) | $ | 49.0 | | $ | (21.9) |
| Depreciation and amortization | 54.6 | | 46.8 |
| Interest expense, net | 25.5 | | 27.2 |
| Income tax expense | 2.3 | | 49.9 |
| | | |
| EBITDA from operations | $ | 131.4 | | $ | 102.0 |
|
| | | | | | | |
| | Three Months Ended
December 31, |
| (Dollars in millions) | 2017 | | 2016 |
| Earnings/(loss) from continuing operations | $ | (21.9 | ) | | $ | 17.4 |
|
| Depreciation and amortization | 46.8 |
| | 35.5 |
|
| Interest expense, net | 27.2 |
| | 22.8 |
|
| Income tax expense/(benefit) | 49.9 |
| | 9.5 |
|
| EBITDA from continuing operations | $ | 102.0 |
| | $ | 85.2 |
|
Softgel Technologies segment | | | | 2017 vs. 2016 | | 2018 vs. 2017 | |
| Factors Contributing to Year-Over-Year Change | Three Months Ended
December 31, | Factors Contributing to Year-Over-Year Change | Three Months Ended
December 31, | |
| | Net Revenue | | Segment EBITDA | | Net Revenue | | Segment EBITDA |
| Revenue/Segment EBITDA without acquisitions / divestitures | (3 | )% | | 4 | % | |
| Impact of acquisitions | 12 | % | | 9 | % | |
| Revenue/Segment EBITDA without divestitures | | Revenue/Segment EBITDA without divestitures | (1) | % | | (9) | % |
| Impact of divestitures | | Impact of divestitures | (2) | % | | — | % |
| Constant currency change | 9 | % | | 13 | % | Constant currency change | (3) | % | | (9) | % |
| Foreign currency translation impact on reporting | 4 | % | | 2 | % | Foreign currency translation impact on reporting | (3) | % | | (3) | % |
| Total % change | 13 | % | | 15 | % | Total % change | (6) | % | | (12) | % |
Softgel Technologies’Technologies net revenue increaseddecreased by $19.1$7.4 million, or 9%3%, excluding the impact of foreign exchange, compared to the three months ended December 31, 2016. Net revenue decreased 3%, excluding the impact of the Accucaps acquisition,2017, primarily driven by decreased profit participation revenuevolume in the segment's consumer health business of 2% as compared to three months ended December 31, 2016. Excluding the reduction5% resulting from a shortage in product participation revenue, net revenue without acquisitions decreased 1% primarily drivenour ibuprofen supply, partially offset by decreased end-marketincreased volume demand forin our European prescription products in Europe, and lower end-market volume demand for consumer health products in Latin America and Asia Pacific, partially offset with revenue generated by a historical contractual settlement.business.
Softgel Technologies' SegmentTechnologies segment EBITDA increased by $5.6decreased $4.5 million, or 13%9%, compared to the three months ended December 31, 2016,2017, excluding the impact of foreign exchange. Segment EBITDA increased 4%exchange, driven primarily by a shortage in our ibuprofen supply, which led to a decrease in our consumer health business by 16%, excluding the impact of the Accucaps acquisition. Excluding the reduction of product participation profit of 8%, segment EBITDA without acquisitions increased 12%, primarily related to the impact of a historical contractual settlement of 6% and apartially offset by favorable shift in product mix within our consumer health products in Asia Pacific and within ourEuropean prescription products in North America.business.
The net revenue and EBITDA impact to our Softgel Technologies segment from the Accucaps acquisition for the three months ended December 31, 2017 was an increase
In December 2017, we divested of two manufacturing sites in Asia Pacific operated within the Softgel Technologies segment in order to better streamline our global operations. The site divestitures were material neither individually norresulted in aggregatea decrease to net revenue of 2% and no impact to Segment EBITDA in the three months ended December 31, 2018 compared to the segment or to the Company.three months ended December 31, 2017.
Biologics and Specialty Drug Delivery Solutions segment | | | | 2017 vs. 2016 | | 2018 vs. 2017 | |
| Factors Contributing to Year-Over-Year Change | Three Months Ended
December 31, | Factors Contributing to Year-Over-Year Change | Three Months Ended
December 31, | |
| | Net Revenue | | Segment EBITDA | | Net Revenue | | Segment EBITDA |
| Revenue/Segment EBITDA without acquisitions | 9 | % | | 18 | % | Revenue/Segment EBITDA without acquisitions | 15 | % | | 18 | % |
| Impact of acquisitions | 21 | % | | 40 | % | Impact of acquisitions | 10 | % | | 10 | % |
| Constant currency change | 30 | % | | 58 | % | Constant currency change | 25 | % | | 28 | % |
| Foreign currency translation impact on reporting | 3 | % | | 4 | % | |
| Total % Change | 33 | % | | 62 | % | |
| Foreign exchange fluctuation | | Foreign exchange fluctuation | (1) | % | | (1) | % |
| Total % change | | Total % change | 24 | % | | 27 | % |
Net revenue in our Biologics and Specialty Drug Delivery Solutions segment increased by $64.4$36.8 million, or 25%, compared to the three months ended December 31, 2017, excluding the impact of foreign exchange. Net revenue without acquisitions increased by 15% due to favorable end-customer demand for our U.S. based drug substance biologics offerings of 9% and increased revenue within our respiratory and ophthalmic platform primarily as a result of timing of shipments in the prior year of 8%, partially offset by decreased end-market demand for our European-based drug product offerings of 2%.
Biologics and Specialty Drug Delivery segment EBITDA increased by $11.2 million, or 30%28%, compared to the three months ended December 31, 2016, excluding the impact of foreign exchange. Revenue without acquisitions increased by 9%, driven primarily by timing of a standard maintenance shut-down at our European sterile pre-filled syringe facility of 6%, increased volume from our biologics offerings of 4%, partially offset by a decrease in product participation revenue of 1%.
Drug Delivery Solutions' segment EBITDA increased by $29.1 million, or 58%, compared to the three months ended December 31, 2016,2017, excluding the impact of foreign exchange. Segment EBITDA without acquisitions increased by 18%, primarily due to favorable absorption of cost and timing of a standard maintenance shut-down at our European sterile pre-filled syringe facility, increased volume from our biologics offerings,demand as discussed above.
On October 23, 2017, we acquired Catalent Indiana, which increased net revenue and a favorable shift in end-customer demand to certain higher margin offerings primarilySegment EBITDA in our U.S. operationsBiologics and Specialty Drug Delivery segment by 10% and 10%, respectively, in the three months ended December 31, 2018 compared to the corresponding prior-year period.
Oral Drug Delivery segment
| | | | | | | | | | | |
| 2018 vs. 2017 | | |
| Factors Contributing to Year-Over-Year Change | Three Months Ended
December 31, | | |
| Net Revenue | | Segment EBITDA |
| Revenue without acquisitions/divestitures | (3) | % | | (15) | % |
| Impact of acquisitions | 17 | % | | 26 | % |
| | | |
| Constant currency change | 14 | % | | 11 | % |
| Foreign currency translation impact on reporting | (2) | % | | (2) | % |
| Total % Change | 12 | % | | 9 | % |
Net revenue in our Oral Drug Delivery segment increased by $18.6 million, or 14%, compared to the three months ended December 31, 2017, excluding the impact of foreign exchange, primarily as a result of the Juniper acquisition. Revenue without acquisitions decreased 3%, primarily driven by decreased end-market demand for certain higher-margin offerings within our commercial oral delivery solutions platform. These increases wereplatform, partially offset by operational inefficiencies with respect to products utilizingincreased demand for our blow-fill-seal technology platform, decreased profit from ourdevelopment and analytical services platform.
Oral Drug Delivery segment EBITDA increased by $4.4 million, or 11%, compared to the three months ended December 31, 2017, excluding the impact of foreign exchange, primarily as a result of the Juniper acquisition. Segment EBITDA without acquisitions decreased 15%, primarily due to decreased volumes and an unfavorable mix shift related to certain higher-margin offerings primarily within our commercial oral delivery solutions platform, drivenpartially offset by decreased sales volumesincreased volume related to fee-for-service development work and analytical testing in the U.S., and a reduction in profit related to product participation.
TheOn August 14, 2018, we acquired Juniper, which increased net revenue and Segment EBITDA impact toin our Oral Drug Delivery Solutions segment from the Catalent Indiana acquisition for the three months ended December 31, 2017 was an increase of 21%2018, by 17% and 40%26%, respectively, compared to the prior-year period.
Clinical Supply Services segment
| | | | 2017 vs. 2016 | | 2018 vs. 2017 | |
| Factors Contributing to Year-Over-Year Change | Three Months Ended
December 31, | Factors Contributing to Year-Over-Year Change | Three Months Ended
December 31, | |
| | Net Revenue | | Segment EBITDA | | Net Revenue | | Segment EBITDA |
| Revenue/Segment EBITDA without acquisitions | 36 | % | | 55 | % | |
| Impact of acquisitions | — | % | | — | % | |
| Revenue/Segment EBITDA | | Revenue/Segment EBITDA | 2 | % | | 13 | % |
| Comparator revenue recognition adoption impact | | Comparator revenue recognition adoption impact | (27) | % | | — | % |
| | Constant currency change | 36 | % | | 55 | % | Constant currency change | (25) | % | | 13 | % |
| Foreign currency translation impact on reporting | 5 | % | | 9 | % | Foreign currency translation impact on reporting | (1) | % | | (2) | % |
| Total % Change | 41 | % | | 64 | % | Total % Change | (26) | % | | 11 | % |
Clinical Supply Services'Services net revenue increaseddecreased by $28.0$26.7 million, or 36%, compared to the three months ended December 31, 2016, excluding the impact of foreign exchange, primarily due to increased lower-margin comparator sourcing volume of approximately $17 million, or 22%, and higher volume and favorable mix in our storage and distribution business of approximately $13 million, or 16%.
Clinical Supply Services' segment EBITDA increased by $6.4 million, or 55%25%, excluding the impact of foreign exchange, compared to the three months ended December 31, 2016,2017. As a result of the adoption of ASC 606, the Company recorded comparator sourcing arrangements on a net basis versus a gross basis resulting in a decrease to net revenue by 27%, partially offset by a 2% increase in revenue due to higher volume in our storage and distribution business.
Clinical Supply Services segment EBITDA increased by $2.5 million, or 13%, excluding the impact of foreign exchange, compared to the three months ended December 31, 2017, primarily due to increased sales volumes and favorable mix in our storage and distribution business and improved capacity utilization across the network, and increased profit from our lower-margin comparator sourcing.
network.
Six Months Ended December 31, 20172018 Compared to the Six Months Ended December 31, 20162017
The below tables summarize several financial metrics we use to measure performance for the six months ended December 31, 2018 and six months ended December 31, 2017. Refer to the discussions below regarding performance and use of key financial metrics.
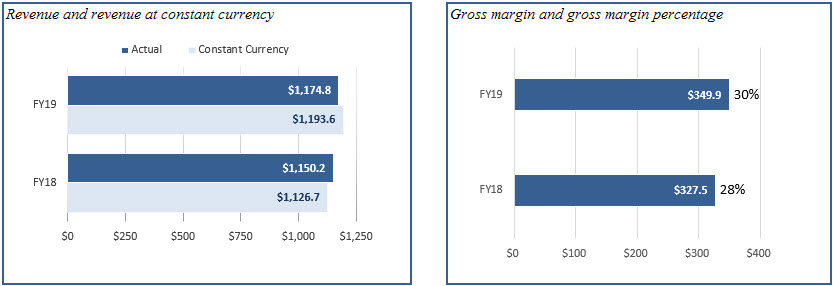
| | | | | | | | | | | | | | Six Months Ended
December 31, | | | FX Impact | | Constant Currency Increase/(Decrease) | |
| | Six Months Ended
December 31, | | FX impact | | Constant Currency Increase/(Decrease) | | 2018 | | 2017 | | | | Change $ | | Change % |
| (Dollars in millions) | 2017 | | 2016 | |
| | Change $ | | Change % | |
| Net revenue | $ | 1,150.2 |
| | $ | 925.9 |
| | $ | 23.5 |
| | $ | 200.8 |
| | 22 | % | Net revenue | $ | 1,174.8 | | $ | 1,150.2 | | $ | (18.8) | | $ | 43.4 | | 4 | % |
| Cost of sales | 822.7 |
| | 653.9 |
| | 18.8 |
| | 150.0 |
| | 23 | % | |
| Cost of products sold | | Cost of products sold | 824.9 | | 822.7 | | (13.5) | | 15.7 | | 2 | % |
| Gross margin | 327.5 |
| | 272.0 |
| | 4.7 |
| | 50.8 |
| | 19 | % | Gross margin | 349.9 | | 327.5 | | (5.3) | | 27.7 | | 8 | % |
| Selling, general and administrative expenses | 221.3 |
| | 194.4 |
| | 1.4 |
| | 25.5 |
| | 13 | % | Selling, general and administrative expenses | 238.7 | | 222.3 | | (1.6) | | 18.0 | | 8 | % |
| Impairment charges and (gain)/loss on sale of assets | 4.2 |
| | 0.5 |
| | 0.1 |
| | 3.6 |
| | * |
| Impairment charges and (gain)/loss on sale of assets | 2.8 | | 4.2 | | (0.1) | | (1.3) | | (31) | % |
| Restructuring and other | 1.3 |
| | 4.4 |
| | — |
| | (3.1 | ) | | (70 | )% | Restructuring and other | 9.8 | | 1.3 | | (0.3) | | 8.8 | | * | |
| | Operating earnings | 100.7 |
| | 72.7 |
| | 3.2 |
| | 24.8 |
| | 34 | % | Operating earnings | 98.6 | | 99.7 | | (3.3) | | 2.2 | | 2 | % |
| Interest expense, net | 51.5 |
| | 44.9 |
| | 0.3 |
| | 6.3 |
| | 14 | % | Interest expense, net | 53.6 | | 51.5 | | (0.1) | | 2.2 | | 4 | % |
| Other (income)/expense, net | 19.3 |
| | (3.9 | ) | | 2.3 |
| | 20.9 |
| | * |
| |
| Earnings from continuing operations, before income taxes | 29.9 |
| | 31.7 |
| | 0.6 |
| | (2.4 | ) | | (8 | )% | |
| Income tax expense/(benefit) | 48.0 |
| | 9.7 |
| | (0.3 | ) | | 38.6 |
| | * |
| |
| Other expense, net | | Other expense, net | 7.1 | | 18.3 | | (1.2) | | (10.0) | | (55) | % |
| Earnings from continuing operations before income taxes | | Earnings from continuing operations before income taxes | 37.9 | | 29.9 | | (2.0) | | 10.0 | | 33 | % |
| Income tax expense | | Income tax expense | 3.3 | | 48.0 | | (0.1) | | (44.6) | | (93) | % |
| | Net earnings/(loss) | $ | (18.1 | ) | | $ | 22.0 |
| | $ | 0.9 |
| | $ | (41.0 | ) | | * |
| Net earnings/(loss) | $ | 34.6 | | $ | (18.1) | | $ | (1.9) | | $ | 54.6 | | * | |
|
*Percentage not meaningful
Net Revenue
| | | | | | | |
| 2018 vs. 2017 | | |
| Factors Contributing to Year-Over-Year Change | Six Months Ended
December 31, | | |
| Net Revenue | | |
| Revenue without acquisitions/divestitures | (5) | % | | |
| Impact of acquisitions | 9 | % | | |
| Impact of divestitures | — | % | | |
| Constant currency change | 4 | % | | |
| Foreign currency translation impact on reporting | (2) | % | | |
| Total % change | 2 | % | | |
Net revenue increased by $200.8$43.4 million, or 22%4%, compared to the six months ended December 31, 2016,2017, excluding the impact of foreign exchange. Net revenue increased 11% as a result ofexchange, primarily due to acquisitions. We acquired Pharmatek Laboratories, Inc. ("Pharmatek") in September 2016 and Catalent Indiana in October 2017 both within our Drug Delivery Solutions segment, and AccucapsJuniper in February 2017, within our Softgel Technologies segment. ExcludingAugust 2018. Further excluding the impact of acquisitions and divestitures, net revenue increased 11%decreased 5%, primarily duerelated to increased volumea reduction in lower-marginrevenue from comparator sourcing and within our storage and distribution businessarrangements within our Clinical Supply Services segment and favorable end customer demand for certain higher margin offerings within our oral delivery solutions platform and increased volume from our biologics offerings within our Drug Delivery Solutions segmentsegment. As a result of the adoption of ASC 606, we recorded comparator sourcing arrangements on a net basis versus a gross basis, resulting in our U.S. operations.a decrease in net revenue of 5%, with no corresponding decrease to EBITDA.
Gross Margin
Gross margin increased by $50.8$27.7 million, or 19%8%, compared to the six months ended December 31, 2016,2017, excluding the impact of foreign exchange. Gross margin increased across all three reportable segmentsexchange, primarily due to increaseincreased sales volumes as a result of acquisitions as discussed above. On a constant currency basis, gross margin, as a percentage of revenue, decreased 70 basis points to 28.7%was 29.8% in the six months ended December 31, 2017 as compared to 29.4% in2018, an increase from the prior-year period,prior year of 130 basis points, primarily driven by decreased product participation revenue within both our Softgel Technologies and our Drug Delivery Solutions segments and an unfavorable mix shift within our Softgel Technologies segment to lower-margin consumer health products as a result of the Accucaps acquisition, partially offset byadoption of ASC 606, the Company recorded comparator sourcing arrangements on a favorable mix shiftnet basis versus a gross basis, which resulted in an increase to certain highergross margin offerings within our oral delivery solutions and biologics offerings in our U.S. operations within our Drug Delivery Solutions segment.percentage of 150 basis points.
Selling, General, and Administrative Expense
Selling, general, and administrative expense increased $25.5by $18 million, or 13%8%, compared to the six months ended December 31, 2016,2017, excluding the impact of foreign exchange, primarily driven by acquisition related expenses duringas a result of the period, including one-time transaction fees of $10 million related to the acquisition of Catalent Indiana in October 2017 and an increase ofJuniper acquisitions by approximately $11$13 million, which included approximately $6$10 million of incremental depreciation and amortization expense and $4approximately $2 million incrementalof employee-related costs.costs Selling, general, and administrative expenses further increased by approximately $4$9 million due to increased employee-related costs, of which $2 million was non-cash
equity compensation, as compared to the prior-year period, partially offset by a reduction of acquisition-related expenses during the year.
Impairment Charges and Loss on Sale of Assets
Impairment charges for non-cash equity-based compensation driven by higher expense for certain performance based awardsthe six months ended December 31, 2018 and December 31, 2017 were $2.8 million and $4.2 million, respectively. Impairment charges in the current period.
Impairment chargesyear were related to fixed assets that ceased being used and (gain)/loss on sale of assets
Impairment charges and loss on sale of assets of $4.2 million includeswhose value was therefore not recoverable. The prior year included the loss on salethe sales of two Softgel Technologies segment manufacturing sites in the Asia Pacific region. The site divestitures were not material, neithereither individually noror in the aggregate, to the segment or to the Company.our business as a whole.
Restructuring and Other
Restructuring and other charges of $1.3$9.8 million for the six months ended December 31, 2017 decreased2018 increased by $3.1$8.5 million, compared to the six months ended December 31, 2016. Other costs2017 and were driven by increases in employee-related actions to further streamline the six months ended December 31, 2016 included claim resolution charges of $3.2 million (without regard to possible future insurance recoveries), related to a previous temporary regulatory suspension at one of our manufacturing facilities.business. Restructuring expense will vary period to periodperiod-to-period based on the level of acquisitions during the yearsite consolidation efforts and site consolidationother efforts to further streamline the business.
Interest Expense, net
Interest expense, net of $51.5$53.6 million for the six months ended December 31, 20172018 increased $6.6by $2.1 million, or 4%, compared to the six months ended December 31, 2016,2017, primarily driven by ana higher average higher level of outstanding debt associated withduring the financingfirst quarter of fiscal 2019 and deferred purchase consideration for the Catalent Indiana acquisition in October 2017, partially offset by the 2018 Equity Offering, ordinary-course principal payments on our term loans, and an overall reduction in our interest rates on our senior secured credit facility asfacilities compared to the prior yearprior-year period.
On October 18, 2017, we completed the Debt Offering. Concurrent with the Debt Offering, we completed the Third Amendment, which lowered the interest rate on U.S. dollar-denominated and euro-denominated term loans and the revolving credit facility. The new applicable rate for U.S. dollar-denominated term loans decreased 0.50%, and the new applicable rate for euro-denominated term loans is LIBOR decreased 0.75%. The new applicable rate for the revolving loans decreased 1.25%.
Further, a component of the purchase price for the Catalent Indiana acquisition consists of $200 million in deferred purchase consideration payable in $50 million installments, on each anniversary of the closing date over a period of four years, which is accounted for as debt and includes a component of imputed interest expense.
On December 9, 2016, we completed the Euro Notes offering. The Euro Notes bear interest at the rate of 4.75% per annum and are payable semi-annually in arrears on June 15 and December 15 of each year.
Other (Income)/Expense, net
Other expense, net of $19.3$7.1 million for the six months ended December 31, 20172018 was primarily driven by a $4.2 million charge from the partial extinguishment of our U.S. dollar-denominated term loans on August 1, 2018 to reduce our debt discount and deferred financing costs. Other expense, net also includes non-cash foreign currency translation losses in the period of $2.4 million.
Other expense, net for the six months ended December 31, 2017 of $18.3 million was primarily driven by financing charges of $11.8 million of financing charges related to the Debt OfferingUSD Notes offering and the Third Amendment, and includeswhich included a $6.1 million charge for commitment fees paid during the first quarter of fiscal 2018 on the Bridge Facility. Further, other2018. Other expense, net for the six months ended December 31, 2017 includesalso included $6.9 million of non-cash net losses from foreign exchange translation.
Other income, net for the six months ended December 31, 2016 of $3.9 million was primarily driven by non-cash netcurrency gains from foreign exchange translation recorded during the period of $7.5 million, partially offset by $4.3 million of financing charges in the prior year.
Provision/(Benefit) for Income TaxesTax Expense
DuringIn December 2017, the second quarter ended December 31, 2017, we recorded a one-time net charge of $46.0 million within our incomeU.S. government enacted wide-ranging tax provision as a provisional estimate oflegislation, the net accounting impact of theTax Cuts and Jobs Act (the "2017 Tax Act"). The 2017 Tax Act in accordance with SAB 118, of which $48.7 million million relatedsignificantly revised U.S. income tax law by, among other provisions, (a) lowering the applicable U.S. federal statutory income tax rate from 35% to the21%, (b) creating a partial territorial tax system that includes imposing a mandatory transitionone-time transitional tax for deemed repatriation ofon previously deferred foreign earnings, (c) creating provisions regarding (1) income $8.7 million of which we expectdeemed to pay over an 8-year period after consideringbe Global Intangible Low Tax Income ("GILTI"), (2) the use of certain net operating lossesForeign Derived Intangible Income ("FDII") deduction, and foreign tax credits,(3) the Base Erosion Anti-Abuse Tax ("BEAT"), and certain limitations on executive compensation. The impact to our business resulting from the 2017 Tax Act, including related changes to our tax obligations and effective tax rate in future periods, as well as the one-time enactment-related charges recorded during the second quarter in fiscal 2018 on a provisional basis, are based on a reasonable estimate and are subject to change, and any change could differ materially from our current expectations. Further, there are certain effects of the 2017 Tax Act we cannot reasonably estimate as of the time of this filing, including (a) the GILTI rules, (b) the FDII deduction, (c) the BEAT, (d)provisions eliminating or reducing certain income tax deductions, such as deductions for interest expense, executive compensation expense, and certain employee expenses, and (e)expenses.
The SEC staff issued Staff Accounting Bulletin No. 118 ("SAB 118"), which allowed companies to record the state tax impact of the 2017 Tax Act. As additional data is gathered, analyzed, and considered in contexteffects of the 2017 Tax Act on a provisional basis based on a reasonable estimate and ASC 740,then, if necessary, subsequently adjust such amounts during a limited measurement period as more information became available. The Company’s measurement period has expired as of December 31,2018. For the three months ended December 31, 2018, we may recordrecorded a net benefit of $6.9 million reducing the estimated net charge from $42.5 million previously recorded during fiscal 2018, to $35.6 million. This reduction is primarily related to additional or differentforeign tax charges in future periodscredit benefits associated with the mandatory transition tax charge for deemed repatriation of deferred foreign income. There were no other changes recorded to the tax provision related to the 2017 Tax Act. The Company continues to evaluate the potential impact of all provisions of the 2017 Tax Act, as the U.S. Treasury Department has and is expected to continue issuing guidance related to the 2017 Tax Act during the measurement period.Company’s fiscal year 2019.
Our provision for income taxes for the six months ended December 31, 2018 was $3.3 million relative to earnings from continuing operations before income taxes of $37.9 million. Our provision for income taxes for the six months ended December 31, 2017 was $48.0 million relative to earnings from continuing operations before income taxes of $29.9 million. Our provision for income taxes for the six months ended December 31, 2016 was $9.7
million relative to earnings before income taxes of $31.7 million. The income tax provision for the current period is not comparable to the same period of the prior year due to the impact of the 2017 Tax Act,
changes in pretax income over many jurisdictions, and the impact of discrete items.items including equity compensation. Generally, fluctuations in theour effective tax rate are primarily due to changes in the geographic distribution of our geographic pretax income resulting from our business mix and changes in the tax impact of permanent differences, restructuring, other special items, and other discrete tax items, which may have unique tax implications depending on the nature of the item.
Segment Review
The Company’sbelow charts depict the percentage of revenue allocable to each of the Company's four segments for the six months ended December 31, 2018 compared to the six months ended December 31, 2017. Refer below for discussions regarding the segments' revenue and EBITDA performance.
Our results on a segment basis for the six months ended December 31, 20172018 compared to the six months ended December 31, 20162017 were as follows:
| | | | | | | | | | | | | | | | | | | | | | | | | | | | | |
| | Six Months Ended
December 31, | | | | FX Impact | | Constant Currency Increase/(Decrease) | | |
| 2018 | | 2017 | | | | Change $ | | Change % |
| Softgel Technologies | | | | | | | | | |
| Net revenue | $ | 412.9 | | $ | 447.8 | | $ | (13.3) | | $ | (21.6) | | (5) | % |
| Segment EBITDA | 77.5 | | 85.2 | | (2.8) | | (4.9) | | (6) | % |
| Biologics and Specialty Drug Delivery | | | | | | | | | |
| Net revenue | 338.9 | | 240.4 | | (1.6) | | 100.1 | | 42 | % |
| Segment EBITDA | 77.3 | | 48.6 | | (0.3) | | 29.0 | | 60 | % |
| Oral Drug Delivery | | | | | | | | | |
| Net revenue | 284.1 | | 271.8 | | (2.3) | | 14.6 | | 5 | % |
| Segment EBITDA | 72.2 | | 79.9 | | (0.9) | | (6.8) | | (9) | % |
| Clinical Supply Services | | | | | | | | | |
| Net revenue | 158.5 | | 218.4 | | (1.5) | | (58.4) | | (27) | % |
| Segment EBITDA | 41.2 | | 35.7 | | (0.7) | | 6.2 | | 17 | % |
| Inter-segment revenue elimination | (19.6) | | (28.2) | | (0.1) | | 8.7 | | (31) | % |
Unallocated Costs (1) | (69.2) | | (82.2) | | 1.6 | | 11.4 | | (14) | % |
| Combined Total | | | | | | | | | |
| Net revenue | $ | 1,174.8 | | $ | 1,150.2 | | $ | (18.8) | | $ | 43.4 | | 4 | % |
| | | | | | | | | |
| EBITDA from continuing operations | $ | 199.0 | | $ | 167.2 | | $ | (3.1) | | $ | 34.9 | | 21 | % |
|
| | | | | | | | | | | | | | | | | | |
| | Six Months Ended
December 31, | | FX impact | | Constant Currency Increase/(Decrease) |
| (Dollars in millions) | 2017 | | 2016 | |
| | Change $ | | Change % |
| Softgel Technologies | | | | | | | | | |
| Net revenue | $ | 447.8 |
| | $ | 388.3 |
| | $ | 11.1 |
| | $ | 48.4 |
| | 12 | % |
| Segment EBITDA | 85.2 |
| | 73.9 |
| | 1.2 |
| | 10.1 |
| | 14 | % |
| Drug Delivery Solutions | | | | | | | | | |
| Net revenue | 511.2 |
| | 405.3 |
| | 9.5 |
| | 96.4 |
| | 24 | % |
| Segment EBITDA | 128.5 |
| | 92.0 |
| | 2.3 |
| | 34.2 |
| | 37 | % |
| Clinical Supply Services | | | | | | | | | |
| Net revenue | 218.4 |
| | 152.0 |
| | 4.1 |
| | 62.3 |
| | 41 | % |
| Segment EBITDA | 35.7 |
| | 22.1 |
| | 1.1 |
| | 12.5 |
| | 57 | % |
| Inter-segment revenue elimination | (27.2 | ) | | (19.7 | ) | | (1.2 | ) | | (6.3 | ) | | 32 | % |
Unallocated costs (1) | (82.2 | ) | | (40.1 | ) | | (2.3 | ) | | (39.8 | ) | | 99 | % |
| Combined total | | | | | | | | | |
| Net revenue | $ | 1,150.2 |
| | $ | 925.9 |
| | $ | 23.5 |
| | $ | 200.8 |
| | 22 | % |
| | | | | | | | | | |
| EBITDA from continuing operations | $ | 167.2 |
| | $ | 147.9 |
| | $ | 2.3 |
| | $ | 17.0 |
| | 11 | % |
*Percentage not meaningful
| |
(1) | Unallocated costs includes equity-based compensation, certain acquisition-related costs, impairment charges, and certain other costs that are not allocated to the segments as follows: |
|
| | | | | | | |
| | Six Months Ended
December 31, |
| (Dollars in millions) | 2017 | | 2016 |
| Impairment charges and gain/(loss) on sale of assets | $ | (4.2 | ) | | $ | (0.5 | ) |
| Equity compensation | (15.5 | ) | | (11.8 | ) |
Restructuring and other special items (2) | (24.2 | ) | | (13.1 | ) |
Other income/(expense), net (3) | (19.3 | ) | | 3.9 |
|
| Non-allocated corporate costs, net | (19.0 | ) | | (18.6 | ) |
| Total unallocated costs | $ | (82.2 | ) | | $ | (40.1 | ) |
| |
(2) | Restructuring and other special items include transaction and integration costs associated with the acquisition of Catalent Indiana. |
(1) Unallocated costs include restructuring and special items, equity-based compensation, impairment charges, certain other corporate-directed costs, and other costs that are not allocated to the segments as follows:
| |
(3) | Amounts for the six months ended December 31, 2017 include $11.8 million of financing expenses related to the offering of the USD Notes and the Third Amendment and include a $6.1 million charge for commitment fees paid during the first quarter of fiscal 2018 the Bridge Facility. |
| | | | | | | | | | | |
| | Six Months Ended
December 31, | | |
| (Dollars in millions) | 2018 | | 2017 |
| Impairment charges and gain/(loss) on sale of assets | $ | (2.8) | | $ | (4.2) |
| Equity compensation | (17.5) | | (15.5) |
Restructuring and other special items (a) | (19.1) | | (24.2) |
| | | |
| | | |
| | | |
Other (expense), net (b) | (7.1) | | (18.3) |
| Non-allocated corporate costs, net | (22.7) | | (20.0) |
| Total unallocated costs | $ | (69.2) | | $ | (82.2) |
(a) Restructuring and other special items include transaction and integration costs associated with the acquisition of Catalent Indiana and Juniper.
(b) Other (expense), net of $7.1 million for the six months ended December 31, 2018 was primarily driven by a write-off of $4.2 million of previously capitalized financing charges related to the Company's U.S. dollar term loan under its senior secured credit facility. The six months ended December 31, 2017 includes financing charges of $11.8 million related to the USD Notes offering and the Third Amendment, which included a $6.1 million charge for commitment fees paid during the first quarter of fiscal 2018 on the unused Bridge Facility discussed. Foreign currency losses were also included within other (expense), net in both years.
Provided below is a reconciliation of net earnings/(loss) from continuing operations to EBITDA from continuing operations:
| | | | Six Months Ended
December 31, | | Six Months Ended
December 31, | |
| (Dollars in millions) | 2017 | | 2016 | (Dollars in millions) | 2018 | | 2017 |
| Earnings/(loss) from continuing operations | $ | (18.1 | ) | | $ | 22.0 |
| |
| Net earnings/(loss) | | Net earnings/(loss) | $ | 34.6 | | $ | (18.1) |
| Depreciation and amortization | 85.8 |
| | 71.3 |
| Depreciation and amortization | 107.5 | | 85.8 |
| Interest expense, net | 51.5 |
| | 44.9 |
| Interest expense, net | 53.6 | | 51.5 |
| Income tax (benefit)/expense | 48.0 |
| | 9.7 |
| |
| EBITDA from continuing operations | $ | 167.2 |
| | $ | 147.9 |
| |
| Income tax expense | | Income tax expense | 3.3 | | 48.0 |
| | EBITDA from operations | | EBITDA from operations | $ | 199.0 | | $ | 167.2 |
Softgel Technologies segment
| | | | 2017 vs. 2016 | | 2018 vs. 2017 | |
| Factors Contributing to Year-Over-Year Change | Six Months Ended
December 31, | Factors Contributing to Year-Over-Year Change | Six Months Ended
December 31, | |
| | Net Revenue | | Segment EBITDA | | Net Revenue | | Segment EBITDA |
| Revenue/Segment EBITDA without acquisitions | (1 | )% | | 1 | % | |
| Impact of acquisitions | 13 | % | | 13 | % | |
| Revenue / Segment EBITDA without divestitures | | Revenue / Segment EBITDA without divestitures | (3) | % | | (6) | % |
| | Impact of divestitures | | Impact of divestitures | (2) | % | | — | % |
| Constant currency change | 12 | % | | 14 | % | Constant currency change | (5) | % | | (6) | % |
| Foreign exchange fluctuation | 3 | % | | 1 | % | Foreign exchange fluctuation | (3) | % | | (3) | % |
| Total % Change | 15 | % | | 15 | % | |
| Total % change | | Total % change | (8) | % | | (9) | % |
Softgel Technologies’ net revenue increased $48.4decreased $21.6 million, or 12%5%, excluding the impact of foreign exchange, as compared to the six months ended December 31, 2016.2017. Net revenue decreased 1%, excluding the impact of the Accucaps acquisition, primarily driven by decreased profit participation revenue of 1% as compared to six months ended December 31, 2016.
Softgel Technologies' Segment EBITDA increased by $10.1 million, or 14%3%, compared to the six months ended December 31, 2016,2017, excluding the impact of divestitures. Excluding the reduction in product-participation revenue, net revenue without divestitures decreased 2%, primarily due to lower end-market volume demand for prescription products in North America coupled with a shortage in our ibuprofen supply, which occurred during the second quarter, and led to a decrease in our consumer health business of 2%.
Softgel Technologies’ Segment EBITDA decreased by $4.9 million, or 6%, compared to the six months ended December 31, 2017, excluding the impact of foreign exchange. Segment EBITDA increased 1% excluding the impact of the Accucaps acquisition. Excluding the reduction of product participation profit of 5%4%, segmentSegment EBITDA without acquisitions increased 6%divestitures decreased 2%, driven primarily relatedby a shortage in our ibuprofen supply, which led to the impact of a historical contractual settlement of 4% anddecrease in our consumer health business by 8%, partially offset by a favorable shift in product mix within our European prescription products in North America.business.
Net revenue and Segment EBITDA in our Softgel Technologies segment increased in the six months ended December 31, 2017 compared to the six months ended December 31, 2016 by 13% and 13%, respectively, due to the Accucaps acquisition.
In December 2017, we divested of two manufacturing sites in Asia Pacific operated withinin the Softgel Technologies segment in order to better streamline our global operations. The site divestitures were material neither individually norresulted in aggregatea decrease to net revenue of 2% with no impact to Segment EBITDA in the six months ended December 31, 2018 compared to the segment or to the Company.six months ended December 31, 2017.
Biologics and Specialty Drug Delivery Solutions segment | | | | 2017 vs. 2016 | | 2018 vs. 2017 | |
| Factors Contributing to Year-Over-Year Change | Six Months Ended
December 31, | Factors Contributing to Year-Over-Year Change | Six Months Ended
December 31, | |
| | Net Revenue | | Segment EBITDA | | Net Revenue | | Segment EBITDA |
| Revenue/Segment EBITDA without acquisitions | 11 | % | | 14 | % | |
| Revenue / Segment EBITDA without acquisitions | | Revenue / Segment EBITDA without acquisitions | 11 | % | | 9 | % |
| Impact of acquisitions | 13 | % | | 23 | % | Impact of acquisitions | 31 | % | | 51 | % |
| Constant currency change | 24 | % | | 37 | % | Constant currency change | 42 | % | | 60 | % |
| Foreign exchange fluctuation | 2 | % | | 3 | % | Foreign exchange fluctuation | (1) | % | | (1) | % |
| Total % Change | 26 | % | | 40 | % | |
| Total % change | | Total % change | 41 | % | | 59 | % |
|
Net revenue in our Biologics and Specialty Drug Delivery Solutions segment increased by $96.4$100.1 million, or 24%42%, compared to the six months ended December 31, 2016,2017, excluding the impact of foreign exchange. RevenueNet revenue without acquisitions increased by 11%, driven primarily by favorable end customerend-customer demand for certain higher margin offerings primarily in our U.S. operations within our oral delivery solutions platform of 5%, increased volume from ourbased drug substance biologics offerings of 4%7%, increased end-market demand for products within our respiratory and by timingophthalmic platform of execution related to timing of a standard maintenance shut-down at2%, and increased end-market demand for our European sterile pre-filled syringe facilitybased drug product offerings of 2%.
Biologics and Specialty Drug Delivery Solutions' Segmentsegment EBITDA increased by $34.2$29 million, or 37%60%, compared to the six months ended December 31, 2016,2017, excluding the impact of foreign exchange. Segment EBITDA without acquisitions increased by 14%9%, primarily due to an increase in sales volumes driven by favorable end-customer demand for certain higher margin offerings primarily in our U.S. operations within our oral delivery solutions platform of 11%, increased volume from our U.S. drug substance biologics offerings of 10%, and favorable absorption of cost and timing of a standard maintenance shut-down at our European sterile pre-filled syringe facility of 5%. Segment EBITDA also increased as a result of increased profit from our San Diego site (obtained as part of the Pharmatek acquisition) lapping a full year of ownership. These increases were partially offset by operational inefficiencies with respect to products utilizing our blow-fill-seal technology platform of 10%, decreased profit from our analytical services platform driven by decreased sales volumes related to fee-for-service development work and analytical testing in the U.S. of 6%.
On September 22, 2016, we acquired Pharmatek, which increased net revenue and EBITDA in our Drug Delivery Solutions segment for the six months ended December 31, 2017 by 2% and 1%, respectively, compared to the corresponding prior-year period.drug product offerings.
On October 23, 2017, we acquired Catalent Indiana, which increased net revenue and Segment EBITDA in our Biologics and Specialty Drug Delivery Solutions segment forby 31% and 51%, respectively, in the six months ended December 31, 2017 by 11% and 22%, respectively,2018 compared to the corresponding prior-year period.
Clinical Supply ServicesOral Drug Delivery segment
| | | | | | | | | | | |
| 2018 vs. 2017 | | |
| Factors Contributing to Year-Over-Year Change | Six Months Ended
December 31, | | |
| Net Revenue | | Segment EBITDA |
| Revenue / Segment EBITDA without acquisitions | (6) | % | | (26) | % |
| Impact of acquisitions | 11 | % | | 17 | % |
| | | |
| Constant currency change | 5 | % | | (9) | % |
| Foreign exchange fluctuation | — | % | | (1) | % |
| Total % Change | 5 | % | | (10) | % |
|
| | | | | |
| | 2017 vs. 2016 |
| Factors Contributing to Year-Over-Year Change | Six Months Ended
December 31, |
| | Net Revenue | | Segment EBITDA |
| Revenue/Segment EBITDA without acquisitions | 41 | % | | 57 | % |
| Impact of acquisitions | — | % | | — | % |
| Constant currency change | 41 | % | | 57 | % |
| Foreign exchange fluctuation | 3 | % | | 5 | % |
| Total % Change | 44 | % | | 62 | % |
Clinical Supply Services' netNet revenue in our Oral Drug Delivery segment increased by $62.3$14.6 million, or 41%5%, compared to the six months ended December 31, 2016,2017, excluding the impact of foreign exchange, primarily due to increased lower-margin comparator sourcing volume of approximately $35resulting from our Juniper acquisition. Revenue without acquisitions decreased 6%, primarily driven by decreased end-market demand for certain higher-margin offerings primarily in our U.S. operations within our commercial oral delivery solutions platform.
Oral Drug Delivery’s Segment EBITDA decreased by $6.8 million, or 23%9%, and higher volume related to our storage and distribution business of approximately $27 million, or 18%.
Clinical Supply Services' Segment EBITDA increased by $12.5 million, or 57%, excluding the impact of foreign exchange, compared to the six months ended December 31, 2016,2017, excluding the impact of foreign exchange. Segment EBITDA without acquisitions decreased 26%, primarily due to decreased volumes related to certain higher-margin offerings within our commercial oral delivery solutions platform.
On August 14, 2018, we acquired Juniper, which increased net revenue and Segment EBITDA in our Oral Drug Delivery segment for the six months ended December 31, 2018 by 11% and 17%, respectively, compared to the prior-year period.
Clinical Supply Services segment
| | | | | | | | | | | |
| 2018 vs. 2017 | | |
| Factors Contributing to Year-Over-Year Change | Six Months Ended
December 31, | | |
| Net Revenue | | Segment EBITDA |
| Revenue / Segment EBITDA | 3 | % | | 17 | % |
| Comparator revenue recognition adoption impact | (30) | % | | — | % |
| | | |
| Constant currency change | (27) | % | | 17 | % |
| Foreign exchange fluctuation | — | % | | (2) | % |
| Total % Change | (27) | % | | 15 | % |
Clinical Supply Services’ net revenue decreased by $58.4 million, or 27%, compared to the six months ended December 31, 2017, excluding the impact of foreign exchange. As a result of the adoption of ASC 606, the Company recorded comparator sourcing arrangements on a net basis versus a gross basis resulting in a decrease to net revenue by 30%, partially offset by an increase in revenue primarily due to higher volume in our storage and distribution business and higher comparator sourcing volume as compared to the prior-year period.
Clinical Supply Services’ Segment EBITDA increased by $6.2 million, or 17%, excluding the impact of foreign exchange, as compared to the six months ended December 31, 2017, primarily due to increased sales volumes in our storage and
distribution business, improved capacity utilization across the network, as well as increased profit from our lower-margin comparator sourcing.
Liquidity and Capital Resources
Sources and Uses of Cash
Our principal source of liquidity has been cash flows generated from operations and certain financing activities for acquisitions. The principal uses of cash are to fund planned operating and capital expenditures, business or asset acquisitions, interest payments on debt, and any mandatory or discretionary principal payments on debt issuances. As of December 31, 2017, our financing needs were supported by the five-year,2018, Operating Company had available a $200 million revolving credit facility maintained by Catalent Pharma Solutions, Inc. (our "Operating Company") that matures in May 2022 (following the Third Amendment in October 2017), the capacity of which is reduced by $13.0$6.3 million in outstanding letters of credit. The revolving credit facility includes borrowing capacity available for letters of credit and for short-term borrowings, referred to as swing-line borrowings. As of December 31, 2017,2018, we had no outstanding borrowings under our revolving credit facility.
On October 29, 2015, our Board of Directors authorized a share repurchase program to use up to $100.0 million to repurchase shares of our outstanding common stock.stock, par value $0.01 ("Common Stock"). Under the program, we are authorized to repurchase shares through open market purchases, privately negotiated transactions, or otherwise as permitted by applicable federal securities laws. There has been no purchase pursuant to this program as of December 31, 2017.
U.S. Tax Reform Considerations
Recent changes to the taxation of undistributed foreign earnings in connection with the 2017 Tax Act could potentially change our future intentions regarding the reinvestment of such earnings. We intend to continue to monitor regulatory developments concerning the taxation of undistributed foreign earnings, as well as our liquidity needs both domestic and foreign. If our plans change and we choose to repatriate any funds to the U.S. in the future, we could potentially be subject to applicable state, local, and/or foreign taxes. We have yet to determine the potential use of any cash that may be repatriated to the U.S. as a result of the 2017 Tax Act. Based on the current estimate of the mandatory transition cash tax liability of $8.7 million and timing of the related payments, we believe that cash from operations will be sufficient to make all required payments.2018.
Cash Flows
The following table summarizes our consolidated statement of cash flows:
| | | | | | | | | | | | | | | | | |
| | Six Months Ended
December 31, | | | | |
| (Dollars in millions) | 2018 | | 2017 | | $ Change |
| Net cash provided by/(used in): | | | | | |
| Operating activities | $ | 84.5 | | $ | 176.0 | | $ | (91.5) |
| Investing activities | $ | (208.8) | | $ | (825.7) | | $ | 616.9 |
| Financing activities | $ | (73.8) | | $ | 682.4 | | $ | (756.2) |
|
| | | | | | | | | | | |
| | Six Months Ended
December 31, | | |
| (Dollars in millions) | 2017 | | 2016 | | Difference |
| Net cash provided by/(used in): | | | | | |
| Operating activities | $ | 176.0 |
| | $ | 96.0 |
| | $ | 80.0 |
|
| Investing activities | $ | (825.7 | ) | | $ | (138.5 | ) | | $ | (687.2 | ) |
| Financing activities | $ | 682.4 |
| | $ | 175.7 |
| | $ | 506.7 |
|
Operating Activities
For the six months ended December 31, 2017,2018, cash provided by operating activities was $176.0$84.5 million, compared to $96.0$176.0 million for the corresponding prior-year period. Cash flow from operating activities for the six months ended December 31, 2017 increased2018 decreased due to certain working capital improvements primarily driven by a decrease in trade receivables from the higher collection of receivables during the corresponding prior-year period and higher inventory levels during the current-year six-month period compared to the prior-year period.
Investing Activities
For the six months ended December 31, 2017,2018, cash used in investing activities was $825.7$208.8 million compared to $138.5$825.7 million for the six months ended December 31, 2016,2017, primarily driven by $748.0 million of cash paid for the acquisition of Catalent Indiana, in the second quarternet of fiscal 2018. Duringcash acquired during the prior-year six-month period, $86.9while cash paid for acquisition during the current-year six-months period was $127.5 million, net of cash was paidacquired for the acquisition of Pharmatek, netJuniper in August 2018. Other use of cash acquired. The increase in cash used in investing activities was also due to an increaseincludes cash used in acquisitions of property, plant, and equipment, which totaled $82.9$81.3 million for the six months ended December 31, 20172018 compared to $54.1$82.9 million in the six months ended December 31, 2016.
2017.
Financing Activities
For the six months ended December 31, 2017,2018, cash provided byused in financing activities was $682.4$73.8 million compared to $175.7cash provided by financing activities of $682.4 million for the six months ended December 31, 2016,2017. The cash used in financing activities during the current six-month period is primarily driven by $450 million used in a partial paydown of the U.S. dollar-denominated term loan in July 2018, and the first installment payment on the deferred purchase consideration of which $44.0 million represents the deemed principal portion of the debt. These payments were offset by net proceeds of $445.5 million raised as part of the 2018 Equity Offering. In the 2018 Equity Offering, we sold 11.4 million shares, including the underwriters' over-allotment, of our Common Stock at a price to the public of $40.24 per share, before underwriting discounts and commissions. The net proceeds of $445.5 million include the effect of discounts and commissions and other offering expenses. We used the net proceeds to repay a corresponding portion of the outstanding borrowings under the U.S. dollar-denominated term loans. The cash provided by financing activities in the prior-year six-month period was primarily driven by net proceeds of $442.6$442 million and $277.8 million raised as part of our Debt OfferingUSD Notes offering and a primary offering of our common stockCommon Stock in September 2017 (the "Equity"2017 Equity Offering"), respectively, during the current-yearprior-year six-month period. In the 2017 Equity Offering, we sold 7.4 million shares, of our common stockincluding the underwriters' over-allotment, at a price to the public of $39.10 per share, before underwriting discounts and commissions. The net proceeds of $277.8 million includesinclude the effect of these discounts and commissions and other offering expenses. The net proceeds of these offeringsthe 2017 Equity Offering were used to fund a portion of the initial consideration for the Catalent Indiana acquisition. Contemporaneous to completing the Debt Offerings, we completed the Third Amendment to lower the interest rate and extend the maturity dates on our senior secured credit facilities. In connection with the Debt Offering and the Third Amendment, we incurred $22.8 million of debt discount and third-party financing costs, of which $11.8 million was expensed and recorded in other expense/(income), net in the consolidated statement of operations.
Guarantees and Security
Senior Secured Credit Facilities
All obligations under the Credit Agreement and the guarantees of those obligations are secured by substantially all of the following assets of Operating Company and each guarantor (Operating Company's parent entity PTS Intermediate Holdings LLC ("PTS Intermediate"), and each of Operating Company's material domestic subsidiaries), subject to certain exceptions:
•a pledge of 100% of the capital stock of Operating Company and 100% of the equity interests directly held by Operating Company and each guarantor in any wholly owned material subsidiary of Operating Company or any guarantor (which pledge, in the case of any non-U.S. subsidiary of a U.S. subsidiary, will not include more than 65% of the voting stock of such non-U.S. subsidiary); and
•a security interest in, and mortgages on, substantially all tangible and intangible assets of Operating Company and of each guarantor, subject to certain limited exceptions.
The Euro Notes and the USD Notes
All obligations under the Euro Notes and the USD Notes are general, unsecured, and subordinated to all existing and future secured indebtedness of the guarantors to the extent of the value of the assets securing such indebtedness. The Euro Notes and the USD Notes are each separately guaranteed by all of Operating Company's wholly owned U.S. subsidiaries that guarantee the senior secured credit facilities. Neither the Euro Notes nor the USD Notes are guaranteed by either PTS Intermediate Holdings LLC or Catalent, Inc.
Debt Covenants
Senior Secured Credit Facilities
The Credit Agreement contains a number of covenants that, among other things, restrict, subject to certain exceptions, Operating Company’s (and Operating Company’s restricted subsidiaries’) ability to incur additional indebtedness or issue certain preferred shares; create liens on assets; engage in mergers and consolidations; sell assets; pay dividends and distributions or repurchase capital stock; repay subordinated indebtedness; engage in certain transactions with affiliates; make investments, loans, or advances; make certain acquisitions; enter into sale and leaseback transactions; amend material agreements governing Operating Company’s subordinated indebtednessindebtedness; and change Operating Company’s lines of business.
The Credit Agreement also contains change of controlchange-of-control provisions and certain customary affirmative covenants and events of default. The revolving credit facility requires compliance with a net leverage covenant when there is a 30% or more draw outstanding at a period end. As of December 31, 2017, we were2018, Operating Company was in compliance with all material covenants related to our senior-secured obligations.under the Credit Agreement.
Subject to certain exceptions, the Credit Agreement permits usOperating Company and ourits restricted subsidiaries to incur certain additional indebtedness, including secured indebtedness. None of ourOperating Company's non-U.S. subsidiaries or its Puerto Rico subsidiariessubsidiary is a guarantor of the loans.
Under the Credit Agreement, Operating Company's ability to engage in certain activities such as incurring certain additional indebtedness, making certain investments, and paying certain dividends is tied to ratios based on Adjusted EBITDA (which is defined as "Consolidated EBITDA" in the Credit Agreement). Adjusted EBITDA is based on the definitions in the Credit Agreement, is not defined under GAAP, and is subject to important limitations.
As market conditions warrant, we and our affiliates may from time to time seek to purchase our outstanding debt in privately negotiated or open marketopen-market transactions, by tender offer or otherwise. Subject to any applicable limitation contained in the Credit Agreement, any purchase made by us may be funded by the use of cash on our balance sheet or the incurrence of new secured or unsecured debt. The amounts involved in any such purchase transactions, individually or in the aggregate, may be material. Any such purchase may be with respect to a substantial amount of a particular class or series of debt, with the
attendant reduction in the trading liquidity of such class or series. In addition, any such purchases made at prices below the “adjusted issue price” (as defined for U.S. federal income tax purposes) may result in taxable cancellation of indebtedness income to us, which amounts may be material, and in related adverse tax consequences to us.
The Euro Notes and the USD Notes
The Indentures governing the Euro Notes and the USD Notes (the "Indentures") contain certain covenants that, among other things, limit the ability of Operating Company and its restricted subsidiaries to incur or guarantee more debt or issue certain preferred shares, pay dividends on, repurchase, or make distributions in respect of their capital stock or make other restricted payments,payments; make certain investments,investments; sell certain assets,assets; create liens,liens; consolidate, merge, sell, or otherwise dispose of all or substantially all of their assets,assets; enter into certain transactions with their affiliates,affiliates; and designate their subsidiaries as unrestricted subsidiaries. These covenants are subject to a number of exceptions, limitations and qualifications as set forth in the Indentures. The Indentures also contain customary events of default including, but not limited to, nonpayment, breach of covenants, and payment or acceleration defaults in certain other indebtedness of Operating Company or certain of its subsidiaries. Under the Indentures, uponUpon an event of default, either the holders of at least 30% in principal amount of eithereach of the then-outstanding Euro Notes or the then-outstanding USD Notes, or either of the Trustees under the applicable notesIndentures, may declare the applicable notes immediately due and payable, or in certain circumstances, the applicable notes automatically will become automatically immediately due and immediately payable. As of December 31, 2017, we were2018, Operating Company was in compliance with all material covenants related tounder the Indentures.
As of December 31, 20172018 and June 30, 2017,2018, the amounts of cash and cash equivalents held by foreign subsidiaries were $272.2$179.0 million and $249.8$124.7 million, respectively, out of the total consolidated cash and cash equivalents of $329.5$207.9 million and $288.3$410.2 million, respectively. These balances are dispersed across many international locations around the world.
Backlog
While we generally have long-term supply agreements that provide for a revenue stream over a period of years, our backlog represents, as of a point in time, future service revenues from work not yet completed. For our Softgel Technologies and Drug Delivery Solutions segments, backlog represents firm orders for manufacturing services and includes minimum volumes, where applicable. For our Clinical Supply Services segment, backlog represents estimated future service revenues from work not yet completed under signed contracts. Using these methods of reporting backlog, as of December 31, 2017, backlog was approximately $1,121.6 million, compared to approximately $1,052.2 million as of June 30, 2017, including approximately $306.0 million and $338.3 million, respectively, related to our Clinical Supply Services segment. We expect to recognize approximately 70% of revenue from the backlog in existence as of December 31, 2017 by June 30, 2018.
To the extent projects are delayed, the timing of our revenue could be affected. If a customer cancels an order, we may be reimbursed for the costs we have incurred. For orders that are placed inside a contractual firm period, we generally have a contractual right to payment in the event of cancellation. Fluctuations in our reported backlog levels also result from the timing and order pattern of our customers who often seek to manage their level of inventory on hand. Because of customer ordering patterns, our backlog reported for certain periods may fluctuate and may not be indicative of future results.
Interest Rate Risk Management
A portion of the debt used to finance our operations is exposed to interest-rate fluctuations. We may use various hedging strategies and derivative financial instruments to create an appropriate mix of fixed- and floating-rate assets and liabilities. Historically, we have used interest-rate swaps to manage the economic effect of variable ratevariable-rate interest obligations associated with our floating-rate term loans so that the interest payable on the term loans effectively becomes fixed at a certain rate, thereby reducing the impact of future interest-rate changes on our future interest expense. As of December 31, 2017,2018, we did not have any interest-rate swap agreementsagreement in place that would have the economic effect of modifying the variablevariable-rate interest obligations associated with our floating-rate term loans.
Currency Risk Management
We are exposed to fluctuations in the Euro-USDeuro-U.S. dollar exchange rate on our investments in our foreign operations in Europe. While we do not actively hedge against changes in foreign currency, we have mitigated the exposure of our investments in our European operations by denominating a portion of our debt in euros. At December 31, 2017,2018, we had $811.9$777.7 million of euro-denominated debt outstanding that qualifies as a hedge of a net investment in foreign operations. Refer to Note 910 to our unaudited consolidated financial statements included elsewhere in this Quarterly Report on Form 10-Q for further discussion of net investment hedge activity in the period.
Periodically,From time to time, we may utilizeuse forward foreign currency exchange contracts to manage our exposure to the variability of cash flows primarily related to the foreign exchange rate changes of future foreign currency transaction costs. In addition, we may utilize
foreign currency forwarduse such contracts to protect the value of existing foreign currency assets and liabilities. Currently, we do not utilizeuse any forward foreign currency exchange contracts. We expect to continue to evaluate hedging opportunities for foreign currency in the future.
Contractual Obligations
Besides the changeschange in our long-term obligations related to the Third Amendment, the offering$450.0 million partial paydown of the USD Notes, and the deferred purchase consideration associated with the Catalent Indiana acquisition as disclosed in Liquidity and Capital Resources earlier in this Item,outstanding borrowings under Operating Company's U.S. dollar-denominated term loans on July 31, 2018, there has been no significant change to our contractual obligations since our Annual Report on Form 10-K for the period ended June 30, 2017.Fiscal 2018 10-K. Refer to Note 106 to our unaudited consolidated financial statements included elsewhere in this Quarterly Report on Form 10-Q for a further discussion regarding tax reform and the Company'sour long-term obligations.
Off-Balance Sheet Arrangements
Other than operating leases and outstanding letters of credit as discussed above, we do not have any material off-balance sheet arrangements as of December 31, 2017.2018.
| |
Item 3. | QUANTITATIVE AND QUALITATIVE DISCLOSURES ABOUT MARKET RISK |
Item 3. QUANTITATIVE AND QUALITATIVE DISCLOSURES ABOUT MARKET RISK
We are exposed to cash flow and earnings fluctuations as a result of certain market risks. These market risks primarily relate to changes in interest rates associated with our long-term debt obligations and foreign exchange rate changes.
Interest Rate Risk
The Company has historically used interest-rate swaps to manage the economic effect of variable ratevariable-rate interest obligations associated with our floating-rate term loans so that the interest payable on the term loans effectively becomes fixed at a certain rate, thereby reducing the impact of future interest-rate changes on our future interest expense. As of December 31, 2017,2018, we did not have any interest-rate swap agreements in place that would either have the economic effect of modifying the variablevariable-rate interest obligations associated with our floating-rate term loans or would be considered an effective cash flow hedge for financial reporting purposes.
Foreign Currency Exchange Risk
By the nature of our global operations, we are exposed to cash flow and earnings fluctuations resulting from foreign exchange rate variation. These exposures are transactional and translational in nature. Since we manufacture and sell our products throughout the world, our foreign currencyforeign-currency risk is diversified. Principal drivers of this diversified foreign exchangeforeign-exchange exposure include the European euro, British pound, Argentinean peso, Brazilian real, and Australian dollar. Our transactional exposure arises from the purchase and sale of goods and services in currencies other than the functional currency of our operational units. We also have exposure related to the translation of financial statements of our foreign subsidiaries into U.S. dollars, the functional currency of the parent.Operating Company. The financial statements of our operations outside the U.S. are measured using the local currency as the functional currency. Adjustments to translate the assets and liabilities of these foreign operations in U.S. dollars are accumulated as a component of accumulated other comprehensive income/(loss) utilizing period-end exchange rates. Foreign currencyForeign-currency transaction gains and losses calculated by utilizing weighted average exchange rates for the period are included in the statements of operations in “other (income)/other expense, net.” Such foreign currencyforeign-currency transaction gains and losses include inter-company loans denominated in non-U.S. dollar currencies.
| |
Item 4. | CONTROLS AND PROCEDURES |
Item 4. CONTROLS AND PROCEDURES
Disclosure Controls and Procedures
We maintain disclosure controls and procedures that are designed to ensure that information required to be disclosed in our reports under the Exchange Act is recorded, processed, summarized, and reported within the time periods specified in the SEC’s rules and forms, and that such information is accumulated and communicated to our management, including our President and Chief Executive Officer and our ExecutiveSenior Vice President and Chief Financial Officer, as appropriate, to allow timely decisions regarding required disclosures. Any control or procedures, no matter how well designed and operated, can provide only reasonable assurance of achieving the desired control objectives. Our management, with the participation of our President and Chief Executive Officer, and our ExecutiveSenior Vice President and Chief Financial Officer, has evaluated the effectiveness of the design and operation of our disclosure controls and procedures as of the end of the period covered by this Quarterly Report on Form 10-Q. Based upon that evaluation, our President and Chief Executive Officer and our ExecutiveSenior Vice President and Chief Financial Officer concluded that, as of December 31, 2017,2018, our disclosure controls and procedures were effective to accomplish their objectives at the reasonable assurance level.
Changes in Internal Control over Financial Reporting
There was no change in our internal control over financial reporting (as such term is defined in Rules 13a-15(f) and 15d-15(f) under the Exchange Act) that occurred during our most recent fiscal quarter that has materially affected, or is reasonably likely to materially affect, our internal control over financial reporting.
In October 2017, the Company acquired Catalent Indiana. During the six months ended December 31, 2018, we continued to integrate Catalent Indiana into the Company’s financial reporting processes and procedures and internal control over financial reporting. As part of this process, we have undertaken efforts to significantly enhance the internal controls of Catalent Indiana, which were not subject to the internal control requirements applicable to U.S. public companies prior to our acquisition, to bring them in line with our internal controls over financial reporting, and those efforts are ongoing.
PART II. OTHER INFORMATION
Item 1. LEGAL PROCEEDINGS
SEC inquiry into Juniper Pharmaceuticals, Inc.
On August 14, 2018, Operating Company acquired Juniper. On November 14, 2016, Juniper filed with the SEC restated audited consolidated financial statements for the fiscal years ended December 31, 2013 through December 31, 2015, including the unaudited consolidated financial information for each quarterly period within the fiscal years ended December 31, 2014 and 2015, and restated unaudited consolidated financial statements for the quarters ended March 31, 2016 and June 30, 2016 and the related quarters in 2015, in order to correct certain timing errors regarding how it recognized revenue from a supply contract with an affiliate of Merck KGaA. On January 24, 2017, Juniper received a subpoena from the SEC requesting information concerning these restatements and related issues. Juniper responded to the subpoena and is cooperating with the SEC’s inquiry, including the taking of testimony from former Juniper employees and others. The Company continues to receive and resolve claims stemming from a prior, temporary, regulatory suspension of one of our manufacturing facilities. To date, more than 30 customersunderstands that the inquiry is ongoing but does not believe the outcome of the facility have presented claims againstinvestigation will be material to it; nonetheless, the Company for alleged losses, including lost profits and other types of indirect or consequential damagescannot provide any assurance regarding that they have allegedly suffered due to the temporary suspension, or have reserved their right to do so subsequently. The Company is unable to estimate at this time either the total value of claims that are reasonably possible to be asserted with respect to this matter or the likely cost to resolve them, although (a) as of the end of December 31, 2017, the Company has settled 18 customer claims and (b) certain remaining customers have presented the Company with support for other claims having an aggregate claim value of approximately $4 million. To date, none of the asserted claims takes into account limitations of liability in the contracts governing these claims or any other defense that the Company may assert. In addition, the Company may have insurance for additional costs it may incur as a result of such claims, subject to various deductibles and other limitations, but there can be no assurance as to the aggregate amount or timing of insurance recoveries against any such costs.outcome.
Other
From time to time, the Company may be involved in legal proceedings arising in the ordinary course of business, including, without limitation, inquiries and claims concerning environmental contamination as well as litigation and allegations in connection with acquisitions, product liability, manufacturing or packaging defects, and claims for reimbursement for the cost of lost or damaged active pharmaceutical ingredients, the cost of any of which could be significant. The Company intends to vigorously defend itself against any such litigation and does not currently believe that the outcome of any such litigation will have a material adverse effect on the Company’s financial statements. In addition, the healthcare industry is highly regulated and government agencies continue to scrutinize certain practices affecting government programs and otherwise.
From time to time, the Company receives subpoenas or requests for information relating to the business practices and activities of customers or suppliers from various governmental agencies or private parties, including from state attorneys general, the U.S. Department of Justice, and private parties engaged in patent infringement, antitrust, tort, and other litigation. The Company generally responds to such subpoenas and requests in a timely and thorough manner, which responses sometimes require considerable time and effort and can result in considerable costs being incurred. The Company expects to incur costs in future periods in connection with future requests.
Item 1A. RISK FACTORS
In addition to the other information set forth in this report, you should carefully consider the factors discussed in the section entitled “Risk Factors”"Risk Factors" in our Annual Report on FormFiscal 2018 10-K for the fiscal year ended June 30, 2017,2018, which could materially affect our business, financial condition, or future results. The risks described in our Annual Report on Form 10-Ksuch report are not the only risks facing us. Additional risks and uncertainties not currently known to us or that we currently deem to be immaterial also may materially adversely affect our business, financial condition, and/or operating results. Other than what was disclosed in the Special Note Regarding Forward-Looking Statements, and discussed below, there has been no material change to the risk factors disclosed in the Company’s Annual Report on Form 10-K.
The following information amends, updates, and should be read in conjunction with the risk factors and information disclosed in theour Fiscal 20172018 10-K.
The impact to our business of recently enacted U.S. tax legislation could differ materially from our current estimates.
On December 22, 2017, the U.S. government enacted wide-ranging tax legislation, the 2017 Tax Act. The 2017 Tax Act significantly revises U.S. tax law by, among other provisions, lowering the applicable U.S. federal statutory income tax rate from 35% to 21%, creating a partial territorial tax system that includes a mandatory one-time transition tax on previously deferred foreign earnings, and eliminating or reducing certain income tax deductions.
Although we are still determining whether the 2017 Tax Act will ultimately benefit our results of operations and financial condition in future periods, primarily by reducing the applicable U.S. federal statutory income tax rate from 35% to 21%, we recorded a one-time net charge of $46.0 million within our income tax provision as a provisional estimate of the net accounting impact of the 2017 Tax Act in the second quarter of fiscal 2018. We recorded this charge on a provisional basis, based on our present understanding of the 2017 Tax Act and other information available as of the time of the estimates, including assumptions and expectations about future events.
Although we believe these provisional amounts represent a reasonable estimate of the ultimate enactment-related impact the 2017 Tax Act will have on our consolidated financial statements, we may adjust these amounts materially as additional information becomes available and we complete further analyses. The impact of the 2017 Tax Act to our business in future
periods is also subject to a variety of factors beyond our control including, but not limited to, (i) potential amendments to the 2017 Tax Act; (ii) potential changes to state, local, and foreign tax laws in response to the 2017 Tax Act; and (iii) potential new or interpretative guidance issued by the SEC, the Financial Accounting Standards Board or the Internal Revenue Service related to the 2017 Tax Act. Any of these factors could cause our actual results to differ materiality from our current expectations and/or investors’ expectations. Further, there are certain effects of the 2017 Tax Act we cannot reasonably estimate, including (a) the GILTI rules, (b) the FDII deduction, (c) the BEAT, (d) provisions eliminating or reducing certain income tax deductions, such as interest expense, and certain employee expenses, and (e) the state tax impact of the 2017 Tax Act. As we gather, analyze, and consider additional data in the context of the 2017 Tax Act and ASC 740 Income Taxes, we may adjust in future periods our current estimates, but we will do so only during the measurement period prescribed by SAB 118. Any such adjustment may be material.
| |
Item 2. | UNREGISTERED SALES OF EQUITY SECURITIES AND USE OF PROCEEDS |
Item 2. UNREGISTERED SALES OF EQUITY SECURITIES AND USE OF PROCEEDS
None.
Purchase of Equity Securities
None.
| |
Item 3. | DEFAULTS UPON SENIOR SECURITIES |
Item 3. DEFAULTS UPON SENIOR SECURITIES
None.
| |
Item 4. | MINE SAFETY DISCLOSURES |
Item 4. MINE SAFETY DISCLOSURES
Not applicable.
Item 5. OTHER INFORMATION
Not applicable.
Item 6. EXHIBITS
| | | | | | | | |
| | Third Amended and Restated Certificate of Incorporation of Catalent, Inc., as filed with the Secretary of State of the State of Delaware on October 31, 2018 (incorporated by reference to Exhibit 3.1 to the Company’s Current Report on Form 8-K filed with the Commission on November 6, 2018) |
| | |
| | Offer letter, dated JanuaryBylaws of Catalent, Inc., effective October 31, 2018 between Wetteny Joseph and Catalent Pharma Solutions, LLC (incorporated by reference to Exhibit 3.2 to the Company’s Current Report on Form 8-K filed with the Commission on November 6, 2018). |
| | |
| | Catalent, Inc. 2018 Omnibus Incentive Plan with UK Sub-plan.*† |
| | |
| | Catalent, Inc. 2019 Employee Stock Purchase Plan (incorporated by reference to Exhibit 10.2 to the Company's current reportCurrent Report on Form 8-K filed on February 5, 2018, File No. 001-36587) November 6, 2018).† |
| | |
| | Certification of the Chief Executive Officer pursuant to Rule 13a-14(a) or Rule 15d-14(a) of the Securities Exchange Act of 1934, as amended* |
| | |
| | Certification of the Chief Financial Officer pursuant to Rule 13a-14(a) or Rule 15d-14(a) of the Securities Exchange Act of 1934, as amended* |
| | |
| | Certification of the Chief Executive Officer pursuant to 18 U.S.C. Section 1350, as adopted pursuant to Section 906 of the Sarbanes-Oxley Act of 2002** |
| | |
| | Certification of the Chief Financial Officer pursuant to 18 U.S.C. Section 1350, as adopted pursuant to Section 906 of the Sarbanes-Oxley Act of 2002** |
| | |
| 101.1 | | The following financial information from Catalent, Inc.’s Quarterly Report on Form 10-Q for the quarter ended December 31, 20172018 formatted in inline XBRL: (i) Consolidated Statements of Operations for the Three and NineSix Months Ended December 31, 20172018 and 2016;2017; (ii) Consolidated Statements of Comprehensive Income/(Loss) for the Three and NineSix Months Ended December 31, 20172018 and 20162017 (iii) Consolidated Balance Sheets as of December 31, 20172018 and June 30, 2017;2018; (iv) Consolidated Statement of Changes in Shareholders’ Equity/(Deficit) as of December 31, 2017;2018; (v) Consolidated Statements of Cash Flows for the Six Months Ended December 31, 20172018 and 2016;2017; and (vi) Notes to Unaudited Consolidated Financial Statements. |
* Filed herewith
** Furnished herewith
† Represents a management contract, compensatory plan or arrangement in which the directors and/or executive officers are eligible to participate.
SIGNATURES
Pursuant to the requirements of the Securities Exchange Act of 1934, the registrant has duly caused this report to be signed on its behalf by the undersigned, thereunto duly authorized.
| | | | | | | | | | | | | | |
| | CATALENT, INC. (Registrant) | | | | | | | | Date: | | CATALENT, INC.
(Registrant)
| | | | | Date: | February 5, 20182019 | By: | | /s/ John R. Chiminski | | | | | John R. Chiminski | | | | | President & Chief Executive Officer | | | | | | | Date: | February 5, 20182019 | By: | | /s/ Matthew M. WalshWetteny Joseph | | | | | Matthew M. WalshWetteny Joseph | | | | | ExecutiveSenior Vice President & Chief Financial Officer |
|