UNITED STATES
SECURITIES AND EXCHANGE COMMISSION
Washington, D.C. 20549
FORM 10-Q
|
| | |
ý☒ | | Quarterly Report Pursuant to Section 13 or 15(d) of the Securities Exchange Act of 1934 |
| For the quarterly period ended |
March 31,June 30, 2020 |
| or |
o☐ | | Transition Report Pursuant to Section 13 or 15(d) of the Securities Exchange Act of 1934 |
Commission File Number: 001-38272
EVOQUA WATER TECHNOLOGIES CORP.
(Exact name of registrant as specified in its charter)
|
| | | |
Delaware | | 46-4132761 |
(State or other jurisdiction of incorporation or organization) | | 46-4132761
(I.R.S. Employer Identification No.) |
210 Sixth Avenue | | 15222 |
| Pittsburgh, | Pennsylvania | |
| (Address of principal executive offices) | |
15222
(Zip code) |
(724) (724) 772-0044
(Registrant’s telephone number, including area code)
Securities registered pursuant to Section 12(b) of the Act:
|
| | |
| Title of each class | Trading Symbol(s) | Name of each exchange on which registered |
| Common Stock, par value $0.01 per share | AQUA | New York Stock Exchange |
Indicate by check mark whether the registrant (1) has filed all reports required to be filed by Section 13 or 15(d) of the Securities Exchange Act of 1934 during the preceding 12 months (or for such shorter period that the registrant was required to file such reports), and (2) has been subject to such filing requirements for the past 90 days. Yes ý☒ No o☐
Indicate by check mark whether the registrant has submitted electronically and posted on its corporate Web site, if any, every Interactive Data File required to be submitted and posted pursuant to Rule 405 of Regulation S-T (§ 232.405 of
this chapter) during the preceding 12 months (or for such shorter period that the registrant was required to submit and post such files). Yes ý☒ No o☐
Indicate by check mark whether the registrant is a large accelerated filer, an accelerated filer, a non-accelerated filer, a smaller reporting company or an emerging growth company. See the definitions of “large accelerated filer”, “accelerated filer”, “smaller reporting company” and “emerging growth company” in Rule 12b-2 of the Exchange Act.
|
| | | | | | | | |
Large accelerated filer o☐ | | Accelerated filer | ☒ | | Accelerated filer ý
| | Non-accelerated filer o☐ (Do not check if a smaller reporting company) | | Smaller reporting company o
| ☐ |
| | | Emerging growth company o | ☐ |
If an emerging growth company, indicate by check mark if the registrant has elected not to use the extended transition period for complying with any new or revised financial accounting standards provided pursuant to Section 13(a) of the Exchange Act. o☐
Indicate by check mark whether the registrant is a shell company (as defined in Rule 12b-2 of the Exchange Act). Yes o☐ No ý☒
There were 116,974,960117,199,388 shares of the registrant’s common stock, par value $0.01 per share, outstanding as of April 30,July 31, 2020.
EVOQUA WATER TECHNOLOGIES CORP.
TABLE OF CONTENTS
CAUTIONARY NOTE REGARDING FORWARD-LOOKING STATEMENTS
This Quarterly Report on Form 10-Q (this “Report”) contains forward‑looking statements within the meaning of the Private Securities Litigation Reform Act of 1995, Section 27A of the Securities Act, as amended (the “Securities Act”), and Section 21E of the Securities Exchange Act of 1934, as amended (the “Exchange Act”). You can generally identify forward‑looking statements by our use of forward‑looking terminology such as “anticipate,” “believe,” “continue,” “could,” “estimate,” “expect,” “intend,” “may,” “might,” “plan,” “potential,” “predict,” “projection,” “seek,” “should,” “will” or “would” or the negative thereof or other variations thereon or comparable terminology. In particular, statements about the markets in which we operate, including growth of our various markets, our expectations, beliefs, plans, strategies, objectives, prospects, assumptions, or future events or performance, statements regarding our two-segment restructuring actions and expected restructuring charges and cost savings for fiscal 2020 and beyond, and statements related to the COVID-19 pandemic and its impact on our business contained in this Report are forward‑looking statements.
We have based these forward‑looking statements on our current expectations, assumptions, estimates and projections. While we believe these expectations, assumptions, estimates and projections are reasonable, such forward‑looking statements are only predictions and involve known and unknown risks and uncertainties, many of which are beyond our control. These and other important factors, including those discussed in Part I, Item 1A. “Risk Factors” of our Annual Report on Form 10-K for the fiscal year ended September 30, 2019, as filed with the Securities and Exchange Commission (“SEC”) on November 25, 2019, Part II, Item 1A. “Risk Factors” of our Quarterly Report on Form 10-Q for the quarter ended March 31, 2020, as filed with the SEC on May 6, 2020, and Part I, Item 2. “Management’s Discussion and Analysis of Financial Condition and Results of Operation” of this Report and Part II, Item 1A. “Risk Factors” of this Report may cause our actual results, performance or achievements to differ materially from any future results, performance or achievements expressed or implied by these forward‑looking statements or could affect our share price. Some of the factors that could cause actual results to differ materially from those expressed or implied by the forward‑looking statements include:
general global economic and business conditions, including the impacts of the COVID-19 pandemic and recent disruptions in global oil markets;
our ability to compete successfully in our markets;
our ability to continue to develop or acquire new products, services and solutions and adapt our business to meet the demands of our customers, comply with changes to government regulations and achieve market acceptance with acceptable margins;
our ability to implement our growth strategy, including acquisitions, and our ability to identify suitable acquisition targets;
our ability to operate or integrate any acquired businesses, assets or product lines profitably or otherwise successfully implement our growth strategy;
our ability to achieve the expected benefits of our restructuring actions, andincluding restructuring our business into two segments;
material and other cost inflation and our ability to mitigate the impact of inflation by increasing selling prices and improving our productivity efficiencies;
our ability to execute projects in a timely manner, consistent with our customers’ demands;
our ability to accurately predict the timing of contract awards;
delays in enactment or repeals of environmental laws and regulations;
the potential for us to become subject to claims relating to handling, storage, release or disposal of hazardous materials;
risks associated with product defects and unanticipated or improper use of our products;
the potential for us to incur liabilities to customers as a result of warranty claims or failure to meet performance guarantees;
our ability to meet our customers’ safety standards or the potential for adverse publicity affecting our reputation as a result of incidents such as workplace accidents, mechanical failures, spills, uncontrolled discharges, damage to customer or third‑party property or the transmission of contaminants or diseases;
litigation, regulatory or enforcement actions and reputational risk as a result of the nature of our business or our participation in large‑scale projects;
seasonality of sales and weather conditions;
risks related to government customers, including potential challenges to our government contracts or our eligibility to serve government customers;
the potential for our contracts with federal, state and local governments to be terminated or adversely modified prior to completion;
risks related to foreign, federal, state and local environmental, health and safety laws and regulations and the costs associated therewith;
risks associated with international sales and operations, including our operations in China;
our ability to adequately protect our intellectual property from third‑party infringement;
our increasing dependence on the continuous and reliable operation of our information technology systems;
risks related to our substantial indebtedness;
our need for a significant amount of cash, which depends on many factors beyond our control;
risks related to AEA Investors LP’s (along with certain of its affiliates, collectively, “AEA”) ownership interest in us; and
other risks and uncertainties, including those listed under Part I, Item 1A. “Risk Factors” in our Annual Report on Form 10-K for the fiscal year ended September 30, 2019, as filed with the SEC on November 25, 2019, Part II, Item 1A. “Risk Factors” of thisour Quarterly Report on Form 10-Q for the quarter ended March 31, 2020, as filed with the SEC on May 6, 2020, and in other filings we may make from time to time with the SEC.
Given these risks and uncertainties, you are cautioned not to place undue reliance on such forward‑looking statements. The forward‑looking statements contained in this Report are not guarantees of future performance and our actual results of operations, financial condition and liquidity, and the development of the industry in which we operate, may differ materially from the forward‑looking statements contained in this Report. In addition, even if our results of operations, financial condition and liquidity, and events in the industry in which we operate, are consistent with the forward‑looking statements contained in this Report, they may not be predictive of results or developments in future periods.
Any forward‑looking statement that we make in this Report speaks only as of the date of such statement. Except as required by law, we do not undertake any obligation to update or revise, or to publicly announce any update or revision to, any of the forward‑looking statements, whether as a result of new information, future events or otherwise, after the date of this Report.
Part I - Financial Information
Item 1. Consolidated Financial Statements
INDEX TO UNAUDITED CONSOLIDATED FINANCIAL STATEMENTS
|
| |
| Evoqua Water Technologies Corp. | |
| Unaudited Consolidated Financial Statements | |
| |
| |
| |
| |
| |
| |
| |
Evoqua Water Technologies Corp.
Consolidated Balance Sheets
| | | | (Unaudited) | | | (Unaudited) | | |
| | March 31,
2020 | | September 30,
2019 | June 30,
2020 | | September 30,
2019 |
| ASSETS | | | | | | |
| Current assets | $ | 609,831 |
| | $ | 637,293 |
| $ | 642,722 |
| | $ | 637,293 |
|
| Cash and cash equivalents | 108,495 |
| | 109,881 |
| 142,737 |
| | 109,881 |
|
| Receivables, net | 243,418 |
| | 257,585 |
| 242,898 |
| | 257,585 |
|
| Inventories, net | 151,427 |
| | 137,164 |
| 159,446 |
| | 137,164 |
|
| Contract assets | 81,249 |
| | 73,467 |
| 77,590 |
| | 73,467 |
|
| Prepaid and other current assets | 25,242 |
| | 21,940 |
| 20,051 |
| | 21,940 |
|
| Assets held for sale | — |
| | 37,256 |
| — |
| | 37,256 |
|
| Property, plant, and equipment, net | 344,918 |
| | 333,584 |
| 356,424 |
| | 333,584 |
|
| Goodwill | 388,881 |
| | 392,890 |
| 393,427 |
| | 392,890 |
|
| Intangible assets, net | 323,740 |
| | 314,767 |
| 316,299 |
| | 314,767 |
|
| Deferred income taxes, net of valuation allowance | 3,845 |
| | 2,790 |
| 4,170 |
| | 2,790 |
|
| Operating lease right-of-use assets, net | 42,885 |
| | — |
| 39,427 |
| | — |
|
| Other non‑current assets | 25,793 |
| | 25,715 |
| 25,427 |
| | 25,715 |
|
| Non-current assets held for sale | — |
| | 30,809 |
| — |
| | 30,809 |
|
| Total assets | $ | 1,739,893 |
| | $ | 1,737,848 |
| $ | 1,777,896 |
| | $ | 1,737,848 |
|
| LIABILITIES AND EQUITY | | | | | | |
| Current liabilities | $ | 322,490 |
| | $ | 322,221 |
| $ | 335,292 |
| | $ | 322,221 |
|
| Accounts payable | 151,107 |
| | 144,247 |
| 154,322 |
| | 144,247 |
|
| Current portion of debt | 14,241 |
| | 13,418 |
| 14,611 |
| | 13,418 |
|
| Contract liabilities | 33,691 |
| | 39,051 |
| 30,841 |
| | 39,051 |
|
| Product warranties | 5,107 |
| | 4,922 |
| 5,246 |
| | 4,922 |
|
| Accrued expenses and other liabilities | 112,091 |
| | 101,839 |
| 124,016 |
| | 101,839 |
|
| Income tax payable | 6,253 |
| | 4,536 |
| 6,256 |
| | 4,536 |
|
| Liabilities held for sale | — |
| | 14,208 |
| — |
| | 14,208 |
|
| Non‑current liabilities | 994,900 |
| | 1,049,805 |
| 995,274 |
| | 1,049,805 |
|
| Long‑term debt, net of deferred financing fees | 854,981 |
| | 951,599 |
| |
| Long-term debt | | 855,359 |
| | 951,599 |
|
| Product warranties | 1,161 |
| | 2,332 |
| 1,600 |
| | 2,332 |
|
| Obligation under operating leases | 34,033 |
| | — |
| 31,008 |
| | — |
|
| Other non‑current liabilities | 91,311 |
| | 78,661 |
| 93,909 |
| | 78,661 |
|
| Deferred income taxes | 13,414 |
| | 13,548 |
| 13,398 |
| | 13,548 |
|
| Non-current liabilities held for sale | — |
| | 3,665 |
| — |
| | 3,665 |
|
| Total liabilities | 1,317,390 |
| | 1,372,026 |
| 1,330,566 |
| | 1,372,026 |
|
| Commitments and Contingent Liabilities (Note 20) |
|
| |
|
|
|
| |
|
|
| Shareholders’ equity | | | | | | |
| Common stock, par value $0.01: authorized 1,000,000 shares; issued 119,070 shares, outstanding 116,876 at March 31, 2020; issued 116,008, outstanding 114,344 shares at September 30, 2019 | 1,185 |
| | 1,154 |
| |
| Treasury stock: 2,194 shares at March 31, 2020 and 1,664 shares at September 30, 2019 | (2,837 | ) | | (2,837 | ) | |
| Additional paid‑in capital | 573,745 |
| | 552,422 |
| |
| Common stock, par value $0.01: authorized 1,000,000 shares; issued 119,392 shares, outstanding 117,197 at June 30, 2020; issued 116,008, outstanding 114,344 shares at September 30, 2019 | | 1,187 |
| | 1,154 |
|
| Treasury stock: 2,195 shares at June 30, 2020 and 1,664 shares at September 30, 2019 | | (2,837 | ) | | (2,837 | ) |
| Additional paid-in capital | | 578,842 |
| | 552,422 |
|
| Retained deficit | (115,356 | ) | | (174,976 | ) | (93,972 | ) | | (174,976 | ) |
| Accumulated other comprehensive loss, net of tax | (36,306 | ) | | (13,004 | ) | (38,019 | ) | | (13,004 | ) |
| Total Evoqua Water Technologies Corp. equity | 420,431 |
| | 362,759 |
| 445,201 |
| | 362,759 |
|
| Non‑controlling interest | 2,072 |
| | 3,063 |
| |
| Non-controlling interest | | 2,129 |
| | 3,063 |
|
| Total shareholders’ equity | 422,503 |
| | 365,822 |
| 447,330 |
| | 365,822 |
|
| Total liabilities and shareholders’ equity | $ | 1,739,893 |
| | $ | 1,737,848 |
| $ | 1,777,896 |
| | $ | 1,737,848 |
|
See accompanying notes to these Unaudited Consolidated Financial Statements
Evoqua Water Technologies Corp.
Unaudited Consolidated Statements of Operations
(In thousands except per share data)
| | | | Three Months Ended
March 31, | | Six Months Ended
March 31, | Three Months Ended
June 30, | | Nine Months Ended
June 30, |
| | 2020 | | 2019 | | 2020 | | 2019 | 2020 | | 2019 | | 2020 | | 2019 |
| Revenue from product sales | $ | 205,969 |
| | $ | 206,868 |
| | $ | 402,529 |
| | $ | 386,956 |
| $ | 207,575 |
| | $ | 210,363 |
| | $ | 610,104 |
| | $ | 597,319 |
|
| Revenue from services | 145,694 |
| | 141,760 |
| | 295,239 |
| | 284,674 |
| 140,252 |
| | 149,980 |
| | 435,491 |
| | 434,654 |
|
| Revenue from product sales and services | 351,663 |
| | 348,628 |
| | 697,768 |
| | 671,630 |
| 347,827 |
| | 360,343 |
| | 1,045,595 |
| | 1,031,973 |
|
| Cost of product sales | (144,156 | ) | | (153,857 | ) | | (284,612 | ) | | (290,452 | ) | (143,457 | ) | | (148,417 | ) | | (428,069 | ) | | (438,869 | ) |
| Cost of services | (96,301 | ) | | (99,160 | ) | | (196,235 | ) | | (196,837 | ) | (94,136 | ) | | (100,632 | ) | | (290,371 | ) | | (297,469 | ) |
| Cost of product sales and services | (240,457 | ) | | (253,017 | ) | | (480,847 | ) | | (487,289 | ) | (237,593 | ) | | (249,049 | ) | | (718,440 | ) | | (736,338 | ) |
| Gross profit | 111,206 |
| | 95,611 |
| | 216,921 |
| | 184,341 |
| 110,234 |
| | 111,294 |
| | 327,155 |
| | 295,635 |
|
| General and administrative expense | (62,130 | ) | | (48,215 | ) | | (107,900 | ) | | (103,046 | ) | (44,867 | ) | | (49,525 | ) | | (152,767 | ) | | (152,571 | ) |
| Sales and marketing expense | (33,976 | ) | | (35,435 | ) | | (71,990 | ) | | (71,587 | ) | (29,855 | ) | | (31,959 | ) | | (101,845 | ) | | (103,546 | ) |
| Research and development expense | (3,189 | ) | | (3,957 | ) | | (6,873 | ) | | (8,103 | ) | (2,782 | ) | | (3,281 | ) | | (9,655 | ) | | (11,384 | ) |
| Total operating expenses | (99,295 | ) | | (87,607 | ) | | (186,763 | ) | | (182,736 | ) | (77,504 | ) | | (84,765 | ) | | (264,267 | ) | | (267,501 | ) |
| Other operating income | 9,518 |
| | 3,651 |
| | 61,238 |
| | 3,879 |
| 621 |
| | 746 |
| | 61,859 |
| | 4,625 |
|
| Other operating expense | (274 | ) | | (187 | ) | | (549 | ) | | (375 | ) | (285 | ) | | (184 | ) | | (834 | ) | | (559 | ) |
| Income before interest expense and income taxes | 21,155 |
| | 11,468 |
| | 90,847 |
| | 5,109 |
| 33,066 |
| | 27,091 |
| | 123,913 |
| | 32,200 |
|
| Interest expense | (13,252 | ) | | (14,474 | ) | | (26,835 | ) | | (28,917 | ) | (10,485 | ) | | (14,842 | ) | | (37,320 | ) | | (43,759 | ) |
| Income (loss) before income taxes | 7,903 |
| | (3,006 | ) | | 64,012 |
| | (23,808 | ) | 22,581 |
| | 12,249 |
| | 86,593 |
| | (11,559 | ) |
| Income tax benefit (expense) | 7 |
| | 4,579 |
| | (2,596 | ) | | 9,093 |
| |
| Income tax (expense) benefit | | (740 | ) | | (7,959 | ) | | (3,336 | ) | | 1,134 |
|
| Net income (loss) | 7,910 |
| | 1,573 |
| | 61,416 |
| | (14,715 | ) | 21,841 |
| | 4,290 |
| | 83,257 |
| | (10,425 | ) |
| Net income attributable to non‑controlling interest | 98 |
| | 189 |
| | 459 |
| | 631 |
| 457 |
| | 155 |
| | 916 |
| | 786 |
|
| Net income (loss) attributable to Evoqua Water Technologies Corp. | $ | 7,812 |
| | $ | 1,384 |
| | $ | 60,957 |
| | $ | (15,346 | ) | $ | 21,384 |
| | $ | 4,135 |
| | $ | 82,341 |
| | $ | (11,211 | ) |
| Basic income (loss) per common share | $ | 0.07 |
| | $ | 0.01 |
| | $ | 0.52 |
| | $ | (0.13 | ) | $ | 0.18 |
| | $ | 0.04 |
| | $ | 0.71 |
| | $ | (0.10 | ) |
| Diluted income (loss) per common share | $ | 0.06 |
| | $ | 0.01 |
| | $ | 0.50 |
| | $ | (0.13 | ) | $ | 0.18 |
| | $ | 0.03 |
| | $ | 0.68 |
| | $ | (0.10 | ) |
See accompanying notes to these Unaudited Consolidated Financial Statements
Evoqua Water Technologies Corp.
Unaudited Consolidated Statements of Comprehensive Income (Loss)
(In thousands)
| | | | Three Months Ended
March 31, | | Six Months Ended
March 31, | Three Months Ended
June 30, | | Nine Months Ended
June 30, |
| | 2020 | | 2019 | | 2020 | | 2019 | 2020 | | 2019 | | 2020 | | 2019 |
| Net income (loss) | $ | 7,910 |
| | $ | 1,573 |
| | $ | 61,416 |
| | $ | (14,715 | ) | $ | 21,841 |
| | $ | 4,290 |
| | $ | 83,257 |
| | $ | (10,425 | ) |
| Other comprehensive (loss) income | | | | | | | | | | | | | | |
| Foreign currency translation adjustments | (14,724 | ) | | 2,817 |
| | (23,562 | ) | | 1,263 |
| 1,366 |
| | (526 | ) | | (22,196 | ) | | 737 |
|
| Unrealized derivative loss on cash flow hedges, net of tax | (162 | ) | | (611 | ) | | (211 | ) | | (54 | ) | (3,314 | ) | | (161 | ) | | (3,525 | ) | | (215 | ) |
| Change in pension liability, net of tax | 235 |
| | 97 |
| | 471 |
| | 193 |
| 235 |
| | 95 |
| | 706 |
| | 288 |
|
| Total other comprehensive (loss) income | (14,651 | ) | | 2,303 |
| | (23,302 | ) | | 1,402 |
| (1,713 | ) | | (592 | ) | | (25,015 | ) | | 810 |
|
| Less: Comprehensive income attributable to non‑controlling interest | (98 | ) | | (189 | ) | | (459 | ) | | (631 | ) | (457 | ) | | (155 | ) | | (916 | ) | | (786 | ) |
| Comprehensive (loss) income attributable to Evoqua Water Technologies Corp. | $ | (6,839 | ) | | $ | 3,687 |
| | $ | 37,655 |
| | $ | (13,944 | ) | |
| Comprehensive income (loss) attributable to Evoqua Water Technologies Corp. | | $ | 19,671 |
| | $ | 3,543 |
| | $ | 57,326 |
| | $ | (10,401 | ) |
See accompanying notes to these Unaudited Consolidated Financial Statements
Evoqua Water Technologies Corp.
Unaudited Consolidated Statements of Changes in Equity
(In thousands)
| | | | Three Months Ended March 31, 2020 | Three Months Ended June 30, 2020 |
| | Common Stock | | Treasury Stock | | Additional
Paid‑in
Capital | | Retained
Deficit | | Accumulated
Other Comprehensive Loss | | Non‑controlling
Interest | | Total | Common Stock | | Treasury Stock | | Additional
Paid‑in
Capital | | Retained
Deficit | | Accumulated
Other Comprehensive Loss | | Non‑controlling
Interest | | Total |
| | Shares | | Cost | | Shares | | Cost | | Shares | | Cost | | Shares | | Cost | |
| Balance at December 31, 2019 | 117,653 |
| | $ | 1,170 |
| | 2,083 |
| | $ | (2,837 | ) | | $ | 560,132 |
| | $ | (123,854 | ) | | $ | (21,655 | ) | | $ | 2,174 |
| | $ | 415,130 |
| |
| Balance at March 31, 2020 | | 119,070 |
| | $ | 1,185 |
| | 2,194 |
| | $ | (2,837 | ) | | $ | 573,745 |
| | $ | (115,356 | ) | | $ | (36,306 | ) | | $ | 2,072 |
| | $ | 422,503 |
|
| Cumulative effect of adoption of new accounting standards | — |
| | — |
| | — |
| | — |
| | — |
| | 686 |
| | — |
| | — |
| | 686 |
| — |
| | — |
| | — |
| | — |
| | — |
| | — |
| | — |
| | — |
| | — |
|
| Equity based compensation expense | — |
| | — |
| | — |
| | — |
| | 2,304 |
| | — |
| | — |
| | — |
| | 2,304 |
| — |
| | — |
| | — |
| | — |
| | 2,520 |
| | — |
| | — |
| | — |
| | 2,520 |
|
| Issuance of common stock | 30 |
| | 15 |
| | — |
| | — |
| | 11,309 |
| | — |
| | — |
| | — |
| | 11,324 |
| — |
| | 2 |
| | — |
| | — |
| | 2,577 |
| | — |
| | — |
| | — |
| | 2,579 |
|
| Shares withheld related to net share settlement (including tax withholdings) | 1,387 |
| | — |
| | 111 |
| | — |
| | — |
| | — |
| | — |
| | — |
| | — |
| 322 |
| | — |
| | 1 |
| | — |
| | — |
| | — |
| | — |
| | — |
| | — |
|
| Dividends paid to non-controlling interest | — |
| | — |
| | — |
| | — |
| | — |
| | — |
| | — |
| | (200 | ) | | (200 | ) | — |
| | — |
| | — |
| | — |
| | — |
| | — |
| | — |
| | (400 | ) | | (400 | ) |
| Net income | — |
| | — |
| | — |
| | — |
| | — |
| | 7,812 |
| | — |
| | 98 |
| | 7,910 |
| — |
| | — |
| | — |
| | — |
| | — |
| | 21,384 |
| | — |
| | 457 |
| | 21,841 |
|
| Other comprehensive loss | — |
| | — |
| | — |
| | — |
| | — |
| | — |
| | (14,651 | ) | | — |
| | (14,651 | ) | — |
| | — |
| | — |
| | — |
| | — |
| | — |
| | (1,713 | ) | | — |
| | (1,713 | ) |
| Balance at March 31, 2020 | 119,070 |
| | $ | 1,185 |
| | 2,194 |
| | $ | (2,837 | ) | | $ | 573,745 |
| | $ | (115,356 | ) | | $ | (36,306 | ) | | $ | 2,072 |
| | $ | 422,503 |
| |
| Balance at June 30, 2020 | | 119,392 |
| | $ | 1,187 |
| | 2,195 |
| | $ | (2,837 | ) | | $ | 578,842 |
| | $ | (93,972 | ) | | $ | (38,019 | ) | | $ | 2,129 |
| | $ | 447,330 |
|
| | | | Three Months Ended March 31, 2019 | Three Months Ended June 30, 2019 |
| | Common Stock | | Treasury Stock | | Additional
Paid‑in
Capital | | Retained
Deficit | | Accumulated
Other Comprehensive Loss | | Non‑controlling
Interest | | Total | Common Stock | | Treasury Stock | | Additional
Paid‑in
Capital | | Retained
Deficit | | Accumulated
Other Comprehensive Loss | | Non‑controlling
Interest | | Total |
| | Shares | | Cost | | Shares | | Cost | | Shares | | Cost | | Shares | | Cost | |
| Balance at December 31, 2018 | 115,048 |
| | $ | 1,145 |
| | 1,105 |
| | $ | (2,837 | ) | | $ | 538,013 |
| | $ | (182,002 | ) | | $ | (9,918 | ) | | $ | 3,003 |
| | $ | 347,404 |
| |
| Balance at March 31, 2019 | | 115,691 |
| | $ | 1,151 |
| | 1,518 |
| | $ | (2,837 | ) | | $ | 542,104 |
| | $ | (180,618 | ) | | $ | (7,615 | ) | | $ | 3,192 |
| | $ | 355,377 |
|
| Equity based compensation expense | — |
| | — |
| | — |
| | — |
| | 4,745 |
| | — |
| | — |
| | — |
| | 4,745 |
| — |
| | — |
| | — |
| | — |
| | 4,978 |
| | — |
| | — |
| | — |
| | 4,978 |
|
| Issuance of common stock | 51 |
| | — |
| | — |
| | — |
| | 273 |
| | — |
| | — |
| | — |
| | 273 |
| 46 |
| | — |
| | — |
| | — |
| | — |
| | — |
| | — |
| | — |
| | — |
|
| Shares withheld related to net share settlement (including tax withholdings) | 592 |
| | 6 |
| | 413 |
| | — |
| | (927 | ) | | — |
| | — |
| | — |
| | (921 | ) | 231 |
| | 3 |
| | 138 |
| | — |
| | (315 | ) | | — |
| | — |
| | — |
| | (312 | ) |
| Dividends paid to non-controlling interest | | — |
| | — |
| | — |
| | — |
| | — |
| | — |
| | — |
| | (150 | ) | | (150 | ) |
| Net income | — |
| | — |
| | — |
| | — |
| | — |
| | 1,384 |
| | — |
| | 189 |
| | 1,573 |
| — |
| | — |
| | — |
| | — |
| | — |
| | 4,135 |
| | — |
| | 155 |
| | 4,290 |
|
| Other comprehensive income | — |
| | — |
| | — |
| | — |
| | — |
| | — |
| | 2,303 |
| | — |
| | 2,303 |
| — |
| | — |
| | — |
| | — |
| | — |
| | — |
| | (592 | ) | | — |
| | (592 | ) |
| Balance at March 31, 2019 | 115,691 |
| | $ | 1,151 |
| | 1,518 |
| | $ | (2,837 | ) | | $ | 542,104 |
| | $ | (180,618 | ) | | $ | (7,615 | ) | | $ | 3,192 |
| | $ | 355,377 |
| |
| Balance at June 30, 2019 | | 115,968 |
| | $ | 1,154 |
| | 1,656 |
| | $ | (2,837 | ) | | $ | 546,767 |
| | $ | (176,483 | ) | | $ | (8,207 | ) | | $ | 3,197 |
| | $ | 363,591 |
|
| | | | Six Months Ended March 31, 2020 | Nine Months Ended June 30, 2020 |
| | Common Stock | | Treasury Stock | | Additional
Paid‑in
Capital | | Retained
Deficit | | Accumulated
Other Comprehensive Loss | | Non‑controlling
Interest | | Total | Common Stock | | Treasury Stock | | Additional
Paid‑in
Capital | | Retained
Deficit | | Accumulated
Other Comprehensive Loss | | Non‑controlling
Interest | | Total |
| | Shares | | Cost | | Shares | | Cost | | Shares | | Cost | | Shares | | Cost | |
| Balance at September 30, 2019 | 116,008 |
| | $ | 1,154 |
| | 1,664 |
| | $ | (2,837 | ) | | $ | 552,422 |
| | $ | (174,976 | ) | | $ | (13,004 | ) | | $ | 3,063 |
| | $ | 365,822 |
| 116,008 |
| | $ | 1,154 |
| | 1,664 |
| | $ | (2,837 | ) | | $ | 552,422 |
| | $ | (174,976 | ) | | $ | (13,004 | ) | | $ | 3,063 |
| | $ | 365,822 |
|
| Cumulative effect of adoption of new accounting standards | — |
| | — |
| | — |
| | — |
| | — |
| | (1,337 | ) | | — |
| | — |
| | (1,337 | ) | — |
| | — |
| | — |
| | — |
| | — |
| | (1,337 | ) | | — |
| | — |
| | (1,337 | ) |
| Equity based compensation expense | — |
| | — |
| | — |
| | — |
| | 5,984 |
| | — |
| | — |
| | — |
| | 5,984 |
| — |
| | — |
| | — |
| | — |
| | 8,504 |
| | — |
| | — |
| | — |
| | 8,504 |
|
| Issuance of common stock | 150 |
| | 31 |
| | — |
| | — |
| | 15,339 |
| | — |
| | — |
| | — |
| | 15,370 |
| 150 |
| | 33 |
| | — |
| | — |
| | 17,916 |
| | — |
| | — |
| | — |
| | 17,949 |
|
| Shares withheld related to net share settlement (including tax withholdings) | 2,912 |
| | — |
| | 530 |
| | — |
| | — |
| | — |
| | — |
| | — |
| | — |
| 3,234 |
| | — |
| | 531 |
| | — |
| | — |
| | — |
| | — |
| | — |
| | — |
|
| Dividends paid to non-controlling interest | — |
| | — |
| | — |
| | — |
| | — |
| | — |
| | — |
| | (1,450 | ) | | (1,450 | ) | — |
| | — |
| | — |
| | — |
| | — |
| | — |
| | — |
| | (1,850 | ) | | (1,850 | ) |
| Net income | — |
| | — |
| | — |
| | — |
| | — |
| | 60,957 |
| | — |
| | 459 |
| | 61,416 |
| — |
| | — |
| | — |
| | — |
| | — |
| | 82,341 |
| | — |
| | 916 |
| | 83,257 |
|
| Other comprehensive loss | — |
| | — |
| | — |
| | — |
| | — |
| | — |
| | (23,302 | ) | | — |
| | (23,302 | ) | — |
| | — |
| | — |
| | — |
| | — |
| | — |
| | (25,015 | ) | | — |
| | (25,015 | ) |
| Balance at March 31, 2020 | 119,070 |
| | $ | 1,185 |
| | 2,194 |
| | $ | (2,837 | ) | | $ | 573,745 |
| | $ | (115,356 | ) | | $ | (36,306 | ) | | $ | 2,072 |
| | $ | 422,503 |
| |
| Balance at June 30, 2020 | | 119,392 |
| | $ | 1,187 |
| | 2,195 |
| | $ | (2,837 | ) | | $ | 578,842 |
| | $ | (93,972 | ) | | $ | (38,019 | ) | | $ | 2,129 |
| | $ | 447,330 |
|
| | | | Six Months Ended March 31, 2019 | Nine Months Ended June 30, 2019 |
| | Common Stock | | Treasury Stock | | Additional
Paid‑in
Capital | | Retained
Deficit | | Accumulated
Other Comprehensive Loss | | Non‑controlling
Interest | | Total | Common Stock | | Treasury Stock | | Additional
Paid‑in
Capital | | Retained
Deficit | | Accumulated
Other Comprehensive Loss | | Non‑controlling
Interest | | Total |
| | Shares | | Cost | | Shares | | Cost | | Shares | | Cost | | Shares | | Cost | |
| Balance at September 30, 2018 | 115,016 |
| | $ | 1,145 |
| | 1,087 |
| | $ | (2,837 | ) | | $ | 533,435 |
| | $ | (163,871 | ) | | $ | (9,017 | ) | | $ | 3,161 |
| | $ | 362,016 |
| 115,016 |
| | $ | 1,145 |
| | 1,087 |
| | $ | (2,837 | ) | | $ | 533,435 |
| | $ | (163,871 | ) | | $ | (9,017 | ) | | $ | 3,161 |
| | $ | 362,016 |
|
| Cumulative effect of adoption of new accounting standards | — |
| | — |
| | — |
| | — |
| | — |
| | (1,401 | ) | | — |
| | — |
| | (1,401 | ) | — |
| | — |
| | — |
| | — |
| | — |
| | (1,401 | ) | | — |
| | — |
| | (1,401 | ) |
| Equity based compensation expense | — |
| | — |
| | — |
| | — |
| | 9,270 |
| | — |
| | — |
| | — |
| | 9,270 |
| — |
| | — |
| | — |
| | — |
| | 14,248 |
| | — |
| | — |
| | — |
| | 14,248 |
|
| Issuance of common stock | 62 |
| | — |
| | — |
| | — |
| | 341 |
| | — |
| | — |
| | — |
| | 341 |
| 108 |
| | — |
| | — |
| | — |
| | 341 |
| | — |
| | — |
| | — |
| | 341 |
|
| Shares withheld related to net share settlement (including tax withholdings) | 613 |
| | 6 |
| | 431 |
| | — |
| | (942 | ) | | — |
| | — |
| | — |
| | (936 | ) | 844 |
| | 9 |
| | 569 |
| | — |
| | (1,257 | ) | | — |
| | — |
| | — |
| | (1,248 | ) |
| Dividends paid to non-controlling interest | — |
| | — |
| | — |
| | — |
| | — |
| | — |
| | — |
| | (600 | ) | | (600 | ) | — |
| | — |
| | — |
| | — |
| | — |
| | — |
| | — |
| | (750 | ) | | (750 | ) |
| Net (loss) income | — |
| | — |
| | — |
| | — |
| | — |
| | (15,346 | ) | | — |
| | 631 |
| | (14,715 | ) | — |
| | — |
| | — |
| | — |
| | — |
| | (11,211 | ) | | — |
| | 786 |
| | (10,425 | ) |
| Other comprehensive income | — |
| | — |
| | — |
| | — |
| | — |
| | — |
| | 1,402 |
| | — |
| | 1,402 |
| — |
| | — |
| | — |
| | — |
| | — |
| | — |
| | 810 |
| | — |
| | 810 |
|
| Balance at March 31, 2019 | 115,691 |
| | $ | 1,151 |
| | 1,518 |
| | $ | (2,837 | ) | | $ | 542,104 |
| | $ | (180,618 | ) | | $ | (7,615 | ) | | $ | 3,192 |
| | $ | 355,377 |
| |
| Balance at June 30, 2019 | | 115,968 |
| | $ | 1,154 |
| | 1,656 |
| | $ | (2,837 | ) | | $ | 546,767 |
| | $ | (176,483 | ) | | $ | (8,207 | ) | | $ | 3,197 |
| | $ | 363,591 |
|
See accompanying notes to these Unaudited Consolidated Financial Statements
Evoqua Water Technologies Corp.
Unaudited Consolidated Statements of Changes in Cash Flows
(In thousands)
| | | | Six Months Ended
March 31, | Nine Months Ended
June 30, |
| | 2020 | | 2019 | 2020 | | 2019 |
| Operating activities | | | | | | |
| Net income (loss) | $ | 61,416 |
| | $ | (14,715 | ) | $ | 83,257 |
| | $ | (10,425 | ) |
| Reconciliation of net income (loss) to cash flows provided by operating activities: | | | | | | |
| Depreciation and amortization | 52,514 |
| | 47,252 |
| 80,056 |
| | 71,397 |
|
| Amortization of debt related costs (includes $1,795 and $0 write off of deferred financing fees) | 3,103 |
| | 1,231 |
| 3,504 |
| | 1,916 |
|
| Deferred income taxes | (1,209 | ) | | (11,411 | ) | (1,422 | ) | | (4,115 | ) |
| Share-based compensation | 5,984 |
| | 9,270 |
| 8,504 |
| | 14,248 |
|
| Loss (gain) on sale of property, plant and equipment | 170 |
| | (122 | ) | 767 |
| | (588 | ) |
| Gain on sale of business | (68,051 | ) | | — |
| (68,051 | ) | | — |
|
| Foreign currency exchange losses on intercompany loans and other non-cash items | 1,514 |
| | 5,228 |
| (2,438 | ) | | 4,002 |
|
| Changes in assets and liabilities | | | | | | |
| Accounts receivable | 7,256 |
| | 20,600 |
| 8,685 |
| | 7,495 |
|
| Inventories | (17,800 | ) | | (14,175 | ) | (25,523 | ) | | (17,664 | ) |
| Contract assets | (5,377 | ) | | (8,159 | ) | (1,486 | ) | | (6,912 | ) |
| Prepaids and other current assets | (3,715 | ) | | 7,487 |
| 1,359 |
| | 7,260 |
|
| Accounts payable | 6,004 |
| | (8,875 | ) | 8,938 |
| | (2,819 | ) |
| Accrued expenses and other liabilities | (16,794 | ) | | (11,178 | ) | (19,919 | ) | | (19,578 | ) |
| Contract liabilities | (4,920 | ) | | 5,774 |
| (7,893 | ) | | 13,051 |
|
| Income taxes | 2,140 |
| | (1,742 | ) | 1,620 |
| | (6,786 | ) |
| Other non‑current assets and liabilities | (252 | ) | | 879 |
| 12,528 |
| | 3,875 |
|
| Net cash provided by operating activities | 21,983 |
| | 27,344 |
| 82,486 |
| | 54,357 |
|
| Investing activities | | | | | | |
| Purchase of property, plant and equipment | (38,759 | ) | | (40,682 | ) | (65,924 | ) | | (63,948 | ) |
| Purchase of intangibles | (622 | ) | | (2,898 | ) | (708 | ) | | (4,775 | ) |
| Proceeds from sale of property, plant and equipment | 271 |
| | 2,875 |
| 379 |
| | 2,860 |
|
| Proceeds from sale of business, net of cash of $12,117 | 118,894 |
| | — |
| 118,894 |
| | — |
|
| Acquisitions, net of $0 cash received | (11,164 | ) | | 2,048 |
| |
| Acquisitions, net of cash received of $0 and $2,073 | | (10,884 | ) | | (2,811 | ) |
| Net cash provided by (used in) investing activities | 68,620 |
| | (38,657 | ) | 41,757 |
| | (68,674 | ) |
| Financing activities | | | | | | |
| Issuance of debt, net of deferred issuance costs | 8,212 |
| | 10,663 |
| 12,859 |
| | 15,965 |
|
| Borrowings under credit facility | 2,597 |
| | 115,000 |
| 2,597 |
| | 230,000 |
|
| Repayment of debt | (109,333 | ) | | (120,856 | ) | (113,572 | ) | | (238,908 | ) |
| Repayment of capital lease obligation | (6,694 | ) | | (4,925 | ) | |
| Repayment of finance lease obligation | | (9,988 | ) | | (9,273 | ) |
| Payment of earn-out related to previous acquisitions | (175 | ) | | (461 | ) | (175 | ) | | (461 | ) |
| Proceeds from issuance of common stock | 15,370 |
| | 341 |
| 17,949 |
| | 341 |
|
| Taxes paid related to net share settlements of share-based compensation awards | — |
| | (936 | ) | — |
| | (1,248 | ) |
| Cash paid for interest rate cap | — |
| | (2,235 | ) | — |
| | (2,235 | ) |
| Distribution to non‑controlling interest | (1,450 | ) | | (600 | ) | (1,850 | ) | | (750 | ) |
| Net cash used in financing activities | (91,473 | ) | | (4,009 | ) | (92,180 | ) | | (6,569 | ) |
| Effect of exchange rate changes on cash | (516 | ) | | (293 | ) | 793 |
| | (357 | ) |
| Change in cash and cash equivalents | (1,386 | ) | | (15,615 | ) | 32,856 |
| | (21,243 | ) |
| Cash and cash equivalents | | | | | | |
| Beginning of period | 109,881 |
| | 82,365 |
| 109,881 |
| | 82,365 |
|
| End of period | $ | 108,495 |
| | $ | 66,750 |
| $ | 142,737 |
| | $ | 61,122 |
|
See accompanying notes to these Unaudited Consolidated Financial Statements
Evoqua Water Technologies Corp.
Unaudited Supplemental Disclosure of Cash Flow Information
(In thousands)
| | | | Six Months Ended
March 31, | Nine Months Ended
June 30, |
| | 2020 | | 2019 | 2020 | | 2019 |
| Supplemental disclosure of cash flow information | | | | | | |
| Cash paid for taxes | $ | 2,133 |
| | $ | 4,585 |
| $ | 3,865 |
| | $ | 8,731 |
|
| Cash paid for interest | $ | 22,953 |
| | $ | 26,180 |
| $ | 31,200 |
| | $ | 39,409 |
|
| Non‑cash investing and financing activities | | | | | | |
| Finance lease transactions | $ | 4,308 |
| | $ | 8,296 |
| $ | 8,401 |
| | $ | 11,788 |
|
| Operating lease transactions | 10,076 |
| | — |
| 12,085 |
| | — |
|
| Option and Purchase Right | 7,167 |
| | — |
| 7,167 |
| | — |
|
See accompanying notes to these Unaudited Consolidated Financial Statements
Evoqua Water Technologies Corp.
Notes to Unaudited Consolidated Financial Statements
(In thousands)
1. Description of the Company and Basis of Presentation
Background
Evoqua Water Technologies Corp. (referred to herein as the “Company” or “EWT”) was incorporated on October 7, 2013. On January 15, 2014, Evoqua Water Technologies Corp., acquired through its wholly owned entities, EWT Holdings II Corp. and EWT Holdings III Corp. (a/k/a Evoqua Water Technologies), all of the outstanding shares of Siemens Water Technologies, a group of legal entity businesses formerly owned by Siemens AG (“Siemens”). The stock purchase closed on January 15, 2014 and was effective January 16, 2014 (the “Acquisition”). The stock purchase price, net of cash received, was approximately $730,577. On November 6, 2017, the Company completed its initial public offering (“IPO”), pursuant to which an aggregate of 27,777 shares of common stock were sold, of which 8,333 were sold by the Company and 19,444 were sold by the selling shareholders, with a par value of $0.01 per share. After underwriting discounts and commissions and other expenses, the Company received net proceeds from the IPO of approximately $137,605. The Company used a portion of these proceeds to repay $104,936 of indebtedness (including accrued and unpaid interest) under EWT III’s senior secured first lien term loan facility and the remainder for general corporate purposes. The Company did not receive any proceeds from the sale of shares by the selling shareholders. On November 7, 2017, the selling shareholders sold an additional 4,167 shares of common stock as a result of the exercise in full by the underwriters of an option to purchase additional shares.
On March 19, 2018, the Company completed a secondary public offering, pursuant to which 17,500 shares of common stock were sold by certain selling shareholders. On March 21, 2018, the selling shareholders sold an additional 2,625 shares of common stock as a result of the exercise in full by the underwriters of an option to purchase additional shares. On March 10, 2020, the Company completed an additional secondary public offering, pursuant to which 13,000 shares of common stock were sold by certain selling shareholders. The Company did not receive any proceeds from the sale of shares by the selling shareholders in either of these secondary public offerings.
The Business
EWT provides a wide range of product brands and advanced water and wastewater treatment systems and technologies, as well as mobile and emergency water supply solutions and service contract options through its branch network. Headquartered in Pittsburgh, Pennsylvania, EWT is a multi‑national corporation with operations in the United States (“U.S.”), Canada, the United Kingdom (“UK”), the Netherlands, Germany, Australia, the People’s Republic of China, Singapore, the Republic of Korea and India.
The Company is organizationally structured into two2 reportable operating segments for the purpose of making operational decisions and assessing financial performance: (i) Integrated Solutions and Services and (ii) Applied Product Technologies.
Basis of Presentation
The accompanying Unaudited Consolidated Financial Statements have been prepared in accordance with accounting principles generally accepted in the U.S. (“GAAP”). All intercompany transactions have been eliminated. Unless otherwise specified, all dollar amounts in these notes are referred to in thousands.
The interim Unaudited Consolidated Financial Statements have been prepared pursuant to the rules and regulations of the Securities and Exchange Commission (“SEC”). Certain information and note disclosures normally included in financial statements prepared in accordance with GAAP have been condensed or omitted pursuant to such SEC rules. We believe that the disclosures made are adequate to make the information presented not misleading. We consistently applied the accounting policies described in our Annual Report on Form 10-K for the fiscal year ended September 30, 2019, as filed with the SEC on November 25, 2019 and as amended on December 4, 2019 (“2019 Annual Report”), in preparing these Unaudited Consolidated Financial Statements, with the exception of accounting standard updates described in Note 2, “Summary of Significant Accounting Policies.” These Unaudited Consolidated Financial Statements should be read in
conjunction with the audited financial statements and the notes included in our 2019 Annual Report. Certain prior period amounts have been reclassified to conform to the current period presentation.
2. Summary of Significant Accounting Policies
Fiscal Year
The Company’s fiscal year ends on September 30.
Use of Estimates
The Unaudited Consolidated Financial Statements have been prepared in conformity with GAAP and require management to make estimates and assumptions. These assumptions affect the reported amounts of assets and liabilities and disclosure of contingent assets and liabilities at the date of the Unaudited Consolidated Financial Statements and the reported amounts of revenue and expenses during the reporting period. Estimates are revised as additional information becomes available. Actual results could differ from these estimates.
Cash and Cash Equivalents
Cash and cash equivalents are liquid investments with an original maturity of three or fewer months when purchased.
Accounts Receivable
Receivables are primarily comprised of uncollected amounts owed to us from transactions with customers and are presented net of allowances for doubtful accounts. Allowances are estimated based on historical write‑offs and the economic status of customers. The Company considers a receivable delinquent if it is unpaid after the term of the related invoice has expired. Write‑offs are recorded at the time all collection efforts have been exhausted.
Inventories
Inventories are stated at the lower of cost or market, where cost is generally determined on the basis of an average or first‑in, first‑out (“FIFO”) method. Production costs comprise direct material and labor and applicable manufacturing overheads, including depreciation charges. The Company regularly reviews inventory quantities on hand and writes off excess or obsolete inventory based on estimated forecasts of product demand and production requirements. Manufacturing operations recognize cost of product sales using standard costing rates with overhead absorption which generally approximates actual cost.
Property, Plant, and Equipment
Property, plant, and equipment is valued at cost less accumulated depreciation. Depreciation expense is recognized using the straight‑line method. Useful lives are reviewed annually and, if expectations differ from previous estimates, adjusted accordingly. Estimated useful lives for major classes of depreciable assets are as follows:
|
| |
| Asset Class | Estimated Useful Life |
| Machinery and equipment | 3 to 20 years |
| Buildings and improvements | 10 to 40 years |
Leasehold improvements are depreciated over the shorter of their estimated useful life or the term of the lease. Costs related to maintenance and repairs that do not extend the assets’ useful life are expensed as incurred.
Acquisitions
Acquisitions are recorded using the purchase method of accounting. The purchase price of acquisitions is allocated to the tangible and intangible assets acquired and liabilities assumed based on their estimated fair value at the acquisition date. The excess of the acquisition price over those estimated fair values is recorded as goodwill. Changes to the acquisition date preliminary fair values prior to the expiration of the measurement period, a period not to exceed 12 months from date of acquisition, are recorded as an adjustment to the associated goodwill. Contingent consideration resulting from acquisitions is recorded at its estimated fair value on the acquisition date. These obligations are revalued during each subsequent reporting period and changes in the fair value of the contingent consideration obligations can result from adjustments in the probability of achieving future development steps, sales targets and profitability and are recorded in General and administrative expenses in the Unaudited Consolidated Statements of Operations. Acquisition-related expenses and restructuring costs, if any, are recognized separately from the business combination and are expensed as incurred.
Goodwill and Other Intangible Assets
Goodwill represents purchase consideration paid in a business combination that exceeds the value assigned to the net assets of acquired businesses. Other intangible assets consist of customer‑related intangibles, proprietary technology, software, trademarks and other intangible assets. The Company amortizes intangible assets with definite useful lives on a straight‑line basis over their respective estimated economic lives which range from 1 to 26 years.
The Company reviews goodwill to determine potential impairment annually during the fourth quarter of the fiscal year, or more frequently if events and circumstances indicate that the asset might be impaired. Impairment testing for goodwill is performed at a reporting unit level. The quantitative impairment testing utilizes both a market (guideline public company) and income (discounted cash flows) method for determining fair value. In estimating the fair value of the reporting unit, the Company utilized a discounted cash flow (“DCF”) valuation technique, which incorporates judgments and estimates of future cash flows, future revenue and gross profit growth rates, terminal value amount, capital expenditures and applicable weighted‑average cost of capital used to discount these estimated cash flows. The estimates and projections used in the estimate of fair value are consistent with ourthe current budget and long‑range plans, including anticipated change in market conditions, industry trend, growth rates and planned capital expenditures, among other considerations.
Impairment of Long‑Lived Assets
Long‑lived assets, such as property, plant, and equipment, and purchased intangibles subject to amortization, are reviewed for impairment whenever events or changes in circumstances indicate that the carrying amount of an asset or asset group may not be recoverable. Recoverability of the asset or asset group is measured by comparison of its carrying amount to undiscounted future net cash flows the asset or asset group is expected to generate. If the carrying amount of an asset or asset group is not recoverable, the Company recognizes an impairment loss based on the excess of the carrying amount of the asset or asset group over its respective fair value which is generally determined as the present value of estimated future cash flows or as the appraised value.
Assets Held for Sale
Assets and liabilities (the “disposal group”) are classified as held for sale when all of the following criteria are met: (i) the Company commits to a plan to sell the disposal group; (ii) it is unlikely the disposal plan will be significantly modified or discontinued; (iii) the disposal group is available for immediate sale in its present condition; (iv) actions required to complete the sale of the disposal group have been initiated; (v) the sale of the asset is probable and the completed sale is expected to occur within one year; and (vi) the disposal group is actively being marketed for sale at a price that is reasonable given its current market value. Upon classification as held for sale, such assets are no longer depreciated or depleted, and a measurement for impairment is performed to determine if there is any excess of carrying value over fair value less costs to sell. Subsequent changes to estimated fair value less the cost to sell will impact the measurement of assets held for sale if the fair value is determined to be less than the carrying value of the assets.
Debt Issuance Costs and Debt Discounts
Debt issuance costs are capitalized and amortized over the contractual term of the underlying debt using the straight line method which approximates the effective interest method. Debt discounts and lender arrangement fees deducted from the proceeds have been included as a component of the carrying value of debt and are being amortized to interest expense using the effective interest method.
Beginning inIn the first quarter of 2019, the Company entered into an interest rate cap to mitigate risks associated with the Company’s variable rate debt. See Note 11, “Derivative Financial Instruments” for further details. The Company paid $2,235 as a premium for the interest rate cap, which iswas being amortized to interest expense over its three-year term.term of three years. The Company terminated the interest rate cap during the third quarter of 2020, and as a result wrote off the remaining unamortized premium of $1,118 to interest expense. No additional fees were incurred. The Company recorded $186$124 and $186$187 of premium amortization to interest expense during the three months ended March 31,June 30, 2020 and 2019, respectively and $372$496 and $248$435 during the sixnine months ended March 31,June 30, 2020 and 2019, respectively. See Note 11, “Derivative Financial Instruments” for further details.
In January 2020, the Company utilized $100,000 of the proceeds from the sale of the Memcor product line to repay a portion of the Company’s First Lien Term Loans. As a result of the prepayment, the Company wrote off $1,795 of deferred financing fees during the three months ended March 31, 2020.
In February 2020, the Company entered into Amendment No. 7 to the Credit Agreement, and as a result incurred $760 of fees which were recorded as deferred financing fees on the Consolidated Balance Sheets.
Amortization of debt issuance costs and discounts included in interest expense were $421$277 and $489$498 for the three months ended March 31,June 30, 2020 and 2019, respectively and $936$1,213 and $983$1,481 for the sixnine months ended March 31,June 30, 2020 and 2019, respectively.
Revenue Recognition
The Company adopted Accounting Standards Update (“ASU”) No. 2014-09, Revenue from Contracts with Customers (Topic 606) on October 1, 2018, and recognizes sales of products and services based on the five-step analysis of transactions as provided in Topic 606 which requires an entity to recognize revenue to depict the transfer of promised goods or services to customers in an amount that reflects the consideration to which the entity expects to be entitled in exchange for such goods or services.
For sales of aftermarket parts or products with a low level of customization and engineering time, the Company recognizes revenues at the time risks and rewards of ownership pass, which is generally when products are shipped or delivered to the customer as the Company has no obligation for installation. Sales of short‑term service arrangements are recognized as the services are performed, and sales of long‑term service arrangements are typically recognized on a straight‑line basis over the life of the agreement.
For certain arrangements where there is significant customization to the product, the Company recognizes revenue either over time or at a point in time. These products include large capital water treatment projects, systems and solutions for municipal and industrial applications. The nature of the contracts is generally fixed price with milestone billings. The Company recognizes revenue over time if the product has no alternative use and the Company has an enforceable right to payment for the performance completed to date, including a normal profit margin, in the event of termination for convenience. If these two criteria are not met, revenues from these contracts will not be recognized until construction is complete. Contract revenues and cost estimates are reviewed and revised quarterly at a minimum and the cumulative effect of such adjustments are recognized in current operations. The amount of such adjustments havehas not been material. See Note 4, “Revenue” for further details.
Product Warranties
Accruals for estimated expenses related to warranties are made at the time products are sold and are recorded as a component of Cost of product sales in the Unaudited Consolidated Statements of Operations. The estimated warranty obligation is based on product warranty terms offered to customers, ongoing product failure rates, material usage and service delivery costs expected to be incurred in correcting a product failure, as well as specific obligations for known failures and other currently available evidence. The Company assesses the adequacy of the recorded warranty liabilities on a regular basis and adjusts amounts as necessary.
Leases
The Company accounts for leases in accordance with ASC Topic No. 842, Leases, adopted as of October 1, 2019 (Topic 842). Please see the “Accounting Pronouncements Recently Adopted” section below for information regarding this adoption. See Note 19, “Leases” for further details.
Lessee Accounting
The Company leases office space, buildings, vehicles, forklifts, computers, copiers and other assets under non-cancelablenon-cancellable operating and finance leases. The Company determines whether an arrangement is or contains a lease at the inception of the arrangement based on the terms and conditions in the contract. A contract contains a lease if there is an identified asset and the Company has the right to control the asset. If the arrangement contains a lease, the Company recognizes a right-of-use (“ROU”) asset and an operating lease liability as of the lease commencement date. Operating lease assets and finance lease assets are included in Operating lease right-of-use assets, net and Property, plant, and equipment, net, respectively, on the Consolidated Balance Sheets. The corresponding operating lease liabilities are included in Accrued expenses and other liabilities and Obligation under operating leases on the Consolidated Balance Sheets. The corresponding finance lease liabilities are included in Accrued expenses and other liabilities and Other non‑current liabilities on the Consolidated Balance Sheets.
Lessor Accounting
The Company generates revenue through the lease of its water treatment equipment and systems to customers. In certain instances, the Company enters into a contract with a customer but must construct the underlying asset prior to its lease. At the time of contract inception, the Company determines if an arrangement is or contains a lease. These contracts generally contain both lease and non-lease components, including installation, maintenance and monitoring services of the Company ownedCompany-owned equipment, in addition to sale of certain constructed assets. In situations where arrangements contain multiple elements, contract consideration is allocated based on relative standalone selling price. Lease components associated to underlying assets that have an alternative use are classified as operating leases with revenue recognized over time throughout the lease term, whereas lease components associated to underlying assets that have no alternative use and the Company has an enforceable right to payment for the performance completed to date, including a normal profit margin, in the event of termination for convenience are classified as sales-type leases, with point in time revenue recognition at the on-set of the lease. In order for a component to be separate, the Customer would be able to benefit from the right of use of the component separately or with other resources readily available to the Customer and the right of the use is not highly dependent or highly interrelated with the other rights to use the other underlying assets or components.
Shipping and Handling Cost
Shipping and handling costs are included as a component of Cost of product sales.
Derivative Financial Instruments
The Company’s risk-management strategy uses derivative financial instruments to manage interest rate risk and foreign currency exchange rate risk. The Company’s objective in using interest rate derivatives is to add stability to interest expense and manage its exposure to interest rate movements. To accomplish this objective, in November 2018,the third quarter of 2020, the Company entered into an interest rate capswap which has been designated as a cash flow hedge. The Company uses foreign currency derivative contracts in order to manage the effect of exchange rate fluctuations on forecasted sales and purchases that are denominated in foreign currencies. To mitigate the impact of foreign exchange rate risk, the Company entered into a series of forward contracts designated as cash flow hedges. The Company does not enter into derivatives for trading or speculative purposes. The Company accounts for derivatives and hedging activities in accordance with ASC Topic No. 815, Derivatives and Hedging (ASC 815). The Company recognizes all derivatives on the balance sheet at fair value. Changes in the fair values of derivatives that are not designated as hedges are recognized in earnings. If the derivative is designated and qualifies as a hedge, depending on the nature of the hedge, changes in the fair value of the derivatives are either offset against the change in the hedged assets or liabilities through earnings or recognized in Accumulated other comprehensive income (loss), net of tax (“AOCI”) until the hedged item is recognized in earnings.
Income Taxes
The Company recognizes deferred tax assets and liabilities for the future tax consequences attributable to differences between the financial statement carrying amounts of existing assets and liabilities and their respective tax bases. Deferred tax assets and liabilities are measured using enacted tax rates expected to apply to taxable income in the years in which those temporary differences are expected to be recovered or settled. The effect on deferred tax assets and liabilities of a change in tax rates is recognized in income in the period that included the enactment date. Valuation allowances are provided against deferred tax assets when it is deemed more likely than not that some portion or all of the deferred tax asset will not be realized within a reasonable time period. We assess tax positions using a two‑step process. A tax position is recognized
if it meets a more‑likely‑than‑not threshold and is measured at the largest amount of benefit that is greater than 50% percent of being realized. Uncertain tax positions are reviewed each balance sheet date.
Foreign Currency Translation and Transactions
The functional currency for the international subsidiaries is the local currency. Assets and liabilities are translated into U.S. dollars using current rates of exchange, with the resulting translation adjustments recorded in AOCI within shareholders’ equity. Revenues and expenses are translated at the weighted‑average exchange rate for the period, with the resulting translation adjustments recorded in the Unaudited Consolidated Statements of Operations.
Foreign currency translation (gains) losses, mainly related to intercompany loans, which aggregated $7,614$(3,833) and $593$(772) for the three months ended March 31,June 30, 2020 and 2019, respectively, and $1,171$(2,662) and $5,408$4,636 for the sixnine months ended March 31,June 30, 2020 and 2019, respectively, are primarily included in General and administrative expenses in the Unaudited Consolidated Statements of Operations.
Research and Development Costs
Research and development costs are expensed as incurred. The Company recorded $3,189$2,782 and $3,957$3,281 for the three months ended March 31,June 30, 2020 and 2019, respectively, and $6,873$9,655 and $8,103$11,384 for the sixnine months ended March 31,June 30, 2020 and 2019, respectively.
Equity‑based Compensation
The Company measures the cost of awards of equity instruments to employees based on the grant‑date fair value of the award. The grant‑date fair value of a non-qualified stock option is determined using the Black‑Scholes model. The fair value of restricted stock unit awards is determined using the closing price of the Company’s common stock on the date of grant. Compensation costs resulting from equity-based payment transactions are recognized primarily within General and administrative expenses, at fair value over the requisite vesting period on a straight-line basis.
Earnings (Loss) Per Share
Basic earnings (loss) per common share is computed based on the weighted averageweighted-average number of shares of common stock outstanding during the period. Diluted earnings per common share is computed based on the weighted averageweighted-average number of shares of common stock, plus the effect of diluted common shares outstanding during the period using the treasury stock method. Diluted potential common shares include outstanding stock options.
Retirement Benefits
The Company applies ASC Topic No. 715, Compensation—Retirement Benefits, which requires the recognition in pension obligations and AOCI of actuarial gains or losses, prior service costs or credits and transition assets or obligations that have previously been deferred. The determination of retirement benefit pension obligations and associated costs requires the use of actuarial computations to estimate participant plan benefits to which the employees will be entitled. The significant assumptions primarily relate to discount rates, expected long‑term rates of return on plan assets, rate of future compensation increases, mortality, years of service, and other factors. The Company develops each assumption using relevant experience in conjunction with market‑related data for each individual country in which such plans exist. All actuarial assumptions are reviewed annually with third‑party consultants and adjusted as necessary. For the recognition of net periodic postretirementpost-retirement cost, the calculation of the expected return on plan assets is generally derived by applying the expected long‑term rate of return on the market‑related value of plan assets. The fair value of plan assets is determined based on actual market prices or estimated fair value at the measurement date.
Variable Interest Entities
Treated Water Outsourcing (“TWO”) is a joint venture between the Company and Nalco Water, an Ecolab company, in which the Company holds a 50% partnership interest. The Company is obligated to absorb all risk of loss up to 100% of the joint venture partner’s equity. As such, the Company fully consolidates TWO as a variable interest entity (“VIE”) under ASC Topic No. 810, Consolidation. The Company has not provided additional financial support to this entity which it is not contractually required to provide, and the Company does not have the ability to use the assets of TWO to settle obligations of the Company’s other subsidiaries.
The following provides a summary of TWO’s balance sheet as of March 31,June 30, 2020 and September 30, 2019, and summarized financial information for the three and sixnine months ended March 31,June 30, 2020 and 2019.
| | | | March 31,
2020 | | September 30,
2019 | June 30, 2020 | | September 30,
2019 |
| Current assets (includes cash of $2,569 and $3,903) | $ | 4,567 |
| | $ | 6,324 |
| |
| Current assets (includes cash of $2,505 and $3,903) | | $ | 4,548 |
| | $ | 6,324 |
|
| Property, plant and equipment | 1,212 |
| | 2,186 |
| 1,109 |
| | 2,186 |
|
| Goodwill | 2,206 |
| | 2,206 |
| 2,206 |
| | 2,206 |
|
| Other non-current assets | 3 |
| | 3 |
| 3 |
| | 3 |
|
| Total liabilities | (1,639 | ) | | (2,388 | ) | (1,402 | ) | | (2,388 | ) |
|
| | | | | | | | | | | | | | | |
| | Three Months Ended
June 30, | | Nine Months Ended
June 30, |
| | 2020 | | 2019 | | 2020 | | 2019 |
| Total revenues | $ | 1,328 |
| | $ | 2,573 |
| | $ | 5,180 |
| | $ | 8,951 |
|
| Total operating expenses | (803 | ) | | (2,231 | ) | | (3,847 | ) | | (7,267 | ) |
| Income from operations | $ | 525 |
| | $ | 342 |
| | $ | 1,333 |
| | $ | 1,684 |
|
|
| | | | | | | | | | | | | | | |
| | Three Months Ended
March 31, | | Six Months Ended
March 31, |
| | 2020 | | 2019 | | 2020 | | 2019 |
| Total revenues | $ | 1,210 |
| | $ | 3,222 |
| | $ | 3,852 |
| | $ | 6,378 |
|
| Total operating expenses | (1,086 | ) | | (2,806 | ) | | (3,044 | ) | | (5,036 | ) |
| Income from operations | $ | 124 |
| | $ | 416 |
| | $ | 808 |
| | $ | 1,342 |
|
On October 1, 2019, the Company acquired a 60% investment position in San Diego-based Frontier Water Systems, LLC (“Frontier”). The Frontier acquisition is a VIE because it has insufficient equity to finance its activities due to key assets being assigned to the Company upon acquisition. The Company is the primary beneficiary of Frontier because the Company has the power to direct the activities that most significantly affect the Frontier’s economic performance. As the agreement to purchase the remaining interest was determined to be financing due to the mandatory Purchase Right, as per ASC Topic 480, Distinguishing Liabilities From Equity, the Company recognized a liability for the remaining 40% interest. Additionally, the Company fully consolidates Frontier as a VIE under ASC Topic No. 810, Consolidation. See Note 3, “Acquisitions and Divestitures” for further discussion of the Frontier acquisition.
The following provides a summary of Frontier’s balance sheet as of March 31,June 30, 2020 and summarized financial information for the three and sixnine months ended March 31, 2020.June 30, 2020.
| | | | March 31,
2020 | June 30, 2020 |
| Current assets (includes cash of $3,721) | $ | 4,465 |
| |
| Current assets (includes cash of $2,611) | | $ | 4,106 |
|
| Property, plant and equipment | 3,283 |
| 3,251 |
|
| Goodwill | — |
| 2,582 |
|
| Other non-current assets | — |
| — |
|
| Total liabilities | (3,685 | ) | (3,457 | ) |
|
| | | | | | | |
| | Three Months Ended
June 30, | | Nine Months Ended
June 30, |
| | 2020 | | 2020 |
| Total revenues | $ | 1,411 |
| | $ | 4,134 |
|
| Total operating expenses | (1,498 | ) | | (5,047 | ) |
| Loss from operations | $ | (87 | ) | | $ | (913 | ) |
|
| | | | | | | |
| | Three Months Ended
March 31, | | Six Months Ended
March 31, |
| | 2020 | | 2020 |
| Total revenues | $ | 1,078 |
| | $ | 2,723 |
|
| Total operating expenses | (1,612 | ) | | (3,549 | ) |
| Loss from operations | $ | (534 | ) | | $ | (826 | ) |
Recent Accounting Pronouncements
In March 2020, the Financial Accounting Standards Board (“FASB”) issued ASU 2020-04, Reference Rate Reform (Topic 848): Facilitation of the Effects of Reference Rate Reform on Financial Reporting which provides optional expedients and exceptions for contracts, hedging relationships and other transactions that reference LIBOR or another reference rate expected to be discontinued because of reference rate reform, if certain criteria are met. ASU 2020-04 is effective immediately
and expires on December 21, 2022. The ASU allows eligible contracts that are modified to be accounted for as a continuation of those contracts, permits companies to preserve their hedging accounting during the transition period and enables companies to make a one-time election to transfer or sell held-to-maturity debt securities that are affected by rate reform. The Company is currently assessing the impact of adoption on the Company’s Unaudited Consolidated Financial Statements and related disclosures.
In March 2020, the FASB issued ASU 2020-03, Codification Improvements to Financial Instruments, which includes several amendments to clarify, conform or improve the Codification and make it easier to apply by eliminating inconsistencies and providing clarifications. The ASU includes seven different issues that describe the areas of improvement and the related amendments, which have various effective dates. The Company is currently assessing the impact of adoption on the Company’s Unaudited Consolidated Financial Statements and related disclosures.
In November 2018, the FASB issued ASU 2018-19, Codification Improvements to Topic 326, Financial Instruments—Credit Losses which clarifies that receivables from operating leases are accounted for using the lease guidance and not as financial instruments. ASU 2018-19 will be effective for the Company for the quarter ending December 31, 2020, with early adoptionsadoption permitted. The Company is currently assessing the impact of adoption on the Company’s Unaudited Consolidated Financial Statements.
In November 2018, the FASB issued ASU 2018-18, Collaborative Arrangements (Topic 808) Clarifying the Interaction between Topic 808 and Topic 606, which clarifies that certain transactions between collaborative arrangement participants should be accounted for as revenue under Topic 606 when the collaborative arrangement participant is a customer in the context of a unit of account. In addition, unit-of-account guidance in Topic 808 was aligned with the guidance in Topic 606 (that is, a distinct good or service) when an entity is assessing whether the collaborative arrangement or a part of the arrangement is within the scope of Topic 606. ASU 2018-18 should be applied retrospectively to the date of initial adoption of Topic 606 and is effective for the Company for the quarter ending December 31, 2020, with early adoption permitted. The Company is currently assessing the impact of adoption on the Company’s Unaudited Consolidated Financial Statements.
In August 2018, the FASB issued ASU 2018-13, Fair Value Measurement (Subtopic 820): Disclosure Framework—Changes to the Disclosure Requirements for Fair Value Measurement, which modifies the disclosure requirements on fair value measurements. The amendments on changes in unrealized gains and losses, the range and weighted average of significant unobservable inputs used to develop Level 3 fair value measurements, and the narrative description of measurement uncertainty should be applied prospectively for only the most recent interim or annual period presented in the initial year of adoption. All other amendments should be applied retrospectively to all periods presented upon their effective date. ASU 2018-14 will be effective for the Company for the quarter ending December 31, 2020, with early adoption permitted. The Company is currently assessing the impact of adoption on the Company’s disclosures.
In June 2016, the FASB issued ASU 2016-13, Financial Instruments—Credit Losses (Topic 326): Measurement of Credit Losses on Financial Instruments, amended in November 2019 (ASU 2019-11 and 2019-10), which requires entities to use a new forward-looking “expected loss” model that reflects expected credit losses, including credit losses related to trade receivables, and requires consideration of a broader range of reasonable and supportable information to inform credit loss estimates which generally will result in the earlier recognition of allowances for losses. ASU 2016-13 will be effective for the Company for the quarter ending December 31, 2020, with early adoption permitted.2020. The Company is currently assessing thenot expecting this ASU to have a significant impact of adoption on the Company’s Unaudited Consolidated Financial Statements.Statements given our current practices and history.
Accounting Pronouncements Recently AdoptedRevenue Recognition
The Company adopted ASU 2019-12, Income TaxesAccounting Standards Update (“ASU”) No. 2014-09, Revenue from Contracts with Customers (Topic 740): Simplifying606) on October 1, 2018, and recognizes sales of products and services based on the Accountingfive-step analysis of transactions as provided in Topic 606 which requires an entity to recognize revenue to depict the transfer of promised goods or services to customers in an amount that reflects the consideration to which the entity expects to be entitled in exchange for Income Taxessuch goods or services.
For sales of aftermarket parts or products with a low level of customization and engineering time, the Company recognizes revenues at the time risks and rewards of ownership pass, which is generally when products are shipped or delivered to the customer as the Company has no obligation for installation. Sales of short‑term service arrangements are recognized as the services are performed, and sales of long‑term service arrangements are typically recognized on a straight‑line basis over the life of the agreement.
For certain arrangements where there is significant customization to the product, the Company recognizes revenue either over time or at a point in time. These products include large capital water treatment projects, systems and solutions for municipal and industrial applications. The nature of the contracts is generally fixed price with milestone billings. The Company recognizes revenue over time if the product has no alternative use and the Company has an enforceable right to payment for the performance completed to date, including a normal profit margin, in the event of termination for convenience. If these two criteria are not met, revenues from these contracts will not be recognized until construction is complete. Contract revenues and cost estimates are reviewed and revised quarterly at a minimum and the cumulative effect of such adjustments are recognized in current operations. The amount of such adjustments has not been material. See Note 4, “Revenue” for further details.
Product Warranties
Accruals for estimated expenses related to warranties are made at the time products are sold and are recorded as a component of Cost of product sales in the Unaudited Consolidated Statements of Operations. The estimated warranty obligation is based on product warranty terms offered to customers, ongoing product failure rates, material usage and service delivery costs expected to be incurred in correcting a product failure, as well as specific obligations for known failures and other currently available evidence. The Company assesses the adequacy of the recorded warranty liabilities on a regular basis and adjusts amounts as necessary.
Leases
The Company accounts for leases in accordance with ASC Topic No. 842, Leases, adopted as of October 1, 2019 (Topic 842). Please see the “Accounting Pronouncements Recently Adopted” section below for information regarding this adoption. See Note 19, “Leases” for further details.
Lessee Accounting
The Company leases office space, buildings, vehicles, forklifts, computers, copiers and other assets under non-cancellable operating and finance leases. The Company determines whether an arrangement is or contains a lease at the inception of the arrangement based on the terms and conditions in the contract. A contract contains a lease if there is an identified asset and the Company has the right to control the asset. If the arrangement contains a lease, the Company recognizes a right-of-use (“ROU”) asset and an operating lease liability as of the lease commencement date. Operating lease assets and finance lease assets are included in Operating lease right-of-use assets, net and Property, plant, and equipment, net, respectively, on the Consolidated Balance Sheets. The corresponding operating lease liabilities are included in Accrued expenses and other liabilities and Obligation under operating leases on the Consolidated Balance Sheets. The corresponding finance lease liabilities are included in Accrued expenses and other liabilities and Other non‑current liabilities on the Consolidated Balance Sheets.
Lessor Accounting
The Company generates revenue through the lease of its water treatment equipment and systems to customers. In certain instances, the Company enters into a contract with a customer but must construct the underlying asset prior to its lease. At the time of contract inception, the Company determines if an arrangement is or contains a lease. These contracts generally contain both lease and non-lease components, including installation, maintenance and monitoring services of the Company-owned equipment, in addition to sale of certain constructed assets. In situations where arrangements contain multiple elements, contract consideration is allocated based on relative standalone selling price. Lease components associated to underlying assets that have an alternative use are classified as operating leases with revenue recognized over time throughout the lease term, whereas lease components associated to underlying assets that have no alternative use and the Company has an enforceable right to payment for the performance completed to date, including a normal profit margin, in the event of termination for convenience are classified as sales-type leases, with point in time revenue recognition at the on-set of the lease. In order for a component to be separate, the Customer would be able to benefit from the right of use of the component separately or with other resources readily available to the Customer and the right of the use is not highly dependent or highly interrelated with the other rights to use the other underlying assets or components.
Shipping and Handling Cost
Shipping and handling costs are included as a component of Cost of product sales.
Derivative Financial Instruments
The Company’s risk-management strategy uses derivative financial instruments to manage interest rate risk and foreign currency exchange rate risk. The Company’s objective in using interest rate derivatives is to add stability to interest expense and manage its exposure to interest rate movements. To accomplish this objective, in the third quarter of 2020, the Company entered into an interest rate swap which simplifies the accounting for income taxes by removing certain exceptions and by clarifying and amending existing guidancehas been designated as a cash flow hedge. The Company uses foreign currency derivative contracts in order to improve consistent applicationmanage the effect of exchange rate fluctuations on forecasted sales and simplify GAAP for other areaspurchases that are denominated in foreign currencies. To mitigate the impact of Topic 740. This adoption did not have an impact onforeign exchange rate risk, the Company’s Unaudited Consolidated Financial Statements.
Company entered into a series of forward contracts designated as cash flow hedges. The Company adopted ASU 2018‑07, Compensation—Stock Compensation (Topic 718): Improvements to Nonemployee Share-Based Payment Accounting, as of October 1, 2019. ASU 2018-07 expands the scope of Topic 718 to include share-based payment transactionsdoes not enter into derivatives for acquiring goods and services from nonemployees. This adoption did not have an impact on the Company’s Unaudited Consolidated Financial Statements.
trading or speculative purposes. The Company adopted ASU 2017‑12, accounts for derivatives and hedging activities in accordance with ASC Topic No. 815, Derivatives and Hedging (Topic (ASC 815): Targeted Improvements to Accounting for Hedging Activities, as of October 1, 2019. ASU 2017-12 expands and refines hedge accounting for both nonfinancial and financial risk components and aligns the recognition and presentation of the effects of the hedging instrument and the hedged item in the financial statements and also made certain targeted improvements to simplify the application of hedge accounting guidance and ease the administrative burden of hedge documentation requirements and assessing hedge effectiveness. This adoption did not have a material impact on the Company’s Unaudited Consolidated Financial Statements.
. The Company adopted ASU 2016-02, Leases (Topic 842), including associated ASUs related to Topic 842,as of October 1, 2019. ASU No. 2016-02 requires recognition of operating leases as lease assets and liabilitiesrecognizes all derivatives on the balance sheet at fair value. Changes in the fair values of derivatives that are not designated as hedges are recognized in earnings. If the derivative is designated and disclosurequalifies as a hedge, depending on the nature of key information about leasing arrangements. Amendmentsthe hedge, changes in the fair value of the derivatives are either offset against the change in the hedged assets or liabilities through earnings or recognized in Accumulated other comprehensive income (loss), net of tax (“AOCI”) until the hedged item is recognized in earnings.
Income Taxes
The Company recognizes deferred tax assets and liabilities for the future tax consequences attributable to differences between the standard were issued byfinancial statement carrying amounts of existing assets and liabilities and their respective tax bases. Deferred tax assets and liabilities are measured using enacted tax rates expected to apply to taxable income in the FASByears in January, Julywhich those temporary differences are expected to be recovered or settled. The effect on deferred tax assets and December 2018, and March 2019 including certain practical expedients, an amendment that provides an additional and optional transition method to adopt the standard at the adoption date and recognizeliabilities of a cumulative-effect adjustment to the opening balance of retained earningschange in tax rates is recognized in income in the period that included the enactment date. Valuation allowances are provided against deferred tax assets when it is deemed more likely than not that some portion or all of adoptionthe deferred tax asset will not be realized within a reasonable time period. We assess tax positions using a two‑step process. A tax position is recognized
if it meets a more‑likely‑than‑not threshold and certain narrow-scope improvementsis measured at the largest amount of benefit that is greater than 50% percent of being realized. Uncertain tax positions are reviewed each balance sheet date.
Foreign Currency Translation and Transactions
The functional currency for lessors.the international subsidiaries is the local currency. Assets and liabilities are translated into U.S. dollars using current rates of exchange, with the resulting translation adjustments recorded in AOCI within shareholders’ equity. Revenues and expenses are translated at the weighted‑average exchange rate for the period, with the resulting translation adjustments recorded in the Unaudited Consolidated Statements of Operations.
Foreign currency translation (gains) losses, mainly related to intercompany loans, which aggregated $(3,833) and $(772) for the three months ended June 30, 2020 and 2019, respectively, and $(2,662) and $4,636 for the nine months ended June 30, 2020 and 2019, respectively, are primarily included in General and administrative expenses in the Unaudited Consolidated Statements of Operations.
Research and Development Costs
Research and development costs are expensed as incurred. The Company adopted this standardrecorded $2,782 and $3,281 for the three months ended June 30, 2020 and 2019, respectively, and $9,655 and $11,384 for the nine months ended June 30, 2020 and 2019, respectively.
Equity‑based Compensation
The Company measures the cost of awards of equity instruments to employees based on the grant‑date fair value of the award. The grant‑date fair value of a non-qualified stock option is determined using a modified retrospective approach, applying the new standard to all leases existing atBlack‑Scholes model. The fair value of restricted stock unit awards is determined using the closing price of the Company’s common stock on the date of initial adoptiongrant. Compensation costs resulting from equity-based payment transactions are recognized primarily within General and administrative expenses, at fair value over the requisite vesting period on a straight-line basis.
Earnings (Loss) Per Share
Basic earnings (loss) per common share is computed based on the weighted-average number of shares of common stock outstanding during the period. Diluted earnings per common share is computed based on the weighted-average number of shares of common stock, plus the effect of diluted common shares outstanding during the period using the treasury stock method. Diluted potential common shares include outstanding stock options.
Retirement Benefits
The Company applies ASC Topic No. 715, Compensation—Retirement Benefits, which requires the recognition in pension obligations and AOCI of actuarial gains or losses, prior service costs or credits and transition assets or obligations that have previously been deferred. The determination of retirement benefit pension obligations and associated costs requires the use of actuarial computations to estimate participant plan benefits to which the employees will be entitled. The significant assumptions primarily relate to discount rates, expected long‑term rates of return on plan assets, rate of future compensation increases, mortality, years of service, and other factors. The Company develops each assumption using relevant experience in conjunction with market‑related data for each individual country in which such plans exist. All actuarial assumptions are reviewed annually with third‑party consultants and adjusted as necessary. For the recognition of net periodic post-retirement cost, the calculation of the expected return on plan assets is generally derived by applying the expected long‑term rate of return on the market‑related value of plan assets. The fair value of plan assets is determined based on actual market prices or estimated fair value at the measurement date.
Variable Interest Entities
Treated Water Outsourcing (“TWO”) is a joint venture between the Company electedand Nalco Water, an Ecolab company, in which the Company holds a 50% partnership interest. The Company is obligated to apply the transition requirements at the October 1, 2019 effective date rather than the beginningabsorb all risk of loss up to 100% of the earliest comparative period presented.joint venture partner’s equity. As a result,such, the Company recordedfully consolidates TWO as a cumulative effect adjustment in the period of adoption, and prior periods were not restated and continue to be reported in accordance with historic accountingvariable interest entity (“VIE”) under ASC Topic No. 840. In addition,810, Consolidation. The Company has not provided additional financial support to this entity which it is not contractually required to provide, and the Company has elected the package of practical expedients permitted under the transition guidance which does not require reassessmenthave the ability to use the assets of prior conclusions relatedTWO to contracts containingsettle obligations of the Company’s other subsidiaries.
The following provides a lease, lease classification and initial direct lease costs. As an accounting policy election, the Company elected to exclude short-term leases (termsummary of 12 months or less) from theTWO’s balance sheet and accounts for non-lease and lease components separately for all asset classes. The following table summarizes the impact of adoption to the Consolidated Balance Sheet as of October 1, 2019:June 30, 2020 and September 30, 2019, and summarized financial information for the three and nine months ended June 30, 2020 and 2019.
|
| | | | | | | | | | | |
| | As Reported September 30, 2019 | | Impact of Adoption of ASU 2016-02 | | Updated October 1, 2019 |
| Assets | | | | | |
| Prepaid and other current assets | $ | 21,940 |
| | $ | (73 | ) | | $ | 21,867 |
|
| Total current assets | 637,293 |
| | (73 | ) | | 637,220 |
|
| Property, plant and equipment, net | 333,584 |
| | 2,812 |
| | 336,396 |
|
| Operating lease right-of-use assets, net | — |
| | 42,073 |
| | 42,073 |
|
| Total Assets | 1,737,848 |
| | 44,812 |
| | 1,782,660 |
|
| Liabilities | | | | | |
| Accrued expenses and other liabilities | 101,839 |
| | 13,596 |
| | 115,435 |
|
| Total current liabilities | 322,221 |
| | 13,596 |
| | 335,817 |
|
| Obligation under operating leases | — |
| | 29,308 |
| | 29,308 |
|
| Other non-current liabilities | 78,661 |
| | 3,245 |
| | 81,906 |
|
| Total non-current liabilities | 1,049,805 |
| | 32,553 |
| | 1,082,358 |
|
| Total liabilities | 1,372,026 |
| | 46,149 |
| | 1,418,175 |
|
| Shareholders' equity | | | | | |
| Retained deficit | (174,976 | ) | | (1,337 | ) | | (176,313 | ) |
| Total Evoqua Water Technologies Corp. equity | 362,759 |
| | (1,337 | ) | | 361,422 |
|
| Total shareholder's equity | 365,822 |
| | (1,337 | ) | | 364,485 |
|
| Total liabilities and shareholders' equity | $ | 1,737,848 |
| | $ | 44,812 |
| | $ | 1,782,660 |
|
|
| | | | | | | |
| | June 30, 2020 | | September 30,
2019 |
| Current assets (includes cash of $2,505 and $3,903) | $ | 4,548 |
| | $ | 6,324 |
|
| Property, plant and equipment | 1,109 |
| | 2,186 |
|
| Goodwill | 2,206 |
| | 2,206 |
|
| Other non-current assets | 3 |
| | 3 |
|
| Total liabilities | (1,402 | ) | | (2,388 | ) |
3. Acquisitions and Divestitures |
| | | | | | | | | | | | | | | |
| | Three Months Ended
June 30, | | Nine Months Ended
June 30, |
| | 2020 | | 2019 | | 2020 | | 2019 |
| Total revenues | $ | 1,328 |
| | $ | 2,573 |
| | $ | 5,180 |
| | $ | 8,951 |
|
| Total operating expenses | (803 | ) | | (2,231 | ) | | (3,847 | ) | | (7,267 | ) |
| Income from operations | $ | 525 |
| | $ | 342 |
| | $ | 1,333 |
| | $ | 1,684 |
|
Acquisitions
Acquisitions support the Company’s strategy of delivering a broad solutions portfolio with robust technology across multiple geographies and end markets. The Company continues to evaluate potential strategic acquisitions of businesses, assets and product lines and believes that capex-like, tuck-in acquisitions present a key opportunity within its overall growth strategy.
On October 1, 2019, the Company acquired a 60% investment position in San Diego-based Frontier Water Systems, LLC (“Frontier”) for $11,160 cash paid at closing.. The Frontier acquisition is a pioneer in the development of patented, engineered equipment packages for high-rate treatment and removal of selenium, nitrate and other metals from complex water systems. During the six months ended March 31, 2020,VIE because it has insufficient equity to finance its activities due to key assets being assigned to the Company incurred approximately $402 in acquisition costs, which are included in General and administrative expenses. Frontier is part of the Integrated Solutions and Services segment.
upon acquisition. The Company has entered into an agreement to purchaseis the remaining 40% interest inprimary beneficiary of Frontier on or prior to March 30, 2024. This agreement (a) gives holders of the remaining 40% interest in Frontier (the “Minority Owners”) the right to sell to Evoqua up to approximately 10% of the outstanding equity in Frontier at a predetermined price, which right may be exercised by the Minority Owners between January 1, 2021 and February 28, 2021 (the “Option”), and (b) obligatesbecause the Company has the power to purchase anddirect the Minority Owners to sell all ofactivities that most significantly affect Frontier’s economic performance. As the Minority Owners’ remaining interest in Frontier at the fair market value at the time of sale on or prior to March 30, 2024 (the “Purchase Right”). The Purchase Right may be exercised early by the Minority Owners. The agreement to purchase the remaining interest was determined to be financing due to the mandatory Purchase Right, as per ASC Topic 480, Distinguishing Liabilities From Equity, and as such, the Company will recognizerecognized a liability for the remaining 40% interest.
The value Additionally, the Company fully consolidates Frontier as a VIE under ASC Topic No. 810, Consolidation. See Note 3, “Acquisitions and Divestitures” for further discussion of the Option was determined to be $506 usingFrontier acquisition.
The following provides a Black Scholes model,summary of Frontier’s balance sheet as of June 30, 2020 and is included within Accrued expenses and other liabilities on the Consolidated Balance Sheets.
The value of the Purchase Right was determined to be $6,661, and is included within Other non‑current liabilities on the Consolidated Balance Sheets, based upon the enterprise value of Frontier upon the acquisition date as per ASC Topic 480, Distinguishing Liabilities From Equity. Pursuant to ASC Topic 480, the Company determined that this should be recorded as a liability and should be recognized at the fair value at the time of inception, adjusted for any consideration or unstated rights or privileges. The liability will be subsequently measured at an amount that would be paid on the reporting date with any change in value from the previous reporting date recognized as interest cost.
The accountingsummarized financial information for the acquisition has not yet been completed because the Company has not finalized the valuations of the acquired assets, assumed liabilitiesthree and identifiable intangible assets, including goodwill. The preliminary opening balance sheet for Frontier is summarized as follows:nine months ended June 30, 2020.
|
| | | |
| Current assets | $ | 3,186 |
|
| Property, plant and equipment | 3,570 |
|
| Goodwill | 1,466 |
|
| Intangible assets | 11,571 |
|
| Total assets acquired | 19,793 |
|
| Liabilities related to Option and Purchase Right | (7,167 | ) |
| Other liabilities assumed | (1,466 | ) |
| Net assets acquired | $ | 11,160 |
|
|
| | | |
| | June 30, 2020 |
| Current assets (includes cash of $2,611) | $ | 4,106 |
|
| Property, plant and equipment | 3,251 |
|
| Goodwill | 2,582 |
|
| Other non-current assets | — |
|
| Total liabilities | (3,457 | ) |
Divestitures |
| | | | | | | |
| | Three Months Ended
June 30, | | Nine Months Ended
June 30, |
| | 2020 | | 2020 |
| Total revenues | $ | 1,411 |
| | $ | 4,134 |
|
| Total operating expenses | (1,498 | ) | | (5,047 | ) |
| Loss from operations | $ | (87 | ) | | $ | (913 | ) |
OnRecent Accounting Pronouncements
In March 2020, the Financial Accounting Standards Board (“FASB”) issued ASU 2020-04, Reference Rate Reform (Topic 848): Facilitation of the Effects of Reference Rate Reform on Financial Reporting which provides optional expedients and exceptions for contracts, hedging relationships and other transactions that reference LIBOR or another reference rate expected to be discontinued because of reference rate reform, if certain criteria are met. ASU 2020-04 is effective immediately
and expires on December 21, 2022. The ASU allows eligible contracts that are modified to be accounted for as a continuation of those contracts, permits companies to preserve their hedging accounting during the transition period and enables companies to make a one-time election to transfer or sell held-to-maturity debt securities that are affected by rate reform. The Company is currently assessing the impact of adoption on the Company’s Unaudited Consolidated Financial Statements and related disclosures.
In March 2020, the FASB issued ASU 2020-03, Codification Improvements to Financial Instruments, which includes several amendments to clarify, conform or improve the Codification and make it easier to apply by eliminating inconsistencies and providing clarifications. The ASU includes seven different issues that describe the areas of improvement and the related amendments, which have various effective dates. The Company is currently assessing the impact of adoption on the Company’s Unaudited Consolidated Financial Statements and related disclosures.
In November 2018, the FASB issued ASU 2018-19, Codification Improvements to Topic 326, Financial Instruments—Credit Losses which clarifies that receivables from operating leases are accounted for using the lease guidance and not as financial instruments. ASU 2018-19 will be effective for the Company for the quarter ending December 31, 2019,2020, with early adoption permitted. The Company is currently assessing the impact of adoption on the Company’s Unaudited Consolidated Financial Statements.
In November 2018, the FASB issued ASU 2018-18, Collaborative Arrangements (Topic 808) Clarifying the Interaction between Topic 808 and Topic 606, which clarifies that certain transactions between collaborative arrangement participants should be accounted for as revenue under Topic 606 when the collaborative arrangement participant is a customer in the context of a unit of account. In addition, unit-of-account guidance in Topic 808 was aligned with the guidance in Topic 606 (that is, a distinct good or service) when an entity is assessing whether the collaborative arrangement or a part of the arrangement is within the scope of Topic 606. ASU 2018-18 should be applied retrospectively to the date of initial adoption of Topic 606 and is effective for the Company completedfor the previously-announced salequarter ending December 31, 2020, with early adoption permitted. The Company is currently assessing the impact of adoption on the Memcor product lineCompany’s Unaudited Consolidated Financial Statements.
In August 2018, the FASB issued ASU 2018-13, Fair Value Measurement (Subtopic 820): Disclosure Framework—Changes to DuPont de Nemours, Inc. (“DuPont”).the Disclosure Requirements for Fair Value Measurement, which modifies the disclosure requirements on fair value measurements. The aggregate purchase price paid by DuPontamendments on changes in unrealized gains and losses, the range and weighted average of significant unobservable inputs used to develop Level 3 fair value measurements, and the narrative description of measurement uncertainty should be applied prospectively for only the most recent interim or annual period presented in the Transaction was $110,000 in cash, subjectinitial year of adoption. All other amendments should be applied retrospectively to certain adjustments. Following adjustmentsall periods presented upon their effective date. ASU 2018-14 will be effective for cash and net working capital, gross proceeds paid by DuPont were $131,011.the Company for the quarter ending December 31, 2020, with early adoption permitted. The Company recognized a $49,000 net pre-tax benefitis currently assessing the impact of adoption on the saleCompany’s disclosures.
In June 2016, the FASB issued ASU 2016-13, Financial Instruments—Credit Losses (Topic 326): Measurement of the Memcor product line, netCredit Losses on Financial Instruments, amended in November 2019 (ASU 2019-11 and 2019-10), which requires entities to use a new forward-looking “expected loss” model that reflects expected credit losses, including credit losses related to trade receivables, and requires consideration of $8,300a broader range of discretionary compensation paymentsreasonable and supportable information to employees in connection with the transaction and $1,000 in transaction costs incurredinform credit loss estimates which generally will result in the three months ended December 31, 2019. As a resultearlier recognition of net working capital adjustments,allowances for losses. ASU 2016-13 will be effective for the Company
recognized an additional $9,000 net pre-tax benefit in for the three months ended Marchquarter ending December 31, 2020. The Company utilized $100,000 of the proceeds from the transactionis not expecting this ASU to repayhave a portion ofsignificant impact on the Company’s First Lien Term Loans in January 2020.Unaudited Consolidated Financial Statements given our current practices and history.
4. Revenue
Revenue Recognition
The Company adopted Accounting Standards Update (“ASU”) No. 2014-09, Revenue from Contracts with Customers (Topic 606) on October 1, 2018, and recognizes sales of products and services based on the five-step analysis of transactions as provided in Topic 606 which requires an entity to recognize revenue to depict the transfer of promised goods or services to customers in an amount that reflects the consideration to which the entity expects to be entitled in exchange for such goods or services.
For sales of aftermarket parts or products with a low level of customization and engineering time, the Company recognizes revenues at the time risks and rewards of ownership pass, which is generally when products are shipped or delivered to the customer as the Company has no obligation for installation. Sales of short‑term service arrangements are recognized as the services are performed, and sales of long‑term service arrangements are typically recognized on a straight‑line basis over the life of the agreement.
For certain arrangements where there is significant customization to the product, the Company recognizes revenue either over time or at a point in time. These products include large capital water treatment projects, systems and solutions for municipal and industrial applications. The nature of the contracts is generally fixed price with milestone billings. The Company recognizes revenue over time if the product has no alternative use and the Company has an enforceable right to payment for the performance completed to date, including a normal profit margin, in the event of termination for convenience. If these two criteria are not met, revenues from these contracts will not be recognized until construction is complete. Contract revenues and cost estimates are reviewed and revised quarterly at a minimum and the cumulative effect of such adjustments are recognized in current operations. The amount of such adjustments has not been material. See Note 4, “Revenue” for further details.
Product Warranties
Accruals for estimated expenses related to warranties are made at the time products are sold and are recorded as a component of Cost of product sales in the Unaudited Consolidated Statements of Operations. The estimated warranty obligation is based on product warranty terms offered to customers, ongoing product failure rates, material usage and service delivery costs expected to be incurred in correcting a product failure, as well as specific obligations for known failures and other currently available evidence. The Company assesses the adequacy of the recorded warranty liabilities on a regular basis and adjusts amounts as necessary.
Leases
The Company accounts for leases in accordance with ASC Topic No. 842, Leases, adopted as of October 1, 2019 (Topic 842). Please see the “Accounting Pronouncements Recently Adopted” section below for information regarding this adoption. See Note 19, “Leases” for further details.
Lessee Accounting
The Company leases office space, buildings, vehicles, forklifts, computers, copiers and other assets under non-cancellable operating and finance leases. The Company determines whether an arrangement is or contains a lease at the inception of the arrangement based on the terms and conditions in the contract. A contract contains a lease if there is an identified asset and the Company has the right to control the asset. If the arrangement contains a lease, the Company recognizes a right-of-use (“ROU”) asset and an operating lease liability as of the lease commencement date. Operating lease assets and finance lease assets are included in Operating lease right-of-use assets, net and Property, plant, and equipment, net, respectively, on the Consolidated Balance Sheets. The corresponding operating lease liabilities are included in Accrued expenses and other liabilities and Obligation under operating leases on the Consolidated Balance Sheets. The corresponding finance lease liabilities are included in Accrued expenses and other liabilities and Other non‑current liabilities on the Consolidated Balance Sheets.
Lessor Accounting
The Company generates revenue through the lease of its water treatment equipment and systems to customers. In certain instances, the Company enters into a contract with a customer but must construct the underlying asset prior to its lease. At the time of contract inception, the Company determines if an arrangement is or contains a lease. These contracts generally contain both lease and non-lease components, including installation, maintenance and monitoring services of the Company-owned equipment, in addition to sale of certain constructed assets. In situations where arrangements contain multiple elements, contract consideration is allocated based on relative standalone selling price. Lease components associated to underlying assets that have an alternative use are classified as operating leases with revenue recognized over time throughout the lease term, whereas lease components associated to underlying assets that have no alternative use and the Company has an enforceable right to payment for the performance completed to date, including a normal profit margin, in the event of termination for convenience are classified as sales-type leases, with point in time revenue recognition at the on-set of the lease. In order for a component to be separate, the Customer would be able to benefit from the right of use of the component separately or with other resources readily available to the Customer and the right of the use is not highly dependent or highly interrelated with the other rights to use the other underlying assets or components.
Shipping and Handling Cost
Shipping and handling costs are included as a component of Cost of product sales.
Derivative Financial Instruments
The Company’s risk-management strategy uses derivative financial instruments to manage interest rate risk and foreign currency exchange rate risk. The Company’s objective in using interest rate derivatives is to add stability to interest expense and manage its exposure to interest rate movements. To accomplish this objective, in the third quarter of 2020, the Company entered into an interest rate swap which has been designated as a cash flow hedge. The Company uses foreign currency derivative contracts in order to manage the effect of exchange rate fluctuations on forecasted sales and purchases that are denominated in foreign currencies. To mitigate the impact of foreign exchange rate risk, the Company entered into a series of forward contracts designated as cash flow hedges. The Company does not enter into derivatives for trading or speculative purposes. The Company accounts for derivatives and hedging activities in accordance with ASC Topic No. 815, Derivatives and Hedging (ASC 815). The Company recognizes all derivatives on the balance sheet at fair value. Changes in the fair values of derivatives that are not designated as hedges are recognized in earnings. If the derivative is designated and qualifies as a hedge, depending on the nature of the hedge, changes in the fair value of the derivatives are either offset against the change in the hedged assets or liabilities through earnings or recognized in Accumulated other comprehensive income (loss), net of tax (“AOCI”) until the hedged item is recognized in earnings.
Income Taxes
The Company recognizes deferred tax assets and liabilities for the future tax consequences attributable to differences between the financial statement carrying amounts of existing assets and liabilities and their respective tax bases. Deferred tax assets and liabilities are measured using enacted tax rates expected to apply to taxable income in the years in which those temporary differences are expected to be recovered or settled. The effect on deferred tax assets and liabilities of a change in tax rates is recognized in income in the period that included the enactment date. Valuation allowances are provided against deferred tax assets when it is deemed more likely than not that some portion or all of the deferred tax asset will not be realized within a reasonable time period. We assess tax positions using a two‑step process. A tax position is recognized
if it meets a more‑likely‑than‑not threshold and is measured at the largest amount of benefit that is greater than 50% percent of being realized. Uncertain tax positions are reviewed each balance sheet date.
Foreign Currency Translation and Transactions
The functional currency for the international subsidiaries is the local currency. Assets and liabilities are translated into U.S. dollars using current rates of exchange, with the resulting translation adjustments recorded in AOCI within shareholders’ equity. Revenues and expenses are translated at the weighted‑average exchange rate for the period, with the resulting translation adjustments recorded in the Unaudited Consolidated Statements of Operations.
Foreign currency translation (gains) losses, mainly related to intercompany loans, which aggregated $(3,833) and $(772) for the three months ended June 30, 2020 and 2019, respectively, and $(2,662) and $4,636 for the nine months ended June 30, 2020 and 2019, respectively, are primarily included in General and administrative expenses in the Unaudited Consolidated Statements of Operations.
Research and Development Costs
Research and development costs are expensed as incurred. The Company recorded $2,782 and $3,281 for the three months ended June 30, 2020 and 2019, respectively, and $9,655 and $11,384 for the nine months ended June 30, 2020 and 2019, respectively.
Equity‑based Compensation
The Company measures the cost of awards of equity instruments to employees based on the grant‑date fair value of the award. The grant‑date fair value of a non-qualified stock option is determined using the Black‑Scholes model. The fair value of restricted stock unit awards is determined using the closing price of the Company’s common stock on the date of grant. Compensation costs resulting from equity-based payment transactions are recognized primarily within General and administrative expenses, at fair value over the requisite vesting period on a straight-line basis.
Earnings (Loss) Per Share
Basic earnings (loss) per common share is computed based on the weighted-average number of shares of common stock outstanding during the period. Diluted earnings per common share is computed based on the weighted-average number of shares of common stock, plus the effect of diluted common shares outstanding during the period using the treasury stock method. Diluted potential common shares include outstanding stock options.
Retirement Benefits
The Company applies ASC Topic No. 715, Compensation—Retirement Benefits, which requires the recognition in pension obligations and AOCI of actuarial gains or losses, prior service costs or credits and transition assets or obligations that have previously been deferred. The determination of retirement benefit pension obligations and associated costs requires the use of actuarial computations to estimate participant plan benefits to which the employees will be entitled. The significant assumptions primarily relate to discount rates, expected long‑term rates of return on plan assets, rate of future compensation increases, mortality, years of service, and other factors. The Company develops each assumption using relevant experience in conjunction with market‑related data for each individual country in which such plans exist. All actuarial assumptions are reviewed annually with third‑party consultants and adjusted as necessary. For the recognition of net periodic post-retirement cost, the calculation of the expected return on plan assets is generally derived by applying the expected long‑term rate of return on the market‑related value of plan assets. The fair value of plan assets is determined based on actual market prices or estimated fair value at the measurement date.
Variable Interest Entities
Treated Water Outsourcing (“TWO”) is a joint venture between the Company and Nalco Water, an Ecolab company, in which the Company holds a 50% partnership interest. The Company is obligated to absorb all risk of loss up to 100% of the joint venture partner’s equity. As such, the Company fully consolidates TWO as a variable interest entity (“VIE”) under ASC Topic No. 810, Consolidation. The Company has not provided additional financial support to this entity which it is not contractually required to provide, and the Company does not have the ability to use the assets of TWO to settle obligations of the Company’s other subsidiaries.
The following provides a summary of TWO’s balance sheet as of June 30, 2020 and September 30, 2019, and summarized financial information for the three and nine months ended June 30, 2020 and 2019.
|
| | | | | | | |
| | June 30, 2020 | | September 30,
2019 |
| Current assets (includes cash of $2,505 and $3,903) | $ | 4,548 |
| | $ | 6,324 |
|
| Property, plant and equipment | 1,109 |
| | 2,186 |
|
| Goodwill | 2,206 |
| | 2,206 |
|
| Other non-current assets | 3 |
| | 3 |
|
| Total liabilities | (1,402 | ) | | (2,388 | ) |
|
| | | | | | | | | | | | | | | |
| | Three Months Ended
June 30, | | Nine Months Ended
June 30, |
| | 2020 | | 2019 | | 2020 | | 2019 |
| Total revenues | $ | 1,328 |
| | $ | 2,573 |
| | $ | 5,180 |
| | $ | 8,951 |
|
| Total operating expenses | (803 | ) | | (2,231 | ) | | (3,847 | ) | | (7,267 | ) |
| Income from operations | $ | 525 |
| | $ | 342 |
| | $ | 1,333 |
| | $ | 1,684 |
|
On October 1, 2019, the Company acquired a 60% investment position in San Diego-based Frontier Water Systems, LLC (“Frontier”). The Frontier acquisition is a VIE because it has insufficient equity to finance its activities due to key assets being assigned to the Company upon acquisition. The Company is the primary beneficiary of Frontier because the Company has the power to direct the activities that most significantly affect Frontier’s economic performance. As the agreement to purchase the remaining interest was determined to be financing due to the mandatory Purchase Right, as per ASC Topic 480, Distinguishing Liabilities From Equity, the Company recognized a liability for the remaining 40% interest. Additionally, the Company fully consolidates Frontier as a VIE under ASC Topic No. 810, Consolidation. See Note 3, “Acquisitions and Divestitures” for further discussion of the Frontier acquisition.
The following provides a summary of Frontier’s balance sheet as of June 30, 2020 and summarized financial information for the three and nine months ended June 30, 2020.
|
| | | |
| | June 30, 2020 |
| Current assets (includes cash of $2,611) | $ | 4,106 |
|
| Property, plant and equipment | 3,251 |
|
| Goodwill | 2,582 |
|
| Other non-current assets | — |
|
| Total liabilities | (3,457 | ) |
|
| | | | | | | |
| | Three Months Ended
June 30, | | Nine Months Ended
June 30, |
| | 2020 | | 2020 |
| Total revenues | $ | 1,411 |
| | $ | 4,134 |
|
| Total operating expenses | (1,498 | ) | | (5,047 | ) |
| Loss from operations | $ | (87 | ) | | $ | (913 | ) |
Recent Accounting Pronouncements
In March 2020, the Financial Accounting Standards Board (“FASB”) issued ASU 2020-04, Reference Rate Reform (Topic 848): Facilitation of the Effects of Reference Rate Reform on Financial Reporting which provides optional expedients and exceptions for contracts, hedging relationships and other transactions that reference LIBOR or another reference rate expected to be discontinued because of reference rate reform, if certain criteria are met. ASU 2020-04 is effective immediately
and expires on December 21, 2022. The ASU allows eligible contracts that are modified to be accounted for as a continuation of those contracts, permits companies to preserve their hedging accounting during the transition period and enables companies to make a one-time election to transfer or sell held-to-maturity debt securities that are affected by rate reform. The Company is currently assessing the impact of adoption on the Company’s Unaudited Consolidated Financial Statements and related disclosures.
In March 2020, the FASB issued ASU 2020-03, Codification Improvements to Financial Instruments, which includes several amendments to clarify, conform or improve the Codification and make it easier to apply by eliminating inconsistencies and providing clarifications. The ASU includes seven different issues that describe the areas of improvement and the related amendments, which have various effective dates. The Company is currently assessing the impact of adoption on the Company’s Unaudited Consolidated Financial Statements and related disclosures.
In November 2018, the FASB issued ASU 2018-19, Codification Improvements to Topic 326, Financial Instruments—Credit Losses which clarifies that receivables from operating leases are accounted for using the lease guidance and not as financial instruments. ASU 2018-19 will be effective for the Company for the quarter ending December 31, 2020, with early adoption permitted. The Company is currently assessing the impact of adoption on the Company’s Unaudited Consolidated Financial Statements.
In November 2018, the FASB issued ASU 2018-18, Collaborative Arrangements (Topic 808) Clarifying the Interaction between Topic 808 and Topic 606, which clarifies that certain transactions between collaborative arrangement participants should be accounted for as revenue under Topic 606 when the collaborative arrangement participant is a customer in the context of a unit of account. In addition, unit-of-account guidance in Topic 808 was aligned with the guidance in Topic 606 (that is, a distinct good or service) when an entity is assessing whether the collaborative arrangement or a part of the arrangement is within the scope of Topic 606. ASU 2018-18 should be applied retrospectively to the date of initial adoption of Topic 606 and is effective for the Company for the quarter ending December 31, 2020, with early adoption permitted. The Company is currently assessing the impact of adoption on the Company’s Unaudited Consolidated Financial Statements.
In August 2018, the FASB issued ASU 2018-13, Fair Value Measurement (Subtopic 820): Disclosure Framework—Changes to the Disclosure Requirements for Fair Value Measurement, which modifies the disclosure requirements on fair value measurements. The amendments on changes in unrealized gains and losses, the range and weighted average of significant unobservable inputs used to develop Level 3 fair value measurements, and the narrative description of measurement uncertainty should be applied prospectively for only the most recent interim or annual period presented in the initial year of adoption. All other amendments should be applied retrospectively to all periods presented upon their effective date. ASU 2018-14 will be effective for the Company for the quarter ending December 31, 2020, with early adoption permitted. The Company is currently assessing the impact of adoption on the Company’s disclosures.
In June 2016, the FASB issued ASU 2016-13, Financial Instruments—Credit Losses (Topic 326): Measurement of Credit Losses on Financial Instruments, amended in November 2019 (ASU 2019-11 and 2019-10), which requires entities to use a new forward-looking “expected loss” model that reflects expected credit losses, including credit losses related to trade receivables, and requires consideration of a broader range of reasonable and supportable information to inform credit loss estimates which generally will result in the earlier recognition of allowances for losses. ASU 2016-13 will be effective for the Company for the quarter ending December 31, 2020. The Company is not expecting this ASU to have a significant impact on the Company’s Unaudited Consolidated Financial Statements given our current practices and history.
Accounting Pronouncements Recently Adopted
The Company adopted ASU 2019-12, Income Taxes (Topic 740): Simplifying the Accounting for Income Taxes, as of October 1, 2019, which simplifies the accounting for income taxes by removing certain exceptions and by clarifying and amending existing guidance in order to improve consistent application of and simplify GAAP for other areas of Topic 740. This adoption did not have an impact on the Company’s Unaudited Consolidated Financial Statements.
The Company adopted ASU 2018‑07, Compensation—Stock Compensation (Topic 718): Improvements to Nonemployee Share-Based Payment Accounting, as of October 1, 2019. ASU 2018-07 expands the scope of Topic 718 to include share-based payment transactions for acquiring goods and services from nonemployees. This adoption did not have an impact on the Company’s Unaudited Consolidated Financial Statements.
The Company adopted ASU 2017‑12, Derivatives and Hedging (Topic 815): Targeted Improvements to Accounting for Hedging Activities, as of October 1, 2019. ASU 2017-12 expands and refines hedge accounting for both nonfinancial and financial risk components and aligns the recognition and presentation of the effects of the hedging instrument and the hedged item in the financial statements and also made certain targeted improvements to simplify the application of hedge accounting guidance and ease the administrative burden of hedge documentation requirements and assessing hedge effectiveness. This adoption did not have a material impact on the Company’s Unaudited Consolidated Financial Statements.
The Company adopted ASU 2016-02, Leases (Topic 842), including associated ASUs related to Topic 842,as of October 1, 2019. ASU No. 2016-02 requires recognition of operating leases as lease assets and liabilities on the balance sheet, and disclosure of key information about leasing arrangements. Amendments to the standard were issued by the FASB in January, July and December 2018, and March 2019 including certain practical expedients, an amendment that provides an additional and optional transition method to adopt the standard at the adoption date and recognize a cumulative-effect adjustment to the opening balance of retained earnings in the period of adoption and certain narrow-scope improvements for lessors. The Company adopted this standard using a modified retrospective approach, applying the new standard to all leases existing at the date of initial adoption and the Company elected to apply the transition requirements at the October 1, 2019 effective date rather than the beginning of the earliest comparative period presented. As a result, the Company recorded a cumulative effect adjustment in the period of adoption, and prior periods were not restated and continue to be reported in accordance with historic accounting under ASC Topic No. 840. In addition, the Company has elected the package of practical expedients permitted under the transition guidance which does not require reassessment of prior conclusions related to contracts containing a lease, lease classification and initial direct lease costs. As an accounting policy election, the Company elected to exclude short-term leases (term of 12 months or less) from the balance sheet and accounts for non-lease and lease components separately for all asset classes. The following table summarizes the impact of adoption to the Consolidated Balance Sheet as of October 1, 2019:
|
| | | | | | | | | | | |
| | As Reported September 30, 2019 | | Impact of Adoption of ASU 2016-02 | | Updated October 1, 2019 |
| Assets | | | | | |
| Prepaid and other current assets | $ | 21,940 |
| | $ | (73 | ) | | $ | 21,867 |
|
| Total current assets | 637,293 |
| | (73 | ) | | 637,220 |
|
| Property, plant and equipment, net | 333,584 |
| | 2,812 |
| | 336,396 |
|
| Operating lease right-of-use assets, net | — |
| | 42,073 |
| | 42,073 |
|
| Total Assets | 1,737,848 |
| | 44,812 |
| | 1,782,660 |
|
| Liabilities | | | | | |
| Accrued expenses and other liabilities | 101,839 |
| | 13,596 |
| | 115,435 |
|
| Total current liabilities | 322,221 |
| | 13,596 |
| | 335,817 |
|
| Obligation under operating leases | — |
| | 29,308 |
| | 29,308 |
|
| Other non-current liabilities | 78,661 |
| | 3,245 |
| | 81,906 |
|
| Total non-current liabilities | 1,049,805 |
| | 32,553 |
| | 1,082,358 |
|
| Total liabilities | 1,372,026 |
| | 46,149 |
| | 1,418,175 |
|
| Shareholders' equity | | | | | |
| Retained deficit | (174,976 | ) | | (1,337 | ) | | (176,313 | ) |
| Total Evoqua Water Technologies Corp. equity | 362,759 |
| | (1,337 | ) | | 361,422 |
|
| Total shareholder's equity | 365,822 |
| | (1,337 | ) | | 364,485 |
|
| Total liabilities and shareholders' equity | $ | 1,737,848 |
| | $ | 44,812 |
| | $ | 1,782,660 |
|
3. Acquisitions and Divestitures
Acquisitions
Acquisitions support the Company’s strategy of delivering a broad solutions portfolio with robust technology across multiple geographies and end markets. The Company continues to evaluate potential strategic acquisitions of businesses, assets and product lines and believes that capex-like, tuck-in acquisitions present a key opportunity within its overall growth strategy.
On October 1, 2019, the Company acquired a 60% investment position in San Diego-based Frontier Water Systems, LLC (“Frontier”) for $11,160 cash paid at closing. During the third quarter of 2020, as a result of net working capital adjustments, the Company received $275 in cash from the sellers of Frontier, reducing the purchase price to $10,885. Frontier is a pioneer in the development of patented, engineered equipment packages for high-rate treatment and removal of selenium, nitrate and other metals from complex water systems. During the nine months ended June 30, 2020, the Company incurred approximately $424 in acquisition costs, which are included in General and administrative expenses. Frontier is part of the Integrated Solutions and Services segment.
The Company has entered into an agreement to purchase the remaining 40% interest in Frontier on or prior to March 30, 2024. This agreement (a) gives holders of the remaining 40% interest in Frontier (the “Minority Owners”) the right to sell to Evoqua up to approximately 10% of the outstanding equity in Frontier at a predetermined price, which right may be exercised by the Minority Owners between January 1, 2021 and February 28, 2021 (the “Option”), and (b) obligates the Company to purchase and the Minority Owners to sell all of the Minority Owners’ remaining interest in Frontier at the fair market value at the time of sale on or prior to March 30, 2024 (the “Purchase Right”). The Purchase Right may be exercised early by the Minority Owners. The agreement to purchase the remaining interest was determined to be financing due to the mandatory Purchase Right, as per ASC Topic 480, Distinguishing Liabilities From Equity, and as such, the Company has recognized a liability for the remaining 40% interest.
The value of the Option was determined to be $506 using a Black Scholes model, and is included within Accrued expenses and other liabilities on the Consolidated Balance Sheets.
The value of the Purchase Right was determined to be $6,661, and is included within Other non‑current liabilities on the Consolidated Balance Sheets, based upon the enterprise value of Frontier upon the acquisition date as per ASC Topic 480, Distinguishing Liabilities From Equity. Pursuant to ASC Topic 480, the Company determined that this should be recorded as a liability and should be recognized at the fair value at the time of inception, adjusted for any consideration or unstated rights or privileges. The liability will be subsequently measured at an amount that would be paid on the reporting date with any change in value from the previous reporting date recognized as interest cost.
The accounting for the acquisition has not yet been completed because the Company has not finalized the deferred tax accounting related to the purchase price allocation. The preliminary opening balance sheet for Frontier is summarized as follows:
|
| | | |
| Current assets | $ | 3,186 |
|
| Property, plant and equipment | 2,963 |
|
| Goodwill | 1,798 |
|
| Intangible assets | 11,571 |
|
| Total assets acquired | 19,518 |
|
| Liabilities related to Option and Purchase Right | (7,167 | ) |
| Other liabilities assumed | (1,466 | ) |
| Net assets acquired | $ | 10,885 |
|
Divestitures
On December 31, 2019, the Company completed the sale of the Memcor product line to DuPont de Nemours, Inc. (“DuPont”). The aggregate purchase price paid by DuPont in the Transaction was $110,000 in cash, subject to certain adjustments. Following adjustments for cash and net working capital, gross proceeds paid by DuPont were $131,011. The Company recognized a $49,000 net pre-tax benefit on the sale of the Memcor product line, net of $8,300 of discretionary
compensation payments to employees in connection with the transaction and $1,000 in transaction costs incurred in the three months ended December 31, 2019. As a result of net working capital adjustments, the Company recognized an additional $9,000 net pre-tax benefit in the three months ended March 31, 2020. The Company utilized $100,000 of the proceeds from the transaction to repay a portion of the Company’s First Lien Term Loans in January 2020.
4. Revenue
Revenue Recognition
The Company recognizes sales of products and services based on the five-step analysis of transactions as provided in Topic 606. For all contracts with customers, the Company first identifies the contract which usually is established when the customer’s purchase order is accepted or acknowledged. Next the Company identifies the performance obligations in the contract. A performance obligation is a promise in a contract to transfer a distinct good or service to the customer. The Company then determines the transaction price in the arrangement and allocates the transaction price to each performance obligation identified in the contract. The Company’s allocation of the transaction price to the performance obligations are based on the relative standalone selling prices for the goods and services contained in a particular performance obligation. The transaction price is adjusted for the Company’s estimate of variable consideration which may include discounts if the Company would fail to meet certain performance requirements, volume discounts or early payment discounts. To estimate variable consideration, the Company utilizes historical experience and known terms. Variable consideration in contracts for the three and sixnine months ended March 31,June 30, 2020 was insignificant.
For sales of aftermarket parts or products with a low level of customization and engineering time, the Company recognizes revenues at the time risks and rewards of ownership pass, which is generally when products are shipped or delivered to the customer as the Company has no obligation for installation. The Company considers shipping and handling services to be fulfillment activities and as such they do not represent separate performance obligations for revenue recognition. Sales of service arrangements are recognized as the services are performed.
For certain arrangements where there is significant customization to the product and for long-term construction-type sales contracts, revenue may be recognized over time. In these instances, revenue is recognized using a measure of progress that applies an input method based on costs incurred in relation to total estimated costs. These arrangements include large capital water treatment projects, systems and solutions for municipal and industrial applications. The nature of the contracts is generally fixed price with milestone billings. In order for revenue to be recognized over a period of time, the product must have no alternative use and the Company must have an enforceable right to payment for the performance completed to date, including a normal profit margin, in the event of termination for convenience. If these two criteria are not met, revenues from these contracts will not be recognized until construction is complete. Instead, revenues from these contracts will be recognized when construction is complete. Contract revenues and cost estimates are reviewed and revised quarterly at a minimum and the cumulative effect of such adjustments are recognized in current operations. The amount of such adjustments havehas not been material.
The Company has made accounting policy elections to exclude all taxes by governmental authorities from the measurement of the transaction price and that long-term construction-type sales contracts, or those contracts for products with significant customization that the total contract price is less than $100 will be recorded at the point in time when the construction is complete.
Performance Obligations
The Company elects to apply the practical expedient to exclude from this disclosure revenue related to performance obligations if the product has an alternative use and the Company does not have an enforceable right to payment for the performance completed to date, including a normal profit margin, in the event of termination for convenience. The Company maintains a backlog of confirmed orders of approximately $174,824$163,517 at March 31,June 30, 2020. This backlog represents the aggregate amount of the transaction price allocated to performance obligations that were unsatisfied or partially unsatisfied as of the end of the reporting period. The Company estimates that the majority of these performance obligations will be satisfied within the next twelve months.
The recording of assets recognized from the costs to obtain and fulfill customer contracts primarily relate to the deferral of sales commissions. The Company’s costs incurred to obtain or fulfill a contract with a customer are classified
as non-current assets and amortized to expense over the period of benefit of the related revenue. These costs are recorded within Cost of product sales and services. The amount of contract costs was insignificant at March 31,June 30, 2020.
The Company offers standard warranties that generally do not represent a separate performance obligation. In certain instances, a warranty is obtained separately from the original equipment sale or the warranty provides incremental services and as such is treated as a separate performance obligation.
Disaggregation of Revenue
In accordance with Topic 606, the Company disaggregates revenue from contracts with customers into source of revenue, reportable operating segment and geographical regions. The Company determined that disaggregating revenue into these categories meets the disclosure objective in Topic 606 which is to depict how the nature, amount, timing and uncertainty of revenue and cash flows are affected by economic factors.
Information regarding the source of revenues:
| | | | Three Months Ended
March 31, | | Six Months Ended
March 31, | Three Months Ended
June 30, | | Nine Months Ended
June 30, |
| | 2020 | | 2019 | | 2020 | | 2019 | 2020 | | 2019 | | 2020 | | 2019 |
| Revenue from contracts with customers recognized under Topic 606 | $ | 314,994 |
| | $ | 316,098 |
| | $ | 623,596 |
| | $ | 609,102 |
| $ | 310,525 |
| | $ | 325,009 |
| | $ | 934,121 |
| | $ | 934,111 |
|
| Other (1) | 36,669 |
| | 32,530 |
| | 74,172 |
| | 62,528 |
| 37,302 |
| | 35,334 |
| | 111,474 |
| | 97,862 |
|
| Total | $ | 351,663 |
| | $ | 348,628 |
| | $ | 697,768 |
| | $ | 671,630 |
| $ | 347,827 |
| | $ | 360,343 |
| | $ | 1,045,595 |
| | $ | 1,031,973 |
|
| |
| (1) | Other revenue relates to revenue recognized from Topic 842 (previously Topic 840), Leases, mainly attributable to long term rentals. |
Information regarding revenues disaggregated by source of revenue and segment is as follows:
| | | | Three Months Ended March 31, | Three Months Ended June 30, |
| | 2020 | | 2019 | 2020 | | 2019 |
| | Integrated Solutions and Services | | Applied Product Technologies | | Total | | Integrated Solutions and Services | | Applied Product Technologies | | Total | Integrated Solutions and Services | | Applied Product Technologies | | Total | | Integrated Solutions and Services | | Applied Product Technologies | | Total |
| Revenue from capital projects | $ | 66,092 |
| | $ | 75,214 |
| | $ | 141,306 |
| | $ | 57,631 |
| | $ | 76,271 |
| | $ | 133,902 |
| $ | 64,692 |
| | $ | 85,654 |
| | $ | 150,346 |
| | $ | 52,132 |
| | $ | 83,390 |
| | $ | 135,522 |
|
| Revenue from aftermarket | 31,901 |
| | 32,762 |
| | 64,663 |
| | 32,474 |
| | 40,492 |
| | 72,966 |
| 29,143 |
| | 28,086 |
| | 57,229 |
| | 29,968 |
| | 44,873 |
| | 74,841 |
|
| Revenue from service | 139,892 |
| | 5,802 |
| | 145,694 |
| | 136,759 |
| | 5,001 |
| | 141,760 |
| 134,876 |
| | 5,376 |
| | 140,252 |
| | 143,329 |
| | 6,651 |
| | 149,980 |
|
| Total | $ | 237,885 |
| | $ | 113,778 |
| | $ | 351,663 |
| | $ | 226,864 |
| | $ | 121,764 |
| | $ | 348,628 |
| $ | 228,711 |
| | $ | 119,116 |
| | $ | 347,827 |
| | $ | 225,429 |
| | $ | 134,914 |
| | $ | 360,343 |
|
| | | | Six Months Ended March 31, | Nine Months Ended June 30, |
| | 2020 | | 2019 | 2020 | | 2019 |
| | Integrated Solutions and Services | | Applied Product Technologies | | Total | | Integrated Solutions and Services | | Applied Product Technologies | | Total | Integrated Solutions and Services | | Applied Product Technologies | | Total | | Integrated Solutions and Services | | Applied Product Technologies | | Total |
| Revenue from capital projects | $ | 120,712 |
| | $ | 150,140 |
| | $ | 270,852 |
| | $ | 100,640 |
| | $ | 147,497 |
| | $ | 248,137 |
| $ | 185,404 |
| | $ | 235,794 |
| | $ | 421,198 |
| | $ | 152,772 |
| | $ | 230,887 |
| | $ | 383,659 |
|
| Revenue from aftermarket | 61,574 |
| | 70,103 |
| | 131,677 |
| | 63,270 |
| | 75,549 |
| | 138,819 |
| 90,717 |
| | 98,189 |
| | 188,906 |
| | 93,238 |
| | 120,422 |
| | 213,660 |
|
| Revenue from service | 283,737 |
| | 11,502 |
| | 295,239 |
| | 273,452 |
| | 11,222 |
| | 284,674 |
| 418,613 |
| | 16,878 |
| | 435,491 |
| | 416,781 |
| | 17,873 |
| | 434,654 |
|
| Total | $ | 466,023 |
| | $ | 231,745 |
| | $ | 697,768 |
| | $ | 437,362 |
| | $ | 234,268 |
| | $ | 671,630 |
| $ | 694,734 |
| | $ | 350,861 |
| | $ | 1,045,595 |
| | $ | 662,791 |
| | $ | 369,182 |
| | $ | 1,031,973 |
|
Information regarding revenues disaggregated by geographic area is as follows:
|
| | | | | | | | | | | | | | | |
| | Three Months Ended
June 30, | | Nine Months Ended
June 30, |
| | 2020 | | 2019 | | 2020 | | 2019 |
| United States | $ | 285,077 |
| | $ | 284,737 |
| | $ | 853,067 |
| | $ | 823,923 |
|
| Europe | 23,413 |
| | 26,677 |
| | 79,906 |
| | 71,235 |
|
| Asia | 19,806 |
| | 23,007 |
| | 51,268 |
| | 62,411 |
|
| Canada | 16,536 |
| | 20,873 |
| | 50,418 |
| | 58,836 |
|
| Australia | 2,995 |
| | 5,049 |
| | 10,936 |
| | 15,568 |
|
| Total | $ | 347,827 |
| | $ | 360,343 |
| | $ | 1,045,595 |
| | $ | 1,031,973 |
|
|
| | | | | | | | | | | | | | | |
| | Three Months Ended
March 31, | | Six Months Ended
March 31, |
| | 2020 | | 2019 | | 2020 | | 2019 |
| United States | $ | 290,273 |
| | $ | 280,468 |
| | $ | 567,990 |
| | $ | 539,186 |
|
| Europe | 30,381 |
| | 23,141 |
| | 56,493 |
| | 44,558 |
|
| Canada | 16,319 |
| | 17,660 |
| | 33,882 |
| | 37,963 |
|
| Asia | 12,720 |
| | 20,496 |
| | 31,462 |
| | 39,404 |
|
| Australia | 1,970 |
| | 6,863 |
| | 7,941 |
| | 10,519 |
|
| Total | $ | 351,663 |
| | $ | 348,628 |
| | $ | 697,768 |
| | $ | 671,630 |
|
Contract Balances
The Company performs its obligations under a contract with a customer by transferring products and/or services in exchange for consideration from the customer. The Company receives payments from customers based on a billing schedule as established in its contracts.
Contract assets relate to costs incurred to perform in advance of scheduled billings. Contract liabilities relate to payments received in advance of performance under the contracts. Change in contract assets and liabilities are due to the Company’s performance under the contract.
The tables below providesprovide a roll-forward of contract assets and contract liabilities balances for the periods presented:
| | | | Six Months Ended
March 31, | Nine Months Ended
June 30, |
| Contract assets (a) | 2020 | | 2019 | 2020 | | 2019 |
| Balance at beginning of period | $ | 73,467 |
| | $ | 69,147 |
| $ | 73,467 |
| | $ | 69,147 |
|
| Cumulative effect of adoption of new accounting standards | — |
| | (6,106 | ) | — |
| | (6,106 | ) |
| Recognized in current period | 172,228 |
| | 148,103 |
| 255,623 |
| | 225,341 |
|
| Reclassified to accounts receivable | (166,535 | ) | | (139,848 | ) | (253,199 | ) | | (218,433 | ) |
| Amounts related to sale of the Memcor product line | 2,710 |
| | — |
| 2,710 |
| | — |
|
| Foreign currency | (621 | ) | | 14 |
| (1,011 | ) | | 69 |
|
| Balance at end of period | $ | 81,249 |
| | $ | 71,310 |
| $ | 77,590 |
| | $ | 70,018 |
|
| |
| (a) | Excludes receivable balances which are disclosed on the Consolidated Balance Sheets. |
|
| | | | | | | |
| | Nine Months Ended
June 30, |
| Contract Liabilities | 2020 | | 2019 |
| Balance at beginning of period | $ | 39,051 |
| | $ | 17,652 |
|
| Cumulative effect of adoption of new accounting standards |
| | 1,773 |
|
| Recognized in current period | 241,468 |
| | 214,444 |
|
| Amounts in beginning balance reclassified to revenue | (37,508 | ) | | (20,127 | ) |
| Current period amounts reclassified to revenue | (210,985 | ) | | (181,266 | ) |
| Amounts related to sale of the Memcor product line | (700 | ) | | — |
|
| Foreign currency | (485 | ) | | (164 | ) |
| Balance at end of period | $ | 30,841 |
| | $ | 32,312 |
|
|
| | | | | | | |
| | Six Months Ended
March 31, |
| Contract Liabilities | 2020 | | 2019 |
| Balance at beginning of period | $ | 39,051 |
| | $ | 17,652 |
|
| Cumulative effect of adoption of new accounting standards | — |
| | 1,773 |
|
| Recognized in current period | 157,114 |
| | 135,532 |
|
| Amounts in beginning balance reclassified to revenue | (37,497 | ) | | (21,161 | ) |
| Current period amounts reclassified to revenue | (124,194 | ) | | (108,599 | ) |
| Amounts related to sale of the Memcor product line | (700 | ) | | — |
|
| Foreign currency | (83 | ) | | (129 | ) |
| Balance at end of period | $ | 33,691 |
| | $ | 25,068 |
|
5. Fair Value Measurements
As of March 31,June 30, 2020 and September 30, 2019, the fair values of cash and cash equivalents, accounts receivable and accounts payable approximate carrying values due to the short maturity of these items.
The Company measures the fair value of pension plan assets and liabilities, deferred compensation plan assets and liabilities on a recurring basis pursuant to ASC Topic No. 820, Fair Value Measurement. ASC Topic No. 820 establishes a three‑tier fair value hierarchy, which prioritizes the inputs used in measuring fair value. These tiers include:
Level 1: Quoted prices for identical instruments in active markets.
Level 2: Quoted prices for similar instruments in active markets; quoted prices for identical or similar instruments in markets that are not active; and model‑derived valuations whose inputs are observable or whose significant value driver is observable.
Level 3: Unobservable inputs in which little or no market data is available, therefore requiring an entity to develop its own assumptions.
The following table presents the Company’s financial assets and liabilities at fair value. The fair values related to the pension plan assets are determined using net asset value (“NAV”) as a practical expedient, or by information categorized in the fair value hierarchy level based on the inputs used to determine fair value. The reported carrying amounts of deferred compensation plan assets and liabilities and debt approximate their fair values. The Company uses interest rates and other relevant information generated by market transactions involving similar instruments to fair value these assets and liabilities, therefore all are classified as Level 2 within the valuation hierarchy.
|
| | | | | | | | | | | | | | | |
| | Net Asset Value | | Quoted Market
Prices in Active
Markets (Level 1) | | Significant Other
Observable Inputs
(Level 2) | | Significant
Unobservable Inputs
(Level 3) |
| As of June 30, 2020 | | | | | | | |
| Assets: | | | | | | | |
| Pension plan | | | | | | | |
| Cash | $ | — |
| | $ | 14,207 |
| | $ | — |
| | $ | — |
|
| Government Securities | 2,846 |
| | — |
| | — |
| | — |
|
| Liability Driven Investment | 5,603 |
| | — |
| | — |
| | — |
|
| Guernsey Unit Trust | 1,000 |
| | — |
| | — |
| | — |
|
| Global Absolute Return | 1,935 |
| | — |
| | — |
| | — |
|
| Deferred compensation plan assets | | | | | | | |
| Trust Assets | — |
| | 6 |
| | — |
| | — |
|
| Insurance | — |
| | — |
| | 18,654 |
| | — |
|
| Foreign currency forward contracts | — |
| | — |
| | 305 |
| | — |
|
| Liabilities: | | | | | | | |
| Pension plan | — |
| | — |
| | (43,981 | ) | | — |
|
| Deferred compensation plan liabilities | — |
| | — |
| | (19,960 | ) | | — |
|
| Long‑term debt | — |
| | — |
| | (854,885 | ) | | — |
|
| Interest rate swap | — |
| | — |
| | (3,258 | ) | | — |
|
| Foreign currency forward contracts | — |
| | — |
| | (411 | ) | | — |
|
| Earn-outs related to acquisitions | — |
| | — |
| | — |
| | (91 | ) |
| Option and Purchase Right | — |
| | — |
| | — |
| | (7,167 | ) |
| | | | | | | | |
| As of September 30, 2019 | | | | | | | |
| Assets: | | | | | | | |
| Pension plan | | | | | | | |
| Cash | $ | — |
| | $ | 14,607 |
| | $ | — |
| | $ | — |
|
| Government Securities | 4,703 |
| | — |
| | — |
| | — |
|
| Liability Driven Investment | 3,261 |
| | — |
| | — |
| | — |
|
| Guernsey Unit Trust | 997 |
| | — |
| | — |
| | — |
|
| Global Absolute Return | 1,957 |
| | — |
| | — |
| | — |
|
| Deferred compensation plan assets | | | | | | | |
| Trust Assets | — |
| | 16 |
| | — |
| | — |
|
| Insurance | — |
| | — |
| | 18,684 |
| | — |
|
| Interest rate cap | — |
| | — |
| | 19 |
| | — |
|
| Foreign currency forward contracts | — |
| | — |
| | 278 |
| | — |
|
| Liabilities: | | | | | | | |
| Pension plan | — |
| | — |
| | (42,948 | ) | | — |
|
| Deferred compensation plan liabilities | — |
| | — |
| | (21,318 | ) | | — |
|
| Long‑term debt | — |
| | — |
| | (979,357 | ) | | — |
|
| Foreign currency forward contracts | — |
| | — |
| | (154 | ) | | — |
|
| Earn-outs related to acquisitions | — |
| | — |
| | — |
| | (1,545 | ) |
|
| | | | | | | | | | | | | | | |
| | Net Asset Value | | Quoted Market
Prices in Active
Markets (Level 1) | | Significant Other
Observable Inputs
(Level 2) | | Significant
Unobservable Inputs
(Level 3) |
| As of March 31, 2020 | | | | | | | |
| Assets: | | | | | | | |
| Pension plan | | | | | | | |
| Cash | $ | — |
| | $ | 13,902 |
| | $ | — |
| | $ | — |
|
| Government Securities | 2,305 |
| | — |
| | — |
| | — |
|
| Liability Driven Investment | 5,232 |
| | — |
| | — |
| | — |
|
| Guernsey Unit Trust | 1,003 |
| | — |
| | — |
| | — |
|
| Global Absolute Return | 1,776 |
| | — |
| | — |
| | — |
|
| Deferred compensation plan assets | | | | | | | |
| Trust Assets | — |
| | 6 |
| | — |
| | — |
|
| Insurance | — |
| | — |
| | 18,877 |
| | — |
|
| Interest rate cap | — |
| | — |
| | 1 |
| | — |
|
| Foreign currency forward contracts | — |
| | — |
| | 405 |
| | — |
|
| Liabilities: | | | | | | | |
| Pension plan | — |
| | — |
| | (43,224 | ) | | — |
|
| Deferred compensation plan liabilities | — |
| | — |
| | (19,928 | ) | | — |
|
| Long‑term debt | — |
| | — |
| | (811,286 | ) | | — |
|
| Foreign currency forward contracts | — |
| | — |
| | (420 | ) | | — |
|
| Earn-outs related to acquisitions | — |
| | — |
| | — |
| | (91 | ) |
| Option and Purchase Right | — |
| | — |
| | — |
| | (7,167 | ) |
| | | | | | | | |
| As of September 30, 2019 | | | | | | | |
| Assets: | | | | | | | |
| Pension plan | | | | | | | |
| Cash | $ | — |
| | $ | 14,607 |
| | $ | — |
| | $ | — |
|
| Government Securities | 4,703 |
| | — |
| | — |
| | — |
|
| Liability Driven Investment | 3,261 |
| | — |
| | — |
| | — |
|
| Guernsey Unit Trust | 997 |
| | — |
| | — |
| | — |
|
| Global Absolute Return | 1,957 |
| | — |
| | — |
| | — |
|
| Deferred compensation plan assets | | | | | | | |
| Trust Assets | — |
| | 16 |
| | — |
| | — |
|
| Insurance | — |
| | — |
| | 18,684 |
| | — |
|
| Interest rate cap | — |
| | — |
| | 19 |
| | — |
|
| Foreign currency forward contracts | — |
| | — |
| | 278 |
| | — |
|
| Liabilities: | | | | | | | |
| Pension plan | — |
| | — |
| | (42,948 | ) | | — |
|
| Deferred compensation plan liabilities | — |
| | — |
| | (21,318 | ) | | — |
|
| Long‑term debt | — |
| | — |
| | (979,357 | ) | | — |
|
| Foreign currency forward contracts | — |
| | — |
| | (154 | ) | | — |
|
| Earn-outs related to acquisitions | — |
| | — |
| | — |
| | (1,545 | ) |
The pension plan assets and liabilities and deferred compensation plan assets and liabilities are included in Other non‑current assets and Other non‑current liabilities at March 31,June 30, 2020 and September 30, 2019.
The Company records contingent consideration arrangements at fair value on a recurring basis and the associated balances presented as of March 31,June 30, 2020 and September 30, 2019 are earn-outs related to acquisitions. The fair value of earn-outs related to acquisitions is based on significant unobservable inputs including the achievement of certain performance
metrics. Significant changes in these inputs would result in corresponding increases or decreases in the fair value of the earn-out each period until the related contingency has been resolved. Changes in the fair value of the contingent consideration obligations can result from adjustments in the probability of achieving future development steps, sales targets and profitability and are recorded in General and administrative expenses in the Unaudited Consolidated Statements of Operations.
A roll-forward of the activity in the Company’s fair value of earn-outs related to acquisitions is as follows:
| | | | Current Portion (1) | | Long-term Portion (2) | | Total | Current Portion (1) | | Long-term Portion (2) | | Total |
| Balance at September 30, 2019 | $ | 611 |
| | $ | 934 |
| | $ | 1,545 |
| $ | 611 |
| | $ | 934 |
| | $ | 1,545 |
|
| Payments | (187 | ) | | — |
| | (187 | ) | (187 | ) | | — |
| | (187 | ) |
| Fair value adjustment | (333 | ) | | (934 | ) | | (1,267 | ) | (333 | ) | | (934 | ) | | (1,267 | ) |
| Balance at March 31, 2020 | $ | 91 |
| | $ | — |
| | $ | 91 |
| |
| Balance at June 30, 2020 | | $ | 91 |
| | $ | — |
| | $ | 91 |
|
| |
| (1) | Included in Accrued expenses and other liabilities on the Consolidated Balance Sheets. |
| |
| (2) | Included in Other non‑current liabilities on the Consolidated Balance Sheets. |
Pursuant to the acquisition of Frontier, the Company recorded a liability for the Option and Purchase Right
to purchase the remaining 40% interest. The fair value of the options is based upon significant unobservable inputs including future earnings and other market factors. Significant changes in these inputs would result in corresponding increases or decreases in the fair value of the options each period until the purchase of the remaining 40% interest has occurred. Changes in the fair value can result from earnings achieved over the passage of time and will be recorded in Interest expense in the Unaudited Consolidated Statements of Operations. As of March 31,June 30, 2020, $506 is included in Accrued expenses and other liabilities related to the Option and $6,661 is included in Other non‑current liabilities related to the Purchase Right on the Consolidated Balance Sheets.
6. Accounts Receivable
Accounts receivable are summarized as follows:
|
| | | | | | | |
| | June 30,
2020 | | September 30,
2019 |
| Accounts receivable | $ | 247,478 |
| | $ | 262,491 |
|
| Allowance for doubtful accounts | (4,580 | ) | | (4,906 | ) |
| Receivables, net | $ | 242,898 |
| | $ | 257,585 |
|
|
| | | | | | | |
| | March 31,
2020 | | September 30,
2019 |
| Accounts receivable | $ | 248,248 |
| | $ | 262,491 |
|
| Allowance for doubtful accounts | (4,830 | ) | | (4,906 | ) |
| Receivables, net | $ | 243,418 |
| | $ | 257,585 |
|
7. Inventories
The major classes of Inventories, net are as follows:
|
| | | | | | | |
| | June 30,
2020 | | September 30,
2019 |
| Raw materials and supplies | $ | 86,604 |
| | $ | 75,223 |
|
| Work in progress | 19,544 |
| | 14,741 |
|
| Finished goods and products held for resale | 62,380 |
| | 58,223 |
|
| Costs of unbilled projects | 4,553 |
| | 2,347 |
|
| Reserves for excess and obsolete | (13,635 | ) | | (13,370 | ) |
| Inventories, net | $ | 159,446 |
| | $ | 137,164 |
|
|
| | | | | | | |
| | March 31,
2020 | | September 30,
2019 |
| Raw materials and supplies | $ | 78,434 |
| | $ | 75,223 |
|
| Work in progress | 18,115 |
| | 14,741 |
|
| Finished goods and products held for resale | 63,699 |
| | 58,223 |
|
| Costs of unbilled projects | 4,926 |
| | 2,347 |
|
| Reserves for excess and obsolete | (13,747 | ) | | (13,370 | ) |
| Inventories, net | $ | 151,427 |
| | $ | 137,164 |
|
8. Property, Plant, and Equipment
Property, plant, and equipment consists of the following:
|
| | | | | | | |
| | June 30,
2020 | | September 30,
2019 |
| Machinery and equipment | $ | 341,606 |
| | $ | 316,390 |
|
| Rental equipment | 201,379 |
| | 172,534 |
|
| Land and buildings | 69,313 |
| | 64,165 |
|
| Construction in process | 54,975 |
| | 40,599 |
|
| | 667,273 |
| | 593,688 |
|
| Less: accumulated depreciation | (310,849 | ) | | (260,104 | ) |
| | $ | 356,424 |
| | $ | 333,584 |
|
|
| | | | | | | |
| | March 31,
2020 | | September 30,
2019 |
| Machinery and equipment | $ | 336,535 |
| | $ | 316,390 |
|
| Rental equipment | 188,054 |
| | 172,534 |
|
| Land and buildings | 68,560 |
| | 64,165 |
|
| Construction in process | 43,938 |
| | 40,599 |
|
| | 637,087 |
| | 593,688 |
|
| Less: accumulated depreciation | (292,169 | ) | | (260,104 | ) |
| | $ | 344,918 |
| | $ | 333,584 |
|
The Company entered into secured financing agreements that require providing a security interest in specified equipment. As of March 31,June 30, 2020 and September 30, 2019, the gross and net amounts of those assets are as follows:
|
| | | | | | | | | | | | | | | |
| | June 30,
2020 | | September 30,
2019 |
| | Gross | | Net | | Gross | | Net |
| Machinery and equipment | $ | 59,307 |
| | $ | 49,959 |
| | $ | 48,288 |
| | $ | 42,162 |
|
| Construction in process | 3,724 |
| | 3,724 |
| | 2,531 |
| | 2,531 |
|
| | $ | 63,031 |
| | $ | 53,683 |
| | $ | 50,819 |
| | $ | 44,693 |
|
|
| | | | | | | | | | | | | | | |
| | March 31,
2020 | | September 30,
2019 |
| | Gross | | Net | | Gross | | Net |
| Machinery and equipment | $ | 55,691 |
| | $ | 47,566 |
| | $ | 48,288 |
| | $ | 42,162 |
|
| Construction in process | 4,239 |
| | 4,239 |
| | 2,531 |
| | 2,531 |
|
| | $ | 59,930 |
| | $ | 51,805 |
| | $ | 50,819 |
| | $ | 44,693 |
|
Depreciation expense and maintenance and repairs expense for the three and sixnine months ended March 31,June 30, 2020 and 2019 were as follows:
|
| | | | | | | | | | | | | | | |
| | Three Months Ended
June 30, | | Nine Months Ended
June 30, |
| | 2020 | | 2019 | | 2020 | | 2019 |
| Depreciation expense | $ | 18,992 |
| | $ | 15,979 |
| | $ | 54,480 |
| | $ | 47,334 |
|
| Maintenance and repair expense | 4,601 |
| | 6,144 |
| | 15,915 |
| | 18,192 |
|
|
| | | | | | | | | | | | | | | |
| | Three Months Ended
March 31, | | Six Months Ended
March 31, |
| | 2020 | | 2019 | | 2020 | | 2019 |
| Depreciation expense | $ | 18,185 |
| | $ | 16,146 |
| | $ | 35,488 |
| | $ | 31,355 |
|
| Maintenance and repair expense | 5,249 |
| | 5,891 |
| | 11,314 |
| | 12,048 |
|
9. Goodwill
Changes in the carrying amount of goodwill are as follows:
|
| | | | | | | | | | | |
| | Integrated Solutions and Services | | Applied Product Technologies | | Total |
| Balance at September 30, 2019 | $ | 222,013 |
| | $ | 170,877 |
| | $ | 392,890 |
|
| Business combinations and divestitures | 1,798 |
| | (405 | ) | | 1,393 |
|
| Measurement period adjustment | — |
| | 298 |
| | 298 |
|
| Foreign currency translation | (1,142 | ) | | (12 | ) | | (1,154 | ) |
| Balance at June 30, 2020 | $ | 222,669 |
| | $ | 170,758 |
| | $ | 393,427 |
|
|
| | | | | | | | | | | |
| | Integrated Solutions and Services | | Applied Product Technologies | | Total |
| Balance at September 30, 2019 | $ | 222,013 |
| | $ | 170,877 |
| | $ | 392,890 |
|
| Business combinations and divestitures | 1,466 |
| | (405 | ) | | 1,061 |
|
| Measurement period adjustment | — |
| | 298 |
| | 298 |
|
| Foreign currency translation | (2,884 | ) | | (2,484 | ) | | (5,368 | ) |
| Balance at March 31, 2020 | $ | 220,595 |
| | $ | 168,286 |
| | $ | 388,881 |
|
As of March 31,June 30, 2020 and September 30, 2019, $151,958$152,024 and $151,880, respectively, of goodwill was deductible for tax purposes.
10. Debt
Long‑term debt consists of the following:
|
| | | | | | | |
| | June 30,
2020 | | September 30,
2019 |
| First Lien Term Loan, due December 20, 2024 | $ | 821,646 |
| | $ | 928,753 |
|
| Revolving Credit Facility | — |
| | — |
|
| Equipment Financing, due June 30, 2024 to July 5, 2029, interest rates ranging from 3.84% to 8.07% | 56,003 |
| | 45,960 |
|
| Notes Payable, due July 31, 2023 | 661 |
| | 807 |
|
| Mortgage, due June 30, 2028 | 1,617 |
| | 1,635 |
|
| Total debt | 879,927 |
| | 977,155 |
|
| Less unamortized discount and lender fees | (9,957 | ) | | (12,138 | ) |
| Total net debt | 869,970 |
| | 965,017 |
|
| Less current portion | (14,611 | ) | | (13,418 | ) |
| Total long‑term debt | $ | 855,359 |
| | $ | 951,599 |
|
|
| | | | | | | |
| | March 31,
2020 | | September 30,
2019 |
| First Lien Term Loan, due December 20, 2024 | $ | 824,015 |
| | $ | 928,753 |
|
| Revolving Credit Facility | — |
| | — |
|
| Equipment Financing, due June 30, 2024 to July 5, 2029, interest rates ranging from 4.32% to 8.07% | 53,192 |
| | 45,960 |
|
| Notes Payable, due July 31, 2023 | 711 |
| | 807 |
|
| Mortgage, due June 30, 2028 | 1,602 |
| | 1,635 |
|
| Total debt | 879,520 |
| | 977,155 |
|
| Less unamortized discount and lender fees | (10,298 | ) | | (12,138 | ) |
| Total net debt | 869,222 |
| | 965,017 |
|
| Less current portion | (14,241 | ) | | (13,418 | ) |
| Total long‑term debt | $ | 854,981 |
| | $ | 951,599 |
|
Term Facilities and Revolving Credit Facility
On January 15, 2014, EWT Holdings III Corp. (“EWT III”), an indirect wholly-owned subsidiary of the Company, entered into a First Lien Credit Agreement and Second Lien Credit Agreement (the “Credit Agreements” or, after the prepayment and termination of the Second Lien Credit Agreement, the “First Lien Credit Agreement” or “Credit Agreement”) among EWT III, EWT Holdings II Corp., the lenders party thereto and Credit Suisse AG as administrative agent and collateral agent.
In January 2020, the Company utilized $100,000 of the proceeds from the sale of the Memcor product line to repay a portion of the Company’s First Lien Term Loans. As a result of the prepayment, the Company wrote off $1,795 of deferred financing fees during the three months ended March 31, 2020. On February 18, 2020, EWT III entered into Amendment No. 7 (the “Amendment”), among EWT III, as the borrower, EWT Holdings II Corp,Corp., as parent guarantor, the subsidiary guarantors party thereto, the financial institutions party thereto, and Credit Suisse AG, as administrative agent and collateral agent, relating to the Credit Agreement. As a result of the Amendment, the Company incurred $760 of fees which were recorded as deferred financing fees on the Consolidated Balance Sheets. Prior to the Amendment, First Lien Term Loans in an aggregate principal amount of approximately $826,000 (the “Existing Term Loans”) were outstanding under the Credit Agreement. Pursuant to the Amendment, the Existing Term Loans were refinanced with the proceeds of the refinancing term loans. Additionally, the Amendment amended the Credit Agreement to, among other things:
| |
| (i) | reduce the interest rate spread applicable to term loans based on LIBOR from (A) 2.75% to 2.50% per annum during any period during which EWT III maintains a public corporate family rating better than or equal to B1 from Moody’s and B+ from SAP,S&P, in each case with a stable outlook (a “Ratings Condition Period”), and (B) 3.00% to 2.75% per annum for any period other than a Ratings Condition Period; |
| |
| (ii) | reduce the interest rate spread applicable to term loans based on the Base Rate from (A) 1.75% to 1.50% per annum during any Ratings Condition Period and (B) 2.00% to 1.75% per annum during any period other than a Ratings Condition Period; |
| |
| (iii) | remove the 1.00% floor for term loans based on LIBOR and the 2.00% floor for term loans based on the Base Rate; |
| |
| (iv) | schedule existing indebtedness and investments, allowing EWT III and its subsidiaries to incur incremental indebtedness and make incremental investments under the applicable baskets; |
| |
| (v) | increase the generally permitted investments basket; and |
| |
| (vi) | extend the 1.00% prepayment premium for refinancing in connection with certain repricing transactions through August 18, 2020. |
The Company makes quarterly principal payments of $2,369. At March 31,June 30, 2020, the interest rate on borrowings was 4.35%3.45%, comprised of 1.60%0.70% LIBOR plus the 2.75% spread.
Total deferred fees related to the First Lien Term Loan were $10,298$9,957 and $12,138, net of amortization, as of March 31,June 30, 2020 and September 30, 2019, respectively. These fees were included as a contra liability to debt on the Consolidated Balance Sheets.
The following summarizes the Company’s outstanding borrowings under the Revolver and outstanding letters of credit as of March 31,June 30, 2020 and September 30, 2019, respectively.
|
| | | | | | | |
| | June 30,
2020 | | September 30,
2019 |
| Borrowing availability under the Revolver | $ | 125,000 |
| | $ | 125,000 |
|
| Outstanding borrowings under the Revolver | — |
| | — |
|
| Outstanding letters of credit under the Revolver | 11,872 |
| | 12,956 |
|
| Unused amounts under the Revolver | $ | 113,128 |
| | $ | 112,044 |
|
| | | | |
| Additional letters of credit under a separate arrangement | $ | 51 |
| | $ | 204 |
|
|
| | | | | | | |
| | March 31,
2020 | | September 30,
2019 |
| Borrowing availability under the Revolver | $ | 125,000 |
| | $ | 125,000 |
|
| Outstanding borrowings under the Revolver | — |
| | — |
|
| Outstanding letters of credit under the Revolver | 11,972 |
| | 12,956 |
|
| Unused amounts under the Revolver | $ | 113,028 |
| | $ | 112,044 |
|
| | | | |
| Additional letters of credit under a separate arrangement | $ | 49 |
| | $ | 204 |
|
The First Lien Credit Agreement contains limitations on incremental borrowings, is subject to leverage ratios and allows for optional prepayments. Under certain circumstances, the Company may be required to remit excess cash flows as defined based upon exceeding certain leverage ratios. The Company did not exceed such ratios during the sixnine months ended March 31,June 30, 2020, does not anticipate exceeding such ratios during the year ending September 30, 2020, and therefore does not anticipate any additional repayments during the year ending September 30, 2020.
Repayment Schedule
Aggregate maturities of all long‑term debt, including current portion of long‑term debt and excluding finance lease obligations as of March 31,June 30, 2020, are presented below:
|
| | | |
| Fiscal Year | |
| Remainder of 2020 | $ | 3,638 |
|
| 2021 | 14,661 |
|
| 2022 | 14,915 |
|
| 2023 | 15,125 |
|
| 2024 | 15,051 |
|
| Thereafter | 816,537 |
|
| Total | $ | 879,927 |
|
|
| | | |
| Fiscal Year | |
| Remainder of 2020 | $ | 7,101 |
|
| 2021 | 14,338 |
|
| 2022 | 14,579 |
|
| 2023 | 14,774 |
|
| 2024 | 14,685 |
|
| Thereafter | 814,043 |
|
| Total | $ | 879,520 |
|
11. Derivative Financial Instruments
Interest Rate Risk Management
The Company is subject to market risk exposure arising from changes in interest rates on the senior secured credit facilities, which bear interest at rates that are indexed against LIBOR. The Company’s objectives in using interest rate derivatives are to add stability to interest expense and to mitigate its exposure to rising interest rates. To accomplish these objectives, the Company entered into an interest rate cap, designated as a cash flow hedge,swap during the third quarter of fiscal 2020 to mitigate risks associated with variable rate debt. The interest rate swap is effective June 30, 2020, has a term of five years to hedge the variability of interest payments on the first $500,000 of the Company’s senior secured debt and provides for a fixed rate of 0.5455%. The interest rate swap has been designated as a cash flow hedge and unrealized gains or losses, net of income tax, are recorded as a component of AOCI on the Consolidated Balance Sheets. As interest payments are made, the realized gain or loss on the payments are recorded in Interest expense on the Unaudited Consolidated Statements of Operations.
In addition, in the third quarter of fiscal 2020, the Company terminated the interest rate cap it had entered effective November 28, 2018. The LIBOR interest rate cap coverscovered a notional amount of $600,000 of the Company’s senior secured debt, iswas effective for a period of three years and hashad a strike rate of 3.5%. Interest rate caps designated as cash flow hedges involve the receipt of stipulated amounts from a counterparty if interest rates rise above the strike rate defined in the contract. The premium paid for the interest rate cap was $2,235 and iswas being amortized to interest expense over its three-year term usingof three years. As a result of the caplet method.termination, this derivative was de-designated from hedge accounting and the Company wrote off the remaining unamortized premium of $1,118 to interest expense. No additional fees were incurred. At March 31, 2020 and September 30, 2019, the unamortized premium was $1,242 and $1,614, respectively, of which $497 and $869 respectively, iswas included in Other non‑current assets and the remaining $745 iswas included in Prepaid and other current assets. The Company recorded $186$124 and $186$187 of premium
amortization to interest expense during the three months ended March 31,June 30, 2020 and 2019, respectively, and $372$496 and $248$435 of premium amortization to interest expense during the sixnine months ended March 31,June 30, 2020 and 2019, respectively.
Foreign Currency Risk Management
The Company’s functional currency is the U.S. dollar. By operating internationally, the Company is subject to foreign currency risk from transactions denominated in currencies other than the U.S. dollar (“foreign currencies”). To mitigate cross-currency transaction risk, the Company analyzes significant exposures where it has receipts or payments in a currency other than the functional currency of its operations, and from time to time may strategically enter into short-term foreign currency forward contracts to lock in some or all of the cash flows associated with these transactions. The Company is also subject to currency translation risk associated with converting the foreign operations’ financial statements into U.S. dollars. The Company uses foreign currency derivative contracts in order to manage the effect of exchange fluctuations on forecasted sales and purchases that are denominated in foreign currencies. To mitigate the impact of foreign exchange rate risk, the Company entered into a series of forward contracts designated as cash flow hedges. As of March 31,June 30, 2020, the notional amount of the forward contracts held to sell foreign currencies was $15,745.$17,866.
Credit Risk Management
The counterparties to the Company’s derivative contracts are highly ratedhighly-rated financial institutions. The Company regularly reviews the creditworthiness of its financial counterparties and fully expects the counterparties to perform under their respective agreements. The Company is not subject to any obligations to post collateral under derivative instrument contracts. The Company records all derivative instruments on a gross basis in the Consolidated Balance Sheets. Accordingly, there are no offsetting amounts that net assets against liabilities.
Derivatives Designated as Cash Flow Hedges
The Company accounts for derivatives and hedging activities in accordance with ASC Topic No. 815, “Derivatives and Hedging” (Topic No. 815). As required by Topic No. 815, the Company records all derivatives on the balance sheet at fair value and adjusts to market on a quarterly basis. The Company’s interest rate cap is valued based on readily observablereadily-observable market inputs, such as quotations on interest rates and LIBOR yield curves at the reporting date. The Company’s foreign currency forward contracts are valued based on quoted forward foreign exchange prices and spot rates at the reporting date. For a derivative that is designated as a cash flow hedge, changes in the fair value of the derivative are recognized in AOCI until the hedged item affects earnings. The Company does not use derivative financial instruments for trading or speculative purposes.
The following represents the fair value recorded for derivatives designated as cash flow hedges for the periods presented:
| | | | | Asset Derivatives | | Asset Derivatives |
| | Balance Sheet Location | | March 31,
2020 | | September 30,
2019 | Balance Sheet Location | | June 30, 2020 | | September 30,
2019 |
| Interest rate cap | Prepaid and other current assets | | $ | 1 |
| | $ | 19 |
| Prepaid and other current assets | | $ | — |
| | $ | 19 |
|
| Foreign currency forward contracts | Prepaid and other current assets | | 378 |
| | 269 |
| Prepaid and other current assets | | 278 |
| | 269 |
|
|
| | | | | | | | | |
| | | | Liability Derivative |
| | Balance Sheet Location | | June 30, 2020 | | September 30,
2019 |
| Interest rate swap | Accrued expenses and other current liabilities | | $ | 3,258 |
| | $ | — |
|
| Foreign currency forward contracts | Accrued expenses and other current liabilities | | 411 |
| | 154 |
|
|
| | | | | | | | | |
| | | | Liability Derivative |
| | Balance Sheet Location | | March 31,
2020 | | September 30,
2019 |
| Foreign currency forward contracts | Accrued expenses and other current liabilities | | $ | 420 |
| | $ | 154 |
|
The following represents the amount of (loss) gain recognized in AOCI (net of tax) during the periods presented:
|
| | | | | | | | | | | | | | | |
| | Three Months Ended
June 30, | | Nine Months Ended
June 30, |
| | 2020 | | 2019 | | 2020 | | 2019 |
| Interest rate swap | $ | (3,258 | ) | | $ | — |
| | $ | (3,258 | ) | | $ | — |
|
| Interest rate cap | (20 | ) | | (78 | ) | | (19 | ) | | 56 |
|
| Foreign currency forward contracts | 10 |
| | (173 | ) | | (150 | ) | | (487 | ) |
|
| | | | | | | | | | | | | | | |
| | Three Months Ended
March 31, | | Six Months Ended
March 31, |
| | 2020 | | 2019 | | 2020 | | 2019 |
| Interest rate cap | $ | 15 |
| | $ | (646 | ) | | $ | 1 |
| | $ | 134 |
|
| Foreign currency forward contracts | (179 | ) | | 20 |
| | (160 | ) | | (314 | ) |
The following represents the amount of (loss) gain on foreign currency forward contracts reclassified from AOCI into earnings during the periods presented:
|
| | | | | | | | | | | | | | | | |
| | | Three Months Ended
June 30, | | Nine Months Ended
June 30, |
| Location of (Loss) Gain | | 2020 | | 2019 | | 2020 | | 2019 |
| Cost of product sales and services | | $ | (2 | ) | | $ | (4 | ) | | $ | (8 | ) | | $ | (130 | ) |
| General and administrative expense | | 48 |
| | — |
| | 78 |
| | 1 |
|
| Selling and marketing expense | | — |
| | — |
| | 28 |
| | — |
|
| Research and development expense | | — |
| | (86 | ) | | — |
| | (87 | ) |
| | | $ | 46 |
| | $ | (90 | ) | | $ | 98 |
| | $ | (216 | ) |
|
| | | | | | | | | | | | | | | | |
| | | Three Months Ended
March 31, | | Six Months Ended
March 31, |
| Location of (Loss) Gain | | 2020 | | 2019 | | 2020 | | 2019 |
| Cost of product sales and services | | $ | (6 | ) | | $ | — |
| | $ | (6 | ) | | $ | (126 | ) |
| General and administrative expense | | (24 | ) | | 1 |
| | 30 |
| | 1 |
|
| Selling and marketing expense | | 28 |
| | — |
| | 28 |
| | — |
|
| Research and development expense | | — |
| | (16 | ) | | — |
| | (1 | ) |
| | | $ | (2 | ) | | $ | (15 | ) | | $ | 52 |
| | $ | (126 | ) |
Based on the fair value amounts of the Company’s cash flow hedges at March 31,June 30, 2020, the Company expects that approximately $96$187 of pre-tax net losses will be reclassified from AOCI into earnings during the next twelve months. The amount ultimately realized, however, will differ as exchange rates vary and the underlying contracts settle. In addition, $745 of caplet amortization will be amortized into interest expense during the next twelve months.
Derivatives Not Designated as Cash Flow Hedges
The following represents the fair value recorded for derivatives not designated as cash flow hedges for the periods presented:
|
| | | | | | | | | |
| | | | Asset Derivatives |
| | Balance Sheet Location | | June 30, 2020 | | September 30,
2019 |
| Foreign currency forward contracts | Prepaid and other current assets | | $ | 27 |
| | $ | 9 |
|
|
| | | | | | | | | |
| | | | Asset Derivatives |
| | Balance Sheet Location | | March 31,
2020 | | September 30,
2019 |
| Foreign currency forward contracts | Prepaid and other current assets | | $ | 27 |
| | $ | 9 |
|
12. Product Warranties
The Company accrues warranty obligations associated with certain products as revenue is recognized. Provisions for the warranty obligations are based upon historical experience of costs incurred for such obligations, adjusted for site‑specific risk factors, and, as necessary, for current conditions and factors. There are significant uncertainties and judgments involved in estimating warranty obligations, including changing product designs, differences in customer installation processes and future claims experience which may vary from historical claims experience.
A reconciliation of the activity related to the accrued warranty, including both the current and long‑term portions, is as follows:
|
| | | | | | | | | | | | | | | |
| | Current Product Warranties | | Non-Current Product Warranties |
| | Nine Months Ended
June 30, | | Nine Months Ended
June 30, |
| | 2020 | | 2019 | | 2020 | | 2019 |
| Balance at beginning of the period | $ | 4,922 |
| | $ | 8,907 |
| | $ | 2,332 |
| | $ | 3,360 |
|
| Warranty provision for sales | 2,496 |
| | 4,134 |
| | 481 |
| | 1,148 |
|
| Settlement of warranty claims | (3,243 | ) | | (4,896 | ) | | (1,298 | ) | | (509 | ) |
| Amounts related to sale of the Memcor product line | 795 |
| | — |
| | 136 |
| | — |
|
| Foreign currency translation and other | 276 |
| | 119 |
| | (51 | ) | | (258 | ) |
| Balance at end of the period | $ | 5,246 |
| | $ | 8,264 |
| | $ | 1,600 |
| | $ | 3,741 |
|
|
| | | | | | | | | | | | | | | |
| | Current Product Warranties | | Non-Current Product Warranties |
| | Six Months Ended
March 31, | | Six Months Ended
March 31, |
| | 2020 | | 2019 | | 2020 | | 2019 |
| Balance at beginning of the period | $ | 4,922 |
| | $ | 8,907 |
| | $ | 2,332 |
| | $ | 3,360 |
|
| Warranty provision for sales | 1,892 |
| | 3,218 |
| | 62 |
| | 954 |
|
| Settlement of warranty claims | (2,567 | ) | | (3,304 | ) | | (1,248 | ) | | (241 | ) |
| Amounts related to sale of the Memcor product line | 795 |
| | — |
| | 135 |
| | — |
|
| Foreign currency translation and other | 65 |
| | (21 | ) | | (120 | ) | | (71 | ) |
| Balance at end of the period | $ | 5,107 |
| | $ | 8,800 |
| | $ | 1,161 |
| | $ | 4,002 |
|
13. Restructuring and Related Charges
To better align its resources with its growth strategies and reduce the cost structure, the Company commits to various restructuring plans as necessary. The Company has undertaken various restructuring initiatives, including the wind-down of the Company’s operations in Italy, restructuring of the Company’s operations in Australia, consolidation of functional support structures on a global basis, and consolidation of the Singaporean research and development center.
On October 30, 2018, the Company announced a transition from a three-segment3-segment structure to a two-segment2-segment operating model designed to better serve the needs of customers worldwide. This new structure was effective October 1, 2018 and combined the Municipal services business with the former Industrial segment into a new segment, Integrated Solutions and Services, a group entirely focused on engaging directly with end users. The former Products segment and Municipal products businesses have been combined into a new segment, Applied Product Technologies, which is focused on developing product platforms to be sold primarily through third partythird-party channels. The Company expects to incur up to $2,000$1,500 of cash costs throughexpense during the remainder of fiscal 2020 as a resultfinal phase of this transition related to other non-employee related business optimizations.transition.
Beginning in the second quarter of fiscal 2020, the Company undertook activities to reduce the cost structure and rationalize location footprint following the sale of the Memcor product line. The Company currently expects to incur approximately $3,000 to $5,000 of additional costs related to these initiatives through the remainder of fiscal 2020 relatedand is currently evaluating additional actions that could extend to these initiatives.the following fiscal year.
The table below sets forth the amounts accrued for the restructuring components and related activity:
|
| | | | | | | |
| | Nine Months Ended
June 30, |
| | 2020 | | 2019 |
| Balance at beginning of the period | $ | 655 |
| | $ | 710 |
|
| Restructuring charges following the sale of the Memcor product line | 4,758 |
| | — |
|
| Restructuring charges related to two-segment realignment | 1,866 |
| | 9,274 |
|
| Restructuring charges related to other initiatives | 1,141 |
| | 2,086 |
|
| Write off charge and other non‑cash activity | (62 | ) | | (520) |
|
| Cash payments | (7,314) |
| | (9,830) |
|
| Other adjustments | — |
| | (76) |
|
| Balance at end of the period | $ | 1,044 |
| | $ | 1,644 |
|
|
| | | | | | | |
| | Six Months Ended
March 31, |
| | 2020 | | 2019 |
| Balance at beginning of the period | $ | 655 |
| | $ | 710 |
|
| Restructuring charges following the sale of the Memcor product line | 3,659 |
| | — |
|
| Restructuring charges related to two-segment realignment | 1,233 |
| | 7,046 |
|
| Restructuring charges related to other initiatives | 780 |
| | 1,111 |
|
| Write off charge and other non‑cash activity | (62 | ) | | (449) |
|
| Cash payments | (5,831) |
| | (5,997) |
|
| Other adjustments | — |
| | (72) |
|
| Balance at end of the period | $ | 434 |
| | $ | 2,349 |
|
The balances for accrued restructuring liabilities at March 31,June 30, 2020 and September 30, 2019, are recorded in Accrued expenses and other liabilities on the Consolidated Balance Sheets. Restructuring charges primarily represent
severance charges, certain non-cash charges and consulting fees. The Company expects to pay the remaining amounts accrued as of March 31,June 30, 2020 during the remainder of fiscal 2020.
The table below sets forth the location of amounts recorded above on the Unaudited Consolidated Statements of Operations:
|
| | | | | | | |
| | Nine Months Ended
June 30, |
| | 2020 | | 2019 |
| Cost of product sales and services | $ | 5,198 |
| | $ | 4,912 |
|
| General and administrative expense | 2,310 |
| | 4,929 |
|
| Sales and marketing expense | 173 |
| | 891 |
|
| Research and development expense | 22 |
| | 108 |
|
| $ | 7,703 |
| | $ | 10,840 |
|
|
| | | | | | | |
| | Six Months Ended
March 31, |
| | 2020 | | 2019 |
| Cost of product sales and services | $ | 3,765 |
| | $ | 3,316 |
|
| General and administrative expense | 1,760 |
| | 3,634 |
|
| Sales and marketing expense | 62 |
| | 648 |
|
| Research and development expense | 23 |
| | 110 |
|
| $ | 5,610 |
| | $ | 7,708 |
|
The Company continues to evaluate restructuring activities that may result in additional charges in the future.
14. Employee Benefit Plans
The Company maintains multiple employee benefit plans.
Certain of the Company’s employees in the UK were participants in a Siemens defined benefit plan established for employees of a UK-based operation acquired by Siemens in 2004. The plan was frozen with respect to future service credits for active employees, however the benefit formula recognized future compensation increases. The Company agreed to establish a replacement defined benefit plan, with the assets of the Siemens scheme transferring to the new scheme on April 1, 2015.
The Company’s employees in Germany also participate in a defined benefit plan. Assets equaling the plan’s accumulated benefit obligation were transferred to a German defined benefit plan sponsored by the Company upon the acquisition of EWT from Siemens. The German entity also sponsors a defined benefit plan for a small group of employees located in France.
The components of net periodic benefit cost for the plans were as follows:
|
| | | | | | | | | | | | | | | |
| | Three Months Ended
June 30, | | Nine Months Ended
June 30, |
| | 2020 | | 2019 | | 2020 | | 2019 |
| Service cost | $ | 259 |
| | $ | 214 |
| | $ | 779 |
| | $ | 648 |
|
| Interest cost | 67 |
| | 118 |
| | 203 |
| | 357 |
|
| Expected return on plan assets | (30 | ) | | (30 | ) | | (89 | ) | | (90 | ) |
| Amortization of actuarial losses | 235 |
| | 95 |
| | 706 |
| | 288 |
|
| Pension expense for defined benefit plans | $ | 531 |
| | $ | 397 |
| | $ | 1,599 |
| | $ | 1,203 |
|
|
| | | | | | | | | | | | | | | |
| | Three Months Ended
March 31, | | Six Months Ended
March 31, |
| | 2020 | | 2019 | | 2020 | | 2019 |
| Service cost | $ | 259 |
| | $ | 217 |
| | $ | 520 |
| | $ | 434 |
|
| Interest cost | 68 |
| | 120 |
| | 136 |
| | 239 |
|
| Expected return on plan assets | (29 | ) | | (30 | ) | | (59 | ) | | (60 | ) |
| Amortization of actuarial losses | 235 |
| | 97 |
| | 471 |
| | 193 |
|
| Pension expense for defined benefit plans | $ | 533 |
| | $ | 404 |
| | $ | 1,068 |
| | $ | 806 |
|
The components of pension expense, other than the service cost component which is included in General and administrative expense, are included in the line item Other operating expense in the Unaudited Consolidated Statements of Operations.
15. Income Taxes
The income tax provision for interim periods is comprised of tax on ordinary income (loss) provided at the most recent projected annual effective tax rate (“PAETR”), adjusted for the tax effect of discrete items. Management estimates the PAETR each quarter based on the forecasted annual pretax income or (loss). The Company is required to reduce deferred tax assets by a valuation allowance if, based on all available evidence, it is considered more likely than not that some portion
or all of the benefit of the deferred tax assets will not be realized in future periods. The Company also records the income tax impact of certain discrete, unusual or infrequently occurring items including changes in judgment about valuation allowances and effects of changes in tax laws or rates, in the interim period in which they occur.
When a company maintains a valuation allowance in a particular jurisdiction, no net deferred income tax expense or (benefit) will typically be provided. Jurisdictions with projected income that maintain a valuation allowance typically will form part of the PAETR calculation discussed above. However, jurisdictions with a projected loss for the year that maintain a valuation allowance are excluded from the PAETR calculation. Instead, the income tax for these jurisdictions is computed separately.
The actual year-to-date income tax expense (benefit) is the product of the most current PAETR and the actual year-to-date pretax income (loss) adjusted for any discrete tax items. The income tax expense (benefit) for a particular quarter, except for the first quarter, is the difference between the year-to-date calculation of income tax expense (benefit) and the year-to-date calculation for the prior quarter. Items unrelated to current period ordinary income or (loss) are recognized entirely in the period identified as a discrete item of tax. Discrete items generally relate to changes in tax laws, adjustments to prior period’s actual liability determined upon filing tax returns, and adjustments to previously recorded reserves for uncertain tax positions, initially recording or fully reversing valuation allowances. The inclusion of discrete items in a particular quarter can cause the actual effective rate for that quarter to vary significantly from the PAETR.
Therefore, the actual effective income tax rate for a particular quarter can vary significantly based upon the jurisdictional mix and timing of actual earnings compared to projected annual earnings, permanent items, earnings for those jurisdictions that maintain a valuation allowance, tax associated with jurisdictions excluded from the PAETR calculation and discrete items.
Annual Effective Tax Rate
The PAETR, which excludes the impact of discrete items, was 4.5%3.9% and 48.8%38.9% as of the sixnine months ended March 31,June 30, 2020 and 2019, respectively. For the sixnine months ended March 31,June 30, 2020, the PAETR of 4.5%3.9% was lower than the U.S federal statutory rate of 21.0% primarily due to the gain on the sale of the Memcor product line, the U.S. valuation allowance provided on U.S. deferred tax assets as well as the impact of deferred tax liabilities related to indefinite lived intangibles, a portion of which were reversed in relation to the sale of the Memcor product line.
The Company continues to maintain a full valuation on U.S. federal and state net deferred tax assets (excluding the tax effects of deferred tax liabilities associated with indefinite lived intangibles) for the year ending September 30, 2020 as a result of pretax losses incurred since the Company’s inception in early 2014. The Company reported positive pre-tax earnings for the first time in 2017 and is projecting positive pre-tax earnings in 2020, however, the Company generated pre-tax losses in all other years.years and was in a three-year cumulative loss position at September 30, 2019. The Company believes it is prudent to retain a valuation allowance until a more consistent pattern of earnings is established and net operating loss carryforwards begin to be utilized.
Prior and Current Period Tax Expense
For the three months ended March 31,June 30, 2020, the Company recognized an income tax benefitexpense of $7$740 on pretax income of $7,903.$22,581. The rate of 0.09%3.3% differed from the U.S. statutory rate of 21.0%21% principally due to the favorable impact to the PAETR of the gain on the sale of the Memcor product line which did not generate significant tax expense due to the combination of the U.S. valuation allowance and favorable foreign tax regimes, as well as the favorable impact of the reversal of a portion of deferred tax liabilities related to indefinite lived intangibles.
For the three months ended March 31,June 30, 2019, the Company recognized an income tax benefitexpense of $4,579$7,959 on a pretax lossincome of $3,006. Discrete$12,249. The rate of 65% differed from the U.S. statutory rate of 21% principally due to lower forecasted earnings in the U.S. due to restructuring initiatives for which no tax benefit will be realized, the impact of deferred tax liabilities related to indefinite lived intangibles as well as discrete items during the period related to the adjustment process for the quarter were not material.difference between actual tax results per tax returns filed versus those expected from the prior year tax provision.
For the sixnine months ended March 31,June 30, 2020, the Company recognized income tax expense of $2,596$3,336 on pretax income of $64,012.$86,593. The rate of 4.06%3.9% differed from the statutory rate of 21.0%21% principally due to the gain on the sale of the Memcor product line which did not generate significant tax expense due to the combination of the U.S. valuation allowance and favorable foreign tax regimes, as well as the favorable impact of the reversal of a portion of deferred tax liabilities related to indefinite lived intangibles.
For the sixnine months ended March 31,June 30, 2019, the Company recognized an income tax benefit of $9,093$1,134 on a pretax loss of $23,808.$11,559. The rate of 38.2%9.8% differed from the statutory rate of 21% principally due to the benefit on an overall year-to-date loss offset by higher forecasted earnings in certain non-U.S. jurisdictions that have a higher statutory tax rate than the U.S. as well as the impact of deferred tax liabilities related to indefinite lived intangibles.
At March 31,June 30, 2020, the Company had gross unrecognized tax benefits of $1,309.$1,313.
On March 27, 2020, The Coronavirus Aid, Relief, and Economic Security (CARES) Act (the “CARES Act”) was passed in response to the COVID-19 pandemic. Provisions of the CARES Act adjust elements of the TCJA,Tax Cuts and Jobs Act (“TCJA”), including net operating loss (“NOL”) modifications, a relaxation of the limitation on interest deductions, and modification of the credits for prior year minimum tax liability.
The CARES Act accelerates the ability of companies to recover the alternative minimum tax (“AMT”) credits by permitting immediate refund claims.
The TCJA subjected net operating losses arising in tax years beginning after December 31, 2017 to a taxable income limitation and eliminated the ability to carry these net operating losses back to a prior tax year. The CARES Act modified these rules and provides that NOLs arising in a tax year beginning after December 31, 2017 and ending before January 1, 2021 can be carried back five years. Additionally, the taxable income limitation is temporarily suspended for tax years beginning before January 1, 2021.
The TCJA limited the business interest expense deduction to 30% of adjusted taxable income (“ATI”) starting with the 2018 tax years. The CARES Act modified the TCJA limitations for business interest expense for 2019 and 2020 by increasing the limitation to 50% of ATI. Further, for the tax year 2020, the Company may use either the 2019 or 2020 ATI for purposes of determining deductible business interest expense.
The CARES Act did not have an impact on the Company’s Unaudited Consolidated Financial Statements.
16. Share-Based Compensation
The Company designs equity compensation plans to attract and retain employees while also aligning employees’ interests with the interests of the Company’s shareholders. In addition, members of the Company’s Board of Directors (the “Board”) participate in equity compensation plans in connection with their service on the Company’s Board.
The Company established the Evoqua Water Technologies Corp. Stock Option Plan (the “Stock Option Plan”) shortly after the acquisition date of January 16, 2014. The plan allows certain management employees and the Board to purchase shares in Evoqua Water Technologies Corp. Under the Stock Option Plan, the number of shares available for award was 11,083. As of March 31,June 30, 2020, there were approximately 1,704 shares available for future grants, however, the Company does not currently intend to make additional grants under the Stock Option Plan.
In connection with the IPO, the Board adopted, and the Company’s shareholders approved, the Evoqua Water Technologies Corp. 2017 Equity Incentive Plan (or the “Equity Incentive Plan”), under which equity awards may be granted in the form of options, restricted stock, restricted stock units, stock appreciation rights, dividend equivalent rights, share awards and performance-based awards (including performance share units and performance-based restricted stock). Upon adoption of the Equity Incentive Plan, 5,100 shares of common stock of the Company were reserved for issuance thereunder. On February 18, 2020, the Company’s shareholders approved the amendment and restatement of the Equity Incentive Plan in order to increase the number of shares of common stock reserved for issuance thereunder by 5,000 shares and incorporate other changes. As of March 31,June 30, 2020, there were approximately 5,9315,963 shares available for grants under the Equity Incentive Plan.
In addition to the establishment of the Equity Incentive Plan, in connection with the IPO, the Company entered into restricted stock unit (“RSU”) agreements with each of the executive officers and certain other key members of management. Pursuant to the RSU agreements, 1,197 stock-settled RSUs were granted, the aggregate value of which equals $25,000. The RSUs vested and settled in full upon the second anniversary of the IPO on November 2, 2019, resulting in the issuance of 1,159 shares, 419 of which were deposited into treasury in satisfaction of withholding tax obligations resulting from the vesting of the RSUs.
Option awards are granted at various times during the year, vest ratably at 25% per year, and are exercisable at the time of vesting. The options granted have a ten-year contractual term.term of ten years.
A summary of the stock option activity as of March 31,June 30, 2020 is presented below:
|
| | | | | | | | | | | | |
| (In thousands, except per share amounts) | Options | | Weighted Average Exercise Price/Share | | Weighted Average Remaining Contractual Term | | Aggregate Intrinsic Value |
| Outstanding at September 30, 2019 | 8,619 |
| | $ | 8.15 |
| | 6.3 years | | $ | 80,826 |
|
| Granted | 800 |
| | 23.52 |
| | | |
|
|
| Exercised | (1,711 | ) | | 5.61 |
| | | |
|
|
| Cancelled | (5 | ) | | 20.50 |
| | | | |
| Forfeited | (106 | ) | | 15.05 |
| | | |
|
|
| Outstanding at June 30, 2020 | 7,597 |
| | $ | 10.24 |
| | 6.2 years | | $ | 69,871 |
|
| Options exercisable at June 30, 2020 | 5,294 |
| | $ | 6.92 |
| | 5.1 years | | $ | 63,047 |
|
| Options vested and expected to vest at June 30, 2020 | 7,521 |
| | $ | 10.13 |
| | 6.2 years | | $ | 69,763 |
|
|
| | | | | | | | | | | | |
| (In thousands, except per share amounts) | Options | | Weighted Average Exercise Price/Share | | Weighted Average Remaining Contractual Term | | Aggregate Intrinsic Value |
| Outstanding at September 30, 2019 | 8,619 |
| | $ | 8.15 |
| | 6.3 years | | $ | 80,826 |
|
| Granted | 793 |
| | 23.60 |
| | | |
|
|
| Exercised | (1,461 | ) | | 5.70 |
| | | |
|
|
| Cancelled | (2 | ) | | 20.88 |
| | | | |
| Forfeited | (64 | ) | | 15.4 |
| | | |
|
|
| Outstanding at March 31, 2020 | 7,885 |
| | $ | 10.1 |
| | 6.3 years | | $ | 30,330 |
|
| Options exercisable at March 31, 2020 | 5,522 |
| | $ | 6.83 |
| | 5.3 years | | $ | 29,445 |
|
| Options vested and expected to vest at March 31, 2020 | 7,790 |
| | $ | 9.96 |
| | 6.3 years | | $ | 30,324 |
|
The total intrinsic value of options exercised (which is the amount by which the stock price exceeded the exercise price of the options on the date of exercise) during the sixnine months ended March 31,June 30, 2020 was $22,608.$26,051.
A summary of the status of the Company's non-vested stock options as of and for the sixnine months ended March 31,June 30, 2020 is presented below.
| | | (In thousands, except per share amounts) | Shares | | Weighted Average Grant Date Fair Value/Share | Shares | | Weighted Average Grant Date Fair Value/Share |
| Nonvested at beginning of period | 2,379 |
| | $ | 4.96 |
| 2,379 |
| | $ | 4.96 |
|
| Granted | 793 |
| | 6.05 |
| 800 |
| | 6.06 |
|
| Vested | (745 | ) | | 4.85 |
| (770 | ) | | 4.77 |
|
| Forfeited | (64 | ) | | 5.33 |
| (106 | ) | | 4.97 |
|
| Nonvested at end of period | 2,363 |
| | $ | 5.35 |
| 2,303 |
| | $ | 5.40 |
|
The total fair value of options vested during the sixnine months ended March 31,June 30, 2020, was $3,612.$3,673.
Restricted Stock Units
The following is a summary of the RSU activity for the sixnine months ended March 31,June 30, 2020.
|
| | | | | | |
| (In thousands, except per share amounts) | Shares | | Weighted Average Grant Date Fair Value/Share |
| Outstanding at September 30, 2019 | 2,002 |
| | $ | 17.45 |
|
| Granted | 386 |
| | 23.10 |
|
| Vested | (1,554 | ) | | 18.80 |
|
| Forfeited | (51 | ) | | 14.09 |
|
| Outstanding at June 30, 2020 | 783 |
| | $ | 17.77 |
|
| Vested and expected to vest at June 30, 2020 | 749 |
| | $ | 17.64 |
|
|
| | | | | | |
| (In thousands, except per share amounts) | Shares | | Weighted Average Grant Date Fair Value/Share |
| Outstanding at September 30, 2019 | 2,002 |
| | $ | 17.45 |
|
| Granted | 375 |
| | 23.35 |
|
| Vested | (1,553 | ) | | 18.81 |
|
| Forfeited | (31 | ) | | 12.67 |
|
| Outstanding at March 31, 2020 | 793 |
| | $ | 17.78 |
|
| Vested and expected to vest at March 31, 2020 | 750 |
| | $ | 17.56 |
|
Expense Measurement and Recognition
Total share-based compensation expense was $2,326$2,542 and $4,764$4,985 during the three months ended March 31,June 30, 2020 and 2019, respectively, of which $2,304$2,520 and $4,745$4,978 was non-cash, respectively. Total share-based compensation expense was $6,017$8,559 and $9,323$14,308 during the sixnine months ended March 31,June 30, 2020 and 2019, respectively, of which $5,984$8,504 and $9,270$14,248 was non-cash, respectively. The unrecognized compensation expense related to stock options and restricted stock units was $11,475$10,140 and $13,256,$11,972, respectively at March 31,June 30, 2020, and is expected to be recognized over a weighted average period of 2.72.3 years and 3.12.9 years, respectively. The Company received $15,370$17,949 from the exercise of stock options during the sixnine months ended March 31,June 30, 2020. The remaining stock options exercised during the sixnine months ended March 31,June 30, 2020 were effected via a cashless net exercise.
Employee Stock Purchase Plan
Effective October 1, 2018, the Company implemented an employee stock purchase plan (“ESPP”) which allows employees to purchase shares of the Company’s stock at 85% of the lower of the fair market value on the first day of the applicable offering period or on the last business day of a six-month purchase period within the offering period. These purchases wereare offered twice throughout each fiscal 2019,year, and were paid by employees through payroll deductions over the respective six month purchase period, at which point the stock will be transferred to the employees. On December 21, 2018, the Company registered 11,297 shares of common stock, par value $0.01 per share, of which 5,000 are available for future issuance under the ESPP. During the threenine months ended March 31,June 30, 2020 and 2019, the Company incurred compensation expense of $35$227 and $138,$293, respectively in salaries and wages in respect of the ESPP, representing the fair value of the discounted price of the shares. During the six months ended March 31, 2020 and 2019, the Company incurred compensation expense of $74 and $293, respectively. These amounts are included in the total share-based compensation expense above. On October 1, 2019 and April 1, 2020, 56 and 7571 shares, respectively were issued under the ESPP plan.
17. Concentration of Credit Risk
The Company’s cash and cash equivalents and accounts receivable are potentially subject to concentration of credit risk. Cash and cash equivalents are placed with financial institutions that management believes are of high credit quality. Accounts receivable are derived from revenue earned from customers located in the U.S. and internationally and generally do not require collateral. The Company’s trade receivables do not represent a significant concentration of credit risk at March 31,June 30, 2020 and September 30, 2019 due to the wide variety of customers and markets into which products are sold and their dispersion across geographic areas. The Company does perform ongoing credit evaluations of its customers and maintains an allowance for potential credit losses on trade receivables. As of and for the three and sixnine months ended March 31,June 30, 2020 and 2019, no customer accounted for more than 10% of net sales or net accounts receivable.
The Company operates predominantly in ten10 countries worldwide and provides a wide range of proven product brands and advanced water and wastewater treatment technologies, mobile and emergency water supply solutions and service contract options through its Integrated Solutions and Services and Applied Product Technologies segments. The
Company is a multi-national business but its sales and operations are primarily in the U.S. Sales to unaffiliated customers are based on the Company locations that maintain the customer relationship and transacts the external sale.
18. Related‑Party Transactions
The Company reimbursed AEA Investors LP (“AEA”), the Company’s private equity sponsor, for normal and customary expenses incurred by AEA on behalf of the Company. The Company notes that these related-party transactions have not been significant in the three and sixnine months ended March 31,June 30, 2020 and 2019.
19. Leases
Lessee Accounting
As discussed in Note 2, “Summary of Significant Accounting Policies” the Company adopted ASU 2016-02 on October 1, 2019. ASU 2016-02 requires a lessee to recognize assets and liabilities on the balance sheet for all leases, with the result being the recognition of a right-of-use (“ROU”) asset and a corresponding lease liability. The lease liability is equal to the present value of the minimum lease payments for the term of the lease using the discount rate determined at lease commencement and including any optional renewal periods that were determined to be reasonably certain to be exercised. The ROU asset is equal to the initial measurement of the lease liability plus any lease payments made to the lessor at or before the commencement date and any unamortized initial indirect costs incurred by the lessee, less any unamortized lease incentives received. ROU assets are periodically reviewed for impairment whenever events or changes in circumstances arise. During the sixnine months ended March 31,June 30, 2020, the Company incurred no impairment charges on ROU assets.
The discount rate utilized in calculating the lease liability is the rate implicit in the lease, if known, otherwise, the incremental borrowing rate (“IBR”) for the expected lease term is used. Generally, the Company cannot determine the interest rate implicit in the lease. The Company’s IBR approximates the rate the Company would have to pay on a collateralized basis to borrow an amount equal to the lease payments under similar terms.
The Company occupies certain facilities and operates certain equipment and vehicles under non‑cancelable lease arrangements. Lease agreements may contain lease escalation clauses and purchase and renewal options. At the inception of a contract, the Company determines whether the arrangement is or contains a lease. A lease is determined to exist if there is an identified asset, the Company has the right to obtain substantially all of the economic benefits from the use of the identified asset and the right to direct the use of the asset. Once a lease is determined to exist, the Company determines the lease classification at lease commencement. Leases are classified as operating or finance leases based on specific criteria. Operating lease expense is recognized on a straight-line basis on the Unaudited Consolidated Statements of Operations. Finance lease expense have front-loaded expense recognition that is recognized as depreciation expense and interest expense on the Unaudited Consolidated Statements of Operations. On the Consolidated Statements of Changes in Cash Flows, payments for operating leases are included in operating activities and payments for finance leases are included in financing activity, with the interest component included in operating activities.
The Company’s real estate leases often include options to extend the lease term; however, the Company has not included the renewal options in the ROU asset and lease liability because the likelihood of renewal was not reasonably certain. In addition, the Company has leases that include variable lease payments, for items such as maintenance or other operating expenses, which are expensed as incurred as variable lease expense.
Adoption of ASU 2016-02, Leases (Topic 842)
The Company applied Topic 842 to all existing leases at October 1, 2019 using the modified retrospective approach. As a result, prior period amounts have not been adjusted and continue to be reported in accordance with the Company’s historical accounting under Topic 840. The Company has elected the following package of practical expedients which exempts the Company from having to reassess: (i) whether expired or existing contracts contain a lease, (ii) the lease classification for expired or existing leases, and (iii) initial direct costs for existing leases. In addition, the Company elected to separate lease and non-lease components for all asset classes, did not elect to use hindsight to determine the lease term and made an accounting policy election for short-term leases which does not require the capitalization of leases with terms of 12 months or less.
As a result of adoption of Topic 842 on October 1, 2019, the Company recognized $42,073 of ROU assets related to operating leases in Operating lease right-of-use assets, net and $42,904 of corresponding lease liabilities, of which $13,596 is included in Accrued expenses and other liabilities and $29,308 is included in Obligation under operating leases on the Consolidated Balance Sheets. The difference is attributable to deferred rent balance as of September 30, 2019 that reduced the ROU asset balance on October 1, 2019, of which $73 was removed from Prepaid and other current assets and the remainder was recognized in Retained deficit on the Consolidated Balance Sheets. In addition, the Company recorded an ROU asset related to finance leases in Property, plant, and equipment, net of $2,812 and $3,245 in corresponding lease liabilities included in Other non‑current liabilities on the Consolidated Balance Sheets, with the difference recognized in Retained deficit. See Note 2, “Summary of Significant Accounting Policies” for further information on the impact of adoption.
The following represents the components of lease cost for the three and sixnine months ended March 31,June 30, 2020 and other information for both operating and finance leases for the sixnine months ended March 31,June 30, 2020:
| | | | Three Months Ended
March 31, 2020 | | Six Months Ended
March 31, 2020 | Three Months Ended
June 30, 2020 | | Nine Months Ended
June 30, 2020 |
| Lease cost | | | | | | |
| Finance lease cost: | | | | | | |
| Amortization of ROU assets | $ | 3,411 |
| | $ | 6,831 |
| $ | 3,359 |
| | $ | 10,190 |
|
| Interest on lease liabilities | 493 |
| | 1,011 |
| 490 |
| | 1,501 |
|
| Operating lease cost | 3,916 |
| | 8,131 |
| 3,944 |
| | 12,075 |
|
| Short-term lease cost | 1,079 |
| | 1,916 |
| 2,774 |
| | 4,690 |
|
| Variable lease cost | — |
| | — |
| — |
| | — |
|
| Sublease income | (14 | ) | | (28 | ) | (14 | ) | | (42 | ) |
| Total lease cost | $ | 8,885 |
| | $ | 17,861 |
| $ | 10,553 |
| | $ | 28,414 |
|
| | | Other information | | |
| (Gains)/losses on sale and leaseback transactions, net | $ | — |
| $ | — |
|
| Cash paid for amounts included in the measurement of lease liabilities | | |
| Operating cash flows from finance leases | $ | 1,015 |
| $ | 1,504 |
|
| Operating cash flows from operating leases | 7,991 |
| 12,003 |
|
| Financing cash flows from finance leases | 6,703 |
| 9,991 |
|
| ROU assets obtained in exchange for new finance lease liabilities | 4,185 |
| 8,411 |
|
| ROU assets obtained in exchange for new operating lease liabilities | 6,321 |
| 5,668 |
|
| ROU asset remeasurement | (651 | ) | 125 |
|
| Weighted average remaining lease term - finance leases | 3.9 years |
| 3.9 years |
|
| Weighted average remaining lease term - operating leases | 5.0 years |
| 5.0 years |
|
| Weighted average discount rate - finance leases | 4.8 | % | 4.7 | % |
| Weighted average discount rate - operating leases | 4.5 | % | 4.5 | % |
The following table reconciles future minimum undiscounted rental commitments for operating leases to operating lease liabilities record on the Consolidated Balance Sheet as of March 31,June 30, 2020:
|
| | | |
| Fiscal Year | |
| Remainder of 2020 | $ | 3,886 |
|
| 2021 | 13,455 |
|
| 2022 | 9,763 |
|
| 2023 | 7,481 |
|
| 2024 | 5,288 |
|
| Thereafter | 9,938 |
|
| Total undiscounted lease payments | $ | 49,811 |
|
| Present value adjustment | (5,810 | ) |
| Operating lease liabilities | 44,001 |
|
| Less current installments of obligations under operating leases | 12,993 |
|
| Obligations under operating leases, excluding current installments | $ | 31,008 |
|
|
| | | |
| Fiscal Year | |
| Remainder of 2020 | $ | 7,917 |
|
| 2021 | 13,313 |
|
| 2022 | 9,617 |
|
| 2023 | 7,340 |
|
| 2024 | 5,143 |
|
| Thereafter | 9,523 |
|
| Total undiscounted lease payments | $ | 52,853 |
|
| Present value adjustment | (5,346 | ) |
| Operating lease liabilities | 47,507 |
|
| Less current installments of obligations under operating leases | 13,474 |
|
| Obligations under operating leases, excluding current installments | $ | 34,033 |
|
The gross and net carrying values of the equipment under finance leases as of March 31,June 30, 2020 and September 30, 2019 was as follows:
|
| | | | | | | |
| | June 30,
2020 | | September 30,
2019 |
| Gross carrying amount | $ | 84,151 |
| | $ | 69,760 |
|
| Net carrying amount | 36,194 |
| | 36,337 |
|
|
| | | | | | | |
| | March 31,
2020 | | September 30,
2019 |
| Gross carrying amount | $ | 81,221 |
| | $ | 69,760 |
|
| Net carrying amount | 35,655 |
| | 36,337 |
|
The following table reconciles future minimum undiscounted rental commitments for finance leases to the finance lease liabilities recorded on the Consolidated Balance Sheet as of March 31,June 30, 2020:
|
| | | |
| Fiscal Year | |
| Remainder of 2020 | $ | 3,582 |
|
| 2021 | 12,222 |
|
| 2022 | 9,770 |
|
| 2023 | 7,187 |
|
| 2024 | 4,874 |
|
| Thereafter | 3,449 |
|
| Total undiscounted lease payments | 41,084 |
|
| Present value adjustment | (3,776 | ) |
| Finance lease liabilities | 37,308 |
|
| Less current installments of obligations under finance leases | 11,456 |
|
| Obligations under finance leases, excluding current installments | $ | 25,852 |
|
|
| | | |
| Fiscal Year | |
| Remainder of 2020 | $ | 7,005 |
|
| 2021 | 11,446 |
|
| 2022 | 8,907 |
|
| 2023 | 6,361 |
|
| 2024 | 4,125 |
|
| Thereafter | 2,761 |
|
| Total undiscounted lease payments | 40,605 |
|
| Present value adjustment | (3,910 | ) |
| Finance lease liabilities | 36,695 |
|
| Less current installments of obligations under finance leases | 11,545 |
|
| Obligations under finance leases, excluding current installments | $ | 25,150 |
|
The current installments of obligations under finance leases are included in Accrued expenses and other liabilities. Obligations under finance leases, excluding current installments, are included in Other non-current liabilities.
Lessor Accounting
The Company is a lessor to multiple parties. In certain instances, the Company enters into a contract with a customer but must construct the underlying asset prior to its lease. At the time of contract inception, the Company determines if an arrangement is or contains a lease. These contracts generally contain both lease and non-lease components, including installation, maintenance and monitoring services of the Company owned equipment, in addition to sale of certain constructed assets. In situations where arrangements contain multiple elements, contract consideration is allocated based on relative standalone selling price. Lease components associated to underlying assets that have an alternative use are classified as
operating leases with revenue recognized over time throughout the lease term, within Revenue from services on the Unaudited Consolidated Statements of Operations. Lease components associated to underlying assets that have no alternative use are classified as sales-type leases, with point in time revenue recognition at the on-set of the lease. In order for a component to be separate, the Customer would be able to benefit from the right of use of the component separately or with other resources readily available to the Customer and the right of the use is not highly dependent or highly interrelated with the other rights to use the other underlying assets or components.
As of March 31,June 30, 2020, future minimum lease payments receivable under operating leases are as follows:
|
| | | |
| Fiscal year | |
| Remainder of 2020 | $ | 41,173 |
|
| 2021 | 78,159 |
|
| 2022 | 48,401 |
|
| 2023 | 35,193 |
|
| 2024 | 24,133 |
|
| Thereafter | 91,454 |
|
| Future minimum lease payments | $ | 318,513 |
|
|
| | | |
| Fiscal year | |
| Remainder of 2020 | $ | 61,220 |
|
| 2021 | 66,671 |
|
| 2022 | 40,955 |
|
| 2023 | 30,637 |
|
| 2024 | 20,613 |
|
| Thereafter | 92,388 |
|
| Future minimum lease payments | $ | 312,484 |
|
20. Commitments and Contingencies
Guarantees
From time to time, the Company is required to provide letters of credit, bank guarantees, or surety bonds in support of its commitments and as part of the terms and conditions on water treatment projects. In addition, the Company is required to provide letters of credit or surety bonds to the Department of Environmental Protection or equivalent in some states in order to maintain its licenses to handle toxic substances at certain of its water treatment facilities.
These financial instruments typically expire after all Company commitments have been met, a period typically ranging from twelve months to ten years, or more in some circumstances. The letters of credit, bank guarantees, or surety bonds are arranged through major banks or insurance companies. In the case of surety bonds, the Company generally indemnifies the issuer for all costs incurred if a claim is made against the bond.
The following summarizes the Company’s outstanding letters of credit and surety bonds as of March 31,June 30, 2020 and September 30, 2019, respectively.
|
| | | | | | | |
| | June 30,
2020 | | September 30,
2019 |
| Revolving credit capacity | $ | 45,000 |
| | $ | 45,000 |
|
| Letters of credit outstanding | 11,872 |
| | 12,956 |
|
| Remaining revolving credit capacity | $ | 33,128 |
| | $ | 32,044 |
|
| | | | |
| Surety capacity | $ | 230,000 |
| | $ | 220,000 |
|
| Surety issuances | 148,108 |
| | 144,717 |
|
| Remaining surety available | $ | 81,892 |
| | $ | 75,283 |
|
|
| | | | | | | |
| | March 31,
2020 | | September 30,
2019 |
| Revolving credit capacity | $ | 45,000 |
| | $ | 45,000 |
|
| Letters of credit outstanding | 11,972 |
| | 12,956 |
|
| Remaining revolving credit capacity | $ | 33,028 |
| | $ | 32,044 |
|
| | | | |
| Surety capacity | $ | 230,000 |
| | $ | 220,000 |
|
| Surety issuances | 146,371 |
| | 144,717 |
|
| Remaining surety available | $ | 83,629 |
| | $ | 75,283 |
|
The longest maturity date of letters of credit and surety bonds in effect as of March 31,June 30, 2020 was March 20, 2030.
Litigation
From time to time, the Company is subject to various claims, charges and litigation matters that arise in the ordinary course of business. The Company believes these actions are a normal incident of the nature and kind of business in which the Company is engaged. While it is not feasible to predict the outcome of these matters with certainty, the Company does
not believe that any asserted or unasserted legal claims or proceedings, individually or in the aggregate, will have a material adverse effect on its business, financial condition, results of operations or prospects.
21. Accrued Expenses and Other Liabilities
Accrued expenses and other liabilities consisted of the following:
|
| | | | | | | |
| | June 30,
2020 | | September 30,
2019 |
| Salaries, wages and other benefits | $ | 44,735 |
| | $ | 35,206 |
|
| Obligation under operating leases | 12,993 |
| | — |
|
| Obligation under finance leases | 11,456 |
| | 17,859 |
|
| Insurance liabilities | 7,570 |
| | 4,895 |
|
| Third party commissions | 9,434 |
| | 11,394 |
|
| Taxes, other than income | 5,029 |
| | 5,215 |
|
| Provisions for litigation | 2,718 |
| | 1,533 |
|
| Severance payments | 1,044 |
| | 655 |
|
| Option and Purchase Right | 506 |
| | — |
|
| Earn-outs related to acquisitions | 91 |
| | 611 |
|
| Other | 28,440 |
| | 24,471 |
|
| | $ | 124,016 |
| | $ | 101,839 |
|
|
| | | | | | | |
| | March 31,
2020 | | September 30,
2019 |
| Salaries, wages and other benefits | $ | 39,273 |
| | $ | 35,206 |
|
| Obligation under operating leases | 13,474 |
| | — |
|
| Obligation under finance leases | 11,545 |
| | 17,859 |
|
| Third party commissions | 9,625 |
| | 11,394 |
|
| Insurance liabilities | 6,973 |
| | 4,895 |
|
| Taxes, other than income | 3,385 |
| | 5,215 |
|
| Provisions for litigation | 1,943 |
| | 1,533 |
|
| Option and Purchase Right | 506 |
| | — |
|
| Severance payments | 434 |
| | 655 |
|
| Earn-outs related to acquisitions | 91 |
| | 611 |
|
| Other | 24,842 |
| | 24,471 |
|
| | $ | 112,091 |
| | $ | 101,839 |
|
22. Business Segments
The Company’s reportable operating segments are defined as components of an enterprise about which separate financial information is available that is evaluated on a regular basis by the chief operating decision maker, or decision making group, in deciding how to allocate resources to an individual segment and in assessing performance. The key factors used to identify these reportable operating segments are the organization and alignment of the Company’s internal operations, the nature of the products and services, and customer type.
The Company has two2 reportable operating segments, Integrated Solutions and Services and Applied Product Technologies. The business segments are described as follows:
Integrated Solutions and Services is a group entirely focused on engaging directly with end users through direct sales with a market vertical focus. Integrated Solutions and Services provides tailored services and solutions in collaboration with the customers backed by life‑cycle services including on‑demand water, outsourced water, recycle / reuse and emergency response service alternatives to improve operational reliability, performance and environmental compliance. Key offerings within this segment also include equipment systems for industrial needs (influent water, boiler feed water, ultrahigh purity, process water, wastewater treatment and recycle / reuse), full-scale outsourcing of operations and maintenance, and municipal services, including odor and corrosion control services.
Applied Product Technologies is focused on developing product platforms to be sold primarily through third party channels. This segment primarily engages in indirect sales through independent sales representatives, distributors and aftermarket channels. Applied Product Technologies provides a range of highly differentiated and scalable products and technologies specified by global water treatment designers, OEMs, engineering firms and integrators. Key offerings within this segment include filtration and separation, disinfection, wastewater solutions, anode and electrochlorination technology and aquatics technologies and solutions for the global recreational and commercial pool market.
The Company evaluates its business segments’ operating results based on earnings before interest, taxes, depreciation and amortization, and certain other charges that are specific to the activities of the respective segments. Corporate activities include general corporate expenses, elimination of intersegmentinter-segment transactions, interest income and expense and certain other charges. Certain other charges include restructuring and other business transformation charges that have been
undertaken to align and reposition the Company to the current reporting structure, acquisition related costs (including transaction costs, certain integration costs and recognition of backlog intangible assets recorded in purchase accounting) and share-based compensation charges.
Since certain administrative and other operating expenses and other items have not been allocated to business segments, the results in the below table are not necessarily a measure computed in accordance with generally accepted accounting principles and may not be comparable to other companies.
| | | | Three Months Ended
March 31, | | Six Months Ended
March 31, | Three Months Ended
June 30, | | Nine Months Ended
June 30, |
| | 2020 | | 2019 | | 2020 | | 2019 | 2020 | | 2019 | | 2020 | | 2019 |
| Total sales | | | | | | | | | | | | | | |
| Integrated Solutions and Services | $ | 240,824 |
| | $ | 228,939 |
| | $ | 472,624 |
| | $ | 441,216 |
| $ | 230,314 |
| | $ | 227,815 |
| | $ | 702,938 |
| | $ | 669,031 |
|
| Applied Product Technologies | 129,424 |
| | 148,136 |
| | 267,953 |
| | 278,670 |
| 136,350 |
| | 158,526 |
| | 404,303 |
| | 437,196 |
|
| Total sales | 370,248 |
| | 377,075 |
| | 740,577 |
| | 719,886 |
| 366,664 |
| | 386,341 |
| | 1,107,241 |
| | 1,106,227 |
|
| Intersegment sales | | | | | | | | | | | | | | |
| Integrated Solutions and Services | 2,939 |
| | 2,075 |
| | 6,601 |
| | 3,854 |
| 1,603 |
| | 2,386 |
| | 8,204 |
| | 6,240 |
|
| Applied Product Technologies | 15,646 |
| | 26,372 |
| | 36,208 |
| | 44,402 |
| 17,234 |
| | 23,612 |
| | 53,442 |
| | 68,014 |
|
| Total intersegment sales | 18,585 |
| | 28,447 |
| | 42,809 |
| | 48,256 |
| 18,837 |
| | 25,998 |
| | 61,646 |
| | 74,254 |
|
| Sales to external customers | | | | | | | | | | | | | | |
| Integrated Solutions and Services | 237,885 |
| | 226,864 |
| | 466,023 |
| | 437,362 |
| 228,711 |
| | 225,429 |
| | 694,734 |
| | 662,791 |
|
| Applied Product Technologies | 113,778 |
| | 121,764 |
| | 231,745 |
| | 234,268 |
| 119,116 |
| | 134,914 |
| | 350,861 |
| | 369,182 |
|
| Total sales | 351,663 |
| | 348,628 |
| | 697,768 |
| | 671,630 |
| 347,827 |
| | 360,343 |
| | 1,045,595 |
| | 1,031,973 |
|
| Operating profit (loss) | | | | | | | | | | | | | | |
| Integrated Solutions and Services | 36,695 |
| | 37,011 |
| | 69,849 |
| | 64,937 |
| 32,608 |
| | 37,345 |
| | 102,457 |
| | 102,282 |
|
| Applied Product Technologies | 23,750 |
| | 11,321 |
| | 86,892 |
| | 15,838 |
| 23,588 |
| | 22,524 |
| | 110,480 |
| | 38,362 |
|
| Corporate | (39,290 | ) | | (36,864 | ) | | (65,894 | ) | | (75,666 | ) | (23,130 | ) | | (32,778 | ) | | (89,024 | ) | | (108,444 | ) |
| Total operating profit | 21,155 |
| | 11,468 |
| | 90,847 |
| | 5,109 |
| 33,066 |
| | 27,091 |
| | 123,913 |
| | 32,200 |
|
| Interest expense | (13,252 | ) | | (14,474 | ) | | (26,835 | ) | | (28,917 | ) | (10,485 | ) | | (14,842 | ) | | (37,320 | ) | | (43,759 | ) |
| Income (loss) before income taxes | 7,903 |
| | (3,006 | ) | | 64,012 |
| | (23,808 | ) | 22,581 |
| | 12,249 |
| | 86,593 |
| | (11,559 | ) |
| Income tax benefit (expense) | 7 |
| | 4,579 |
| | (2,596 | ) | | 9,093 |
| |
| Income tax (expense) benefit | | (740 | ) | | (7,959 | ) | | (3,336 | ) | | 1,134 |
|
| Net income (loss) | $ | 7,910 |
| | $ | 1,573 |
| | $ | 61,416 |
| | $ | (14,715 | ) | $ | 21,841 |
| | $ | 4,290 |
| | $ | 83,257 |
| | $ | (10,425 | ) |
| Depreciation and amortization | | | | | | | | | | | | | | |
| Integrated Solutions and Services | $ | 17,336 |
| | $ | 14,314 |
| | $ | 32,957 |
| | $ | 28,272 |
| $ | 17,745 |
| | $ | 14,035 |
| | $ | 50,702 |
| | $ | 42,307 |
|
| Applied Product Technologies | 3,543 |
| | 4,458 |
| | 7,117 |
| | 8,792 |
| 3,556 |
| | 4,350 |
| | 10,673 |
| | 13,142 |
|
| Corporate | 6,492 |
| | 5,390 |
| | 12,440 |
| | 10,188 |
| 6,241 |
| | 5,760 |
| | 18,681 |
| | 15,948 |
|
| Total depreciation and amortization | $ | 27,371 |
| | $ | 24,162 |
| | $ | 52,514 |
| | $ | 47,252 |
| $ | 27,542 |
| | $ | 24,145 |
| | $ | 80,056 |
| | $ | 71,397 |
|
| Capital expenditures | | | | | | | | | | | | | | |
| Integrated Solutions and Services | $ | 18,997 |
| | $ | 19,972 |
| | $ | 33,184 |
| | $ | 33,657 |
| $ | 23,734 |
| | $ | 19,646 |
| | $ | 56,918 |
| | $ | 53,303 |
|
| Applied Product Technologies | 1,084 |
| | 2,060 |
| | 3,367 |
| | 4,268 |
| 1,040 |
| | 1,720 |
| | 4,407 |
| | 5,988 |
|
| Corporate | 1,106 |
| | 1,081 |
| | 2,208 |
| | 2,757 |
| 2,391 |
| | 1,900 |
| | 4,599 |
| | 4,657 |
|
| Total capital expenditures | $ | 21,187 |
| | $ | 23,113 |
| | $ | 38,759 |
| | $ | 40,682 |
| $ | 27,165 |
| | $ | 23,266 |
| | $ | 65,924 |
| | $ | 63,948 |
|
|
| | | | | | | |
| | June 30,
2020 | | September 30,
2019 |
| Assets | | | |
| Integrated Solutions and Services | $ | 836,389 |
| | $ | 762,707 |
|
| Applied Product Technologies | 589,721 |
| | 657,879 |
|
| Corporate | 351,786 |
| | 317,262 |
|
| Total assets | $ | 1,777,896 |
| | $ | 1,737,848 |
|
| Goodwill | | | |
| Integrated Solutions and Services | $ | 222,669 |
| | $ | 222,013 |
|
| Applied Product Technologies | 170,758 |
| | 170,877 |
|
| Total goodwill | $ | 393,427 |
| | $ | 392,890 |
|
|
| | | | | | | |
| | March 31,
2020 | | September 30,
2019 |
| Assets | | | |
| Integrated Solutions and Services | $ | 791,507 |
| | $ | 762,707 |
|
| Applied Product Technologies | 568,635 |
| | 657,879 |
|
| Corporate | 379,751 |
| | 317,262 |
|
| Total assets | $ | 1,739,893 |
| | $ | 1,737,848 |
|
| Goodwill | | | |
| Integrated Solutions and Services | $ | 220,595 |
| | $ | 222,013 |
|
| Applied Product Technologies | 168,286 |
| | 170,877 |
|
| Total goodwill | $ | 388,881 |
| | $ | 392,890 |
|
23. Earnings Per Share
The following table sets forth the computation of basic and diluted earnings (loss) from continuing operations per common share (in thousands, except per share amounts):
|
| | | | | | | | | | | | | | | |
| | Three Months Ended
June 30, | | Nine Months Ended
June 30, |
| | 2020 | | 2019 | | 2020 | | 2019 |
| Numerator: | | | | | | | |
| Numerator for basic and diluted earnings (loss) per common share—Net income (loss) attributable to Evoqua Water Technologies Corp. | $ | 21,384 |
| | $ | 4,135 |
| | $ | 82,341 |
| | $ | (11,211 | ) |
| Denominator: | | | | | | | |
| Denominator for basic net income (loss) per common share—weighted average shares | 116,621 |
| | 114,653 |
| | 116,621 |
| | 114,653 |
|
| Effect of dilutive securities: | | | | | | | |
| Share‑based compensation | 3,595 |
| | 4,781 |
| | 4,432 |
| | — |
|
| Denominator for diluted net income (loss) per common share—adjusted weighted average shares | 120,216 |
| | 119,434 |
| | 121,053 |
| | 114,653 |
|
| Basic earnings (loss) attributable to Evoqua Water Technologies Corp. per common share | $ | 0.18 |
| | $ | 0.04 |
| | $ | 0.71 |
| | $ | (0.10 | ) |
| Diluted earnings (loss) attributable to Evoqua Water Technologies Corp. per common share | $ | 0.18 |
| | $ | 0.03 |
| | $ | 0.68 |
| | $ | (0.10 | ) |
|
| | | | | | | | | | | | | | | |
| | Three Months Ended
March 31, | | Six Months Ended
March 31, |
| | 2020 | | 2019 | | 2020 | | 2019 |
| Numerator: | | | | | | | |
| Numerator for basic and diluted earnings (loss) per common share—Net income (loss) attributable to Evoqua Water Technologies Corp. | $ | 7,812 |
| | $ | 1,384 |
| | $ | 60,957 |
| | $ | (15,346 | ) |
| Denominator: | | | | | | | |
| Denominator for basic net income (loss) per common share—weighted average shares | 116,459 |
| | 114,525 |
| | 116,459 |
| | 114,525 |
|
| Effect of dilutive securities: | | | | | | | |
| Share‑based compensation | 4,391 |
| | 4,188 |
| | 4,892 |
| | — |
|
| Denominator for diluted net income (loss) per common share—adjusted weighted average shares | 120,850 |
| | 118,713 |
| | 121,351 |
| | 114,525 |
|
| Basic earnings (loss) attributable to Evoqua Water Technologies Corp. per common share | $ | 0.07 |
| | $ | 0.01 |
| | $ | 0.52 |
| | $ | (0.13 | ) |
| Diluted earnings (loss) attributable to Evoqua Water Technologies Corp. per common share | $ | 0.06 |
| | $ | 0.01 |
| | $ | 0.50 |
| | $ | (0.13 | ) |
Since the Company was in a net loss position for the sixnine months ended March 31,June 30, 2019, there was no difference between the number of shares used to calculate basic and diluted loss per share. Because of their anti-dilutive effect, 4,1854,358 common share equivalents, comprised of employee stock options, have been excluded from the diluted EPS calculation for the sixnine months ended March 31,June 30, 2019.
Item 2. Management’s Discussion and Analysis ofFinancial Condition and Results of Operations
The following discussion and analysis of our financial condition and results of our operations should be read in conjunction with the Unaudited Consolidated Financial Statements, including the notes, included in Part I, Item 1 of this Quarterly Report on Form 10-Q (this “Report”), and with our audited consolidated financial statements and the related notes thereto in our Annual Report on Form 10-K for the fiscal year ended September 30, 2019, as filed with the SEC on November 25, 2019 and as amended on December 4, 2019 (the “2019 Annual Report”). You should review the disclosures in Part I, Item 1A. “Risk Factors” in the 2019 Annual Report, in Part II, Item 1A. “Risk Factors” of our Quarterly Report on Form 10-Q for the quarter ended March 31, 2020, as filed with the SEC on May 6, 2020, as well as any cautionary language in this report, including the disclosures in Part II, Item 1A. “Risk Factors” in this Report, for a discussion of important factors that could cause actual results to differ materially from the results described in or implied by the forward-looking statements contained in the following discussion and analysis. Unless otherwise indicated or the context otherwise requires, all references to “the Company,” “Evoqua,” “Evoqua Water Technologies Corp.,” “EWT Holdings I Corp.,” “we,” “us,” “our” and similar terms refer to Evoqua Water Technologies Corp., together with its consolidated subsidiaries. Unless otherwise specified, all dollar amounts in this section are referred to in millions.
Overview and Background
We are a leading provider of mission critical water and wastewater treatment solutions, offering a broad portfolio of products, services and expertise to support industrial, municipal and recreational customers who value water. With over 200,000 installations worldwide, we hold leading positions in the industrial, commercial and municipal water treatment markets in North America. We offer a comprehensive portfolio of differentiated, proprietary technology solutions sold under a number of market‑leading and well‑established brands to our global customer base. We have worked to protect water, the environment and our employees for over 100 years. As a result, we have earned a reputation for quality, safety and reliability and are sought out by our customers to solve the full range of their water treatment needs, and maintaining our reputation is critical to the success of our business.
Our solutions are designed to ensure that our customers have the quantity and quality of water that meets their unique specifications. We enable our customers to achieve lower costs through greater uptime, throughput and efficiency in their operations and support their regulatory compliance and environmental sustainability. We deliver and maintain these mission critical solutions through the largest service network in North America, assuring our customers continuous uptime with 9692 branches as of March 31,June 30, 2020. We have an extensive service and support network, and as a result, a certified Evoqua Service Technician is generally no more than a two‑hour drive from more than 90% of our North American customers’ sites.
Our vision “to be the world’s first choice for water solutions” and our values of “integrity, customers, performance and sustainable” foster a corporate culture that is focused on establishing a workforce that is enabled, empowered and accountable, which creates a highly entrepreneurial and dynamic work environment. Our purpose is “Transforming water. Enriching life.” We draw from a long legacy of water treatment innovations and industry firsts, supported by more than 1,100 granted or pending patents, which in aggregate are imperative to our business. Our core technologies are primarily focused on removing impurities from water, rather than neutralizing them through the addition of chemicals, and we are able to achieve purification levels which are 1,000 times greater than typical drinking water.
Business Segments
Our business is organized by customer base and offerings into two reportable operating segments that each draw from the same reservoir of leading technologies, shared manufacturing infrastructure, common business processes and corporate philosophies. Our reportable operating segments consist of: (i) our Integrated Solutions and Services segment and (ii) our Applied Product Technologies segment. The key factors used to identify these reportable operating segments are the organization and alignment of our internal operations, the nature of the products and services and customer type.
Within the Integrated Solutions and Services segment, we primarily provide tailored solutions in collaboration with our customers backed by life‑cycle services including on‑demand water, outsourced water, recycle and reuse and emergency response service alternatives to improve operational reliability, performance and environmental compliance.
Within the Applied Product Technologies segment, we provide a highly differentiated and scalable range of products and technologies specified by global water treatment designers, OEMs, engineering firms and integrators.
We evaluate our business segments’ operating results based on income from operations and EBITDA or Adjusted EBITDA on a segment basis. EBITDA and Adjusted EBITDA are non-GAAP financial measures. For more information regarding EBITDA and Adjusted EBITDA, including a reconciliation to the most directly comparable GAAP financial measure, please see the section titled “How We Assess the Performance of Our Business”. Corporate activities include general corporate expenses, elimination of intersegment transactions, interest income and expense and certain other charges, which have not been allocated to business segments. As such, the segment results provided herein may not be comparable to other companies.
Organic Growth Drivers
Market Growth
We maintain a leading position among customers in growing industries that utilize water as a critical part of their operations or production processes, including pharmaceuticals and health sciences, microelectronics, food and beverage, hydrocarbon and chemical processing, power, general manufacturing, municipal drinking and wastewater, marine and aquatics. Water treatment is an essential, non‑discretionary market that is growing in importance as access to clean water has become an international priority. Underpinning this growth are a number of global, long‑term trends that have resulted in increasingly stringent effluent regulations, along with a growing demand for cleaner and sustainable waste streams for reuse. These trends include the growing global population, increasing levels of urbanization and continued global economic growth, and we have seen these trends manifest themselves within our various end markets creating multiple avenues of growth. For example, within the industrial market, water is an integral and meaningful component in the production of a wide‑range of goods spanning from consumer electronics to automobiles. We anticipate that the COVID-19 pandemic and the resulting economic downturn may cause some near-term contraction in certain end markets that we serve, and we continue to monitor macroeconomic trends closely. However, we do not expect that the pandemic will significantly alter these long-term trends.
Our Existing Customer Base
We believe our strong brands, leading position in highly fragmented markets, scalable and global offerings, leading installed base and unique ability to provide complete treatment solutions will enable us to capture a larger share of our existing customers’ water treatment spend while expanding with existing and new customers into adjacent end‑markets and underpenetrated regions, including by investing in our sales force and cross‑selling to existing customers. We believe that we are uniquely positioned to further penetrate our core markets, with over 200,000 installations across over 38,000 global customers. We maintain a customer‑intimate business model with strong brand value and provide solutions‑focused offerings capable of serving a customer’s full lifecycle water treatment needs, both in current and new geographic regions.
Our Service Model
We selectively target high value projects with opportunities for recurring business through service, parts and other aftermarket opportunities over the lifecycle of the process or capital equipment. In particular, we have developed internet‑connected monitoring technologies through the deployment of our WaterOne® service platform, which enables customers to outsource their water treatment systems and focus on their core business, offering customers system optimization, predictive and proactive service, and simplified billing and pricing. Our WaterOne® platform also enables us to transition our customers to pricing models based on usage, which otherwise would not have been possible without technological advancement. Our technology solutions provide customers with increased stability and predictability in water‑related costs, while enabling us to optimize our service route network and on demand offerings through predictive analytics, which we believe will result in market share gains, improved service levels, increased barriers to entry and reduced costs.
Product and Technology Development
We develop our technologies through in‑house research, development and engineering and targeted tuck‑in, vertical market and geography‑expanding, technology-enhancing acquisitions. We have a reservoir of recently launched technologies and a strong pipeline of new offerings designed to provide customers with innovative, value‑enhancing solutions. Furthermore, since April 2016, we have successfully completed thirteen acquisitions and the acquisition of a 60% interest
in Frontier Water Systems LLC (“Frontier”), each of which expands our vertical markets and geographic reach and enhance our technologies, strengthening our existing capabilities and adding new capabilities and cross selling opportunities in areas such as mobile wastewater treatment, soil and air treatment, regenerative media filtration, anodes, UV and ozone disinfection, aerobic and anaerobic biological treatment technologies and electrochemical and electrochlorination cells. We are able to rapidly scale new technologies using our leading direct and third‑party sales channels and our relationships with key influencers, including municipal representatives, engineering firms, designers and other system specifiers. We believe our continued investment in driving penetration of our recently launched technologies, robust pipeline of new capabilities and best‑in‑class channels to market will allow us to continue to address our customer needs across the water lifecycle.
Operational Excellence
We believe that continuous improvement of our operations, processes and organizational structure is a key driver of our earnings growth. We have separately identified and are pursuing a number of discrete initiatives which, if successful, we expect could result in additional cost savings over the next two years. These initiatives include our supply chain improvement program to consolidate and manage global spending, our improved logistics and transportation management program, capturing benefits of our WaterOne® platform and further optimizing our engineering cost structure, our global shared services organization and our sales, inventory and operations planning. These improvements focus on creating value for customers through reduced lead times, improved quality and superior customer support, while also creating value for shareholders through enhanced earnings growth. Furthermore, as a result of significant investments we have made and plan to continue to make in our footprint and facilities, we believe we have capacity to support our planned growth without commensurate increase in fixed costs.
Acquisitions and Divestitures
We believe that capex-like, tuck‑in acquisitions present a key opportunity within our overall growth strategy, which we will continue to evaluate strategically. These strategic acquisitions are expected to enable us to accelerate our growth by extending our critical mass in existing markets, as well as expand in new geographies and new end market verticals. Our existing customer relationships, best‑in‑class channels to market and ability to rapidly commercialize technologies provide a strong platform to drive rapid growth in the businesses we acquire. To capitalize on these opportunities, we have built an experienced team dedicated to mergers and acquisitions that has, since April 2016, successfully completed thirteen acquisitions and the acquisition of a 60% interest in Frontier, each of which expands our vertical markets and geographic reach and enhance our technologies, with purchase prices ranging from approximately $2.6 million to approximately $283.7 million, and pre‑acquisition revenues ranging from approximately $3.1 million to approximately $55.7 million.
On December 31, 2019 we completed the sale of the Memcor product line to DuPont de Nemours, Inc. (DuPont). The aggregate purchase price paid by DuPont was $110.0 million in cash, subject to certain adjustments. Following adjustments for cash and net working capital, gross proceeds paid by DuPont were $131.0 million. The Company recognized a $49.0 million net pre-tax benefit on the sale of the Memcor product line, net of $8.3 million of discretionary compensation payments to employees in connection with the transaction and $1.0 million in transaction costs incurred in the three months ended December 31, 2019. As a result of net working capital adjustments, the Company recognized an additional $9.0 million net pre-tax benefit in the three months ended March 31, 2020. The Company and DuPont have a history of collaboration, and following the sale, DuPont will continue to supply the Company with Memcor® products.
Key Factors and Trends Affecting Our Business and Financial Statements
Various trends and other factors affect or have affected our operating results, including:
Impact of the COVID-19 pandemic. As discussed further below,In response to the challenges created by the COVID-19 pandemic, did notwe have a material impact oncontinued to prioritize protecting the safety of our consolidated resultsemployees and stakeholders, taking actions to ensure the resiliency of operations inour business and managing the three months ended March 31, 2020.business for liquidity. Our business has been considered essential under federal and local standards, and we have maintained business continuity at our critical service branches and manufacturing facilities. We have taken measures to protect our employees, including implementation of remote working practices where possible and managing our supply chain to ensure that necessary personal protective equipment is available
to our personnel. We have also taken initialcertain cost reduction actions such as reduction of marketing and travel activity as well as deferment of headcount additions to preserve liquidity and reallocated existing resources to maintain productivity levels.levels where feasible.
In general, we sawhave seen increased demand for services from customers in healthcarepharmaceutical and pharmaceuticallaboratory industries beginning in mid-to-late Marchthrough the period ended June 30, 2020, as the impact of the pandemic broadened. However, we also begancontinue to see signs of uneven demand for our products and services from customers in certain other industries, during that period.such as oil and gas, refining and aquatics. Customer site shut-downs and project delays created by the pandemic contributed to a decline in revenue from services in the quarter. We continue to evaluate the impact of the pandemic on our business, particularly how social distancing guidelines and government-imposed restrictions might continue to affect our access to our customers’ sites and how the economic downturn resulting from the pandemic might affect our customers’ willingness to make capital expenditures and our ability to collect from our customers. Given the evolving nature of the unprecedented pandemic, the overall impact on our operations over the remainder of the fiscal year cannot be reasonably estimated at this time.
For more information regarding factors and events that may impact our business, results of operations and financial condition from the effects of the COVID-19 pandemic, see “ItemPart II, Item 1A. Risk“Risk Factors” of this Report.our Quarterly Report on Form 10-Q for the quarter ended March 31, 2020, as filed with the SEC on May 6, 2020.
Overall economic trends. The overall economic environment and related changes in industrial, commercial and municipal spending impact our business. In general, positive conditions in the broader economy promote industrial, commercial and municipal customer spending, while economic weakness results in a reduction of new industrial, commercial and municipal project activity. Macroeconomic factors that can affect customer spending patterns, and thereby our results of operations, include population growth, total water consumption, municipal budgets, employment rates, business conditions, the availability of credit or capital, interest rates, tax rates, imposition of tariffs and regulatory changes. Since the businesses of our customers vary in cyclicality, periodic downturns in any specific sector typically have modest impacts on our overall business. For example, the current weakness in global oil markets has created, and we expect will continue to create, some weakness in demand from customers that we serve in the oil and gas industry. Additionally, the COVID-19 pandemic has increased economic uncertainty and has caused an economic slowdown that is likely to continue and may result in a sustained global recession.
Changes in costs and availability. We have significant exposures to certain commodities, including steel, caustic, carbon, calcium nitrate and iridium, and volatility in the market price and availability of these commodity input materials has a direct impact on our costs and our business. For example, restrictions on international trade, including tariffs imposed by the U.S. government and other governments, as well as supply chain disruptions caused by the COVID-19 pandemic, have increased and could further increase the cost of certain materials and have restricted and could further restrict availability of certain commodities, which may result in delays in our execution of projects. Although we have offset a portion of these cost increases through price increases, there can be no assurance that we will be able to continue to recuperate additional cost increases from our customers through product price increases. If we are unable to manage commodity fluctuations through pricing actions, cost savings projects and sourcing decisions as well as through consistent productivity improvements, it may adversely impact our gross profit and gross margin. Further, additional potential acquisitions and international expansion will place increased demands on our operational, managerial, administrative and other resources. Managing our growth effectively will require us to continue to enhance our management systems, financial and management controls and information systems. We will also be required to hire, train and retain operational and sales personnel, which affects our operating margins.
Inflation and deflation trends. Our financial results can be expected to be directly impacted by substantial increases in costs due to commodity cost increases or general inflation which could lead to a reduction in our revenues as well as greater margin pressure as increased costs may not be able to be passed on to customers. We actively monitor changes in cost and respond as we deem appropriate to attempt to mitigate the impact to our results.
Fluctuation in quarterly results. Our quarterly results have historically varied depending upon a variety of factors, including funding, readiness of projects, regulatory approvals and significant weather events. In addition, our contracts for
large capital water treatment projects, systems and solutions for industrial, commercial and municipal applications are generally fixed‑price contracts with milestone billings. As a result of these factors, our working capital requirements and demands on our distribution and delivery network may fluctuate during the year.
New products and technologies. Our ability to maintain our appeal to existing customers and attract new customers depends on our ability to originate, develop and offer a compelling array of products, services and solutions responsive to evolving customer innovations, preferences and specifications. We expect that increased use of water in industrial and commercial processes will drive increased customer demand in the future, and our ability to grow will depend in part on effectively responding to innovation in our customers’ processes and systems. Further, our ability to provide products that comply with evolving government regulations will also be a driver of the appeal of our products, services and solutions to industrial and commercial customers.
Government policies. Decaying water systems in the United States (“U.S.”) will require critical drinking water and wastewater repairs, often led by municipal governments. Further, as U.S. states increase regulation on existing and emerging contaminants, we expect that our customers will increasingly require sustainable solutions to their water‑related needs. In general, increased infrastructure investment and more stringent municipal, state and federal regulations promote increased spending on our products, services and solutions, while a slowdown in investment in public infrastructure or the elimination of key environmental regulations could result in lower industrial and municipal spending on water systems and products.
Availability of water. In general, we expect demand for our products and services to increase as the availability of clean water from public sources decreases. Secular trends that will drive demand for water across a multitude of industrial, commercial and municipal applications include global population growth, urbanization, industrialization and overall economic growth. In addition, the supply of clean water could be adversely impacted by factors including an aging water infrastructure within North America and increased levels of water stress from seasonal rainfall, inadequate water storage options or treatment technologies. Because water is a critical component and byproduct of many processes, including in manufacturing and product development, we expect that, as global consumption patterns evolve and water shortages persist, demand for our equipment and services will continue to increase.
Operational investment. Our historical operating results reflect the impact of our ongoing investments to support our growth. We have made significant investments in our business that we believe have laid the foundation for continued profitable growth. Activities related to operational investments include employee training and development, integrating acquired businesses, implementing enhanced information systems, research, development and engineering investments and other activities to enable us to support our operating model.
Our ability to source and distribute products effectively. Our revenues are affected by our ability to purchase our inputs in sufficient quantities at competitive prices. While we believe our suppliers have adequate capacity to meet our current and anticipated demand, our level of revenues could be adversely affected in the event of constraints in our supply chain, including the inability of our suppliers to produce sufficient quantities of raw materials in a manner that is able to match demand from our customers.
Contractual relationships with customers. Due to our large installed base and the nature of our contractual relationships with our customers, we have high visibility into a large portion of our revenue. The one‑ to twenty‑year terms of many of our service contracts and the regular delivery and replacement of many of our products help to insulate us from the negative impact of any typical economic decline.
Exchange rates. The reporting currency for our Unaudited Consolidated Financial Statements is the U.S. dollar. We operate in numerous countries around the world and therefore, certain of our assets, liabilities, revenues and expenses are denominated in functional currencies other than the U.S. dollar, primarily in the euro, U.K. sterling, Chinese renminbi, Canadian dollar, Australian dollar and Singapore dollar. To prepare our Unaudited Consolidated Financial Statements we must translate those assets, liabilities, revenues and expenses into U.S. dollars at the applicable exchange rate. As a result, increases or decreases in the value of the U.S. dollar against these other currencies will affect the amount of these items recorded in our Unaudited Consolidated Financial Statements, even if their value has not changed in the functional currency. While we believe that we are not susceptible to any material impact on our results of operations caused by fluctuations in exchange rates because our operations are primarily conducted in the U.S., if we expand our foreign operations in the future, substantial increases or decreases in the value of the U.S. dollar relative to these other currencies could have a significant impact on our results of operations.
How We Assess the Performance of Our Business
In assessing the performance of our business, we consider a variety of performance and financial measures. The key indicators of the financial condition and operating performance of our business are revenue, gross profit, gross margin, operating expenses, net income (loss) and Adjusted EBITDA (which is a non-GAAP financial measure).
Revenue
Our sales are a function of sales volumes and selling prices, each of which is a function of the mix of product and service sales, and consist primarily of:
sales of tailored light industry technologies, heavy industry technologies and environmental products, services and solutions in collaboration with our industrial customers, backed by lifecycle services including emergency response services and outsourced water alternatives, to a broad group of industrial customers in our U.S., Canada and Singapore markets;
sales of products, services and solutions to engineering firms and municipalities to purify drinking water and treat wastewater globally; and
sales of a wide variety of differentiated products and technologies, to an array of OEM, distributor, end‑user, engineering firm and integrator customers in all of our geographic markets and aftermarket channels.
Cost of Sales, Gross Profit and Gross Margin
Gross profit is determined by subtracting cost of product sales and cost of services from our product and services revenue. Gross margin measures gross profit as a percentage of our combined product and services revenue.
Cost of product sales consists of all manufacturing costs required to bring a product to a ready for sale condition, including direct and indirect materials, direct and indirect labor costs including benefits, freight, depreciation, information technology, rental and insurance, repair and maintenance, utilities, other manufacturing costs, warranties and third party commissions.
Cost of services primarily consists of the cost of personnel and travel for our field service, supply chain and technicians, depreciation of equipment and field service vehicles and freight costs.
Operating Expenses
Operating expenses consist primarily of general and administrative, sales and marketing and research and development expenses.
General and Administrative. General and administrative expenses (“G&A expense”) consist of fixed overhead personnel expenses associated with our corporate functions and our service organization (including district and branch managers, customer service, contract renewals and regeneration plant management). We expect our general and administrative expenses to increase due to the anticipated growth of our business and related infrastructure as well as due to the legal, accounting, insurance, investor relations and other costs associated with being a public company.
Sales and Marketing. Sales and marketing expenses (“S&M expense”) consist primarily of advertising and marketing promotions of our products, services and solutions and related personnel expenses (including all Evoqua sales and application employees’ base compensation and incentives), as well as sponsorship costs, consulting and contractor expenses, travel, display expenses and related amortization. We expect our sales and marketing expenses to increase as we continue to actively promote our products, services and solutions.
Research and Development. Research and development expenses (“R&D expense”) consist primarily of personnel expenses related to research and development, patents, sustaining engineering, consulting and contractor expenses, tooling and prototype materials and overhead costs allocated to such expenses. Substantially all of our research and development expenses are related to developing new products and services and improving our existing products and services. To date, research and development expenses have been expensed as incurred, because the period between achieving technological
feasibility and the release of products and services for sale has been short and development costs qualifying for capitalization have been insignificant.
R&D expense can fluctuate depending on our determination to invest in developing new products, services and solutions and enhancing our existing products, services and solutions versus adding these capabilities through a mergers and acquisitions strategy.
Net Income (Loss)
Net income (loss) is determined by subtracting operating expenses and interest expense from, and adding other operating income (expense), equity income from our partnership interest in Treated Water Outsourcing and income tax benefit (expense) to, gross profit. For more information on how we determine gross profit, see “Gross Profit.”
Adjusted EBITDA
Adjusted EBITDA, which is a non-GAAP financial measure, is one of the primary metrics used by management to evaluate the financial performance of our business. Adjusted EBITDA is defined as net income (loss) before interest expense, income tax benefit (expense) and depreciation and amortization, adjusted for the impact of certain other items, including restructuring and related business transformation costs, purchase accounting adjustment costs, non-cash share-based compensation, transaction costs and other gains, losses and expenses. We present Adjusted EBITDA because we believe it is frequently used by analysts, investors and other interested parties to evaluate companies in our industry. Further, we believe it is helpful in highlighting trends in our operating results and provides greater clarity to management and our investors regarding the operational impact of long termlong-term strategic decisions regarding capital structure, the tax jurisdictions in which we operate and capital investments. Management uses Adjusted EBITDA to supplement GAAP measures of performance as follows:
to assist investors and analysts in comparing our operating performance across reporting periods on a consistent basis by excluding items that we do not believe are indicative of our core operating performance;
in our management incentive compensation which is based in part on components of Adjusted EBITDA;
in certain calculations under our senior secured credit facilities, which use components of Adjusted EBITDA;
to evaluate the effectiveness of our business strategies;
to make budgeting decisions; and
to compare our performance against that of other peer companies using similar measures.
In addition to the above, our chief operating decision maker uses EBITDA and Adjusted EBITDA of each reportable operating segment to evaluate the operating performance of such segments. EBITDA and Adjusted EBITDA of the reportable operating segments do not include certain charges that are presented within corporate activities. These charges include certain restructuring and other business transformation charges that have been incurred to align and reposition the Company to the current reporting structure, acquisition related costs (including transaction costs, integration costs and recognition of backlog intangible assets recorded in purchase accounting) and share-based compensation charges.
You are encouraged to evaluate each adjustment and the reasons we consider it appropriate for supplemental analysis. In addition, in evaluating Adjusted EBITDA, you should be aware that in the future, we may incur expenses similar to the adjustments in the presentation of Adjusted EBITDA. Our presentation of Adjusted EBITDA should not be construed as an inference that our future results will be unaffected by unusual or non‑recurring items. In addition, Adjusted EBITDA may not be comparable to similarly titled measures used by other companies in our industry or across different industries.
The following is a reconciliation of our Net income (loss) to Adjusted EBITDA (unaudited, amounts in millions):
| | | | Three Months Ended
March 31, | | Six Months Ended
March 31, | Three Months Ended
June 30, | | Nine Months Ended
June 30, |
| | 2020 | | 2019 | | 2020 | | 2019 | 2020 | | 2019 | | 2020 | | 2019 |
| Net income (loss) | $ | 7.9 |
| | $ | 1.6 |
| | $ | 61.4 |
| | $ | (14.7 | ) | $ | 21.8 |
| | $ | 4.3 |
| | $ | 83.3 |
| | $ | (10.4 | ) |
| Income tax expense (benefit) | — |
| | (4.6 | ) | | 2.6 |
| | (9.1 | ) | 0.8 |
| | 7.9 |
| | 3.3 |
| | (1.2 | ) |
| Interest expense | 13.3 |
| | 14.5 |
| | 26.8 |
| | 28.9 |
| 10.5 |
| | 14.9 |
| | 37.3 |
| | 43.8 |
|
| Operating profit | 21.2 |
| | 11.5 |
| | 90.8 |
| | 5.1 |
| 33.1 |
| | 27.1 |
| | 123.9 |
| | 32.2 |
|
| Depreciation and amortization | 27.3 |
| | 24.2 |
| | 52.5 |
| | 47.3 |
| 27.6 |
| | 24.1 |
| | 80.1 |
| | 71.4 |
|
| EBITDA | 48.5 |
| | 35.7 |
| | 143.3 |
| | 52.4 |
| 60.7 |
| | 51.2 |
| | 204.0 |
| | 103.6 |
|
| Restructuring and related business transformation costs (a) | 6.2 |
| | 8.3 |
| | 7.9 |
| | 14.0 |
| 3.1 |
| | 4.5 |
| | 11.0 |
| | 18.5 |
|
| Share-based compensation (b) | 2.3 |
| | 4.7 |
| | 6.0 |
| | 9.3 |
| 2.6 |
| | 5.0 |
| | 8.6 |
| | 14.3 |
|
| Transaction costs (c) | 0.5 |
| | 2.4 |
| | 0.7 |
| | 4.5 |
| 0.3 |
| | 1.0 |
| | 1.0 |
| | 5.5 |
|
| Other (gains) losses and expenses (d) | (0.8 | ) | | 5.6 |
| | (57.6 | ) | | 14.9 |
| (2.9 | ) | | (1.1 | ) | | (60.5 | ) | | 13.8 |
|
| Adjusted EBITDA | $ | 56.7 |
| | $ | 56.7 |
| | $ | 100.3 |
| | $ | 95.1 |
| $ | 63.8 |
| | $ | 60.6 |
| | $ | 164.1 |
| | $ | 155.7 |
|
(a) Restructuring and related business transformation costs
Adjusted EBITDA is calculated prior to considering certain restructuring or business transformation events. These events may occur over extended periods of time, and in some cases it is reasonably possible that they could reoccur in future periods based on reorganizations of the business, cost reduction or productivity improvement needs, or in response to economic conditions. For the periods presented such events include the following:
| |
| (i) | Certain costs and expenses in connection with various restructuring initiatives, including severance costs, relocation costs, recruiting expenses, and third-party consultant costs to assist with these initiatives. This includes: |
| |
| (A) | amounts related to the Company’s restructuring initiatives to reduce the cost structure and rationalize location footprint following the sale of the Memcor product line; |
| |
| (B) | amounts related to the Company’s transition from a three-segment structure to a two-segment operating model designed to better serve the needs of customers worldwide; and |
| |
| (C) | amounts related to various other initiatives implemented to restructure and reorganize our business with the appropriate management team and cost structure. |
| | | | Three Months Ended
March 31, | | Six Months Ended
March 31, | Three Months Ended
June 30, | | Nine Months Ended
June 30, |
| | 2020 | | 2019 | | 2020 | | 2019 | 2020 | | 2019 | | 2020 | | 2019 |
Post Memcor divestiture restructuring(1) | $ | 3.7 |
| | $ | — |
| | $ | 3.7 |
| | $ | — |
| $ | 1.2 |
| | $ | — |
| | $ | 4.9 |
| | $ | — |
|
| Cost of product sales and services ("Cost of sales") | 2.9 |
| | — |
| | 2.9 |
| | — |
| 0.8 |
| | — |
| | 3.7 |
| | — |
|
| S&M expense | 0.1 |
| | — |
| | 0.1 |
| | — |
| (0.1 | ) | | — |
| | — |
| | — |
|
| G&A expense | 0.7 |
| | — |
| | 0.7 |
| | — |
| 0.5 |
| | — |
| | 1.2 |
| | — |
|
Two-segment restructuring(2) | $ | 0.3 |
| | $ | 5.1 |
| | $ | 1.3 |
| | $ | 7.0 |
| $ | 0.6 |
| | $ | 2.9 |
| | $ | 1.9 |
| | $ | 9.9 |
|
| Cost of sales | 0.3 |
| | 2.5 |
| | 0.6 |
| | 2.7 |
| 0.4 |
| | 1.4 |
| | 1.0 |
| | 4.1 |
|
| R&D expense | — |
| | 0.1 |
| | — |
| | 0.1 |
| — |
| | — |
| | — |
| | 0.1 |
|
| S&M expense | — |
| | 0.4 |
| | — |
| | 0.6 |
| — |
| | 0.3 |
| | — |
| | 0.9 |
|
| G&A expense | 0.4 |
| | 2.1 |
| | 0.7 |
| | 3.6 |
| 0.2 |
| | 1.2 |
| | 0.9 |
| | 4.8 |
|
| Other operating (income) expense | (0.4 | ) | | — |
| | — |
| | — |
| |
Various other initiatives(3) | $ | 0.3 |
| | $ | 0.2 |
| | $ | 0.5 |
| | $ | 0.7 |
| $ | 0.5 |
| | $ | 0.6 |
| | $ | 1.0 |
| | $ | 1.3 |
|
| Cost of sales | 0.3 |
| | 0.2 |
| | 0.4 |
| | 0.5 |
| 0.3 |
| | 0.2 |
| | 0.7 |
| | 0.7 |
|
| S&M expense | | 0.1 |
| | — |
| | 0.1 |
| | — |
|
| G&A expense | — |
| | — |
| | 0.1 |
| | 0.2 |
| 0.1 |
| | 0.4 |
| | 0.2 |
| | 0.6 |
|
| Total | $ | 4.3 |
| | $ | 5.3 |
| | $ | 5.5 |
| | $ | 7.7 |
| $ | 2.3 |
| | $ | 3.5 |
| | $ | 7.8 |
| | $ | 11.2 |
|
| |
(1) | all of which $4.8 million is reflected in restructuring charges in Note 13, “Restructuring and Related Charges” in Part I, Item 1 of this Quarterly Report on Form 10-Q (the “Restructuring Footnote”) in the sixnine months ended March 31,June 30, 2020. |
| |
(2) | of which $1.9 million and $9.3 million is reflected in the Restructuring Footnote in the nine months ended June 30, 2020 and 2019, respectively. |
| |
(2)
| of which $1.2 million and $7.0 million is reflected in the Restructuring Footnote in the six months ended March 31, 2020 and 2019, respectively. |
| |
(3) | all of which is reflected in the Restructuring Footnote in the sixnine months ended March 31,June 30, 2020 and 2019, respectively. |
| |
| (ii) | legal settlement costs and intellectual property related fees associated with legacy matters prior to the AEA Acquisition, including fees and settlement costs related to product warranty litigation on Memcor products and certain discontinued products. This includes: |
| | | | Three Months Ended
March 31, | | Six Months Ended
March 31, | Three Months Ended
June 30, | | Nine Months Ended
June 30, |
| | 2020 | | 2019 | | 2020 | | 2019 | 2020 | | 2019 | | 2020 | | 2019 |
| Cost of sales | $ | 0.1 |
| | $ | — |
| | $ | 0.2 |
| | $ | 0.1 |
| $ | 0.3 |
| | $ | 0.1 |
| | $ | 0.5 |
| | $ | 0.2 |
|
| G&A expense | 0.2 |
| | 0.2 |
| | 0.2 |
| | 0.5 |
| 0.1 |
| | 0.2 |
| | 0.3 |
| | 0.7 |
|
| Total | $ | 0.3 |
| | $ | 0.2 |
| | $ | 0.4 |
| | $ | 0.6 |
| $ | 0.4 |
| | $ | 0.3 |
| | $ | 0.8 |
| | $ | 0.9 |
|
| |
| (iii) | expenses associated with our information technology and functional infrastructure transformation subsequent to the AEA Acquisition, including activities to optimize information technology systems and functional infrastructure processes. This includes: |
| | | | Three Months Ended
March 31, | | Six Months Ended
March 31, | Three Months Ended
June 30, | | Nine Months Ended
June 30, |
| | 2020 | | 2019 | | 2020 | | 2019 | 2020 | | 2019 | | 2020 | | 2019 |
| Cost of sales | $ | — |
| | $ | — |
| | $ | 0.1 |
| | $ | 0.1 |
| $ | — |
| | $ | 0.3 |
| | $ | 0.1 |
| | $ | 0.4 |
|
| G&A expense | 0.4 |
| | 2.3 |
| | 0.7 |
| | 5.0 |
| (0.1 | ) | | 0.9 |
| | 0.6 |
| | 5.9 |
|
| Total | $ | 0.4 |
| | $ | 2.3 |
| | $ | 0.8 |
| | $ | 5.1 |
| $ | (0.1 | ) | | $ | 1.2 |
| | $ | 0.7 |
| | $ | 6.3 |
|
| |
| (iv) | costs associated with the March 2020 secondary public offering of common stock held by certain shareholders of the Company, as well as costs incurred by us in connection with establishment of our public company compliance structure and processes, including consultant costs. This includes: |
| | | | Three Months Ended
March 31, | | Six Months Ended
March 31, | Three Months Ended
June 30, | | Nine Months Ended
June 30, |
| | 2020 | | 2019 | | 2020 | | 2019 | 2020 | | 2019 | | 2020 | | 2019 |
| G&A expense | $ | 1.2 |
| | $ | 0.5 |
| | $ | 1.2 |
| | $ | 0.6 |
| $ | 0.5 |
| | $ | (0.5 | ) | | $ | 1.7 |
| | $ | 0.1 |
|
| Total | $ | 1.2 |
| | $ | 0.5 |
| | $ | 1.2 |
| | $ | 0.6 |
| $ | 0.5 |
| | $ | (0.5 | ) | | $ | 1.7 |
| | $ | 0.1 |
|
| |
| (b) | Share-based compensation |
Adjusted EBITDA is calculated prior to considering non‑cash share‑based compensation expenses related to equity awards. See Note 16, “Share-Based Compensation” in Part I, Item 1 of this Quarterly Report on Form 10-Q for further detail.
| |
| (c) | Transaction related costs |
Adjusted EBITDA is calculated prior to considering transaction, integration and restructuring costs associated with business combinations because these costs are unique to each transaction and represent costs that were incurred as a result of the transaction decision. Such costs may include, without limitation, consulting and legal costs associated with due diligence and closing a transaction, restructuring and integration costs such as severance, facility consolidation costs, product rationalization or inventory obsolescence charges, system integration or conversion costs, fair value changes associated with contingent consideration, and costs associated with any litigation matters that arise subsequent to our acquisition of a business for which the matter in question preceded the transaction, but was not known, not probable or unresolved at the date of acquisition. We believe that viewing earnings prior to considering these charges provides investors with useful additional perspective because the significant costs incurred in connection with business combinations result primarily from the need to eliminate duplicate assets, activities or employees - a natural result of acquiring or disposing a fully integrated set of activities. Integration and restructuring costs associated with a business combination may occur over several years. This includes:
| | | | Three Months Ended
March 31, | | Six Months Ended
March 31, | Three Months Ended
June 30, | | Nine Months Ended
June 30, |
| | 2020 | | 2019 | | 2020 | | 2019 | 2020 | | 2019 | | 2020 | | 2019 |
| Cost of sales | $ | (0.3 | ) | | $ | 1.1 |
| | $ | (0.2 | ) | | $ | 1.3 |
| $ | 0.1 |
| | $ | 0.1 |
| | $ | (0.1 | ) | | $ | 1.4 |
|
| G&A expense | 0.5 |
| | 1.3 |
| | 0.9 |
| | 3.2 |
| 0.2 |
| | 0.9 |
| | 1.1 |
| | 4.1 |
|
| Other operating (income) expense | 0.3 |
| | — |
| | — |
| | — |
| |
| Total | $ | 0.5 |
| | $ | 2.4 |
| | $ | 0.7 |
| | $ | 4.5 |
| $ | 0.3 |
| | $ | 1.0 |
| | $ | 1.0 |
| | $ | 5.5 |
|
| |
| (d) | Other (gains), losses and expenses |
Adjusted EBITDA is calculated prior to considering certain other significant (gains), losses and expenses. Such significant items represent substantive and/or unusual items that are evaluated on an individual basis. Such evaluation considers both the quantitative and qualitative aspects of their nature and they may be highly variable and difficult to predict. Unusual items may represent items that are not part of our ongoing business, items that, either as a result of their nature or size, we would not expect to occur as part of our normal business on a regular basis, items that would be non-recurring, or items related to products we no longer sell. While not all-inclusive, examples of items that could be included as other (gains), losses and expenses would be amounts related to non-cash foreign currency exchange gains and losses on intercompany loans, significant warranty events, and certain disposals of businesses, products or facilities that do not qualify as discontinued operations under GAAP. For the periods presented such events include the following:
| |
| (i) | impact of foreign exchange gains and losses; |
| |
| (ii) | foreign exchange impact related to headquarter allocations; |
| |
| (iii) | expenses on disposal related to maintaining non‑operational business locations, net of gain on sale; |
| |
| (iv) | expenses incurred by the Company related to the remediation of manufacturing defects caused by a third- party vendor; |
| |
| (v) | charges incurred by the Company related to product rationalization in its electro-chlorination business; |
| |
| (vi) | net pre-tax benefit on the sale of the Memcor product line, which is net of $8.3 million of discretionary compensation payments to employees in connection with the transaction and $1.0 million in transaction costs incurred in the sixnine months ended March 31, 2020;June 30, 2020 and gain on the sale of property in the three and nine months ended June 30, 2019; |
| |
| (vii) | expenses incurred by the Company related to the write-off of inventory associated with product rationalization and facility consolidation.consolidation; and |
| |
| (viii) | expenses incurred by the Company as a result of the COVID-19 pandemic, including additional charges for personal protective equipment, increased costs for facility sanitization and one-time payments to certain employees. |
Other (gains), losses and expenses include the following for the periods presented below:
| | | Three Months Ended March 31, 2020 | |
| Three Months Ended June 30, 2020 | | Three Months Ended June 30, 2020 |
| | Other Adjustments | Other Adjustments |
| | (i) | | (ii) | | (iii) | | (iv) | | (v) | | (vi) | | (vii) | | Total | (i) | | (ii) | | (iii) | | (iv) | | (v) | | (vi) | | (vii) | | (viii) | | Total |
| Cost of sales | $ | 0.3 |
| | $ | — |
| | $ | — |
| | $ | (0.1 | ) | | $ | 0.2 |
| | $ | 0.1 |
| | $ | — |
| | $ | 0.5 |
| $ | — |
| | $ | — |
| | $ | — |
| | $ | — |
| | $ | 0.1 |
| | $ | — |
| | $ | — |
| | $ | 0.7 |
| | $ | 0.8 |
|
| G&A expense | 7.8 |
| | — |
| | — |
| | — |
| | — |
| | (0.8 | ) | | — |
| | 7.0 |
| (4.0 | ) | | (0.1 | ) | | — |
| | — |
| | — |
| | — |
| | — |
| | 0.4 |
| | (3.7 | ) |
| Other operating (income) expense | — |
| | — |
| | — |
| | — |
| | — |
| | (8.3 | ) | | — |
| | (8.3 | ) | |
| Total | $ | 8.1 |
| | $ | — |
| | $ | — |
| | $ | (0.1 | ) | | $ | 0.2 |
| | $ | (9.0 | ) | | $ | — |
| | $ | (0.8 | ) | $ | (4.0 | ) | | $ | (0.1 | ) | | $ | — |
| | $ | — |
| | $ | 0.1 |
| | $ | — |
| | $ | — |
| | $ | 1.1 |
| | $ | (2.9 | ) |
| | | Three Months Ended March 31, 2019 | |
| Three Months Ended June 30, 2019 | | Three Months Ended June 30, 2019 |
| | Other Adjustments | Other Adjustments |
| | (i) | | (ii) | | (iii) | | (iv) | | (v) | | (vi) | | (vii) | | Total | (i) | | (ii) | | (iii) | | (iv) | | (v) | | (vi) | | (vii) | | (viii) | | Total |
| Cost of sales | $ | (0.2 | ) | | $ | — |
| | $ | — |
| | $ | 0.3 |
| | $ | (0.1 | ) | | $ | — |
| | $ | 5.1 |
| | $ | 5.1 |
| $ | 0.2 |
| | $ | — |
| | $ | — |
| | $ | 0.4 |
| | $ | 0.2 |
| | $ | — |
| | $ | (0.1 | ) | | $ | — |
| | $ | 0.7 |
|
| G&A expense | 0.5 |
| | — |
| | — |
| | — |
| | — |
| | — |
| | — |
| | 0.5 |
| (1.4 | ) | | — |
| | — |
| | — |
| | — |
| | — |
| | — |
| | — |
| | (1.4 | ) |
| Other operating (income) expense | | — |
| | — |
| | — |
| | — |
| | — |
| | (0.4 | ) | | — |
| | — |
| | (0.4 | ) |
| Total | $ | 0.3 |
| | $ | — |
| | $ | — |
| | $ | 0.3 |
| | $ | (0.1 | ) | | $ | — |
| | $ | 5.1 |
| | $ | 5.6 |
| $ | (1.2 | ) | | $ | — |
| | $ | — |
| | $ | 0.4 |
| | $ | 0.2 |
| | $ | (0.4 | ) | | $ | (0.1 | ) | | $ | — |
| | $ | (1.1 | ) |
| | | Six Months Ended March 31, 2020 | |
| Nine Months Ended June 30, 2020 | | Nine Months Ended June 30, 2020 |
| | Other Adjustments | Other Adjustments |
| | (i) | | (ii) | | (iii) | | (iv) | | (v) | | (vi) | | (vii) | | Total | (i) | | (ii) | | (iii) | | (iv) | | (v) | | (vi) | | (vii) | | (viii) | | Total |
| Cost of sales | $ | (0.1 | ) | | $ | — |
| | $ | — |
| | $ | 0.1 |
| | $ | 0.3 |
| | $ | 0.2 |
| | $ | — |
| | $ | 0.5 |
| $ | (0.1 | ) | | $ | — |
| | $ | — |
| | $ | 0.1 |
| | $ | 0.4 |
| | $ | 0.2 |
| | $ | — |
| | $ | 0.7 |
| | $ | 1.3 |
|
| G&A expense | 1.6 |
| | 0.1 |
| | — |
| | — |
| | — |
| | 0.1 |
| | — |
| | 1.8 |
| (2.4 | ) | | — |
| | — |
| | — |
| | — |
| | 0.1 |
| | — |
| | 0.4 |
| | (1.9 | ) |
| Other operating (income) expense | — |
| | — |
| | — |
| | (1.6 | ) | | — |
| | (58.3 | ) | | — |
| | (59.9 | ) | — |
| | — |
| | — |
| | (1.6 | ) | | — |
| | (58.3 | ) | | — |
| | — |
| | (59.9 | ) |
| Total | $ | 1.5 |
| | $ | 0.1 |
| | $ | — |
| | $ | (1.5 | ) | | $ | 0.3 |
| | $ | (58.0 | ) | | $ | — |
| | $ | (57.6 | ) | $ | (2.5 | ) | | $ | — |
| | $ | — |
| | $ | (1.5 | ) | | $ | 0.4 |
| | $ | (58.0 | ) | | $ | — |
| | $ | 1.1 |
| | $ | (60.5 | ) |
| | | Six Months Ended March 31, 2019 | |
| Nine Months Ended June 30, 2019 | | Nine Months Ended June 30, 2019 |
| | Other Adjustments | Other Adjustments |
| | (i) | | (ii) | | (iii) | | (iv) | | (v) | | (vi) | | (vii) | | Total | (i) | | (ii) | | (iii) | | (iv) | | (v) | | (vi) | | (vii) | | (viii) | | Total |
| Cost of sales | $ | — |
| | $ | — |
| | $ | 0.5 |
| | $ | 1.3 |
| | $ | 3.0 |
| | $ | — |
| | $ | 5.1 |
| | $ | 9.9 |
| $ | 0.2 |
| | $ | — |
| | $ | 0.5 |
| | $ | 1.7 |
| | $ | 3.2 |
| | $ | — |
| | $ | 5.0 |
| | $ | — |
| | $ | 10.6 |
|
| G&A expense | 5.0 |
| | — |
| | — |
| | — |
| | — |
| | — |
| | — |
| | 5.0 |
| 3.6 |
| | — |
| | — |
| | — |
| | — |
| | — |
| | — |
| | — |
| | 3.6 |
|
| Other operating (income) expense | | — |
| | — |
| | — |
| | — |
| | — |
| | (0.4 | ) | | — |
| | — |
| | (0.4 | ) |
| Total | $ | 5.0 |
| | $ | — |
| | $ | 0.5 |
| | $ | 1.3 |
| | $ | 3.0 |
| | $ | — |
| | $ | 5.1 |
| | $ | 14.9 |
| $ | 3.8 |
| | $ | — |
| | $ | 0.5 |
| | $ | 1.7 |
| | $ | 3.2 |
| | $ | (0.4 | ) | | $ | 5.0 |
| | $ | — |
| | $ | 13.8 |
|
Immaterial rounding differences may be present in the tables above.
Results of Operations
The following tables summarize key components of our results of operations for the periods indicated:
| | | | Three Months Ended March 31, | | Six Months Ended March 31, | Three Months Ended June 30, | | Nine Months Ended June 30, |
| | 2020 | | 2019 | | | | 2020 | | 2019 | | | 2020 | | 2019 | | | | 2020 | | 2019 | | |
| (In millions, except per share amounts) | | | % of Revenue | | | | % of Revenue | | % Variance | | | | % of Revenue | | | | % of Revenue | | % Variance | | | % of Revenue | | | | % of Revenue | | % Variance | | | | % of Revenue | | | | % of Revenue | | % Variance |
| Revenue | $ | 351.7 |
| | 100.0 | % | | $ | 348.6 |
| | 100.0 | % | | 0.9 | % | | $ | 697.8 |
| | 100.0 | % | | $ | 671.6 |
| | 100.0 | % | | 3.9 | % | $ | 347.8 |
| | 100.0 | % | | $ | 360.3 |
| | 100.0 | % | | (3.5 | )% | | $ | 1,045.6 |
| | 100.0 | % | | $ | 1,032.0 |
| | 100.0 | % | | 1.3 | % |
| Cost of product sales and services | (240.5 | ) | | (68.4 | )% | | (253.0 | ) | | (72.6 | )% | | (4.9 | )% | | (480.9 | ) | | (68.9 | )% | | (487.3 | ) | | (72.6 | )% | | (1.3 | )% | (237.6 | ) | | (68.3 | )% | | (249.0 | ) | | (69.1 | )% | | (4.6 | )% | | (718.4 | ) | | (68.7 | )% | | (736.4 | ) | | (71.4 | )% | | (2.4 | )% |
| Gross profit | 111.2 |
| | 31.6 | % | | 95.6 |
| | 27.4 | % | | 16.3 | % | | 216.9 |
| | 31.1 | % | | 184.3 |
| | 27.4 | % | | 17.7 | % | 110.2 |
| | 31.7 | % | | 111.3 |
| | 30.9 | % | | (1.0 | )% | | 327.2 |
| | 31.3 | % | | 295.6 |
| | 28.6 | % | | 10.7 | % |
| General and administrative expense | (62.1 | ) | | (17.7 | )% | | (48.2 | ) | | (13.8 | )% | | 28.8 | % | | (107.9 | ) | | (15.5 | )% | | (103.0 | ) | | (15.3 | )% | | 4.8 | % | (44.9 | ) | | (12.9 | )% | | (49.6 | ) | | (13.8 | )% | | (9.5 | )% | | (152.8 | ) | | (14.6 | )% | | (152.6 | ) | | (14.8 | )% | | 0.1 | % |
| Sales and marketing expense | (34.0 | ) | | (9.7 | )% | | (35.4 | ) | | (10.2 | )% | | (4.0 | )% | | (72.0 | ) | | (10.3 | )% | | (71.6 | ) | | (10.7 | )% | | 0.6 | % | (29.8 | ) | | (8.6 | )% | | (31.9 | ) | | (8.9 | )% | | (6.6 | )% | | (101.8 | ) | | (9.7 | )% | | (103.5 | ) | | (10.0 | )% | | (1.6 | )% |
| Research and development expense | (3.2 | ) | | (0.9 | )% | | (4.0 | ) | | (1.1 | )% | | (20.0 | )% | | (6.9 | ) | | (1.0 | )% | | (8.1 | ) | | (1.2 | )% | | (14.8 | )% | (2.8 | ) | | (0.8 | )% | | (3.3 | ) | | (0.9 | )% | | (15.2 | )% | | (9.7 | ) | | (0.9 | )% | | (11.4 | ) | | (1.1 | )% | | (14.9 | )% |
| Other operating income (expense), net | 9.3 |
| | 2.6 | % | | 3.5 |
| | 1.0 | % | | 165.7 | % | | 60.7 |
| | 8.7 | % | | 3.5 |
| | 0.5 | % | | 1,634.3 | % | 0.4 |
| | 0.1 | % | | 0.6 |
| | 0.2 | % | | (33.3 | )% | | 61.0 |
| | 5.8 | % | | 4.1 |
| | 0.4 | % | | 1,387.8 | % |
| Interest expense | (13.3 | ) | | (3.8 | )% | | (14.5 | ) | | (4.2 | )% | | (8.3 | )% | | (26.8 | ) | | (3.8 | )% | | (28.9 | ) | | (4.3 | )% | | (7.3 | )% | (10.5 | ) | | (3.0 | )% | | (14.9 | ) | | (4.1 | )% | | (29.5 | )% | | (37.3 | ) | | (3.6 | )% | | (43.8 | ) | | (4.2 | )% | | (14.8 | )% |
| Income (loss) before income taxes | 7.9 |
| | 2.2 | % | | (3.0 | ) | | (0.9 | )% | | 363.3 | % | | 64.0 |
| | 9.2 | % | | (23.8 | ) | | (3.5 | )% | | 368.9 | % | 22.6 |
| | 6.5 | % | | 12.2 |
| | 3.4 | % | | (85.2 | )% | | 86.6 |
| | 8.3 | % | | (11.6 | ) | | (1.1 | )% | | 846.6 | % |
| Income tax benefit (expense) | 0.0 |
| | — | % | | 4.6 |
| | 1.3 | % | | 100.0 | % | | (2.6 | ) | | (0.4 | )% | | 9.1 |
| | 1.4 | % | | (128.6 | )% | |
| Income tax (expense) benefit | | (0.8 | ) | | (0.2 | )% | | (7.9 | ) | | (2.2 | )% | | 89.9 | % | | (3.3 | ) | | (0.3 | )% | | 1.2 |
| | 0.1 | % | | (375.0 | )% |
| Net income (loss) | 7.9 |
| | 2.2 | % | | 1.6 |
| | 0.5 | % | | 393.8 | % | | 61.4 |
| | 8.8 | % | | (14.7 | ) | | (2.2 | )% | | 517.7 | % | 21.8 |
| | 6.3 | % | | 4.3 |
| | 1.2 | % | | 407.0 | % | | 83.3 |
| | 8.0 | % | | (10.4 | ) | | (1.0 | )% | | 901.0 | % |
| Net income attributable to non‑controlling interest | 0.1 |
| | — | % | | 0.2 |
| | 0.1 | % | | (50.0 | )% | | 0.4 |
| | 0.1 | % | | 0.6 |
| | 0.1 | % | | (33.3 | )% | 0.4 |
| | 0.1 | % | | 0.2 |
| | 0.1 | % | | 100.0 | % | | 1.0 |
| | 0.1 | % | | 0.8 |
| | 0.1 | % | | 25.0 | % |
| Net income (loss) attributable to Evoqua Water Technologies Corp. | $ | 7.8 |
| | 2.2 | % | | $ | 1.4 |
| | 0.4 | % | | 457.1 | % | | $ | 61.0 |
| | 8.7 | % | | $ | (15.3 | ) | | (2.3 | )% | | 498.7 | % | $ | 21.4 |
| | 6.2 | % | | $ | 4.1 |
| | 1.1 | % | | 422.0 | % | | $ | 82.3 |
| | 7.9 | % | | $ | (11.2 | ) | | (1.1 | )% | | 834.8 | % |
| | | | | | | | | | | | | | | | | | | | | | | | | | | | | | | | | | | | | | | |
| Weighted average shares outstanding | | | | | | | | | | | | | | | | | | | | | | | | | | | | | | | | | | | | | | |
| Basic | 116.5 |
| | | | 114.5 |
| | | | | | 116.5 |
| | | | 114.5 |
| | | | | 116.6 |
| | | | 114.7 |
| | | | | | 116.6 |
| | | | 114.7 |
| | | | |
| Diluted | 120.9 |
| | | | 118.7 |
| | | | | | 121.4 |
| | | | 114.5 |
| | | | | 120.2 |
| | | | 119.4 |
| | | | | | 121.1 |
| | | | 114.7 |
| | | | |
| Earnings (loss) per share | | | | | | | | | | | | | | | | | | | | | | | | | | | | | | | | | | | | | | |
| Basic | $ | 0.07 |
| | | | $ | 0.01 |
| | | | | | $ | 0.52 |
| | | | $ | (0.13 | ) | | | | | $ | 0.18 |
| | | | $ | 0.04 |
| | | | | | $ | 0.71 |
| | | | $ | (0.10 | ) | | | | |
| Diluted | $ | 0.06 |
| | | | $ | 0.01 |
| | | | | | $ | 0.50 |
| | | | $ | (0.13 | ) | | | | | $ | 0.18 |
| | | | $ | 0.03 |
| | | | | | $ | 0.68 |
| | | | $ | (0.10 | ) | | | | |
| | | | | | | | | | | | | | | | | | | | | | | | | | | | | | | | | | | | | | | |
| Other financial data: | | | | | | | | | | | | | | | | | | | | | | | | | | | | | | | | | | | | |
| Adjusted EBITDA(1) | $ | 56.7 |
| | 16.1 | % | | $ | 56.7 |
| | 16.3 | % | | — | % | | $ | 100.3 |
| | 14.4 | % | | $ | 95.1 |
| | 14.2 | % | | 5.5 | % | $ | 63.8 |
| | 18.3 | % | | $ | 60.6 |
| | 16.8 | % | | 5.3 | % | | $ | 164.1 |
| | 15.7 | % | | $ | 155.7 |
| | 15.1 | % | | 5.4 | % |
| |
| (1) | For the definition of Adjusted EBITDA (a non-GAAP financial measure) and a reconciliation to net income (loss), its most directly comparable financial measure presented in accordance with GAAP, see “How We Assess the Performance of Our Business-Adjusted EBITDA.” |
Consolidated Results
Revenues-Revenues increased $3.1decreased $12.5 million, or 0.9%3.5%, to $351.7$347.8 million in the three months ended March 31,June 30, 2020 from $348.6$360.3 million in the three months ended March 31,June 30, 2019. Revenues increased $26.2$13.6 million, or 3.9%1.3%, to $697.8$1,045.6 million in the sixnine months ended March 31,June 30, 2020 from $671.6$1,032.0 million in the sixnine months ended March 31,June 30, 2019.
The following table provides the change in revenues from product sales and revenues from services, respectively:
| | | | Three Months Ended March 31, | | Six Months Ended March 31, | Three Months Ended June 30, | | Nine Months Ended June 30, |
| | 2020 | | 2019 | | % Variance | | 2020 | | 2019 | | % Variance | 2020 | | 2019 | | % Variance | | 2020 | | 2019 | | % Variance |
| | | | % of Revenue | | | | % of Revenue | | | | | | % of Revenue | | | | % of Revenue | | | | | % of Revenue | | | | % of Revenue | | | | | | % of Revenue | | | | % of Revenue | | |
| Revenue from product sales | $ | 206.0 |
| | 58.6 | % | | $ | 206.8 |
| | 59.3 | % | | (0.4 | )% | | $ | 402.6 |
| | 57.7 | % | | $ | 386.9 |
| | 57.6 | % | | 4.1 | % | $ | 207.6 |
| | 59.7 | % | | $ | 210.3 |
| | 58.4 | % | | (1.3 | )% | | $ | 610.1 |
| | 58.3 | % | | $ | 597.3 |
| | 57.9 | % | | 2.1 | % |
| Revenue from services | 145.7 |
| | 41.4 | % | | 141.8 |
| | 40.7 | % | | 2.8 | % | | 295.2 |
| | 42.3 | % | | 284.7 |
| | 42.4 | % | | 3.7 | % | 140.2 |
| | 40.3 | % | | 150.0 |
| | 41.6 | % | | (6.5 | )% | | 435.5 |
| | 41.7 | % | | 434.7 |
| | 42.1 | % | | 0.2 | % |
| | $ | 351.7 |
| | 100.0 | % | | $ | 348.6 |
| | 100.0 | % | | 0.9 | % | | $ | 697.8 |
| | 100.0 | % | | $ | 671.6 |
| | 100.0 | % | | 3.9 | % | $ | 347.8 |
| | 100.0 | % | | $ | 360.3 |
| | 100.0 | % | | (3.5 | )% | | $ | 1,045.6 |
| | 100.0 | % | | $ | 1,032.0 |
| | 100.0 | % | | 1.3 | % |
Revenues from product sales decreased $0.8$2.7 million, or 0.4%1.3%, to $206.0$207.6 million in the three months ended March 31,June 30, 2020 from $206.8$210.3 million in the three months ended March 31,June 30, 2019. The decrease was primarily driven byrelated to a decreasedecline in aftermarket revenues of $8.3$17.5 million, primarilyof which $15.2 million was driven by the divestiture of the Memcor product line as well as site closures and delays due to COVID-19. This decline was partially offset by increased capital revenues of $7.4 million.$14.8 million derived primarily from activity in the microelectronics end market.
Revenues from product sales increased $15.7$12.8 million, or 4.1%2.1%, to $402.6$610.1 million in the sixnine months ended March 31,June 30, 2020 from $386.9$597.3 million in the sixnine months ended March 31,June 30, 2019. The increase was primarily driven by increasedadditional capital revenues of $22.7$37.5 million, of which $4.9primarily related to projects in the microelectronics end market as well as $1.0 million was related to the acquisitions of ATG UV and Frontier, partially offset by a decrease in aftermarket revenues of $7.1$24.8 million, primarily driven byrelated to the divestiture of the Memcor product line.line as well as site closures and delays due to COVID-19.
Revenues from services increased $3.9decreased $9.8 million, or 2.8%6.5%, to $145.7$140.2 million in the three months ended March 31,June 30, 2020 from $141.8$150.0 million in the three months ended March 31,June 30, 2019. This decrease was evenly driven by the timing of completion of certain large projects in the prior year as well as the impact of COVID-19 shut-downs and delays, primarily in refining and oil and gas end markets, offset somewhat by price realization related to established service contracts.
Revenues from services increased $0.8 million, or 0.2%, to $435.5 million in the nine months ended June 30, 2020 from $434.7 million in the nine months ended June 30, 2019. This increase was driven by strongerstrong organic service growth, which was augmented by price realization.
Revenues from services increased $10.5 million, or 3.7%, to $295.2 millionrealization, offset by the decline in the sixthree months ended March 31,June 30, 2020 from $284.7 million indue to the six months ended March 31, 2019. This increase was driven by stronger organic service growth, which was augmented by price realization.factors mentioned above.
Cost of Sales and Gross Margin-Total gross margin increased to 31.6%31.7% in the three months ended March 31,June 30, 2020 from 27.4%30.9% in the three months ended March 31,June 30, 2019. Total gross margin increased to 31.1%31.3% in the sixnine months ended March 31,June 30, 2020 from 27.4%28.6% in the sixnine months ended March 31,June 30, 2019.
The following table provides the change in cost of product sales and cost of services, respectively, along with related gross margins:
| | | | Three Months Ended March 31, | | Six Months Ended March 31, | Three Months Ended June 30, | | Nine Months Ended June 30, |
| | 2020 | | 2019 | | 2020 | | 2019 | 2020 | | 2019 | | 2020 | | 2019 |
| | | | Gross Margin % | | | | Gross Margin % | | | | Gross Margin % | | | | Gross Margin % | | | Gross Margin % | | | | Gross Margin % | | | | Gross Margin % | | | | Gross Margin % |
| Cost of product sales | $ | (144.2 | ) | | 30.0 | % | | $ | (153.9 | ) | | 25.6 | % | | $ | (284.6 | ) | | 29.3 | % | | $ | (290.5 | ) | | 24.9 | % | $ | (143.5 | ) | | 30.9 | % | | $ | (148.4 | ) | | 29.4 | % | | $ | (428.1 | ) | | 29.8 | % | | $ | (438.9 | ) | | 26.5 | % |
| Cost of services | (96.3 | ) | | 33.9 | % | | (99.1 | ) | | 30.1 | % | | (196.2 | ) | | 33.5 | % | | (196.8 | ) | | 30.9 | % | (94.1 | ) | | 32.9 | % | | (100.6 | ) | | 32.9 | % | | (290.4 | ) | | 33.3 | % | | (297.5 | ) | | 31.6 | % |
| | $ | (240.5 | ) | | 31.6 | % | | $ | (253.0 | ) | | 27.4 | % | | $ | (480.8 | ) | | 31.1 | % | | $ | (487.3 | ) | | 27.4 | % | $ | (237.6 | ) | | 31.7 | % | | $ | (249.0 | ) | | 30.9 | % | | $ | (718.4 | ) | | 31.3 | % | | $ | (736.4 | ) | | 28.6 | % |
Gross margin from product sales increased by 4.4%1.5% to 30.0%30.9% in the three months ended March 31,June 30, 2020 from 25.6%29.4% in the three months ended March 31,June 30, 2019. The increase in gross margin was primarily driven by costs incurred in
improved plant productivity and operational execution as the prior yearCompany continues to realize the benefits of $5.1 million, mainly due to product rationalization, that did not reoccur in the current year. The remaining change is related to change inrestructuring efforts along with some impact from product mix and price realization.
Gross margin from product sales increased by 4.4%3.3% to 29.3%29.8% in the sixnine months ended March 31,June 30, 2020 from 24.9%26.5% in the sixnine months ended March 31,June 30, 2019. The increase in gross margin was primarily driven by costs incurred in the prior year of $9.9$10.6 million mainly duerelated to restructuring and product rationalization, that did not reoccur in the current year. The remaining change is related to change in product mix and price realization.
Gross margin from services increased by approximately 3.8% to 33.9%remained flat at 32.9% in the three months ended March 31,June 30, 2020 from 30.1% in the three months ended March 31,as compared to 2019. The operational impacts of declining revenue volume and productivity challenges were neutralized by improved pricing. Gross margin from services also increased approximately 2.6%1.7% to 33.5%33.3% in the sixnine months ended March 31,June 30, 2020 from 30.9%31.6% in the sixnine months ended March 31,June 30, 2019. These increases areThis increase is mainly driven by price realization recognized in revenue as well as better leverage of fixed costscontinued focus on labor productivity even as previous increases in revenue volumes increase.were offset in the current period.
Operating Expenses-Operating expenses increased $11.7decreased $7.3 million, or 13.4%8.6%, to $99.3$77.5 million in the three months ended March 31,June 30, 2020 from $87.6$84.8 million in the three months ended March 31,June 30, 2019. The change in foreign currency translation, most of which is related to intercompany loans, resulted in a net increasedecrease in operating expenses of $7.0$3.0 million period over period. Other increasesThe remaining decrease is due to various efforts taken by the Company to reduce costs across various areas in operating expenses include $2.5 million associated with the acquisitions of ATG UVresponse to COVID-19 uncertainties, such as reduced travel and Frontier, transaction costs related to the sale of the Memcor product line of $1.0 million and additionalother employee related expenses of $1.2 million.costs.
Operating expenses increased $4.1decreased $3.2 million, or 2.2%(1.2)%, to $186.8$264.3 million in the sixnine months ended March 31,June 30, 2020 from $182.7$267.5 million in the sixnine months ended March 31,June 30, 2019. This increasedecrease is mainly due to favorable change in foreign currency translation on the following:
increased employee related expensesintercompany loans of $3.3 million;
$6.7 million, partially offset by increased costs of $2.3$3.8 million related to the addition of operating expenses as a result of the ATG UV and Frontier acquisitions, mainly due to amortization expense on purchased intangibles;intangibles. The remaining decrease is due to various efforts taken by the Company to reduce costs across various areas in response to COVID-19 uncertainties, such as reduced travel and other employee costs.
A discussion of operating expenses by category is as follows:
Research and Development Expense - Research and development expenses decreased $0.5 million during the three months ended June 30, 2020 as compared to June 30, 2019, and decreased $1.7 million during the nine months ended of the same periods due to the Company’s continued efforts to reduce spending, offset partially by increased expenses by the addition of the Frontier acquisition.
Sales and Marketing Expense - Sales and marketing expenses had a decrease of $2.1 million during the three months ended June 30, 2020 and a decrease of $1.7 million during the nine months ended June 30, 2020, respectively, mainly due to a reduction in certain marketing initiatives and travel related expenses, offset by increased costs by the addition of the Frontier acquisition.
General and Administrative Expense - General and administrative expenses decreased $4.7 million, or 9.5%, to $44.9 million in the three months ended June 30, 2020 from $49.6 million in the three months ended June 30, 2019. This decrease in general and administrative expenses was primarily due to the favorable change in foreign currency translation on the intercompany loans, as described above, of $2.9 million, in addition to a reduction in travel related expenses of $1.8 million.
General and administrative expenses increased $0.2 million, or 0.1%, to $152.8 million in the nine months ended June 30, 2020 from $152.6 million in the nine months ended June 30, 2019. The increase is due to:
increased employee related expenses of $3.1 million;
increased costs of $1.2$3.3 million incurred in connection withrelated to the secondary public offering of shares of common stock held by certain shareholdersaddition of the Company; andFrontier acquisition;
| |
| • | costs incurred related to the secondary public offering of shares of common stock held by certain shareholders of the Company of $1.6 million; and |
transaction costs related to the sale of the Memcor product line of $1.0 million.
The above increases were partially offset by by:
favorable change in foreign currency translation on the intercompany loans of $3.7$6.3 million;
reduction in travel expenses of $2.5 million.
A discussion ofOther operating expensesincome (expense)-Other operating income (expense) decreased slightly by category is as follows:
Research and Development Expense - Research and development expenses decreased $0.8$0.2 million, during the three months ended March 31, 2020 as compared to March 31, 2019, and decreased $1.2 million during the six months ended of the same periods due to the Company’s continued efforts to reduce spending, offset partially by increased expenses due to the Frontier acquisition.
Sales and Marketing Expense - Sales and marketing expenses had a decrease of $1.4 million during the three months ended March 31, 2020 due to a reduction in employee related expenses, and an increaseincome of $0.4 million in the six months ended mainly due to the Frontier acquisition offset by the reduction in employee related expenses.
General and Administrative Expense - General and administrative expenses increased $13.9 million, or 28.8%, to $62.1 million in the three months ended March 31,June 30, 2020 from $48.2income of $0.6 million in the three months ended March 31,June 30, 2019. This increase in general and administrative expenses was primarily due to the unfavorable change in foreign currency translation on the intercompany loans, as described above, of $7.0 million. We also saw increased depreciation and amortization of $2.5 million, mainly related to the acquisitions of ATG UV and Frontier. These acquisitions resulted in further increases within general and administrative expenses of $0.5 million. Costs incurred related to the secondary public offering of shares of common stock held by certain shareholders of the Company were $1.2 million, and employee related expenses increased by $1.1 million.
General and administrative expenses increased $4.9 million, or 4.8%, to $107.9 million in the six months ended March 31, 2020 from $103.0 million in the six months ended March 31, 2019. The increase is due to:
depreciation and amortization of $2.7 million, mainly related to the ATG UV and Frontier acquisitions;
increased employee related expenses of $2.4 million;
increased costs of $1.3 million related to the Frontier and ATG UV acquisitions;
costs incurred related to the secondary public offering of shares of common stock held by certain shareholder of the Company of $1.2 million; and
transaction costs related to the sale of the Memcor product line of $1.0 million.
The above increases were partially offset by unfavorable change in foreign currency translation on the intercompany loans of $3.7 million.
Other operating income (expense)-Other operating income (expense) increased $5.8 million, to income of $9.3 million in the three months ended March 31, 2020 from income of $3.5 million in the three months ended March 31, 2019. The current year amount is primarily related to the gain on sale of the Memcor product line, while the amount in the prior year was primarily due to release of an acquisition related contingency due to the passage of time.
Other operating income (expense) increased $57.2$56.9 million to income of $60.7$61.0 million in the sixnine months ended March 31,June 30, 2020 from income of $3.5$4.1 million in the sixnine months ended March 31,June 30, 2019. The increase is mainly due to the net pre-tax benefit on sale of the Memcor product line of $58.0 million, which is net of $8.3 million of discretionary compensation payments to employees in connection with the transaction and $1.0 million in transaction costs incurred in the first quarter of 2020.
Interest Expense-Interest expense decreased $1.2$4.4 million, or 8.3%29.5%, to $13.3$10.5 million in the three months ended March 31,June 30, 2020 from $14.5$14.9 million in the three months ended March 31,June 30, 2019. Interest expense decreased $2.1$6.5 million, or 7.3%14.8%, to $26.8$37.3 million in the sixnine months ended March 31,June 30, 2020 from $28.9$43.8 million in the sixnine months ended March 31,June 30, 2019. The decrease in interest expense was primarily driven by a reduction in LIBOR year over year in addition to a $100 million pay down of debt repayment in the three months ended March 31,June 30, 2019, partially offset by a write-off of deferred financing fees related to the debt paydown and interest expense associated with additional equipment financings.
Income tax (expense) benefit (expense)-An-Income tax expense of $0.8 million and income tax benefitexpense of $7 and an income tax benefit of $4.6$7.9 million were recorded for the three months ended March 31,June 30, 2020 and 2019, respectively. The decrease in tax expense from the prior year was principally due to the favorable impact to the projected annual effective tax rate of the gain on the sale of the Memcor product line which did not generate significant tax expense due to the combination of the U.S. valuation allowance and favorable foreign tax regimes, as well as the favorable impact of the reversal of a portion of deferred tax liabilities related to indefinite lived intangibles, as compared to the prior year in which the quarter reflected the year-to-date cumulative tax impact of a profitable quarter while remaining in a year-to-date loss.
Income tax expense of $3.3 million and an income tax benefit of $1.2 million was recorded for the nine months ended June 30, 2020 and 2019, respectively. The increase in tax expense from the prior year was principally due to the significant income earned in the current year, primarily from the sale of the Memcor product line, as compared to a significant loss in the prior year.
Income tax expense of $2.6 million and an income tax benefit of $9.1 million was recorded for the six months ended March 31, 2020 and 2019, respectively. The decrease in tax benefit from the prior year was principally due to the significant income earned in the current year, primarily from the sale of the Memcor product line, as compared to a significant loss in the prior year.
Net Income-Net income increased by $6.3$17.5 million, or 393.8%407.0%, to $7.9$21.8 million for the three months ended March 31,June 30, 2020, from a net income of $1.6$4.3 million in the three months ended March 31,June 30, 2019. The main driver of this increase is the sale of the Memcor product line, which resulted inwas a net pre-tax benefit on sale of $9.0 million in the three months ended March 31, 2020. In addition to the net benefit of the sale, we saw overall contributions of revenue volume and mix of $11.9 million. These increases were offset by $7.6 million of foreign currency loss, mainly due to intercompany loans, versus a prior year period foreign currency loss of $0.6 million, resulting in a net loss of $7 million. Additionally, income increases were offset by a $4.6 million net increasedecrease in income tax expense in the current year period based on the projected effective tax rate for the fiscal year.year of $7.1 million. Additionally, there was a reduction in interest of expense of $4.4 million and a favorable change in foreign currency translation resulting in a net gain of $3.1 million. The remaining increase in net income is due to overall contributions of revenue volume and mix, operational efficiency and cost savings.
Net income increased by $76.1$93.7 million, or 517.7%901.0%, to net income of $61.4$83.3 million for the sixnine months ended March 31,June 30, 2020 from a net loss of $14.7$10.4 million in the sixnine months ended March 31,June 30, 2019. The main driver of this increase iswas the sale of the Memcor product line, which resulted in a gain on sale of $67.3 million, less amounts paid for discretionary bonuses of $8.3 million and transaction costs of $1.0 million incurred in the sixnine months ended March 31,June 30, 2020. The resulting
net pre-tax benefit was $58.0 million. In addition to the net benefit of the sale, we saw overall contributions of revenue volume and mix as well as operational efficiencies of $19.6$26.4 million and a favorable change in foreign currency translation resulting in a net gain of $7.3 million. Finally, interest expense decreased by $6.5 million. These increases were offset by an increase in income tax expense of $4.5 million.
Adjusted EBITDA- Adjusted-Adjusted EBITDA is a non-GAAP financial measure. Adjusted EBITDA for the three months ended March 31,June 30, 2020 was $56.7$63.8 million which is consistent with, as compared to $60.6 million for the three months ended March 31,June 30, 2019. Adjusted EBITDA for the quarter as compared to the prior year period was driven primarily by increased revenue volume, price realization,operational efficiencies and favorable changes in mix,cost savings, offset by the changes as compared to the prior year period in non-recurring expenses and benefits.
Adjusted EBITDA increased $5.2$8.4 million, or 5.5%5.4%, to $100.3$164.1 million for the sixnine months ended March 31,June 30, 2020 from $95.1$155.7 million for the sixnine months ended March 31,June 30, 2019. The increase in Adjusted EBITDA as compared to the prior year period was primarily driven by the increased revenue volume augmented by price realization and the favorable change in mix driven by higher service volumes.as well as operational efficiencies.
Segment Results
| | | | Three Months Ended March 31, | | Six Months Ended March 31, | Three Months Ended June 30, | | Nine Months Ended June 30, |
| | 2020 | | 2019 | | % Variance | | 2020 | | 2019 | | % Variance | 2020 | | 2019 | | % Variance | | 2020 | | 2019 | | % Variance |
| | | | % of Revenue | | | | % of Revenue | | | | | | % of Revenue | | | | % of Revenue | | | | | % of Revenue | | | | % of Revenue | | | | | | % of Revenue | | | | % of Revenue | | |
| Revenues | | | | | | | | | | | | | | | | | | | | | | | | | | | | | | | | | | | | | | |
| Integrated Solutions and Services | $ | 237.9 |
| | 67.6 | % | | $ | 226.8 |
| | 65.1 | % | | 4.9 | % | | $ | 466.0 |
| | 66.8 | % | | $ | 437.3 |
| | 65.1 | % | | 6.6 | % | $ | 228.7 |
| | 65.8 | % | | $ | 225.4 |
| | 62.6 | % | | 1.5 | % | | $ | 694.7 |
| | 66.4 | % | | $ | 662.8 |
| | 64.2 | % | | 4.8 | % |
| Applied Product Technologies | 113.8 |
| | 32.4 | % | | 121.8 |
| | 34.9 | % | | (6.6 | )% | | 231.8 |
| | 33.2 | % | | 234.3 |
| | 34.9 | % | | (1.1 | )% | 119.1 |
| | 34.2 | % | | 134.9 |
| | 37.4 | % | | (11.7 | )% | | 350.9 |
| | 33.6 | % | | 369.2 |
| | 35.8 | % | | (5.0 | )% |
| Total Consolidated | 351.7 |
| | 100.0 | % | | 348.6 |
| | 100.0 | % | | 0.9 | % | | 697.8 |
| | 100.0 | % | | 671.6 |
| | 100.0 | % | | 3.9 | % | 347.8 |
| | 100.0 | % | | 360.3 |
| | 100.0 | % | | (3.5 | )% | | 1,045.6 |
| | 100.0 | % | | 1,032.0 |
| | 100.0 | % | | 1.3 | % |
| Operating profit (loss) | | | | | | | | | | | | | | | | | | | | | | | | | | | | | | | | | | | | | | |
| Integrated Solutions and Services | 36.7 |
| | 10.4 | % | | 37.0 |
| | 10.6 | % | | (0.8 | )% | | 69.8 |
| | 10.0 | % | | 64.9 |
| | 9.7 | % | | 7.6 | % | 32.6 |
| | 9.4 | % | | 37.4 |
| | 10.4 | % | | (12.8 | )% | | 102.5 |
| | 9.8 | % | | 102.3 |
| | 9.9 | % | | 0.2 | % |
| Applied Product Technologies | 23.8 |
| | 6.8 | % | | 11.3 |
| | 3.2 | % | | 110.6 | % | | 86.9 |
| | 12.5 | % | | 15.8 |
| | 2.4 | % | | 450.0 | % | 23.6 |
| | 6.8 | % | | 22.5 |
| | 6.2 | % | | 4.9 | % | | 110.5 |
| | 10.6 | % | | 38.4 |
| | 3.7 | % | | 187.8 | % |
| Corporate | (39.3 | ) | | (11.2 | )% | | (36.8 | ) | | (10.6 | )% | | 6.8 | % | | (65.9 | ) | | (9.4 | )% | | (75.6 | ) | | (11.3 | )% | | (12.8 | )% | (23.1 | ) | | (6.6 | )% | | (32.8 | ) | | (9.1 | )% | | (29.6 | )% | | (89.1 | ) | | (8.5 | )% | | (108.5 | ) | | (10.5 | )% | | (17.9 | )% |
| Total Consolidated | 21.2 |
| | 6.0 | % | | 11.5 |
| | 3.3 | % | | 84.3 | % | | 90.8 |
| | 13.0 | % | | 5.1 |
| | 0.8 | % | | 1,680.4 | % | 33.1 |
| | 9.5 | % | | 27.1 |
| | 7.5 | % | | 22.1 | % | | 123.9 |
| | 11.8 | % | | 32.2 |
| | 3.1 | % | | 284.8 | % |
| EBITDA | | | | | | | | | | | | | | | | | | | | | | | | | | | | | | | | | | | | | | |
| Integrated Solutions and Services | 54.0 |
| | 15.4 | % | | 51.3 |
| | 14.7 | % | | 5.3 | % | | 102.8 |
| | 14.7 | % | | 93.2 |
| | 13.9 | % | | 10.3 | % | 50.4 |
| | 14.5 | % | | 51.4 |
| | 14.3 | % | | (1.9 | )% | | 153.2 |
| | 14.7 | % | | 144.6 |
| | 14.0 | % | | 5.9 | % |
| Applied Product Technologies | 27.3 |
| | 7.8 | % | | 15.8 |
| | 4.5 | % | | 72.8 | % | | 94.0 |
| | 13.5 | % | | 24.6 |
| | 3.7 | % | | 282.1 | % | 27.1 |
| | 7.8 | % | | 26.9 |
| | 7.5 | % | | 0.7 | % | | 121.2 |
| | 11.6 | % | | 51.5 |
| | 5.0 | % | | 135.3 | % |
| Corporate and unallocated costs | (32.8 | ) | | (9.3 | )% | | (31.4 | ) | | (9.0 | )% | | 4.5 | % | | (53.5 | ) | | (7.7 | )% | | (65.4 | ) | | (9.7 | )% | | (18.2 | )% | (16.8 | ) | | (4.8 | )% | | (27.1 | ) | | (7.5 | )% | | (38.0 | )% | | (70.4 | ) | | (6.7 | )% | | (92.5 | ) | | (9.0 | )% | | (23.9 | )% |
| Total Consolidated | $ | 48.5 |
| | 13.8 | % | | $ | 35.7 |
| | 10.2 | % | | 35.9 | % | | $ | 143.3 |
| | 20.5 | % | | $ | 52.4 |
| | 7.8 | % | | 173.5 | % | $ | 60.7 |
| | 17.5 | % | | $ | 51.2 |
| | 14.2 | % | | 18.6 | % | | $ | 204.0 |
| | 19.5 | % | | $ | 103.6 |
| | 10.0 | % | | 96.9 | % |
Adjusted EBITDA is a non-GAAP financial measure. Adjusted EBITDA on a segment basis is defined as earnings before interest expense, income tax expense (benefit) and depreciation and amortization, adjusted for the impact of certain other items that have been reflected at the segment level. The following is a reconciliation of our segment Adjusted EBITDA to operating profit, its most directly comparable financial measure presented in accordance with GAAP:
| | | | Three Months Ended March 31, | | Six Months Ended March 31, | Three Months Ended June 30, | | Nine Months Ended June 30, |
| | 2020 | | 2019 | | 2020 | | 2019 | 2020 | | 2019 | | 2020 | | 2019 |
| | Integrated Solutions and Services | | Applied Product Technologies | | Integrated Solutions and Services | | Applied Product Technologies | | Integrated Solutions and Services | | Applied Product Technologies | | Integrated Solutions and Services | | Applied Product Technologies | Integrated Solutions and Services | | Applied Product Technologies | | Integrated Solutions and Services | | Applied Product Technologies | | Integrated Solutions and Services | | Applied Product Technologies | | Integrated Solutions and Services | | Applied Product Technologies |
| Operating Profit | $ | 36.7 |
| | $ | 23.8 |
| | $ | 37.0 |
| | $ | 11.3 |
| | $ | 69.8 |
| | $ | 86.9 |
| | $ | 64.9 |
| | $ | 15.8 |
| $ | 32.6 |
| | $ | 23.6 |
| | $ | 37.4 |
| | $ | 22.5 |
| | $ | 102.5 |
| | $ | 110.5 |
| | $ | 102.3 |
| | $ | 38.4 |
|
| Depreciation and amortization | 17.3 |
| | 3.5 |
| | 14.3 |
| | 4.5 |
| | 33.0 |
| | 7.1 |
| | 28.3 |
| | 8.8 |
| 17.8 |
| | 3.5 |
| | 14.0 |
| | 4.4 |
| | 50.7 |
| | 10.7 |
| | 42.3 |
| | 13.1 |
|
| EBITDA | $ | 54.0 |
| | $ | 27.3 |
| | $ | 51.3 |
| | $ | 15.8 |
| | $ | 102.8 |
| | $ | 94.0 |
| | $ | 93.2 |
| | $ | 24.6 |
| $ | 50.4 |
| | $ | 27.1 |
| | $ | 51.4 |
| | $ | 26.9 |
| | $ | 153.2 |
| | $ | 121.2 |
| | $ | 144.6 |
| | $ | 51.5 |
|
| Restructuring and related business transformation costs (a) | 0.1 |
| | 3.3 |
| | 0.1 |
| | 0.2 |
| | 0.1 |
| | 4.0 |
| | 0.4 |
| | 0.5 |
| 0.2 |
| | 1.6 |
| | — |
| | 0.2 |
| | 0.3 |
| | 5.6 |
| | 0.4 |
| | 0.7 |
|
| Transaction costs (b) | — |
| | — |
| | — |
| | — |
| | — |
| | (1.3 | ) | | 0.5 |
| | 0.7 |
| — |
| | 0.1 |
| | — |
| | — |
| | — |
| | (1.2 | ) | | 0.5 |
| | 0.7 |
|
| Other losses (gains) and expenses (c) | — |
| | (8.9 | ) | | — |
| | 5.2 |
| | — |
| | (59.2 | ) | | 0.2 |
| | 9.3 |
| — |
| | 0.1 |
| | — |
| | 0.2 |
| | — |
| | (59.1 | ) | | 0.1 |
| | 9.6 |
|
| Adjusted EBITDA (d) | $ | 54.1 |
| | $ | 21.7 |
| | $ | 51.4 |
| | $ | 21.2 |
| | $ | 102.9 |
| | $ | 37.5 |
| | $ | 94.3 |
| | $ | 35.1 |
| $ | 50.6 |
| | $ | 28.9 |
| | $ | 51.4 |
| | $ | 27.3 |
| | $ | 153.5 |
| | $ | 66.5 |
| | $ | 145.6 |
| | $ | 62.5 |
|
| |
| (a) | Represents costs and expenses in connection with restructuring initiatives distinct to our Integrated Solutions and Services and Applied Product Technologies segments in the three and sixnine months ended March 31,June 30, 2020 and 2019, respectively. Such expenses are primarily composed of severance and relocation costs. |
| |
| (b) | Represents costs associated with a change in the current estimate of certain acquisitions achieving their earn-out targets, which resulted in a (decrease) increase to the fair valued amount of the earn-out recorded upon acquisition, in the three and sixnine months ended March 31,June 30, 2020 and 2019, respectively, distinct to our Integrated Solutions and Services and Applied Product Technologies segments. |
| |
| (c) | Other losses, (gains) and expenses as discussed above in “How We Assess the Performance of Our Business-Adjusted EBITDA” distinct to our Integrated Solutions and Services (“ISS”) and Applied Product Technologies (“APT”) segments include the following: |
| | | | Three Months Ended March 31, | | Six Months Ended March 31, | Three Months Ended June 30, | | Nine Months Ended June 30, |
| | 2020 | | 2019 | | 2020 | | 2019 | 2020 | | 2019 | | 2020 | | 2019 |
| (In millions) | ISS | | APT | | ISS | | APT | | ISS | | APT | | ISS | | APT | ISS | | APT | | ISS | | APT | | ISS | | APT | | ISS | | APT |
| Net pre-tax benefit on sale of the Memcor product line | $ | — |
| | $ | (9.0 | ) | | $ | — |
| | $ | — |
| | $ | — |
| | $ | (58.0 | ) | | $ | — |
| | $ | — |
| $ | — |
| | $ | — |
| | $ | — |
| | $ | — |
| | $ | — |
| | $ | (58.0 | ) | | $ | — |
| | $ | — |
|
| Gain on sale of property | | — |
| | — |
| | — |
| | (0.4 | ) | | — |
| | — |
| | — |
| | (0.4 | ) |
| Remediation of manufacturing defects | — |
| | (0.1 | ) | | — |
| | 0.3 |
| | — |
| | (1.5 | ) | | — |
| | 1.3 |
| — |
| | — |
| | — |
| | 0.4 |
| | — |
| | (1.5 | ) | | — |
| | 1.7 |
|
| Product rationalization in electro-chlorination business | — |
| | 0.2 |
| | — |
| | (0.1 | ) | | — |
| | 0.3 |
| | — |
| | 3.0 |
| — |
| | 0.1 |
| | — |
| | 0.3 |
| | — |
| | 0.4 |
| | — |
| | 3.2 |
|
| Expenses related to maintaining non-operational business locations | — |
| | — |
| | — |
| | — |
| | — |
| | — |
| | 0.2 |
| | — |
| — |
| | — |
| | — |
| | — |
| | — |
| | — |
| | 0.1 |
| | — |
|
| Write-off of inventory | — |
| | — |
| | — |
| | 5.1 |
| | — |
| | — |
| | — |
| | 5.1 |
| — |
| | — |
| | — |
| | (0.1 | ) | | — |
| | — |
| | — |
| | 5.0 |
|
| Foreign exchange impact related to headquarter allocations | — |
| | — |
| | — |
| | (0.1 | ) | | — |
| | — |
| | — |
| | (0.1 | ) | — |
| | — |
| | — |
| | — |
| | — |
| | — |
| | — |
| | 0.1 |
|
| Total | $ | — |
| | $ | (8.9 | ) | | $ | — |
| | $ | 5.2 |
| | $ | — |
| | $ | (59.2 | ) | | $ | 0.2 |
| | $ | 9.3 |
| $ | — |
| | $ | 0.1 |
| | $ | — |
| | $ | 0.2 |
| | $ | — |
| | $ | (59.1 | ) | | $ | 0.1 |
| | $ | 9.6 |
|
| |
| (d) | For the definition of Adjusted EBITDA (a non-GAAP financial measure) and a reconciliation to net income (loss), its most directly comparable financial measure presented in accordance with GAAP, see “How We Assess the Performance of Our Business-Adjusted EBITDA.” Immaterial rounding differences may be present in the tables above. |
Integrated Solutions and Services
Revenues in the Integrated Solutions and Services segment increased $11.1$3.3 million, or 4.9%1.5%, to $237.9$228.7 million in the three months ended March 31,June 30, 2020 from $226.8$225.4 million in the three months ended March 31,June 30, 2019. The increase in revenue was mainly driven by growth in capital revenue of $7.7 million in addition to increased service revenue of $2.8$11.7 million, exclusive of acquisitions, whichthe Frontier acquisition. These increases were primarily driven by continued to be augmented by price realization. Our recent investmentstrong demand for water solutions and systems in the microelectronics end market. The Frontier acquisition resulted in an additionalanother increase of $1.1$1.4 million of revenue. These increases were offset by a slight decline in aftermarketservice revenue of $0.5$8.8 million. The segment saw stable but uneven demanddecline was evenly driven by the timing of completion of certain large projects in the prior year, as a resultwell as the impact of the COVID-19 pandemic during the latter half of March. The segment saw increases in volume in healthcare related end markets, partly offset by declinesshut down and delays, primarily in the refining and oil and gas end markets. Demand in the power, microelectronics, food & beverage and municipal end markets, remained stable through the period.offset somewhat by price realization related to established service contracts. Finally, aftermarket revenue saw a decline of $1.0 million.
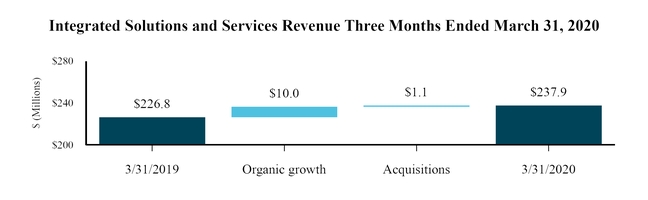
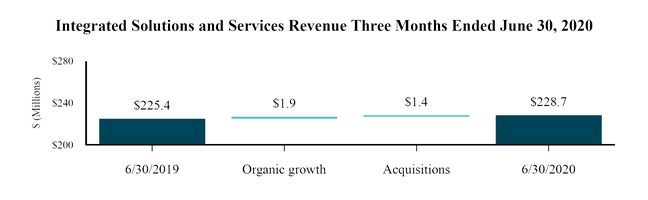
Revenues in the Integrated Solutions and Services segment increased $28.7$31.9 million, or 6.6%4.8%, to $466.0$694.7 million in the sixnine months ended March 31,June 30, 2020 from $437.3$662.8 million in the sixnine months ended March 31,June 30, 2019. The increase in revenue was driven by stronger capital growth of $18.6$30.0 million, exclusive of acquisitions, primarily related to projects in the microelectronics end market. In addition, to service growth of $9.6$1.0 million which was augmenteda combination of price realization offset by price realization.
timing of large projects completed in the prior year as well as the impact of COVID-19 shut-downs and delays, primarily in the refining and oil and gas end markets. Our recent investment in Frontier resulted in an additional increase of $2.3$3.7 million of revenue. These increases were offset by a reduction in aftermarket revenue of $1.8$2.8 million.
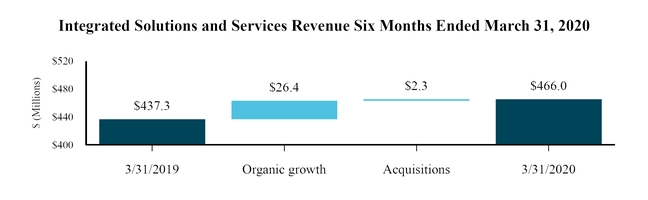
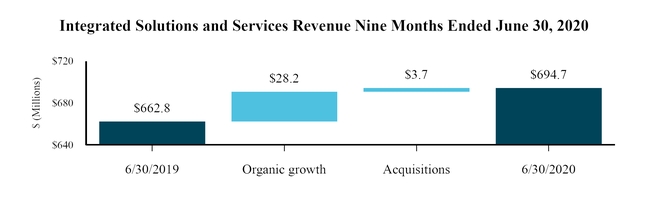
Operating profit in the Integrated Solutions and Services segment decreased $0.3$4.8 million, or 0.8%12.8%, to $36.7$32.6 million in the three months ended March 31,June 30, 2020 from $37.0$37.4 million in the three months ended March 31,June 30, 2019. Segment profitability was impacted by $2.8 million of operational variances related to lower service volumes and productivity due to customer shutdowns and enhanced safety protocols as well as $2.9 million related to increased employee related expenses, offset by $2.1 million of cost containment measures implemented in response to the uncertainties of COVID-19. Additionally, higher depreciation and amortization expense resulted in another reduction of profit of $3.8 million. These decreases were partially offset by $2.6 million profit in the period driven by increased organic and acquisition related revenue volume, augmented by improved pricing.
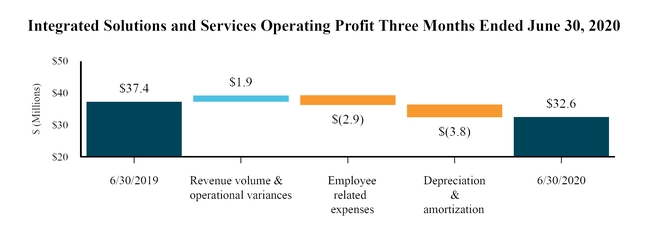
Operating profit in the Integrated Solutions and Services segment increased $0.2 million, or 0.2%, to $102.5 million in the nine months ended June 30, 2020 from $102.3 million in the nine months ended June 30, 2019. Segment profitability improved $6.5$16.7 million in the period driven by increased organic and acquisition related revenue volume, augmented by improved pricing, and favorable change in product mix drivenoffset by the higher service volumes. Negative
drivers to profitability were increased employee related expenses$2.8 million of $3.8 million and higher depreciation and amortization expense of $3.0 million.
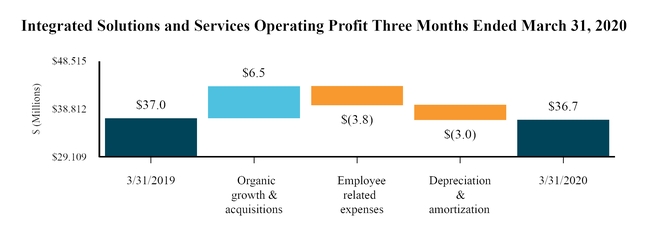
Operating profitoperational variances in the Integrated Solutionscurrent quarter related to lower service volumes and Services segment increased $4.9productivity due to customer shutdowns and enhanced safety protocols. The current period negative impacts were somewhat mitigated by $2.1 million or 7.6%,of cost containment measures implemented in response to $69.8 million in the six months ended March 31, 2020 from $64.9 million in the six months ended March 31, 2019. Segment profitability improved $13.8 million in the period driven by increased organic and acquisition related revenue volume, augmented by improved pricing, and favorable change in product mix driven by the higher service volumes.uncertainties of COVID-19. Profitability in the current year was also favorably impacted by the non-recurrence of $0.5 million of charges related to the achievement of earn-out targets associated with the Pure Water acquisition, in addition to the non-recurrence of other charges noted in the prior year of approximately $0.5$0.2 million related to restructuring and inactive sites. Negative drivers to profitability were increased employee related expenses of $5.2$8.1 million and higher depreciation and amortization expense of $4.7$8.4 million.
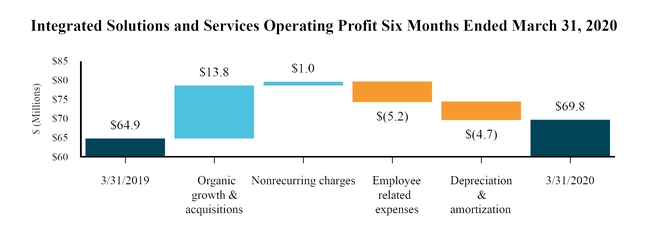
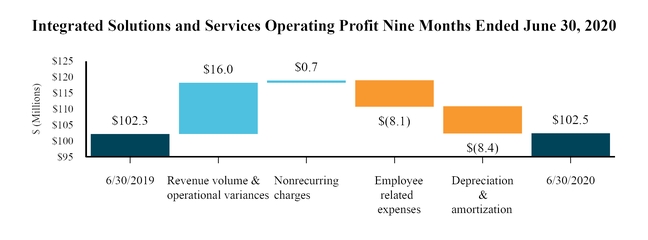
EBITDA in the Integrated Solutions and Services segment increased $2.7decreased $1.0 million, or 5.3%1.9%, to $54.0$50.4 million in the three months ended March 31,June 30, 2020, compared to $51.3$51.4 million in the three months ended March 31,June 30, 2019 and increased $9.6$8.6 million, or 10.3%5.9%, to $102.8$153.2 million in the sixnine months ended March 31,June 30, 2020, compared to $93.2$144.6 million in the sixnine months ended March 31,June 30, 2019.
Applied Product Technologies
Revenues in the Applied Product Technologies segment decreased $8.0$15.8 million, or 6.6%11.7%, to $113.8$119.1 million in the three months ended March 31,June 30, 2020 from $121.8$134.9 million in the three months ended March 31,June 30, 2019. The impact from the divestiture of the Memcor product line and the acquisition of ATG UV resulted in a net reduction in revenue of $8.1$11.1 million. Additionally, APTThe segment also saw an unfavorable foreign currency translation impact of $1.4 million. Additionally, revenue declined across multiple product lines in both the Americas and EMEA regions by $3.6 million and $1.7 million, respectively, mainly due to COVID-19 related site closures and delays. These decreases were partially
offset by organic revenue growth by an increase in both EMEAAsia Pacific of $5.4$2.0 million, driven by volume in the Anodes and Aquatics & Electrochlorination product lines, andas demand improved in the Americas region of $1.8 million across multiple product lines, partially offset by a decline in Asia Pacific of $5.7 million, mainly due to COVID-19 related slow down and delays.as it recovers from COVID-19.
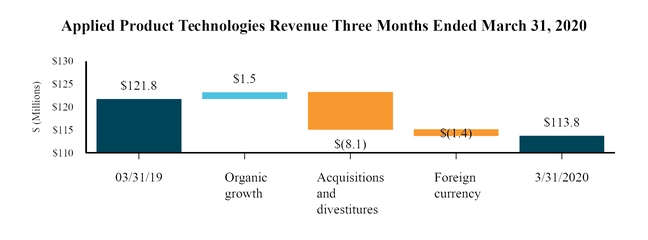
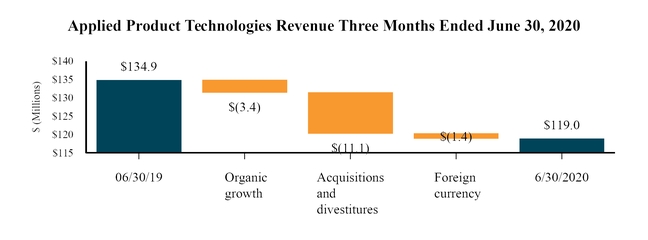
Revenues in the Applied Product Technologies segment decreased $2.5$18.3 million to $231.8$350.9 million in the sixnine months ended March 31,June 30, 2020 from $234.3$369.2 million in the sixnine months ended March 31,June 30, 2019. The divestiture of the Memcor product line and the acquisition of ATG UV resulted in a net reduction in revenue of $4.1$15.2 million. Organic revenue grew in EMEA by $6.6Additionally, organic revenues were down $3.3 million driven by capital volume in Aquatics & Electrochlorination product lines and $1.2 million in the Americas region by $0.3 million, partially offset by a decline inand Asia Pacific of $3.2 millionregions, respectfully, predominantly due to COVID-19 slow down and delays. These increases were partially offset byThe segment also saw an unfavorable foreign currency translation impact of $2.1$3.5 million. These declines were partially offset by organic revenue growth in EMEA of $4.9 million.
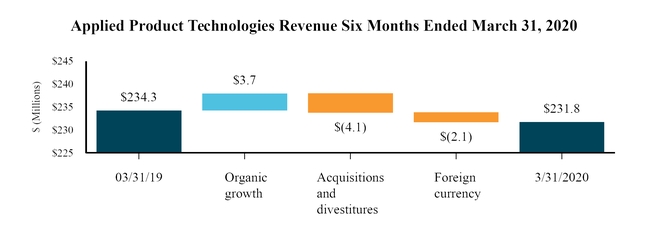
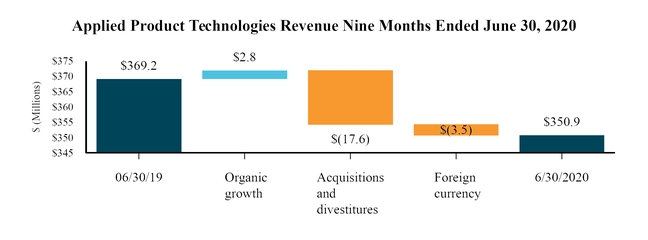
Operating profit in the Applied Product Technologies segment increased $12.5$1.1 million, or 110.6%4.9%, to $23.8$23.6 million in the three months ended March 31,June 30, 2020 from $11.3$22.5 million in the three months ended March 31,June 30, 2019. The increase is mainly due to the the additional funds received as a result of the net working capital settlement related to the net pre-tax benefit on sale of the Memcor product line of $9.0 million. Increased profit was also driven by volume and mix performance augmented by improved pricing,and price of $6.4$3.2 million, operational performance improvements of $1.0 million, employee & other cost variances of $0.7 million, in addition to lower depreciation of $1.0 million and $0.5 million$0.9 million. These increases were offset by a volume impact of net benefit from the$2.3 million. The divestiture of the Memcor product line and the acquisition of ATG UV. These increases were offset by operational variances of $2.6 million, increased employee related expensesUV resulted in a net reduction of $0.8 million, and $0.3$0.2 million ofin unfavorable foreign currency.
Further operating profit decreases were due to one-time costs of $0.7$1.8 million related to:
An increase in restructuring charges of $3.1$1.4 million primarily due to costs incurred following the sale of the Memcor product line;
An increase in costs related to charges incurred by the Company related to product rationalization in its electro-chlorination business of $0.3 million; and
Release of an acquisition related contingency due to the passage of time in the prior year for $2.8 million.
These increases were partially offset by:
Reduction in costs incurred by the Company related to the write–off of inventoryA gain on sale recorded in the prior year of $5.1$0.4 million, associated with product rationalizationwhich did not reoccur in the current year; and facility consolidation; and
An increase of $0.1 million related to charges related to the achievement of earn-out targets on a prior acquisition.
These decreases were partially offset by:
A reduction in costs incurred by the Company in the prior year from a settlement with a third-party vendor associated with remediation of manufacturing defects caused by the vendor of $0.4 million.
| |
| • | Other non-recurring charges related to product rationalization that declined by $0.1 million as compared to the prior year period. |
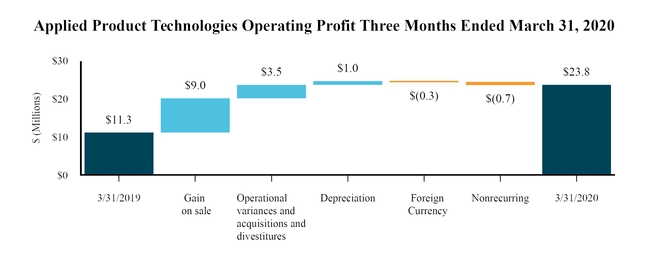
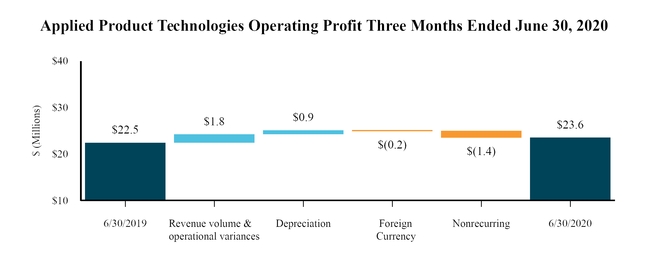
Operating profit in the Applied Product Technologies segment increased $71.1$72.1 million, or 450.0%187.8%, to $86.9$110.5 million in the sixnine months ended March 31,June 30, 2020 from $15.8$38.4 million in the sixnine months ended March 31,June 30, 2019. The increase is mainly due to the net pre-tax benefit on sale of the Memcor product line of $58.0 million, which is net of $8.3 million of discretionary compensation payments to employees in connection with the transaction and $1.0 million in transaction costs incurred. Increased profit was also driven by volume and mix performance, augmented by improved pricing, of $8.1$9.0 million, in addition to a $1.1$0.3 million net benefit from the divestiture of the Memcor product line and the acquisition of ATG UV and lower depreciation of $1.7$2.4 million. Further increases were due to net reductions in nonrecurring costs of $6.3$5.3 million related to:
Reduction in costs incurred by the Company related to the write–off of inventory in the prior year of $5.1$5.0 million associated with product rationalization and facility consolidation;
A reduction in costs incurred by the Company from a settlement with a third-party vendor associated with remediation of manufacturing defects caused by the vendor of $2.8$3.2 million;
Reductions in costs related to the achievement of earn-out targets associated with certain acquisitions of $2.0$1.9 million;
Reductions in product rationalization costs related to charges incurred by the Company related to product rationalization in its electro-chlorination business of $2.7$2.8 million;
A gain on sale recorded in the prior year of $0.4 million which did not reoccur in the current year;
Increases in restructuring charges of $3.5$4.9 million primarily due to costs incurred following the sale of the Memcor product line; and
Release of an acquisition related contingency due to the passage of time in the prior year for $2.8 million.
Operating profit was reduced by operational variances of $2.9 million,inflation and employee related costs increased $0.8$0.6 million, and foreign currency of $0.4$0.5 million, and operational variances of $1.6 million.
EBITDA in the Applied Product Technologies segment increased $11.5$0.2 million, or 72.8%0.7%, to $27.3$27.1 million in the three months ended March 31,June 30, 2020, compared to $15.8$26.9 million in the three months ended March 31,June 30, 2019. EBITDA in the Applied Product Technologies segment increased $69.4$69.7 million, or 282.1%135.3%, to $94.0$121.2 million in the sixnine months ended March 31,June 30, 2020, compared to $24.6$51.5 million in the sixnine months ended March 31,June 30, 2019.
Liquidity and Capital Resources
Liquidity describes the ability of a company to generate sufficient cash flows to meet the cash requirements of its business operations, including working capital needs, debt service, acquisitions, other commitments and contractual obligations. We consider liquidity in terms of cash flows from operations and their sufficiency to fund our operating and investing activities.
Our principal sources of liquidity are our cash generated by operating activities and borrowings under our Revolving Credit Facility. Historically, we have financed our operations primarily from cash generated from operations and periodic borrowings under our $125.0 million Revolving Credit Facility. Our primary cash needs are for day to day operations, to pay interest and principal on our indebtedness, to fund working capital requirements and to make capital expenditures.
As part of our ongoing efforts to improve our cash flow and related liquidity, we work with suppliers to optimize our terms and conditions, including some timesoccasionally extending payment terms. We also facilitate a voluntary supply chain finance program (the “program”) to provide certain of our suppliers with the opportunity to sell receivables due from us to participating financial institutions at the sole discretion of both the suppliers and the financial institutions. A third party administers the program; our responsibility is limited to making payment on the terms originally negotiated with our supplier, regardless of whether the supplier sells its receivable to a financial institution. We do not enter into agreements with any of the participating financial institutions in connection with the program. The range of payment terms we negotiate with our suppliers is consistent, irrespective of whether a supplier participates in the program. The March 31June 30 year to date amounts settled through the program and paid to participating financial institutions were $15.7$24.1 million, and $0$0.2 million in fiscal 2020 and fiscal 2019, respectively. A downgrade in our credit rating or changes in the financial markets could limit the financial institutions’ willingness to commit to participation in the program.
We expect to continue to finance our liquidity requirements through internally generated funds, borrowings under our Revolving Credit Facility and equipment financing arrangements. We believe that our projected cash flows generated from operations, together with borrowings under our Revolving Credit Facility and other financing arrangements are sufficient to fund our principal debt payments, interest expense, our working capital needs and our expected capital
expenditures for the next twelve months. Our capital expenditures for the sixnine months ended March 31,June 30, 2020 and 2019 were $38.8$65.9 million and $40.7$63.9 million, respectively. However, our budgeted capital expenditures can vary from period to period based on the nature of capital intensive project awards. From time to time, we may enter into financing arrangements related
to capital expenditures for equipment used to provide services to our customers. In addition, we may draw on our Revolving Credit Facility from time to time to fund or partially fund an acquisition.
As of March 31,June 30, 2020, we had total indebtedness of $879.5$879.9 million, including $824.0$821.6 million of borrowings under the First Lien Term Loan Facility, no borrowings under our Revolving Credit Facility, $53.2$56.0 million in borrowings related to equipment financing, $0.7 million of notes payable related to certain equipment related contracts and $1.6 million related to a mortgage. We also had $12.0$11.9 million of letters of credit issued under our $125.0 million Revolving Credit Facility and an additional $49$51 thousand of letters of credit issued under a separate uncommitted facility as of March 31,June 30, 2020.
Our senior secured credit facilities contain a number of covenants imposing certain restrictions on our business. These restrictions may affect our ability to operate our business and may limit our ability to take advantage of potential business opportunities as they arise. The restrictions these covenants place on our business operations, include limitations on our or our subsidiaries’ ability to:
incur or guarantee additional indebtedness;
make certain investments;
pay dividends or make distributions on our capital stock;
sell assets, including capital stock of restricted subsidiaries;
agree to payment restrictions affecting our restricted subsidiaries;
consolidate, merge, sell or otherwise dispose of all or substantially all of our assets;
enter into transactions with our affiliates;
incur liens; or
designate any of our subsidiaries as unrestricted subsidiaries.
We are a holding company and do not conduct any business operations of our own. As a result, our ability to pay cash dividends on our common stock, if any, is dependent upon cash dividends and distributions and other transfers from our operating subsidiaries. Under the terms of our senior secured credit facilities, our operating subsidiaries are currently limited in their ability to pay cash dividends to us, and we expect these limitations to continue in the future under the terms of any future credit agreement or any future debt or preferred equity securities of ours or of our subsidiaries.
In addition, our Revolving Credit Facility, but not the First Lien Term Loan Facility, contains a financial covenant which requires us to comply with the maximum first lien net leverage ratio of 5.55 to 1.00 as of the last day of any quarter on which the aggregate amount of revolving loans and letters of credit outstanding under the Revolving Credit Facility (net of cash collateralized letters of credit and undrawn outstanding letters of credit in an amount of up to 50% of the Revolving Credit Facility) exceeds 25% of the total commitments thereunder.
As of March 31,June 30, 2020 and September 30, 2019, we were in compliance with the covenants contained in the senior secured credit facilities.
Our indebtedness could adversely affect our ability to raise additional capital, limit our ability to react to changes in the economy or our industry, expose us to interest rate risk and prevent us from meeting our obligations.
Cash Flows
The following table summarizes the changes to our cash flows for the periods presented:
| | | | Six Months Ended
March 31, | Nine Months Ended
June 30, |
| (In millions) | 2020 | | 2019 | 2020 | | 2019 |
| Statement of Cash Flows Data | | |
| Net cash provided by operating activities | $ | 22.0 |
| | $ | 27.3 |
| $ | 82.5 |
| | $ | 54.4 |
|
| Net cash provided by (used in) investing activities | 68.6 |
| | (38.6 | ) | 41.8 |
| | (68.7 | ) |
| Net cash used in financing activities | (91.5 | ) | | (4.0 | ) | (92.2 | ) | | (6.6 | ) |
| Effect of exchange rate changes on cash | (0.5 | ) | | (0.3 | ) | 0.8 |
| | (0.3 | ) |
| Change in cash and cash equivalents | $ | (1.4 | ) | | $ | (15.6 | ) | $ | 32.9 |
| | $ | (21.2 | ) |
Operating Activities
Cash flows from operating activities can fluctuate significantly from period‑to‑period as working capital needs and the timing of payments for restructuring activities and other items impact reported cash flows.
Net cash provided by operating activities decreasedincreased to a source of $22.0$82.5 million in the sixnine months ended March 31,June 30, 2020 from a source of $27.3$54.4 million in the sixnine months ended March 31,June 30, 2019.
Operating cash flows in the sixnine months ended March 31,June 30, 2020 reflect an increase in net earnings of $76.1$93.7 million as compared to the sixnine months ended March 31,June 30, 2019, primarily driven by the sale of the Memcor product line.
Non‑The add back of non‑cash items reducedincreased operating cash flows by $6.0$20.9 million in the sixnine months ended March 31,June 30, 2020 as compared to an increase to operating cash flows of $51.4$86.9 million in the sixnine months ended March 31,June 30, 2019, resulting in an overall reduction of $57.4$65.9 million. This reduction was primarily driven by the adjustment for gain on sale of business, offset by an increase in depreciation and amortization expense. Non-cash changes also include the foreign currency translation gain or loss.loss and share-based compensation.
The aggregate of receivables, inventories, contract assets and liabilities and accounts payable used $14.8$17.3 million in operating cash flows in the sixnine months ended March 31,June 30, 2020 compared to a use of $4.8$6.8 million in operating cash flows in the sixnine months ended March 31,June 30, 2019.
| |
| ◦ | Accounts receivable and payable was a source of $12.9 million |
| |
| ◦ | Inventories had a use of $7.9 million |
| |
| ◦ | Contract assets and liabilities had a use of $15.5 million |
The amount of cash flow generated from or used by the above mentioned accounts depends upon how effectively we manage our cash conversion cycle, which is a representation of the number of days that elapse from the date of purchase of raw materials and components to the collection of cash from customers. Our cash conversion cycle can be significantly impacted by the timing of collections and payments in a period.
| |
| • | Income taxes provided $1.6 million during the nine months ended June 30, 2020, as compared to using $6.8 million during the nine months ended June 30, 2019, resulting in an increase to cash flows of $8.4 million. |
The aggregate of prepaid expense and other current assets, income taxes and other non currentthe remaining assets and liabilities provided $1.8used $6.0 million inof operating cash flows in the sixnine months ended March 31,June 30, 2020 compared to $6.6$8.4 million provided in the sixnine months ended March 31,June 30, 2019. This is mainly due to timing of payments.
Accrued expenses and other liabilities used $16.8 million in operating cash flows in the six months ended March 31, 2020 compared to a use of $11.2 million in the six months ended March 31, 2019, mainly due to timing of payments. | |
| ◦ | Prepaids and other current assets and Other non‑current assets and liabilities provided $13.9 million during the nine months ended June 30, 2020, as compared to $11.1 million during the nine months ended June 30, 2019, resulting in an increase to cash flows of $2.8 million. |
| |
| ◦ | Accrued expenses and other liabilities used $19.9 million in operating cash flows in the nine months ended June 30, 2020 compared to a use of $19.6 million in the nine months ended June 30, 2019, resulting in a decrease to cash flows of $0.3 million. |
Investing Activities
Net cash provided by investing activities increased $107.3$110.4 million to $68.6$41.8 million in the sixnine months ended March 31,June 30, 2020 from a use of $38.7$68.7 million in the sixnine months ended March 31,June 30, 2019. This increase was largely driven by proceeds from the sale of the Memcor product line during the sixnine months ended March 31,June 30, 2020, partially offset by lower cash outflow associated with the Frontier acquisition in the current year period. Other activity related to purchase of capital or intangible assets remained relatively consistent with the prior period.
Financing Activities
Net cash used in financing activities decreased $87.5increased $85.6 million to a use of $91.5$92.2 million in the sixnine months ended March 31,June 30, 2020 from a use of $4.0$6.6 million in the sixnine months ended March 31,June 30, 2019. This loweradditional amount of cash used in financing activities for the sixnine months ended March 31,June 30, 2020 was primarily due to the $100 million debt payment and and increased distribution of dividends to non-controlling interest, offset by cash received from common stock.
Seasonality
Our business has historically exhibited seasonality resulting from our customers’ increasing demand for our products and services during the spring and summer months as compared to the fall and winter months. For example, our business servicing municipal customers experiences increased demand for our odor control product lines and services in the warmer months which, together with other factors, has historically resulted in improved performance in the second half of our fiscal year. Inclement weather, such as hurricanes, droughts and floods, can also drive increased demand for our products and services. As a result, our results from operations may vary from period to period.
Seasonal trends historically displayed by our business could be impacted by the COVID-19 pandemic, and past performance should not be considered indicative of future results. For example, decreased customer demand resulting from the economic slowdown caused by the pandemic and the measures taken to control its spread could negate the seasonal factors that have historically resulted in improved performance in the second half of our fiscal year.
Off‑Balance Sheet Arrangements
As of March 31,June 30, 2020 and September 30, 2019, we had letters of credit totaling $12.0$11.9 million and $13.2$13.5 million, respectively, and surety bonds totaling $146.4$148.1 million and $144.7 million, respectively, outstanding under our credit arrangements. The longest maturity date of the letters of credit and surety bonds in effect as of March 31,June 30, 2020 was March 20, 2030.
Critical Accounting Policies and Estimates
See Note 2, “Summary of Significant Accounting Policies”in the Unaudited Consolidated Financial Statements in Item 1 of this Report for a complete discussion of our significant accounting policies and recent accounting pronouncements.
Item 3. Quantitative and Qualitative Disclosures about Market Risk
We have market risk exposure arising from changes in interest rates on our senior secured credit facilities, which bear interest at rates that are benchmarked against LIBOR. In November 2018,the third quarter of 2020, the Company entered into an interest rate capswap to mitigate risks associated with variable rate debt. The LIBOR interest rate capswap has a notional valuefive-year term to hedge the variability of $600interest payments on the first $500.0 million is effective for a period of three yearsthe Company’s senior secured debt and has a strike price of 3.5%fixes the variable LIBOR rate to 0.5455%.
Based on our overall interest rate exposure to variable rate debt outstanding of $824.0$821.6 million as of March 31,June 30, 2020, a 1% increase or decrease in interest rates would decrease or increase income (loss) before income taxes by approximately $8.3 million. By comparison, based on our overall interest rate exposure to variable rate debt outstanding of $933.5$931.1 million as of March 31,June 30, 2019, a 1% increase or decrease in interest rates would have decreased or increased income (loss) before income taxes by approximately $9.4 million.
For a discussion of the Company’s exposure to market risk related to inflation, tariffs and foreign currency exchange rates, please refer to Part II, Item 7A, “Quantitative and Qualitative Disclosures About Market Risk,” of our Annual Report on Form 10-K for the fiscal year ended September 30, 2019, as filed with the SEC on November 25, 2019. There have been no material changes to the Company’s exposure to these market risks during the first halfnine months of fiscal 2020.
Item 4. Controls and Procedures.
Evaluation of Disclosure Controls and Procedures
Our disclosure controls and procedures (as defined in Rules 13a-15(e) or 15d-15(e) under the Securities Exchange Act of 1934, as amended) are designed to ensure that information required to be disclosed in the reports that we file or submit under the Exchange Act is recorded, processed, summarized, and reported within the time periods specified in the rules and forms of the Securities and Exchange Commission and to ensure that information required to be disclosed is accumulated and communicated to management, including our principal executive and financial officers, to allow timely decisions regarding disclosure. Our management has evaluated, under the supervision and with the participation of our Chief Executive Officer (“CEO”) and Chief Financial Officer (“CFO”), the effectiveness of our disclosure controls and procedures as of the end of the period covered by this Report and, based on their evaluation, have concluded that the disclosure controls and procedures were effective as of such date.
While our disclosure controls and procedures are designed to provide reasonable assurance of their effectiveness, because of the inherent limitations in all control systems, no evaluation of controls can provide absolute assurance that all control issues and instances of fraud, if any, within the Company have been detected.
Changes to Internal Control Over Financial Reporting
There were no changes in our internal control over financial reporting that occurred during the quarterly period ended March 31,June 30, 2020 that have materially affected, or are reasonably likely to materially affect, our internal control over financial reporting.
Part II - Other Information
Item 1. Legal Proceedings
From time to time, we are subject to various claims, charges and litigation matters that arise in the ordinary course of business. We believe these actions are a normal incident of the nature and kind of business in which we are engaged. While it is not feasible to predict the outcome of these matters with certainty, we do not believe that any asserted or unasserted legal claims or proceedings, individually or in the aggregate, will have a material adverse effect on our business, financial condition, results of operations or prospects.
On or around November 6, 2018, a purported shareholder of the Company filed a class action lawsuit in the U.S. District Court for the Southern District of New York, captioned McWilliams v. Evoqua Water Technologies Corp., et al., Case No. 1:18-CV-10320, alleging that the Company and senior management violated federal securities laws. On January 31, 2019, the court appointed lead plaintiffs and lead counsel in connection with the action and captioned the action “In re Evoqua Water Technologies Corp. Securities Litigation,” Master File No. 1:18-CV-10320. On March 28, 2019, lead plaintiffs filed an amended complaint, which asserts claims pursuant to the Securities Exchange Act of 1934 (the “Exchange Act”) and the Securities Act of 1933 (the “Securities Act”) against the Company, members of the Company’s Board of Directors, senior management, other executives and/or employees, AEA Investors LP and a number of its affiliated entities, and the underwriters of the Company’s initial public offering and secondary public offering. The amended complaint alleges that the defendants violated federal securities laws by issuing false, misleading, and/or omissive disclosures concerning the Company’s integration of acquired companies, the Company’s reduction-in-force, and the Company’s accounting practices. The lawsuit seeks compensatory damages in an unspecified amount to be proved at trial, an award of reasonable costs and expenses to the plaintiff and class counsel, and such other relief as the court may deem just and proper. On June 26, 2019, the defendants filed motions to dismiss the amended complaint. Briefing in connection with the motions to dismiss was completed on October 4, 2019. On March 30, 2020, the Court granted the motions to dismiss the Exchange Act claims and denied the motions to dismiss the Securities Act claims. The Company believes that this lawsuit is without merit and intends to vigorously defend itself against the allegations.
On or around April 10, 2019, a purported shareholder of the Company filed a shareholder derivative lawsuit ostensibly on behalf of the Company in the U.S. District Court for the Western District of Pennsylvania, captioned Dallas Torgersen, derivatively on behalf of Evoqua Water Technologies Corp. v. Ronald C. Keating, et al., Case No. 2:19-CV-410. The complaint names as defendants the Company’s CEO, the Company’s CFO, and members of the Company’s Board of Directors, and it names the Company as a nominal defendant. The complaint alleges, among other things, that the individual defendants violated federal securities laws by issuing false, misleading, and/or omissive disclosures in the period leading up to the Company’s October 30, 2018 disclosure and that they breached their fiduciary duties to the Company. The lawsuit seeks compensatory damages in an unspecified amount to be proved at trial, an award of reasonable costs and expenses, restitution from the individual defendants, an order directing the Company and the individual defendants to take all necessary actions to reform and improve the Company’s corporate governance and internal procedures to comply with the law and to prevent the events alleged from reoccurring, including by putting forth for shareholder vote certain resolutions for amendments to the Company’s charter or bylaws, and such other relief as the court may deem just and proper. On June 14, 2019, the Court entered an order staying the lawsuit pending resolution of the In re Evoqua Water Technologies Corp. Securities Litigation lawsuit described above. The Company believes that this lawsuit is without merit and intends to vigorously defend itself against the allegations.
On or around July 27, 2020, a purported shareholder of the Company filed a shareholder derivative lawsuit ostensibly on behalf of the Company in the U.S. District Court for the Western District of Pennsylvania, captioned Robert Hyams, derivatively on behalf of Evoqua Water Technologies Corp. v. Ronald C. Keating, et al., Case No. 2:20-CV-1112. The complaint names as defendants the Company’s CEO, the Company’s CFO, members of the Company’s Board of Directors, and AEA Investors LP and a number of its affiliated entities, and it names the Company as a nominal defendant. The complaint alleges, among other things, that the defendants violated federal securities laws by issuing false, misleading, and/or omissive disclosures in the period leading up to the Company’s October 30, 2018 disclosure and that they breached their fiduciary duties to the Company. The lawsuit seeks compensatory damages in an unspecified amount to be proved at trial, an award of reasonable costs and expenses, restitution from the individual defendants, an order directing the Company and the individual defendants to take all necessary actions to reform and improve the Company’s corporate governance and internal procedures to comply with the law and to prevent the events alleged from reoccurring, including by putting forth
for shareholder vote certain resolutions for amendments to the Company’s charter or bylaws, and such other relief as the court may deem just and proper. The Company believes that this lawsuit is without merit and intends to vigorously defend itself against the allegations.
Item 1A. Risk Factors
The following additional risk factors should be read in conjunction with the risk factors previously disclosed in Part I, Item1A. “Risk Factors” of our Annual Report on Form 10-K for the fiscal year ended September 30, 2019, as filed with the SEC on November 25, 2019, and the information contained in this Quarterly Report on Form 10-Q and our other reports and registration statements filed with the SEC. Any one or more of such factors could directly or indirectly cause our actual results of operations and financial condition to vary materially from past or anticipated future results of operations and financial condition. Any of these factors, in whole or in part, could materially and adversely affect our business, financial condition, results of operations or prospects. Aside from the risk factors described below, as of the date hereof, we do not
believe there thereThere have been no material changes to the information concerning risk factors as stated in our Annual Report on Form 10-K for the fiscal year ended September 30, 2019, as filed with the SEC on November 25, 2019.
The COVID-19 pandemic and other future public health crises or pandemics could materially and adversely affect our business, results of operations and financial condition.
The COVID-19 pandemic has caused a global economic slowdown,2019, as efforts to control the spread of the virus have resulted in mandatory closures of certain businesses, “shelter in place” and “stay at home” orders forcing employees to work remotely, significant travel restrictions and global supply chain disruptions. Given the evolving nature of this unprecedented pandemic, the ultimate impactamended on our operations cannot be reasonably estimated at this time. The pandemic and the measures implemented to control its spread have impacted and will likely continue to impact certain of our customers’ and suppliers’ operations, some of whom may face extended financial hardships. Depending on the extent of the impact, this could decrease customer demand for our products and services, limit our access to our customers’ sites and put at risk our ability to collect from customers amounts due for products and services provided to them. Similarly, it could limit our suppliers’ ability to provide the materials that we need to manufacture and deliver certain products to our customers, in which case we may need to seek alternate suppliers, which could result in cost increases and delays in shipments. These impacts on our customers and suppliers could negatively affect our liquidity, sales and profitability and have a material adverse effect on our overall business and financial condition.
The COVID-19 pandemic has also heightened risks associated with our internal operations. Our service technicians enter high-risk areas such as hospitals and testing laboratories. Although we are closely monitoring and following guidance from public health officials related to personal safety, preventative measures and personal protective equipment, these service technicians are at greater risk of exposure to the virus. An outbreak among our service technician population or an outbreak among employees at any of our manufacturing facilities, which may require us to suspend or reduce operations at that facility, could have a material adverse effect on our overall business and financial condition. We may also experience decreased productivity due to fear among our employees to return to work at our service branches, manufacturing facilities and office locations as a result of the pandemic. Additionally, a large number of our employees are working remotely as a result of restrictions imposed to control the spread of the virus. This could result in decreased employee efficiency and increased cyber-security risk, each of which could have a material adverse effect on our overall business and financial condition.
The equity markets in the United States are experiencing volatility due to the COVID-19 pandemic and as a result, the market price of our common stock may decline. Additionally, any increased uncertainty may result in a sustained global recession and may impact our ability to access the capital marketsDecember 4, 2019, and our usual sources of liquidityQuarterly Report on reasonable terms, or at all.
AlthoughForm 10-Q for the COVID-19 pandemic did not have a material impact on our consolidated results of operations in the three monthsquarter ended March 31, 2020, the future impact of this outbreak is highly uncertain and cannot be predicted. If COVID-19 continues to spread, or if the duration of the disruption is prolonged, our business, financial condition, results of operations or prospects could be materially adversely affected. Even after the COVID-19 outbreak has subsided, we may continue to experience impacts to our business and our financial results in subsequent quarters due to the pandemic’s impact on the global economy and on certain markets that we serve. Because this pandemic is unprecedented and continuously evolving, COVID-19 may also affect our operating and financial results in a manner that is not presently known to us or not presently considered to be a significant risk to our operations.
Our operations in China expose us to risks inherent in doing business there.
We currently have operations and source and manufacture certain of our materials and products for global distribution from third-party suppliers and manufacturers in China. Operating in China exposes us to certain political, legal and economic risks, including risks resulting from disease or public health crises. For example, in December 2019, a strain of coronavirus (COVID-19) was reported to have surfaced in Wuhan, China, which has and is continuing to spread throughout China and other parts of the world, including the United States. Although we do not believe that the COVID-19 outbreak of the coronavirus within China has had a material adverse impact on our operations to date, the future impact of this pandemic is highly uncertain and cannot be predicted but our sales to and operations in China may be impacted. For additional risks relating to the outbreak of COVID-19, please see the risk factor titled “The COVID-19 pandemic and other future
public health crises or pandemics could materially and adversely affect our business, results of operations and financial condition.”
Our ability to operate in China may be adversely affected by changes in U.S. and Chinese laws and regulations such as those related to, among other things, taxation, import and export tariffs, environmental regulations, land use rights, intellectual property, currency controls, network security, employee benefits and other matters, and we may not obtain or retain the requisite legal permits to continue to operate in China or we may become subject to costs or operational limitations imposed in connection with obtaining and complying with such permits. We may experience difficulty in establishing management, legal and financial controls, collecting financial data and preparing financial statements, books of account and corporate records and instituting business practices that meet U.S. and international standards. We may also experience difficulty in managing relations with our employees, distributors, suppliers or customers, with whom disagreements or conflicts of interest could materially adversely affect our operations or our ability to source and manufacture certain of our materials and products in China. Further, the third parties we rely on in China may disclose our confidential information or intellectual property to competitors or third parties, which could result in the illegal distribution and sale of counterfeit versions of our products. Any of these factors could have a material adverse effect on our business, financial condition, results of operations or prospects.
Additionally, the rapid development of the Chinese economy has led to increased labor costs, and the cost of labor in China may continue to increase in the future. Our results of operations will be materially and adversely affected if our labor costs, or the labor costs of our suppliers and manufacturers, increase significantly. We and our manufacturers and suppliers may be unable to find a sufficient number of qualified workers due to the intensely competitive and fluid market for skilled labor in China. Furthermore, pursuant to Chinese labor laws, employers in China are subject to various requirements when signing labor contracts, paying remuneration, determining the term of employees’ probation and unilaterally terminating labor contracts. These labor laws and related regulations impose liabilities on employers and may significantly increase the costs of workforce reductions. If we decide to change or reduce our workforce, these labor laws could limit or restrict our ability to make such changes in a timely, favorable and effective manner. Any of these events could have a material adverse effect our business, financial condition, results of operations or prospects.
Disruptions in the global oil markets could have a material adverse effect on demand for our products and services from customers in the oil and gas industry.
Global oil markets have recently experienced significant volatility and dramatic decreases in spot prices due to decreased demand resulting from the COVID-19 pandemic and increased supply resulting from aggressive increases in production of oil by Saudi Arabia and Russia. As a result of this volatility in global oil markets, we have seen some delays on orders and some decreased demand for our products and services from customers in the oil and gas industry. Although these delays and decreases in demand did not have a material effect on our results of operations in the three months ended March 31, 2020, if the volatility continues, it could have a material adverse effect on our business, results of operations and financial condition.
The phase-out, replacement or unavailability of the London Interbank Offered Rate (LIBOR) could affect interest rates under our existing credit facility agreements, as well as our ability to seek future debt financing.
LIBOR is the basic rate of interest used in lending between banks on the London interbank market and is widely used as a reference for setting the interest rates on loans globally. We use LIBOR as a reference rate to calculate interest rates under our revolving credit facility and our term loan facility, which are scheduled to mature in December 2022 and December 2024, respectively. In 2017, the United Kingdom’s Financial Conduct Authority, which regulates LIBOR, announced that it intends to phase out LIBOR by the end of 2021. It is unclear if LIBOR will cease to exist at that time or if new methods of calculating LIBOR will be established such that it continues to exist after 2021. The U.S. Federal Reserve, in conjunctionfiled with the Alternative Reference Rates Committee, a steering committee comprised of large U.S. financial institutions, is considering replacing U.S. dollar LIBOR with a new index, the Secured Overnight Financing Rate (SOFR), calculated using short-term repurchase agreements backed by Treasury securities. Our senior secured credit facilities do not include specific references to SOFR as a replacement for LIBOR, and whether or not SOFR or another alternative reference rate attains market traction as a LIBOR replacement tool remains in question. Additionally, it is uncertain if LIBOR will cease to exist after calendar year 2021, or whether additional reforms to LIBOR may be enacted, or whether alternative reference rates will gain market acceptance as a replacement for LIBOR. If LIBOR ceases to exist, we will need to agree upon a replacement index with banks under our senior secured credit facilities, and certain of the interest ratesSEC on May 6, 2020.
under such agreements may change. The new rates may not be as favorable to us as those in effect prior to any LIBOR phase-out.
In addition, the transition process may involve, among other things, increased volatility or illiquidity in markets for instruments that currently rely on LIBOR. The transition may also result in reductions in the value of certain instruments or the effectiveness of related transactions such as hedges, increased borrowing costs, uncertainty under applicable documentation, or difficult and costly consent processes. Any such effects of the transition away from LIBOR, as well as other unforeseen effects, may result in expenses, difficulties, complications or delays in connection with future financing efforts, which could have a material adverse impact on our business, financial condition and results of operations.
Item 2. Unregistered Sales of Equity Securities and Use of Proceeds
None.
Item 3. Defaults Upon Senior Securities
None.
Item 4. Mine Safety Disclosures
None.
Item 5. Other Information
None.
Item 6. Exhibits
The following exhibits are filed or furnished as a part of this report:
|
| |
Exhibit No. | Exhibit Description |
10.1 †* | |
10.2 | Amendment No. 7, among EWT Holdings III Corp., as borrower, EWT Holdings II Corp., as parent guarantor, the subsidiary guarantors party thereto, the financial institutions party thereto, as lenders, and Credit Suisse AG, as administrative agent and collateral agent, dated February 18, 2020 (incorporated by reference to Exhibit 10.1 to the Registrant’s Form 8-K filed on February 24, 2020 (File No. 001-38272)). |
| 31.1* | |
| 31.2* | |
| 32.1* | |
| 32.2* | |
| 101.INS* | Inline XBRL Instance Document.Document - the instance document does not appear in the Interactive Data File because its XBRL tags are embedded within the Inline XBRL document. |
| 101.SCH* | Inline XBRL Taxonomy Extension Schema Document. |
| 101.CAL* | Inline XBRL Taxonomy Extension Calculation Linkbase Document. |
| 101.DEF* | Inline XBRL Taxonomy Extension Definition Linkbase Document. |
| 101.LAB* | Inline XBRL Taxonomy Extension Label Linkbase Document. |
| 101.PRE* | Inline XBRL Taxonomy Extension Presentation Linkbase Document. |
| 104 | Cover Page Interactive Data File - the cover page interactive data file does not appear in the Interactive Data File because its XBRL tags are embedded within the Inline XBRL document (included in Exhibit 101). |
† Indicates a management contract or compensatory plan or arrangement.
SIGNATURES
Pursuant to the requirements of the Securities Exchange Act of 1934, the Registrant has duly caused this report to be signed on its behalf by the undersigned thereunto duly authorized.
|
| | |
| | EVOQUA WATER TECHNOLOGIES CORP. |
| | |
| | |
| | |
| | |
| | |
May 6,August 4, 2020 | /s/ RONALD C. KEATING |
| | By: | Ronald C. Keating |
| | | Chief Executive Officer (Principal Executive Officer) |
| | |
| | |
| | |
| | |
| | |
May 6,August 4, 2020 | /s/ BENEDICT J. STAS |
| | By: | Benedict J. Stas |
| | | Chief Financial Officer (Principal Financial Officer and Principal Accounting Officer) |
| | | |