SECURITIES AND EXCHANGE COMMISSION
Washington, D.C. 20549
Form 10-Q
xWashington, D.C. 20549
Form 10-Q
☒ Quarterly report pursuant to Section 13 or 15(d) of the Securities Exchange Act of 1934
For the quarterly period ended September 30, 2016 2017
☐o Transition report pursuant to Section 13 or 15(d) of the Securities Exchange Act of 1934
Commission File Number: 000-52015
Western Capital Resources, Inc.
(Exact Name of Registrant as Specified in its Charter)
| Delaware | 47-0848102 | |
| (State or Other Jurisdiction of Incorporation or Organization) | (I.R.S. Employer Identification Number) |
11550 “I” Street, Suite 150, Omaha, Nebraska 68137
(Address of Principal Executive Offices) (Zip Code)
Registrant’s telephone number, including area code: (402) 551-8888
N/A
(Former name, former address and former fiscal year, if changed since last report)
Check whether the issuer (1) filed all reports required to be filed by Section 13 or 15(d) of the Securities Exchange Act of 1934 during the past 12 months (or for such shorter period that the registrant was required to file such reports), and (2) has been subject to such filing requirements for the past 90 days. Yesþ ☑ Noo ☐
Indicate by check mark whether the registrant has submitted electronically and posted on its corporate website, if any, every Interactive Data File required to be submitted and posted pursuant to Rule 405 of Regulation S-T (§232.405 of this chapter) during the preceding 12 months (or for such shorter period that the registrant was required to submit and post such files). Yesþ ☑ Noo ☐
Indicate by check mark whether the registrant is a large accelerated filer, an accelerated filer, a non-accelerated filer, or a smaller reporting company, or an emerging growth company. See definitions of “large accelerated filer,” “accelerated filer,” and “smaller reporting company,” and “emerging growth company” in Rule 12b-2 of the Exchange Act (check one):
| Large accelerated filer | Accelerated filer |
| Non-accelerated filer | Smaller reporting company |
| Emerging growth company ☐ |
If an emerging growth company, indicate by check mark if the registrant has elected not to use the extended transition period for complying with any new or revised financial accounting standards provided pursuant to Section 13(a) of the Exchange Act. ☐
Indicate by check mark whether the registrant is a shell company (as defined in Rule 12b-2 of the Exchange Act).
Yeso ☐ Noþ ☑
APPLICABLE ONLY TO CORPORATE ISSUERS
As of November 14, 2016,2017, the registrant had outstanding 9,497,8609,390,997 shares of common stock, $0.001 par value per share.
Western Capital Resources, Inc.
Index
2
WESTERN CAPITAL RESOURCES, INC. AND SUBSIDIARIES
CONTENTS
| Page | |
| CONDENSED CONSOLIDATED FINANCIAL STATEMENTS | |
| Condensed Consolidated Balance Sheets | 4 |
| Condensed Consolidated Statements of | 5 |
| Condensed Consolidated Statements of Cash Flows | 6 |
| Notes to Condensed Consolidated Financial Statements | 7 |
3
WESTERN CAPITAL RESOURCES, INC. AND SUBSIDIARIES
CONDENSED CONSOLIDATED BALANCE SHEETS (Unaudited)
| September 30, 2016 | December 31, 2015 | September 30, 2017 | December 31, 2016 | |||||||||||||
| ASSETS | ||||||||||||||||
| CURRENT ASSETS | ||||||||||||||||
| Cash | $ | 7,895,897 | $ | 7,847,669 | $ | 8,628,397 | $ | 14,159,975 | ||||||||
| Loans receivable (less allowance for losses of $993,000 and $1,177,000, respectively) | 4,411,062 | 4,884,438 | ||||||||||||||
| Accounts receivable (less allowance for losses of $166,000 and $272,000, respectively) | 2,260,911 | 1,963,192 | ||||||||||||||
| Inventory | 8,856,267 | 7,617,850 | ||||||||||||||
| Loans receivable (less allowance for losses of $784,000 and $1,036,000, respectively) | 4,081,657 | 4,438,276 | ||||||||||||||
| Accounts receivable (less allowance for doubtful accounts of $19,000 and $13,000, respectively) | 994,966 | 696,657 | ||||||||||||||
| Inventory, net | 9,846,062 | 9,095,460 | ||||||||||||||
| Prepaid income taxes | 1,106,133 | — | ||||||||||||||
| Prepaid expenses and other | 2,805,092 | 2,589,749 | 4,164,032 | 3,399,433 | ||||||||||||
| Other current assets held for sale | 1,509,914 | 1,348,061 | ||||||||||||||
| TOTAL CURRENT ASSETS | 26,229,229 | 24,902,898 | 30,331,161 | 33,137,862 | ||||||||||||
| NOTE RECEIVABLE | — | 2,920,112 | ||||||||||||||
| PROPERTY AND EQUIPMENT, net | 9,314,175 | 8,561,321 | 11,586,783 | 9,409,234 | ||||||||||||
| GOODWILL | 13,355,592 | 13,355,591 | 5,796,529 | 5,796,528 | ||||||||||||
| INTANGIBLE ASSETS, net | 7,677,512 | 8,018,616 | 5,277,826 | 1,295,559 | ||||||||||||
| DEFERRED INCOME TAXES | 263,000 | 518,000 | ||||||||||||||
| OTHER | 877,494 | 783,907 | 1,065,936 | 1,001,466 | ||||||||||||
| NONCURRENT ASSETS HELD FOR SALE | 6,441,241 | 6,649,891 | ||||||||||||||
| TOTAL ASSETS | $ | 57,454,002 | $ | 55,622,333 | $ | 60,762,476 | $ | 60,728,652 | ||||||||
| LIABILITIES AND EQUITY | ||||||||||||||||
| CURRENT LIABILITIES | ||||||||||||||||
| Accounts payable | $ | 3,836,177 | $ | 4,577,118 | ||||||||||||
| Accrued expenses and other liabilities | 5,486,943 | 6,232,267 | ||||||||||||||
| Accounts payable and accrued expenses | $ | 10,613,642 | $ | 11,626,627 | ||||||||||||
| Other current liabilities | 1,293,210 | 1,198,311 | ||||||||||||||
| Income taxes payable | 151,869 | 1,135,031 | — | 95,551 | ||||||||||||
| Note payable – short-term | 84,009 | - | 74,831 | 55,819 | ||||||||||||
| Current portion long-term debt | 1,100,000 | 4,900,008 | 1,780,000 | 1,780,000 | ||||||||||||
| Current portion capital lease obligations | 60,464 | 23,860 | 46,485 | 46,400 | ||||||||||||
| Deferred revenue and other | 1,226,142 | 1,796,338 | ||||||||||||||
| Deferred revenue | 1,044,198 | 1,173,660 | ||||||||||||||
| Current liabilities held for sale | 2,270,928 | 2,851,395 | ||||||||||||||
| TOTAL CURRENT LIABILITIES | 11,945,604 | 18,664,622 | 17,123,294 | 18,827,763 | ||||||||||||
| LONG-TERM LIABILITIES | ||||||||||||||||
| Notes payable, net of current portion | 6,776,829 | 3,096,452 | 6,014,885 | 8,681,545 | ||||||||||||
| Capital lease obligations, net of current portion | 106,167 | 33,347 | 63,216 | 94,762 | ||||||||||||
| Deferred income taxes | 4,521,000 | 3,889,000 | ||||||||||||||
| Other | 120,539 | 80,403 | ||||||||||||||
Long-term liabilities held for sale | 2,363,924 | 2,436,080 | ||||||||||||||
| TOTAL LONG-TERM LIABILITIES | 11,524,535 | 7,099,202 | 8,442,025 | 11,212,387 | ||||||||||||
| TOTAL LIABILITIES | 23,470,139 | 25,763,824 | 25,565,319 | 30,040,150 | ||||||||||||
| COMMITMENTS AND CONTINGENCIES (Note 13) | ||||||||||||||||
| COMMITMENTS AND CONTINGENCIES (Note 14) | ||||||||||||||||
| EQUITY | ||||||||||||||||
| WESTERN SHAREHOLDERS’ EQUITY | ||||||||||||||||
| Common stock, $0.001 and no par value, 12,500,000 shares authorized, 9,497,860 and 9,497,534 issued and outstanding. (Note 8) | 950 | - | ||||||||||||||
| Common stock, $0.001 par value, 12,500,000 shares authorized, 9,390,997 and 9,497,871 shares issued and outstanding. | 939 | 950 | ||||||||||||||
| Additional paid-in capital | 28,982,705 | 28,934,392 | 29,031,808 | 28,997,087 | ||||||||||||
| Retained earnings | 4,959,387 | 898,038 | 4,481,291 | 1,643,996 | ||||||||||||
| TOTAL WESTERN SHAREHOLDERS’ EQUITY | 33,943,042 | 29,832,430 | 33,514,038 | 30,642,033 | ||||||||||||
| NONCONTROLLING INTERESTS | 40,821 | 26,079 | 1,683,119 | 46,469 | ||||||||||||
| TOTAL EQUITY | 33,983,863 | 29,858,509 | 35,197,157 | 30,688,502 | ||||||||||||
| TOTAL LIABILITIES AND EQUITY | $ | 57,454,002 | $ | 55,622,333 | $ | 60,762,476 | $ | 60,728,652 | ||||||||
See notes to condensed consolidated financial statements
4
WESTERN CAPITAL RESOURCES, INC. AND SUBSIDIARIES
CONDENSED CONSOLIDATED STATEMENTS OF INCOMEOPERATIONS (Unaudited)
| Three months ended | Nine months ended | Three months ended | Nine months ended | |||||||||||||||||||||||||||||
| September 30, 2016 | September 30, 2015 | September 30, 2016 | September 30, 2015 | September 30, 2017 | September 30, 2016 | September 30, 2017 | September 30, 2016 | |||||||||||||||||||||||||
| REVENUES | ||||||||||||||||||||||||||||||||
| Sales and associated fees | $ | 13,066,705 | $ | 13,403,791 | $ | 52,146,348 | $ | 27,039,059 | $ | 18,535,592 | $ | 13,066,705 | $ | 67,834,678 | $ | 52,146,348 | ||||||||||||||||
| Financing fees and interest | 2,562,569 | 2,865,842 | 7,387,757 | 8,007,438 | 2,342,285 | 2,562,569 | 6,695,439 | 7,387,757 | ||||||||||||||||||||||||
| Royalty and franchise fees, net | 3,056,046 | 2,803,405 | 8,446,416 | 7,883,214 | ||||||||||||||||||||||||||||
| Other revenue | 3,840,147 | 2,878,430 | 10,152,658 | 6,259,541 | 5,255,124 | 2,618,391 | 15,051,477 | 7,147,375 | ||||||||||||||||||||||||
| Total Revenues | 22,525,467 | 21,951,468 | 78,133,179 | 49,189,252 | 26,133,001 | 18,247,665 | 89,581,594 | 66,681,480 | ||||||||||||||||||||||||
| COST OF REVENUES | ||||||||||||||||||||||||||||||||
| Cost of sales | 6,544,212 | 7,324,815 | 26,360,046 | 15,329,353 | 9,599,712 | 6,555,044 | 34,434,610 | 26,393,767 | ||||||||||||||||||||||||
| Provisions for loans receivable losses | 444,689 | 572,959 | 1,176,174 | 1,351,427 | 326,998 | 444,689 | 815,313 | 1,176,174 | ||||||||||||||||||||||||
| Other | 662,410 | 200,303 | 1,819,491 | 730,143 | ||||||||||||||||||||||||||||
| Total Cost of Revenues | 7,651,311 | 8,098,077 | 29,355,711 | 17,410,923 | 9,926,710 | 6,999,733 | 35,249,923 | 27,569,941 | ||||||||||||||||||||||||
| GROSS PROFIT | 14,874,156 | 13,853,391 | 48,777,468 | 31,778,329 | 16,206,291 | 11,247,932 | 54,331,671 | 39,111,539 | ||||||||||||||||||||||||
| OPERATING EXPENSES | ||||||||||||||||||||||||||||||||
| Salaries, wages and benefits | 7,040,838 | 6,236,073 | 20,467,591 | 14,733,576 | 9,384,142 | 5,928,774 | 27,515,294 | 17,041,464 | ||||||||||||||||||||||||
| Occupancy | 2,081,592 | 2,016,406 | 5,949,389 | 4,729,718 | 3,573,785 | 2,021,416 | 9,618,698 | 5,769,871 | ||||||||||||||||||||||||
| Advertising, marketing and development | 1,076,102 | 1,142,751 | 5,293,633 | 1,513,578 | 998,433 | 983,487 | 5,117,015 | 5,021,984 | ||||||||||||||||||||||||
| Depreciation | 309,584 | 234,122 | 881,333 | 444,814 | 438,822 | 282,633 | 1,114,513 | 797,192 | ||||||||||||||||||||||||
| Amortization | 140,647 | 141,783 | 422,510 | 359,133 | 216,253 | 54,528 | 323,911 | 164,154 | ||||||||||||||||||||||||
| Other | 2,795,326 | 2,280,809 | 8,049,581 | 5,754,519 | 2,469,726 | 1,954,320 | 7,878,396 | 5,978,859 | ||||||||||||||||||||||||
| Total Operating Expense | 13,444,089 | 12,051,944 | 41,064,037 | 27,535,338 | ||||||||||||||||||||||||||||
| Total Operating Expenses | 17,081,161 | 11,225,158 | 51,567,827 | 34,773,524 | ||||||||||||||||||||||||||||
| OPERATING INCOME | 1,430,067 | 1,801,447 | 7,713,431 | 4,242,991 | ||||||||||||||||||||||||||||
| OPERATING INCOME (LOSS) FROM CONTINUING OPERATIONS | (874,870 | ) | 22,774 | 2,763,844 | 4,338,015 | |||||||||||||||||||||||||||
| OTHER INCOME (EXPENSES): | ||||||||||||||||||||||||||||||||
| Interest income | 955 | 995 | 2,964 | 3,065 | 346 | 955 | 131,985 | 2,964 | ||||||||||||||||||||||||
| Interest expense | (93,665 | ) | (198,048 | ) | (413,390 | ) | (401,299 | ) | (121,647 | ) | (93,366 | ) | (370,213 | ) | (320,017 | ) | ||||||||||||||||
| Total Other Income (Expenses) | (92,710 | ) | (197,053 | ) | (410,426 | ) | (398,234 | ) | ||||||||||||||||||||||||
| Total Other Income (Expense) | (121,301 | ) | (92,411 | ) | (238,228 | ) | (317,053 | ) | ||||||||||||||||||||||||
| INCOME BEFORE INCOME TAXES | 1,337,357 | 1,604,394 | 7,303,005 | 3,844,757 | ||||||||||||||||||||||||||||
| INCOME (LOSS) FROM CONTINUING OPERATIONS BEFORE INCOME TAXES | (996,171 | ) | (69,637 | ) | 2,525,616 | 4,020,962 | ||||||||||||||||||||||||||
| INCOME TAX EXPENSE | 551,000 | 724,293 | 2,752,000 | 1,696,813 | ||||||||||||||||||||||||||||
| PROVISION FOR INCOME TAXES FOR CONTINUING OPERATIONS | (386,000 | ) | 10,000 | 863,000 | 1,485,000 | |||||||||||||||||||||||||||
| NET INCOME | 786,357 | 880,101 | 4,551,005 | 2,147,944 | ||||||||||||||||||||||||||||
| NET INCOME (LOSS) FROM CONTINUING OPERATIONS | (610,171 | ) | (79,637 | ) | 1,662,616 | 2,535,962 | ||||||||||||||||||||||||||
| Less net income attributable to noncontrolling interests | (6,004 | ) | (6,498 | ) | (14,742 | ) | (12,485 | ) | ||||||||||||||||||||||||
| LESS NET INCOME FROM CONTINUING OPERATIONS ATTRIBUTABLE TO NONCONTROLLING INTEREST | (99,865 | ) | — | (99,865 | ) | — | ||||||||||||||||||||||||||
| NET INCOME (LOSS) FROM CONTINUING OPERATIONS ATTRIBUTABLE TO WESTERN COMMON SHAREHOLDERS | (710,036 | ) | (79,637 | ) | 1,562,751 | 2,535,962 | ||||||||||||||||||||||||||
| DISCONTINUED OPERATIONS | ||||||||||||||||||||||||||||||||
| Income from operations of discontinued operations | 1,171,159 | 1,406,994 | 3,988,232 | 3,282,043 | ||||||||||||||||||||||||||||
| Provision for income taxes for discontinued operations | 440,000 | 541,000 | 1,511,000 | 1,267,000 | ||||||||||||||||||||||||||||
| Income from discontinued operations | 731,159 | 865,994 | 2,477,232 | 2,015,043 | ||||||||||||||||||||||||||||
| Less net income from discontinued operations attributable to noncontrolling interests | (4,925 | ) | (6,004 | ) | (17,446 | ) | (14,742 | ) | ||||||||||||||||||||||||
| Net income from discontinued operations attributable to Western common shareholders | 726,234 | 859,990 | 2,459,786 | 2,000,301 | ||||||||||||||||||||||||||||
| NET INCOME ATTRIBUTABLE TO WESTERN COMMON SHAREHOLDERS | $ | 780,353 | $ | 873,603 | $ | 4,536,263 | $ | 2,135,459 | $ | 16,198 | $ | 780,353 | $ | 4,022,537 | $ | 4,536,263 | ||||||||||||||||
| EARNINGS PER SHARE ATTRIBUTABLE TO WESTERN COMMON SHAREHOLDERS | ||||||||||||||||||||||||||||||||
| Basic and diluted | $ | 0.08 | $ | 0.09 | $ | 0.48 | $ | 0.30 | ||||||||||||||||||||||||
| EARNINGS (LOSS) PER SHARE ATTRIBUTABLE TO WESTERN COMMON SHAREHOLDERS | ||||||||||||||||||||||||||||||||
| FROM CONTINUING OPERATIONS - Basic and diluted | $ | (0.08 | ) | $ | (0.01 | ) | $ | 0.17 | $ | 0.27 | ||||||||||||||||||||||
| FROM DISCONTINUED OPERATIONS - Basic and diluted | $ | 0.08 | $ | 0.09 | $ | 0.26 | $ | 0.21 | ||||||||||||||||||||||||
| FROM CONTINUING AND DISCONTINUED OPERATIONS - Basic and diluted | $ | 0.00 | $ | 0.08 | $ | 0.43 | $ | 0.48 | ||||||||||||||||||||||||
| WEIGHTED AVERAGE COMMON SHARES OUTSTANDING | ||||||||||||||||||||||||||||||||
| Basic and diluted | 9,497,608 | 9,497,689 | 9,497,559 | 7,177,176 | ||||||||||||||||||||||||||||
| Basic and diluted from discontinued operations | 9,390,997 | 9,497,608 | 9,418,009 | 9,497,559 | ||||||||||||||||||||||||||||
See notes to condensed consolidated financial statements.
WESTERN CAPITAL RESOURCES, INC. AND SUBSIDIARIES
CONDENSED CONSOLIDATED STATEMENTS OF CASH FLOWS (Unaudited)
| Nine Months Ended | ||||||||
| September 30, 2017 | September 30, 2016 | |||||||
| OPERATING ACTIVITIES | ||||||||
| Net Income | $ | 1,662,616 | $ | 2,535,962 | ||||
| Adjustments to reconcile net income to net cash provided by operating activities: | ||||||||
| Depreciation – continuing operations | 1,114,513 | 797,192 | ||||||
| Amortization – continuing operations | 323,911 | 164,154 | ||||||
| Share based compensation | 34,721 | 49,263 | ||||||
| Deferred income taxes | 117,000 | 632,000 | ||||||
| Loss on disposal of property and equipment | 22,030 | 8,014 | ||||||
| Changes in operating assets and liabilities: | ||||||||
| Loans receivable | 356,619 | 473,376 | ||||||
| Accounts receivable | (298,309 | ) | 28,186 | |||||
| Inventory | (750,602 | ) | (1,238,417 | ) | ||||
| Prepaid expenses and other assets | (1,746,082 | ) | (620,529 | ) | ||||
| Accounts payable and accrued expenses | (891,043 | ) | (1,898,140 | ) | ||||
| Deferred revenue and other current liabilities | (34,563 | ) | (452,611 | ) | ||||
| Operating cash flows from discontinued operations | 2,047,050 | 1,778,505 | ||||||
| Net cash provided by operating activities | 1,957,861 | 2,256,955 | ||||||
| INVESTING ACTIVITIES | ||||||||
| Purchase of property and equipment– continuing operations | (1,999,408 | ) | (1,227,121 | ) | ||||
| Acquisition of stores, net of cash acquired | (188,325 | ) | (588,241 | ) | ||||
| Advances on note receivable, net | (513,744 | ) | — | |||||
| Proceeds from disposal of property and equipment | 16,959 | 109,350 | ||||||
| Investing activities of discontinued operations | (30,023 | ) | (17,594 | ) | ||||
| Net cash used by investing activities | (2,714,541 | ) | (1,723,606 | ) | ||||
| FINANCING ACTIVITIES | ||||||||
| Payments on notes payable – short-term | (63,303 | ) | — | |||||
| Advances (Payments) on line of credit, net | (998,426 | ) | 1,538,708 | |||||
| Advances on note payable – long-term | — | 418,301 | ||||||
| Payments on notes payable – long-term– continuing operations | (2,457,450 | ) | (451,640 | ) | ||||
| Common stock redemption | (480,928 | ) | — | |||||
| Advances on capital lease | — | 185,318 | ||||||
| Payments on capital lease | (31,461 | ) | (75,894 | ) | ||||
| Dividend paid | (704,325 | ) | (474,914 | ) | ||||
| Financing activities of discontinued operations | (39,005 | ) | (1,625,000 | ) | ||||
| Net cash used in financing activities | (4,774,898 | ) | (485,121 | ) | ||||
| NET CHANGE IN CASH | (5,531,578 | ) | 48,228 | |||||
| CASH | ||||||||
| Beginning of period | 14,159,975 | 7,847,669 | ||||||
| End of period | $ | 8,628,397 | $ | 7,895,897 | ||||
| SUPPLEMENTAL DISCLOSURE OF CASH FLOW INFORMATION | ||||||||
| Income taxes paid | $ | 3,648,839 | $ | 3,103,162 | ||||
| Interest paid | $ | 354,601 | $ | 550,231 | ||||
| Noncash investing and financing activities: | ||||||||
| Note receivable balance applied to acquisition of stores (Note 11) | $ | 3,433,856 | $ | — | ||||
| Financed acquisition of stores (Note 11) | $ | 789,216 | $ | — | ||||
| Noncontrolling interest’s equity contribution in acquisition of stores (Note 11) | $ | 1,550,724 | $ | — | ||||
| Long-term debt proceeds used to pay off debt and interest | $ | — | $ | 3,021,699 | ||||
| Long-term debt proceeds used to pay prepaid financing costs | $ | — | $ | 60,000 | ||||
See notes to condensed consolidated financial statements.
5
WESTERN CAPITAL RESOURCES, INC. AND SUBSIDIARIES
CONDENSED CONSOLIDATED STATEMENTS OF CASH FLOWS (Unaudited)
| Nine Months Ended | ||||||||
| September 30, 2016 | September 30, 2015 | |||||||
| OPERATING ACTIVITIES | ||||||||
| Net Income | $ | 4,551,005 | $ | 2,147,944 | ||||
| Adjustments to reconcile net income to net cash provided by operating activities: | ||||||||
| Depreciation | 881,333 | 444,814 | ||||||
| Amortization | 422,510 | 359,133 | ||||||
| Share based compensation | 49,263 | 76,538 | ||||||
| Deferred income taxes | 632,000 | 390,000 | ||||||
| Loss on disposal of property and equipment | 8,014 | - | ||||||
| Changes in operating assets and liabilities: | ||||||||
| Loans receivable | 473,376 | 233,848 | ||||||
| Accounts receivable | (297,719 | ) | (492,684 | ) | ||||
| Inventory | (1,238,417 | ) | (1,645,395 | ) | ||||
| Prepaid expenses and other assets | (224,921 | ) | (612,532 | ) | ||||
| Accounts payable and accrued liabilities | (2,469,429 | ) | (468,720 | ) | ||||
| Deferred revenue and other current liabilities | (570,196 | ) | (137,896 | ) | ||||
| Accrued liabilities and other | 40,136 | (21,252 | ) | |||||
| Net cash provided by operating activities | 2,256,955 | 273,798 | ||||||
| INVESTING ACTIVITIES | ||||||||
| Purchases of property and equipment | (1,244,715 | ) | (507,075 | ) | ||||
| Acquisition of stores, net of cash acquired | (588,241 | ) | (2,608,500 | ) | ||||
| Cash received through acquisitions | - | 2,470,930 | ||||||
| Proceeds from sale of property and equipment | 109,350 | - | ||||||
| Net cash used by investing activities | (1,723,606 | ) | (644,645 | ) | ||||
| FINANCING ACTIVITIES | ||||||||
| Payments on notes payable – short-term | - | (120,000 | ) | |||||
| Advances on line of credit, net | 1,538,708 | - | ||||||
| Advances on note payable – long-term | 418,301 | - | ||||||
| Payments on notes payable – long-term, net | (2,076,640 | ) | (191,668 | ) | ||||
| Advances (payments) on capital leases, net | 109,424 | (42,107 | ) | |||||
| Dividend paid | (474,914 | ) | - | |||||
| Net cash used in financing activities | (485,121 | ) | (353,775 | ) | ||||
| NET INCREASE (DECREASE) IN CASH | 48,228 | (724,622 | ) | |||||
| CASH | ||||||||
| Beginning of period | 7,847,669 | 4,273,350 | ||||||
| End of period | $ | 7,895,897 | $ | 3,548,728 | ||||
| SUPPLEMENTAL DISCLOSURE OF CASH FLOW INFORMATION | ||||||||
| Income taxes paid | $ | 3,103,162 | $ | 1,759,171 | ||||
| Interest paid | $ | 550,231 | $ | 392,751 | ||||
| Noncash investing and financing activities: | ||||||||
| Net assets acquired in JPPA/RAI/JPRE acquisition | $ | - | $ | 6,123,398 | ||||
| Deposit applied to purchase of intangibles | $ | - | $ | 50,000 | ||||
| Long-term debt proceeds used to pay off debt and interest | $ | 3,021,699 | $ | - | ||||
| Long-term debt proceeds used to pay prepaid financing costs | $ | 60,000 | $ | - | ||||
See notes to condensed consolidated financial statements.
WESTERN CAPITAL RESOURCES, INC. AND SUBSIDIARIES
NOTES TO CONDENSED CONSOLIDATED FINANCIAL STATEMENTS (Unaudited)
| 1. | Basis of Presentation, Nature of Business and Summary of Significant Accounting Policies – |
Basis of Presentation
The accompanying unaudited condensed consolidated financial statements have been prepared according to the instructions to Form 10-Q and Section 210.8-03(b) of Regulation S-X of the Securities and Exchange Commission (SEC)(“SEC”) and, therefore, certain information and footnote disclosures normally included in financial statements prepared in accordance with accounting principles generally accepted in the United States of America (“GAAP”) have been omitted.
In the opinion of management, all adjustments (consisting of normal recurring accruals) considered necessary for a fair presentation have been included. Operating results for the three and nine month periodperiods ended September 30, 20162017 are not necessarily indicative of the results that may be expected for the year ending December 31, 2016.2017.
For further information, refer to the Condensed Consolidated Financial Statements and footnotes thereto included in our Form 10-K for the year ended December 31, 2015.2016. The condensed consolidated balance sheet at December 31, 2015,2016, has been derived from the audited consolidated financial statements at that date, but does not include all of the information and footnotes required by GAAP.
Nature of Business
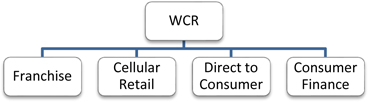
Western Capital Resources, Inc. (“WCR”)(WCR) is a parent company owning operating subsidiaries, with percentage owned shown parenthetically, as summarized below:below.
| Franchise |
| AlphaGraphics, Inc. |
| Cellular Retail |
| PQH Wireless, Inc. |
| Direct to Consumer |
| J & P Park Acquisitions, Inc. |
| Restorers Acquisition, Inc. |
| J & P Real Estate, LLC |
| Consumer Finance |
| Wyoming Financial Lenders, Inc. |
| Express Pawn, Inc. |
References in these financial statement notes to “Company” or “we” refer to Western Capital Resources, Inc. and its subsidiaries. References to specific companies within our enterprise, such “AGI,” “PQH,” “JPPA,” “RAI,” “JPRE,” “WFL” or “EPI” are references only to those companies.
Basis of Consolidation
The consolidated financial statements include the accounts of WCR, its wholly owned subsidiaries and other entities in which the Company owns a controlling financial interest. For financial interests in which the Company owns a controlling financial interest, the Company applies the provisions of ASC 810 applicable to reporting the equity and net income or loss attributable to noncontrolling interests. All significant intercompany balances and transactions of the Company have been eliminated in consolidation.
Use of Estimates
The preparation of condensed consolidated financial statements in conformity with accounting principles generally accepted in the United States of America requires management to make estimates and assumptions that may affect certain reported amounts and disclosures in the condensed consolidated financial statements and accompanying notes. Management bases its estimates on historical experience and on various other assumptions that are believed to be reasonable under the circumstances. Actual results could differ from those estimates. Significant management estimates relate to the notes and loans receivable allowance, carrying value and impairment of long-lived goodwill and intangible assets, inventory valuation and obsolescence, estimated useful lives of property and equipment, gift certificate and customermerchandise credits liability and deferred taxes and tax uncertainties.
Reclassifications
Certain Statements of IncomeOperations reclassifications have been made in the presentation of our prior financial statements and accompanying notes to conform to the presentation as of and for the three and nine monthsmonth periods ended September 30, 2016.2017.
In accordance with appropriate accounting rules, the Company has reclassified its previously reported financial results to exclude the results of the discontinued operations of the Franchise segment and these results are presented on a historical basis as a separate line in the Company’s condensed consolidated statements of operations and condensed consolidated balance sheets entitled “held for sale.” Also in accordance with appropriate accounting rules, continuing corporate overhead costs previously allocated to discontinued operations has been reallocated to continuing operations. The notes to the condensed consolidated financial statements have been revised to reflect only the results of continuing operations, except where noted.
Recent Accounting Pronouncements
In May 2014, the Financial Accounting Standards Board (“FASB”) and the International Accounting Standards Board (“IASB”) jointly issued a comprehensive new revenue recognition standard that will supersede nearly all existing revenue recognition guidance under US GAAP.GAAP and IFRS. This converged standard including subsequent updates, is effective for annual and interim periods beginning after December 15, 2017. The Company is currently assessing the potential effects on our financial condition, results of operations and consolidated financial statements.
In November 2015, the FASB issued ASU No. 2015-17, “Income Taxes (Topic 740): Balance Sheet Classification of Deferred Taxes” (“ASU 2015-17”). The standard requires that deferred tax assets and liabilities be classified as noncurrent on the balance sheet rather than being separated into current and noncurrent. ASU 2015-17 is effective for fiscal years, and interim periods within those years, beginning after December 15, 2016. Early adoption is permitted and the standard may be applied either retrospectively or on a prospective basis to all deferred tax assets and liabilities. The Company early adopted ASU 2015-17 during our first quarter of fiscal year 2016 on a retrospective basis. Accordingly, we reclassified the current deferred taxes to noncurrent on our December 31, 2015 Condensed Consolidated Balance Sheet, which decreased current deferred tax assets by $0.56 million and decreased noncurrent deferred tax liabilities by $0.56 million.
In February 2016, the FASB issued ASU No. 2016-02, “LeasesLeases (Topic 842)” (“ASU 2016-02”). The standard requires recognizing, related to recognition of lease assets and lease liabilities on the balance sheet and disclosing key information about leasing arrangements. This ASU 2016-02 is effective for fiscal years, and interimannual reporting periods within those years, beginning after December 15, 2018. Early2018, including interim periods within that annual period, with early adoption is permitted and the standard is to be applied using a modified retrospectivelyretrospective approach. The Company is currently evaluating the impact thatthe ASU 2016-02 will have on our financial condition, results of operations and consolidated financial statements.
In June 2016, the FASB issued ASU No. 2016-13, “FinancialFinancial Instruments - Credit Losses (Topic 326): Measurement, related to the measurement of Credit Lossescredit losses on Financial Instruments” (“ASU 2016-13”).financial instruments. The standard requires a financial asset (or a group of financial assets) measured at amortized cost basis to be presented at the net amount expected to be collected. This ASU 2016-13 is effective for fiscal years, and interimannual reporting periods within those years, beginning after December 15, 2019. Early adoption is permitted earlier as of the fiscal years beginning after December 15, 2018 includingand interim periods within those fiscal yearsthat annual period, with early adoption permitted and the standard is to be applied using a modified retrospectivelyretrospective approach. The Company is currently evaluating the impact thatthe ASU 2016-13 will have on our financial condition, results of operations and consolidated financial statements.
No other new accounting pronouncements issued or effective during the fiscal quarteryear have had or are expected to have a material impact on our condensedthe consolidated financial statements.
| 2. | Risks Inherent in the Operating Environment – |
Regulatory
The Company’s Consumer Finance segment activities are highly regulated under numerous local, state, and federal laws, regulations and rules, which are subject to change. New laws, regulations or rules could be enacted or issued, interpretations of existing laws, regulations or rules may change and enforcement action by regulatory agencies may intensify. Over the past several years, consumer advocacy groups and certain media reports have advocated governmental and regulatory action to prohibit or severely restrict sub-prime lending activities of the kind conducted by the Company. The federal Consumer Financial Protection Bureau has indicated that it will use its authority to further regulate the payday industry and has been actively enforcinginvolved in the enforcement of existing regulations within its jurisdiction.consumer-protection laws applicable to the payday industry.
Any adverse change in present local, state, and federal laws or regulations that govern or otherwise affect lending could result in the Consumer Finance segment’s curtailment or cessation of operations in certain or all jurisdictions or locations. Furthermore, any failure to comply with any applicable local, state or federal laws or regulations could result in fines, litigation, closure of one or more store locationslocation closure or negative publicity. Any such change or failure would have a corresponding impact on the Company’s and segment’s results of operations and financial condition, primarily through a decrease in revenues resulting from the cessation or curtailment of operations, decrease in operating income through increased legal expenditures or fines, and could also negatively affect the Company’s general business prospects due to lost or decreased operating income or if negative publicity effects its ability to obtain additional financing as needed.
In addition, the passage of federal or state laws and regulations or changes in interpretations of them could, at any point, essentially prohibit the business we conduct in the Consumer Finance segment from conducting its lending business in its current form. Any such legal or regulatory change would certainly have a material and adverse effect on the Company, its operating results, financial condition and prospects, and perhaps even the viability of the business we conduct in the Consumer Finance segment.
3. Loans Receivable –
At September 30, 2016 and December 31, 2015, theThe Consumer Finance segment’s outstanding loans receivable aging was as follows:
| September 30, 2016 | ||||||||||||||||||||||||||||||||
| September 30, 2017 | September 30, 2017 | |||||||||||||||||||||||||||||||
| Payday | Installment | Pawn & Title | Total | Payday | Installment | Pawn & Title | Total | |||||||||||||||||||||||||
| Current | $ | 3,645,540 | $ | 248,820 | $ | 282,212 | $ | 4,176,572 | $ | 3,348,335 | $ | 258,785 | $ | 317,367 | $ | 3,924,487 | ||||||||||||||||
| 1-30 | 290,044 | 46,460 | - | 336,504 | 227,700 | 51,146 | — | 278,846 | ||||||||||||||||||||||||
| 31-60 | 249,995 | 23,836 | - | 273,831 | 188,750 | 25,247 | — | 213,997 | ||||||||||||||||||||||||
| 61-90 | 175,254 | 15,287 | - | 190,541 | 120,350 | 12,936 | — | 133,286 | ||||||||||||||||||||||||
| 91-120 | 150,320 | 10,087 | - | 160,407 | 127,408 | 5,623 | — | 133,031 | ||||||||||||||||||||||||
| 121-150 | 131,000 | 3,684 | - | 134,684 | 97,366 | 1,659 | — | 99,025 | ||||||||||||||||||||||||
| 151-180 | 129,724 | 1,799 | - | 131,523 | 81,905 | 1,080 | — | 82,985 | ||||||||||||||||||||||||
| 4,771,877 | 349,973 | 282,212 | 5,404,062 | 4,191,814 | 356,476 | 317,367 | 4,865,657 | |||||||||||||||||||||||||
| Less Allowance | (920,000 | ) | (73,000 | ) | - | (993,000 | ) | (695,000 | ) | (89,000 | ) | — | (784,000 | ) | ||||||||||||||||||
| $ | 3,851,877 | $ | 276,973 | $ | 282,212 | $ | 4,411,062 | $ | 3,496,814 | $ | 267,476 | $ | 317,367 | $ | 4,081,657 | |||||||||||||||||
| December 31, 2015 | ||||||||||||||||
| Payday | Installment | Pawn & Title | Total | |||||||||||||
| Current | $ | 4,065,706 | $ | 291,947 | $ | 286,514 | $ | 4,644,167 | ||||||||
| 1-30 | 332,217 | 43,179 | - | 375,396 | ||||||||||||
| 31-60 | 263,486 | 24,233 | - | 287,719 | ||||||||||||
| 61-90 | 199,526 | 16,293 | - | 215,819 | ||||||||||||
| 91-120 | 196,123 | 9,417 | - | 205,540 | ||||||||||||
| 121-150 | 160,386 | 4,985 | - | 165,371 | ||||||||||||
| 151-180 | 165,237 | 2,189 | - | 167,426 | ||||||||||||
| 5,382,681 | 392,243 | 286,514 | 6,061,438 | |||||||||||||
| Less Allowance | (1,081,000 | ) | (96,000 | ) | - | (1,177,000 | ) | |||||||||
| $ | 4,301,681 | $ | 296,243 | $ | 286,514 | $ | 4,884,438 | |||||||||
| December 31, 2016 | ||||||||||||||||
| Payday | Installment | Pawn & Title | Total | |||||||||||||
| Current | $ | 3,683,603 | $ | 272,703 | $ | 284,460 | $ | 4,240,766 | ||||||||
| 1-30 | 253,297 | 44,433 | — | 297,730 | ||||||||||||
| 31-60 | 201,375 | 27,905 | — | 229,280 | ||||||||||||
| 61-90 | 185,072 | 18,747 | — | 203,819 | ||||||||||||
| 91-120 | 159,435 | 15,737 | — | 175,172 | ||||||||||||
| 121-150 | 176,625 | 8,889 | — | 185,514 | ||||||||||||
| 151-180 | 134,171 | 7,824 | — | 141,995 | ||||||||||||
| 4,793,578 | 396,238 | 284,460 | 5,474,276 | |||||||||||||
| Less Allowance | (953,000 | ) | (83,000 | ) | — | (1,036,000 | ) | |||||||||
| $ | 3,840,578 | $ | 313,238 | $ | 284,460 | $ | 4,438,276 | |||||||||
As a result of the Consumer Finance segment’s collection efforts, it historically writes off approximately 43% of returned payday items. Based on days past the check return date, write-offs of payday returned items historically have tracked at the following approximate percentages: 1 to 30 days4. Loans Receivable Allowance – 43%; 31 to 60 days – 65%; 61 to 90 days – 83%; 91 to 120 days – 89%; 121 to 150 days – 91%; and 151 + days – 93%.
A rollforward of the Consumer Finance segment’s loans receivable allowance is as follows:
| Nine Months Ended September 30, 2016 | Year Ended December 31, 2015 | Nine Months Ended September 30, 2017 | Year Ended December 31, 2016 | |||||||||||||
| Loans receivable allowance, beginning of period | $ | 1,177,000 | $ | 1,219,000 | $ | 1,036,000 | $ | 1,177,000 | ||||||||
| Provision for loan losses charged to expense | 1,176,174 | 1,904,893 | 815,313 | 1,605,867 | ||||||||||||
| Charge-offs, net | (1,360,174 | ) | (1,946,893 | ) | (1,067,313 | ) | (1,746,867 | ) | ||||||||
| Loans receivable allowance, end of period | $ | 993,000 | $ | 1,177,000 | $ | 784,000 | $ | 1,036,000 | ||||||||
5. Accounts Receivable –
A breakdown of accounts receivables for continuing operations by segment are as offollows:
| September 30, 2017 | ||||||||||||||||
| Cellular Retail | Direct to Consumer | Consumer Finance | Total | |||||||||||||
| Accounts receivable | $ | 342,876 | $ | 657,868 | $ | 13,222 | $ | 1,013,966 | ||||||||
| Less allowance | — | (19,000 | ) | — | (19,000 | ) | ||||||||||
| Net account receivable | $ | 342,876 | $ | 638,868 | $ | 13,222 | $ | 994,966 | ||||||||
| December 31, 2016 | ||||||||||||||||
| Cellular Retail | Direct to Consumer | Consumer Finance | Total | |||||||||||||
| Accounts receivable | $ | 333,800 | $ | 363,426 | $ | 12,431 | $ | 709,657 | ||||||||
| Less allowance | — | (13,000 | ) | — | (13,000 | ) | ||||||||||
| Net account receivable | $ | 333,800 | $ | 350,426 | $ | 12,431 | $ | 696,657 | ||||||||
6. Notes Payable – Long Term –
| September 30, 2017 | December 31, 2016 | |||||||
| Revolving credit facility (with a credit limit of $3,000,000) to a financial institution with monthly payments of interest only at LIBOR plus 3.5% (4.75% at September 30, 2017), secured by substantially all assets of the Company with stated guarantee amounts by subsidiaries, maturing April 21, 2018 | $ | — | $ | 998,426 | ||||
| Note payable to a financial institution with monthly principal payment of $58,333 plus interest at LIBOR plus 3.5% (4.75% at September 30, 2017), securedby substantially all assets of the Company with stated guarantee amounts by subsidiaries, maturing April 21, 2021 | 1,502,959 | 3,091,667 | ||||||
| Note payable to a financial institution with monthly principal payment of $56,667 plus interest at LIBOR plus 3.5% (4.75% at September 30, 2017), securedby substantially all assets of the Company with stated guarantee amounts by subsidiaries, maturing December 1, 2021 | 2,831,264 | 3,400,000 | ||||||
| Subsidiary note payable to a financial institution with monthly principal payment of $33,334 plus annual paydowns equal to JPRE’s net cash flow from operations due within 120 days of the calendar year end plus interest at LIBOR plus 3.5% (4.75% at September 30, 2017), securedby JPRE assets, maturing June 5, 2019 when remaining principal balance is due | 2,671,446 | 2,971,452 | ||||||
| Subsidiary note payable to seller with monthly interest payments only at 6%, maturing June 30, 2022 | 789,216 | — | ||||||
| Total | 7,794,885 | 10,461,545 | ||||||
| Less current maturities | (1,780,000 | ) | (1,780,000 | ) | ||||
| $ | 6,014,885 | $ | 8,681,545 | |||||
At September 30, 20162017 and December 31, 2015 are as follows:
| September 30, 2016 | ||||||||||||||||||||
| Franchise | Cellular Retail | Direct to Consumer | Consumer Finance | Total | ||||||||||||||||
| Accounts receivable | $ | 1,624,351 | $ | 172,813 | $ | 619,568 | $ | 10,179 | $ | 2,426,911 | ||||||||||
| Less allowance | (149,000 | ) | - | (17,000 | ) | - | (166,000 | ) | ||||||||||||
| Net account receivable | $ | 1,475,351 | $ | 172,813 | $ | 602,568 | 10,179 | $ | 2,260,911 | |||||||||||
| December 31, 2015 | ||||||||||||||||||||
| Franchise | Cellular Retail | Direct to Consumer | Consumer Finance | Total | ||||||||||||||||
| Accounts receivable | $ | 1,332,446 | $ | 148,346 | $ | 754,400 | $ | - | $ | 2,235,192 | ||||||||||
| Less allowance | (183,000 | ) | - | (89,000 | ) | - | (272,000 | ) | ||||||||||||
| Net account receivable | $ | 1,149,446 | $ | 148,346 | $ | 665,400 | - | $ | 1,963,192 | |||||||||||
Deferred revenue and other liabilities consist of the following:
| September 30, 2016 | December 31, 2015 | |||||||
| Deferred financing fees | $ | 265,779 | $ | 285,452 | ||||
| Deferred franchise development and service fees | 130,500 | 264,000 | ||||||
| Merchandise credits and gift card liability | 694,302 | 1,127,470 | ||||||
| Other | 135,561 | 119,416 | ||||||
| Total | $ | 1,226,142 | $ | 1,796,338 | ||||
| September 30, 2016 | December 31, 2015 | |||||||
| Note payable (with a credit limit of $3,000,000) to River City Equity, Inc., a related party, with interest payable monthly at 12% due June 30, 2016 and upon certain events can be collateralized by substantially all assets of WCR, excluding any equity interest in AGI (terminated May 2016) | $ | $ | 3,000,000 | |||||
| Note payable to a financial institution with monthly principal payment of $58,333 plus interest at LIBOR plus 3.5% (4.125% at September 30, 2016), secured by substantially all assets of the Company with stated guarantee amounts by subsidiaries, maturing April 21, 2021 | 3,266,667 | - | ||||||
| Revolving credit facility (with a credit limit of $3,000,000) to a financial institution with monthly payments of interest only at LIBOR plus 3.5% (4.125% at September 30, 2016), secured by substantially all assets of the Company with stated guarantee amounts by subsidiaries, maturing April 21, 2018 | 1,538,708 | - | ||||||
| Subsidiary note payable to a financial institution with quarterly principal payments of $375,000 plus interest at prime rate plus 2.5%, secured by the AGI’s assets, maturing March 2017 (terminated May 2016) | - | 1,625,000 | ||||||
| Subsidiary note payable to a financial institution with monthly principal payment of $33,334 plus annual paydowns equal to JPRE’s net cash flow from operations due within 120 days of the calendar year end plus interest at LIBOR plus 3.5% (4.125% at September 30, 2016), secured by JPRE assets, maturing June 5, 2019 when remaining principal balance is due | 3,071,454 | 3,371,460 | ||||||
| Total | 7,876,829 | 7,996,460 | ||||||
| Less current maturities | (1,100,000 | ) | (4,900,008 | ) | ||||
| $ | 6,776,829 | $ | 3,096,452 | |||||
Future minimum long-term principal payments are as follows:
| Year | Amount | |||
| 1 | $ | 1,100,000 | ||
| 2 | 2,638,716 | |||
| 3 | 2,971,446 | |||
| 4 | 700,000 | |||
| 5 | 466,667 | |||
| Thereafter | - | |||
| $ | 7,876,829 | |||
On April 22, 2016, WCR entered into a Credit Agreement with a financial institution. The Credit Agreement provides the Company with an acquisition loan facility in an aggregate amount of up to $9,000,000, having a commitment maturity date of April 21, 2018. Funds advanced under the acquisition loan facility bear interest at a floating per annum rate equal to one-month LIBOR plus 3.50%, adjusted on a monthly basis, and mature five years from the date of advance. At closing, $3,500,000 was advanced under the acquisition loan replacing the $3,000,000 River City Equity debt and $500,000 of other term debt. At September 30, 2016, approximately $7,195,000$7,666,000 and $4,510,000 of credit was available under the acquisition and revolving credit facilities.facilities, respectively.
See Note 13 for additional terms and conditions related to the Credit Agreement.7. Equity –
In March 2017, the Company redeemed 106,874 shares of common stock for $480,928 in a private and unsolicited transaction.
8. Cash Dividends –
| Date declared | February 24, 2017 | |||
| Record date | March 17, 2017 | |||
| Date paid | March 24, 2017 | |||
| Dividend per share of common stock | $ | 0.025 | ||
| Date declared | May 12, 2017 | |||
| Record date | July 14, 2017 | |||
| Date paid | July 24, 2017 | |||
| Dividend per share of common stock | $ | 0.025 | ||
| Date declared | August 28, 2017 | |||
| Record date | September 18, 2017 | |||
| Date paid | September 29, 2017 | |||
| Dividend per share of common stock | $ | 0.025 | ||
On January 20, 2016, our shareholders approved a plan to reincorporate Western Capital Resources, Inc. in Delaware at a special meeting of the shareholders called for that purpose. The reincorporation was completed May 11, 2016.9. Other Operating Expense –
| Date declared | May 24, 2016 | August 11, 2016 | |||
| Record date | June 6, 2016 | September 14, 2016 | |||
| Date paid | June 15, 2016 | September 21, 2016 | |||
| Dividend per share of common stock | $ | 0.025 | $ | 0.025 |
A breakout of other expense is as follows:
| Three Months Ended September 30, | Nine Months Ended September 30, | |||||||||||||||
| 2016 | 2015 | 2016 | 2015 | |||||||||||||
| Bank fees | $ | 337,939 | $ | 310,419 | $ | 1,273,057 | $ | 595,164 | ||||||||
| Collection costs | 85,306 | 99,587 | 311,457 | 319,890 | ||||||||||||
| Conference expense | 468,124 | 460,602 | 762,680 | 671,287 | ||||||||||||
| Insurance | 184,106 | 110,788 | 528,995 | 286,783 | ||||||||||||
| Management and advisory fees | 195,425 | 125,754 | 619,954 | 400,057 | ||||||||||||
| Professional and consulting fees | 488,978 | 483,575 | 1,531,923 | 1,401,683 | ||||||||||||
| Supplies | 231,995 | 167,480 | 591,919 | 496,116 | ||||||||||||
| Other | 803,453 | 522,604 | 2,429,596 | 1,583,539 | ||||||||||||
| $ | 2,795,326 | $ | 2,280,809 | $ | 8,049,581 | $ | 5,754,519 | |||||||||
| Three Months Ended September 30, | Nine Months Ended September 30, | |||||||||||||||
| 2017 | 2016 | 2017 | 2016 | |||||||||||||
| Bank fees | $ | 379,245 | $ | 320,156 | $ | 1,484,460 | $ | 1,216,555 | ||||||||
| Collection costs | 94,197 | 85,306 | 275,619 | 311,457 | ||||||||||||
| Insurance | 260,419 | 174,699 | 757,690 | 502,025 | ||||||||||||
| Management and advisory fees | 193,710 | 195,425 | 537,853 | 577,954 | ||||||||||||
| Professional and consulting fees | 555,977 | 368,527 | 1,704,803 | 1,174,323 | ||||||||||||
| Supplies | 341,808 | 222,745 | 1,080,325 | 555,099 | ||||||||||||
| Other | 644,370 | 587,462 | 2,037,646 | 1,641,446 | ||||||||||||
| $ | 2,469,726 | $ | 1,954,320 | $ | 7,878,396 | $ | 5,978,859 | |||||||||
Effective10. Segment Information –
Segment information related to the three and nine month periods ended September 30, 2017 and 2016 for continuing operations is presented below:
Three Months Ended September 30, 2017 (in thousands) | ||||||||||||||||||||
Cellular Retail | Direct to Consumer | Consumer Finance | Corporate | Total | ||||||||||||||||
| Revenue from external customers | $ | 18,301 | $ | 4,983 | $ | 2,849 | $ | — | $ | 26,133 | ||||||||||
| Net income (loss) | $ | (223 | ) | $ | (462 | ) | $ | 326 | $ | (251 | ) | $ | (610 | ) | ||||||
| Expenditures for segmented assets | $ | 6,408 | $ | 139 | $ | 1 | $ | 7 | $ | 6,555 | ||||||||||
Three Months Ended September 30, 2016 (in thousands) | ||||||||||||||||||||
Cellular Retail | Direct to Consumer | Consumer Finance | Corporate | Total | ||||||||||||||||
| Revenue from external customers | $ | 9,294 | $ | 5,945 | $ | 3,009 | $ | — | $ | 18,248 | ||||||||||
| Net income (loss) | $ | 72 | $ | (325 | ) | $ | 391 | $ | (218 | ) | $ | (80 | ) | |||||||
| Expenditures for segmented assets | $ | 241 | $ | 50 | $ | 21 | $ | — | $ | 312 | ||||||||||
Nine Months Ended September 30, 2017 (in thousands) | ||||||||||||||||||||||||
Cellular | Direct to Consumer | Consumer Finance | Corporate | Discontinued Operations | Total | |||||||||||||||||||
| Revenue from external customers | $ | 52,432 | $ | 29,014 | $ | 8,136 | $ | — | $ | — | $ | 89,582 | ||||||||||||
| Net income (loss) | $ | 65 | $ | 1,507 | $ | 781 | $ | (690 | ) | $ | — | $ | 1,663 | |||||||||||
| Total segmented assets | $ | 28,375 | $ | 13,462 | $ | 8,080 | $ | 2,162 | $ | 8,683 | $ | 60,762 | ||||||||||||
| Expenditures for segment assets | $ | 7,612 | $ | 341 | $ | 1 | $ | 8 | $ | — | $ | 7,962 | ||||||||||||
Nine Months Ended September 30, 2016 (in thousands) | ||||||||||||||||||||||||
Cellular | Direct to Consumer | Consumer Finance | Corporate | Discontinued Operations | Total | |||||||||||||||||||
| Revenue from external customers | $ | 27,152 | $ | 30,699 | $ | 8,830 | $ | — | $ | — | $ | 66,681 | ||||||||||||
| Net income (loss) | $ | 526 | $ | 1,682 | $ | 964 | $ | (636 | ) | $ | — | $ | 2,536 | |||||||||||
| Total segmented assets | $ | 16,472 | $ | 14,723 | $ | 15,735 | $ | 413 | $ | 10,111 | $ | 57,454 | ||||||||||||
| Expenditures for segment assets | $ | 1,688 | $ | 88 | $ | 39 | $ | — | $ | — | $ | 1,815 | ||||||||||||
11. Acquisition –
In 2016, PQH entered into an agreement to acquire 20 Cricket Wireless retail locations, with an option to purchase an additional 33 locations. The aggregate purchase price for all 53 locations was approximately $6,000,000, subject to reduction in the event that the seller exercised an option to retain a 30% ownership in the acquired business. From November 22, 2016 through June 1, 2015,30, 2017, PQH purchased with cash all outstanding membership interests in four separate limited liability companies (Green Communications, LLC, an Arizona LLC, Green Communications, LLC, an Oregon LLC, Green Communications, LLC,operated the store locations under a Washington LLC and Go Green, LLC an Arizona LLC).management agreement. Effective July 1, 2015,2017, we consummated the Company acquiredacquisition transaction by acquiring a 100%70% interest in all 53 locations through a subsidiary of PQH, and the seller, upon exercising its option to retain a 30% ownership interest in the businessesacquired business, contributed its interest to the subsidiary. As a result, PQH owns 70% of RAI, JPPA,the newly formed subsidiary and JPRE, by completing a merger and contribution transaction.the seller owns the remaining 30% of that subsidiary.
The provisional fair value of the purchase consideration together with the corresponding fair value of the contribution by noncontrolling interests was allocated to the net tangible assets acquired. We accounted for the acquisition of stores as the purchase of a business under GAAP under the acquisition method of accounting. The assets and liabilities acquired were recorded as of the acquisition date, at their respective fair values and consolidated with those of our company. The fair value of the net assets acquired was approximately $6,000,000. The excess of the aggregate fair value over the net tangible assets has been treated as a gain on bargain purchase in accordance with ASC 805. The purchase price allocation was based, in part, on management’s knowledge of wireless retail business and is preliminary. Once we complete our analysis to finalize the purchase price allocation, which includes finalizing the valuation report, it is reasonably possible that, there could be significant changes to the preliminary values below. Under the purchase method of accounting, the assets acquired and liabilities assumed were recorded at their provisional fair values as of the purchase date as follows:
| July 1, 2017 | ||||
| Inventory | $ | 217,000 | ||
| Property and equipment | 1,332,000 | |||
| Intangible assets | 4,306,000 | |||
| Other assets | 103,000 | |||
| Net assets acquired | $ | 5,958,000 | ||
12. Discontinued Operations –
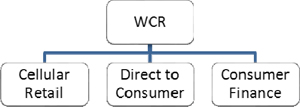
On September 29, 2017, the Board of Directors of the Company authorized the Company to enter into a sale agreement (see Note 15) for 100% of its stock holdings of AGI, the sole business comprising the Company’s Franchise segment.
In accordance with the provisions of ASC 205-20, the Company has separately reported the assets and liabilities of the discontinued operations of the Franchise segment in the Condensed Consolidated Balance Sheets. The assets and liabilities have been reflected as held for sale in the unaudited Condensed Consolidated Balance Sheets as of September 30, 2017 and December 31, 2016, and consist of the following:
September 30, 2017 (unaudited) | December 31, 2016 (unaudited) | |||||||
| OTHER CURRENT ASSETS: | ||||||||
| Accounts receivable (less allowance for losses of $145,000 and $83,000, respectively) | $ | 1,306,762 | $ | 1,020,210 | ||||
| Prepaid expenses and other | 203,152 | 327,851 | ||||||
| TOTAL OTHER CURRENT ASSETS | $ | 1,509,914 | $ | 1,348,061 | ||||
| NONCURRENT ASSETS: | ||||||||
| Property and equipment, net | $ | 243,147 | $ | 287,386 | ||||
| Intangible assets, net | 5,983,031 | 6,241,386 | ||||||
| Other | 215,063 | 121,119 | ||||||
| TOTAL NONCURRENT ASSETS | $ | 6,441,241 | $ | 6,649,891 | ||||
| CURRENT LIABILITIES | ||||||||
| Accounts payable and accrued expenses | $ | 841,097 | $ | 1,375,754 | ||||
| Other liabilities | 1,142,999 | 1,044,061 | ||||||
| Income taxes payable | — | 170,262 | ||||||
| Current portion capital lease obligations | — | 7,620 | ||||||
| Deferred revenue and other | 286,832 | 253,698 | ||||||
| TOTAL CURRENT LIABILITIES | $ | 2,270,928 | $ | 2,851,395 | ||||
| LONG-TERM LIABILITIES | ||||||||
| Deferred income taxes | $ | 2,155,000 | $ | 2,293,000 | ||||
| Other | 208,924 | 143,080 | ||||||
| TOTAL LONG-TERM LIABILITIES | $ | 2,363,924 | $ | 2,436,080 | ||||
In accordance with the provisions of ASC 205-20, the Company has not included the results of operations of the Franchise segment in the results from continuing operations. The results of operations for the acquiredthis business have been includedreflected as discontinued operations in the consolidated financial statements sinceunaudited Condensed Consolidated Statements of Operations for the datesnine month periods ended September 30, 2017 and 2016, and consist of the acquisition. following:
| Nine Months Ended | ||||||||
September 30, 2017 (unaudited) | September 30, 2016 (unaudited) | |||||||
| REVENUES | $ | 12,298,655 | $ | 11,451,699 | ||||
| COST OF REVENUES | 2,098,486 | 1,819,491 | ||||||
| GROSS PROFIT | 10,200,169 | 9,632,208 | ||||||
| OPERATING EXPENSES: | ||||||||
| Salaries, wages and benefits | 3,194,025 | 3,426,127 | ||||||
| Occupancy | 140,428 | 179,518 | ||||||
| Advertising, marketing and development | 436,566 | 271,649 | ||||||
| Depreciation | 74,263 | 84,141 | ||||||
| Amortization | 258,356 | 258,356 | ||||||
| Other | 2,108,299 | 2,037,001 | ||||||
| 6,211,937 | 6,256,792 | |||||||
| OPERATING INCOME | 3,988,232 | 3,375,416 | ||||||
| INTEREST EXPENSE | — | (93,373 | ) | |||||
| INCOME BEFORE INCOME TAXES | 3,988,232 | 3,282,043 | ||||||
| PROVISION FOR INCOME TAXES | 1,511,000 | 1,267,000 | ||||||
| NET INCOME | 2,477,232 | 2,015,043 | ||||||
| Less net income attributable to noncontrolling interests | (17,446 | ) | (14,742 | ) | ||||
| NET INCOME ATTRIBUTABLE TO WESTERN COMMON SHAREHOLDERS | $ | 2,459,786 | $ | 2,000,301 | ||||
13. Pro Forma –
As more fully disclosed in Notes 12 and 15 herein, the Company sold 100% of its stock holdings of AGI on October 3, 2017.The following table presents the unaudited results of continuing operations for the three and nine monthsmonth periods ended September 30, 20162017 and the unaudited pro forma results of operations for the three and nine months ended September 30, 20152016 (in thousands, except for per share data) as if the acquisitionsdisposition of the discontinued operations had been consummated at the beginning of 2015.2016. The pro forma net income below excludes theinterest expense on debt required to be paid off at closing of the transactions.disposition transaction and related tax effect. The pro forma results of continuing operations are prepared for comparative purposes only and do not necessarily reflect the results that would have occurred had the acquisitiondisposition occurred at the beginning of the 20152016 or the results which may occur in the future.
Three Months Ended September 30, 2017 (in thousands)
| ||||||||||||||||||||
Cellular Retail | Direct to Consumer | Consumer Finance | Corporate | Total | ||||||||||||||||
| Revenue | $ | 18,301 | $ | 4,983 | $ | 2,849 | $ | — | $ | 26,133 | ||||||||||
| % of total revenue | 70.0 | % | 19.1 | % | 10.9 | % | — | % | 100.0 | % | ||||||||||
| Net income | $ | (190 | ) | $ | (462 | ) | $ | 326 | $ | (251 | ) | $ | (577 | ) | ||||||
| Net income attributable to noncontrolling interests | $ | 100 | $ | — | $ | — | $ | — | $ | 100 | ||||||||||
| Net income attributable to Western common shareholders | $ | (290 | ) | $ | (462 | ) | $ | 326 | $ | (251 | ) | $ | (677 | ) | ||||||
| Earnings per share attributable to Western common shareholders – basic and diluted | $ | (0.031 | ) | $ | (0.049 | ) | $ | 0.035 | $ | (0.027 | ) | $ | (0.072 | ) | ||||||
Three Months Ended September 30, 2016 (in thousands)
| ||||||||||||||||||||
Cellular Retail | Direct to Consumer | Consumer Finance | Corporate | Total | ||||||||||||||||
| Revenue | $ | 9,294 | $ | 5,945 | $ | 3,099 | $ | — | $ | 18,248 | ||||||||||
| % of total revenue | 50.9 | % | 32.6 | % | 16.5 | % | — | % | 100.0 | % | ||||||||||
| Net income | $ | 95 | $ | (325 | ) | $ | 391 | $ | (218 | ) | $ | (57 | ) | |||||||
| Net income attributable to noncontrolling interests | $ | — | $ | — | $ | — | $ | — | $ | — | ||||||||||
| Net income attributable to Western common shareholders | $ | 95 | $ | (325 | ) | $ | 391 | $ | (218 | ) | $ | (57 | ) | |||||||
| Earnings per share attributable to Western common shareholders – basic and diluted | $ | 0.010 | $ | (0.034 | ) | $ | 0.041 | $ | (0.023 | ) | $ | (0.006 | ) | |||||||
Nine Months Ended September 30, 2017 (in thousands)
| ||||||||||||||||||||
Cellular Retail | Direct to Consumer | Consumer Finance | Corporate | Total | ||||||||||||||||
| Revenue | $ | 52,432 | $ | 29,014 | $ | 8,136 | $ | — | $ | 89,582 | ||||||||||
| % of total revenue | 58.5 | % | 32.4 | % | 9.1 | % | — | % | 100.0 | % | ||||||||||
| Net income | $ | 183 | $ | 1,507 | $ | 781 | $ | (690 | ) | $ | 1,781 | |||||||||
| Net income attributable to noncontrolling interests | $ | 100 | $ | — | $ | — | $ | — | $ | 100 | ||||||||||
| Net income attributable to Western common shareholders | $ | 83 | $ | 1,507 | $ | 781 | $ | (690 | ) | $ | 1,681 | |||||||||
| Earnings per share attributable to Western common shareholders – basic and diluted | $ | 0.009 | $ | 0.160 | $ | 0.083 | $ | (0.073 | ) | $ | 0.179 | |||||||||
Nine Months Ended September 30, 2016 (in thousands)
| ||||||||||||||||||||
Cellular Retail | Direct to Consumer | Consumer Finance | Corporate | Total | ||||||||||||||||
| Revenue | $ | 27,152 | $ | 30,699 | $ | 8,830 | $ | — | $ | 66,681 | ||||||||||
| % of total revenue | 40.7 | % | 46.0 | % | 13.3 | % | — | % | 100.0 | % | ||||||||||
| Net income | $ | 565 | $ | 1,682 | $ | 964 | $ | (636 | ) | $ | 2,575 | |||||||||
| Net income attributable to noncontrolling interests | $ | — | $ | — | $ | — | $ | — | $ | — | ||||||||||
| Net income attributable to Western common shareholders | $ | 565 | $ | 1,682 | $ | 964 | $ | (636 | ) | $ | 2,575 | |||||||||
| Earnings per share attributable to Western common shareholders – basic and diluted | $ | 0.059 | $ | 0.177 | $ | 0.102 | $ | (0.067 | ) | $ | 0.271 | |||||||||
| Franchise | Cellular Retail | Direct to Consumer | Consumer Finance | Corporate | Total | |||||||||||||||||||
| Three Months Ended September 30, 2016 | ||||||||||||||||||||||||
| Revenue | $ | 4,278 | $ | 9,294 | $ | 5,944 | $ | 3,009 | $ | - | $ | 22,525 | ||||||||||||
| % of total revenue | 19.0 | % | 41.2 | % | 26.4 | % | 13.4 | % | -% | 100.0 | % | |||||||||||||
| Net income (loss) | $ | 749 | $ | 73 | $ | (325 | ) | $ | 391 | $ | (102 | ) | $ | 786 | ||||||||||
| Net income attributable to noncontrolling interests | $ | 6 | $ | - | $ | - | $ | - | $ | - | $ | 6 | ||||||||||||
| Net income (loss) attributable to WCR common shareholders | $ | 743 | $ | 73 | $ | (325 | ) | $ | 391 | $ | (102 | ) | $ | 780 | ||||||||||
| Earnings (loss) per share attributable to WCR common shareholders – basic and diluted | $ | 0.078 | $ | 0.008 | $ | (0.034 | ) | $ | 0.041 | $ | (0.011 | ) | $ | 0.082 | ||||||||||
| Three Months Ended September 30, 2015 | ||||||||||||||||||||||||
| Pro forma revenue | $ | 3,675 | $ | 9,537 | $ | 5,442 | $ | 3,297 | $ | - | $ | 21,951 | ||||||||||||
| % of total pro forma revenue | 16.7 | % | 43.5 | % | 24.8 | % | 15.0 | % | -% | 100.0 | % | |||||||||||||
| Pro forma net income (loss) | $ | 829 | $ | 443 | $ | (569 | ) | $ | 390 | $ | (167 | ) | $ | 926 | ||||||||||
| Pro forma net income attributable to noncontrolling interests | $ | 6 | $ | - | $ | - | $ | - | $ | - | $ | 6 | ||||||||||||
| Pro forma net income (loss) attributable to WCR common shareholders | $ | 823 | $ | 443 | $ | (569 | ) | $ | 390 | $ | (167 | ) | $ | 920 | ||||||||||
| Pro forma earnings (loss) per share attributable to WCR common shareholders – basic and diluted | $ | 0.087 | $ | 0.047 | $ | (0.060 | ) | $ | 0.041 | $ | (0.018 | ) | $ | 0.097 | ||||||||||
| Franchise | Cellular Retail | Direct to Consumer | Consumer Finance | Corporate | Total | |||||||||||||||||||
| Nine Months Ended September 30, 2016 | ||||||||||||||||||||||||
| Revenue | $ | 11,452 | $ | 27,152 | $ | 30,699 | $ | 8,830 | $ | - | $ | 78,133 | ||||||||||||
| % of total revenue | 14.6 | % | 34.8 | % | 39.3 | % | 11.3 | % | -% | 100.0 | % | |||||||||||||
| Net income (loss) | $ | 1,834 | $ | 526 | $ | 1,682 | $ | 964 | $ | (455 | ) | $ | 4,551 | |||||||||||
| Net income attributable to noncontrolling interests | $ | 15 | $ | - | $ | - | $ | - | $ | - | $ | 15 | ||||||||||||
| Net income (loss) attributable to WCR common shareholders | $ | 1,819 | $ | 526 | $ | 1,682 | $ | 964 | $ | (455 | ) | $ | 4,536 | |||||||||||
| Earnings (loss) per share attributable to WCR common shareholders – basic and diluted | $ | 0.192 | $ | 0.055 | $ | 0.177 | $ | 0.102 | $ | (0.048 | ) | $ | 0.478 | |||||||||||
| Nine Months Ended September 30, 2015 | ||||||||||||||||||||||||
| Pro forma revenue | $ | 9,641 | $ | 29,632 | $ | 30,296 | $ | 9,451 | $ | - | $ | 79,020 | ||||||||||||
| % of total pro forma revenue | 12.2 | % | 37.5 | % | 38.3 | % | 12.0 | % | -% | 100.0 | % | |||||||||||||
| Pro forma net income (loss) | $ | 1,585 | $ | 967 | $ | 1,365 | $ | 932 | $ | (408 | ) | $ | 4,441 | |||||||||||
| Pro forma net income attributable to noncontrolling interests | $ | 13 | $ | - | $ | - | $ | - | $ | - | $ | 13 | ||||||||||||
| Pro forma net income (loss) attributable to WCR common shareholders | $ | 1,572 | $ | 967 | $ | 1,365 | $ | 932 | $ | (408 | ) | $ | 4,428 | |||||||||||
| Pro forma earnings (loss) per share attributable to WCR common shareholders – basic and diluted | $ | 0.165 | $ | 0.102 | $ | 0.144 | $ | 0.098 | $ | (0.043 | ) | $ | 0.466 | |||||||||||
|
| Franchise | Cellular Retail | Direct to Consumer | Consumer Finance | Corporate | Total | |||||||||||||||||||
| Revenue from external customers | $ | 4,278 | $ | 9,294 | $ | 5,944 | $ | 3,009 | $ | - | $ | 22,525 | ||||||||||||
| Net income (loss) | $ | 749 | $ | 73 | $ | (325 | ) | $ | 391 | $ | (102 | ) | $ | 786 | ||||||||||
| Expenditures for segmented assets | $ | 3 | $ | 241 | $ | 50 | $ | 21 | $ | - | $ | 315 | ||||||||||||
|
| Franchise | Cellular Retail | Direct to Consumer | Consumer Finance | Corporate | Total | |||||||||||||||||||
| Revenue from external customers | $ | 3,675 | $ | 9,537 | $ | 5,442 | $ | 3,297 | $ | - | $ | 21,951 | ||||||||||||
| Net income (loss) | $ | 829 | $ | 443 | $ | (569 | ) | $ | 390 | $ | (213 | ) | $ | 880 | ||||||||||
| Expenditures for segmented assets | $ | - | $ | - | $ | 186 | $ | 29 | $ | - | $ | 215 | ||||||||||||
|
| Franchise | Cellular Retail | Direct to Consumer | Consumer Finance | Corporate | Total | |||||||||||||||||||
| Revenue from external customers | $ | 11,452 | $ | 27,152 | $ | 30,699 | $ | 8,830 | $ | - | $ | 78,133 | ||||||||||||
| Net income (loss) | $ | 1,834 | $ | 526 | $ | 1,682 | $ | 964 | $ | (455 | ) | $ | 4,551 | |||||||||||
| Total segment assets | $ | 10,111 | $ | 16,472 | $ | 14,723 | $ | 15,735 | $ | 413 | $ | 57,454 | ||||||||||||
| Expenditures for segmented assets | $ | 19 | $ | 1,688 | $ | 89 | $ | 39 | $ | - | $ | 1,835 | ||||||||||||
|
| Franchise | Cellular Retail | Direct to Consumer | Consumer Finance | Corporate | Total | |||||||||||||||||||
| Revenue from external customers | $ | 9,641 | $ | 24,655 | $ | 5,442 | $ | 9,451 | $ | - | $ | 49,189 | ||||||||||||
| Net income (loss) | $ | 1,585 | $ | 910 | $ | (569 | ) | $ | 932 | $ | (710 | ) | $ | 2,148 | ||||||||||
| Total segment assets | $ | 9,379 | $ | 12,823 | $ | 13,568 | $ | 16,299 | $ | 544 | $ | 52,613 | ||||||||||||
| Expenditures for segmented assets | $ | 91 | $ | 3,656 | $ | 186 | $ | 45 | $ | 14 | $ | 3,992 | ||||||||||||
| 14. Commitments and Contingencies – |
Employment Agreements
The Company is party to an Amended and Restated Employment Agreement with its Chief Executive Officer, Mr. John Quandahl. Among other things, this agreement contains provisions for an annual performance-based cash bonus pool for management. The agreement was amended April 1, 2016 to extend the term through March 2019.
Pursuant to the Company’s numerous employment agreements, bonuses of approximately $390,000$92,000 and $1,083,000$411,000 were accrued for the three and nine month periods ended September 30, 2016,2017, respectively.
Credit Facility
15. Subsequent Events –
Sale of Franchise Segment
On October 2, 2017, the Company entered into a Purchase and Sale Agreement (the “Agreement”) with U.S. Business Holdings, Inc. (the “Purchaser”), MBE WorldWide S.p.A. (as guarantor for the Purchaser), BC Alpha, LLC (“BCA”, a wholly owned subsidiary of BC Alpha Holdings II, LLC), and BC Alpha Holdings II, LLC (“BCAH”, a wholly owned subsidiary of the Company). Pursuant to the Agreement, BCA sold all of its shares of capital stock of AGI to the Purchaser. This sale, which closed on October 3, 2017, constitutes the sale of the Company’s franchise segment. The cash purchase price paid by the Purchaser pursuant to the Agreement was $61,500,000, subject to post-closing working capital adjustments. BCA, BCAH, the Company and the Purchaser also agreed to make a joint election under Section 338(h)(10) of the Internal Revenue Code, which treats the transaction as an asset purchase for tax purposes subject to satisfaction of applicable legal requirements.
Pursuant to the Agreement, the Company, BCA and BCAH made customary representations and warranties regarding AGI and its business, and agreed to certain covenants, including customary non-compete and no-solicit covenants related to the AGI business for a period of three years from the closing date. In addition, the Agreement requires the Company to indemnify the Purchaser for damages resulting from or arising out of any inaccuracy or breach of any representation, warranty or covenant of the Company, BCA or BCAH in the Agreement and for certain other matters. The Company’s indemnification obligations generally survive for 24 months following the closing. The Company’s maximum aggregate liability for indemnification claims for any such inaccuracies or breaches is generally limited to an indemnification escrow of $6,500,000, 50% of which (less any indemnification claims) is to be disbursed 12 months following the closing, with the remaining balance (less any indemnification claims) to be disbursed 24 months following the closing.
As a result of the transaction, the Company received approximately $49,000,000 in proceeds from the sale, after taking into account the impact of the estimated working capital and similar purchase price adjustments, the escrowing of $6,500,000 of sale proceeds, the payoff of the Company’s current balance on its Fifth Third acquisition credit facility of approximately $4,300,000, and the payoff of an aggregate amount of approximately $1,600,000 in transaction costs and pre-closing AGI liabilities related to the cancellation and redemption of securities at the AGI level that occurred prior to the transaction.
In connection with the transaction, the Company also entered into a Consent and Third Loan Modification Agreement (the “Modification Agreement”) with Fifth Third Bank, as lender (“Fifth Third”), which amended that certain Credit Agreement between the Company and Fifth Third, dated April 22, 2016, WCR entered into a Credit Agreement with a financial institution. Certain company subsidiaries areas amended (the “Credit Agreement”) to (i) release Fifth Third’s liens on the assets of AGI, BCA and BCAH, (ii) remove AGI, BCA and BCAH as guarantors of the borrowings andCompany’s obligations under the Credit Agreement. All borrowings underAgreement, and (iii) release Fifth Third’s lien on the Credit Agreement are secured by substantially all assets of WCR and the guarantor subsidiaries.Company’s equity interests in BCAH.
The Credit Agreement requires WCR to meet certain financial tests, includingReal Estate Debt Payoff
On October 12, 2017 the Company paid off the subsidiary note payable with Fifth Third which had a leverage ratiomaturity date of June 5, 2019 and a fixed charge coverage ratio, as defined in the Credit Agreement. Subject to certain exceptions, the Credit Agreement contains covenants limiting the company’s ability to (or to permit the guarantor subsidiaries to) merge or consolidate with, or engage in a salebalance of substantially all assets to, any party, but WCR or any guarantor subsidiary generally may nonetheless merge with another party if (i) WCR or guarantor subsidiary is the entity surviving such merger, and (ii) immediately after giving effect to such merger, no default shall have occurred and be continuing under the Credit Agreement. Subject to certain exceptions, the Credit Agreement also contains covenants limiting WCR’s ability to (or to permit the guarantor subsidiaries to) create liens on assets, incur additional indebtedness, make certain types of investments, and pay dividends or make certain other types of restricted payments, but WCR may nonetheless pay dividends to its shareholders if (a) there are no outstanding loans or unpaid interest under the revolving credit facility, and (b) no default shall have occurred and be continuing under the Credit Agreement. Some covenant waivers were granted by the financial institution during the three months ended September 30, 2016.$2,638,112.
Cellular Retail Growth CommitmentRisks Inherent in Our Consumer Finance Segment
Effective June 6, 2016, PQH entered into
In October 2017, the Consumer Financial Protection Bureau issued final rules affecting the payday lending industry and other market participants who make available certain kinds of high-interest loans. Those rules will generally require lenders to take steps to reasonably determine that borrowers will be able repay the loans according to their terms without needing to reborrow within the following 30 days. The rules also generally prohibit lenders from directly withdrawing payment from a Cricket Wireless Exclusive Dealer Agreement Amendment for Retail Expansion. Perborrower’s bank account after two prior consecutive attempted withdrawals have failed. Finally, the agreement, PQH commitsrules prohibit lenders from making loans to opencustomers who have earlier taken out three “covered” loans (i.e., payday loans and certain other kinds of high-interest loans) within 30 days of each other until at least 150 locations by December 31, 2017, including 50 locations by December 31, 2016. Also30 days have passed from the date on which the last such covered loan is no longer outstanding. These rules will become effective June 6, 2016, Cricket Wireless, LLC has increased certain compensation arrangements inon or about July 2019, and are expected to have a material impact on the existing dealer agreement and will provide a subsidy for each location opened during the term of the agreement.
Wireless Retail Transactionindustry.
PQH entered into an Asset Purchase Agreement for the acquisition of 20 Cricket Wireless retail locations for $2,050,000 and an option to purchase an additional 33 locations for an aggregate purchase price of $7,200,000. In addition, if PQH exercised its option, seller has an option to retain a 30% ownership in the 53 store transaction, with a corresponding adjustment to the purchase price. It is anticipated that the transaction will close in November 2016.
Consumer Finance Segment Law Change
On November 8, 2016, South Dakota voters approved a measure effectively banning payday lending in South Dakota. Unless delayed, the effective date of the measure will be November 16, 2016. Revenue generated in South Dakota is approximately 5% of Consumer Finance segment year to date revenue through September 30, 2016.
The CompanyWe evaluated all other events or transactions that occurred after September 30, 20162017 up through November 14, 2016, the date we issued these financial statements. During this period we did not have any additional material subsequent events that impacted our financial statements.statements other than those listed above.
Item 2. Management’s Discussion and Analysis of Financial Condition and Results of Operations
Forward-Looking Statements
Some of the statements made in this report are “forward-looking statements,” as that term is defined under Section 27A of the Securities Act and Section 21E of the Securities Exchange Act of 1934. These forward-looking statements are based upon our current expectations and projections about future events. Whenever used in this report, the words “believe,” “anticipate,” “intend,” “estimate,” “expect” and similar expressions, or the negative of such words and expressions, are intended to identify forward-looking statements, although not all forward-looking statements contain such words or expressions. The forward-looking statements in this report are primarily located in the material set forth under the heading “Management’s Discussion and Analysis of Financial Condition and Results of Operations” (Part I, Item 2), but may be found in other parts of this report as well. These forward-looking statements generally relate to our plans, objectives and expectations for future operations and are based upon management’s current estimates and projections of future results or trends. Although we believe that our plans and objectives reflected in or suggested by these forward-looking statements are reasonable, we may not achieve these plans or objectives. You should read this report completely and with the understanding that actual future results may be materially different from what we expect. We will not necessarily update forward-looking statements even though our situation may change in the future.
Specific factors that might cause actual results to differ from our expectations embodied in our forward-looking statements, or that might affect the value of the common stock, include but are not limited to:
| the success of new stores related to our expansion plans in the Cellular Retail |
| changes in local, state or federal laws and regulations governing lending practices, or changes in the interpretation of such laws and |
| litigation and regulatory actions directed toward us or the industries in which we operate, particularly in certain key states or nationally; |
| our need for additional financing; |
| unpredictability or uncertainty in financing markets, which could impair our ability to grow our business through acquisitions; |
| changes in Cricket dealer compensation; |
| failure of or disruption caused by a significant vendor; |
| outside factors that affect our ability to obtain product and fulfill orders; and |
| our ability to successfully operate or integrate recent or future business acquisitions. |
Other factors that could cause actual results to differ from those implied by the forward-looking statements in this report are more fully described in the “Risk Factors” section of our Annual Report on Form 10-K for the fiscal year ended December 31, 2015.2016.
Industry data and other statistical information used in this report are based on independent publications, government publications, reports by market research firms or other published independent sources. Some data are also based on our good faith estimates, derived from our review of internal surveys and the independent sources listed above. Although we believe these sources are reliable, we have not independently verified the information.
17
OVERVIEW
Western Capital Resources, Inc. (“WCR” or “Western Capital”) is a holding company havingwith a controlling interest in subsidiaries operating in the following industries and operating segments:
Our “Franchise” segment is comprised of AlphaGraphics, Inc. (99.2% owned), the franchisor of AlphaGraphics® customized print and marketing solutions. Our “Cellular Retail” segment is comprised of an authorized Cricket Wireless dealer and involves the retail sale of cellular phones and accessories to consumers through our wholly owned subsidiary PQH Wireless, Inc. and its subsidiaries. Our “Direct to Consumer” segment consists of (1) a wholly owned online and direct marketing distribution retailer and distributor of live plants, seeds, holiday gifts and garden accessories operating in the retail marketselling its products under the Park Seed, Jackson & Perkins and Wayside Gardens tradebrand names and in the wholesale marketas well as a wholesaler under the Park Wholesale trade name,brand, and (2) a wholly owned online and direct marketing distribution retailer of home improvement and restoration products operating as Van Dyke’s Restorers. Our “Consumer Finance” segment consists of retail financial services conducted through our wholly owned subsidiaries Wyoming Financial Lenders, Inc. and Express Pawn, Inc. Throughout this report, we collectively refer to WCR and its consolidated subsidiaries as “we,” the “Company,” and “us.”
Following are actual andpro forma revenues by operatingOn October 3, 2017 the Company sold 100% of its stock holdings of AlphaGraphics, Inc. (“AGI”), the sole business comprising the Company’s franchise segment, for an aggregate purchase price of $61,500,000 (subject to adjustment) and as more fully explained in Note 15 “Subsequent Events” of the three and nine month periodsnotes to our condensed consolidated financial statements included in this report. AGI net income applicable to the Company’s shareholders for the nine-month period ended September 30, 2016 and 2015:2017 was $2.46 million, which represents 61.15% of the total net income applicable to the Company’s shareholders for the period.
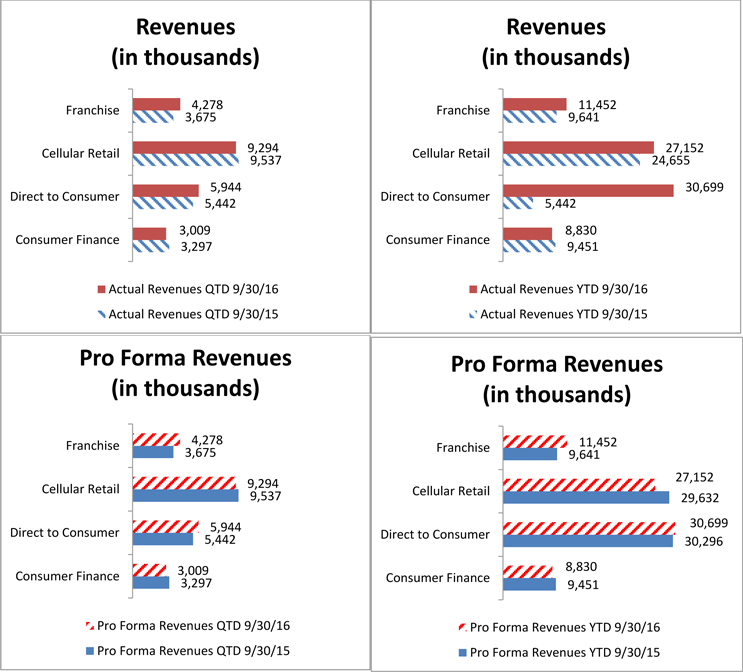
Discussion of Critical Accounting Policies
Our condensed consolidated financial statements and accompanying notes have been prepared in accordance with accounting principles generally accepted in the United States of America applied on a consistent basis. The preparation of these financial statements requires us to make a number of estimates and assumptions that affect the reported amounts of assets and liabilities, the disclosure of contingent assets and liabilities at the date of the financial statements, and the reported amounts of revenues and expenses during the reporting periods. We evaluate these estimates and assumptions on an ongoing basis. We base these estimates on the information currently available to us and on various other assumptions that we believe are reasonable under the circumstances. Actual results could vary materially from these estimates under different assumptions or conditions.
Our significant accounting policies are discussed in Note 1, “Basis of Presentation, Nature of Business and Summary of Significant Accounting Policies,” of the notes to our condensed consolidated financial statements included in this report. We believe that the following critical accounting policies affect the more significant estimates and assumptions used in the preparation of our condensed consolidated financial statements.
Loan Loss Allowance
Included in loans receivable are unpaid principal, interest and fee balances of payday, installment, pawn and title loans that have not reached their maturity date, and “late” payday loans that have reached maturity within the last 180 days and have remaining outstanding balances. Late payday loans generally are unpaid loans where a customer’s personal check has been deposited and the check has been returned due to non-sufficient funds in the customer’s account, a closed account, or other reasons. All returned items are charged-off after 180 days, as collections after that date have not been significant. Loans are carried at cost plus accrued interest or fees through maturity date, less payments made and a loans receivable allowance.
The Company doesWe do not specifically reserve for any individual payday, installment or title loan. The Company aggregatesWe aggregate loan types for purposes of estimating the loss allowance using a methodology that analyzes historical portfolio statistics and management’s judgment regarding recent trends noted in the portfolio. This methodology takes into account several factors, including (1) the amount of loan principal, interest and fee outstanding, (2) historical charge offs from loans that originated during the last 24 months, (3) current and expected collection patterns and (4) current economic trends. The Company utilizesWe utilize a software program to assist with the tracking of its historical portfolio statistics. A loan loss allowance is maintained for anticipated losses for payday and installment loans based primarily on our historical percentages by loan type of net charge offs, applied against the applicable balance of loan principal, interest and fees outstanding. The CompanyWe also periodically performsperform a look-back analysis on its loan loss allowance to verify the historical allowance established tracks with the actual subsequent loan write-offs and recoveries. The Company isWe are aware that as conditions change, it may also need to make additional allowances in future periods. Loan losses or charge-offs of pawn or title loans are not recorded because the value of the collateral exceeds the loan amount. See Note 4 to our condensed consolidated financial statements included in this report for a rollforward of our loans receivable allowance.
Valuation of Long-lived and Intangible Assets
We assess the possibility of impairment of long-lived and intangible assets whenever events or changes in circumstances indicate that the carrying value may not be recoverable. Factors that could trigger an impairment review include significant underperformance relative to expected historical or projected future cash flows, significant changes in the manner of use of acquired assets or the strategy for the overall business, and significant negative industry events or trends. In addition, we conduct an annual goodwill impairment test as of October 1 each year. We assess our goodwill for impairment at the reporting unit level by applying a fair value test. This fair value test involves a two-step process. The first step is to compare the carrying value of our net assets to our fair value. If the fair value is determined to be less than the carrying value, a second step is performed to measure the amount of the impairment, if any.
Results of Operations – Three Months Ended September 30, 20162017 Compared to Three Months Ended September 30, 20152016
Net income attributable to our common shareholders was $0.02 million, or $0.00 per share (basic and diluted), for the quarter ended September 30, 2017, compared to net income of $0.78 million, or $0.08 per share (basic and diluted), for the quarter ended September 30, 2016, compared2016. Net loss from continuing operations attributable to $0.87our common shareholders was $0.71 million, or $0.09($0.08) per share (basic and diluted), for the quarter ended September 30, 2015.2017, compared to net loss of $0.08 million, or ($0.01) per share (basic and diluted), for the quarter ended September 30, 2016. Net income from discontinued operations attributable to our common shareholders was $0.73 million, or $0.08 per share (basic and diluted), for the quarter ended September 30, 2017 compared to $0.86 million, or $0.09 per share (basic and diluted) for the quarter ended September 30, 2016.
We expect segment operating results and earnings per share to change throughout 20162017 due, at least in part, to the seasonality of the Direct to Consumer and Cellular Retail segments, growth in the Cellular Retail segment, discontinued operations of our Franchise segment, and potential mergers and acquisitions activity.
Following is a discussion of operating results by segment.
The following table provides quarter-over-quarter revenues and net income attributable to WCR common shareholders by continuing operating segment (in thousands):
| Cellular Retail | Direct to Consumer | Consumer Finance | Corporate | Total | ||||||||||||||||||||||||||||||||||||||||
| Three Months Ended September 30, 2017 | ||||||||||||||||||||||||||||||||||||||||||||
| Revenues | $ | 18,301 | $ | 4,983 | $ | 2,849 | $ | — | $ | 26,133 | ||||||||||||||||||||||||||||||||||
| % of total revenue | 70.0 | % | 19.1 | % | 10.9 | % | — | % | 100.0 | % | ||||||||||||||||||||||||||||||||||
| Net income (loss) | $ | (223 | ) | $ | (462 | ) | $ | 326 | $ | (251 | ) | $ | (610 | ) | ||||||||||||||||||||||||||||||
| Net income (loss) attributable to WCR common shareholders | $ | (323 | ) | $ | (462 | ) | $ | 326 | $ | (251 | ) | $ | (710 | ) | ||||||||||||||||||||||||||||||
| Franchise | Cellular Retail | Direct to Consumer | Consumer Finance | Corporate | Total | |||||||||||||||||||||||||||||||||||||||
| Three Months Ended September 30, 2016 | ||||||||||||||||||||||||||||||||||||||||||||
| Revenues | $ | 4,278 | $ | 9,294 | $ | 5,944 | $ | 3,009 | $ | - | $ | 22,525 | $ | 9,294 | $ | 5,945 | $ | 3,009 | $ | — | $ | 18,248 | ||||||||||||||||||||||
| % of total revenue | 19.0 | % | 41.2 | % | 26.4 | % | 13.4 | % | -% | 100.0 | % | 50.9 | % | 32.6 | % | 16.5 | % | — | % | 100.0 | % | |||||||||||||||||||||||
| Net income (loss) | $ | 749 | $ | 73 | $ | (325 | ) | $ | 391 | $ | (102 | ) | $ | 786 | $ | 72 | $ | (325 | ) | $ | 391 | $ | (218 | ) | $ | (80 | ) | |||||||||||||||||
| Net income (loss) attributable to WCR common shareholders | $ | 743 | $ | 73 | $ | (325 | ) | $ | 391 | $ | (102 | ) | $ | 780 | $ | 72 | $ | (325 | ) | $ | 391 | $ | (218 | ) | $ | (80 | ) | |||||||||||||||||
| Three Months Ended September 30, 2015 | ||||||||||||||||||||||||||||||||||||||||||||
| Revenues | $ | 3,675 | $ | 9,537 | $ | 5,442 | $ | 3,297 | $ | - | $ | 21,951 | ||||||||||||||||||||||||||||||||
| % of total revenue | 16.7 | % | 43.5 | % | 24.8 | % | 15.0 | % | -% | 100.0 | % | |||||||||||||||||||||||||||||||||
| Net income (loss) | $ | 829 | $ | 443 | $ | (569 | ) | $ | 390 | $ | (213 | ) | $ | 880 | ||||||||||||||||||||||||||||||
| Net income (loss) attributable to WCR common shareholders | $ | 823 | $ | 443 | $ | (569 | ) | $ | 390 | $ | (213 | ) | $ | 874 | ||||||||||||||||||||||||||||||
Franchise
The table below summarizes the number of AlphaGraphics business centers owned and operated by franchisees during the quarters ended September 30, 2016 and 2015:
| Beginning | New | Closed | Ending | |||||||||||||
| 2016 | ||||||||||||||||
| US Centers | 258 | 1 | (1 | ) | 258 | |||||||||||
| International Centers | 25 | - | - | 25 | ||||||||||||
| Total | 283 | 1 | (1 | ) | 283 | |||||||||||
| 2015 | ||||||||||||||||
| US Centers | 250 | 4 | (2 | ) | 252 | |||||||||||
| International Centers | 26 | - | - | 26 | ||||||||||||
| Total | 276 | 4 | (2 | ) | 278 | |||||||||||
Our U.S. franchisees reported approximate center sales for the quarters ended September 30 as follows:
| 2016 | 2015 | |||||||
| Total gross U.S. network-wide center sales | $ | 69,849,000 | $ | 67,193,000 | ||||
Revenues and net income for the quarters ended September 30, 2016 and 2015 were $4.28 million versus $3.68 million and $0.75 million versus $0.83 million, respectively. Contributing to the revenue growth of 16.40% was a 9.01% increase in royalty and franchise development fee revenue and a 150.78% increase in services revenue which includes revenue from new low margin services added in 2016. The revenue growth of 3.89% was offset with the increase direct cost of services provided and a 13.61% increase in operating costs, resulting in the segment net income decrease to $0.75 million from $0.83 million in the prior year comparable quarter.
Cellular Retail
A summary table of the number of Cricket cellular retail stores we operated during the quartersquarter ended September 30, 20162017 and 20152016 follows:
| 2016 | 2015 | 2017 | 2016 | |||||||||||||
| Beginning | 116 | 110 | 268 | 116 | ||||||||||||
| Acquired/ Launched | 10 | - | 15 | 10 | ||||||||||||
| Closed | - | (8 | ) | (3 | ) | — | ||||||||||
| Ending | 126 | 102 | 280 | 126 | ||||||||||||
The Cellular Retail divisionsegment revenues and contribution to net income each decreasedincrease period over period is a result of operating significantly more stores period over period. A significant portionIncluded in the growth in the number of locations are 53 mature stores we acquired a 70% ownership interest in effective July 1, 2017. We had previously operated these locations since November 22, 2016 under the management agreement. In addition to operating these additional mature locations, we also operated an additional 100 locations (net of closed locations), most of which were launched. While the launching of the new locations contributed to revenue is from phone sales and there are two factors that have influenced a decline in phone revenue period over period. Prior year comparable quarter volume was positively influenced by customer migrations to Cricket Wireless’ new GSM network, so a volume decrease was anticipated. Discounting of phones isgrowth, it also a significant factor affecting revenue and discounts increased approximately $1.35 million period over period. These discounts also reduce cost of phones and do not impact gross profit or net income. While phone sales revenue decreased period over period, dealer compensation and customer fees increased 17.9%. Other factors contributingcontributed to the decline in segment net income are growth related and include increased marketing and development costs, infrastructure costs and depreciation expense.period over period.
Direct to Consumer
The Direct to Consumer segment has seasonal sources of revenue and historically experiences a greater proportion of annual revenue and net income in the months of March through May and December due to the seasonal products it sells. For the current quarter and comparable prior year period, the Direct to Consumer segment had net loss of ($0.46) million and ($0.33) million, compared to a net loss of ($0.57) million for the comparable prior year period.respectively. Revenues for the three month period ended September 30, 20162017 were $5.94$4.98 million compared to pro forma revenues for the comparable period in 20152016 of $5.44 million, an increase in of 9.2%$5.95 million.
Consumer Finance
A summary table of the number of consumer finance locations we operated during the quarters ended September 30, 20162017 and 20152016 follows:
| 2016 | 2015 | 2017 | 2016 | |||||||||||||
| Beginning | 46 | 51 | 41 | 46 | ||||||||||||
| Acquired/ Launched | - | - | — | — | ||||||||||||
| Closed | (1 | ) | - | — | (1 | ) | ||||||||||
| Ending | 45 | 51 | 41 | 45 | ||||||||||||
Our Consumer Finance segment revenues decreased 8.7% for the quarter ended September 30, 20162017 compared to the quarter ended September 30, 2015. We sold or closed 6 underperforming store2016 due to the closing of five locations between the comparable periods and regional economic downturns in the Midwest, primarily Wyoming, North Dakota and South Dakota continue to contribute to revenue declines. Reductions in net bad debt and operating costs have helped to keepat the end of 2016. Revenue decreased 5.32% period over period while net income flat quarter over quarter.decreased 16.62%.
Corporate
Costs related to our Corporate segment were $0.10$0.25 million for the quarter ended September 30, 20162017 compared to $0.21$0.22 million for the quarter ended September 30, 2015.2016. In accordance with authoritative guidance applicable to discontinued operations, prior year comparable Corporate costs have been increased from those reported in previously filed reports as a result of continuing corporate overhead previously allocated to discontinued operations being reallocated to corporate.
Results of Operations – Nine Months Ended September 30, 20162017 Compared to Nine Months Ended September 30, 20152016
Net income attributable to our common shareholders was $4.02 million, or $0.43 per share (basic and diluted), for the nine-month period ended September 30, 2017, compared to net income of $4.54 million, or $0.48 per share (basic and diluted), for the nine monthsnine-month period ended September 30, 2016, compared2016. Net income from continuing operations attributable to $2.14our common shareholders was $1.56 million, or $0.30$0.17 per share (basic and diluted), for the comparablenine-month period in 2015 andended September 30, 2017, compared to pro forma net income for the prior comparable period of $4.43$2.54 million, or $0.47$0.27 per share (basic and diluted). As further discussed below, The Franchise, Direct, for the nine-month period ended September 30, 2016. Net income from discontinued operations attributable to Consumerour common shareholders was $2.46 million, or $0.26 per share (basic and Consumer Finance operating segments each contributeddiluted), for the nine-month period ended September 30, 2017 compared to the increase in net income of $2.00 million, or $0.21 per share (basic and diluted) for the year over yearnine-month period while the Retail Wireless segment decreased.ended September 30, 2016.
As previously noted, weWe expect segment operating results and earnings per share to change throughout 20162017 due, at least in part, to the seasonality of the Direct to Consumer and Cellular Retail segments, growth in the Cellular Retail segment, discontinued operations of our Franchise segment, and potential mergers and acquisitions activity.
Following is a discussion of operating results by segment.
The following table provides period over periodperiod-over-period revenues and net income attributable to WCR common shareholders by continuing operating segment (in thousands):
| Cellular Retail | Direct to Consumer | Consumer Finance | Corporate | Total | ||||||||||||||||||||||||||||||||||||||||
| Nine Months Ended September 30, 2017 | ||||||||||||||||||||||||||||||||||||||||||||
| Revenues | $ | 52,432 | $ | 29,014 | $ | 8,136 | $ | — | $ | 89,582 | ||||||||||||||||||||||||||||||||||
| % of total revenue | 58.5 | % | 32.4 | % | 9.1 | % | — | % | 100.0 | % | ||||||||||||||||||||||||||||||||||
| Net income (loss) | $ | 65 | $ | 1,507 | $ | 781 | $ | (690 | ) | $ | 1,663 | |||||||||||||||||||||||||||||||||
| Net income (loss) attributable to WCR common shareholders | $ | (35 | ) | $ | 1,507 | $ | 781 | $ | (690 | ) | $ | 1,563 | ||||||||||||||||||||||||||||||||
| Franchise | Cellular Retail | Direct to Consumer | Consumer Finance | Corporate | Total | |||||||||||||||||||||||||||||||||||||||
| Nine Months Ended September 30, 2016 | ||||||||||||||||||||||||||||||||||||||||||||
| Revenues | $ | 11,452 | $ | 27,152 | $ | 30,699 | $ | 8,830 | $ | - | $ | 78,133 | $ | 27,152 | $ | 30,699 | $ | 8,830 | $ | — | $ | 66,681 | ||||||||||||||||||||||
| % of total revenue | 14.6 | % | 34.8 | % | 39.3 | % | 11.3 | % | -% | 100.0 | % | 40.7 | % | 46.0 | % | 13.3 | % | — | % | 100.0 | % | |||||||||||||||||||||||
| Net income (loss) | $ | 1,834 | $ | 526 | $ | 1,682 | $ | 964 | $ | (455 | ) | $ | 4,551 | $ | 526 | $ | 1,682 | $ | 964 | $ | (636 | ) | $ | 2,536 | ||||||||||||||||||||
| Net income (loss) attributable to WCR common shareholders | $ | 1,819 | $ | 526 | $ | 1,682 | $ | 964 | $ | (455 | ) | $ | 4,536 | $ | 526 | $ | 1,682 | $ | 964 | $ | (636 | ) | $ | 2,536 | ||||||||||||||||||||
| Nine Months Ended September 30, 2015 | ||||||||||||||||||||||||||||||||||||||||||||
| Revenues | $ | 9,641 | $ | 24,655 | $ | 5,442 | $ | 9,451 | $ | - | $ | 49,189 | ||||||||||||||||||||||||||||||||
| % of total revenue | 19.6 | % | 50.1 | % | 11.1 | % | 19.2 | % | -% | 100.0 | % | |||||||||||||||||||||||||||||||||
| Net income (loss) | $ | 1,585 | $ | 910 | $ | (569 | ) | $ | 932 | $ | (710 | ) | $ | 2,148 | ||||||||||||||||||||||||||||||
| Net income (loss) attributable to WCR common shareholders | $ | 1,572 | $ | 910 | $ | (569 | ) | $ | 932 | $ | (710 | ) | $ | 2,135 | ||||||||||||||||||||||||||||||
Pro Forma Nine Months Ended September 30, 2015 | ||||||||||||||||||||||||||||||||||||||||||||
| Pro Forma Revenues | $ | 9,641 | $ | 29,632 | $ | 30,296 | $ | 9,451 | $ | - | $ | 79,020 | ||||||||||||||||||||||||||||||||
| Pro Forma % of total revenue | 12.2 | % | 37.5 | % | 38.3 | % | 12.0 | % | -% | 100.0 | % | |||||||||||||||||||||||||||||||||
| Pro Forma Net income (loss) | $ | 1,585 | $ | 967 | $ | 1,365 | $ | 932 | $ | (408 | ) | $ | 4,441 | |||||||||||||||||||||||||||||||
| Pro Forma Net income (loss) attributable to WCR common shareholders | $ | 1,572 | $ | 967 | $ | 1,365 | $ | 932 | $ | (408 | ) | $ | 4428 | |||||||||||||||||||||||||||||||
23
Franchise
The table below summarizes the number of AlphaGraphics business centers owned and operated by franchisees during the nine month periods ended September, 2016 and 2015:
| Beginning | New | Closed | Ending | |||||||||||||
| 2016 | ||||||||||||||||
| US Centers | 254 | 7 | (3 | ) | 258 | |||||||||||
| International Centers | 25 | - | - | 25 | ||||||||||||
| Total | 279 | 7 | (3 | ) | 283 | |||||||||||
| 2015 | ||||||||||||||||
| US Centers | 242 | 14 | (4 | ) | 252 | |||||||||||
| International Centers | 32 | - | (6 | ) | 26 | |||||||||||
| Total | 274 | 14 | (10 | ) | 278 | |||||||||||
Our U.S. franchisees reported approximate center sales for the nine month periods ended September 30 as follows:
| 2016 | 2015 | |||||||
| Total gross U.S. network-wide center sales | $ | 208,510,000 | $ | 199,346,000 | ||||
Revenues for the nine month period ended September 30, 2016 and 2015 were $11.45 million and $9.64 million, respectively. Contributing to the revenue growth of 18.78% was a 7.14% increase in royalty and franchise development fee revenue and a 122.04% increase in services revenue, primarily attributable to revenue from new low margin services added in 2016. The revenue growth, net of direct costs and together with a 6.18% increase in operating costs period over period resulted in the segment net income increase to $1.83 million from $1.59 million for the prior year comparable period.
Cellular Retail
A summary table of the number of Cricket cellular retail stores we operated during the nine month periods ended September 30, 20162017 and 20152016 follows:
| 2016 | 2015 | 2017 | 2016 | |||||||||||||
| Beginning | 99 | 61 | 198 | 99 | ||||||||||||
| Acquired/ Launched | 33 | 49 | 93 | 33 | ||||||||||||
| Closed | (6 | ) | (8 | ) | (11 | ) | (6 | ) | ||||||||
| Ending | 126 | 102 | 280 | 126 | ||||||||||||
Average store revenue and gross profit was downThe increase in Cellular Retail segment revenues in the current nine month period overcompared to the same period as expected sincein the prior period volume was positively influenced by customer migrationsyear is due to Cricket Wireless’ new GSM network. Discounted phone prices (with a corresponding decrease in cost) have also contributed tooperating approximately 154 additional locations during at least some portion of the decrease in revenue. However, dealer compensation and customer fee revenue, both with no direct cost of revenues associated with the revenue, each have increased. Increased operating costs include one-time store consolidation costs in addition to cost incurred related to expansion efforts. Management expects to realize the benefit of these non-recurring costscomparable periods. Included in the mid-term.increased location count are 53 locations we operated under a management agreement effective November 22, 2016 and subsequently acquired a 70% ownership interest in effective July 1, 2017.
Direct to Consumer
On July 1, 2015, we added our newest segment,The Direct to Consumer.Consumer segment has seasonal sources of revenue and historically experiences a greater proportion of annual revenue and net income in the months of March through May and December due to the seasonal products it sells. Revenues for the nine month period ended September 30, 20162017 were $29.01 million compares to $30.70 million up a marginal 1.3% from pro forma revenues for the comparable period in 2015 of $30.30 million. For the nine month period ended September 30, 2016, the Direct to Consumer segment had net income of $1.68 million and pro forma net income of $1.37 million in the comparable period of the prior year, a 22.6% increase.2016.
Consumer Finance
A summary table of the number of consumer finance locations we operated during the nine month periods ended September 30, 20162017 and 20152016 follows:
| 2016 | 2015 | 2017 | 2016 | |||||||||||||
| Beginning | 47 | 51 | 41 | 47 | ||||||||||||
| Acquired/ Launched | - | - | — | — | ||||||||||||
| Closed | (2 | ) | - | — | (2 | ) | ||||||||||
| Ending | 45 | 51 | 41 | 45 | ||||||||||||
Our Consumer Finance segment revenues decreased 6.57% for the nine months ended September 30, 2016 from the comparable nine month period ended September 30, 2015. Same store payday and installment lending revenue decreased 3.76%. The impact2017 compared to the nine month period ended September 30, 2016 as a result of the regional economic downturnsstore closings in the Midwest, primarily Wyoming, North Dakota and South Dakota have contributed significantly toat the decrease in same store revenueend of 2016. Revenue decreased 7.86% period over period. Similarly to the quarter over quarter results, reductions inperiod while net bad debt and operating costs have helped to keep the net results relatively stable period over period.income decreased 18.98%.
Corporate
Costs related to our Corporate segment were $0.46$0.69 million for the nine monthsmonth period ended September 30, 20162017 compared to $0.71$0.64 million for the nine monthsmonth period ended September 30, 2015. The nine month period2016. As previously noted in 2015 included approximately $0.32 million in transaction related costs.this report, continuing corporate overhead costs previously allocated to the discontinued operations has been reallocated to corporate.
Liquidity and Capital Resources
Summary cash flow data is as follows:
| Nine Months Ended September 30, | Nine Months Ended September 30, | |||||||||||||||
| 2016 | 2015 | 2017 | 2016 | |||||||||||||
| Cash flows provided (used) by: | ||||||||||||||||
| Operating activities | $ | 2,256,955 | $ | 273,798 | $ | 1,957,861 | $ | 2,256,955 | ||||||||
| Investing activities | (1,723,606 | ) | (644,645 | ) | (2,714,541 | ) | (1,723,606 | ) | ||||||||
| Financing activities | (485,121 | ) | (353,775 | ) | (4,774,898 | ) | (485,121 | ) | ||||||||
| Net increase (decrease) in cash | 48,228 | (724,622 | ) | |||||||||||||
| Net decrease in cash | (5,531,578 | ) | 48,228 | |||||||||||||
| Cash, beginning of period | 7,847,669 | 4,273,350 | 14,159,975 | 7,847,669 | ||||||||||||
| Cash, end of period | $ | 7,895,897 | $ | 3,548,728 | $ | 8,628,397 | $ | 7,895,897 | ||||||||
At September 30, 2016,2017, we had cash of $7.90$8.63 million compared to cash of $3.55$7.90 million on September 30, 2015.2016. Both comparable periods include cash flows utilized for growth in our Cellular Retail segment. We believe thatIn July of 2017, we reduced our available cash, combinedoutstanding credit facility balance by $1 million.
As previously noted, effective July 1, 2017 we closed on an acquisition of Cricket retail stores. Prior to closing, we advanced funds pursuant to a Note Receivable arrangement with expectedthe sellers. Advances made pre-closing were included in investing activities and at closing the Note Receivable balance was applied to the purchase price. Included in the amount applied, which is not included in cash flows from operationsinvesting activities for the nine months ended September 30, 2017 was $2.92 million advanced in 2016. Amounts advanced in 2016 together with amounts advanced in 2017 and available financing,paid at closing totaled approximately $3.62 million.
As previously noted, on October 3, 2017 we sold all of our shares of capital stock of our discontinued franchise operations. The transaction resulted in $49 million of liquidity to the Company. Post-closing we extinguished an additional $2.7 million of debt. The balance of approximately $46 million will be sufficientused to fund our scheduled debt repaymentspay an estimated $22 million of income taxes and the Cellular Retail segment anticipated capital expenditures through September 30, 2017.for acquisitions.
Off-Balance Sheet Arrangements
We had no off-balance sheet arrangements as of September 30, 2016.2017.
Item 4. Controls and Procedures
Evaluation of Disclosure Controls and Procedures
We maintain disclosure controls and procedures designed to provide reasonable assurance that information required to be disclosed in our reports filed pursuant to the Securities Exchange Act of 1934 is recorded, processed, summarized and reported within the time periods specified in the SEC’s rules and forms, and that such information is accumulated and communicated to our management, including our Chief Executive Officer and Chief Financial Officer, as appropriate, to allow timely decisions regarding required disclosure. A control system, no matter how well conceived and operated, can provide only reasonable, not absolute, assurance the objectives of the control system are met.
We utilize the Committee of Sponsoring Organization’sInternal Control – Integrated Framework, 2013 version,for the design, implementation and assessment of the effectiveness of our disclosure controls and procedures and internal control over financial reporting.
As of September 30, 2016,2017, our Chief Executive Officer and Chief Financial Officer carried out an assessment of the effectiveness of our disclosure controls and procedures as such term is defined in Rule 13a-15(e) under the Securities and Exchange Act of 1934.Based on this assessment, our Chief Executive Officer and Chief Financial Officer concluded our disclosure controls and procedures are effective as of September 30, 2016.2017.
Changes in Internal Control over Financial Reporting
There were no changes in our internal control over financial reporting during the quarter ended September 30, 20162017 that have materially affected, or are reasonably likely to materially affect, our internal control over financial reporting.
25
��
On November 1, 2017, the Company entered into a Second Amended and Restated Management and Advisory Agreement with Blackstreet Capital Management, LLC, dated July 21, 2012, as earlier amended on each of October 1, 2014 and July 1, 2015. The amended and restated agreement eliminates the Company’s unilateral right to terminate the agreement in connection with a change in control of the Company. As a result, any termination of the amended and restated agreement in connection with a change in control of the Company will require the mutual consent of both the Company and Blackstreet Capital Management.
26
Pursuant to the requirements of the Securities and Exchange Act of 1934, the registrant has duly caused this report to be signed on its behalf by the undersigned, thereunto duly authorized.
| Dated: November 14, | Western Capital Resources, Inc. | |
| (Registrant) | ||
| By: | /s/ John Quandahl | |
| John Quandahl | ||
| Chief Executive Officer and Chief Operating Officer | ||
| By: | /s/ | |
| Chief Financial Officer | ||
27