SECURITIES AND EXCHANGE COMMISSION
Washington, D.C. 20549
Form 10-Q
xWashington, D.C. 20549
Form 10-Q
☒ Quarterly report pursuant to Section 13 or 15(d) of the Securities Exchange Act of 1934
For the quarterly period ended March 31, 20172018
o☐ Transition report pursuant to Section 13 or 15(d) of the Securities Exchange Act of 1934
Commission File Number: 000-52015
Western Capital Resources, Inc.
(Exact Name of Registrant as Specified in its Charter)
| Delaware | 47-0848102 | |
| (State or Other Jurisdiction of Incorporation or Organization) | (I.R.S. Employer Identification Number) |
11550 “I” Street, Suite 150, Omaha, Nebraska 68137
| 11550 “I” Street, Suite 150, Omaha, Nebraska 68137 | ||
| (Address of Principal Executive Offices) (Zip Code) |
| Registrant’s telephone number, including area code: (402) 551-8888 | ||
N/A
Registrant’s telephone number, including area code: (402) 551-8888
N/A
| (Former name, former address and former fiscal year, if changed since last report) |
(Former name, former address and former fiscal year, if changed since last report)
CheckIndicate by check mark whether the issuerregistrant (1) has filed all reports required to be filed by Section 13 or 15(d) of the Securities Exchange Act of 1934 during the pastpreceding 12 months (or for such shorter period that the registrant was required to file such reports), and (2) has been subject to such filing requirements for the past 90 days. Yesþ ☑ Noo ☐
Indicate by check mark whether the registrant has submitted electronically and posted on its corporate website, if any, every Interactive Data File required to be submitted and posted pursuant to Rule 405 of Regulation S-T (§232.405 of this chapter) during the preceding 12 months (or for such shorter period that the registrant was required to submit and post such files). Yesþ ☑ Noo ☐
Indicate by check mark whether the registrant is a large accelerated filer, an accelerated filer, a non-accelerated filer, a smaller reporting company, or an emerging growth company. See definitions of “large accelerated filer,” “accelerated filer,” “smaller reporting company,” and “emerging growth company” in Rule 12b-2 of the Exchange Act (check one):
| Large accelerated filer | Accelerated filer |
| Non-accelerated filer | Smaller reporting company |
| Emerging growth company |
If an emerging growth company, indicate by check mark if the registrant has elected not to use the extended transition period for complying with any new or revised financial accounting standards provided pursuant to Section 13(a) of the Exchange Act.o ☐
Indicate by check mark whether the registrant is a shell company (as defined in Rule 12b-2 of the Exchange Act).
Yeso ☐ Noþ ☑
APPLICABLE ONLY TO CORPORATE ISSUERS
As of May 15, 2017,2018, the registrant had outstanding 9,390,997 shares of common stock, $0.001 par value per share.
Western Capital Resources, Inc.
Index
WESTERN CAPITAL RESOURCES, INC. AND SUBSIDIARIES
CONTENTS
| Page | |
| CONDENSED CONSOLIDATED FINANCIAL STATEMENTS | |
| Condensed Consolidated Balance Sheets | 4 |
| Condensed Consolidated Statements of | 5 |
| Condensed Consolidated Statements of Cash Flows | 6 |
| Notes to Condensed Consolidated Financial Statements | 7 |
3
WESTERN CAPITAL RESOURCES, INC. AND SUBSIDIARIES | |||||||
| March 31, 2018 | December 31, 2017 | ||||||
| (Unaudited) | |||||||
| ASSETS | |||||||
| CURRENT ASSETS | |||||||
| Cash and cash equivalents | $ | 9,125,283 | $ | 21,295,819 | |||
| Short-term investments | 44,386,857 | 32,292,902 | |||||
| Loans receivable (net of allowance for losses of $698,000 and $833,000, respectively) | 3,362,498 | 4,310,003 | |||||
| Accounts receivable (net of allowance for losses of $57,000 and $16,000, respectively) | 2,191,743 | 764,071 | |||||
| Inventory (net of allowance of $577,000 and $576,000, respectively) | 10,010,703 | 9,130,842 | |||||
| Prepaid expenses and other | 3,691,137 | 3,762,974 | |||||
| Escrow and other receivables | 3,285,231 | 3,482,770 | |||||
| TOTAL CURRENT ASSETS | 76,053,452 | 75,039,381 | |||||
| INVESTMENTS | 2,000,000 | 3,000,000 | |||||
| PROPERTY AND EQUIPMENT, net | 11,116,899 | 11,347,234 | |||||
| GOODWILL | 5,796,528 | 5,796,528 | |||||
| INTANGIBLE ASSETS, net | 4,819,669 | 4,987,769 | |||||
| ESCROW FUNDS RECEIVABLE | 3,250,000 | 3,250,000 | |||||
| OTHER | 668,807 | 823,244 | |||||
| TOTAL ASSETS | $ | 103,705,355 | $ | 104,244,156 | |||
| LIABILITIES AND EQUITY | |||||||
| CURRENT LIABILITIES | |||||||
| Accounts payable and accrued expenses | $ | 11,996,557 | $ | 11,897,968 | |||
| Other current liabilities | 1,198,493 | 1,354,558 | |||||
| Income taxes payable | 18,725,244 | 18,730,647 | |||||
| Note payable – short-term | 29,250 | 51,992 | |||||
| Current portion capital lease obligations | 47,858 | 47,174 | |||||
| Deferred revenue | 1,164,450 | 1,073,600 | |||||
| TOTAL CURRENT LIABILITIES | 33,161,852 | 33,155,939 | |||||
| LONG-TERM LIABILITIES | |||||||
| Notes payable, net of current portion | 789,216 | 789,216 | |||||
| Capital lease obligations, net of current portion | 38,934 | 51,172 | |||||
| Deferred income taxes | 1,379,000 | 1,456,000 | |||||
| Other | 98,259 | 98,259 | |||||
| TOTAL LONG-TERM LIABILITIES | 2,305,409 | 2,394,647 | |||||
| TOTAL LIABILITIES | 35,467,261 | 35,550,586 | |||||
| COMMITMENTS AND CONTINGENCIES (Note 14) | |||||||
| EQUITY | |||||||
| WESTERN SHAREHOLDERS’ EQUITY | |||||||
| Common stock, $0.001 par value, 12,500,000 shares authorized, 9,390,997 shares issued and outstanding. | 939 | 939 | |||||
| Additional paid-in capital | 29,031,741 | 29,031,741 | |||||
| Retained earnings | 37,262,637 | 37,903,204 | |||||
| TOTAL WESTERN SHAREHOLDERS’ EQUITY | 66,295,317 | 66,935,884 | |||||
| NONCONTROLLING INTERESTS | 1,942,777 | 1,757,686 | |||||
| TOTAL EQUITY | 68,238,094 | 68,693,570 | |||||
| TOTAL LIABILITIES AND EQUITY | $ | 103,705,355 | $ | 104,244,156 | |||
WESTERN CAPITAL RESOURCES, INC. AND SUBSIDIARIES
CONDENSED CONSOLIDATED BALANCE SHEETS (Unaudited)
| March 31, 2017 | December 31, 2016 | |||||||
| ASSETS | ||||||||
| CURRENT ASSETS | ||||||||
| Cash | $ | 11,208,398 | $ | 14,159,975 | ||||
| Loans receivable (less allowance for losses of $880,000 and $1,036,000, respectively) | 3,529,939 | 4,438,276 | ||||||
| Accounts receivable (less allowance for losses of $123,000 and $96,000, respectively) | 3,408,305 | 1,716,867 | ||||||
| Inventory | 10,342,291 | 9,095,460 | ||||||
| Prepaid expenses and other | 4,346,777 | 3,727,284 | ||||||
| TOTAL CURRENT ASSETS | 32,835,710 | 33,137,862 | ||||||
| NOTES RECEIVABLE | 3,437,956 | 2,920,112 | ||||||
| PROPERTY AND EQUIPMENT, net | 10,086,273 | 9,696,620 | ||||||
| GOODWILL | 5,796,528 | 5,796,528 | ||||||
| INTANGIBLE ASSETS, net | 7,396,426 | 7,536,945 | ||||||
| OTHER | 1,220,022 | 1,122,585 | ||||||
| TOTAL ASSETS | $ | 60,772,915 | $ | 60,210,652 | ||||
| LIABILITIES AND EQUITY | ||||||||
| CURRENT LIABILITIES | ||||||||
| Accounts payable and accrued expenses | $ | 11,805,009 | $ | 13,002,381 | ||||
| Other current liabilities | 2,065,419 | 2,242,372 | ||||||
| Income taxes payable | 1,614,644 | 265,813 | ||||||
| Note payable – short-term | 30,020 | 55,819 | ||||||
| Current portion long-term debt | 1,780,000 | 1,780,000 | ||||||
| Current portion capital lease obligations | 47,100 | 54,020 | ||||||
| Deferred revenue | 1,819,987 | 1,427,358 | ||||||
| TOTAL CURRENT LIABILITIES | 19,162,179 | 18,827,763 | ||||||
| LONG-TERM LIABILITIES | ||||||||
| Notes payable, net of current portion | 7,326,332 | 8,681,545 | ||||||
| Capital lease obligations, net of current portion | 82,102 | 94,762 | ||||||
| Deferred income taxes | 1,812,000 | 1,775,000 | ||||||
| Other | 162,272 | 143,080 | ||||||
| TOTAL LONG-TERM LIABILITIES | 9,382,706 | 10,694,387 | ||||||
| TOTAL LIABILITIES | 28,544,885 | 29,522,150 | ||||||
| COMMITMENTS AND CONTINGENCIES (Note 12) | ||||||||
| EQUITY | ||||||||
| WESTERN SHAREHOLDERS’ EQUITY | ||||||||
| Common stock, $0.001 par value, 12,500,000 shares authorized, 9,390,997 and 9,497,871 shares issued and outstanding. | 939 | 950 | ||||||
| Additional paid-in capital | 29,008,229 | 28,997,087 | ||||||
| Retained earnings | 3,190,543 | 1,643,996 | ||||||
| TOTAL WESTERN SHAREHOLDERS’ EQUITY | 32,199,711 | 30,642,033 | ||||||
| NONCONTROLLING INTERESTS | 28,319 | 46,469 | ||||||
| TOTAL EQUITY | 32,228,030 | 30,688,502 | ||||||
| TOTAL LIABILITIES AND EQUITY | $ | 60,772,915 | $ | 60,210,652 | ||||
See notes to condensed consolidated financial statements
.
4
WESTERN CAPITAL RESOURCES, INC. AND SUBSIDIARIES
CONDENSED CONSOLIDATED STATEMENTS OF INCOME (unaudited)
See notes to condensed consolidated financial statements
5
WESTERN CAPITAL RESOURCES, INC. AND SUBSIDIARIES
CONDENSED CONSOLIDATED STATEMENTS OF CASH FLOWS (Unaudited)
See notes to condensed consolidated financial statements.
WESTERN CAPITAL RESOURCES, INC. AND SUBSIDIARIES
NOTES TO CONDENSED CONSOLIDATED FINANCIAL STATEMENTS (Unaudited)
| 1. | Basis of Presentation, Nature of Business and Summary of Significant Accounting Policies – |
Basis of Presentation
The accompanying unaudited condensed consolidated financial statements have been prepared according to the instructions to Form 10-Q and Section 210.8-03(b) of Regulation S-X of the Securities and Exchange Commission (SEC) and, therefore, certain information and footnote disclosures normally included in financial statements prepared in accordance with accounting principles generally accepted in the United States of America (“GAAP”)(GAAP) have been omitted.
In the opinion of management, all adjustments (consisting of normal recurring accruals) considered necessary for a fair presentation have been included. Operating results for the three month period ended March 31, 20172018 are not necessarily indicative of the results that may be expected for the year ending December 31, 2017.2018.
For further information, refer to the Condensed Consolidated Financial Statements and footnotes thereto included in our Form 10-K for the year ended December 31, 2016.2017. The condensed consolidated balance sheet at December 31, 2016,2017, has been derived from the audited consolidated financial statements at that date, but does not include all of the information and footnotes required by GAAP.
Nature of Business
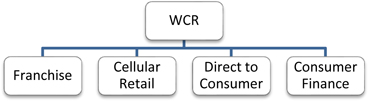
Western Capital Resources, Inc. (WCR) is a parent company owning operating subsidiaries, with percentage owned shown parenthetically, as summarized below.
| Cellular Retail |
| PQH Wireless, Inc. (PQH) (100%) – operates 236 cellular retail stores |
| Direct to Consumer |
| J & P Park Acquisitions, Inc. (JPPA) (100%) – an online and direct marketing distribution retailer of 1) live plants, seeds, holiday gifts and garden accessories selling its products under Park Seed, Jackson & Perkins, and Wayside Gardens brand names and 2) home improvement and restoration products operating under the Van Dyke’s Restorers brand, as well as a seed wholesaler under the Park Wholesale brand. |
| J & P Real Estate, LLC (JPRE) (100%) – owns real estate utilized as JPPA’s distribution and warehouse facility and the corporate offices of |
| Consumer Finance |
| Wyoming Financial Lenders, Inc. (WFL) (100%) – owns and operates “payday” stores (40 as of March 31, |
| Express Pawn, Inc. (EPI) (100%) – owns and operates retail pawn stores (three as of March 31, |
| ● | Discontinued Operations 2017 - Franchise |
| ○ | AlphaGraphics, Inc. (AGI) – franchisor of domestic and international AlphaGraphics Business Centers which specialize in the planning, production, and management of visual communications for businesses and individuals throughout the world. AGI was sold on October 2, 2017. |
References in these financial statement notes to “Company” or “we” refer to Western Capital Resources, Inc. and its subsidiaries. References to specific companies within our enterprise, such “AGI,”as” “PQH,” “JPPA,” “RAI,” “JPRE,” “WFL”“WFL,” “EPI” or “EPI”“AGI” are references only to those companies.
Basis of Consolidation
The consolidated financial statements include the accounts of the WCR, its wholly owned subsidiaries and other entities in which the Company owns a controlling financial interest. For financial interests in which the Company owns a controlling financial interest, the Company applies the provisions of ASCFinancial Accounting Standards Board Accounting Standards Codification (ASC) 810, “Consolidation” applicable to reporting the equity and net income or loss attributable to noncontrolling interests. All significant intercompany balances and transactions of the Company have been eliminated in consolidation.consolidation, with the exception of the presentation of dividends received from discontinued subsidiary operations in the Condensed Consolidated Statement of Cash Flows.
Use of Estimates
The preparation of consolidated financial statements in conformity with accounting principles generally accepted in the United States of America requires management to make estimates and assumptions that may affect certain reported amounts and disclosures in the consolidated financial statements and accompanying notes. Management bases its estimates on historical experience and on various other assumptions that are believed to be reasonable under the circumstances. Actual results could differ from those estimates. Significant management estimates relate to the notesloans and loansaccounts receivable allowance, carrying value and impairment of long-lived goodwill and intangible assets, inventory valuation and obsolescence, estimated useful lives of property and equipment, gift certificate and merchandise credits liability and deferred taxes and tax uncertainties.
Reclassifications
Certain Statements of Income and Statements of Cash Flows reclassifications have been made in the presentation of our prior financial statements and accompanying notes to conform to the presentation as of and for the three months ended March 31, 2017.2018.
In accordance with ASC 205-20-45-6, interest on debt required to be paid as a result of our Franchise segment disposal transaction has been allocated to discontinued operations and, in accordance with ASC 205-20-45-9, general corporate overhead has not been allocated to discontinued operations. These re-allocations and related income tax have been made in the presentation of our prior financial statements and accompanying notes.
Recent Accounting Pronouncements
In May 2014, the Financial Accounting Standards Board (FASB) and the International Accounting Standards Board (IASB) jointly issued a comprehensive new revenue recognition standard that will supersede nearly all existing revenue recognition guidance under US GAAP and IFRS.GAAP. This converged standard is effective for annual and interim periods beginning after December 15, 2017. The Company is currently assessinghas adopted this standard as of January 1, 2018 applying it on a retrospective basis as of the potential effectsdate adopted and determined it had no impact on our financial condition, results of operations and consolidated financial statements.
In February 2016, the FASB issued ASU 2016-02, Leases (Topic 842), related to recognition of lease assets and lease liabilities on the balance sheet and disclosing key information about leasing arrangements. ThisThe ASU is effective for annual reporting periods beginning after December 15, 2018, including interim periods within that annual period, with early adoption permitted and to be applied using a modified retrospective approach. The Company is currently evaluating the impact the ASU will have on our financial condition, results of operations and consolidated financial statements.
In June 2016, the FASB issued ASU 2016-13, Financial Instruments - Credit Losses (Topic 326) relatedstatements and expects its adoption to the measurement of credit losses on financial instruments. The standard requireshave a financial asset (or a group of financial assets) measured at amortized cost basis to be presented at the net amount expected to be collected. This ASU is effective for annual reporting periods beginning after December 15, 2018 and interim periods within that annual period, with early adoption permitted and the standard to be applied using a modified retrospective approach. The Company is currently evaluating thematerial impact the ASU will have on our financial condition resultsdue to a material addition of operationsoperating lease assets and consolidated financial statements.liabilities in accordance with the ASU.
No other new accounting pronouncements issued or effective during the fiscal year have had or are expected to have a material impact on the consolidated financial statements.
| 2. | Risks Inherent in the Operating Environment – |
Regulatory
The Company’s Consumer Finance segment activities are highly regulated under numerous local,federal, state, and federallocal laws, regulations and rules, which are subject to change. New laws, regulations or rules could be enacted or issued, interpretations of existing laws, regulations or rules may change and enforcement action by regulatory agencies may intensify. Over the past several years, consumer advocacy groups and certain media reports have advocated governmental and regulatory action to prohibit or severely restrict sub-prime lending activities of the kind conducted by the Company. The federalAfter several years of research, debate, and public hearings, in October 2017 the U.S. Consumer Financial Protection Bureau has indicated that it will use its authority(CFPB) issued new rules for payday lending. The proposed rules, scheduled to further regulatego into effect in August 2019, would impose significant restrictions on the payday industry, and has been actively assessingit is expected that a large number of lenders would be forced to close their stores. The CFPB’s studies projected a reduction in the number of lenders by 50%, while industry studies forecast a much higher attrition rate. At this time it is uncertain whether the rule will be implemented as announced, rewritten with more favorable terms for the industry, or thrown out altogether. If the rule is implemented as written, it could have a significant penalties or seeking settlement payments.and negative impact on business conducted within our Consumer Finance segment.
AnyThe above rule or any other adverse change in present local,federal, state, and federalor local laws or regulations that govern or otherwise affect lending could result in the Consumer Finance segment’s curtailment or cessation of operations in certain or all jurisdictions or locations. Furthermore, any failure to comply with any applicable local,federal, state or federallocal laws or regulations could result in fines, litigation, closure of one or more store locations or negative publicity. Any such change or failure would have a corresponding impact on the Company’s and segment’s results of operations and financial condition, primarily through a decrease in revenues resulting from the cessation or curtailment of operations, decrease in operating income through increased legal expenditures or fines, and could also negatively affect the Company’s general business prospects due to lost or decreased operating income or if negative publicity effectsaffects its ability to obtain additional financing as needed.
In addition, the passage of federal, state or statelocal laws and regulations or changes in interpretations of them could, at any point, essentially prohibit the Consumer Finance segment from conducting its lending business in its current form. Any such legal or regulatory change would certainly have a material and adverse effect on the Company, its operating results, financial condition and prospects, and perhaps even the viability of the Consumer Finance segment.
| 3. |
The following table shows the Company’s cash equivalents and held-to-maturity investments, by significant investment category, recorded as cash equivalents or short- and long-term investments as of March 31, 2018 and December 31, 2017:
| March 31, 2018 | December 31, 2017 | |||||||
| Cash and cash equivalents | ||||||||
| Operating accounts | $ | 8,778,235 | $ | 10,524,923 | ||||
| Certificates of deposit | — | 750,000 | ||||||
| Money Market Mutual Funds - U.S. Treasury obligations | 347,048 | 10,020,896 | ||||||
| Subtotal | 9,125,283 | 21,295,819 | ||||||
| Held to Maturity Investments | ||||||||
| Certificates of deposit | 14,297,734 | 13,250,000 | ||||||
| T-Bill Zero CPN | 32,089,123 | 22,042,902 | ||||||
| Subtotal | 46,386,857 | 35,292,902 | ||||||
| TOTAL | $ | 55,512,140 | $ | 56,588,721 | ||||
As of March 31, 2018, held to maturity securities consisted of the following:
| Cost | Accrued Interest | Amortized Discount | Amortized Cost | Unrealized Gain (Loss) | Estimated Fair Value | |||||||||||||||||||
| Certificates of Deposit | $ | 14,250,000 | $ | 47,734 | $ | — | $ | 14,297,734 | $ | (87,544 | ) | $ | 14,210,190 | |||||||||||
| Treasury Bills | $ | 31,961,012 | $ | — | $ | 128,111 | $ | 32,089,123 | $ | (1,897 | ) | $ | 32,087,226 | |||||||||||
| 4. | Loans Receivable – |
The Consumer Finance segment’s outstanding loans receivable aging was as follows:
| March 31, 2017 | ||||||||||||||||||||||||||||||||
| March 31, 2018 | March 31, 2018 | |||||||||||||||||||||||||||||||
| Payday | Installment | Pawn & Title | Total | Payday | Installment | Pawn & Title | Total | |||||||||||||||||||||||||
| Current | $ | 2,911,699 | $ | 188,774 | $ | 275,963 | $ | 3,376,436 | $ | 2,773,711 | $ | 190,525 | $ | 263,650 | $ | 3,227,886 | ||||||||||||||||
| 1-30 | 199,317 | 32,807 | - | 232,124 | 166,548 | 38,121 | — | 204,669 | ||||||||||||||||||||||||
| 31-60 | 133,955 | 20,032 | - | 153,987 | 108,590 | 23,535 | — | 132,125 | ||||||||||||||||||||||||
| 61-90 | 170,483 | 15,082 | - | 185,565 | 145,640 | 15,484 | — | 161,124 | ||||||||||||||||||||||||
| 91-120 | 148,190 | 11,078 | - | 159,268 | 97,171 | 9,294 | — | 106,465 | ||||||||||||||||||||||||
| 121-150 | 143,073 | 7,556 | - | 150,629 | 112,903 | 3,299 | — | 116,202 | ||||||||||||||||||||||||
| 151-180 | 145,807 | 6,123 | - | 151,930 | 110,344 | 1,683 | — | 112,027 | ||||||||||||||||||||||||
| 3,852,524 | 281,452 | 275,963 | 4,409,939 | 3,514,907 | 281,941 | 263,650 | 4,060,498 | |||||||||||||||||||||||||
| Less Allowance | (812,000 | ) | (68,000 | ) | - | (880,000 | ) | (627,000 | ) | (71,000 | ) | — | (698,000 | ) | ||||||||||||||||||
| $ | 3,040,524 | $ | 213,452 | $ | 275,963 | $ | 3,529,939 | $ | 2,887,907 | $ | 210,941 | $ | 263,650 | $ | 3,362,498 | |||||||||||||||||
| December 31, 2016 | ||||||||||||||||||||||||||||||||
| Payday | Installment | Pawn & Title | Total | |||||||||||||||||||||||||||||
| Current | $ | 3,683,603 | $ | 272,703 | $ | 284,460 | $ | 4,240,766 | ||||||||||||||||||||||||
| 1-30 | 253,297 | 44,433 | - | 297,730 | ||||||||||||||||||||||||||||
| 31-60 | 201,375 | 27,905 | - | 229,280 | ||||||||||||||||||||||||||||
| 61-90 | 185,072 | 18,747 | - | 203,819 | ||||||||||||||||||||||||||||
| 91-120 | 159,435 | 15,737 | - | 175,172 | ||||||||||||||||||||||||||||
| 121-150 | 176,625 | 8,889 | - | 185,514 | ||||||||||||||||||||||||||||
| 151-180 | 134,171 | 7,824 | - | 141,995 | ||||||||||||||||||||||||||||
| 4,793,578 | 396,238 | 284,460 | 5,474,276 | |||||||||||||||||||||||||||||
| Less Allowance | (953,000 | ) | (83,000 | ) | - | (1,036,000 | ) | |||||||||||||||||||||||||
| $ | 3,840,578 | $ | 313,238 | $ | 284,460 | $ | 4,438,276 | |||||||||||||||||||||||||
| December 31, 2017 | ||||||||||||||||
| Payday | Installment | Pawn & Title | Total | |||||||||||||
| Current | $ | 3,550,077 | $ | 271,926 | $ | 318,361 | $ | 4,140,364 | ||||||||
| 1-30 | 216,376 | 47,356 | — | 263,732 | ||||||||||||
| 31-60 | 187,916 | 27,766 | — | 215,682 | ||||||||||||
| 61-90 | 150,278 | 17,976 | — | 168,254 | ||||||||||||
| 91-120 | 110,943 | 11,870 | — | 122,813 | ||||||||||||
| 121-150 | 131,171 | 4,748 | — | 135,919 | ||||||||||||
| 151-180 | 93,222 | 3,017 | — | 96,239 | ||||||||||||
| 4,439,983 | 384,659 | 318,361 | 5,143,003 | |||||||||||||
| Less Allowance | (745,000 | ) | (88,000 | ) | — | (833,000 | ) | |||||||||
| $ | 3,694,983 | $ | 296,659 | $ | 318,361 | $ | 4,310,003 | |||||||||
| Loans Receivable Allowance – |
A rollforward of the Consumer Finance segment’s loans receivable allowance is as follows:
| Three Months Ended March 31, 2017 | Year Ended December 31, 2016 | Three Months Ended March 31, 2018 | Year Ended December 31, 2017 | |||||||||||||
| Loans receivable allowance, beginning of period | $ | 1,036,000 | $ | 1,177,000 | $ | 833,000 | $ | 1,036,000 | ||||||||
| Provision for loan losses charged to expense | 237,581 | 1,605,867 | 200,202 | 1,122,144 | ||||||||||||
| Charge-offs, net | (393,581 | ) | (1,746,867 | ) | (335,202 | ) | (1,325,144 | ) | ||||||||
| Loans receivable allowance, end of period | $ | 880,000 | $ | 1,036,000 | $ | 698,000 | $ | 833,000 | ||||||||
| Accounts Receivable – |
A breakdown of accounts receivables by segment as of March 31, 20172018 and December 31, 20162017 are as follows:
| March 31, 2017 | ||||||||||||||||||||
| Franchise | Cellular Retail | Direct to Consumer | Consumer Finance | Total | ||||||||||||||||
| Accounts receivable | $ | 1,691,336 | $ | 235,525 | $ | 1,595,258 | $ | 9,186 | $ | 3,531,305 | ||||||||||
| Less allowance | (65,000 | ) | - | (58,000 | ) | - | (123,000 | ) | ||||||||||||
| Net account receivable | $ | 1,626,336 | $ | 235,525 | $ | 1,537,258 | $ | 9,186 | $ | 3,408,305 | ||||||||||
| December 31, 2016 | ||||||||||||||||||||||||||||||||||||
| March 31, 2018 | March 31, 2018 | |||||||||||||||||||||||||||||||||||
| Franchise | Cellular Retail | Direct to Consumer | Consumer Finance | Total | Cellular Retail | Direct to Consumer | Consumer Finance | Total | ||||||||||||||||||||||||||||
| Accounts receivable | $ | 1,103,210 | $ | 333,800 | $ | 363,426 | $ | 12,431 | $ | 1,812,867 | $ | 315,549 | $ | 1,920,585 | $ | 12,609 | $ | 2,248,743 | ||||||||||||||||||
| Less allowance | (83,000 | ) | - | (13,000 | ) | - | (96,000 | ) | — | (57,000 | ) | — | (57,000 | ) | ||||||||||||||||||||||
| Net account receivable | $ | 1,020,210 | $ | 333,800 | $ | 350,426 | $ | 12,431 | $ | 1,716,867 | $ | 315,549 | $ | 1,863,585 | $ | 12,609 | $ | 2,191,743 | ||||||||||||||||||
| December 31, 2017 | ||||||||||||||||
| Cellular Retail | Direct to Consumer | Consumer Finance | Total | |||||||||||||
| Accounts receivable | $ | 399,459 | $ | 365,476 | $ | 15,136 | $ | 780,071 | ||||||||
| Less allowance | — | (16,000 | ) | — | (16,000 | ) | ||||||||||
| Net account receivable | $ | 399,459 | $ | 349,476 | $ | 15,136 | $ | 764,071 | ||||||||
| 7. |
The Company leases retail and office facilities under operating leases with terms ranging from month to month to six years, with rights to extend for additional periods. Future minimum base lease payments (in thousands) are approximately as follows:Finished goods inventory, net of allowance, by segment consists of the following:
| Year Ending December 31, | Operating Leases | |||
| 2017 (remainder) | $ | 5,221 | ||
| 2018 | 5,959 | |||
| 2019 | 5,060 | |||
| 2020 | 2,992 | |||
| 2021 | 2,132 | |||
| Thereafter | 459 | |||
| Total minimum base lease payments | $ | 21,823 | ||
Three Months Ended March 31, 2018 | Year Ended December 31, 2017 | |||||||
| Cellular Retail | $ | 5,742,969 | $ | 5,287,932 | ||||
| Direct to Consumer | 3,457,377 | 2,988,052 | ||||||
| Consumer Finance | 810,357 | 854,858 | ||||||
| $ | 10,010,703 | $ | 9,130,842 | |||||
| Notes Payable – Long Term – |
| March 31, 2017 | December 31, 2016 | |||||||
| Revolving credit facility (with a credit limit of $3,000,000) to a financial institution with monthly payments of interest only at LIBOR plus 3.5% (4.375% at March 31, 2017), secured by substantially all assets of the Company with stated guarantee amounts by subsidiaries, maturing April 21, 2018 | $ | 144,882 | $ | 998,426 | ||||
| Note payable to a financial institution with monthly principal payment of $58,333 plus interest at LIBOR plus 3.5% (4.375% at March 31, 2017), securedby substantially all assets of the Company with stated guarantee amounts by subsidiaries, maturing April 21, 2021 | 2,916,667 | 3,091,667 | ||||||
| Note payable to a financial institution with monthly principal payment of $56,667 plus interest at LIBOR plus 3.5% (4.375% at March 31, 2017), securedby substantially all assets of the Company with stated guarantee amounts by subsidiaries, maturing December 1, 2021 | 3,173,333 | 3,400,000 | ||||||
| Subsidiary note payable to a financial institution with monthly principal payment of $33,334 plus annual paydowns equal to JPRE’s net cash flow from operations due within 120 days of the calendar year end plus interest at LIBOR plus 3.5% (4.375% at March 31, 2017), securedby JPRE assets, maturing June 5, 2019 when remaining principal balance is due | 2,871,450 | 2,971,452 | ||||||
| Total | 9,106,332 | 10,461,545 | ||||||
| Less current maturities | (1,780,000 | ) | (1,780,000 | ) | ||||
| $ | 7,326,332 | $ | 8,681,545 | |||||
| March 31, 2018 | December 31, 2017 | |||||||
| Subsidiary subordinated note payable to seller with monthly interest only payments at 6%, guaranteed by PQH, maturingAugust 5, 2022 whentheprincipal balance is due. | 789,216 | 789,216 | ||||||
| Total | 789,216 | 789,216 | ||||||
| Less current maturities | — | — | ||||||
| $ | 789,216 | $ | 789,216 | |||||
The Company is party to a Credit Agreement with a financial institution entered into on April 22, 2016 and subject to subsequent amendments. The Credit Agreement provides the Company with a revolving line of credit facility in an aggregate amount up to $3,000,000, having a maturity date of April 21, 2018 and an acquisition loan facility in an aggregate amount of up to $9,000,000, having a maturity date of April 21, 2018. The revolver and the acquisition loan facility bear interest at a floating per annum rate equal to one-month LIBOR plus 3.50%, adjusted on a monthly basis. Funds advanced under the acquisition loan facility mature five years from the date of advance. At March 31, 2017 approximately $5,765,0002018, the entire $12,000,000 of credit was available under the credit facilities. See Notes 14 and 15 for additional terms, conditions and amendment related to the Credit Agreement.
InThe provision for income taxes for continuing operations is 121.3% and 37.1% of income before the provision for income taxes for the three month period ended March 31, 2018 and 2017, respectively. The significant difference in rate is the Company redeemed 106,874 sharesresult of common stock for $480,928 in a private and unsolicited transaction.the 2018 net income attributable to noncontrolling interests not being subjected to income tax at the corporate level. Rather the “passthrough” taxable income is taxed to the noncontrolling interests at an individual level.
| Cash Dividends – |
| Date declared | February 24, 2017 | January 18, 2018 | ||||||
| Record date | March 17, 2017 | February 9, 2018 | ||||||
| Date paid | March 24, 2017 | February 14, 2018 | ||||||
| Dividend per share of common stock | $ | 0.025 | $ | 0.05 | ||||
| Other Operating Expense – |
A breakout of other expense is as follows:
| For The Three Months Ended March 31, | For The Three Months Ended March 31, | |||||||||||||||
| 2017 | 2016 | 2018 | 2017 | |||||||||||||
| Bank fees | $ | 550,349 | $ | 438,034 | $ | 502,564 | $ | 532,175 | ||||||||
| Collection costs | 89,894 | 116,188 | 84,605 | 89,894 | ||||||||||||
| Conference expense | 289,206 | 265,405 | ||||||||||||||
| Insurance | 250,008 | 181,476 | 205,295 | 240,740 | ||||||||||||
| Management and advisory fees | 223,481 | 221,025 | 193,710 | 153,481 | ||||||||||||
| Professional and consulting fees | 811,130 | 595,210 | 543,096 | 662,089 | ||||||||||||
| Supplies | 332,072 | 183,274 | 217,436 | 324,136 | ||||||||||||
| Other | 994,529 | 741,892 | 948,534 | 739,272 | ||||||||||||
| $ | 3,540,669 | $ | 2,742,504 | $ | 2,695,240 | $ | 2,741,787 | |||||||||
| Discontinued Operations – |
As more fully disclosed in Note 19 of the Notes to Consolidated Financial Statements for the year ended December 31, 2017, on October 3, 2017 the Company closed on the sale of its franchise segment.
In accordance with the provisions of ASC 205-20, the Company has not included the results of operations of the Franchise segment in the results from continuing operations. The results of operations for this business have been reflected as discontinued operations in the unaudited Condensed Consolidated Statements of Operations for the three month periods ended March 31, 2017, and consist of the following:
| Three Months Ended | ||||
| March 31, 2017 | ||||
| REVENUES OF DISCONTINUED OPERATIONS | $ | 3,943,309 | ||
| COST OF REVENUES OF DISCONTINUED OPERATIONS | 648,197 | |||
| GROSS PROFIT OF DISCONTINUED OPERATIONS | 3,295,112 | |||
| OPERATING EXPENSES OF DISCONTINUED OPERATIONS: | ||||
| Salaries, wages and benefits | 1,098,739 | |||
| Occupancy | 42,764 | |||
| Advertising, marketing and development | 102,597 | |||
| Depreciation | 24,092 | |||
| Amortization | 86,118 | |||
| Other | 789,700 | |||
| 2,144,010 | ||||
| OPERATING INCOME OF DISCONTINUED OPERATIONS | 1,151,102 | |||
| OTHER INCOME (EXPENSE) OF DISCONTINUED OPERATIONS | ||||
| Interest expense | (80,781 | ) | ||
| INCOME BEFORE INCOME TAXES OF DISCONTINUED OPERATIONS | 1,070,321 | |||
| PROVISION FOR INCOME TAXES OF DISCONTINUED OPERATIONS | 412,000 | |||
| NET INCOME OF DISCONTINUED OPERATIONS | 658,321 | |||
| Less net income of discontinued operations attributable to noncontrolling interests | (5,085 | ) | ||
| NET INCOME OF DISCONTINUED OPERATIONS ATTRIBUTABLE TO WESTERN COMMON SHAREHOLDERS | $ | 653,236 | ||
In accordance with the provisions of ASC 205-20, the Company has separately reported the cash flow activity of the discontinued operations of the Franchise segment in the Consolidated Statements of Cash Flows. The cash flow activity from discontinued operations have been reflected as discontinued operations in the Consolidated Statements of Cash Flows for the three month period ended March, 2017, and consist of the following:
| Three Months Ended | ||||
| March 31, 2017 | ||||
| DISCONTINUED OPERATING ACTIVITIES | ||||
| Net income of discontinued operations | $ | 658,321 | ||
| Adjustments to reconcile net income of discontinued operations to net cash provided by operating activities of discontinued operations: | ||||
| Depreciation | 24,092 | |||
| Amortization | 86,118 | |||
| Share based compensation | 2,243 | |||
| Deferred income taxes | (29,000 | ) | ||
| Changes in operating assets and liabilities: | ||||
| Accounts receivable | (606,126 | ) | ||
| Prepaid expenses and other assets | 114,753 | |||
| Accounts payable and accrued expenses | (597,356 | ) | ||
| Deferred revenue and other current liabilities | 682,016 | |||
| Other liabilities – long-term | 19,192 | |||
| Net cash provided by operating activities of discontinued operations | $ | 354,253 | ||
| FINANCING ACTIVITIES OF DISCONTINUED OPERATIONS | ||||
| Principal payments on capital lease obligations | $ | (7,620 | ) | |
| Dividends to shareholders | (3,170,728 | ) | ||
| Net cash used in financing activities of discontinued operations | $ | (3,178,348 | ) | |
| 13. | Segment Information – |
Segment information related to the three month periods ended March 31, 2018 and 2017 and 2016for continuing operations is presented below:
| Three Months Ended March 31, 2017 (in thousands) | ||||||||||||||||||||||||
| Franchise | Cellular Retail | Direct to Consumer | Consumer Finance | Corporate | Total | |||||||||||||||||||
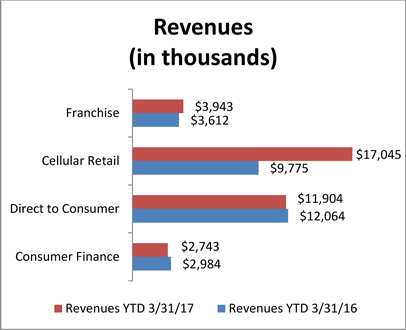
| Revenue from external customers | $ | 3,943 | $ | 17,045 | $ | 11,904 | $ | 2,743 | $ | - | $ | 35,635 | ||||||||||||
| Net income (loss) | $ | 635 | $ | 620 | $ | 866 | $ | 254 | $ | (108 | ) | $ | 2,267 | |||||||||||
| Total segmented assets | $ | 8,879 | $ | 24,794 | $ | 15,429 | $ | 8,047 | $ | 3,624 | $ | 60,773 | ||||||||||||
| Three Months Ended March 31, 2016 (in thousands) | ||||||||||||||||||||||||
| Franchise | Cellular Retail | Direct to Consumer | Consumer Finance | Corporate | Total | |||||||||||||||||||
| Revenue from external customers | $ | 3,612 | $ | 9,775 | $ | 12,064 | $ | 2,984 | $ | - | $ | 28,435 | ||||||||||||
| Net income (loss) | $ | 523 | $ | 371 | $ | 904 | $ | 312 | $ | (135 | ) | $ | 1,975 | |||||||||||
| Total segmented assets | $ | 9,481 | $ | 14,746 | $ | 16,779 | $ | 13,747 | $ | 698 | $ | 55,451 | ||||||||||||
Three Months Ended March 31, 2018 (in thousands)
| ||||||||||||||||||||
Cellular | Direct to Consumer | Consumer Finance | Corporate | Total | ||||||||||||||||
| Revenue from external customers | $ | 17,107 | $ | 10,681 | $ | 2,671 | $ | — | $ | 30,459 | ||||||||||
| Net income (loss) | $ | (375 | ) | $ | 329 | $ | 331 | $ | (271 | ) | $ | 14 | ||||||||
| Total segment assets | $ | 27,567 | $ | 15,092 | $ | 7,003 | $ | 54,043 | $ | 103,705 | ||||||||||
| Expenditures for segmented assets | $ | 117 | $ | 310 | $ | — | $ | — | $ | 427 | ||||||||||
Three Months Ended March 31, 2017 (in thousands)
| ||||||||||||||||||||||||
Cellular | Direct to Consumer | Consumer Finance | Corporate | Discontinued Operations | Total | |||||||||||||||||||
| Revenue from external customers | $ | 17,045 | $ | 11,904 | $ | 2,743 | $ | — | $ | — | $ | 31,692 | ||||||||||||
| Net income (loss) | $ | 669 | $ | 866 | $ | 254 | $ | (180 | ) | $ | — | $ | 1,609 | |||||||||||
| Total segment assets | $ | 24,794 | $ | 15,429 | $ | 8,047 | $ | 4,076 | $ | 8,879 | $ | 61,225 | ||||||||||||
| Expenditures for segmented assets | $ | 673 | $ | 81 | $ | — | $ | — | $ | — | $ | 754 | ||||||||||||
| Commitments and Contingencies – |
Employment Agreements
Pursuant to the Company’s numerous employment agreements, bonuses for continuing operation of approximately $331,000$73,000 and $256,000 were accrued for the three month periods ended March 31, 2018 and 2017, respectively.
Credit Facility
The Company is party to a Credit Agreement with a financial institution. Certain Company subsidiaries are guarantors of the borrowings and obligations under the Credit Agreement. All borrowings under the Credit Agreement are secured by substantially all assets of WCR and the guarantor subsidiaries.
The Credit Agreement requires WCR to meet certain financial tests, including a leverage ratio and a fixed charge coverage ratio, as defined in the Credit Agreement. Subject to certain exceptions, the Credit Agreement contains covenants limiting the Company’s ability to (or to permit the guarantor subsidiaries to) merge or consolidate with, or engage in a sale of substantially all assets to, any party, but WCR or any guarantor subsidiary generally may nonetheless merge with another party if (i) WCR or guarantor subsidiary is the entity surviving such merger, and (ii) immediately after giving effect to such merger, no default shall have occurred and be continuing under the Credit Agreement. Subject to certain exceptions, the Credit Agreement also contains covenants limiting WCR’s ability to (or to permit the guarantor subsidiaries to) create liens on assets, incur additional indebtedness, make certain types of investments, and pay dividends or make certain other types of restricted payments, but WCR may nonetheless pay dividends to its shareholders if (a) there are no outstanding loans or unpaid interest under the revolving credit facility, and (b) no default shall have occurred and be continuing under the Credit Agreement. Some covenant waivers were granted by the financial institution during the period ended March 31, 2017.2018.
Assigned Leases
The Company’s Cellular Retail segment has transferred operations of 37 locations to other dealers. Minimum lease payments of assigned or assumed non-cancelable operating leases related to transferred locations in which a release has not been obtained from the lessor are approximately $3,000,000 as of March 31, 2018.
| Subsequent Events – |
Credit Facility
On April 26, 2018 the Company entered into a Fourth Loan Modification Agreement related to the Credit Agreement with a financial institution, pursuant to which, among other things, the maturity date of the Credit Agreement was extended to April 21, 2020 and the financial covenants were modified by removing the consolidated leverage ratio and consolidated fixed charge coverage ratio covenants and adding a minimum liquidity covenant.
Dividend Declared
Our Board of Directors declared the following dividend:
| Date declared | May 2, 2018 | |||
| Record date | May 17, 2018 | |||
| Date paid | May 24, 2018 | |||
| Dividend per share of common stock | $ | 0.05 | ||
We evaluated all events or transactions that occurred after March 31, 20172018 up through the date we issued these financial statements. During this period we did not have any material subsequent events that impacted our financial statements.
Item 2. Management’s Discussion and Analysis of Financial Condition and Results of Operations
Forward-Looking Statements
Some of the statements made in this report are “forward-looking statements,” as that term is defined under Section 27A of the Securities Act and Section 21E of the Securities Exchange Act of 1934. These forward-looking statements are based upon our current expectations and projections about future events. Whenever used in this report, the words “believe,” “anticipate,” “intend,” “estimate,” “expect” and similar expressions, or the negative of such words and expressions, are intended to identify forward-looking statements, although not all forward-looking statements contain such words or expressions. The forward-looking statements in this report are primarily located in the material set forth under the heading “Management’s Discussion and Analysis of Financial Condition and Results of Operations” (Part I, Item 2), but may be found in other parts of this report as well. These forward-looking statements generally relate to our plans, objectives and expectations for future operations and are based upon management’s current estimates and projections of future results or trends. Although we believe that our plans and objectives reflected in or suggested by these forward-looking statements are reasonable, we may not achieve these plans or objectives. You should read this report completely and with the understanding that actual future results may be materially different from what we expect. We will not necessarily update forward-looking statements even though our situation may change in the future.
Specific factors that might cause actual results to differ from our expectations embodied in our forward-looking statements, or that might affect the value of the common stock, include but are not limited to:
| the seasonal nature of the products sold in our Direct to Consumer segment - a significant portion of pre-tax net income contributed by the segment is earned during the months of March through May and December, consequently the third quarter of each year typically results in a net loss; |
| the success of new stores related to our expansion plans in the Cellular Retail segment; |
| changes in |
| litigation and regulatory actions directed toward us or the industries in which we operate, particularly in certain key states or nationally; |
| our need for additional financing; |
| unpredictability or uncertainty in financing markets which could impair our ability to grow our business through acquisitions; |
| changes in Cricket dealer compensation; |
| failure of or disruption caused by a significant vendor; |
| outside factors that affect our ability to obtain product and fulfill orders; and |
| our ability to successfully operate or integrate recent or future business acquisitions. |
Other factors that could cause actual results to differ from those implied by the forward-looking statements in this report are more fully described in the “Risk Factors” section of our Annual Report on Form 10-K for the fiscal year ended December 31, 2016.2017.
Industry data and other statistical information used in this report are based on independent publications, government publications, reports by market research firms or other published independent sources. Some data areis also based on our good faith estimates, derived from our review of internal surveys and the independent sources listed above. Although we believe these sources are reliable, we have not independently verified the information.
OVERVIEW
Western Capital Resources, Inc. (“WCR”(WCR or “Western Capital”)Western Capital), a Delaware corporation originally incorporated in Minnesota in 2001 and reincorporated in Delaware in 2016, is a holding company withhaving a controlling interest in subsidiaries operating in the following industries and operating segments:
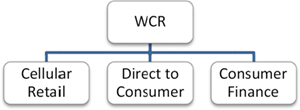
Our “Franchise” segment is comprised of AlphaGraphics, Inc. (99.2% owned), the franchisor of AlphaGraphics® customized print and marketing solutions. Our “Cellular Retail” segment is comprised of an authorized Cricket Wireless dealer and involves the retail sale of cellular phones and accessories to consumers through our wholly owned subsidiary PQH Wireless, Inc. and its subsidiaries.subsidiaries, one of which is 70% owned. Our “Direct to Consumer” segment consists of (1) a wholly owned online and direct marketing distribution retailer of live plants, seeds, holiday gifts and garden accessories selling its products under Park Seed, Jackson & Perkins and Wayside Gardens brand names and home improvement and restoration products operating as Van Dyke’s Restorers as well as a wholesaler under the Park Wholesale brand, and (2) a wholly owned online and direct marketing distribution retailer of home improvement and restoration products operating as Van Dyke’s Restorers.brand. Our “Consumer Finance” segment consists of retail financial services conducted through our wholly owned subsidiaries Wyoming Financial Lenders, Inc. and Express Pawn, Inc. Throughout this report, we collectively refer to WCR and its consolidated subsidiaries as “we,” the “Company,” and “us.”
Following is key financial data for the three month period ended March 31, 2017 and 2016:
Discussion of Critical Accounting Policies
Our condensed consolidated financial statements and accompanying notes have been prepared in accordance with accounting principles generally accepted in the United States of America applied on a consistent basis. The preparation of these financial statements requires us to make a number of estimates and assumptions that affect the reported amounts of assets and liabilities, the disclosure of contingent assets and liabilities at the date of the financial statements, and the reported amounts of revenues and expenses during the reporting periods. We evaluate these estimates and assumptions on an ongoing basis. We base these estimates on the information currently available to us and on various other assumptions that we believe are reasonable under the circumstances. Actual results could vary materially from these estimates under different assumptions or conditions.
Our significant accounting policies are discussed in Note 1, “Basis of Presentation, Nature of Business and Summary of Significant Accounting Policies,” of the notes to our condensed consolidated financial statements included in this report. We believe that the following critical accounting policies affect the more significant estimates and assumptions used in the preparation of our condensed consolidated financial statements.
Loan Loss Allowance
Included in loans receivable are unpaid principal, interest and fee balances of payday, installment, pawn and title loans that have not reached their maturity date, and “late” payday loans that have reached maturity within the last 180 days and have remaining outstanding balances. Late payday loans generally are unpaid loans where a customer’s personal check has been deposited and the check has been returned due to non-sufficient funds in the customer’s account, a closed account, or other reasons. All returned items are charged-off after 180 days, as collections after that date have not been significant. Loans are carried at cost plus accrued interest or fees through maturity date, less payments made and a loans receivable allowance.
The Company does not specifically reserve for any individual payday, installment or title loan. The Company aggregates loan types for purposes of estimating the loss allowance using a methodology that analyzes historical portfolio statistics and management’s judgment regarding recent trends noted in the portfolio. This methodology takes into account several factors, including (1) the amount of loan principal, interest and fee outstanding, (2) historical charge offs from loans that originated during the last 24 months, (3) current and expected collection patterns and (4) current economic trends. The Company utilizes a software program to assist with the tracking of its historical portfolio statistics. A loan loss allowance is maintained for anticipated losses for payday and installment loans based primarily on our historical percentages by loan type of net charge offs, applied against the applicable balance of loan principal, interest and fees outstanding. The Company also periodically performs a look-back analysis on its loan loss allowance to verify the historical allowance established tracks with the actual subsequent loan write-offs and recoveries. The Company is aware that as conditions change, it may also need to make additional allowances in future periods. Loan losses or charge-offs of pawn or title loans are not recorded because the value of the collateral exceeds the loan amount. See Note 45 to our condensed consolidated financial statements included in this report for a rollforward of our loans receivable allowance.
Valuation of Long-lived and Intangible Assets
We assess the possibility of impairment of long-lived and intangible assets, other than goodwill, whenever events or changes in circumstances indicate that the carrying value may not be recoverable. Factors that could trigger an impairment review include significant underperformance relative to expected historical or projected future cash flows, significant changes in the manner of use of acquired assets or the strategy for the overall business, and significant negative industry events or trends. In addition, we conduct an annual goodwill
Goodwill
Goodwill represents the excess of acquisition cost over the fair value of identifiable finite lived net assets acquired and is not amortized. Goodwill is tested for impairment testannually as of October 1, each year.or more frequently if events or changes in circumstances indicate potential impairment. We assess ourtest for goodwill for impairment at the reporting unit level, by applyingwhich aligns with the Company’s segments. We perform a qualitative assessment to determine if a quantitative impairment test is necessary. If quantitative testing is necessary based on a qualitative assessment, we apply a fair value test. This fair value test involves a two-step process. The first step is to compare the carrying value of our net assets to our fair value. If the fair value is determined to be less than the carrying value, a second step is performed to measure the amount of the impairment, if any.
Results of Operations – Three Months Ended March 31, 20172018 Compared to Three Months Ended March 31, 20162017
Net income (loss) for continuing operations attributable to our common shareholders was $2.26$(0.17) million, or $0.24($0.02) per share (basic and diluted), for the quarter ended March 31, 2017,2018, compared to $1.97$1.61 million, or $0.21$0.17 per share (basic and diluted), for the quarter ended March 31, 2016.2017.
We expect segment operating results and earnings per share to change throughout 20172018 due, at least in part, to the seasonality of the Direct to Consumer and Cellular Retail segments, growthretraction in the Cellular Retail segment, and potential mergers and acquisitions activity.
Following is a discussion of operating results by segment.
The following table provides quarter-over-quarter revenues and net income attributable to WCR common shareholders by continuing operating segment for the quarters ended March 31, 2018 and March 31, 2017 (in thousands):
| Cellular Retail | Direct to Consumer | Consumer Finance | Corporate | Total | ||||||||||||||||||||||||||||||||||||||||
| Three Months Ended March 31, 2018 | ||||||||||||||||||||||||||||||||||||||||||||
| Revenue | $ | 17,107 | $ | 10,681 | $ | 2,671 | $ | — | $ | 30,459 | ||||||||||||||||||||||||||||||||||
| % of total revenue | 56.1 | % | 35.1 | % | 8.8 | % | — | % | 100.0 | % | ||||||||||||||||||||||||||||||||||
| Net income (loss) | $ | (375 | ) | $ | 329 | $ | 331 | $ | (271 | ) | $ | 14 | ||||||||||||||||||||||||||||||||
| Net income (loss) attributable to noncontrolling interests | $ | 185 | $ | — | $ | — | $ | — | $ | 185 | ||||||||||||||||||||||||||||||||||
| Net income (loss) attributable to WCR common shareholders | $ | (560 | ) | $ | 329 | $ | 331 | $ | (271 | ) | $ | (171 | ) | |||||||||||||||||||||||||||||||
| Franchise | Cellular Retail | Direct to Consumer | Consumer Finance | Corporate | Total | |||||||||||||||||||||||||||||||||||||||
| Three Months Ended March 31, 2017 | ||||||||||||||||||||||||||||||||||||||||||||
| Revenues | $ | 3,943 | $ | 17,045 | $ | 11,904 | $ | 2,743 | $ | - | $ | 35,635 | ||||||||||||||||||||||||||||||||
| Revenue | $ | 17,045 | $ | 11,904 | $ | 2,743 | $ | — | $ | 31,692 | ||||||||||||||||||||||||||||||||||
| % of total revenue | 11.1 | % | 47.8 | % | 33.4 | % | 7.7 | % | - | % | 100.0 | % | 53.8 | % | 37.5 | % | 8.7 | % | — | % | 100.0 | % | ||||||||||||||||||||||
| Net income (loss) | $ | 635 | $ | 620 | $ | 866 | $ | 254 | $ | (108 | ) | $ | 2,267 | $ | 669 | $ | 866 | $ | 254 | $ | (180 | ) | $ | 1,609 | ||||||||||||||||||||
| Net income (loss) attributable to noncontrolling interests | $ | — | $ | — | $ | — | $ | — | $ | — | ||||||||||||||||||||||||||||||||||
| Net income (loss) attributable to WCR common shareholders | $ | 630 | $ | 620 | $ | 866 | $ | 254 | $ | (108 | ) | $ | 2,262 | $ | 669 | $ | 866 | $ | 254 | $ | (180 | ) | $ | 1,609 | ||||||||||||||||||||
| Three Months Ended March 31, 2016 | ||||||||||||||||||||||||||||||||||||||||||||
| Revenues | $ | 3,612 | $ | 9,775 | $ | 12,064 | $ | 2,984 | $ | - | $ | 28,435 | ||||||||||||||||||||||||||||||||
| % of total revenue | 12.7 | % | 34.4 | % | 42.4 | % | 10.5 | % | - | % | 100.0 | % | ||||||||||||||||||||||||||||||||
| Net income (loss) | $ | 523 | $ | 371 | $ | 904 | $ | 312 | $ | (135 | ) | $ | 1,975 | |||||||||||||||||||||||||||||||
| Net income (loss) attributable to WCR common shareholders | $ | 519 | $ | 371 | $ | 904 | $ | 312 | $ | (135 | ) | $ | 1,971 | |||||||||||||||||||||||||||||||
Franchise
The table below summarizes the number of AlphaGraphics business centers owned and operated by franchisees during the quarter ended March 31, 2017 and 2016:
| Beginning | New | Closed | Ending | |||||||||||||
| 2017 | ||||||||||||||||
| US Centers | 256 | - | (3 | ) | 253 | |||||||||||
| International Centers | 25 | - | - | 25 | ||||||||||||
| Total | 281 | - | (3 | ) | 278 | |||||||||||
| 2016 | ||||||||||||||||
| US Centers | 254 | 4 | (1 | ) | 257 | |||||||||||
| International Centers | 25 | - | - | 25 | ||||||||||||
| Total | 279 | 4 | (1 | ) | 282 | |||||||||||
Our U.S. franchisees reported approximate center sales for the quarter ended March 31, 2017 and 2016 as follows:
| 2017 | 2016 | |||||||
| Total gross U.S. network-wide center sales | $ | 69,084,000 | $ | 67,786,000 | ||||
Our revenues in the Franchise segment for the quarter ended March 31, 2017 and 2016 were $3.94 million versus $3.61 million, an increase of 9.1%. Segment net income period over period increased 23% to $0.64 million from $0.52 million in the prior year period.
Cellular Retail
A summary table of the number of Cricket cellular retail stores we operated during the quarter ended March 31, 20172018 and 20162017 follows:
| 2017 | 2016 | 2018 | 2017 | |||||||||||||
| Beginning | 198 | 99 | 278 | 198 | ||||||||||||
| Acquired/ Launched | 46 | 14 | 1 | 46 | ||||||||||||
| Closed | - | (2 | ) | |||||||||||||
| Closed/Transferred | (43 | ) | — | |||||||||||||
| Ending | 244 | 111 | 236 | 244 | ||||||||||||
The Cellular Retail segment revenues and contributionhas achieved substantial growth in location count since the beginning of 2017 as a result of our expansion initiative. While some newly launched locations are performing well, others have been slow to net income each increased period over period. Both increases are primarily attributableramp up. Due to the 53underperformance, as is evident in the number of locations closed or transferred to other Cricket dealers thus far in 2018, we have accelerated store count reductions that we had anticipated occurring at a later date. Because the growth initiative included leased properties with three to five year terms, there will be additional mature stores we operated under a store operating agreement beginning in November 2016. In additioncosts incurred to operating these additional mature locations, we also operated another 80 locations, mostterminate leases or sublet leased properties of which had been launched within the fourth quarter of 2016 and first quarter of 2017.closed locations.
Direct to Consumer
The Direct to Consumer segment has seasonal sources of revenue and historically experiences a greater proportion of annual revenue and net income in the months of March through May and December due to the seasonal products it sells. For the current quarter, the Direct to Consumer segment had net income of $0.87$0.33 million compared to net income of $0.90$0.87 million for the comparable prior year period. Revenues for the three month period ended March 31, 20172018 were $10.68 million compared to $11.90 million compared tofor the comparable period in 20162017. In 2018 we have experienced some delays in sales due to weather conditions and shipping zones not opening up as early as 2017. In the quarter ended March 31, 2018 we incurred approximately $222,000 of $12.06 million.nonrecurring expenses to relocate distribution for our Van Dyke’s Restorers brand. Distribution services previously provided by an outsourced 3PL will now be performed in-house from our South Carolina facility.
Consumer Finance
A summary table of the number of consumer finance locations we operated during the quarters ended March 31, 20172018 and 20162017 follows:
| 2017 | 2016 | 2018 | 2017 | |||||||||||||
| Beginning | 41 | 47 | 41 | 41 | ||||||||||||
| Acquired/ Launched | - | - | — | — | ||||||||||||
| Closed | - | - | — | — | ||||||||||||
| Ending | 41 | 47 | 41 | 41 | ||||||||||||
Our Consumer Finance segment revenues decreased $0.72 million, or 2.6%, for the quarter ended March 31, 20172018 compared to the quarter ended March 31, 2016. We closed two underperforming store locations and another 4 locations2017. Our net income for the same period increased 30.3% over the same period of the prior year largely due to state legislative changes between the comparable periods. Revenue decreased 8.1% period over period while netreduction of ongoing expenses and income decreased 18.6%.tax expense.
Corporate
Costs related to our Corporate segment were $0.11$0.27 million for the quarter ended March 31, 2018 compared to $0.18 million for the quarter ended March 31, 2017. The period over period increase is primarily due to interest expense. Because we have no outstanding balances on the parent level credit facility and no operating segment is receiving direct benefit from it, current period unused line fees and amortization of loan costs have been treated as a corporate expense.
Consolidated Income Tax Expense
Provision for income tax benefit for continuing operations for the quarter ended March 31, 2018 was ($0.08) million compared to income tax expense of $0.95 million for the quarter ended March 31, 2017 comparedfor an effective rate of 121.30% and 37.10%, respectively.
The significant difference in rate is the result of the 2018 net income attributable to $0.14 million fornoncontrolling interests not being subjected to income tax at the quarter ended March 31, 2016.corporate level. Rather the “passthrough” taxable income is taxed to the noncontrolling interests at an individual level.
Liquidity and Capital Resources
Summary cash flow data is as follows:
| Three Months Ended March 31, | Three Months Ended March 31, | |||||||||||||||
| 2017 | 2016 | 2018 | 2017 | |||||||||||||
| Cash flows provided (used) by: | ||||||||||||||||
| Operating activities | $ | 445,468 | $ | 173,150 | $ | (474,025 | ) | $ | 445,468 | |||||||
| Investing activities | (1,257,515 | ) | (899,047 | ) | (11,192,665 | ) | 1,889,978 | |||||||||
| Financing activities | (2,139,530 | ) | (815,702 | ) | (503,846 | ) | (5,287,023 | ) | ||||||||
| Net decrease in cash | (2,951,577 | ) | (1,541,599 | ) | (12,170,536 | ) | (2,951,577 | ) | ||||||||
| Cash, beginning of period | 14,159,975 | 7,847,669 | 21,295,819 | 14,159,975 | ||||||||||||
| Cash, end of period | $ | 11,208,398 | $ | 6,306,070 | $ | 9,125,283 | $ | 11,208,398 | ||||||||
At March 31, 2017,2018, we had cash and cash equivalents of $11.21$9.13 million and highly liquid investments of $46.4 million compared to cash and cash equivalents of $6.31$11.21 million on March 31, 2017. Both comparable periods include cash flows utilized for growth in our Cellular Retail segment. WeFor 2018, we believe that our available cash, combined with expected cash flows from operations and available financing under credit facilities of approximately $5.77 million,our held-to-maturity investments, will be sufficient to fund our scheduled debt repaymentsliquidity and capital expenditure requirements through March of 2019. We also have a $3,000,000 revolving credit facility and a $9,000,000 acquisition credit facility available to us. Our expected short-term uses of available cash include the funding of operating activities, payment of income tax liabilities related to our sale of the Franchise segment and the Cellular Retail segment anticipated capital expenditures through March 31, 2018.payment of dividends.
Off-Balance Sheet Arrangements
We had no off-balance sheet arrangements as of March 31, 2017.2018.
Item 4. Controls and Procedures
Evaluation of Disclosure Controls and Procedures
We maintain disclosure controls and procedures designed to provide reasonable assurance that information required to be disclosed in our reports filed pursuant to the Securities Exchange Act of 1934 is recorded, processed, summarized and reported within the time periods specified in the SEC’s rules and forms, and that such information is accumulated and communicated to our management, including our Chief Executive Officer and Chief Financial Officer, as appropriate, to allow timely decisions regarding required disclosure. A control system, no matter how well conceived and operated, can provide only reasonable, not absolute, assurance the objectives of the control system are met.
We utilize the Committee of Sponsoring Organization’sInternal Control – Integrated Framework, 2013 version,for the design, implementation and assessment of the effectiveness of our disclosure controls and procedures and internal control over financial reporting.
As of March 31, 2017,2018, our Chief Executive Officer and Chief Financial Officer carried out an assessment of the effectiveness of our disclosure controls and procedures as such term is defined in Rule 13a-15(e) under the Securities and Exchange Act of 1934.Based on this assessment, our Chief Executive Officer and Chief Financial Officer concluded our disclosure controls and procedures are effective as of March 31, 20172018.
Changes in Internal Control over Financial Reporting
There were no changes in our internal control over financial reporting during the quarter ended March 31, 20172018 that have materially affected, or are reasonably likely to materially affect, our internal control over financial reporting.
| Exhibit | Description | |
| Consent and Fourth Amendment Agreement, dated April 26, 2018, by and among the Company, certain subsidiaries named therein and Fifth Third Bank (incorporated by reference to Exhibit 10.1 to the registrant’s current report on Form 8-K filed on May 2, 2018). | ||
| 31.1 | Certification pursuant to Section 302 of the Sarbanes-Oxley Act of 2002 (filed herewith). | |
| 31.2 | Certification pursuant to Section 302 of the Sarbanes-Oxley Act of 2002 (filed herewith). | |
| 32 | ||
| 101.INS | XBRL Instance Document (filed herewith). | |
| 101.SCH | XBRL Schema Document (filed herewith). | |
| 101.CAL | XBRL Calculation Linkbase Document (filed herewith). | |
| 101.DEF | XBRL Definition Linkbase Document (filed herewith). | |
| 101.LAB | XBRL Label Linkbase Document (filed herewith). | |
| 101.PRE | XBRL Presentation Linkbase Document (filed herewith). |
Pursuant to the requirements of the Securities and Exchange Act of 1934, the registrant has duly caused this report to be signed on its behalf by the undersigned, thereunto duly authorized.
| Dated: May 15, | Western Capital Resources, Inc. | |
| (Registrant) | ||
| By: | /s/ John Quandahl | |
| John Quandahl | ||
| Chief Executive Officer and Chief Operating Officer | ||
| By: | /s/ | |
| Chief Financial Officer | ||