Private Placement
In April 2015, we commenced a private placement offering of Series B Units consisting of shares of Series B Preferred Stock and warrants to purchase common stock at an offering price of $16.00 per Series B Unit. During the period April 2015 through December 2016, we sold 266,887 shares of Series B Convertible Preferred Stock and Warrants to purchase 222,262 shares of common stock, for aggregate gross proceeds of $4,270,192.
The private Series B Unit offering was terminated on February 25, 2016. As a result of our IPO and pursuant to certain exchange rights granted to participants in the Series B Unit offering, holders of Series B Preferred Stock received the right to exchange each share of Series B Preferred Stock they owned into two shares of common stock. As of December 31, 2016, all holders of Series B Preferred Stock had exercised their Series B exchange rights, and as a result we issued 539,974 shares of restricted common stock in exchange for the 269,987 shares of Series B Preferred Stock that had been previously outstanding. All of the previously issued Series B Preferred Stock was cancelled. Although the stock was cancelled all of the 224,897 warrants issued in connection with the Series B Units remain outstanding at September 30, 2017. Such warrants have an exercise price of $16.00 per share and expire between April 21 and June 30, 2022. These warrants were classified as derivative liabilities until September 30, 2017; at which time they were reclassified to equity (additional paid in capital). The reclassification was made on September 30, 2017 after determining that the exchange rights as defined in the Michigan “Certificate of Amendment – Corporation”, filed on August 19, 2016 no longer required liability classification (see Note 2).
XG SCIENCES, INC.
NOTES TO UNAUDITED CONDENSED CONSOLIDATED FINANCIAL STATEMENTS
SEPTEMBER 30, 2017
NOTE 5 – DERIVATIVE LIABILITY WARRANTS
At inception, the Series A Convertible Preferred Stock warrants issued in conjunction with convertible notes issued in 2013 (subsequently converted into Series A Preferred Stock), equipment financing leases procured in 2013 and 2014, and certain other pre-emptive rights and the common stock warrants issued in connection with the 2015 Series B Unit offering were derivative liabilities which require re-measurement at fair value each reporting period.
As mentioned in Note 2, during the three months ended September 30, 2017, we chose to adopt ASU 2017-11 which changed the classification analysis of certain warrants with anti-dilution features. Since we chose to early adopt ASU 2017-11 in an interim period, the adjustments were reflected as of the beginning of the fiscal year as a cumulative-effect adjustment to the Company’s beginning accumulated deficit as of January 1, 2016. As a result of adopting ASU 2017-11, the Company no longer recognizes a liability related to 972,720 warrants, which were only classified as liabilities a result of having anti-dilution features.
As mentioned in Note 4, 224,897 warrants related to the Series B offering were reclassified from derivative liabilities on the balance sheet to equity at September 30, 2017 because the requirement to classify them as liabilities was removed when we amended the Series B Certificate of Designation in August of 2016.
The initial value of the stock warrants issued as consideration for the equipment financing leases in 2013 and 2014 was recorded as a reduction of the capital lease obligation and is being amortized as part of the effective interest cost on the capital lease obligation (see Note 8).
In 2014 when we entered into financing agreements with Samsung, AAOF and XGS II, we provided our shareholders with preemptive rights to purchase shares of Series A Convertible Preferred Stock for every two shares of Series A Convertible Preferred Stock or Common Stock owned by the shareholder. In addition, for every two shares of Series A Convertible Preferred Stock purchased by a shareholder, we issued such shareholder a warrant to purchase one additional share of Series A Convertible Preferred Stock with the same terms as the warrants issued to AAOF and XGS II.
Also, as part of our private placement of Series B Units in April 2015, shareholders and holders of our convertible notes were provided the right to purchase their pro rata share of any class of stock that the Company sells or issues. The sale of Series B Preferred Stock in the April 2015 offering triggered the preemptive rights resulting in the issuance of shares of Series B Preferred Stock and warrants. As of September 30, 2017, the total number of Stock Warrants issued due to the preemptive rights offerings was 58,689.
XG SCIENCES, INC.
NOTES TO UNAUDITED CONDENSED CONSOLIDATED FINANCIAL STATEMENTS
SEPTEMBER 30, 2017
The following table summarizes the fair value of the derivative liabilities as of September 30, 2017 and December 31, 2016:
| September 30, 2017 | December 31, 2016 | |||||||
| Warrants issued with Secured Convertible Notes | $ | — | $ | 6,554,160 | ||||
| Warrants issued with equipment financing leases | — | 655,418 | ||||||
| Warrants issued with preemptive rights | — | 443,790 | ||||||
| Warrants issued with April 2015 private placement of Series B Units | — | 246,881 | ||||||
| Adoption of accounting standard ASU 2017-11 | — | (7,650,442 | ) | |||||
| Total derivative liabilities | $ | — | $ | 249,807 | ||||
The Company estimated the fair value of their warrant derivative liabilities as of September 30, 2017 and December 31, 2016, using a lattice model and the following assumptions:
The value of the warrants is estimated using a binomial lattice model. Equivalent amounts reflect the net results of multiple modeling simulations that the lattice model applies to underlying assumptions. Because the Company is not publicly traded on a national exchange or to our knowledge, an over-the-counter market, the expected volatility of the Company’s stock was developed using historical volatility for a peer group for a period equal to the expected term of the warrants. The fair value of the warrants will be significantly influenced by the fair value of our common stock, stock price volatility, and the risk-free interest components of the lattice technique.
Changes in the fair value of Derivative Liabilities, carried at fair value, are reported as “Change in fair value of derivative liability — warrants” in the Statement of Operations. Comparative prior periods were prepared using the newly adopted ASU 2017-11 as follows:
| Three months ended September 30, | ||||||||
| 2017 | 2016 | |||||||
| Warrants issued with preemptive rights | $ | (506 | ) | $ | 26,423 | |||
| Warrants issued with April 2015 private placement of Series B Units | (42,648 | ) | 315 | |||||
| Total Derivative Gain (Loss) | $ | (43,154 | ) | $ | 26,738 | |||
| Nine months ended September 30, | ||||||||
| 2017 | 2016 | |||||||
| Warrants issued with preemptive rights | $ | (545 | ) | $ | 48,964 | |||
| Warrants issued with April 2015 private placement of Series B Units | (46,067 | ) | 577 | |||||
| Warrants issued with Bridge Financing | 1,258 | |||||||
| Total Derivative Gain (Loss) | $ | (46,612 | ) | $ | 50,799 | |||
13
XG SCIENCES, INC.
NOTES TO UNAUDITED CONDENSED CONSOLIDATED FINANCIAL STATEMENTS
SEPTEMBER 30, 2017
Subsequent to the Company’s early adoption of ASU 2017-11, which effected 972,720 warrants related to Series A Preferred stock, and the Company’s reclassification of 224,897 warrants related to Series B Preferred stock on September 30, 2017 (from derivative liabilities to equity) we are no longer required to record the change in fair values for these instruments.
NOTE 64 – STOCK WARRANTS ACCOUNTED FOR AS EQUITY INSTRUMENTS
The following table summarizes the common stock warrants (including the warrants previously accounted for as derivatives) outstanding at September 30, 2017,2019, which are accounted for as equity instruments, all of which are exercisable:
| Date Issued | Expiration Date | Indexed Stock | Exercise Price | Number of Warrants | ||||||||
| 10/08/2012 | 10/08/2027 | Common | $ | 12.00 | 5,000 | |||||||
| 01/15/2014 - 12/31/2014 | 01/15/2024 | Series A Convertible Preferred | $ | 12.00 | 972,720 | |||||||
| 04/30/2015- 05/26/2015 | 04/30/2022 | Common | $ | 16.00 | 218,334 | |||||||
| 06/30/2015 | 06/30/2022 | Common | $ | 16.00 | 6,563 | |||||||
| 12/31/2015 | 12/31/2020 | Common | $ | 8.00 | 20,625 | |||||||
| 03/31/2016 | 03/31/2021 | Common | $ | 10.00 | 10,600 | |||||||
| 04/30/2016 | 04/30/2021 | Common | $ | 10.00 | 895 | |||||||
| 12/14/2016 | 12/01/2023 | Common | $ | 8.00 | 50,000 | |||||||
| 07/18/2017 | 12/01/2023 | Common | $ | 8.00 | 25,000 | |||||||
| 09/22/2017 | 12/01/2023 | Common | $ | 8.00 | 25,000 | |||||||
| 12/04/2017 | 12/01/2023 | Common | $ | 8.00 | 25,000 | |||||||
| 07/08/2019 | 12/01/2023 | Common | $ | 8.00 | 50,000 | |||||||
| 1,409,737 | ||||||||||||
Each warrant indexed to Series A Convertible Preferred Stock is currently exercisable and exchangeable into 1.875 shares of common stock. On a common stock equivalent basis, the exercise price would equal $6.40/common share.
NOTE 5 – STOCKHOLDERS’ EQUITY (DEFICIT)
Common Stock
The Company is authorized to issue 25,000,000 shares of common stock, no par value per share of which 4,024,443 and 3,760,268 shares were issued and outstanding as of September 30, 2019 and December 31, 2018, respectively.
During the nine months ended September 30, 2019 the Company issued 251,675 shares of common stock pursuant to the Offering. During the nine months ended September 30, 2018 the Company issued 967,668 shares of common stock pursuant to the Offering. Upon completion of the Offering on April 12, 2019, the Company had sold 2,615,425 shares of common stock in the Offering at a price of $8.00 per share for gross proceeds of $20,923,400.
Potentially dilutive securities consist of shares potentially issuable pursuant to stock options and warrants as well as shares that would result from full conversion of all outstanding convertible securities. These potentially dilutive securities were 3,081,487 and 2,894,742 as of September 30, 2019 and 2018, respectively, and are excluded from diluted net loss per share calculations because they are anti-dilutive.
Series A Convertible Preferred Stock
The Company is authorized to issue up to 3,000,000 shares of Series A Convertible Preferred Stock (the “Series A Preferred”). Each share of the Series A Preferred, which has a liquidation preference of $12.00 per share, was originally convertible at any time, at the option of the holder, into one share of common stock at the lower of: (a) $12.00 per share, or (b) 80% of the price at which the Company sells any equity or equity-linked securities in the future. In December 2015, the conversion price of the Series A Preferred was reduced from $12.00 to $6.40 (80% of the $8.00 per share Offering price), and thus, each share of Series A Preferred Stock is now convertible into 1.875 shares of common stock.
The Series A Preferred also contains typical anti-dilution provisions that provide for adjustment of the conversion price to reflect stock splits, stock dividends, or similar events. The Series A Preferred is subject to mandatory conversion into common stock upon the listing of the Company’s common stock on the NASDAQ Stock Market or the New York Stock Exchange. However, the Series A Preferred is not subject to the mandatory conversion until all outstanding convertible securities are also converted into common stock. The Series A Preferred ranks senior to all other equity or equity equivalent securities of the Company other than those securities which are explicitly senior or pari passu in rights and liquidation preference to the Series A Preferred and pari passu with the Company’s Series B Preferred Stock.
The Company issued 1,456,126 shares of Series A Preferred in connection with the conversion of certain convertible notes on December 31, 2015. During the period from May 17, 2016 through December 31, 2018 the Company issued shares of Series A Preferred Stock to Aspen Advanced Opportunity Fund, LP (“AAOF”) as payment for lease financing obligations under the terms of a Master Leasing Agreement.
As of September 30, 2019, and December 31, 2018, the Company had 1,890,354 shares of Series A Preferred Stock issued and outstanding which is currently convertible into 3,544,414 shares of our common stock.
| Date Issued | Expiration Date | Exercise Price | Number of Warrants | |||||||
| 07/01/2009 | 07/01/2019 | $ | 8.00 | 6,000 | ||||||
| 10/08/2012 | 10/08/2027 | $ | 12.00 | 5,000 | ||||||
| 01/15/2014 - 12/31/2014 | 01/15/2024 | $ | 6.40 | 972,720 | ||||||
| 04/30/2015- 05/26/2015 | 04/30/2022 | $ | 16.00 | 218,334 | ||||||
| 06/30/2015 | 06/30/2022 | $ | 16.00 | 6,563 | ||||||
| 12/14/2016 | 12/01/2023 | $ | 8.00 | 50,000 | ||||||
| 07/18/2017 | 12/01/2023 | $ | 8.00 | 25,000 | ||||||
| 09/22/2017 | 12/01/2023 | $ | 8.00 | 25,000 | ||||||
| 1,308,617 | ||||||||||
| 12 |
XG SCIENCES, INC.
NOTES TO UNAUDITED CONDENSED CONSOLIDATED FINANCIAL STATEMENTS
NOTE 76 – EQUITY INCENTIVE PLAN
We previously established the 2007 Stock Option Plan (the “2007 Plan”), which was scheduled to expire on October 30, 2017 and under which we granted key employees and directorsmembers of our Board options to purchase shares of our common stock at not less than fair market value as of the grant date. On May 4, 2017, the Board approved the 2017 Equity Incentive Plan (the “2017 Plan”) to replace the 2007 Stock Option Plan, which became effective upon the approval of the stockholders holding a majority of the voting power in the Company on July 18, 2017. The 2017 Plan replaces the 2007 Plan and authorizes us to issue awards (stock options and restricted stock) with respect ofup to a maximum of 1,200,000 shares of our common stock, which equals the number of shares authorized under the 2007 Plan, as amended.Plan.
On July 24, 2017, certain stock options from the prior incentive stock option plan2007 Plan were cancelled and replacement stock options were awarded. The replacement stock option awards have an exercise price of $8.00 per share, a seven-year term, are vested 50% on date of grant with the remaining vesting over a 4 year4-year period from the date issued and are subject to certain other terms. Each option holder received options equal to 150% of the number of cancelled stock options. The cancellation and reissuance of the stock options were treated as a modification under ASC 718, Compensation-Stock Compensation. Incremental compensation cost of approximately$1,015,758 $1,015,758 was measured as the excess of the fair value of the modified award over the fair value of the original award immediately before the terms were modified. Compensation cost of approximately $501,071 was recorded on the date of cancellation for awards that were vested on the date of the modification. For unvested awards, compensation cost of approximately $514,687 will be recorded over the remaining requisite service period. The fair values of the replacement options granted were estimated on the dates of grant using the Black Scholes option-pricing model using the following assumptions: Stock price: $8.00, Exercise Price: $8.00, Expected Term: 3.51-4.78, Volatility: 34.78% - 36.87%, Risk free rate: 1.53% - 1.83%.
On August 10, 2017,September 30, 2019 and September 30, 2018, the Company granted stock options and restricted stock to each of its board members as part of their compensation package. Each of the 4 board members receivedBoard member 2,500 stock options and 2,500 shares of restricted stock for their boardBoard services. The options were granted at a price of $8.00 per share and had an aggregate grant date fair value of $26,120. The options vest ratably over a four-year period beginning on the one-year anniversary. The options had an aggregate grant date fair value of $38,295 and $29,580 on September 30, 2019 and September 30, 2018, respectively. The restricted stock issued on September 30, 2019 to the boardBoard members havehas an aggregate fair value of $80,000$100,000 and vest ratably in arrears over four quarters on the last day of each fiscal quarter following the grant date. For the three months ended September 30, 2019 and 2018, the amount of restricted stock compensation expense recorded was $25,000 and $20,000, respectively. For the nine months ended September 30, 2019 and 2018, the amount of restricted stock compensation expense recorded was $65,000 and $60,000, respectively.
All options granted thus far under the 2017 Plan have an exercise price of $8.00 per share and vesting of the options ranges from immediate to 25% per year, with most options vesting 25% per year beginning on the one-year anniversary of the grant date. The options expire seven years from the date of grant.
Stock-based compensation expense was $120,158 and $338,814 for the three and nine months ended September 30, 2019, respectively. Stock-based compensation expense was $86,749 and $260,980 for the three and nine months ended September 30, 2018, respectively. As of September 30, 2019, there was approximately $1,068,921 in unrecognized compensation cost related to the options granted under the 2017 2,500 sharesplan. We expect to recognize these costs over the remaining vesting terms, ranging from 3 to 4 years.
A summary of restrictedthe stock had vested resulting in compensation expenseoptions available as of $20,000.September 30, 2019 and 2018 is as follows:
| Weighted | ||||||||
| Number | Average | |||||||
| Of | Exercise | |||||||
| Options | Price | |||||||
| Options outstanding at June 30, 2019 | 825,375 | $ | 8.00 | |||||
| Changes during the period: | ||||||||
| Expired | (23,250 | ) | 8.00 | |||||
| New Options Granted – at market price | 12,500 | 8.00 | ||||||
| Options outstanding at September 30, 2019 | 814,625 | $ | 8.00 | |||||
| Options exercisable at September 30, 2019 | 498,393 | $ | 8.00 | |||||
| Weighted | ||||||||
| Number | Average | |||||||
| Of | Exercise | |||||||
| Options | Price | |||||||
| Options outstanding at June 30, 2018 | 665,875 | $ | 8.00 | |||||
| Changes during the period: | ||||||||
| Expired | — | 8.00 | ||||||
| New Options Granted – at market price | 12,000 | 8.00 | ||||||
| Options outstanding at September 30, 2018 | 677,875 | $ | 8.00 | |||||
| Options exercisable at September 30, 2018 | 388,400 | $ | 8.00 | |||||
| 13 |
XG SCIENCES, INC.
NOTES TO UNAUDITED CONDENSED CONSOLIDATED FINANCIAL STATEMENTS
SEPTEMBER 30, 2017
A summary of the stock option activity for the nine months ended September 30, 2017 is as follows:
| Weighted | ||||||||
| Number | Average | |||||||
| Of | Exercise | |||||||
| Options | Price | |||||||
| Options outstanding at beginning of year | 369,750 | $ | 11.89 | |||||
| Changes during the year: | ||||||||
| Expired | (12,000 | ) | 12.00 | |||||
| Cancellation of existing options | (357,750 | ) | 12.00 | |||||
| Issuance of replacement options | 536,625 | 8.00 | ||||||
| New Options Granted – at market price | 108,000 | 8.00 | ||||||
| Exercised | — | — | ||||||
| Options outstanding at end of Period | 644,625 | 8.00 | ||||||
| Options exercisable at end of Period | 322,158 | 8.00 | ||||||
The fair values of options granted are estimated on the dates of grant using the Black Scholes option-pricing model. Vesting of the options granted range from immediately to 25% per year, with most of the replacement options vesting 50% on date of grant with the remaining vesting over a 4 year period from the date issued. The options expire in seven years from date of grant.
NOTE 87 – CAPITAL LEASES
AsRight of September 30, 2017Use Asset and December 31, 2016, we have capital lease obligations as follows:
| September 30, 2017 | December 31, 2016 | |||||||
| Capital lease obligations | $ | 214,191 | $ | 449,368 | ||||
| Unamortized warrant discount | (23,252 | ) | (65,595 | ) | ||||
| Net obligations | 190,939 | 383,773 | ||||||
| Short-term portion of obligations | (159,628 | ) | (268,667 | ) | ||||
| Long-term portion of obligations | $ | 31,311 | $ | 115,106 | ||||
Our AAOF capital lease obligations are four-year leases starting on January 1, 2014 and January 1, 2015. Our other capital leases expire at various dates in 2018, have average effective interest rates of 0% and contain bargain purchase options that allow us to purchase the leased property for a minimal amount upon the expiration of the lease term.Leased Liability:
NOTE 9 —Customer, Supplier, country, and Product ConcentrationsEstimated Lease Life – Lease term through December 2022
| Three months ended September 30, 2019 | ||||
| Right-of-use lease assets- operating as of June 30, 2019 | $ | 1,767,269 | ||
| Less: Accumulated amortization | (43,410 | ) | ||
| Right-of-use lease assets- operating as of September 30, 2019 | $ | 1,723,859 | ||
| Lease liability-operating as of June 30, 2019 | $ | 1,873,352 | ||
| Less: Accumulated Amortization | (47,662 | ) | ||
| Lease liability operating-as of September 30, 2019 | $ | 1,825,690 | ||
| Operating lease expense for the three months ended September 30, 2019 | $ | 156,824 | ||
| Actual remaining lease payments | $ | 2,128,537 | ||
| Present value of remaining payments | $ | 1,825,690 |
Supplemental cash flow information related to leases:
| Leases | ||||
| Three months | ||||
| ended | ||||
| September 30, 2019 | ||||
| Cash paid for amounts included in the measurement of lease liabilities: | ||||
| Operating cash flows from operating leases | $ | 161,077 | ||
| The undiscounted annual future minimum lease payments summarized by year in the table below: | ||||
| Maturities of leases liabilities were as follows: | ||||
| Year ending December 31, 2019 (excluding the nine months ended September 30, 2019) | $ | 164,164 | ||
| Year ending December 31, 2020 | 660,387 | |||
| Year ending December 31, 2021 | 660,438 | |||
| Year ending December 31, 2022 | 643,548 | |||
| Total Lease payments | 2,128,537 | |||
| Less imputed interest | (302,847 | ) | ||
| Total | $ | 1,825,690 | ||
| Weighted average remaining lease term- operating leases (in months) | 37 | |||
| Weighted average discount rate- operating leases (annual) | 9.98 | % |
| Leases | ||||
| Nine months | ||||
| ended | ||||
| September 30, 2019 | ||||
| Cash paid for amounts included in the measurement of lease liabilities: | ||||
| Operating cash flows from operating leases | $ | 468,327 | ||
| The undiscounted annual future minimum lease payments summarized by year in the table below: | ||||
| Maturities of leases liabilities were as follows: | ||||
| Year ending December 31, 2019 (excluding the nine months ended September 30, 2019) | $ | 164,164 | ||
| Year ending December 31, 2020 | 660,387 | |||
| Year ending December 31, 2021 | 660,438 | |||
| Year ending December 31, 2022 | 643,548 | |||
| Total Lease payments | 2,128,537 | |||
| Less imputed interest | (302,847 | ) | ||
| Total | $ | 1,825,690 | ||
| Weighted average remaining lease term- operating leases (in months) | 37 | |||
| Weighted average discount rate- operating leases (annual) | 9.98 | % |
Grants and Licensing Revenue Concentration
| 14 |
For the three months ended September 30, 2017, one grantor accounted for 100% of the total grant revenue. During the nine months ended September 30, 2017, two grantors accounted for 25% and 75% of total grant revenue. During the three months ended September 30, 2016, two grantors accounted for 50% each of the total grant revenue, and for the nine months ended September 30, 2016, two grantors accounted for 12% and 88% of the total grant revenue in each period. There was no licensing revenue for the three months ended September 30, 2017. Licensing revenue for the nine months ended September 30, 2017, and for the three and nine months ended 2016, came from one licensor.
Product Concentration
Concentrations of product sales greater than 10% of total product sales are shown in the table below. We attempt to minimize the risk associated with product concentrations by continuing to develop new products to add to our portfolio of products offered.
| For the Three Months Ended September 30, | For the Nine Months Ended September 30, | |||||||||||||||
| 2017 | 2016 | 2017 | 2016 | |||||||||||||
| Grade C-300 HP | * | * | 14% | * | ||||||||||||
| Grade C-500 | 66% | * | 41% | * | ||||||||||||
| Grade R-10 | * | 16% | * | 12% | ||||||||||||
| Grade M-15 | * | 16% | * | 14% | ||||||||||||
* Denotes less than 10% of product sales.
XG SCIENCES, INC.
NOTES TO UNAUDITED CONDENSED CONSOLIDATED FINANCIAL STATEMENTS
SEPTEMBER 30, 2017
Customer Concentration
During the three months ended September 30, 2017 we had two customers whose purchases accounted for 19% and 65% of product sales. During the three months ended September 30, 2016 we had three customers who accounted for 10%, 12% and 21% of product sales.
For the nine months ended September 30, 2017 we had two customers whose purchases accounted for 17%, and 36% of product sales. During the nine months ended September 30, 2016 we had two customers whose purchases accounted for 11% each of product sales.
At September 30, 2017, there were two customers who had an accounts receivable balance greater than 10% of our total outstanding receivable balance. At September 30, 2016, there were two customers who had an accounts receivable balance greater than 10% of our total outstanding receivable balance.
Country Concentration
We sell our products on a worldwide basis. All of these sales are denominated in U.S. dollars.
International sales for the three months ended September 30, 2017 were 33% of product sales as compared with 54% for the three months ended September 30, 2016. One country, China, accounted for 19% of product sales for the three months ended September 30, 2017 and three countries, China, the United Kingdom and South Korea, accounted for 10%, 14%, and 20%, respectively, of product sales for the three months ended September 30, 2016.
International sales for the nine months ended September 30, 2017 were 34% of product sales as compared with 66% for the nine months ended September 30, 2016. One country, China, accounted for approximately 17% of product sales for the nine months ended September 30, 2017 and two countries, the United Kingdom and South Korea, accounted for 10% and 30%, respectively, of product sales for the nine months ended September 30, 2016.
Suppliers
We buy raw materials used in manufacturing from several sources. These materials are available from a large number of sources. Thus, we believe a change in suppliers would have no material effect on our operations. We did not have any purchases from one supplier that were more than 10% of total purchases for the three months and nine months ended September 30, 2017 and 2016.
NOTE 10 -8 – RELATED PARTY TRANSACTIONS
We have a licensing agreement for exclusive use of patents and pending patents with Michigan State University (“MSU”), a shareholder of the Company via the MSU Foundation. During the three months ended September 30, 20172019 and 20162018 we recorded licensing expense of $12,500 per quarter. During the nine months ended September 30, 20172019 and 20162018 we recorded licensing expense of $37,500 in each period.$37,500.
We have also entered into product licensing agreements with, POSCO, a shareholder. See below for POSCO. Other than MSU and POSCO, there were no other royalty expenses or revenue recognized duringDuring the three orand nine months ended September 30, 2017 and 2016.
The Company and POSCO, a shareholder of the Company, entered into a license agreement dated June 8, 2011, pursuant to which POSCO agreed to pay a minimum annual royalty of $100,000 per year if certain circumstances existed, among other things. The Company believed that this minimum annual royalty became due annually beginning on February 28, 2015, and up until June 30, 2017, recorded this royalty revenue at a rate of $25,000 per quarter. POSCO disputed its obligation to pay this minimum annual royalty, and2019 we did not pay the royalty inissue any prior year. We filed a demand for arbitration in the International Court of Arbitration on March 9, 2016, in an effort to resolve the dispute. Pursuant to a confidential settlement, on November 3, 2017, the Company and POSCO agreed to settle the dispute and to dismiss the arbitration. Based on terms of the settlement, no allowance is considered necessary. At September 30, 2017 we have a balance of $175,000 reflected in other current assets on the condensed consolidated balance sheet. This represents an accrual of licensing revenue of $100,000 for three and a half years less 50% to reflect an estimate of the portion of 2017, 2016, 2015, and 2014 licensing fees we believed to be not collectible. At December 31, 2016 the accrued licensing fees and allowance netted together was $150,000.
XG SCIENCES, INC.
NOTES TO UNAUDITED CONDENSED CONSOLIDATED FINANCIAL STATEMENTS
SEPTEMBER 30, 2017
On March 18, 2013, we entered into a series of agreements with two private investment funds: Aspen Advanced Opportunity Fund, LP (“AAOF”) and XGS II, LLC (“XGS II”), and pursuant to a Shareholders’ Agreement dated March 18, 2013 (as amended on February 26, 2016), a principal of each private fund serves as a member of our Board of Directors. These financing agreements were amended and restated on July 12, 2013 to provide for expanded financing commitments from AAOF and XGS II. Pursuant to these agreements, AAOF and XGS II agreed to provide $10 million of financing to the Company in the form of Secured Convertible Notes and AAOF agreed to provide an additional $1.0 million of lease financing arrangements. All of the principal and accrued interest on the Secured Convertible Notes issued to AAOF and XGS II were converted into Series A Preferred Stock in December 2016.
Duringstock. For the three months ended September 30, 2017 and 20162018, we issued 7,14010,663 shares per period of Series A Preferred Stockstock to AAOF, a special purpose investment fund whose general partners are members of our Board, as payment for lease financing obligations under the terms of the Master Lease Agreement, dated March 18, 2013. For the nine months ended September 30, 2017 and 20162018, we issued a total of 21,42024,943 shares per period as payment for lease obligations.
On August 10, 2017 restricted common stock in the amount of 2,500 shares, vesting at 25% or 625 shares on September 30, 2017, December 31, 2017, March 31, 2017, and June 30, 2017 was granted to each of four Board members: Steven C. Jones, Arnold Allemang, Dave Pendell, and Peifeng (Molly) Zhang. These awards were pursuant to the 2017 Equity Incentive Plan. In addition to the restricted stock, these Board members also received 2,500 stock options granted on August 10, 2017. These options vest equally over four years starting on the 1st anniversary of the date of grant. Both the restricted stock and the stock options have an exercise price of $8.00 per share. The options expire on the seventh anniversary of the date of grant.
| 15 |
NOTE 11 – OTHER SUBSEQUENT EVENTS
During the period from October 1 through November 13, 2017, we received common stock proceeds of $405,000 for the sale of 50,625 shares.
ItemITEM 2. Management’s Discussion and Analysis of Financial Condition and Results of Operations
Forward-Looking Statements
In this Quarterly Report on Form 10-Q, unless otherwise indicated, the words “we”, “us”, “our”, “XG”, “XGS”, “XG Sciences” or the “Company” refer to XG Sciences, Inc. and its wholly owned subsidiary, XG Sciences IP, LLC, a Michigan limited liability company.
Introduction
The following discussion and analysis should be read in conjunction with the unaudited condensed consolidated financial statements, and the notes thereto included herein. The information contained below includes statements of the Company’s or management’s beliefs, expectations, hopes, goals and plans that, if not historical, are forward-looking statements subject to certain risks and uncertainties that could cause actual results to differ materially from those anticipated in the forward-looking statements. For a discussion on forward-looking statements, see the information set forth in the introductory note to this quarterly report on Form 10-Q under the caption “Forward-Looking Statements”, which information is incorporated herein by reference.
Overview of our Business
XG Sciences was formed in May 2006 for the purpose of commercializing certain technology to produce graphene nanoplatelets and integrated, value-added products containing graphene nanoplatelets. First isolated and characterized in 2004, graphene is a single layer of carbon atoms configured in an atomic-scale honeycomb lattice. Among many noted properties, monolayer graphene is harder than diamonds, lighter than steel but significantly stronger, and conducts electricity better than copper. Graphene nanoplatelets are particles consisting of multiple layers of graphene. Graphene nanoplatelets have unique capabilities for energy storage, thermal conductivity, electrical conductivity, barrier properties, lubricity and the ability to impart physical property improvements when incorporated into plastics, metals or other matrices.
We believe the unique properties of graphene and graphene nanoplatelets will enable numerous new product applications and the market for such products will quickly grow to be a significant market opportunity. Our business model is to design, manufacture and sell advanced materials we call xGnP®graphene nanoplatelets and value-added products incorporating xGnP® nanoplatelets. We currently have hundreds of customers trialing our products for numerous applications, including, but not limited to lithium ion batteries, lead acid batteries, thermally conductive adhesives, composites, thermal transfer fluids, thermal management and heat transfer, inks and coatings, printed electronics, construction materials, cement, and militaryin a range of other industrial uses. We believe our proprietary processes have enabled us to be a low-cost producer of high quality,high-quality, graphene nanoplatelets and value-added integrated products containing graphene nanoplatelets and that we are well positioned to address a wide range of end-use applications.
Our Customers
We sell products to customers around the world and have sold materials to over 1,0001,300 customers in 47 countries since 2008. Some of these customers are research organizations and some are commercial organizations. Our customers have included well-known automotive and OEM suppliers around the world (Ford, Johnson Controls, Magna, Honda Engineering) world-scale, global-scale lithium ion battery manufacturers in the US,U.S., South Korea and China (Samsung SDI, LG Chemical, Lishen, A123) and diverse specialty material companies (3M, BASF, Henkel, Dow Chemical, DuPont), as well as leading research centers such as Lawrence Livermore National Laboratory and Oakridge National Laboratory. The majority of our customers are still ordering in smaller quantities consistent with their development and engineering qualification work.
We have also licensed some of our base manufacturing technology to other companies and we consider technology licensing a component of our business model.companies. Our licensees include POSCO, the fourthfifth largest steel manufacturer in the world by volume of2018 tonnage output, and Cabot Corporation (“Cabot”), a leading global specialty chemicals and performance materials company. These licensees further extend our technology through their customer networks. Ultimately, we believe we will benefit in terms of royalties on sales of xGnP® nanoplatelets produced and sold by our licensees. The below bar charts show the number of customers and total orders fulfilled by year based on actual purchases of our materials and orders for free samples or materials used in joint development programs.

| 16 |
Our Products
XG Sciences is a manufacturer of graphene nanoplatelets marketed under the brand xGnP® and value-added products that contain graphene nanoplatelets. The term “graphene” is used widely in the literature and the popular press to cover a variety of specific forms of the material. We generally think about two broad classes of graphene materials:
| 1. | One-atom thick films of carbon commonly referred to as monolayer graphene, manufactured typically from gases by assembling molecules to form relatively large, transparent sheets of material. These materials have been characterized by their performance attributes that differentiate them from other advanced materials and that may include: 200 times stronger than steel, flexible and able to stretch up to 25% of its original length, optically transparent, more electrically conductive than copper, more thermally conductive than any other known material and atomic-level barrier properties. XG Sciences does not manufacture these films and does not participate in the markets for these films and believes that in general, the markets for these films do not compete with those for graphene nanoplatelets. |
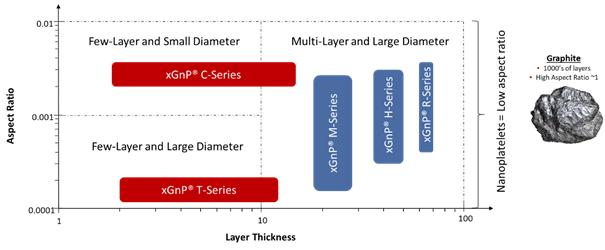
| 2. | Ultra-thin particles of carbon that consist of layers of graphene sheets ranging in thickness from a few layers to many layers – that are commonly referred to as graphene nanoplatelets (“GNP” or “GNPs”). Because GNPs are thin and can be manufactured in a range of diameters, they are useful for a wide variety of applications. XG Sciences manufactures GNPs that range in thickness from a few nanometers and up to 10-20 nanometers and with diameters ranging from less than 1 micron and up to 100 microns. The manufacture of these graphene particles is our main area of expertise, and their use in practical applications is the focus of our sales, marketing and development activities. |
| 17 |
The well-publicized isolation and characterization of graphene in 2004 at the University of Manchester, has spawned a new class of 2D materials based on layers of carbon atoms arranged in a hexagonal array and each carbon having lone pair electrons. The unique characterization and related performance of this new class of materials is derived from their two-dimensional nature and their composition of sp2carbon atoms arranged in a hexagonal array. The ability of any new material to be exploited in industrial applications will depend on its fit-for-performance. In the case of graphene nanoplatelets, the fit-for-performance is very much related to their aspect ratio (among other factors) in that the diameter is typically significantly greater than the thickness. This is what differentiates the material from bulk graphite of high crystallinity and purity. We classify nanoplatelets consisting of largely basel planes of carbon atoms packed in a hexagonal array (i.e., graphene) as graphene nanoplatelets so long as their aspect ratio may be classified as two-dimension and are thus in the form of platelets. Such a definition implies that the thickness is nanoscale – GNPs having a thickness in the range from generally 0.6 nanometers and up to many 10’s of nanometers. We have chosen to utilize the definitions as set out by the Carbon Journal editorial team (Carbon, volume 65, pp.1-6) and Fullerex (Bulk Graphene Pricing Report, 2019) which provides classification for the various material types which provide meaningful descriptions of commercially available graphene.
Graphene Product Thickness Definitions Based on Thickness
| Number of Layers | Product Description |
| 1 | Graphene (monolayer) |
| 1-3 | Very Few Layer Graphene (vFLG) |
| 2-5 | Few Layer Graphene (FLG) |
| 2-10 | Multilayer Graphene (MLG) |
| >10 | Graphene Nanoplatelets (GNP) |
Bulk MaterialsMaterials.. We target oursell bulk materials under the trademarked brand name of xGnP® nanoplatelets for usegraphene nanoplatelets. These materials are produced in a wide range of largevarious grades, which are analogous to average particle thickness, and growing end-use markets. Our proprietary manufacturing processes allow us to produce nanoplatelets with varying performance characteristics that can be tuned to specific end-use applications based on customer requirements. We currently offer fouraverage particle diameters. There are three commercial “grades” of bulk graphene nanoplatelet materials,grades (Grades H, M & R), each of which is offered in three standard particle sizes and a fourth, C Grade, which is offered in three standard surface areas. We also have access to other development grades (Grade T, for example), but which are not yet made available commercially and have been used internally for those products containing graphene nanoplatelets. These bulk materials, which normally ship in the form of a dry powder, are especially applicable for use as additives in polymeric or metallic composites, or in coatings or other formulations where particular electrical, thermal or barrier applications are desired by our customers. We also offer our material in the form of dispersions of nanoplatelets in liquids such as water, alcohol, or organic solvents, or mixed into resins or polymers such as thermoplastics or thermosets. We use two different commercial processes to produce these bulk materials:
Grade H/M/R/T materials are produced through chemical intercalation of natural graphite followed by thermal exfoliation using a proprietary process developed by us. The “grade” designates the thickness and surface characteristics of the material, and each grade is available in various average particle sizes,diameters. Surface area, calculated by the Brunauer, Emmet, and Teller (BET) Method, is used as a convenient proxy for thickness, so each grade of products produced through chemical intercalation is designated by its average surface area, which allows for surface areas rangingranges from 50 to 800 square meters per 150 m2/gram of material depending onmaterial. We are able to extend the product. Othersurface area higher (250 m2/gram for T Grade) but are not yet producing these materials in metric-ton quantities. As the market need emerges for this class of materials, we will scale them as needed. For example, we introduced a new Grade of xGnP® powders, R-Grade, with improved electrical conductivity targeting use in applications for electrically and thermally conductive ink and composites and have scaled R-Grade to metric-ton quantities.
Grade C materials are produced through a high-shear mechanical exfoliation using a proprietary process and equipment that we invented, designed, constructed and patented. The Grade C materials are smaller particles than those grades produced through chemical exfoliation, and Grade C materials are designated by their BET surface area, which ranges from 300 to 800 m2/gram. We are able to produce other surface areas and may be mademake those available depending on the needs for specific applications. In addition, we sellcommercially as needed by our customers.
The following graphic depicts xGnP® graphene nanoplatelets in the form of pre-dispersed mixtures with water, alcohol, or other organic solvents and resins. In addition to selling bulk nanoplatelets, we also offer the following integrated, value-added products that contain our graphene nanoplatelets in various forms.
Energy Storage Materials. These consist of specialty advanced materials that have been formulated for specific applications in the energy storage segment. Chief among these is our proprietary, specially formulated silicon-graphene composite material (also referred to as “SiG” or “XG SiG®”) for use in lithium-ion battery anodes. XG SiG® targets the never-ending need for higher battery capacity and longer life. In several customer trials, our SiG material has demonstrated the potential to increase battery energy storage capacity by 3-5x what is currently available with conventional lithium ion batteries today. Additionally, we offer various bulk materials for use as conductive additives for cathodes and anodes in lithium-ion batteries, as an additive to anode slurries for lead-carbon batteries, as a componentfunction of both layer thickness and aspect ratio (thickness by diameter), two key parameters which will influence their performance in coatings for current collectors in lithium-ion batteriesa range of industrial applications.
| 18 |
XG Sciences’ Graphene Nanoplatelet Product Portfolio and we are investigating the use of our materials as part of other battery components.Versus Graphite
Composites.These consist of an aqueous-based compositioncompositions of specially designed xGnP®xGnP® graphene nanoplatelets formulated toin pre-dispersed mixtures that can be easily dispersedincorporated in concretevarious polymers. Our integrated composites portfolio includes pre-compounded resins derived from a range of thermoplastics as well as master batches of resins and targeted specificallyxGnP® nanoplatelets and their combination with resins and fibers for consumeruse in various end-use applications that may include industrial, automotive and industrial applications. Usesporting goods and which have demonstrated efficacy in standard injection molding, compression molding, blow molding and 3-D processes, to name but a few. Our current product portfolio of polymer resins containing various forms of our GNPxGnP® Concrete Additivegraphene nanoplatelets and in varying concentration includes polyurethane (XGPU), polypropylene (XGPP), polyethylene terephthalate (XGPET), vinyl ester (XGVE), polyetherimide (XGPEI) and high-density polyethylene (XGHDPE). Other polymers may be added over time depending on the end-market and customer needs. In addition, we offer various bulk materials with demonstrated efficacy in plastic composites to impart improved physical performance to such matrices, which may be supplied as dry powders or as aqueous or solvent-based dispersions or cakes as described above. We have also targeted use of our graphene nanoplatelets as an additive in cement mixtures, which we believe results in improved barrier resistance, durability, toughness and corrosion protection. The graphene nanoplatelets promoteOur GNP®Concrete Additive promotes the formation of more uniform and smaller grain structure in the cement. This fine-grain and uniform structure gives the concrete improvements in flexural and compressive strength. In addition, the embedded graphene nanoplatelets will stop cracks from forming and retard crack propagation, should any cracks form – the combination of which will improve lifetime and durability. We intend to further extend our integrated composites portfolio to include pre-compounded resins derived from a rangedurability of thermoplastics as well as mother batches of resins and xGnP® nanoplatelets and their combination with resins and fibers for use various end-use applications. In addition, we offer various bulk materials with demonstrated efficacy in plastic composites to impart improved physical performance to such matrices, which may be supplied as dry powders or as aqueous or solvent-based dispersions or cakes.
Thermal Management Materials. These consist mainly of two types of products, our XG Leaf® sheet products and various thermal interface materials (“TIM”) in the form of custom greases or pastes. XG Leaf® is a family of sheet products ideally suited for use in thermal management in portable electronics, which may include cell phones, tablets and notebook PC’s. As these devices continue to adopt faster electronics, higher data management capabilities, brighter displays with ever increasing definition, they generate more and more heat. Managing that heat is a key requirement for the portable electronics market and our XG Leaf® product line is well suited to address the need. These sheets are made using special formulations of xGnP® graphene nanoplatelets as precursors, along with other materials for specific applications. There are several different types of XG Leaf® available in various thicknesses, depending on the end-use requirements for thermal conductivity, electrical conductivity, or resistive heating. Our custom XG TIM™ greases and pastes are also designed to be used in various high temperature environments. Additionally, we offer various bulk materials for use as active components in liquids, coatings and plastic composites to impart improved thermal management performance to such matrices.
19
cement.
Inks and Coatings. These consist of specially-formulated dispersions of xGnP®together with solvents, binders, and other additives to make electrically or thermally conductive products designed for printing or coating and which are showing promise in diverse customer applications such as advanced packaging, electrostatic dissipation and thermal management. We also offer a set of standardized ink formulations suitable for printing. These inks offer the capability to print electrical circuits or antennas or mightand may be suitable for other electrical or thermal applications. All of these formulations can be customized for specific customer requirements.
Energy Storage Materials. These consist of specialty advanced materials that have been formulated for specific applications in the energy storage segment. We offer various bulk materials for use as conductive additives for cathodes and anodes in lithium-ion batteries, as an additive to anode slurries for lead-carbon batteries, as a component in coatings for current collectors in lithium-ion batteries and we are investigating the use of our materials as part of other battery components.
Thermal Management Materials. These consist mainly of various thermal interface materials (“TIM”) in the form of custom greases or pastes. Our custom XG TIM®greases and pastes are also designed to be used in various high temperature environments. Additionally, we offer various bulk materials for use as active components in adhesives, liquids, coatings and plastic composites to impart improved thermal management performance to such matrices.
Our Focus Areas
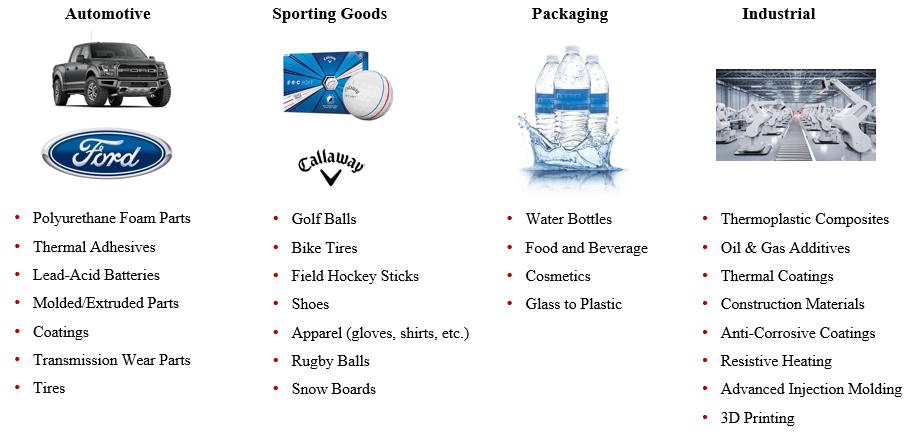
We believe we are a “platform play” in advanced materials, because our proprietary processes allow us to produce varying grades of graphene nanoplatelets that can be mapped to a variety of applications and in many market segments. However, we are prioritizing our efforts in specific areas and with specific customers that we believe represent opportunities for either relatively near-term revenue or especially large and attractive markets. At this time, we are focused on three high priority areas: Energy Storage, Thermal Managementfour key vertical markets: Automotive, Sporting Goods, Packaging and Composites.Industrial. The following table showsgraphic provides examples of target applications within each of the types of applications we are pursuing, the expecting timing of revenue and the addressable market size of selected market opportunities.four key verticals where XG Sciences has either commercial sales or is in development with one or more customers.
| 19 |
XGS Market/Application Focus Areas & 2018 Market Size

Addressable Markets
20The markets for our materials arelarge and growing. As one example, the 2019 North American packaging market for plastic bottles and containers is estimated to be more than $34 billion (Mordor Intelligence).Further,Mordor estimates the 2019 global market for PET water bottles at 543.8 billion units. XG Sciences is engaged in the commercial supply ofxGnP®graphene nanoplatelets for use in water bottles manufactured initially in North America and we are expanding our market activities into other geographies. If each water bottle produced in 2019 were to incorporate just 1 milligram of xGnP® graphene nanoplatelets, the total revenue available to XG Sciences may range from $200 to $300 million, depending on product form.
Commercialization Process
Because graphene is a new material, most of our customers are still developing applications that use our products. Commercialization is a process, the exact timing of which is often difficult to predict. It starts with our own internal R&D to validate performance for an identified market or customer-specific need. Our customers then validate the performance of our materials and determine whether our products can be incorporated into their manufacturing processes. This is initially done at pilot projectproduction scale levels. Our customers then have to introduce products that incorporate our materials to their own customers to validate performance. After their customers have validated performance, our customers will then move to commercial scale production. Every customer goes through the same process, but will do so at varying speeds, depending on the customer, the product application and the end-use market. Thus, we are not always able to predict when our customers will begin ordering commercial volumes of our materials or predict their expected volumes over time. However, as customers move through the process, we generally receive feedback and gain greater insights regarding their commercialization plans. TheAccording to our respective customers, the following are examples of where our products are providing value to our customers at levels that are either in commercial production or we believe will warrant their use on a commercial basis (see also Exhibit 99.1 to Post-Effective Amendment No. 5 to the Existing Registration Statement for our Summary Customer Pipeline validating the value of our products in various end-use markets and applications):basis.
| The Ford Motor Company, after having demonstrated a 17 percent reduction in noise, a 20 percent improvement in mechanical properties and a 30 percent improvement in heat endurance properties compared with that of polyurethane foam used without graphene, began incorporating our graphene nanoplatelets for polyurethane based foam parts in over ten under hood components on the Ford F-150 and Mustang in 2018; |
| · | Light emitting diode module and product company demonstrated approximately 50% improvement in thermal management capability when compared to existing commercial thermal management products, translating into a 15% improvement in thermal management at the device |
| Plastics composite part manufacturer |
| Plastic composite parts manufacturer |
| 20 |
The process of “designing-in” new materials is relatively complex and involves the use of relatively small amounts of the new material in laboratory and engineering development for an extended period of time. Following successful development, customers that incorporate our materials into their products will then order much larger quantities of material to support commercial production. Although, our customers are under no obligation to report to us on the usage of our materials, some have indicated that they have introduced or will soon introduce commercial products that use our materials. Thus, while many of our customers are currently purchasing our materials in kilogram (one or two pound) quantities, some are now ordering at multiple ton quantities and we believe many will require tens of tons or even hundreds of tons of material whenas they commercialize products that incorporate our materials. We also believe that those customers already in production will increase their order volume as demand increases and others will begin to move into commercial volume production as they gain more experience in working with our materials and engage new customers. For example, we shipped a 1 metric ton order in the fourth quarter of 2016 to a customer who is currently moving into larger scale production and had previously used smaller quantities. In the first quarter of 2017 we shipped 1.6 metric tons of dry powder for various end-use customers and another 1.8 metric tons in the second quarter. In the third quarter of 2017 we shipped over 5.7 tons and based on known customer demand we forecast shipping more than 15 metric tons of product in the fourth quarter of 2017. This demand profile is further evidence that we are transitioning into higher-volume production, and we expect further, sizable increases in demand in 2018.
We also believe average order size is an indicator of commercial traction. The majority of our customers are still ordering in smaller quantities consistent with their development and engineering qualification work. The average order sizes, by quarter from the first quarter of 2015 through third quarter of 2017 are given below. These data represent orders shipped in the respective quarter and exclude no charge orders targeted mainly for R&D purposes. The data show that the average order size has increased steadily over the last two years, and we believe that it will continue to increase in the fourth quarter of 2017 and in 2018 as more customers commercialize products using our materials.

2017 and 2018 RevenueCommercialization Trends
We are tracking the commercial and development status of more than 10075 different customer applications using our materials with some customers pursuing multiple applications. As of September 30, 2017,2019, we had fifteentwenty (20) specific customer applications where our materials are incorporated into our customers’ products and such customers are actively promoting or selling these products to their own customers. In addition, we have another thirteennineteen (19) customer applications where our customers have indicated that they expect to begin shipping product incorporating our materials in the next 3 – 6 months and we have another twelvetwenty-five (25) customer applications where our customers have indicated an intent to commercialize in the next 6 – 9 months. We are also haveworking with numerous additional customers with whom we are working that have not yet indicated an exact date for commercialization, but we believe have the potential to contribute to meaningful revenue in 2018.2020. The following graphic demonstrates the trendcommercialization trends over the past 68 fiscal quarters as an increasing number of customers indicate their intent to commercialize applications and move into actively selling or promoting products for future sales.
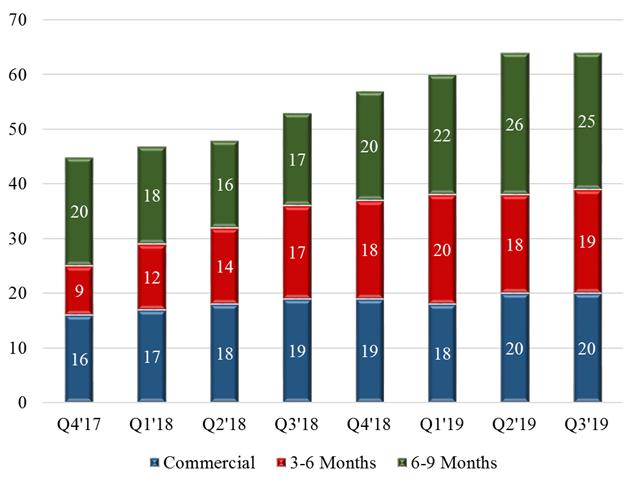
(a) Customer applications where our materials are used in customer products and they are actively selling them to their customers.
(b) Customer applications where our customers are indicating that they expect to begin shipping products incorporating our materials in the next 3-6 months.
(c) Customer applications where our customers are indicating an intent to commercialize in the next 6-9 months.
Manufacturing Capacity
We anticipate thatcompleted the average order size for these customersfirst phase of expansion in our newest 64,000 square-foot facility in the first half of 2018. The expansion has added 90 metric tons of graphene nanoplatelet production capacity, bringing the total capacity of the facility up to approximately 180 metric tons of dry powder. Phase two of the expansion was partially complete by year-end 2018 and resulted in up to ~270 metric tons of total graphene nanoplatelet output capacity at the facility. We expect to complete the last portion of this phase two expansion in the second half of 2019, resulting in up to ~400 metric tons of total graphene nanoplatelet output capacity. Our total graphene nanoplatelet output capacity across both of our manufacturing facilities, as of September 30, 2019, exceeded 300 metric tons per year and will increase to an approximate 450 metric tons by year-end. The expansions support our mission to continue commercializing the use of graphene in customer products across diverse industries. XG’s increasing capacity will support our expected growth in demand for our products over the fourth quarternext several fiscal quarters. However, additional manufacturing capabilities for certain value-added products and certain bulk materials remain to be developed and may require the acquisition of 2017additional facilities. In particular, the production processes for certain integrated products will require additional capital and throughout 2018 as their demand grows. As a result,may require additional facilities to meet expected future customer demand.
Some of the Company’s products are new products that have not yet been fully developed and for which manufacturing operations have not yet been fully scaled. Although we believe we will begin shipping significantly greater quantities ofcontinue to scale our products, and thus begin scaling revenueproduction capability in 2019, we have not yet demonstrated the capability to produce sufficient materials to generate the ongoing revenues necessary to sustain our operations in the last quarter of 2017 and in 2018. Based on the status of current discussions with customers and their feedback on the performance of our materials in their products, we believe we will be able to recognize approximately $15 – $30 million of revenue in 2018, although this cannot be assured.
long-term.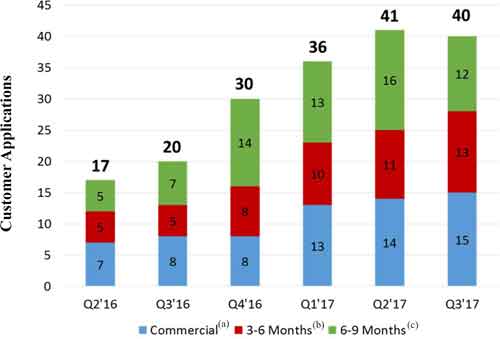
| 21 |
Addressable Markets
The markets that we serve are large and rapidly growing. For example, as shown in the figure below, Avicenne Energy (“The Rechargeable Battery Market, 2014 – 2025”, July 2015) estimates that the market for materials used in lithium ion battery anodes is currently approximately $1 billion, but is expected to approximately double over the next ten years. We believe our ability to address next generation anode materials represents a significant opportunity for us.
According to Prismark Partners, LLC, a leading electronics industry consulting firm specializing in advanced materials, the 2014 market for finished graphitic heat spreaders as sold to the OEM and EMS companies with adhesive, PET, and/or copper backing for selected portable applications was $600 million, and is expected to reach $900 million in 2018. The market is currently in a significant expansion period driven by the demand for portable devices. In a press release dated June 30, 2016, Gartner, Inc., a leading research organization, estimated the 2016 global smartphone market at 1.9 billion units and worldwide combined shipments of devices (PC’s, tablets, ultraphones and mobile devices were expected to reach 2.4 billion units in 2016). Every cell phone has some form of thermal management system, and we believe many of the new smart phones and other portable devices being developed can benefit from the thermal management properties of our XG Leaf® product line. In August 2016, International Data Corporation (IDC) in their Worldwide Quarterly Tablet Tracker, estimated the global shipment of tablets in 2016 at 183.4 million units. Thus, we believe our XG Leaf® product line is well positioned to address a very large and rapidly growing market.
Our Intellectual Property
Some of our proprietary manufacturing processes were developed at Michigan State University (MSU) and licensed to us in 2006. We license three U.S. patents and patent applications from MSU. However, overOn August 8, 2016, we signed an agreement acquiring an exclusive license with Meta Co. (Meta) to Metna’s background IP for use of graphene nanoplatelets as additives to concrete mixtures. For purposes of the agreement, Metna’s background IP relates to the U.S. Patent 8,951,343. Also, on August 8, 2016, we entered into a second agreement for an exclusive license related to all Metna’s background technology and foreground technology, including any jointly-owned foreground technology where the end use is known to be any graphite additive dispersed in concrete mixtures. On April 25, 2019 we signed an Intellectual Property License, Joint Development and Commercialization Agreement with Niagara Bottling acquiring exclusive license to certain of Niagara’s patents and applications relating to the use of graphene nanoplatelets in packaging applications. For purposes of the agreement, Niagara’s IP relates to five (5) U.S. patents and patent applications and two (2) international applications. Over time, our scientists and engineers have made many further discoveries and inventions that are embodied in the form of (as(and as of September 30, 2017)2019): eightseventeen (17) additional U.S. patents, 11twenty-one (21) foreign patents, 17twelve (12) additional U.S. patent applications and numerous trade secrets. For each patent application filed in the U.S., we make a determination on the nature and value of the patent. For many of the applications filed in the U.S., additional filings are made in other countries such as the European Union, Japan, South Korea, China, Taiwan or other applicable countries. As of September 30, 2017,2019, we maintained 36fifteen (15) international patent applications. These filings and analyses are made on a case-by-case basis. Typically, patents that are defensive in nature are not filed abroad, while those that are protective of active XGS products or applications are filed in relevant countries abroad. Our general IP strategy is to keep as trade secrets those manufacturing processes that are difficult to enforce should they be disclosed and to seek patent coverage for other manufacturing processes, materials derived from those processes, unique combinations of materials and end uses of materials containing graphene nanoplatelets. We believe that the combination of our rights under the MSU license,various licenses, our patents and patent applications, and our trade secrets create a strong intellectual property position.
Operating Segment
We have one reportable operating segment that manufactures xGnP® graphene nanoplatelets and value-added products produced therefrom, conducts research on graphene nanoplatelets and related products, and licenses our technology as appropriate. As of September 30, 2017,2019, we shipped products on a worldwide basis, buthowever all of our assets were located within the United States.
Results of Operations for the Three and Nine Months Ended September 30, 20172019 Compared with the Three and Nine Months Ended September 30, 20162018
| Summary Income Statement | For the Three Months Ended September 30, | For the Nine Months Ended September 30, | For the Three Months Ended September 30, | For the Nine Months Ended September 30, | ||||||||||||||||||||||||||||||||||||||||||||
| 2017 | 2016 | Change | 2017 | 2016 | Change | 2019 | 2018 | Change | 2019 | 2018 | Change | |||||||||||||||||||||||||||||||||||||
| Total Revenue | $ | 472,261 | $ | 163,967 | $ | 308,294 | $ | 1,038,529 | $ | 514,110 | $ | 524,419 | ||||||||||||||||||||||||||||||||||||
| Total Revenues | $ | 123,247 | $ | 1,126,385 | $ | (1,003,138 | ) | $ | 1,227,594 | $ | 2,863,575 | (1,635,981 | ) | |||||||||||||||||||||||||||||||||||
| Cost of Goods Sold | 716,261 | 367,395 | 348,866 | 1,712,875 | 1,172,397 | 540,478 | 935,393 | 1,253,116 | (317,723 | ) | 2,906,171 | 3,573,838 | (667,667 | ) | ||||||||||||||||||||||||||||||||||
| Gross Loss | (244,000 | ) | (203,428 | ) | (40,572 | ) | (674,346 | ) | (658,287 | ) | (16,059 | ) | (812,146 | ) | (126,731 | ) | (685,415 | ) | (1,678,577 | ) | (710,263 | ) | (968,314 | ) | ||||||||||||||||||||||||
| Research & Development Expense | 215,949 | 231,312 | (15,363 | ) | 706,575 | 866,668 | (160,093 | ) | 381,511 | 435,956 | (54,445 | ) | 1,151,524 | 1,000,101 | 151,423 | |||||||||||||||||||||||||||||||||
| Sales, General & Administrative Expense | 1,466,505 | 896,650 | 569,855 | 3,386,857 | 2,618,252 | 768,605 | 1,266,037 | 1,297,179 | (31,142 | ) | 4,173,338 | 3,631,652 | 541,686 | |||||||||||||||||||||||||||||||||||
| Total Operating Expense | 1,682,454 | 1,127,962 | 554,492 | 4,093,432 | 3,484,920 | 608,512 | 1,647,548 | 1,733,135 | (85,587 | ) | 5,324,862 | 4,631,753 | 693,109 | |||||||||||||||||||||||||||||||||||
| Operating Loss | (1,926,454 | ) | (1,331,390 | ) | (595,064 | ) | (4,767,778 | ) | (4,143,207 | ) | (624,571 | ) | (2,459,694 | ) | (1,859,866 | ) | (599,828 | ) | (7,003,439 | ) | (5,342,016 | ) | (1,661,423 | ) | ||||||||||||||||||||||||
| Other Income (Expense) | (105,968 | ) | (23,687 | ) | (82,281 | ) | (296,983 | ) | (136,398 | ) | (160,585 | ) | ||||||||||||||||||||||||||||||||||||
| Other Expense | (110,999 | ) | (81,926 | ) | (29,073 | ) | (265,941 | ) | (247,647 | ) | (18,294 | ) | ||||||||||||||||||||||||||||||||||||
| Net Loss | $ | (2,032,422 | ) | $ | (1,355,077 | ) | $ | (677,345 | ) | $ | (5,064,761 | ) | $ | (4,279,605 | ) | $ | (785,156 | ) | $ | (2,570,693 | ) | $ | (1,941,792 | ) | $ | (628,901 | ) | $ | (7,269,380 | ) | $ | (5,589,663 | ) | $ | (1,679,717 | ) | ||||||||||||
| 22 |
Revenue
RevenueThe decrease in Product sales for the three and nine months ended September 30, 20172019 versus the same period last year, is primarily the result of a large customer pre-buying their inventory needs in the fourth quarter of 2018 and, 2016, by category,partially, in the first quarter of 2019. This customer, although delaying reorders, continues to use our product in their manufacturing processes. We have a very strong customer pipeline and continue to establish a robust baseline of customers who are shown below.nearing commercial status. We believe that once these customers reach commercial status with products that incorporate our products, each will begin to order from us on a regular basis, which will help to mitigate the quarter to quarter revenue variability.
| Summary of Revenue | For the Three Months Ended September 30, | For the Nine Months Ended September 30, | ||||||||||||||||||||||
| 2017 | 2016 | Change | 2017 | 2016 | Change | |||||||||||||||||||
| Product Sales | $ | 446,795 | $ | 88,856 | $ | 357,939 | $ | 863,574 | $ | 230,635 | $ | 632,939 | ||||||||||||
| Grants | 25,466 | 50,111 | (24,645 | ) | 124,955 | 208,475 | (83,520 | ) | ||||||||||||||||
| Licensing | — | 25,000 | (25,000 | ) | 50,000 | 75,000 | (25,000 | ) | ||||||||||||||||
| Total Revenue | $ | 472,261 | $ | 163,967 | $ | 308,294 | $ | 1,038,529 | $ | 514,110 | $ | 524,419 | ||||||||||||
Product sales consist of two broad categories: (1) material sold to customers for research or development purposes; and (2) production orders for customers. Typically, the order sizes for the first category are relatively small, however we expect orders in the second category to be much larger in the future. For the three months ended September 30, 2017,2019, product sales increaseddecreased by $357,939,$1,003,138, or 403%89% from the comparable period in the prior year. Foryear and for the nine months ended September 30, 2017,2019, product sales increaseddecreased by $632,939,$1,635,981, or 274%57% from the comparable period in the prior year. The main reasondecrease in revenue for the increasethree months ended September 30, 2019 is due to our largest customer suspending orders during the period. The customer has not stopped using our products, but rather, is working down material pre-ordered in product sales wasthe latter half of 2018 and currently held in inventory and being used to produce their products. This customer continues to ship their products incorporating our material and we expect they will work down existing inventory over the next few quarters and will then resume purchasing our products at historical levels. In addition, other customers are moving through development programs towards commercialization, requiring larger quantities of our materials for advanced testing, pilot production and commercial-scale production activities. We believe that those customers already in production will increase their order volume as demand increases and other customersothers will begin to move into commercial volume production as they gain more experience in working with our materials and engage their own customers. As a result of this movement, we shipped 1.6 metric tons of bulk powders in the first quarter of 2017 and 1.8 metric tons of bulk powders in the second quarter of 2017. In the third quarter of 2017 we shipped over 5.7 metric tons and based on known customer demand we forecast shipping more than 15 metric tons of product in the fourth quarter of 2017.
We ship our products from our Lansing, MI manufacturing facilities to customers around the world. During the threenine months ended September 30, 2017,2019, we shipped materialsto customers in 1625 countries, as compared to 1623 countries during the same three-month period in 2016.2018. For the threenine months ended September 30, 2017, shipments2019, sales to onlytwo countries, South Korea and Switzerland, accounted for more than 10% of revenue. For the nine months ended, September 30, 2018, no product sales to any one country accounted for more than 10% of product sales, China.sales. During the three months ended September 30, 2019, we shipped materials to customers in 15 countries, as compared to 15 countries during the same period in 2018. For the three months ended September 30, 2016, shipments2019, sales to one foreign country, Switzerland, accounted for more than 10% of revenue. For the three countries, South Korea, China and the United Kingdommonths ended, September 30, 2018, no product sales to any one country accounted for more than 10% of product sales.
During the first nine months ended September 30, 2017, we shipped materials to customers in 29 different countries, versus 24 countries the same nine-month period in 2016. For the nine months ended September 30, 2017, shipments to only once country, China, accounted for more than 10% of product sales. For the first nine months ended September 30, 2016, two countries, South Korea and the United Kingdom, accounted for more than 10% of product sales.
Order Summary
The table below shows a comparison of domestic and international orders fulfilled (note that this does not include(excluding orders for free samples). The table also includes the average order size for product sales. These numbers indicateThe average order size for product revenue during the three months and nine months ended September 30, 2019 decreased by 86% and 46%, respectively, as compared to the same period in 2018. The relatively small average order size means that the majority of our customer base remains active with research and development projects that only use limited amounts of our materials, but that thematerial. We expect our average order size is increasingto increase significantly as more customers approachreach commercial status with products using our materials. The average order size for the product revenue during the first nine months ended September 30, 2017 increased by 259% as compared to the same period in 2016. Although the average size of these orders is still relatively small, we have begun shipping in metric ton quantities to multiple customers.status.
| For the Three Months Ended September 30, | For the Nine Months Ended September 30, | |||||||||||||||||||||||||||||||||||||||||||||||
| 2017 | 2016 | Change | 2017 | 2016 | Change | |||||||||||||||||||||||||||||||||||||||||||
| Order Summary | For the Three Months Ended September 30, | For the Nine Months Ended September 30, | ||||||||||||||||||||||||||||||||||||||||||||||
| (unaudited) | 2019 | 2018 | Change | 2019 | 2018 | Change | ||||||||||||||||||||||||||||||||||||||||||
| Number of orders - domestic | 22 | 39 | (17 | ) | 89 | 91 | (2 | ) | 33 | 49 | (16 | ) | 84 | 76 | 8 | |||||||||||||||||||||||||||||||||
| Number of orders - international | 37 | 29 | 8 | 125 | 114 | 11 | 26 | 26 | — | 80 | 130 | (50 | ) | |||||||||||||||||||||||||||||||||||
| Number of orders - total | 59 | 68 | (9 | ) | 214 | 205 | 9 | 59 | 75 | (16 | ) | 164 | 206 | (42 | ) | |||||||||||||||||||||||||||||||||
| Average order size for product sales recorded in r Statement of Operations | $ | 7,573 | $ | 1,307 | $ | 6,266 | $ | 4,035 | $ | 1,125 | $ | 2,910 | ||||||||||||||||||||||||||||||||||||
| Percentage change | 480 | % | 259 | % | ||||||||||||||||||||||||||||||||||||||||||||
| Average order size for product sales recorded in our Statement of Operations | $ | 2,089 | $ | 15,018 | $ | (12,929 | ) | $ | 7,485 | $ | 13,901 | $ | (6,416 | ) | ||||||||||||||||||||||||||||||||||
| % change | (86 | %) | (46 | %) | ||||||||||||||||||||||||||||||||||||||||||||
Grant Revenue
Grant revenue for the three and nine months September 30, 2017 and 2016 consisted of proceeds from sources as shown in the table below:
| For the Three Months Ended September 30 | For the Nine Months Ended September 30 | |||||||||||||||||||||||||||||||
| 2017 | % | 2016 | % | 2017 | % | 2016 | % | |||||||||||||||||||||||||
| Mercedes Benz North America | $ | 25,466 | 100 | % | $ | — | — | % | $ | 31,208 | 25 | % | $ | — | — | % | ||||||||||||||||
| Department of Energy | — | — | 25,111 | 50 | 93,747 | 75 | 183,475 | 88 | ||||||||||||||||||||||||
| Grand Valley State | — | — | 25,000 | 50 | — | 25,000 | 12 | |||||||||||||||||||||||||
| Total | $ | 25,466 | 100 | % | $ | 50,111 | 100 | % | $ | 124,955 | 100 | % | $ | 208,475 | 100 | % | ||||||||||||||||
Licensing Revenue
The Company and POSCO, a shareholder of the Company, entered into a license agreement dated June 8, 2011, pursuant to which POSCO agreed to pay a minimum annual royalty of $100,000 per year if certain circumstances existed, among other things. The Company believed that this minimum annual royalty became due annually beginning on February 28, 2015, and up until June 30, 2017, recorded this royalty revenue at a rate of $25,000 per quarter. POSCO disputed its obligation to pay this minimum annual royalty, and did not pay the royalty in any prior year. We filed a demand for arbitration in the International Court of Arbitration on March 9, 2016, in an effort to resolve the dispute. Pursuant to a confidential settlement, on November 3, 2017, the Company and POSCO agreed to settle the dispute and to dismiss the arbitration. Based on terms of the settlement, no allowance is considered necessary. At September 30, 2017 we have a balance of $175,000 reflected in other current assets on the condensed consolidated balance sheet. This represents an accrual of licensing revenue of $100,000 for three and a half years less 50% to reflect an estimate of the portion of 2017, 2016, 2015, and 2014 licensing fees we believed to be not collectible. At December 31, 2016 the accrued licensing fees and allowance netted together was $150,000.
Cost of Goods Sold
We use a standard cost system to estimate the direct costs of products sold. Direct costs include estimates of raw material costs, packaging, freight charges net of those billed to customers, and an allocation for direct labor and manufacturing overhead. Because of the nature of our production processes, there is a substantial fixed manufacturing expense requirement that represents the ongoing cost of maintaining production facilities that are not directly related to products sold, so we use a “full capacity” allocation of overhead based on an estimate of what product costs would be if the manufacturing facilities were operating on a full-time basis and producing products at the designed capacity. This estimate involves estimating both the level of expenses as well as production amounts as if the manufacturing facility were operating on a continuous 24 hour per day, 5 day per week production schedule.
Gross Profit Summary
| 23 |
The following table shows the relationship of direct costs to product sales for the three months and nine months ended September 30, 20172019 and 2016:2018:
| Gross Profit Summary | For the Three Months Ended September 30, | For the Nine Months Ended September 30, | For the Three Months Ended September 30, | For the Nine Months Ended September 30, | ||||||||||||||||||||||||||||||||||||||||||||
| 2017 | 2016 | Change | 2017 | 2016 | Change | 2019 | 2018 | Change | 2019 | 2018 | Change | |||||||||||||||||||||||||||||||||||||
| Product Sales | $ | 446,795 | $ | 88,856 | $ | 357,939 | $ | 863,574 | $ | 230,635 | $ | 632,939 | $ | 123,247 | $ | 1,126,385 | $ | (1,003,138 | ) | $ | 1,227,594 | $ | 2,863,575 | $ | (1,635,981 | ) | ||||||||||||||||||||||
| Direct Costs | 266,462 | 44,344 | 222,118 | 476,774 | 101,397 | 375,377 | 73,113 | 708,249 | (635,136 | ) | 950,677 | 1,739,700 | (789,023 | ) | ||||||||||||||||||||||||||||||||||
| Direct Cost Margin | $ | 180,333 | $ | 44,512 | $ | 135,821 | $ | 386,800 | $ | 129,238 | $ | 257,562 | $ | 50,134 | $ | 418,136 | $ | (368,002 | ) | $ | 276,917 | $ | 1,123,875 | $ | (846,958 | ) | ||||||||||||||||||||||
| % of Sales | 40.4 | % | 50.1 | % | 44.8 | % | 56.0 | % | 40.7 | % | 37.1 | % | 22.6 | % | 39.2 | % | ||||||||||||||||||||||||||||||||
| Unallocated Manufacturing Expense | 449,799 | 323,051 | 126,748 | 1,236,101 | 1,071,000 | 165,101 | 862,280 | 544,867 | 317,413 | 1,955,494 | 1,834,138 | 121,356 | ||||||||||||||||||||||||||||||||||||
| Gross Loss on Product Sales | $ | (269,466 | ) | $ | (278,539 | ) | $ | 9,073 | $ | (849,301 | ) | $ | (941,762 | ) | $ | 92,461 | $ | (812,146 | ) | $ | (126,731 | ) | $ | (685,415 | ) | $ | (1,678,577 | ) | $ | (710,263 | ) | $ | (968,314 | ) | ||||||||||||||
We believe that the fluctuations in gross loss on product sales and direct cost from period to period are not indicative of future margins because of the relatively small size of our sales in comparison to our future expectations. Direct costs vary depending on the size of an order, the specific products being ordered, and other factors like shipping destination (which on small orders can represent a significant percentage of the cost).
Costs associated with grant revenue tend to be a mixture of facilities use, management time, labor from scientists, technicians and manufacturing personnel, and some supplies. Because of the difficulty of developing and maintaining an administrative system to gather direct costs for grants, together with the relatively small size of grant revenue, we do not track direct costs for grant revenue as a separate cost category. Therefore, we do not calculate direct cost margins associated with grant revenue but, rather, we view this revenue as being supported by indirect corporate expenses.
Costs associated with licensing revenue tend to be a mixture of IP costs as well as management and administrative expenses that are indirect in nature. As such, we do not assign direct costs to licensing revenue. Where revenue from a license agreement can be assigned to specific product revenue, we classify this revenue as product sales and, using our standard cost system, assign direct costs to those sales.
The remaining “non-direct” costs of operating our manufacturing facilities are recorded as unallocated manufacturing expenses. These expenses include personnel costs, rent, utilities, indirect supplies, depreciation, and related indirect expenses. Unallocated manufacturing expenses are expensed as incurred. We allocate these costs to direct product costs based on the proportion of these expenses that would be representative of direct product costs if we were operating our factory at full capacity.
For the three months ended September 30, 2017,2019, unallocated manufacturing expenses increased by 39%58% to $449,799$862,280 as compared to $323,051 during the same period$544,867 in 2016, an2018. The increase of $126,748. Higher levels of manufacturing$317,413 is largely due to fixed overhead expense will be incurred as we prepare for anticipated volume increases.cost not being allocated to finished goods due to capacity underutilization.
For the nine months ended September 30, 2017,2019, unallocated manufacturing expenses increased by 15%6% to $1,236,101$1,955,494 as compared to $1,071,000 during the same period$1,834,138 in 2016, an2018. The increase of $165,103. In$121,356 is largely due to increased project related expenses at the first three quarters of 2017 we have incurred some higher levels of manufacturing overhead expense as we prepare for anticipated volume increases.Mason, MI facility which opened in mid-2018
Sales, General and Administrative Expenses
During the three months ended September 30, 20172019, we incurred selling, general and administrative (“SG&A”) expenses (SG&A) of $1,466,505.$1,266,037. This is an increasea decrease of $569,855approximately $31,142 or 64%2.4% from the same period in 2016, which was primarily the result of2018. This decrease in SG&A expense is related to a one-time, non-cash charge of $501,071 recordeddecrease in July 2017 to account for the cancellation and replacement of certain stock options. See note 7 in the financial statements for further discussion of the modifications. As we continue to grow and gain traction in the marketplace our SG&A expenses will fluctuate but should stabilize and become more fixed in nature as we achieve economies of scale.contracted services.
During the nine months ended September 30, 20172019 we incurred SG&Aselling, general and administrative expenses (SG&A) of $3,386,857.$4,173,338. This is an increase of approximately $768,605 or 29%$541,686 from the same period in 2016, which was2018, primarily the result of a one-time, non-cash charge of $501,071 recordeddue to increases in July 2017 to account for the cancellation and replacement of certain stock options. See note 7 in the financial statements for further discussion of the modifications. In addition, during the nine months ended September 30, 2016, we incurred a $182,146 reduction in SG&A expenses associated with reclassifying certain expenses related to the DOE Phase I SBIR grant intopersonnel costs as our research and development expenses. This resulted in a reduction of SG&A expenses in 2016 that did not occur in 2017. As we continue to grow and gain traction in the marketplace our SGA expenses will fluctuate but should stabilize and become more fixed in nature as we achieve economies of scale.sales team expands.
Research and Development Expenses
Research and development expenses forDuring the three months ended September 30, 2017 were $215,949 as compared to $231,312 for2019, we incurred research and development expenses (R&D) of $381,511. This is a decrease of $54,445 or 12.5% from the same period in 2016. The2018. This decrease of $15,363 or 7%in R&D is largelyprimarily due to higher expenses in 2016 to work onlower equipment repairs and complete the DOE Phase I SBIR grant (which was completed by June 30, 2016).maintenance.
Research and development expenses for the nine months ended September 30, 20172019 were $706,575$1,151,524 as compared to $866,668$1,000,101 for the same period ended September 30, 2016. The decreasein 2018, an increase of $160,093 or 18%$151,423. This increase in R&D is largelyprimarily due to higher expensesincreases in 2016personnel as we continue to work on and complete the DOE Phase I SBIR grant.build our R&D team.
| 24 |
Other Income (Expense)
The following table shows a comparison of other income and expense by major expense component for the three and nine months ended September 30, 20172019 and 2016:2018:
| For the Three Months Ended September 30, | For the Nine Months Ended September 30, | |||||||||||||||||||||||
| 2019 | 2018 | Change | 2019 | 2018 | Change | |||||||||||||||||||
| Interest expense, net | $ | (110,999 | ) | $ | (81,926 | ) | $ | (29,073 | ) | $ | (265,941 | ) | $ | (250,900 | ) | $ | (15,041 | ) | ||||||
| Government incentives, net | — | — | — | — | 3,253 | (3,253 | ) | |||||||||||||||||
| Total | $ | (110,999 | ) | $ | (81,926 | ) | $ | (29,073 | ) | $ | (265,941 | ) | $ | (247,647 | ) | $ | (18,294 | ) | ||||||
| Other Income (Expense) | For the Three Months Ended September 30, | For the Nine Months Ended September 30, | ||||||||||||||||||||||
| 2017 | 2016 | Change | 2017 | 2016 | Change | |||||||||||||||||||
| Interest expense, net | $ | (62,814 | ) | $ | (55,816 | ) | $ | (6,998 | ) | $ | (176,347 | ) | $ | (240,588 | ) | $ | 64,241 | |||||||
| Gain (loss) from change in fair value of derivative liability - warrants | (43,154 | ) | 26,738 | (69,892 | ) | (46,612 | ) | 50,799 | (97,411 | ) | ||||||||||||||
| Government incentives, net | — | 24,000 | (24,000 | ) | (74,024 | ) | 72,000 | (146,024 | ) | |||||||||||||||
| Loss on disposal of intangible assets | — | (18,609 | ) | 18,609 | — | (18,609 | ) | 18,609 | ||||||||||||||||
| Total | $ | (105,968 | ) | $ | (23,687 | ) | $ | (82,281 | ) | $ | (296,983 | ) | $ | (136,398 | ) | $ | (160,585 | ) | ||||||
Interest expense, net of interest income in the three months ended September 30, 2017, increased by $6,998 compared to the same period in 2016. Net interest expense for the nine months ended September 30, 2017 decreased by $64,241 compared to the same period in 2016. The decreasing balance in our lease financing agreements accounts for declining interest in the current year but this is offset by our draws on the Dow Facility (see Note 2 in the financial statements).
Gain/(loss) from changes in the fair value of derivative liability warrants from the previous valuation period are characterized as other (expense)/other income on our Statement of Operations as a result of the GAAP requirement to use variable accounting for such instruments. These values fluctuate from period to period as a result of updating inputs used in the trinomial lattice model used to value such warrants, including risk free rate, volatility, remaining term of each warrant, and the underlying stock price assumption used in such calculations. On September 30, 2017 we reclassified 224,897 warrants related to Series B Preferred stock from derivative liabilities to equity and we are no longer required to record the change in fair values for these instruments.
Government incentives include accruals for incentive awards from state and local government entities relating to new hires during the period indicated, net of any true up of previous accruals to reflect actual payments. In 2016, we accrued $74,000 for expected incentive awards from the Michigan Economic Growth Authority (“MEGA”), based on our experience in receiving such incentive awards over the previous four years for our hiring practices. Upon review by MEGA in May 2017, our 2016 incentive was declined, because of our failure to meet a baseline assumed hiring threshold, which we missed by two full-time equivalent employees by December 31, 2016. Since 2016 was the final year for this incentive award program, we wrote off this previously accrued award in the three months ended June 30, 2017, and thus we recorded a loss of $74,024 in the nine month period ending September 30, 2017.
Cash Flow Summary
The following condensed cash flow statement compares cash flow from operating, investing, and financing activities for the nine months ended September 30, 2017 and 2016.
| For the Nine Months Ended September 30, | Change 2016 – 2017 | |||||||||||||||
| 2017 | 2016 | $ | % | |||||||||||||
| Cash, beginning of period | $ | 1,785,343 | $ | 1,060,224 | $ | 725,119 | 68 | % | ||||||||
| Net Cash provided by (used in): | ||||||||||||||||
| Operating activities | (3,803,899 | ) | (2,667,307 | ) | (1,136,592 | ) | 43 | |||||||||
| Investing Activities | (543,486 | ) | (173,451 | ) | (370,035 | ) | 213 | |||||||||
| Financing Activities | 3,879,803 | 2,418,038 | 1,461,765 | 60 | ||||||||||||
| Net increase (decrease) in cash | (467,582 | ) | (422,720 | ) | 44,862 | 11 | ||||||||||
| Cash, end of period | $ | 1,317,761 | $ | 637,504 | $ | 680,257 | 107 | % | ||||||||
Net cash used in operating activities for the nine months ended September 30, 2017 and 2016 was $3,803,900 and $2,667,307, respectively.
Investing activities for the nine months ended September 30, 2017 included net capital expenditures for the purchase of property and equipment of $428,015 and $115,470 for intellectual property as compared with $84,187 for property and equipment and $89,264 for intellectual property during the same period in 2016. These levels of capital expenditures are higher as we have begun to update and install equipment necessary to increase production capacity to meet anticipated customer orders for those customers who are moving into commercialization of products containing our materials.
Financing activities provided a net increase in cash of $3,879,803 and $2,418,038 for the nine months ended September 30, 2017 and 2016, respectively. For the first nine months ended September 30, 2017 gross proceeds from the issuance of common stock was $2,140,400 and stock issuance expenses were $245,972 as compared to proceeds from the issuance of common stock for the nine months ended September 30, 2016 of $3,102,032 and stock issuance expenses of $538,640. Financing activities in nine months ending September 30, 2017 also included $2,000,000 of loan proceeds from the Dow Facility (see Note 3 in the financial statements) versus zero in the nine months ending September 30, 2016.
Liquidity and Capital Expenditures
Liquidity
We have historically incurred recurring losses from operations and we may continue to generate negative cash flows as we implement our business plan. Our condensed consolidated financial statements are prepared using US GAAP as applicable to a going concern, which contemplates the realization of assets and liquidation of liabilities in the normal course of business.
In December
As of November 11, 2019, we had cash on hand of $560,775. We believe our cash is sufficient to fund our operations for at least twelve months after taking into account various sources of funding and cash received from continued commercial sales of our products. Our primary means for raising funds since 2016 we entered intohas been through our offering of shares of common stock at a fixed price of $8.00 per share to the general public in a self-underwritten offering (the “Offering”) and under a draw loan note and agreement (the “Dow Facility”) with The Dow Chemical Company (“Dow”(the “Dow Facility”) to provide up to $10 million of secured debt financing at an interest rate of 5% per year, drawable at our request under certain conditions. We received $2 million at closing, $1 million on July 18, 2017, and $1 million on September 22, 2017. We currently have $1 million of additional funding available on or before December 1, 2017. On April 12, 2019, we completed the Offering, after selling 2,615,425 shares under the Dow Facility. After December 1, 2017, an additional $5 million becomes available under the Dow Facility ifRegistration Statement at a price of $8.00 per share for total proceeds of $20,923,400. On July 8, 2019 we have raised $10 million of equity capital after October 31, 2016.
As of November 10, 2017, we had cash on hand of $1,226,776 and currently available funds of $1borrowed $2 million under the Dow Facility. Our financial projections show thatOn November 12, 2019 we may needrequested to raise an additional $6-8borrow $2 million before we are capable of achieving sustainable free cash flow after capital expenditures. We intend that the primary means for raising such funds will be through our IPO, the additional $1 million of currently available funds under the Dow Facility (See Note 3). There has been an agreement between the parties to extend the draw deadline through December 1, 2020.
There has been no public market for our securities and up to an additional $5 million of proceeds from the Dow Facility in the event that we raise $10 million of additional equity capital after October 31, 2016. Thus far, we have raised approximately $3 million through the sale of 376,078 shares ofa public market may never develop, or, if any market does develop, it may not be sustained. Our common stock between November 1, 2016 and September 30, 2017 towards the requirement to raise $10 million of additional equity capital in order to open up the remaining $5 million of availabilityis not currently quoted on the Dow Facility. There can be no assurance that we will be able to raise additional equity capital in the IPO or in subsequent equity offeringstraded on any exchange or that the terms and conditions ofon any future financings will be workable or acceptable to us and our stockholders.
over-the-counter market. In the event we are unable to fund our operations from existing cash on hand, operating cash flows, additional borrowings or raising equity capital, we may be forced to reduce our expenses, slow down our growth rate, or discontinue operations. Our condensed consolidated financial statements do not include any adjustments relating to the recoverability and classification of recorded asset amounts or the amounts and classification of liabilities that might be necessary should we be unable to continue as a going concern.
Critical Accounting EstimatesPolicies
In preparing the condensed consolidated financial statements in accordance with accounting principles generally accepted in the United States of America (“U.S. GAAP”), we have adopted various accounting policies. Our most significant accounting policies are disclosed in Note 2 to the consolidated financial statements included in our Form 10-K10-K/A for the year ended December 31, 2016.2018.
The preparation of the condensed consolidated financial statements in conformity with U.S. GAAP requires us to make estimates and assumptions that affect the amounts reported in the condensed consolidated financial statements and accompanying notes. Our estimates and assumptions, including those related to inventories, intangible assets, property, plant and equipment, legal proceedings, research and development, warranty obligations, product liability, fair valued liabilities, sales returns and discounts, going concern, and income taxes are updated as appropriate, which in most cases is at least quarterly. We base our estimates on historical experience, or various judgements about the reported values of assets, liabilities, revenue and expenses. Actual results may materially differ from these estimates.
ItemITEM 3. Quantitative and Qualitative Disclosures about Market RiskQUANTITATIVE AND QUALITATIVE DISCLOSURES ABOUT MARKET RISK
Smaller reporting companies are not required to provide this information.
ItemITEM 4. Controls and ProceduresCONTROLS AND PROCEDURES
(a)Evaluation of disclosure controls and procedures. We maintain disclosure controls and procedures designed to ensure that information required to be disclosed in reports filed under the Exchange Act is recorded, processed, summarized, and reported within the time periods specified in the SEC rules and forms, and that such information is accumulated and communicated to our management, including our principal executive officer and principal financial officer, as appropriate, to allow timely decisions regarding required disclosure. In designing and evaluating our disclosure controls and procedures, management recognized that any controls and procedures, no matter how well designed and operated, can provide only reasonable assurance of achieving the desired control objectives.
As required by SEC Rule 15d-15, our management carried out an evaluation, under the supervision and with the participation of our principal executive officer and principal financial officer, of the effectiveness of our disclosure controls and procedures as of the end of the period covered by this Quarterly Report on Form 10-Q. Based on that evaluation, our principal executive officer and principal financial officer concluded that our disclosure controls and procedures were effective at a reasonable assurance level as of the end of the period covered by this report.
(b)Changes in internal controls. There were no changes in our internal control over financial reporting that occurred during the three months ended September 30, 20172019 that have materially affected, or are reasonably likely to materially affect, our internal control over financial reporting.
| 25 |
ItemITEM 1. Legal Proceedings.LEGAL PROCEEDINGS.
The Company and POSCO, a shareholder of the Company, entered into a license agreement dated June 8, 2011, pursuant to which POSCO agreed to pay a minimum annual royalty of $100,000 per year if certain circumstances existed, among other things. The Company believed that this minimum annual royalty became due annually beginning on February 28, 2015, and up until June 30, 2017, recorded this royalty revenue at a rate of $25,000 per quarter. POSCO disputed its obligation to pay this minimum annual royalty, and did not pay the royalty in any prior year. We filed a demand for arbitration in the International Court of Arbitration on March 9, 2016, in an effort to resolve the dispute. Pursuant to a confidential settlement, on November 3, 2017, the Company and POSCO agreed to settle the dispute and to dismiss the arbitration. Based on terms of the settlement, no allowance is considered necessary.None.
ItemITEM 1A. Risk Factors.RISK FACTORS.
Smaller reporting companies are not required to provide this information.
ITEM 2. UNREGISTERED SALES OF EQUITY SECURITIES AND USE OF PROCEEDS.
Item 2. Unregistered Sales of Equity Securities and Use of Proceeds.
During the three months endedThe following sets forth information regarding all unregistered securities sold from July 1, 2019 through September 30, 2019:
| (1) | We granted stock options to purchase an aggregate of 12,500 shares at an exercise prices of $8.00 per share to Board members, consultants and directors under the 2017 Equity Plan; |
| (2) | We granted an aggregate of 12,500 shares of restricted stock with an aggregate fair value of $100,000 under the 2017 Incentive Plan. |
The issuances of securities described in paragraphs (1) and 2016 we issued 7,140 shares per period of Series A Preferred Stock(2) above were deemed to Aspen Advanced Opportunity Fund, LP as payment for lease financing obligationsbe exempt from registration under the terms ofSecurities Act in reliance on Rule 701 promulgated under the Master Lease Agreement, dated March 18, 2013. For the nine months ended September 30, 2017Securities Act as transactions by an issuer not involving a public offering or under benefit plans and 2016 we issued a total of 21,420 shares per periodcontracts relating to compensation as payment for lease obligations.provided under Rule 701.
On August 10, 2017, we granted 2,500 shares of restricted stock to each of the following independent Board members as Board compensation: Steven C. Jones, Arnold Allemang, Dave Pendell, and Peifeng (Molly) Zhang. These shares vest 25% on the last day of each fiscal quarter on September 30, 2017, December 31, 2017, March 31, 2018, and June 30, 2017. Such shares were issued pursuant to the 2017 Equity Incentive Plan.
ItemITEM 3. Defaults Upon Senior Securities.DEFAULTS UPON SENIOR SECURITIES.
None.
ItemITEM 4. Mine Safety Disclosures.MINE SAFETY DISCLOSURES.
None.
ItemITEM 5. Other Information.OTHER INFORMATION.
None.
None
| 26 |
ItemITEM 6. Exhibits.EXHIBITS.
| EXHIBIT NUMBER | DESCRIPTION | LOCATION | ||
| Certifications of the Chief Executive Officer | Filed herewith | |||
| 31.2 | Certification of the Chief Financial Officer pursuant to Section 302 of the Sarbanes-Oxley Act of 2002 | Filed herewith | ||
| 32.1 | ||||
| Certification Pursuant To 18 U.S.C. Section 1350, As Adopted Pursuant | Filed herewith | |||
| 32.2 | Certification Pursuant To 18 U.S.C. Section 1350, As Adopted Pursuant to Section 906 of the Sarbanes-Oxley Act of 2002* | Filed herewith | ||
| 101. INS | XBRL Instance Document | Filed herewith | ||
| 101. CAL | XBRL Taxonomy Extension Calculation Link base Document | Filed herewith | ||
| 101. DEF | XBRL Taxonomy Extension Definition Link base Document | Filed herewith | ||
| 101. LAB | XBRL Taxonomy Label Link base Document | Filed herewith | ||
| 101. PRE | XBRL Extension Presentation Link base Document | Filed herewith | ||
| 101. SCH | XBRL Taxonomy Extension Scheme Document | Filed herewith |
31
| 27 |
Pursuant to the requirements of the Securities Exchange Act of 1934, as amended,this report has been signed below by the following persons on behalf of the registrant has duly caused this Quarterly Reportand in the capacities and on Form 10-Q to be signed on its behalf by the undersigned, thereunto duly authorized.
XG SCIENCES, INC.dates indicated.
Dated: November | By: | /s/ Philip L. Rose | |
| Name: | Philip L. Rose | ||
| Title: | Chief Executive Officer | ||
| Dated: November | By: | /s/ | |
| Name: | |||
| Title: |
| 28 |
32